Embed Size (px)
Citation preview

RESEARCH ARTICLE
Di-(2-Ethylhexyl) Phthalate Metabolites inUrine Show Age-Related Changes andAssociations with Adiposity and Parametersof Insulin Sensitivity in ChildhoodArianna Smerieri1, Chiara Testa2,3,4, Pietro Lazzeroni1, Francesca Nuti2,3,4, Enzo Grossi5,Silvia Cesari1, Luisa Montanini1, Giuseppe Latini6,7, Sergio Bernasconi1, AnnaMaria Papini2,3,4, Maria E. Street1,8*
1 Department of Pediatrics, University Hospital of Parma, Parma, Italy, 2 Interdepartimental Laboratory ofPeptide & Protein Chemistry & Biology (www.peptlab.eu), Florence, Italy, 3 Department of Chemistry “UgoSchiff,” University of Florence, Sesto Fiorentino, Italy, 4 PeptLab@UCP c/o LCB EA 4505 Université deCergy-Pontoise, Cergy-Pontoise, France, 5 Villa Santa Maria Institute, Tavernerio, Italy, 6 ClinicalPhysiology Institute (IFC-CNR), National Research Council of Italy, Lecce Section, Lecce, Italy, 7 Division ofneonatology, Perrino Hospital, Brindisi, Italy, 8 Depts of Paediatrics and of Research and Statistics, S. MariaNuova Hospital and Research Institute, Reggio Emilia, Italy
Abstract
Objectives
Phthalates might be implicated with obesity and insulin sensitivity. We evaluated the levels
of primary and secondary metabolites of Di-(2-ethylhexyl) phthalate (DEHP) in urine in
obese and normal-weight subjects both before and during puberty, and investigated their re-
lationships with auxological parameters and indexes of insulin sensitivity.
Design and Methods
DEHP metabolites (MEHP, 6-OH-MEHP, 5-oxo-MEHP, 5-OH-MEHP, and 5-CX-MEHP),
were measured in urine by RP-HPLC-ESI-MS. Traditional statistical analysis and a data
mining analysis using the Auto-CM analysis were able to offer an insight into the complex bi-
ological connections between the studied variables.
Results
The data showed changes in DEHP metabolites in urine related with obesity, puberty, and
presence of insulin resistance. Changes in urine metabolites were related with age, height
and weight, waist circumference and waist to height ratio, thus to fat distribution. In addition,
clear relationships in both obese and normal-weight subjects were detected among MEHP,
its products of oxidation and measurements of insulin sensitivity.
PLOS ONE | DOI:10.1371/journal.pone.0117831 February 23, 2015 1 / 16
a11111
OPEN ACCESS
Citation: Smerieri A, Testa C, Lazzeroni P, Nuti F,Grossi E, Cesari S, et al. (2015) Di-(2-Ethylhexyl)Phthalate Metabolites in Urine Show Age-RelatedChanges and Associations with Adiposity andParameters of Insulin Sensitivity in Childhood. PLoSONE 10(2): e0117831. doi:10.1371/journal.pone.0117831
Academic Editor:Wei Shen, Qingdao AgriculturalUniversity, CHINA
Received: July 1, 2014
Accepted: December 31, 2014
Published: February 23, 2015
Copyright: © 2015 Smerieri et al. This is an openaccess article distributed under the terms of theCreative Commons Attribution License, which permitsunrestricted use, distribution, and reproduction in anymedium, provided the original author and source arecredited.
Data Availability Statement: All relevant data arewithin the paper.
Funding: This study was supported by funds of theDept. of Paediatrics, University of Parma, Italy, byBracco Foundation, Milan, Italy, by Fondazione EnteCassa di Risparmio di Firenze (Italy), the RegioneToscana (Italy): POR CReO FESR 2007-2013 ASSE1- Linea di intervento 1.1.C Bando Regionale 2009,the ANR(France) for the Chaire d’Excellence to AMPProject PepKit ANR-09-CEXC-013-01 and the EcoleDoctorale Sciences et Ingénierie de l’Université de

Conclusion
It remains to be elucidated whether exposure to phthalates per se is actually the risk factor
or if the ability of the body to metabolize phthalates is actually the key point. Further studies
that span from conception to elderly subjects besides further understanding of DEHP me-
tabolism are warranted to clarify these aspects.
IntroductionObesity, insulin resistance, and type 2 diabetes are interrelated metabolic disorders which prev-alence has increased substantially in the past two decades [1]. Insulin resistance occurs whenincreasing amounts of insulin are required to correctly regulate transport of plasma glucoseinto peripheral tissues. Although the precise mechanism is unclear, insulin resistance is com-monly associated with an increase in central (visceral) obesity [2].
Some studies have reported an association between persistent exposure to some organic pol-lutants, such as phthalates, bisphenol A, heavy metals and polychlorobiphenyl, and increasedbody weight and diabetes [3], antagonism to the action of thyroid hormone nuclear receptorswith a reduction in fT3 and fT4 [4,5] and an increase in oxidative stress [6]. Oxidative stress isrelated with inflammation and inflammation itself is a cause of insulin resistance [7]. Obesity ischaracterised also by a low grade of chronic inflammation [8], and in addition mechanisms in-ducing insulin resistance, mediated by pro-inflammatory cytokines have been described [7,9].
High molecular weight phthalates, such as Di-(2-ethylhexyl) phthalate (DEHP), are primar-ily used as plasticizers for the manufacturing of polyvinyl chloride (PVC), which is used exten-sively in consumer products, flooring and wall coverings, as well as food contact applications,medical devices, toys and cosmetic containers [10]. In the United States more than 75% of thepopulation has measurable levels of urinary metabolites of phthalates [11].
A causal role for high-molecular-weight phthalates in obesity is biologically plausible [12–16]. Perturbation of thyroid function has also been considered a possible cause for increasingbody mass index (BMI) [17], and some authors claim that their anti-androgenic effect couldalso be implicated with increasing BMI [18].
Concentrations of urinary phthalate metabolites have been found to be associated with in-creased waist circumference and insulin resistance in adult males [2,19].
Phthalates are rapidly metabolized in the body, with elimination half-lives of less than 24hours [20]. Selected phthalate monoesters, such as mono(2-ethylhexyl)phthalate (MEHP) arealso reproductive and developmental toxicants [21].
Urine is the preferred matrix for phthalate determination in humans [22]. Because of rapidmetabolism urinary metabolite levels are typically higher, and therefore, more precisely measuredthan levels of the parent compound found in other media. Several studies have examined the with-in-person variability of phthalate metabolites and concluded that despite their short half-lives, ex-posure may be sufficiently stable to assign an exposure level based on a single sample [23–25].
In recent years, systems biology approaches have developed. These methods applied to bio-medical and biological data attempt to model and discover specific properties and complex in-teractions within biological systems. These comprise artificial adaptive systems (AAS) which useis rapidly spreading in biology and medicine [26] besides other disciplines, and could representan excellent method to study the effects of environmental contaminants on human biology.Auto Contractive Map (Auto-CM) a new Artificial Neural Network [27] is effective at highlight-ing any kind of consistent pattern and/or systematic relationships, and hidden trends and
DEHP, Obesity and Insulin Sensitivity
PLOS ONE | DOI:10.1371/journal.pone.0117831 February 23, 2015 2 / 16
Cergy-Pontoise for the PhD fellowship at CT. Thefunders had no role in study design, data collectionand analysis, decision to publish, or preparation ofthe manuscript.
Competing Interests: The authors have declaredthat no competing interests exist.

associations among variables, in particular is able to describe a context which is typical of livingsystems where a continuous time dependent complex change in the variable value is present.
We hypothesized that exposure to phthalates was related with obesity and insulin resistance,and we aimed to evaluate the levels of the primary and secondary metabolites of DEHP inurine in obese and normal-weight subjects both before and during puberty, and to investigatetheir relationships with auxological parameters and indexes of insulin sensitivity using bothtraditional statistical analysis (i.e.Mann-Whitney test, Kruskall-Wallis ANOVA, correlationtests) and Auto-CM analysis.
Materials and Methods
Subjects and auxological observationsBoth prepubertal and pubertal obese (N:41) and normal-weight children (N:31) were enrolledconsecutively at the paediatric endocrine clinic at the University Hospital in Parma. The chil-dren were comparable for age, sex and pubertal stages. The features of these subjects are sum-marized in Table 1. All subjects came from the same geographical area where they were born(Fig. 1). Controls were subjects having normal familial short stature, negative endocrine exami-nations, no chronic diseases and negative celiac screening. For the obese subjects, endocrinedisorders, chronic diseases and genetic syndromes or dysmorphic features were considered
Table 1. Clinical characteristics, anthropometric data, and measurements of insulin sensitivity inobese and normal-weight subjects (controls).
Parameter Controls Obese p
Number 31 41
Males/Females 19/12 22/19
Pubertal/Prepubertal 20/11 27/14
Chronological age (yr) 12.69 ± 0.66 12.53 ± 0.48 ns
Height SDS -0.91 ± 0.30 0.91 ± 0.16 0.0001
Mid Parental Ht SDS -0.21 ± 0.18 -0.12 ± 0.15 ns
BMI SDS (Cole) -0.12 (-0.88–0.75) 3.41 (3.04–3.59) 0.0001
Birth weight (Kg) 3.04 ± 0.13 3.4 ± 0.09 0.01
Waist circumference (cm) 107.0 ± 2.54
Waist circumference/height ratio 0.68 ± 0.01
Chronological age at onset of obesity (yr) 5.2 ± 0.50
Insulin (IU/L) 8.5 ± 1.2 15.9 ± 1.9 0.002
Glucose (mg/dl) 80.2 ± 1.2 82.8 ± 1 ns
FGIR 13.2 (6.67–20.0) 6.4 (4.42–9.44) 0.001
HOMA-IR 1.09 (0.79–2.56) 2.46 (1.88–3.43) 0.0001
WBISI 3.64 ± 0.25
AUCG 234.8 (214–261)
AUCI 225.5 ± 17.0
Data are mean± SEM for normal distribution, median (25th-75th percentile) for asymmetric distribution.
FGIR: Fasting glucose to insulin ratio; WBISI: Whole Body Insulin Sensitivity Index; AUCG: Area under the
curve for glucose calculated from the Oral Glucose Tolerance Test (OGTT); AUCI: Area under the curve for
insulin calculated from the OGTT.
doi:10.1371/journal.pone.0117831.t001
DEHP, Obesity and Insulin Sensitivity
PLOS ONE | DOI:10.1371/journal.pone.0117831 February 23, 2015 3 / 16

exclusion criteria. Height (Ht) and weight were measured in all subjects using a Harpenden sta-diometer, and an electronic scale, respectively. Ht and mid-parental height (MPHt) were ex-pressed as standard deviation scores (SDS) using the Italian reference data [28].
Body mass index (BMI) was calculated as weight/height2 (Kg/m2), and standardized ac-cording Cole’s reference data [29]. Subjects with a BMI above the one indicated for age and sexaccording to the IOFT criteria [30] were considered obese. These were also all above the 95thcentile according to the Italian reference data, and the control subjects had normal weight(BMI< 75th centile according to Italian reference data) [28]. Waist circumference and waist toheight ratio were taken in addition in the obese subjects to assess fat distribution [31].
Based on breast development or genitalia staging subjects were classified in pubertal andprepubertal according to Tanner’s criteria [32,33].
Measurements of insulin sensitivityAll obese subjects underwent an oral glucose tolerance test (OGTT) after an overnight fast. Aglucose load of 1.75 g/kg body weight (max 75 g) in 300 mL water was prepared and adminis-tered in 3 min. Blood samples were taken prior to, and 30, 60, 90 and 120 min after glucose in-gestion. In all subjects insulin and glucose were assessed at all time points.
Fig 1. Geographical distribution of the obese and normal-weight subjects. The children came from a small area within the Emilia-Romagna region inItaly, mainly between the provinces of Parma and Reggio-Emilia.
doi:10.1371/journal.pone.0117831.g001
DEHP, Obesity and Insulin Sensitivity
PLOS ONE | DOI:10.1371/journal.pone.0117831 February 23, 2015 4 / 16

The insulinogenic index was calculated as Δ insulin (0–30 min) divided by Δ glucose (0–30min) where the values were calculated at baseline and at 30 min during OGTT, and was used asan index of pancreatic β-cell function [35].
The fasting glucose-to-insulin ratio (FGIR) was calculated as the ratio of fasting plasma glu-cose (G0) divided by fasting plasma insulin (I0) levels [35] where G0 was in milligrams per deci-liter and I0 in microunits per milliliter.
Homeostasis model assessment estimate of insulin resistance (HOMA-IR) was calculated,
according to the following formula [34]: G0�I022:5
where G0 and I0 were basal fasting glucose and in-
sulin, respectively. Glucose was expressed in mmol/L and insulin in mIU/mL. HOMA-IR in-dexes were classified according to criteria for age and Tanner stage of puberty [36].
The whole body insulin sensitivity index (WBISI) was calculated based on insulin (IU/mL)and glucose (mg/dl) concentrations obtained during the OGTT and the corresponding fastingvalues, as originally described by Matsuda and DeFronzo [35]. Areas under the curve for insu-lin (AUCI) and glucose (AUCG), were calculated using trapezoidal integration [37].
The presence of metabolic syndrome was established based on the International DiabetesFederation criteria [38].
Insulin sensitivity parameters of obese and normal-weight subjects are reported in Table 1.Plasma glucose concentrations were assayed using a polarographic method (Synchron CX
systems).Insulin concentrations were measured using a chemiluminescence method by Diagnostic
Products Corporation (Los Angeles, CA, USA) for reading by Immulite2000. The intra-assayCV was 6.5, the inter-assay CV 7.1%.
Determination of DEHP secondary metabolites in urineFirst morning urine specimens were collected in all subjects, and stored at -20°C until assayed.
The following metabolites were measured as previously described [39]: MEHP (mono-(2-ethylhexenyl) 1,2-benzenedicarboxylate) and 6-OH-MEHP (mono-(2-ethyl-6-hydroxyhexyl)1,2-benzenedicarboxylate), 5-oxo-MEHP(mono-(2-ethyl-5-oxohexyl) 1,2-benzenedicarboxy-late), 5-Cx-MEHP (mono-(2-ethyl-5-carboxypentyl) 1,2-benzenedicarboxylate, and 5-OH-MEHP (mono-(2-ethyl-5-hydroxyhexyl) 1,2-benzenedicarboxylate) (Fig. 2). Each single me-tabolite, used as pure analytical standard (<98% purity), was synthesized in the Laboratory ofPeptide and Protein Chemistry and Biology (PeptLab) at the University of Florence, followingthe previously described procedure [40]. All the solvents, labware and instrumentation usedduring the solid phase extraction (SPE) procedure and the HPLC-ESI-MS analytical process,were verified to be MEHP and secondary oxidative metabolites free.
DEHPmetabolite concentrations in each single specimen were normalized according to urinarycreatinine concentration. All children had urine creatinine within the normal reference range forage. Urine creatinine measurements were assesed using a Synchron AS/ASTRA clinical analyser(Beckman Instruments). We used values (μg/L) for creatinine and (g/L) for dilution correction inthe analyses, therefore the concentration of each metabolite in urine was expressed as μg/g.
Human urine samples (1 mL) were defrosted, sonicated, mixed and dispensed in glass tubesprior to assaying. Then ammonium acetate buffer (250 mL, pH 6.5) was added. Incubationwith β glucuronidase (5 mL, 200 units/mL, Roche Biochemical) was performed at 37°C for 90min, resulting in quantitative glucuronide hydrolysis of phthalates and metabolites. Afterdeconjugation, samples were treated with two steps of SPE, (SPE cartridges 3 mL/60 mg ofOasis HBL, Waters) to remove any contamination of biological matrix, following the proceduredescribed by Blount et al. [41]. Analytes were finally eluted with acetonitrile and ethyl acetate,concentrated, re-suspended in water. All the samples were analysed by RP-HPLC-ESI-MS.
DEHP, Obesity and Insulin Sensitivity
PLOS ONE | DOI:10.1371/journal.pone.0117831 February 23, 2015 5 / 16

Fig 2. Metabolism of DEHP. (A) Hydrolytic/oxidative pathway leading to MEHP and secondary metaboliteformation. (B) Formation of glucuronic conjugates of DEHPmetabolites.
doi:10.1371/journal.pone.0117831.g002
DEHP, Obesity and Insulin Sensitivity
PLOS ONE | DOI:10.1371/journal.pone.0117831 February 23, 2015 6 / 16

One blank and one quality-control (QC) sample were included in each batch of samples. TheQC sample was spiked with pooled urine, and MEHP and secondary oxidative metabolite stan-dards in known concentration (200 ng/mL). The lower limits of quantification (LOQs) were0.042 μg/L MEHP, 0.048 μg/L 5-OH-MEHP, 0.049 μg/L 5-oxo-MEHP, 0.0051 5-Cx-MEHPand 0.008 μg/L 6-OH-MEHP. In urine, the limits of detection (LODs) were 0.014 μg/L MEHP,0.016 μg/L 5-OH-MEHP, 0.016 μg/L 5-oxo-MEHP, 0.019 5-Cx-MEHP and 0.002 μg/L 6-OH-MEHP. Calibration curves for the quantitative urine analysis were calculated for all analytesplotting peak area average (y) against concentration of standards (x). Five standard solutions(linear range: 2.5–2500 ng/mL) for calibration curve plotting, were prepared for all the metabo-lites. Curves with correlation coefficients (r2) greater than 0.998 were generated (MEHP 0.999,5-OH-MEHP 0.999, 5-oxo-MEHP 0.999, 5-Cx-MEHP 0.999 and 6-OH-MEHP 0.998).
Ethical Committee ApprovalInformed consent was obtained from the parents of subjects and controls as appropriate. Thestudy was approved by the local Ethics Committee in Parma.
Statistical AnalysisStatistical analysis was carried out using the SPSS package 18.0. Any normal distribution ofdata was assessed by the Kolmogorov-Smirnov test. As no significant difference was detectedin this series between males and females, subjects of both sexes were analyzed together.
To analyze differences between obese and normal-weight subjects, and differences betweensubgroups of obese subjects we used Student’s T test for unpaired data or Mann-Whitney test,and Kruskall-Wallis ANOVA followed by Bonferroni’s correction as appropriate. Non-parametric Spearman correlation test was used to measure associations between variables andDEHP metabolites. A multiple linear regression analysis was performed to establish whichwere the major determinants of MEHP urinary concentration.
Data are expressed as mean±SEM, and as median and 25th-75th percentiles as appropriate.Only significant correlations are reported in the text.
Auto Semantic Connectivity Map (Auto-CM) analysisAuto-CM is a new data mining tool based on an Artificial Neural Network that is effective athighlighting any kind of consistent pattern and/or systematic relationships, and hidden trendsand associations among variables. The architecture and mathematics of Auto-CM were de-scribed elsewhere [27]. Briefly, Auto-CMs‘spatializes’ the correlation among variables by build-ing a suitable embedding space where a visually transparent and cognitively natural notion suchas ‘closeness’ among variables reflects accurately their associations. Auto-CM converts this‘closeness’ into a compelling graph-theoretical representation that picks all and only the rele-vant correlations and organizes them into a coherent picture. Moreover, it fully exploits the to-pological meaning of graph-theoretical representations in that actual paths connecting vertices(variables) in the representation carry a definite meaning in terms of logical interdependence inexplaining the data set’s variability. The Auto-CM is characterized by a three-layer architecture:an Input layer, where the signal is captured from the environment, a Hidden layer, where thesignal is modulated inside the Auto-CM, and an Output layer, through which the AutoCMfeeds back upon the environment on the basis of the stimuli previously received and processed.
The input variables for each model were: MEHP, 6-OH-MEHP, 5-oxo-MEHP,5-OH-MEHP, 5-Cx-MEHP, FGIR, HOMA index, insulinogenic index, HtSDS, BMISDS, andbirth weight SDS. Quite uncommonly, the weights determined by Auto-CM after the trainingphase, admit a direct interpretation. Specifically, they are proportional to the strength of many-
DEHP, Obesity and Insulin Sensitivity
PLOS ONE | DOI:10.1371/journal.pone.0117831 February 23, 2015 7 / 16

to-many associations across all variables. Subsequently, association strengths are visualized bytransforming weights into physical distances: i.e. couples of variables which connection weightsare higher get relatively nearer and viceversa if connection weights are lower, they get furtherapart. By applying a simple mathematical filter such as the minimum spanning tree to the ma-trix of distances, a graph is generated [42,43], termed connectivity map [27]. This representa-tion allows a visual mapping of the complex web of connection schemes among variables, andgreatly eases the detection of the variables that play a key role in the schemes. The system pro-vides also a quantification of the ‘strength’ of links among variables (nodes of the graph) by anumerical coefficient. The strength of the link ranges from 0 (minimum strength) to 1 (maxi-mal strength). In this study we transformed 11 input continuous variables in 22 input variablesconstructing for each of them, scaled from 0 to 1, its complement. In the map we have namedthese two different forms as high and low [44].
Results
Differences in DEHPmetabolite concentrationsUrinary DEHP metabolites in obese children and controls. The percentages of detectableDEHP metabolites in urine samples from obese and normal-weight (control subjects) are
Table 2. DEHP metabolites were measurable in the urine samples of obese and normal-weight (control subjects) in the following percentageswith respect to the total number of subjects enrolled in each of the two groups.
MEHP 5CX-MEHP 5OH-MEHP 5OXO-MEHP 6OH-MEHP
OBESE 75.6% 80.5% 80.5% 87.8% 87.8%
CONTROLS 96.8% 38.7% 83.9% 74.2% 51.6%
Obese children had increased 5-OH-MEHP, 5-oxo-MEHP, and 6-OH-MEHP concentrations, compared with normal-weight children, as reported in Fig. 3.
doi:10.1371/journal.pone.0117831.t002
Fig 3. Concentration and distribution of single DEHPmetabolites in urine. (A) control subject and (B)obese children and adolescents.
doi:10.1371/journal.pone.0117831.g003
DEHP, Obesity and Insulin Sensitivity
PLOS ONE | DOI:10.1371/journal.pone.0117831 February 23, 2015 8 / 16

reported in Table 2. 5-Cx-MEHP and 6-OH-MEHP were less detectable in normal-weightthan in obese subjects.
Both obese and control subjects were subsequently subdivided according to presence or ab-sence of puberty (Table 3).
In childhood, MEHP urine concentrations were higher in pre-puberty than in puberty bothin control and obese subjects. Prepubertal controls had lower concentrations of 6-OH-MEHPthan prepubertal obese subjects, and had less 5-OH-MEHP, 5-oxo-MEHP and 6-OH-MEHPconcentrations than pubertal obese subjects.
Urinary DEHP metabolites in obese children, based on the HOMA index. 9/39 obese(23%) subjects had an increased HOMA index compatible with insulin resistance.
Obese children with normal HOMA index had significantly higher 5-oxo-MEHP concen-trations than obese subjects with insulin resistance (0.52±0.13 vs 0.17±0.06 μg/g, P: 0.02).6-OH-MEHP showed a trend to be lower in insulin resistance.
Urinary DEHP metabolites in obese children, based on the presence or absence of themetabolic syndrome. 18/39 obese subjects (46%) had the metabolic syndrome. No statisticalsignificant difference was observed between the two groups, however, obese children with met-abolic syndrome showed a trend to have lower 5-OH-MEHP, 5-oxo-MEHP, and 6-OH-MEHPurinary concentrations (data not shown).
Correlation analysis in obese patients and in controlsCorrelation of DEHP metabolites with auxological parameters. In controls, MEHP was neg-atively correlated with chronological age (rho:-0.349; p<0.03) and with the presence of puberty(rho:-0.564, p<0.001; Table 4).
When normal-weight subjects were analysed separately based on the absence or presence ofpuberty, in prepubertal subjects the correlation between 5-oxo-MEHP and HtSDS was con-firmed (rho:0.535; p<0.022), whereas in pubertal controls 5-Cx-MEHP was negatively corre-lated with birth weight (rho:-0.617; p<0.043), and 5-oxo-MEHP was positively correlated withBMISDS (rho:0.611; p<0.046).
In obese subjects, MEHP was negatively correlated with chronological age, as in controls (rho:-0.349, p< 0.034), and with waist circumference (rho:-0.342; p< 0.038). Interestingly, MEHPwas correlated also negatively with the age at onset of obesity (rho: -0.286; p< 0.05; Table 4 B).
5-Cx-MEHP was positively correlated with waist circumference (rho: 0.366; p<0.026) andwith the waist to height ratio (rho: 0.409; p< 0.012; Table 4 B).
Table 3. Concentration of DEHP metabolites in urine normalized by creatinine (espressed as μg/g).
A Controls Prepubertal B Controls Pubertal C Obese Prepubertal D Obese Pubertal p Significant differences
MEHP 0.15 (0.05–0.34) 0.04 (0.02–0.08) 0.27 (0.08–0.44) 0.1 (0.03–0.18) 0.004 A v sB;A vs C;B vs D
5OH-MEHP 0.14 (0.08–0.53) 0.1 (0.04–0.15) 1.24 (0.27–2.67) 0.43 (0.23–1.97) 0.0001 C vs D;
5CX-MEHP 1.46 (0.49–2.84) 0.78 (0.50–1.58) 0.76 (0.11–0.93) 0.60 (0.28–0.90) ns
5OXO-MEHP 0.14 (0.04–0.53) 0.14 (0.06–0.27) 0.35 (0.06–0.74) 0.30 (0.18–0.40) ns
6OH-MEHP 0.41 (0.11–0.87) 0.25 (0.05–0.35) 1.05 (0.26–1.4) 0.56 (0.32–0.9) 0.01 C vs D; A vs C
Reported results are from Kruskall-Wallis ANOVA.
Data are median (25th-75th percentile);
vs: versus.
doi:10.1371/journal.pone.0117831.t003
DEHP, Obesity and Insulin Sensitivity
PLOS ONE | DOI:10.1371/journal.pone.0117831 February 23, 2015 9 / 16
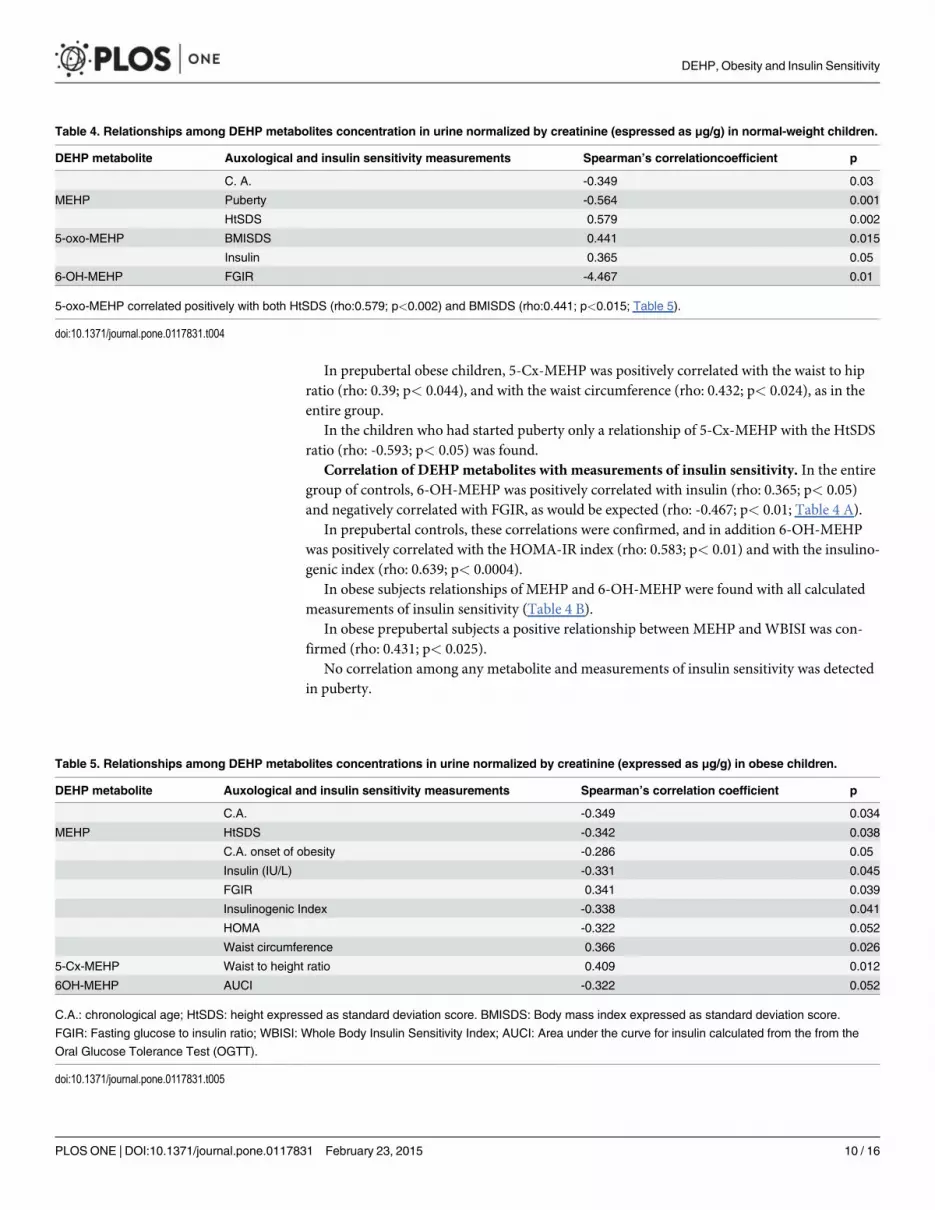
In prepubertal obese children, 5-Cx-MEHP was positively correlated with the waist to hipratio (rho: 0.39; p< 0.044), and with the waist circumference (rho: 0.432; p< 0.024), as in theentire group.
In the children who had started puberty only a relationship of 5-Cx-MEHP with the HtSDSratio (rho: -0.593; p< 0.05) was found.
Correlation of DEHPmetabolites with measurements of insulin sensitivity. In the entiregroup of controls, 6-OH-MEHP was positively correlated with insulin (rho: 0.365; p< 0.05)and negatively correlated with FGIR, as would be expected (rho: -0.467; p< 0.01; Table 4 A).
In prepubertal controls, these correlations were confirmed, and in addition 6-OH-MEHPwas positively correlated with the HOMA-IR index (rho: 0.583; p< 0.01) and with the insulino-genic index (rho: 0.639; p< 0.0004).
In obese subjects relationships of MEHP and 6-OH-MEHP were found with all calculatedmeasurements of insulin sensitivity (Table 4 B).
In obese prepubertal subjects a positive relationship between MEHP andWBISI was con-firmed (rho: 0.431; p< 0.025).
No correlation among any metabolite and measurements of insulin sensitivity was detectedin puberty.
Table 4. Relationships among DEHP metabolites concentration in urine normalized by creatinine (espressed as μg/g) in normal-weight children.
DEHP metabolite Auxological and insulin sensitivity measurements Spearman’s correlationcoefficient p
C. A. -0.349 0.03
MEHP Puberty -0.564 0.001
HtSDS 0.579 0.002
5-oxo-MEHP BMISDS 0.441 0.015
Insulin 0.365 0.05
6-OH-MEHP FGIR -4.467 0.01
5-oxo-MEHP correlated positively with both HtSDS (rho:0.579; p<0.002) and BMISDS (rho:0.441; p<0.015; Table 5).
doi:10.1371/journal.pone.0117831.t004
Table 5. Relationships among DEHP metabolites concentrations in urine normalized by creatinine (expressed as μg/g) in obese children.
DEHP metabolite Auxological and insulin sensitivity measurements Spearman’s correlation coefficient p
C.A. -0.349 0.034
MEHP HtSDS -0.342 0.038
C.A. onset of obesity -0.286 0.05
Insulin (IU/L) -0.331 0.045
FGIR 0.341 0.039
Insulinogenic Index -0.338 0.041
HOMA -0.322 0.052
Waist circumference 0.366 0.026
5-Cx-MEHP Waist to height ratio 0.409 0.012
6OH-MEHP AUCI -0.322 0.052
C.A.: chronological age; HtSDS: height expressed as standard deviation score. BMISDS: Body mass index expressed as standard deviation score.
FGIR: Fasting glucose to insulin ratio; WBISI: Whole Body Insulin Sensitivity Index; AUCI: Area under the curve for insulin calculated from the from the
Oral Glucose Tolerance Test (OGTT).
doi:10.1371/journal.pone.0117831.t005
DEHP, Obesity and Insulin Sensitivity
PLOS ONE | DOI:10.1371/journal.pone.0117831 February 23, 2015 10 / 16

Multiple Regression AnalysisAmultiple regression analysis was performed using MEHP as dependent variable, and HtSDS,BMISDS, gender, puberty, waist circumference, waist to height ratio, CA age at onset of obesity,HOMA, WBISI, AUCG, AUCI, and the insulinogenic index as independent variables in obesechildren. This showed a significant effect of puberty (p: 0.020), a near significant effect of CAage at onset of puberty (p:0.055), and of waist circumference (p: 0.059). In controls, HtSDS,BMISDS, gender, puberty, birth weight, HOMA and insulinogenic index were the available in-dependent variables and a significant relationship was found for puberty (P: 0.001) and a nearsignificant effect for gender (p: 0.051).
Auto-CM analysisThe main relationships among the variables emerging from the AutoCM are shown is Fig. 4.
The condition of obesity and normal-weight were clearly distinct and on opposite sides ofthe graph.
High MEHP and high 6-OH-MEHP concentrations were associated with a high BMISDSwith a moderate-high link strength. Vice versa low 5-oxo-MEHP urine concentrations were as-sociated with a low FGIR and a low insulinogenic index with a very high link strength. A highconcentration of 5-Cx-MEHP was associated with a low HtSDS. Birth weight showed no rela-tionship with the metabolites analyzed.
Fig 4. Semantic Connectivity Map linking DEHPmetabolites. Analysis with auxological parameters and measurements of insulin sensitivity in normal-weight and obese children and adolescents. Values ranging from 0 (no association) to 1 (the strongest association) express the strength of association.
doi:10.1371/journal.pone.0117831.g004
DEHP, Obesity and Insulin Sensitivity
PLOS ONE | DOI:10.1371/journal.pone.0117831 February 23, 2015 11 / 16

DiscussionThe data of this study showed changes in DEHP metabolites related with obesity, onset of pu-berty, and presence of insulin resistance. Changes in urine metabolites were related also withwaist circumference and waist to height ratio, thus to fat distribution.
The main limitation of this study stands in the small number of subjects analysed, however,large population studies have addressed issues related to exposure but have not taken into ac-count aspects specifically related with metabolism and very few studies have considered re-stricted age-groups [45]. We selected subjects all born and living in a small geographical areawithin the Emilia-Romagna Region in the North of Italy, an industrialized area, so that signifi-cant regional exposure differences should have been excluded. One of the major exposureroutes for DEHP, one of the most diffuse phthalates, is represented, however, by food ingestion[46]. A European group estimated exposure to DEHP to be about one order of magnitudehigher in children than in adults supporting the need and interest to assess exposure and me-tabolism in different phases of life [47]. A limitation to this study is represented by the lack ofspecific data relative to food and calorie intake. However, if the obese subjects had been on adiet, a restricted quality/amount of food would have also represented a limitation. We cannotrule out, however, higher food ingestion in these same subjects.
From a metabolic point of view hydrolysis of DEHP, oxidative metabolism of MEHP andorgan-specific metabolites of DEHP have been previously examined in laboratory animals[48–54]. However, the hepatic and extra-hepatic metabolism of DEHP in humans has not beenwell characterized yet.
We detected differences between obese and normal-weight children in the concentration ofDEHPmetabolites in urine. In particular, 5-Cx-MEHP and 6-OH-MEHP were higher in concen-tration in obese than in normal-weight children. This could be generically ascribed to a differentexposure and/or metabolism in the groups investigated. Omega 1 oxidation and transformation ofMEHP to 5-Cx-MEHP was reduced in normal-weight subjects, whereas both ω and ω-1 oxidationend-products (Fig. 3) were increased in obesity. In prepuberty, MEHP seemed to be less oxidized,independent of obesity suggesting that metabolism physiologically changes with age but that thereare differences between obese and normal-weight subjects. In the obese children, 5-oxo-MEHPwas higher in the subjects having an abnormal HOMA index which could suggest that oxidationend products are increased when a degree of insulin resistance is present. Furthermore, the Auto-CM analysis showed a relationship between a low 5-oxo-MEHP concentration and a low FGIR, afeature of insulin-resistance. The low 5-oxo-MEHP concentration was also associated with a lowinsulinogenic index, suggestive of impaired β-cell function.
The negative relationship between MEHP and chronological age suggested an increase inMEHP metabolism with age, and onset of puberty. The negative relationship of MEHP withage at onset of obesity could suggest that a reduced capacity to metabolize MEHP might be acause or consequence of obesity. Furthermore, we detected a negative relationship of MEHPwith waist circumference, and with abdominal fat distribution (waist to height ratio) support-ing a relationship between MEHP metabolism and fat distribution. The multiple regressionanalysis confirmed in the obese group a major effect of puberty, and an effect of chronologicalage at onset of obesity, and of fat distribution (waist circumference).
Moreover, when Auto-CM analysis was used, a high MEHP concentration was directly re-lated with a high BMISDS as well as with high 6-OH-MEHP concentrations in urine. This lat-ter finding was in accordance with other author’s findings. Wang et al. also reported thisrelationship in an 8–11 age-group which would have included both pre-and pubertal subjects[55], and other studies reported this same finding in much wider and heterogeneous popula-tion studies [19,25,56].
DEHP, Obesity and Insulin Sensitivity
PLOS ONE | DOI:10.1371/journal.pone.0117831 February 23, 2015 12 / 16

Among the downstream metabolites, in obese children, 5-Cx-MEHP was correlated with in-creased adipose tissue in prepuberty, whereas in puberty most relationships were lost suggest-ing that puberty in itself played a major role in regulating DEHP metabolism, as confirmed inthe multiple regression analysis in both the normal-weight and obese children. A gender effectwas seen in the normal-weight subjects but statistical significance was not attained likely due tothe limited number of subjects included in this pilot study.
The positive correlation, in controls, of 6-OH-MEHP with insulin, and the HOMA index,and the negative correlation with the FGIR suggested that this metabolic pathway favoured in-sulin resistance. This was further confirmed by the negative relationship of 6-OH-MEHP withthe amount of insulin released (AUCI) in the obese children.
In summary, these findings showed that the more MEHP was metabolised to 6-OH-MEHP,the greater the state of insulin resistance in a given subject, whereas the lesser MEHP was meta-bolised, the lesser insulin was required, the better the FGIR, the lower the HOMA index, andthe higher the WBISI (Table 4 B).
At variance with our study, previous studies in white elderly subjects, evaluating MEHP inserum, failed to detected any relationship with the HOMA-IR index, however, this could bedue both to the age-group considered and to the substrate used to determine its concentration[57, 58]. Interestingly, in our series, 6-OH-MEHP was also the only metabolite capable of dis-criminating between the conditions of obesity and normal- weight.
Finally, in prepubertal controls, 5-Cx-MEHP was found to be negatively correlated withbirth weight. Birth weight was normal in all the children enrolled in the study, however, thismight suggest a possible programming of MEHP metabolism in utero which extends at least toprepubertal years. However, the AutoCM analysis failed to find a link of birth weight with anyof the metabolites studied in this study. Other authors have described relationships of otherphthalates with birth weight [59], therefore, it might be that in this study we were not lookingat the phthalate metabolites significantly influencing growth and weight in utero.
Possible limitations of this study stand in the sample size, in the lack of details related withfood, and daily calorie intake. Furthermore, it is unknown whether the shorter stature in thecontrols could have affected the results.
In conclusion, metabolism changed with age, height, weight, and mostly puberty. Fat distri-bution and measurements of insulin sensitivity showed relationships with specificDEHP metabolites.
Author ContributionsConceived and designed the experiments: MES AMP. Performed the experiments: AS CT FN.Analyzed the data: AS EG LMMES. Contributed reagents/materials/analysis tools: SB GLAMP PL SC. Wrote the paper: MES AS.
References1. Low S, Chin MC, Deurenberg-Yap M (2009) Review on epidemic of obesity. Ann Acad Med Singapore
38: 57–59. PMID: 19221672
2. Stahlhut RW, VanWijngaarden E, Dye TD, Cook S, Swan SH (2007) Concentrations of urinary phthal-ate metabolites are associated with increased waist circumference and insulin resistance in adult U.S.males. Environ Health Perspect 115: 876–882. PMID: 17589594
3. Sugiyama S, Shimada N, Miyoshi H, Yamauchi K (2005) Detection of thyroid sistemi-disrupting chemi-cals using in vivo and in vitro screening essays in Xenopus Laevis. Toxicol Sci 88: 367–374. PMID:16179385
4. Vasiliu O, Cameron L, Gardiner J, Deguire P, KarmausW (2006) Polybrominated biphenyls, polychlori-nated biphenyls, body weight, and incidence of adult-onset diabetes mellitus. Epidemiology 17:352–359. PMID: 16755267
DEHP, Obesity and Insulin Sensitivity
PLOS ONE | DOI:10.1371/journal.pone.0117831 February 23, 2015 13 / 16

5. Meeker JD, Calafat AM, Hauser R (2007) Di(2-ethylhexyl) phthalate metabolites may alter thyroidhor-mone levels in men. Environ. Health Perspect 115: 1029–1034. PMID: 17637918
6. Hong YC, Park EY, Park MS, Ko JA, Oh SY, et al. (2009) Community level exposure to chemicals andoxidative stress in adult population. Toxicol Lett 184: 139–144. doi: 10.1016/j.toxlet.2008.11.001PMID: 19049859
7. Shoelson SE, Lee J, Goldfine AB (2006) Inflammation and insulin resistance. J Clin Invest 116:1793–1801. PMID: 16823477
8. Osborn O, Olefsky JM (2012) The cellular and signaling networks linking the immune system and me-tabolism in disease. Nat Med 18: 363–374. doi: 10.1038/nm.2627 PMID: 22395709
9. Boura-Halfon S, Zick Y (2009) Phosphorylation of IRS proteins; insulin action; and insulin resistance.Am J Physiol Endocrinol Metab 296: 581–591.
10. ATSDR (Agency for Toxic Substances and Disease Registry) (2002) Division of Toxicology. Toxicologi-cal profile for di(2-ethylhexyl)phthalate (DEHP). Atlanta, GA. PMID: 25057650
11. Silva MJ, Samandar E, Preau JL Jr, Needham LL, Calafat AM (2006) Urinary oxidative metabolites of di(2-ethylhexyl) phthalate in humans. Toxicology 219: 22–32. PMID: 16332407
12. Trasande L, Attina TM, Sathyanarayana S, Spanier AJ, Blustein J (2013) Race/ethnicity-specific asso-ciations of urinary phthalates with childhood body mass in a nationally representative sample. EnvironHealth Perspect 121: 501–506. doi: 10.1289/ehp.1205526 PMID: 23428635
13. Casals-Casas C, Feige JN, Desvergne B (2008) Interference of pollutants with PPARs: endocrine dis-ruption meets metabolism. Int J Obes (Lond) 32: S53–61.
14. Desvergne B, Feige JN, Casals-Casas C (2009) PPAR-mediated activity of phthalates: A link to theobesity epidemic? Mol Cell Endocrinol; 304: 43–48. doi: 10.1016/j.mce.2009.02.017 PMID: 19433246
15. Feige JN, Gerber A, Casals-Casas C, Yang Q, Winkler C, et al. (2010) The pollutant diethylhexylphthalate regulates hepatic energy metabolism via species-specific PPARalpha-dependent mecha-nisms. Environ Health Perspect 118: 234–241. doi: 10.1289/ehp.0901217 PMID: 20123618
16. Latini G, Marcovecchio ML, Del Vecchio A, Gallo F, Bertino E, et al. (2009) Influence of environment oninsulin sensitivity. Environ Int 35: 987–993. doi: 10.1016/j.envint.2009.03.008 PMID: 19395033
17. Knudsen N, Laurberg P, Rasmussen LB, Bulow I, Perrild H, et al. (2005) Small differences in thyroidfunction may be important for body mass index and the occurrence of obesity in the population. J ClinEndocrinol Metab 90: 4019–4024. PMID: 15870128
18. Hatch EE, Nelson JW, Stahlhut RW,Webster TF (2010) Association of endocrine disruptors and obesi-ty: perpectives from epidemiological studies. Int J Androl 33: 324–332. doi: 10.1111/j.1365-2605.2009.01035.x PMID: 20113374
19. Hatch EE, Nelson JW, Qureshi MM, Weinberg J, Moore LL, et al. (2008) Association of urinary phthal-ate metabolite concentrations with body mass index and waist circumference: a cross-sectional studyof NHANES data, 1999–2002. Environ Health 7: 27. doi: 10.1186/1476-069X-7-27 PMID: 18522739
20. Koch HM, Bolt HM, Preuss R, Angerer J (2005) Newmetabolites of di(2-ethylhexyl) phthalate (DEHP)in human urine and serum after single oral doses of deuterium-labelled DEHP. Arch Toxicol 79:367–376. PMID: 15700144
21. CrinnionWJ (2010) Toxic effects of the easily avoidable phthalates and parabens. Alter Med Rev 2010;15: 190–196. PMID: 21155623
22. Swan SH (2008) Environmental phthalate exposure in relation to reproductive outcomes and otherhealth endpoints in humans. Environ Res 108: 177–184. PMID: 18949837
23. Hoppin JA, Brock JW, Davis BJ, Baird DD (2002) Reproducibility of urinary phthalate metabolites in firstmorning urine samples. Environ Health Perspect 110: 515–518. PMID: 12003755
24. Hauser R, Meeker JD, Park S, Silva MJ, Calafat AM (2004) Temporal variability of urinary phthalate me-tabolite levels in men of reproductive age. Environ Health Perspect 112: 1734–1740. PMID: 15579421
25. Teitelbaum SL, Britton JA, Calafat AM, Ye X, Silva MJ, et al. (2008) Temporal variability in urinary con-centrations of phthalate metabolites, phytoestrogens and phenols amongminority children in the UnitedStates. Environ Res 106: 257–269. PMID: 17976571
26. Penco S, Grossi E, Cheng S, Intraligi M, Maurelli G, et al. (2005) Assessment of the role of genetic poly-morphism in venous thrombosis through artificial neural networks. Ann HumGen 69: 693–706. PMID:16266408
27. BuscemaM, Grossi E, Snowdon D, Antuono P (2008) Auto-Contractive Maps: an artificial adaptive sys-tem for data mining. An Application to Alzheimer disease. Curr Alzheimer Res 5: 481–498. PMID:18855590
28. Cacciari E, Milani S, Balsamo A, Spada E, Bona G, et al. (2002) Italian cross-sectional growth chartsfor height, weight and BMI (6–20yr). Eu J Clin Nutr 56: 171–180.
DEHP, Obesity and Insulin Sensitivity
PLOS ONE | DOI:10.1371/journal.pone.0117831 February 23, 2015 14 / 16

29. Cole TJ (2002) A chart to link child centiles of body mass index, weight and height. Eur J Clin Nutr 56:1194–1199. PMID: 12494304
30. Cole TJ, Bellizzi MC, Flegal KM, Dietz WH (2000) Establishing a standard definition for child overweightand obesity worldwide: international survey. BMJ 320: 1240–1243. PMID: 10797032
31. Maffeis C, Banzato C, Talamini G, Obesity Study Group of the Italian Society of Pediatric Endocrinologyand Diabetology (2008) Waist-to-height ratio, a useful index to identify high metabolic risk in overweightchildren. J Pediatr 152: 207–213. doi: 10.1016/j.jpeds.2007.09.021 PMID: 18206690
32. Marshall WA, Tanner J (1969) Variations in pattern of pubertal changes in girls. Arch Disease Child 44:291–303. PMID: 5785179
33. Marshall WA, Tanner J (1969) Variations in pattern of pubertal changes in boys. Arch Disease Child45: 13–23.
34. Uwaifo GI, Fallon EM, Chin J, Elberg J, Parikh SJ, et al.(2002) Indices of insulin action, disposal, andsecretion derived from fasting samples and clamps in normal glucose-tolerant black and white children.Diabetes Care; 25: 2081–2087. PMID: 12401760
35. Matsuda M, DeFronzo RA (1999) Insulin sensitivity indices obtained from oral glucose tolerance test-ing: comparison with the euglycemic insulin clamp. Diabetes Care 22: 1462–1470. PMID: 10480510
36. D’Annunzio G, Vanelli M, Pistorio A, Minuto N, Bergamino L, et al. (2009) Insulin resistance and secre-tion indexes in healthy Italian children and adolescents: a multicentre study. Acta Biomed 80: 21–28.PMID: 19705616
37. Belfiore F, Iannello S; Volpicelli G (1998) Insulin sensitivity indices calculated from basal and OGTT-in-duced insulin; glucose; and FFA levels. Mol Gen Metab 63: 134–141.
38. Zimmet P, Alberti G, Kaufman F, Tajima N, Silink M, et al. (2007) International Diabetes FederationTask Force on Epidemiology and Prevention of Diabetes. The metabolic syndrome in children and ado-lescents. Lancet 369: 2059–2061. PMID: 17586288
39. Testa C, Nuti F, Hayek J, De Felice C, Chelli M, et al. (2012) Di-(2-ethylhexyl) phthalate and autismspectrum disorders. ASN Neuro 4: 223–229. doi: 10.1042/AN20120015 PMID: 22537663
40. Nuti F, Hildenbrand S, Chelli M, Wodarz R, Papini AM (2005) Synthesis of DEHPmetabolites as bio-markers for GC-MS evaluation of phthalates as endocrine disrupters. Bioorg Med Chem 13:3461–3465. PMID: 15848759
41. Blount BC, Milgram KE, Silva MJ, Malek NA, Reidy JA, et al. (2000) Quantitative detection of eightphthalate metabolites in human urine using HPLC-APCIMS/MS. Anal Chem 72: 4127–4134. PMID:10994974
42. Licastro F, Porcellini E, Chiappelli M, Forti P, BuscemaM, et al. (2010) Multivariable network associat-ed with cognitive decline and dementia. Neurobiol Aging 31: 257–269. doi: 10.1016/j.neurobiolaging.2008.03.019 PMID: 18485535
43. Eller-Vainicher C, Zhukouskaya VV, Tolkachev YV, Koritko SS, Cairoli E, et al. (2011) Low bone miner-al density and its predictors in type 1 diabetic patients evaluated by the classic statistics and artificialneural network analysis. Diabetes Care 34: 2186–2191. doi: 10.2337/dc11-0764 PMID: 21852680
44. Gironi M, Saresella M, Rovaris M, Vaghi M, Nemni R, et al. (2013) A novel data mining system pointsout ridde relationships between immunological markers in multiple sclerosis. Immun Ageing 10: 1–7.doi: 10.1186/1742-4933-10-1 PMID: 23305498
45. Silva MJ, Barr DB, Reidy JA, Malek NA, Hodge CC, et al. (2004) Urinary level of seven pthalate metab-olites in the US population from the National Health and Nutrition Examination Survey (NHANES)1999–2000. Environ Health Perspect 112: 331–338. PMID: 14998749
46. Clark K, Cousins I, Mac Kay D (2003) Assessment of critical exposure pathways In: Staples C, ed. TheHandbook of Environmental Chemistry, Vol 3Q; Phthalate Esters, Springer: New York, pp 227–262.
47. Wormuth M, Scheringer M, Vollenweider M, Hungerbühler K (2006) What are the sources of exposureto eight frequently used phthalic acid esters in Europeans? Risk Anal 26: 803–824. PMID: 16834635
48. Albro PW, Corbett JT, Schroeder JL, Jordan S, Matthews HB (1982) Pharmacokinetics, interactionswith macromolecules and species differences in metabolism of DEHP. Environ Health Perspect 45:19–25. PMID: 7140694
49. Driven HAAM, Van Den Broek PHH, Peeters MCE, Peters JGP, MennesWC, et al. (1993) Effects ofthe peroxisome proliferator mono(2-ethylhexyl) phthalate in primary hepatocytes cultures derived fromrat, guinea pig, rabbit and monkey. Biochem Pharmacol 45: 2425–2434. PMID: 8328980
50. Ito Y, Yokota H, Wang R, Yamanoshita O, Ichihara G, et al. (2005) Species differences in the metabo-lism of di(2-ethylhexyl) phthalate (DEHP) in several organs of mice, rats, and marmosets. Arch Toxicol79: 147–154. PMID: 15798888
DEHP, Obesity and Insulin Sensitivity
PLOS ONE | DOI:10.1371/journal.pone.0117831 February 23, 2015 15 / 16

51. Peck CC, Albro PW (1982) Toxic potential of the plasticizer di(2-ethylhexyl) phthalate in the context ofits disposition and metabolism in primates and man. Environ Health Perspect 45: 11–17. PMID:7140682
52. Kato K, Silva MJ, Needham LL, Calafat AM (2005) Determination of 16 phthalate metabolites in urineusing automated sample preparation andon-line preconcentration/high-performance liquid chromatog-raphy/tandemmass spectrometry. Anal Chem 77: 2985–2991. PMID: 15859620
53. CDC (Centers for Disease Control and Prevention) (2009) The 4th National Report on Human Expo-sure to Environmental Chemicals. http://www.cdc.gov/exposurereport/pdf/FourthReport.pdf. Accessed2009 June 1st.
54. Choi K, Joo H, Campbell JL Jr, Clewell RA, Andersen ME, et al. (2012) In vitro metabolism of di(2-ethyl-hexyl) phthalate (DEHP) by various tissues and cytochrome P450s of human and rat. Toxicol In Vitro26: 315–322. doi: 10.1016/j.tiv.2011.12.002 PMID: 22186153
55. Wang H, Zhou Y, Tang C, He Y, Wu J, et al. (2013) Urinary phthalate metabolites are associated withbody mass index and waist circumference in Chinese school children. Plos One 8: e56800. doi: 10.1371/journal.pone.0056800 PMID: 23437242
56. Boas M, Frederiksen H, Feldt-Rasmussen U, Skakkebaek NF, Hegedus L, et al. (2010) Childhood ex-posure to phthalates: associations with thyroid function, insulin-like growth factor I, and growth. EnvironHealth Perspect 118: 1458–1464. doi: 10.1289/ehp.0901331 PMID: 20621847
57. Norris JM, Rich SS (2012) Genetics of glucose homeostasis: implications for insulin resistance andmetabolic syndrome. Arterioscler Thromb Vasc Biol 32: 2091–2096. doi: 10.1161/ATVBAHA.112.255463 PMID: 22895670
58. Lind PM, Zethelius B, Lind L (2012) Circulating levels of Phthalate metabolites are associated with prev-alent diabetes in the elderly. Diabetes Care 35: 1519–1524. doi: 10.2337/dc11-2396 PMID: 22498808
59. Philippat C, Mortamais M, Chevrier C, Petit C, Calafat AM, et al. (2011). Exposure to Phthalates andPhenols during pregnancy and offspring size at birth- Environ Health Perspect 120:464–470. doi: 10.1289/ehp.1103634 PMID: 21900077
DEHP, Obesity and Insulin Sensitivity
PLOS ONE | DOI:10.1371/journal.pone.0117831 February 23, 2015 16 / 16


