Embed Size (px)
Citation preview
ARTICLE IN PRESS
Available at www.sciencedirect.com
journal homepage: www.elsevier.com/locate/ijhydene
I N T E R N A T I O N A L J O U R N A L O F H Y D R O G E N E N E R G Y 3 3 ( 2 0 0 8 ) 1 7 3 5 – 1 7 4 6
0360-3199/$ - see frodoi:10.1016/j.ijhyde
�Corresponding auE-mail address:
Review
Diagnostic tools in PEM fuel cell research:Part I Electrochemical techniques
Jinfeng Wua, Xiao Zi Yuana, Haijiang Wanga,�, Mauricio Blancoa,b,Jonathan J. Martina, Jiujun Zhanga
aInstitute for Fuel Cell Innovation, National Research Council Canada, Vancouver, BC, Canada V6T 1W5bDepartment of Chemical and Biological Engineering, University of British Columbia, Vancouver, BC, Canada V6T 1Z4
a r t i c l e i n f o
Article history:
Received 5 December 2007
Accepted 19 January 2008
Keywords:
PEM fuel cell
Stack
Diagnostic tool
Design
nt matter & 2008 Internane.2008.01.013
thor. Tel.: +1 604 221 3038;[email protected]
a b s t r a c t
To meet the power density, reliability, and cost requirements that will enable a widespread
use of fuel cells, many research activities focus on an understanding of the thermo-
dynamics as well as the fluid mechanical and electrochemical processes within a fuel cell.
To date, a wide range of experimental diagnostics is imperative not only to help a
fundamental understanding of fuel cell dynamics but also to provide benchmark-quality
data for modeling research. This two-part paper reviews various tools for diagnosing
polymer electrolyte membrane (PEM) fuel cells and stacks, and attempts to incorporate the
most recent technical advances in PEM fuel cell diagnosis. In Part I, we review various
electrochemical techniques and outline the principle, experimental implementation, and
data processing of each technique. Capabilities and weaknesses of these techniques are
also discussed. In Part II of the review we will cover physical/chemical methods.
& 2008 International Association for Hydrogen Energy. Published by Elsevier Ltd. All rights
reserved.
Contents
1. Introduction . . . . . . . . . . . . . . . . . . . . . . . . . . . . . . . . . . . . . . . . . . . . . . . . . . . . . . . . . . . . . . . . . . . . . . . . . . . . . . . . . . 1736
2. Electrochemical techniques . . . . . . . . . . . . . . . . . . . . . . . . . . . . . . . . . . . . . . . . . . . . . . . . . . . . . . . . . . . . . . . . . . . . . . 1736
2.1. Polarization curve. . . . . . . . . . . . . . . . . . . . . . . . . . . . . . . . . . . . . . . . . . . . . . . . . . . . . . . . . . . . . . . . . . . . . . . . . 1736
2.2. Current interruption. . . . . . . . . . . . . . . . . . . . . . . . . . . . . . . . . . . . . . . . . . . . . . . . . . . . . . . . . . . . . . . . . . . . . . . 1738
2.3. Electrochemical impedance spectroscopy . . . . . . . . . . . . . . . . . . . . . . . . . . . . . . . . . . . . . . . . . . . . . . . . . . . . . . 1739
2.3.1. Cathode behavior . . . . . . . . . . . . . . . . . . . . . . . . . . . . . . . . . . . . . . . . . . . . . . . . . . . . . . . . . . . . . . . . . . . 1739
2.3.2. Anode behavior . . . . . . . . . . . . . . . . . . . . . . . . . . . . . . . . . . . . . . . . . . . . . . . . . . . . . . . . . . . . . . . . . . . . 1740
2.3.3. Fuel cell stack. . . . . . . . . . . . . . . . . . . . . . . . . . . . . . . . . . . . . . . . . . . . . . . . . . . . . . . . . . . . . . . . . . . . . . 1740
2.3.4. Summary . . . . . . . . . . . . . . . . . . . . . . . . . . . . . . . . . . . . . . . . . . . . . . . . . . . . . . . . . . . . . . . . . . . . . . . . . 1741
2.4. Other electrochemical methods . . . . . . . . . . . . . . . . . . . . . . . . . . . . . . . . . . . . . . . . . . . . . . . . . . . . . . . . . . . . . . 1741
2.4.1. Cyclic voltammetry (CV). . . . . . . . . . . . . . . . . . . . . . . . . . . . . . . . . . . . . . . . . . . . . . . . . . . . . . . . . . . . . . 1741
2.4.2. CO stripping voltammetry . . . . . . . . . . . . . . . . . . . . . . . . . . . . . . . . . . . . . . . . . . . . . . . . . . . . . . . . . . . . 1742
tional Association for Hydrogen Energy. Published by Elsevier Ltd. All rights reserved.
fax: +1 604 221 3001.c.ca (H. Wang).

ARTICLE IN PRESS
I N T E R N AT I O N A L J O U R N A L O F H Y D R O G E N E N E R G Y 3 3 ( 2 0 0 8 ) 1 7 3 5 – 1 7 4 61736
2.4.3. Linear sweep voltammetry (LSV) . . . . . . . . . . . . . . . . . . . . . . . . . . . . . . . . . . . . . . . . . . . . . . . . . . . . . . . 1743
2.4.4. Cathode discharge . . . . . . . . . . . . . . . . . . . . . . . . . . . . . . . . . . . . . . . . . . . . . . . . . . . . . . . . . . . . . . . . . . 1743
3. Concluding remarks . . . . . . . . . . . . . . . . . . . . . . . . . . . . . . . . . . . . . . . . . . . . . . . . . . . . . . . . . . . . . . . . . . . . . . . . . . . . 1743
Acknowledgment. . . . . . . . . . . . . . . . . . . . . . . . . . . . . . . . . . . . . . . . . . . . . . . . . . . . . . . . . . . . . . . . . . . . . . . . . . . . . . . 1744
References . . . . . . . . . . . . . . . . . . . . . . . . . . . . . . . . . . . . . . . . . . . . . . . . . . . . . . . . . . . . . . . . . . . . . . . . . . . . . . . . . . . . 1744
1. Introduction
Much attention has been paid to fuel cells because they
offer a highly efficient and environmentally friendly technol-
ogy for energy conversion. Of the various types of fuel cells
available, polymer electrolyte membrane (PEM) fuel cells are
considered to be the most promising for both stationary and
mobile applications due to their significant advantages such
as high efficiency and the absence of noxious emissions [1].
However, the commercial success of PEM fuel cells depends
on their performance durability and cost competitiveness
with other energy conversion and power generation devices.
A better understanding of all the operating parameters
influencing the function of the entire cell and phenomena
occurring in the electrodes, especially the performance and
efficiency-limiting processes, is essential for achieving this
goal.
Fuel cell science and technology cuts across multiple
disciplines, including materials science, interfacial science,
transport phenomena, electrochemistry, and catalysis. It is
always a major challenge to fully understand the thermo-
dynamics, fluid mechanics, fuel cell dynamics, and electro-
chemical processes within a fuel cell. A large number of
researchers are currently placing their focus on experimental
diagnostics and mathematical modeling. On the one hand,
diagnostic tools can help distinguish the structure–property–
performance relationships between a fuel cell and its
components. On the other hand, results obtained from
experimental diagnostics also provide benchmark-quality
data for fundamental models, which further benefit in
prediction, control, and optimization of various transport
and electrochemical processes occurring within fuel cells.
At present, researchers characterizing PEM fuel cells are
mainly concentrated on the following issues: (1) mass
distribution [2,3], especially water distribution over the active
electrode including flooding detection leading to low catalyst
utilization, (2) resistance diagnosis and membrane drying
detection [4,5], which closely relate to membrane conductiv-
ity, (3) optimization of electrode structures and components
[6], fuel cell design, and operating conditions [7,8], (4) current
density distribution in dimensionally large scale fuel cells
[9,10], (5) temperature variation resulting from a non-uniform
electrochemical reaction and contact resistance in a single
cell [11,12], and different interconnection resistances for a
stack, and (6) flow visualization for direct observation of what
is occurring within the fuel cell [13,14]. Due to the complexity
of the heat and mass transport processes occurring in fuel
cells, there are typically a multitude of parameters to be
determined. For all the previous reasons, it is important to
examine the operation of PEM fuel cells or stacks with
suitable techniques, which allow for evaluation of these
parameters separately and can determine the influence of
each on the global fuel cell performance.
Various diagnostic tools for the accurate analysis of PEM
fuel cells and stacks have been developed. A few review
papers have also been published about these prior efforts in
PEM fuel cell diagnostics. In a recent review about funda-
mental models for fuel cell engineering, Wang [15] briefly
summarized some diagnostic techniques, which were parti-
cularly pertinent to the modeling of PEM fuel cells. Hinds [16]
provided a good review of the literature regarding experi-
mental techniques employed in the characterization of fuel
cell performance and durability, but his work was mainly
limited to ex situ tools and applications.
The objective of this review is to provide a comprehensive
survey of in situ diagnostic tools presently used in PEM fuel
cell research. For the purpose of perspicuity, in this review,
various diagnostic tools employed in the characterization and
determination of fuel cell performances are summarized into
two general categories: electrochemical techniques and
physical/chemical methods. Electrochemical techniques are
discussed in this part, while physical/chemical methods will
be discussed in Part II.
2. Electrochemical techniques
Electrochemical techniques, such as the polarization curve,
current interruption, and electrochemical impedance spec-
troscopy (EIS), have been popularly employed in the diagnosis
of fuel cells. Recent advances in the application of these
electrochemical approaches to PEM fuel cells are described
herein, and some novel methods are covered.
2.1. Polarization curve
A plot of cell potential against current density under a set of
constant operating conditions, known as a polarization curve,
is the standard electrochemical technique for characterizing
the performance of fuel cells (both single cells and stacks)
[17–19]. It yields information on the performance losses in the
cell or stack under operating conditions. A steady-state
polarization curve can be obtained by recording the current
as a function of cell potential or recording the cell potential as
the cell current changes. A non-steady state polarization
curve can be obtained using a rapid current sweep [20]. By
measuring polarization curves certain parameters such as the
effects of the composition, flow rate, temperature, and
relative humidity of the reactant gases on cell performance
can be characterized and compared systematically.
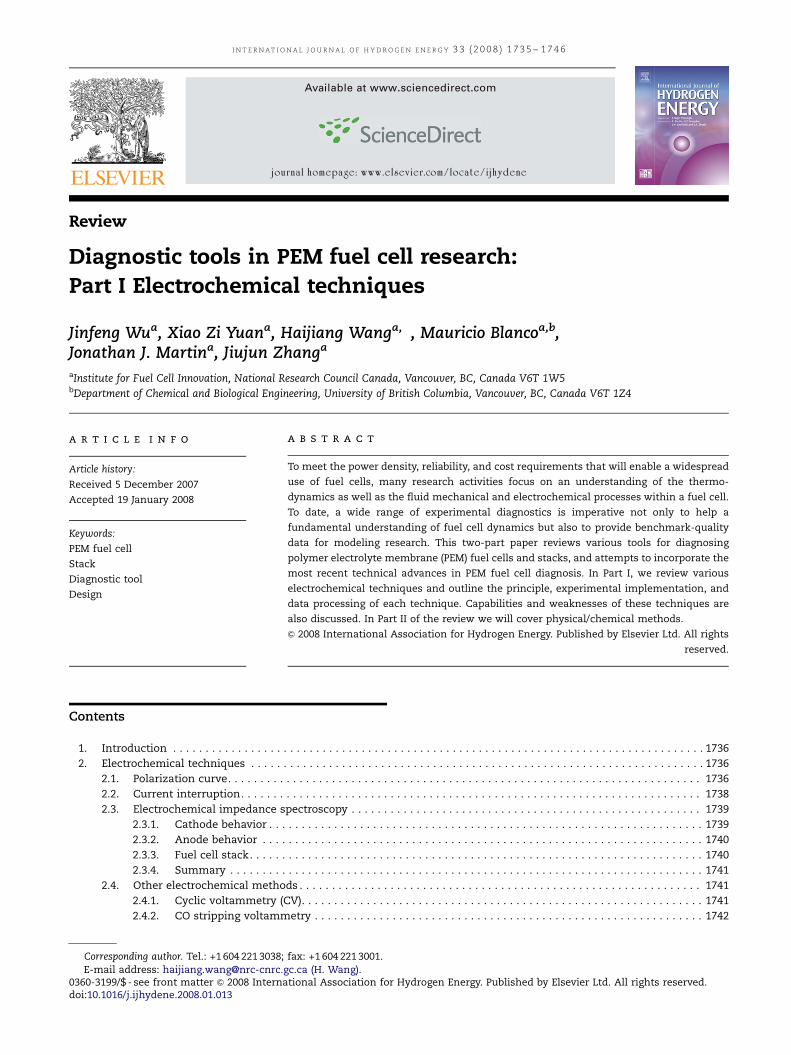
The ideal polarization curve for a single hydrogen/air fuel
cell has three major regions, which are shown in Fig. 1 [17]. At
low current densities (the region of activation polarization),
the cell potential drops sharply and the majority of these
losses are due to the sluggish kinetics of oxygen reduction
reaction (ORR) [17]. At intermediate current densities (the
ARTICLE IN PRESS
Fig. 1 – Schematic of an ideal polarization curve with the
corresponding regions and overpotentials (modified from
Barbir [17] with permission).
I N T E R N A T I O N A L J O U R N A L O F H Y D R O G E N E N E R G Y 3 3 ( 2 0 0 8 ) 1 7 3 5 – 1 7 4 6 1737
region of ohmic polarization), the voltage loss caused by
ohmic resistance becomes significant and results mainly
from resistance to the flow of ions in the electrolyte and
resistance to the flow of electrons through the electrode [21].
In this region, the cell potential decreases nearly linearly with
current density, while the activation overpotential reaches a
relatively constant value [17]. At high current densities (the
region of concentration polarization), mass transport effects
dominate due to the transport limit of the reactant gas
through the pore structure of the gas diffusion layers (GDLs)
and electrocatalyst layers (CLs), and cell performance drops
drastically [22]. From Fig. 1 it can also be seen that the
difference between the theoretical cell potential (1.23 V) and
the thermoneutral voltage (1.4 V) represents the energy loss
under the reversible condition (the reversible loss) [19]. Very
often, polarization curves are converted to power density
versus current density plots by multiplying the potential by
the current density at each point of the curve.
Up to now, several modeling studies have been carried out
to elucidate the electrochemical behavior of PEM fuel cells,
and for this purpose, several empirical equations were
introduced to mimic the polarization curves. Srinivasan
et al. [23,24] developed the following equation to describe
the relation between the cell voltage, E, and current density, i,
in the low and intermediate current density ranges, where
the electrochemical reaction is controlled by the activation
and ohmic losses:
E ¼ E0 � b logðiÞ � Ri, (1)
where E0 ¼ Er þ b log i0 and the two subsequent terms de-
scribe the different loss mechanisms. Er is the reversible
potential of the cell, i0 and b are the exchange current density
and Tafel slope for oxygen reduction, respectively. The second
term in Eq. (1) is predominant at low current densities and
describes the activation overpotential. In the third term, R
represents the resistance that causes a linear variation of the
cell potential with the current density, which is predominant
in the intermediate current density region.
Kim et al. [25] modified Eq. (1) by introducing an additional
term in order to fit the cell voltage against current density
behavior over the whole current density range,
E ¼ E0 � Ri� b logðiÞ �m expðniÞ, (2)
where m and n are the parameters related to mass transport
limitation. Bevers et al. [26] found in their one-dimensional
model that m correlates to the electrolyte conductivity and n
to the porosity of the GDL. In the high current density region
the last term becomes predominant, and is used to match the
losses due to the mass transport limitations.
Lee et al. [27] took into account the influence of pressure
parameters on the concentration polarization in PEM fuel cell
stack models,
E ¼ E0 � Ri� b logðiÞ �m expðniÞ � a logP
PO2
!, (3)
where P is the total pressure, PO2is the partial pressure of
oxygen, and a is an empirical equation constant.
Based on Eq. (2), Squadrito et al. [28] developed a
logarithmic equation based on a mechanistic analysis in
order to find an expression for the concentration polarization,
which was then modified to fit a set of experimental data:
E ¼ E0 � Ri� b logðiÞ þ aik lnð1� biÞ, (4)
where the term aik accounts for the pre-logarithmic terms
attributed to the different contributions and acts as an
‘‘amplification term’’, expressed in potential units, k is a
dimensionless number, b is the inverse of the limiting current
density, a is the transfer coefficient. It was further claimed
that Eq. (4) was able to predict a more accurate behavior at
high current densities since k mainly influences the point at
which there is departure from the linear behavior and adetermines the shape of the curve at high current densities.
The nonlinear contributions to the cell potential drop at
high current densities result from interface phenomena
occurring in the cathode reactive region. Pisani et al. [29]
developed a semi-empirical equation, based on the integral of
the oxygen concentration over the reactive region,
E ¼ E0 � Ri� b lnðiÞ þ a ln 1�i
ilS�mð1�i=ilÞ
� �, (5)
where S is a flooding parameter, m is an empirical constant,
and il is the limiting current density.
More complex empirical equations based on Eq. (2) have also
been developed. For example, Amphlett et al. [30] presented
empirical equations and terms that related activation losses,
internal resistance, and all temperature dependencies through
fitting parameters. Sena et al. [31] analyzed the catalyst layer
and considered it as a thin film/flooded agglomerate, thus the
gas diffusion electrode is assumed to be formed by an
assembly of flooded zones (catalytic zones) and empty zones
(no catalyst present). The final equation related the oxygen
diffusion effects in the gas diffusion electrode:
E ¼ E0 � Ri� b logðiÞ þ b log 1�i
iO2L
!, (6)
where iO2L is the limiting current density due to a limiting
oxygen diffusion effect.
More recently, Williams et al. [32] described a technique
based on the analysis of polarization curves (through similar
equations shown previously) that evaluates six sources of
ARTICLE IN PRESS
I N T E R N AT I O N A L J O U R N A L O F H Y D R O G E N E N E R G Y 3 3 ( 2 0 0 8 ) 1 7 3 5 – 1 7 4 61738
polarization, mainly associated with the cathode side of a
PEM fuel cell.
Polarization curves provide information on the perfor-
mance of the cell or stack as a whole. While they are useful
indicators of overall performance under specific operating
conditions, they fail to produce much information about the
performance of individual components within the cell. They
cannot be performed during normal operation of a fuel cell
and take significant time to finish. In addition, they fail to
differentiate different mechanisms from each other; for
example, both flooding and drying inside a fuel cell cannot
be distinguished in a single polarization curve [17]. They are
also incapable of resolving time-dependent processes occur-
ring in the fuel cell and the stack [16]. For the latter purpose,
current interrupt, EIS measurements, and other electroche-
mical approaches are preferred. These techniques will be
introduced in the following sections.
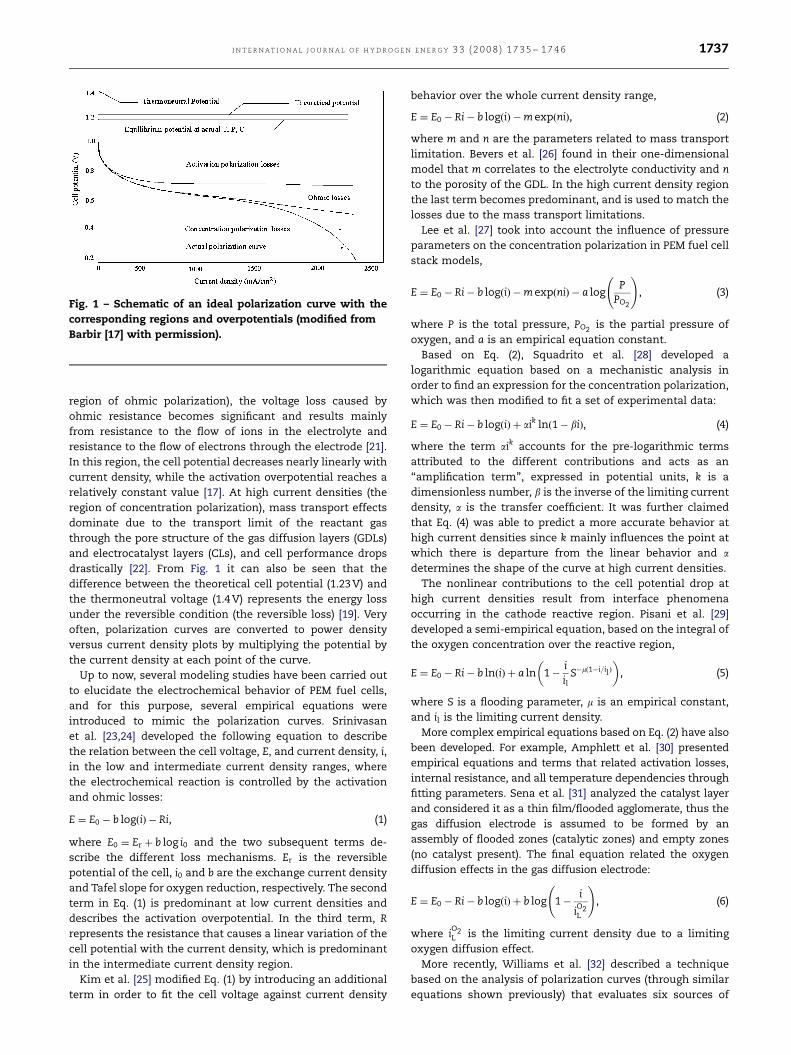
2.2. Current interruption
In general, the current interrupt method is used for measure-
ment of the ohmic losses (i.e., cell resistance) in a PEM fuel
cell. The principle of the technique is that the ohmic losses
vanish much faster than the electrochemical overpotentials
when the current is interrupted [33]. As shown schematically
in Fig. 2, a typical current interrupt result is presented by
recording the voltage transient upon interruption of the
current after the fuel cell had been operated at a constant
current. The ohmic losses disappear almost immediately and
the electrochemical (or activation) overpotentials decline to
the open circuit value at a considerably slower rate. There-
fore, rapid acquisition of the voltage transient data is of vital
importance to adequate separation of the ohmic and activa-
Fig. 2 – Ideal voltage transient in a PEM fuel cell after current
interruption. The cell is operated at a fixed current. At t ¼ t0,
the current is interrupted and the ohmic losses vanish
almost immediately. After the current interruption,
overpotentials start to decay and the voltage rises
exponentially toward the open-circuit voltage. At t ¼ t1, the
current is again switched on (from Mennola et al. [4] with
permission).
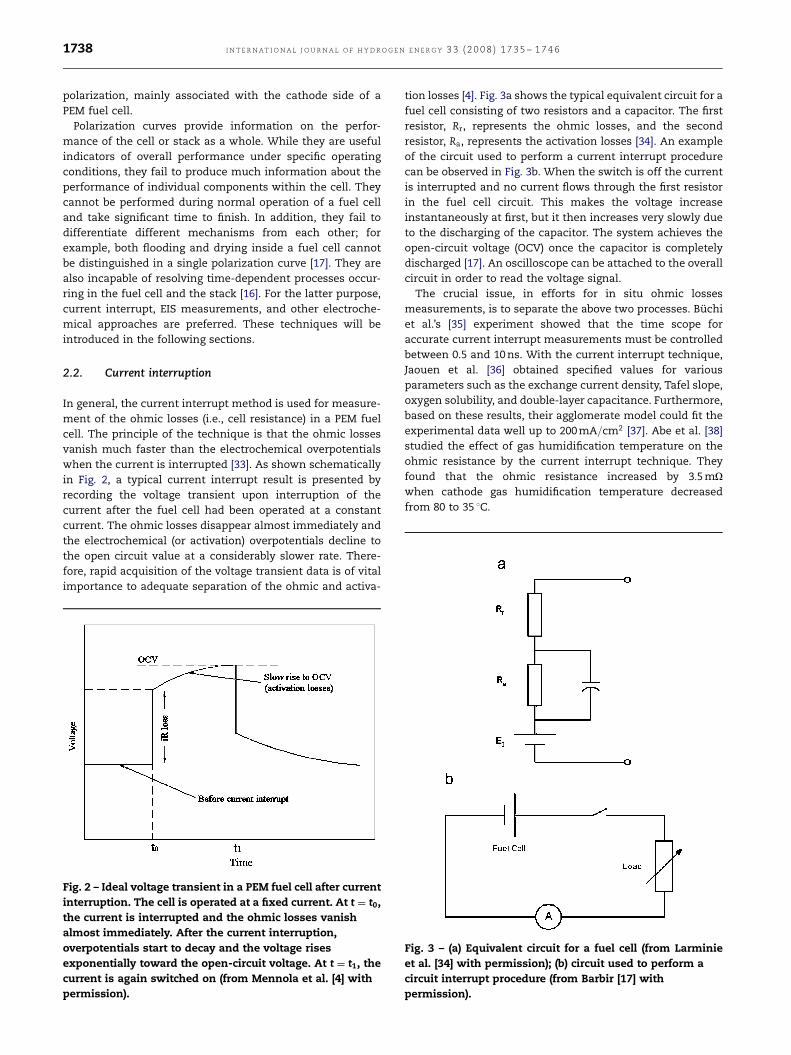
tion losses [4]. Fig. 3a shows the typical equivalent circuit for a
fuel cell consisting of two resistors and a capacitor. The first
resistor, Rr, represents the ohmic losses, and the second
resistor, Ra, represents the activation losses [34]. An example
of the circuit used to perform a current interrupt procedure
can be observed in Fig. 3b. When the switch is off the current
is interrupted and no current flows through the first resistor
in the fuel cell circuit. This makes the voltage increase
instantaneously at first, but it then increases very slowly due
to the discharging of the capacitor. The system achieves the
open-circuit voltage (OCV) once the capacitor is completely
discharged [17]. An oscilloscope can be attached to the overall
circuit in order to read the voltage signal.
The crucial issue, in efforts for in situ ohmic losses
measurements, is to separate the above two processes. Buchi
et al.’s [35] experiment showed that the time scope for
accurate current interrupt measurements must be controlled
between 0.5 and 10 ns. With the current interrupt technique,
Jaouen et al. [36] obtained specified values for various
parameters such as the exchange current density, Tafel slope,
oxygen solubility, and double-layer capacitance. Furthermore,
based on these results, their agglomerate model could fit the
experimental data well up to 200 mA=cm2 [37]. Abe et al. [38]
studied the effect of gas humidification temperature on the
ohmic resistance by the current interrupt technique. They
found that the ohmic resistance increased by 3:5 mO
when cathode gas humidification temperature decreased
from 80 to 35 1C.
Fig. 3 – (a) Equivalent circuit for a fuel cell (from Larminie
et al. [34] with permission); (b) circuit used to perform a
circuit interrupt procedure (from Barbir [17] with
permission).
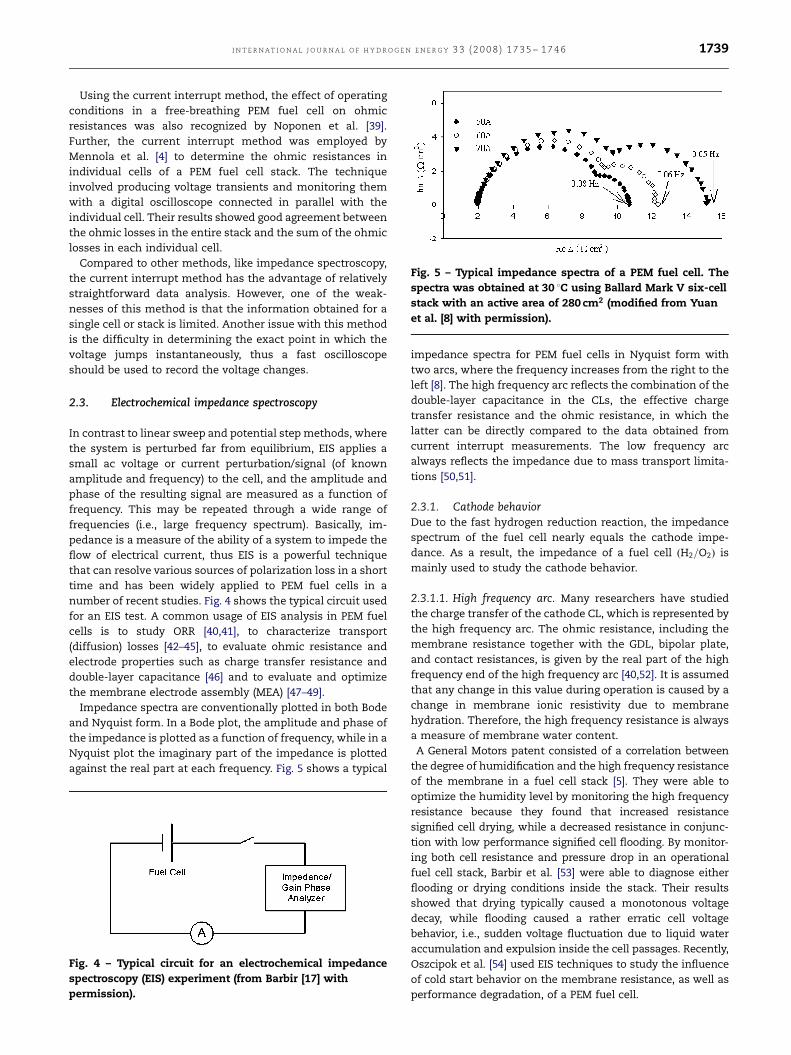
ARTICLE IN PRESS
Fig. 5 – Typical impedance spectra of a PEM fuel cell. The
spectra was obtained at 30 1C using Ballard Mark V six-cell
stack with an active area of 280 cm2 (modified from Yuan
et al. [8] with permission).
I N T E R N A T I O N A L J O U R N A L O F H Y D R O G E N E N E R G Y 3 3 ( 2 0 0 8 ) 1 7 3 5 – 1 7 4 6 1739
Using the current interrupt method, the effect of operating
conditions in a free-breathing PEM fuel cell on ohmic
resistances was also recognized by Noponen et al. [39].
Further, the current interrupt method was employed by
Mennola et al. [4] to determine the ohmic resistances in
individual cells of a PEM fuel cell stack. The technique
involved producing voltage transients and monitoring them
with a digital oscilloscope connected in parallel with the
individual cell. Their results showed good agreement between
the ohmic losses in the entire stack and the sum of the ohmic
losses in each individual cell.
Compared to other methods, like impedance spectroscopy,
the current interrupt method has the advantage of relatively
straightforward data analysis. However, one of the weak-
nesses of this method is that the information obtained for a
single cell or stack is limited. Another issue with this method
is the difficulty in determining the exact point in which the
voltage jumps instantaneously, thus a fast oscilloscope
should be used to record the voltage changes.
2.3. Electrochemical impedance spectroscopy
In contrast to linear sweep and potential step methods, where
the system is perturbed far from equilibrium, EIS applies a
small ac voltage or current perturbation/signal (of known
amplitude and frequency) to the cell, and the amplitude and
phase of the resulting signal are measured as a function of
frequency. This may be repeated through a wide range of
frequencies (i.e., large frequency spectrum). Basically, im-
pedance is a measure of the ability of a system to impede the
flow of electrical current, thus EIS is a powerful technique
that can resolve various sources of polarization loss in a short
time and has been widely applied to PEM fuel cells in a
number of recent studies. Fig. 4 shows the typical circuit used
for an EIS test. A common usage of EIS analysis in PEM fuel
cells is to study ORR [40,41], to characterize transport
(diffusion) losses [42–45], to evaluate ohmic resistance and
electrode properties such as charge transfer resistance and
double-layer capacitance [46] and to evaluate and optimize
the membrane electrode assembly (MEA) [47–49].
Impedance spectra are conventionally plotted in both Bode
and Nyquist form. In a Bode plot, the amplitude and phase of
the impedance is plotted as a function of frequency, while in a
Nyquist plot the imaginary part of the impedance is plotted
against the real part at each frequency. Fig. 5 shows a typical
Fig. 4 – Typical circuit for an electrochemical impedance
spectroscopy (EIS) experiment (from Barbir [17] with
permission).
impedance spectra for PEM fuel cells in Nyquist form with
two arcs, where the frequency increases from the right to the
left [8]. The high frequency arc reflects the combination of the
double-layer capacitance in the CLs, the effective charge
transfer resistance and the ohmic resistance, in which the
latter can be directly compared to the data obtained from
current interrupt measurements. The low frequency arc
always reflects the impedance due to mass transport limita-
tions [50,51].
2.3.1. Cathode behaviorDue to the fast hydrogen reduction reaction, the impedance
spectrum of the fuel cell nearly equals the cathode impe-
dance. As a result, the impedance of a fuel cell ðH2=O2Þ is
mainly used to study the cathode behavior.
2.3.1.1. High frequency arc. Many researchers have studied
the charge transfer of the cathode CL, which is represented by
the high frequency arc. The ohmic resistance, including the
membrane resistance together with the GDL, bipolar plate,
and contact resistances, is given by the real part of the high
frequency end of the high frequency arc [40,52]. It is assumed
that any change in this value during operation is caused by a
change in membrane ionic resistivity due to membrane
hydration. Therefore, the high frequency resistance is always
a measure of membrane water content.
A General Motors patent consisted of a correlation between
the degree of humidification and the high frequency resistance
of the membrane in a fuel cell stack [5]. They were able to
optimize the humidity level by monitoring the high frequency
resistance because they found that increased resistance
signified cell drying, while a decreased resistance in conjunc-
tion with low performance signified cell flooding. By monitor-
ing both cell resistance and pressure drop in an operational
fuel cell stack, Barbir et al. [53] were able to diagnose either
flooding or drying conditions inside the stack. Their results
showed that drying typically caused a monotonous voltage
decay, while flooding caused a rather erratic cell voltage
behavior, i.e., sudden voltage fluctuation due to liquid water
accumulation and expulsion inside the cell passages. Recently,
Oszcipok et al. [54] used EIS techniques to study the influence
of cold start behavior on the membrane resistance, as well as
performance degradation, of a PEM fuel cell.
ARTICLE IN PRESS
I N T E R N AT I O N A L J O U R N A L O F H Y D R O G E N E N E R G Y 3 3 ( 2 0 0 8 ) 1 7 3 5 – 1 7 4 61740
While the high frequency intercept corresponds to the
ohmic resistance, the diameter of the arc relates to the
charge transfer resistance of the CLs at high frequencies.
Many models were developed to discuss the mechanism of
the cathode CLs, such as the simple pore model [55],
agglomerate model [55], macrohomogeneous model [42,43],
and flooded-agglomerate model [56] under stationary condi-
tions. Several equivalent circuit models have also been
developed to mimic the spectra, such as the nonlinear least-
squares procedure (NLSQ) [56] and transmission line model
[43]. Consequently, the effects due to charge transfer, air
diffusion through the pores of CL, and diffusion in the
ionomer layer surrounding the catalyst particles could be
separated.
Based on a macrohomogeneous model of the gas diffusion
electrode, Springer et al. [42] demonstrated that simultaneous
fitting of impedance spectra obtained at different potentials
could be used to evaluate the sources of PEM fuel cell losses.
Three different types of losses caused by interfacial kinetics,
CL proton conductivity, and membrane conductivity, were
resolved in their impedance spectra. Eikerling and Korn [43]
employed the macrohomogeneous model to describe the
impedance responses of PEM fuel cells and further used the
transmission line model to simulate the impedance spectra.
The relationship between the structure of the CL and
impedance spectra was studied as well. The transmission
line model was also employed by Makharia et al. [57] to mimic
the CLs in H2=N2 and H2=O2 fueled PEM fuel cells. Parameters
such as cell ohmic resistance, CL electrolyte resistance, and
double-layer capacitance were extracted. More recently,
Lefebvre et al. [44] and Jia et al. [58] used the transmission
line model to simulate the impedance behavior of PEM fuel
cell CLs under a N2 atmosphere at the cathode side and,
ultimately, the ionomer loading in the CL [6] was optimized.
Furthermore, they used EIS to study the capacitance and ion
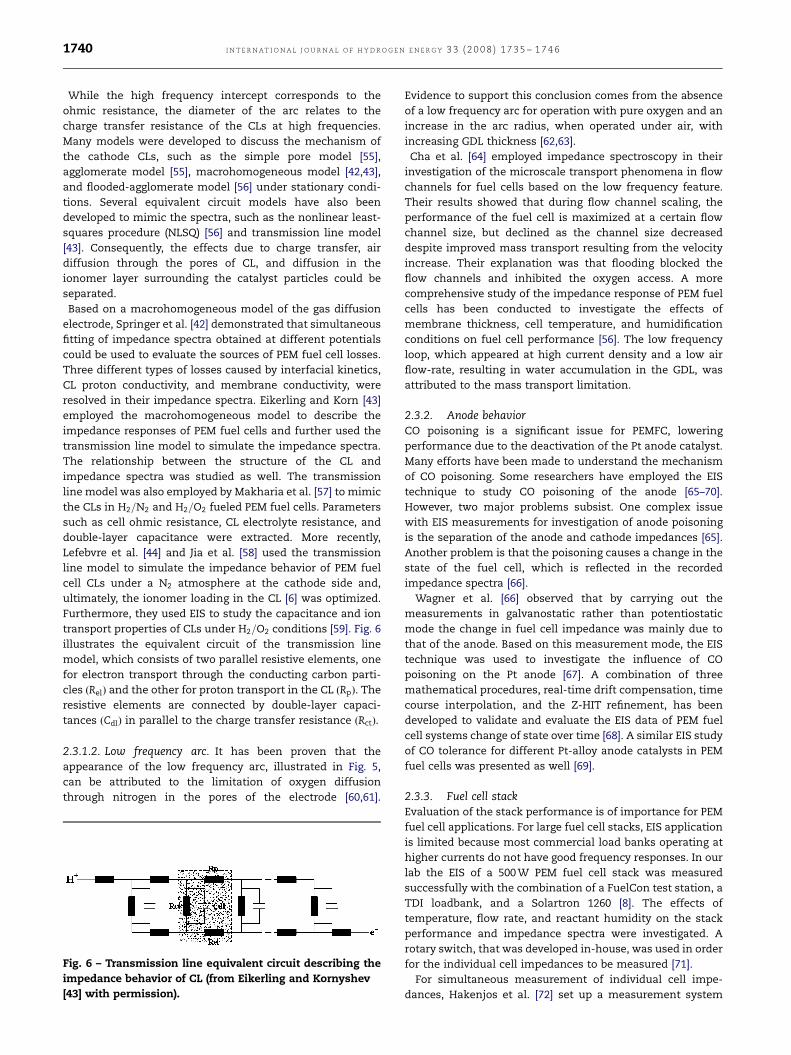
transport properties of CLs under H2=O2 conditions [59]. Fig. 6
illustrates the equivalent circuit of the transmission line
model, which consists of two parallel resistive elements, one
for electron transport through the conducting carbon parti-
cles ðRelÞ and the other for proton transport in the CL ðRpÞ. The
resistive elements are connected by double-layer capaci-
tances ðCdlÞ in parallel to the charge transfer resistance ðRctÞ.
2.3.1.2. Low frequency arc. It has been proven that the
appearance of the low frequency arc, illustrated in Fig. 5,
can be attributed to the limitation of oxygen diffusion
through nitrogen in the pores of the electrode [60,61].
Fig. 6 – Transmission line equivalent circuit describing the
impedance behavior of CL (from Eikerling and Kornyshev
[43] with permission).
Evidence to support this conclusion comes from the absence
of a low frequency arc for operation with pure oxygen and an
increase in the arc radius, when operated under air, with
increasing GDL thickness [62,63].
Cha et al. [64] employed impedance spectroscopy in their
investigation of the microscale transport phenomena in flow
channels for fuel cells based on the low frequency feature.
Their results showed that during flow channel scaling, the
performance of the fuel cell is maximized at a certain flow
channel size, but declined as the channel size decreased
despite improved mass transport resulting from the velocity
increase. Their explanation was that flooding blocked the
flow channels and inhibited the oxygen access. A more
comprehensive study of the impedance response of PEM fuel
cells has been conducted to investigate the effects of
membrane thickness, cell temperature, and humidification
conditions on fuel cell performance [56]. The low frequency
loop, which appeared at high current density and a low air
flow-rate, resulting in water accumulation in the GDL, was
attributed to the mass transport limitation.
2.3.2. Anode behaviorCO poisoning is a significant issue for PEMFC, lowering
performance due to the deactivation of the Pt anode catalyst.
Many efforts have been made to understand the mechanism
of CO poisoning. Some researchers have employed the EIS
technique to study CO poisoning of the anode [65–70].
However, two major problems subsist. One complex issue
with EIS measurements for investigation of anode poisoning
is the separation of the anode and cathode impedances [65].
Another problem is that the poisoning causes a change in the
state of the fuel cell, which is reflected in the recorded
impedance spectra [66].
Wagner et al. [66] observed that by carrying out the
measurements in galvanostatic rather than potentiostatic
mode the change in fuel cell impedance was mainly due to
that of the anode. Based on this measurement mode, the EIS
technique was used to investigate the influence of CO
poisoning on the Pt anode [67]. A combination of three
mathematical procedures, real-time drift compensation, time
course interpolation, and the Z-HIT refinement, has been
developed to validate and evaluate the EIS data of PEM fuel
cell systems change of state over time [68]. A similar EIS study
of CO tolerance for different Pt-alloy anode catalysts in PEM
fuel cells was presented as well [69].
2.3.3. Fuel cell stackEvaluation of the stack performance is of importance for PEM
fuel cell applications. For large fuel cell stacks, EIS application
is limited because most commercial load banks operating at
higher currents do not have good frequency responses. In our
lab the EIS of a 500 W PEM fuel cell stack was measured
successfully with the combination of a FuelCon test station, a
TDI loadbank, and a Solartron 1260 [8]. The effects of
temperature, flow rate, and reactant humidity on the stack
performance and impedance spectra were investigated. A
rotary switch, that was developed in-house, was used in order
for the individual cell impedances to be measured [71].
For simultaneous measurement of individual cell impe-
dances, Hakenjos et al. [72] set up a measurement system
ARTICLE IN PRESS
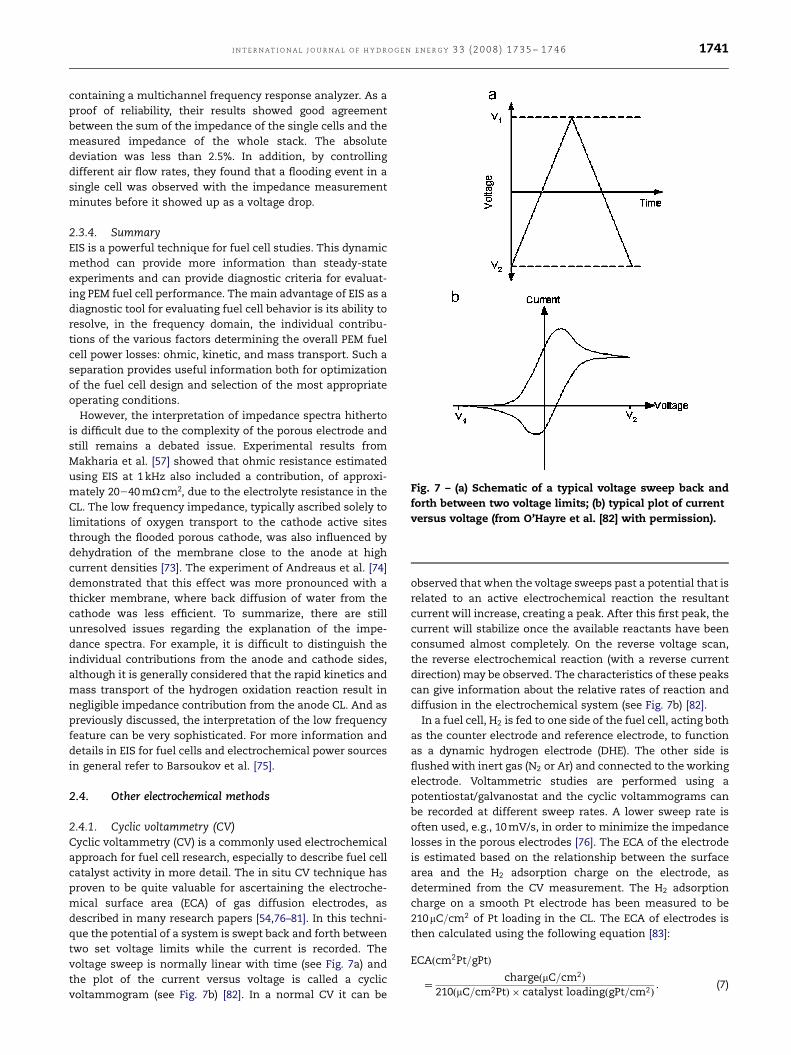
Fig. 7 – (a) Schematic of a typical voltage sweep back and
forth between two voltage limits; (b) typical plot of current
versus voltage (from O’Hayre et al. [82] with permission).
I N T E R N A T I O N A L J O U R N A L O F H Y D R O G E N E N E R G Y 3 3 ( 2 0 0 8 ) 1 7 3 5 – 1 7 4 6 1741
containing a multichannel frequency response analyzer. As a
proof of reliability, their results showed good agreement
between the sum of the impedance of the single cells and the
measured impedance of the whole stack. The absolute
deviation was less than 2.5%. In addition, by controlling
different air flow rates, they found that a flooding event in a
single cell was observed with the impedance measurement
minutes before it showed up as a voltage drop.
2.3.4. SummaryEIS is a powerful technique for fuel cell studies. This dynamic
method can provide more information than steady-state
experiments and can provide diagnostic criteria for evaluat-
ing PEM fuel cell performance. The main advantage of EIS as a
diagnostic tool for evaluating fuel cell behavior is its ability to
resolve, in the frequency domain, the individual contribu-
tions of the various factors determining the overall PEM fuel
cell power losses: ohmic, kinetic, and mass transport. Such a
separation provides useful information both for optimization
of the fuel cell design and selection of the most appropriate
operating conditions.
However, the interpretation of impedance spectra hitherto
is difficult due to the complexity of the porous electrode and
still remains a debated issue. Experimental results from
Makharia et al. [57] showed that ohmic resistance estimated
using EIS at 1 kHz also included a contribution, of approxi-
mately 20240 mO cm2, due to the electrolyte resistance in the
CL. The low frequency impedance, typically ascribed solely to
limitations of oxygen transport to the cathode active sites
through the flooded porous cathode, was also influenced by
dehydration of the membrane close to the anode at high
current densities [73]. The experiment of Andreaus et al. [74]
demonstrated that this effect was more pronounced with a
thicker membrane, where back diffusion of water from the
cathode was less efficient. To summarize, there are still
unresolved issues regarding the explanation of the impe-
dance spectra. For example, it is difficult to distinguish the
individual contributions from the anode and cathode sides,
although it is generally considered that the rapid kinetics and
mass transport of the hydrogen oxidation reaction result in
negligible impedance contribution from the anode CL. And as
previously discussed, the interpretation of the low frequency
feature can be very sophisticated. For more information and
details in EIS for fuel cells and electrochemical power sources
in general refer to Barsoukov et al. [75].
2.4. Other electrochemical methods
2.4.1. Cyclic voltammetry (CV)Cyclic voltammetry (CV) is a commonly used electrochemical
approach for fuel cell research, especially to describe fuel cell
catalyst activity in more detail. The in situ CV technique has
proven to be quite valuable for ascertaining the electroche-
mical surface area (ECA) of gas diffusion electrodes, as
described in many research papers [54,76–81]. In this techni-
que the potential of a system is swept back and forth between
two set voltage limits while the current is recorded. The
voltage sweep is normally linear with time (see Fig. 7a) and
the plot of the current versus voltage is called a cyclic
voltammogram (see Fig. 7b) [82]. In a normal CV it can be
observed that when the voltage sweeps past a potential that is
related to an active electrochemical reaction the resultant
current will increase, creating a peak. After this first peak, the
current will stabilize once the available reactants have been
consumed almost completely. On the reverse voltage scan,
the reverse electrochemical reaction (with a reverse current
direction) may be observed. The characteristics of these peaks
can give information about the relative rates of reaction and
diffusion in the electrochemical system (see Fig. 7b) [82].
In a fuel cell, H2 is fed to one side of the fuel cell, acting both
as the counter electrode and reference electrode, to function
as a dynamic hydrogen electrode (DHE). The other side is
flushed with inert gas (N2 or Ar) and connected to the working
electrode. Voltammetric studies are performed using a
potentiostat/galvanostat and the cyclic voltammograms can
be recorded at different sweep rates. A lower sweep rate is
often used, e.g., 10 mV/s, in order to minimize the impedance
losses in the porous electrodes [76]. The ECA of the electrode
is estimated based on the relationship between the surface
area and the H2 adsorption charge on the electrode, as
determined from the CV measurement. The H2 adsorption
charge on a smooth Pt electrode has been measured to be
210mC=cm2 of Pt loading in the CL. The ECA of electrodes is
then calculated using the following equation [83]:
ECAðcm2Pt=gPtÞ
¼chargeðmC=cm2Þ
210ðmC=cm2PtÞ � catalyst loadingðgPt=cm2Þ. (7)
ARTICLE IN PRESS
I N T E R N AT I O N A L J O U R N A L O F H Y D R O G E N E N E R G Y 3 3 ( 2 0 0 8 ) 1 7 3 5 – 1 7 4 61742
The disadvantage of this technique for assessing supported
electrocatalysts is that the carbon features mask the H2
adsorption and desorption characteristics, e.g., double layer
charging and redox behavior of surface active groups on
carbon. To avoid the occurrence of carbon oxidation, the
anodic limit is always set below 1.0 V (versus DHE) [77]. In
Fig. 8 a typical fuel cell CV can be observed. The two peaks
identified represent the hydrogen adsorption and desorption
peaks on the platinum catalyst surface [82]. The forward and
reverse double-layer current density, Idl charging, which is offset
from the zero current value by the crossover current density,
icrossover, is also shown in this figure.
2.4.2. CO stripping voltammetryCO stripping voltammetry is another common technique for
determining the ECA of electrodes through the oxidation of
adsorbed CO at room temperature, operating under the same
principle as CV [84,85]. One side of the fuel cell is supplied
with CO plus inert gas, or humidified high purity inert gas
(Ar or N2Þ, and connected to the working electrode while
humidified H2 is fed to the other side, serving as the DHE [85].
During the CO adsorption process, CO plus inert gas is
supplied to the anode at a certain flow rate, while keeping
the electrode potential at about 0.1 V (versus DHE). Then, the
gas is switched to high-purity Ar for a long time to remove
any CO from the gas phase. To record the CO stripping
voltammogram, the potential is scanned from the adsorption
value to near 0.9 V with a scan rate of 5 [86] or 10 mV/s [84].
When assessing ECA based on CO stripping voltammetry, one
can also employ Eq. (7) by utilizing a value of 424mC=cm2 for
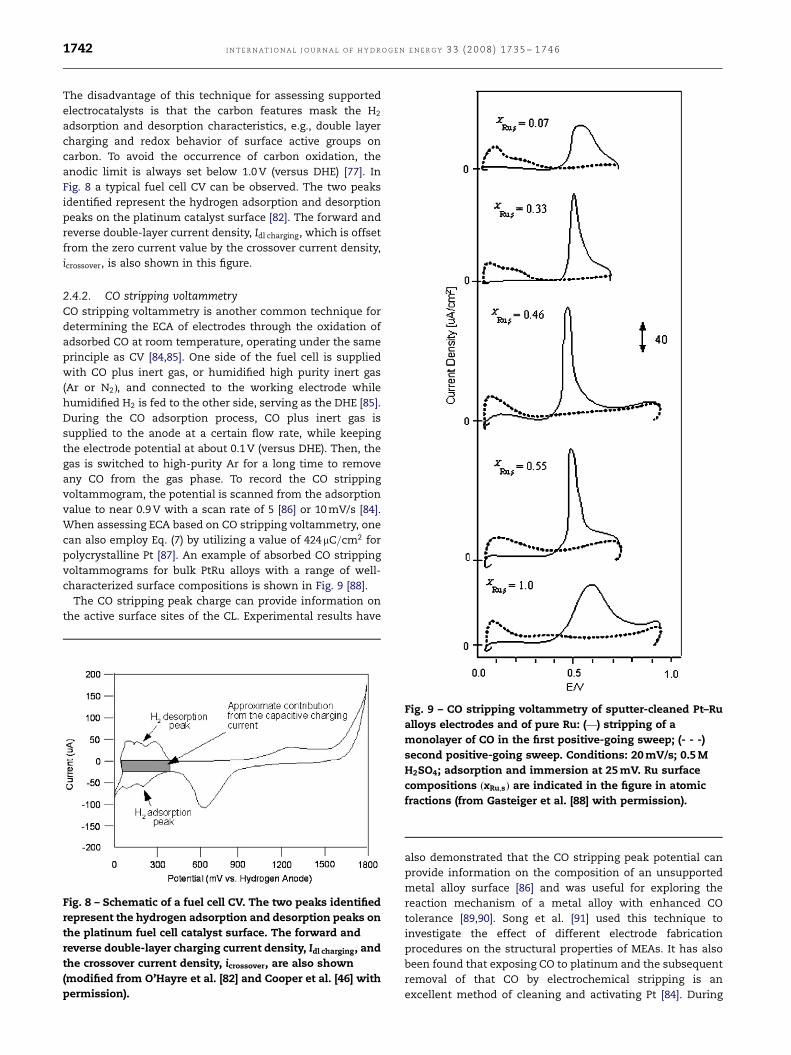
polycrystalline Pt [87]. An example of absorbed CO stripping
voltammograms for bulk PtRu alloys with a range of well-
characterized surface compositions is shown in Fig. 9 [88].
The CO stripping peak charge can provide information on
the active surface sites of the CL. Experimental results have
Fig. 8 – Schematic of a fuel cell CV. The two peaks identified
represent the hydrogen adsorption and desorption peaks on
the platinum fuel cell catalyst surface. The forward and
reverse double-layer charging current density, Idl charging, and
the crossover current density, icrossover, are also shown
(modified from O’Hayre et al. [82] and Cooper et al. [46] with
permission).
Fig. 9 – CO stripping voltammetry of sputter-cleaned Pt–Ru
alloys electrodes and of pure Ru: (—) stripping of a
monolayer of CO in the first positive-going sweep; (- - -)
second positive-going sweep. Conditions: 20 mV/s; 0.5 M
H2SO4; adsorption and immersion at 25 mV. Ru surface
compositions ðxRu;sÞ are indicated in the figure in atomic
fractions (from Gasteiger et al. [88] with permission).
also demonstrated that the CO stripping peak potential can
provide information on the composition of an unsupported
metal alloy surface [86] and was useful for exploring the
reaction mechanism of a metal alloy with enhanced CO
tolerance [89,90]. Song et al. [91] used this technique to
investigate the effect of different electrode fabrication
procedures on the structural properties of MEAs. It has also
been found that exposing CO to platinum and the subsequent
removal of that CO by electrochemical stripping is an
excellent method of cleaning and activating Pt [84]. During
ARTICLE IN PRESS
I N T E R N A T I O N A L J O U R N A L O F H Y D R O G E N E N E R G Y 3 3 ( 2 0 0 8 ) 1 7 3 5 – 1 7 4 6 1743
the CO adsorption and desorption processes, no degradation
in the MEA performance or the ECA of Pt was noted.
It is important to note that the study in Brett et al. [84] was
performed with the use of a segmented cell also used to
investigate current distribution in PEM fuel cells. For more
information on current distribution refer to the second part of
this review.
2.4.3. Linear sweep voltammetry (LSV)Crossover of hydrogen and oxygen through the membrane is
considered to be one of the most important phenomena in
PEM fuel cells, which leads to a fuel inefficiency [92]. Linear
sweep voltammetry (LSV) experiments are always conducted
at room temperature to evaluate and monitor fuel crossover
and to check for the presence of electrical shorts [93,94]. The
experiment procedure is similar to the CV technique, with the
principal difference of being the irreversible scan. Humidified
H2 and N2 are supplied to the anode and cathode sides of the
fuel cell, respectively. The scan potential ranges from 0 to
0.8 V with higher voltages being avoided to prevent Pt
oxidation [93]. The experimental procedure involves control-
ling the potential of the fuel cell cathode (working electrode)
and monitoring any electrochemical activity that occurs in
the form of a current. Since N2 gas is the only substance
introduced into the cathode side, any current generated in the
given potential range is solely attributed to the electroche-
mical oxidation of H2 gas that crosses over from the anode
side through the membrane. The crossover current typically
increases with the scan potential and rapidly reaches a
limiting value when the potential grows to around 300 mV
[94]. At this value all crossover H2 is instantaneously oxidized
due to the high overpotential applied. Based on the limiting
current, one can, ultimately, calculate the flux of H2 gas using
Faraday’s law [94]. Using this diagnostic method, Song et al.
[95] determined the hydrogen crossover rate through Nafion
112 membrane at elevated temperatures up to 120 1C.
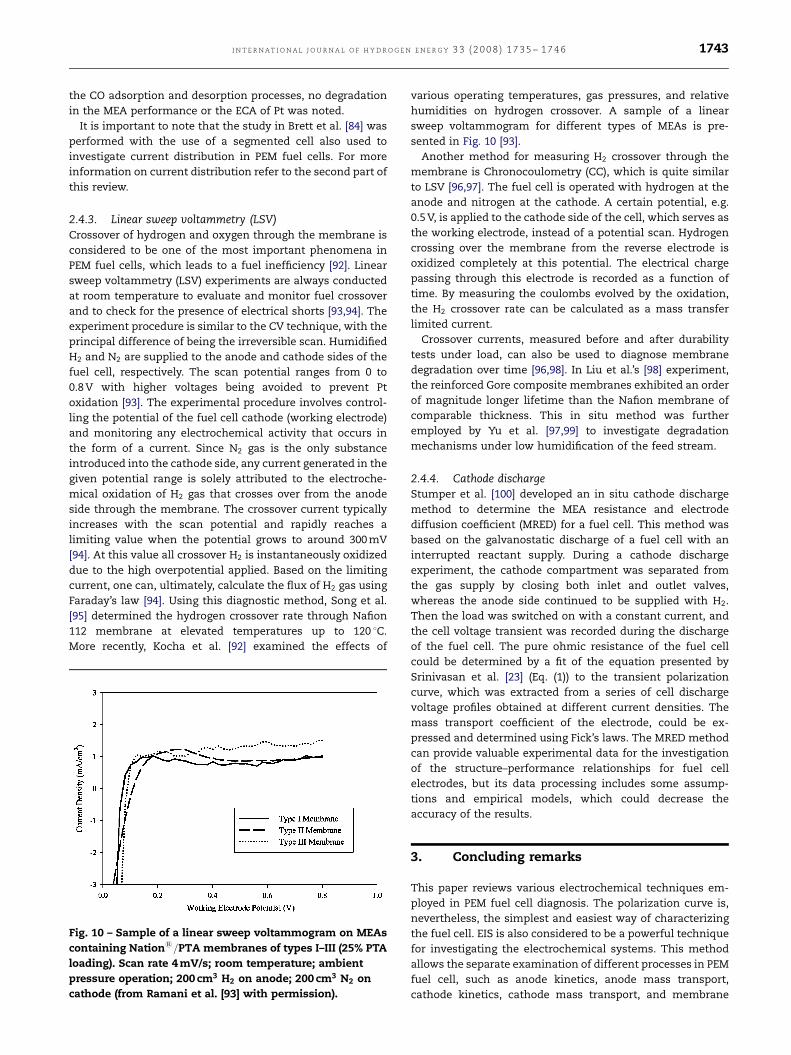
More recently, Kocha et al. [92] examined the effects of
Fig. 10 – Sample of a linear sweep voltammogram on MEAs
containing Nations=PTA membranes of types I–III (25% PTA
loading). Scan rate 4 mV/s; room temperature; ambient
pressure operation; 200 cm3 H2 on anode; 200 cm3 N2 on
cathode (from Ramani et al. [93] with permission).
various operating temperatures, gas pressures, and relative
humidities on hydrogen crossover. A sample of a linear
sweep voltammogram for different types of MEAs is pre-
sented in Fig. 10 [93].
Another method for measuring H2 crossover through the
membrane is Chronocoulometry (CC), which is quite similar
to LSV [96,97]. The fuel cell is operated with hydrogen at the
anode and nitrogen at the cathode. A certain potential, e.g.
0.5 V, is applied to the cathode side of the cell, which serves as
the working electrode, instead of a potential scan. Hydrogen
crossing over the membrane from the reverse electrode is
oxidized completely at this potential. The electrical charge
passing through this electrode is recorded as a function of
time. By measuring the coulombs evolved by the oxidation,
the H2 crossover rate can be calculated as a mass transfer
limited current.
Crossover currents, measured before and after durability
tests under load, can also be used to diagnose membrane
degradation over time [96,98]. In Liu et al.’s [98] experiment,
the reinforced Gore composite membranes exhibited an order
of magnitude longer lifetime than the Nafion membrane of
comparable thickness. This in situ method was further
employed by Yu et al. [97,99] to investigate degradation
mechanisms under low humidification of the feed stream.
2.4.4. Cathode dischargeStumper et al. [100] developed an in situ cathode discharge
method to determine the MEA resistance and electrode
diffusion coefficient (MRED) for a fuel cell. This method was
based on the galvanostatic discharge of a fuel cell with an
interrupted reactant supply. During a cathode discharge
experiment, the cathode compartment was separated from
the gas supply by closing both inlet and outlet valves,
whereas the anode side continued to be supplied with H2.
Then the load was switched on with a constant current, and
the cell voltage transient was recorded during the discharge
of the fuel cell. The pure ohmic resistance of the fuel cell
could be determined by a fit of the equation presented by
Srinivasan et al. [23] (Eq. (1)) to the transient polarization
curve, which was extracted from a series of cell discharge
voltage profiles obtained at different current densities. The
mass transport coefficient of the electrode, could be ex-
pressed and determined using Fick’s laws. The MRED method
can provide valuable experimental data for the investigation
of the structure–performance relationships for fuel cell
electrodes, but its data processing includes some assump-
tions and empirical models, which could decrease the
accuracy of the results.
3. Concluding remarks
This paper reviews various electrochemical techniques em-
ployed in PEM fuel cell diagnosis. The polarization curve is,
nevertheless, the simplest and easiest way of characterizing
the fuel cell. EIS is also considered to be a powerful technique
for investigating the electrochemical systems. This method
allows the separate examination of different processes in PEM
fuel cell, such as anode kinetics, anode mass transport,
cathode kinetics, cathode mass transport, and membrane

ARTICLE IN PRESS
I N T E R N AT I O N A L J O U R N A L O F H Y D R O G E N E N E R G Y 3 3 ( 2 0 0 8 ) 1 7 3 5 – 1 7 4 61744
conductivity. Moreover, it is a powerful tool to determine
electrode parameters as functions of the structure and
composition, which is a prerequisite to optimize the elec-
trode.
Other techniques employed in PEM fuel cell diagnosis are
catalogued into physical/chemical methods, such as neutron
imaging, magnetic resonant imaging, and current distribution
approaches. Physical/chemical methods will be discussed in
the second part of this review.
Acknowledgment
The authors gratefully acknowledge the National Fuel Cell
program of National Research Council Canada for supporting
this project.
R E F E R E N C E S
[1] Gottesfeld S, Zawodzinski TA. Polymer electrolyte fuel cells.In: Alkire RC, Gerischer H, Kolb DM, Tobias CW, editors.Advances in electrochemical science and engineering, vol.5. Weinheim: Wiley-VCH; 1997. p. 195–301.
[2] Mench MM, Dong QL, Wang CY. In situ water distributionmeasurements in a polymer electrolyte fuel cell. J PowerSources 2003;124(1):90–8.
[3] Dong Q, Kull J, Mench MM. In situ water distributionmeasurements in a polymer electrolyte fuel cell. J PowerSources 2005;139(1):106–14.
[4] Mennola T, Mikkola M, Noponen M. Measurement of ohmicvoltage losses in individual cells of a PEMFC stack. J PowerSources 2002;112(1):261–72.
[5] Mathias MF, Grot SA. System and method for controlling thehumidity level of a fuel cell. US Patent 6,376,111, April 2002.
[6] Li G, Pickup PG. Ionic conductivity of PEMFC electrodes.J Electrochem Soc 2003;150(11):C745–52.
[7] Yang XG, Zhang FY, Lubawy AL, Wang CY. Visualization ofliquid water transport in a PEFC. Electrochem Solid-StateLett 2004;7:A408–11.
[8] Yuan X, Sun JC, Blanco M, Wang H, Zhang JJ, Wilkinson DP.AC impedance diagnosis of a 500 W PEM fuel cell stack: PartI: stack impedance. J Power Sources 2006;161(2):920–8.
[9] Stumper J, Campbell SA, Wilkinson DP, Johnson MC, DavisM. In-situ methods for the determination of currentdistributions in PEM fuel cells. Electrochim Acta1998;43(24):3773–83.
[10] Cleghorn SJC, Derouin CR, Wilson MS, Gottesfeld S. Aprinted circuit board approach to measuring current dis-tribution in a fuel cell. J Appl Electrochem 1998;28(7):663–72.
[11] Hebling C, Borsdorf R. The Knowledge Foundation’s 5thinternational small fuel cells 2003: small fuel cells forportable power applications, New Orleans, LA; May 2003.
[12] Wilkinson M, Blanco M, Gu E, Martin JJ, Wilkinson DP, ZhangJJ, et al. In situ experimental technique for measurement oftemperature and current distribution in proton exchangemembrane fuel cells. Electrochem Solid-State Lett2006;9:A507–11.
[13] Tuber K, Pocza D, Hebling C. Visualization of water buildupin the cathode of a transparent PEM fuel cell. J PowerSources 2003;124(2):403–14.
[14] Ma HP, Zhang HM, Hu J, Cai YH, Yi BL. Diagnostic tool todetect liquid water removal in the cathode channels ofproton exchange membrane fuel cells. J Power Sources2006;162(1):469–73.
[15] Wang CY. Fundamental models for fuel cell engineering.Chem Rev 2004;104(10):4727–66.
[16] Hinds G. Performance and durability of PEM fuel cells. 2004NPL Report DEPC-MPE 002, National Physical Laboratory,Teddington, UK; 2004.
[17] Barbir F. PEM fuel cells: theory and practice. New York:Elsevier/Academic Press; 2005.
[18] Barbir F. Engineering materials and processes. In: SammesN, editor. Fuel cell technology: reaching towards commer-cialization. London: Springer; 2006. p. 27–31.
[19] Li X. Principle of fuel cells. New York: Taylor & Francis; 2006.[20] Lim CY, Haas HR. A diagnostic method for an electroche-
mical fuel cell and fuel cell components. WO Patent2,006,029,254, March 2006.
[21] Hirschenhofer JH, Stauffer DB, Engleman RR, Klett MG. Fuelcell handbook, 4th ed. DOE/FETC-99/1076. Reading, PA:Parsons Corporation; 1998. p. 2.5–6.
[22] Ju H, Wang CY. Experimental validation of a PEM fuel cellmodel by current distribution data. J Electrochem Soc2004;151(11):A1954–60.
[23] Srinivasan S, Ticianelli EA, Derouin CR, Redondo A. Ad-vances in solid polymer electrolyte fuel cell technology withlow platinum loading electrodes. J Power Sources1988;22(3–4):359–75.
[24] Srinivasan S, Velew OA, Parthasarathy A, Manko DJ, ApplebyAJ. High energy efficiency and high power density protonexchange membrane fuel cells—electrode kinetics andmass transport. J Power Sources 1991;36(3):299–320.
[25] Kim J, Lee SM, Srinivasan S. Modeling of proton exchangemembrane fuel cell performance with an empirical equa-tion. J Electrochem Soc 1995;142(8):2670–4.
[26] Bevers D, Wohr M, Yasuda K, Oguro K. Simulation of apolymer electrolyte fuel cell electrode. J Appl Electrochem1997;27(11):1254–64.
[27] Lee JH, Lalk TR, Appleby AJ. Modeling electrochemicalperformance in large scale proton exchange membranefuel cell stacks. J Power Sources 1998;70(2):258–68.
[28] Squadrito G, Maggio G, Passalacqua E, Lufrano F, Patti A. Anempirical equation for polymer electrolyte fuel cell (PEFC)behaviour. J Appl Electrochem 1999;29(12):1449–55.
[29] Pisani L, Murgia G, Valentini M, D’Agurnno B. A new semi-empirical approach to performance curves of polymerelectrolyte fuel cells. J Power Sources 2002;108(1–2):192–203.
[30] Amphlett JC, Baumert RM, Mann RF, Peppley BA, Roberge PR,Harris TJ. Performance modeling of the ballard Mark IV solidpolymer electrolyte fuel cell. J Electrochem Soc1995;142(1):9–15.
[31] Sena DR, Ticianelli EA, Paganin VA, Gonzalez ER. Effect ofwater transport in a PEFC at low temperatures operatingwith dry hydrogen. J Electroanal Chem 1999;477(2):164–70.
[32] Williams MV, Kunz HR, Fenton JM. Analysis of polarizationcurves to evaluate polarization sources in hydrogen/air PEMfuel cells. J Electrochem Soc 2005;152(3):A635–44.
[33] Wruck WJ, Machado RM, Chapman TW. Current interrup-tion-instrumentation and applications. J Electrochem Soc1987;134(3):539–46.
[34] Larminie J, Dicks A. Fuel cell systems explained. New York:Wiley; 2003.
[35] Buchi FN, Marek A, Scherer GG. In situ membrane resistancemeasurements in polymer electrolyte fuel cells by fastauxiliary current pulses. J Electrochem Soc1995;142(6):1895–901.
[36] Jaouen F, Lindbergh G, Wiezell K. Transient techniques forinvestigating mass-transport limitations in gas diffusionelectrodes. J Electrochem Soc 2003;150(12):A1711–7.
[37] Jaouen F, Lindbergh G. Transient techniques for investigat-ing mass-transport limitations in gas diffusion electrodes.J Electrochem Soc 2003;150(12):A1699–710.

ARTICLE IN PRESS
I N T E R N A T I O N A L J O U R N A L O F H Y D R O G E N E N E R G Y 3 3 ( 2 0 0 8 ) 1 7 3 5 – 1 7 4 6 1745
[38] Abe T, Shima H, Watanabe K, Ito Y. Study of PEFCs by ACimpedance, current interrupt, and dew point measure-ments. J Electrochem Soc 2004;151(1):A101–5.
[39] Noponen M, Hottinen T, Mennola T, Mikkola M, Lund P.Determination of mass diffusion overpotential distributionwith flow pulse method from current distribution mea-surements in a PEMFC. J Appl Electrochem2002;32(10):1081–9.
[40] Parthasarathy A, Dave B, Srinivasan S, Appleby AJ. Theplatinum microelectrode/Nafion interface: an electroche-mical impedance spectroscopic analysis of oxygen reduc-tion kinetics and Nafion characteristics. J Electrochem Soc1992;139(6):1634–41.
[41] Antoine O, Bultel Y, Durand R. Oxygen reduction reactionkinetics and mechanism on platinum nanoparticles insideNafions. J Electroanal Chem 2001;499(1):85–94.
[42] Springer TE, Zawodzinski TA, Wilson MS, Gottesfeld S.Characterization of polymer electrolyte fuel cells using ACimpedance spectroscopy. J Electrochem Soc1996;143(2):587–99.
[43] Eikerling M, Kornyshev AA. Electrochemical impedance ofthe cathode catalyst layer in polymer electrolyte fuel cells.J Electroanal Chem 1999;475(2):107–23.
[44] Lefebvre MC, Martin RB, Pickup PG. Characterization of ionicconductivity profiles within proton exchange membranefuel cell gas diffusion electrodes by impedance spectro-scopy. Electrochem Solid-State Lett 1999;2:259–61.
[45] Saab P, Garzon FH, Zawodzinski TA. The effects of proces-sing conditions and chemical composition on electronic andionic resistivities of fuel cell electrode composites.J Electrochem Soc 2003;150(2):A214–8.
[46] Cooper KR, Ramani V, Fenton JM, Kunz HR. Experimentalmethods and data analyses for polymer electrolyte fuelcells. Southern Pines, NC: Scribner Associates Inc.; 2005.
[47] Romero-Castanon T, Arriaga LG, Cano-Castillo U. Impe-dance spectroscopy as a tool in the evaluation of MEA’s.J Power Sources 2003;118(1–2):179–82.
[48] Song JM, Cha SY, Lee WM. Optimal composition of polymerelectrolyte fuel cell electrodes determined by the ACimpedance method. J Power Sources 2001;94(1):78–84.
[49] Wagner N. Characterization of membrane electrode assem-blies in polymer electrolyte fuel cells using a.c. impedancespectroscopy. J Appl Electrochem 2002;32(8):859–63.
[50] Ivers-Tiffee E, Weber A, Schichlein A. Electrochemicalimpedance spectroscopy. In: Vielstich W, Gasteiger HA,Lamm A, editors. Handbook of fuel cells: fundamentals,technology and applications, vol. 2. New York: Wiley; 2003.p. 220–35.
[51] Perry ML, Newman J, Cairns EJ. Mass transport in gas-diffusion electrodes: a diagnostic tool for fuel-cell cathodes.J Electrochem Soc 1998;145(1):5–15.
[52] Kurzweil P, Fischle HJ. A new monitoring method forelectrochemical aggregates by impedance spectroscopy.J Power Sources 2004;127(1–2):331–40.
[53] Barbir F, Gorgun H, Wang X. Relationship between pressuredrop and cell resistance as a diagnostic tool for PEM fuelcells. J Power Sources 2005;141(1):96–101.
[54] Oszcipok M, Riemann D, Kronenwett U, Kreideweis M,Zedda M. Statistic analysis of operational influences onthe cold start behaviour of PEM fuel cells. J Power Sources2005;145(2):407–15.
[55] Raistrick ID. Impedance studies of porous electrodes.Electrochim Acta 1990;35(10):1579–86.
[56] Ciureanu M, Roberge R. Electrochemical impedance study ofPEM fuel cells. Experimental diagnostics and modeling of aircathodes. J Phys Chem B 2001;105(17):3531–9.
[57] Makharia R, Mathias MF, Baker DR. Measurement of catalystlayer electrolyte resistance in PEFCs using electrochemical
impedance spectroscopy. J Electrochem Soc2005;152(5):A970–7.
[58] Jia N, Martin RB, Qi Z, Lefebvre MC, Pickup PG. Modificationof carbon supported catalysts to improve performance ingas diffusion electrodes. Electrochim Acta2001;46(18):2863–9.
[59] Easton EB, Pickup PG. An electrochemical impedancespectroscopy study of fuel cell electrodes. ElectrochimActa 2005;50(12):2469–74.
[60] Bautista M, Bultel Y, Ozil P. Polymer electrolyte membranefuel cell modelling: d.c. and a.c. solutions. Chem Eng ResDes 2004;82(A7):907–17.
[61] Mueller JT, Urban PM. Characterization of direct methanolfuel cells by ac impedance spectroscopy. J Power Sources1998;75(1):139–43.
[62] Wilson MS, Springer TE, Davey JR, Gottesfeld S. Proceedingsof the first international symposium on proton conductingmembrane fuel cells. Pennington, NJ; 1995. p. 115–26.
[63] Freire TJP, Gonzalez ER. Effect of membrane characteristicsand humidification conditions on the impedance responseof polymer electrolyte fuel cells. J Electroanal Chem2001;503(1–2):57–68.
[64] Cha SW, O’Hayre R, Prinz FB. Proceedings of secondinternational conference on fuel cell science, engineeringand technology. Rochester, NY, June 14–16; 2004.
[65] Mazurek M, Benker N, Roth C, Buhrmester T, Fuess H.Electrochemical impedance and X-ray absorption spectro-scopy (EXAFS) as in-situ methods to study the PEMFC anode.Fuel Cells 2006;6(1):16–20.
[66] Wagner N, Gulzow E. Change of electrochemical impedancespectra (EIS) with time during CO-poisoning of the Pt-anodein a membrane fuel cell. J Power Sources 2004;127(1–2):341–7.
[67] Schiller CA, Richter F, Gulzow E, Wagner N. Relaxationimpedance as a model for the deactivation mechanism offuel cells due to carbon monoxide poisoning. Phys ChemChem Phys 2001;3(11):2113–6.
[68] Schiller CA, Richter F, Gulzow E, Wagner N. Validation andevaluation of electrochemical impedance spectra of sys-tems with states that change with time. Phys Chem ChemPhys 2001;3(3):374–8.
[69] Leng YJ, Wang X, Hsing IM. Assessment of CO-tolerance fordifferent Pt-alloy anode catalysts in a polymer electrolytefuel cell using ac impedance spectroscopy. J ElectroanalChem 2002;528(1–2):145–52.
[70] Ciureanu M, Wang H. Electrochemical impedance study ofelectrode-membrane assemblies in PEM fuel cells: I. Electro-oxidation of H2 and H2=CO mixtures on Pt-based gas-diffusion electrodes. J Electrochem Soc 1999;146(11):4031–40.
[71] Yuan X, Sun JC, Wang H, Zhang J. AC impedance diagnosis ofa 500 W PEM fuel cell stack: Part II: individual cellimpedance. J Power Sources 2006;161(2):929–37.
[72] Hakenjos A, Zobel M, Clausnitzer J, Hebling C. Simultaneouselectrochemical impedance spectroscopy of single cells in aPEM fuel cell stack. J Power Sources 2006;154(2):360–3.
[73] Paganin VA, Oliveira CLF, Ticianelli EA, Springer TE, Gonza-lez ER. Modelistic interpretation of the impedance responseof a polymer electrolyte fuel cell. Electrochim Acta1998;43(24):3761–6.
[74] Andreaus B, McEvoy AJ, Scherer GG. Analysis of perfor-mance losses in polymer electrolyte fuel cells at highcurrent densities by impedance spectroscopy. ElectrochimActa 2002;47(13–14):2223–9.
[75] Barsoukov E, Macdonald JR. Impedance spectroscopy theory,experiment and applications. New York: Wiley; 2005.
[76] Ticianelli EA, Derouin CR, Srinivasan S. Localization ofplatinum in low catalyst loading electrodes to attain highpower densities in SPE fuel cells. J Electroanal Chem1988;251(2):275–95.
ARTICLE IN PRESS
I N T E R N AT I O N A L J O U R N A L O F H Y D R O G E N E N E R G Y 3 3 ( 2 0 0 8 ) 1 7 3 5 – 1 7 4 61746
[77] Srinivasan S, Ticianelli EA, Derouin CR, Redondo A. Ad-vances in solid polymer electrolyte fuel cell technology withlow platinum loading electrodes. J Power Sources1988;22(3–4):359–75.
[78] Koponen U, Kumpulainen H, Bergelin M, Keskinen J,Peltonen T, Valkiainen M, et al. Characterization of Pt-based catalyst materials by voltammetric techniques.J Power Sources 2003;118(1–2):325–33.
[79] Wang M, Woo K, Lou T, Lou Y, Zhai Y, Kim D. Definingcatalyst layer ingredients in PEMFC by orthogonal test andC–V method. Int J Hydrogen Energy 2005;30(4):381–4.
[80] Tamizhmani G, Capuano GA. Improved electrocatalyticoxygen reduction performance of platinum ternary alloy-oxide in solid-polymer-electrolyte fuel cells. J ElectrochemSoc 1994;141(4):968–75.
[81] Wang X, Hsing I, Yue PL. Electrochemical characterization ofbinary carbon supported electrode in polymer electrolytefuel cells. J Power Sources 2001;96:282–7.
[82] O’Hayre R, Cha SW, Colella W, Brinz FB. Fuel cell funda-mentals. New York: Wiley; 2006.
[83] Ralph TR, Hards GA, Keating JE, Campbell SA, Wilkinson DP,David M, et al. Low cost electrodes for proton exchangemembrane fuel cells. J Electrochem Soc1997;144(11):3845–57.
[84] Brett DJL, Atkins S, Brandon NP, Vesovic V, Vasileiadis N,Kucernak AR. Investigation of reactant transport within apolymer electrolyte fuel cell using localised CO strippingvoltammetry and adsorption transients. J Power Sources2004;133(2):205–13.
[85] Salgado JRC, Antolini E, Gonzalez ER. Pt–Co/C PEMFCselectrocatalysts for oxygen reduction in H2=O2 synthesizedby borohydride method. J Electrochem Soc2004;151(12):A2143–9.
[86] Dinh HN, Ren XM, Garzon FH, Zelenay P, Gottesfeld S.Electrocatalysis in direct methanol fuel cells in-situ probingof PtRu anode catalyst surfaces. J Electroanal Chem2000;491(1–2):222–33.
[87] Pozio A, Francesco MDe, Cemmi A, Cardellini F, Giorgi L.Comparison of high surface Pt/C catalysts by cyclicvoltammetry. J Power Sources 2002;105(1):13–9.
[88] Gasteiger HA, Markovic N, Ross PN, Cairns EJ. Carbonmonoxide electrooxidation on well-characterized plati-num–ruthenium alloys. J Phys Chem 1994;98(2):617–25.
[89] Gu T, Lee WK, Zee JWV, Murthy M. Effect of reformatecomponents on PEMFC performance. J Electrochem Soc2004;151(12):A2100–5.
[90] Mukerjee S, Lee SJ, Ticianelli EA, McBreen J, Grgur BN,Markovic NM, et al. Investigation of enhanced CO tolerancein proton exchange membrane fuel cells by carbon sup-ported PtMo alloy catalyst. Electrochem Solid-State Lett1999;2:12–5.
[91] Song SQ, Liang ZX, Zhou WJ, Sun GQ, Xin Q, Stergiopoulos V,et al. Direct methanol fuel cells: the effect of electrodefabrication procedure on MEAs structural properties andcell performance. J Power Sources 2005;145(2):495–501.
[92] Kocha SS, Yang JD, Yi JS. Characterization of gas crossoverand its implications in PEM fuel cells. AIChE J2006;52(5):1916–25.
[93] Ramani V, Kunz HR, Fenton JM. Investigation ofNafions=HPA composite membranes for high tempera-ture/low relative humidity PEMFC operation. J Membr Sci2004;232(1–2):31–44.
[94] Ramani V, Kunz HR, Fenton JM. Stabilized compositemembranes and membrane electrode assemblies for ele-vated temperature/low relative humidity PEFC operation.J Power Sources 2005;152:182–8.
[95] Song Y, Fenton JM, Kunz HR, Bonville LJ, Williams MV. High-performance PEMFCs at elevated temperatures using Nafion112 membranes. J Electrochem Soc 2005;152(3):A539–44.
[96] Cleghorn S, Kolde J, Liu W. Catalyst-coated compositemembranes. In: Vielstich W, Gasteiger HA, Lamm A,editors. Handbook of fuel cells: fundamentals, technologyand applications, vol. 3. New York: Wiley; 2003. p. 566–75.
[97] Yu J, Matsuura T, Yoshikawa Y, Islam MN, Hori M. In situanalysis of performance degradation of a PEMFC undernonsaturated humidifications. Electrochem Solid-State Lett2005;8:A156–8.
[98] Liu W, Singh A, Rusch G, Ruth K. The membrane durabilityin PEM fuel cells. J New Mater Electrochem Syst2001;4(4):227–31.
[99] Yu J, Matsuura T, Yoshikawa Y, Islam MN, Hori M. Lifetimebehavior of a PEM fuel cell with low humidification of feedstream. Phys Chem Chem Phys 2005;7(2):373–8.
[100] Stumper J, Haas H, Granados A. In situ determination ofMEA resistance and electrode diffusivity of a fuel cell.J Electrochem Soc 2005;152(4):A837–44.