Embed Size (px)
Citation preview
Aquat. Living Resour. 21, 171–184 (2008)c© EDP Sciences, IFREMER, IRD 2008DOI: 10.1051/alr:2008032www.alr-journal.org
AquaticLivingResources
Diet-morphology relationship in a fish assemblagefrom a medium-sized river of French Guiana:the effect of species taxonomic proximity
Bernard de Mérona1,a, Bernard Hugueny1, Francisco Leonardo Tejerina-Garro2
and Emmanuelle Gautheret3
1 Antenne IRD, UR 131 au Laboratoire d’Ecologie des Hydrosystèmes Fluviaux, Université Claude Bernard Lyon-1, 43 Bd. 11 nov. 1918,69622 Villeurbanne Cedex, France
2 Centro de Biologia Aquática, Universidade Católica de Goiás, Av. Engler s/n Jardim Mariliza, CP 86, CEP 74605-010, Goiânia, GO, Brasil3 22 av. Paul Lafargue, 94500 Champigny sur Marne, France
Received 28 February 2008; Accepted 30 April 2008
Abstract – We investigated the global relationship between diet and morphology for 42 fish species from a medium-sized river in French Guiana and checked the influence of the species taxonomic proximity on the implication ofindividual morphological traits in that relation. The 42 species were classified in eight trophic guilds based on analysisof more than 4000 stomach contents. Taxonomic proximity between species was accounted for by an autoregressivemodel applied to original data of diet and morphology. Original and taxonomic-free data were then submitted to aCanonical Correspondence Analysis in order to detect the relationship between diet and morphology. We compared theresults obtained by analyzing the original data and the corrected data. The results confirm the existence of a significantglobal relationship between diet and morphology. However, morphological traits responsible for that relation weredifferent when considering the taxonomic-free data. Particularly the well known relationship between gut length anddetritivory was not observed on the taxonomic free analysis. It is concluded that controlling for phylogeny is essentialto the detection of relationships between diet and morphology. It is also concluded that, despite the robustness of somerelationships between morphology and diet, many diets cannot be inferred by a ecomorphological approach.
Key words: Freshwater fish / River / Neotropics / Ecomorphology / French Guiana
Résumé – Relation régime alimentaire et morphologie dans un assemblage de poissons d’une rivière demoyenne importance en Guyane française. Effet de la proximité taxonomique entre espèces. Nous avons re-cherché une relation globale entre le régime alimentaire et la morphologie sur 42 espèces dans une rivière de moyenneimportance de Guyane française et vérifié l’influence de la proximité taxonomique sur l’implication de traits morpho-logiques individuels dans cette relation. A partir de l’analyse de plus de 4000 contenus stomacaux, les 42 espèces ontété classifiées en huit guildes trophiques. La proximité taxonomique entre espèces a été prise en compte par un modèleauto-régressif appliqué sur les données originales de régime alimentaire et de morphologie. Les données originaleset les données corrigées on été ensuite soumises à une analyse canonique des correspondances, en vue de détecter larelation entre régime et morphologie. Nous avons comparé les résultats obtenus par l’analyse des données originales etcorrigées. Les résultats confirment l’existence d’une relation globale significative entre régime et morphologie. Cepen-dant, les traits morphologiques responsables de cette relation sont différents pour les données corrigées par rapport auxdonnées originales. En particulier, la relation bien connue, entre la taille de l’intestin et un régime détritivore, n’apparaîtpas dans l’analyse des données corrigées. Ainsi, le contrôle de la phylogénie nous paraît essentiel dans les études sur lesrelations morphologie/régime alimentaire. De plus, en dépit de la robustesse de quelques relations entre la morphologieet le régime alimentaire, de nombreux régimes ne peuvent être déduits de l’approche écomorphologique.
1 Introduction
The trophic position of fish species has been extensivelyused in the study of fish communities (Hartley 1948;
a Corresponding author: [email protected]
Wiegert and Owen 1971; Herrera 1976; Roger andGrandperrin 1976; Schlosser 1982; Angermeier and Karr1983; Grossman 1986; Bowlby and Roff 1986; Schoener 1989;Parrish 1989; Winemiller 1990; Wooton and Oemke 1992;Flecker 1992; Sheldon and Meffe 1993; Chipps et al. 1994;
Article published by EDP Sciences
172 B. de Mérona et al.: Aquat. Living Resour. 21, 171–184 (2008)
Araujo et al. 1995; Adite and Winemiller 1997; Godinhoet al. 1998; Maridet et al. 1998). However there are manylimitations in accurately determining food regimes of fish.Many species are opportunistic foragers, particularly those in-habiting dynamic river habitats. Some species have long timeintervals between two meals, while others crush their food,rendering items in stomach contents difficult to determine. Allthese make the study of fish communities through diet a verylong and arduous task.
One way to avoid these difficulties is to view the fishspecies’ morphology as the expression of an ecological role.The relationship between form and function has long beenrecognized (see Motta et al. 1995a for an historical overviewof the concept), although it has received much more atten-tion in recent years and the term “ecomorphology” has beenintroduced (Karr and James 1975). This approach states thatspecies occupying similar ecological niches have evolved insuch a way that they are close in some key morphologicalfeatures. Many empirical observations illustrate this hypoth-esis (Keast 1978; Gatz 1979a,b; Gatz 1981; Wikramanayake1990; Wainwright 1991; Labropoulou and Marakis 1998; Piet1998) although few others did not (Grossman 1986; Mottaet al. 1995b; Adite and Winemiller 1997). In some occasionsthis ecomorphological hypothesis has been confirmed by sta-tistical tests (Winemiller and al. 1995; Hugueny and Pouilly1999; Pouilly et al. 2003; Ibanez et al. 2007). From a statisti-cal point of view, species in an assemblage cannot be consid-ered as independent units as they all originate from a commonancestor (Harvey and Pagel 1991). It is likely that recently di-verged species will be morphologically and ecologically sim-ilar. Therefore, the detection of a relationship between mor-phology and diet in an assemblage of species should take intoaccount the phylogenetic relatedness. The result will be tolower the weight of similarities between closely related speciesand emphasize the convergence of unrelated species.
Earlier studies generated contradictory results. In a studyof a fish assemblage from a river in Virginia, Douglas andMatthews (1992) showed that the relationship between dietand morphology turned non-significant when taking into ac-count the phylogeny of the species. Conversely, other studiesled to the inverse conclusion, that is, the relation is main-tained after removing the effect of phylogenetic (or taxo-nomic) relatedness (Winemiller et al. 1995; Hugueny andPouilly 1999; Pouilly et al. 2003). Moreover Ibanez et al.(2007) did not found any phylogenetic influence on morphol-ogy or diet in an assemblage of a small creak of the Boli-vian Amazon Basin. Biogeographical and ecological factorscould explain these contradictory results. In the Neotropicalichthyofauna, morphological diversification is particularly de-veloped (Winemiller 1991) and it is likely that this correspondsto a high level of specialization in functional adaptations ofspecies. In addition, heterogeneous environments exhibiting apredictable variability generate greater diversity and availabil-ity of food resources which can favor the development of spe-cialized diets and the evolution of adapted morphologies.
This hypothesis of habitat influence on ecomorphologi-cal relationships in communities could not be tested withouta multiplication of observations in different habitats. There-fore, the first objective of our study was to investigate the
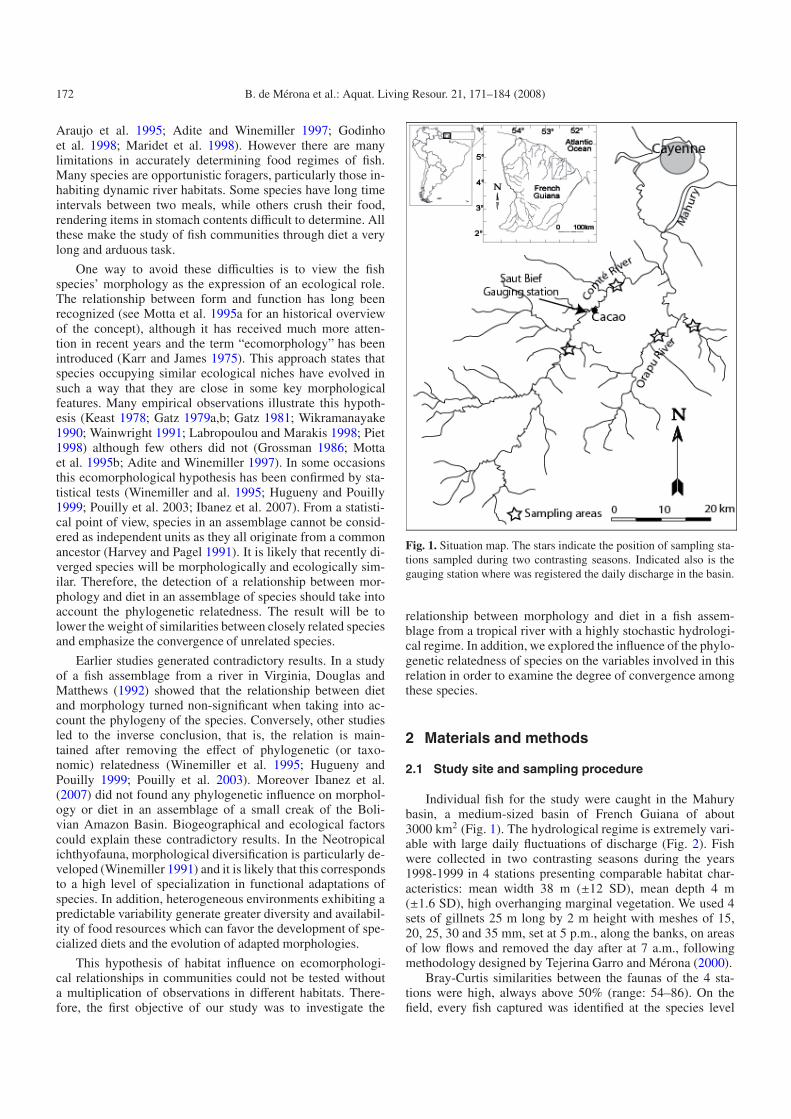
Fig. 1. Situation map. The stars indicate the position of sampling sta-tions sampled during two contrasting seasons. Indicated also is thegauging station where was registered the daily discharge in the basin.
relationship between morphology and diet in a fish assem-blage from a tropical river with a highly stochastic hydrologi-cal regime. In addition, we explored the influence of the phylo-genetic relatedness of species on the variables involved in thisrelation in order to examine the degree of convergence amongthese species.
2 Materials and methods
2.1 Study site and sampling procedure
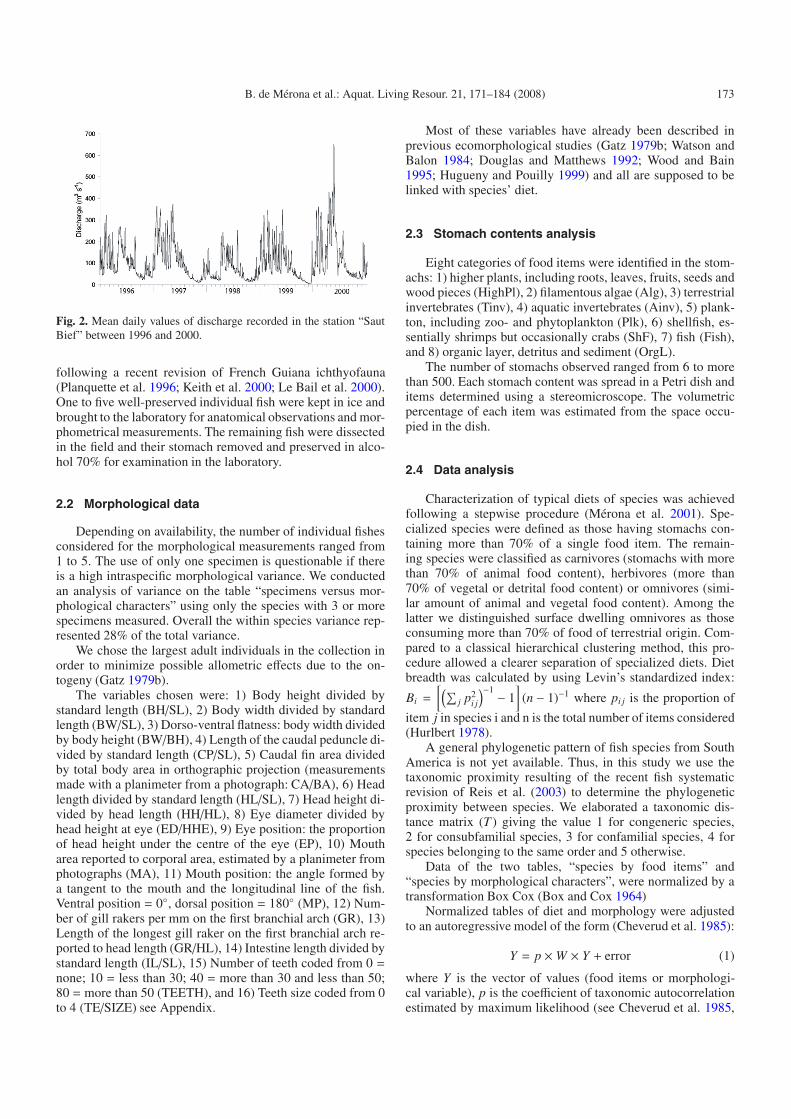
Individual fish for the study were caught in the Mahurybasin, a medium-sized basin of French Guiana of about3000 km2 (Fig. 1). The hydrological regime is extremely vari-able with large daily fluctuations of discharge (Fig. 2). Fishwere collected in two contrasting seasons during the years1998-1999 in 4 stations presenting comparable habitat char-acteristics: mean width 38 m (±12 SD), mean depth 4 m(±1.6 SD), high overhanging marginal vegetation. We used 4sets of gillnets 25 m long by 2 m height with meshes of 15,20, 25, 30 and 35 mm, set at 5 p.m., along the banks, on areasof low flows and removed the day after at 7 a.m., followingmethodology designed by Tejerina Garro and Mérona (2000).
Bray-Curtis similarities between the faunas of the 4 sta-tions were high, always above 50% (range: 54–86). On thefield, every fish captured was identified at the species level
B. de Mérona et al.: Aquat. Living Resour. 21, 171–184 (2008) 173
Fig. 2. Mean daily values of discharge recorded in the station “SautBief” between 1996 and 2000.
following a recent revision of French Guiana ichthyofauna(Planquette et al. 1996; Keith et al. 2000; Le Bail et al. 2000).One to five well-preserved individual fish were kept in ice andbrought to the laboratory for anatomical observations and mor-phometrical measurements. The remaining fish were dissectedin the field and their stomach removed and preserved in alco-hol 70% for examination in the laboratory.
2.2 Morphological data
Depending on availability, the number of individual fishesconsidered for the morphological measurements ranged from1 to 5. The use of only one specimen is questionable if thereis a high intraspecific morphological variance. We conductedan analysis of variance on the table “specimens versus mor-phological characters” using only the species with 3 or morespecimens measured. Overall the within species variance rep-resented 28% of the total variance.
We chose the largest adult individuals in the collection inorder to minimize possible allometric effects due to the on-togeny (Gatz 1979b).
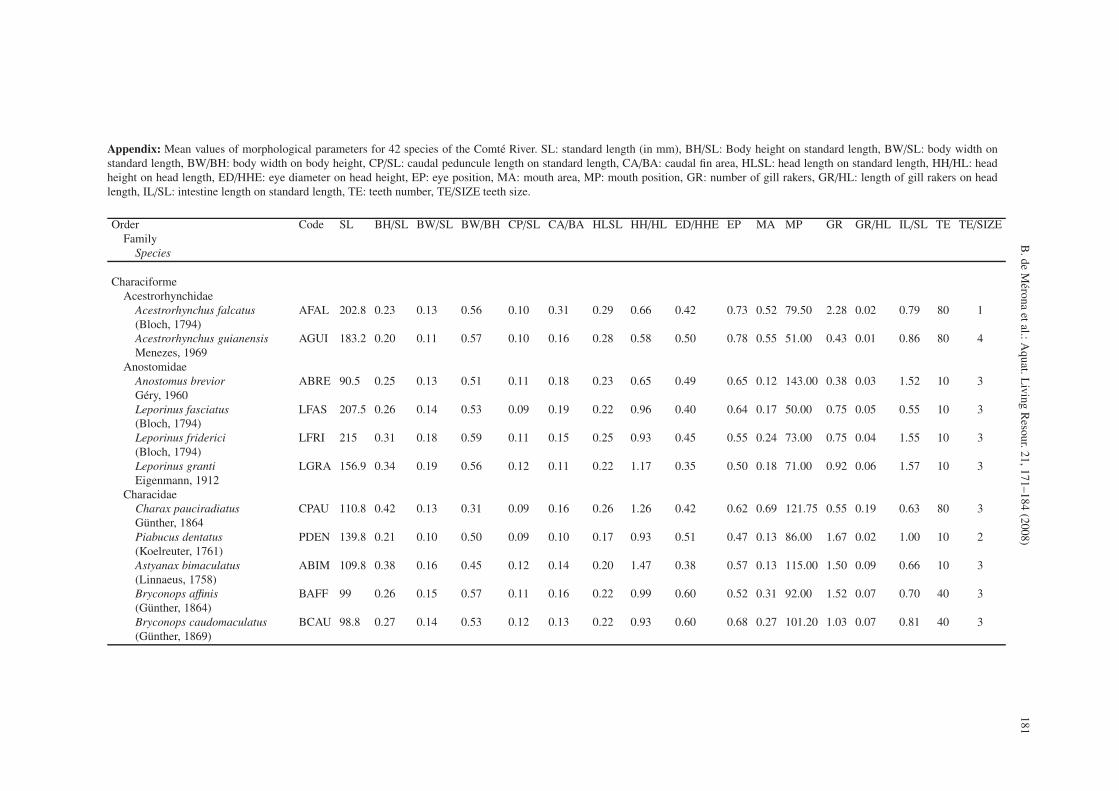
The variables chosen were: 1) Body height divided bystandard length (BH/SL), 2) Body width divided by standardlength (BW/SL), 3) Dorso-ventral flatness: body width dividedby body height (BW/BH), 4) Length of the caudal peduncle di-vided by standard length (CP/SL), 5) Caudal fin area dividedby total body area in orthographic projection (measurementsmade with a planimeter from a photograph: CA/BA), 6) Headlength divided by standard length (HL/SL), 7) Head height di-vided by head length (HH/HL), 8) Eye diameter divided byhead height at eye (ED/HHE), 9) Eye position: the proportionof head height under the centre of the eye (EP), 10) Moutharea reported to corporal area, estimated by a planimeter fromphotographs (MA), 11) Mouth position: the angle formed bya tangent to the mouth and the longitudinal line of the fish.Ventral position = 0◦, dorsal position = 180◦ (MP), 12) Num-ber of gill rakers per mm on the first branchial arch (GR), 13)Length of the longest gill raker on the first branchial arch re-ported to head length (GR/HL), 14) Intestine length divided bystandard length (IL/SL), 15) Number of teeth coded from 0 =none; 10 = less than 30; 40 = more than 30 and less than 50;80 = more than 50 (TEETH), and 16) Teeth size coded from 0to 4 (TE/SIZE) see Appendix.
Most of these variables have already been described inprevious ecomorphological studies (Gatz 1979b; Watson andBalon 1984; Douglas and Matthews 1992; Wood and Bain1995; Hugueny and Pouilly 1999) and all are supposed to belinked with species’ diet.
2.3 Stomach contents analysis
Eight categories of food items were identified in the stom-achs: 1) higher plants, including roots, leaves, fruits, seeds andwood pieces (HighPl), 2) filamentous algae (Alg), 3) terrestrialinvertebrates (Tinv), 4) aquatic invertebrates (Ainv), 5) plank-ton, including zoo- and phytoplankton (Plk), 6) shellfish, es-sentially shrimps but occasionally crabs (ShF), 7) fish (Fish),and 8) organic layer, detritus and sediment (OrgL).
The number of stomachs observed ranged from 6 to morethan 500. Each stomach content was spread in a Petri dish anditems determined using a stereomicroscope. The volumetricpercentage of each item was estimated from the space occu-pied in the dish.
2.4 Data analysis
Characterization of typical diets of species was achievedfollowing a stepwise procedure (Mérona et al. 2001). Spe-cialized species were defined as those having stomachs con-taining more than 70% of a single food item. The remain-ing species were classified as carnivores (stomachs with morethan 70% of animal food content), herbivores (more than70% of vegetal or detrital food content) or omnivores (simi-lar amount of animal and vegetal food content). Among thelatter we distinguished surface dwelling omnivores as thoseconsuming more than 70% of food of terrestrial origin. Com-pared to a classical hierarchical clustering method, this pro-cedure allowed a clearer separation of specialized diets. Dietbreadth was calculated by using Levin’s standardized index:
Bi =
[(∑j p2
i j
)−1 − 1]
(n − 1)−1 where pi j is the proportion of
item j in species i and n is the total number of items considered(Hurlbert 1978).
A general phylogenetic pattern of fish species from SouthAmerica is not yet available. Thus, in this study we use thetaxonomic proximity resulting of the recent fish systematicrevision of Reis et al. (2003) to determine the phylogeneticproximity between species. We elaborated a taxonomic dis-tance matrix (T ) giving the value 1 for congeneric species,2 for consubfamilial species, 3 for confamilial species, 4 forspecies belonging to the same order and 5 otherwise.
Data of the two tables, “species by food items” and“species by morphological characters”, were normalized by atransformation Box Cox (Box and Cox 1964)
Normalized tables of diet and morphology were adjustedto an autoregressive model of the form (Cheverud et al. 1985):
Y = p ×W × Y + error (1)
where Y is the vector of values (food items or morphologi-cal variable), p is the coefficient of taxonomic autocorrelationestimated by maximum likelihood (see Cheverud et al. 1985,
174 B. de Mérona et al.: Aquat. Living Resour. 21, 171–184 (2008)
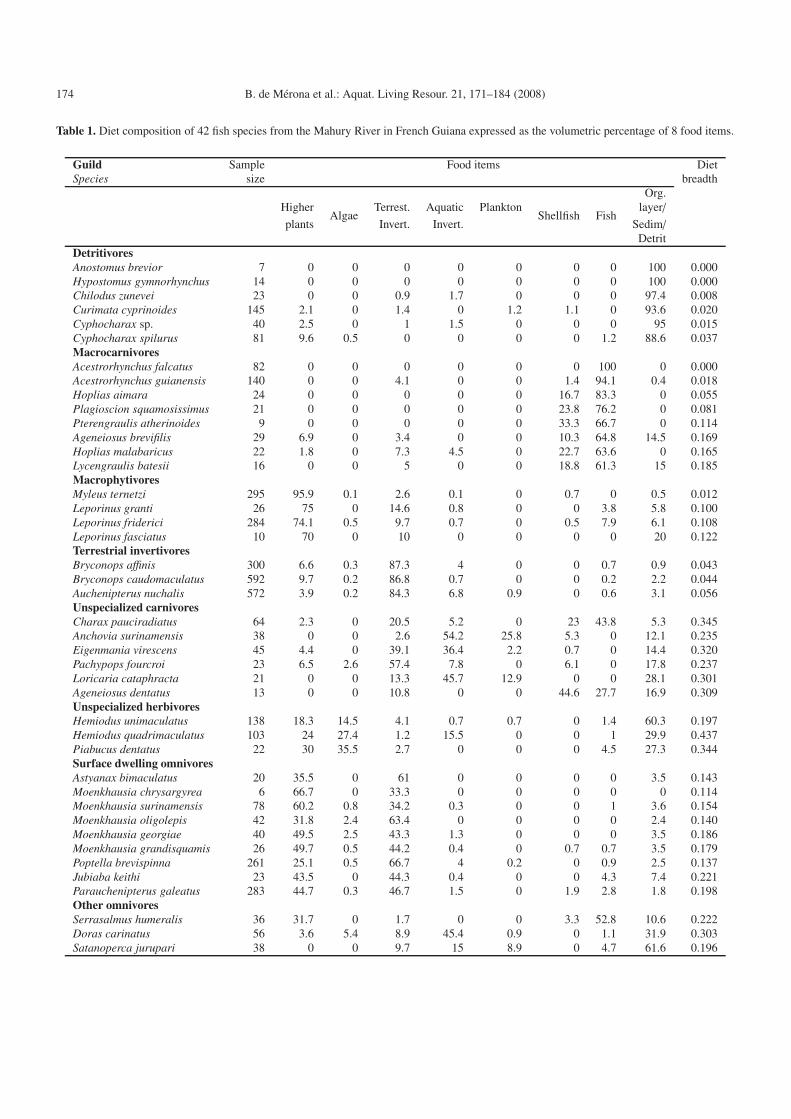
Table 1. Diet composition of 42 fish species from the Mahury River in French Guiana expressed as the volumetric percentage of 8 food items.
Guild Sample Food items DietSpecies size breadth
Org.Higher Terrest. Aquatic Plankton layer/
Algae Shellfish Fishplants Invert. Invert. Sedim/
DetritDetritivoresAnostomus brevior 7 0 0 0 0 0 0 0 100 0.000Hypostomus gymnorhynchus 14 0 0 0 0 0 0 0 100 0.000Chilodus zunevei 23 0 0 0.9 1.7 0 0 0 97.4 0.008Curimata cyprinoides 145 2.1 0 1.4 0 1.2 1.1 0 93.6 0.020Cyphocharax sp. 40 2.5 0 1 1.5 0 0 0 95 0.015Cyphocharax spilurus 81 9.6 0.5 0 0 0 0 1.2 88.6 0.037MacrocarnivoresAcestrorhynchus falcatus 82 0 0 0 0 0 0 100 0 0.000Acestrorhynchus guianensis 140 0 0 4.1 0 0 1.4 94.1 0.4 0.018Hoplias aimara 24 0 0 0 0 0 16.7 83.3 0 0.055Plagioscion squamosissimus 21 0 0 0 0 0 23.8 76.2 0 0.081Pterengraulis atherinoides 9 0 0 0 0 0 33.3 66.7 0 0.114Ageneiosus brevifilis 29 6.9 0 3.4 0 0 10.3 64.8 14.5 0.169Hoplias malabaricus 22 1.8 0 7.3 4.5 0 22.7 63.6 0 0.165Lycengraulis batesii 16 0 0 5 0 0 18.8 61.3 15 0.185MacrophytivoresMyleus ternetzi 295 95.9 0.1 2.6 0.1 0 0.7 0 0.5 0.012Leporinus granti 26 75 0 14.6 0.8 0 0 3.8 5.8 0.100Leporinus friderici 284 74.1 0.5 9.7 0.7 0 0.5 7.9 6.1 0.108Leporinus fasciatus 10 70 0 10 0 0 0 0 20 0.122Terrestrial invertivoresBryconops affinis 300 6.6 0.3 87.3 4 0 0 0.7 0.9 0.043Bryconops caudomaculatus 592 9.7 0.2 86.8 0.7 0 0 0.2 2.2 0.044Auchenipterus nuchalis 572 3.9 0.2 84.3 6.8 0.9 0 0.6 3.1 0.056Unspecialized carnivoresCharax pauciradiatus 64 2.3 0 20.5 5.2 0 23 43.8 5.3 0.345Anchovia surinamensis 38 0 0 2.6 54.2 25.8 5.3 0 12.1 0.235Eigenmania virescens 45 4.4 0 39.1 36.4 2.2 0.7 0 14.4 0.320Pachypops fourcroi 23 6.5 2.6 57.4 7.8 0 6.1 0 17.8 0.237Loricaria cataphracta 21 0 0 13.3 45.7 12.9 0 0 28.1 0.301Ageneiosus dentatus 13 0 0 10.8 0 0 44.6 27.7 16.9 0.309Unspecialized herbivoresHemiodus unimaculatus 138 18.3 14.5 4.1 0.7 0.7 0 1.4 60.3 0.197Hemiodus quadrimaculatus 103 24 27.4 1.2 15.5 0 0 1 29.9 0.437Piabucus dentatus 22 30 35.5 2.7 0 0 0 4.5 27.3 0.344Surface dwelling omnivoresAstyanax bimaculatus 20 35.5 0 61 0 0 0 0 3.5 0.143Moenkhausia chrysargyrea 6 66.7 0 33.3 0 0 0 0 0 0.114Moenkhausia surinamensis 78 60.2 0.8 34.2 0.3 0 0 1 3.6 0.154Moenkhausia oligolepis 42 31.8 2.4 63.4 0 0 0 0 2.4 0.140Moenkhausia georgiae 40 49.5 2.5 43.3 1.3 0 0 0 3.5 0.186Moenkhausia grandisquamis 26 49.7 0.5 44.2 0.4 0 0.7 0.7 3.5 0.179Poptella brevispinna 261 25.1 0.5 66.7 4 0.2 0 0.9 2.5 0.137Jubiaba keithi 23 43.5 0 44.3 0.4 0 0 4.3 7.4 0.221Parauchenipterus galeatus 283 44.7 0.3 46.7 1.5 0 1.9 2.8 1.8 0.198Other omnivoresSerrasalmus humeralis 36 31.7 0 1.7 0 0 3.3 52.8 10.6 0.222Doras carinatus 56 3.6 5.4 8.9 45.4 0.9 0 1.1 31.9 0.303Satanoperca jurupari 38 0 0 9.7 15 8.9 0 4.7 61.6 0.196
B. de Mérona et al.: Aquat. Living Resour. 21, 171–184 (2008) 175
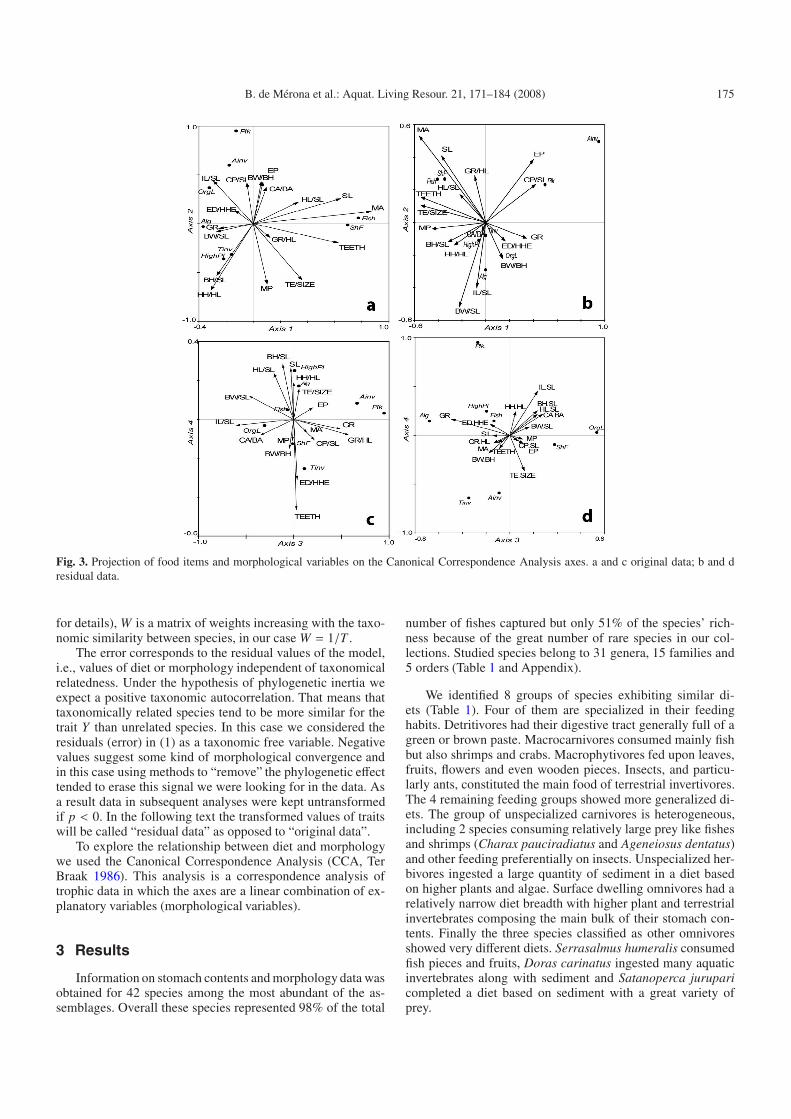
Fig. 3. Projection of food items and morphological variables on the Canonical Correspondence Analysis axes. a and c original data; b and dresidual data.
for details), W is a matrix of weights increasing with the taxo-nomic similarity between species, in our case W = 1/T .
The error corresponds to the residual values of the model,i.e., values of diet or morphology independent of taxonomicalrelatedness. Under the hypothesis of phylogenetic inertia weexpect a positive taxonomic autocorrelation. That means thattaxonomically related species tend to be more similar for thetrait Y than unrelated species. In this case we considered theresiduals (error) in (1) as a taxonomic free variable. Negativevalues suggest some kind of morphological convergence andin this case using methods to “remove” the phylogenetic effecttended to erase this signal we were looking for in the data. Asa result data in subsequent analyses were kept untransformedif p < 0. In the following text the transformed values of traitswill be called “residual data” as opposed to “original data”.
To explore the relationship between diet and morphologywe used the Canonical Correspondence Analysis (CCA, TerBraak 1986). This analysis is a correspondence analysis oftrophic data in which the axes are a linear combination of ex-planatory variables (morphological variables).
3 Results
Information on stomach contents and morphology data wasobtained for 42 species among the most abundant of the as-semblages. Overall these species represented 98% of the total
number of fishes captured but only 51% of the species’ rich-ness because of the great number of rare species in our col-lections. Studied species belong to 31 genera, 15 families and5 orders (Table 1 and Appendix).
We identified 8 groups of species exhibiting similar di-ets (Table 1). Four of them are specialized in their feedinghabits. Detritivores had their digestive tract generally full of agreen or brown paste. Macrocarnivores consumed mainly fishbut also shrimps and crabs. Macrophytivores fed upon leaves,fruits, flowers and even wooden pieces. Insects, and particu-larly ants, constituted the main food of terrestrial invertivores.The 4 remaining feeding groups showed more generalized di-ets. The group of unspecialized carnivores is heterogeneous,including 2 species consuming relatively large prey like fishesand shrimps (Charax pauciradiatus and Ageneiosus dentatus)and other feeding preferentially on insects. Unspecialized her-bivores ingested a large quantity of sediment in a diet basedon higher plants and algae. Surface dwelling omnivores had arelatively narrow diet breadth with higher plant and terrestrialinvertebrates composing the main bulk of their stomach con-tents. Finally the three species classified as other omnivoresshowed very different diets. Serrasalmus humeralis consumedfish pieces and fruits, Doras carinatus ingested many aquaticinvertebrates along with sediment and Satanoperca juruparicompleted a diet based on sediment with a great variety ofprey.
176 B. de Mérona et al.: Aquat. Living Resour. 21, 171–184 (2008)
Table 2. Results of Canonical Correspondence Analyses (CCA) between diet and morphology of 42 fish species from the Mahury basin inFrench Guiana. Orig. = original data; Resid. = taxonomic-free data.
Axis 1 Axis 2 Axis 3 Axis 4Orig. Resid. Orig. Resid. Orig. Resid. Orig. Resid.
Cumulative % of dietary data 26.9 30.4 44.2 47.0 57.1 52.2 63.1 56.0Cumulative % of diet/morphology relationship 38.4 48.9 63.1 75.6 81.5 83.9 90.1 90.0Diet/morphology relationship (r2) 87.7 78.1 69.9 73.1 71.7 44.1 53.7 62.4
Table 3. Fraction of variance of food items explained by the 4 first axes of Canonical Correspondence Analyses on original and residual data.In bold, fraction > 20% of variance explained by the model. Terr invert: terrestrial invertebrates; Aquat invert: aquatic invertebrates; Organiclayer: detritus or sediment.
Item Axis 1 Axis 2 Axis 3 Axis 4 % Expl.Orig. Resid. Orig. Resid. Orig. Resid. Orig. Resid. Orig. Resid.
Higher plants 0.113 0.034 0.309 0.116 0.001 0.029 0.197 0.045 63.53 48.01Algae 0.052 0.000 0.000 0.256 0.002 0.109 0.015 0.005 39.84 47.75Terr invert 0.064 0.000 0.249 0.053 0.046 0.081 0.220 0.280 58.49 53.54Aquat invert 0.024 0.584 0.275 0.160 0.463 0.000 0.001 0.018 79.43 78.07Plankton 0.005 0.309 0.274 0.067 0.369 0.007 0.000 0.088 76.76 50.79Shellfish 0.452 0.411 0.000 0.244 0.000 0.038 0.021 0.003 73.67 77.44Fish 0.808 0.391 0.005 0.167 0.007 0.003 0.004 0.004 84.92 62.10Organic layer 0.203 0.099 0.265 0.233 0.239 0.230 0.003 0.000 71.06 57.40
Table 4. Contributions of morphological variables in Canonical Cor-respondence Analyses of original and residual data. E = additional fit(increase in eigenvalue in %); P = probability from 199 random per-mutations. In bold, variables selected by a stepwise forward model(see methods for abbreviations).
Morphological Original data Residual datavariables
P E P ESL 0.130 3.409 0.078 4.878BH/SL 0.322 1.705 0.372 2.439BW/SL 0.920 0.568 0.034 7.317BW/BH 0.592 1.136 0.068 4.878CP/SL 0.488 1.705 0.704 2.439CA/BA 0.132 2.841 0.242 2.439HL/SL 0.794 0.568 0.718 2.439HH/HL 0.002 12.500 0.098 4.878ED/HHE 0.084 3.409 0.116 4.878EP 0.030 4.545 0.002 17.073MA 0.002 30.114 0.002 21.951MP 0.230 2.273 0.476 2.439GR 0.164 2.841 0.158 4.878GR/HL 0.012 9.091 0.180 2.439IL/SL 0.002 11.364 0.734 0.000TEETH 0.008 6.250 0.208 2.439TE/SIZE 0.006 5.682 0.010 12.195
Canonical Correspondence Analyses of the two data sets(original and residual) both revealed significant relationshipsbetween diet and morphology (p = 0.002). In both cases the4 first factors of the analysis explained more than 90% of thetotal variability of the data sets (Table 2). However the corre-lations of diet versus morphology on the 4 axis were slightlyhigher for the original data as compared to those for the resid-ual data. The fraction of variance of each food item explainedby morphology was generally lower for the residual data withthe exception of algae (48% vs. 40%) and shellfish (77% vs.
74%) (Table 3). For the other items this value varies from 64to 85% for the original data and from 48 to 78% for the resid-ual data. The main differences between the two analyses con-cerned the morphological variables involved in the explanatorymodel. A stepwise forward selection of these variables gave amodel with 7 variables explaining 79.55% of the total variabil-ity of the original data set, whereas the same method appliedto the residual data gave a model with 4 variables explaining58.54% of the total variability of the data set (Table 4). Threevariables were common in the two models: the mouth area andthe teeth size, both showing a strong association with items fishand shellfish and eye position with aquatic invertebrates andplankton (Fig. 3a–d). Gut length was associated with organiclayer, teeth number and size with fish and shellfish (Fig. 3a),gill raker size with plankton, head height with higher plants(Fig. 3c), when considering original data. Body width was as-sociated with higher plants in the residual data model (Fig. 3b).
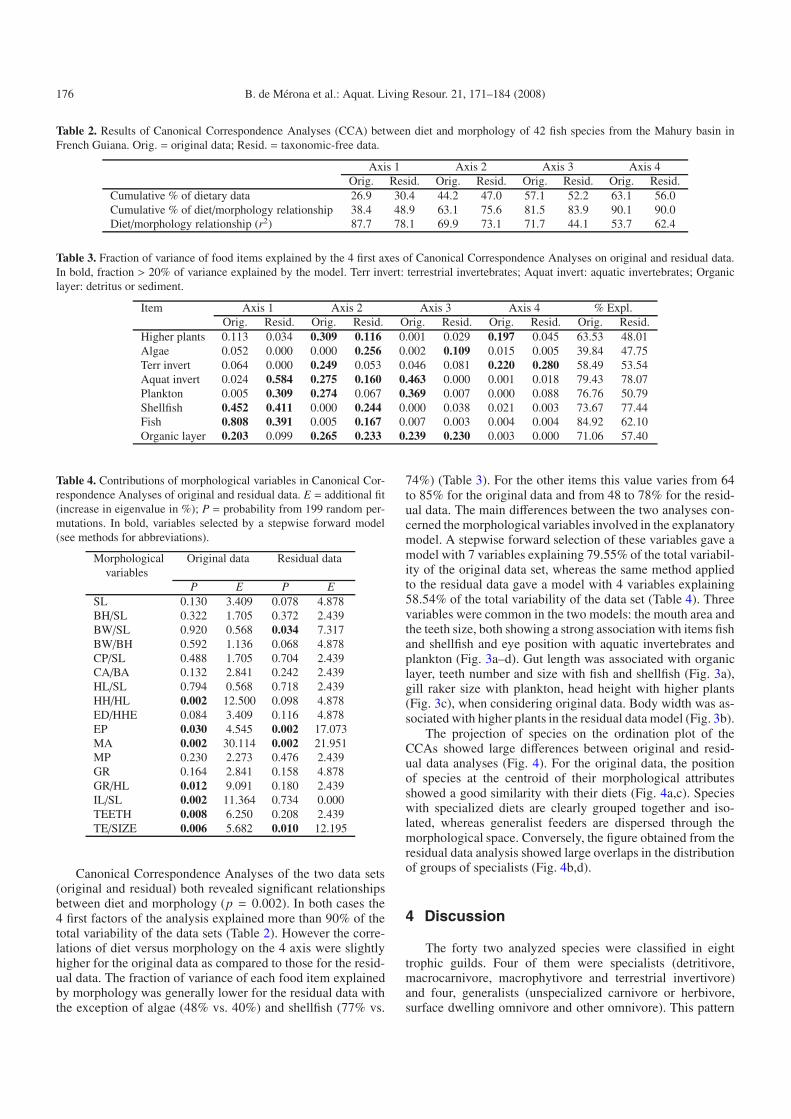
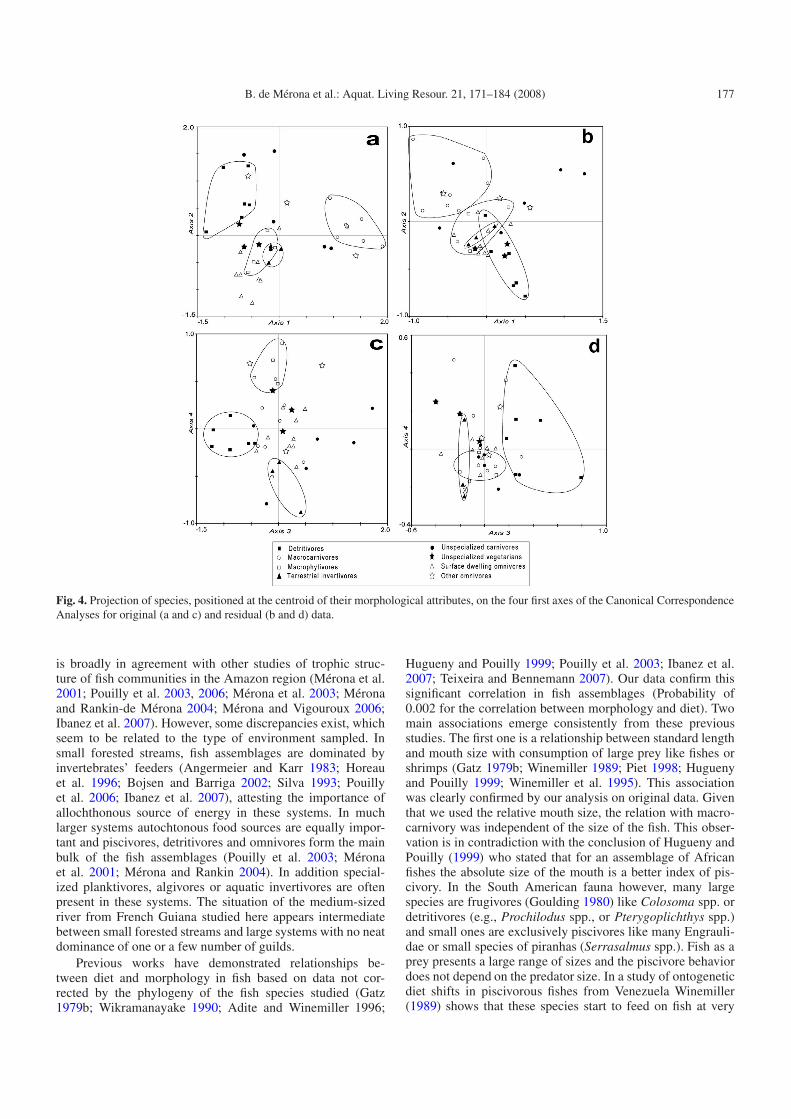
The projection of species on the ordination plot of theCCAs showed large differences between original and resid-ual data analyses (Fig. 4). For the original data, the positionof species at the centroid of their morphological attributesshowed a good similarity with their diets (Fig. 4a,c). Specieswith specialized diets are clearly grouped together and iso-lated, whereas generalist feeders are dispersed through themorphological space. Conversely, the figure obtained from theresidual data analysis showed large overlaps in the distributionof groups of specialists (Fig. 4b,d).
4 Discussion
The forty two analyzed species were classified in eighttrophic guilds. Four of them were specialists (detritivore,macrocarnivore, macrophytivore and terrestrial invertivore)and four, generalists (unspecialized carnivore or herbivore,surface dwelling omnivore and other omnivore). This pattern
B. de Mérona et al.: Aquat. Living Resour. 21, 171–184 (2008) 177
Fig. 4. Projection of species, positioned at the centroid of their morphological attributes, on the four first axes of the Canonical CorrespondenceAnalyses for original (a and c) and residual (b and d) data.
is broadly in agreement with other studies of trophic struc-ture of fish communities in the Amazon region (Mérona et al.2001; Pouilly et al. 2003, 2006; Mérona et al. 2003; Méronaand Rankin-de Mérona 2004; Mérona and Vigouroux 2006;Ibanez et al. 2007). However, some discrepancies exist, whichseem to be related to the type of environment sampled. Insmall forested streams, fish assemblages are dominated byinvertebrates’ feeders (Angermeier and Karr 1983; Horeauet al. 1996; Bojsen and Barriga 2002; Silva 1993; Pouillyet al. 2006; Ibanez et al. 2007), attesting the importance ofallochthonous source of energy in these systems. In muchlarger systems autochtonous food sources are equally impor-tant and piscivores, detritivores and omnivores form the mainbulk of the fish assemblages (Pouilly et al. 2003; Méronaet al. 2001; Mérona and Rankin 2004). In addition special-ized planktivores, algivores or aquatic invertivores are oftenpresent in these systems. The situation of the medium-sizedriver from French Guiana studied here appears intermediatebetween small forested streams and large systems with no neatdominance of one or a few number of guilds.
Previous works have demonstrated relationships be-tween diet and morphology in fish based on data not cor-rected by the phylogeny of the fish species studied (Gatz1979b; Wikramanayake 1990; Adite and Winemiller 1996;
Hugueny and Pouilly 1999; Pouilly et al. 2003; Ibanez et al.2007; Teixeira and Bennemann 2007). Our data confirm thissignificant correlation in fish assemblages (Probability of0.002 for the correlation between morphology and diet). Twomain associations emerge consistently from these previousstudies. The first one is a relationship between standard lengthand mouth size with consumption of large prey like fishes orshrimps (Gatz 1979b; Winemiller 1989; Piet 1998; Huguenyand Pouilly 1999; Winemiller et al. 1995). This associationwas clearly confirmed by our analysis on original data. Giventhat we used the relative mouth size, the relation with macro-carnivory was independent of the size of the fish. This obser-vation is in contradiction with the conclusion of Hugueny andPouilly (1999) who stated that for an assemblage of Africanfishes the absolute size of the mouth is a better index of pis-civory. In the South American fauna however, many largespecies are frugivores (Goulding 1980) like Colosoma spp. ordetritivores (e.g., Prochilodus spp., or Pterygoplichthys spp.)and small ones are exclusively piscivores like many Engrauli-dae or small species of piranhas (Serrasalmus spp.). Fish as aprey presents a large range of sizes and the piscivore behaviordoes not depend on the predator size. In a study of ontogeneticdiet shifts in piscivorous fishes from Venezuela Winemiller(1989) shows that these species start to feed on fish at very
178 B. de Mérona et al.: Aquat. Living Resour. 21, 171–184 (2008)
small sizes 40 to 80 mm SL. Number and size of teeth are twoother characters that have been linked to the capture of largeprey such as crayfish or fish (Gatz 1979b) and could be anothergood index of a macrocarnivorous diet.
The second important association pointed out by previousworks, and also detected in the analysis of our original data,is that of the relative gut length with consumption of detri-tus (Kapoor et al. 1975; Reifel and Travill 1978; Paugy 1994;Kramer and Bryant 1995; Hugueny and Pouilly 1999; Pouillyet al. 2003; Ibanez et al. 2007). Herbivory was also sometimesreported as linked to gut length in the literature and this isapparently related to the quantity of indigestible material inthe diet (Kapoor et al. 1975). Indeed species like Myleus spp.have a long intestine generally full of leaf debris. However,at the community level, the relation macrophytes/gut lengthhas never been proved (Gatz 1979; Hugueny and Pouilly 1999;Pouilly et al. 2003) and was not found in our data either. Thisis probably due to the position of many omnivores, whichconsume large amount of vegetal material but have a relativelyshort intestine. Herbivorous diet was instead associated withhead height (for the original data) and body width (for theresidual data). Generally, herbivorous species are poor swim-mers, inhabiting preferentially the still waters of pools. Anevolution towards a high or large body could have the adaptivesignificance of avoiding predation and increasing maneuver-ability.
Long and numerous gill rakers are generally associatedwith a filtering feeding behavior and as a consequence withsmall prey (Kliewer 1970). However, Gatz ‘s results (1979b)did not strongly support this hypothesis: for the set of species,he analyzed, the taxonomic component seemed to be determi-nant in the relationship. Gill raker number and size have beenshown to be associated with planktivory in the Mamoré flood-plain (Pouilly et al. 2003). Our data weakly support this con-clusion. Number and size of gill rakers were somehow corre-lated (r = 0.4377) and were associated to plankton and aquaticinvertebrates. The weakness of this relation in the Mahurybasin was probably due to the fact that plankton is a relativelyrare resource in that environment and, as a consequence, thereis no specialist planktivore in our assemblage. These resultssuggest that the number and size of gill rakers are not strongpredictive characters for attributing a diet to a morphologicalfeature in our context. In our data, an eye in an upward posi-tion was apparently linked to aquatic invertebrates. This obser-vation supports Gatz’s assumption that a dorsal position of eyecould be associated, along with other characters, to a benthichabitat preference, compatible with a diet based on aquatic in-vertebrates (Gatz 1979a).
We found a strong taxonomic influence on both diet andmorphology. For most of the variables (morphology and fooditem) the taxonomic proximity of species was correlated toproximity in morphology and/or diet. This result is in con-tradiction with the situation observed in the Chipiriri Riverwhere no relation has been detected between morphology ordiet and phylogenetic proximity (Ibanez et al. 2007). The spe-cific composition of the assemblages under study is probablyresponsible for this contradiction. In the Chipiriri River, only2 genera out of 28 contained more than one species (actuallytwo) whereas 7 out of 31 included more than one species in the
Mahury assemblage. Although, our sample was partial, due togillnets’ selectivity, it could be hypothesized that habitat playsa fundamental role in the evolution of fish assemblages lead-ing to different faunistic compositions. Indeed, large habitatsharbor more niches and allow the coexistence of more species.
Because of the strong influence of taxonomic related-ness on diet and morphology in our set of data, it hasbeen accounted for in the correlation between morphologyand diet. The result suggests that unrelated species havingsimilar diets display similar morphological adaptations, andthus display convergence. However some correlations betweenmorphological traits and diet have been altered by consideringtaxonomic-free variables instead of raw data.
Two main associations between morphology and diet weremaintained after removing the taxonomic proximity betweenspecies: mouth area and teeth size with fish and shellfishconsumption, and eye position with aquatic invertebrates andplankton. Because macrocarnivores and consumers of aquaticinvertebrates included species belonging to distantly relatedfamilies, the relation should be, indeed, relatively phylogenet-ically independent and the results evidenced an evolutionaryprocess based on convergence.
Conversely the association between gut length and detri-tivory was not demonstrated in our analysis of taxonomic-free data. This is probably due to the fact that gut morphol-ogy and length have a strong taxonomic component. This hasbeen shown in the African ichthyofauna (Kouamélan et al.1997), and this is probably also the case for the Neotropi-cal ichthyofauna. Indeed, detritivory is closely related to thephylogeny of species as every studied species from the fami-lies or sub-families Curimatidae, Prochilodontidae or Hypos-tominae are mud-feeders (Kramer and Bryant 1995; Bowen1988; Goulding et al. 1988; Mérona et al. 2001; Mérona andRankin-de Mérona 2004). Ideally correlations between vari-ables should be preserved when taxonomy (phylogeny) is ac-counted for. However when entire taxa (e.g. families) are ho-mogeneous in their morphology and ecology the removal ofthe taxonomic component leads to weakness the initial eco-morphological relationships as observed in our data with therelationship between detrivory and gut length.
Thus, for this character, we could hypothesize an evolu-tionary process based on parallelism, that is a convergencewithin relatively close evolutionary lines (Winemiller et al.1995).
5 Conclusion
Our results based on the original data (i.e. those not cor-rected by the taxonomic relatedness of species) confirm for-mer works on tropical rich ichthyofauna (Wikramanayake1990; Winemiller 1995; Hugueny and Pouilly 1999; Pouillyet al. 2003; Ibanez et al. 2007). Three main specialized di-ets, macrocarnivory (especially ichthyophagy), detritivory andplanktivory were associated to some morphological features.Generally the authors confirmed that the overall correlation be-tween diet and morphology was still significant when control-ling the effect of the phylogeny (or failing that, the taxonomy)of the analyzed group of species in the model and inferred thereality of the associations between individual morphological
B. de Mérona et al.: Aquat. Living Resour. 21, 171–184 (2008) 179
traits and diet. The analysis conducted here shows that signifi-cant overall correlations between morphology and diet both inraw data and data corrected by the phylogeny does not neces-sarily imply similar individual associations between morpho-logical traits and food items. Although considering taxonomicdistance as a surrogate of true phylogenetic distance, our re-sults suggest that phylogeny has indeed a significant influenceon the relationship between diet and morphology in our setof data. The results presented also suggest that the habitat inwhich the study is conducted has an influence on the relation-ships found between morphology and diet via the taxonomiccomposition of its fauna. However many more observations indifferent habitats are necessary to test this hypothesis. Overall,it appears that a few associations morphology/diet are robustbut are not sufficient to infer a trophic structure of an entirefish assemblage as a number of diets are not clearly associatedwith morphological features.
Acknowledgements. This study was part of a large project, whichreceived financial support from the French government and the Re-gional Assembly of French Guiana Region. Special thanks are givento the technical staff of hydrobiology laboratory of Centre IRD ofCayenne: Jean-Claude Bron, Rolland Ruffine and Michel Tarcy. Weare also grateful to three anonymous referees whose commentariesand corrections were very helpful in improving the manuscript. Atlast, many thanks to Judy Rankin-de Mérona for the language editingand critical reading.
References
Adite A., Winemiller K.O., 1997, Trophic ecology and ecomorphol-ogy of fish assemblages in coastal lakes of Benin, West Africa.Ecoscience 4, 6–23.
Angermeier P.L., Karr J.R., 1983, Fish communities along environ-mental gradients in a system of tropical streams. Environ. Biol.Fishes 9, 117–135.
Araujo Lima C.A.R.M., Agostinho A.A., Fabre N.N., 1995, Trophicaspects of fish communities in Brazilian rivers and reservoirs.In: Tundisi J.G., Bicudo C.E.M., Matsamura Tundisi T. (Eds.)Limnology in Brazil, Brazil, Brazilian Academy of Sciences/Brazilian Limnological Society, pp. 105–136.
Bojsen B.H., Barriga R., 2002, Effects of deforestation on fish com-munty structure in Ecuadorian Amazon streams. Freshw. Biol.47, 2246–2260.
Bowen S.H., 1988, Detritivory and herbivory. In: Levêque C., BrutonM.N., Ssentongo G.W. (Eds) Biologie et écologie des poissonsd’eau douce africains., Paris, ORSTOM, pp. 243–247.
Bowlby J.N., Roff J.C., 1986, Trophic structure in southern Ontariostreams. Ecology 67, 1670–1679.
Box G.E.P., Cox D.R., 1964, An analysis of transformations. J. R.Stat. Soc., Ser. B 26, 211–243.
Cheverud J.M., Dow M.M., Leutenegger W., 1985, The quantitativeassessment of phylogenetic constraints in comparative analysis:sexual dimorphism in body weight among primates. Evolution39, 1335–1351.
Chipps S.R., Perry W.B., Perry S.A., 1994, Fish assemblages of thecentral Appalachian Mountains: an examination of trophic groupabundance in nine West Virginia streams. Environ. Biol. Fishes40, 91–98.
Douglas M.E., Matthews W.J., 1992, Does morphology predict ecol-ogy? Hypothesis testing within a freshwater stream fish assem-blage. Oikos 65, 213–224.
Flecker A.S., 1992, Fish trophic guilds and the structure of a tropicalstream: weak direct vs. strong indirect effects. Ecology 73, 927–940.
Gatz Jr. A.J., 1979a, Community organization in fishes as indicatedby morphological features. Ecology 60, 711–718.
Gatz Jr. A.J., 1979b, Ecological morphology of freshwater streamfishes. Tulane Stud. Zool. Bot. 21, 91–124.
Gatz Jr. A.J., 1981, Morphologically inferred niche differentiation instream fishes. Am. Midl. Nat. 106, 10–21.
Godinho F.N., Ferreira M.T., Castro M.I.P.E., 1998, Fish assemblagecomposition in relation to environmental gradients in Portuguesereservoirs. Aquat. Living Resour. 11, 325–334.
Goulding M., 1980, The fishes and the forest. Berkeley, Los Angeles,London, University of California Press.
Goulding M., Carvalho M.L., Ferreira E.J.G., 1988, Rio Negro. Richlife in poor water. The Hague, The Netherlands, SPB AcademicPublishing bv.
Grossman G.D., 1986, Food resource partitioning in a rocky intertidalfish assemblage. J. Zool., London B 1, 317–355.
Hartley P.H.T., 1948, Food and feeding relationships in a communityof fresh-water fishes. J. Anim. Ecol. 17, 1–14.
Harvey P.H., Pagel M.D., 1991, The comparative method in evolu-tionary biology. Oxford, Oxford University Press.
Herrera C.M., 1976, A trophic diversity index for presence-abscencefood data. Oecologia (Berlin) 25, 187–191.
Horeau V., Cerdan P., Champeau A., Richard S., 1996, Importancedes apports exogènes dans le régime alimentaire de quelquespoissons de “criques” du bassin versant du fleuve Sinnamary(Guyane française). Rev. Ecol. (Terre et Vie) 51, 29–41.
Hugueny B., Pouilly M., 1999, Morphological correlates of diet in anassemblage of West African freshwater fishes. J. Fish Biol. 54,1310–1325.
Hurlbert S.H., 1978, The measurement of niche overlap and somerelatives. Ecology 59, 67–77.
Ibanez C., Tedesco P., Bigorne R., Hugueny B., Pouilly M., Zepita C.,Zubieta J., Oberdorff. T., 2007, Dietary-morphological relation-ships in fish assemblages of small forested streams in the BolivianAmazon. Aquat. Living Resour. 20, 131–142.
Kapoor B.G., Smit H., Verighina I.A., 1975, The alimentary canal anddigestion in Teleosts. Adv. Mar. Biol. 13, 109–239.
Karr J.R., James F.C., 1975, Eco-morphological configurations andconvergent evolution in species and communities. In Cody M.L.,Diamond J.M. (eds.) Ecology and Evolution of Communities.Cambridge, Harvard University Press, pp. 258–291.
Keast A., 1978, Trophic and spatial interrelationships in the fishspecies of an Ontario temperate lake. Environ. Biol. Fishes 3, 7-31.
Keith P., Le Bail P.-Y., Planquette P., 2000, Atlas des poissons d’eaudouce de Guyane. Tome 2, fasc. I. Paris, MNHN/SPN.
Kliewer E.V., 1970, Gillraker variation and diet in lake whitefishCoregonus clupeaformis in nothern Manitoba. In: Lindsey C.C.,Woods C.S. (eds.) Biology of Coregonides fishes. Winnipeg,Univ. Manitoba Press, pp. 147–165.
Kouamélan E.P., Gourène G., Teugels G.G., N’Douba V., Thys vanden Audenaerde F.E., 1997, Diversité morphologique du tube di-gestif chez 39 espèces de poissons africains et relation avec laclassification ichtyologique. J. Afr. Zool. 111, 109–119.
Kramer D.L., Bryant M.J., 1995, Intestine length in the fishes of atropical stream, 1. Ontogenetic allometry. Environ. Biol. Fishes42, 115–127.
180 B. de Mérona et al.: Aquat. Living Resour. 21, 171–184 (2008)
Labropoulou M., Marakis G., 1998, Morphological-dietary relation-ships vithin two assemblages of marine demersal fishes. Environ.Biol. Fishes 51, 309–319.
Le Bail P.-Y., Keith P., Planquette P., 2000, Atlas des poissons d’eaudouce de Guyane. Tome 2, fasc. 2. Paris, MNHN/SPN.
Maridet L., Wasson J.G., Philippe M., Amoros C., Naiman R.J., 1998,Trophic structure of three streams with contrasting riparian vege-tation and geomorphology. Arch. Hydrobiol. 144, 61–85
Mérona B. de, Santos G.M. Dos, Almeida R.G. de, 2001, Short termeffects of Tucurui Dam (Amazonia, Brazil) on the trophic organi-zation of fish communities. Environ. Biol. Fishes 60, 375–392.
Mérona B. de, Vigouroux R., Horeau V., 2003, Changes in food re-sources and their utilization by fish assemblages in a large tropi-cal reservoir in South America (Petit-Saut Dam, French Guiana).Acta Oecol. 24, 147–156.
Mérona B. de, Rankin-de Mérona J., 2004, Food resource partitioningin a fish community of the Central Amazon floodplain. Neotrop.Ichthyol. 2, 75–84.
Mérona B. de, Vigouroux R., 2006, Diet changes in fish species froma large reservoir in South America and their impact on the trophicstructure of fish assemblages (Petit-Saut Dam, French Guiana).Int. J. Limnol. 42, 53–61.
Motta P.J., Norton S.F., Luczkovich J.J., 1995a, Perspectives on theecomorphology of bony fishes. Environ. Biol. Fishes 44, 11–20.
Motta P.J., Clifton K.B., Hernandez P., Eggold B.T., 1995b,Ecomorphological correlates in ten species of subtropical sea-grass fishes: diets and microhabitat utilization. Environ. Biol.Fishes 44, 37–60.
Parrish J.D., 1989, Fish communities of interacting shallow-waterhabitats in tropical oceanic regions. Mar. Ecol. Prog. Ser. 58,143–160.
Paugy D., 1994, Ecologie des poissons tropicaux d’un cours d’eautemporaire (Baoulé, haut bassin du Sénégal au Mali): adapta-tion au milieu et plasticité du régime alimentaire. Rev. Hydrobiol.Trop. 27, 157–172.
Piet G.J., 1998, Ecomorphology of a size-structured tropical freshwa-ter fish community. Environ. Biol. Fishes 51, 67–86.
Planquette P., Keith P., Le Bail J.-Y., 1996, Atlas des poissons d’eaudouce de Guyane. Tome 1. Paris, IEGB-MNHN/INRA/CSP/Min.Environnement.
Pouilly M., Lino F., Bretenoux J.–G., Rosales C., 2003, Dietary-morphological relationships in a fish assemblage of the BolivianAmazonian floodplain. J. Fish Biol. 62, 1137–1158.
Pouilly M., Barrera S., Rosales C., 2006, Changes of taxonomic andtrophic structure of fish assemblages along an environmental gra-dient in the Upper Beni watershed (Bolivia). J. Fish Biol. 68,137–156.
Reifel C.W., Travill A.A., 1978, Gross morphology of the alimentarycanal in 10 Teleostean species. Anat. Anz. 144, 441–449.
Reis R.E., Kullander S.O., Ferraris Jr. C.J., 2003, Check list of thefreshwater fishes of South and Central America. Porto Alegre,Brasil, Edipucrs.
Roger C., Grandperrin R., 1976, Pelagic food webs in the tropicalpacific. Limnol. Oceanogr. 21, 731–735.
Schlosser I.J., 1982, Trophic structure, reproductive success, andgrowth rate of fishes in a natural and modified headwater stream.Can. J. Fish. Aquat. Sci. 39, 968–978.
Schoener T.W., 1989, Food webs from the small to the large. Ecology70, 1559–1589.
Sheldon A.L., Meffe G.K., 1993, Multivariate analysis of feeding re-lationships of fishes in blackwater streams. Environ. Biol. Fishes37, 161–171.
Silva C.P.D., 1993, Alimentação e distribuição espacial de algumasespécies de peixes do igarapé do Candirú, Amazonas, Brazil.Acta Amazon. 23, 271–285.
Tejerina-Garro F.L., Mérona B. de, 2000, Gill net sampling standard-isation in large rivers of French Guiana (South America). Bull.Fr. Pêche Piscic. 357/358, 227–240.
Teixeira I., Bennemann S.T., 2007, Ecomorfologia refletindo a dietados peixes em um reservatório no sul do Brasil. Biota Neotrop. 7,67–76.
Ter Braak C.J.F., 1986, Canonical Correspondence Analysis, a neweigenvector technique for multivariate direct gradient analysis.Ecology 67, 1167–1179.
Wainwright P.C., 1991, Ecomorphology. Experimental functionalanatomy for ecological problems. Am. Zool. 31, 680–693.
Watson D.J., Balon E.K., 1984, Ecomorphological analysis of fishtaxocenes in rainforest streams of northern Borneo. J. Fish Biol.25, 371–385.
Wiegert R.G., Owen D.F., 1971, Trophic structure, available re-sources and populations density in terrestrial vs. aquatic ecosys-tems. J. Theor. Biol. 30, 69–81.
Wikramanayake E.D., 1990, Ecomorphology and biogeography of atropical stream assemblage: evolution of assemblage structure.Ecology 71, 1756–1764.
Winemiller K.O., 1989, Ontogenic diet shifts and resource partition-ing among piscivorous fishes in the Venezuelan llanos. Environ.Biol. Fishes 26, 177–199.
Winemiller K.O., 1990, Spatial and temporal variation in tropical fishtrophic networks. Ecol. Monogr. 60, 331–367.
Winemiller K.O., 1991, Ecomorphological diversification in low-land freshwater fish assemblages from five biotic regions. Ecol.Monogr. 61, 343–365.
Winemiller, K.O., Kelso-Winemiller L.C., Brenkert A.L., 1995,Ecomorphological diversification and convergence in fluvial ci-chlid fishes. Environ. Biol. Fishes 44, 235–261.
Wood B.M., Bain M.B., 1995, Morphology and microhabitat use instream fish. Can. J. Fish. Aquat. Sci. 52, 1487–1498.
Wootton J.T., Oemke M.P., 1992, Latitudinal differences in fish com-munity trophic structure, and the role of fish herbivory in a CostaRican stream. Environ. Biol. Fishes 35, 311–319.
B.de
Mérona
etal.:Aquat.L
ivingR
esour.21,171–184(2008)
181
Appendix: Mean values of morphological parameters for 42 species of the Comté River. SL: standard length (in mm), BH/SL: Body height on standard length, BW/SL: body width onstandard length, BW/BH: body width on body height, CP/SL: caudal peduncule length on standard length, CA/BA: caudal fin area, HLSL: head length on standard length, HH/HL: headheight on head length, ED/HHE: eye diameter on head height, EP: eye position, MA: mouth area, MP: mouth position, GR: number of gill rakers, GR/HL: length of gill rakers on headlength, IL/SL: intestine length on standard length, TE: teeth number, TE/SIZE teeth size.
Order Code SL BH/SL BW/SL BW/BH CP/SL CA/BA HLSL HH/HL ED/HHE EP MA MP GR GR/HL IL/SL TE TE/SIZEFamily
Species
CharaciformeAcestrorhynchidae
Acestrorhynchus falcatus AFAL 202.8 0.23 0.13 0.56 0.10 0.31 0.29 0.66 0.42 0.73 0.52 79.50 2.28 0.02 0.79 80 1(Bloch, 1794)Acestrorhynchus guianensis AGUI 183.2 0.20 0.11 0.57 0.10 0.16 0.28 0.58 0.50 0.78 0.55 51.00 0.43 0.01 0.86 80 4Menezes, 1969
AnostomidaeAnostomus brevior ABRE 90.5 0.25 0.13 0.51 0.11 0.18 0.23 0.65 0.49 0.65 0.12 143.00 0.38 0.03 1.52 10 3Géry, 1960Leporinus fasciatus LFAS 207.5 0.26 0.14 0.53 0.09 0.19 0.22 0.96 0.40 0.64 0.17 50.00 0.75 0.05 0.55 10 3(Bloch, 1794)Leporinus friderici LFRI 215 0.31 0.18 0.59 0.11 0.15 0.25 0.93 0.45 0.55 0.24 73.00 0.75 0.04 1.55 10 3(Bloch, 1794)Leporinus granti LGRA 156.9 0.34 0.19 0.56 0.12 0.11 0.22 1.17 0.35 0.50 0.18 71.00 0.92 0.06 1.57 10 3Eigenmann, 1912
CharacidaeCharax pauciradiatus CPAU 110.8 0.42 0.13 0.31 0.09 0.16 0.26 1.26 0.42 0.62 0.69 121.75 0.55 0.19 0.63 80 3Günther, 1864Piabucus dentatus PDEN 139.8 0.21 0.10 0.50 0.09 0.10 0.17 0.93 0.51 0.47 0.13 86.00 1.67 0.02 1.00 10 2(Koelreuter, 1761)Astyanax bimaculatus ABIM 109.8 0.38 0.16 0.45 0.12 0.14 0.20 1.47 0.38 0.57 0.13 115.00 1.50 0.09 0.66 10 3(Linnaeus, 1758)Bryconops affinis BAFF 99 0.26 0.15 0.57 0.11 0.16 0.22 0.99 0.60 0.52 0.31 92.00 1.52 0.07 0.70 40 3(Günther, 1864)Bryconops caudomaculatus BCAU 98.8 0.27 0.14 0.53 0.12 0.13 0.22 0.93 0.60 0.68 0.27 101.20 1.03 0.07 0.81 40 3(Günther, 1869)
182B
.deM
éronaetal.:A
quat.Living
Resour.21,171–184
(2008)
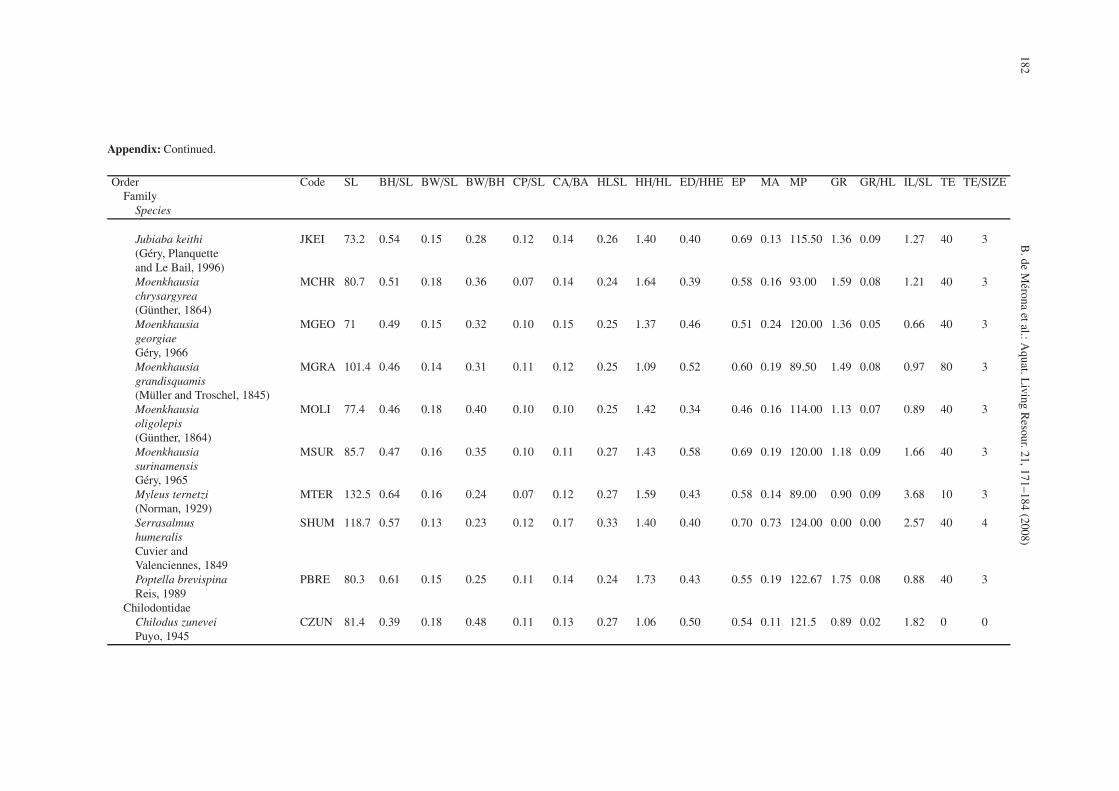
Appendix: Continued.
Order Code SL BH/SL BW/SL BW/BH CP/SL CA/BA HLSL HH/HL ED/HHE EP MA MP GR GR/HL IL/SL TE TE/SIZEFamily
Species
Jubiaba keithi JKEI 73.2 0.54 0.15 0.28 0.12 0.14 0.26 1.40 0.40 0.69 0.13 115.50 1.36 0.09 1.27 40 3(Géry, Planquetteand Le Bail, 1996)Moenkhausia MCHR 80.7 0.51 0.18 0.36 0.07 0.14 0.24 1.64 0.39 0.58 0.16 93.00 1.59 0.08 1.21 40 3chrysargyrea(Günther, 1864)Moenkhausia MGEO 71 0.49 0.15 0.32 0.10 0.15 0.25 1.37 0.46 0.51 0.24 120.00 1.36 0.05 0.66 40 3georgiaeGéry, 1966Moenkhausia MGRA 101.4 0.46 0.14 0.31 0.11 0.12 0.25 1.09 0.52 0.60 0.19 89.50 1.49 0.08 0.97 80 3grandisquamis(Müller and Troschel, 1845)Moenkhausia MOLI 77.4 0.46 0.18 0.40 0.10 0.10 0.25 1.42 0.34 0.46 0.16 114.00 1.13 0.07 0.89 40 3oligolepis(Günther, 1864)Moenkhausia MSUR 85.7 0.47 0.16 0.35 0.10 0.11 0.27 1.43 0.58 0.69 0.19 120.00 1.18 0.09 1.66 40 3surinamensisGéry, 1965Myleus ternetzi MTER 132.5 0.64 0.16 0.24 0.07 0.12 0.27 1.59 0.43 0.58 0.14 89.00 0.90 0.09 3.68 10 3(Norman, 1929)Serrasalmus SHUM 118.7 0.57 0.13 0.23 0.12 0.17 0.33 1.40 0.40 0.70 0.73 124.00 0.00 0.00 2.57 40 4humeralisCuvier andValenciennes, 1849Poptella brevispina PBRE 80.3 0.61 0.15 0.25 0.11 0.14 0.24 1.73 0.43 0.55 0.19 122.67 1.75 0.08 0.88 40 3Reis, 1989
ChilodontidaeChilodus zunevei CZUN 81.4 0.39 0.18 0.48 0.11 0.13 0.27 1.06 0.50 0.54 0.11 121.5 0.89 0.02 1.82 0 0Puyo, 1945
B.de
Mérona
etal.:Aquat.L
ivingR
esour.21,171–184(2008)
183
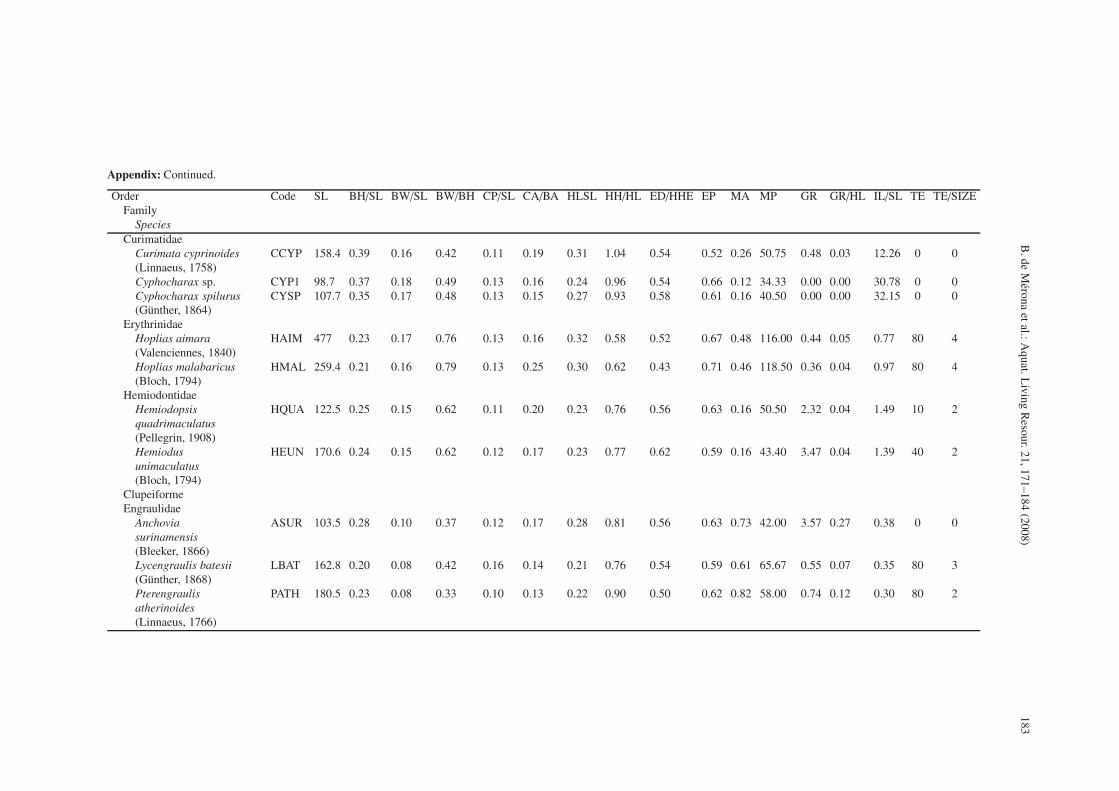
Appendix: Continued.
Order Code SL BH/SL BW/SL BW/BH CP/SL CA/BA HLSL HH/HL ED/HHE EP MA MP GR GR/HL IL/SL TE TE/SIZEFamily
SpeciesCurimatidae
Curimata cyprinoides CCYP 158.4 0.39 0.16 0.42 0.11 0.19 0.31 1.04 0.54 0.52 0.26 50.75 0.48 0.03 12.26 0 0(Linnaeus, 1758)Cyphocharax sp. CYP1 98.7 0.37 0.18 0.49 0.13 0.16 0.24 0.96 0.54 0.66 0.12 34.33 0.00 0.00 30.78 0 0Cyphocharax spilurus CYSP 107.7 0.35 0.17 0.48 0.13 0.15 0.27 0.93 0.58 0.61 0.16 40.50 0.00 0.00 32.15 0 0(Günther, 1864)
ErythrinidaeHoplias aimara HAIM 477 0.23 0.17 0.76 0.13 0.16 0.32 0.58 0.52 0.67 0.48 116.00 0.44 0.05 0.77 80 4(Valenciennes, 1840)Hoplias malabaricus HMAL 259.4 0.21 0.16 0.79 0.13 0.25 0.30 0.62 0.43 0.71 0.46 118.50 0.36 0.04 0.97 80 4(Bloch, 1794)
HemiodontidaeHemiodopsis HQUA 122.5 0.25 0.15 0.62 0.11 0.20 0.23 0.76 0.56 0.63 0.16 50.50 2.32 0.04 1.49 10 2quadrimaculatus(Pellegrin, 1908)Hemiodus HEUN 170.6 0.24 0.15 0.62 0.12 0.17 0.23 0.77 0.62 0.59 0.16 43.40 3.47 0.04 1.39 40 2unimaculatus(Bloch, 1794)
ClupeiformeEngraulidae
Anchovia ASUR 103.5 0.28 0.10 0.37 0.12 0.17 0.28 0.81 0.56 0.63 0.73 42.00 3.57 0.27 0.38 0 0surinamensis(Bleeker, 1866)Lycengraulis batesii LBAT 162.8 0.20 0.08 0.42 0.16 0.14 0.21 0.76 0.54 0.59 0.61 65.67 0.55 0.07 0.35 80 3(Günther, 1868)Pterengraulis PATH 180.5 0.23 0.08 0.33 0.10 0.13 0.22 0.90 0.50 0.62 0.82 58.00 0.74 0.12 0.30 80 2atherinoides(Linnaeus, 1766)
184B
.deM
éronaetal.:A
quat.Living
Resour.21,171–184
(2008)
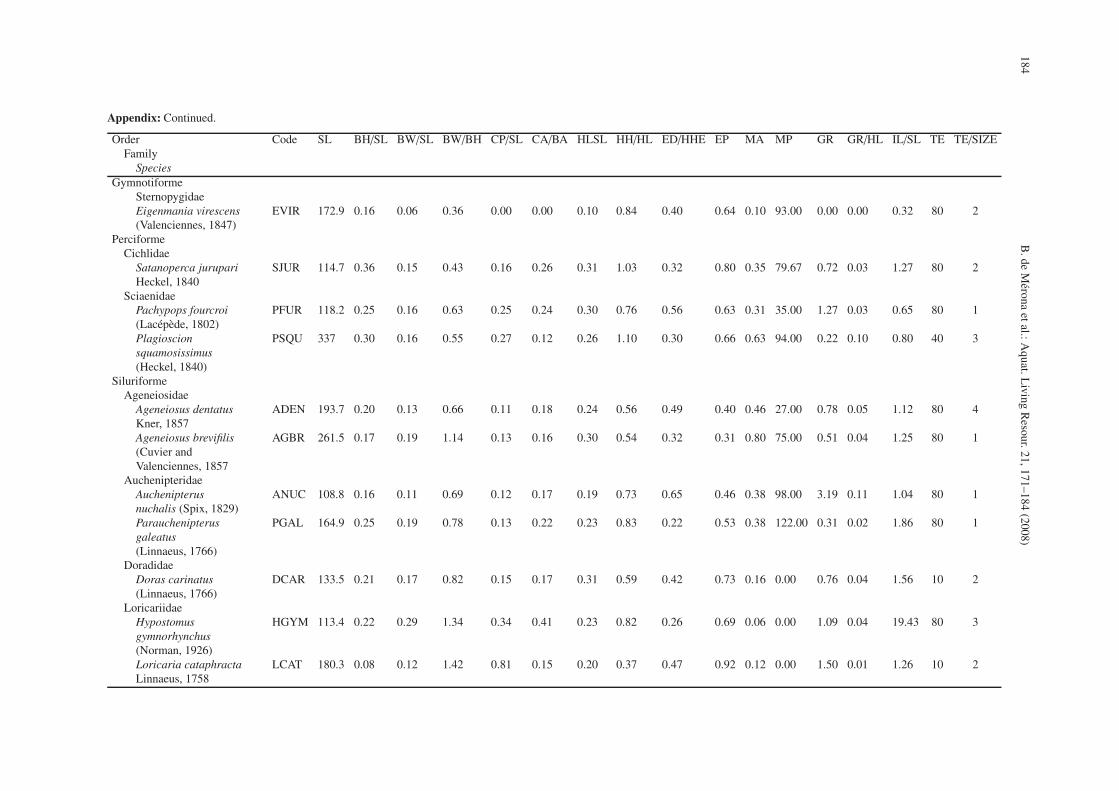
Appendix: Continued.
Order Code SL BH/SL BW/SL BW/BH CP/SL CA/BA HLSL HH/HL ED/HHE EP MA MP GR GR/HL IL/SL TE TE/SIZEFamily
SpeciesGymnotiforme
SternopygidaeEigenmania virescens EVIR 172.9 0.16 0.06 0.36 0.00 0.00 0.10 0.84 0.40 0.64 0.10 93.00 0.00 0.00 0.32 80 2(Valenciennes, 1847)
PerciformeCichlidae
Satanoperca jurupari SJUR 114.7 0.36 0.15 0.43 0.16 0.26 0.31 1.03 0.32 0.80 0.35 79.67 0.72 0.03 1.27 80 2Heckel, 1840
SciaenidaePachypops fourcroi PFUR 118.2 0.25 0.16 0.63 0.25 0.24 0.30 0.76 0.56 0.63 0.31 35.00 1.27 0.03 0.65 80 1(Lacépède, 1802)Plagioscion PSQU 337 0.30 0.16 0.55 0.27 0.12 0.26 1.10 0.30 0.66 0.63 94.00 0.22 0.10 0.80 40 3squamosissimus(Heckel, 1840)
SiluriformeAgeneiosidae
Ageneiosus dentatus ADEN 193.7 0.20 0.13 0.66 0.11 0.18 0.24 0.56 0.49 0.40 0.46 27.00 0.78 0.05 1.12 80 4Kner, 1857Ageneiosus brevifilis AGBR 261.5 0.17 0.19 1.14 0.13 0.16 0.30 0.54 0.32 0.31 0.80 75.00 0.51 0.04 1.25 80 1(Cuvier andValenciennes, 1857
AuchenipteridaeAuchenipterus ANUC 108.8 0.16 0.11 0.69 0.12 0.17 0.19 0.73 0.65 0.46 0.38 98.00 3.19 0.11 1.04 80 1nuchalis (Spix, 1829)Parauchenipterus PGAL 164.9 0.25 0.19 0.78 0.13 0.22 0.23 0.83 0.22 0.53 0.38 122.00 0.31 0.02 1.86 80 1galeatus(Linnaeus, 1766)
DoradidaeDoras carinatus DCAR 133.5 0.21 0.17 0.82 0.15 0.17 0.31 0.59 0.42 0.73 0.16 0.00 0.76 0.04 1.56 10 2(Linnaeus, 1766)
LoricariidaeHypostomus HGYM 113.4 0.22 0.29 1.34 0.34 0.41 0.23 0.82 0.26 0.69 0.06 0.00 1.09 0.04 19.43 80 3gymnorhynchus(Norman, 1926)Loricaria cataphracta LCAT 180.3 0.08 0.12 1.42 0.81 0.15 0.20 0.37 0.47 0.92 0.12 0.00 1.50 0.01 1.26 10 2Linnaeus, 1758