Embed Size (px)
Citation preview
Earth and Planetary Science Letters 270 (2008) 63–72
Contents lists available at ScienceDirect
Earth and Planetary Science Letters
j ourna l homepage: www.e lsev ie r.com/ locate /eps l
Different isotope and chemical patterns of pyrite oxidation related to lag andexponential growth phases of Acidithiobacillus ferrooxidans reveal a microbialgrowth strategy
Benjamin Brunner a,⁎, Jae-Young Yu a,b, Randall E. Mielke a, John A. MacAskill c, Stojan Madzunkov c,Terry J. McGenity d, Max Coleman a
a Planetary Science and Life Detection Section, Jet Propulsion Laboratory, California Institute of Technology, 4800 Oak Grove Drive, Pasadena, CA 91109, USAb Department of Geology, Kangwon National University, Chuncheon, Kangwon-Do 200-701, Republic of Koreac Astrophysics and Space Sciences Section, Jet Propulsion Laboratory/Caltech, 4800 Oak Grove Drive, Pasadena, CA 91109, USAd Department of Biological Sciences, University of Essex, Wivenhoe Park, Colchester, Essex, CO4 3SQ, UK
⁎ Corresponding author. Currently at Max-Planck-InstCelsiusstrasse 1, Bremen 28359, Germany.
E-mail address: [email protected] (B. Brunn
0012-821X/$ – see front matter © 2008 Elsevier B.V. Aldoi:10.1016/j.epsl.2008.03.019
A B S T R A C T
A R T I C L E I N F OArticle history:
The solution chemistry dur Received 6 July 2007Received in revised form 20 February 2008Accepted 4 March 2008Available online 18 March 2008Editor: G.D. Price
Keywords:Acidithiobacillus ferrooxidanspyrite oxidationgrowth phasesoxygen and sulfur isotopecomposition of sulfatedegassing of sulfur dioxide from acidsolutionssulfite
ing the initial (slow increase of dissolved iron and sulfate) and main stage (rapidincrease of dissolved iron and sulfate) of pyrite leaching by Acidithiobacillus ferrooxidans (Af) at a starting pHof 2.05 shows significant differences. During the initial stage, ferrous iron (Fe2+) is the dominant iron speciesin solution and the molar ratio of produced sulfate (SO4
2−) and total iron (Fetot) is 1.1, thus does not reflect thestoichiometry of pyrite (FeS2). During the main stage, ferric iron (Fe3+) is the dominant iron species insolution and the SO4
2−:Fetot ratio is with 1.9, close to the stoichiometry of FeS2. Another difference betweeninitial and main stage is an initial trend to slightly higher pH values followed by a drop during the main stageto pH 1.84. These observations raise the question if there are different modes of bioleaching of pyrite, and ifthere are, what those modes imply in terms of leaching mechanisms.Different oxygen and sulfur isotope trends of sulfate during the initial and main stages of pyrite oxidationconfirm that there are two pyrite bioleaching modes. The biochemical reactions during initial stage are bestexplained by the net reaction FeS2+3O2⇒Fe2++SO4
2−+SO2(g). The degassing of sulfur dioxide (SO2) acts assink for sulfur depleted in 34S compared to pyrite, and is the cause of the SO4
2−:Fetot ratio of 1.1 and the nearconstant pH. During the exponential phase, pyrite sulfur is almost quantitatively converted to sulfate,according to the net reaction FeS2+15/4O2+1/2H2O⇒Fe3++2SO4
2−+H+. We hypothesize that the transitionbetween the modes of bioleaching of pyrite is due to the impact of the accumulation of ferrous iron, whichinduces changes in the metabolic activity of Af and may act as an inhibitor for the oxidation of sulfur species.This transition defines a fundamental change in the growth strategy of Af. A mode, where bacteria gainenergy by oxidation of elemental sulfur to sulfite but show little growth is switched into a mode, wherebacteria gain a smaller amount of energy by the oxidation of ferrous iron, but induce much faster pyriteleaching rates due to the production of ferric iron.
© 2008 Elsevier B.V. All rights reserved.
1. Introduction
Bacteria are important mediators of geochemical reactions. Due toits contribution to acid mine drainage problems, the bacterial oxida-tion of pyrite by Acidithiobacillus ferrooxidans (Af) is one of the best-studied examples of such a process. Pyrite oxidation rates aredramatically increased by the role of Af in the oxidation of ferrous toferric iron. While bacterial oxidation of ferrous iron has been studiedintensely and is well understood, the initiation of pyrite leaching by Afhas only been investigated in a few studies (e.g. Mustin et al.; 1992; Yu
itute for Marine Microbiology,
er).
l rights reserved.
et al.; 2001; Mielke et al.; 2003) and characterization of the chemicalreactions resulting in sulfur and oxygen isotope fractionations islacking so far. A deeper understanding of the bacterial mechanisms inthe initial stage of pyrite leaching is essential in terms of ecology andevolution of Af (survival strategies) and for the evaluation of isotopepatterns related to oxidation of pyrite that could indicate presence orabsence of life (biomarkers).
During the initial stage of pyrite oxidation in the presence of Af,iron is mostly accumulated in its ferrous form, Fe2+, and the accu-mulation rates of iron and sulfate do not correspond to the 2:1 stoi-chiometry for sulfur and iron in pyrite (e.g. Mustin et al.; 1992; Yuet al.; 2001). In the main stage of pyrite leaching by Af, the leachingproducts are sulfate and ferric iron (Fe3+), and their ratio is close to the2:1 sulfur–iron stoichiometry of pyrite (FeS2) (Yu et al.; 2001). The
64 B. Brunner et al. / Earth and Planetary Science Letters 270 (2008) 63–72
curious discrepancy in the solution chemistry between differentstages of pyrite leaching by Af leads to the hypothesis that the pyriteoxidation mechanism in the presence of Af in the initial stage of pyriteoxidation is different from the one in the main stage.
1.1. The Yu et al. (2001) experiments
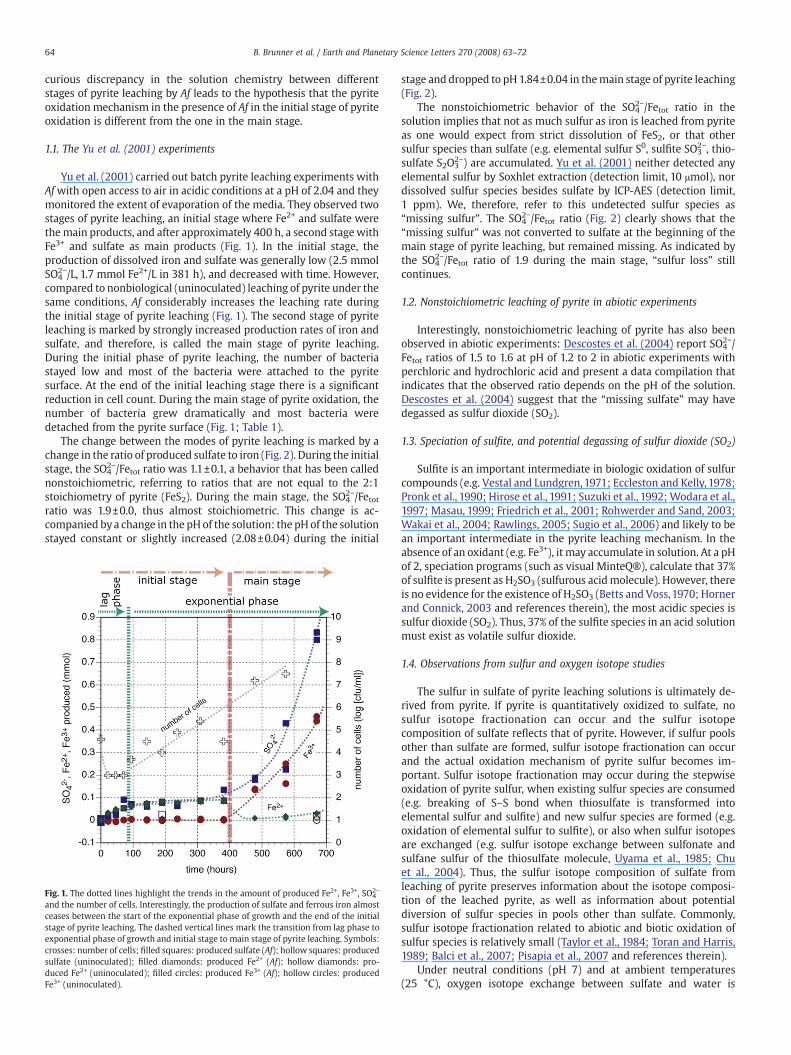
Yu et al. (2001) carried out batch pyrite leaching experiments withAfwith open access to air in acidic conditions at a pH of 2.04 and theymonitored the extent of evaporation of the media. They observed twostages of pyrite leaching, an initial stage where Fe2+ and sulfate werethemain products, and after approximately 400 h, a second stagewithFe3+ and sulfate as main products (Fig. 1). In the initial stage, theproduction of dissolved iron and sulfate was generally low (2.5 mmolSO4
2−/L, 1.7 mmol Fe2+/L in 381 h), and decreased with time. However,compared to nonbiological (uninoculated) leaching of pyrite under thesame conditions, Af considerably increases the leaching rate duringthe initial stage of pyrite leaching (Fig. 1). The second stage of pyriteleaching is marked by strongly increased production rates of iron andsulfate, and therefore, is called the main stage of pyrite leaching.During the initial phase of pyrite leaching, the number of bacteriastayed low and most of the bacteria were attached to the pyritesurface. At the end of the initial leaching stage there is a significantreduction in cell count. During the main stage of pyrite oxidation, thenumber of bacteria grew dramatically and most bacteria weredetached from the pyrite surface (Fig. 1; Table 1).
The change between the modes of pyrite leaching is marked by achange in the ratio of produced sulfate to iron (Fig. 2). During the initialstage, the SO4
2−/Fetot ratio was 1.1±0.1, a behavior that has been callednonstoichiometric, referring to ratios that are not equal to the 2:1stoichiometry of pyrite (FeS2). During the main stage, the SO4
2−/Fetotratio was 1.9±0.0, thus almost stoichiometric. This change is ac-companied bya change in the pH of the solution: the pH of the solutionstayed constant or slightly increased (2.08±0.04) during the initial
Fig. 1. The dotted lines highlight the trends in the amount of produced Fe2+, Fe3+, SO42−
and the number of cells. Interestingly, the production of sulfate and ferrous iron almostceases between the start of the exponential phase of growth and the end of the initialstage of pyrite leaching. The dashed vertical lines mark the transition from lag phase toexponential phase of growth and initial stage to main stage of pyrite leaching. Symbols:crosses: number of cells; filled squares: produced sulfate (Af); hollow squares: producedsulfate (uninoculated); filled diamonds: produced Fe2+ (Af); hollow diamonds: pro-duced Fe2+ (uninoculated); filled circles: produced Fe3+ (Af); hollow circles: producedFe3+ (uninoculated).
stage and dropped to pH 1.84±0.04 in themain stage of pyrite leaching(Fig. 2).
The nonstoichiometric behavior of the SO42−/Fetot ratio in the
solution implies that not as much sulfur as iron is leached from pyriteas one would expect from strict dissolution of FeS2, or that othersulfur species than sulfate (e.g. elemental sulfur S0, sulfite SO3
2−, thio-sulfate S2O3
2−) are accumulated. Yu et al. (2001) neither detected anyelemental sulfur by Soxhlet extraction (detection limit, 10 μmol), nordissolved sulfur species besides sulfate by ICP-AES (detection limit,1 ppm). We, therefore, refer to this undetected sulfur species as“missing sulfur”. The SO4
2−/Fetot ratio (Fig. 2) clearly shows that the“missing sulfur” was not converted to sulfate at the beginning of themain stage of pyrite leaching, but remained missing. As indicated bythe SO4
2−/Fetot ratio of 1.9 during the main stage, “sulfur loss” stillcontinues.
1.2. Nonstoichiometric leaching of pyrite in abiotic experiments
Interestingly, nonstoichiometric leaching of pyrite has also beenobserved in abiotic experiments: Descostes et al. (2004) report SO4
2−/Fetot ratios of 1.5 to 1.6 at pH of 1.2 to 2 in abiotic experiments withperchloric and hydrochloric acid and present a data compilation thatindicates that the observed ratio depends on the pH of the solution.Descostes et al. (2004) suggest that the “missing sulfate” may havedegassed as sulfur dioxide (SO2).
1.3. Speciation of sulfite, and potential degassing of sulfur dioxide (SO2)
Sulfite is an important intermediate in biologic oxidation of sulfurcompounds (e.g. Vestal and Lundgren,1971; Eccleston and Kelly, 1978;Pronk et al., 1990; Hirose et al., 1991; Suzuki et al., 1992; Wodara et al.,1997; Masau, 1999; Friedrich et al., 2001; Rohwerder and Sand, 2003;Wakai et al., 2004; Rawlings, 2005; Sugio et al., 2006) and likely to bean important intermediate in the pyrite leaching mechanism. In theabsence of an oxidant (e.g. Fe3+), it may accumulate in solution. At a pHof 2, speciation programs (such as visual MinteQ®), calculate that 37%of sulfite is present as H2SO3 (sulfurous acidmolecule). However, thereis no evidence for the existence of H2SO3 (Betts and Voss,1970; Hornerand Connick, 2003 and references therein), the most acidic species issulfur dioxide (SO2). Thus, 37% of the sulfite species in an acid solutionmust exist as volatile sulfur dioxide.
1.4. Observations from sulfur and oxygen isotope studies
The sulfur in sulfate of pyrite leaching solutions is ultimately de-rived from pyrite. If pyrite is quantitatively oxidized to sulfate, nosulfur isotope fractionation can occur and the sulfur isotopecomposition of sulfate reflects that of pyrite. However, if sulfur poolsother than sulfate are formed, sulfur isotope fractionation can occurand the actual oxidation mechanism of pyrite sulfur becomes im-portant. Sulfur isotope fractionation may occur during the stepwiseoxidation of pyrite sulfur, when existing sulfur species are consumed(e.g. breaking of S–S bond when thiosulfate is transformed intoelemental sulfur and sulfite) and new sulfur species are formed (e.g.oxidation of elemental sulfur to sulfite), or also when sulfur isotopesare exchanged (e.g. sulfur isotope exchange between sulfonate andsulfane sulfur of the thiosulfate molecule, Uyama et al., 1985; Chuet al., 2004). Thus, the sulfur isotope composition of sulfate fromleaching of pyrite preserves information about the isotope composi-tion of the leached pyrite, as well as information about potentialdiversion of sulfur species in pools other than sulfate. Commonly,sulfur isotope fractionation related to abiotic and biotic oxidation ofsulfur species is relatively small (Taylor et al., 1984; Toran and Harris,1989; Balci et al., 2007; Pisapia et al., 2007 and references therein).
Under neutral conditions (pH 7) and at ambient temperatures(25 °C), oxygen isotope exchange between sulfate and water is
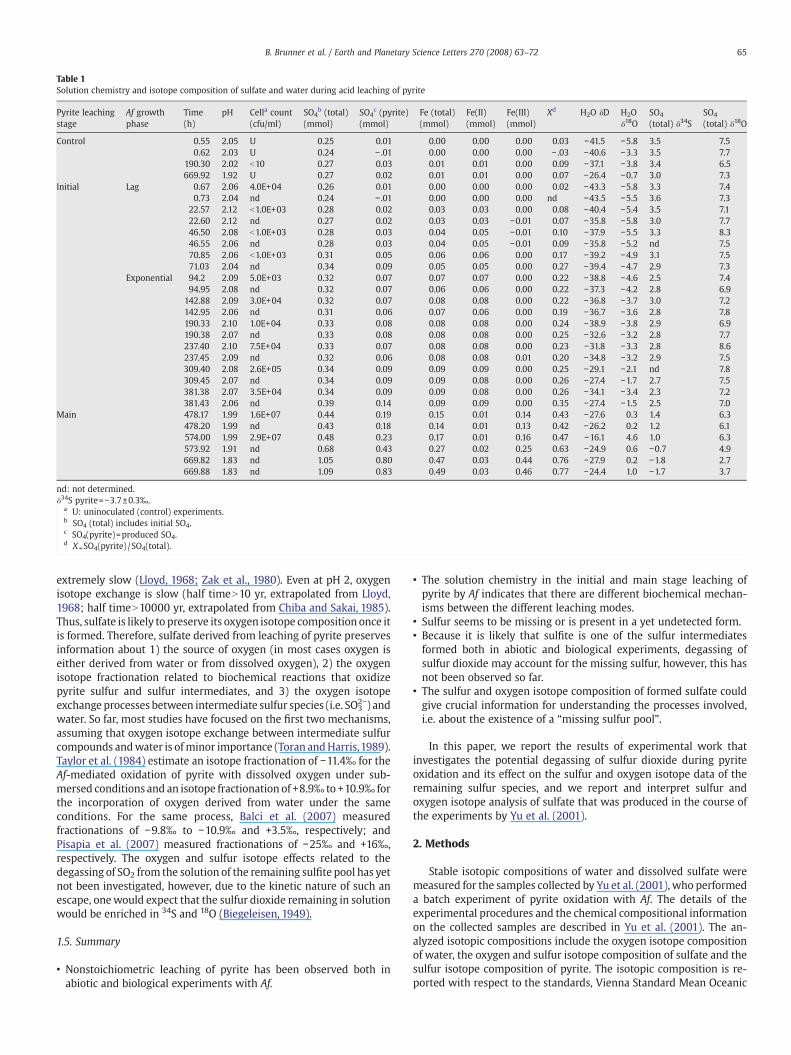
Table 1Solution chemistry and isotope composition of sulfate and water during acid leaching of pyrite
Pyrite leachingstage
Af growthphase
Time(h)
pH Cella count(cfu/ml)
SO4b (total)
(mmol)SO4
c (pyrite)(mmol)
Fe (total)(mmol)
Fe(II)(mmol)
Fe(III)(mmol)
Xd H2O δD H2Oδ18O
SO4
(total) δ34SSO4
(total) δ18O
Control 0.55 2.05 U 0.25 0.01 0.00 0.00 0.00 0.03 −41.5 −5.8 3.5 7.50.62 2.03 U 0.24 − .01 0.00 0.00 0.00 − .03 −40.6 −3.3 3.5 7.7
190.30 2.02 b10 0.27 0.03 0.01 0.01 0.00 0.09 −37.1 −3.8 3.4 6.5669.92 1.92 U 0.27 0.02 0.01 0.01 0.00 0.07 −26.4 −0.7 3.0 7.3
Initial Lag 0.67 2.06 4.0E+04 0.26 0.01 0.00 0.00 0.00 0.02 −43.3 −5.8 3.3 7.40.73 2.04 nd 0.24 − .01 0.00 0.00 0.00 nd −43.5 −5.5 3.6 7.3
22.57 2.12 b1.0E+03 0.28 0.02 0.03 0.03 0.00 0.08 −40.4 −5.4 3.5 7.122.60 2.12 nd 0.27 0.02 0.03 0.03 −0.01 0.07 −35.8 −5.8 3.0 7.746.50 2.08 b1.0E+03 0.28 0.03 0.04 0.05 −0.01 0.10 −37.9 −5.5 3.3 8.346.55 2.06 nd 0.28 0.03 0.04 0.05 −0.01 0.09 −35.8 −5.2 nd 7.570.85 2.06 b1.0E+03 0.31 0.05 0.06 0.06 0.00 0.17 −39.2 −4.9 3.1 7.571.03 2.04 nd 0.34 0.09 0.05 0.05 0.00 0.27 −39.4 −4.7 2.9 7.3
Exponential 94.2 2.09 5.0E+03 0.32 0.07 0.07 0.07 0.00 0.22 −38.8 −4.6 2.5 7.494.95 2.08 nd 0.32 0.07 0.06 0.06 0.00 0.22 −37.3 −4.2 2.8 6.9
142.88 2.09 3.0E+04 0.32 0.07 0.08 0.08 0.00 0.22 −36.8 −3.7 3.0 7.2142.95 2.06 nd 0.31 0.06 0.07 0.06 0.00 0.19 −36.7 −3.6 2.8 7.8190.33 2.10 1.0E+04 0.33 0.08 0.08 0.08 0.00 0.24 −38.9 −3.8 2.9 6.9190.38 2.07 nd 0.33 0.08 0.08 0.08 0.00 0.25 −32.6 −3.2 2.8 7.7237.40 2.10 7.5E+04 0.33 0.07 0.08 0.08 0.00 0.23 −31.8 −3.3 2.8 8.6237.45 2.09 nd 0.32 0.06 0.08 0.08 0.01 0.20 −34.8 −3.2 2.9 7.5309.40 2.08 2.6E+05 0.34 0.09 0.09 0.09 0.00 0.25 −29.1 −2.1 nd 7.8309.45 2.07 nd 0.34 0.09 0.09 0.08 0.00 0.26 −27.4 −1.7 2.7 7.5381.38 2.07 3.5E+04 0.34 0.09 0.09 0.08 0.00 0.26 −34.1 −3.4 2.3 7.2381.43 2.06 nd 0.39 0.14 0.09 0.09 0.00 0.35 −27.4 −1.5 2.5 7.0
Main 478.17 1.99 1.6E+07 0.44 0.19 0.15 0.01 0.14 0.43 −27.6 0.3 1.4 6.3478.20 1.99 nd 0.43 0.18 0.14 0.01 0.13 0.42 −26.2 0.2 1.2 6.1574.00 1.99 2.9E+07 0.48 0.23 0.17 0.01 0.16 0.47 −16.1 4.6 1.0 6.3573.92 1.91 nd 0.68 0.43 0.27 0.02 0.25 0.63 −24.9 0.6 −0.7 4.9669.82 1.83 nd 1.05 0.80 0.47 0.03 0.44 0.76 −27.9 0.2 −1.8 2.7669.88 1.83 nd 1.09 0.83 0.49 0.03 0.46 0.77 −24.4 1.0 −1.7 3.7
nd: not determined.δ34S pyrite=−3.7±0.3‰.
a U: uninoculated (control) experiments.b SO4 (total) includes initial SO4.c SO4(pyrite)=produced SO4.d X =SO4(pyrite) /SO4(total).
65B. Brunner et al. / Earth and Planetary Science Letters 270 (2008) 63–72
extremely slow (Lloyd, 1968; Zak et al., 1980). Even at pH 2, oxygenisotope exchange is slow (half timeN10 yr, extrapolated from Lloyd,1968; half timeN10000 yr, extrapolated from Chiba and Sakai, 1985).Thus, sulfate is likely to preserve its oxygen isotope composition once itis formed. Therefore, sulfate derived from leaching of pyrite preservesinformation about 1) the source of oxygen (in most cases oxygen iseither derived from water or from dissolved oxygen), 2) the oxygenisotope fractionation related to biochemical reactions that oxidizepyrite sulfur and sulfur intermediates, and 3) the oxygen isotopeexchange processes between intermediate sulfur species (i.e. SO3
2−) andwater. So far, most studies have focused on the first two mechanisms,assuming that oxygen isotope exchange between intermediate sulfurcompounds andwater is ofminor importance (Toran andHarris,1989).Taylor et al. (1984) estimate an isotope fractionation of −11.4‰ for theAf-mediated oxidation of pyrite with dissolved oxygen under sub-mersed conditions and an isotope fractionation of +8.9‰ to +10.9‰ forthe incorporation of oxygen derived from water under the sameconditions. For the same process, Balci et al. (2007) measuredfractionations of −9.8‰ to −10.9‰ and +3.5‰, respectively; andPisapia et al. (2007) measured fractionations of −25‰ and +16‰,respectively. The oxygen and sulfur isotope effects related to thedegassing of SO2 from the solution of the remaining sulfite pool has yetnot been investigated, however, due to the kinetic nature of such anescape, onewould expect that the sulfur dioxide remaining in solutionwould be enriched in 34S and 18O (Biegeleisen, 1949).
1.5. Summary
• Nonstoichiometric leaching of pyrite has been observed both inabiotic and biological experiments with Af.
• The solution chemistry in the initial and main stage leaching ofpyrite by Af indicates that there are different biochemical mechan-isms between the different leaching modes.
• Sulfur seems to be missing or is present in a yet undetected form.• Because it is likely that sulfite is one of the sulfur intermediatesformed both in abiotic and biological experiments, degassing ofsulfur dioxide may account for the missing sulfur, however, this hasnot been observed so far.
• The sulfur and oxygen isotope composition of formed sulfate couldgive crucial information for understanding the processes involved,i.e. about the existence of a “missing sulfur pool”.
In this paper, we report the results of experimental work thatinvestigates the potential degassing of sulfur dioxide during pyriteoxidation and its effect on the sulfur and oxygen isotope data of theremaining sulfur species, and we report and interpret sulfur andoxygen isotope analysis of sulfate that was produced in the course ofthe experiments by Yu et al. (2001).
2. Methods
Stable isotopic compositions of water and dissolved sulfate weremeasured for the samples collected by Yu et al. (2001), who performeda batch experiment of pyrite oxidation with Af. The details of theexperimental procedures and the chemical compositional informationon the collected samples are described in Yu et al. (2001). The an-alyzed isotopic compositions include the oxygen isotope compositionof water, the oxygen and sulfur isotope composition of sulfate and thesulfur isotope composition of pyrite. The isotopic composition is re-ported with respect to the standards, Vienna Standard Mean Oceanic
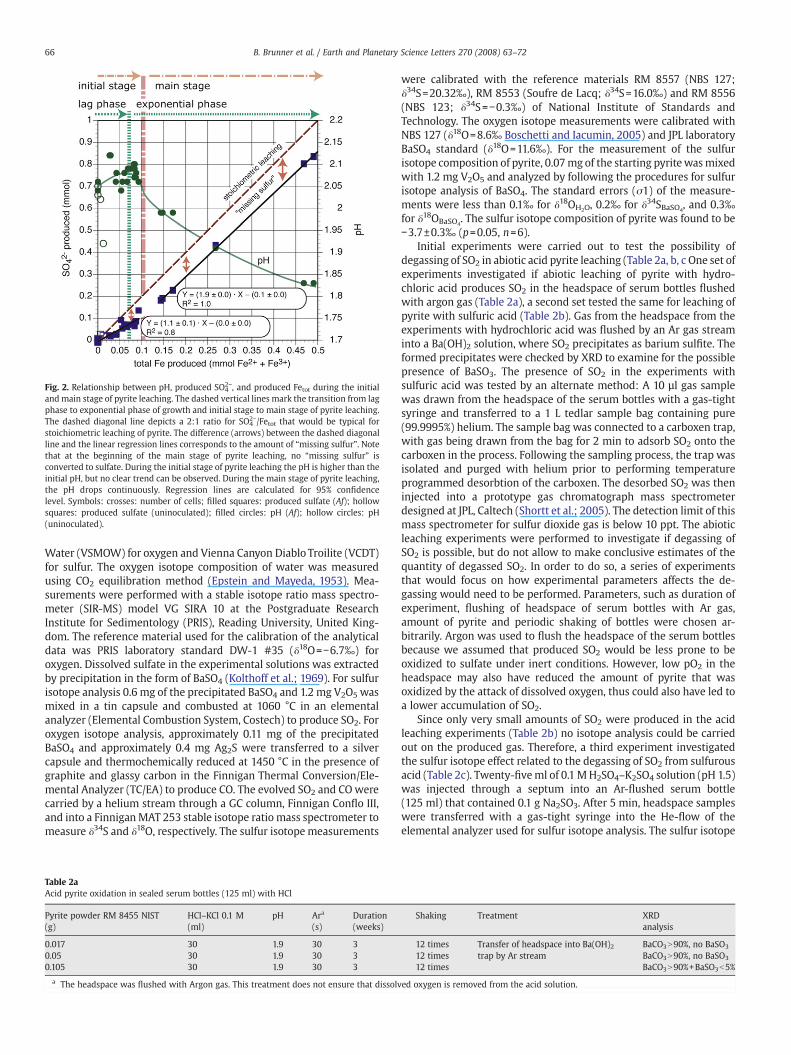
Fig. 2. Relationship between pH, produced SO42−, and produced Fetot during the initial
and main stage of pyrite leaching. The dashed vertical lines mark the transition from lagphase to exponential phase of growth and initial stage to main stage of pyrite leaching.The dashed diagonal line depicts a 2:1 ratio for SO4
2−/Fetot that would be typical forstoichiometric leaching of pyrite. The difference (arrows) between the dashed diagonalline and the linear regression lines corresponds to the amount of “missing sulfur”. Notethat at the beginning of the main stage of pyrite leaching, no “missing sulfur” isconverted to sulfate. During the initial stage of pyrite leaching the pH is higher than theinitial pH, but no clear trend can be observed. During the main stage of pyrite leaching,the pH drops continuously. Regression lines are calculated for 95% confidencelevel. Symbols: crosses: number of cells; filled squares: produced sulfate (Af); hollowsquares: produced sulfate (uninoculated); filled circles: pH (Af); hollow circles: pH(uninoculated).
66 B. Brunner et al. / Earth and Planetary Science Letters 270 (2008) 63–72
Water (VSMOW) for oxygen and Vienna Canyon Diablo Troilite (VCDT)for sulfur. The oxygen isotope composition of water was measuredusing CO2 equilibration method (Epstein and Mayeda, 1953). Mea-surements were performed with a stable isotope ratio mass spectro-meter (SIR-MS) model VG SIRA 10 at the Postgraduate ResearchInstitute for Sedimentology (PRIS), Reading University, United King-dom. The reference material used for the calibration of the analyticaldata was PRIS laboratory standard DW-1 #35 (δ18O=−6.7‰) foroxygen. Dissolved sulfate in the experimental solutions was extractedby precipitation in the form of BaSO4 (Kolthoff et al.; 1969). For sulfurisotope analysis 0.6 mg of the precipitated BaSO4 and 1.2 mg V2O5 wasmixed in a tin capsule and combusted at 1060 °C in an elementalanalyzer (Elemental Combustion System, Costech) to produce SO2. Foroxygen isotope analysis, approximately 0.11 mg of the precipitatedBaSO4 and approximately 0.4 mg Ag2S were transferred to a silvercapsule and thermochemically reduced at 1450 °C in the presence ofgraphite and glassy carbon in the Finnigan Thermal Conversion/Ele-mental Analyzer (TC/EA) to produce CO. The evolved SO2 and COwerecarried by a helium stream through a GC column, Finnigan Conflo III,and into a FinniganMAT 253 stable isotope ratio mass spectrometer tomeasure δ34S and δ18O, respectively. The sulfur isotopemeasurements
Table 2aAcid pyrite oxidation in sealed serum bottles (125 ml) with HCl
Pyrite powder RM 8455 NIST(g)
HCl–KCl 0.1 M(ml)
pH Ara
(s)Duration(weeks)
0.017 30 1.9 30 30.05 30 1.9 30 30.105 30 1.9 30 3
a The headspace was flushed with Argon gas. This treatment does not ensure that dissolv
were calibrated with the reference materials RM 8557 (NBS 127;δ34S=20.32‰), RM 8553 (Soufre de Lacq; δ34S=16.0‰) and RM 8556(NBS 123; δ34S=−0.3‰) of National Institute of Standards andTechnology. The oxygen isotope measurements were calibrated withNBS 127 (δ18O=8.6‰ Boschetti and Iacumin, 2005) and JPL laboratoryBaSO4 standard (δ18O=11.6‰). For the measurement of the sulfurisotope composition of pyrite, 0.07mg of the starting pyritewasmixedwith 1.2 mg V2O5 and analyzed by following the procedures for sulfurisotope analysis of BaSO4. The standard errors (σ1) of the measure-ments were less than 0.1‰ for δ18OH2O, 0.2‰ for δ34SBaSO4
, and 0.3‰for δ18OBaSO4
. The sulfur isotope composition of pyrite was found to be−3.7±0.3‰ (p=0.05, n=6).
Initial experiments were carried out to test the possibility ofdegassing of SO2 in abiotic acid pyrite leaching (Table 2a, b, c One set ofexperiments investigated if abiotic leaching of pyrite with hydro-chloric acid produces SO2 in the headspace of serum bottles flushedwith argon gas (Table 2a), a second set tested the same for leaching ofpyrite with sulfuric acid (Table 2b). Gas from the headspace from theexperiments with hydrochloric acid was flushed by an Ar gas streaminto a Ba(OH)2 solution, where SO2 precipitates as barium sulfite. Theformed precipitates were checked by XRD to examine for the possiblepresence of BaSO3. The presence of SO2 in the experiments withsulfuric acid was tested by an alternate method: A 10 µl gas samplewas drawn from the headspace of the serum bottles with a gas-tightsyringe and transferred to a 1 L tedlar sample bag containing pure(99.9995%) helium. The sample bag was connected to a carboxen trap,with gas being drawn from the bag for 2 min to adsorb SO2 onto thecarboxen in the process. Following the sampling process, the trap wasisolated and purged with helium prior to performing temperatureprogrammed desorbtion of the carboxen. The desorbed SO2 was theninjected into a prototype gas chromatograph mass spectrometerdesigned at JPL, Caltech (Shortt et al.; 2005). The detection limit of thismass spectrometer for sulfur dioxide gas is below 10 ppt. The abioticleaching experiments were performed to investigate if degassing ofSO2 is possible, but do not allow to make conclusive estimates of thequantity of degassed SO2. In order to do so, a series of experimentsthat would focus on how experimental parameters affects the de-gassing would need to be performed. Parameters, such as duration ofexperiment, flushing of headspace of serum bottles with Ar gas,amount of pyrite and periodic shaking of bottles were chosen ar-bitrarily. Argon was used to flush the headspace of the serum bottlesbecause we assumed that produced SO2 would be less prone to beoxidized to sulfate under inert conditions. However, low pO2 in theheadspace may also have reduced the amount of pyrite that wasoxidized by the attack of dissolved oxygen, thus could also have led toa lower accumulation of SO2.
Since only very small amounts of SO2 were produced in the acidleaching experiments (Table 2b) no isotope analysis could be carriedout on the produced gas. Therefore, a third experiment investigatedthe sulfur isotope effect related to the degassing of SO2 from sulfurousacid (Table 2c). Twenty-fiveml of 0.1 MH2SO4–K2SO4 solution (pH 1.5)was injected through a septum into an Ar-flushed serum bottle(125 ml) that contained 0.1 g Na2SO3. After 5 min, headspace sampleswere transferred with a gas-tight syringe into the He-flow of theelemental analyzer used for sulfur isotope analysis. The sulfur isotope
Shaking Treatment XRDanalysis
12 times Transfer of headspace into Ba(OH)2trap by Ar stream
BaCO3N90%, no BaSO3
12 times BaCO3N90%, no BaSO3
12 times BaCO3N90%+BaSO3b5%
ed oxygen is removed from the acid solution.
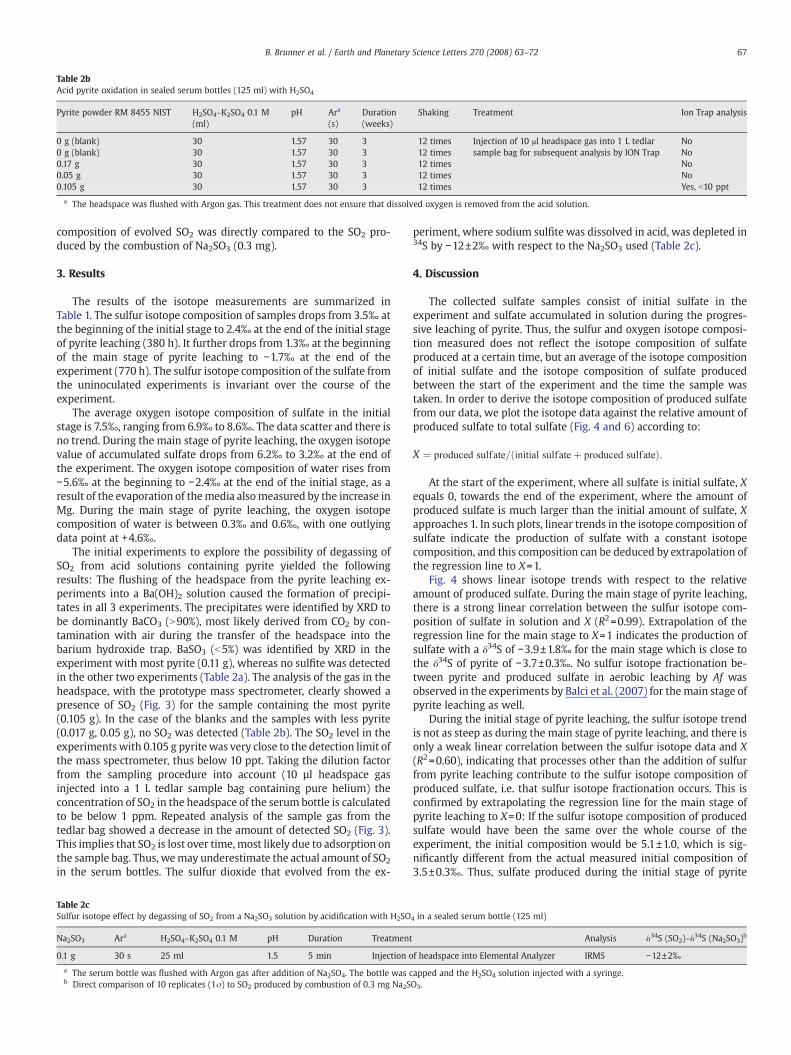
Table 2bAcid pyrite oxidation in sealed serum bottles (125 ml) with H2SO4
Pyrite powder RM 8455 NIST H2SO4–K2SO4 0.1 M(ml)
pH Ara
(s)Duration(weeks)
Shaking Treatment Ion Trap analysis
0 g (blank) 30 1.57 30 3 12 times Injection of 10 μl headspace gas into 1 L tedlarsample bag for subsequent analysis by ION Trap
No0 g (blank) 30 1.57 30 3 12 times No0.17 g 30 1.57 30 3 12 times No0.05 g 30 1.57 30 3 12 times No0.105 g 30 1.57 30 3 12 times Yes, b10 ppt
a The headspace was flushed with Argon gas. This treatment does not ensure that dissolved oxygen is removed from the acid solution.
67B. Brunner et al. / Earth and Planetary Science Letters 270 (2008) 63–72
composition of evolved SO2 was directly compared to the SO2 pro-duced by the combustion of Na2SO3 (0.3 mg).
3. Results
The results of the isotope measurements are summarized inTable 1. The sulfur isotope composition of samples drops from 3.5‰ atthe beginning of the initial stage to 2.4‰ at the end of the initial stageof pyrite leaching (380 h). It further drops from 1.3‰ at the beginningof the main stage of pyrite leaching to −1.7‰ at the end of theexperiment (770 h). The sulfur isotope composition of the sulfate fromthe uninoculated experiments is invariant over the course of theexperiment.
The average oxygen isotope composition of sulfate in the initialstage is 7.5‰, ranging from 6.9‰ to 8.6‰. The data scatter and there isno trend. During the main stage of pyrite leaching, the oxygen isotopevalue of accumulated sulfate drops from 6.2‰ to 3.2‰ at the end ofthe experiment. The oxygen isotope composition of water rises from−5.6‰ at the beginning to −2.4‰ at the end of the initial stage, as aresult of the evaporation of themedia alsomeasured by the increase inMg. During the main stage of pyrite leaching, the oxygen isotopecomposition of water is between 0.3‰ and 0.6‰, with one outlyingdata point at +4.6‰.
The initial experiments to explore the possibility of degassing ofSO2 from acid solutions containing pyrite yielded the followingresults: The flushing of the headspace from the pyrite leaching ex-periments into a Ba(OH)2 solution caused the formation of precipi-tates in all 3 experiments. The precipitates were identified by XRD tobe dominantly BaCO3 (N90%), most likely derived from CO2 by con-tamination with air during the transfer of the headspace into thebarium hydroxide trap. BaSO3 (b5%) was identified by XRD in theexperiment with most pyrite (0.11 g), whereas no sulfite was detectedin the other two experiments (Table 2a). The analysis of the gas in theheadspace, with the prototype mass spectrometer, clearly showed apresence of SO2 (Fig. 3) for the sample containing the most pyrite(0.105 g). In the case of the blanks and the samples with less pyrite(0.017 g, 0.05 g), no SO2 was detected (Table 2b). The SO2 level in theexperimentswith 0.105 g pyritewas very close to the detection limit ofthe mass spectrometer, thus below 10 ppt. Taking the dilution factorfrom the sampling procedure into account (10 µl headspace gasinjected into a 1 L tedlar sample bag containing pure helium) theconcentration of SO2 in the headspace of the serum bottle is calculatedto be below 1 ppm. Repeated analysis of the sample gas from thetedlar bag showed a decrease in the amount of detected SO2 (Fig. 3).This implies that SO2 is lost over time, most likely due to adsorption onthe sample bag. Thus, wemay underestimate the actual amount of SO2
in the serum bottles. The sulfur dioxide that evolved from the ex-
Table 2cSulfur isotope effect by degassing of SO2 from a Na2SO3 solution by acidification with H2SO
Na2SO3 Ara H2SO4–K2SO4 0.1 M pH Duration Treatment
0.1 g 30 s 25 ml 1.5 5 min Injection o
a The serum bottle was flushed with Argon gas after addition of Na2SO4. The bottle was cb Direct comparison of 10 replicates (1σ) to SO2 produced by combustion of 0.3 mg Na2S
periment, where sodium sulfite was dissolved in acid, was depleted in34S by −12±2‰ with respect to the Na2SO3 used (Table 2c).
4. Discussion
The collected sulfate samples consist of initial sulfate in theexperiment and sulfate accumulated in solution during the progres-sive leaching of pyrite. Thus, the sulfur and oxygen isotope composi-tion measured does not reflect the isotope composition of sulfateproduced at a certain time, but an average of the isotope compositionof initial sulfate and the isotope composition of sulfate producedbetween the start of the experiment and the time the sample wastaken. In order to derive the isotope composition of produced sulfatefrom our data, we plot the isotope data against the relative amount ofproduced sulfate to total sulfate (Fig. 4 and 6) according to:
X ¼ produced sulfate= initial sulfateþ produced sulfateð Þ:
At the start of the experiment, where all sulfate is initial sulfate, Xequals 0, towards the end of the experiment, where the amount ofproduced sulfate is much larger than the initial amount of sulfate, Xapproaches 1. In such plots, linear trends in the isotope composition ofsulfate indicate the production of sulfate with a constant isotopecomposition, and this composition can be deduced by extrapolation ofthe regression line to X=1.
Fig. 4 shows linear isotope trends with respect to the relativeamount of produced sulfate. During the main stage of pyrite leaching,there is a strong linear correlation between the sulfur isotope com-position of sulfate in solution and X (R2=0.99). Extrapolation of theregression line for the main stage to X=1 indicates the production ofsulfate with a δ34S of −3.9±1.8‰ for the main stage which is close tothe δ34S of pyrite of −3.7±0.3‰. No sulfur isotope fractionation be-tween pyrite and produced sulfate in aerobic leaching by Af wasobserved in the experiments by Balci et al. (2007) for themain stage ofpyrite leaching as well.
During the initial stage of pyrite leaching, the sulfur isotope trendis not as steep as during the main stage of pyrite leaching, and there isonly a weak linear correlation between the sulfur isotope data and X(R2=0.60), indicating that processes other than the addition of sulfurfrom pyrite leaching contribute to the sulfur isotope composition ofproduced sulfate, i.e. that sulfur isotope fractionation occurs. This isconfirmed by extrapolating the regression line for the main stage ofpyrite leaching to X=0: If the sulfur isotope composition of producedsulfate would have been the same over the whole course of theexperiment, the initial composition would be 5.1±1.0, which is sig-nificantly different from the actual measured initial composition of3.5±0.3‰. Thus, sulfate produced during the initial stage of pyrite
4 in a sealed serum bottle (125 ml)
Analysis δ34S (SO2)–δ34S (Na2SO3)b
f headspace into Elemental Analyzer IRMS −12±2‰
apped and the H2SO4 solution injected with a syringe.O3.
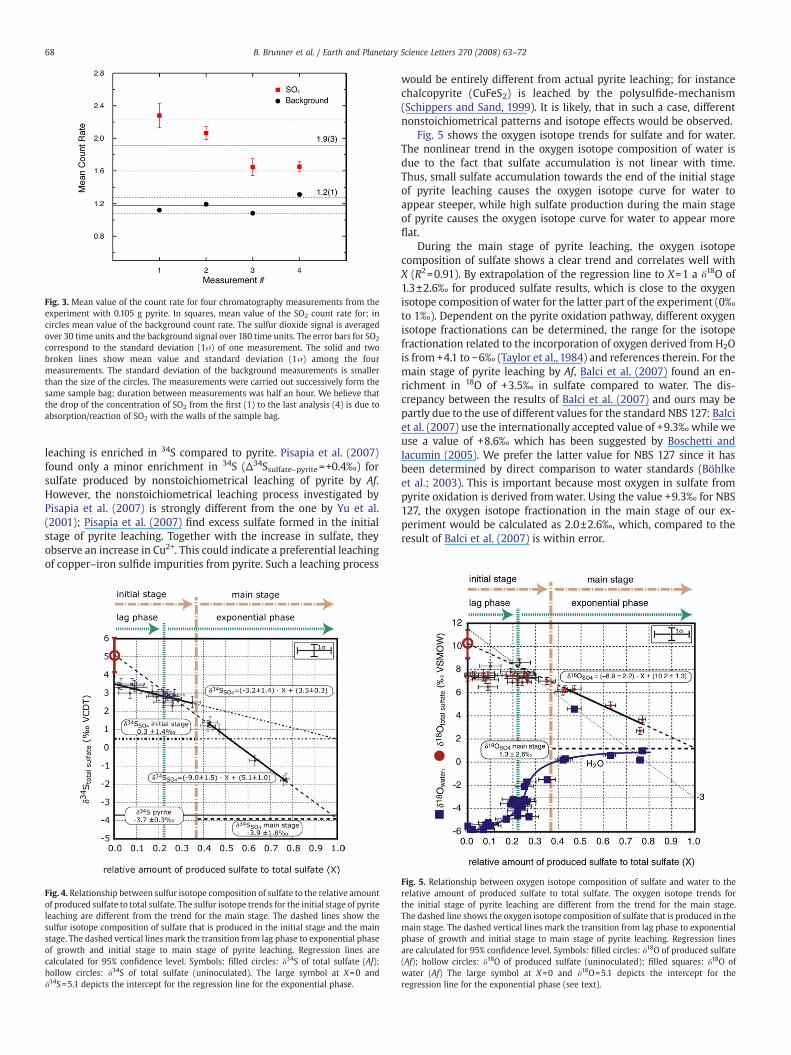
Fig. 3. Mean value of the count rate for four chromatography measurements from theexperiment with 0.105 g pyrite. In squares, mean value of the SO2 count rate for; incircles mean value of the background count rate. The sulfur dioxide signal is averagedover 30 time units and the background signal over 180 time units. The error bars for SO2
correspond to the standard deviation (1σ) of one measurement. The solid and twobroken lines show mean value and standard deviation (1σ) among the fourmeasurements. The standard deviation of the background measurements is smallerthan the size of the circles. The measurements were carried out successively form thesame sample bag; duration between measurements was half an hour. We believe thatthe drop of the concentration of SO2 from the first (1) to the last analysis (4) is due toabsorption/reaction of SO2 with the walls of the sample bag.
68 B. Brunner et al. / Earth and Planetary Science Letters 270 (2008) 63–72
leaching is enriched in 34S compared to pyrite. Pisapia et al. (2007)found only a minor enrichment in 34S (Δ34Ssulfate–pyrite=+0.4‰) forsulfate produced by nonstoichiometrical leaching of pyrite by Af.However, the nonstoichiometrical leaching process investigated byPisapia et al. (2007) is strongly different from the one by Yu et al.(2001); Pisapia et al. (2007) find excess sulfate formed in the initialstage of pyrite leaching. Together with the increase in sulfate, theyobserve an increase in Cu2+. This could indicate a preferential leachingof copper–iron sulfide impurities from pyrite. Such a leaching process
Fig. 4. Relationship between sulfur isotope composition of sulfate to the relative amountof produced sulfate to total sulfate. The sulfur isotope trends for the initial stage of pyriteleaching are different from the trend for the main stage. The dashed lines show thesulfur isotope composition of sulfate that is produced in the initial stage and the mainstage. The dashed vertical lines mark the transition from lag phase to exponential phaseof growth and initial stage to main stage of pyrite leaching. Regression lines arecalculated for 95% confidence level. Symbols: filled circles: δ34S of total sulfate (Af);hollow circles: δ34S of total sulfate (uninoculated). The large symbol at X=0 andδ34S=5.1 depicts the intercept for the regression line for the exponential phase.
would be entirely different from actual pyrite leaching; for instancechalcopyrite (CuFeS2) is leached by the polysulfide-mechanism(Schippers and Sand, 1999). It is likely, that in such a case, differentnonstoichiometrical patterns and isotope effects would be observed.
Fig. 5 shows the oxygen isotope trends for sulfate and for water.The nonlinear trend in the oxygen isotope composition of water isdue to the fact that sulfate accumulation is not linear with time.Thus, small sulfate accumulation towards the end of the initial stageof pyrite leaching causes the oxygen isotope curve for water toappear steeper, while high sulfate production during the main stageof pyrite causes the oxygen isotope curve for water to appear moreflat.
During the main stage of pyrite leaching, the oxygen isotopecomposition of sulfate shows a clear trend and correlates well withX (R2=0.91). By extrapolation of the regression line to X=1 a δ18O of1.3±2.6‰ for produced sulfate results, which is close to the oxygenisotope composition of water for the latter part of the experiment (0‰to 1‰). Dependent on the pyrite oxidation pathway, different oxygenisotope fractionations can be determined, the range for the isotopefractionation related to the incorporation of oxygen derived from H2Ois from +4.1 to −6‰ (Taylor et al., 1984) and references therein. For themain stage of pyrite leaching by Af, Balci et al. (2007) found an en-richment in 18O of +3.5‰ in sulfate compared to water. The dis-crepancy between the results of Balci et al. (2007) and ours may bepartly due to the use of different values for the standard NBS 127: Balciet al. (2007) use the internationally accepted value of +9.3‰while weuse a value of +8.6‰ which has been suggested by Boschetti andIacumin (2005). We prefer the latter value for NBS 127 since it hasbeen determined by direct comparison to water standards (Böhlkeet al.; 2003). This is important because most oxygen in sulfate frompyrite oxidation is derived fromwater. Using the value +9.3‰ for NBS127, the oxygen isotope fractionation in the main stage of our ex-periment would be calculated as 2.0±2.6‰, which, compared to theresult of Balci et al. (2007) is within error.
Fig. 5. Relationship between oxygen isotope composition of sulfate and water to therelative amount of produced sulfate to total sulfate. The oxygen isotope trends forthe initial stage of pyrite leaching are different from the trend for the main stage.The dashed line shows the oxygen isotope composition of sulfate that is produced in themain stage. The dashed vertical lines mark the transition from lag phase to exponentialphase of growth and initial stage to main stage of pyrite leaching. Regression linesare calculated for 95% confidence level. Symbols: filled circles: δ18O of produced sulfate(Af); hollow circles: δ18O of produced sulfate (uninoculated); filled squares: δ18O ofwater (Af) The large symbol at X=0 and δ18O=5.1 depicts the intercept for theregression line for the exponential phase (see text).
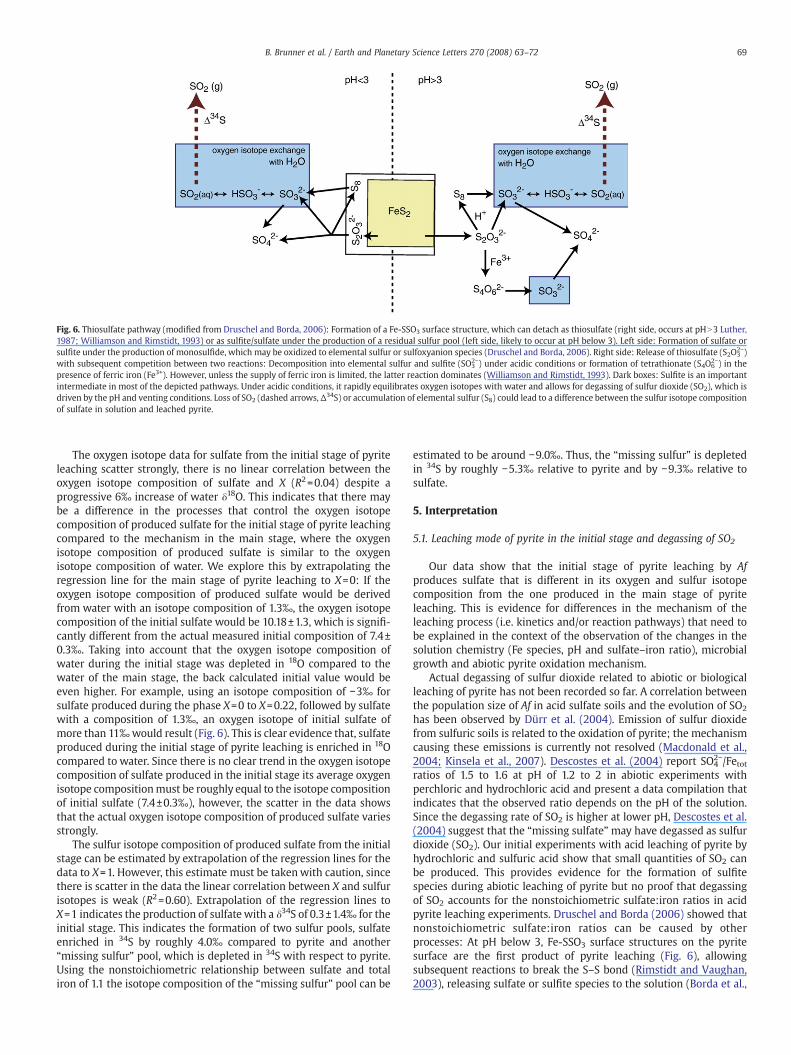
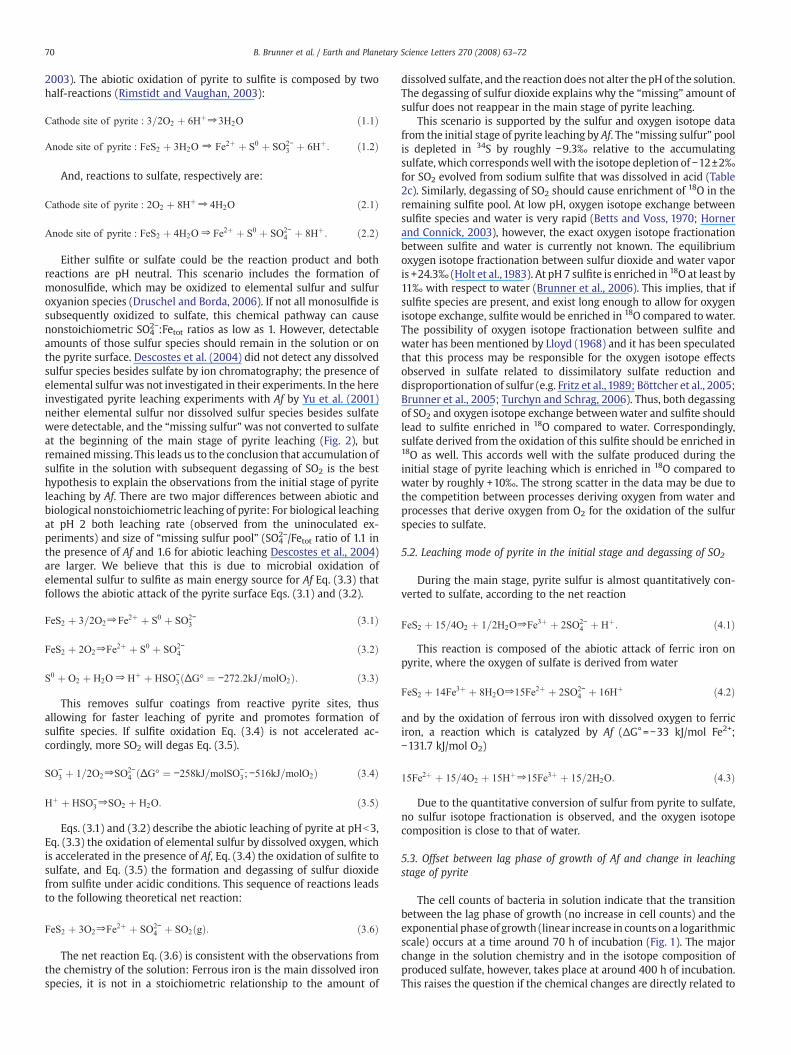
Fig. 6. Thiosulfate pathway (modified from Druschel and Borda, 2006): Formation of a Fe-SSO3 surface structure, which can detach as thiosulfate (right side, occurs at pHN3 Luther,1987; Williamson and Rimstidt, 1993) or as sulfite/sulfate under the production of a residual sulfur pool (left side, likely to occur at pH below 3). Left side: Formation of sulfate orsulfite under the production of monosulfide, which may be oxidized to elemental sulfur or sulfoxyanion species (Druschel and Borda, 2006). Right side: Release of thiosulfate (S2O3
2−)with subsequent competition between two reactions: Decomposition into elemental sulfur and sulfite (SO3
2−) under acidic conditions or formation of tetrathionate (S4O62−) in the
presence of ferric iron (Fe3+). However, unless the supply of ferric iron is limited, the latter reaction dominates (Williamson and Rimstidt, 1993). Dark boxes: Sulfite is an importantintermediate in most of the depicted pathways. Under acidic conditions, it rapidly equilibrates oxygen isotopes with water and allows for degassing of sulfur dioxide (SO2), which isdriven by the pH and venting conditions. Loss of SO2 (dashed arrows, Δ34S) or accumulation of elemental sulfur (S8) could lead to a difference between the sulfur isotope compositionof sulfate in solution and leached pyrite.
69B. Brunner et al. / Earth and Planetary Science Letters 270 (2008) 63–72
The oxygen isotope data for sulfate from the initial stage of pyriteleaching scatter strongly, there is no linear correlation between theoxygen isotope composition of sulfate and X (R2=0.04) despite aprogressive 6‰ increase of water δ18O. This indicates that there maybe a difference in the processes that control the oxygen isotopecomposition of produced sulfate for the initial stage of pyrite leachingcompared to the mechanism in the main stage, where the oxygenisotope composition of produced sulfate is similar to the oxygenisotope composition of water. We explore this by extrapolating theregression line for the main stage of pyrite leaching to X=0: If theoxygen isotope composition of produced sulfate would be derivedfrom water with an isotope composition of 1.3‰, the oxygen isotopecomposition of the initial sulfate would be 10.18±1.3, which is signifi-cantly different from the actual measured initial composition of 7.4±0.3‰. Taking into account that the oxygen isotope composition ofwater during the initial stage was depleted in 18O compared to thewater of the main stage, the back calculated initial value would beeven higher. For example, using an isotope composition of −3‰ forsulfate produced during the phase X=0 to X=0.22, followed by sulfatewith a composition of 1.3‰, an oxygen isotope of initial sulfate ofmore than 11‰would result (Fig. 6). This is clear evidence that, sulfateproduced during the initial stage of pyrite leaching is enriched in 18Ocompared to water. Since there is no clear trend in the oxygen isotopecomposition of sulfate produced in the initial stage its average oxygenisotope compositionmust be roughly equal to the isotope compositionof initial sulfate (7.4±0.3‰), however, the scatter in the data showsthat the actual oxygen isotope composition of produced sulfate variesstrongly.
The sulfur isotope composition of produced sulfate from the initialstage can be estimated by extrapolation of the regression lines for thedata to X=1. However, this estimate must be takenwith caution, sincethere is scatter in the data the linear correlation between X and sulfurisotopes is weak (R2=0.60). Extrapolation of the regression lines toX=1 indicates the production of sulfate with a δ34S of 0.3±1.4‰ for theinitial stage. This indicates the formation of two sulfur pools, sulfateenriched in 34S by roughly 4.0‰ compared to pyrite and another“missing sulfur” pool, which is depleted in 34S with respect to pyrite.Using the nonstoichiometric relationship between sulfate and totaliron of 1.1 the isotope composition of the “missing sulfur” pool can be
estimated to be around −9.0‰. Thus, the “missing sulfur” is depletedin 34S by roughly −5.3‰ relative to pyrite and by −9.3‰ relative tosulfate.
5. Interpretation
5.1. Leaching mode of pyrite in the initial stage and degassing of SO2
Our data show that the initial stage of pyrite leaching by Afproduces sulfate that is different in its oxygen and sulfur isotopecomposition from the one produced in the main stage of pyriteleaching. This is evidence for differences in the mechanism of theleaching process (i.e. kinetics and/or reaction pathways) that need tobe explained in the context of the observation of the changes in thesolution chemistry (Fe species, pH and sulfate–iron ratio), microbialgrowth and abiotic pyrite oxidation mechanism.
Actual degassing of sulfur dioxide related to abiotic or biologicalleaching of pyrite has not been recorded so far. A correlation betweenthe population size of Af in acid sulfate soils and the evolution of SO2
has been observed by Dürr et al. (2004). Emission of sulfur dioxidefrom sulfuric soils is related to the oxidation of pyrite; the mechanismcausing these emissions is currently not resolved (Macdonald et al.,2004; Kinsela et al., 2007). Descostes et al. (2004) report SO4
2−/Fetotratios of 1.5 to 1.6 at pH of 1.2 to 2 in abiotic experiments withperchloric and hydrochloric acid and present a data compilation thatindicates that the observed ratio depends on the pH of the solution.Since the degassing rate of SO2 is higher at lower pH, Descostes et al.(2004) suggest that the “missing sulfate”may have degassed as sulfurdioxide (SO2). Our initial experiments with acid leaching of pyrite byhydrochloric and sulfuric acid show that small quantities of SO2 canbe produced. This provides evidence for the formation of sulfitespecies during abiotic leaching of pyrite but no proof that degassingof SO2 accounts for the nonstoichiometric sulfate:iron ratios in acidpyrite leaching experiments. Druschel and Borda (2006) showed thatnonstoichiometric sulfate:iron ratios can be caused by otherprocesses: At pH below 3, Fe-SSO3 surface structures on the pyritesurface are the first product of pyrite leaching (Fig. 6), allowingsubsequent reactions to break the S–S bond (Rimstidt and Vaughan,2003), releasing sulfate or sulfite species to the solution (Borda et al.,
70 B. Brunner et al. / Earth and Planetary Science Letters 270 (2008) 63–72
2003). The abiotic oxidation of pyrite to sulfite is composed by twohalf-reactions (Rimstidt and Vaughan, 2003):
Cathode site of pyrite : 3=2O2 þ 6Hþ⇒3H2O ð1:1Þ
Anode site of pyrite : FeS2 þ 3H2O ⇒ Fe2þ þ S0 þ SO2−3 þ 6Hþ: ð1:2Þ
And, reactions to sulfate, respectively are:
Cathode site of pyrite : 2O2 þ 8Hþ⇒ 4H2O ð2:1Þ
Anode site of pyrite : FeS2 þ 4H2O⇒ Fe2þ þ S0 þ SO2−4 þ 8Hþ: ð2:2Þ
Either sulfite or sulfate could be the reaction product and bothreactions are pH neutral. This scenario includes the formation ofmonosulfide, which may be oxidized to elemental sulfur and sulfuroxyanion species (Druschel and Borda, 2006). If not all monosulfide issubsequently oxidized to sulfate, this chemical pathway can causenonstoichiometric SO4
2−:Fetot ratios as low as 1. However, detectableamounts of those sulfur species should remain in the solution or onthe pyrite surface. Descostes et al. (2004) did not detect any dissolvedsulfur species besides sulfate by ion chromatography; the presence ofelemental sulfur was not investigated in their experiments. In the hereinvestigated pyrite leaching experiments with Af by Yu et al. (2001)neither elemental sulfur nor dissolved sulfur species besides sulfatewere detectable, and the “missing sulfur”was not converted to sulfateat the beginning of the main stage of pyrite leaching (Fig. 2), butremainedmissing. This leads us to the conclusion that accumulation ofsulfite in the solution with subsequent degassing of SO2 is the besthypothesis to explain the observations from the initial stage of pyriteleaching by Af. There are two major differences between abiotic andbiological nonstoichiometric leaching of pyrite: For biological leachingat pH 2 both leaching rate (observed from the uninoculated ex-periments) and size of “missing sulfur pool” (SO4
2−/Fetot ratio of 1.1 inthe presence of Af and 1.6 for abiotic leaching Descostes et al., 2004)are larger. We believe that this is due to microbial oxidation ofelemental sulfur to sulfite as main energy source for Af Eq. (3.3) thatfollows the abiotic attack of the pyrite surface Eqs. (3.1) and (3.2).
FeS2 þ 3=2O2⇒Fe2þ þ S0 þ SO2−3 ð3:1Þ
FeS2 þ 2O2⇒Fe2þ þ S0 þ SO2−4 ð3:2Þ
S0 þ O2 þ H2O⇒Hþ þ HSO−3ðΔG- ¼ −272:2kJ=molO2Þ: ð3:3Þ
This removes sulfur coatings from reactive pyrite sites, thusallowing for faster leaching of pyrite and promotes formation ofsulfite species. If sulfite oxidation Eq. (3.4) is not accelerated ac-cordingly, more SO2 will degas Eq. (3.5).
SO−3 þ 1=2O2⇒SO2−
4 ðΔG- ¼ −258kJ=molSO−3; −516kJ=molO2Þ ð3:4Þ
Hþ þ HSO−3⇒SO2 þ H2O: ð3:5Þ
Eqs. (3.1) and (3.2) describe the abiotic leaching of pyrite at pHb3,Eq. (3.3) the oxidation of elemental sulfur by dissolved oxygen, whichis accelerated in the presence of Af, Eq. (3.4) the oxidation of sulfite tosulfate, and Eq. (3.5) the formation and degassing of sulfur dioxidefrom sulfite under acidic conditions. This sequence of reactions leadsto the following theoretical net reaction:
FeS2 þ 3O2⇒Fe2þ þ SO2−4 þ SO2ðgÞ: ð3:6Þ
The net reaction Eq. (3.6) is consistent with the observations fromthe chemistry of the solution: Ferrous iron is the main dissolved ironspecies, it is not in a stoichiometric relationship to the amount of
dissolved sulfate, and the reaction does not alter the pH of the solution.The degassing of sulfur dioxide explains why the “missing” amount ofsulfur does not reappear in the main stage of pyrite leaching.
This scenario is supported by the sulfur and oxygen isotope datafrom the initial stage of pyrite leaching by Af. The “missing sulfur” poolis depleted in 34S by roughly −9.3‰ relative to the accumulatingsulfate, which correspondswell with the isotope depletion of −12±2‰for SO2 evolved from sodium sulfite that was dissolved in acid (Table2c). Similarly, degassing of SO2 should cause enrichment of 18O in theremaining sulfite pool. At low pH, oxygen isotope exchange betweensulfite species and water is very rapid (Betts and Voss, 1970; Hornerand Connick, 2003), however, the exact oxygen isotope fractionationbetween sulfite and water is currently not known. The equilibriumoxygen isotope fractionation between sulfur dioxide and water vaporis +24.3‰ (Holt et al.,1983). At pH 7 sulfite is enriched in 18O at least by11‰ with respect to water (Brunner et al., 2006). This implies, that ifsulfite species are present, and exist long enough to allow for oxygenisotope exchange, sulfite would be enriched in 18O compared to water.The possibility of oxygen isotope fractionation between sulfite andwater has been mentioned by Lloyd (1968) and it has been speculatedthat this process may be responsible for the oxygen isotope effectsobserved in sulfate related to dissimilatory sulfate reduction anddisproportionation of sulfur (e.g. Fritz et al., 1989; Böttcher et al., 2005;Brunner et al., 2005; Turchyn and Schrag, 2006). Thus, both degassingof SO2 and oxygen isotope exchange betweenwater and sulfite shouldlead to sulfite enriched in 18O compared to water. Correspondingly,sulfate derived from the oxidation of this sulfite should be enriched in18O as well. This accords well with the sulfate produced during theinitial stage of pyrite leaching which is enriched in 18O compared towater by roughly +10‰. The strong scatter in the data may be due tothe competition between processes deriving oxygen from water andprocesses that derive oxygen from O2 for the oxidation of the sulfurspecies to sulfate.
5.2. Leaching mode of pyrite in the initial stage and degassing of SO2
During the main stage, pyrite sulfur is almost quantitatively con-verted to sulfate, according to the net reaction
FeS2 þ 15=4O2 þ 1=2H2O⇒Fe3þ þ 2SO2−4 þ Hþ: ð4:1Þ
This reaction is composed of the abiotic attack of ferric iron onpyrite, where the oxygen of sulfate is derived from water
FeS2 þ 14Fe3þ þ 8H2O⇒15Fe2þ þ 2SO2−4 þ 16Hþ ð4:2Þ
and by the oxidation of ferrous iron with dissolved oxygen to ferriciron, a reaction which is catalyzed by Af (ΔG°=−33 kJ/mol Fe2+;−131.7 kJ/mol O2)
15Fe2þ þ 15=4O2 þ 15Hþ⇒15Fe3þ þ 15=2H2O: ð4:3Þ
Due to the quantitative conversion of sulfur from pyrite to sulfate,no sulfur isotope fractionation is observed, and the oxygen isotopecomposition is close to that of water.
5.3. Offset between lag phase of growth of Af and change in leachingstage of pyrite
The cell counts of bacteria in solution indicate that the transitionbetween the lag phase of growth (no increase in cell counts) and theexponential phase of growth (linear increase in counts on a logarithmicscale) occurs at a time around 70 h of incubation (Fig. 1). The majorchange in the solution chemistry and in the isotope composition ofproduced sulfate, however, takes place at around 400 h of incubation.This raises the question if the chemical changes are directly related to
71B. Brunner et al. / Earth and Planetary Science Letters 270 (2008) 63–72
changes in the growth phases of the bacteria. During the initial stage ofpyrite leaching, themajor increase in sulfate and iron in solution occursin the first 100 h, while in the time between 100 and 400 h, the sulfateand iron concentration remains almost constant (Fig. 1). This indicatesthat the leaching mode of Af during the lag phase is replaced by aleaching mode that belongs to the initial part of the exponentialgrowth phase. Since ferrous iron is readily available in the solution, thecells in solution are likely to gain their energy from its oxidation toferric iron Eq. (4.3). In fact, the cell count just before 400 h shows adecrease (Table 1), which we interpret as adaptation to the newmetabolic pathway. This reduction is similar to the reduction at thebeginning of the experiment when an inoculum taken from anexponential growth culture adapts to pyrite oxidation in the absenceof ferrous iron. At the start of the exponential growth, the number ofbacteria in solution is very low and the rate of production of ferric ironis smaller than the rate of ferric iron reduction in the abiotic attack onpyrite Eq. (4.2). Therefore, ferrous iron remains the dominant ironspecies in solution. In the absence of ferric iron that would oxidizesulfite, sulfur dioxide degassing and thus nonstoichiometric leachingof pyrite may still occur, however, the very small amount of change inthe concentration of sulfate and ferrous iron during the time between100 and 400 h makes it hard to explore this in more detail. Thus, thereis an offset between the lag phase of growth of Af and the change in thesolution chemistry of pyrite; however, the chemical changes are linkedto the change in the growth phases.
During the lag phase, the bacteria are attached to the pyrite surface,where elemental sulfur is formed, and the oxidation of this elementalsulfur seems to be the energy source. Preferred oxidation of elementalsulfur over ferrous iron, as is the case in the initial stage of pyrite leachingby Af, has been observed before at pH values below 1.3 (Sand, 1989).Interestingly, the production rate of ferrous iron and sulfate declinesalmost to zero after the end of the lag phase in growth of Af (70–100 h).This indicates that the nonstoichimetric pyrite leachingmechanismwaslimited, either by substrate availability (i.e. reactive sites on the pyritesurface) or by accumulated products, i.e. ferrous iron and sulfite,triggering changes in themetabolic activity ofAf. Inhibition of enzymaticactivities of Af has been observed for sulfite (Sugio et al., 1994; Takeuchiand Suzuki, 1994; Rohwerder and Sand, 2003), for ferrous iron (Sugio etal., 1990; Sugio et al., 1992; Das et al., 1993) and for pH below 1.3 (Sand,1989). In the initial stage of pyrite leaching of the Yu et al. (2001)experiments, the sulfite concentrations were below the detection limits(b1 ppm), the concentration of ferrous iron reached 2 mM and the pHstayed above 2. Thus, accumulation of ferrous iron is the most likelycandidate that may have caused inhibition of certain metabolicprocesses of Af. Sugio et al. (1990) found that hydrogen sulfide:ferriciron oxidoreductase and sulfite:ferric iron oxidoreductase were com-pletely inhibited by 20 mM and 1 mM Fe2+, respectively. The use ofelemental sulfur as energy source by Afwas completely inhibited above108 mM of Fe2+. Thus, the accumulation of ferrous iron may have anegative influence on the capability of Af to oxidize sulfur compounds.Margalith et al. (1966) observed that the oxidation rate of Fe2+ by Afdecreased in the presence of elemental sulfur, indicating that theremight be a competition between microbial oxidation of sulfurcompounds and oxidation of ferrous iron. Recent investigations intothe protein expression during growth of Af on ferrous iron and sulfurcompounds (Brasseur et al., 2004; Ramírez et al., 2004; Yarzábal et al.,2004) confirm the strong influence of the concentration of Fe2+ on themetabolic activity of Af. Thus, high concentrations of ferrous iron maytrigger the transition froma sulfuroxidationmechanismtoamechanismwhere oxidation of ferrous iron dominates. The transition betweeninitial and main stage of pyrite leaching by Af sheds light on aninteresting physiological aspect: Amode, where bacteria gain energy byoxidation of elemental sulfur (ΔG0=−272.2 kJ/mol O2) but show littlegrowth in population due to a slow abiotic pyrite leachingmechanism isswitched into a mode, where bacteria gain a smaller amount of energyby the oxidation of ferrous iron (ΔG0=−131.7 kJ/mol O2), but induce
much faster pyrite leaching rates due to the production of ferric iron.Compared to the main stage, where bacteria mainly depend on theavailability of ferrous iron from the solution, the initial phase of pyriteoxidation seems to be amuchmore secureway to establish a sustainablepopulation. Thus, the intriguing change in the leaching mechanism ofpyrite by Af may reflect a survival and growth strategy.
6. Outlook
This work puts emphasis on four aspects related to oxidation ofpyrite by Af: The importance of the initial stage of pyrite leaching, thedegassing of sulfur dioxide during biological and abiotic acid pyriteleaching, the importance of sulfite as an intermediate in the oxidationof pyrite and the influence of ferrous iron on the metabolic activity ofAf. None of these aspects is new in the literature, however, yet, theyhave not been explored thoroughly. We hope that our work stimulatesfurther research in this direction.
7. Conclusions
Sulfur and oxygen isotope analysis of sulfate that is producedduring pyrite leaching by Af confirms that the leaching mechanismduring the initial stage of pyrite leaching is different from the mech-anism in the main stage. Enrichment in the 18O of produced sulfates inthe initial stage indicates the formation of sulfite as an intermediatethat is not immediately converted to sulfate, therefore allowing foroxygen isotope exchange between sulfite species and water andallowing for degassing of sulfur dioxide under acidic conditions. Lossof 34S-depleted SO2 causes enrichment of 34S in formed sulfate andexplains nonstoichiometric sulfur–iron ratios during the initial stageof pyrite leaching. This is consistent with observed degassing of SO2 inabiotic acid pyrite leaching experiments.
The transition from initial stage of pyrite stage may be triggered bythe accumulationof ferrous iron. It defines a fundamental change in thegrowth strategy of Af. Amode, where bacteria gain energy by oxidationof elemental sulfur (ΔG0=−272.2 kJ/mol O2) but show little growth inpopulation due to a slowabiotic pyrite leachingmechanism is switchedinto a mode, where bacteria gain a smaller amount of energy bythe oxidation of ferrous iron (ΔG0=−131.7 kJ/mol O2), but inducemuchfaster pyrite leaching rates due to the production of ferric iron.
Acknowledgements
This researchwas carried out by the Jet Propulsion Laboratory (JPL),California Institute of Technology, under contract with the NationalAeronautics and Space Administration (NASA) with support from JPL'sResearch and Technology Development Programvia a grant toMC. Thevisiting program of Kangwon National University Research Fundsupported J-Y. Yu's visit to PRIS in 1998 and to JPL in 2005. We greatlyacknowledgeM. Isaacs in PRIS for helping in isotopic analysis of water,B. Abbey for doing theXRD analysis andG. L. Arnold for discussions andhelp with statistics. We are very grateful for the thorough review by K.W. Mandernack that helped focus and strengthen this manuscript.
References
Balci, N., Shanks, W.C., Mayer, B., Mandernack, K.W., 2007. Oxygen and sulfur isotopesystematics of sulfate produced by bacterial and abiotic oxidation of pyrite.Geochimica et Cosmochimica Acta. doi:10.1016/j.gca.2007.04.017.
Betts, R.H., Voss, R.H., 1970. The kinetics of oxygen exchange between the sulfite ion andwater. Canadian Journal of Chemistry 48, 2036–2041.
Biegeleisen, J., 1949. The relative velocities of isotopic molecules. Journal of ChemicalPhysics 17, 675–678.
Böhlke, J.K., Mroczkowski, S.J., Coplen, T.B., 2003. Oxygen isotopes in nitrate: newreference materials for 18O:17O:16O measurements and observation on nitrate-water equilibration. Rapid Communications in Mass Spectrometry 17, 1835–1846.doi:10.1002/rcm.1123.
Borda, M.J., Strongin, D.R., Schoonen, M.A., 2003. A vibrational spectroscopic study ofthe oxidation of pyrite by ferric iron. American Mineralogist 88 (8–9), 1318–1323.
72 B. Brunner et al. / Earth and Planetary Science Letters 270 (2008) 63–72
Boschetti, T., Iacumin, P., 2005. Continuous-flow d18O measurements: new approach tostandardization, high-temperature thermodynamic and sulfate analysis. RapidCommunications in Mass Spectrometry 19, 3007–3014. doi:10.1002/rcm.2161.
Böttcher, M.E., Thamdrup, B., Gehre, M., Theune, A., 2005. 34S/32S and 18O/16Ofractionation during sulfur disproportionation by Desulfobulbus propionicus.Geomicrobiology Journal 22, 219–226. doi:10.1080/01490450590947751.
Brasseur, G., Levican, G., Bonnefoy, V., Holmes, D., Jedlicki, E., Lemesle-Meunier, D., 2004.Apparent redundancy of electron transfer pathways via bc1 complexes andterminal oxidases in the extremophilic chemolithoautotrophic Acidithiobacillusferrooxidans. Biochimica et Biophysica Acta 1656, 114–126.
Brunner, B., Bernasconi, S.M., Kleikemper, J., Schroth, M.H., 2005. A model for oxygenand sulfur isotope fractionation in sulfate during bacterial sulfate reductionprocesses. Geochimica et Cosmochimica Acta 69 (20), 4773–4785. doi:10.1016/j.gca.2005.04.017.
Brunner, B., Mielke, R.E., Coleman, M., 2006. Abiotic oxygen isotope equilibriumfractionation between sulfite and water. Eos Trans. AGU 87 (52) Fall Meet. Suppl.,Abstract V11C-0601.
Chiba, H., Sakai, H., 1985. Oxygen isotope exchange rate between dissolved sulfate andwaterat hydrothermal temperatures.GeochimicaetCosmochimicaActa49, 993–1000.
Chu, X., Ohmoto, H., Cole, D.R., 2004. Kinetics of sulfur isotope exchange betweenaqueous sulfide and thiosulfate involving intra- and intermolecular reactionsat hydrothermal conditions Chemical Geology 211, 217–235. doi:10.1016/j.chemgeo.2004.06.013.
Das, A., Mishra, A.K., Roy, P., 1993. Inhibition of thiosulfate and tetrathionate oxidationby ferrous iron in Thiobacillus ferrooxidans. FEMS Microbiology Letters 112, 67–72.
Descostes,M., Vitorge, P., Beaucaire, C., 2004. Pyrite dissolution inacidicmedia.Geochimicaet Cosmochimica Acta 68 (22), 4559–4569. doi:10.1016/j.gca.2004.04.012.
Druschel, G., Borda, M., 2006. Comment on “Pyrite dissolution in acidic media” by M.Descostes, P. Vitorge, and C. Beaucaire. Geochimica et Cosmochimica Acta 70,5246–5250. doi:10.1016/j.gca.2005.07.023.
Dürr, M., Kinsela, A., Macdonald, B.C.T., White, I., 2004. Influence of land use on theemission of sulfur dioxide from acid sulfate soils. SuperSoil 2004: 3rd AustralianNew Zealand Soils Conference, 5–9 December 2004. University of Sydney Australia.
Eccleston, M., Kelly, D.P., 1978. Oxidation kinetics and chemostat growth kinetics ofThiobacillus ferrooxidans on tetrathionate and thiosulfate. Journal of Bacteriology134 (3), 718–727.
Epstein, S., Mayeda, T.K., 1953. Variation of 18O content of waters from natural sources.Geochimica et Cosmochimica Acta 4, 213–224.
Friedrich, C.G., Rother, D., Bardischewsky, F., Quentmeier, A., Fischer, J., 2001. Oxidationof reduced inorganic sulfur compounds by bacteria: emergence of a commonmechanism? Applied and Environmental Microbiology 67 (7), 2873–2882.doi:10.1128/AEM.67.7.2873-2882.2001.
Fritz, P., Basharmal, G.M., Drimmie, R.J., Ibsen, J., Qureshi, R.M., 1989. Oxygen isotopeexchange between sulphate and water during bacterial reduction of sulphate.Chemical Geology (Isotope Geoscience Section) 79, 99–105.
Hirose, T., Suzuki, H., Inagaki, K., Tanaka, H., Tano, T., Sugio, T., 1991. Inhibition of sulfuruse by sulfite ion in Thiobacillus ferrooxidans. Agricultural and Biological Chemistry55 (10), 2479–2484.
Holt, B.D., Cunningham, P.T., Engelkemeir, A.G., Graczyk, D.G., Kumar, R., 1983. Oxygen-18 study of nonaqueous-phase oxidation of sulfur dioxide. Atmospheric Environ-ment 17 (3), 625–632.
Horner, D.A., Connick, R.E., 2003. Kinetics of oxygen exchange between the two isomersof bisulfite ion, disulfite ion (S2O52-), and water as studied by oxygen-17 nuclearmagnetic resonance spectroscopy. Inorganic Chemistry 42 (6), 1884–1894.doi:10.1021/ic020692n.
Kinsela, A.S., Reynolds, J.K., Melville, M.D., 2007. Agricultural acid sulfate soils: apotential source of volatile sulfur compounds? Environment & Chemistry 4, 18–25.doi:10.1071/EN06071.
Kolthoff, J.M., Meehan, E.J., Sadell, E.B., Bruckenstein, S., 1969. Quantitative ChemicalAnalysis, 4th Ed. McMillan, New York.
Lloyd, R.M., 1968. Oxygen isotope behavior in the sulfate–water system. Journal ofGeophysical Research Vol. 73 (18), 6099–6110.
Luther III, G.W., 1987. Pyrite oxidation and reduction: molecular orbital theoryconsiderations. Geochimica et Cosmochimica Acta 51, 3193–3199.
Margalith, P., Silver, M., Lundgren, D.G., 1966. Sulfur oxidation by the iron bacteriumFerrobacillus ferrooxidans. Journal of Bacteriology 92 (6), 1706–1709.
Masau, R.J.Y., 1999. The mechanism of thiosulfate oxidation by Thiobacillus thiooxidans.Master Thesis. Faculty of Graduate Studies, Department of Microbiology, Universityof Manitoba, Winnipeg, Manitoba.158 p.
Macdonald, B.C.T., Denmead, O.T., White, I., Melville, M.D., 2004. Natural sulfur dioxideemissions from sulfuric soils. Atmospheric Environment 38, 1473–1480. doi:10.1016/j.atmosenv.2003.12.005.
Mielke, R.E., Pace, D.L., Porter, T., Southam, G., 2003. A critical stage in the formationof acid mine drainage: colonization of pyrite by Acidithiobacillus ferrooxidans underpH-neutral conditions. Geobiology 1 (1), 81–90. doi:10.1046/j.1472-4669.2003.00005.x.
Mustin, C., Berthelin, J., Marion, P., de Donato, P., 1992. Corrosion and electrochemicaloxidation of a pyrite by Thiobacillus ferrooxidans. Applied and EnvironmentalMicrobiology 58 (4), 1175–1182.
Pisapia, C., Chaussidon, M., Mustin, C., Humbert, B., 2007. O and S isotopic compositionof dissolved and attached oxidation products of pyrite by Acidithiobacillusferrooxidans: comparison with abiotic oxidations. Geochimica et CosmochimicaActa 71, 2474–2490. doi:10.1016/j.gca.2007.02.021.
Pronk, J.T., Meulenberg, R., Hazeu, W., Bos, P., Kuenen, J.G., 1990. Oxidation of reducedinorganic sulphur compounds by acidophilic thiobacilli. FEMS MicrobiologyReviews 75, 293–306.
Ramírez, P., Guiliani, N., Valenzuela, L., Beard, S., Jerez, C.A., 2004. differential proteinexpression during growth of Acidithiobacillus ferrooxidans on ferrous iron, sulfurcompounds, or metal sulfides. Applied and Environmental Microbiology 70 (8),4491–4498. doi:10.1128/AEM.70.8.4491-4498.2004.
Rawlings, D.E., 2005. Characteristics and adaptability of iron- and sulfur-oxidizingmicroorganisms used for the recovery of metals from minerals and theirconcentrates. Microbial Cell Factories 4 (13), 1–15. doi:10.1186/1475-2859-4-13.
Rimstidt, J.D., Vaughan, D.J., 2003. Pyrite oxidation: a state-of-the-art assessment of thereaction mechanism. Geochimica et Cosmochimica Acta 67 (5), 873–880.doi:10.1016/S0016-7037(02)01165-1.
Rohwerder, T., Sand, W., 2003. The sulfane sulfur of persulfides is the actual substrate ofthe sulfur-oxidizing enzymes from Acidithiobacillus and Acidiphilium spp. Micro-biology 149, 1699–1709. doi:10.1099/mic.0.26212-0.
Sand, W., 1989. Ferric iron reduction by Thiobacillus ferrooxidans at extremely low pH-values. Biogeochemistry 7, 195–201.
Schippers, A., Sand, W., 1999. Bacterial leaching of metal sulfides proceeds by twoindirect mechanisms via thiosulfate or via polysulfides and sulfur. Applied andEnvironmental Micorbiology 65, 319–321.
Shortt, B.J., Darrach, M.R., Holland, P.M., Chutjian, A., 2005. Miniaturized system of a gaschromatograph coupled with a Paul ion trap mass spectrometer. Journal of MassSpectrometry 40, 36–42.
Sugio, T., Hirose, T., Oto, A., Inagaki, K., Tano, T., 1990. the regulation of sulfur use byferrous ion in Thiobacillus ferrooxidans. Agricultural and Biological Chemistry 54 (8),2017–2022.
Sugio, T., Hirose, T., Li-Zhen, Y., Tano, T., 1992. Purification and some properties of sulfite:ferric ion oxidoreductase from Thiobacillus ferrooxidans. Journal of Bacteriology 174(12), 4189–4192.
Sugio, T., Uemura, S., Makino, I., Iwahori, K., Tano, T., Blake II, R.C., 1994. Sensitivity ofiron-oxidizing bacteria, Thiobacillus ferrooxidans and Leptospirillum ferrooxidans, tobisulfite ion. Applied and Environmental Microbiology 60 (2), 722–725.
Sugio, T., Hisazumi, T., Kanao, T., Kamimura, K., Takeuchi, F., Negishi, A., 2006. Existenceof aa3-type ubiquinol oxidase as a terminal oxidase in sulfite of Acidithiobacillusthiooxidans. Bioscience, Biotechnology, and Biochemistry 70 (7), 1584–1591.
Suzuki, I., Chan, C.W., Takeuchi, T.L., 1992. Oxidation of elemental sulfur to sulfite by Thioba-cillus thiooxidans cells. Applied and Environmental Microbiology 58 (11), 3767–3769.
Takeuchi, T.L., Suzuki, I., 1994. Effect of pH on sulfite oxidation by Thiobacillusthiooxidans cells with sulfurous acid or sulfur dioxide as a possible substrate.Journal of Bacteriology 176 (3), 913–916.
Taylor, B.E., Wheeler, M.C., Nordstrom, D.K., 1984. Stable isotope geochemistry of acidmine drainage: experimental oxidation of pyrite. Geochimica et Cosmochimica Acta48, 2669–2678.
Toran, L., Harris, R., 1989. Interpretation of sulfur and oxygen isotopes in biological andabiological sulfide oxidation. Geochimica et Cosmochimica Acta 53, 2341–2348.
Turchyn, A.V., Schrag, D.P., 2006. Cenozoic evolution of the sulfur cycle: insight fromoxygen isotopes in marine sulfate. Earth and Planetary Science Letters 241,763–779. doi:10.1016/j.epsl.2005.11.007.
Uyama, F., Chiba, H., Kusakabe, M., Sakai, H., 1985. Sulfur isotope exchange reactions inthe aqueous system: thiosulfate-sulfide-sulfate at hydrothermal temperature.Geochemical Journal 19, 301–315.
Vestal, J.R., Lundgren, D.G., 1971. The sulfite oxidase of Thiobacillus ferrooxidans(Ferrobacillus ferrooxidans). Canadian Journal of Biochemistry 49, 1125–1130.
Wakai, S., Kikumoto, M., Kanao, T., Kamimura, K., 2004. Involvement of sulfide:quinoneoxidoreductase in sulfur oxidation of an acidophilic iron-oxidizing bacterium, Aci-dithiobacillus ferrooxidans NASF-1. Bioscience, Biotechnology, and Biochemistry 68(12), 2519–2528.
Williamson, M.A., Rimstidt, J.D., 1993. The rate of decomposition of the ferric-thiosulfatecomplex in acidic aqueous solutions. Geochimica et Cosmochimica Acta 57, 3555–3561.
Wodara, C., Bardischewsky, F., Friedrich, C.G., 1997. Cloning and characterization ofsulfite dehydrogenase, two c-type cytochromes, and a flavoprotein of Paracoccusdenitrificans GB17: essential role of sulfite dehydrogenase in lithotrophic sulfuroxidation. Journal of Bacteriology 179 (16), 5014–5023.
Yarzábal, A., Appia-Ayme, C., Ratouchniak, J., Bonnefoy, V., 2004. Regulation of theexpression of the Acidithiobacillus ferrooxidans rus operon encoding two cyto-chromes c, a cytochrome oxidase and rusticyanin. Microbiology 150, 2113–2123.doi:10.1099/mic.0.26966-0.
Yu, J.Y., McGenity, T.J., Coleman, M.L., 2001. Solution chemistry during the lag phase andexponential phase of pyrite oxidation by Thiobacillus ferrooxidans. ChemicalGeology 175, 307–317.
Zak, I., Sakai, H., Kaplan, I.R., 1980. Factors controlling the 18O/16O and 34S/32s isotoperatios of ocean sulfates, evaporites and interstitial sulfates from modern deepsea sediments. Isotope Marine Chemistry, Chapter 17. Institute of Geophysicsand Planetary Physics, University of California Los Angeles, California 90024, USA,pp. 339–373. Contribution No. 1957.


