Embed Size (px)
Citation preview
274 Biophysical Journal Volume 85 July 2003 274–289
Differential Modulation of Cardiac Ca21 Channel Gating by b-Subunits
Igor Dzhura* and Alan Neely*y
*Department of Physiology, Texas Tech University, Lubbock, Texas USA; and yCentro de Neurosciencias de Valparaıso,University of Valparaıso, Valparaıso, Chile
ABSTRACT To investigate the mechanisms that increase ionic currents when Ca21 channels’ a1 subunits are co-expressed
with the b-subunits, we compared channel activity of CaV1.2 (a1C) co-expressed with b1a and b2a in Xenopus oocytes.
Normalized by charge movement, ionic currents were near threefold larger with b2a than with b1a. At the single-channel level,
the open probability (Po) was over threefold larger with b2a, and traces with high Po were more frequent. Among traces with Po[
0.1, the mean duration of burst of openings (MBD) were nearly twice as long for a1Cb2a (15.1 6 0.7 ms) than for a1Cb1a (8.4 6
0.5 ms). Contribution of endogenous b3xo was ruled out by comparing MBDs with a1C-cRNA alone (4.7 6 0.1 ms) with b3xo
(14.3 6 1.1 ms), and with b1b (8.2 6 0.5 ms). Open-channel current amplitude distributions were indistinguishable for a1Cb1a
and a1Cb2a, indicating that opening and closing kinetics are similar with both subunits. Simulations with constant opening and
closing rates reproduced the microscopic kinetics accurately, and therefore we conclude that the conformational change-limiting
MBD is differentially regulated by the b-subunits and contributes to the larger ionic currents associated with b2a, whereas
closing and opening rates do not change, which should reflect the activity of a separate gate.
INTRODUCTION
High-voltage Ca21 channels are multisubunit membrane
proteins composed of four nonhomologous subunits: the a1
subunit, encompassing all the structural elements of
a functional voltage-activated channel; and three regulatory
subunits: a2/d, b, and g. Co-expression of a2/d- and/or
b-subunits with the a1 subunit increases macroscopic
currents, suggesting that these subunits may regulate channel
abundance (Wei et al., 1991; Williams et al., 1992). How-
ever, increased ionic currents often displayed significant al-
teration in time and voltage dependence (Stea et al., 1993;
Singer et al., 1991), indicating that the function of the chan-
nel may also be modulated by the regulatory subunit.
Through gating current measurements we showed that co-
expression of b2a augments ionic conductance fivefold with-
out changing the maximum gating charge movement (Neely
et al., 1993). The coupling efficiency of charge movement to
pore opening is also increased by the b-subunit in a neu-
ronal Ca21 channel (CaV2.3) expressed in Xenopus oocytes
(Olcese et al., 1996).
Further insight in the functional changes associated with
co-expression of the b-subunit was gained by comparing
single-channel activity of CaV1.2 expressed with or without
b2a (Wakamori et al., 1993; Neely et al., 1995; Costantin
et al., 1998). All these studies rule out changes in single-
channel conductance and report increases in the frequency of
long openings to explain, at least partially, how ionic
currents may be increased by the b-subunit. Since native
Ca21 channels activate in different gating modes with
characteristic open probability (Po) (Cavalie et al., 1986;
Hess et al., 1984), the frequency of long openings may be
increased by b if the interaction with a1 promotes modes of
higher Po. Shift in gating modes with different subunit
combinations has been shown to occur in the acetylcholine-
activated channel (Naranjo and Brehm, 1993). However,
rather than an increase in the fraction of time spent in the
high Po mode, co-expression of b2a with a1C was correlated
instead with an increase in the frequency of mode switching
(Costantin et al., 1998). Co-expression of the neuronal
isoform of b with CaV2.1 led to an increase in the mean
open-time also, with no evidence of mode shifting
(Wakamori et al., 1999).
A common assumption in these co-expression experi-
ments was that contribution of endogenous subunits is
negligible. Today this view is no longer tenable since we
know that b releases a1 from the endoplasmic reticulum
(Bichet et al., 2000) and is required for the expression
(Tareilus et al., 1997) and proper targeting of channels
(Chien et al., 1995; Brice et al., 1997). This combined effect
on expression and function was suggested to reflect the
binding of multiple b-subunits: association with one b
would be required for expression whereas functional changes
would come about with additional b-subunits. In this
scheme, lower coupling efficiencies may arise from channels
with an incomplete complement of b, as it would be the case
if, for example, b1a expresses less efficiently than b2a
(Birnbaumer et al., 1998). Here we compare the gating
behavior of channels from oocytes co-expressing a1C with
two different b-subunits: the cardiac (b2a) and the skeletal
(b1a) muscle isoform. We show that oocytes expressing
a1Cb2a display higher ionic-to-gating current ratio than the
ones expressing a1Cb1a. At the single-channel level, we
found that the Po for channels from a1Cb2a expressing
oocytes is severalfold higher than for a1Cb1a, with an
Submitted January 22, 2003, and accepted for publication March 17, 2003.
Address reprint requests to Alan Neely, Centro de Neurociencias de
Valparaıso, Universidad de Valparaıso, Gran Bretana 1111, Valparaıso,
Chile. Tel.: 56-32-50-8054; Fax: 56-32-28-3320; E-mail: [email protected].
Igor Dzhura’s current address is Dept. of Medicine, Division of Cardiology,
Vanderbilt University Medical Ctr., 315 MRB II, 2220 Pierce Ave.,
Nashville, TN 37232.
� 2003 by the Biophysical Society
0006-3495/03/07/274/16 $2.00
increase in the number of sweeps with higher Po. Among
traces with Po [ 0.1, MBD was nearly twice as long for
a1Cb2a than for a1Cb1a, suggesting that the b-subunit
modulates gating within a mode. We also analyzed oocytes
expressing other subunit combinations to rule out channel
heterogeneity as the source of this functional difference.
The duration of burst of openings is determined by the
transition rate to long-lived closed state and the ratio between
opening and closing rates (Colquhoun and Sakmann, 1985).
When opening and closing events are well-resolved, all these
rates can be obtained directly from dwell-time histograms. In
the presence of the dihydropyridine agonist Bay K 6844, as
used here, most openings appear well-resolved, but they are
often interrupted by brief closures that, when missed, lead to
an overestimation of the open state’s lifetime. This error
cannot be corrected for in a model-independent manner
(McManus and Magleby, 1991). To test for differences in
opening and closing rates in a detection-independent
manner, we compared the distribution of current amplitudes
of a1Cb2a and a1Cb1a and found no difference. Opening and
closing rates derived directly from these distributions (Marks
and Jones, 1992; Prodhom et al., 1989) were over 10-fold
faster than predicted from dwell-time histograms. Simulated
single-channel activity with these faster rates reproduced
open-time and burst-duration histograms for both subunit
combinations when only the rate leading to long-lived closed
states was changed. Changes in fast gating that increase
MBD visibly alter the open-channel amplitude distribution,
indicating that a conformational change leading to long-lived
closed state is being differentially regulated by the b-sub-
units and that modulation of this transition partially accounts
for the increases in coupling efficiencies. In contrast, closing
and opening rates do not appear to sense the presence of the
b-subunit, indicating that a separate gating mechanism is
involved.
METHODS
RNA synthesis and oocytes preparation
The cardiac Ca21 channel a1 subunit was an amino terminal deletion mutant
of the rabbit CaV1.2 (DN60) that yields larger ionic and gating currents
without changes in kinetics or sensitivity to the modulation by the b-subunit
(Wei et al., 1996). The b2a (Wei et al., 1991) and b1b (Pragnell et al., 1991)
subunits were from rat, the b1awas from rabbit (Ruth et al., 1989) and b3xo is
a b3-like subunit cloned from Xenopus oocytes (Tareilus et al., 1997).DN60,
b2a, and b3xo subunits were subcloned into pAGA2 (Sanford et al., 1991),
b1a in pGEM-3, and b1b in pBS. pAGADN60, pAGAb2a and pAGAb3xo
cDNA were linearized with HindIII; pBSb1b with NotI and pGEMb1a with
XbaI (New England Biolabs, Beverly, MA). RNAs were synthesized in vitro
with the mMESSAGE MACHINE (Ambion, Austin, TX) according to the
manufacturer instructions and resuspended in 10 ml of water at 4–6 mg/ml.
Stock solutions were diluted from 10- to 100-fold and the dilutions yield-
ing larger expression and maximal functional changes were chosen for
subsequent experiments. For the oocytes included in the article, cRNA were
diluted as follows: b2a 1:40, b1a 1:20, b1b 1:20, b3xo 1:60, and DN60 1:20.
50 nl of cRNA were injected per oocyte using a 10-ml automatic injector
(Drummond Scientific, Broomall, PA).
Large Xenopus female frogs (Nasco,Modesto, CA) were anaesthetized by
immersion in 0.15% tricaine for 15 min. One or two lobes of an ovary were
removed through a 10- to 12-mm abdominal incision under sterile conditions.
Oocytes were harvested from the same frog up to five times, allowing at least
six weeks of recovery. This procedure, general care, and handling of Xenopus
frogs were carried out according to a protocol approved by the Institutional
Animal Care Committee of Texas Tech University Health Sciences Center.
Oocytes were defolliculated by collagenase treatment (2 mg/ml, type II from
Worthington Biochemical, Lakewood, NJ) for 30 min in Ca21-free solution
(82.5mMNaCl, 2.5mMKCl, 1mMMgCl2, and 5mMHEPES titrated to pH
7.6 with NaOH). Collagenase treatment was stopped by repeated rinses with
Ca21-free media that was then replaced by SOS (100 mM NaCl, 2 mM KCl,
1.8 mM CaCl2, 1 mM MgCl2, and 5 mM HEPES titrated to pH 7.6 with
NaOH) in several partial dilution steps over a period of 1 h. Oocytes were
maintained at 19.58C in SOS supplemented with Na-pyruvate (2.5 mM),
gentamycin (50 or 200mg/ml), and Verapamil (10mM). The latter appears to
increase survival of oocytes expressing large Ca21 currents, although
a systematic survey was not carried out.
Recording techniques
Macroscopic currents were recorded using the cut-open oocyte voltage-
clamp technique (Taglialatela et al., 1992) with a CA-1 amplifier (Dagan,
Minneapolis, MN). Oocyte membrane exposed to the bottom chamber was
permeabilized by a brief treatment with 0.1% saponin. The voltage pipettes
were filled with 2 M tetramethylammonium-methanesulfonate, 50 mM
NaCl, and 10 mM EGTA and had tip resistance from 600–1200 kV. Data
acquisition and analysis were performed using the pCLAMP6 system (Axon
Instruments, Foster City, CA). The external solution contained 10 mM
Ba21, 96 mM n-methylglucamine, and 10 mM HEPES, and the pH was
adjusted to 7.0 with methanesulfonic acid (MES). The internal solution
contained 120 mM n-methylglucamine, 10 mM EGTA, and 10 mM HEPES
and the pH was adjusted to 7.0 with MES.
Patch-clamp recordings of single channels were performed with an
Axopatch-200A with an integrating headstage (Axon Instruments, Foster
City, CA). Patch pipetteswere pulled from aluminum silicate capillary (Sutter
Instrument, Novato, CA) and filled with a solution containing 76 mM Ba21,
10 mM HEPES, and 100 nM S(�)Bay K 8644 (Research Biochemical
International, Natick, MA). The pH was adjusted to 7.0 with MES. Pipette
resistance ranged from 4 to 7 MV. Vitelline membranes were removed
manually after exposure to a hyperosmotic solution (2–5min) containing 200
mMK-glutamate, 20mMKCl, 1mMMgCl2, 10mMEGTA, 10mMHEPES,
and 100 nMS(�) BayK 8644 and titrated to pH 7.2with KOH.Oocytes were
then placed in the recording chamber with a depolarizing solution of the
following composition: 110 mM K1, 10 mM HEPES titrated to pH 7.0 with
MES. Channels were activated by 185-ms pulses to 0 mV at 1 Hz from
a holding potential of �70 mV sampled at 20 kHz and filtered at 2 kHz.
Unless noted otherwise, all chemical and reagents were from Sigma-
Aldrich (St. Louis, MO).
Data analysis
Dwell-time histograms
Dwell-time histograms were constructed with the dedicated software
TRANSIT (VanDongen, 1996) from traces corrected for capacitive transients
and leakage currents by subtracting the average of traces without openings.
This software also yields aPo estimate by calculating the fraction of time spent
in the open state. The number of samples was reduced by one-half before the
analysis resulting in an effective sampling rate of 10 kHz. Multiexponential
probability density functions (PDF) were adjusted to fit dwell-time
histograms displayed in Sigworth-Sine coordinates using a maximum
likelihood algorithm (Sigworth and Sine, 1987). The first bin included for
the analysis of closed and open-time histogramswas from0.36 to 0.44ms that
corresponds to the first bin followed by a nonempty bin. This eliminates
events shorter than three times the dead time of the system (�0.1 ms).
Differential Modulation by Ca2+ Channel b-Subunits 275
Biophysical Journal 85(1) 274–289
A burst was defined as a series of consecutive openings separated by
closures briefer than tcrit, such that
1� expð�tcrit=tSÞ ¼ expð�tcrit=tLÞ: (1)
Here, tL and tS correspond to the mean duration of long and short closures
respectively obtained from fitting closed-duration histograms with a double-
exponential PDF. Shut intervals pertaining to either long- or short-lived
closed states will have the same probability of being misclassified if their
duration is equal to tcrit (Colquhoun and Sakmann, 1985).
All-points histograms
Opening and closing rate constants were extracted from all-point histograms
according to a method introduced by Fitzhugh (1983) and Yellen (1984) and
later adapted for Ca21 channels by Marks and Jones (1992). Briefly, the
filtered flicker of a channel between a single open and closed state is
described by a b-distribution in the absence of noise,
BðxÞ ¼ xða��1Þ
3 ð1� xÞðb��1Þ
; (2)
where a*¼ t kO and b*¼ t kC, kO and kC are the opening and closing rates,
respectively, t is the time constant of the filters, and x is the normalized
current amplitude (open ¼ 1 and closed ¼ 0). The value of t was calculated
as in Marks and Jones (1992). Background noise was included as
a convolution of B(x) with a Normal distribution describing baseline
fluctuations (Villarroel et al., 1988),
AðxÞ ¼ BðxÞ � A e½�0:5ððx�mÞ=sÞ2 �
; (3)
where m and s are the mean and standard deviation of the baseline noise,
respectively.
To eliminate capacitive transients, a multiexponential function that best
described the transient at the beginning of the test pulse was subtracted from
each pulse. After this subtraction, the beginning and end of the traces were
forced to �0� eliminating any remaining capacitive component. The data was
then filtered digitally at 300 Hz with a Gaussian filter. Traces whose baseline
deviated from zero were readjusted by eye. All-point histograms were then
constructed with FETCHAN6 (Axon Instrument) and exported to an Excel
(Microsoft, Seattle,WA) spreadsheet for further analysis. Bins between�0.3
and10.3 pA were normalized to a total area of �1� and a Normal distribution
adjusted. The theoretical Normal distribution was then convolved to B(x) to
obtain A(x), which was then compared to the open-channel amplitude PDF
(APDF). The convolutionwas performedwith a program originallywritten in
QuickBasic by Marks and Jones (1992), later adapted as an Excel macro.
Amplitude bins of all-points histograms were divided by the single-channel
current amplitude and the area normalized by the total count between 70%and
150% of the amplitude to generate the APDF. Single-channel current
amplitudes were first measured in prolonged openings and then adjusted
(65%) to improve the quality of the fit of the APDF.
Simulation of single-channel activity
The program CSIM 2.0 (Axon Instruments) was used to simulate single-
channel activity. The single-channel conductance was set to 17 pS and the
reversal potential to 170 mV. Sampling rate was set at 10 kHz, the filter at
1.7 kHz, and 0.18 pA of noise was added. The cutoff frequency was
determined by measuring the rise time (10–90% in 200 ms) of single-channel
openings from the experimental records.
RESULTS
Macroscopic currents
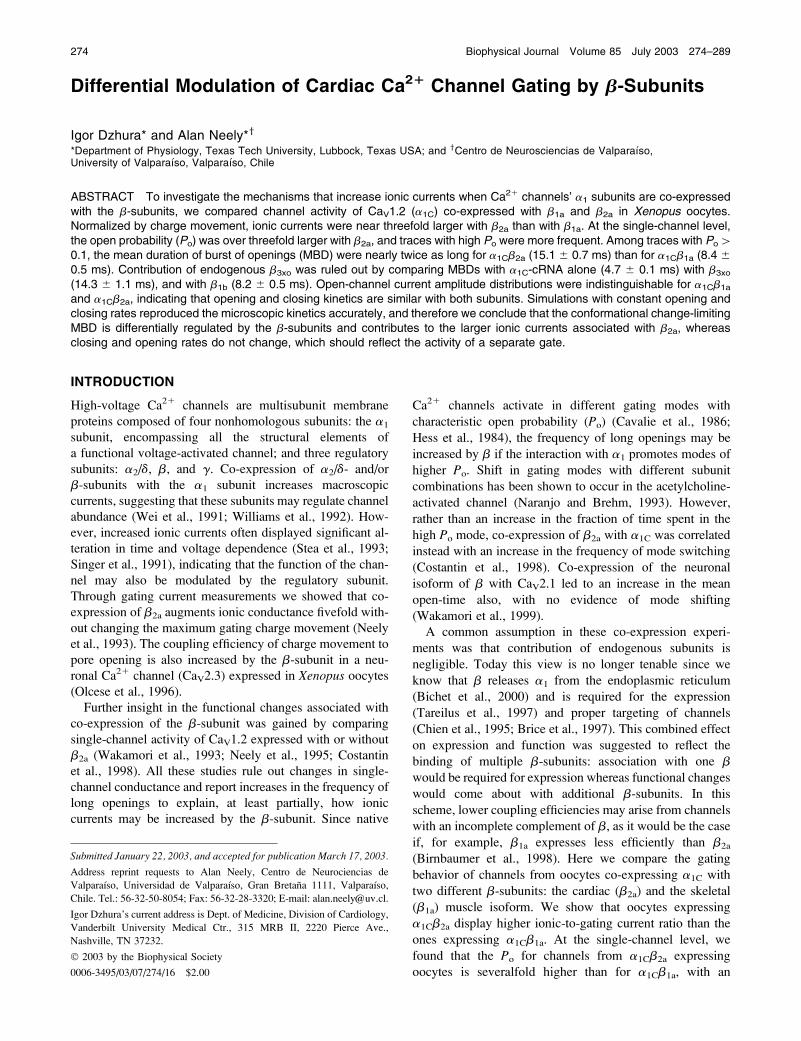
Fig. 1 compares voltage-clamp traces and current-voltage
plots from oocytes expressing either a1cb2a or a1cb1a. To
separate differences in function and expression for each
oocyte, we normalized inward currents measured at the end
of each pulse by the amount of charge movement measured
at the onset of a depolarizing step (Qon) to the current
reversal potential (155 to 167 mV, Fig. 1 B). At these
voltages, contribution of ionic current is negligible (Fig. 1 B)
and charge movement is expected to have reached their
maximum for the different subunit combinations of Ca12
channels expressed in oocytes (Neely et al., 1993). Channel
expression, as assayed by Qon, was highly variable and not
significantly different for the two subunit combinations. In
10 mM Ba21 the average Qon was 5036 129 nC (n¼ 8) and
2836 117 nC (n¼ 7) for a1cb1a and a1cb2a respectively. On
the other hand, when ionic currents were normalized by Qon,
we observed that a1C combined with b2a yields larger ionic
currents (�2.616 0.62 nA/pC at110 mV, with n ¼ 7) than
when combined with b1a (�0.976 0.26 nA/pC at120 mV,
with n¼ 8). Such an increase in coupling efficiency between
charge movement and ionic current can occur through an
increase in the single-channel conductance and/or the Po of
the channel. Since these issues are addressed through single-
channel recordings taken in the presence of channel agonist
FIGURE 1 Current-voltage relationship normalized by charge movement
for oocytes expressing a1Cb1a or a1Cb2a. (A) Superimposed voltage-clamp
traces during 60-ms depolarizing steps from �40 mV to 155 mV in 5-mV
increments from two oocytes; one expressing a1Cb1a (top) and the other
a1Cb2a (bottom) in 10 mM external Ba12. Membranes were held at�80 mV
between depolarizing pulses and linear components were subtracted by the
p/�4 protocol from the same holding voltage. Currents were sampled at 5
kHz and filtered at 1 kHz. (B) Example of charge-movement measurement
(shaded area) at the onset of a depolarization to the current reversal potential
from an oocyte expressing a1Cb2a. (C) Average IV plots normalized by
charge-movement from eight oocytes expressing a1Cb1a (�) and seven
oocytes expressing a1Cb2a (d). Error bars represent SE. (D) Normalized IV
plots in the presence of 0.1 mM (�)Bay K 8644 and 76 mM external Ba21
from eight oocytes expressing a1Cb1a (�) and seven oocytes expressing
a1Cb2a (d).
276 Dzhura and Neely
Biophysical Journal 85(1) 274–289
and high external Ba21 to overcome bandwidth and noise
limitations, we also compared normalized ionic currents in
0.1 mM S(�) Bay K 8644 and 76 mM external Ba21. In
these recording conditions, a1cb2a expressing oocytes yield
�5.56 nA/pC (at 120 mV, with n ¼ 7) compared to �1.92nA/pC (at 125 mV, with n ¼ 8) for a1cb1a. (Fig. 1 D) and
Qon was 2056 21 nC (n¼ 8) for a1cb1a and 2506 92 nC (n
¼ 7) for a1cb2a.
Single-channel activity
Single-channel currents were measured at �30, 0, and 130
mV from oocytes expressing each subunit combination
and compiled to calculate single-channel conductances. As
predicted from previous work comparing a1C and a1Cb2a
(Wakamori et al., 1993), the single-channel conductance of
a1Cb1a and a1Cb2a is the same (17.2 6 0.8 pS and 17.6 6
0.6 pS for a1Cb1a or a1Cb2a, respectively) and thus, we
focused our analysis in differences in Po at 0 mV. At this
potential, differences in the amplitude in macroscopic
currents were large (fourfold) and bursts of openings are
well-separated by long closures. To evaluate the changes
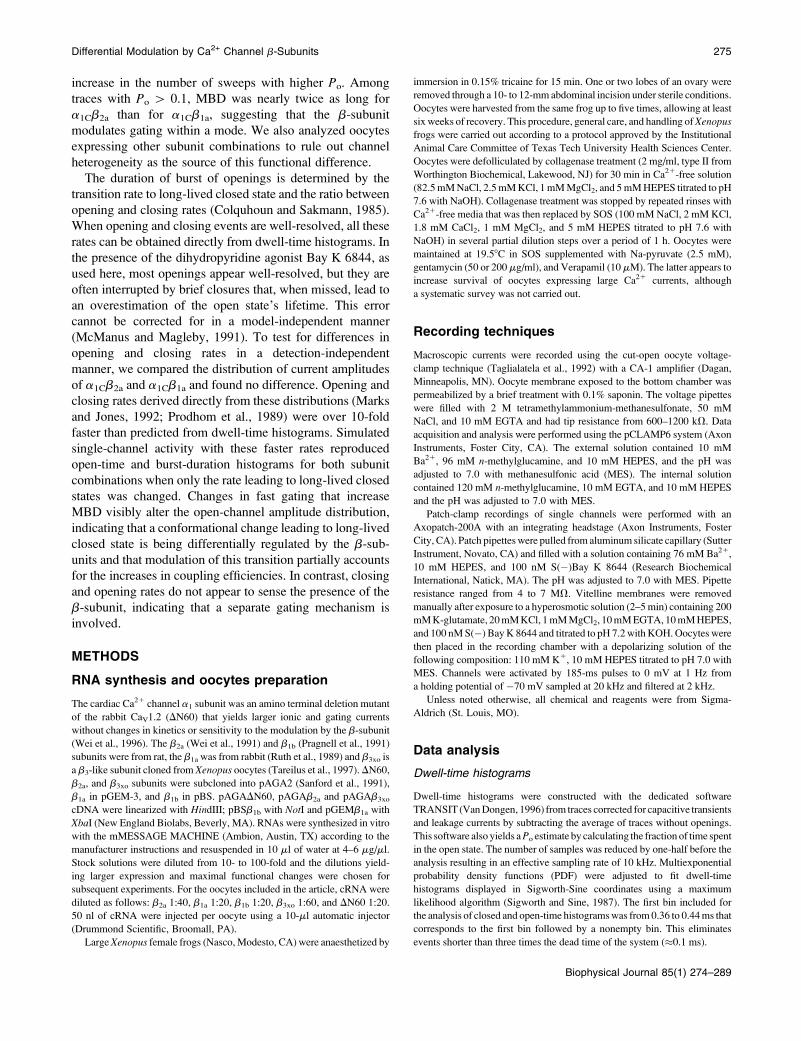
in Po, we selected seven and four patches from oocytes
expressing a1Cb1a and a1Cb2a, respectively, that lacked
simultaneous openings and displayed comparable activity at
the beginning and end of the recordings (Fig. 2). Average
traces from these patches (Fig. 3 A), measured as the mean
amplitudes during the final 100 ms of the pulse, were 12.13
fA for a1Cb1a and 46.32 fA for a1Cb2a. This fourfold change
compares well with the difference in macroscopic currents
recorded at 0 mV. Since there is no change in single-channel
conductance, this finding indicates that the a1Cb2a subunit
combination yields channels with a larger Po than with
a1Cb1a. Assuming that individual openings contribute 1.3
pA and all records contained only one active channel, the
average Po would then be 0.009 for a1Cb1a and 0.036 for
a1Cb2a. Estimating the number of active channels from
patches with such a low Po is virtually impossible. However,
in the Discussion we will argue that records containing two
channels are more likely to have been included in the a1Cb1a
data set and in such case the difference in Po would be
underestimated. On the other hand, macroscopic currents
normalized by charge movement were also about fourfold
larger for a1Cb2a than for a1Cb1a at 0 mV.
Single-channel activity recorded in oocytes shared several
features characteristic of native cardiac Ca21 channels
exposed to the agonist S(�)Bay K 8644 (Hess et al.,
1984): repeated depolarization often failed to evoke channel
openings (nulls) and the Po for traces with openings appears
to fall in two classes reminiscent of the high and low Po
modes (Fig. 2). In one mode of gating (Low Po), traces
displayed brief and isolated openings whereas multiple
bursts of openings characterized traces of the other mode
(High Po). Both modes of gating were observed in patches
from oocytes expressing a1Cb1a and a1Cb2a. The existence
of gating modes was confirmed by run analysis as described
in Horn et al. (1984). For single-channel patches with[20%
of active traces, the standardized random variable Z was
larger than the critical value (1.64) expected for a random
distribution (P # 0.05) with both subunit combinations.
To sort out the extent to which changes in gating modes
or in gating within each mode contributed to this difference,
we compared the Po distributions through Po histograms
combining all traces. Although we found a high degree of
overlap (Fig. 3 B), the Mann-Whitney-Wilcoxon test
(Bancroft and Han, 1981) indicates that there is more than
a 95% probability that the two histograms originated from
different populations and that Po for b2a is higher than for
b1a. The average Po calculated from these histograms yields
0.0086 0.003 for a1Cb1a and 0.0206 0.007 for a1Cb2a. We
also noted that the sum of two exponential distributions
approximated the Po distributions and thus resorted to
logarithmic binning to resolve different gating modes.
Indeed, with this transformation, Po histograms of active
traces appear clearly bimodal, with a peak at low Po ; 0.003
for both subunit combinations, and a second peak at 0.1 for
a1Cb1a and at 0.2 for a1Cb2a (Fig. 3 C). Also, the relative
frequency of traces with Po[ 0.1 was severalfold larger for
a1Cb2a (18.0 6 2.3%) than for a1Cb1a (4.4 6 1.6%),
FIGURE 2 Single-channel recordings (top) and dairy plots (bottom) from
oocytes expressing either a1Cb1a (A) or a1Cb2a (B). The patch from the
oocyte expressing a1Cb1a was interrupted after 500 traces whereas 1000
traces were collected from the oocyte expressing a1Cb2a. Traces with Po[
0.1 are labeled by *. Shaded rectangles over the dairy plots point to traces
selected for display. Channels were activated at 1 Hz by 185-ms pulses to
0 mV from a holding potential of �70 mV. Recordings were sampled at 20
kHz and filtered at 2 kHz.
Differential Modulation by Ca2+ Channel b-Subunits 277
Biophysical Journal 85(1) 274–289

whereas traces with no or very low activity (Po # 0.06) were
more frequent with a1Cb1a (92.0 6 2.7%) than with a1Cb2a
(77.46 3.1%; Fig. 3D). These results indicate that increased
frequency of high Po sweeps contribute to the augmented
currents observed in oocytes expressing a1Cb2a.
Unfortunately, patch-to-patch variability, the relatively
short duration of runs and difficulties in separating each
mode, prevented us from establishing whether this increase
is due to a higher chance of entering the high Po mode or
larger stability of this state. On the other hand, the shift in the
mode of the high Po sweeps revealed in the log-binned Po
histograms suggests that channel kinetics within gating
modes may also contribute to increases in Pomediated by co-
expression of b2a.
Dwell-time histograms
For the analysis of dwell-times, recordings from patches with
a few isolated double openings were also included to
improve our estimates of mean open times and MBD by
raising the number of experiments to 14 for a1Cb2a and 12
for a1Cb1a. However, the lifetime of long closed states may
be underestimated, since even for sweeps without over-
lapping openings there is a chance that two channels be-
came active simultaneously. Another shortcoming of adding
patches known to have more than one channel is that sweeps
selected by mode may also include some activity of channels
in different modes. Bearing these limitations in mind, only
the changes in the major components of dwell-time histo-
grams were considered.
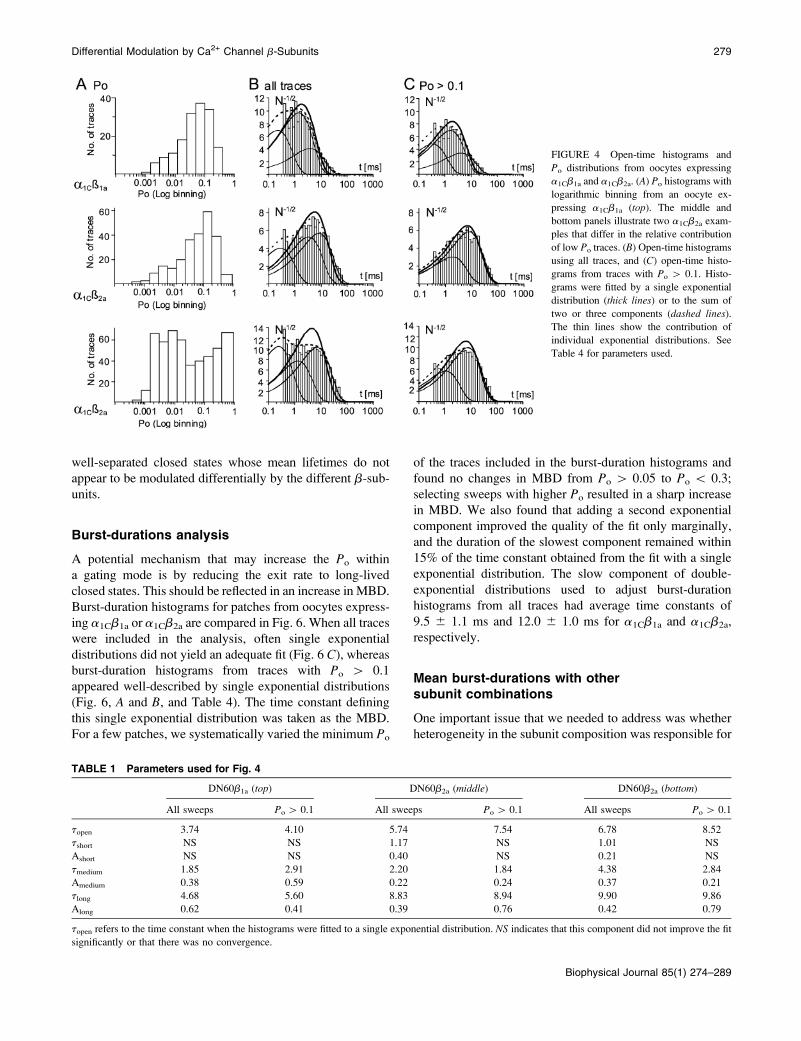
Open-time histograms constructed with all traces in
a recording often required the sum of up to three exponential
distributions to adequately describe the data, even for chan-
nels with seemingly mono-modal Po distribution (Fig. 4).
On the other hand, contribution of brief openings (tfast\
0.5 ms) to open-time histograms was greatly reduced, and
often no longer detectable when traces with Po # 0.1 were
excluded, even for clearly bimodal channels, as illustrated
in Fig. 4. Average time constants and relative amplitudes of
each component for histograms constructed with all traces or
only with traces with Po[0.1 or Po# 0.1 are summarized in
Table 2. We only found a significant difference in the time
constant of the fast component measured in the histograms
built from traces with Po[ 0.1. However, this component
turns out to be shorter for a1Cb2a (1.546 0.33 ms compared
to 2.60 6 0.56 ms for a1Cb1a) and thus, would contribute to
a decrease in Po for a1Cb2a. We also noted that events with
open-time\ 0.6 ms were more frequent than predicted by
the exponential distributions, suggesting that the combined
effect of noise and limited bandwidth was giving rise to
nonexponential distributions (McManus et al., 1987). This
problem was further aggravated by the small number of
events in each recording (5626 177 and 14026 299 events
for a1Cb1a and a1Cb2a, respectively). As an alternative, we
compared the time constants defining the single exponential
distribution that best described the open-time histograms
constructed from traces with Po[ 0.1. With this simplifi-
cation, we were able to detect a modest (26%) but sta-
tistically significant increase in topen with b2a (Table 4).
A minimum of two exponential distributions was
necessary to describe closed-time histograms, and some-
times a third component of intermediate duration could be
detected. If only closures from traces with a Po[ 0.1 were
selected, the intermediate component could seldom be
resolved. The simplest interpretation for this complexity is
that closing events arising from low Po gating mode were not
eliminated completely by selecting traces with Po[ 0.1, as
would happen when channels switched mode within a trace.
However, this source of error should affect, to a similar
extent, the measurements obtained with both b-subunits, and
a simplified model should increase our ability to detect
differences. Here we limited the number of exponential
components to two. Fig. 5 compares closed-time histograms
from the same patches used for the open-time histograms
shown in Fig. 4. With this simplification, we identified two
FIGURE 3 Mean current and Po distribution from oocytes expressing
a1Cb1a (cross-hatched ) and a1Cb2a (shaded ) subunits. (A) Mean current
traces constructed with 2628 traces from seven single-channel patches from
four oocytes expressing a1Cb1a (dotted line) and 1514 traces from four
single-channel patches from four oocytes expressing a1Cb2a (continuous
line). Traces were smoothed by averaging of window of 5 ms. (B) Po
frequency histograms constructed from the same records used in A expressed
as a percent of the total number of traces. (C) Po frequency histograms as in
B but using logarithmic binning. (D) Cumulative Po distributions. For
a1Cb2a, on average, 77.46 3.1% of the traces have Po# 0.06, while 23.86
3.1% have Po[ 0.06; 18.0 6 1.9% Po[ 0.1; 4.8% 6 0.3% Po[ 0.3; and
1.76 0.3% Po[0.5. For a1Cb1a, 92.06 2.7% of the traces have Po# 0.06,
while 8.06 2.7% of the traces have Po[0.06; 4.46 1.6% Po[0.1; 0.36
0.1% Po[0.3; and 0.036 0.03% Po[0.5. The differences are statistically
significant for all bins in D (P\ 0.05, two-tailed t-test).
278 Dzhura and Neely
Biophysical Journal 85(1) 274–289
well-separated closed states whose mean lifetimes do not
appear to be modulated differentially by the different b-sub-
units.
Burst-durations analysis
A potential mechanism that may increase the Po within
a gating mode is by reducing the exit rate to long-lived
closed states. This should be reflected in an increase in MBD.
Burst-duration histograms for patches from oocytes express-
ing a1Cb1a or a1Cb2a are compared in Fig. 6. When all traces
were included in the analysis, often single exponential
distributions did not yield an adequate fit (Fig. 6 C), whereas
burst-duration histograms from traces with Po [ 0.1
appeared well-described by single exponential distributions
(Fig. 6, A and B, and Table 4). The time constant defining
this single exponential distribution was taken as the MBD.
For a few patches, we systematically varied the minimum Po
of the traces included in the burst-duration histograms and
found no changes in MBD from Po [ 0.05 to Po \ 0.3;
selecting sweeps with higher Po resulted in a sharp increase
in MBD. We also found that adding a second exponential
component improved the quality of the fit only marginally,
and the duration of the slowest component remained within
15% of the time constant obtained from the fit with a single
exponential distribution. The slow component of double-
exponential distributions used to adjust burst-duration
histograms from all traces had average time constants of
9.5 6 1.1 ms and 12.0 6 1.0 ms for a1Cb1a and a1Cb2a,
respectively.
Mean burst-durations with other
subunit combinations
One important issue that we needed to address was whether
heterogeneity in the subunit composition was responsible for
FIGURE 4 Open-time histograms and
Po distributions from oocytes expressing
a1Cb1a and a1Cb2a. (A) Po histograms with
logarithmic binning from an oocyte ex-
pressing a1Cb1a (top). The middle and
bottom panels illustrate two a1Cb2a exam-
ples that differ in the relative contribution
of low Po traces. (B) Open-time histograms
using all traces, and (C) open-time histo-
grams from traces with Po [ 0.1. Histo-
grams were fitted by a single exponential
distribution (thick lines) or to the sum of
two or three components (dashed lines).
The thin lines show the contribution of
individual exponential distributions. See
Table 4 for parameters used.
TABLE 1 Parameters used for Fig. 4
DN60b1a (top) DN60b2a (middle) DN60b2a (bottom)
All sweeps Po[ 0.1 All sweeps Po[ 0.1 All sweeps Po[ 0.1
topen 3.74 4.10 5.74 7.54 6.78 8.52
tshort NS NS 1.17 NS 1.01 NS
Ashort NS NS 0.40 NS 0.21 NS
tmedium 1.85 2.91 2.20 1.84 4.38 2.84
Amedium 0.38 0.59 0.22 0.24 0.37 0.21
tlong 4.68 5.60 8.83 8.94 9.90 9.86
Along 0.62 0.41 0.39 0.76 0.42 0.79
topen refers to the time constant when the histograms were fitted to a single exponential distribution. NS indicates that this component did not improve the fit
significantly or that there was no convergence.
Differential Modulation by Ca2+ Channel b-Subunits 279
Biophysical Journal 85(1) 274–289
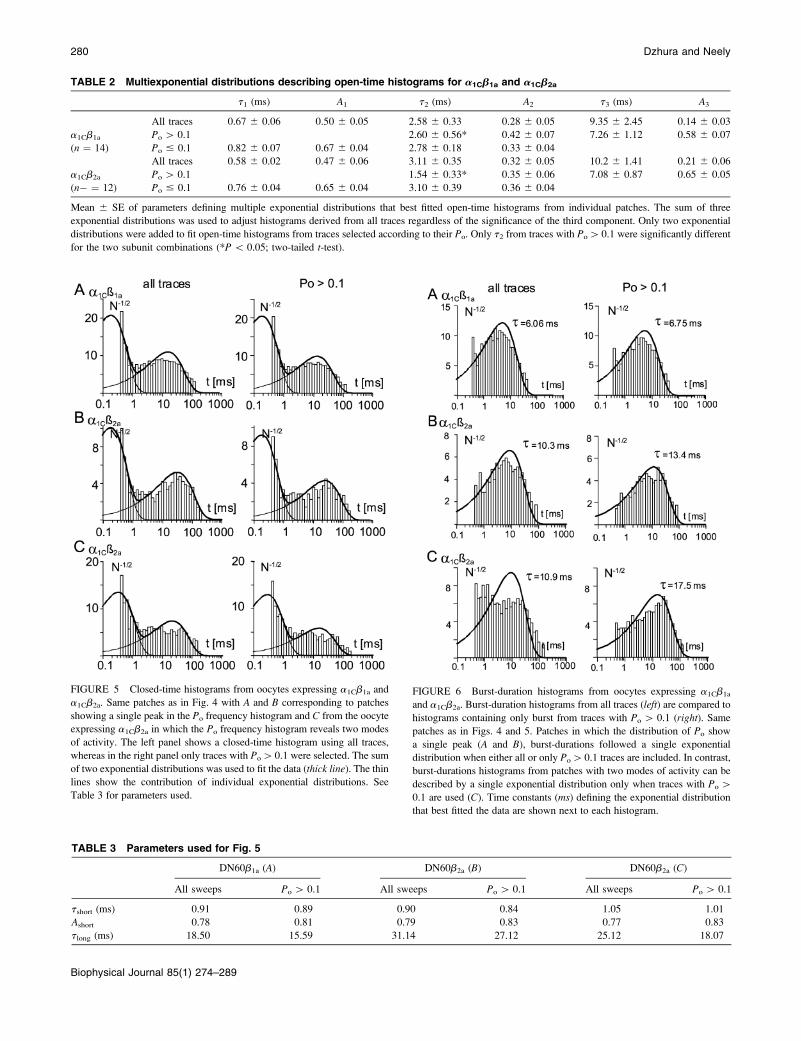
FIGURE 5 Closed-time histograms from oocytes expressing a1Cb1a and
a1Cb2a. Same patches as in Fig. 4 with A and B corresponding to patches
showing a single peak in the Po frequency histogram and C from the oocyte
expressing a1Cb2a in which the Po frequency histogram reveals two modes
of activity. The left panel shows a closed-time histogram using all traces,
whereas in the right panel only traces with Po[0.1 were selected. The sum
of two exponential distributions was used to fit the data (thick line). The thin
lines show the contribution of individual exponential distributions. See
Table 3 for parameters used.
FIGURE 6 Burst-duration histograms from oocytes expressing a1Cb1a
and a1Cb2a. Burst-duration histograms from all traces (left) are compared to
histograms containing only burst from traces with Po[ 0.1 (right). Same
patches as in Figs. 4 and 5. Patches in which the distribution of Po show
a single peak (A and B), burst-durations followed a single exponential
distribution when either all or only Po[0.1 traces are included. In contrast,
burst-durations histograms from patches with two modes of activity can be
described by a single exponential distribution only when traces with Po[
0.1 are used (C). Time constants (ms) defining the exponential distribution
that best fitted the data are shown next to each histogram.
TABLE 2 Multiexponential distributions describing open-time histograms for a1Cb1a and a1Cb2a
t1 (ms) A1 t2 (ms) A2 t3 (ms) A3
All traces 0.67 6 0.06 0.50 6 0.05 2.58 6 0.33 0.28 6 0.05 9.35 6 2.45 0.14 6 0.03
a1Cb1a Po[ 0.1 2.60 6 0.56* 0.42 6 0.07 7.26 6 1.12 0.58 6 0.07
(n ¼ 14) Po # 0.1 0.82 6 0.07 0.67 6 0.04 2.78 6 0.18 0.33 6 0.04
All traces 0.58 6 0.02 0.47 6 0.06 3.11 6 0.35 0.32 6 0.05 10.2 6 1.41 0.21 6 0.06
a1Cb2a Po[ 0.1 1.54 6 0.33* 0.35 6 0.06 7.08 6 0.87 0.65 6 0.05
(n� ¼ 12) Po # 0.1 0.76 6 0.04 0.65 6 0.04 3.10 6 0.39 0.36 6 0.04
Mean 6 SE of parameters defining multiple exponential distributions that best fitted open-time histograms from individual patches. The sum of three
exponential distributions was used to adjust histograms derived from all traces regardless of the significance of the third component. Only two exponential
distributions were added to fit open-time histograms from traces selected according to their Po. Only t2 from traces with Po[ 0.1 were significantly different
for the two subunit combinations (*P\ 0.05; two-tailed t-test).
TABLE 3 Parameters used for Fig. 5
DN60b1a (A) DN60b2a (B) DN60b2a (C)
All sweeps Po[ 0.1 All sweeps Po[ 0.1 All sweeps Po[ 0.1
tshort (ms) 0.91 0.89 0.90 0.84 1.05 1.01
Ashort 0.78 0.81 0.79 0.83 0.77 0.83
tlong (ms) 18.50 15.59 31.14 27.12 25.12 18.07
280 Dzhura and Neely
Biophysical Journal 85(1) 274–289
the observed difference in MBD. For instance, in some
patches, channel activity could arise from an a1C subunit
combined with an endogenous b-subunits (b3xo). In this case
the likelihood of recording patches with b3xo could be higher
if cRNA encoding b1a expressed less efficiently than cRNA
encodingb2a. In this scenario, a decrease inMBD could result
from an increased contribution of a1Cb3xo rather than from
functional differences between b2a and b1a. Alternatively, if
two or more b-subunits interact with the channel-forming
subunit (Tareilus et al., 1997), a1C channels coupled to
a single b may display shorter MBD and channels with
a reduced subunit complement may predominate with one of
theb-isoforms. To sort out these possibilities, we investigated
the behavior of Ca21 channels expressed in oocytes injected
with cRNA encoding a1C alone and combined with cRNA
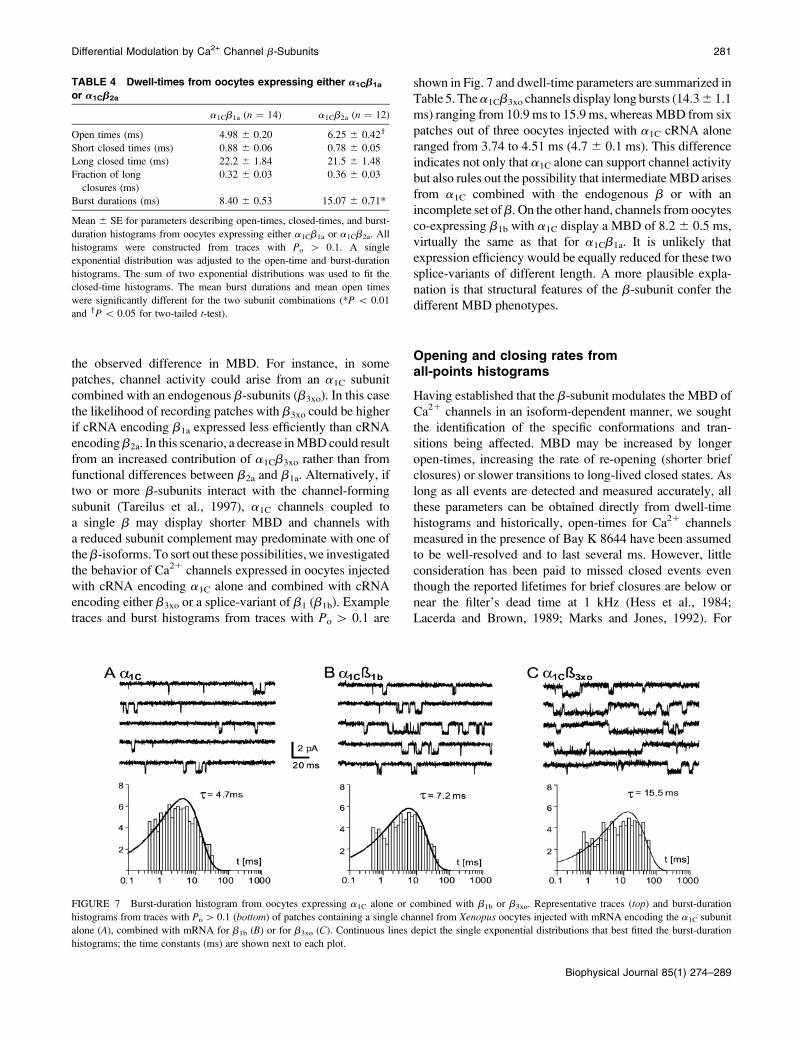
encoding either b3xo or a splice-variant of b1 (b1b). Example
traces and burst histograms from traces with Po[ 0.1 are
shown in Fig. 7 and dwell-time parameters are summarized in
Table 5. Thea1Cb3xo channels display long bursts (14.36 1.1
ms) ranging from 10.9 ms to 15.9 ms, whereas MBD from six
patches out of three oocytes injected with a1C cRNA alone
ranged from 3.74 to 4.51 ms (4.7 6 0.1 ms). This difference
indicates not only that a1C alone can support channel activity
but also rules out the possibility that intermediateMBD arises
from a1C combined with the endogenous b or with an
incomplete set ofb. On the other hand, channels from oocytes
co-expressing b1b with a1C display a MBD of 8.26 0.5 ms,
virtually the same as that for a1Cb1a. It is unlikely that
expression efficiency would be equally reduced for these two
splice-variants of different length. A more plausible expla-
nation is that structural features of the b-subunit confer the
different MBD phenotypes.
Opening and closing rates from
all-points histograms
Having established that the b-subunit modulates the MBD of
Ca21 channels in an isoform-dependent manner, we sought
the identification of the specific conformations and tran-
sitions being affected. MBD may be increased by longer
open-times, increasing the rate of re-opening (shorter brief
closures) or slower transitions to long-lived closed states. As
long as all events are detected and measured accurately, all
these parameters can be obtained directly from dwell-time
histograms and historically, open-times for Ca21 channels
measured in the presence of Bay K 8644 have been assumed
to be well-resolved and to last several ms. However, little
consideration has been paid to missed closed events even
though the reported lifetimes for brief closures are below or
near the filter’s dead time at 1 kHz (Hess et al., 1984;
Lacerda and Brown, 1989; Marks and Jones, 1992). For
FIGURE 7 Burst-duration histogram from oocytes expressing a1C alone or combined with b1b or b3xo. Representative traces (top) and burst-duration
histograms from traces with Po[ 0.1 (bottom) of patches containing a single channel from Xenopus oocytes injected with mRNA encoding the a1C subunit
alone (A), combined with mRNA for b1b (B) or for b3xo (C). Continuous lines depict the single exponential distributions that best fitted the burst-duration
histograms; the time constants (ms) are shown next to each plot.
TABLE 4 Dwell-times from oocytes expressing either a1Cb1a
or a1Cb2a
a1Cb1a (n ¼ 14) a1Cb2a (n ¼ 12)
Open times (ms) 4.98 6 0.20 6.25 6 0.42y
Short closed times (ms) 0.88 6 0.06 0.78 6 0.05
Long closed time (ms) 22.2 6 1.84 21.5 6 1.48
Fraction of long
closures (ms)
0.32 6 0.03 0.36 6 0.03
Burst durations (ms) 8.40 6 0.53 15.07 6 0.71*
Mean 6 SE for parameters describing open-times, closed-times, and burst-
duration histograms from oocytes expressing either a1Cb1a or a1Cb2a. All
histograms were constructed from traces with Po [ 0.1. A single
exponential distribution was adjusted to the open-time and burst-duration
histograms. The sum of two exponential distributions was used to fit the
closed-time histograms. The mean burst durations and mean open times
were significantly different for the two subunit combinations (*P\ 0.01
and yP\ 0.05 for two-tailed t-test).
Differential Modulation by Ca2+ Channel b-Subunits 281
Biophysical Journal 85(1) 274–289
a simple two-states model and a 50% threshold detection
algorithm, the true mean lifetime of the open state (ttrue(O))
can be calculated from the observed mean lifetime (tobs(O)),
the fraction of detected shut intervals (Fdet(S)), and the mean
lifetime of missed shut intervals (Tmiss(S)), taking into
consideration the dead time (Td) of the recording, according
to McManus and co-workers (1987):
tobsð0Þ ¼ttrueð0Þ1 ð1� FdetðSÞÞ3 TmissðSÞ
FdetðSÞ
; (4)
where
FdetðSÞ ¼ expð�Td=ttrueðSÞÞ; (5)
and
TmissðSÞ ¼ttrueðSÞ � ðttrueðSÞ � TdÞ3 exp½�Td=ttrueðSÞ�
ð1� exp½�Td=ttrueðSÞ�Þ: (6)
By reversing S andO, a similar set of equations yields ttrue(O)and ttrue(S).
Assuming Td ¼ 0.1 ms and tobs(O) and tobs(S) from
Table 4 (open-time and short closed-time respectively), we
numerically solved the complete set of equations for
a1Cb1a and a1Cb2a. As expected, two sets of solutions
were obtained for each subunit combination; for a1Cb1a,
ttrue(O) and ttrue(S) can take the values of 4.10 ms and 0.66
ms or 0.039 ms and 0.023 ms, respectively, whereas
a1Cb2a, 5.07 ms and 0.57 ms, or 0.041 ms and 0.022 ms,
constitute solutions for ttrue(O) and ttrue(S), respectively. To
determine which of the two possible solutions is a better
approximation of ttrue(O) and ttrue(S), we used the dis-
tribution of current amplitudes within a burst of openings
(APDF) to obtain a detection-independent estimate of the
channel opening and closing rate (Pietrobon et al., 1989;
Prodhom et al., 1989; Villarroel et al., 1988; Yellen,
1984). Here, to simplify the analysis we neglected the
contributions from transitions at the beginning and end of
bursts and constructed all-points histograms from whole
traces with Po[ 0.1 (see Methods). One of the advantages
of this approach is that information on baseline noise can
be extracted from the same histogram. Fig. 8 compares
APDF from two patches expressing a1Cb1a and a1Cb2a,
chosen for having the same baseline noise and open-
channel current amplitudes, and shows that they are nearly
identical. This match suggests that opening and closing
rates for both subunit combinations are the same. To
extract opening and closing rates from APDF, we
systematically varied kO and kC and found that when the
ratio kO/kC was kept at 10 and kO [ 10,000 s�1, A(x) fit
the experimental APDF extremely well. The thick line in
Fig. 8 C corresponds to A(x) when kO ¼ 25,000 s�1 and kC¼ 2500 s�1. This indicates that ttrue(S) and ttrue(O) are near
10-fold shorter than predicted by dwell-time histograms,
and also that the Po within bursts is close to 0.9. The latter
would also be consistent with the slowest solution of
ttrue(S) and ttrue(O) for a1Cb2a (kO ¼ 1762 s�1 and kC ¼197 s�1 ), but A(x) is visibly sharper than the data (thin
line in Fig. 8 C). On the other hand, the fast solution ( kO¼ 43,478 s�1 and kC ¼ 25,651 s�1) yields a rather wide
and symmetrical A(x) that reaches a maximum near
a normalized amplitude of 0.6 that is inconsistent with
the expected Po within bursts (not shown). From these
comparisons, it would appear, then, that ttrue(S) and ttrue(O)are near 10-fold shorter than predicted by dwell-time
histograms, and cannot be corrected for by the equations
proposed for a two-states model.
Modeling and simulations
To further evaluate whether opening and closing rates were
as fast as suggested by the APDF, we studied the behavior of
one of the simplest model, that gives rise to bursts of
openings: a sequence of three states with a final opening
where a series of fast transitions between C1 and O are
terminated by a transition to a long-lived closed state (C2).
C2 k�1
C1 !kO
kC
O: (7)
In this case, the MBD depends on the rate connecting C1 to
C2 (k�1) and the relative time spent on C1 according to the
following equation (Colquhoun and Hawkes, 1981):
MBD ¼1
kC11
kO
k�1
� �
1kO
k�1
1
kO 1 k�1
� �
: (8)
Assuming kO ¼ 25,000 s�1 and kC ¼ 2500 s�1, as in the
TABLE 5 Dwell-times from oocytes expressing a1C, a1Cb3XO or a1Cb1b
a1C (n ¼ 6) a1Cb1b (n ¼ 5) a1Cb3xo (n ¼ 5)
Open times (ms) 2.85 6 0.25 4.48 6 0.59* 6.48 6 0.63*
Short closed times (ms) 0.87 6 0.13 0.86 6 0.11 0.80 6 0.03
Long closed times (ms) 18.7 6 1.59 25.4 6 3.89 22.5 6 1.52
Fraction of long closures 0.61 6 0.04 0.43 6 0.05* 0.42 6 0.03*
Burst durations (ms) 4.67 6 0.12 8.19 6 0.45* 14.31 6 1.07*
Mean6SE for parameters describing open-times, closed-times, and burst-durations histograms fromoocytes expressinga1C,a1Cb1b, ora1Cb3xo. All histograms
were constructed from traces with Po[0.1. A single exponential distribution was adjusted to the open-time and burst-durations histograms and the sum of two
exponential distributions was used to fit the closed-time histograms.With the two b-subunits, mean burst durations, open times, and the fraction of long closures
were significantly different from data obtained from oocytes injected with a1C-mRNA injected by itself (*P\0.01 for a two-tailed t-test).
282 Dzhura and Neely
Biophysical Journal 85(1) 274–289
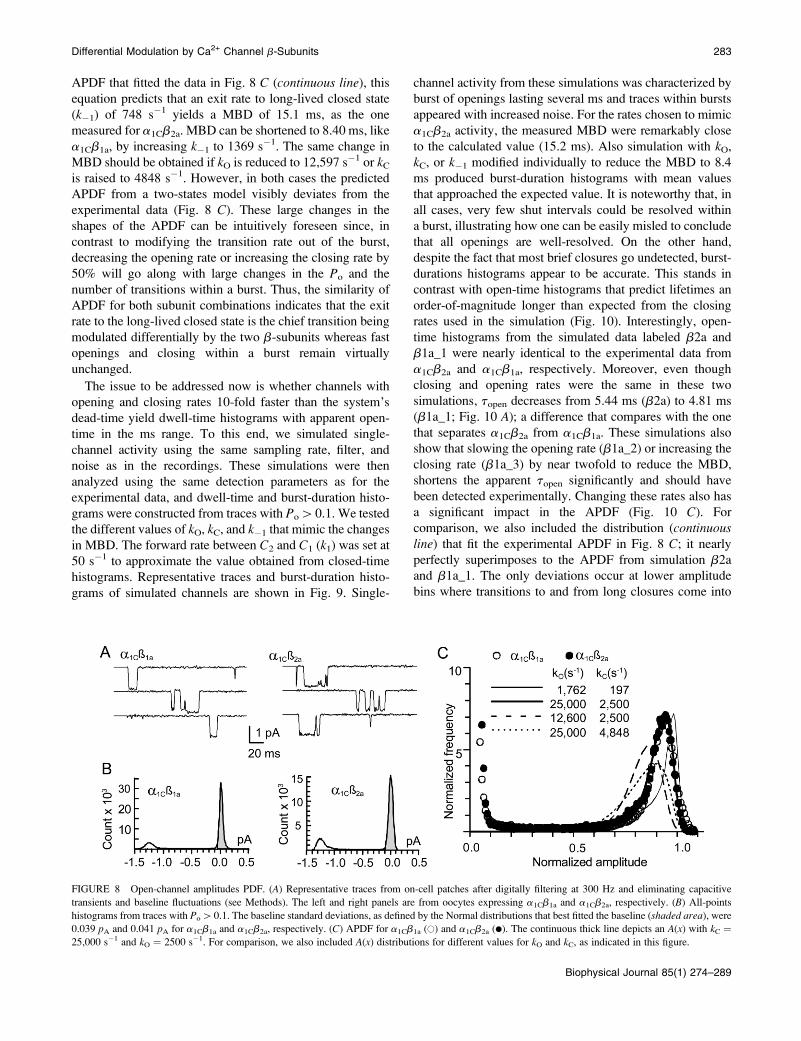
APDF that fitted the data in Fig. 8 C (continuous line), this
equation predicts that an exit rate to long-lived closed state
(k�1) of 748 s�1 yields a MBD of 15.1 ms, as the one
measured for a1Cb2a. MBD can be shortened to 8.40 ms, like
a1Cb1a, by increasing k�1 to 1369 s�1. The same change in
MBD should be obtained if kO is reduced to 12,597 s�1 or kCis raised to 4848 s�1. However, in both cases the predicted
APDF from a two-states model visibly deviates from the
experimental data (Fig. 8 C). These large changes in the
shapes of the APDF can be intuitively foreseen since, in
contrast to modifying the transition rate out of the burst,
decreasing the opening rate or increasing the closing rate by
50% will go along with large changes in the Po and the
number of transitions within a burst. Thus, the similarity of
APDF for both subunit combinations indicates that the exit
rate to the long-lived closed state is the chief transition being
modulated differentially by the two b-subunits whereas fast
openings and closing within a burst remain virtually
unchanged.
The issue to be addressed now is whether channels with
opening and closing rates 10-fold faster than the system’s
dead-time yield dwell-time histograms with apparent open-
time in the ms range. To this end, we simulated single-
channel activity using the same sampling rate, filter, and
noise as in the recordings. These simulations were then
analyzed using the same detection parameters as for the
experimental data, and dwell-time and burst-duration histo-
grams were constructed from traces with Po[0.1. We tested
the different values of kO, kC, and k�1 that mimic the changes
in MBD. The forward rate between C2 and C1 (k1) was set at
50 s�1 to approximate the value obtained from closed-time
histograms. Representative traces and burst-duration histo-
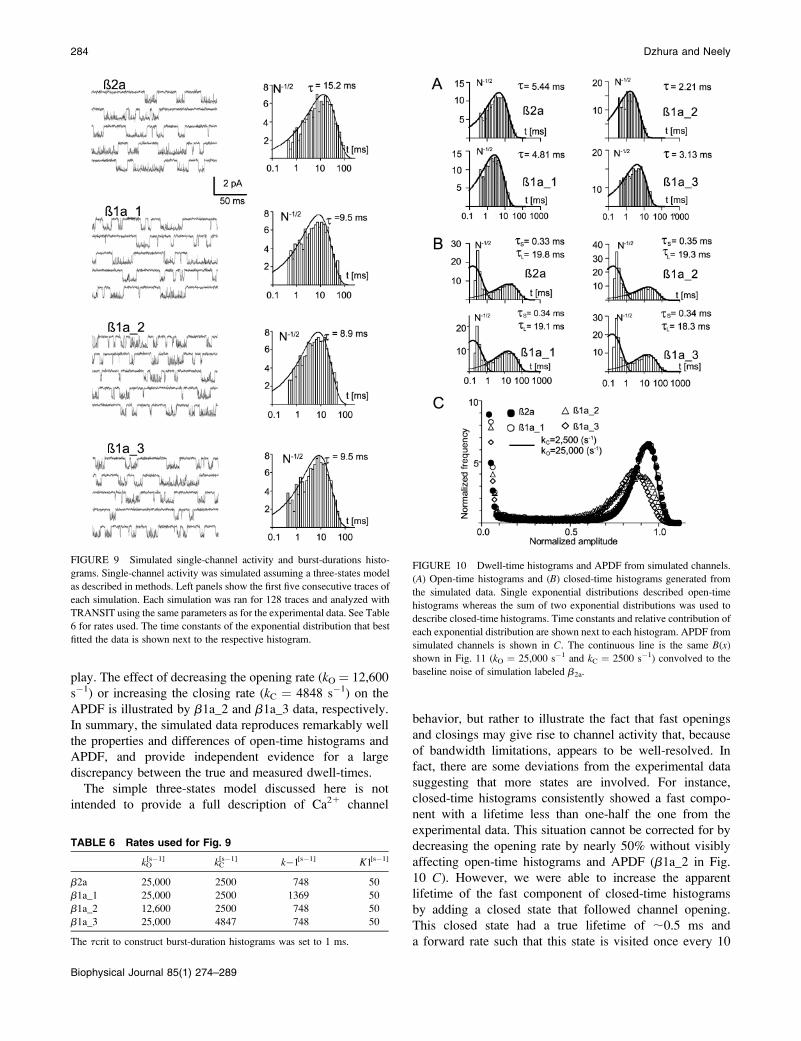
grams of simulated channels are shown in Fig. 9. Single-
channel activity from these simulations was characterized by
burst of openings lasting several ms and traces within bursts
appeared with increased noise. For the rates chosen to mimic
a1Cb2a activity, the measured MBD were remarkably close
to the calculated value (15.2 ms). Also simulation with kO,
kC, or k�1 modified individually to reduce the MBD to 8.4
ms produced burst-duration histograms with mean values
that approached the expected value. It is noteworthy that, in
all cases, very few shut intervals could be resolved within
a burst, illustrating how one can be easily misled to conclude
that all openings are well-resolved. On the other hand,
despite the fact that most brief closures go undetected, burst-
durations histograms appear to be accurate. This stands in
contrast with open-time histograms that predict lifetimes an
order-of-magnitude longer than expected from the closing
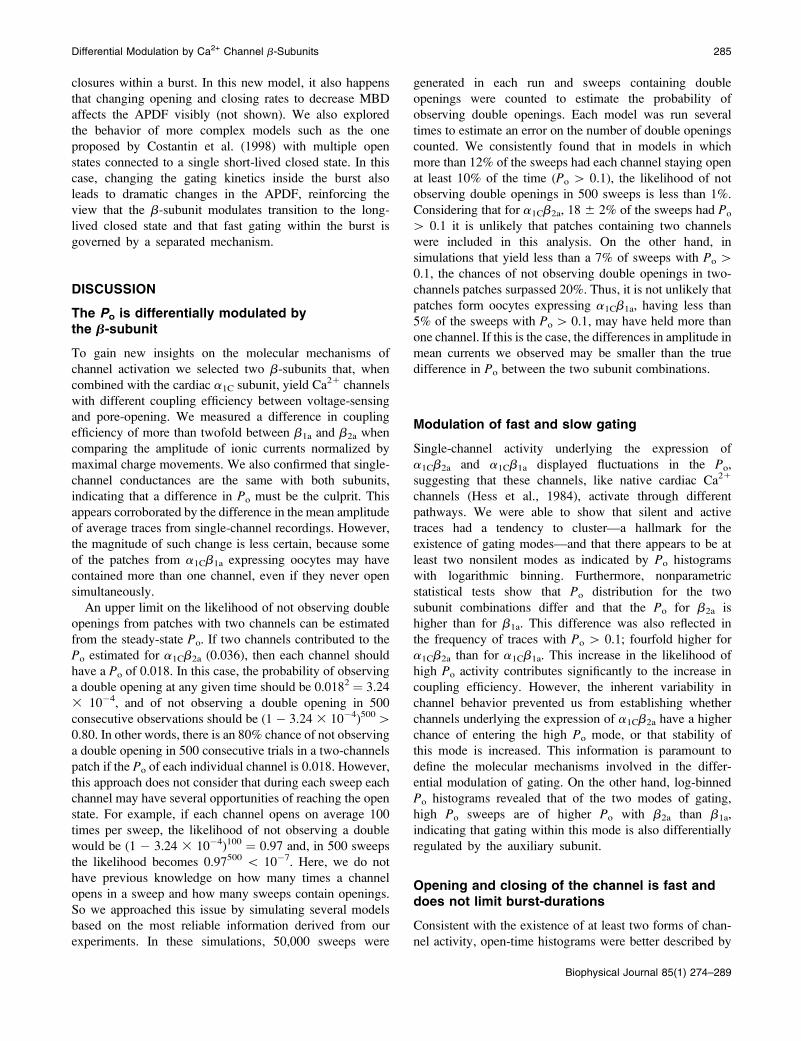
rates used in the simulation (Fig. 10). Interestingly, open-
time histograms from the simulated data labeled b2a and
b1a_1 were nearly identical to the experimental data from
a1Cb2a and a1Cb1a, respectively. Moreover, even though
closing and opening rates were the same in these two
simulations, topen decreases from 5.44 ms (b2a) to 4.81 ms
(b1a_1; Fig. 10 A); a difference that compares with the one
that separates a1Cb2a from a1Cb1a. These simulations also
show that slowing the opening rate (b1a_2) or increasing the
closing rate (b1a_3) by near twofold to reduce the MBD,
shortens the apparent topen significantly and should have
been detected experimentally. Changing these rates also has
a significant impact in the APDF (Fig. 10 C). For
comparison, we also included the distribution (continuous
line) that fit the experimental APDF in Fig. 8 C; it nearly
perfectly superimposes to the APDF from simulation b2a
and b1a_1. The only deviations occur at lower amplitude
bins where transitions to and from long closures come into
FIGURE 8 Open-channel amplitudes PDF. (A) Representative traces from on-cell patches after digitally filtering at 300 Hz and eliminating capacitive
transients and baseline fluctuations (see Methods). The left and right panels are from oocytes expressing a1Cb1a and a1Cb2a, respectively. (B) All-points
histograms from traces with Po[0.1. The baseline standard deviations, as defined by the Normal distributions that best fitted the baseline (shaded area), were
0.039 pA and 0.041 pA for a1Cb1a and a1Cb2a, respectively. (C) APDF for a1Cb1a (�) and a1Cb2a (d). The continuous thick line depicts an A(x) with kC ¼
25,000 s�1 and kO ¼ 2500 s�1. For comparison, we also included A(x) distributions for different values for kO and kC, as indicated in this figure.
Differential Modulation by Ca2+ Channel b-Subunits 283
Biophysical Journal 85(1) 274–289
play. The effect of decreasing the opening rate (kO ¼ 12,600
s�1) or increasing the closing rate (kC ¼ 4848 s�1) on the
APDF is illustrated by b1a_2 and b1a_3 data, respectively.
In summary, the simulated data reproduces remarkably well
the properties and differences of open-time histograms and
APDF, and provide independent evidence for a large
discrepancy between the true and measured dwell-times.
The simple three-states model discussed here is not
intended to provide a full description of Ca21 channel
behavior, but rather to illustrate the fact that fast openings
and closings may give rise to channel activity that, because
of bandwidth limitations, appears to be well-resolved. In
fact, there are some deviations from the experimental data
suggesting that more states are involved. For instance,
closed-time histograms consistently showed a fast compo-
nent with a lifetime less than one-half the one from the
experimental data. This situation cannot be corrected for by
decreasing the opening rate by nearly 50% without visibly
affecting open-time histograms and APDF (b1a_2 in Fig.
10 C). However, we were able to increase the apparent
lifetime of the fast component of closed-time histograms
by adding a closed state that followed channel opening.
This closed state had a true lifetime of ;0.5 ms and
a forward rate such that this state is visited once every 10
FIGURE 9 Simulated single-channel activity and burst-durations histo-
grams. Single-channel activity was simulated assuming a three-states model
as described in methods. Left panels show the first five consecutive traces of
each simulation. Each simulation was ran for 128 traces and analyzed with
TRANSIT using the same parameters as for the experimental data. See Table
6 for rates used. The time constants of the exponential distribution that best
fitted the data is shown next to the respective histogram.
FIGURE 10 Dwell-time histograms and APDF from simulated channels.
(A) Open-time histograms and (B) closed-time histograms generated from
the simulated data. Single exponential distributions described open-time
histograms whereas the sum of two exponential distributions was used to
describe closed-time histograms. Time constants and relative contribution of
each exponential distribution are shown next to each histogram. APDF from
simulated channels is shown in C. The continuous line is the same B(x)
shown in Fig. 11 (kO ¼ 25,000 s�1 and kC ¼ 2500 s�1) convolved to the
baseline noise of simulation labeled b2a.
TABLE 6 Rates used for Fig. 9
kO[s�1] kC
[s�1] k�1[s�1] K1[s�1]
b2a 25,000 2500 748 50
b1a_1 25,000 2500 1369 50
b1a_2 12,600 2500 748 50
b1a_3 25,000 4847 748 50
The tcrit to construct burst-duration histograms was set to 1 ms.
284 Dzhura and Neely
Biophysical Journal 85(1) 274–289
closures within a burst. In this new model, it also happens
that changing opening and closing rates to decrease MBD
affects the APDF visibly (not shown). We also explored
the behavior of more complex models such as the one
proposed by Costantin et al. (1998) with multiple open
states connected to a single short-lived closed state. In this
case, changing the gating kinetics inside the burst also
leads to dramatic changes in the APDF, reinforcing the
view that the b-subunit modulates transition to the long-
lived closed state and that fast gating within the burst is
governed by a separated mechanism.
DISCUSSION
The Po is differentially modulated by
the b-subunit
To gain new insights on the molecular mechanisms of
channel activation we selected two b-subunits that, when
combined with the cardiac a1C subunit, yield Ca21 channels
with different coupling efficiency between voltage-sensing
and pore-opening. We measured a difference in coupling
efficiency of more than twofold between b1a and b2a when
comparing the amplitude of ionic currents normalized by
maximal charge movements. We also confirmed that single-
channel conductances are the same with both subunits,
indicating that a difference in Po must be the culprit. This
appears corroborated by the difference in the mean amplitude
of average traces from single-channel recordings. However,
the magnitude of such change is less certain, because some
of the patches from a1Cb1a expressing oocytes may have
contained more than one channel, even if they never open
simultaneously.
An upper limit on the likelihood of not observing double
openings from patches with two channels can be estimated
from the steady-state Po. If two channels contributed to the
Po estimated for a1Cb2a (0.036), then each channel should
have a Po of 0.018. In this case, the probability of observing
a double opening at any given time should be 0.0182 ¼ 3.24
3 10�4, and of not observing a double opening in 500
consecutive observations should be (1 � 3.24 3 10�4)500[
0.80. In other words, there is an 80% chance of not observing
a double opening in 500 consecutive trials in a two-channels
patch if the Po of each individual channel is 0.018. However,
this approach does not consider that during each sweep each
channel may have several opportunities of reaching the open
state. For example, if each channel opens on average 100
times per sweep, the likelihood of not observing a double
would be (1 � 3.24 3 10�4)100 ¼ 0.97 and, in 500 sweeps
the likelihood becomes 0.97500 \ 10�7. Here, we do not
have previous knowledge on how many times a channel
opens in a sweep and how many sweeps contain openings.
So we approached this issue by simulating several models
based on the most reliable information derived from our
experiments. In these simulations, 50,000 sweeps were
generated in each run and sweeps containing double
openings were counted to estimate the probability of
observing double openings. Each model was run several
times to estimate an error on the number of double openings
counted. We consistently found that in models in which
more than 12% of the sweeps had each channel staying open
at least 10% of the time (Po[ 0.1), the likelihood of not
observing double openings in 500 sweeps is less than 1%.
Considering that for a1Cb2a, 18 6 2% of the sweeps had Po
[ 0.1 it is unlikely that patches containing two channels
were included in this analysis. On the other hand, in
simulations that yield less than a 7% of sweeps with Po[
0.1, the chances of not observing double openings in two-
channels patches surpassed 20%. Thus, it is not unlikely that
patches form oocytes expressing a1Cb1a, having less than
5% of the sweeps with Po[ 0.1, may have held more than
one channel. If this is the case, the differences in amplitude in
mean currents we observed may be smaller than the true
difference in Po between the two subunit combinations.
Modulation of fast and slow gating
Single-channel activity underlying the expression of
a1Cb2a and a1Cb1a displayed fluctuations in the Po,
suggesting that these channels, like native cardiac Ca21
channels (Hess et al., 1984), activate through different
pathways. We were able to show that silent and active
traces had a tendency to cluster—a hallmark for the
existence of gating modes—and that there appears to be at
least two nonsilent modes as indicated by Po histograms
with logarithmic binning. Furthermore, nonparametric
statistical tests show that Po distribution for the two
subunit combinations differ and that the Po for b2a is
higher than for b1a. This difference was also reflected in
the frequency of traces with Po[ 0.1; fourfold higher for
a1Cb2a than for a1Cb1a. This increase in the likelihood of
high Po activity contributes significantly to the increase in
coupling efficiency. However, the inherent variability in
channel behavior prevented us from establishing whether
channels underlying the expression of a1Cb2a have a higher
chance of entering the high Po mode, or that stability of
this mode is increased. This information is paramount to
define the molecular mechanisms involved in the differ-
ential modulation of gating. On the other hand, log-binned
Po histograms revealed that of the two modes of gating,
high Po sweeps are of higher Po with b2a than b1a,
indicating that gating within this mode is also differentially
regulated by the auxiliary subunit.
Opening and closing of the channel is fast and
does not limit burst-durations
Consistent with the existence of at least two forms of chan-
nel activity, open-time histograms were better described by
Differential Modulation by Ca2+ Channel b-Subunits 285
Biophysical Journal 85(1) 274–289
several exponential components. We were able to partially
isolate the component with the largest time constant by
building open-time histograms from traces with Po[0.1 and
fitting a single exponential distribution. Mean open-times
measured in this manner were only slightly different for each
subunit combinations. In contrast, MBDs were near twice as
long for a1Cb2a than for a1Cb1a channels. If this increase
reflects changes in the energy landscape of the final transition
to the open state, differences in closing or opening rates
should have been observed. Dwell-time histograms failed to
reveal any changes in the rate of channel opening and the
difference in mean open-times is insufficient to account for
the increase in MBD. However, the combined effect of noise,
filtering, and missed events was likely to have a significant
impact on dwell-time histograms.
As a first approximation we applied the equations
developed by McManus and co-workers (1987) to estimate
true values for mean open-time and mean closed-time and
found two possible solutions about an order-of-magnitude
apart from each other. The simplest approach to determine
which solutions correspond to the true mean dwell-time
would have been to take recordings filtered at 5 or 10 kHz,
but noise levels would make event detection virtually
impossible. Algorithms capable of obtaining rate constants
from noisy traces (Qin et al., 1996) were also of little help
since they are model-dependent and unable to handle
voltage-dependent channels displaying heterogeneous kinet-
ics. Reasoning that the two possible solutions for the true
mean dwell-times yield clearly different APDF, we com-
pared them with the experimental data and found that neither
of them was adequate. However, we did discover that the
experimental APDF could be reproduced assuming opening
and closing rates of 25,000 s�1 and 2500 s�1, respectively.
Simulated channels with these rates also reproduced quite
well open-time and burst-duration histograms, indicating that
opening and closing rates are an order-of-magnitude faster
than previously thought. More importantly, the APDF for
a1Cb1a and a1Cb2a are virtually identical, whereas changes in
opening and closing rates sufficient to halve MBD result in
clear differences in APDF. Together, these findings allow us
to conclude that the exit rate to long-lived closed state is
differentially modulated by the twob-subunits while opening
and closing rates remain unchanged and consequently,
structures controlling fast transitions in and out of the open
state(s) are different from those limiting burst-durations.
Multiple gates controls channel opening
The idea that more that one structure can close voltage-
dependent channels is not without precedent. Among the
best-characterized examples are inactivation by the N-ter-
minus of some K1 channels (Hoshi et al., 1990), the III–IV
domain linker of Na1 channels (Patton et al., 1992), and the
C-terminus of Ca21 channel (de Leon et al., 1995).
Structures in the pore of K1 channels also have been shown
to influence C-type inactivation (Lopez-Barneo et al., 1993).
Here, the inactivation gate is unlikely to contribute to the
observed differences in MBD, since voltage-dependent
inactivation in Cav1.2 occurs in seconds (Neely et al.,
1994). We cannot completely rule out yet that steady-state
inactivation at the holding potential (�80 mV) may differ
between a1Cb1a and a1Cb2a, and contribute to changes in the
number of nulls sweeps.
In addition to structures involved in long-lived non-
conducting states, the pore region of the channel may also
influence the lifetime of the open state. For example, K1
channels with identical voltage sensors and divergent pore
structures have mean open-time that differ by more than
threefold (Kirsch et al., 1992). On the other hand, a construct
of the Shaker K1 channel that can be locked in the open
conformation (Holmgren et al., 1997) can still display brief
shut intervals at the single-channel level (Holmgren,
personal communication). Interestingly, a detailed analysis
of deactivation kinetic in Shaker channel suggests that this
‘‘pore-gate’’ give rise to conductance sublevels with
a lifetime of few ms (Zheng et al., 2001). In light of these
results it is plausible that in Ca21 channels, brief shut
intervals of ;40 ms may arise from the activity of a pore-
gate. It is also reasonable to assume that this pore-gate
involves structures in the outer vestibule of the channel and
does not sense the presence of the b-subunit, as indicated by
the virtual identity of the APDF for both subunit combi-
nations.
Differential modulation of the MBD partially
account for the increase in Po
We have established that the MBD for a1Cb1a is shorter than
for a1Cb2a but we have not discussed to what extent this
phenomenon contributes to the difference in Powe observed.
Since opening and closing rates do not appear to be dif-
ferentially modulated, the change in MBD reflects changes
in the exit rate to long-lived closed states (k�1). The im-
pact that these changes will have on the channel Po will
depend mostly on the number of openings per burst. As the
number of openings in a burst decreases, larger increases
in k�1 will be needed to shorten the burst duration. As
a consequence, the equilibrium will be shifted toward C2 and
the channel will wander among long-closed states several
times before initiating a burst. This will produce a dramatic
decrease in the Po. In short, decreases in the MBD will be
accompanied by large changes in Po. In fact, the changes in
Po will increase asymptotically as the number of opening per
bursts approaches to �1� (Fig. 11), suggesting that changes in
k�1 may be responsible for all the changes we observed. For
example, if kO ¼ 1762 s�1 and kC ¼ 192 s�1, as we may
derive from dwell-time histograms, a MBD of 8.40 ms is
obtained with k�1 ¼ 2991 s�1. These values yield 1.6
openings per burst. Reducing k�1 to 998 s�1 augments the
MBD to 15.1 ms and the number of openings per burst to
286 Dzhura and Neely
Biophysical Journal 85(1) 274–289
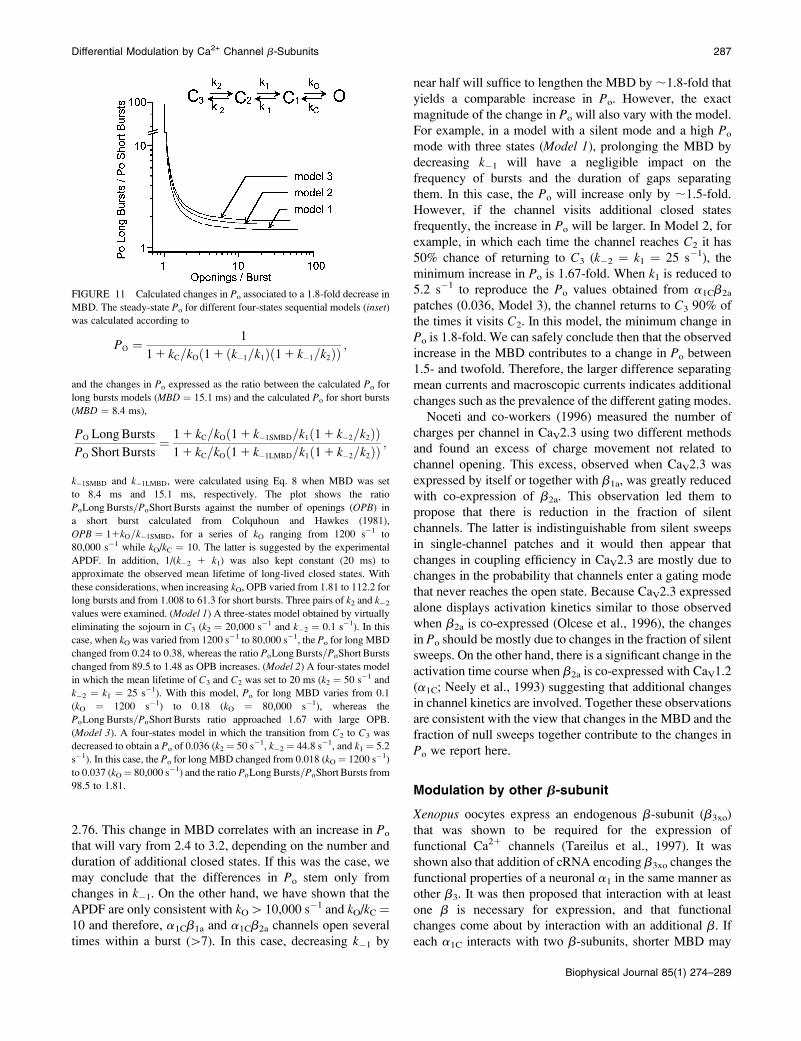
2.76. This change in MBD correlates with an increase in Po
that will vary from 2.4 to 3.2, depending on the number and
duration of additional closed states. If this was the case, we
may conclude that the differences in Po stem only from
changes in k�1. On the other hand, we have shown that the
APDF are only consistent with kO[10,000 s�1 and kO/kC¼10 and therefore, a1Cb1a and a1Cb2a channels open several
times within a burst ([7). In this case, decreasing k�1 by
near half will suffice to lengthen the MBD by;1.8-fold that
yields a comparable increase in Po. However, the exact
magnitude of the change in Po will also vary with the model.
For example, in a model with a silent mode and a high Po
mode with three states (Model 1), prolonging the MBD by
decreasing k�1 will have a negligible impact on the
frequency of bursts and the duration of gaps separating
them. In this case, the Po will increase only by ;1.5-fold.
However, if the channel visits additional closed states
frequently, the increase in Po will be larger. In Model 2, for
example, in which each time the channel reaches C2 it has
50% chance of returning to C3 (k�2 ¼ k1 ¼ 25 s�1), the
minimum increase in Po is 1.67-fold. When k1 is reduced to
5.2 s�1 to reproduce the Po values obtained from a1Cb2a
patches (0.036, Model 3), the channel returns to C3 90% of
the times it visits C2. In this model, the minimum change in
Po is 1.8-fold. We can safely conclude then that the observed
increase in the MBD contributes to a change in Po between
1.5- and twofold. Therefore, the larger difference separating
mean currents and macroscopic currents indicates additional
changes such as the prevalence of the different gating modes.
Noceti and co-workers (1996) measured the number of
charges per channel in CaV2.3 using two different methods
and found an excess of charge movement not related to
channel opening. This excess, observed when CaV2.3 was
expressed by itself or together with b1a, was greatly reduced
with co-expression of b2a. This observation led them to
propose that there is reduction in the fraction of silent
channels. The latter is indistinguishable from silent sweeps
in single-channel patches and it would then appear that
changes in coupling efficiency in CaV2.3 are mostly due to
changes in the probability that channels enter a gating mode
that never reaches the open state. Because CaV2.3 expressed
alone displays activation kinetics similar to those observed
when b2a is co-expressed (Olcese et al., 1996), the changes
in Po should be mostly due to changes in the fraction of silent
sweeps. On the other hand, there is a significant change in the
activation time course when b2a is co-expressed with CaV1.2
(a1C; Neely et al., 1993) suggesting that additional changes
in channel kinetics are involved. Together these observations
are consistent with the view that changes in the MBD and the
fraction of null sweeps together contribute to the changes in
Po we report here.
Modulation by other b-subunit
Xenopus oocytes express an endogenous b-subunit (b3xo)
that was shown to be required for the expression of
functional Ca21 channels (Tareilus et al., 1997). It was
shown also that addition of cRNA encoding b3xo changes the
functional properties of a neuronal a1 in the same manner as
other b3. It was then proposed that interaction with at least
one b is necessary for expression, and that functional
changes come about by interaction with an additional b. If
each a1C interacts with two b-subunits, shorter MBD may
FIGURE 11 Calculated changes in Po associated to a 1.8-fold decrease in
MBD. The steady-state Po for different four-states sequential models (inset)
was calculated according to
PO ¼1
11 kC=kOð11 ðk�1=k1Þð11 k�1=k2ÞÞ;
and the changes in Po expressed as the ratio between the calculated Po for
long bursts models (MBD ¼ 15.1 ms) and the calculated Po for short bursts
(MBD ¼ 8.4 ms),
PO LongBursts
PO Short Bursts¼
11 kC=kOð11 k�1SMBD=k1ð11 k�2=k2ÞÞ
11 kC=kOð11 k�1LMBD=k1ð11 k�2=k2ÞÞ;
k�1SMBD and k�1LMBD, were calculated using Eq. 8 when MBD was set
to 8.4 ms and 15.1 ms, respectively. The plot shows the ratio
PoLongBursts=PoShort Bursts against the number of openings (OPB) in
a short burst calculated from Colquhoun and Hawkes (1981),
OPB ¼ 11kO=k�1SMBD, for a series of kO ranging from 1200 s�1 to
80,000 s�1 while kO/kC ¼ 10. The latter is suggested by the experimental
APDF. In addition, 1/(k�2 1 k1) was also kept constant (20 ms) to
approximate the observed mean lifetime of long-lived closed states. With
these considerations, when increasing kO, OPB varied from 1.81 to 112.2 for
long bursts and from 1.008 to 61.3 for short bursts. Three pairs of k2 and k�2values were examined. (Model 1) A three-states model obtained by virtually
eliminating the sojourn in C3 (k2 ¼ 20,000 s�1 and k�2 ¼ 0.1 s�1). In this
case, when kO was varied from 1200 s�1 to 80,000 s�1, the Po for long MBD
changed from 0.24 to 0.38, whereas the ratio PoLongBursts=PoShort Bursts
changed from 89.5 to 1.48 as OPB increases. (Model 2) A four-states model
in which the mean lifetime of C3 and C2 was set to 20 ms (k2 ¼ 50 s�1 and
k�2 ¼ k1 ¼ 25 s�1). With this model, Po for long MBD varies from 0.1
(kO ¼ 1200 s�1) to 0.18 (kO ¼ 80,000 s�1), whereas the
PoLongBursts=PoShort Bursts ratio approached 1.67 with large OPB.
(Model 3). A four-states model in which the transition from C2 to C3 was
decreased to obtain a Po of 0.036 (k2¼ 50 s�1, k�2¼ 44.8 s�1, and k1 ¼ 5.2
s�1). In this case, the Po for long MBD changed from 0.018 (kO¼ 1200 s�1)
to 0.037 (kO¼ 80,000 s�1) and the ratio PoLongBursts=PoShort Bursts from
98.5 to 1.81.
Differential Modulation by Ca2+ Channel b-Subunits 287
Biophysical Journal 85(1) 274–289
arise from channels with an incomplete complement of b.
This hypothesis is ruled out here by the observation that
oocytes injected with a1C cRNA by itself yield channels with
MBD duration shorter than when co-injected with b1a
cRNA, and because addition of b3xo cRNA yield channels
with MBD longer than for a1Cb1a. Furthermore, the splice-
variant b1b of b1a that comes from the same species as a1C
yields channels with similar MBD. These findings also show
that the structures conferring the long MBD phenotype are
shared between b2a from rabbit and b3 from Xenopus,
whereas the ones for the short MBD phenotype are shared by
b1a and b1b. We are currently investigating chimeras
between different isoforms of the b-subunit to identify the
structures associated with these phenotypes that will
ultimately also help in identifying the molecular determi-
nants regulating channel gating.
We thank C.J. Lingle, D. Naranjo and A. Zahradnikova for their insightful
comments on the manuscript and S.J. Jones for kindly providing the source
code of the software to perform convolution of the beta and Gaussian
distributions.
This work was supported by grants from the National Institutes of Health
(GM-53196) and the Fondo Nacional de Ciencia y Technologıa (1991016)
to A.N.
REFERENCES
Bancroft, T. A., and C.-P. Han. 1981. Statistical Theory and Inference inResearch. Marcek Dekker, New York.
Bichet, D., V. Cornet, S. Geib, E. Carlier, S. Volsen, T. Hoshi, Y. Mori, andM. De Waard. 2000. The I–II loop of the Ca21 channel a1 subunitcontains an endoplasmic reticulum retention signal antagonized by theb-subunit. Neuron. 25:177–190.
Birnbaumer, L., N. Qin, R. Olcese, E. Tareilus, D. Platano, J. Costantin,and E. Stefani. 1998. Structures and functions of calcium channelb-subunits. J. Bioenerg. Biomembr. 30:357–375.
Brice, N. L., N. S. Berrow, V. Campbell, K. M. Page, K. Brickley, I.Tedder, and A. C. Dolphin. 1997. Importance of the differentb-subunitsin the membrane expression of the a1A and a2 calcium channel subunits:studies using a depolarization-sensitive a1A antibody. Eur. J. Neurosci.9:749–759.
Cavalie, A., D. Pelzer, and W. Trautwein. 1986. Fast and slow gatingbehavior of single calcium channel current in cardiac cells. PflugersArch. 406:241–248.
Chien, A. J., X. L. Zhao, R. E. Shirokov, T. S. Puri, C. F. Chang, D. Sun,E. Rios, and M. M. Hosey. 1995. Roles of a membrane-localizedb-subunit in the formation and targeting of functional L-type Ca21
channels. J. Biol. Chem. 270:30036–30044.
Colquhoun, D., and B. Sakmann. 1985. Fast events in single-channelcurrents activated by acetylcholine and its analogues at the frog muscleend-plate. J. Physiol. 369:501–557.
Colquhoun, D., and A. G. Hawkes. 1981. On the stochastic properties ofsingle ion channels. Proc. R. Soc. Lond. B Biol. Sci. 211:205–235.
Costantin, J., F. Noceti, N. Qin, X. Wei, L. Birnbaumer, and E. Stefani.1998. Facilitation by the b2a-subunit of pore openings in cardiac Ca21
channels. J. Physiol. 507:93–103.
de Leon, M., Y. Wang, L. Jones, E. Perez-Reyes, X. Wei, T. W. Soong,T. P. Snutch, and D. T. Yue. 1995. Essential Ca21-binding motif forCa21-sensitive inactivation of L-type Ca21 channels. Science. 270:1502–1506.
Fitzhugh, R. 1983. Statistical properties of the asymmetric randomtelegraph signal, with applications to single channel analysis. Math.Biosci. 64:75–89.
Hess, P., J. B. Lansman, and R. W. Tsien. 1984. Different modes of Ca21
channel gating behaviour favored by dihydropyridine Ca21 agonists andantagonists. Nature. 311:538–544.
Holmgren, M., P. L. Smith, and G. Yellen. 1997. Trapping of organicblockers by closing of voltage-dependent K1 channels: evidence fora trap door mechanism of activation gating. J. Gen. Physiol. 109:527–535.
Horn, R., C. A. Vandenberg, and K. Lange. 1984. Statistical analysis ofsingle sodium channels. Effects of n-bromoacetamide. Biophys. J. 45:323–335.
Hoshi, T., W. N. Zagotta, and R. W. Aldrich. 1990. Biophysical andmolecular mechanisms of Shaker potassium channel inactivation.Science. 250:533–538.
Kirsch, G. E., J. A. Drewe, M. Taglialatela, R. H. Joho, M. DeBiasi, H. A.Hartmann, and A. M. Brown. 1992. A single nonpolar residue in thedeep pore of related K1 channels acts as a K1:Rb1 conductance switch.Biophys. J. 62:136–143.
Lacerda, A. E., and A. M. Brown. 1989. Nonmodal gating of cardiaccalcium channels as revealed by dihydropyridines. J. Gen. Physiol. 93:1243–1273.
Lopez-Barneo, J., T. Hoshi, S. H. Heinemann, and R. Aldrich. 1993.Effects of external cations and mutations in the pore region on C-typeinactivation of Shaker potassium channels. Receptors Channels. 1:61–71.
Marks, T. N., and S. W. Jones. 1992. Calcium currents in the A7r5 smoothmuscle-derived cell line. J. Gen. Physiol. 99:367–390.
McManus, O. B., A. L. Blatz, and K. L. Magleby. 1987. Sampling, logbinning, fitting, and plotting durations of open and shut intervals fromsingle channels and the effects of noise. Pflugers Arch. 410:530–553.
McManus, O. B., and K. L. Magleby. 1991. Accounting for the Ca21-dependent kinetics of single large- conductance Ca21-activated K1
channels in rat skeletal muscle. J. Physiol. 443:739–777.
Naranjo, D., and P. Brehm. 1993. Modal shifts in acetylcholine receptorchannel gating confer subunit-dependent desensitization. Science.260:1811–1814.
Neely, A., R. Olcese, P. Baldelli, X. Wei, L. Birnbaumer, and E. Stefani.1995. Dual activation of the cardiac Ca21 channel a1C-subunit and themodulation by the b-subunit. Am. J. Physiol. 268:C732–C740.
Neely, A., R. Olcese, X. Wei, L. Birnbaumer, and E. Stefani. 1994. Ca21-dependent inactivation of a cloned cardiac Ca21 channel a1 subunit (a1C)expressed in Xenopus oocytes. Biophys. J. 66:1895–1903.
Neely, A., X. Wei, R. Olcese, L. Birnbaumer, and E. Stefani. 1993.Potentiation by the b-subunit of the ratio of the ionic current to thecharge movement in the cardiac calcium channel. Science. 262:575–578.
Noceti, F., P. Baldelli, X. Wei, N. Qin, L. Toro, L. Birnbaumer, and E.Stefani. 1996. Effective gating charges per channel in voltage-dependentK1 and Ca21 channels. J. Gen. Physiol. 108:143–155.
Olcese, R., A. Neely, N. Qin, X. Wei, L. Birnbaumer, and E. Stefani. 1996.Coupling between charge movement and pore opening in vertebrateneuronal a1E calcium channels. J. Physiol. 497:675–686.
Patton, D. E., J. W. West, W. A. Catterall, and A. L. Goldin. 1992. Aminoacid residues required for fast Na1-channel inactivation: chargeneutralizations and deletions in the III–IV linker. Proc. Natl. Acad.Sci. USA. 89:10905–10909.
Pietrobon, D., B. Prodhom, and P. Hess. 1989. Interactions of protons withsingle open L-type calcium channels. pH dependence of proton-inducedcurrent fluctuations with Cs1, K1, and Na1 as permeant ions. J. Gen.Physiol. 94:1–21.
Pragnell, M., J. Sakamoto, S. D. Jay, and K. P. Campbell. 1991. Cloningand tissue-specific expression of the brain calcium channel b-subunit.FEBS Lett. 291:253–258.
Prodhom, B., D. Pietrobon, and P. Hess. 1989. Interactions of protons withsingle open L-type calcium channels. Location of protonation site and
288 Dzhura and Neely
Biophysical Journal 85(1) 274–289
dependence of proton- induced current fluctuations on concentration andspecies of permeant ion. J. Gen. Physiol. 94:23–42.
Qin, F., A. Auerbach, and F. Sachs. 1996. Estimating single-channel kineticparameters from idealized patch-clamp data containing missed events.Biophys. J. 70:264–280.
Ruth, P., A. Rohrkasten, M. Biel, E. Bosse, S. Regulla, H. E. Meyer, V.Flockerzi, and F. Hofmann. 1989. Primary structure of the b-subunit ofthe DHP-sensitive calcium channel from skeletal muscle. Science.245:1115–1118.
Sanford, J., J. Codina, and L. Birnbaumer. 1991. g-subunit of G-proteins,but not their a- or b-subunits, are polyisoprenylated. J. Biol. Chem.266:9570–9579.
Sigworth, F. J., and S. M. Sine. 1987. Data transformations for improveddisplay and fitting of single-channel dwell-time histograms. Biophys. J.52:1047–1054.
Singer, D., M. Biel, I. Lotan, V. Flockerzi, F. Hofmann, and N. Dascal.1991. The roles of the subunits in the function of the calcium channel.Science. 253:1553–1557.
Stea, A., S. J. Dubel, M. Pragnell, J. P. Leonard, K. P. Campbell, and T. P.Snutch. 1993. A b-subunit normalizes the electrophysiological propertiesof a cloned N-type Ca21 channel a1 subunit. Neuropharmacology.32:1103–1116.
Taglialatela, M., L. Toro, and E. Stefani. 1992. Novel voltage clamp torecord small, fast currents from ion channels expressed in Xenopusoocytes. Biophys. J. 61:78–82.
Tareilus, E., M. Roux, N. Qin, R. Olcese, J. M. Zhou, E. Stefani, and L.Birnbaumer. 1997. A Xenopus oocyte b-subunit: Evidence for a role inthe assembly/expression of voltage-gated calcium channels that isseparate from its role as a regulatory subunit. Proc. Natl. Acad. Sci.USA. 94:1703–1708.
Van Dongen, A. M. 1996. A new algorithm for idealizing single ionchannel data containing multiple unknown conductance levels. Biophys.J. 70:1303–1315.
Villarroel, A., O. Alvarez, A. Oberhauser, and R. Latorre. 1988. Probinga Ca21-activated K1 channel with quaternary ammonium ions. PflugersArch. 413:118–126.
Wakamori, M., G. Mikala, and Y. Mori. 1999. Auxiliary subunits operateas a molecular switch in determining gating behaviour of the unitary N-type Ca21 channel current in Xenopus oocytes. J. Physiol. 517:659–672.
Wakamori, M., G. Mikala, A. Schwartz, and A. Yatani. 1993. Single-channel analysis of a cloned human heart L-type Ca21 channel a1
subunit and the effects of a cardiac b-subunit. Biochem. Biophys. Res.Commun. 196:1170–1176.
Wei, X., A. Neely, R. Olcese, W. Lang, E. Stefani, and L. Birnbaumer.1996. Increase in Ca21 channel expression by deletions at the aminoterminus of the cardiac a1C-subunit. Receptors Channels. 4:205–215.
Wei, X. Y., E. Perez Reyes, A. E. Lacerda, G. Schuster, A. M. Brown, andL. Birnbaumer. 1991. Heterologous regulation of the cardiac Ca21
channel a1 subunit by skeletal muscle b- and g- subunits. Implicationsfor the structure of cardiac L-type Ca21 channels. J. Biol. Chem. 266:21943–21947.
Williams, M. E., D. H. Feldman, A. F. McCue, R. Brenner, G. Velicelebi,S. B. Ellis, and M. M. Harpold. 1992. Structure and functionalexpression of a1-, a2-, and b-subunits of a novel human neuronalcalcium channel subtype. Neuron. 8:71–84.
Yellen, G. 1984. Ionic permeation and blockade in Ca21-activated K1
channels of bovine chromaffin cells. J. Gen. Physiol. 84:157–186.
Zheng, J., L. Vankataramanan, and F. J. Sigworth. 2001. Hidden Markovmodel analysis of intermediate gating steps associated with the pore gateof Shaker potassium channels. J. Gen. Physiol. 118:547–562.
Differential Modulation by Ca2+ Channel b-Subunits 289
Biophysical Journal 85(1) 274–289


