Embed Size (px)
Citation preview
Dc
OMa
b
c
d
e
f
a
ARR2AA
KASPOHS
1
cisctfflmfaoaho
0d
Talanta 84 (2011) 341–346
Contents lists available at ScienceDirect
Talanta
journa l homepage: www.e lsev ier .com/ locate / ta lanta
irect photothermal techniques for rapid quantification of total anthocyaninontent in sour cherry cultivars
ttó Dókaa,∗, Gitta Ficzekb, Dane Bicanicc,d, Ruud Spruijt c, Svjetlana Luterotti e,agdolna Tóthb, Josephus Gerardus Buijnsters f, György Végvárib
Department of Physics and Mathematics, University of West Hungary, Deak F. sq. 1, 9200 Mosonmagyaróvár, HungaryDepartment of Fruit Science, Corvinus University H-1118 Budapest, Villányi str. 29-43, HungaryLaboratory of Biophysics, Wageningen University, Dreijenlaan 3, 6703 HA Wageningen, The NetherlandsDepartment of Food Quality and Nutrition, Faculty of Food Technology and Biotechnology, University of Zagreb, Pierottieva 6, HR-10000 Zagreb, CroatiaFaculty of Pharmacy and Biochemistry, University of Zagreb, Ante Kovacica 1, HR-10000 Zagreb, CroatiaInstitute for Molecules and Materials, Radboud University Nijmegen, Heijendaalseweg 135, 6525 AJ Nijmegen, The Netherlands
r t i c l e i n f o
rticle history:eceived 10 September 2010eceived in revised form8 December 2010ccepted 7 January 2011vailable online 15 January 2011
a b s t r a c t
The analytical performance of the newly proposed laser-based photoacoustic spectroscopy (PAS) andof optothermal window (OW) method for quantification of total anthocyanin concentration (TAC) infive sour cherry varieties is compared to that of the spectrophotometry (SP). High performance liquidchromatography (HPLC) was used to identify and quantify specific anthocyanins. Both, PAS and OW aredirect methods that unlike SP and HPLC obviate the need for the extraction of analyte. The outcomeof the study leads to the conclusion that PAS and OW are both suitable for quick screening of TAC in
eywords:nthocyanins determinationour cherry (Prunus cerasus L.)hotoacoustic spectroscopyptothermal windowPLC
sour cherries. The correlation between the two methods and SP is linear with R2 = 0.9887 for PAS andR2 = 0.9918 for OW, respectively. Both methods are capable of the rapid determination of TAC in sourcherries without a need for a laborious sample pretreatment.
© 2011 Elsevier B.V. All rights reserved.
pectrophotometry
. Introduction
Flavonoids that constitute an important subgroup of phenolicompounds are among the most important components presentn many fruits and vegetables and contribute to their color andensory properties [1]. Among others, flavonoids are located inhloroplasts scavenging the singlet oxygen and reducing the oxida-ive damage induced by UV-B light [2]. Due to their multipleunctions in photoprotection and health effectiveness in humans,avonoids are referred as nutraceuticals [1,2]. Anthocyanin pig-ents that belong to the subgroup of flavonoids are responsible
or orange, red, purple, violet, fuchsia and blue colors in fruitsnd vegetables [3]. In addition, owing to their attractive col-
rs, anthocyanins are often used as food additives. Anthocyaninsre glycosides of 18 anthocyanidins that differ in the degree ofydroxylation and methoxylation. The most common naturallyccurring anthocyanins such as cyanidin, delphinidin, malvini-∗ Corresponding author.E-mail address: [email protected] (O. Dóka).
039-9140/$ – see front matter © 2011 Elsevier B.V. All rights reserved.oi:10.1016/j.talanta.2011.01.007
din, pelargonidin, peonidin and petunidin [4,5] are important inhuman nutrition [6]. Increased public interest in anthocyaninsis associated with their health benefits and potential nutritionaleffects demonstrated in numerous clinical studies. For example,the presence of anthocyanins in foods has been linked with thehealth-promoting benefits such as antioxidant and anti-canceractivities [7]. They were also proven to influence the fixationof the reactive oxygen [8], inhibit the oxidation of lipoproteins[9,10] and prevent the development of cardiovascular diseases[11]. According to Seymour and his team the consumption ofsour cherries reduced the concentration of lipids in the liverof experimental animals [12]. Anthocyanins in cherries are alsoknown to possess the anti-inflammatory, anticancer, antidiabetic,antiobese [13] and antibacterial [14] properties and capacity torelieve the stress and strengthen the immune system. Likewise,these compounds can be used to supplement chemotherapy and
other treatments prescribed for patients suffering of cancer andHIV infection [15].Anthocyanins constitute the most important group of the water-soluble pigments in fruits and plants. They are found in highconcentrations in berry fruits [16], sour cherry [17], bunch-berries

3 anta 8
[i
gaOgp(tlcadacacettaaa
tttttaa
tlmtiei
oh
2
2
vbi[hdiOoew
fFTm
42 O. Dóka et al. / Tal
18] and plum [19]. However, considerable differences in the chem-cal composition among different cultivars have been reported [20].
Sour cherry is rich in anthocyanins with cyanidine-3-lucoside, cyanidine-3-rutinoside, cyanidine-3-sophorosidend cyanidine-3-glucosylrutinoside, dominating the composition.ther anthocyanins found in sour cherry include peonidin-3-lucoside, malvinidin-3-glucoside, delphinidin-3-glucoside andelargonidin-3-glucoside. The total anthocyanin concentrationTAC) in sour cherries was found to vary from a few milligramso tens of milligrams per 100 g fresh product mass. Because theevel of consumer’s knowledge about the nutritional value of sourherry is generally low, it is desirable to gather more informationbout the identity and the amount of various anthocyanins inifferent sour cherry varieties. The identification of anthocyaninsnd their quantification by means of the high performance liquidhromatography (HPLC) and spectrophotometry (SP) have beenttempted by many authors [21,22]. Both approaches are timeonsuming and costly as they require a tedious and laboriousxtraction of the sample prior to the analysis. Besides thesewo destructive methods there exists a variety of non-invasiveechniques (examples are colorimetry, reflectance spectroscopynd chlorophyll fluorescence spectroscopy) that permit fruit to benalyzed with a minimum of pretreatment or of no preparation atll [23].
This paper is dealing with the application of the laser-based pho-oacoustics (PA) and optothermal window (OW) methods in ordero quantify TAC in several sour cherry varieties. Both methods offerhe possibility for a direct quantification of TAC which eliminateshe need for the extraction step and therefore significantly reduceshe overall analysis time. A calibration against the methods suchs HPLC or SP is a necessity since neither PA nor OW are yet thebsolute techniques for measurements of concentration.
Essential to the OW and PAS is the spectral coincidence betweenhe wavelength of the incident radiation and the absorption wave-ength of anthocyanins. Provided the above requirement is being
et, the absorption of the laser radiation by anthocyanins will leado the generation of heat (and thermal waves) in sour cherry causingts temperature to rise. In this study the SP served as the refer-nce method for TAC quantification, while HPLC was used for thedentification and quantification purposes.
As stated already, unlike HPLC and SP, the photothermal meth-ds require no extraction leaving the production of a thawedomogenate the only pretreatment needed.
. Materials and methods
.1. Plant material
Samples of five sour cherry (Prunus cerasus L. syn.: Cerasusulgaris Mill.) cultivars [Gerema (GE), Maliga emléke (ME), Érdiotermo (EB), Érdi jubileum (EJ), Kántorjánosi (KJ)] were harvested
n the year 2009. Fruit-trees were grown on a lowland chernozemfertile, black-coloured soil containing a high percentage (7–15%)umus, phosphoric acids, phosphorus and ammonia, with limeeposits and mildly alkaline in the topsoil] at Érd-Elvira [Exper-
mental Station of the Research Institute for Fruit Growing andrnamentals Budapest-Érd, Hungary central region]. The numberf sunshine hours was 2000, the mean temperature during the veg-tation period was 16.8 ◦C and the mean annual rainfall deposition
as between 550 and 570 mm.Fruits (about 5000 g) of each cultivar were picked (manually)rom all four tree quarters of 15 trees at the optimal ripening stage.ruits were rinsed with a tap water and the pits manually removed.he pitted fruits (skins and fruit-pulp) were homogenized with aixer and homogenates stored at −25 ◦C until analysis.
4 (2011) 341–346
2.2. Chemicals
The anthocyanin standards, pelargonidin 3,5-di-O-glucoside(pelargonin chloride) (CAS number: [17334-58-6]), cyanidin-3,5-di-O-glucoside (cyanin chloride) (CAS number: [2611-67-8]), peonidin chloride (CAS number: [134-01-0]), malvidin-3-galactoside chloride (primulin) (CAS number: [30113-37-2]),delphinidin chloride (CAS number: [528-53-0]) and petunidin chlo-ride (CAS number: [1429-30-7]), as well as all HPLC analytical gradesolvents were purchased from Sigma Aldrich Chemical Co. (St.Louis, MO, USA). The standards (0.5 mg/mL) were 500× diluted withmethanol containing 0.1% (V/V) hydrochloric acid before applyingto HPLC.
2.3. Sample preparation
For HPLC analysis 1.5 mL of thawed fruit homogenate wascentrifuged (Hettich Mikro 22R at 15,000 rpm) during 5 min inEppendorf-tube. The supernatant was filtered through a 0.45-�mMILLEX®-HV Syringe Driven Filter Unit (SLHV 013 NL, PVDF Dura-pore), purchased from Millipore Co. (Bedford, MA, USA).
For SP analysis thawed homogenate was centrifuged (HettichEBA 21 at 15,000 rpm) for 5 min. Aliquots of the super-natant (0.1 mL) were then mixed with 0.2 mL hydrochloric acid(10 mol L−1) in 10.0-mL volumetric flasks, and the volume wasadjusted to the mark using 96% EtOH. The samples were kept indarkness for 30 min.
2.4. HPLC
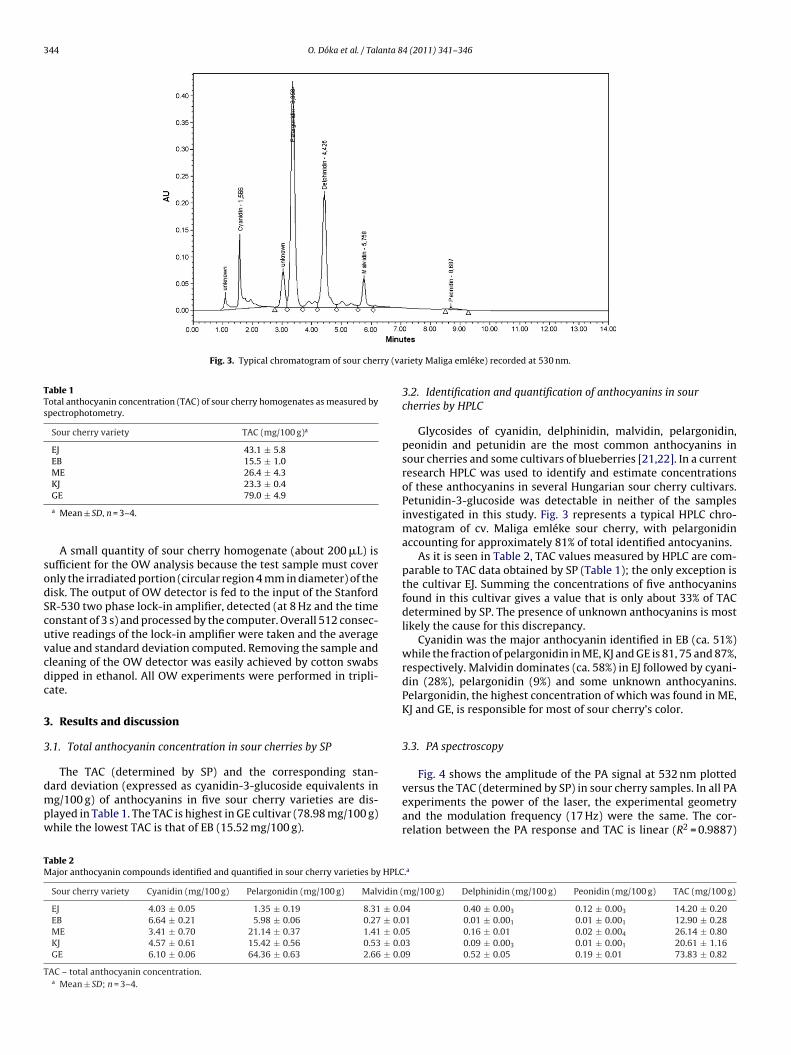
WATERS High Performance Liquid Chromatograph (Waters Co.,34 Maple Street, Milford, MA, USA) equipped with 2487 Dual �Absorbance Detector, 1525 Binary HPLC Pump, In-Line Degasser,Column Thermostat (set at 40 ◦C) and 717 plus Autosampler (setat 5 ◦C) controlled with EMPOWERTM2 software was used for HPLCanalysis. The samples were injected on a SYMMETRY C18 5-�m4.6 mm × 150 mm column. The mobile phase was a mixture ofwater (containing 5% acetic acid):MeOH:ACN (70:10:20, V/V/V).Selected isocratic flow rate was 1 mL min−1. The pressure on thecolumn at 40 ◦C was about 16.1 ± 0.1 MPa and the time needed tocomplete the single HPLC run was 14 min. The volume injectedon a column was 20 �L. The detection was performed at analyt-ical wavelength of 530 nm. The retention times (in min) of thestandards were: 1.566 (cyanidin), 3.340 (pelargonidin), 4.431 (del-phinidin), 5.761 (malvidin), 8.670 (peonidin) and 13.71 (petunidin).Repeated HPLC analyses (n = 3–4) were performed and concen-trations calculated from the areas of the corresponding peaks.The concentrations of the different anthocyanin compounds wereexpressed in mg/100 g homogenate.
2.5. Spectrophotometry
The absorbance at 530 nm was measured on a Hitachi U-2800A spectrophotometer; three to four independent analyseswere performed. The TAC (in mg/100 g homogenate) was calcu-lated according to the approach described by Füleki and Francis [24]and Lee, Durst and Wrolstad [25] and was expressed as cyanidin-3-glucoside equivalents (Mr = 449.2, ε = 26,900 L mol−1 cm−1).
2.6. Photoacoustic spectroscopy
The PAS implies the illumination of a condensed phase sampleby the modulated beam of (laser) radiation the emission wave-length of which coincides with that at which the absorption of thesample is preferably high. The fraction of energy absorbed by thesample is converted to heat; as a result of this the temperature of

O. Dóka et al. / Talanta 84 (2011) 341–346 343
Fig. 1. (a) The sample holder and the PA detector. The modulated laser beam enters the PA cell through the transparent window. Absorption of the incident radiation by thes the cd t quah eam.
tosltoatg
3h(t(mb(1(ewpaltTaqtte
2
sgba
(glued to a sapphire disk) detects the induced stress and producesa periodic voltage signal which is detected (at the modulation fre-quency) by means of the-lock-in amplifier.
ample leads to the generation of thermal waves. In a gas layer above the sample inetected by a microphone. (b) The cross-sectional view of the PA cell. A: transparenolder; F: O-ring; G: capillary tube; H: microphone; I: sample; J: modulated laser b
he sample oscillates periodically at a frequency identical to thatf the modulation. Generated thermal waves reach the sample’surface causing the periodic heating and cooling of the contactingayer of the surrounding gas. Finally, the expansions and contrac-ions of this gas layer give rise to the acoustic wave, the amplitudef which is detected as a voltage (termed PA signal) by means ofmicrophone. It is obvious that optical and thermal parameters of
he sample and the contacting gas both play a decisive role in theeneration of PA signal.
The PA spectrometer used in this study comprised the GLP-III-0, green laser pointer (532 nm, power 16 mW) as a light source, aome made modulator and the PA cell. The mechanically chopped17 Hz) laser beam (J) was focused into the PA cell (Fig. 1). Radia-ion enters the PA cell through a half-inch diameter quartz windowA). The sampling volume (I) and a miniature (4.2 mm × 4.75 mm)
icrophone (Sennheiser KE 4-211-2) (H) are acoustically coupledy means of a 3-mm long capillary (G). The PA cell is a sealedclosed) when the lever of the sample holder (E) is rotated through80◦. In such a position the metal rod (C) presses the sample holderB) against the O-ring (F) which seals the PA detector due to theccentricity of the wheel (D). Sour cherry homogenate (100 �L) (I)as loaded into a semispherical cavity manufactured in the sam-le holder (B). The PA signal was processed by a dual phase lock-inmplifier (Stanford SR530) connected to the computer. With eachoading 512 successive readings of lock-in amplifier have beenaken and the average value and a standard deviation computed.he sour cherry homogenate was then removed from the PA cellnd PA cell cleaned simply using a kitchen towel paper. A freshuantity of the same sour cherry homogenate was then loaded intohe PA cell and the whole procedure repeated. This was done forhree to four loadings; the average of measured values was consid-red representative for the analysis.
.7. Optothermal window
The experimental arrangement for OW analysis used in thistudy is shown in Fig. 2. The 532 nm radiation (16 mW) emitted by areen laser pointer (GLP-III-30) was periodically modulated at 8 Hzy a mechanical chopper. The latter was provided with a LED andphotodiode (to generate reference signal for the lock-in ampli-
losed PA cell these thermal waves generate the sound waves which are eventuallyrtz window; B: sample holder; C: metal rod; D: eccentric wheel; E: lever of sample
fier). Before impinging on a sample the laser beam was allowedto pass through a highly transparent, 0.3-mm thick sapphire disk(characterized by a large thermal expansion coefficient) that car-ries the annular ring of lead zirconate titanate (PZT) piezoelectricmaterial glued to a disk’s rear side. The sapphire disk and thePZT together constitute the optothermal window (OW). An irisdiaphragm mounted coaxially with the OW, prevented the incom-ing radiation from directly heating the piezoelectric transducerthereby causing unwanted OW signal.
Sour cherry homogenate is deposited directly atop the sapphiredisk. Due to the good thermal contact between the sample andthe sapphire disk, the temperature of the disk changes causing itto expand and contract periodically. The piezoelectric transducer
Fig. 2. The schematic diagram of the OW setup. The modulated laser beam passesthrough the iris diaphragm and a transparent sapphire disk window before beingabsorbed by the sample. The generation of heat in the sample causes the window toexpand; such mechanical deformation is measured by the PZT piezoelectric sensor.
344 O. Dóka et al. / Talanta 84 (2011) 341–346
Fig. 3. Typical chromatogram of sour cherry (va
Table 1Total anthocyanin concentration (TAC) of sour cherry homogenates as measured byspectrophotometry.
Sour cherry variety TAC (mg/100 g)a
EJ 43.1 ± 5.8EB 15.5 ± 1.0ME 26.4 ± 4.3
sodScuvcdc
3
3
dmpw
Fig. 4 shows the amplitude of the PA signal at 532 nm plotted
TM
T
KJ 23.3 ± 0.4GE 79.0 ± 4.9
a Mean ± SD, n = 3–4.
A small quantity of sour cherry homogenate (about 200 �L) isufficient for the OW analysis because the test sample must covernly the irradiated portion (circular region 4 mm in diameter) of theisk. The output of OW detector is fed to the input of the StanfordR-530 two phase lock-in amplifier, detected (at 8 Hz and the timeonstant of 3 s) and processed by the computer. Overall 512 consec-tive readings of the lock-in amplifier were taken and the averagealue and standard deviation computed. Removing the sample andleaning of the OW detector was easily achieved by cotton swabsipped in ethanol. All OW experiments were performed in tripli-ate.
. Results and discussion
.1. Total anthocyanin concentration in sour cherries by SP
The TAC (determined by SP) and the corresponding stan-
ard deviation (expressed as cyanidin-3-glucoside equivalents ing/100 g) of anthocyanins in five sour cherry varieties are dis-layed in Table 1. The TAC is highest in GE cultivar (78.98 mg/100 g)hile the lowest TAC is that of EB (15.52 mg/100 g).
able 2ajor anthocyanin compounds identified and quantified in sour cherry varieties by HPLC
Sour cherry variety Cyanidin (mg/100 g) Pelargonidin (mg/100 g) Malvidin (
EJ 4.03 ± 0.05 1.35 ± 0.19 8.31 ± 0.0EB 6.64 ± 0.21 5.98 ± 0.06 0.27 ± 0.0ME 3.41 ± 0.70 21.14 ± 0.37 1.41 ± 0.0KJ 4.57 ± 0.61 15.42 ± 0.56 0.53 ± 0.0GE 6.10 ± 0.06 64.36 ± 0.63 2.66 ± 0.0
AC – total anthocyanin concentration.a Mean ± SD; n = 3–4.
riety Maliga emléke) recorded at 530 nm.
3.2. Identification and quantification of anthocyanins in sourcherries by HPLC
Glycosides of cyanidin, delphinidin, malvidin, pelargonidin,peonidin and petunidin are the most common anthocyanins insour cherries and some cultivars of blueberries [21,22]. In a currentresearch HPLC was used to identify and estimate concentrationsof these anthocyanins in several Hungarian sour cherry cultivars.Petunidin-3-glucoside was detectable in neither of the samplesinvestigated in this study. Fig. 3 represents a typical HPLC chro-matogram of cv. Maliga emléke sour cherry, with pelargonidinaccounting for approximately 81% of total identified antocyanins.
As it is seen in Table 2, TAC values measured by HPLC are com-parable to TAC data obtained by SP (Table 1); the only exception isthe cultivar EJ. Summing the concentrations of five anthocyaninsfound in this cultivar gives a value that is only about 33% of TACdetermined by SP. The presence of unknown anthocyanins is mostlikely the cause for this discrepancy.
Cyanidin was the major anthocyanin identified in EB (ca. 51%)while the fraction of pelargonidin in ME, KJ and GE is 81, 75 and 87%,respectively. Malvidin dominates (ca. 58%) in EJ followed by cyani-din (28%), pelargonidin (9%) and some unknown anthocyanins.Pelargonidin, the highest concentration of which was found in ME,KJ and GE, is responsible for most of sour cherry’s color.
3.3. PA spectroscopy
versus the TAC (determined by SP) in sour cherry samples. In all PAexperiments the power of the laser, the experimental geometryand the modulation frequency (17 Hz) were the same. The cor-relation between the PA response and TAC is linear (R2 = 0.9887)
.a
mg/100 g) Delphinidin (mg/100 g) Peonidin (mg/100 g) TAC (mg/100 g)
4 0.40 ± 0.003 0.12 ± 0.003 14.20 ± 0.201 0.01 ± 0.001 0.01 ± 0.001 12.90 ± 0.285 0.16 ± 0.01 0.02 ± 0.004 26.14 ± 0.803 0.09 ± 0.003 0.01 ± 0.001 20.61 ± 1.169 0.52 ± 0.05 0.19 ± 0.01 73.83 ± 0.82

O. Dóka et al. / Talanta 84 (2011) 341–346 345
y = 1.5703x + 80.353
R 2 = 0.9887
0
100
200
100806040200
TAC, SP (mg/100 g)
PA
sig
na
l ( µ
V)
Fcw
atsSi2dte
3
dsetast
cd
Fcw
Prec
isio
nSE
WM
(%)
Inte
rcep
tD
Les
tim
ate
(mg/
100
g)In
stru
men
tp
reci
sion
(%)
Mea
sure
men
tre
pea
tabi
lity
(%)
)R
SD(%
)M
ean
(�V
)R
SD(%
)
5.3
255.
904.
97.
580.
5–8.
0(5
12re
adin
gs)
1.0–
3.4
(n=
3)0.
01–0
.16.
280
.35
5.3
8.91
1.4–
5.7
(512
read
ings
)0.
4–3.
8(n
=3–
4)0.
1–0.
9
nd
epen
den
tm
easu
rem
ents
(loa
din
gs)
atea
chco
nce
ntr
atio
n.O
W–
opto
ther
mal
win
dow
.PA
S–
ph
otoa
cou
stic
spec
tros
cop
y.R
SD–
rela
tive
SDin
t–
stan
dar
dd
evia
tion
ofth
ere
gres
sion
lin
ein
terc
ept.
SEW
M–
stan
dar
der
ror
ofth
ew
eigh
ted
mea
n.
dep
end
ent
anal
yses
).
ig. 4. The PA signal (at 532 nm and 17 Hz) plotted versus the total anthocyaninoncentration (TAC) in sour cherry homogenates. Mean ± SD, n = 3–4. The TAC valuesere determined spectrophotometrically (SP) at 530 nm.
s shown in Fig. 4. Data points in Fig. 4 are the averages of threeo four consecutive independent measurements. Each single mea-urement represents 512 successive readings of the lock-in signal.tandard deviation in such “single load” type of measurements var-ed between 1 and 6% of the measured value, with an average of%. In the “multi-load” type measurements the achieved standardeviation (actually repeatability) that depends on factors such ashe stability of laser power, the uniformity of sample, etc., did notxceed 4%.
.4. Optothermal window
The OW response to a varying TAC in sour cherry samples isisplayed in Fig. 5. Values shown are the averages of triplicate mea-urements and the error bars indicate one standard deviation. Thexperimental conditions were similar to those used in the PA study,he only exception being the modulation (8 Hz). Under given oper-ting conditions the magnitude of the background OW signal (i.e.,
ignal obtained without the sample atop the sapphire disc) wasypically of the order of a few microvolts.In general, the magnitude of the lock-in signal depends, in aomplex manner, on a variety of parameters including the powerensity of the incident radiation, the modulation frequency, the
y = 5.4578x + 255.9038
R 2 = 0.9918
0
200
400
600
0 20 40 60 80 100
TAC, SP (mg/100 g)
OW
sig
na
l ( µ
V)
ig. 5. The OW signal (at 532 nm and 8 Hz) plotted versus the total anthocyaninoncentration (TAC) in sour cherry homogenates. Mean ± SD, n = 3–4. The TAC valuesere determined spectrophotometrically (SP) at 530 nm. Ta
ble
3R
egre
ssio
nd
ata
for
tota
lan
thoc
yan
ins
inso
ur
cher
ries
.#
Tech
niq
ue
Bes
t-go
odn
ess
ofli
nea
rity
fit
Con
c.ra
nge
(mg/
100
g),N
/nR
2/R
SSSl
ope
Mea
n(×
105
�V
OW
(532
nm
)x15
.5–7
9.0,
5/3
0.99
18/6
.31
×10
25.
458
PAS
(532
nm
)x15
.5–7
9.0,
5/3–
40.
9887
/72.
061.
570
DL
(det
ecti
onli
mit
)=3.
3SD
int/
slop
e.N
–n
um
ber
ofco
nce
ntr
atio
nle
vels
.n–
nu
mbe
rof
ist
and
ard
dev
iati
on.R
2–
coef
fici
ent
ofd
eter
min
atio
n.R
SS–
resi
du
alsu
mof
the
squ
ares
.#
Con
cen
trat
ion
sar
ere
por
ted
for
the
hom
ogen
ates
mea
sure
dby
SPat
530
nm
(3–4
inx
Res
ult
sba
sed
ongr
oss
sign
als.

3 anta 8
stceatTUthccrr
a
4
(simcTciaTismcs
rabwd
ahcpbfaap
[
[
[
[
[
[
[[
[[[[
[
46 O. Dóka et al. / Tal
ensitivity of the piezoelectric detector, thermal and optical proper-ies of both, anthocyanins and sapphire disk, etc. If the experimentalonditions (in the first place, the modulation frequency) are prop-rly chosen, the OW signal becomes solely dependent on thebsorption coefficients of anthocyanins themselves and hence onheir concentrations. The relationship between the OW signal andAC resembled that found the same samples in the PA studies.nder practically identical experimental circumstances the ampli-
ude of the OW signal obtained from each sour cherry sample wasigher (factor 3.5) than that of the PA signal. Again, the observedorrelation between the OW signal and TAC is linear and the coeffi-ient of determination high (R2 = 0.9918). The instrument precisionanged between 1 and 8% (2% on average), and the measurementepeatability was 1–3%.
Analytical performances of the newly established PAS and OWssays are summarized in Table 3.
. Conclusions
The sum of the concentrations of the three anthocyaninspelargonidin, cyanidin and malvidin) found in the investigatedamples constitutes between 2 and 87% of the TAC. For example,n GE pelargonidin is the most abundant anthocyanin making as
uch as 87% of the TAC. On the other hand in cultivar EB the con-entration of malvidin is only 2% of the TAC. When comparing theAC data obtained for investigated samples by HPLC and SP, oneoncludes that HPLC values are at least 96% of TAC data collectedn SP analysis. This finding provides the evidence that the threenthocyanins quoted above indeed are the dominant compounds.he relatively simple fingerprint of anthocyanins identified (HPLC)n this study is in agreement with data obtained previously fromour cherries [26]. It consists of four to five major compounds, theajor constituent of which accounts for at least 50% of the total
oncentration. The concentration of the specific component variesignificantly in different cultivars.
As to cultivar EJ, the TAC found in this study was higher than thateported by Simunic et al. [22]. The TAC depends on a fruit varietynd is also influenced by local climatological conditions (rain, num-er of sunshine hours, temperature, soil type, etc.). This explainshy the TAC of one and the same sour cherry variety can differepending on the geographical origin.
The PAS and OW, two photothermal methods, were evalu-ted in terms of their potential to quantify TAC in sour cherryomogenates. The SP measurements confirmed that TAC in sourherries varies from several milligrams to tens of milligramser 100 g fresh fruit. The response of PAS and OW was cali-
rated against SP; the range of TAC in sour cherries extendsrom 16 to 79 mg/100 g. The correlation between the PA signalnd the TAC (SP results) is highly linear; the same conclusionpplies to OW data. Furthermore, precision data for regression linearameters is favourable for both photothermal methods. Calcu-[
[[[
4 (2011) 341–346
lated DL values are between 7 and 9 mg/100 g TAC. The standarderrors of the weighted mean and the repeatability data suggesta high and comparable precision for both photothermal meth-ods. The sensitivity of the OW method is slightly better than thatof PAS. As far as calibration sensitivity is concerned increasingthe TAC by 1 mg/100 g corresponds to a 5.5 �V increase of theOW signal as compared to 1.6 �V increment observed for the PAsignal.
In conclusion, PAS and OW were both demonstrated useful forassaying TAC in sour cherry homogenates. As such they will bewelcome in the product quality control. The two methods appearinterchangeable; the preference for using a specific approach willin the first instance rely on a desired sensitivity and the availabilityof instrumentation.
References
[1] A.R. Tapas, D.M. Sakarkar, R.B. Kakde, Trop. J. Pharm. Res. 7 (2008) 1089–1099.
[2] G. Agati, M. Tattini, New Phytol. 186 (2010) 786–793.[3] D. Strack, V. Wray, in: J.B. Harbone (Ed.), The Flavonoids, Advances in Research
Since 1986, Chapman & Hall, London, 1994, pp. 1–22.[4] J. Gross, in: J. Gross (Ed.), Pigments in Fruits, Academic Press, London, 1987, pp.
59–77.[5] J. Fleschhut, F. Kratzer, G. Rechkemmer, S.E. Kulling, Eur. J. Nutr. 45 (2006)
7–18.[6] J.M. Kong, L.S. Chia, N.K. Goh, T.F. Chia, R. Brouillard, Phytochemistry 64 (2003)
923–933.[7] L.-S. Wang, G.D. Stoner, Cancer Lett. 269 (2008) 281–290.[8] S.U. Mertens-Talcott, J. Rios, P. Jilma-Stohlawetz, L.A. Pacheco-Palencia,
B. Meibohm, S.T. Talcott, H. Derendorf, J. Agric. Food Chem. 56 (2008)7796–7802.
[9] L.K. Liu, H.J. Lee, Y.W. Shih, C.C. Chyau, C.J. Wang, J. Food Sci. 73 (2008)H113–H121.
10] E.S. Kao, T.H. Tseng, H.J. Lee, K.C. Chan, C.J. Wang, Chem. Biol. Interact. 179(2009) 212–218.
11] S. de Pascual-Teresa, D.A. Moreno, C. García-Viguera, Int. J. Mol. Sci. 11 (2010)1679–1703.
12] E.M. Seymour, A.A.M. Singer, A. Kirakosyan, P.B. Kaufman, S. Warber, S.F.Bolling, J. Med. Food 11 (2008) 252–259.
13] V. Mulabagal, G.A. Lang, D.L. DeWitt, S.S. Dalavoy, M.G. Nair, J. Agric. Food Chem.57 (2009) 1239–1246.
14] C. Ao, A. Li, A.A. Elzaawely, T.D. Xuan, S. Tawata, Food Control 19 (2008)940–948.
15] H. Kamei, Y. Hashimoto, T. Koide, T. Kojima, M. Hasegawa, Cancer Biother. Radio.13 (1998) 447–452.
16] N.P. Seeram, J. Agric. Food Chem. 56 (2008) 630–635.17] J.M. Tall, N.P. Seeram, C. Zhao, M.G. Nair, R.A. Meyer, S.N. Raja, Behav. Brain Res.
153 (2004) 181–188.18] F. Demir, I.H. Kalyoncu, J. Food Eng. 60 (2003) 335–341.19] S. Cahsir, C. Aydin, J. Food Eng. 65 (2004) 145–150.20] M.E. Arena, J. Food Agric. Environ. 6 (2008) 114–118.21] V. Lohachoompol, M. Mulholland, G. Srzednicki, J. Craske, Food Chem. 111
(2008) 249–254.22] V. Simunic, S. Kovac, D. Gaso-Sokac, W. Pfannhauser, M. Murkovic, Eur. Food
Res. Technol. 220 (2005) 575–578.23] G. Agati, S. Meyer, P. Matteini, Z.G. Cerovic, J. Agric. Food Chem. 55 (2007)
1053–1061.24] T. Füleki, F.J. Francis, J. Food Sci. 33 (1968) 471–478.25] J. Lee, R.W. Durst, R.E. Wrolstad, J. AOAC Int. 88 (2005) 1269–1278.26] A. Chandra, M.G. Nair, A. Iezzoni, J. Agric. Food Chem. 40 (1992) 967–969.


