Embed Size (px)
Citation preview
Disentangling the contribution of socioeconomic pathways to future climate-related risks:
The case of heat stress
Guillaume Rohat

DISENTANGLING THE CONTRIBUTION OF SOCIOECONOMIC PATHWAYS TO FUTURE
CLIMATE-RELATED RISKS: THE CASE OF HEAT STRESS
Dissertation
To obtain The degree of doctor at the University of Twente
on the authority of the rector magnificus prof.dr. T.T.M. Palstra
on account of the decision of the Doctorate Board, to be presented
on Tuesday 10 March 2020
Guillaume Rohat
This thesis has been approved by Prof.dr. H. Dao, supervisor Prof.dr.ir. M.F.A.M. van Maarseveen, supervisor Dr. J. Flacke, co-supervisor THIS DOCTORAL DEGREE PROGRAM WAS UNDERTAKEN TOGETHER WITH THE UNIVERSITY OF GENEVA (SWITZERLAND) ITC dissertation number 379 ITC, P.O. Box 217, 7500 AE Enschede, The Netherlands ISBN 978-90-365-4977-6 DOI 10.3990/1.9789036549776 Cover designed by Job Duim Printed by ITC Printing Department Copyright © 2020
Graduation committee: Supervisors Prof.dr. H. Dao Prof.dr.ir. M.F.A.M. van Maarseveen Co-supervisor(s) Dr. J. Flacke Members Prof. J. Birkmann Université de Stuttgart, Allemagne Prof. M. Sahakian Université de Genève, présidente du jury Prof. R.V. Sliuzas Université de Twente, Pays-Bas Prof. M. Stoffel Université de Genève Dr. O. Wilhelmi National Center for Atmospheric Research, USA

Dedicated to my son, Eliott Jacques Gaby Rohat
i
Foreword by the supervisor Under normal circumstances, Guillaume would have submitted and defended this thesis in person. Sadly, the circumstances are, by no stretch of the imagination, normal. Guillaume passed away, completely unexpectedly, on October 2nd 2019. We were all shocked by this tragic news. Guillaume was busy with the final details of his thesis. The acknowledgements to the thesis were already written, the date for the defence had been chosen, and the committee had been invited. He planned to defend his thesis on November 19 at the University of Geneva in Switzerland. The place of the defence was Geneva, because Guillaume did his research at the University of Geneva and pursued a double doctoral degree from the University of Geneva and the University of Twente. Guillaume’s work was very important, not only to us as his supervisors, but also to the broader scientific community. Therefore, we decided to look into the possibility to award Guillaume a posthumous doctorate degree. We asked Guillaume’s partner, Elodie Charriere, and his family how they would feel about this, and they indicated that it would mean a lot to them. With the full support of the PhD committee as well as the dean of the Faculty of Geo-Information Science and Earth Observation (ITC) of the University of Twente, Professor Tom Veldkamp, we submitted an official request for a posthumous graduation of Guillaume Rohat to the Chairman of the Doctorate Board, Professor Thom Palstra, Rector of the University of Twente. There were several reasons for this request. First, the thesis was almost finished. Guillaume had completed all chapters including introduction and synthesis. Second, the quality of his work is extremely high. Five papers from the thesis are already published in highly ranked scientific journals and the sixth is ready for submission. Finally, Guillaume’s outstanding performance throughout the PhD, his exceptional efforts and achievements, and the enormous reputation that he had built up in the Impacts, Adaptation, and Vulnerability (IAV) research community, led to our request. The Doctorate Board of the Twente University, after considering our request and argumentation, agreed on 21 January 2020 to start the process of a posthumous graduation. This is in line with the normal procedure described in the Doctoral Regulations, including assessment of the thesis by an independent graduation committee. At the same time, also University of Geneva accepted the PHD for posthumous graduation based on the reviews of external PhD committee. Thus, Guillaume is awarded posthumous a double doctoral degree. We thank the colleagues at the University of Geneva, particular Professor Hy Dao and Professor Marlyne Sahakian, for the invaluable collaboration.

ii
We wish to state, that the entire text of the thesis as published here is written by Guillaume. We only completed the summary of the thesis, made minor revisions to some references and updated the page numbers in the table of contents. We strongly believe that Guillaume’s work will be foundational for future studies. Johannes Flacke Martin van Maarseveen
iii
Acknowledgements This work would not have been possible without the continuous support, help, and guidance from many people around me. I am sincerely grateful to all of them, and wish to highlight here the most important persons and organizations that contributed to the completion of this PhD thesis. Foremost, I would like to express my gratitude to my supervision team, namely Prof. Hy Dao, Dr. Johannes Flacke, and Prof. Martin van Maarseveen. Obviously, I would never have been able to conduct this thesis without your guidance. I wish to thank Prof. Hy Dao for offering me the opportunity to conduct a
fully funded PhD at the University of Geneva. Your full support throughout the past few years was particularly appreciated, as well as your insightful feedbacks. I really enjoyed your open-mindedness and your ever positive and enthusiastic responses to my requests, whether it be research ideas, new collaborations, research stays abroad, or MSc. student topics.
I am especially thankful to Dr. Johannes Flacke, my daily supervisor at the University of Twente. From the design of the research topic to the writing of the final thesis manuscript, you have always taken the time to read all my five-line-long sentences and to provide numerous straight-to-the-point and insightful comments. Your scientific guidance throughout the thesis was invaluable – it is hard to describe with words how instrumental you have been to the success of this PhD thesis. I am also thankful for the many advice and tips you gave me to navigate through academia, whether it be writing scientific papers, abstracts for conferences, letters to journal editors, or responses to reviewers. I learnt a lot from you. I am also grateful for your warm welcome every time I came to Enschede. I very much enjoyed every stays there and truly appreciated the great amount of time we spent discussing research and daily life topics. I also want to thank you and your family – Heike, Anna, and Jakob – for the warm welcome and the evenings spent together in Münster. These are very good memories that I will not forget.
Finally, I wish to thank Prof. Martin van Maarseveen for the help setting up the joint doctoral agreement and for the external critical insights, which always helped sharpening the papers of this thesis.
I would then like to express my sincere gratitude to Dr. Olga Wilhelmi for her warm welcome at the National Center for Atmospheric Research in Boulder, Colorado. I felt right at home thanks to you. I am particularly thankful for the many discussions we had about what it takes to succeed in the research world – I really learnt a lot. Your scientific research, friendliness, and human-oriented management are truly inspiring. I do hope our paths will cross often in the years to come. Thank you also to you and your family for the evenings at your
iv
place, which are very good memories from my year in Boulder that I will not forget. This thesis would not have been possible without the contribution of the external co-authors (i.e., not including Dr. Johannes Flacke, Dr. Olga Wilhelmi, Prof. Hy Dao, and Prof. Martin van Maarseveen) involved in each Chapter, namely (i) Dr. Simona Pedde, who helped me applying the fuzzy set theory in Chapter 4, (ii) Dr. Alessandro Dosio, who assisted me to perform the heat hazard projections in Europe and in Africa depicted in Chapters 4 and 5, (iii) Dr. Jing Gao, who contributed to the land use projections for Houston depicted in Chapters 6 and 7, and (iv) Dr. Andrew Monaghan, who performed the climate simulations for Houston depicted in Chapters 6 and 7. I also wish to extend thanks to the many individuals not listed as co-authors who helped in one way or another putting together this thesis, namely Dr. Mariya Absar, Jennifer Boehnert, Prof. Gabriele Bolte, Dr. Elizabeth Clarke, Dr. George Cojocaru, Dr. Andries de Jong, Dr. Matthew Hauer, Prof. Matthew Heaton, Dr. Meredith Jennings, Prof. Heike Köckler, Dr. Cassandra O’Lenick, Lena Reimann, Prof. Mark Rounsevell, Dr. Emma Terama, Dr. Hedwig van Delden, Marjan van Herwijnen, and Dr. Michael Wegener. I finally thank the modeling groups that produced and made available the CORDEX simulations’ outputs (African, European, and North-American nodes). I also wish to thank the people with whom I shared my working life, whether it be at the University of Geneva, the University of Twente, or the National Center for Atmospheric Research. I am thankful to my colleagues at the University of Geneva, particularly
the “B3 people” for introducing a lively working atmosphere. I might have declined many lunch propositions but have truly enjoyed our discussions and coffee breaks. A special thanks to Diana for the interesting discussions we had about daily-life topics and our respective PhD struggles, and to Julien for the inspiring discussions, the (too) dark chocolate, your friendliness, and your human-oriented management.
Thank you also to the staff of the PGM Department of ITC at the University of Twente, who always made me feel welcome during my research stays in Enschede and with whom I had interesting discussions over lunch. I especially want to thank Petra for her enthusiastic help dealing with administrative issues and the PhD candidates with whom I shared the offices and coffee breaks, including (but not limited to) Aulia, Rehana, Eduardo, Abhishek, and Lilin.
I am very grateful to my colleagues of the GIS Program at the National Center for Atmospheric Research. My special thanks go to Jennifer Boehnert for the countless lunches and discussions we had, which certainly helped going through this year far away from home. I also wish to thank Dr. Cassie O’Lenick for her hearty welcome and her help with
v
epidemiological data. I hope we will keep in touch and find time to collaborate in the near future. Finally, thank you to Dr. Andrew Monaghan who found time to answer my numerous requests and who showed interest in my research. I am very pleased that I had the opportunity to work with you during this year abroad and I hope we will continue collaborating on VBDs-related research in the coming years.
I am thankful to the external committee members who kindly accepted to be part of the evaluation committee of this PhD thesis, namely Prof. Joern Birkmann, Prof. Richard Sliuzas, Prof. Markus Stoffel, and Dr. Olga Wilhelmi. I also wish to thank Prof. Diana Reckien for being part of the assessment committee of the PhD proposal. I wish to extend special thanks to Prof. Marlyne Sahakian for agreeing to chair the (large) committee and for the enthusiastic help setting up the defense. I would also like to acknowledge the financial support from (i) the Environmental Governance and Territorial Development Hub/Institute (GEDT) at the University of Geneva, (ii) the Open Access fees fund at the University of Geneva, (iii) the Swiss Secretariat for Education, Research, and Innovation (SERI) within its framework “Cotutelles de these” and (iv) the Swiss National Science Foundation (SNSF) Doc. Mobility fellowship. Nobody has been more important to me in the achievement of this PhD thesis than my family and friends, with whom I have spent most of my much-needed relaxing time out of the office. I would especially like to thank my parents for their continuous support and encouragements since Day 1 and their positive response to my desire to pursue my scientific education as far as I could. Thank you also to my in-laws for the hearty welcome over the past few years. Most importantly, I wish to thank my supportive fiancée, Dr. Elodie Charrière, who found time and energy to encourage me all the way (even when this meant spending a year 8’000km away) while completing her own PhD thesis and bearing our little boy – all at the same time. A truly amazing woman.
vi
Table of Contents Foreword by the supervisor ................................................................... i Acknowledgements .............................................................................. iii List of figures ...................................................................................... x List of tables..................................................................................... xiii List of acronyms ................................................................................ xv Chapter 1 Introduction .........................................................................1
1.1 Background – A changing world ................................................2 1.1.1 Climate change ......................................................................2 1.1.2 Socioeconomic development .....................................................4 1.2 Key concepts and frameworks ..................................................6 1.2.1 Extreme heat events ...............................................................6 1.2.2 Vulnerability and risk ...............................................................8 1.2.3 Scenarios ............................................................................ 11 1.2.3.1 Representative Concentration Pathways – RCPs ......................... 13 1.2.3.2 Shared Socioeconomic Pathways – SSPs .................................. 14 1.2.3.3 Scenario Matrix Architecture – SMA ......................................... 19 1.3 Research needs and objectives ............................................... 22 1.3.1 Scholarly-relevant research needs and objectives ...................... 23 1.3.2 Policy-relevant research needs and objectives ........................... 25 1.4 Research methodology and thesis outline ................................. 26 1.4.1 Case studies ........................................................................ 26
Chapter 2 Co-use of existing scenario sets to extend and quantify the Shared Socioeconomic Pathways ..................................................................... 31
2.1 Introduction ......................................................................... 33 2.2 Current state in the (re)use and matching of existing scenario sets .................................................................................... 35 2.3 Scenario matching approach ................................................... 37 2.3.1 Selection of existing scenario sets ........................................... 37 2.3.2 Matching method .................................................................. 38 2.3.3 Leading scenario sets ............................................................ 44 2.3.4 Consistency check and quantification of the Ext-SSPs ................. 44 2.4 Outputs ............................................................................... 45 2.4.1 Narratives of the Ext-SSPs ..................................................... 45 2.4.2 Internal consistency .............................................................. 46 2.4.3 Quantification of drivers of future human vulnerability ................ 47 2.5 Discussion and conclusions ..................................................... 49
Chapter 3 Projecting drivers of human vulnerability under the Shared Socioeconomic Pathways ..................................................................... 53
3.1 Introduction ......................................................................... 55 3.2 Current State of Practice ........................................................ 56 3.2.1 Shared Socioeconomic Pathways – SSPs .................................. 56 3.2.2 Extended SSPs ..................................................................... 56
vii
3.2.3 Integration within Climate-Related Health Impact Assessments ... 57 3.2.4 Research Gaps and Needs ...................................................... 58 3.3 Methods to Project Drivers of Human Vulnerability ..................... 62 3.3.1 Existing Methods .................................................................. 62 3.3.1.1 Use of Sectoral Models .......................................................... 62 3.3.1.2 Spatial Disaggregation ........................................................... 63 3.3.2 Scenario Matching ................................................................. 63 3.3.3 Experts’ Elicitation and Correlation Analyses ............................. 67 3.3.3.1 Determination of Local Trends ................................................ 68 3.3.3.2 Quantification of the Local Trends Based on Experts’ Elicitation ............................................................................ 70 3.3.3.3 Final Projections ................................................................... 72 3.4 Discussion ........................................................................... 73 3.4.1 Addressing the Research Needs .............................................. 73 3.4.2 Limitations ........................................................................... 74 3.5 Conclusion ........................................................................... 76
Chapter 4 Influence of changes in socioeconomic and climatic conditions on future heat-related health challenges in Europe ...................................... 79
4.1 Introduction ......................................................................... 81 4.2 Methods and Data ................................................................. 83 4.2.1 Climate and socioeconomic scenarios ....................................... 83 4.2.2 Heat stress risk framework ..................................................... 84 4.2.2.1 Hazard ................................................................................ 85 4.2.2.2 Vulnerability and exposure ..................................................... 85 4.2.2.3 Integrated heat stress risk ..................................................... 88 4.3 Results ................................................................................ 89 4.3.1 Heat hazard ......................................................................... 89 4.3.2 Socioeconomic vulnerability and exposure ................................ 90 4.3.3 Future heat stress risk ........................................................... 94 4.3.3.1 Spatial clusters of risk across the multiple scenario combinations . 95 4.3.3.2 Populations exposed to very high risk ...................................... 96 4.3.3.3 Individual influence of RCPs and SSPsEU ................................... 98 4.4 Discussion ......................................................................... 100 4.4.1 Likeliness of the scenario combinations .................................. 100 4.4.2 Influence of changes in vulnerability and exposure .................. 100 4.4.3 Sensitivity analysis.............................................................. 103 4.5 Conclusion ........................................................................ 103
Chapter 5 Projections of human exposure to dangerous heat in African cities under multiple socioeconomic and climate scenarios .............................. 107
5.1 Introduction ....................................................................... 109 5.2 Methods ............................................................................ 110 5.2.1 Selection of sample cities ..................................................... 110 5.2.2 Socioeconomic scenarios and urban population projections ....... 112 5.2.3 Climate scenarios and heat index projections .......................... 115
viii
5.2.4 Exposure assessment framework .......................................... 117 5.3 Results .............................................................................. 118 5.3.1 Urban population projections ................................................ 118 5.3.2 Heat index projections ......................................................... 120 5.3.4 Climate, population, and interaction effects ............................ 125 5.3.5 Avoided exposure ............................................................... 126 5.4 Discussion ......................................................................... 129 5.4.1 Diversity of outcomes .......................................................... 129 5.4.2 Sources of uncertainty ......................................................... 129 5.4.3 Crucial role of societal pathways ........................................... 131 5.4.4 Vulnerability under the SSPs ................................................ 133 5.4.5 Caveats ............................................................................. 134 5.5 Conclusion ......................................................................... 135
Chapter 6 Characterizing the role of socioeconomic pathways in shaping future urban heat-related challenges ................................................... 137
6.1 Introduction ....................................................................... 139 6.2 Methods ............................................................................ 141 6.2.1 Spatial extent and scale ....................................................... 142 6.2.2 Extension of the global SSPs for Greater Houston .................... 143 6.2.3 Heat risk model .................................................................. 146 6.2.4 Sectoral modelling of socioeconomic projections ...................... 147 6.2.4.1 Demographic projections ..................................................... 148 6.2.4.2 Social isolation and poverty projections .................................. 149 6.2.4.3 Air conditioning projections .................................................. 149 6.2.5 Land use projections ........................................................... 150 6.2.6 Urban climate projections .................................................... 151 6.2.7 Integrated heat-related mortality assessment ......................... 152 6.3 Results .............................................................................. 153 6.3.1 Demographic growth and future vulnerability .......................... 153 6.3.2 Land use change ................................................................. 155 6.3.3 Future urban heat hazard ..................................................... 156 6.3.4 Heat-related mortality ......................................................... 158 6.3.5 Individual contributions ....................................................... 160 6.4 Discussion ......................................................................... 163 6.4.1 Crucial role of the socioeconomic pathways ............................ 163 6.4.2 Applicability of the scenario framework at the urban scale ........ 164 6.4.2.1 Urban extended SSPs .......................................................... 164 6.4.2.2 Multi-scale quantification of vulnerability drivers ...................... 165 6.4.2.3 Influence of SSPs-driven land use on urban climate ................. 165 6.4.2.4 Usefulness of the scenario matrix .......................................... 166 6.4.3 Caveats ............................................................................. 166 6.5 Conclusions ........................................................................ 167
Chapter 7 Assessing urban heat-related adaptation strategies under multiple plausible futures .............................................................................. 169
ix
7.1 Introduction ....................................................................... 171 7.2 Adaptation within the SSP-RCP framework .............................. 173 7.3 Methods ............................................................................ 174 7.3.1 Case study ......................................................................... 174 7.3.2 Heat risk model .................................................................. 175 7.3.3 Scenario setting ................................................................. 175 7.3.4 Socioeconomic and land use projections ................................. 176 7.3.5 Urban climate projections .................................................... 177 7.3.6 Adaptation strategies .......................................................... 178 7.3.6.1 Design and quantification ..................................................... 178 7.3.6.2 Assessment of effectiveness ................................................. 180 7.4 Results and discussion ......................................................... 181 7.4.1 Heat hazard projection ........................................................ 181 7.4.2 Adaptation targeting the heat hazard ..................................... 182 7.4.4 Adaptation-driven decrease in vulnerability ............................. 187 7.4.5 Effectiveness versus challenges to implementation .................. 188 7.5 Conclusions ........................................................................ 190
Chapter 8 Conclusions and outlook .................................................... 193 8.1 Main achievements and findings ............................................ 194 8.1.1 Extending the global SSPs .................................................... 194 8.1.2 Projecting future heat-related vulnerability ............................. 197 8.1.3 Providing concrete application of the SSP-RCP framework ......... 199 8.1.4 Integrating adaptation within the SSP-RCP framework .............. 202 8.1.5 Detecting severe increase in heat stress risk ........................... 203 8.1.6 Uncovering a wide range of possible outcomes ........................ 206 8.1.7 Demonstrating the central role of socioeconomic pathways ....... 208
..................................................................................................... 210 8.2 Challenges and caveats ....................................................... 212 8.2.1 Relevance of the global SSPs at the local scale ........................ 212 8.2.2 Quantification of future exposure and vulnerability .................. 213 8.2.3 Quantification of heat stress risk ........................................... 215 8.2.4 Influence of SSPs on climate hazard ...................................... 217 8.3 Recommendations for further research ................................... 218
References ...................................................................................... 223 Summary ........................................................................................ 255 Samenvatting .................................................................................. 257
x
List of figures Fig. 1.1 – (a) Concentration of carbon dioxide (in ppm) during ice ages and warm periods for the past 800’000 years; (b) Link between the global temperature (in °C) and concentration of carbon dioxide (in ppm); (c) Global temperature change (in °C) relative to 1986-2005 for the RCPs scenarios ... 3 Fig. 1.2 – (a) Population projections (in billions) for different world regions, using the medium-variant UN projections; (b) Projections of the share of urban population (in %); (c) Share of population with no formal population (in %) ......................................................................................................... 5 Fig. 1.3 – (a) Global and regional (Russia and Europe) median time series of the Heat Wave Magnitude Index relative to 1980-2100, under different climate scenarios; (b) Probability of occurrence of extreme humid heat waves at different warming levels relative to 1861-1880; (c) Schematized urban heat island effect for different urban morphologies .......................................... 8 Fig. 1.4 – Conceptual risk framework developed in IPCC SREX report and IPCC AR5 and used throughout the doctoral thesis ......................................... 10 Fig. 1.5 – (a) Sequential approach used to develop previous IPCC scenario sets; (b) Parallel approach/process used to develop the SSP-RCP framework ....................................................................................................... 12 Fig. 1.6 – (a) Trends in cumulative 21st century CO2 emission relative to radiative forcing; (b) Trends in radiative forcing under the different RCPs . 13 Fig. 1.7 – The five SSPs representing unique combinations of challenges to adaptation and challenges to mitigation ................................................ 14 Fig. 1.8 – Quantitative trends of key variables (GDP, population, urban population, education, and the share of elderly) under the five SSPs, for Switzerland ....................................................................................... 18 Fig. 1.9 – Scenario matrix architecture (SMA) made of SSPs, RCPs, and SPAs ....................................................................................................... 21 Fig. 1.10 – Location of the three different case studies employed throughout this doctoral thesis, namely European Union, African cities, and Houston (Texas) ............................................................................................. 28 Fig. 2.1 – Workflow of the scenario matching method to extend the SSPs, and definitions of key terms in the context of the method described in this paper ............................................................................................... 39 Fig. 2.2 – Categorization of assumptions (a) and pairwise scores for all 121 comparisons (b) for the Demography domain. The combination of the latter for all the domains led to the averaged multi-domains pairwise scores (c) ...... 42 Fig. 2.3 – Graphical analysis based on the averaged (multi-domains) pairwise scores. Thick and thin lines represent pairs of scenarios with very good and good match respectively ..................................................................... 43 Fig. 2.4 – Influence of the three Ext-SSPs on a number of drivers of human vulnerability, assessed in terms of changes compared to the baseline (2010) conditions, for 259 sub-national regions (NUTS-2), in 2050 ...................... 48
xi
Fig. 3.1 – Sample of the available projections of variables related to human vulnerability, under the three extended SSPs (2050) and the baseline (2015) conditions ......................................................................................... 66 Fig. 3.2 – Workflow of the projection method based on experts’ elicitation and correlation analyses ............................................................................ 68 Fig. 3.3 – Center of gravity (blue line) for each trend category ................ 71 Fig. 3.4 – Projections of the prevalence of overweight and of the proportion of elderly living alone, under the four European SSPs (2050) and for current conditions (2015) ............................................................................... 73 Fig. 4.1 – Mean number of summer heat wave days (HWDs) for the baseline (1986-2005) and future (2041-2060) conditions under three RCPs ............ 90 Fig. 4.2 – Spatial distribution of the six drivers of vulnerability, the vulnerability index, and population exposure at the grid-cell level, for baseline socioeconomic conditions and for the year 2050 under the four SSPsEU ...... 93 Fig. 4.3 – Vulnerability index in Europe for the baseline socioeconomic conditions (2015) and for the year 2050 under the four SSPsEU ................. 94 Fig. 4.4. – Scenario matrix representing the spatially explicit multi -model-median heat stress risk for the 17 scenario combinations ......................... 96 Fig. 4.5 – Scenario matrix representing the number of people (in millions) per quintile of heat stress risk – from very low (1st) to very high (5th) – based on multi-model-median risk values for each of the 17 scenario combinations... 97 Fig. 4.6 – Changes in millions of people exposed to high or very high heat stress risk compared to the baseline situation (in red), when assuming changes in climatic conditions alone – for each RCP – or changes in socioeconomic conditions alone – for each SSPEU –, in each European sub-domains .......... 99 Fig. 4.7 – Million people at high/very high risk per region assuming changes in climatic conditions only, changes in both climatic and socioeconomic conditions, and changes in climatic and socioeconomic conditions with fixed population ....................................................................................... 102 Fig. 5.1 – (a) Location of the 173 investigated cities with 2015 population (million), covering the five African regions; (b) Sum of the population (million) for each country covered by the selected cities .................................... 111 Fig. 5.2 – (a) Schematic workflow of the spatial (SP) and non-spatial (NS) approaches to compute cities population projections; (b) Example of cities that currently share a common urban extent; (c) Example of future cities’ boundaries ...................................................................................... 115 Fig. 5.3 – (a) Population projections (in million people) of the cities investigated; (b) Projections of the number of megacities for the whole continent, under the five SSPs ........................................................... 120 Fig. 5.4 – (a) Projections of HI averaged over the continent or regions under different RCPs and time-periods; (b) Projections of the number of cities that exceed a given mean HI threshold, under different RCPs and time-periods 122
xii
Fig. 5.5 – Projections of exposure (in billion person-days) averaged over different time-horizons, (a) for the whole continent and regions, and (b) for the ten most exposed cities ............................................................... 124 Fig. 5.6 – Population, climate, and interaction effect under five selected combinations of SSP-RCP, by the 2030s, 2060s, and 2090s, for Africa, the five African regions, and the ten most exposed cities ................................... 126 Fig. 5.7 – Relative reduction in exposure (%) triggered by shifts in RCPs and by shifts in SSPs (high, medium, and low) ........................................... 128 Fig. 5.8 – Yearly exposure (smoothed) in billion person-days, aggregated at the continental and regional scale, for five selected SSP-RCP combinations ................................................................................... 131 Fig. 6.1 – Methodological framework of the study ................................ 141 Fig 6.2 – Geographical extent of Greater Houston, its 8 Counties and its 1,067 Census tracts, and the spatial extent of the City of Houston ................... 143 Fig. 6.3 – Sectoral modeling of the drivers of vulnerability .................... 147 Fig. 6.4 – (a) Projections of population and vulnerability drivers aggregated for Greater Houston, and (b) spatial patterns (Census tract-level) of projections of population and selected vulnerability drivers..................... 155 Fig. 6.5 – Spatial patterns (1-km grid) of urban fraction and land use, for current conditions (Baseline, year 2010) and future conditions (H-SSP-specific, year 2050) ...................................................................................... 156 Fig. 6.6 – (a) Daily Tmin (°C) in summer averaged at the Census tract level, (b) Mean difference in daily Tmin (°C) in summer between baseline land use and H-SSP-specific land use, and (c) Mean number of days per summer when daily Tmin>27°C .............................................................................. 158 Fig. 6.7 – (a) Spatial patterns of heat-related summer mortalities under different scenario combinations; (b) Excess mortality due to climate change only; (c) Averaged number of mortalities and relative risk aggregated for Greater Houston .............................................................................. 160 Fig. 6.8 – (a) Excess mortality (compared to the historical situation) at the County and regional scale; (b) Spatial patterns of dominant effects at the Census-tract level ............................................................................ 162 Fig. 7.1 – Integration of adaptation-oriented Shared Policy Assumptions (SPAs) within the scenario matrix architecture ...................................... 174 Fig. 7.2 – (a) Census tract-level distribution of decrease in Tmin (°C) due to adaptation; (b) County-level mean decrease in the number of warm nights; (c) Census-tract level decrease in the number of warm nights due to adaptation or mitigation .................................................................... 184 Fig. 7.3 – (a) Census tract-level distribution of vulnerability under each H-SSP; (b) Census tract-level spatial patterns of increase or decrease in vulnerability relative to the baseline; (c) County-level mean effectiveness of the autonomous adaptation ............................................................... 186 Fig. 7.4 – (a) County-level mean effectiveness of adaptation options; (b) Census-tract level spatial pattern of effectiveness of combinations of
xiii
adaptation options; (c) County-level mean effectiveness of the addition of autonomous adaptation and combinations of adaptation options ............ 188 Fig. 7.5 – Effectiveness of adaptation options in relation to challenges to implementation, under each H-SSP, for each adaptation option individually ..................................................................................................... 190 Fig. 8.1 – Diversity of spatial scales and locations found in the 28 IAV studies employing the SSP-RCP framework to explore future heat stress risk ..................................................................................................... 201 Fig. 8.2 – Diversity of drivers of heat-related vulnerability found in the 9 IAV studies employing the SSP-RCP framework and projections of vulnerability to explore future heat stress risk ............................................................ 202 Fig. 8.3 – Combined projections of future heat stress risk in Europe, African cities, and Houston, using the median scenario for each case-study ......... 204 Fig. 8.4 – Combined projections of future heat stress risk for Europe (a), 173 different African cities (b), and Houston, Texas (c) .............................. 206 Fig. 8.5 – Overview of the SSP-RCP combinations employed in the three different case studies of this doctoral thesis ......................................... 207 Fig. 8.6 – Synthesis of the current level and the future range of heat stress risk for each case study, for the 2050s (Europe and Houston) or the 2090s (African cities) ................................................................................. 208 Fig. 8.7 – Socioeconomic, climate, and interaction effects in the three case studies for a few selected SSP-RCP combinations .................................. 210 Fig. 8.8 – Avoided impacts (in %) due to shifts in SSPs and to shifts in RCPs across the three case studies ............................................................ 211 Fig. 8.9 – Overview of the places (colored dots) where quantitative relationships between heat and mortality have been documented, as reviewed by (a) Gasparrini et al. (2017) and (b) Mora et al. (2017) ..................... 216
List of tables
Table 1.1 – Research methodology linking the case studies, work packages (WP) and scholarly- and policy-relevant research objectives (SR and PR respectively) ..................................................................................... 30 Table 2.1 – Shared elements (bold) and non-shared elements (italic) – classified into domains – for which clear assumptions about their future state were depicted in certain scenario sets (grey cells) ................................... 40 Table 2.2 – Categorized narratives’ assumptions of the three Ext-SSPs for the 46 elements investigated .................................................................... 46 Table 3.1 – Statements from assessments of future climate-related health impacts based on SSPs and RCPs - with, in addition, one review study (*) and two IAV studies (**) that do not make use of the SSPs but which reflect typical statements found in the literature ........................................................ 60 Table 3.2 – Groups of scenarios sharing similar storylines, matched with the scenario matching approach ................................................................ 65
xiv
Table 3.3 – Quantitative projections of relevant variables related to human vulnerability that are readily available through the scenario matching approach for the three Ext-SSPs ........................................................................ 67 Table 3.4 – Trends in future prevalence of overweight in Europe under each European SSP (EU-SSPs) and extended SSPs for health ........................... 69 Table 3.5 – Trends in future proportion of elderly living alone in Europe under each European SSP (EU-SSPs) ............................................................. 70 Table 3.6 – Scenario-specific adjustments factors, i.e., percentage of increase or decrease for the period 2015–2050, for overweight prevalence at the European level and for the proportion of elderly living alone at the Sub-European level ................................................................................... 72 Table 4.1 – Determinants of socioeconomic vulnerability to heat stress in Europe ............................................................................................. 86 Table 5.1 – Main assumptions of the five SSPs for population growth, urbanization level, and spatial pattern of urbanization ........................... 112 Table 6.1 – Datasets (and sources) employed to project future socioeconomic and climatic conditions across Greater Houston .................................... 142 Table 6.2 – Qualitative trends for a number of elements under the four extended SSPs for Greater Houston (H-SSPs) ....................................... 146 Table 6.3 – List of experiments conducted to disentangle the individual and combined contribution of each driver of heat-related mortality ................ 153 Table 7.1 – Qualitative development trends of key elements of the four H-SSPs .............................................................................................. 176 Table 7.2 – List of adaptation options investigated in this study, along with their associated targets, ambitiousness, quantification, and acronym ....... 180
xv
List of acronyms
AC Air Conditioning AR Assessment Report ASRE Age-Sex-Race/Ethnicity AT Apparent Temperature B Billion CLIMSAVE Climate Change Integrated Assessment Methodology for Cross-Sectoral Adaptation and Vulnerability in Europe CMIP Coupled Model Intercomparison Project CORDEX Coordinated Regional Climate Downscaling Experiment DEMIFER Demographic and Migratory Flows Affecting European Regions and Cities ET2050 Territorial Scenarios and Visions for Europe EU European Union GDP Gross Domestic Product HI Heat Index HRLDAS High Resolution Land Data Assimilation System HWD Heat Wave Days IAM Integrated Assessment Modelling IAV Impacts, Adaptation, and Vulnerability IMPRESSIONS Impacts and Risks from High-end Scenarios: Strategies for Innovative Solutions IPCC Intergovernmental Panel on Climate Change IQR Interquartile Range NUTS Nomenclature of Territorial Units for Statistics NWS National Weather Service of the United States M Million MUR Mega Urban Region RCM Regional Climate Model RCP Representative Concentration Pathway RH Relative Humidity SIMMER System for Integrated Modeling of Metropolitan Extreme Heat Risk SMA Scenario Matrix Architecture SPA Shared Policy Assumption SRES Special Report on Emissions Scenarios SREX Special Report on Managing the Risks of Extreme Events and Disasters to Advance Climate Change Adaptation SSP Shared Socioeconomic Pathways UGR Urban Growth Rate UHI Urban Heat Island UN United Nations US United States

xvi
WUP World Urbanization Prospects WP Work Packages

1
Chapter 1 Introduction
Background – a changing world
2
1.1 Background – A changing world A changing world. From climate change through demographic growth to urbanization, digital transformation, biodiversity erosion, and globalization, there is no doubt that we live in a changing world. This section describes the two main global changes around which this doctoral thesis revolves, that is, the human-induced climate change and the socioeconomic development of the 21st century.
1.1.1 Climate change
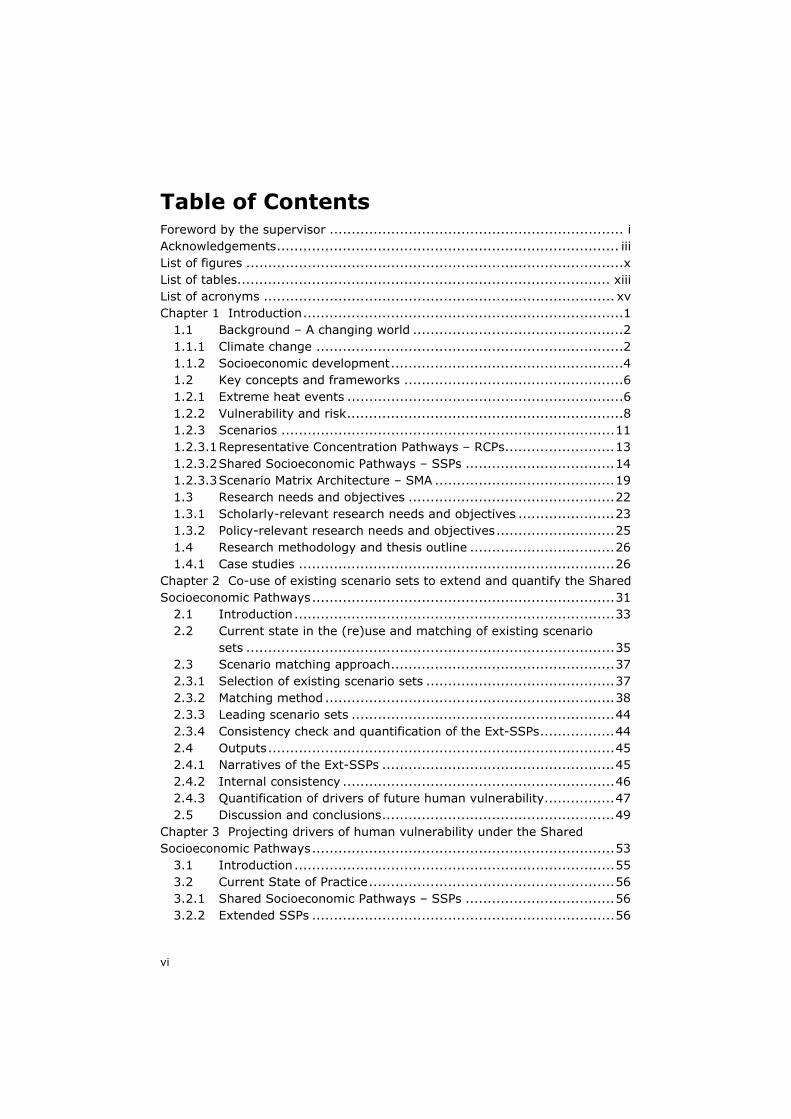
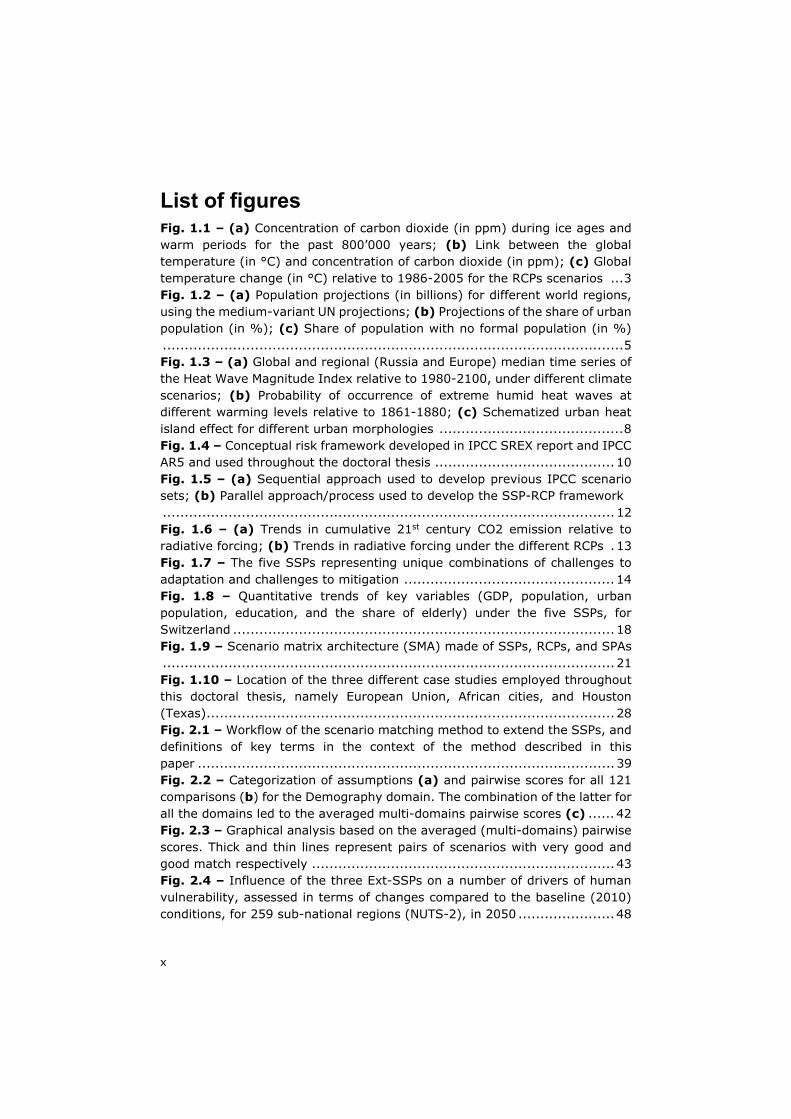
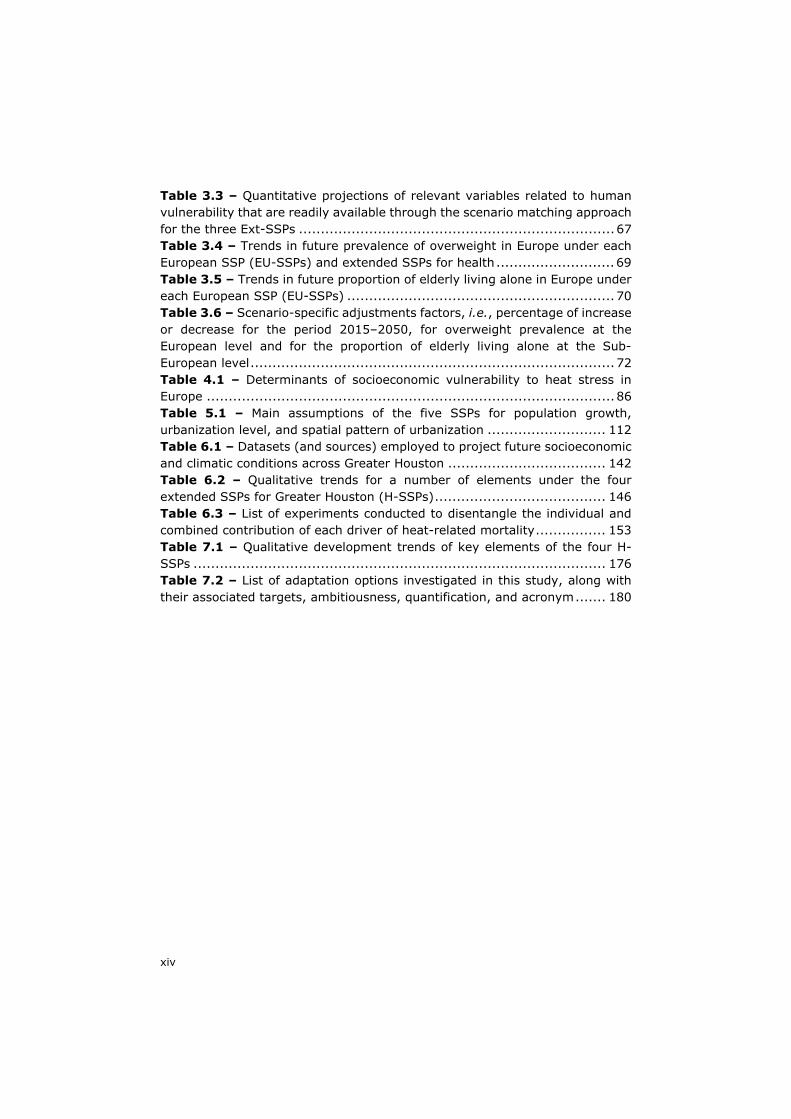
In 1824, the French physicist Joseph Fourier was one of the first scientists to portray the Earth’s atmosphere as the windows of a greenhouse. Decades later, John Tyndall, an Irish chemist, demonstrated experimentally the absorption and emission of infrareds by the carbon dioxide, rapidly followed by the work of the Swedish physicist Svante Arrhenius, who described in 1896 the links between atmospheric carbon dioxide concentration and surface temperature. Almost a century of research later, in 1988, James Hansen delivered his iconic speech in front the US Senate – asserting that the greenhouse effect is changing our climate with a 99% confidence – and the United Nations Environment Program and the World Meteorological Organization came together to jointly establish the Intergovernmental Panel on Climate Change (IPCC), the internationally-recognized authority on the science of climate change. Since then, the IPCC has produced five assessments reports (AR1-5) – and is currently overseeing the production of AR6 – depicting the scientific basis of human-induced climate change, its impacts, and existing options for mitigation and adaptation. Among other things, the climate change research community has shown that recent human activities – such as the burning of fossil fuels and the land conversion for forestry and agriculture – has led to the anthropogenic emissions of unprecedented amounts of greenhouse gases (Figure 1.1a) such as carbon dioxide, methane, halocarbons, or nitrous oxide, in turn leading to an increase in global temperatures since the industrial revolution (Figure 1.1b). Because of the long lifetime of most greenhouse gases and of the continuing anthropogenic emissions, global temperatures are expected to keep rising throughout the 21st century (Figure 1.1c), accompanied by substantial changes in precipitation patterns, sea level rise, and increased intensity, frequency, duration, and spatial extent of climate-related extreme events such as floods, droughts, wild fires, and heat waves (IPCC, 2013). The latter constitute the main climate-related hazard of interest in this doctoral thesis. Such changes in climate are causing a wide range of climate impacts on both natural and human systems on all continents across the globe and at all spatial scales. Climate change affects human systems – in particular human health
Chapter 1
3
and livelihoods – through three major pathways (IPCC, 2014): (i) direct impacts – mainly related to sea level rise and to changes in the intensity and frequency of extreme weather events – such as property damage in low-lying coastal areas, and increased heat-related morbidity and mortality; (ii) indirect impacts mediated by natural systems, such as increased exposure to vector-borne diseases (e.g. dengue) and increased exposure to water and air pollution leading to long-term diseases; and (iii) indirect impacts mediated by human systems, such as the increased risk of hunger and malnutrition due to reduced yields, climate-induced displacement of people, increased threats to human security, and heat-related loss in labor productivity.
Fig. 1.1 – (a) Concentration of carbon dioxide (in ppm) during ice ages and warm periods for the past 800’000 years (adapted from NOAA, 2018); (b) Link between the global temperature (in °C) and concentration of carbon dioxide (in ppm) from 1880 to 2012 (adapted from Walsh et al., 2014; scale starts at 13.5°C for better visualization); (c) Global temperature change (in °C) relative to 1986-2005 for the RCPs scenarios run by CMIP5 (adapted from Knutti and Sedláček, 2012).
Background – a changing world
4
Climate change is not the only global phenomenon to profoundly alter the world we live in. Socioeconomic development and its associated megatrends are also influencing and shaping the future of our modern society. These are described next.
1.1.2 Socioeconomic development
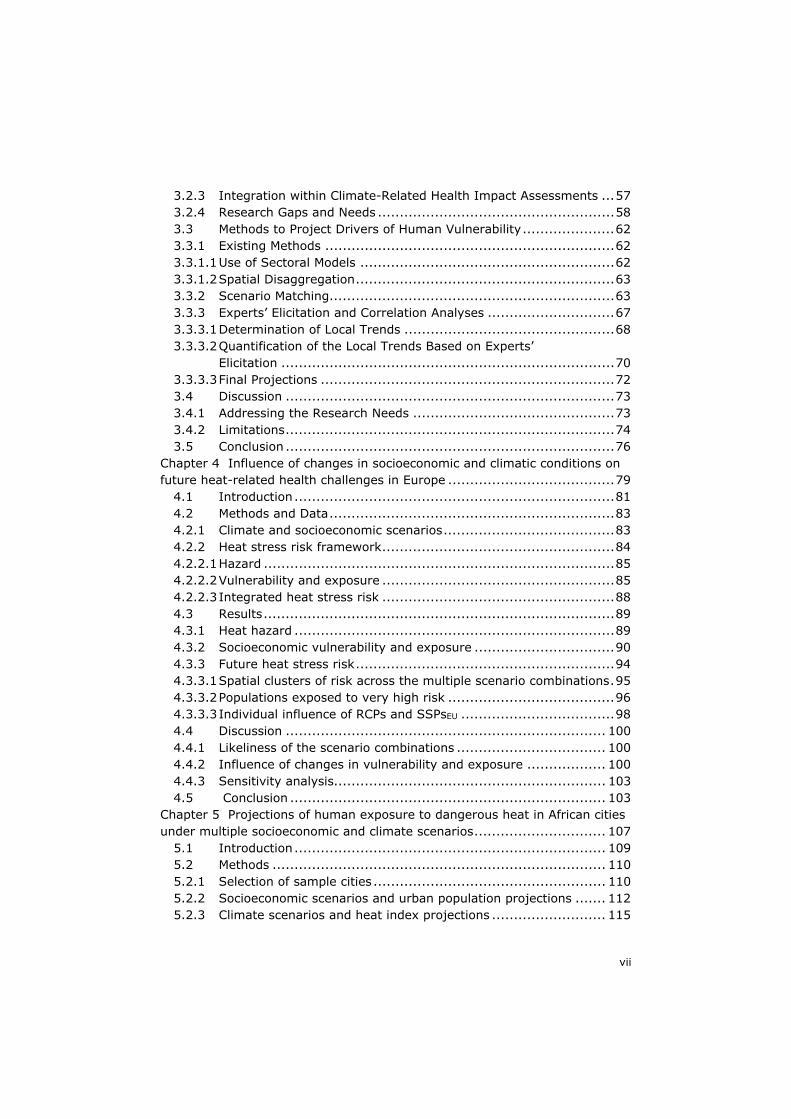
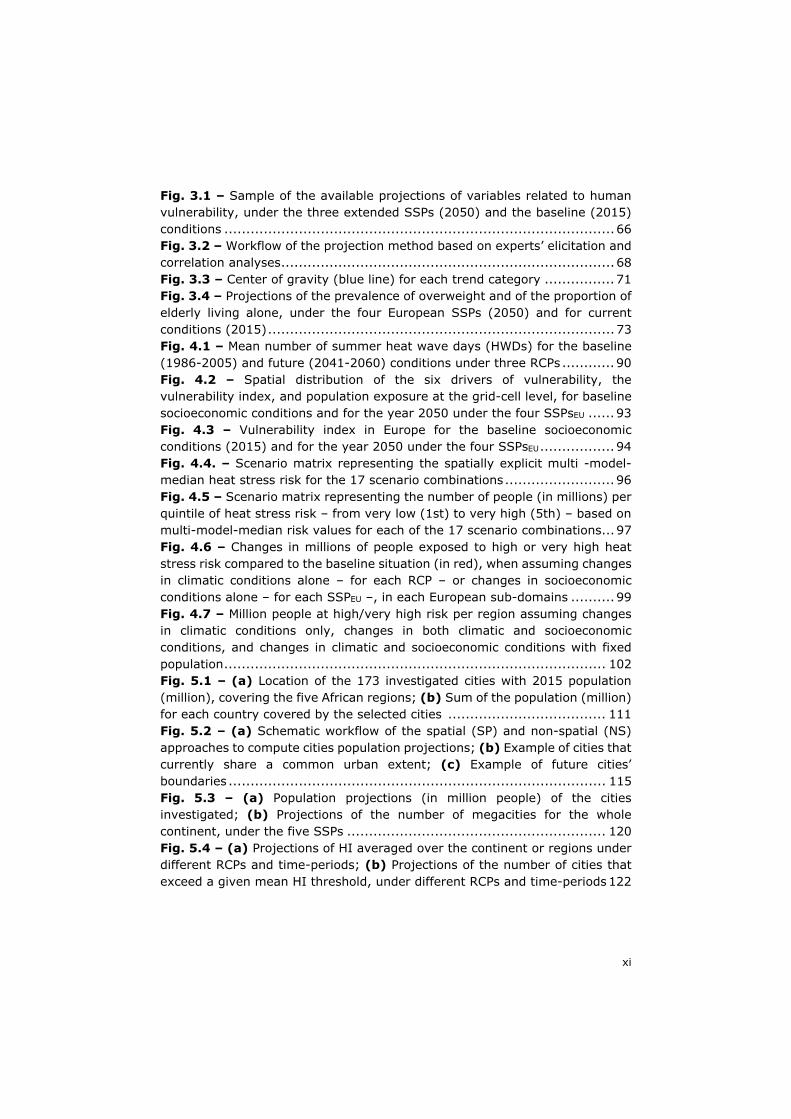
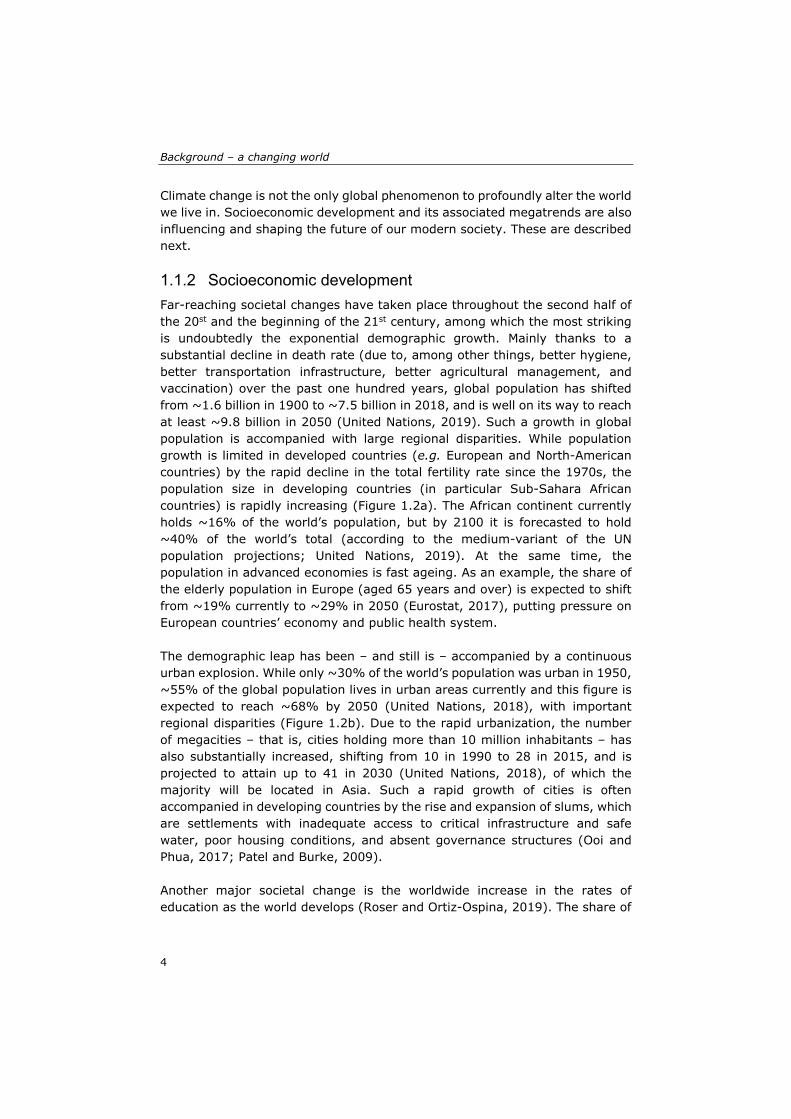
Far-reaching societal changes have taken place throughout the second half of the 20st and the beginning of the 21st century, among which the most striking is undoubtedly the exponential demographic growth. Mainly thanks to a substantial decline in death rate (due to, among other things, better hygiene, better transportation infrastructure, better agricultural management, and vaccination) over the past one hundred years, global population has shifted from ~1.6 billion in 1900 to ~7.5 billion in 2018, and is well on its way to reach at least ~9.8 billion in 2050 (United Nations, 2019). Such a growth in global population is accompanied with large regional disparities. While population growth is limited in developed countries (e.g. European and North-American countries) by the rapid decline in the total fertility rate since the 1970s, the population size in developing countries (in particular Sub-Sahara African countries) is rapidly increasing (Figure 1.2a). The African continent currently holds ~16% of the world’s population, but by 2100 it is forecasted to hold ~40% of the world’s total (according to the medium-variant of the UN population projections; United Nations, 2019). At the same time, the population in advanced economies is fast ageing. As an example, the share of the elderly population in Europe (aged 65 years and over) is expected to shift from ~19% currently to ~29% in 2050 (Eurostat, 2017), putting pressure on European countries’ economy and public health system. The demographic leap has been – and still is – accompanied by a continuous urban explosion. While only ~30% of the world’s population was urban in 1950, ~55% of the global population lives in urban areas currently and this figure is expected to reach ~68% by 2050 (United Nations, 2018), with important regional disparities (Figure 1.2b). Due to the rapid urbanization, the number of megacities – that is, cities holding more than 10 million inhabitants – has also substantially increased, shifting from 10 in 1990 to 28 in 2015, and is projected to attain up to 41 in 2030 (United Nations, 2018), of which the majority will be located in Asia. Such a rapid growth of cities is often accompanied in developing countries by the rise and expansion of slums, which are settlements with inadequate access to critical infrastructure and safe water, poor housing conditions, and absent governance structures (Ooi and Phua, 2017; Patel and Burke, 2009). Another major societal change is the worldwide increase in the rates of education as the world develops (Roser and Ortiz-Ospina, 2019). The share of
Chapter 1
5
population with no formal education has been rapidly declining in the past decades (particularly in developing countries) and will keep decreasing in the next decades (Figure 1.2c), accompanied by an increase in the share of population with higher education in both developed and developing economies where advanced skills become more important. Other important societal changes that are shaping the 21st century are (i) technological breakthrough (Retief et al., 2016): the pace of technological change – particularly in the fields of communication, information, digitalization, artificial intelligence, and medicine – is unprecedented and will continue to transform our world; (ii) economic development (Siddiqui, 2016): the global economic expansion – partly fueled by an increasing globalization – since the end of the 20st century is forecasted to continue throughout the 21st century; (iii) changing disease burdens (Murray and Lopez, 2013): influenced by the rapidly changing social and economic conditions and increased ageing, the global burden from non-communicable disease (such as cancers and diabetes) is now larger than that from communicable diseases and keeps increasing, putting pressure on health systems and challenging people’s lifestyles; and (iv) increased demand and production (Schneider et al., 2011): as the world develops and global population grows, the demand (and therefore the extraction/production) in raw material supplies, food, goods, energy, and water supply is rapidly increasing, threatening most natural systems across the globe.
Fig. 1.2 – (a) Population projections (in billions) for different world regions, using the medium-variant UN projections as an example (adapted from United Nations, 2019); (b) Projections of the share of urban population (in %) for different selected countries representative of their respective region (adapted from United Nations, 2019); (c) Share of population with no formal population (in %) for different selected countries representative of their respective region (adapted from Roser and Nadgy, 2019).
Background – a changing world
6
1.2 Key concepts and frameworks This doctoral thesis revolves around a number of key concepts and frameworks that have been described by a large body of existing literature and that are introduced in this section. In particular, this section (i) defines what extreme heat events and their main impacts and how they can be measured, (ii) introduces the different conceptualizations of vulnerability and risk and presents the latest IPCC risk framework that is used throughout this thesis, (iii) defines what scenarios are, with a focus on the IPCC-guided new scenario framework for climate change research, and (iv) provides an overview of the past and newly-developed approaches to assess future climate-related risks.
1.2.1 Extreme heat events
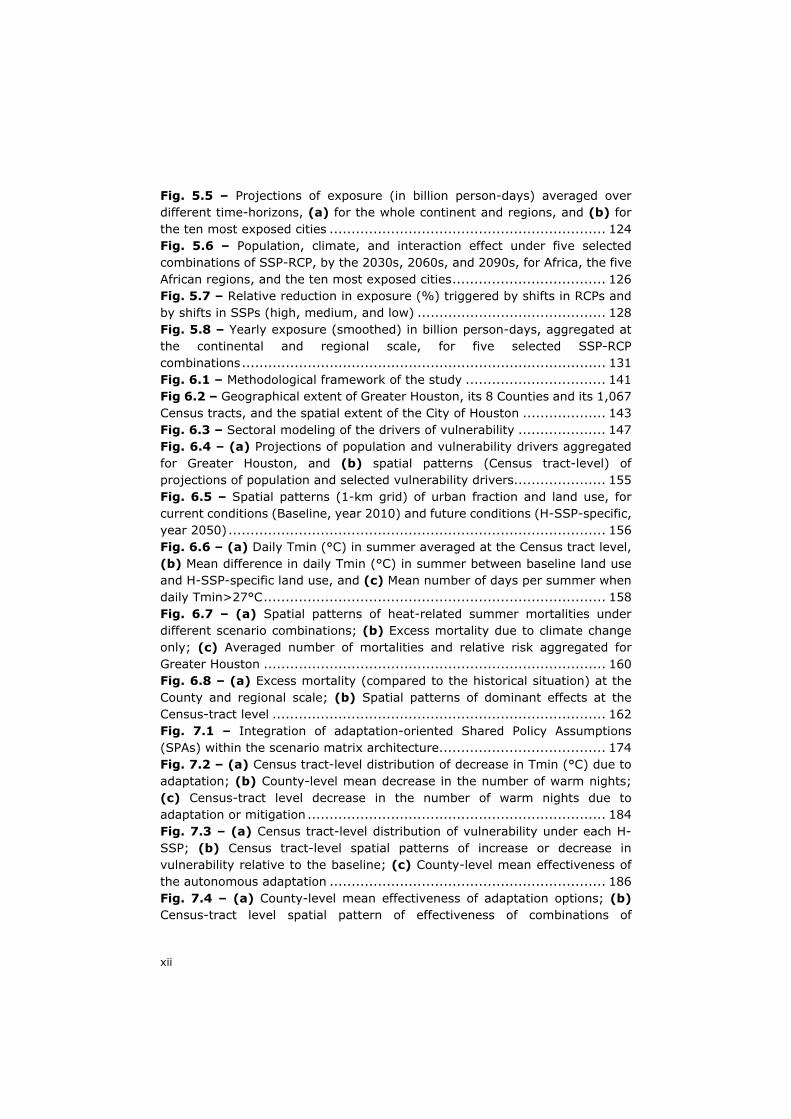
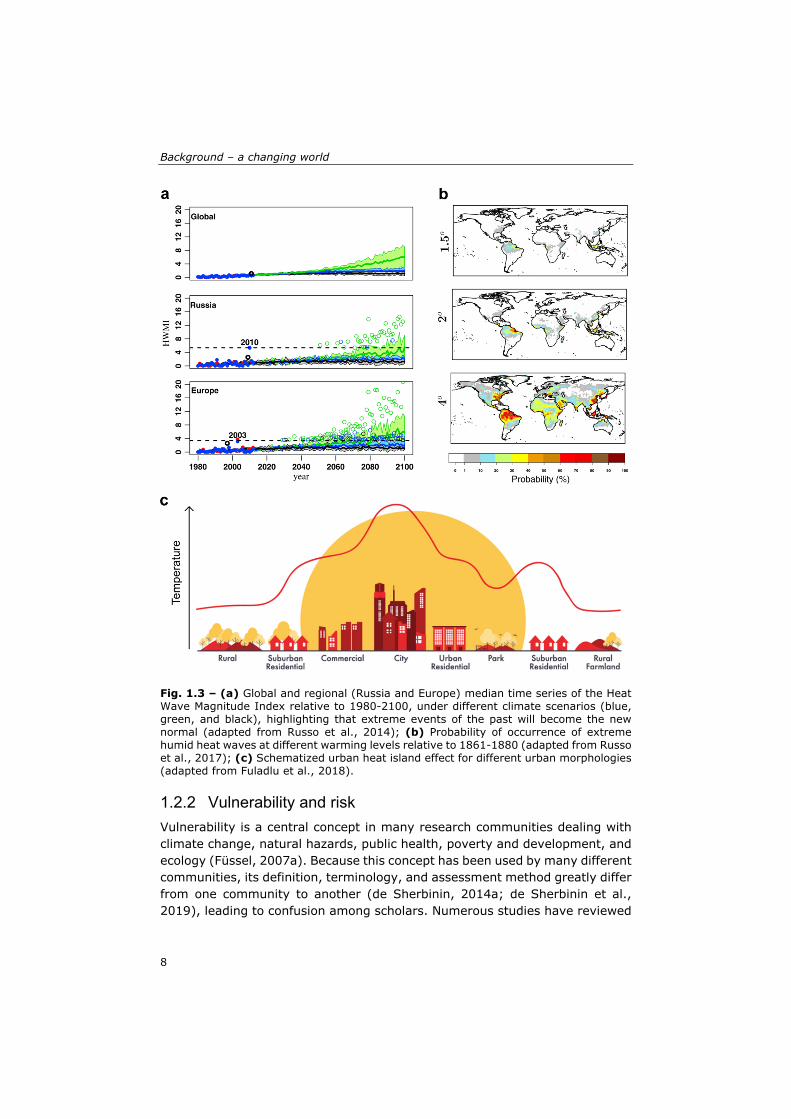
Extreme heat events, which can be broadly defined as periods of abnormally high temperature in a given location, are one of the deadliest climate-related hazards. Extreme temperatures, by threatening the body’s thermoregulation mechanism, can lead to heat exhaustion, heat stroke, and death. These are referred to as heat stress throughout this doctoral thesis. A few recent examples of particularly deadly heat waves include (i) the 1995 Chicago heat wave that caused ~700 deaths over five days, (ii) the 2003 European heat wave that caused ~70’000 deaths in two months, (iii) the 2010 Russian heat wave that caused ~54’000 deaths over one summer, (iv) the 2015 Indian heat wave that caused ~2’500 deaths over a period of two weeks, and (v) the 2018 Japan heat wave that caused ~1’000 deaths over the summer. Recent research suggests that the latter could not have happened without climate change (Imada et al., 2019). There is no doubt that climate change is leading to an increase in the frequency, intensity, duration, and spatial extent of extreme heat events worldwide (Dosio et al., 2018; Fischer and Schär, 2010; Figure 1.3a), which in turn will lead to a rise in heat-related death tolls worldwide (Gasparrini et al., 2017; Mora et al., 2017). There are several ways of defining and measuring heat waves, leading to a wide range of extreme heat metrics (Bao et al., 2015; Perkins, 2015). Existing extreme heat metrics differ on three main aspects. The first is the climatic variable(s) that is (are) accounted for. Some studies account for daily maximum temperatures (e.g. Russo et al., 2014), while others account for daily minimum temperatures (e.g. Marsha et al., 2018) – as it influences the ability to cool off at night, which is an important aspect of heat-related morbidity and mortality (Kovats and Hajat, 2008) – or a combination of the two. Because the air temperature can be different from the apparent temperature (that is, the perceived temperature), some studies also account for the relative humidity and wind speed to approximate the apparent temperature, using metrics such as the US National Weather Service Heat Index (NWS, 2014), the Canadian Humidex (Environment Canada, 2019), or
Chapter 1
7
the wet-bulb globe temperature (e.g. Coffel et al., 2018). It is particularly important to account for the apparent temperature – instead of the air temperature – in places where the majority of heat waves are considered as humid (i.e., tropical and sub-tropical regions; Figure 1.3b), as relative humidity further threatens the body’s ability to thermoregulate (Davis et al., 2016). The second aspect that differs across heat metrics is the threshold to define extreme temperatures. Depending on the spatial scale and the location, some studies use relative thresholds – e.g. 90th or 95th percentile of the historical climatic conditions (e.g. Fischer and Schär, 2010) – while some others use fixed thresholds – e.g. apparent temperature of 40.6°C (Matthews et al., 2017) – or a combination of the two (Dong et al., 2015; Liu et al., 2017). Finally, the third main divergence across heat metrics is the consideration of the heat event’s duration. On the one hand, a large number of heat metrics include a threshold of duration, such as 3 or 6 consecutive days of extreme temperatures (e.g. Dong et al., 2015). On the other hand, a few studies do not include a minimum required duration in the definition of the heat metric (e.g. Asefi-Najafabady et al., 2018; Matthews et al., 2017), as one-day extreme heat events can also lead to health impacts. Extreme heat events are particularly impactful in urban areas, not only because cities are places where people and assets are concentrated, but also because they create a warmer microclimate due to the replacement of natural vegetation with artificial surfaces. The difference in temperature between the inner city and its rural surrounding is known as the urban heat island (UHI) effect (Oke, 1973; Figure 1.3c) and has been evidenced to attain up to 12°C (Oke, 1995). The UHI effect is affected by cities’ morphological factors (e.g. soil sealing, lack of green and blue areas, structures hindering ventilation, building materials) as well as by human activities, e.g. additional heat produced by transportation systems and air conditioning devices (EPA, 2008).
Background – a changing world
8
Fig. 1.3 – (a) Global and regional (Russia and Europe) median time series of the Heat Wave Magnitude Index relative to 1980-2100, under different climate scenarios (blue, green, and black), highlighting that extreme events of the past will become the new normal (adapted from Russo et al., 2014); (b) Probability of occurrence of extreme humid heat waves at different warming levels relative to 1861-1880 (adapted from Russo et al., 2017); (c) Schematized urban heat island effect for different urban morphologies (adapted from Fuladlu et al., 2018).
1.2.2 Vulnerability and risk
Vulnerability is a central concept in many research communities dealing with climate change, natural hazards, public health, poverty and development, and ecology (Füssel, 2007a). Because this concept has been used by many different communities, its definition, terminology, and assessment method greatly differ from one community to another (de Sherbinin, 2014a; de Sherbinin et al., 2019), leading to confusion among scholars. Numerous studies have reviewed
Chapter 1
9
the concept of climate-related vulnerability (e.g. Adger, 2006; Eakin and Luers, 2006; Füssel and Klein, 2006; Gallopin, 2006; Nelson et al., 2010) and several have attempted to resolve the confusion surrounding this concept (Füssel, 2007a; Nelson et al., 2010; Preston et al., 2011; de Sherbinin, 2014a). Existing studies concluded that two distinct interpretations of vulnerability can be found in the field of climate change research: Outcome vulnerability. Also named integrated cross-scale vulnerability, it
represents an integrated vulnerability concept that incorporates information on climate impacts and the socioeconomic ability to cope and to adapt (Füssel, 2009). Drawing upon this, the IPCC has more specifically defined the vulnerability of a system as a function of the magnitude of the climate hazard to which it is exposed (defined as the exposure), its characteristics that influence its response to the climate hazard (defined as the sensitivity), and its capacity to cope with the climate hazard (defined as the adaptive capacity). This conceptualization of vulnerability – also assimilated to the end-point interpretation (Kelly and Adger, 2000) – has been used by the IPCC in its third and fourth assessment report (AR3 and AR4; IPCC, 2001, 2007) and has been widely used by the climate change research community until recently.
Contextual vulnerability. Also known as internal social vulnerability
(O’Brien et al., 2007), it mainly focuses on determinants affecting the ability of a system or individuals to face and cope with climate-related hazards. This conceptualization, originally rooted in the political economy approach (Füssel, 2009), can be viewed as the combination of the concepts of sensitivity and adaptive capacity depicted in the outcome vulnerability interpretation, and can be put more simply as the propensity or predisposition to be adversely affected by climate-related hazards. This conceptualization of vulnerability – also assimilated to the starting-point interpretation (Kelly and Adger, 2000) – has been widely used in the disaster risk reduction community and has been employed by the IPCC in its “Special Report on Managing the Risks of Extreme Events and Disasters to Advance Climate Change Adaptation (SREX)” (IPCC, 2012) as well as in AR5, and is increasingly predominant in the climate change research community.
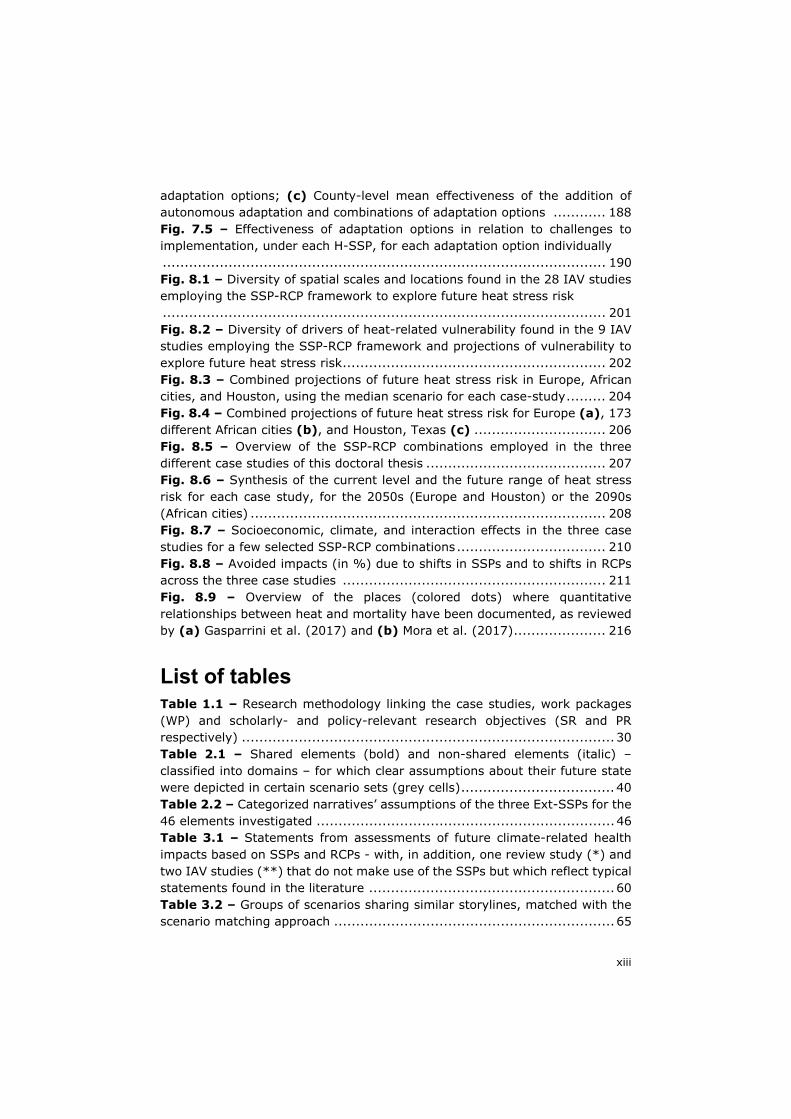
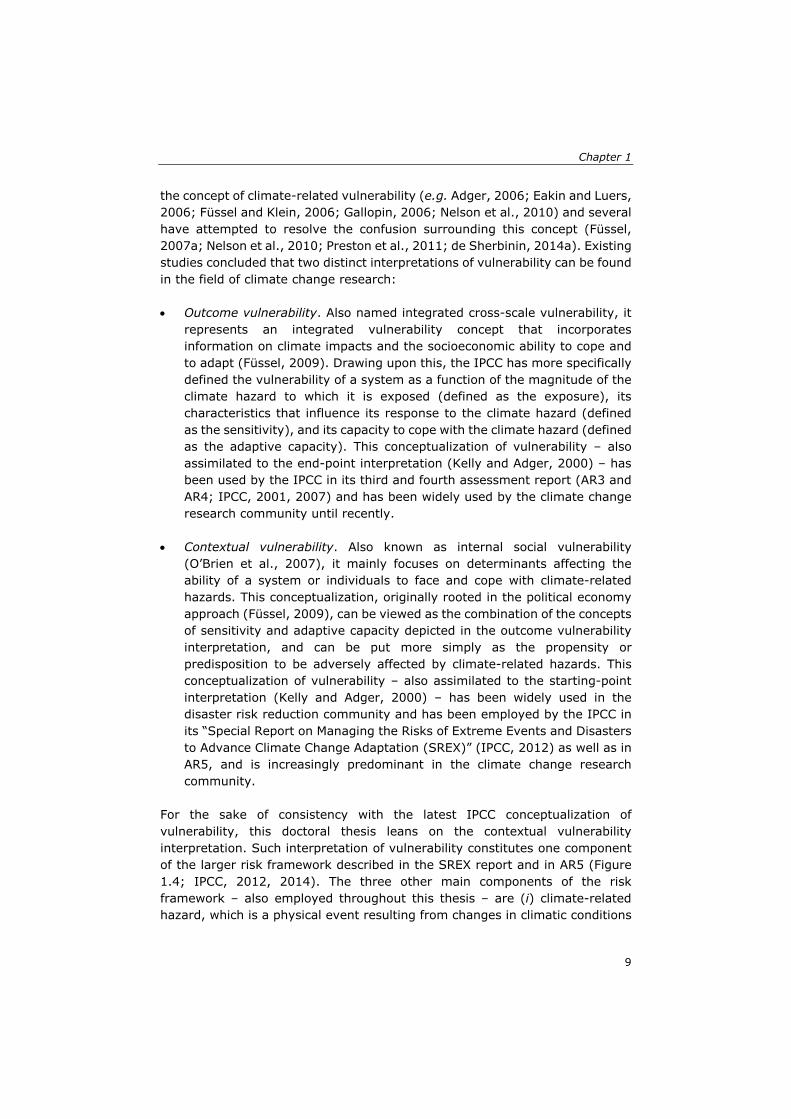
For the sake of consistency with the latest IPCC conceptualization of vulnerability, this doctoral thesis leans on the contextual vulnerability interpretation. Such interpretation of vulnerability constitutes one component of the larger risk framework described in the SREX report and in AR5 (Figure 1.4; IPCC, 2012, 2014). The three other main components of the risk framework – also employed throughout this thesis – are (i) climate-related hazard, which is a physical event resulting from changes in climatic conditions
Background – a changing world
10
that has the potential to adversely affect human and natural systems; (ii) exposure, which is defined by the presence of people, livelihoods, infrastructure, or assets that could be adversely affected by climate-related hazards and therefore could be subject to harm, loss, or damage; and (iii) risk – more specifically the risk of adverse climate impacts – which results from the interaction of climate-related hazards, vulnerability, and exposure (IPCC, 2012, 2014). A large body of literature have evidenced in the past decades the differential vulnerability of individuals and communities to heat-related hazards (Bao et al., 2015). It is generally accepted that individuals and communities with higher heat-related vulnerability are the low-income communities, the elderly, very young children, those with pre-existing medical conditions, low-educated communities, those without access to air conditioning, socially isolated persons, those with limited access to transportation and healthcare facilities, and ethnic minorities (e.g. Reid et al., 2009; Uejio et al., 2011; Wilhelmi and Hayden, 2010; Wolf and McGregor, 2013). It is also worth noticing that (i) determinants of heat-related vulnerability are highly context-specific and can differ from one place to another (Bao et al., 2015; Lundgren and Jonsson, 2012) and that (ii) urban areas in general are often considered to be particularly at risk of climate impacts (Romero-Lankao and Qin, 2011) – such as heat stress – due to the UHI effect (which strengthen the heat hazard), the high concentration of people and assets, and the multiple interactions and interdependences between the cities’ components.
Fig. 1.4 – Conceptual risk framework developed in IPCC SREX report and IPCC AR5 and used throughout the doctoral thesis (from IPCC, 2014).
Chapter 1
11
1.2.3 Scenarios
Medium- and long-term socioeconomic development and greenhouse gases emissions are highly uncertain, as they are function of a wide range of processes that are not yet fully understood and can hardly be modelled in the long run, ranging all the way from global geopolitical context to individual behavior. In the context of climate change research – and of environmental research more broadly – the use of scenarios is the globally acknowledged forward-looking method to apprehend medium- and long-term trends. Scenarios can be defined as coherent, plausible, and internally consistent descriptions of possible future states of the world in several key areas, used to inform future trends and their potential consequences (UKCIP, 2001). In climate change research, scenarios especially allow for a better understanding of uncertainties in order to reach decisions that are robust under multiple plausible futures (Moss et al., 2010) and facilitate the discussion of potential directions and evolutionary paths that development processes could take (Birkmann et al., 2013). As highlighted throughout this doctoral thesis, scenarios are also useful to characterize future climate-related risks under a wide range of possible futures (van Ruijven et al., 2014). Since its establishment in 1988, the IPCC has produced several sets of scenarios for climate change research, the latest being the SRES scenarios, contained in the Special Report on Emissions Scenarios (IPCC, 2000). The SRES scenarios scrutinized the uncertainty in future greenhouse gases emissions – considering a large variety of driving forces – and were accompanied by storylines qualitatively depicting the future socioeconomic conditions, which facilitated the interpretation of the scenarios. Although the SRES scenarios were widely acknowledged and used in climate change-related research, the climate research community and the IPCC recognized the need for new scenarios at the end of the 2000s (Moss et al., 2007). The new scenarios would reflect a decade of new information about socioeconomic development, emerging technologies, and environmental changes, and would answer the new needs of end-users (Moss et al., 2010). The Impacts, Adaptation, and Vulnerability (IAV) research community – which is extremely diverse and draws on research areas that include economic, natural sciences, engineering, and social sciences – particularly called the need for more comprehensive and detailed socioeconomic scenarios that can support forward-looking climate change impacts, adaptation, and vulnerability studies (Kriegler et al., 2012). To develop the new set of IPCC-guided scenarios (the IPCC decided in 2006 not to commission another set of scenarios, but instead provided guidance on scenario development, hence the term “IPCC-guided”), the climate change
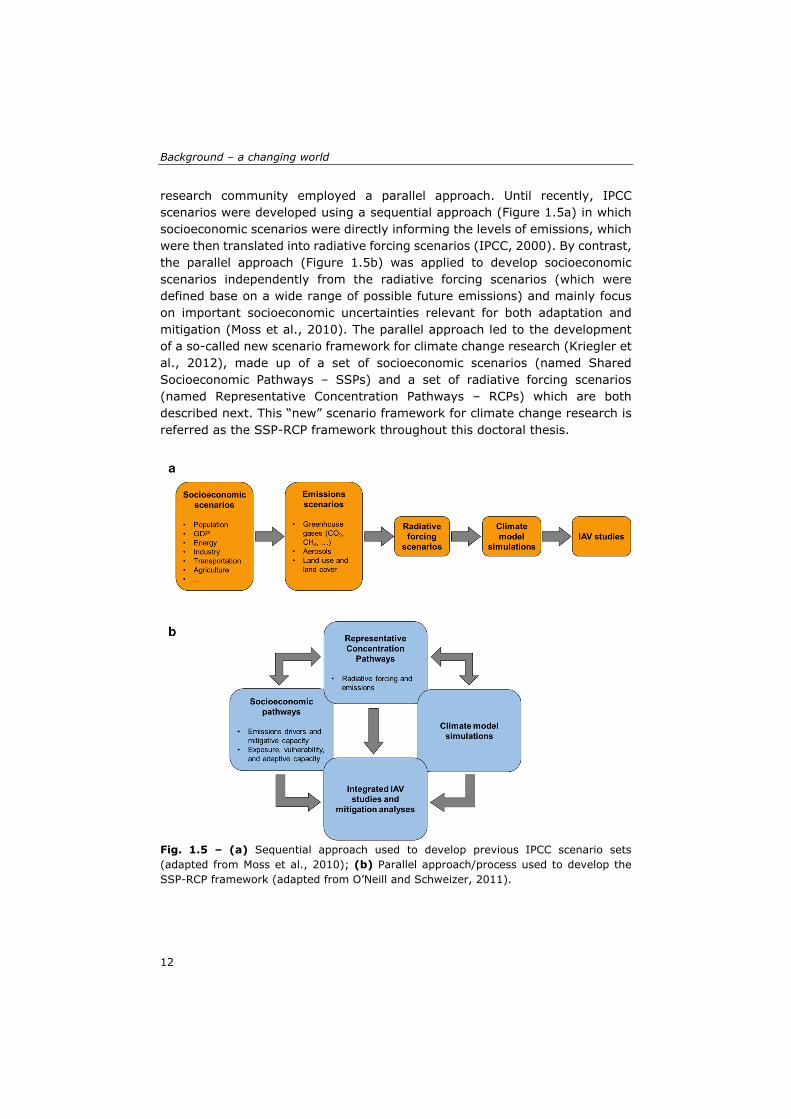
Background – a changing world
12
research community employed a parallel approach. Until recently, IPCC scenarios were developed using a sequential approach (Figure 1.5a) in which socioeconomic scenarios were directly informing the levels of emissions, which were then translated into radiative forcing scenarios (IPCC, 2000). By contrast, the parallel approach (Figure 1.5b) was applied to develop socioeconomic scenarios independently from the radiative forcing scenarios (which were defined base on a wide range of possible future emissions) and mainly focus on important socioeconomic uncertainties relevant for both adaptation and mitigation (Moss et al., 2010). The parallel approach led to the development of a so-called new scenario framework for climate change research (Kriegler et al., 2012), made up of a set of socioeconomic scenarios (named Shared Socioeconomic Pathways – SSPs) and a set of radiative forcing scenarios (named Representative Concentration Pathways – RCPs) which are both described next. This “new” scenario framework for climate change research is referred as the SSP-RCP framework throughout this doctoral thesis.
Fig. 1.5 – (a) Sequential approach used to develop previous IPCC scenario sets (adapted from Moss et al., 2010); (b) Parallel approach/process used to develop the SSP-RCP framework (adapted from O’Neill and Schweizer, 2011).
Chapter 1
13
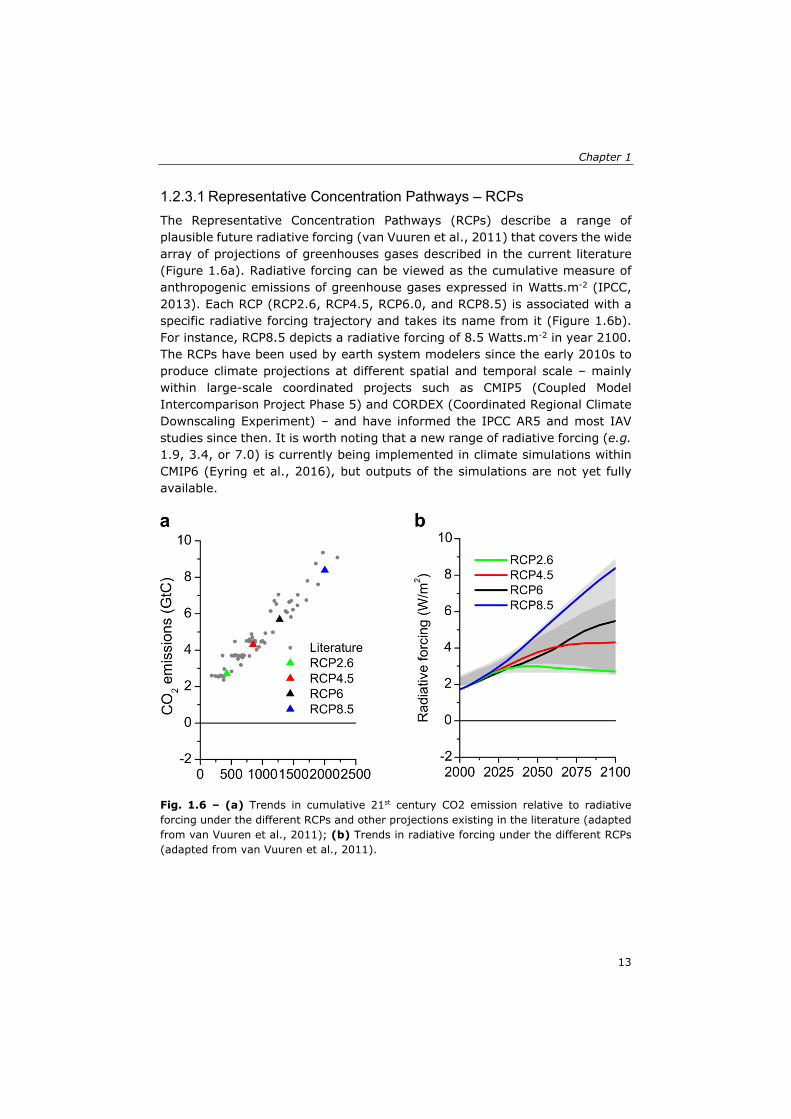
1.2.3.1 Representative Concentration Pathways – RCPs
The Representative Concentration Pathways (RCPs) describe a range of plausible future radiative forcing (van Vuuren et al., 2011) that covers the wide array of projections of greenhouses gases described in the current literature (Figure 1.6a). Radiative forcing can be viewed as the cumulative measure of anthropogenic emissions of greenhouse gases expressed in Watts.m-2 (IPCC, 2013). Each RCP (RCP2.6, RCP4.5, RCP6.0, and RCP8.5) is associated with a specific radiative forcing trajectory and takes its name from it (Figure 1.6b). For instance, RCP8.5 depicts a radiative forcing of 8.5 Watts.m-2 in year 2100. The RCPs have been used by earth system modelers since the early 2010s to produce climate projections at different spatial and temporal scale – mainly within large-scale coordinated projects such as CMIP5 (Coupled Model Intercomparison Project Phase 5) and CORDEX (Coordinated Regional Climate Downscaling Experiment) – and have informed the IPCC AR5 and most IAV studies since then. It is worth noting that a new range of radiative forcing (e.g. 1.9, 3.4, or 7.0) is currently being implemented in climate simulations within CMIP6 (Eyring et al., 2016), but outputs of the simulations are not yet fully available.
Fig. 1.6 – (a) Trends in cumulative 21st century CO2 emission relative to radiative forcing under the different RCPs and other projections existing in the literature (adapted from van Vuuren et al., 2011); (b) Trends in radiative forcing under the different RCPs (adapted from van Vuuren et al., 2011).
Background – a changing world
14
1.2.3.2 Shared Socioeconomic Pathways – SSPs
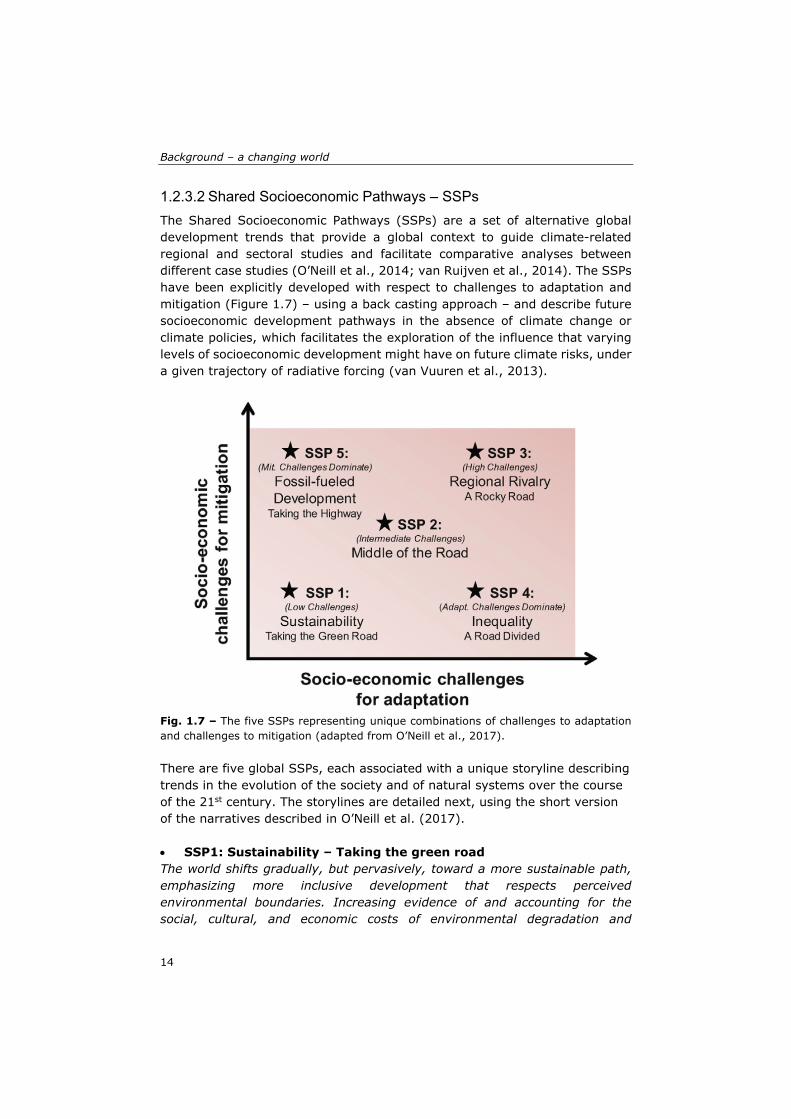
The Shared Socioeconomic Pathways (SSPs) are a set of alternative global development trends that provide a global context to guide climate-related regional and sectoral studies and facilitate comparative analyses between different case studies (O’Neill et al., 2014; van Ruijven et al., 2014). The SSPs have been explicitly developed with respect to challenges to adaptation and mitigation (Figure 1.7) – using a back casting approach – and describe future socioeconomic development pathways in the absence of climate change or climate policies, which facilitates the exploration of the influence that varying levels of socioeconomic development might have on future climate risks, under a given trajectory of radiative forcing (van Vuuren et al., 2013).
Fig. 1.7 – The five SSPs representing unique combinations of challenges to adaptation and challenges to mitigation (adapted from O’Neill et al., 2017). There are five global SSPs, each associated with a unique storyline describing trends in the evolution of the society and of natural systems over the course of the 21st century. The storylines are detailed next, using the short version of the narratives described in O’Neill et al. (2017). SSP1: Sustainability – Taking the green road The world shifts gradually, but pervasively, toward a more sustainable path, emphasizing more inclusive development that respects perceived environmental boundaries. Increasing evidence of and accounting for the social, cultural, and economic costs of environmental degradation and
Chapter 1
15
inequality drive this shift. Management of the global commons slowly improves, facilitated by increasingly effective and persistent cooperation and collaboration of local, national, and international organizations and institutions, the private sector, and civil society. Educational and health investments accelerate the demographic transition, leading to a relatively low population. Beginning with current high-income countries, the emphasis on economic growth shifts toward a broader emphasis on human livelihoods, even at the expense of somewhat slower economic growth over the longer term. Driven by an increasing commitment to achieving development goals, inequality is reduced both across and within countries. Investment in environmental technology and changes in tax structures lead to improved resource efficiency, reducing overall energy and resource use and improving environmental conditions over the longer term. Increased investment, financial incentives and changing perceptions make renewable energy more attractive. Consumption is oriented toward low material growth and lower resource and energy intensity. The combination of directed development of environmentally friendly technologies, a favorable outlook for renewable energy, institutions that can facilitate international cooperation, and relatively low energy demand results in relatively low challenges to mitigation. At the same time, the improvements in human well-being, along with strong and flexible global, regional, and national institutions imply low challenges to adaptation. SSP2: Middle of the road The world follows a path in which social, economic, and technological trends do not shift markedly from historical patterns. Development and income growth proceeds unevenly, with some countries making relatively good progress while others fall short of expectations. Most economies are politically stable. Globally connected markets function imperfectly. Global and national institutions work toward but make slow progress in achieving sustainable development goals, including improved living conditions and access to education, safe water, and health care. Technological development proceeds apace, but without fundamental breakthroughs. Environmental systems experience degradation, although there are some improvements and overall the intensity of resource and energy use declines. Even though fossil fuel dependency decreases slowly, there is no reluctance to use unconventional fossil resources. Global population growth is moderate and levels off in the second half of the century as a consequence of completion of the demographic transition. However, education investments are not high enough to accelerate the transition to low fertility rates in low-income countries and to rapidly slow population growth. This growth, along with income inequality that persists or improves only slowly, continuing societal stratification, and limited social cohesion, maintain challenges to reducing vulnerability to societal and environmental changes and constrain significant advances in sustainable development. These moderate development trends leave the world, on
Background – a changing world
16
average, facing moderate challenges to mitigation and adaptation, but with significant heterogeneities across and within countries. SSP3: Regional rivalry – A rocky road A resurgent nationalism, concerns about competitiveness and security, and regional conflicts push countries to increasingly focus on domestic or, at most, regional issues. This trend is reinforced by the limited number of comparatively weak global institutions, with uneven coordination and cooperation for addressing environmental and other global concerns. Policies shift over time to become increasingly oriented toward national and regional security issues, including barriers to trade, particularly in the energy resource and agricultural markets. Countries focus on achieving energy and food security goals within their own regions at the expense of broader-based development, and in several regions move toward more authoritarian forms of government with highly regulated economies. Investments in education and technological development decline. Economic development is slow, consumption is material-intensive, and inequalities persist or worsen over time, especially in developing countries. There are pockets of extreme poverty alongside pockets of moderate wealth, with many countries struggling to maintain living standards and provide access to safe water, improved sanitation, and health care for disadvantaged populations. A low international priority for addressing environmental concerns leads to strong environmental degradation in some regions. The combination of impeded development and limited environmental concern results in poor progress toward sustainability. Population growth is low in industrialized and high in developing countries. Growing resource intensity and fossil fuel dependency along with difficulty in achieving international cooperation and slow technological change imply high challenges to mitigation. The limited progress on human development, slow income growth, and lack of effective institutions, especially those that can act across regions, implies high challenges to adaptation for many groups in all regions. SSP4: Inequality – A road divided Highly unequal investments in human capital, combined with increasing disparities in economic opportunity and political power, lead to increasing inequalities and stratification both across and within countries. Over time, a gap widens between an internationally-connected society that is well educated and contributes to knowledge- and capital-intensive sectors of the global economy, and a fragmented collection of lower-income, poorly educated societies that work in a labor intensive, low-tech economy. Power becomes more concentrated in a relatively small political and business elite, even in democratic societies, while vulnerable groups have little representation in national and global institutions. Economic growth is moderate in industrialized and middle-income countries, while low income countries lag behind, in many cases struggling to provide adequate access to water, sanitation and health
Chapter 1
17
care for the poor. Social cohesion degrades and conflict and unrest become increasingly common. Technology development is high in the high-tech economy and sectors. Uncertainty in the fossil fuel markets lead to underinvestment in new resources in many regions of the world. Energy companies hedge against price fluctuations partly through diversifying their energy sources, with investments in both carbon-intensive fuels like coal and unconventional oil, but also low-carbon energy sources. Environmental policies focus on local issues around middle and high income areas. The combination of some development of low carbon supply options and expertise, and a well-integrated international political and business class capable of acting quickly and decisively, implies low challenges to mitigation. Challenges to adaptation are high for the substantial proportions of populations at low levels of development and with limited access to effective institutions for coping with economic or environmental stresses. SSP5: Fossil-fueled development – Taking the highway Driven by the economic success of industrialized and emerging economies, this world places increasing faith in competitive markets, innovation and participatory societies to produce rapid technological progress and development of human capital as the path to sustainable development. Global markets are increasingly integrated, with interventions focused on maintaining competition and removing institutional barriers to the participation of disadvantaged population groups. There are also strong investments in health, education, and institutions to enhance human and social capital. At the same time, the push for economic and social development is coupled with the exploitation of abundant fossil fuel resources and the adoption of resource and energy intensive lifestyles around the world. All these factors lead to rapid growth of the global economy. There is faith in the ability to effectively manage social and ecological systems, including by geo-engineering if necessary. While local environmental impacts are addressed effectively by technological solutions, there is relatively little effort to avoid potential global environmental impacts due to a perceived tradeoff with progress on economic development. Global population peaks and declines in the 21st century. Though fertility declines rapidly in developing countries, fertility levels in high income countries are relatively high (at or above replacement level) due to optimistic economic outlooks. International mobility is increased by gradually opening up labor markets as income disparities decrease. The strong reliance on fossil fuels and the lack of global environmental concern result in potentially high challenges to mitigation. The attainment of human development goals, robust economic growth, and highly engineered infrastructure results in relatively low challenges to adaptation to any potential climate change for all but a few. In addition to qualitatively describing the global SSPs, the research community has also been actively engaged in the quantification of key socioeconomic
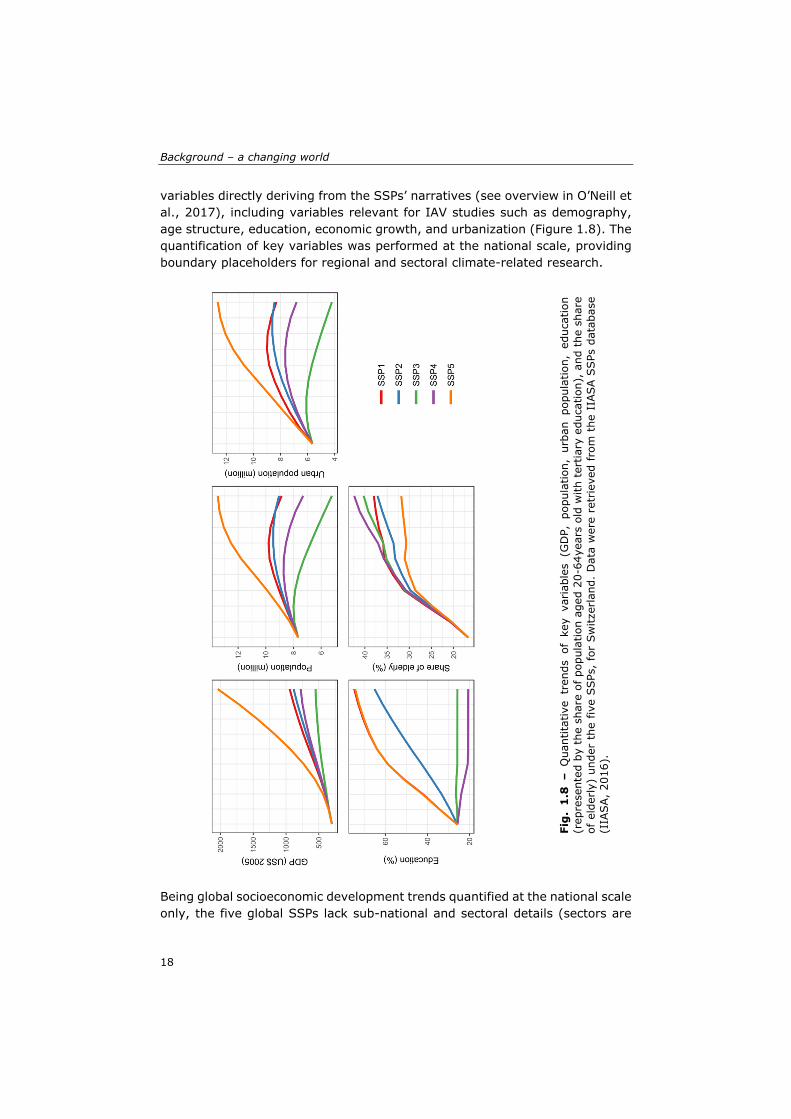
Background – a changing world
18
variables directly deriving from the SSPs’ narratives (see overview in O’Neill et al., 2017), including variables relevant for IAV studies such as demography, age structure, education, economic growth, and urbanization (Figure 1.8). The quantification of key variables was performed at the national scale, providing boundary placeholders for regional and sectoral climate-related research.
Being global socioeconomic development trends quantified at the national scale only, the five global SSPs lack sub-national and sectoral details (sectors are
Fig
. 1
.8 –
Qua
ntita
tive
tren
ds o
f ke
y va
riab
les
(GD
P, p
opul
atio
n, u
rban
pop
ulat
ion,
edu
catio
n (r
epre
sent
ed b
y th
e sh
are
of p
opul
atio
n ag
ed 2
0-64
year
s ol
d w
ith t
ertia
ry e
duca
tion)
, an
d th
e sh
are
of e
lder
ly)
unde
r th
e fiv
e SSPs
, fo
r Sw
itzer
land
. D
ata
wer
e re
trie
ved
from
the
IIA
SA S
SPs
dat
abas
e (I
IASA,
2016
).
Chapter 1
19
defined as specific domains such as transportation, health, fisheries, governance, etc.). To enhance their suitability in regional and/or sectoral IAV studies and to increase their legitimacy and intake by local stakeholders, the SSPs have to be extended, that is, contextualized for a given region and/or sector (van Ruijven et al., 2014). Such an integration of sectoral and regional characteristics is facilitated by the flexibility of the SSPs, which were purposely developed to be extended (O’Neill et al., 2017). Although the sectoral and regional extensions of the global SSPs were few when this doctoral project was conceived (i.e., year 2016), the SSPs extensions have been rapidly flourishing in the literature since then. Examples of sectoral extensions include extended SSPs of urban and population development worldwide (Jones and O’Neill, 2016; Murakami and Yagamata, 2016; Li et al., 2019), in coastal areas (Merkens et al., 2016), in the Mediterranean coast (Reimann et al., 2018) and in large cities (Hoornweg and Pope, 2017), and extended SSPs for public health (Ebi, 2013; Sellers and Ebi, 2018), for the water sector worldwide and in China (Wada et al., 2016; Yao et al., 2017), for forestry (Kemp-Benedict et al., 2014; Nepal et al., 2019), for fisheries (Maury et al., 2017), and for food security worldwide and in a few specific regions (Hasegawa et al., 2015; Mason-D’Croz et al., 2016; Palazzo et al., 2017). Examples of regional extensions include extended SSPs for the Barents region (Nilsson et al., 2017), the Baltic Sea (Zandersen et al., 2019), Southeast US (Absar and Preston, 2015), Europe (Kok et al., 2019), Tokyo (Kamei et al., 2016), Boston (Lino et al., 2019), and New Zealand (Frame et al., 2018).
1.2.3.3 Scenario Matrix Architecture – SMA
Although being developed in parallel and in a non-integrated fashion (unlike the SRES), the RCPs and SSPs have been partly designed to be combined together in a scenario matrix architecture (SMA; van Vuuren et al., 2013 – Figure 1.9) in order to explore future IAV issues under multiple combinations of climate and socioeconomic scenarios (i.e., multiple SSP-RCP combinations). The overall structure of the SMA is built on the idea that any RCP can result from different socioeconomic trajectories (i.e., from different SSPs), but would require different mitigation efforts. These mitigation efforts, in forms in climate policies, have been described as Shared Policy Assumptions (SPAs; Kriegler et al., 2014). Unlike the RCPs and SSPs, no defined set of SPAs has been developed. Instead, authors defined broad types of information that should be contained within the SPAs, such as the ambition level of climate policies and their associated quantitative targets, the types of policies and measures to implement in order to reach the targets, and information about the potential implementation limits and obstacles (Kriegler et al., 2014). Although the SPAs were initially viewed as a critical component of the SMA, very few IAV studies defined and employed the SPAs – most probably due to the lack of a defined set of SPAs. Throughout this manuscript, the SPAs are not considered when combining SSPs with RCPs – likewise the overwhelming majority of IAV studies.
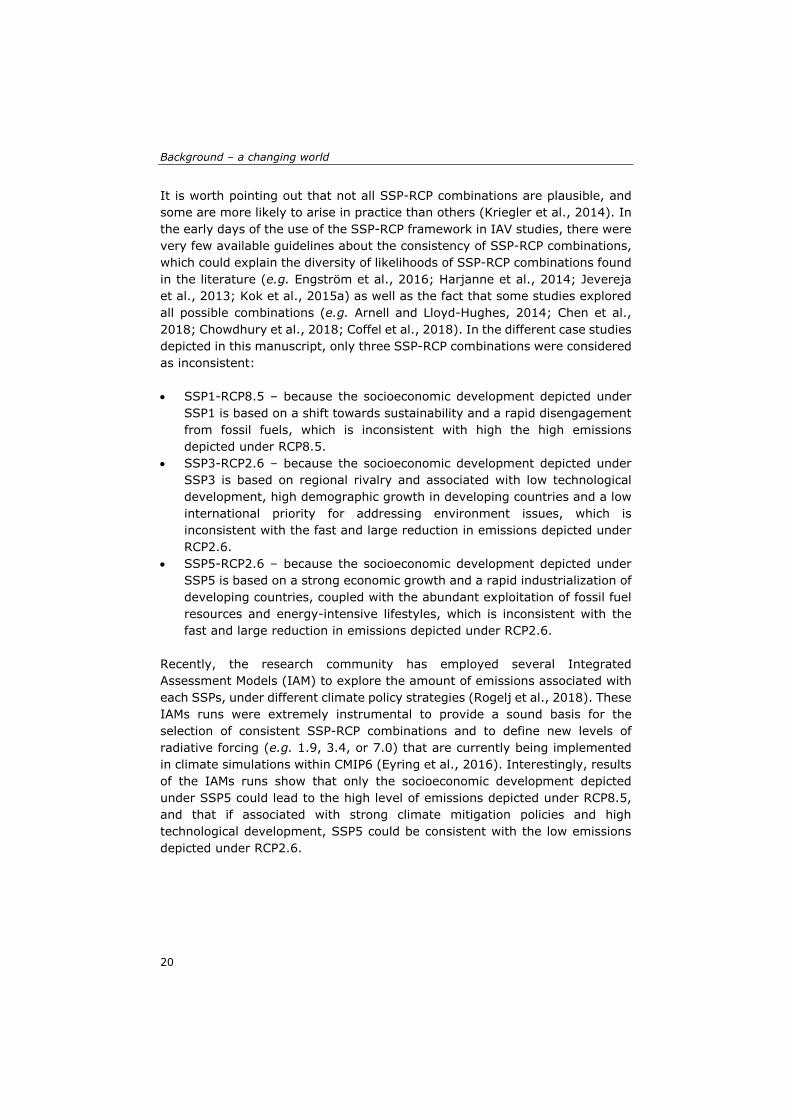
Background – a changing world
20
It is worth pointing out that not all SSP-RCP combinations are plausible, and some are more likely to arise in practice than others (Kriegler et al., 2014). In the early days of the use of the SSP-RCP framework in IAV studies, there were very few available guidelines about the consistency of SSP-RCP combinations, which could explain the diversity of likelihoods of SSP-RCP combinations found in the literature (e.g. Engström et al., 2016; Harjanne et al., 2014; Jevereja et al., 2013; Kok et al., 2015a) as well as the fact that some studies explored all possible combinations (e.g. Arnell and Lloyd-Hughes, 2014; Chen et al., 2018; Chowdhury et al., 2018; Coffel et al., 2018). In the different case studies depicted in this manuscript, only three SSP-RCP combinations were considered as inconsistent: SSP1-RCP8.5 – because the socioeconomic development depicted under
SSP1 is based on a shift towards sustainability and a rapid disengagement from fossil fuels, which is inconsistent with high the high emissions depicted under RCP8.5.
SSP3-RCP2.6 – because the socioeconomic development depicted under SSP3 is based on regional rivalry and associated with low technological development, high demographic growth in developing countries and a low international priority for addressing environment issues, which is inconsistent with the fast and large reduction in emissions depicted under RCP2.6.
SSP5-RCP2.6 – because the socioeconomic development depicted under SSP5 is based on a strong economic growth and a rapid industrialization of developing countries, coupled with the abundant exploitation of fossil fuel resources and energy-intensive lifestyles, which is inconsistent with the fast and large reduction in emissions depicted under RCP2.6.
Recently, the research community has employed several Integrated Assessment Models (IAM) to explore the amount of emissions associated with each SSPs, under different climate policy strategies (Rogelj et al., 2018). These IAMs runs were extremely instrumental to provide a sound basis for the selection of consistent SSP-RCP combinations and to define new levels of radiative forcing (e.g. 1.9, 3.4, or 7.0) that are currently being implemented in climate simulations within CMIP6 (Eyring et al., 2016). Interestingly, results of the IAMs runs show that only the socioeconomic development depicted under SSP5 could lead to the high level of emissions depicted under RCP8.5, and that if associated with strong climate mitigation policies and high technological development, SSP5 could be consistent with the low emissions depicted under RCP2.6.
Chapter 1
21
Fig. 1.9 – Scenario matrix architecture (SMA) made of SSPs, RCPs, and SPAs (adapted from van Vuuren et al., 2013). The color code is based on the plausibility of SSP-RCP combinations as found by IAM runs (Rogelj et al., 2018), with green cells showing consistent combinations (requiring different levels of climate mitigation) and yellow cells showing inconsistent combinations. Black crosses indicate the SSP-RCP combinations that were explored in this doctoral thesis. The SMA is a very useful tool for the IAV community to explore the effect of mitigation and/or adaptation on a particular outcome (Kriegler et al., 2014; van Vuuren et al., 2013). The direct influence of mitigation options on a given climate-related risk can be characterized by a shift down a column of the matrix, e.g. by a shift from SSP2-RCP6.0 to SSP2-RCP2.6. Similarly, the direct influence of climate adaptation (through the transition towards socioeconomic pathways depicting low challenges to adaptation) on a given climate-related risk can be characterized by a shift along a row of the matrix, e.g. by a shift from SSP3-RCP4.5 to SSP1-RCP4.5. More broadly, the shifts along a column or a row of the matrix enable answering questions such as “what is the influence of different socioeconomic pathways on climate-related risks under a given level of climate change” and “what is the influence of different levels of climate change on climate-related risks under a given type of socioeconomic pathways”. Such an approach was heavily used throughout this doctoral thesis to (i) disentangle the relative contribution of socioeconomic development and climate change to future climate-related risks and (ii) assess the avoided risks due to climate adaptation and/or climate mitigation.
SSP1 SSP2 SSP3 SSP4 SSP5
RCP8.5 X X X X
RCP6.0
RCP4.5 X X X X X
RCP2.6 X X X
Shared Socioeconomic Pathways
Rep
resentative
Concentration Pathways
Background – a changing world
22
1.3 Research needs and objectives There is no doubt that climate-related risks – and its components, that is, exposure, vulnerability, and hazard – are temporally dynamic (IPCC, 2012). Changes in climatic conditions are modifying climate-related hazards, while socioeconomic development is directly affecting vulnerability and exposure and indirectly affecting climate-related hazards (e.g. through the UHI effect). Rationally, assessing future climate-related risks requires looking at the future states of both climate and socioeconomic systems. This has been widely acknowledged by the research community. However, up until recently, the integration of future socioeconomic conditions in assessments of future climate-related risks has been very limited (Birkmann et al., 2013). The vast majority of studies are based on climate projections superimposed on current socioeconomic conditions only, hence failing to account for the role socioeconomic development plays in shaping future climate-related risks (Preston et al., 2011). Such a practice is particularly problematic because it potentially overestimates the relative contribution of climate change to future climate-related risks and may introduce a systematic bias into public health adaptation planning (Ebi et al., 2016). This crucial issue of temporal scale mismatch between climatic and socioeconomic conditions in assessments of future climate-related risks has been raised more than 15 years ago, e.g. a UKCIP report (2001) stated that “studies that assess climate change impacts suffer from serious weakness if by default they merely assume that the projected future climates will take place in a world with a society and economic similar to today” and Lorenzoni et al. (2000) argued that “it is at best simplistic and at worst completely misquoted to ignore the co-evolving dynamic development of social and climatic systems”. However, it is only recently that this major drawback of IAV studies has received a great deal of attention, mainly thanks to the creation of the SSPs and the SSP-RCP framework in the 2010s. Since then – and particularly since the finalization and the first quantification of the global SSPs around 2015 – a rapidly growing number of IAV studies have been conducted to operationalize the SSP-RCP framework (at multiple regional and temporal scales and for multiple sectors) and to assess future climate-related risks under changing socioeconomic and climatic conditions. This doctoral thesis is part of such global effort, with a focus on future heat stress risk. The overarching research objective of this work is twofold. First, it aims to advance the use of socioeconomic scenarios in IAV studies, and particularly the operationalization of the SSP-RCP framework for assessments of future heat stress risk, at multiple temporal and spatial scales and in various contexts. Second, it aims to explore the role of socioeconomic development in shaping
Chapter 1
23
future climate-related risks, and particularly the influence of different socioeconomic pathways on future heat stress risk in different contexts. Such scholarly- and policy-relevant research objectives are intrinsically linked (mainly because the methods advanced through the scholarly-relevant research enable exploring policy-relevant research questions) and contain a number of sub-research objectives that are described next.
1.3.1 Scholarly-relevant research needs and objectives
At the beginning of this doctoral thesis, in late 2016, I engaged in a review of the IAV studies that apply the SSP-RCP framework to explore future climate-related risks to public health. At this time, these studies were relatively limited in numbers. Following this short review, I identified a number of methodological shortcomings and research gaps that this doctoral thesis could attempt to address. The main and most redundant shortcomings were related to the following aspects. Lack of interest for future vulnerability. The overwhelming majority of the
reviewed IAV studies focuses on climate-related risks as a function of hazard (using RCPs-based climate projections) and exposure only (using SSPs-based population projections), neglecting the vulnerability of the exposed populations. The lack of quantification of the SSPs for drivers of vulnerability might explain this lack of interest for future vulnerability and therefore the little diversity of socioeconomic projections accounted for (i.e., only population growth). A few exceptions are worth pointing out, such as (i) Hasegawa et al. (2014) who projected indicators of crop demand, share of livestock, trade liberalization, and crop variety to assess future hunger risk, (ii) Hanasaki et al. (2013) and Koutroulis et al. (2016) who projected sectoral water use and demand to explore future risk of water scarcity, and (iii) Dong et al. (2015) who used projections of GDP, age and education to explore future heat stress risk at the global scale.
Little diversification of the geographical extent and scale. The majority of
the reviewed IAV studies focuses on the global scale. The few other studies focus on specific developed regions (Europe or North America) or developed countries (e.g. USA). None of the reviewed studies focuses on (i) the global South or (ii) small-scale geographical units such as cities.
Simplistic downscaling of national projections and use of global scenarios.
Almost most of the reviewed studies make use of the national-level projections of population (and sometimes of GDP, education, and age) published along with the global SSPs’ narratives. To disaggregate these national-level projections to the scale of analysis (often a 50*50km gridded scale, in line with the resolution of climate data), most authors assume the
Background – a changing world
24
growth (e.g. in population or in GDP) to be homogeneously distributed within each country. By doing so, authors do not account for the sub-national socioeconomic dynamics. Moreover, all studies were based on the global SSPs’ narratives, even when focusing on a specific region or country. This use of the global SSPs renders difficult the integration of region- or country-specific socioeconomic development dynamics in the assessment of climate-related risks.
Lack of interest for adaptation. Although most assessments of future
climate-related risks are intended to inform the design of adaptation strategies, none of the reviewed IAV studies considered adaptation.
Building upon the aforementioned research gaps, I identified a number of scholarly-relevant and methodological research objectives that should be addressed in order to operationalize further the SSP-RCP framework in assessments of future climate-related risks. These are (SR = scholarly-relevant research objective): SR1 – To develop methods to extend the global SSPs at the regional and
sub-national scale and for sectors relevant to heat stress risk, such as public health and housing conditions. These methods to extend the global SSPs, in contrast with traditional approaches to develop scenarios from scratch, should be easy to implement and not resource- and time-intensive in order to be taken on board by the IAV community.
SR2 – To develop tools and innovative approaches (including downscaling
techniques) to project exposure and the wide range of drivers of heat-related vulnerability under the SSPs – and/or under extended SSPs – at various temporal and spatial scales and in different contexts. These tools should preferentially make use of the large diversity of existing projection methods in other research fields, such as demography, economy, public health, social studies, and urban planning. These tools should also ensure the consistency between local-scale projections and national-scale projections derived from the global SSPs.
SR3 – To provide concrete examples of operationalization of the SSP-RCP
framework in various case studies with significantly different contexts. Particular attention should be paid to provide concrete examples in the Global South and at the city scale – both applications of the SSP-RCP that were lacking at the time of the review of IAV studies.
SR4 – To develop approaches to integrate and assess adaptation strategies
within the SSP-RCP framework and to provide a concrete example of
Chapter 1
25
operationalization of the SSP-RCP framework for adaptation-oriented climate-related risks assessments.
1.3.2 Policy-relevant research needs and objectives
In addition to answering the aforementioned methodological and scholarly-relevant research objectives, this doctoral thesis also aims to answer policy-relevant research needs. As detailed in section 1.2.1., heat stress risk is one of the most impactful climate-related risks and causes tens of thousands casualties in only one or two months (Mora et al., 2017), with impacts across most regions of the globe. Heat stress risk is a particularly important climate-related risk in urban areas, where people are concentrated and where the characteristics of the urban environment intensify the heat hazard (through the urban heat island). Numerous reports, articles, and perspective papers published in the 2000s and the 2010s have highlighted the need to explore the role of socioeconomic development in shaping future human vulnerability to climate change, including future heat-related vulnerability, as well as to provide projections of future climate-related risks (including heat stress risk) in a context of both climate change and socioeconomic development, in different regions and across various urban centers (e.g. Birkmann et al., 2013; Carter et al., 2007; Ebi, 2013; Ebi et al., 2016; Garschagen and Kraas, 2010; Hales et al., 2014; Hallegatte et al., 2011; IPCC, 2012, 2014; UNDP, 2003, 2010). This is essential for effective adaptation action. Building upon the aforementioned policy-relevant research needs, I identified a number of policy-relevant research objectives. These are (PR = policy-relevant research objective): PR1 – To project future heat stress risk under changing socioeconomic and
climatic conditions, with a particular focus on places where heat stress risk is – or is expected to be – an important climate-related risk. These are places where the heat hazard is strong and/or the vulnerability of the exposed population is high. A particular attention should be paid to future heat stress risk in urban areas.
PR2 – To assess the full range of possible outcomes (in terms of future
heat stress risk) under various levels of climate change and different types of socioeconomic pathway. This allows for exploring the potential of mitigation and adaptation policies to alter the outcome and to potentially minimize the impact of climate change on public health.
PR3 – To characterize the role of socioeconomic development in shaping
future heat stress risk, in various contexts. Particular attention should be paid to the potential avoided risk due to shifts in socioeconomic pathways
Background – a changing world
26
and to the specific socioeconomic levers that policy-makers may have (in addition to climate mitigation policies) to minimize the impact of climate change on public health.
PR4 – To provide information about the most effective heat-related
adaptation strategies in a specific and local context. Particular attention should be paid to exploring the effectiveness of adaptation under multiple plausible futures.
1.4 Research methodology and thesis outline To address the aforementioned scholarly- and policy-relevant research needs and objectives, a specific research methodology – made of different case studies and work packages (WP) – was developed an applied throughout this doctoral dissertation. The overarching research methodology revolves around two main thrusts: From regional to local. This work was purposely designed to begin at the
regional scale (i.e., continent) and subsequently to zoom in from one case study to another in order to reach the intra-city scale. This way, diverse spatial scales and locations are covered – including small-scale geographical units such as cities – in line with the research needs.
From simplicity to complexity. Assessing future heat stress risk under
uncertainty requires multiple research steps, all the way from the design of socioeconomic scenarios to the disentanglement of the individual contribution of drivers of risk. To overcome this complexity, I designed a research methodology in which (i) the first WPs tackle individual research steps – such as the design of scenarios and their quantification – and (ii) the last WPs build upon the knowledge gained and methods developed in the first WPs in order to assess future heat stress risk in an integrated and comprehensive manner.
1.4.1 Case studies
In order to cover a wide range of regional context, geographical extent, and spatial resolution, three different case studies were used throughout this thesis. In view of the scholarly- and policy-relevant research objectives depicted in section 1.3., the following list of criteria was applied to select the three case studies: they must (i) be places where there is an existing and growing heat stress risk, (ii) represent three different regional contexts, i.e., be located in three different continents, with at least one case study in the global South (iii) be of significantly different geographical extent and scale, and (iv) focus on – or include – urbanized areas. Moreover, criteria such as data availability, existing heat stress risk model, and existing relationships with
Chapter 1
27
stakeholders were also taken into account when choosing the case studies. Altogether, these criteria led to the selection of the following three case studies (Figure 1.10): Europe. This regional case study was chosen because it is a region where
extreme heat is one of the most impactful climate-related hazards (Forzieri et al., 2017) and where policy-relevant information about future heat-related challenges is greatly needed (EEA, 2012; Forzieri et al., 2016). It’s changing and ageing society also make it an interesting case study to explore the contribution of changes in socioeconomic conditions on future heat stress risk. Moreover, Europe is a particularly data-rich environment (mainly thanks to the collaboration of countries within the European Union) in which countless environmental and socioeconomic datasets are freely available in a harmonized fashion (i.e., using similar statistical units throughout Europe). Finally, a certain number of studies and research projects have been conducted in Europe to explore future socioeconomic conditions under the SSPs or other scenarios (e.g. CLIMSAVE project; IMPRESSIONS project; Batista e Silva et al., 2016; Hurth et al., 2017; Lückenkötter et al., 2017), which increases the availability of socioeconomic projections.
African cities. This city-scale case study was chosen because large African
cities are currently experiencing unprecedented growth and are leading the global urbanization trend (Lwasa et al., 2018; United Nations, 2018) while being mostly located in tropical and sub-tropical areas where the risk of heat stress is among the highest worldwide (Dong et al., 2015; Dosio, 2017; Dosio et al., 2018). Moreover, the African continent is considered as a data-scarce environment (in terms of socioeconomic data), which makes it an interesting case study to explore the operationalization of the SSP-RCP framework both in the global South and in data-poor environments.
Houston (Texas). This intra-city scale case study was chosen because the
metropolitan area of Houston is severely exposed to extreme heat events due to its sub-tropical climate and its significant urban heat island (Papalexiou et al., 2018; Zhou et al., 2014). Moreover, Houston is also a city facing drastic changes in socioeconomic conditions, with a rapid demographic growth, an increased ethnic diversity, and a transformation of the social fabric (Emerson et al., 2012; PolicyLink, 2013) – altogether making it an interesting case study to explore the influence of local-scale socioeconomic development on future heat stress risk. Finally, heat stress risk in Houston has been well-studied over the past ten years (particularly within the SIMMER project – System for Integrated Modeling of Metropolitan Extreme Heat Risk), resulting in the development of a heat-related mortality model (Heaton et al., 2014) and a urban climate model
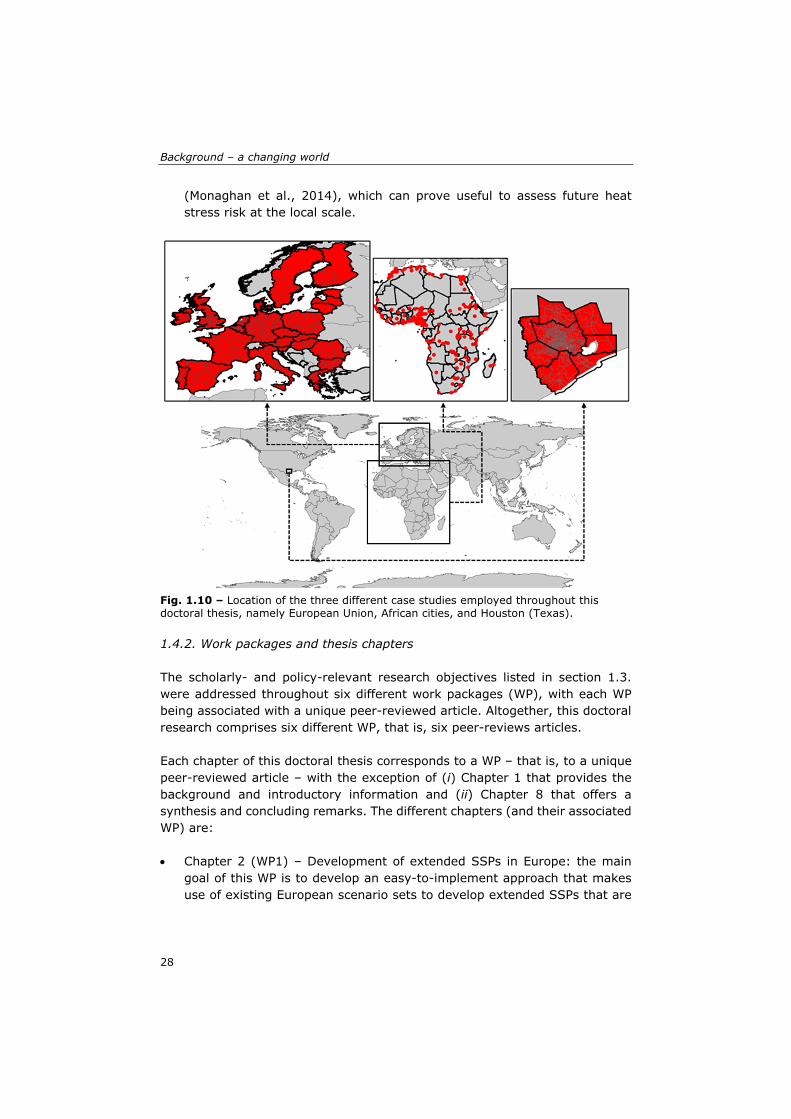
Background – a changing world
28
(Monaghan et al., 2014), which can prove useful to assess future heat stress risk at the local scale.
Fig. 1.10 – Location of the three different case studies employed throughout this doctoral thesis, namely European Union, African cities, and Houston (Texas). 1.4.2. Work packages and thesis chapters The scholarly- and policy-relevant research objectives listed in section 1.3. were addressed throughout six different work packages (WP), with each WP being associated with a unique peer-reviewed article. Altogether, this doctoral research comprises six different WP, that is, six peer-reviews articles. Each chapter of this doctoral thesis corresponds to a WP – that is, to a unique peer-reviewed article – with the exception of (i) Chapter 1 that provides the background and introductory information and (ii) Chapter 8 that offers a synthesis and concluding remarks. The different chapters (and their associated WP) are: Chapter 2 (WP1) – Development of extended SSPs in Europe: the main
goal of this WP is to develop an easy-to-implement approach that makes use of existing European scenario sets to develop extended SSPs that are
Chapter 1
29
contextualized for European region as well as for sectors related to heat-related vulnerability.
Chapter 3 (WP2) – Projections of vulnerability under the SSPs: the main
goal of this WP is to review existing methods – and to provide new tools – to project the wide range of drivers of heat-related vulnerability under the SSPs, at the sub-national scale and in a data-rich environment (i.e., Europe).
Chapter 4 (WP3) – Future heat stress risk in Europe: the main goal of this
WP is to build on findings of the WP1 (extended SSPs) and WP2 (projections of vulnerability) to assess future heat stress risk in Europe – at the subnational scale – under different combinations of SSP and RCPs, with a particular focus on the role played by changes in vulnerability.
Chapter 5 (WP4) – Future heat stress risk in African cities: the main goal
of this WP is to explore future exposure to extreme heat in African cities under multiple plausible futures (that is, different SSP-RCP combinations), and to identify its main drivers, with a particularly focus on the comparison of the roles played by demographic growth and urbanization on the one hand and climate change on the other hand.
Chapter 6 (WP5) – Future heat stress risk in Houston: the main goal of this
WP is to operationalize the SSP-RCP framework at the intra-urban scale (in a data-rich environment) and to explore future heat-related mortality in Houston under different SSP-RCP combinations, with a particular attention on the role played by local changes in vulnerability.
Chapter 7 (WP6) – Adaptation to heat stress risk in Houston: the main goal
of this WP, which heavily relies on the findings of the WP5, is to integrate adaptation within the SSP-RCP framework and to explore the ability of different adaptation strategies to minimize future heat stress risk in Houston, with a particular focus on their challenges to implementation under multiple plausible futures.
These six different WP answer one or several scholarly- and policy-relevant research objectives, as displayed in Table 1.1.
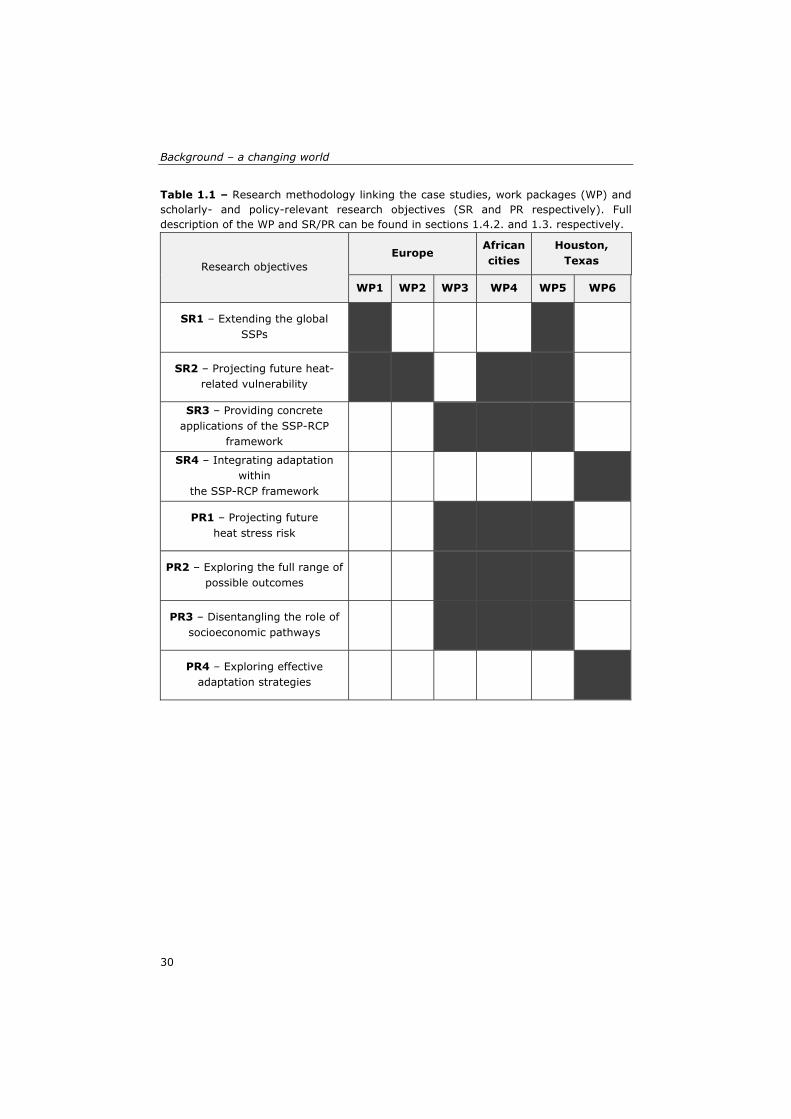
Background – a changing world
30
Table 1.1 – Research methodology linking the case studies, work packages (WP) and scholarly- and policy-relevant research objectives (SR and PR respectively). Full description of the WP and SR/PR can be found in sections 1.4.2. and 1.3. respectively.
Research objectives Europe
African cities
Houston, Texas
WP1 WP2 WP3 WP4 WP5 WP6
SR1 – Extending the global SSPs
SR2 – Projecting future heat-related vulnerability
SR3 – Providing concrete applications of the SSP-RCP
framework
SR4 – Integrating adaptation within
the SSP-RCP framework
PR1 – Projecting future heat stress risk
PR2 – Exploring the full range of possible outcomes
PR3 – Disentangling the role of socioeconomic pathways
PR4 – Exploring effective adaptation strategies
31
Chapter 2 Co-use of existing scenario sets to extend and quantify the Shared Socioeconomic Pathways1
1This chapter is based on the article: Rohat G, Flacke J, Dao H and van Maarseveen M (2018). Co-use of existing scenario sets to extend and quantify the Shared Socioeconomic Pathways. Climatic Change 151: 619-636.
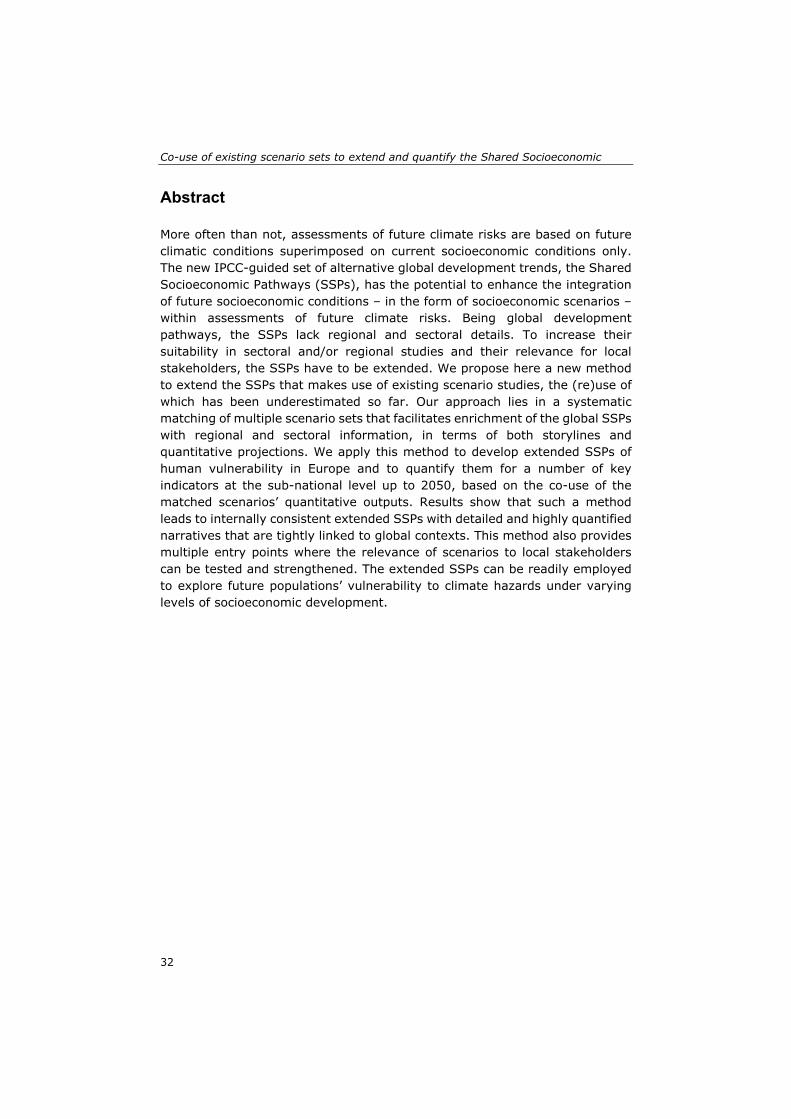
Co-use of existing scenario sets to extend and quantify the Shared Socioeconomic
32
Abstract More often than not, assessments of future climate risks are based on future climatic conditions superimposed on current socioeconomic conditions only. The new IPCC-guided set of alternative global development trends, the Shared Socioeconomic Pathways (SSPs), has the potential to enhance the integration of future socioeconomic conditions – in the form of socioeconomic scenarios – within assessments of future climate risks. Being global development pathways, the SSPs lack regional and sectoral details. To increase their suitability in sectoral and/or regional studies and their relevance for local stakeholders, the SSPs have to be extended. We propose here a new method to extend the SSPs that makes use of existing scenario studies, the (re)use of which has been underestimated so far. Our approach lies in a systematic matching of multiple scenario sets that facilitates enrichment of the global SSPs with regional and sectoral information, in terms of both storylines and quantitative projections. We apply this method to develop extended SSPs of human vulnerability in Europe and to quantify them for a number of key indicators at the sub-national level up to 2050, based on the co-use of the matched scenarios’ quantitative outputs. Results show that such a method leads to internally consistent extended SSPs with detailed and highly quantified narratives that are tightly linked to global contexts. This method also provides multiple entry points where the relevance of scenarios to local stakeholders can be tested and strengthened. The extended SSPs can be readily employed to explore future populations’ vulnerability to climate hazards under varying levels of socioeconomic development.
Chapter 2
33
2.1 Introduction Being driven by both climatic and socioeconomic determinants, future climate risks depend on both future climatic and socioeconomic conditions (Birkmann et al., 2013). Nevertheless, the overwhelming majority of assessments of future climate risks are based on climate scenarios superimposed on current socioeconomic conditions only, hence neglecting the contribution of socioeconomic development and assuming that drivers of risk other than climate change will remain constant (Ebi et al., 2016; Preston et al., 2011), although some notable exceptions exist (Carter et al., 2016). To justify such lack of consideration for future socioeconomic conditions, authors traditionally point out the scarcity of relevant socioeconomic scenarios and projections for Impacts, Adaptation, and Vulnerability (IAV) studies. Partly to enhance the integration of socioeconomic scenarios in IAV assessments, the climate change research community has developed a new set of alternative global development trends, namely the Shared Socioeconomic Pathways – SSPs (O’Neill et al., 2014). The SSPs are part of the new scenario framework for climate change research (Moss et al., 2010), which also comprises a set of greenhouse gas concentration trajectories, namely the Representative Concentration Pathways – RCPs (van Vuuren et al., 2011), and a set of global policy assumptions, namely the Shared Policy Assumptions – SPAs (Kriegler et al., 2014). These three elements have been purposely designed to be combined for exploring future climate risks as well as adaptation and mitigation options (van Vuuren et al., 2014). In this paper, we focus only on the SSPs, which provide a global context to guide climate-related regional and sectoral scenario studies and facilitate comparative analyses between different case-studies (van Ruijven et al., 2014). Unlike the old Special Report on Emission Scenarios (SRES scenarios; IPCC, 2000), which were global exploratory scenarios spanning the scenario space across a two-axes matrix (Global/Regional and Economic/Environmental), the SSPs have been explicitly developed with respect to challenges to adaptation and mitigation (Rothman et al., 2014). Describing future socioeconomic development pathways in the absence of climate change or climate policies, the SSPs facilitate the exploration of the influence that varying levels of socioeconomic development have on future climate risks, under a given trajectory of greenhouse gas emissions (van Vuuren et al., 2014). A rapidly growing number of studies have employed the SSPs to explore the joint influence of climate change and socioeconomic development on future climate risks, such as agricultural-related and hunger risks (e.g. Wiebe et al., 2015), water scarcity risk (e.g. Arnell and Lloyd-Hughes, 2014), flood risk (e.g. Alfieri et al., 2016), fire risk (Knorr et al., 2016), risk of vector-borne diseases (Monaghan et al., 2018), and heat stress risk
Co-use of existing scenario sets to extend and quantify the Shared Socioeconomic
34
(e.g. Dong et al., 2015; Marsha et al., 2018; Rohat et al., 2019b). However, most of these IAV studies made a straightforward use of the global SSPs and relied on quantitative projections at the national level only (IIASA, 2016) – or simplistically downscaled at the sub-national level assuming homogenous growth/decline within the country –, without accounting for the sectoral and regional context. To enhance their suitability in sectoral and regional IAV studies (Wilbanks and Ebi, 2014) and to increase their legitimacy and intake by local stakeholders and practitioners (Absar and Preston, 2015), the global SSPs must be extended, i.e. contextualized, detailed, and eventually quantified for a given sector and/or region (van Ruijven et al., 2014). Such integration of regional and sectoral specificities is facilitated by the flexibility of the SSPs, which have been intentionally designed to be extended (O’Neill et al., 2017). Thought to be a critical activity, the extension of the global SSPs is rapidly growing. Examples of extensions include: (i) extended SSPs of population growth and urban development at the global scale (Jones and O’Neill, 2016), in large cities (Hoornweg and Pope, 2016), and in coastal zones (Merkens et al., 2016; Reimann et al., 2018), (ii) regional SSPs for Europe (Kok et al., 2015a), Tokyo (Kamei et al., 2016), the Barents region (Nilsson et al., 2017; van Oort et al., 2015), and U.S. Southeast (Absar and Preston, 2015), (iii) extended SSPs for health (Sellers and Ebi, 2018), (iv) extended SSPs of food security worldwide (Hasegawa et al., 2015), in South-East Asia (Mason-D'Croz et al., 2016), and in West-Africa (Palazzo et al., 2017), and (v) extended SSPs of water use worldwide (Wada et al., 2016) and in China (Yao et al., 2017). Across the existing methods to develop the extended SSPs, we identified a number of areas where further enhancements might still be possible. Firstly, most of the IAV studies that use the SSPs only employ the quantitative projections – e.g. population, GDP, education, and urbanization – available at the country-level from the SSPs database (IIASA, 2016). Although such an approach is often appropriate, it does not address the issue of contextualizing global scenarios to a specific sector and/or region. Secondly, existing extended SSPs that provide extensions of the storylines are often not accompanied with quantitative projections. While qualitative aspects of scenarios are sufficient in a number of cases, the lack of quantification may restrict their usefulness in quantitative IAV assessments. Thus, methods that concurrently provide detailed narratives and quantification of extended SSPs are needed. Thirdly, the extended SSPs’ storylines that have been subsequently quantified are mostly extended SSPs of population growth, for which a limited number of
Chapter 2
35
socioeconomic variables have been quantified – usually population growth and urbanization. While these quantitative projections are crucial to explore future patterns of human exposure, quantification of a wider range of socioeconomic and environmental variables are also needed to scrutinize future vulnerability patterns. Fourthly, the existing methods to develop extended SSPs generally do not include any systematic and thorough control to ensure the coherency between the extended SSPs and the global SSPs – although notable exceptions have to be pointed out (Kok et al., 2015a; Palazzo et al., 2017). Finally, the development of the extended SSPs can be resource- and time-intensive, as co-development with stakeholders is important and some scenarios may need to be designed almost from scratch. In light of these areas of potential improvements, and building on a few structured and promising methods to extend the global SSPs (Absar and Preston, 2015; Kemp-Benedict et al., 2014; Nilsson et al., 2017; Palazzo et al., 2017), we propose here a new method to develop and readily quantify regional and sectoral extensions of the global SSPs. This method relies exclusively on existing scenario studies, of which the potential usefulness has often been pointed out (Hunt et al., 2012) but the (re)use somewhat underestimated so far. In addition to making use of existing knowledge and to providing a structured and systematic matching of the global SSPs with multiple regional and sectoral scenario sets, the main benefit of this method is that it provides a high degree of quantification through the co-use of existing projections. To exemplify our method, we aim here to develop and quantify extended SSPs of human vulnerability in Europe. Over the past decades, much work has been carried out to identify the wide array of drivers of human vulnerability – i.e. the propensity or predisposition of human populations to be adversely affected by climatic hazards (IPCC, 2012) –, but very little has been done to explore how they will evolve in the future under varying levels of socioeconomic development (Carter et al., 2016; Dunford et al., 2015; Preston et al., 2011). Applying the method presented in this paper, we develop a set of extended SSPs of human vulnerability for 25 member states of the European Union and quantify them for 259 sub-national regions up to 2050.
2.2 Current state in the (re)use and matching of existing scenario sets
In the past decades, a very large number of scenario sets have been developed – often in relation to environmental issues –, as reviewed by e.g. Aerts et al. (2013), EEA (2011), Hunt et al. (2012), and IPBES (2016). Even though the
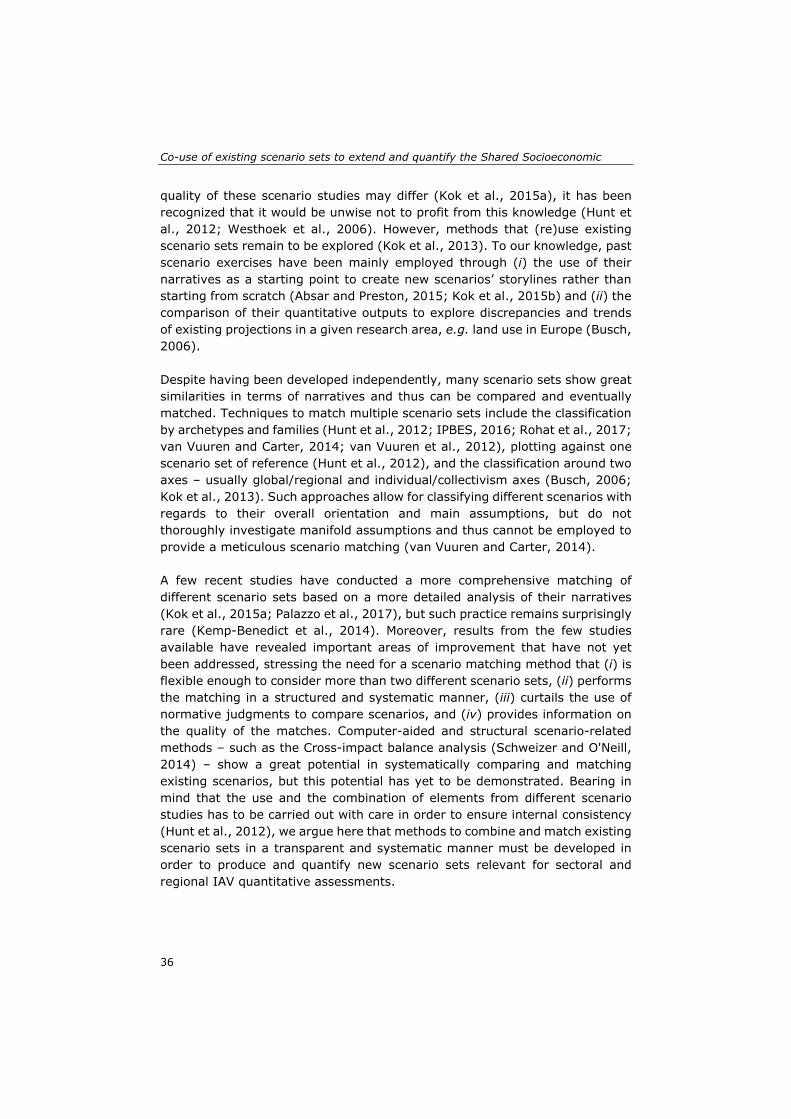
Co-use of existing scenario sets to extend and quantify the Shared Socioeconomic
36
quality of these scenario studies may differ (Kok et al., 2015a), it has been recognized that it would be unwise not to profit from this knowledge (Hunt et al., 2012; Westhoek et al., 2006). However, methods that (re)use existing scenario sets remain to be explored (Kok et al., 2013). To our knowledge, past scenario exercises have been mainly employed through (i) the use of their narratives as a starting point to create new scenarios’ storylines rather than starting from scratch (Absar and Preston, 2015; Kok et al., 2015b) and (ii) the comparison of their quantitative outputs to explore discrepancies and trends of existing projections in a given research area, e.g. land use in Europe (Busch, 2006). Despite having been developed independently, many scenario sets show great similarities in terms of narratives and thus can be compared and eventually matched. Techniques to match multiple scenario sets include the classification by archetypes and families (Hunt et al., 2012; IPBES, 2016; Rohat et al., 2017; van Vuuren and Carter, 2014; van Vuuren et al., 2012), plotting against one scenario set of reference (Hunt et al., 2012), and the classification around two axes – usually global/regional and individual/collectivism axes (Busch, 2006; Kok et al., 2013). Such approaches allow for classifying different scenarios with regards to their overall orientation and main assumptions, but do not thoroughly investigate manifold assumptions and thus cannot be employed to provide a meticulous scenario matching (van Vuuren and Carter, 2014). A few recent studies have conducted a more comprehensive matching of different scenario sets based on a more detailed analysis of their narratives (Kok et al., 2015a; Palazzo et al., 2017), but such practice remains surprisingly rare (Kemp-Benedict et al., 2014). Moreover, results from the few studies available have revealed important areas of improvement that have not yet been addressed, stressing the need for a scenario matching method that (i) is flexible enough to consider more than two different scenario sets, (ii) performs the matching in a structured and systematic manner, (iii) curtails the use of normative judgments to compare scenarios, and (iv) provides information on the quality of the matches. Computer-aided and structural scenario-related methods – such as the Cross-impact balance analysis (Schweizer and O'Neill, 2014) – show a great potential in systematically comparing and matching existing scenarios, but this potential has yet to be demonstrated. Bearing in mind that the use and the combination of elements from different scenario studies has to be carried out with care in order to ensure internal consistency (Hunt et al., 2012), we argue here that methods to combine and match existing scenario sets in a transparent and systematic manner must be developed in order to produce and quantify new scenario sets relevant for sectoral and regional IAV quantitative assessments.
Chapter 2
37
2.3 Scenario matching approach
2.3.1 Selection of existing scenario sets
We applied the following restricting criteria to select the scenario sets that will be used to inform the global SSPs with relevant information about future human vulnerability in Europe. The scenario sets must (i) focus on Europe, (ii) have been developed recently (i.e. post-2010) to ensure their timeliness (iii) contain at least four different scenarios – in order to increase the likelihood of matching them with the five SSPs –, (iv) be related to human vulnerability, (v) contain detailed storylines about future socioeconomic and/or environmental conditions in Europe up to 2050, (vi) be quantified for relevant socioeconomic and/or environmental variables at the sub-national level – at least at the Nomenclature of Territorial Units for Statistics-2 level (NUTS-2; Eurostat, 2016a) – up to 2050, (vii) be widely accepted by the scientific community, and (viii) not contain any explicit assumptions about future levels of greenhouse gas emissions. The latter is of utmost importance to ensure that the extended SSPs can be coupled with different RCPs in future IAV assessments. The screening process (Table S2.1)2 led to the selection of three different European scenario sets, namely ET2050 scenarios (MCRIT, 2014), DEMIFER scenarios (Rees et al., 2010; Rees et al., 2012) and CLIMSAVE scenarios (Gramberger et al., 2013). Despite their differences in terms of development approach (e.g. participatory vs desk-research), these are all exploratory scenario sets which aim at supporting strategic planning and decision support (further detailed in Tables S2.2 and S2.3). In a nutshell, the four ET2050 scenarios focus on territorial development and cohesion and have been quantified at the sub-national scale (NUTS-2 and NUTS-3) for variables such as accessibility, transport nodes, and urbanization. The five DEMIFER scenarios focus on demographic change and its associated drivers, with a strong emphasis on European and national policies, and have been quantified at the sub-national level (NUTS-2) for demographic variables such as migration, life expectancy, population growth, and labor force. The four CLIMSAVE scenarios are multi-disciplinary and cross-sectoral and are the most up-to-date and detailed set of environmental change-related socioeconomic scenarios in Europe, although the next generation is currently being developed (Kok et al., 2015b). Their quantification has been mostly focused on ecosystem services and provisions (e.g. food security, water exploitation) and on determinants of environmental conditions.
2 All tables and figures indicated with an S in this thesis are part of the supplementary information given in the appendix. The appendix can be accessed online under https://doi.org/10.17026/dans-xa9-fkx2.
Co-use of existing scenario sets to extend and quantify the Shared Socioeconomic
38
2.3.2 Matching method
The scenario matching method presented here (synthesized in Figure 2.1) comprises five main steps during which an internally consistent scenario set is developed based on the combination of several existing scenario sets. This method relies on a transparent, systematic, and semi-quantitative investigation of the similarities and discrepancies between qualitative assumptions of multiple scenario sets (i.e. more than two). A point worth mentioning is that the different scenario sets do not necessarily have to be produced at the same spatial scale, as multi-scale scenarios can also be compared and checked for coherency and consistency (Zurek and Henrichs, 2007). However, the different scenario sets should share a similar time-horizon to facilitate their comparison, with the exception of the global SSPs. Being wide socioeconomic development pathways rather than detailed socioeconomic scenarios per se (O’Neill et al., 2017), the SSPs provide future boundaries conditions and depict broad trends that are applicable throughout the entire 21st century. Thus, they can be compared with scenario sets of shorter time-horizon, as already achieved in e.g. Kok et al. (2015a) and Palazzo et al. (2017). In case of non-linear changes – such as population growth, which often peaks and declines – the use of basic quantification of the global SSPs (IIASA, 2016) might be required to better envision the non-linear variations of the variable and its state at a given time. Here, we match the narratives of four relevant scenario sets, namely three European scenario sets and the global SSPs (i.e. 18 scenarios in total). The narratives of the global SSPs were retrieved from O’Neill et al. (2017), whereas narratives of DEMIFER scenarios were retrieved from Rees et al. (2010, 2012), ET2050 scenarios from MCRIT (2014), and CLIMSAVE scenarios from Kok et al. (2013) and Gramberger et al. (2013). While we did not involve European stakeholders in this study, the scenario matching approach presented here provides a number of entry points for stakeholders. The involvement of stakeholders is generally needed to ensure the saliency and credibility of the extended SSPs, particularly if they are to be applied for decision-making.
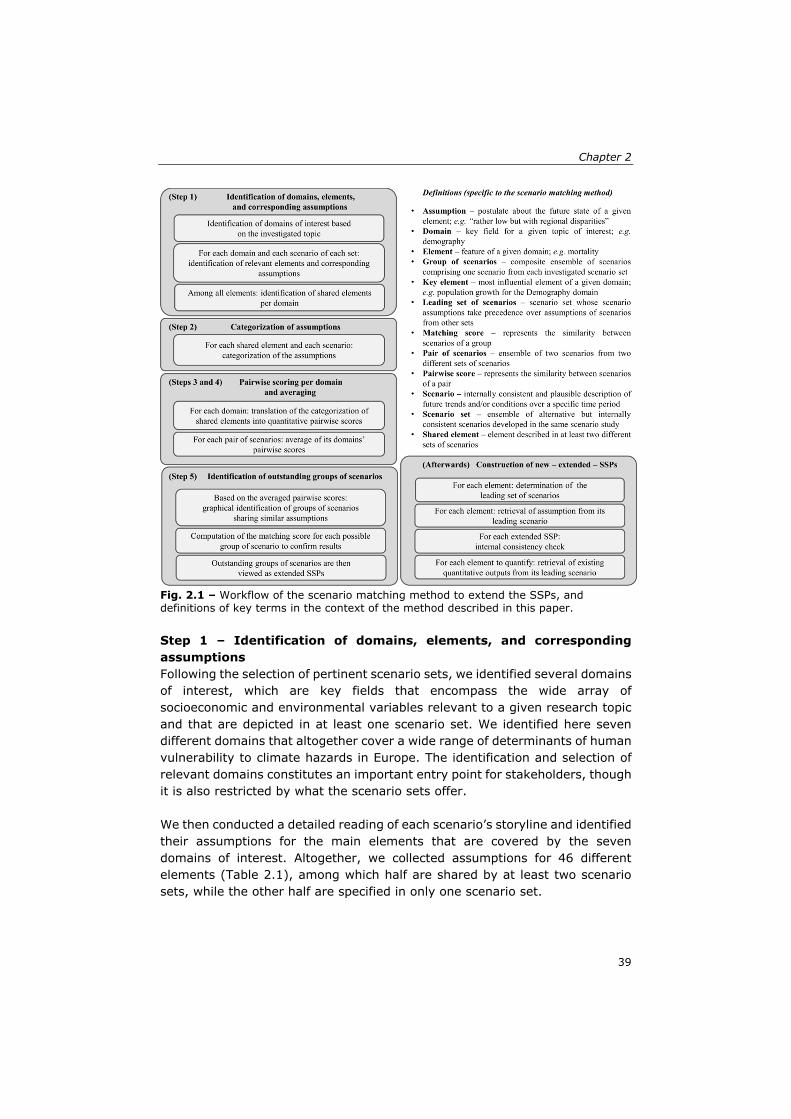
Chapter 2
39
Fig. 2.1 – Workflow of the scenario matching method to extend the SSPs, and definitions of key terms in the context of the method described in this paper. Step 1 – Identification of domains, elements, and corresponding assumptions Following the selection of pertinent scenario sets, we identified several domains of interest, which are key fields that encompass the wide array of socioeconomic and environmental variables relevant to a given research topic and that are depicted in at least one scenario set. We identified here seven different domains that altogether cover a wide range of determinants of human vulnerability to climate hazards in Europe. The identification and selection of relevant domains constitutes an important entry point for stakeholders, though it is also restricted by what the scenario sets offer. We then conducted a detailed reading of each scenario’s storyline and identified their assumptions for the main elements that are covered by the seven domains of interest. Altogether, we collected assumptions for 46 different elements (Table 2.1), among which half are shared by at least two scenario sets, while the other half are specified in only one scenario set.
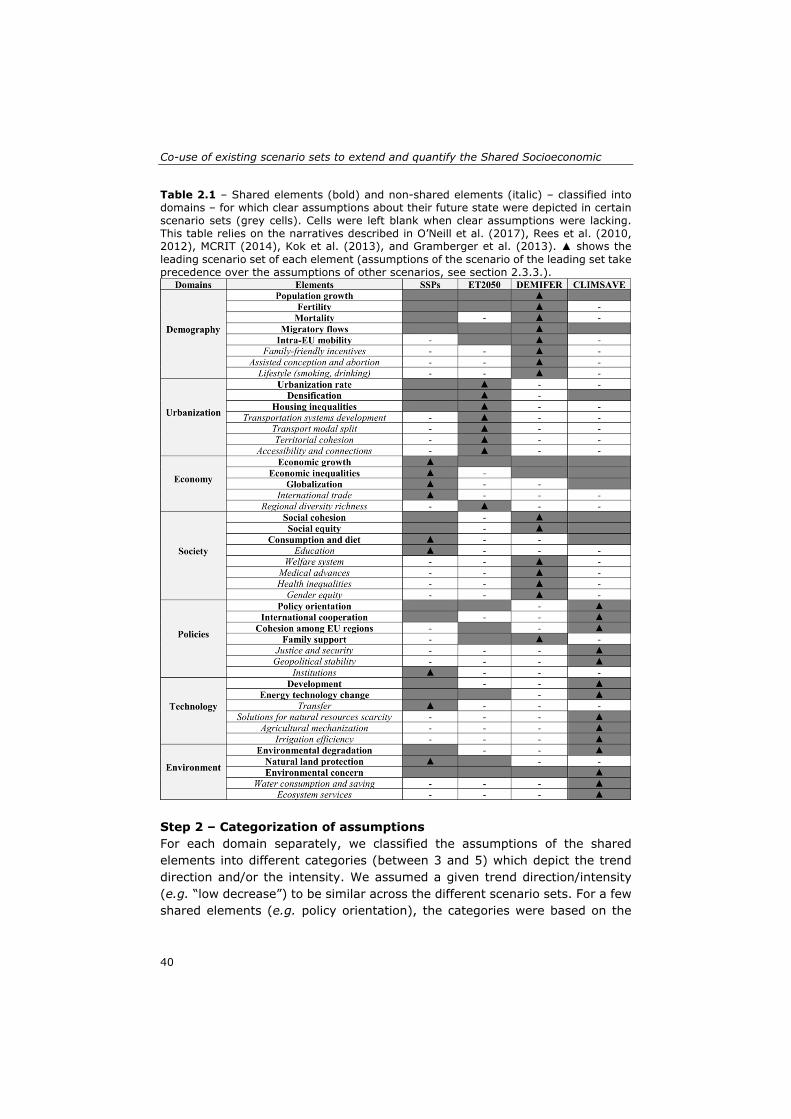
Co-use of existing scenario sets to extend and quantify the Shared Socioeconomic
40
Table 2.1 – Shared elements (bold) and non-shared elements (italic) – classified into domains – for which clear assumptions about their future state were depicted in certain scenario sets (grey cells). Cells were left blank when clear assumptions were lacking. This table relies on the narratives described in O’Neill et al. (2017), Rees et al. (2010, 2012), MCRIT (2014), Kok et al. (2013), and Gramberger et al. (2013). ▲ shows the leading scenario set of each element (assumptions of the scenario of the leading set take precedence over the assumptions of other scenarios, see section 2.3.3.).
Step 2 – Categorization of assumptions For each domain separately, we classified the assumptions of the shared elements into different categories (between 3 and 5) which depict the trend direction and/or the intensity. We assumed a given trend direction/intensity (e.g. “low decrease”) to be similar across the different scenario sets. For a few shared elements (e.g. policy orientation), the categories were based on the
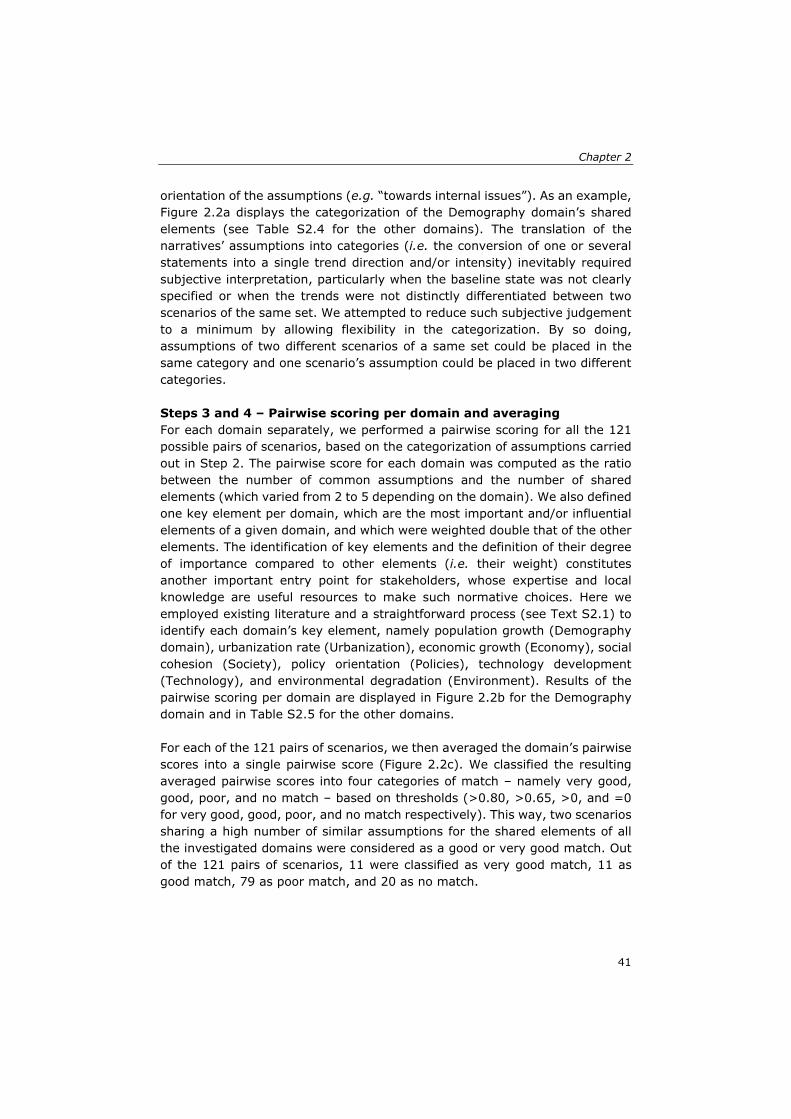
Chapter 2
41
orientation of the assumptions (e.g. “towards internal issues”). As an example, Figure 2.2a displays the categorization of the Demography domain’s shared elements (see Table S2.4 for the other domains). The translation of the narratives’ assumptions into categories (i.e. the conversion of one or several statements into a single trend direction and/or intensity) inevitably required subjective interpretation, particularly when the baseline state was not clearly specified or when the trends were not distinctly differentiated between two scenarios of the same set. We attempted to reduce such subjective judgement to a minimum by allowing flexibility in the categorization. By so doing, assumptions of two different scenarios of a same set could be placed in the same category and one scenario’s assumption could be placed in two different categories. Steps 3 and 4 – Pairwise scoring per domain and averaging For each domain separately, we performed a pairwise scoring for all the 121 possible pairs of scenarios, based on the categorization of assumptions carried out in Step 2. The pairwise score for each domain was computed as the ratio between the number of common assumptions and the number of shared elements (which varied from 2 to 5 depending on the domain). We also defined one key element per domain, which are the most important and/or influential elements of a given domain, and which were weighted double that of the other elements. The identification of key elements and the definition of their degree of importance compared to other elements (i.e. their weight) constitutes another important entry point for stakeholders, whose expertise and local knowledge are useful resources to make such normative choices. Here we employed existing literature and a straightforward process (see Text S2.1) to identify each domain’s key element, namely population growth (Demography domain), urbanization rate (Urbanization), economic growth (Economy), social cohesion (Society), policy orientation (Policies), technology development (Technology), and environmental degradation (Environment). Results of the pairwise scoring per domain are displayed in Figure 2.2b for the Demography domain and in Table S2.5 for the other domains. For each of the 121 pairs of scenarios, we then averaged the domain’s pairwise scores into a single pairwise score (Figure 2.2c). We classified the resulting averaged pairwise scores into four categories of match – namely very good, good, poor, and no match – based on thresholds (>0.80, >0.65, >0, and =0 for very good, good, poor, and no match respectively). This way, two scenarios sharing a high number of similar assumptions for the shared elements of all the investigated domains were considered as a good or very good match. Out of the 121 pairs of scenarios, 11 were classified as very good match, 11 as good match, 79 as poor match, and 20 as no match.
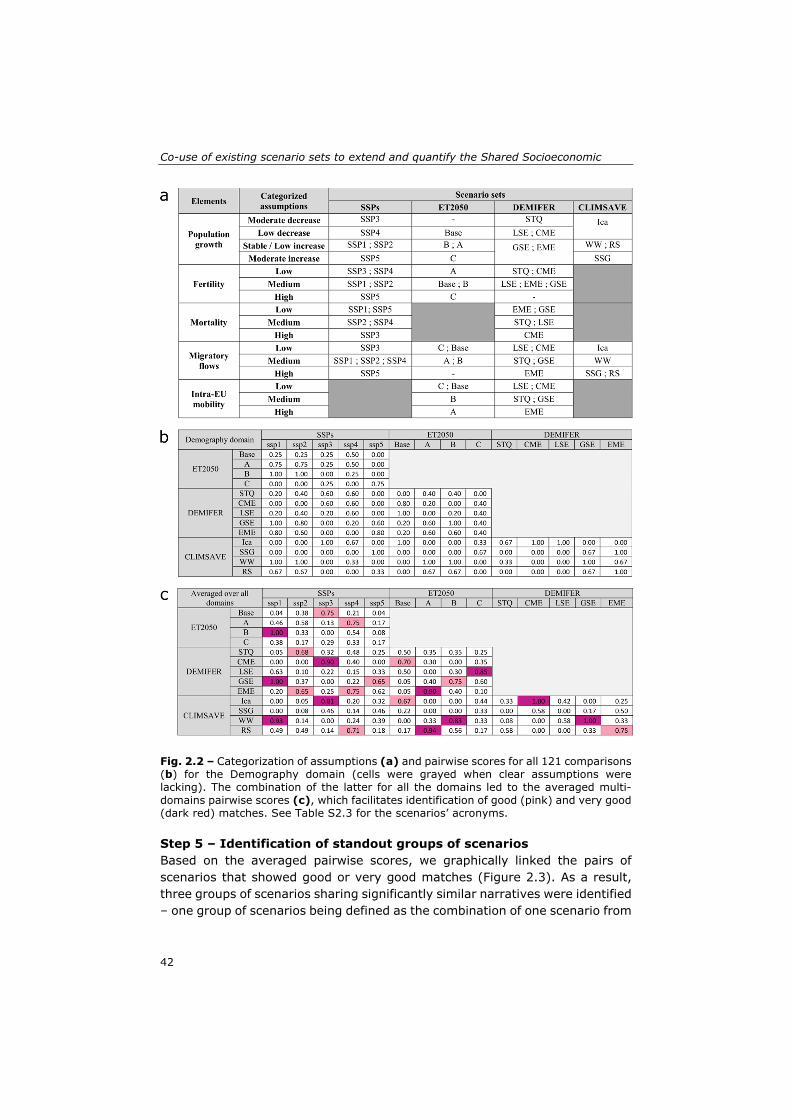
Co-use of existing scenario sets to extend and quantify the Shared Socioeconomic
42
Fig. 2.2 – Categorization of assumptions (a) and pairwise scores for all 121 comparisons (b) for the Demography domain (cells were grayed when clear assumptions were lacking). The combination of the latter for all the domains led to the averaged multi-domains pairwise scores (c), which facilitates identification of good (pink) and very good (dark red) matches. See Table S2.3 for the scenarios’ acronyms. Step 5 – Identification of standout groups of scenarios Based on the averaged pairwise scores, we graphically linked the pairs of scenarios that showed good or very good matches (Figure 2.3). As a result, three groups of scenarios sharing significantly similar narratives were identified – one group of scenarios being defined as the combination of one scenario from
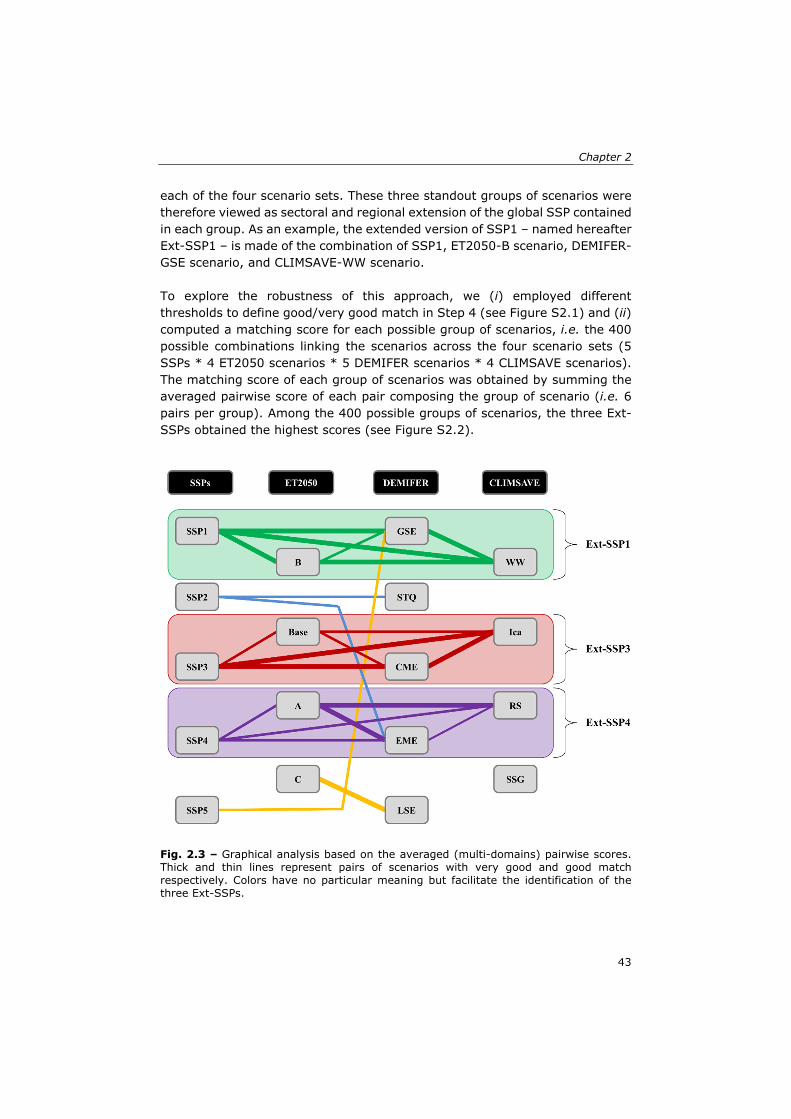
Chapter 2
43
each of the four scenario sets. These three standout groups of scenarios were therefore viewed as sectoral and regional extension of the global SSP contained in each group. As an example, the extended version of SSP1 – named hereafter Ext-SSP1 – is made of the combination of SSP1, ET2050-B scenario, DEMIFER-GSE scenario, and CLIMSAVE-WW scenario. To explore the robustness of this approach, we (i) employed different thresholds to define good/very good match in Step 4 (see Figure S2.1) and (ii) computed a matching score for each possible group of scenarios, i.e. the 400 possible combinations linking the scenarios across the four scenario sets (5 SSPs * 4 ET2050 scenarios * 5 DEMIFER scenarios * 4 CLIMSAVE scenarios). The matching score of each group of scenarios was obtained by summing the averaged pairwise score of each pair composing the group of scenario (i.e. 6 pairs per group). Among the 400 possible groups of scenarios, the three Ext-SSPs obtained the highest scores (see Figure S2.2).
Fig. 2.3 – Graphical analysis based on the averaged (multi-domains) pairwise scores. Thick and thin lines represent pairs of scenarios with very good and good match respectively. Colors have no particular meaning but facilitate the identification of the three Ext-SSPs.
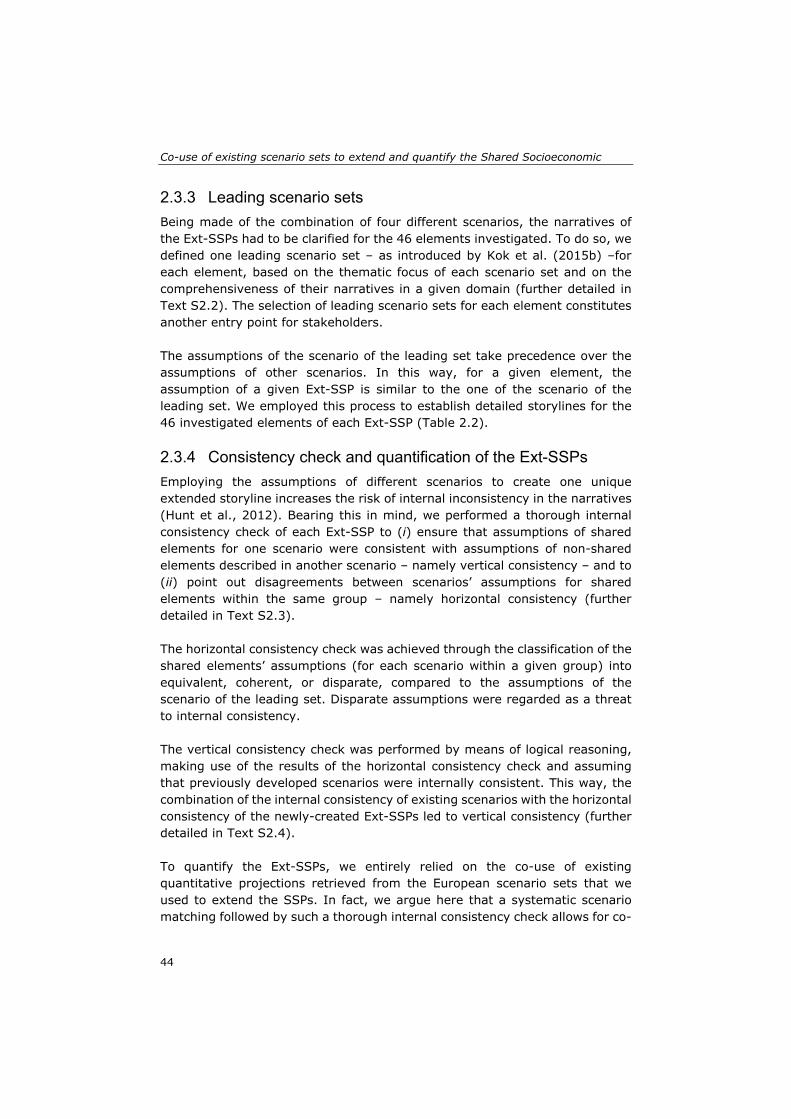
Co-use of existing scenario sets to extend and quantify the Shared Socioeconomic
44
2.3.3 Leading scenario sets
Being made of the combination of four different scenarios, the narratives of the Ext-SSPs had to be clarified for the 46 elements investigated. To do so, we defined one leading scenario set – as introduced by Kok et al. (2015b) –for each element, based on the thematic focus of each scenario set and on the comprehensiveness of their narratives in a given domain (further detailed in Text S2.2). The selection of leading scenario sets for each element constitutes another entry point for stakeholders. The assumptions of the scenario of the leading set take precedence over the assumptions of other scenarios. In this way, for a given element, the assumption of a given Ext-SSP is similar to the one of the scenario of the leading set. We employed this process to establish detailed storylines for the 46 investigated elements of each Ext-SSP (Table 2.2).
2.3.4 Consistency check and quantification of the Ext-SSPs
Employing the assumptions of different scenarios to create one unique extended storyline increases the risk of internal inconsistency in the narratives (Hunt et al., 2012). Bearing this in mind, we performed a thorough internal consistency check of each Ext-SSP to (i) ensure that assumptions of shared elements for one scenario were consistent with assumptions of non-shared elements described in another scenario – namely vertical consistency – and to (ii) point out disagreements between scenarios’ assumptions for shared elements within the same group – namely horizontal consistency (further detailed in Text S2.3). The horizontal consistency check was achieved through the classification of the shared elements’ assumptions (for each scenario within a given group) into equivalent, coherent, or disparate, compared to the assumptions of the scenario of the leading set. Disparate assumptions were regarded as a threat to internal consistency. The vertical consistency check was performed by means of logical reasoning, making use of the results of the horizontal consistency check and assuming that previously developed scenarios were internally consistent. This way, the combination of the internal consistency of existing scenarios with the horizontal consistency of the newly-created Ext-SSPs led to vertical consistency (further detailed in Text S2.4). To quantify the Ext-SSPs, we entirely relied on the co-use of existing quantitative projections retrieved from the European scenario sets that we used to extend the SSPs. In fact, we argue here that a systematic scenario matching followed by such a thorough internal consistency check allows for co-
Chapter 2
45
using the quantitative projections coming from different scenario studies. Therefore, we combined the scenario sets not only in their qualitative aspect (i.e. narratives) but also in their quantitative form (i.e. quantitative projections).
2.4 Outputs
2.4.1 Narratives of the Ext-SSPs
Based on the matching of scenarios originating from different existing sets, we developed regional and sectoral extensions of three different global SSPs, namely Ext-SSP1, Ext-SSP3, and Ext-SSP4. No good matches were established for SSP2 and SSP5; we were therefore unable to extend them. The different European scenario sets that were employed to create the Ext-SSPs all informed the regional extension of the SSPs at both the European and sub-national (NUTS-2) levels. Their contribution to the sectoral extension differed, however. DEMIFER scenarios provided much of the sectoral extension on demographic and social trends, ET2050 scenarios mainly contributed to the extension on urban and territorial development, and CLIMSAVE scenarios provided extension on environmental conditions as well as on European policies and technology to some extent. Through the determination of leading scenario sets for the 46 elements identified, we developed detailed narratives for each Ext-SSP (Table 2.2 and Table S2.6), describing contrasting future states of Europe in 2050, with particular emphasis on expected changes in domains relevant to human vulnerability.
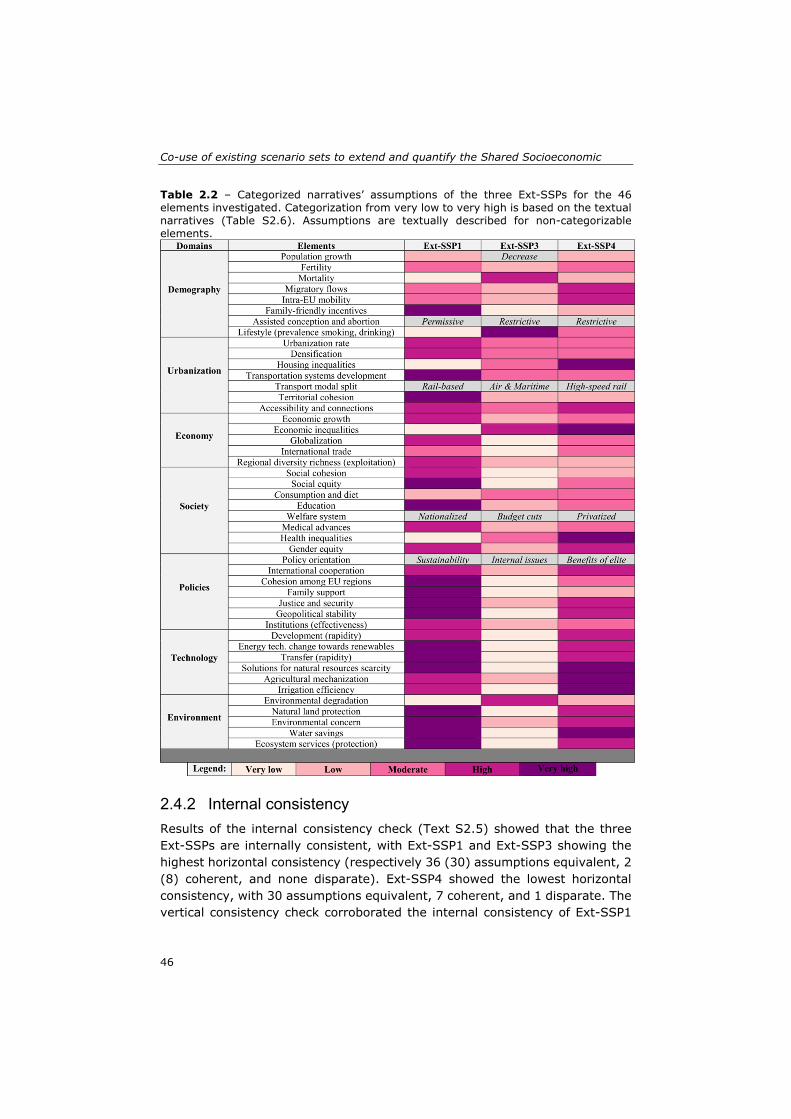
Co-use of existing scenario sets to extend and quantify the Shared Socioeconomic
46
Table 2.2 – Categorized narratives’ assumptions of the three Ext-SSPs for the 46 elements investigated. Categorization from very low to very high is based on the textual narratives (Table S2.6). Assumptions are textually described for non-categorizable elements.
2.4.2 Internal consistency
Results of the internal consistency check (Text S2.5) showed that the three Ext-SSPs are internally consistent, with Ext-SSP1 and Ext-SSP3 showing the highest horizontal consistency (respectively 36 (30) assumptions equivalent, 2 (8) coherent, and none disparate). Ext-SSP4 showed the lowest horizontal consistency, with 30 assumptions equivalent, 7 coherent, and 1 disparate. The vertical consistency check corroborated the internal consistency of Ext-SSP1
Chapter 2
47
and Ext-SSP3 and ensured that the disparate assumption of Ext-SSP4 (for the element “population growth”) did not threaten its internal consistency.
2.4.3 Quantification of drivers of future human vulnerability
Based on the co-use of the matched scenarios’ quantitative outputs, we quantified the three Ext-SSPs for a wide range of socioeconomic and environmental variables, such as (i) population growth, mortality, life expectancy, migratory flows, and labor force participation – all quantified within the DEMIFER project –, (ii) accessibility per travel mode (rail, air, road, maritime), urbanization, and land use – produced within the ET2050 project –, and (iii) fertilizer/pesticide usage, water withdrawals, biodiversity index, and many more ecosystems-related variables – all projected within the CLIMSAVE project. All of these projections are available at the sub-national level (NUTS-2) for 259 sub-national regions, up to 2050, with a common baseline year (2010). Relying on such a high level of quantification, we directly retrieved these readily available projections from their respective research projects for a number of variables related to human vulnerability and explored their future trends under the three Ext-SSPs (Figure 2.4 and Figure S2.3). We particularly focused on changes – compared to baseline (2010) – in accessibility to road/rail and soil artificialization (retrieved from ET2050 project), water exploitation and biodiversity index (retrieved from CLIMSAVE project), and proportion of elderly and internal migration (retrieved from DEMIFER project). In line with the Ext-SSPs’ narratives, results showed that the three socioeconomic development pathways have a highly contrasting influence on a number of environmental and socioeconomic variables. Under all scenarios, large spatial disparities can be seen both across and within countries, highlighting the need for a sub-national quantification of the Ext-SSPs for regional IAV studies.
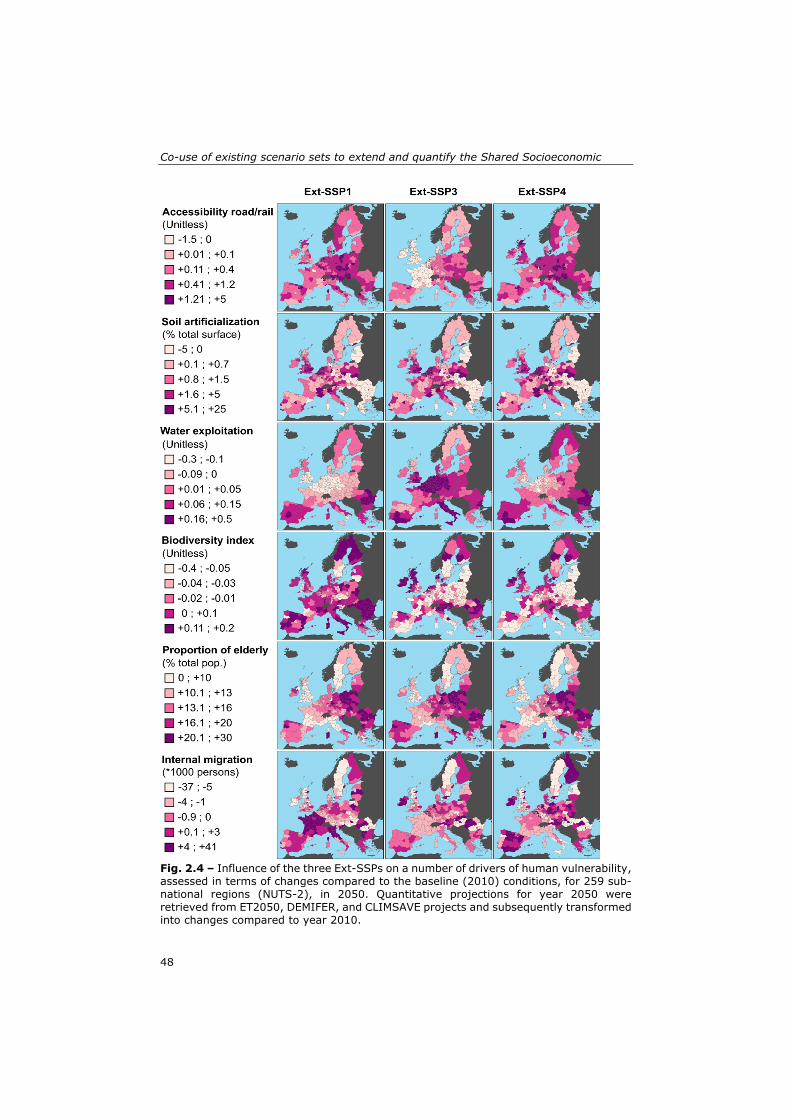
Co-use of existing scenario sets to extend and quantify the Shared Socioeconomic
48
Fig. 2.4 – Influence of the three Ext-SSPs on a number of drivers of human vulnerability, assessed in terms of changes compared to the baseline (2010) conditions, for 259 sub-national regions (NUTS-2), in 2050. Quantitative projections for year 2050 were retrieved from ET2050, DEMIFER, and CLIMSAVE projects and subsequently transformed into changes compared to year 2010.
Chapter 2
49
2.5 Discussion and conclusions The regional and sectoral contextualization and quantification of global development trends such as the SSPs is an inevitable step to enhance their relevance in regional and sectoral IAV studies and their intake by local stakeholders (van Ruijven et al., 2014). With a focus on future human vulnerability in Europe, we presented in this paper a method that uses existing scenario studies to extend the global SSPs. Building upon existing methods to develop extended SSPs, such an approach demonstrates a number of benefits. Firstly, it enables the matching of multiple sets of local existing scenarios with the global SSPs, whereas so far existing methods facilitate matching of only one set of local scenarios with the SSPs (e.g. Nilsson et al., 2017). Such a matching of multiple scenario sets permits a richer and wider extension of the global SSPs than methods based on a single scenario set. Through the matching of three sets of European scenarios with the global SSPs, we developed Ext-SSPs that possess very detailed narratives in multiple sectors such as future environmental conditions (informed by the CLIMSAVE scenarios), demographic trends (informed by the DEMIFER scenarios), and territorial development (informed by the ET2050 scenarios). However, because such an approach requires the use of several existing scenario sets, its applicability may be challenged by the lack of appropriate scenarios. This is particularly the case in scenario-poor environments (e.g. at the local scale or for time-horizons beyond 2050), in which it might be challenging to find scenario sets that (i) are of high quality, (ii) are associated with quantitative projections that share a common baseline, and (iii) respect certain criteria to be mapped against SSPs – such as having at least four different scenarios and not containing any explicit information about future levels of greenhouse gas emissions. Secondly, through the co-use of existing quantitative projections from the leading scenario sets, this method allows for the ready quantification of Ext-SSPs for manifold socioeconomic and environmental variables. As an example, we quantified the three Ext-SSPs for a number of drivers of human vulnerability in Europe, up to 2050, at a relevant sub-national spatial scale. Such a high level of quantification – in addition to the detailed storylines that are relevant to stakeholders – constitutes the greatest benefit of this method to extend the SSPs. This particularly holds since the scarcity of quantitative projections consistent with locally relevant socioeconomic scenarios is one of the main factors limiting their use in IAV studies (Rohat, 2018). Despite the fact that a number of IAV studies based on the SSPs only employed a selection of them (e.g. Marsha et al. (2018) and Monaghan et al. (2018) who considered only SSP3 and SSP5 or Knorr et al. (2016) who considered SSP2,
Co-use of existing scenario sets to extend and quantify the Shared Socioeconomic
50
SSP3, and SSP5), the inability of the method presented here to extend all the five SSPs for a particular sector/region may limit its potential usefulness among the IAV community. This is particularly true in view of the growing number of environmental research projects that make use of at least four different SSPs, e.g. “Adaptation Actions for a Changing Arctic” (Nilsson et al., 2017), “Impacts and Risk from High-End Scenarios” (Kok et al., 2015b), and “Towards Sustainable and Resilient European Farming Systems” (Mathijs et al., 2018). Although SSP2 and SSP5 have been previously linked to other global scenarios – based on archetypes (van Vuuren et al., 2012), we were not able to extend them, partly because the method that we developed provides a far more detailed analysis of the (dis)similarities between scenarios’ assumptions than a mapping by archetypes. This is crucial to ensure the Ext-SSPs’ internal consistency and to enable the co-use of the matched scenarios’ quantitative outputs. Moreover, the peculiar structure of the set of SSPs also limits the matching of SSPs with existing scenario sets, which usually comprise four contrasted scenarios based on a more conventional two-axes structure. This particularly affects the potential matching of SSP2, being a business-as-usual (“middle of the road”) scenario. As for SSP5, we found that its poor match with other existing scenarios – also highlighted in Kok et al. (2018) – mainly lies in the dichotomy between its assumption of high societal sustainability driven by a strong economic growth (dominated by fossil fuels energy) and its assumptions of low environmental sustainability and of low concern for the natural capital. In the other investigated scenario sets, we found that scenarios depicting low environmental sustainability were often associated with very low economic growth and low social capital (e.g. CLIMSAVE SSG), whereas most scenarios depicting high societal sustainability also assumed a high environmental sustainability and a divergence from fossil fuels (i.e. closer to the SSP1 storyline). An interesting follow-up research exercise would be to include the European SSPs (Kok et al., 2015b; Kok et al., 2019) within the scenario matching analysis and to explore in particular the discrepancies and similarities between the European SSP5 and existing local European scenarios. Thirdly, through the categorization of scenarios’ assumptions and the computation of pairwise and matching scores, this method provides a structured and systematic assessment of the similarities between different scenarios of multiple scenario sets. This guarantees the quality of the matches, the coherency between the extended SSPs and the global SSPs, and the internal consistency of the extended SSPs. However, although being structured and semi-quantitative, this method still requires a number of normative judgments, which might alter the outcomes of the scenario matching. For instance, these include the selection of relevant domains and elements, the
Chapter 2
51
weighting of key elements, and the selection of a leading scenario set for each element. We emphasize here the need to fall back on stakeholders for making these normative judgments, as their expertise and local knowledge are useful resources. Moreover, the categorization of the assumptions in step 2 inevitably required subjective interpretation. The use of qualitative data analysis tools (Stratigea et al., 2012) to reduce such subjective interpretation would be worth exploring. In the same vein, the use of computer-aided and structural scenario-related methods – e.g. Cross-impact balance analysis (Schweizer and Kurniawan, 2016; Schweizer and O'Neill, 2014) – would also be worth investigating. While these methods have been designed to explore scenario spaces in a systematic manner (Carlsen et al., 2016a) and to select relevant scenarios among a computer-generated large ensemble of plausible futures (e.g. Carlsen et al., 2016b; Lamontagne et al., 2018), these could be derived from their initial usage and be applied within the scenario matching approach to classify the scenarios’ elements and their assumptions and to perform a systematic consistency check of all the potential Ext-SSPs (i.e. all groups of scenarios). Finally, this approach is less resource- and time-consuming than existing methods to extend SSPs that necessitate to involve (i) stakeholders in form of participatory workshops (e.g. Nilsson et al., 2017) and (ii) modeling teams to translate the narratives into quantitative projections (e.g. Palazzo et al., 2017). However, such shortcuts and gain of time and resources may threaten the stakeholders’ ownership of scenarios, who are involved in the scenarios’ development only through specific entry points. To ensure the credibility of the final scenario sets, particular attention should be given to the initial acceptance by stakeholders of the composite scenario sets employed to extend the SSPs. In view of the detailed narratives and of the high degree of quantification it provides, combined with its high cost-efficiency and the reliability of the matching it provides, such an approach shows great potential to be taken on board by the IAV community to develop and readily quantify regional and sectoral extended SSPs. The latter contain crucial additional information – both qualitative and quantitative – to explore the influence of varying levels of regional socioeconomic development – linked to global contexts – on future vulnerability to climate hazards. Ultimately, these extended SSPs should be integrated within a scenario matrix architecture together with RCPs depicting different levels of greenhouse gas emissions and Shared Policy Assumptions (SPAs) depicting various climate mitigation and adaptation policies. Such scenario matrix architecture can be used to assess the joint contribution of climate and regional socioeconomic changes to future climate risks and to explore the differential impacts of a given RCP under varying levels of socioeconomic development and different adaptation policies. However further research is needed to explore ways to implement the SPAs in IAV-related

Co-use of existing scenario sets to extend and quantify the Shared Socioeconomic
52
scenario studies and ways to differentiate autonomous adaptation within the regional SSPs from specific adaptation options and strategies defined by the climate policies.
53
Chapter 3 Projecting drivers of human vulnerability under the Shared Socioeconomic Pathways3
3This chapter is based on the article: Rohat G (2018). Projecting drivers of human vulnerability under the Shared Socioeconomic Pathways. International Journal of Environmental Research and Public Health 15: 554.
Projecting drivers of human vulnerability under the Shared Socioeconomic Pathways
54
Abstract The Shared Socioeconomic Pathways (SSPs) are the new set of alternative futures of societal development that inform global and regional climate change research. They have the potential to foster the integration of socioeconomic scenarios within assessments of future climate-related health impacts. To date, such assessments have primarily superimposed climate scenarios on current socioeconomic conditions only. Until now, the few assessments of future health risks that employed the SSPs have focused on future human exposure – i.e., mainly future population patterns –, neglecting future human vulnerability. This paper first explores the research gaps –mainly linked to the paucity of available projections – that explain such a lack of consideration of human vulnerability under the SSPs. It then highlights the need for projections of socioeconomic variables covering the wide range of determinants of human vulnerability, available at relevant spatial and temporal scales, and accounting for local specificities through sectoral and regional extended versions of the global SSPs. Finally, this paper presents two innovative methods of obtaining and computing such socioeconomic projections under the SSPs – namely the scenario matching approach and an approach based on experts’ elicitation and correlation analyses – and applies them to the case of Europe. They offer a variety of possibilities for practical application, producing projections at sub-national level of various drivers of human vulnerability such as demographic and social characteristics, urbanization, state of the environment, infrastructure, health status, and living arrangements. Both the innovative approaches presented in this paper and existing methods – such as the spatial disaggregation of existing projections and the use of sectoral models – show great potential to enhance the availability of relevant projections of determinants of human vulnerability. Assessments of future climate-related health impacts should thus rely on these methods to account for future human vulnerability – under varying levels of socioeconomic development – and to explore its influence on future health risks under different degrees of climate change.
Chapter 3
55
3.1 Introduction It has long been acknowledged that socioeconomic determinants play an important role in the characterization of climate risks, through vulnerability and exposure (IPCC, 2012). As a result, nearly all assessments of climate risks consider both climatic (hazard) and socioeconomic (vulnerability and exposure) conditions (de Sherbinin, 2014b). Nevertheless, when it comes to modelling future climate-related health risks, the overwhelming majority of studies have been based on projections of future climatic conditions – through climate models and scenarios – superimposed on current socioeconomic conditions only (Ebi et al., 2016; Preston et al., 2011; Rohat et al., 2018). By making the implicit assumption that drivers of risk other than climate change will remain the same, most of the existing studies have failed to account for the influence that socioeconomic development might have on future climate-related health impacts (Jurgilevich et al., 2017). This crucial issue of temporal scale mismatch was raised more than a decade ago (Lorenzoni et al., 2000; UKCIP, 2001), the dynamics of vulnerability have been long recognized (Adger, 2006), and several papers have stressed the need for improved understanding of future vulnerability (Birkmann et al., 2013; Dilling et al., 2015; Garschagen and Kraas, 2010; IPCC, 2012; Preston et al., 2011). In spite of this, future socioeconomic conditions have been very rarely accounted for until now and projections of human vulnerability are largely lacking (Jurgilevich et al., 2017). Given that a large share of climate risk assessments serve adaptation purposes, such a practice is likely to introduce systematic bias into climate and health adaptation strategies (Ebi et al., 2016). Partly to counteract such shortcomings and to foster the use of socioeconomic scenarios and projections within climate risk assessments, the climate change research community has been engaged over the past few years in the development of a new scenario framework, in which climate and socioeconomic scenarios were developed in parallel (Moss et al., 2010). This new scenario framework for climate change research comprises a set of greenhouse gas emissions trajectories, namely the Representative Concentration Pathways (RCPs; van Vuuren et al., 2011), and a set of global socioeconomic development trends, namely the Shared Socioeconomic Pathways (SSPs; O’Neill et al., 2014). These global pathways have been designed to be combined in a scenario matrix architecture (van Vuuren et al., 2014) – assuming that given RCPs can be reached by different SSPs – to explore the wide range of challenges to mitigation and adaptation. While much of the climate research has been focused on understanding the impacts of different RCPs on a wide array of socioeconomic and natural systems (IPCC, 2014), very little has been done until now to explore the influence of temporal dynamics of
Projecting drivers of human vulnerability under the Shared Socioeconomic Pathways
56
socioeconomic systems – under the SSPs – on future human vulnerability and climate-related health risks (Lutz and Muttarak, 2017). In fact, despite the rapidly growing array of studies making use of both the RCPs and SSPs to explore future climate-related health impacts, the influence of changes in socioeconomic conditions is still largely underestimated and mostly constrained to changes in exposure only, utterly neglecting the effect of changes in human vulnerability (Rohat et al., 2019b). Drawing on this, the aim of this paper is twofold. First, it aims to critically discuss the current state of practice in relation to the use of SSPs in the assessment of future climate-related health impacts, in order to identify and better characterize the research gaps and needs, particularly in terms of availability of socioeconomic projections. Second, through a European case-study, this paper aims to present two innovative methods that complement existing projection methods and have the potential to address the aforementioned research needs.
3.2 Current State of Practice
3.2.1 Shared Socioeconomic Pathways – SSPs
The SSPs are the latest set of IPCC-guided global socioeconomic development trends that provide a global context to guide climate change research at both global and regional levels (O’Neill et al., 2014, 2017). They are made up of five contrasting global development pathways that depict plausible alternative future states of the society and the environment (see Table S3.1). They have been purposely designed to span the wide range of socioeconomic challenges to adaptation and mitigation. A substantial body of literature has documented (i) their development (Ebi et al., 2014; Kriegler et al., 2012; Moss et al., 2010; Nakicenovic et al., 2014; O’Neill et al., 2014, 2017; Schweizer and O’Neill, 2014; van Vuuren and Carter, 2014); (ii) their quantification at the national level up to 2100 for a few key socioeconomic variables – freely available online (IIASA, 2016) – such as demography and education (KC and Lutz, 2014, 2017), urbanization (Jiang and O’Neill, 2017), economic growth (Crespo Cuaresma, 2017; Dellink et al., 2017; Leimbach et al., 2017), and land use (Popp et al., 2017); (iii) their integration with climate change (Riahi et al., 2017); and (iv) their links with future atmospheric concentration of greenhouse gases (Böhmelt, 2017; Guivarch et al., 2016; Marangoni et al., 2017; Velders et al., 2015).
3.2.2 Extended SSPs
An important feature of the SSPs lies in their flexibility. They have been purposely conceived to be extended, i.e., contextualized, detailed, and eventually quantified for specific regions and/or sectors (van Ruijven et al., 2014). Extended versions of the global ‘basic’ SSPs have an increased
Chapter 3
57
suitability and usefulness for local and/or sectoral studies, are of greater relevance for policy-making, and are more likely to be used by local stakeholders. A growing number of studies have employed the narratives of the global SSPs to develop extended SSPs for specific regions and/or sectors. So far, extended SSPs include extended SSPs of urban and population development worldwide (Jones and O’Neill, 2016; Murakami and Yamagata, 2016), in coastal areas (Merkens et al., 2016; Reimann et al., 2018), and in large cities (Hoornweg and Pope, 2016), extended SSPs for health (Ebi, 2013; Sellers and Ebi, 2018), for the water sector (Wada et al., 2016; Yao et al., 2016), for fisheries (Maury et al., 2017), for the forestry sector (Kemp-Benedict et al., 2014), and for food security worldwide (Hasegawa et al., 2015), in West-Africa (Palazzo et al., 2017), and in South-East Asia (Mason-D'Croz et al., 2016), and extended SSPs for specific regions, e.g., the Barents region (Nilsson et al., 2017), the Arctic (Nilsson et al., 2015), Tokyo (Kamei et al., 2016), Iberia (Kok and Pedde, 2016), Scotland (Kok and Pedde, 2016), the US (Absar and Preston, 2015), and Europe (Kok et al., 2015b; Rohat et al., 2018).
3.2.3 Integration within Climate-Related Health Impact Assessments
The SSPs have been purposely designed to be used within Impacts, Adaptation, and Vulnerability (IAV) studies. Therefore, they have the potential to enhance the integration of socioeconomic scenarios within future-looking IAV research (Rothman et al., 2014; van Ruijven et al., 2014) and to improve the comparability between different case studies (Hunter and O'Neill, 2014; Wilbanks and Ebi, 2014). Over the past few years, a rapidly growing number of IAV studies have made use of the SSPs – coupled with different RCPs – to assess future climate-related health impacts under multiple combinations of socioeconomic and climate scenarios. So far, these studies have been conducted in the fields of food security and hunger risks (Biewald et al., 2015; Davenport et al., 2017; Hasegawa et al., 2014; Hasegawa et al., 2016; Ishida et al., 2014; Mason-D'Croz et al., 2016; Springmann et al., 2016; Wiebe et al., 2015), fire risk (Knorr et al., 2016), exposure to vector-borne diseases (Monaghan et al., 2018; Suk, 2016), water scarcity (Arnell and Lloyd-Hughes, 2014; Chen et al., 2018; Hanasaki et al., 2013; Koutroulis et al., 2018; Parkinson et al., 2016; Veldkamp et al., 2016), flood risks (Alfieri et al., 2016; Hinkel et al., 2014; Jongman et al., 2015), air pollution risks (Knorr et al., 2017; Xu et al., 2015), and heat-related health impacts (Anderson et al., 2018; Astrom et al., 2017; Chen et al., 2017; Coffel et al., 2018; Dholakia et al., 2015; Dong et al., 2015; Jones et al., 2018; Kjellstrom et al., 2017; Liu et al., 2017; Marsha et al., 2018; Matthews et al., 2017; Mishra et al., 2017; Mora et al., 2017; Rohat et al., 2017).
Projecting drivers of human vulnerability under the Shared Socioeconomic Pathways
58
3.2.4 Research Gaps and Needs
The aforementioned studies that use SSPs and RCPs to explore future climate-related health impacts show a number of recurrent shortcomings, which can be translated into research gaps and needs. These drawbacks are mainly related to the lack of regional and sectoral contextualization of the global SSPs and to the lack of consideration for vulnerability. These are detailed below. Lack of extended SSPs. A number of existing studies make a straightforward use of the global SSPs’ narratives and of their quantification at the country level, without contextualizing them for the region and/or sector of interest, thus neglecting the processes that are specific to a given region and/or sector and that influence future socioeconomic and environmental trends. The most common practice linked to this shortcoming is to assume a homogeneous population or economic growth rate within an entire country to downscale national projections of the global SSPs at the sub-national scale, without accounting for local socioeconomic processes that may influence the distribution of population or economic growth within the region. For instance, Marsha et al. (2018) have applied the global SSPs’ population change rates at the national level (US) to estimate future population growth in Houston, without considering Houston’s specific socioeconomic and urban development. Similarly, Koutroulis et al. (2018) and Alfieri et al. (2016) have employed national-level quantitative projections of the global SSPs (for GDP and population growth) in their assessments of future water security and flood risk in Europe, without accounting for specific European socioeconomic developments (Kok et al., 2015b). Another recent example lies in a study (Arnell and Lloyd-Hughes, 2014) in which the authors assumed a similar population growth rate in flood-prone areas as the growth rate at the national level, despite recognizing that population usually tends to grow faster in flood-prone areas than in other places (due to the higher growth rate of low-income populations). In this particular case, such an assumption led to an underestimation of the number of people exposed to river flooding. Lack of consideration of vulnerability. The overwhelming majority of existing assessments of future climate-related health impacts account only for future exposure (i.e., the future size of the populations exposed to climatic hazards) under different SSPs and neglect the future populations’ vulnerability (i.e., their abilities to prepare for, respond to, and recover from climatic hazards). Such a lack of consideration of vulnerability can be found in most of the existing studies, e.g., in assessment of future heat stress risk (Chen et al., 2017; Coffel et al., 2017; Liu et al., 2017; Matthews et al., 2017; Mishra et al., 2017), of future flooding risk (Arnell and Lloyd-Hughes, 2014), of future risk of vector-borne diseases (Monaghan et al., 2018), and so on. While most of the aforementioned authors acknowledge that future research should attempt to
Chapter 3
59
integrate projections of drivers of human vulnerability, these are still very rarely found. By disregarding the future states of vulnerability, past studies have focused only on the “population effect” (i.e., the influence of population growth on future populations’ exposure) (Coffel et al., 2018; Matthews et al., 2017) and have substantially underestimated the influence that varying levels of socioeconomic development may have on future climate-related health impacts (Ebi et al., 2016). Up until now, the few studies that have employed projections of vulnerability under the SSPs have been limited to projections of age, education (Dong et al., 2015), income level, water demand (Hanasaki et al., 2013; Koutroulis et al., 2018), urbanization (Rohat et al., 2017), crop demand, and share of livestock (Hasegawa et al., 2014). It is also worth noting that most of these projections of drivers of vulnerability have been employed at a very coarse spatial resolution – country-level mainly –, thus limiting their usefulness for policy-making and their intake by local stakeholders as well as their compatibility with climate projections – often realized at 0.5° (Jacob et al., 2014). To justify such paucity of contextualization of socioeconomic projections under the SSPs and such lack of consideration of future populations’ vulnerability, authors traditionally point out the scarcity of socioeconomic projections, in terms of diversity, spatial scale, consistency with the SSPs, and relevance at local scale (Table 3.1). This research gap provides a convincing explanation of the aforementioned drawbacks. This close look at the current state of practice clearly highlights the needs to develop quantitative projections of socioeconomic variables that are consistent with the global SSPs (i.e., linked to global contexts) while accounting for local and sectoral specificities (i.e., making use of extended SSPs), that are produced at relevant spatial and temporal scales – in line with climate models’ outputs and with the scale at which socioeconomic processes happen –, and that cover the broad range of drivers that influence human vulnerability to climate change.
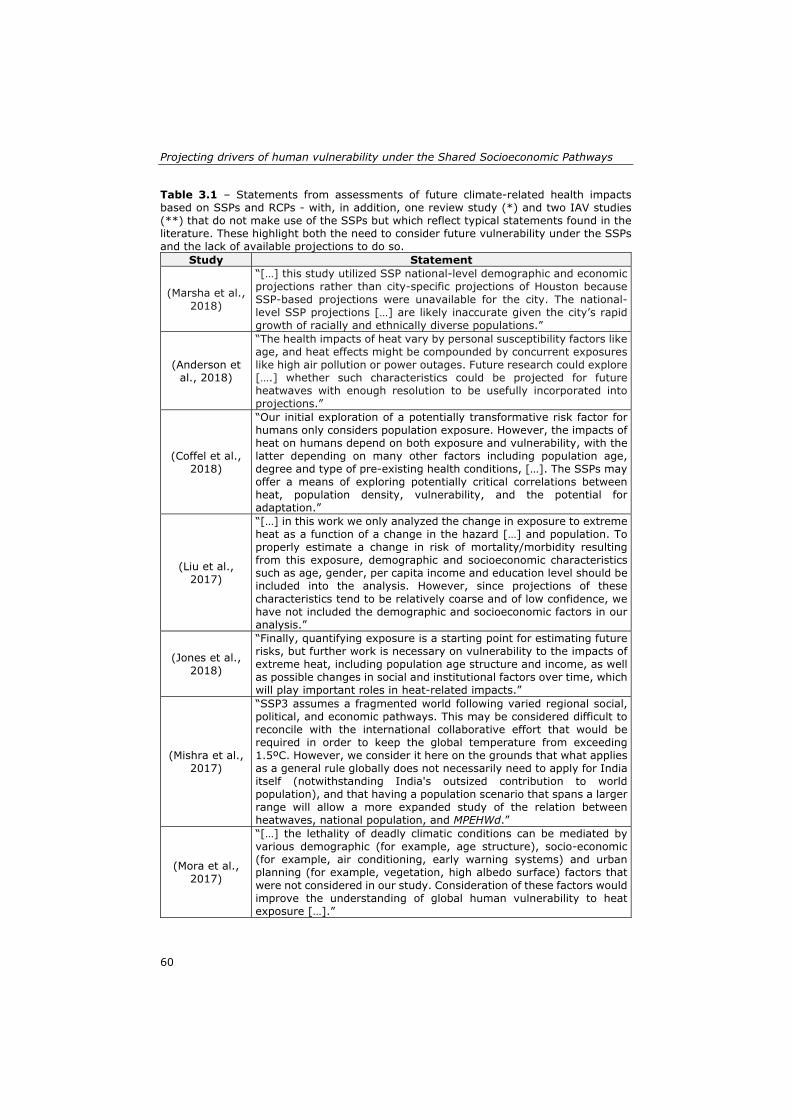
Projecting drivers of human vulnerability under the Shared Socioeconomic Pathways
60
Table 3.1 – Statements from assessments of future climate-related health impacts based on SSPs and RCPs - with, in addition, one review study (*) and two IAV studies (**) that do not make use of the SSPs but which reflect typical statements found in the literature. These highlight both the need to consider future vulnerability under the SSPs and the lack of available projections to do so.
Study Statement
(Marsha et al., 2018)
“[…] this study utilized SSP national-level demographic and economic projections rather than city-specific projections of Houston because SSP-based projections were unavailable for the city. The national-level SSP projections […] are likely inaccurate given the city’s rapid growth of racially and ethnically diverse populations.”
(Anderson et al., 2018)
“The health impacts of heat vary by personal susceptibility factors like age, and heat effects might be compounded by concurrent exposures like high air pollution or power outages. Future research could explore [….] whether such characteristics could be projected for future heatwaves with enough resolution to be usefully incorporated into projections.”
(Coffel et al., 2018)
“Our initial exploration of a potentially transformative risk factor for humans only considers population exposure. However, the impacts of heat on humans depend on both exposure and vulnerability, with the latter depending on many other factors including population age, degree and type of pre-existing health conditions, […]. The SSPs may offer a means of exploring potentially critical correlations between heat, population density, vulnerability, and the potential for adaptation.”
(Liu et al., 2017)
“[…] in this work we only analyzed the change in exposure to extreme heat as a function of a change in the hazard […] and population. To properly estimate a change in risk of mortality/morbidity resulting from this exposure, demographic and socioeconomic characteristics such as age, gender, per capita income and education level should be included into the analysis. However, since projections of these characteristics tend to be relatively coarse and of low confidence, we have not included the demographic and socioeconomic factors in our analysis.”
(Jones et al., 2018)
“Finally, quantifying exposure is a starting point for estimating future risks, but further work is necessary on vulnerability to the impacts of extreme heat, including population age structure and income, as well as possible changes in social and institutional factors over time, which will play important roles in heat-related impacts.”
(Mishra et al., 2017)
“SSP3 assumes a fragmented world following varied regional social, political, and economic pathways. This may be considered difficult to reconcile with the international collaborative effort that would be required in order to keep the global temperature from exceeding 1.5ºC. However, we consider it here on the grounds that what applies as a general rule globally does not necessarily need to apply for India itself (notwithstanding India's outsized contribution to world population), and that having a population scenario that spans a larger range will allow a more expanded study of the relation between heatwaves, national population, and MPEHWd.”
(Mora et al., 2017)
“[…] the lethality of deadly climatic conditions can be mediated by various demographic (for example, age structure), socio-economic (for example, air conditioning, early warning systems) and urban planning (for example, vegetation, high albedo surface) factors that were not considered in our study. Consideration of these factors would improve the understanding of global human vulnerability to heat exposure […].”
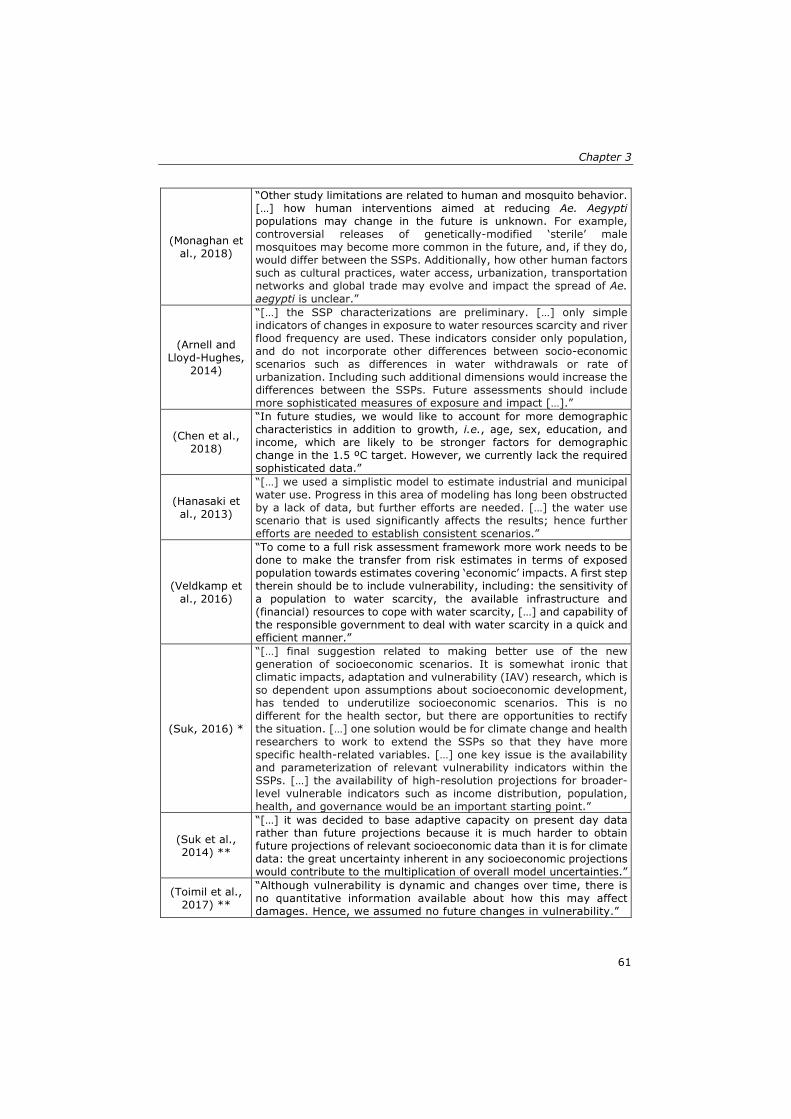
Chapter 3
61
(Monaghan et al., 2018)
“Other study limitations are related to human and mosquito behavior. […] how human interventions aimed at reducing Ae. Aegypti populations may change in the future is unknown. For example, controversial releases of genetically-modified ‘sterile’ male mosquitoes may become more common in the future, and, if they do, would differ between the SSPs. Additionally, how other human factors such as cultural practices, water access, urbanization, transportation networks and global trade may evolve and impact the spread of Ae. aegypti is unclear.”
(Arnell and Lloyd-Hughes,
2014)
“[…] the SSP characterizations are preliminary. […] only simple indicators of changes in exposure to water resources scarcity and river flood frequency are used. These indicators consider only population, and do not incorporate other differences between socio-economic scenarios such as differences in water withdrawals or rate of urbanization. Including such additional dimensions would increase the differences between the SSPs. Future assessments should include more sophisticated measures of exposure and impact […].”
(Chen et al., 2018)
“In future studies, we would like to account for more demographic characteristics in addition to growth, i.e., age, sex, education, and income, which are likely to be stronger factors for demographic change in the 1.5 ºC target. However, we currently lack the required sophisticated data.”
(Hanasaki et al., 2013)
“[…] we used a simplistic model to estimate industrial and municipal water use. Progress in this area of modeling has long been obstructed by a lack of data, but further efforts are needed. […] the water use scenario that is used significantly affects the results; hence further efforts are needed to establish consistent scenarios.”
(Veldkamp et al., 2016)
“To come to a full risk assessment framework more work needs to be done to make the transfer from risk estimates in terms of exposed population towards estimates covering ‘economic’ impacts. A first step therein should be to include vulnerability, including: the sensitivity of a population to water scarcity, the available infrastructure and (financial) resources to cope with water scarcity, […] and capability of the responsible government to deal with water scarcity in a quick and efficient manner.”
(Suk, 2016) *
“[…] final suggestion related to making better use of the new generation of socioeconomic scenarios. It is somewhat ironic that climatic impacts, adaptation and vulnerability (IAV) research, which is so dependent upon assumptions about socioeconomic development, has tended to underutilize socioeconomic scenarios. This is no different for the health sector, but there are opportunities to rectify the situation. […] one solution would be for climate change and health researchers to work to extend the SSPs so that they have more specific health-related variables. […] one key issue is the availability and parameterization of relevant vulnerability indicators within the SSPs. […] the availability of high-resolution projections for broader-level vulnerable indicators such as income distribution, population, health, and governance would be an important starting point.”
(Suk et al., 2014) **
“[…] it was decided to base adaptive capacity on present day data rather than future projections because it is much harder to obtain future projections of relevant socioeconomic data than it is for climate data: the great uncertainty inherent in any socioeconomic projections would contribute to the multiplication of overall model uncertainties.”
(Toimil et al., 2017) **
“Although vulnerability is dynamic and changes over time, there is no quantitative information available about how this may affect damages. Hence, we assumed no future changes in vulnerability.”
Projecting drivers of human vulnerability under the Shared Socioeconomic Pathways
62
3.3 Methods to Project Drivers of Human Vulnerability
In light of the aforementioned research gaps and needs, I introduce here several methods that have the potential to address the need for quantitative projections of drivers of human vulnerability (e.g. age structure, income, infrastructure, access to resources, urbanization, education, pre-existing medical conditions), consistent with the SSPs, contextualized, and produced at relevant spatial and temporal scales. I first briefly discuss the two main approaches that have been applied so far, namely the use of sectoral models and the spatial disaggregation of existing projections, and then detail two new and innovative methods that can complement the existing approaches. These are based (i) on the matching of existing scenario sets to generate consistent projections and (ii) on the quantification of experts’ opinions coupled with correlation analyses. These have been recently applied to Europe to explore future social vulnerability (Rohat et al., 2018) and future heat-related health impacts (Rohat et al., 2019b).
3.3.1 Existing Methods
3.3.1.1 Use of Sectoral Models
Until now, one of the most common approaches to quantifying the SSPs has been the use of sectoral models. For instance, the global SSPs have been quantified for key socioeconomic variables at the national level with sectoral models such as urbanization models (Jiang and O’Neill, 2017), demographic models (KC and Lutz, 2014, 2017), and economic models (Dellink et al., 2017; van der Mensbrugghe, 2015). Worldwide, Jones and O’Neill (2016) have employed a gravity model-based approach to produce spatially-explicit projections of population and urbanization patterns. At the regional level, urbanization and demographic sectoral models have been applied, for instance, to produce urbanization and population projections under the SSPs for the 101 largest cities (Hoornweg and Pope, 2016), for the coastal zones (Merkens et al., 2016), for the Mediterranean area (Reimann et al., 2018), for Europe (Terama et al., 2019). A few other sectoral models have also been used to project – under the SSPs –socioeconomic variables related to water demand and food consumption, mainly at the global scale (Mouratiadou et al., 2016; Springmann et al., 2016; Wada et al., 2016). It should be noted here that the use of sectoral models to project drivers of human vulnerability – other than population and urbanization – at the local scale and based on regional/sectoral extensions of the global SSPs has yet to be explored.
Chapter 3
63
3.3.1.2 Spatial Disaggregation
Another fairly common approach to obtaining projections at a relevant spatial scale in IAV studies is the spatial disaggregation of existing projections, which have been produced at the national scale under the global SSPs (IIASA, 2016). To disaggregate these national-level projections, authors traditionally employed current statistics at sub-national level – considered as the benchmark – and applied country- and SSPs-specific growth/decline rates over all the sub-national units of a given country, ensuring that the relationship between the distance from a given sub-national value to the national mean and the distance from the national mean to the minimum and maximum sub-national values remain similar to those in the benchmark. A few examples of studies that have employed this approach to downscale national projections under the SSPs include (i) Xing et al. (2015) who have downscaled projections of population, GDP per capita, and urban population share under SSP2 for 31 provinces in China, (ii) Marsha et al. (2018) who have downscaled national projections of GDP and population in the US for each block group of Houston city, and (iii) Rohat et al. (2018) who have downscaled projections of education under SSP1, SSP3, and SSP4 at the NUTS-2 level for 30 European countries. While such a downscaling approach based on current figures is useful to approximate the national projections at a local scale, it fails to account for context-specific characteristics that influence local socioeconomic development trends. To account for these local trends, the downscaling process of the national projections should be informed by an interpretation of the global SSPs’ assumptions at the local scale or by context-specific downscaling scenarios. In Europe, Hurth et al. (2017) and Lückenkötter et al. (2017) have downscaled national projections of GDP per capita and population density (under the five SSPs) on the basis of the coupling of the latest scenarios of the European Commission Directorate General for Economic and Financial Affairs – namely the trend and convergence scenarios (Batista e Silva et al., 2016) – with current figures of GDP per capita and population density at very high spatial resolution. The resulting contextualized and downscaled projections of GDP per capita and population density are available at a very high spatial resolution (10 × 10 km spatial grid), accounting for the local context – through the regionalization with the European scenarios – and are consistent with the global SSPs’ national projections. Such projections have been used in Rohat et al. (2019b) and are expected to be integrated within a number of forthcoming European IAV studies.
3.3.2 Scenario Matching
The use of scenarios in environmental studies has substantially increased over the past decades (Hunt et al., 2012), leading to the development of a large number of different scenario sets in Europe (Aerts et al., 2013; EEA, 2011;
Projecting drivers of human vulnerability under the Shared Socioeconomic Pathways
64
Rothman, 2008; ESPON., 2010). Although their scientific acceptance and their relevance for climate-related issues may vary (Kok et al., 2015a), these existing scenario sets represent an extremely valuable basis of knowledge regarding the multiple ways the future could unfold and in relation to the impacts of varying levels of socioeconomic development on a range of sectors such as demography, urbanization, housing, economy, health, land use, agriculture, transportation, and so on (EEA, 2016; van Vuuren et al., 2012). Although it has been argued that it would be unwise not to employ such a great source of knowledge (Westhoek et al., 2006), the re-use of existing scenario sets in IAV studies has been limited until now to the use of their storylines to extend the global SSPs’ narratives (Absar and Preston, 2015; Kok and Pedde, 2016; Kok et al., 2019). To my knowledge, the quantitative elements of existing scenario sets (i.e., their quantitative projections) have never been re-used in assessments of future climate-related health impacts. I argue here that the use of existing quantitative projections of previously-developed scenario sets has the potential to address the need for projections of drivers of human vulnerability, provided that they are consistent with the SSPs. The latter consideration is of the utmost importance to ensure the inter-compatibility between SSPs-based IAV studies (van Ruijven et al., 2013). The consistency between existing scenario sets and the global SSPs should be rigorously checked, using systematic methods to match the narrative of a given existing scenario with the storyline of a given SSP (Absar and Preston, 2015; Kemp-Benedict et al., 2014; Nilsson et al., 2017; Palazzo et al., 2017). Building upon a forthcoming paper (Rohat et al., 2018), I present here the results of a scenario matching approach that was applied to match the global SSPs with three European scenario sets, namely ET2050, DEMIFER, and CLIMSAVE. These can be characterized as follows: ET2050 comprises four scenarios of territorial development and cohesion
in Europe (MCRIT, 2014) that have been quantified for variables related to urbanization, accessibility, and transport nodes, at the sub-national level (Ulied et al., 2014). The four scenarios are named Baseline (Base), MEGAS (A), Regions (B), and Cities (C).
DEMIFER is made up of five European demographic scenarios (Rees et al.,
2010) that have been quantified for a number of key demographic and lifestyle variables such as labor force, ageing, employment, life expectancy, and different types of migration, at sub-national level (Rees et al., 2012). The five scenarios are named Status Quo (STQ), Growing Social Europe (GSE), Expanding Market Europe (EME), Limited Social Europe (LSE), and Challenged Market Europe (CME).
Chapter 3
65
CLIMSAVE comprises four cross-sectoral European scenarios (Gramberger et al., 2012; Gramberger et al., 2013; Kok et al., 2013) that have been quantified for variables related to ecosystems services and provisions and environmental conditions, at high spatial resolution (16 × 16 km) (Holman et al., 2013). The four scenarios are named We are the World (WW), Icarus (Ica), Riders on the Storm (RS), and Should I stay or Should I go (SSG).
Employing a systematic scenario matching approach (i.e., a semi-quantitative approach which aims to quantify the similarities between several scenarios originating from different sets of scenarios), authors identified three different groups of scenarios – made of one scenario of each set – each sharing significantly similar storylines (Table 3.2). These groups of scenarios are then viewed as extended versions of the SSPs (hereafter Ext-SSPs), which showcase an increased relevance (i) at the European level and (ii) for sectors related to human vulnerability, compared to the global SSPs’ storylines. Table 3.2 – Groups of scenarios sharing similar storylines, matched with the scenario matching approach (Rohat et al., 2018). Each group constitutes a given extended SSP (Ext-SSP).
Group of Scenarios
Global SSPs
ET2050 Scenarios
DEMIFER Scenarios
CLIMSAVE Scenarios
Ext-SSP1 SSP1 B GSE WW
Ext-SSP3 SSP3 Base CME Ica
Ext-SSP4 SSP4 A EME RS
Being made up of a combination of scenarios – one from of each of the four scenario sets – the newly-created Ext-SSPs can be readily quantified through the co-use of the quantitative outputs of each scenario set. As an example, the quantitative projections made under ET2050-B, DEMIFER-GSE, and CLIMSAVE-WW are viewed as consistent with one another and with SSP1 – because their respective storylines have been matched – and therefore constitute the quantitative part of Ext-SSP1. In this way, authors were able to readily quantify the three Ext-SSPs at the sub-national level, up to 2050, for a wide number of variables related to territorial development and cohesion (from ET2050 scenarios), demography and lifestyle (from DEMIFER scenarios), and environment (from CLIMSAVE scenarios). A large proportion of these variables are considered as important determinants of human vulnerability and could therefore be integrated within assessments of future climate-related health impacts. Figure 3.1 and Table 3.3 present a sample of these readily available and spatially-explicit quantitative projections in Europe under the three Ext-SSPs.
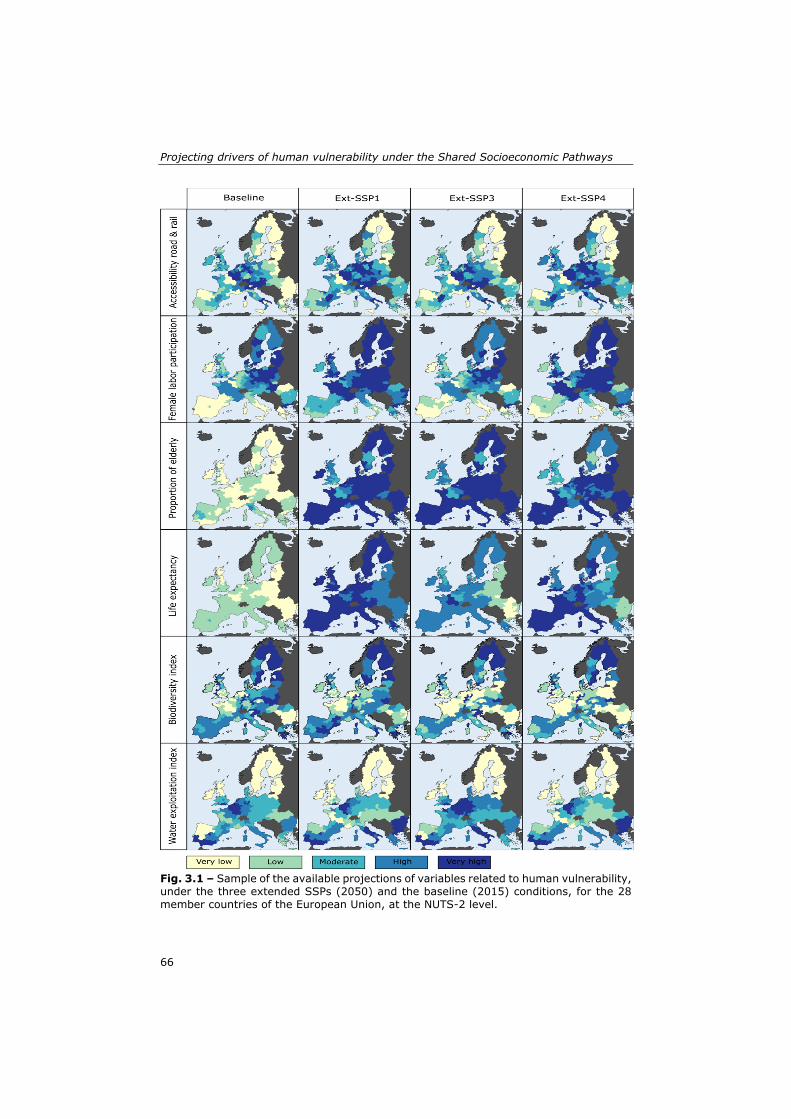
Projecting drivers of human vulnerability under the Shared Socioeconomic Pathways
66
Fig. 3.1 – Sample of the available projections of variables related to human vulnerability, under the three extended SSPs (2050) and the baseline (2015) conditions, for the 28 member countries of the European Union, at the NUTS-2 level.
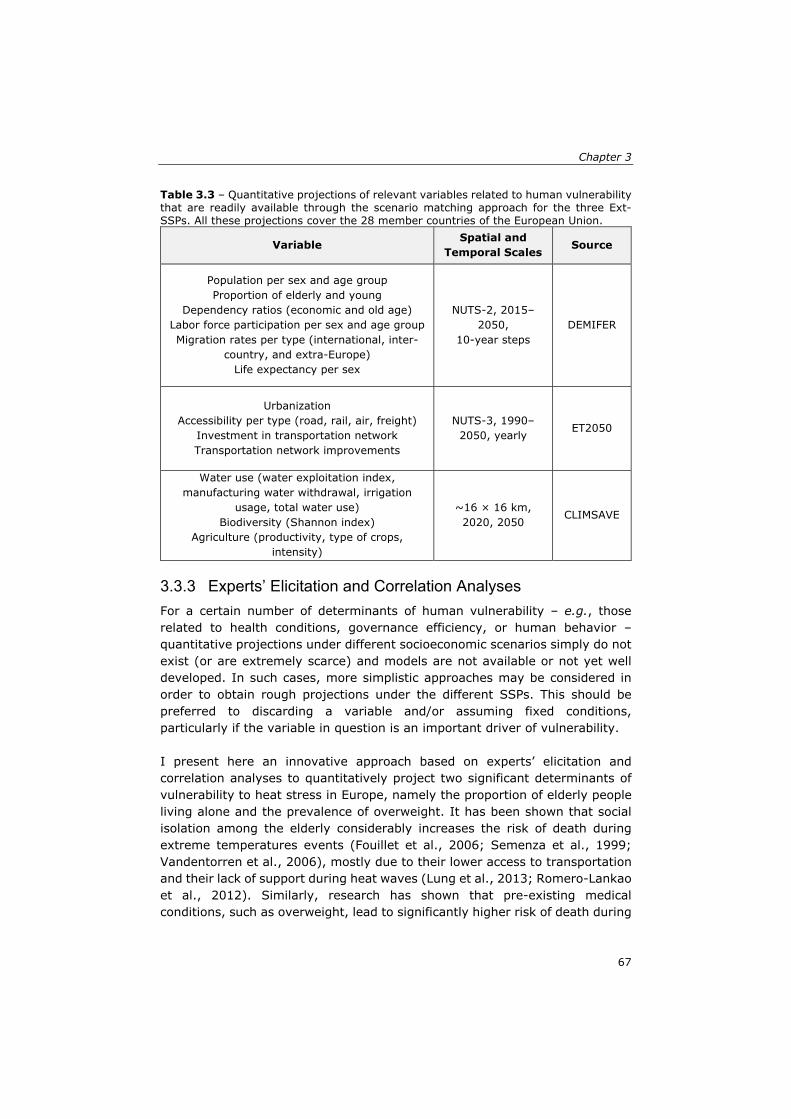
Chapter 3
67
Table 3.3 – Quantitative projections of relevant variables related to human vulnerability that are readily available through the scenario matching approach for the three Ext-SSPs. All these projections cover the 28 member countries of the European Union.
Variable Spatial and
Temporal Scales Source
Population per sex and age group Proportion of elderly and young
Dependency ratios (economic and old age) Labor force participation per sex and age group Migration rates per type (international, inter-
country, and extra-Europe) Life expectancy per sex
NUTS-2, 2015–2050,
10-year steps DEMIFER
Urbanization Accessibility per type (road, rail, air, freight)
Investment in transportation network Transportation network improvements
NUTS-3, 1990–2050, yearly
ET2050
Water use (water exploitation index, manufacturing water withdrawal, irrigation
usage, total water use) Biodiversity (Shannon index)
Agriculture (productivity, type of crops, intensity)
~16 × 16 km, 2020, 2050
CLIMSAVE
3.3.3 Experts’ Elicitation and Correlation Analyses
For a certain number of determinants of human vulnerability – e.g., those related to health conditions, governance efficiency, or human behavior – quantitative projections under different socioeconomic scenarios simply do not exist (or are extremely scarce) and models are not available or not yet well developed. In such cases, more simplistic approaches may be considered in order to obtain rough projections under the different SSPs. This should be preferred to discarding a variable and/or assuming fixed conditions, particularly if the variable in question is an important driver of vulnerability. I present here an innovative approach based on experts’ elicitation and correlation analyses to quantitatively project two significant determinants of vulnerability to heat stress in Europe, namely the proportion of elderly people living alone and the prevalence of overweight. It has been shown that social isolation among the elderly considerably increases the risk of death during extreme temperatures events (Fouillet et al., 2006; Semenza et al., 1999; Vandentorren et al., 2006), mostly due to their lower access to transportation and their lack of support during heat waves (Lung et al., 2013; Romero-Lankao et al., 2012). Similarly, research has shown that pre-existing medical conditions, such as overweight, lead to significantly higher risk of death during
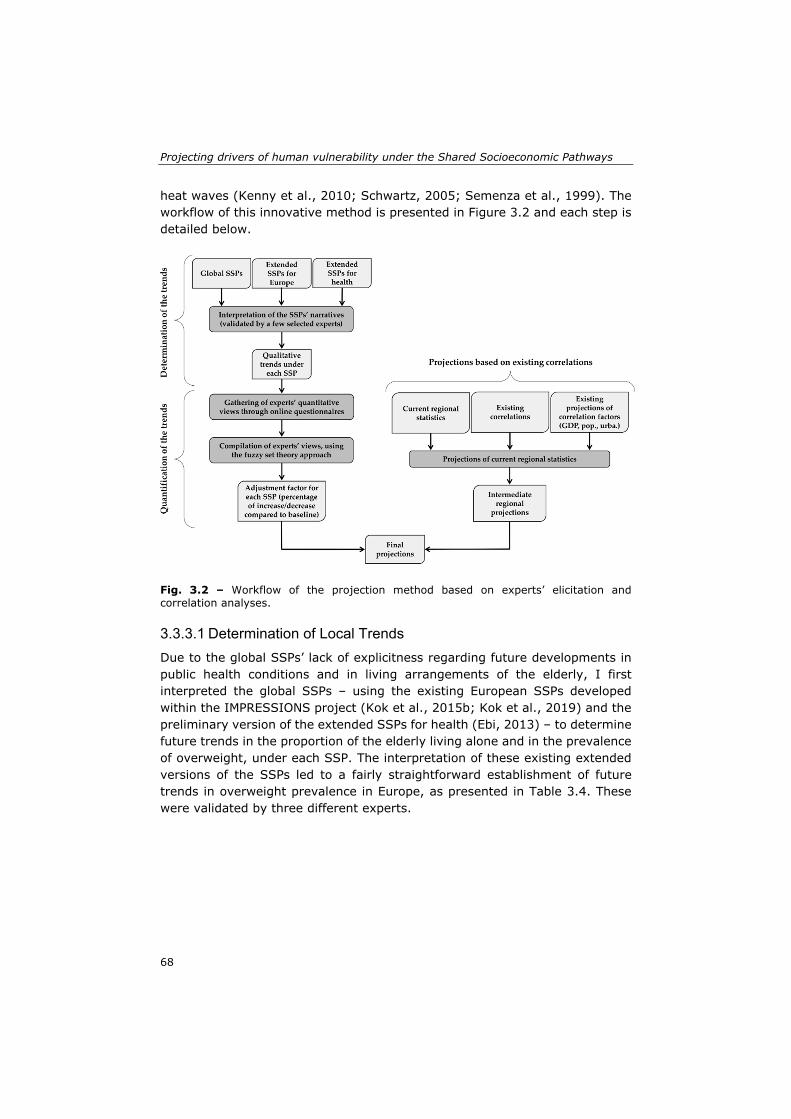
Projecting drivers of human vulnerability under the Shared Socioeconomic Pathways
68
heat waves (Kenny et al., 2010; Schwartz, 2005; Semenza et al., 1999). The workflow of this innovative method is presented in Figure 3.2 and each step is detailed below.
Fig. 3.2 – Workflow of the projection method based on experts’ elicitation and correlation analyses.
3.3.3.1 Determination of Local Trends
Due to the global SSPs’ lack of explicitness regarding future developments in public health conditions and in living arrangements of the elderly, I first interpreted the global SSPs – using the existing European SSPs developed within the IMPRESSIONS project (Kok et al., 2015b; Kok et al., 2019) and the preliminary version of the extended SSPs for health (Ebi, 2013) – to determine future trends in the proportion of the elderly living alone and in the prevalence of overweight, under each SSP. The interpretation of these existing extended versions of the SSPs led to a fairly straightforward establishment of future trends in overweight prevalence in Europe, as presented in Table 3.4. These were validated by three different experts.
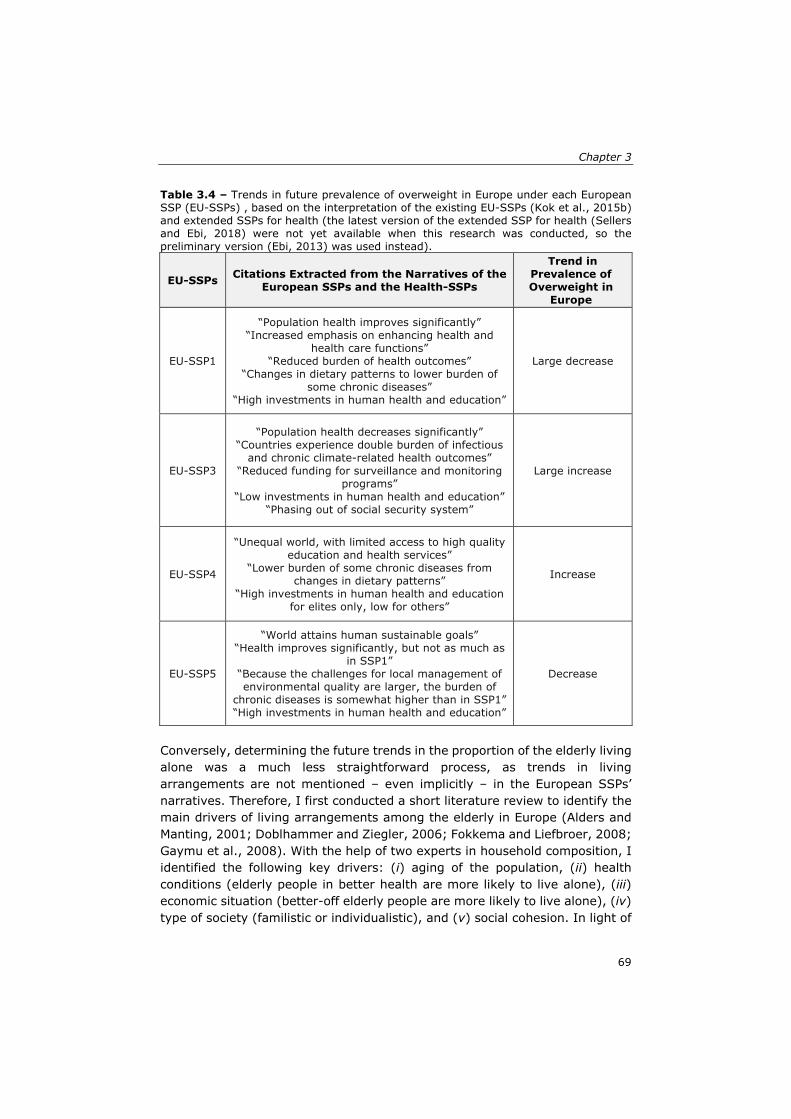
Chapter 3
69
Table 3.4 – Trends in future prevalence of overweight in Europe under each European SSP (EU-SSPs) , based on the interpretation of the existing EU-SSPs (Kok et al., 2015b) and extended SSPs for health (the latest version of the extended SSP for health (Sellers and Ebi, 2018) were not yet available when this research was conducted, so the preliminary version (Ebi, 2013) was used instead).
EU-SSPs Citations Extracted from the Narratives of the European SSPs and the Health-SSPs
Trend in Prevalence of Overweight in
Europe
EU-SSP1
“Population health improves significantly” “Increased emphasis on enhancing health and
health care functions” “Reduced burden of health outcomes”
“Changes in dietary patterns to lower burden of some chronic diseases”
“High investments in human health and education”
Large decrease
EU-SSP3
“Population health decreases significantly” “Countries experience double burden of infectious
and chronic climate-related health outcomes” “Reduced funding for surveillance and monitoring
programs” “Low investments in human health and education”
“Phasing out of social security system”
Large increase
EU-SSP4
“Unequal world, with limited access to high quality education and health services”
“Lower burden of some chronic diseases from changes in dietary patterns”
“High investments in human health and education for elites only, low for others”
Increase
EU-SSP5
“World attains human sustainable goals” “Health improves significantly, but not as much as
in SSP1” “Because the challenges for local management of environmental quality are larger, the burden of
chronic diseases is somewhat higher than in SSP1” “High investments in human health and education”
Decrease
Conversely, determining the future trends in the proportion of the elderly living alone was a much less straightforward process, as trends in living arrangements are not mentioned – even implicitly – in the European SSPs’ narratives. Therefore, I first conducted a short literature review to identify the main drivers of living arrangements among the elderly in Europe (Alders and Manting, 2001; Doblhammer and Ziegler, 2006; Fokkema and Liefbroer, 2008; Gaymu et al., 2008). With the help of two experts in household composition, I identified the following key drivers: (i) aging of the population, (ii) health conditions (elderly people in better health are more likely to live alone), (iii) economic situation (better-off elderly people are more likely to live alone), (iv) type of society (familistic or individualistic), and (v) social cohesion. In light of
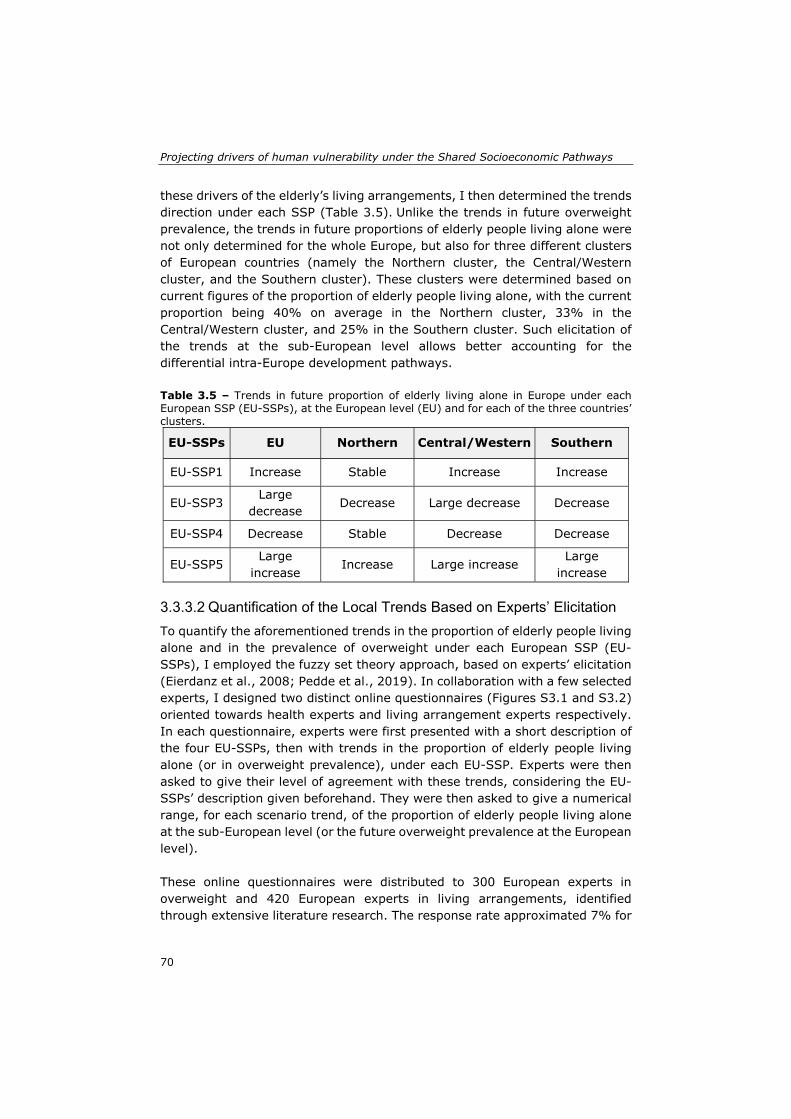
Projecting drivers of human vulnerability under the Shared Socioeconomic Pathways
70
these drivers of the elderly’s living arrangements, I then determined the trends direction under each SSP (Table 3.5). Unlike the trends in future overweight prevalence, the trends in future proportions of elderly people living alone were not only determined for the whole Europe, but also for three different clusters of European countries (namely the Northern cluster, the Central/Western cluster, and the Southern cluster). These clusters were determined based on current figures of the proportion of elderly people living alone, with the current proportion being 40% on average in the Northern cluster, 33% in the Central/Western cluster, and 25% in the Southern cluster. Such elicitation of the trends at the sub-European level allows better accounting for the differential intra-Europe development pathways. Table 3.5 – Trends in future proportion of elderly living alone in Europe under each European SSP (EU-SSPs), at the European level (EU) and for each of the three countries’ clusters.
EU-SSPs EU Northern Central/Western Southern
EU-SSP1 Increase Stable Increase Increase
EU-SSP3 Large
decrease Decrease Large decrease Decrease
EU-SSP4 Decrease Stable Decrease Decrease
EU-SSP5 Large
increase Increase Large increase
Large increase
3.3.3.2 Quantification of the Local Trends Based on Experts’ Elicitation
To quantify the aforementioned trends in the proportion of elderly people living alone and in the prevalence of overweight under each European SSP (EU-SSPs), I employed the fuzzy set theory approach, based on experts’ elicitation (Eierdanz et al., 2008; Pedde et al., 2019). In collaboration with a few selected experts, I designed two distinct online questionnaires (Figures S3.1 and S3.2) oriented towards health experts and living arrangement experts respectively. In each questionnaire, experts were first presented with a short description of the four EU-SSPs, then with trends in the proportion of elderly people living alone (or in overweight prevalence), under each EU-SSP. Experts were then asked to give their level of agreement with these trends, considering the EU-SSPs’ description given beforehand. They were then asked to give a numerical range, for each scenario trend, of the proportion of elderly people living alone at the sub-European level (or the future overweight prevalence at the European level). These online questionnaires were distributed to 300 European experts in overweight and 420 European experts in living arrangements, identified through extensive literature research. The response rate approximated 7% for
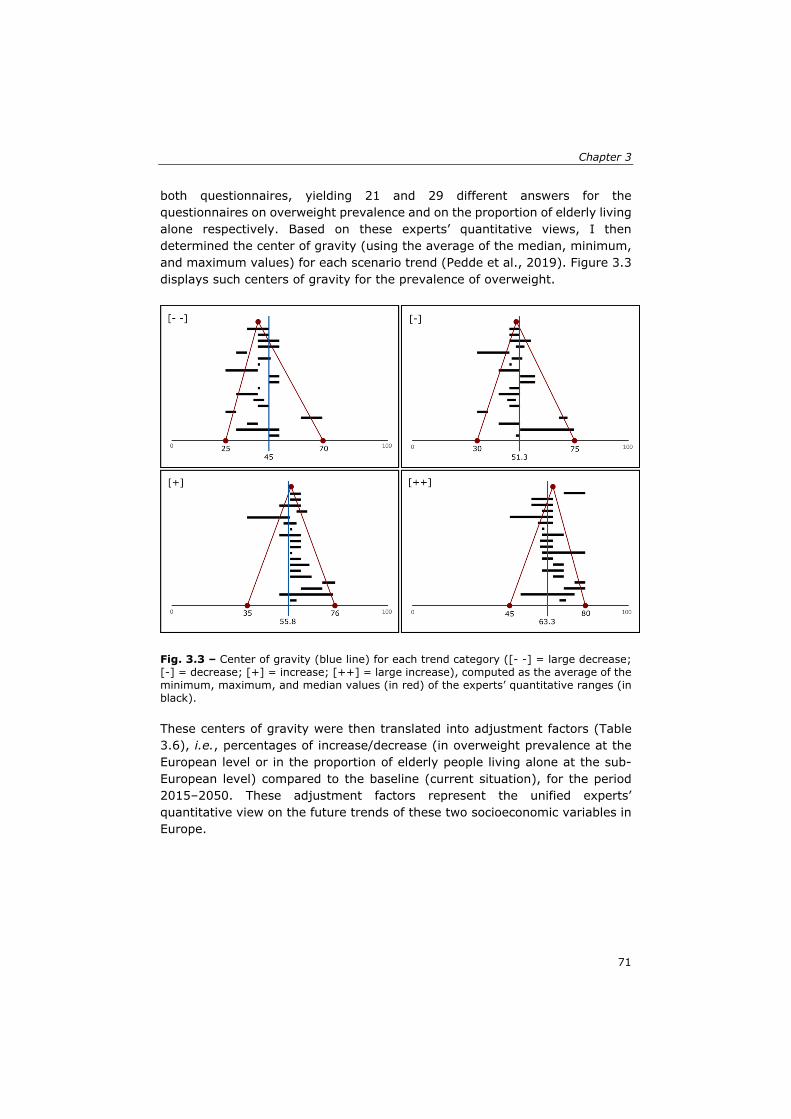
Chapter 3
71
both questionnaires, yielding 21 and 29 different answers for the questionnaires on overweight prevalence and on the proportion of elderly living alone respectively. Based on these experts’ quantitative views, I then determined the center of gravity (using the average of the median, minimum, and maximum values) for each scenario trend (Pedde et al., 2019). Figure 3.3 displays such centers of gravity for the prevalence of overweight.
Fig. 3.3 – Center of gravity (blue line) for each trend category ([- -] = large decrease; [-] = decrease; [+] = increase; [++] = large increase), computed as the average of the minimum, maximum, and median values (in red) of the experts’ quantitative ranges (in black). These centers of gravity were then translated into adjustment factors (Table 3.6), i.e., percentages of increase/decrease (in overweight prevalence at the European level or in the proportion of elderly people living alone at the sub-European level) compared to the baseline (current situation), for the period 2015–2050. These adjustment factors represent the unified experts’ quantitative view on the future trends of these two socioeconomic variables in Europe.
Projecting drivers of human vulnerability under the Shared Socioeconomic Pathways
72
Table 3.6 – Scenario-specific adjustments factors, i.e., percentage of increase or decrease for the period 2015–2050, for overweight prevalence at the European level and for the proportion of elderly living alone at the Sub-European level.
Variable Area Trend Center of Gravity
Adjustment Factor (%)
Overweight prevalence Europe
Large increase 63.3 +19.5
Increase 55.8 +0.1 Decrease 51.3 −14.1
Large decrease 45 −27.6
Proportion of elderly living
alone
Northern Europe Increase 46.6 +16.7 Decrease 33.6 −15.8
Central/Western Europe
Large increase 42.7 +29.3
Increase 39.5 +19.7 Decrease 30.8 −6.5
Large decrease 26.7 −19.2
Southern Europe
Large increase 34.5 +38.0
Increase 29.3 +17.3 Decrease 23.7 −5.3
3.3.3.3 Final Projections
Before producing the final projections of the proportion of elderly people living alone and of the prevalence of overweight, I first computed intermediate regional projections, employing correlation analyses. To do so, I relied on existing correlations between the variable to project and other variables for which projections under the SSPs already exist, e.g., GDP, population, and urbanization. In the case of overweight prevalence, current statistics (Eurostat, 2016b) show that large differences exist across different age groups and urbanization levels. Based on these correlations at the country level and employing existing projections of population (for each age group) and urbanization under the European SSPs – produced at the NUTS-2 level and on a 10 × 10 km spatial grid respectively (Lückenkötter et al., 2017; Terama, 2016) –, I computed intermediate regional projections of overweight prevalence that account for future changes in population structure and urbanization, under each EU-SSPs. Employing the scenario-specific adjustment factors determined by the experts, I then computed the final projections of the overweight prevalence under the four EU-SSPs (Figure 3.4). While these projections are performed at both NUTS-2 level and on a 10 × 10 km spatial grid, the adjustment factors are assumed to be homogeneous over Europe (in the case of the prevalence of
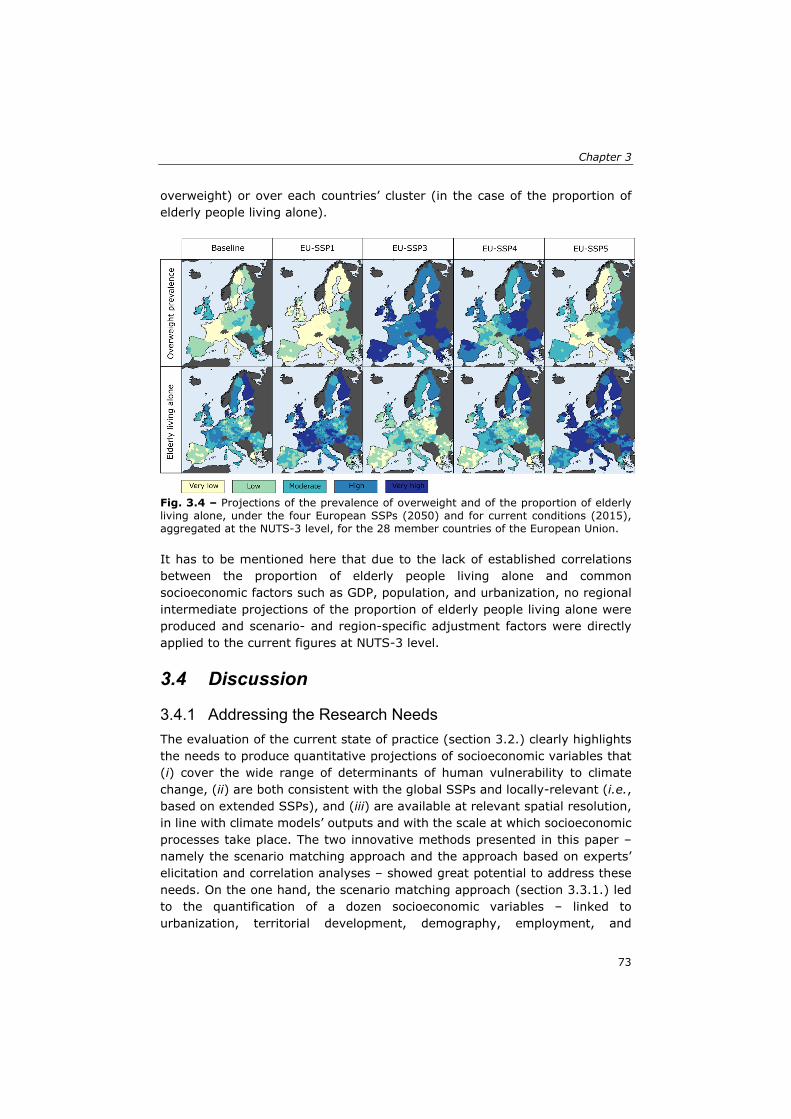
Chapter 3
73
overweight) or over each countries’ cluster (in the case of the proportion of elderly people living alone).
Fig. 3.4 – Projections of the prevalence of overweight and of the proportion of elderly living alone, under the four European SSPs (2050) and for current conditions (2015), aggregated at the NUTS-3 level, for the 28 member countries of the European Union. It has to be mentioned here that due to the lack of established correlations between the proportion of elderly people living alone and common socioeconomic factors such as GDP, population, and urbanization, no regional intermediate projections of the proportion of elderly people living alone were produced and scenario- and region-specific adjustment factors were directly applied to the current figures at NUTS-3 level.
3.4 Discussion
3.4.1 Addressing the Research Needs
The evaluation of the current state of practice (section 3.2.) clearly highlights the needs to produce quantitative projections of socioeconomic variables that (i) cover the wide range of determinants of human vulnerability to climate change, (ii) are both consistent with the global SSPs and locally-relevant (i.e., based on extended SSPs), and (iii) are available at relevant spatial resolution, in line with climate models’ outputs and with the scale at which socioeconomic processes take place. The two innovative methods presented in this paper – namely the scenario matching approach and the approach based on experts’ elicitation and correlation analyses – showed great potential to address these needs. On the one hand, the scenario matching approach (section 3.3.1.) led to the quantification of a dozen socioeconomic variables – linked to urbanization, territorial development, demography, employment, and
Projecting drivers of human vulnerability under the Shared Socioeconomic Pathways
74
biodiversity – at the sub-national scale (mainly NUTS-2 level), up to 2050, under three different European SSPs. The latter are extended versions of the global SSPs that account for the local specificities of the European Union. Such projections of drivers of human vulnerability have the potential to be integrated in assessments of future climate-related health impacts in Europe, which have so far failed to account for the dynamics of vulnerability (Astrom et al., 2017; Forzieri et al., 2016; Paci, 2014). On the other hand, the approach based on experts’ elicitation and correlation analyses (section 3.3.2.) showed that singular– but highly important – determinants of human vulnerability, such as social isolation and pre-existing medical conditions, can also be quantitatively projected under the SSPs at relevant spatial and temporal scales. Here I quantified the future proportion of elderly people living alone and the future prevalence of overweight in Europe, at high-spatial resolution (NUTS-3 and 10 × 10 km spatial grid), under four different European SSPs. As for the projections obtained with the scenario matching approach, these projections can be readily included within assessments of future climate-related health risks in Europe, as highlighted in Rohat et al. (2019b). In addition to these two innovative approaches, which appear to be useful alternatives, existing methods to quantify the SSPs, (e.g. the use of sectoral models and the spatial disaggregation of existing national projections) also show great potential to address the aforementioned research needs. To better address these needs, spatial disaggregation approaches should ideally be informed by local and context-specific downscaling assumptions and/or scenarios. This may enhance the relevance of the outputs for local assessments of climate-related health impacts. Similarly, in order to produce relevant projections for local IAV studies, sectoral models’ inputs should preferably originate from the modelers’ and/or stakeholders’ interpretation of extended versions of the global SSPs rather than from the interpretation of the global SSPs, which largely lack regional and sectoral details (Kok et al., 2015a; Pedde et al., 2019).
3.4.2 Limitations
Although the two innovative approaches presented in this paper have the potential to address the IAV research needs in terms of spatially-explicit, local, and contextualized projections of the wide variety of drivers of human vulnerability – consistent with the SSPs framework –, these are associated with a number of limitations. On the one hand, the scenario matching approach requires the availability of a number of existing scenario sets that showcase specific characteristics, such
Chapter 3
75
as detailed narratives that do not contain any assumptions about climate change – so that they can be matched with different RCPs afterwards – and freely available quantitative projections of the socioeconomic variables of interest, performed at relevant temporal and spatial scales. While appropriate scenario sets were easily found at the European level (Rohat et al., 2018), this may not be the case for scenario-poor regions and for studies aiming at matching the SSPs with more local (e.g. national or sub-national) scenario sets. In addition, the scenario matching approach is unlikely to lead to the local/sectoral extension and quantification of all the five SSPs, but rather of a limited number of them. It is indeed very unlikely that existing scenario sets would be found to comprise an analogous scenario for each of the five SSPs. Nevertheless, bearing in mind that most of the IAV studies do not use the five SSPs but rather focus on the few SSPs that best fit with their research needs (Anderson et al., 2018), such a drawback does not appear to limit the potential applicability of the scenario matching approach in assessments of future climate-related health impacts. On the other hand, the approach based on experts’ elicitation and on correlation analyses makes use of a number of normative judgments and thus provides only rough estimates. For instance, to produce the projections of overweight prevalence with this approach, I assumed that the existing correlations at the national scale – between overweight prevalence and urbanization as well as between overweight prevalence and age groups – were homogeneous within all the sub-national units of a given country and that they will remain the same in the future under all scenarios. Furthermore, I also assumed that the adjustment factors – retrieved from the experts’ quantitative views – were homogeneous over Europe. To account for the potential different regional dynamics across the European countries under each SSP, experts should have been asked to quantify the trends for each of the 28 member countries of the European Union, but this would have inevitably lowered the engagement rate of the experts. In addition to these normative judgments, the projections of overweight prevalence and of the proportion of elderly people living alone could not have been checked for consistency and compared with other projections, as no comparable European scenario exercise was found. Therefore, although they represent the experts’ quantitative views, the accuracy of these projections remains unknown. Finally, although most of the experts showed a high degree of agreement with the trends under each SSPs (Figure S3.3), their quantitative interpretation of these trends differed substantially (as shown in Figure 3.3). Employing a similar approach with different experts is likely to yield different results (i.e., different adjustment factors), hence challenging the replicability of such an approach. Further research is needed to explore the uncertainties associated with the use of
Projecting drivers of human vulnerability under the Shared Socioeconomic Pathways
76
different groups of experts and to assess the fitness of the fuzzy set theory to combine their quantitative interpretations. In the same vein, it is also worth mentioning that the use of different methods will inevitably lead to different projections under the same SSPs, posing underappreciated problems of consistency (Rozell, 2017) and of inter-comparability across different studies. For instance, population projections in Europe under the SSPs can be chosen from (i) Terama et al. (2019), available at the NUTS-2 level, using a regional urbanization growth model and residential preferences under four different European SSPs, (ii) Jones and O’Neill (2016), performed with a gravity-based model and available on a 0.125° grid for the five global SSPs, and (iii) Lückenkötter et al. (2017), realized with the regional downscaling of national projections, available for the five global SSPs and the two downscaling scenarios, on a 0.1° spatial grid. Although such concern of inter-comparability between different sets of projections is limited to a few common variables (primarily population and GDP), it should be scrutinized and accounted for.
3.5 Conclusion Following the development of the new scenario framework for climate change research, a rapidly growing number of assessments of future climate-related health impacts are accounting for future socioeconomic conditions, under varying levels of socioeconomic development (i.e., using different SSPs). Nevertheless, as highlighted in this paper throughout the evaluation of the current state of practice, the vast majority of these assessments have focused only on future exposure (i.e., future population patterns) and have failed to account for future populations’ abilities to prepare for, respond to, and recover from climatic hazards. Scrutinizing the research gaps and needs, this paper underlined the rapidly emerging demand for projections of socioeconomic variables that (i) are both consistent with the global SSPs and linked to the local context, i.e., making use of extended SSPs; (ii) are available at relevant spatial and temporal scales; and (iii) cover the broad range of drivers that influence human vulnerability to climate change. So far, such projections are largely lacking. While the well-structured climate modelling community has been engaged in recent decades in the production of high-level climatic projections, the production of socioeconomic projections to inform IAV studies has been left aside (Lutz and Muttarak, 2017). In this paper, I showed that methods to obtain quantitative projections of socioeconomic variables under the SSPs at relevant spatial/temporal scales exist, and that innovative methods can be developed to complement the existing approaches. I presented two innovative approaches – namely the scenario matching approach and an approach based on experts’ elicitation and
Chapter 3
77
correlation analyses – that both use contextualized (i.e., extended) European SSPs and that enable the quantification of a wide range of determinants of human vulnerability drivers in Europe, at a relevant spatial (sub-national units) and temporal (2050) scale. Although associated with a number of caveats, these approaches – complemented by existing approaches – show great potential for use by the IAV community to enhance the availability of contextualized projections of drivers of human vulnerability under the SSPs and overcome the supposed scarcity of relevant socioeconomic projections. Assessments of future climate-related health impacts should thus rely on these methods to project and account for future populations’ vulnerability. This way, these studies could explore how socioeconomic changes will affect future health risks under different levels of climate change, e.g., 1.5 °C and 2 °C. Further research should be conducted to expand the diversity of approaches to produce socioeconomic projections under the SSPs, and to refine the existing projection methods. In particular, further research is needed to (i) better interpret and translate the narratives of the SSPs (both global and extended versions) into quantitative inputs for sectoral models (Mallampalli et al., 2016; Pedde et al., 2019) –bearing in mind that a given SSP can lead to both negative and positive outcomes on different health issues (Astrom et al., 2017; Sellers and Ebi, 2018), (ii) explore the use of sectoral models developed in other research fields (e.g. housing, energy, and transport planning) – which may provide projections of relevant socioeconomic variables (Rao et al., 2017), (iii) explore the inter-comparability of the different projection methods, and (iv) explore the potential combinations of existing approaches. Such further research would have the objective of advancing our understanding of future vulnerability patterns, so enabling a more accurate assessment of future climate-related health impacts and the design of more appropriate health adaptation strategies.

Projecting drivers of human vulnerability under the Shared Socioeconomic Pathways
78
79
Chapter 4 Influence of changes in socioeconomic and climatic conditions on future heat-related health challenges in Europe4
4This chapter is based on the article: Rohat G, Flacke J, Dosio A, Pedde S, Dao H and van Maarseveen M (2019). Influence of changes in socioeconomic and climatic conditions on future heat-related health challenges in Europe. Global and Planetary Change 172: 45-59.
Influence of changes in socioeconomic and climatic conditions
80
Abstract The majority of assessments of future heat-related health risk are based on projections of heat hazards superimposed solely on current socioeconomic conditions, thus neglecting the potential contribution of drivers of heat stress risk other than climate change. Partly to address this drawback, the climate change research community has developed a new scenario framework, made up of distinct sets of climate and socioeconomic scenarios. The few assessments of future heat-related health risk that have employed this new framework have focused on changes in population exposure but have often not accounted for future populations’ vulnerability. In this paper, we combine European Shared Socioeconomic Pathways with Representative Concentration Pathways to provide spatially explicit European projections of heat-related health risk that account for multiple changes in both socioeconomic and climatic conditions. In doing so, we also address the challenge of accounting for projections of determinants of vulnerability under varying levels of socioeconomic development. Results reveal that the proportion of the European population at very high risk of heat stress will show a steady increase – from 0.4% currently to 20.3%, 32.6%, or 48.4% in 2050 depending on the scenario combination – unless substantial political changes occur rapidly and steadily shift the current socioeconomic development pathway towards sustainability. Ambitious mitigation policies associated with rapid technological progress to enhance human capital could also moderate future heat-related health challenges. Such challenges are unevenly spread across Europe, with the Mediterranean region and Scandinavia being respectively the most and the least impacted regions. Future heat-related health challenges are substantially influenced by varying levels of socioeconomic development, primarily through changes in vulnerability – changes in population exposure being only of secondary importance. The former may even have a more significant impact on future heat stress risk than climate change, particularly in the British Isles and in the Iberian Peninsula. Thus, there is an undeniable necessity to consider the future state of vulnerability – and its uncertainties under varying socioeconomic scenarios – when assessing future heat-related health challenges and designing health adaptation strategies.
Chapter 4
81
4.1 Introduction Heat waves are one of the most prominent climatic hazards (IPCC, 2012) as well as one of the most deadly (Hales et al., 2014), particularly in Europe (Forzieri et al., 2017). There is large evidence that climate change will lead to greater heat waves, in terms of frequency, intensity, duration, and spatial extent (Abaurrea et al., 2018; Dosio et al., 2018; Fischer and Schär, 2010), contributing to a substantial increase in heat-related health impacts such as heat exhaustion, heat stroke, and death (Amengual et al., 2014). The heat stress risk – and resulting health impacts – linked to these extreme temperature events rely not only on the heat hazard, but also on the exposure and vulnerability of the populations (Bao et al., 2015; Carter et al., 2016). It is widely acknowledged that a broad range of socioeconomic factors play an important role in the ability of populations to prepare for, respond to, and recover from heat waves – i.e. their vulnerability (Wilhelmi and Hayden, 2010). However, while the influence of varying levels of climate forcing on future heat stress risk has been extensively explored (e.g. Gasparrini et al., 2017), to date there has been very little consideration of the potential role of changes in socioeconomic conditions. Projections of heat stress risk are traditionally based on future climatic conditions superimposed solely on current socioeconomic conditions (Dong et al., 2015). By taking this approach, the literature fails to account for future populations’ vulnerability, which could potentially be very different from the current position and thus may significantly influence future heat-related health challenges (van Ruijven et al., 2014). Since health adaptation decision-making relies heavily on these assessments of heat stress risk, this standard practice is particularly problematic in that it misestimates the influence of climate change and neglects the role of socioeconomic changes, thus introducing a systematic bias into health management decisions (Ebi et al., 2016). For some time it has been argued that projections of future heat-related health challenges must integrate future socioeconomic conditions and their associated uncertainties (Ebi, 2013; Ebi et al., 2016), through the use of scenarios (Preston et al., 2011). Such an approach is facilitated by the new scenario framework for climate change research (Moss et al., 2010), made up of a set of four greenhouse gases emissions trajectories (Representative Concentrations Pathways – RCPs; van Vuuren et al., 2011) and a set of five global socioeconomic development trends (Shared Socioeconomic Pathways – SSPs; O’Neill et al., 2014).This new framework has the potential to foster the use of socioeconomic scenarios within assessments of future climate risks (Rothman et al., 2014; van Ruijven et al., 2014). Developed in parallel, the RCPs and SSPs have been purposely designed to be combined in a scenario matrix architecture (van Vuuren et al., 2014) to explore future climate risks
Influence of changes in socioeconomic and climatic conditions
82
under multiple combinations of RCPs and SSPs (i.e. spanning a wide range of futures), assuming that a given RCP can be achieved by different SSPs. The latter have been quantified at the national level up to 2100 for key socioeconomic variables such as population and economic growth, urbanization, and education (Crespo Cuaresma, 2017; Jiang and O’Neill, 2017; KC and Lutz, 2014, 2017). In the past few years, combinations of RCPs and SSPs have been applied in a number of studies to assess future climate-related health impacts in the fields of agriculture and food security (e.g. Davenport et al., 2017; Hasegawa et al., 2014), water scarcity and flood risk (e.g. Veldkamp et al., 2016), exposure to vector-borne diseases (Monaghan et al., 2018), fire risk (Knorr et al., 2016), air pollution risk (Xu et al., 2018), and heat stress risk (e.g. Dong et al., 2015; Marsha et al., 2018). Despite this growing body of literature in the latter field, a number of research gaps and methodological issues still need to be explored. First, the wide array of uncertainties in future heat-related health risk due to (i) the full range of plausible socioeconomic scenarios and (ii) their multiple possible combinations with the different RCPs is yet to be scrutinized. Indeed, existing studies have mostly focused until now on a sample of SSPs (e.g. two or three instead of the five contrasting socioeconomic development trends) and on a few selected combinations with RCPs that best suit their research needs. For instance, Anderson et al. (2018) and Marsha et al. (2018) explored future heat-related mortality under two contrasting SSPs (SSP3 and SSP5) that are of high interest to their regional focus (US cities), whereas Dholakia et al. 2015) and Kjellstrom et al. (2018) concentrated on the influence of different RCPs on future heat stress risk and therefore accounted only for a single SSP. Similarly, in their efforts to estimate future exposure and risk of deadly heat under three different levels of climate forcing, Dong et al. (2015), Liu et al. (2017), and Mora et al. (2017) used three integrated scenarios in which each RCP was paired with a different SSP, e.g. SSP1-RCP2.6, SSP3-RCP4.5, and SSP5-RCP8.5. Second, future heat stress risk under multiple combinations of SSPs and RCPs has yet to be explored at high spatial resolution in Europe. So far, past studies applying the new scenario framework and covering Europe have been conducted with a coarse spatial resolution, often at a 0.5° spatial grid (Dong et al., 2015; Kjellstrom et al., 2018; Liu et al., 2017). Such lack of spatial detail may neglect significant local dynamics and may hinder their use by policy-makers to define suitable interventions on a regional scale. Third, projections under the SSPs of the multiple determinants of vulnerability have yet to be integrated within assessments of future heat stress risk. Up to now, existing studies have mainly focused on hazard (heat) and population
Chapter 4
83
exposure, but have neglected the vulnerability of local populations (e.g. Chen et al., 2017; Matthews et al., 2017; Mishra et al., 2017). Most of the authors have acknowledged that future research should attempt to include additional variables that characterize future populations’ vulnerability to heat (e.g. Anderson et al., 2018; Liu et al., 2017), but actual inclusion of such variables remains very rare. The integration of projections of vulnerability drivers into assessments of future heat stress risk has to date been limited to education, income level, age (Dong et al., 2015), urbanization (Rohat et al., 2017), and living arrangements of the elderly (Marsha et al., 2018), at a very coarse spatial resolution (county or national scale projections only). Finally, and linked to the previous point, the influence of varying levels of socioeconomic development on future heat-related health challenges has yet to be explored in light of changes in future populations’ vulnerability. So far, such influence has been quantified only with regard to changes in future populations’ size (e.g. Coffel et al., 2018; Jones et al., 2018; Liu et al., 2017). In view of these research gaps and of the need to provide policy-relevant information about future heat-related health challenges in Europe (Forzieri et al., 2017), the aims of this paper are multiple. First, it aims to provide spatially explicit European projections of heat-related health risk that account for multiple changes in both socioeconomic and climatic conditions. Second, by doing so, this paper also aims to (i) address the challenge of accounting for projections of the wide array of vulnerability determinants, (ii) explore the full range of uncertainties through the use of multiple combinations of SSPs and RCPs, and (iii) investigate the influence of varying levels of socioeconomic development on future heat-related health challenges, mainly through changes in vulnerability.
4.2 Methods and Data
4.2.1 Climate and socioeconomic scenarios
In this paper, we accounted for uncertainty in future climatic conditions through the use of three different emissions pathways, namely RCP2.6, RCP4.5, and RCP8.5 (van Vuuren et al., 2011). RCP2.6 leads to a very low concentration of greenhouse gases, assuming a substantial reduction of emissions and ambitious mitigation policies, in which the mean global temperature shows an increase of 0.4-1.6°C by mid-century (relative to 1986-2005). RCP4.5 is a stabilization scenario leading to a global temperature increase of 0.8-1.8°C by the 2050s. RCP8.5 is a high-emission scenario, under which the mean global temperature shows an increase of 1.4-2.6°C by the 2050s (IPCC, 2014).
Influence of changes in socioeconomic and climatic conditions
84
To account for uncertainty in future socioeconomic conditions, we used four different socioeconomic scenarios. The global SSPs are seen as an up-to-date set of global socioeconomic development trends that provide a global context for climate change research at global and regional levels (O’Neill et al., 2017), but they need to be extended – i.e. contextualized and quantified for specific regions and/or sectors – to increase their suitability for regional and sectoral studies as well as their relevance for policy-making and intake by local stakeholders (Absar and Preston, 2015). In this study, we make use of the extended SSPs for Europe (hereafter SSPEU), which have been developed in the IMPRESSIONS project (Kok and Pedde, 2016; Kok et al., 2019) and have been further extended for sectors relevant to social vulnerability based on a scenario matching approach with multiple existing sets of European scenarios (Rohat et al., 2018). The SSPsEU are consistent with the global SSPs’ narratives but contain far more regional detail about future European socioeconomic development trends. It should be noted that SSP2 – which represents a “middle-of-the-road” type of socioeconomic development – was not extended for Europe, mainly due to its lack of relevance for this region and to the absence of comparable existing scenarios (Kok et al., 2015a). In a nutshell, SSP1EU depicts a strong and sustainable Europe where the emphasis is on human well-being rather than on economic growth, with strong commitments to achieving the Sustainable Development Goals through environmental awareness, reduced inequalities, and less resources-intensive lifestyles. In contrast, SSP3EU depicts a broken Europe with resurgent nationalism and competition, gloomy economic conditions and materialistic lifestyles, associated with a disintegration of the social fabric. SSP4EU describes a highly unequal Europe, where power and the benefits of economic growth are reserved for a small political and business elite, while a large part of the population is left behind with a low level of development and does not benefit from investments in health, education, and environmental protection. Finally, SSP5EU depicts a strong Europe with steady economic growth, competitive markets, and rapid technological progress to enhance human capital, relying on an intensive exploitation of fossil fuel resources and associated with low concerns for global environmental issues as well as consumption-intensive lifestyles (see Table S4.1 for further details on the SSPsEU).
4.2.2 Heat stress risk framework
This paper adopts the latest conceptualization of risk described in the 5th Assessment Report of the Intergovernmental Panel on Climate Change – IPCC AR5 (IPCC, 2014), which characterizes heat stress risk as being the combination of heat hazard, vulnerability (population’s abilities to prepare for, respond to, and recover from heat hazard), and exposure (presence of people).
Chapter 4
85
4.2.2.1 Hazard
A large number of heat hazard indices have been developed and applied in heat stress risk assessments over the past decades (Perkins, 2015). In this paper, we used heat waves days (Dong et al., 2015; Fischer and Schär, 2010; Liu et al., 2017) and considered the heat hazard index as being the number of heat wave days (HWDs) during summer months (June, July, and August) over a given time period. We defined HWDs as the total number of days in a season (summer) that exceed a predefined threshold for at least 6 consecutive days (Dong et al., 2015). Considering the diversity of climatic zones in Europe, the use of either a fixed or a relative threshold may be problematic as the former can lead to overestimating heatwave length in warm climates, and the latter to unrealistically “cold” heatwave at higher latitude. In this study we set the threshold at the local 90th percentile of daily maximum temperature – centered on a 15-days window – over the reference period (Fischer and Schär, 2010). However, if the local 90th percentile is < 25°C, then a fixed threshold of 25°C was applied (similarly to Dong et al., 2015; Liu et al., 2017). Humidity was not accounted for because recent findings suggest that its contribution to deadly heat waves in Europe is negligible (Russo et al., 2017). To compute HWDs, we used projections of daily maximum temperature for the summer months retrieved from seven high-resolution (0.11°) regional climate model (RCM) simulations (full list in Table S4.2) from the Coordinated Regional Climate Downscaling Experiment for Europe (EURO-CORDEX; Jacob et al., 2014). EURO-CORDEX runs have been extensively validated (e.g. Kotlarski et al., 2014), their abilities to simulate present-day heat waves have been assessed (Russo et al., 2015; Vautard et al., 2013), and they have been widely used to analyze projections of extreme temperatures (Dosio, 2016; Dosio and Fischer, 2018). Daily projections were retrieved for the summer months of the period 2041-2060 – to represent year 2050 – and historical runs were used for simulating the baseline climate (1986-2005). HWDs was computed for all combinations of RCMs and RCPs (as well as for the baseline period), yielding an ensemble of 28 different model/scenario combinations. These were then spatially interpolated on a 0.1° spatial grid.
4.2.2.2 Vulnerability and exposure
Because one of the aims of this paper is to encourage the consideration of future vulnerability when assessing future climate risks, we accounted for a range of variables that seek to represent comprehensively the different dimensions of heat-related vulnerability (Table 4.1). Despite the growing number of heat-related mortality studies conducted in Europe – e.g. Âström et al. (2017) – there is still a lack of comprehensive and fine-scale epidemiological
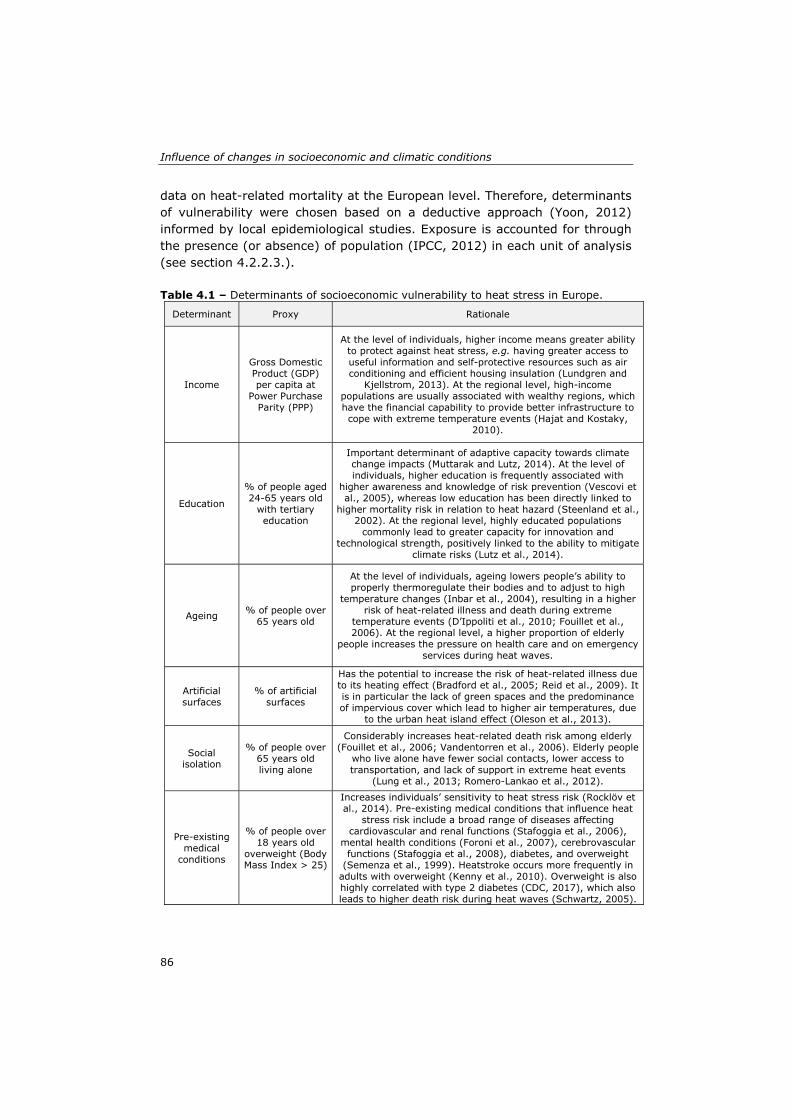
Influence of changes in socioeconomic and climatic conditions
86
data on heat-related mortality at the European level. Therefore, determinants of vulnerability were chosen based on a deductive approach (Yoon, 2012) informed by local epidemiological studies. Exposure is accounted for through the presence (or absence) of population (IPCC, 2012) in each unit of analysis (see section 4.2.2.3.). Table 4.1 – Determinants of socioeconomic vulnerability to heat stress in Europe.
Determinant Proxy Rationale
Income
Gross Domestic Product (GDP) per capita at
Power Purchase Parity (PPP)
At the level of individuals, higher income means greater ability to protect against heat stress, e.g. having greater access to useful information and self-protective resources such as air conditioning and efficient housing insulation (Lundgren and
Kjellstrom, 2013). At the regional level, high-income populations are usually associated with wealthy regions, which have the financial capability to provide better infrastructure to cope with extreme temperature events (Hajat and Kostaky,
2010).
Education
% of people aged 24-65 years old
with tertiary education
Important determinant of adaptive capacity towards climate change impacts (Muttarak and Lutz, 2014). At the level of individuals, higher education is frequently associated with
higher awareness and knowledge of risk prevention (Vescovi et al., 2005), whereas low education has been directly linked to
higher mortality risk in relation to heat hazard (Steenland et al., 2002). At the regional level, highly educated populations
commonly lead to greater capacity for innovation and technological strength, positively linked to the ability to mitigate
climate risks (Lutz et al., 2014).
Ageing % of people over 65 years old
At the level of individuals, ageing lowers people’s ability to properly thermoregulate their bodies and to adjust to high
temperature changes (Inbar et al., 2004), resulting in a higher risk of heat-related illness and death during extreme
temperature events (D’Ippoliti et al., 2010; Fouillet et al., 2006). At the regional level, a higher proportion of elderly
people increases the pressure on health care and on emergency services during heat waves.
Artificial surfaces
% of artificial surfaces
Has the potential to increase the risk of heat-related illness due to its heating effect (Bradford et al., 2005; Reid et al., 2009). It is in particular the lack of green spaces and the predominance of impervious cover which lead to higher air temperatures, due
to the urban heat island effect (Oleson et al., 2013).
Social isolation
% of people over 65 years old living alone
Considerably increases heat-related death risk among elderly (Fouillet et al., 2006; Vandentorren et al., 2006). Elderly people
who live alone have fewer social contacts, lower access to transportation, and lack of support in extreme heat events
(Lung et al., 2013; Romero-Lankao et al., 2012).
Pre-existing medical
conditions
% of people over 18 years old
overweight (Body Mass Index > 25)
Increases individuals’ sensitivity to heat stress risk (Rocklöv et al., 2014). Pre-existing medical conditions that influence heat
stress risk include a broad range of diseases affecting cardiovascular and renal functions (Stafoggia et al., 2006),
mental health conditions (Foroni et al., 2007), cerebrovascular functions (Stafoggia et al., 2008), diabetes, and overweight
(Semenza et al., 1999). Heatstroke occurs more frequently in adults with overweight (Kenny et al., 2010). Overweight is also highly correlated with type 2 diabetes (CDC, 2017), which also leads to higher death risk during heat waves (Schwartz, 2005).
Chapter 4
87
The lack of quantitative and spatially explicit projections of socioeconomic variables under the SSPs is one of the main obstacles to the integration of socioeconomic scenarios within climate risk assessments. In this paper, we relied on innovative projection exercises to obtain spatially explicit projections of the six socioeconomic variables set out in Table 4.1 and of future population (see Text S4.1 for more details on the projection exercises). In summary, population and GDP projections were retrieved from the recent downscaling exercise of the Joint Research Center of the European Commission, which provides projections consistent with the SSPsEU at a 0.1° spatial resolution (Hurth et al., 2017; Lückenkötter et al., 2017). Projections of proportions of artificial surfaces, produced within the IMPRESSIONS project (Berry et al., 2017), were retrieved from Terama et al. (2019). These were made on a 10’ lat/lon spatial grid (~13*13km) using a regional urban growth model parametrized with assumptions of age group-specific residential preferences under the four SSPsEU. Age-specific population projections at sub-national level (NUTS-2 regions) were also retrieved from the IMPRESSIONS project – described in Terama et al. (2019) and available in Terama (2016) – and were further downscaled on a 0.1° spatial grid based on current figures. Projections of education levels were retrieved from the quantification of the global SSPs at national scale (KC and Lutz, 2017), were then further downscaled to the NUTS-2 level based on current figures, and were finally disaggregated to a 0.1° spatial grid assuming a homogeneous proportion of people with higher education within each NUTS-2 region. Consistent projections of overweight prevalence and of the proportion of elderly living alone were nonexistent in Europe – only a few short-term predictions at national and continental levels have been made (Doblhammer and Ziegler, 2006; Gaymu et al., 2008; Webber et al., 2014). To deal with this lack of available data, we carried out an innovative expert-based modeling approach, detailed in Rohat (2018). Briefly, to project the overweight prevalence, we (i) retrieved current figures at national level, (ii) disaggregated them at the NUTS-2 level based on age group-specific statistics of overweight prevalence (iii), further downscaled them on a 0.1° spatial grid based on urbanization-specific overweight figures, (iv) projected these downscaled statistics based on changes in both age group structure and urbanization level under the four SSPsEU, and (v) revised these projections with adjustment factors determined through the quantification of experts’ judgments (retrieved via an online questionnaire) using the fuzzy set theory approach (Eierdanz et al., 2008; Pedde et al., 2019). We applied a similar procedure to project the proportion of elderly people living alone, except that we initially used current figures at the NUTS-3 level and did not apply the age groups- and urbanization-based downscaling.
Influence of changes in socioeconomic and climatic conditions
88
Each variable was then normalized – spatially and temporally – using a linear min-max rescaling and combined into a vulnerability index using an additive approach with equal weights (further discussed in Text S4.2 and in section 4.3.). We computed the vulnerability index under current (2015) socioeconomic conditions (referred to below as the baseline) and under the four SSPsEU for the year 2050.
4.2.2.3 Integrated heat stress risk
We employed the method described in Lung et al. (2013) and computed heat stress risk based on the geometric aggregation of hazard (HWDs) and vulnerability (vulnerability index). Both were normalized in advance – spatially and temporally – using a z-score rescaling with a factor-10 shift, because geometric aggregation requires non-zero positive values (OECD, 2008). Other types of aggregation approach were also used to explore the robustness of the results (see section 4.3.). Using a similar approach as Dong et al. (2015), we validated the integrated heat stress risk framework at the country level with heat wave mortality data from the baseline period (1986-2005) and during the 2003 European heat wave, retrieved from the Emergency Event Database (EM-DAT: http://www.emdat.be) and from Robine et al. (2008). Through linear regression analyses (see Text S4.3), we highlighted the correlation between death counts and estimated heat stress risk, although a comparison at the national level is likely to hide some local level correlations (Lung et al., 2013). We computed heat stress risk at the grid cell level and employed a 0.1° spatial grid (see sections 4.2.2.1. and 4.2.2.2.) – on which all the socioeconomic and climatic data have been interpolated beforehand – covering 8 European regions (sub-domains of the EURO-CORDEX spatial grid) and 25 of the EU-28 member countries (see Text S4.4). The resulting values of heat stress risk were then classified (deciles-based) and population figures were used to determine the number of persons per risk class, with a focus on the number of people at high or very high risk. We excluded from the risk assessment places where exposure was nil (i.e. where no one lives), meaning that we discarded grid cells in which the population density was less than 1 inhab.km-2. We computed future heat stress risk for the year 2050 under all the combinations of SSPs EU and RCPs, exception made of the few inconsistent combinations – SSP1-RCP8.5, SSP3-RCP2.6, and SSP5-RCP2.6 – for which the emissions level of the RCP is very unlikely to be reached by the socioeconomic development depicted in the SSP. In addition, we computed current heat stress risk, represented by baseline socioeconomic and climatic conditions, as well as heat stress risk for the year 2050 assuming either (i) fixed socioeconomic conditions (i.e. combinations of RCPs with baseline socioeconomic conditions), or (ii) fixed climatic conditions (i.e. combinations of SSPsEU with baseline climate). These combinations allow a better exploration of the individual effect
Chapter 4
89
of changes in socioeconomic and climatic conditions on future heat stress risk. We performed the risk assessment for each of the 7 RCM simulations independently and used the multi-model-median values (Petkova et al., 2017) to explore heat stress risk across the 17 aforementioned scenario combinations.
4.3 Results
4.3.1 Heat hazard
The spatially averaged number of heat wave days (HWDs) in Europe for a given time period varies greatly from one RCP to another and from one RCM simulation to another. To emphasize the impact of the three RCPs on future heat hazard, we used the multi-model-median values of HWDs (averaged over the 20-year summer periods). Variability across the 7 different RCMs simulations is displayed through the interquartile range (bracketed). Results show that the heat wave area over Europe – computed as the percentage of grid cells with at least one heat wave per time period – increases from 77.6% (13.5) in the baseline period to 82.7% (7.4) and 84% (9.8) in the 2050s under RCP4.5 and RCP8.5 respectively, but stabilizes under RCP2.6. Spatial patterns of HWDs (Figure 4.1) depict a clear North-to-South latitudinal gradient. Northern Scandinavia has a multi-model-median spatial mean HWDs per summer of less than 1 (0.4) under all RCPs, while in the Mediterranean region the multi-model-median spatial mean HWDs per summer under RCP4.5 and RCP8.5 are respectively 10.2 (4.3) and 12.3 (5.0). The heat wave area in Southern Europe (Mediterranean region and the Iberian Peninsula) is significantly higher than in Northern Europe (Scandinavia and the British Isles) under all RCPs, rising up to 99.4% (1.9) under RCP8.5 (compared to 65.9% (21.2) in Northern Europe under the same RCP). Finally, certain parts of Scandinavia, of the British Isles, and of the Alps show no HWDs under all models and scenarios – due to the minimum fixed threshold of 25°C –, whereas most of the grid cells of the Iberian Peninsula and of the Mediterranean region show more than 10 HWDs per summer under all models and RCPs.
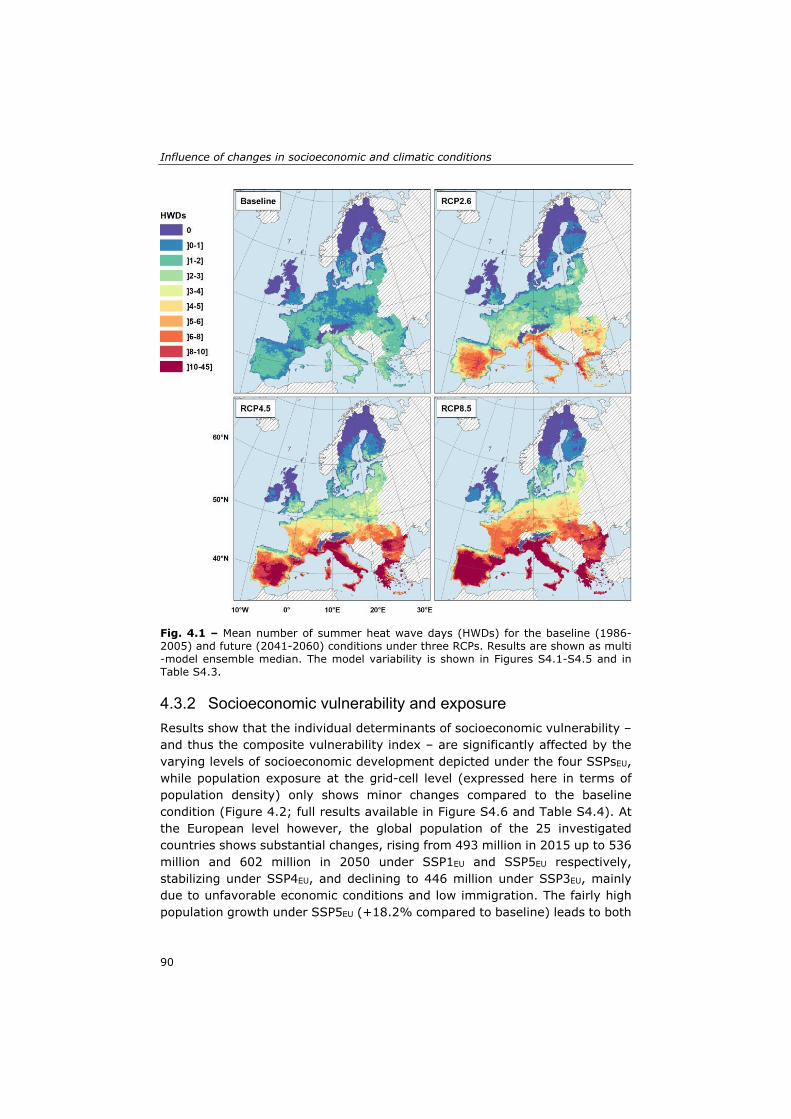
Influence of changes in socioeconomic and climatic conditions
90
Fig. 4.1 – Mean number of summer heat wave days (HWDs) for the baseline (1986-2005) and future (2041-2060) conditions under three RCPs. Results are shown as multi -model ensemble median. The model variability is shown in Figures S4.1-S4.5 and in Table S4.3.
4.3.2 Socioeconomic vulnerability and exposure
Results show that the individual determinants of socioeconomic vulnerability – and thus the composite vulnerability index – are significantly affected by the varying levels of socioeconomic development depicted under the four SSPsEU, while population exposure at the grid-cell level (expressed here in terms of population density) only shows minor changes compared to the baseline condition (Figure 4.2; full results available in Figure S4.6 and Table S4.4). At the European level however, the global population of the 25 investigated countries shows substantial changes, rising from 493 million in 2015 up to 536 million and 602 million in 2050 under SSP1EU and SSP5EU respectively, stabilizing under SSP4EU, and declining to 446 million under SSP3EU, mainly due to unfavorable economic conditions and low immigration. The fairly high population growth under SSP5EU (+18.2% compared to baseline) leads to both
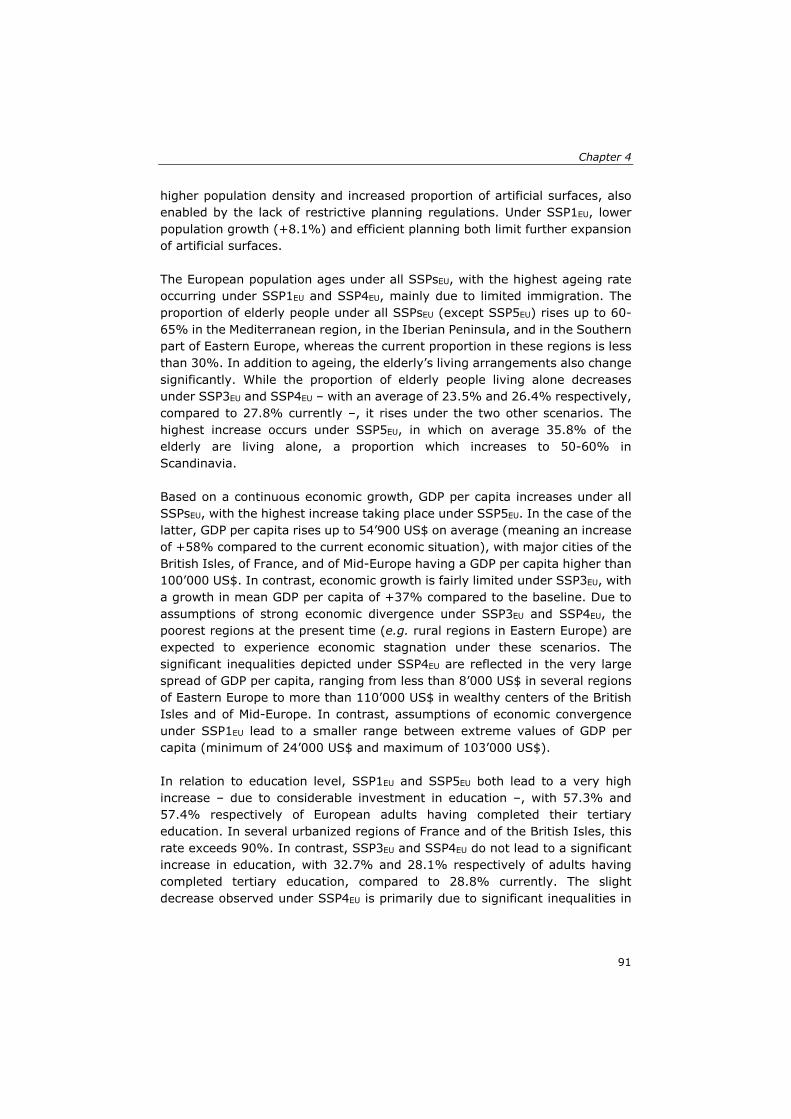
Chapter 4
91
higher population density and increased proportion of artificial surfaces, also enabled by the lack of restrictive planning regulations. Under SSP1EU, lower population growth (+8.1%) and efficient planning both limit further expansion of artificial surfaces. The European population ages under all SSPsEU, with the highest ageing rate occurring under SSP1EU and SSP4EU, mainly due to limited immigration. The proportion of elderly people under all SSPsEU (except SSP5EU) rises up to 60-65% in the Mediterranean region, in the Iberian Peninsula, and in the Southern part of Eastern Europe, whereas the current proportion in these regions is less than 30%. In addition to ageing, the elderly’s living arrangements also change significantly. While the proportion of elderly people living alone decreases under SSP3EU and SSP4EU – with an average of 23.5% and 26.4% respectively, compared to 27.8% currently –, it rises under the two other scenarios. The highest increase occurs under SSP5EU, in which on average 35.8% of the elderly are living alone, a proportion which increases to 50-60% in Scandinavia. Based on a continuous economic growth, GDP per capita increases under all SSPsEU, with the highest increase taking place under SSP5EU. In the case of the latter, GDP per capita rises up to 54’900 US$ on average (meaning an increase of +58% compared to the current economic situation), with major cities of the British Isles, of France, and of Mid-Europe having a GDP per capita higher than 100’000 US$. In contrast, economic growth is fairly limited under SSP3EU, with a growth in mean GDP per capita of +37% compared to the baseline. Due to assumptions of strong economic divergence under SSP3EU and SSP4EU, the poorest regions at the present time (e.g. rural regions in Eastern Europe) are expected to experience economic stagnation under these scenarios. The significant inequalities depicted under SSP4EU are reflected in the very large spread of GDP per capita, ranging from less than 8’000 US$ in several regions of Eastern Europe to more than 110’000 US$ in wealthy centers of the British Isles and of Mid-Europe. In contrast, assumptions of economic convergence under SSP1EU lead to a smaller range between extreme values of GDP per capita (minimum of 24’000 US$ and maximum of 103’000 US$). In relation to education level, SSP1EU and SSP5EU both lead to a very high increase – due to considerable investment in education –, with 57.3% and 57.4% respectively of European adults having completed their tertiary education. In several urbanized regions of France and of the British Isles, this rate exceeds 90%. In contrast, SSP3EU and SSP4EU do not lead to a significant increase in education, with 32.7% and 28.1% respectively of adults having completed tertiary education, compared to 28.8% currently. The slight decrease observed under SSP4EU is primarily due to significant inequalities in
Influence of changes in socioeconomic and climatic conditions
92
terms of investments and access to education, with only small political and business elites benefitting. In contrast to education, the prevalence of overweight increases considerably under SSP3EU and SSP4EU, with 68.5% and 60.8% respectively of the European adult population being overweight in 2050, compared to 51.9% currently. A slightly lower increase is expected under SSP5EU (54.7% on average), while overweight prevalence decreases under SSP1EU (48.9% on average) and reaches less than 35% in certain parts of Scandinavia.
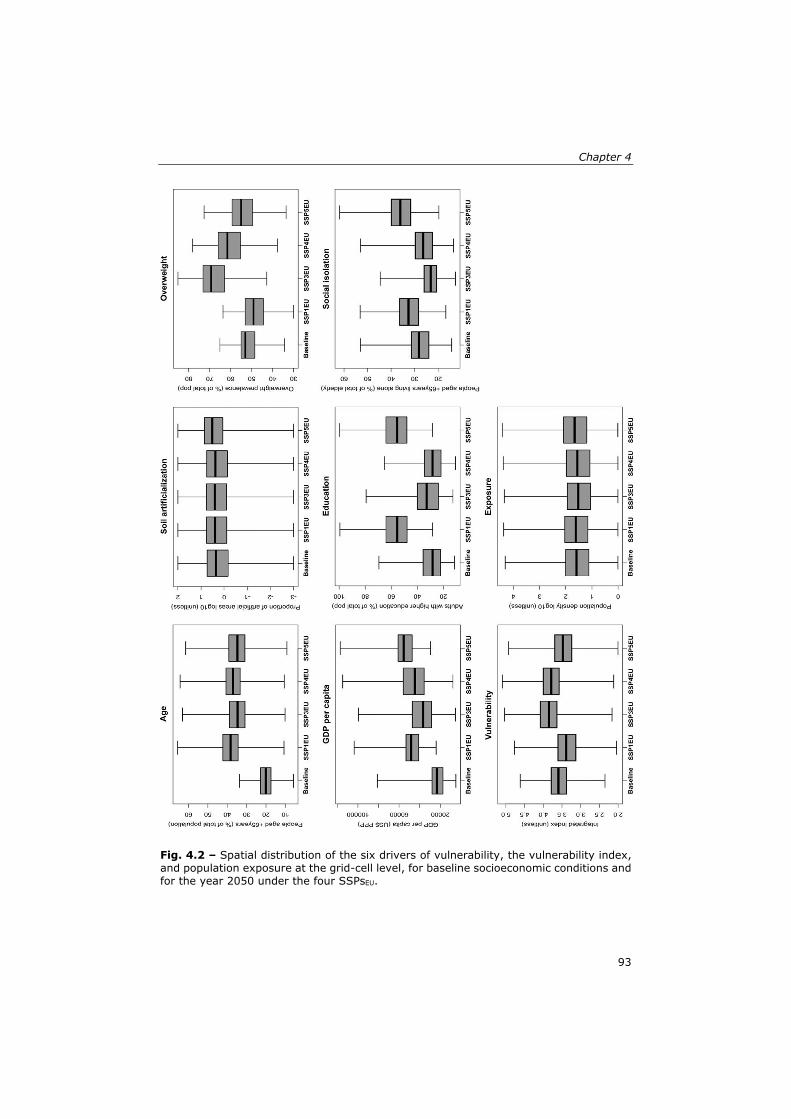
Chapter 4
93
Fig. 4.2 – Spatial distribution of the six drivers of vulnerability, the vulnerability index, and population exposure at the grid-cell level, for baseline socioeconomic conditions and for the year 2050 under the four SSPsEU.
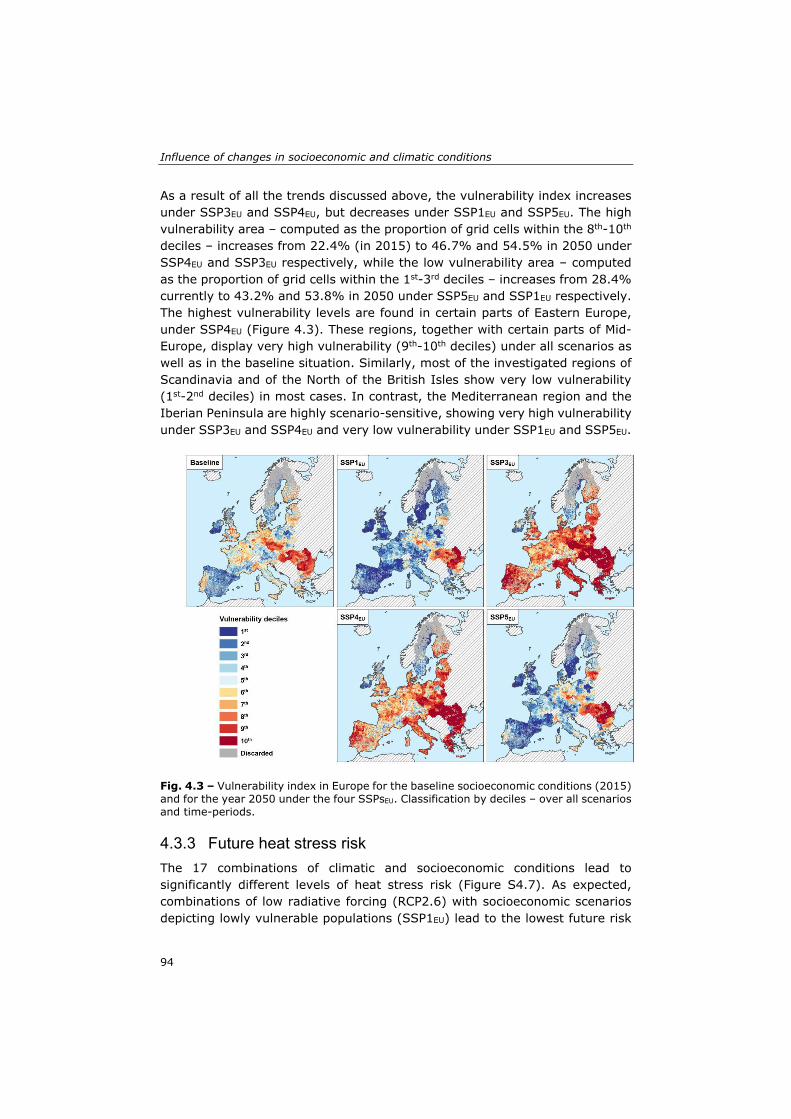
Influence of changes in socioeconomic and climatic conditions
94
As a result of all the trends discussed above, the vulnerability index increases under SSP3EU and SSP4EU, but decreases under SSP1EU and SSP5EU. The high vulnerability area – computed as the proportion of grid cells within the 8th-10th deciles – increases from 22.4% (in 2015) to 46.7% and 54.5% in 2050 under SSP4EU and SSP3EU respectively, while the low vulnerability area – computed as the proportion of grid cells within the 1st-3rd deciles – increases from 28.4% currently to 43.2% and 53.8% in 2050 under SSP5EU and SSP1EU respectively. The highest vulnerability levels are found in certain parts of Eastern Europe, under SSP4EU (Figure 4.3). These regions, together with certain parts of Mid-Europe, display very high vulnerability (9th-10th deciles) under all scenarios as well as in the baseline situation. Similarly, most of the investigated regions of Scandinavia and of the North of the British Isles show very low vulnerability (1st-2nd deciles) in most cases. In contrast, the Mediterranean region and the Iberian Peninsula are highly scenario-sensitive, showing very high vulnerability under SSP3EU and SSP4EU and very low vulnerability under SSP1EU and SSP5EU.
Fig. 4.3 – Vulnerability index in Europe for the baseline socioeconomic conditions (2015) and for the year 2050 under the four SSPsEU. Classification by deciles – over all scenarios and time-periods.
4.3.3 Future heat stress risk
The 17 combinations of climatic and socioeconomic conditions lead to significantly different levels of heat stress risk (Figure S4.7). As expected, combinations of low radiative forcing (RCP2.6) with socioeconomic scenarios depicting lowly vulnerable populations (SSP1EU) lead to the lowest future risk
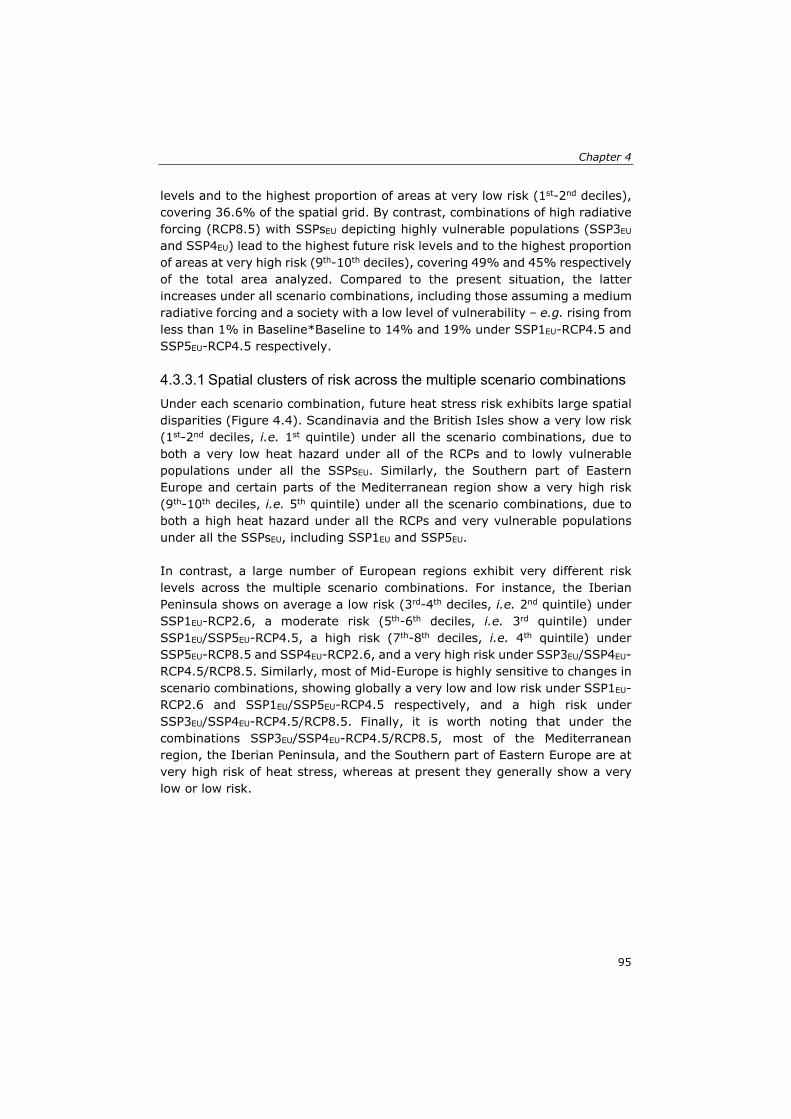
Chapter 4
95
levels and to the highest proportion of areas at very low risk (1st-2nd deciles), covering 36.6% of the spatial grid. By contrast, combinations of high radiative forcing (RCP8.5) with SSPsEU depicting highly vulnerable populations (SSP3EU and SSP4EU) lead to the highest future risk levels and to the highest proportion of areas at very high risk (9th-10th deciles), covering 49% and 45% respectively of the total area analyzed. Compared to the present situation, the latter increases under all scenario combinations, including those assuming a medium radiative forcing and a society with a low level of vulnerability – e.g. rising from less than 1% in Baseline*Baseline to 14% and 19% under SSP1EU-RCP4.5 and SSP5EU-RCP4.5 respectively.
4.3.3.1 Spatial clusters of risk across the multiple scenario combinations
Under each scenario combination, future heat stress risk exhibits large spatial disparities (Figure 4.4). Scandinavia and the British Isles show a very low risk (1st-2nd deciles, i.e. 1st quintile) under all the scenario combinations, due to both a very low heat hazard under all of the RCPs and to lowly vulnerable populations under all the SSPsEU. Similarly, the Southern part of Eastern Europe and certain parts of the Mediterranean region show a very high risk (9th-10th deciles, i.e. 5th quintile) under all the scenario combinations, due to both a high heat hazard under all the RCPs and very vulnerable populations under all the SSPsEU, including SSP1EU and SSP5EU. In contrast, a large number of European regions exhibit very different risk levels across the multiple scenario combinations. For instance, the Iberian Peninsula shows on average a low risk (3rd-4th deciles, i.e. 2nd quintile) under SSP1EU-RCP2.6, a moderate risk (5th-6th deciles, i.e. 3rd quintile) under SSP1EU/SSP5EU-RCP4.5, a high risk (7th-8th deciles, i.e. 4th quintile) under SSP5EU-RCP8.5 and SSP4EU-RCP2.6, and a very high risk under SSP3EU/SSP4EU-RCP4.5/RCP8.5. Similarly, most of Mid-Europe is highly sensitive to changes in scenario combinations, showing globally a very low and low risk under SSP1EU-RCP2.6 and SSP1EU/SSP5EU-RCP4.5 respectively, and a high risk under SSP3EU/SSP4EU-RCP4.5/RCP8.5. Finally, it is worth noting that under the combinations SSP3EU/SSP4EU-RCP4.5/RCP8.5, most of the Mediterranean region, the Iberian Peninsula, and the Southern part of Eastern Europe are at very high risk of heat stress, whereas at present they generally show a very low or low risk.
Influence of changes in socioeconomic and climatic conditions
96
Fig. 4.4. – Scenario matrix representing the spatially explicit multi -model-median heat stress risk for the 17 scenario combinations. Classification by deciles. Colors of the frames indicate the plausibility of the scenario combination (no color (black) is given for combinations with baseline climate and/or baseline socioeconomic conditions).
4.3.3.2 Populations exposed to very high risk
Combined with population projections, the steady increase of heat stress risk in Europe leads to a substantial increase in the number of people at very high risk of heat stress under three of the most likely futures (Figure 4.5). Results
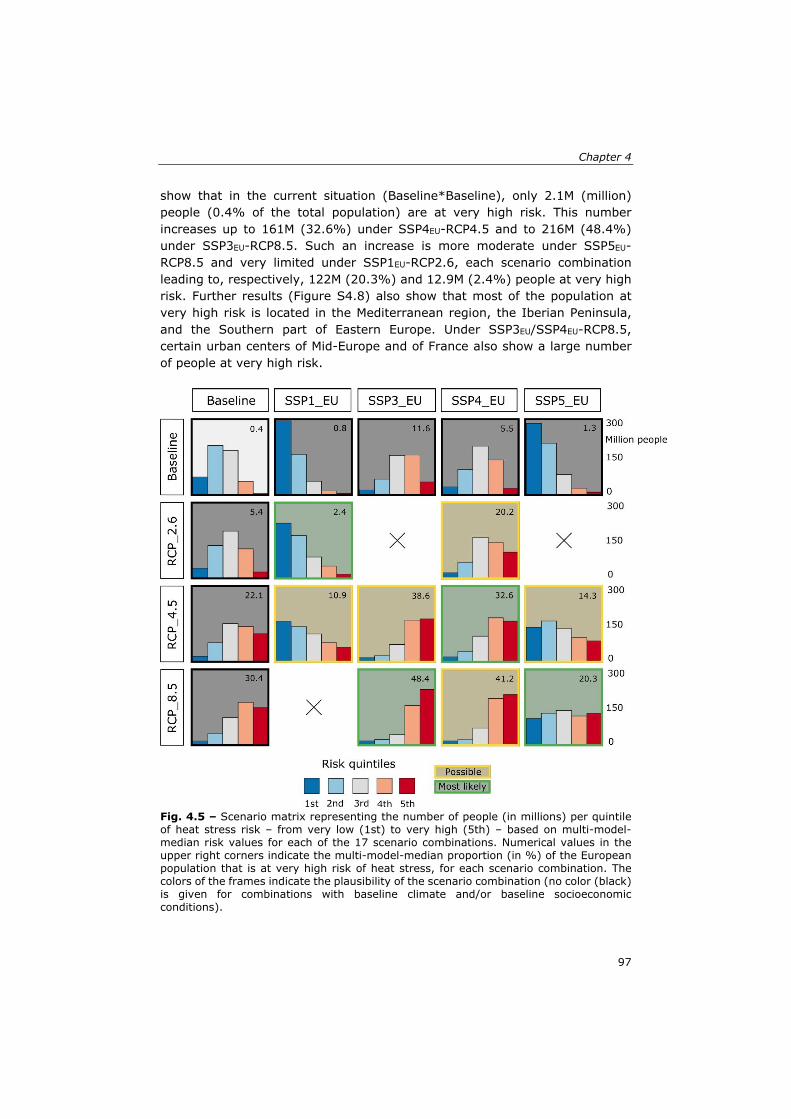
Chapter 4
97
show that in the current situation (Baseline*Baseline), only 2.1M (million) people (0.4% of the total population) are at very high risk. This number increases up to 161M (32.6%) under SSP4EU-RCP4.5 and to 216M (48.4%) under SSP3EU-RCP8.5. Such an increase is more moderate under SSP5EU-RCP8.5 and very limited under SSP1EU-RCP2.6, each scenario combination leading to, respectively, 122M (20.3%) and 12.9M (2.4%) people at very high risk. Further results (Figure S4.8) also show that most of the population at very high risk is located in the Mediterranean region, the Iberian Peninsula, and the Southern part of Eastern Europe. Under SSP3EU/SSP4EU-RCP8.5, certain urban centers of Mid-Europe and of France also show a large number of people at very high risk.
Fig. 4.5 – Scenario matrix representing the number of people (in millions) per quintile of heat stress risk – from very low (1st) to very high (5th) – based on multi-model-median risk values for each of the 17 scenario combinations. Numerical values in the upper right corners indicate the multi-model-median proportion (in %) of the European population that is at very high risk of heat stress, for each scenario combination. The colors of the frames indicate the plausibility of the scenario combination (no color (black) is given for combinations with baseline climate and/or baseline socioeconomic conditions).
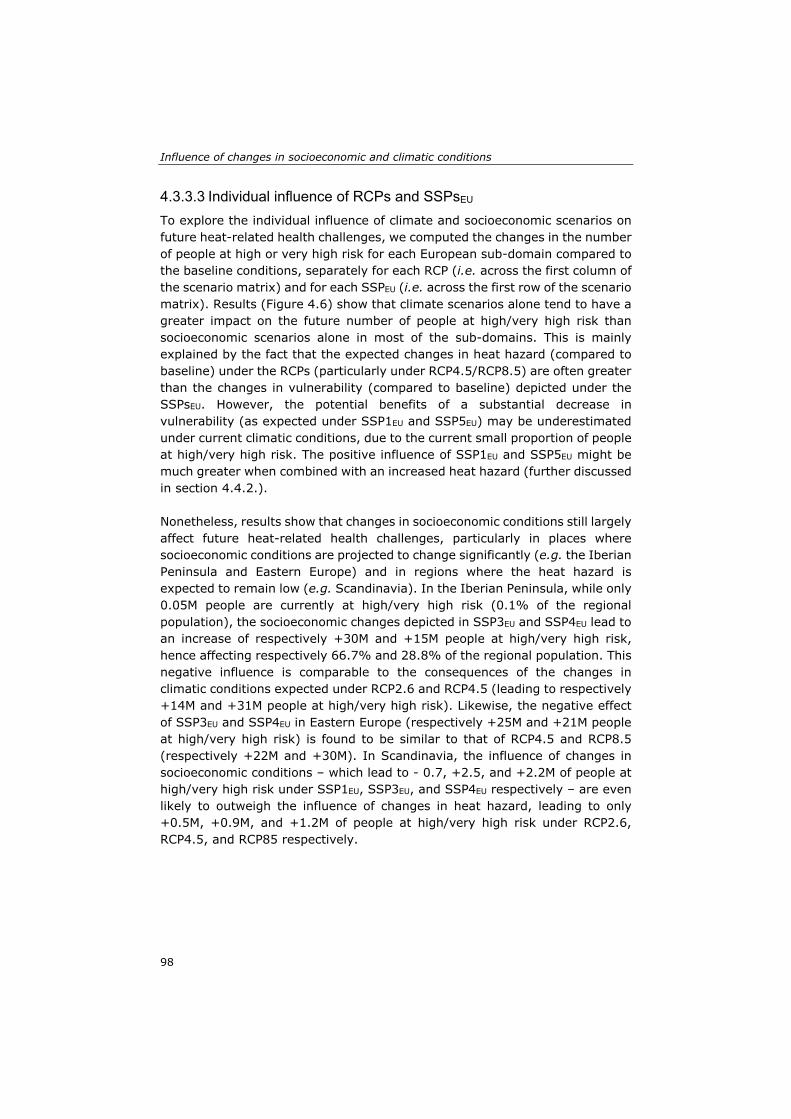
Influence of changes in socioeconomic and climatic conditions
98
4.3.3.3 Individual influence of RCPs and SSPsEU
To explore the individual influence of climate and socioeconomic scenarios on future heat-related health challenges, we computed the changes in the number of people at high or very high risk for each European sub-domain compared to the baseline conditions, separately for each RCP (i.e. across the first column of the scenario matrix) and for each SSPEU (i.e. across the first row of the scenario matrix). Results (Figure 4.6) show that climate scenarios alone tend to have a greater impact on the future number of people at high/very high risk than socioeconomic scenarios alone in most of the sub-domains. This is mainly explained by the fact that the expected changes in heat hazard (compared to baseline) under the RCPs (particularly under RCP4.5/RCP8.5) are often greater than the changes in vulnerability (compared to baseline) depicted under the SSPsEU. However, the potential benefits of a substantial decrease in vulnerability (as expected under SSP1EU and SSP5EU) may be underestimated under current climatic conditions, due to the current small proportion of people at high/very high risk. The positive influence of SSP1EU and SSP5EU might be much greater when combined with an increased heat hazard (further discussed in section 4.4.2.). Nonetheless, results show that changes in socioeconomic conditions still largely affect future heat-related health challenges, particularly in places where socioeconomic conditions are projected to change significantly (e.g. the Iberian Peninsula and Eastern Europe) and in regions where the heat hazard is expected to remain low (e.g. Scandinavia). In the Iberian Peninsula, while only 0.05M people are currently at high/very high risk (0.1% of the regional population), the socioeconomic changes depicted in SSP3EU and SSP4EU lead to an increase of respectively +30M and +15M people at high/very high risk, hence affecting respectively 66.7% and 28.8% of the regional population. This negative influence is comparable to the consequences of the changes in climatic conditions expected under RCP2.6 and RCP4.5 (leading to respectively +14M and +31M people at high/very high risk). Likewise, the negative effect of SSP3EU and SSP4EU in Eastern Europe (respectively +25M and +21M people at high/very high risk) is found to be similar to that of RCP4.5 and RCP8.5 (respectively +22M and +30M). In Scandinavia, the influence of changes in socioeconomic conditions – which lead to - 0.7, +2.5, and +2.2M of people at high/very high risk under SSP1EU, SSP3EU, and SSP4EU respectively – are even likely to outweigh the influence of changes in heat hazard, leading to only +0.5M, +0.9M, and +1.2M of people at high/very high risk under RCP2.6, RCP4.5, and RCP85 respectively.
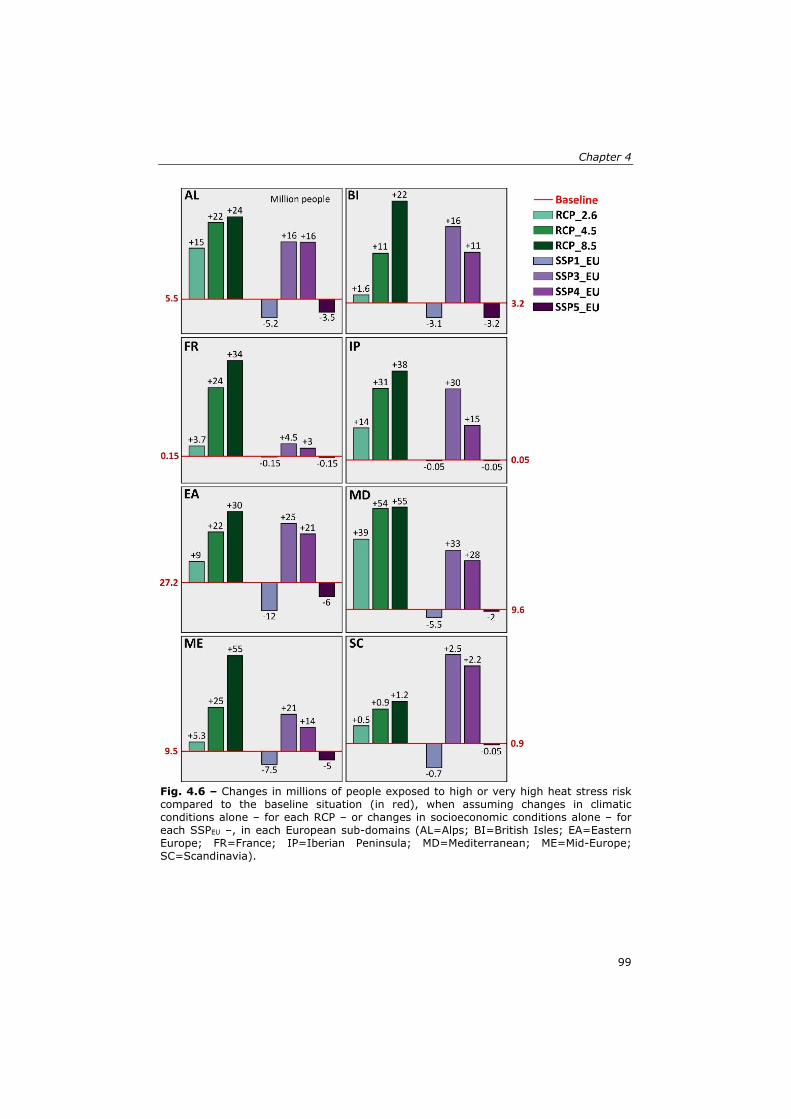
Chapter 4
99
Fig. 4.6 – Changes in millions of people exposed to high or very high heat stress risk compared to the baseline situation (in red), when assuming changes in climatic conditions alone – for each RCP – or changes in socioeconomic conditions alone – for each SSPEU –, in each European sub-domains (AL=Alps; BI=British Isles; EA=Eastern Europe; FR=France; IP=Iberian Peninsula; MD=Mediterranean; ME=Mid-Europe; SC=Scandinavia).
Influence of changes in socioeconomic and climatic conditions
100
4.4 Discussion
4.4.1 Likeliness of the scenario combinations
The potentially possible combinations of a given SSPEU with the different RCPs are not equally plausible, because some would require more ambitious mitigation policies than others (Kriegler et al., 2014; van Vuuren et al., 2014). The most likely combinations for each SSPsEU are SSP1EU-RCP2.6, SSP3EU-RCP8.5, SSP4EU-RCP4.5, and SSP5EU-RCP8.5 (Harjanne et al., 2014; Jevrejeva, 2013; Kok et al., 2015a). Results (Figure 4.5) show that the three latter all lead to a large increase in the proportion of people at very high risk of heat stress in Europe (respectively 48.4%, 32.6%, and 20.3%, compared to 0.4% currently), while SSP1EU-RCP2.6 is the only likely combination that leads to fairly low heat-related health challenges (2.4% of the population at very high risk). SSP5EU- RCP4.5 and SSP4EU-RCP2.6 lead to moderated heat-related health challenges (14.3% and 20.2% of the population at very high risk), but are considered as “possible” only and would thus require ambitious mitigation policies to occur (SSP5EU/SSP4EU are more likely to lead to a RCP8.5/RCP4.5 world). In brief, exploring the outputs of the risk assessment in light of the plausibility of the scenario combinations clearly illustrates that the future proportion of people at very high stress risk in Europe is most likely to increase significantly unless substantial political changes occur to rapidly and steadily shift the current socioeconomic development pathway towards sustainability, as depicted under SSP1EU. Future heat-related challenges could be moderated to some extent by rapid technological progress to enhance human capital – as depicted under SSP5EU – combined with ambitious mitigation policies to limit the warming as expected under RCP4.5.
4.4.2 Influence of changes in vulnerability and exposure
One of the main benefits of developing climate and socioeconomic scenarios in parallel and of combining them afterwards into a scenario matrix is that it allows the exploration of the individual contribution (to future climate risk) of changes in climatic conditions and changes in socioeconomic conditions separately (Moss et al., 2010; van Vuuren et al., 2014). In this paper, we have particularly emphasized the impact that changes in vulnerability – as depicted in the four SSPsEU – have on future heat-related health challenges. Results (Figure 4.6) show that changes in socioeconomic conditions considerably influence the future proportion of people at high/very high risk of heat stress, particularly in places where vulnerability shows substantial changes compared to baseline conditions. To further investigate the influence of SSPsEU on future heat-related health challenges under different climatic conditions, we computed the difference – in terms of number of people at high/very high risk
Chapter 4
101
– between risk assessments that consider changes in socioeconomic conditions (i.e. SSP-RCP) and those that assume static socioeconomic conditions (i.e. RCPs*baseline). This was performed within each European sub-domain, for each SSPEU, and under each future climatic conditions (i.e. under each RCP, exception made of the inconsistent SSP-RCP combinations). Results (Figure 4.7) show that the influence of the different SSPsEU on the future number of people at high/very high risk varies widely from one region to another, as well as from one SSPEU to another, and depends on future climatic conditions. SSP1EU and SSP5EU have the potential to decrease drastically future heat-related health challenges, particularly in a warmer world as expected under RCP4.5 and RCP8.5 (for SSP5EU only). For instance, in most regions, these socioeconomic development pathways lead to a decrease in risk that is of comparable magnitude to the difference in risk level observed between RCP2.6 and RCP4.5 (in the case of SSP1EU) or between RCP4.5 and RCP8.5 (in the case of SSP5EU). In other words, the benefits (in terms of reduction of heat-related health challenges) of shifting towards socioeconomic pathways depicting a society with a low level of vulnerability are comparable to the ones of ambitious mitigation strategies that would enable reaching RCP2.6 rather RCP4.5 (or RCP4.5 rather than RCP8.5). By contrast, the positive effect of limiting warming to the level expected under RCP2.6 or RCP4.5 can be completely counterbalanced and inhibited if the European socioeconomic development follows the pathways depicted in SSP3EU or SSP4EU. Indeed, when considering RCP4.5, both SSP3EU and SSP4EU lead to an increase in the number of people at high/very high risk that is significantly higher than the decrease expected when shifting from RCP8.5 to RCP4.5. Even more importantly, because the socioeconomic development pathways depicted in SSP1EU/SSP5EU and SSP3EU/SSP4EU have an opposite influence on future heat-related health challenges, the benefits of shifting towards SSP1EU or SSP5EU rather than towards SSP3EU or SSP4EU are remarkably large, under all climatic conditions. For instance, following the socioeconomic pathway depicted under SSP4EU (SSP3EU) rather than the one depicted under SSP1EU (SSP5EU) would lead to an increase in the number of people at high/very high risk of +30M (+38M) people in the British Isles, +34M (+22M) in France, +41M (+12M) in the Iberian Peninsula, and +46M (+47M) in Mid-Europe, when combined with RCP4.5 (RCP8.5). Finally, to further explore the individual influence of changes in exposure (i.e. population growth or decline), we computed the number of people at high/very high risk assuming no population change. Results show that changes in exposure have very little influence – compared to changes in vulnerability – on future heat-related health challenges in most regions and under most socioeconomic and climatic scenarios. In a very few cases, changes in exposure
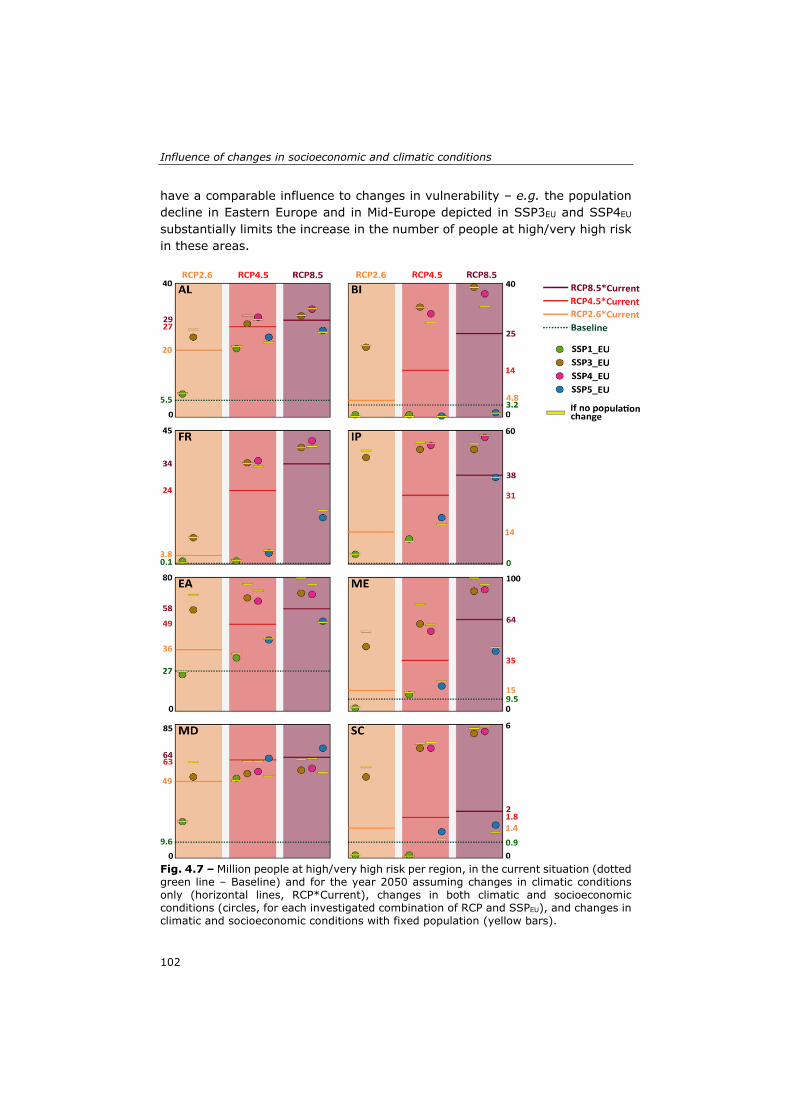
Influence of changes in socioeconomic and climatic conditions
102
have a comparable influence to changes in vulnerability – e.g. the population decline in Eastern Europe and in Mid-Europe depicted in SSP3EU and SSP4EU substantially limits the increase in the number of people at high/very high risk in these areas.
Fig. 4.7 – Million people at high/very high risk per region, in the current situation (dotted green line – Baseline) and for the year 2050 assuming changes in climatic conditions only (horizontal lines, RCP*Current), changes in both climatic and socioeconomic conditions (circles, for each investigated combination of RCP and SSPEU), and changes in climatic and socioeconomic conditions with fixed population (yellow bars).
Chapter 4
103
4.4.3 Sensitivity analysis
To highlight the robustness of the results in relation to the methodological choices, we performed ten different risk assessments, of which (i) two included changes in the method employed to aggregate the determinants of risk, (ii) seven included changes in the choice of the RCM simulation, and (iii) one included a different definition of heat waves (see Text S4.5 for the full details and results). Based on visual and statistical reasoning (Reckien, 2018), we showed that changes in the choice of the RCM simulation and of the definition of heat wave do not substantially affect the results, mainly because the heat hazard is spatially and temporally normalized before being combined with the vulnerability index and exposure to compute risk. Similar results are also obtained when using an additive approach – rather than a geometric aggregation – to combine the heat hazard and the vulnerability index, as well as when using a Principal Component Analysis (PCA) to determine the weight of the vulnerability determinants (rather than an approach with equal weights).
4.5 Conclusion In this paper, we presented a European assessment of future heat-related health challenges based on multiple combinations of climate and socioeconomic scenarios, at high spatial resolution. In doing so, we also accounted for changes in future vulnerability under varying levels of socioeconomic development, whereas to date studies have only focused on changes in human or economic exposure. Informed by four European Shared Socioeconomic Pathways (SSPsEU), we employed consistent projections up to 2050 of several socioeconomic variables – such as GDP per capita (Hurth et al., 2017), population distribution (Lückenkötter et al., 2017), urbanization (Terama et al., 2019), ageing (Terama, 2016), education (KC and Lutz, 2017), pre-existing medical conditions, and social isolation (Rohat, 2018) – to explore future populations’ abilities to prepare for, respond to, and recover from extreme heat events. Results showed that varying levels of socioeconomic development substantially influence future populations’ vulnerability. Under SSP1EU and SSP5EU, the vulnerability at the European level significantly decreases due to strong economic growth and significant investment in education and health, in line with recent evidence suggesting possible declines in vulnerability over time to climatic hazards (Bouwer and Jonkman, 2018). On the other hand, future vulnerability under SSP3EU and SSP4EU substantially increases, mostly due to a lack of education, the deterioration of public health, and gloomy or unequal economic growth. By combining projections of vulnerability and exposure – under the four different SSPsEU – with projections of heat hazard – under three different RCPs –, we explored future heat-related health challenges in Europe and accounted for the full range of uncertainties in both climate change and socioeconomic
Influence of changes in socioeconomic and climatic conditions
104
development. Results revealed that the proportion of the European population at very high risk of heat stress will show a steady increase under three of the four most plausible futures, namely SSP5EU-RCP8.5, SSP3EU-RCP8.5, and SSP4EU-RCP4.5, reaching respectively 20.3%, 32.6%, and 48.4% of the whole population (compared to 0.4% currently). Such a drastic increase is in line with recent findings (Forzieri et al., 2017). Future heat-related health challenges will remain low at the European level only if substantial political changes occur to rapidly and steadily shift towards sustainability – as depicted under SSP1EU. Ambitious mitigation policies associated with rapid technological progress to enhance human capital (as depicted under SSP5EU-RCP4.5) could also moderate future heat-related health challenges to some extent. Such threats to public health will be unevenly distributed across Europe, with Scandinavia and the Mediterranean region showing respectively the lowest and highest heat-related health challenges under most of the scenario combinations. In the latter region, but also in the Southern part of Eastern Europe and in the Iberian Peninsula, a strong increase in heat hazard (as expected under RCP8.5) combined with unequal socioeconomic development and/or gloomy economic conditions associated with a disintegration of the social fabric (as depicted in SSP3EU or SSP4EU) would lead to a world in which the near-totality of the population of these regions is at high or very high risk of heat stress. The spatial clusters of high risk identified in this study – when assuming fixed socioeconomic conditions – are consistent with previous climate risk assessments at the European scale (EEA, 2016). Leaning on the scenario matrix architecture (van Vuuren et al., 2014), we also explored and isolated the influence of varying levels of socioeconomic development on future heat-related health challenges. Results showed that such influence varies from one region to another and depends on the socioeconomic and climate scenarios under consideration. We highlighted that socioeconomic development pathways aiming towards a socially equitable Europe where the emphasis is on human well-being and education (as depicted in SSP1EU) or towards a strong Europe with rapid technological progress to enhance human capital (as depicted in SSP5EU) have the potential to significantly alleviate future heat-related health challenges, particularly when considering a warmer world as expected under RCP4.5 and RCP8.5. In certain regions (e.g. the British Isles, Mid-Europe, and France), the benefits of shifting towards the latter socioeconomic development pathways are comparable to a shift from high-end (RCP8.5) to low-end (RCP2.6) climate scenarios. Conversely, the benefits of ambitious mitigation strategies could be annihilated by socioeconomic pathways comparable to the ones depicted in SSP3EU or in SSP4EU. This ability of varying levels of socioeconomic development to reduce (or increase) future heat-related challenges is due primarily to their impact on vulnerability – changes in population exposure being only of secondary importance –, confirming recent results in the field of hunger risk in which
Chapter 4
105
social vulnerability plays a major role (Davenport et al., 2017; Kamali et al., 2018). We therefore emphasize here that socioeconomic development pathways should not be viewed solely as potential means to reach a given level of radiative forcing, but also as key determinants of future climate risks, particularly when considering their impact on future populations’ vulnerability – and not only on exposure. This sheds light on the undeniable necessity to consider the future state of vulnerability – and its uncertainties under varying levels of socioeconomic development – when assessing future heat-related health challenges and designing health adaptation strategies. Although the findings of this study are robust in response to changes in climate models, in the definition of, and in indicators’ aggregation methods, they should be accompanied by a certain number of caveats. Firstly, the socioeconomic projections – and their spatial disaggregation – are associated with a number of uncertainties, often linked to the modelling approach (Terama et al., 2019) and to the downscaling procedure (Rohat, 2018). Using different sources of socioeconomic projections (for the same set of SSPsEU) would help to properly propagate this source of uncertainty into the risk framework. Secondly, although informed by past studies, the selection of the drivers of vulnerability remained subjective – due to the lack of empirical data – and certain important determinants were not taken into account, such as the legacy component (Fouillet et al., 2008), the use of air conditioning, and acclimatization. Thirdly, the heat index (HWDs) does not account for single hot days that can also cause heat-related excess deaths, so may underestimates heat risk. Finally, the choice of a threshold level of 25°C is debatable and might have led to an underestimation of future risk, particularly in Northern Europe, where recent studies suggest heat-related mortality at temperature levels below 25°C (Âström et al., 2016). While this paper constitutes a step towards a better understanding of the influence of changes in vulnerability – under varying levels of socioeconomic development – on future heat-related health challenges, more diverse and consistent projections of key determinants of vulnerability under different socioeconomic development pathways should open broader opportunities to better quantify their influence on the wide range of future climate risks (Wilbanks and Ebi, 2014), at various spatial scales and in different regions. Further research is also needed to explore ways to consider future adaptation strategies under the SSPs (Anderson et al., 2018). Such adaptation strategies could be dealt with as a third dimension (Petkova et al., 2017) through adaptation pathways or could be accounted for by means of concrete adaptation options and policies directly embedded within each SSP. Further research could make use of the scenario matrix architecture to explore the efficiency of the adaptation strategies under multiple climatic and

Influence of changes in socioeconomic and climatic conditions
106
socioeconomic conditions and to identify the most suitable strategies for reducing heat-related health challenges under all plausible future scenario combinations.
107
Chapter 5 Projections of human exposure to dangerous heat in African cities under multiple socioeconomic and climate scenarios5
5This chapter is based on the article: Rohat G, Flacke J, Dosio A, Dao H and van Maarseveen M (2019). Projections of human exposure to dangerous heat in African cities under multiple socioeconomic and climate scenarios. Earth’s Future 7: 528-546.
Projections of human exposure to dangerous heat in African cities
108
Abstract Human exposure to dangerous heat, driven by climatic and demographic changes, is increasing worldwide. Being located in hot regions and showing high rates of urban population growth, African cities appear particularly likely to face significantly increased exposure to dangerous heat in the coming decades. We combined projections of urban population under five socioeconomic scenarios – Shared Socioeconomic Pathways (SSPs) – with projections of apparent temperature under three Representative Concentration Pathways (RCPs) in order to explore future exposure to dangerous heat across 173 large African cities. Employing multiple SSP-RCP combinations, we demonstrated that the aggregate exposure in African cities will increase by a multiple of 20-52, reaching 86-217 billion person-days per year by the 2090s, depending on the scenario. The most exposed cities are located in Western and Central Africa, although several Eastern African cities showed an increase of more than 2000 times the current level by the 2090s, due to the emergence of dangerous heat conditions combined with steady urban population growth. In most cases, we found future exposure to be predominantly driven by changes in population alone or by concurrent changes in climate and population, with the influence of changes in climate alone being minimal. We also demonstrated that shifting from a high to a low urban population growth pathway leads to a slightly greater reduction in aggregate exposure than shifting from a high to a low emissions pathway (51% vs 48%). This emphasizes the critical role that socioeconomic development plays in shaping heat-related health challenges in African cities.
Chapter 5
109
5.1 Introduction As recently highlighted in the 2018 Revision of World Urbanization Prospects – WUP (United Nations, 2018), African cities are currently experiencing unprecedented growth, driven by factors ranging from technology-driven development to environmental changes affecting primary rural production (Lwasa et al., 2018). Leading the global urbanization trend, the African urban population is expected to at least triple in the 40-year period from 2010 to 2050, reaching 21% of the future world’s urban population. Global warming – even if limited to +1.5°C – will pose serious threats to many urban populations in Africa (Pelling et al., 2018). The effects of climate change on African cities include climate-induced droughts, water scarcity, coastal flooding, salt-water intrusion, river floods, desertification, and heat waves (Lwasa et al., 2018). The frequency, duration, and intensity of the latter are expected to increase considerably in the 21st century over the African continent, particularly in subtropical areas (Dosio, 2017; Dosio et al., 2018; Russo et al., 2016). Such an increase has significant implications for human health, as extreme temperatures are strongly linked to heat stroke and mortality (Gasparrini et al., 2015a,b; Mora et al., 2017). Driven by both high population growth and significant changes in climatic conditions, future exposure to dangerous heat in Africa is projected to show the highest increase worldwide during the 21st century, with South-Asia being close behind (Coffel et al., 2018; Dong et al., 2015; Jones et al., 2018; Liu et al., 2017; Matthews et al., 2017). Recent regional studies conducted in Eastern Africa (Harrington and Otto, 2018) and across the Great African Lakes region (Asefi-Najafabady et al., 2018) have provided a closer look at the effects of changes in socioeconomic and climatic conditions on future exposure to dangerous heat in some parts of Africa. However, the effects of such factors on the urban populations of the many large African cities remain to be explored. Such a lack of focus on African cities may be attributable to the absence of population projections at the city-scale, under different socioeconomic scenarios. In this study, we use both non-spatial and spatial methods to provide urban population projections for African cities under several socioeconomic scenarios, namely the Shared Socioeconomic Pathways – SSPs (O’Neill et al., 2017). These projections are then combined with projections of extreme temperature under different levels of climate forcing, namely the Representative Concentration Pathways – RCPs (van Vuuren et al., 2011), in order to assess future human exposure to dangerous heat in African cities under different combinations of socioeconomic and climate scenarios. Additionally, we noted that existing studies fell short in exploring uncertainties due to various levels of socioeconomic development, as they generally considered only two different SSPs (out of the five) and employed no more
Projections of human exposure to dangerous heat in African cities
110
than four different combinations of RCPs and SSPs, whereas many more combinations are likely to occur (Kriegler et al., 2012). In this study, besides shedding light on a new and critical case study (namely the African cities), we also complement the existing literature by exploring the full range of uncertainties linked to the various societal pathways – i.e. employing the five SSPs – and to their multiple plausible combinations with three levels of radiative forcing (RCPs). Finally, most of the existing studies – irrespective of the spatial coverage and the scenarios – found that demographic change has a significant influence on future exposure to dangerous heat, although more often than not lesser than that of climate change (e.g. Asefi-Najafabady et al., 2018). Because African cities will likely experience the highest levels of urban population growth worldwide (United Nations, 2018), the influence of demographic change on future exposure to extreme heat is likely to be substantial and may even be greater than the effect of climate change alone. In this paper, we test this assumption by (i) thoroughly disentangling the individual contributions of changes in climatic and socioeconomic conditions and (ii) assessing the extent to which exposure could be limited by shifts in socioeconomic and climatic pathways.
5.2 Methods
5.2.1 Selection of sample cities
In this study we focus on large African cities that are listed in the 2014 Revision of WUP (United Nations, 2014) – the 2018 Revision of WUP being unavailable when cities were selected – that is, cities that have a total population exceeding 300’000 inhabitants for the year 2014. This yields a sample of 185 cities, with population size ranging from 300’000 to 18 million inhabitants (Table S5.1). Due to the merging of several contiguous cities (see method section 5.2.2. and Table S5.2), the initial sample was reduced to 173 different cities. These are located across 43 different African countries (Figure 5.1), covering the wide diversity of climatic zones across Africa – from the warm Mediterranean climate of Algiers (Algeria) to the Equatorial climate of Douala (Cameroon) and the humid subtropical climate of Antananarivo (Madagascar). The total population of these cities for the year 2015 – retrieved from the 2018 Revision of WUP (United Nations, 2018) – is 243 million, i.e. ~53% of the continental urban population and ~21% of the total continental population.
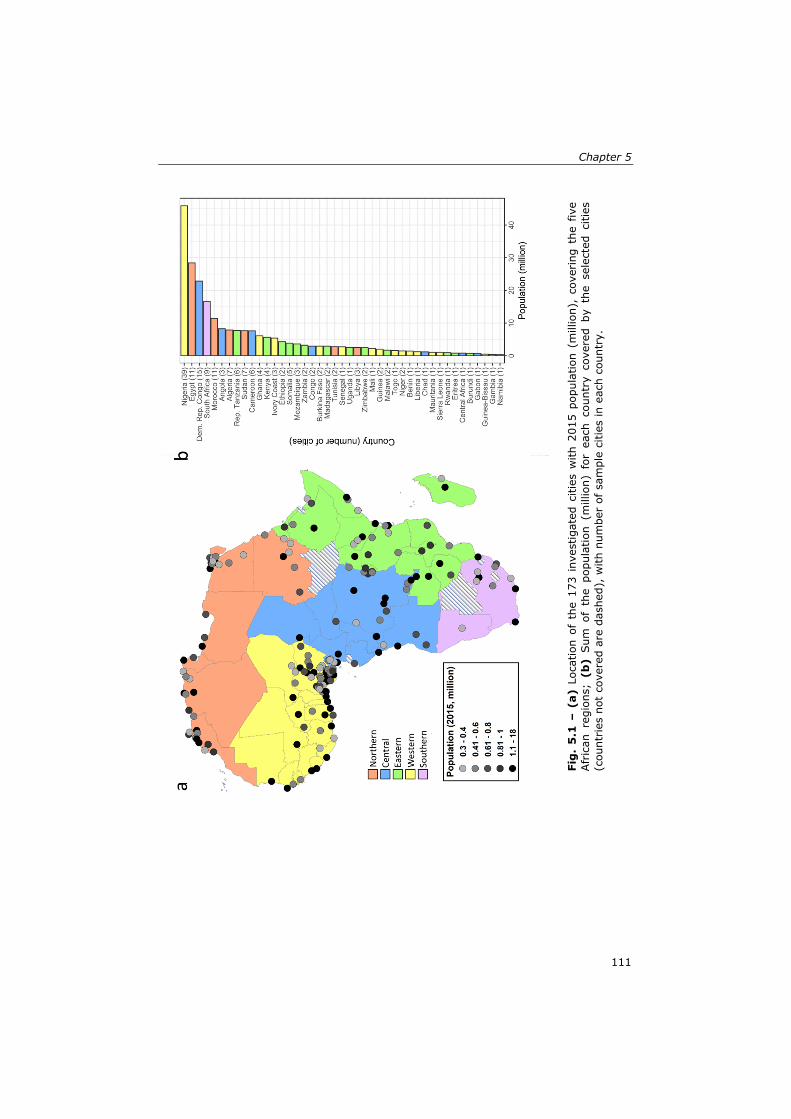
Chapter 5
111
Fig
. 5
.1 –
(a)
Loc
atio
n of
the
173
inv
estig
ated
citi
es w
ith 2
015
popu
latio
n (m
illio
n),
cove
ring
the
fiv
e Afr
ican
reg
ions
; (b
) Sum
of
the
popu
latio
n (m
illio
n) f
or e
ach
coun
try
cove
red
by t
he s
elec
ted
citie
s (c
ount
ries
not
cov
ered
are
das
hed)
, w
ith n
umbe
r of
sam
ple
citie
s in
eac
h co
untr
y.
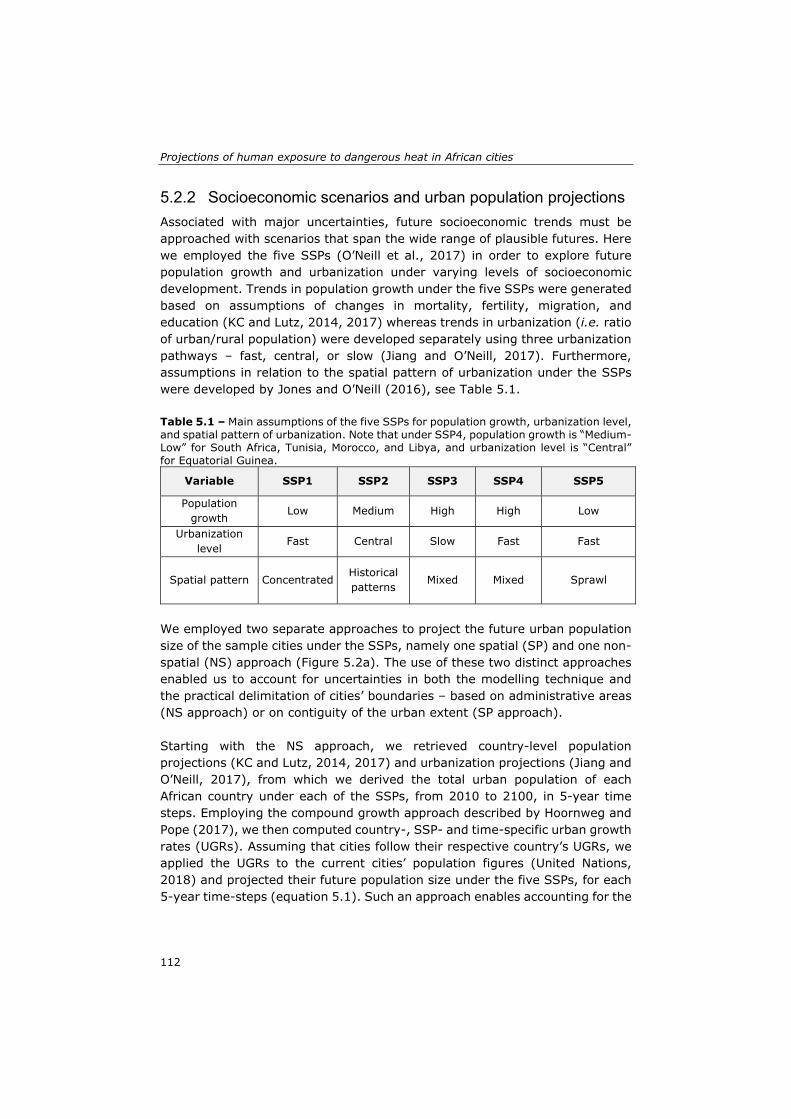
Projections of human exposure to dangerous heat in African cities
112
5.2.2 Socioeconomic scenarios and urban population projections
Associated with major uncertainties, future socioeconomic trends must be approached with scenarios that span the wide range of plausible futures. Here we employed the five SSPs (O’Neill et al., 2017) in order to explore future population growth and urbanization under varying levels of socioeconomic development. Trends in population growth under the five SSPs were generated based on assumptions of changes in mortality, fertility, migration, and education (KC and Lutz, 2014, 2017) whereas trends in urbanization (i.e. ratio of urban/rural population) were developed separately using three urbanization pathways – fast, central, or slow (Jiang and O’Neill, 2017). Furthermore, assumptions in relation to the spatial pattern of urbanization under the SSPs were developed by Jones and O’Neill (2016), see Table 5.1. Table 5.1 – Main assumptions of the five SSPs for population growth, urbanization level, and spatial pattern of urbanization. Note that under SSP4, population growth is “Medium-Low” for South Africa, Tunisia, Morocco, and Libya, and urbanization level is “Central” for Equatorial Guinea.
Variable SSP1 SSP2 SSP3 SSP4 SSP5
Population growth
Low Medium High High Low
Urbanization level
Fast Central Slow Fast Fast
Spatial pattern ConcentratedHistorical patterns
Mixed Mixed Sprawl
We employed two separate approaches to project the future urban population size of the sample cities under the SSPs, namely one spatial (SP) and one non-spatial (NS) approach (Figure 5.2a). The use of these two distinct approaches enabled us to account for uncertainties in both the modelling technique and the practical delimitation of cities’ boundaries – based on administrative areas (NS approach) or on contiguity of the urban extent (SP approach). Starting with the NS approach, we retrieved country-level population projections (KC and Lutz, 2014, 2017) and urbanization projections (Jiang and O’Neill, 2017), from which we derived the total urban population of each African country under each of the SSPs, from 2010 to 2100, in 5-year time steps. Employing the compound growth approach described by Hoornweg and Pope (2017), we then computed country-, SSP- and time-specific urban growth rates (UGRs). Assuming that cities follow their respective country’s UGRs, we applied the UGRs to the current cities’ population figures (United Nations, 2018) and projected their future population size under the five SSPs, for each 5-year time-steps (equation 5.1). Such an approach enables accounting for the
Chapter 5
113
contribution of both endogenous demographic growth and in-migration from rural areas to the future city’s population size.
𝐶𝑖𝑡𝑦_𝑝𝑜𝑝 ∆ 𝐶𝑖𝑡𝑦_𝑝𝑜𝑝 1_ ∆
_∆ 1
∆
(Eq. 5.1)
Where 𝐶𝑖𝑡𝑦_𝑝𝑜𝑝 is the city’s population size for a given time 𝑡, ∆𝑡 is a 5-year
time step, and 𝐶𝑜𝑢𝑛𝑡𝑟𝑦_𝑝𝑜𝑝 is the country’s urban population size for a given
time 𝑡. For the SP approach, we first delineated the current cities’ boundaries by (i) using a 1-km spatial dataset of urban extent for the year 2010 (IFPRI, 2015) and (ii) defining a city as a contiguous urban extent centered around its administrative area boundaries (GADM, 2018) (Figure S5.1). Cities that shared a contiguous urban fabric were merged into one, e.g. the cities of Harare and Chitungwiza (Zimbabwe) were merged to form the urban area of Harare-Chitungwiza (Figure 5.2b). In this way, we merged 22 cities into 12 different urban areas (Table S5.2), thus shifting the final sample of investigated cities from 185 to 173. To enable the comparison of the population projections obtained with the SP and NS approaches, we aggregated the NS-based projections of the 22 aforementioned cities accordingly – e.g. NS-based projections of Harare and Chitungwiza were summed to obtain the population projections of Harare-Chitungwiza. Secondly, we employed the gridded projections of urban population described in Jones and O’Neill (2016) – and downscaled to a 1-km grid by Gao (2017) using the GRUMP grid (CIESIN, 2011) – to compute the size of the urban population contained within each city boundaries. We compared each city’s population size obtained in this way with the WUP estimates (United Nations, 2018) for the same year (2010) and identified a large difference (> 100%) between the two urban population figures for 38 cities (Table S5.3). For those 38 cities, we refrained from employing the SP approach – i.e. population projections of those cities are based only on the NS approach. Thirdly, we delineated future cities’ boundaries based on assumptions of urban expansion under each SSP. Recent findings suggest that Africa will show the highest rate of increase in urban land cover worldwide, with a roughly 7-fold increase in 30 years (Seto et al., 2012). Here we consider urban expansion as being a function of both urban population growth and decline in urban population density (Angel et al., 2016). Projections of urban population growth were directly retrieved from the UGRs computed in equation 5.1, while projections of decline in urban density were informed by historical trends
Projections of human exposure to dangerous heat in African cities
114
(Angel et al., 2016), existing scenarios of urban densities in Africa (Angel et al., 2011; Guneralp et al., 2017), and assumptions of spatial patterns of urban development under the SSPs (Jiang and O’Neill, 2017; Jones and O’Neill, 2016). Based on these sets of information, we assumed no change in population density under SSP1 and an annual decline of (i) 1% under SSP2 (similar to the rate observed in Africa from 1990-2000), (ii) 1.5% under both SSP3 and SSP4 due to mixed spatial patterns of development, and (iii) 2% under SSP5 due to urban sprawling. Assuming a proportional relationship between urban expansion and its two drivers (Angel et al., 2011), both UGRs and annual % of decline in population density were then translated into country- and SSP-specific fold changes in size of urban area compared to the baseline (2010) conditions (Text S5.1 and Figure S5.2a). The resulting fold changes – dominantly driven by population growth, except under SSP5 in some regions (Figure S5.2b) – were then applied to the current cities’ boundaries to determine their future boundaries under each SSP and time-step, assuming a homogeneous urban expansion around the cities’ centroid and defining large water bodies and national borders as barriers of urban expansion (Figure 5.2c). We merged into so-called mega urban regions (MURs) a number of nearby cities that presented overlapping boundaries due to urban expansion. Finally, we employed spatially explicit projections (1-km) of urban population counts under the different SSPs and time-steps (Figure S5.3) and computed the size of the urban population contained within each city boundary, for all SSPs and time steps. In the case of the MURs that were formed based on the overlap of cities’ future boundaries, we broke down the MURs population projections into cities’ population projections based on their respective population proportion within the MUR for the year 2010. This enabled the retention of the original sample of 173 cities.
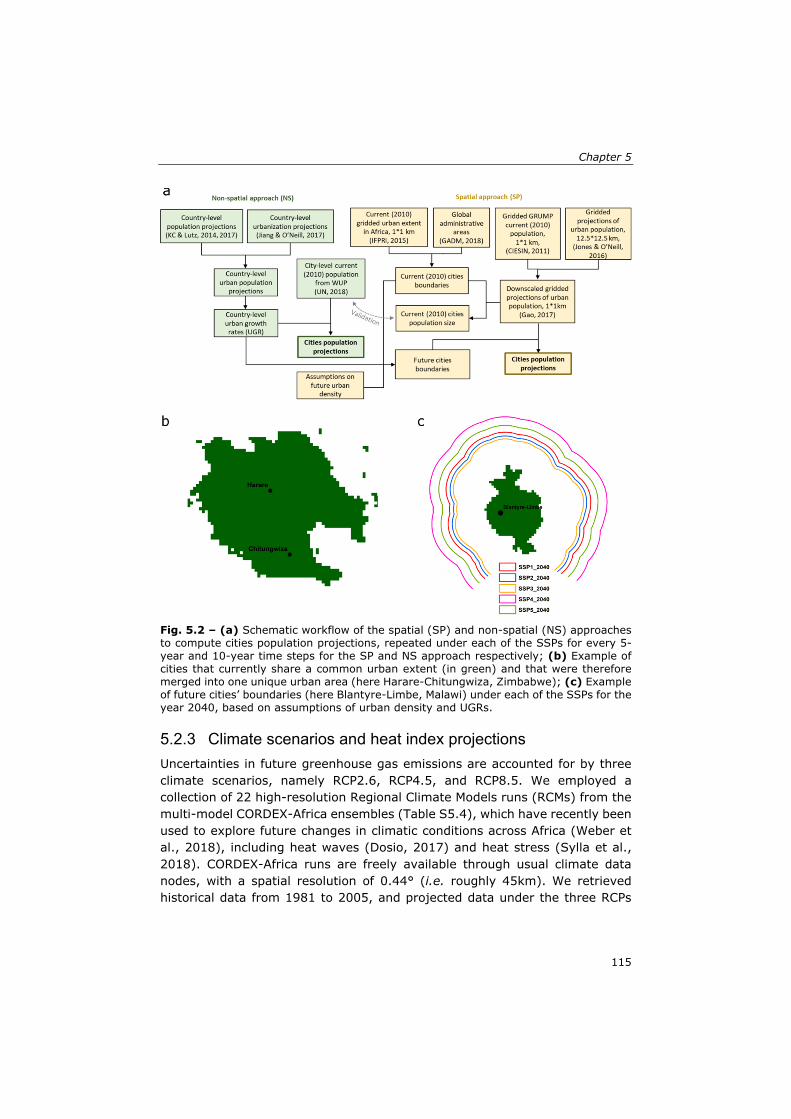
Chapter 5
115
Fig. 5.2 – (a) Schematic workflow of the spatial (SP) and non-spatial (NS) approaches to compute cities population projections, repeated under each of the SSPs for every 5-year and 10-year time steps for the SP and NS approach respectively; (b) Example of cities that currently share a common urban extent (in green) and that were therefore merged into one unique urban area (here Harare-Chitungwiza, Zimbabwe); (c) Example of future cities’ boundaries (here Blantyre-Limbe, Malawi) under each of the SSPs for the year 2040, based on assumptions of urban density and UGRs.
5.2.3 Climate scenarios and heat index projections
Uncertainties in future greenhouse gas emissions are accounted for by three climate scenarios, namely RCP2.6, RCP4.5, and RCP8.5. We employed a collection of 22 high-resolution Regional Climate Models runs (RCMs) from the multi-model CORDEX-Africa ensembles (Table S5.4), which have recently been used to explore future changes in climatic conditions across Africa (Weber et al., 2018), including heat waves (Dosio, 2017) and heat stress (Sylla et al., 2018). CORDEX-Africa runs are freely available through usual climate data nodes, with a spatial resolution of 0.44° (i.e. roughly 45km). We retrieved historical data from 1981 to 2005, and projected data under the three RCPs
Projections of human exposure to dangerous heat in African cities
116
from 2006 onwards. We considered the nearest climatic grid points of each city to be representative of the cities’ climatic conditions. Although some recent studies have considered only maximum temperature to define the heat index 𝐻𝐼 – without accounting for humidity, e.g. (Dong et al., 2015; Harrington and Otto, 2018; Liu et al., 2017) –, evidence suggests that humidity plays an important role in temperature discomfort and dangerous heat and thus must be integrated into the construction of the 𝐻𝐼 (Coffel et al., 2018; Davis et al., 2016; Matthews et al., 2017; Mora et al., 2017), particularly in South-America, Africa, and South-Asia (Russo et al., 2017). Various heat metrics that include both temperature and humidity have been developed over the past few years, all performing well and rather similarly (Anderson et al., 2013; Matthews et al., 2017). Here we employed the apparent temperature (𝐴𝑇) and defined the annual 𝐻𝐼 as being the number of days for which the daily maximum apparent temperature exceeds a given threshold, being set at 105°F (i.e. 40.6°C). The latter is based on the US National Weather Services (NWS) threshold of dangerous heat, widely used in the literature (e.g. Matthews et al., 2017; Russo et al., 2017). Although a fixed threshold was preferred to a relative threshold for the main exposure analysis – to ensure the consistency with past studies –, we also explored future extreme heat using relative thresholds, set as the 95th, 97.5th, and 99th percentiles of the historical local maximum apparent temperature. To compute the apparent temperature, we employed the NWS equation (equation 5.2) with adjustments when required (NWS, 2014).
𝐴𝑇 𝑐 𝑐 𝑇 𝑐 𝑅𝐻 𝑐 𝑇. 𝑅𝐻 𝑐 𝑇 𝑐 𝑅𝐻 𝑐 𝑇 . 𝑅𝐻𝑐 𝑇. 𝑅𝐻 𝑐 𝑇 . 𝑅𝐻 (Eq. 5.2) Where 𝐴𝑇 is apparent temperature (°F), 𝑇 is daily maximum air temperature
(°F), 𝑅𝐻 is daily mean relative humidity (%), 𝑐 = 42.379, 𝑐 = 2.04901523,
𝑐 = 10.14333127, 𝑐 = 0.22475541, 𝑐 = 0.00683783, 𝑐 = 0.05481717, 𝑐 =
0.00122874, 𝑐 = 0.00085282, 𝑐 = 0.00000199. While daily projections of maximum temperature were available for all RCM runs, projections of daily relative humidity were not always available. Where this was the case, we computed relative humidity based on daily projections of specific humidity, air temperature, and surface pressure (Text S5.1). Datasets of observed daily climate variables (such as maximum temperature) for Africa are very scarce (Donat et al., 2013). Therefore, we employed the ERA-Interim (ERA-I) re-analysis from the European Center for Medium-Range Weather Forecasts (Dee et al., 2011) to evaluate the models’ ability to
Chapter 5
117
reproduce historical 𝑅𝐻, 𝑇, 𝐴𝑇, and 𝐻𝐼 over the reference period (1981-2005). We (i) remapped ERA-I daily data to the RCM grid (0.44°) using bilinear interpolation, (ii) employed the hypsometric equation (Text S5.1) to compute the surface pressure from the mean sea level pressure, air temperature, and surface elevation, and (iii) subsequently computed daily 𝑅𝐻 and 𝐴𝑇 respectively. Comparisons between the ERA-I re-analysis and the multi-model mean highlighted the latter’s low ability to reproduce historical 𝑅𝐻, 𝑇, and 𝐴𝑇
(Figures S5.4, S5.5, and S5.6). Conversely, multi-model mean 𝐴𝑇 based on
the combination of models’ 𝑅𝐻 and ERA-I 𝑇 performed well (Figure S5.6),
highlighting the dominating role that 𝑇 plays in 𝐴𝑇’s bias. We therefore bias-
corrected RCMs’ daily 𝑇 – using ERA-I reanalysis datasets and a quantile mapping approach with parametric transformations (Dosio, 2016) – and employed these bias-corrected projections of 𝑇 to compute both historical and
future 𝐴𝑇 and 𝐻𝐼.
5.2.4 Exposure assessment framework
We defined exposure as being the number of people exposed to dangerous heat – that is, the annual 𝐻𝐼 (i.e. number of days when 𝐴𝑇 > 40.6°C) multiplied by the number of people exposed (Jones et al., 2015). The unit of exposure is therefore person-days – in line with other studies (e.g. Coffel et al., 2018; Jones et al., 2018, Liu et al., 2017). For each city and each year, we computed the annual number of person-days of exposure to dangerous heat and averaged them over the baseline period (1985-2005) and future time-periods, namely the 2030s (2020-2040), the 2060s (2050-2070), and the 2090s (2080-2100). Exposure was computed under each climate model run and for both sets of urban population projections (SP and NS). We employed the multi-model mean to explore the results (one model being the combination of one climate model run and one set of population projections) and accounted for the inter-models variation through interquartile ranges (IQR). Considering that certain SSP-RCP combinations are very unlikely to arise (Kriegler et al., 2012), we discarded the few inconsistent combinations – SSP1-RCP8.5, SSP3-RCP2.6, SSP5-RCP2.6 – and employed the remaining twelve potential SSP-RCP combinations (Table S5.5) to account for the full range of plausible futures and to allow for an exploration of the effect on exposure of different SSPs under a given RCP, and vice versa. We also explored the individual influence of demographic and climatic changes on future exposure by computing the so-called climate effect, population effect, and interaction effect (Jones et al., 2015). The climate effect is computed under each RCP by holding population constant (i.e. averaged over the historical
Projections of human exposure to dangerous heat in African cities
118
period) while accounting for climate change. The population effect is computed under each SSP by holding the climate constant (i.e. averaged over the historical period) while accounting for demographic change. The interaction effect (i.e. change in exposure that results from simultaneous changes in both climatic and demographic conditions) is computed under all selected SSP-RCP combinations as the difference between the total exposure and the sum of the climate and population effects. It depicts change in exposure resulting from concurrent changes in climate and population. This metric is particularly relevant in that it captures and quantifies the process by which local populations move into harm’s way, i.e. grow and move into cities that are experiencing increasingly dangerous heat conditions. Finally, we assessed the extent to which exposure was avoided as a result of shifts in socioeconomic or climatic pathways. We particularly focused on the decrease in exposure (in both absolute and relative terms) associated with shifts (i) from a high (or medium) to a low urban population growth pathway, under different climatic conditions (RCPs), and (ii) from a high (or medium) to a low radiative forcing pathway, under different socioeconomic conditions (SSPs) .
5.3 Results
5.3.1 Urban population projections
Based on the mean of the cities’ population projections obtained with the SP and NS approaches, results show that the total population of the 173 sample cities increases under all SSPs compared to the current population (Figure 5.3a). SSP4 leads to the highest growth, with the total urban population reaching 1’230 (+/- 232) million (M) inhabitants by 2070 and 1’772 (297) M by 2100, i.e. a ~ 9-fold increase compared to the baseline (year 2010) population of 209 (31) M people. At the opposite end of the scale, SSP1 and SSP5 are the scenarios leading to the lowest growth, with total urban population reaching respectively 813 (150) and 891 (173) M people in 2100, i.e. a roughly 4-fold increase compared to the baseline. Results also show that under all scenarios – except SSP4 – the pace of urban population growth will slow down as of ~2060. Such continental-scale results hide a number of differentiated trends at the regional scale. Eastern and Western Africa are the regions showing the most significant growth under all scenarios, with the largest increase expected under SSP4. In the latter scenario, the urban population of the sample cities in Central, Western, and Eastern Africa will reach respectively 275 (19), 796 (173), and 514 (67) M people in 2100, meaning respectively a ~10-, 12-, and 17-fold increase compared to the baseline. Conversely, Northern and Southern Africa both show a relatively small increase, with an expected decrease in the second half of the century
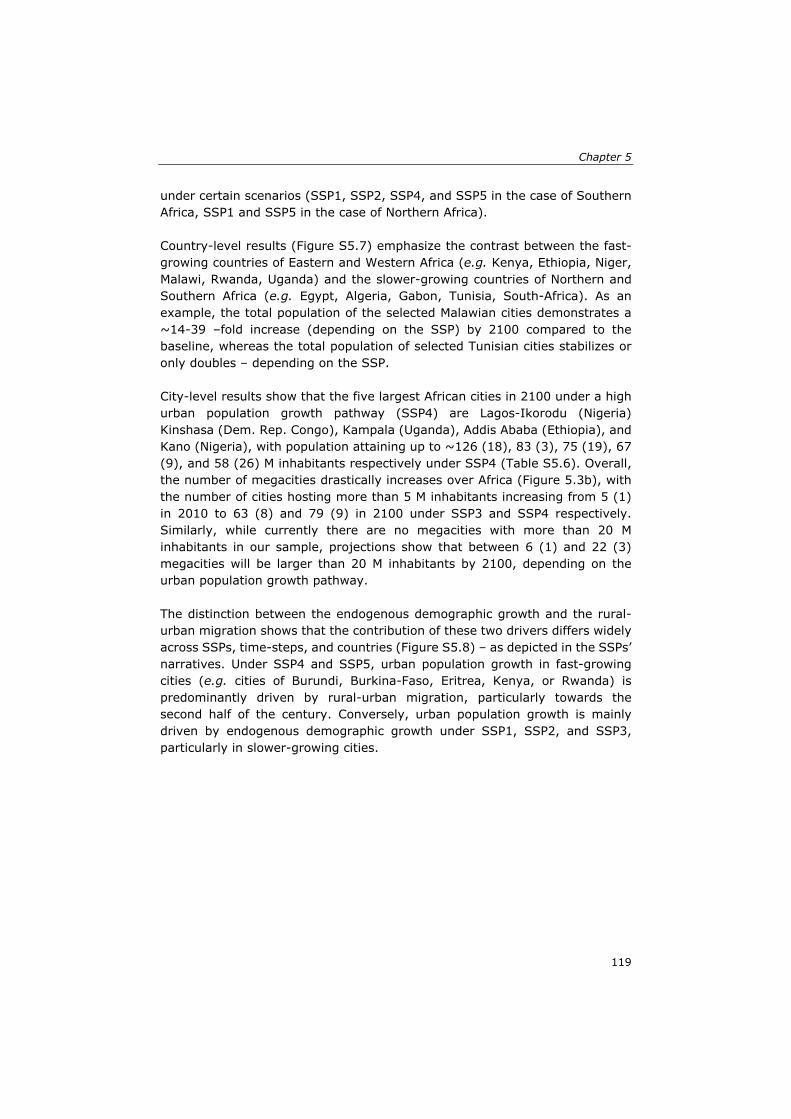
Chapter 5
119
under certain scenarios (SSP1, SSP2, SSP4, and SSP5 in the case of Southern Africa, SSP1 and SSP5 in the case of Northern Africa). Country-level results (Figure S5.7) emphasize the contrast between the fast-growing countries of Eastern and Western Africa (e.g. Kenya, Ethiopia, Niger, Malawi, Rwanda, Uganda) and the slower-growing countries of Northern and Southern Africa (e.g. Egypt, Algeria, Gabon, Tunisia, South-Africa). As an example, the total population of the selected Malawian cities demonstrates a ~14-39 –fold increase (depending on the SSP) by 2100 compared to the baseline, whereas the total population of selected Tunisian cities stabilizes or only doubles – depending on the SSP. City-level results show that the five largest African cities in 2100 under a high urban population growth pathway (SSP4) are Lagos-Ikorodu (Nigeria) Kinshasa (Dem. Rep. Congo), Kampala (Uganda), Addis Ababa (Ethiopia), and Kano (Nigeria), with population attaining up to ~126 (18), 83 (3), 75 (19), 67 (9), and 58 (26) M inhabitants respectively under SSP4 (Table S5.6). Overall, the number of megacities drastically increases over Africa (Figure 5.3b), with the number of cities hosting more than 5 M inhabitants increasing from 5 (1) in 2010 to 63 (8) and 79 (9) in 2100 under SSP3 and SSP4 respectively. Similarly, while currently there are no megacities with more than 20 M inhabitants in our sample, projections show that between 6 (1) and 22 (3) megacities will be larger than 20 M inhabitants by 2100, depending on the urban population growth pathway. The distinction between the endogenous demographic growth and the rural-urban migration shows that the contribution of these two drivers differs widely across SSPs, time-steps, and countries (Figure S5.8) – as depicted in the SSPs’ narratives. Under SSP4 and SSP5, urban population growth in fast-growing cities (e.g. cities of Burundi, Burkina-Faso, Eritrea, Kenya, or Rwanda) is predominantly driven by rural-urban migration, particularly towards the second half of the century. Conversely, urban population growth is mainly driven by endogenous demographic growth under SSP1, SSP2, and SSP3, particularly in slower-growing cities.
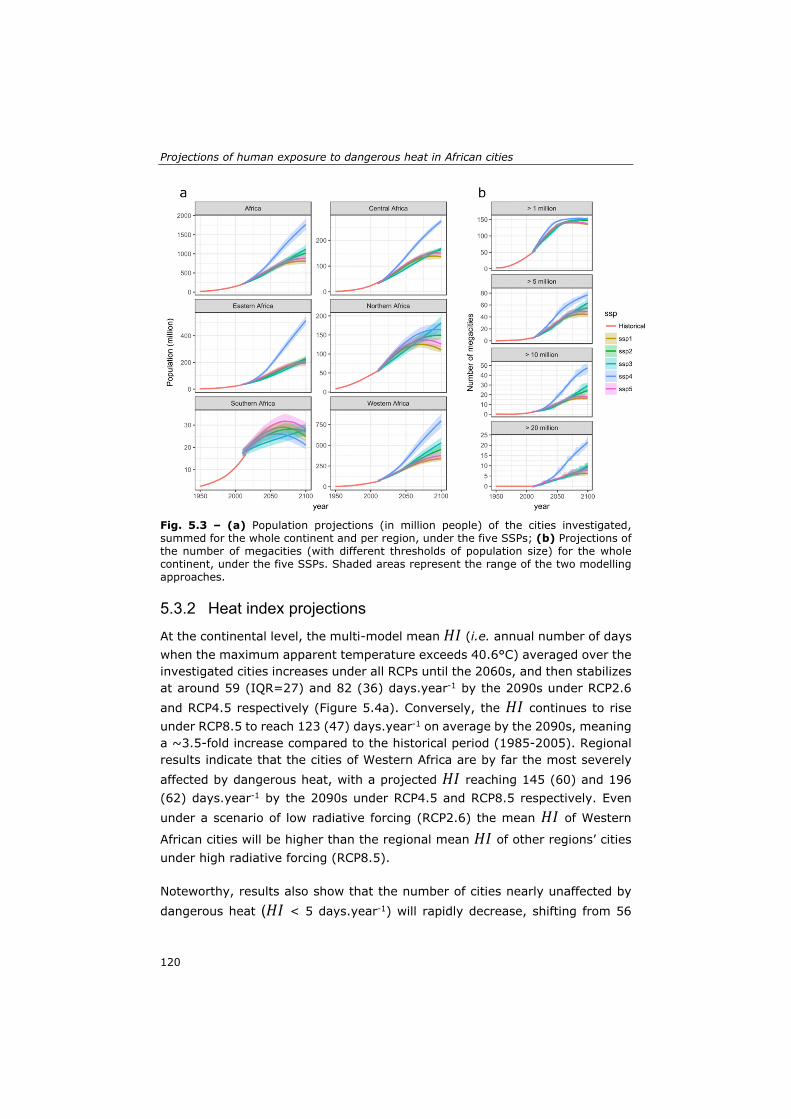
Projections of human exposure to dangerous heat in African cities
120
Fig. 5.3 – (a) Population projections (in million people) of the cities investigated, summed for the whole continent and per region, under the five SSPs; (b) Projections of the number of megacities (with different thresholds of population size) for the whole continent, under the five SSPs. Shaded areas represent the range of the two modelling approaches.
5.3.2 Heat index projections
At the continental level, the multi-model mean 𝐻𝐼 (i.e. annual number of days when the maximum apparent temperature exceeds 40.6°C) averaged over the investigated cities increases under all RCPs until the 2060s, and then stabilizes at around 59 (IQR=27) and 82 (36) days.year-1 by the 2090s under RCP2.6 and RCP4.5 respectively (Figure 5.4a). Conversely, the 𝐻𝐼 continues to rise under RCP8.5 to reach 123 (47) days.year-1 on average by the 2090s, meaning a ~3.5-fold increase compared to the historical period (1985-2005). Regional results indicate that the cities of Western Africa are by far the most severely affected by dangerous heat, with a projected 𝐻𝐼 reaching 145 (60) and 196 (62) days.year-1 by the 2090s under RCP4.5 and RCP8.5 respectively. Even under a scenario of low radiative forcing (RCP2.6) the mean 𝐻𝐼 of Western
African cities will be higher than the regional mean 𝐻𝐼 of other regions’ cities under high radiative forcing (RCP8.5). Noteworthy, results also show that the number of cities nearly unaffected by dangerous heat (𝐻𝐼 < 5 days.year-1) will rapidly decrease, shifting from 56
Chapter 5
121
(17) in the historical period to 30 (12) by the 2060s and 20 (11) by the 2090s under RCP8.5 (Figure 5.4b), i.e. only ~11% of our sample. Similarly, the number of cities experiencing dangerous heat during more than 200 days per year considerably increases under RCP8.5, reaching no less than ~24% of our sample by the 2090s, compared to ~1% over the historical period. It is also worth noting that lower-end scenarios (RCP2.6 and RCP4.5) substantially limit the occurrence of extreme 𝐻𝐼 (e.g. > 250 days.year-1) – with less than ~4% of the selected cities being concerned by the 2090s under these scenarios –, in contrast with RCP8.5, under which ~17% of the sample cities are affected by extreme 𝐻𝐼. In line with the regionally aggregated projections, country and city-scale results (Figures S9 and S10) showed that the most affected countries and cities are located in Western Africa, with several cities of Benin, Burkina Faso, Mali, Guinea-Bissau, and Ghana showing extreme 𝐻𝐼 (> 250 days.year-1) by the
2090s under RCP8.5. The 𝐻𝐼 sensitivity to scenarios is highly dependent on
the region and cities. Some cities show a 𝐻𝐼 of the same magnitude under all
RCPs – e.g. the 𝐻𝐼 of Niamey (Niger) in the 2090s is between 189 (29) and 225 (31) days.year-1 –, whereas other cities such a Luanda and Lubango (Angola) show 𝐻𝐼 values by the 2090s that are ~2.5 times less under RCP2.6 than under RCP8.5.
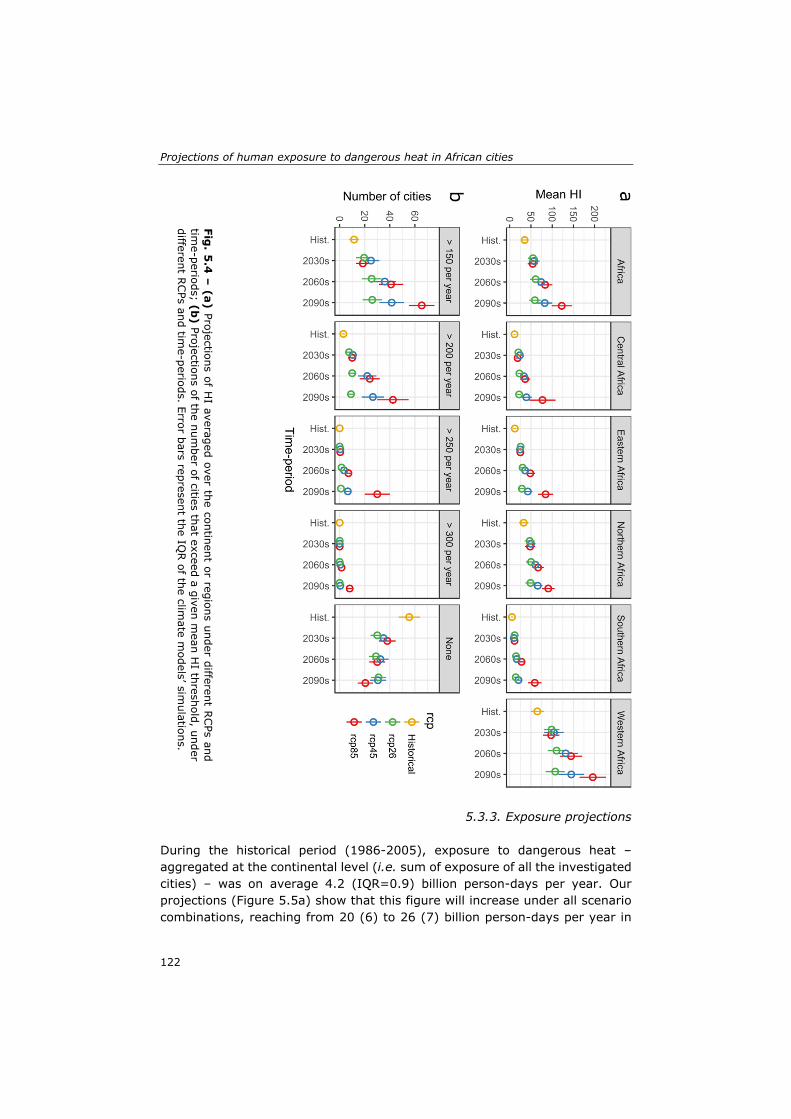
Projections of human exposure to dangerous heat in African cities
122
5.3.3. Exposure projections
During the historical period (1986-2005), exposure to dangerous heat – aggregated at the continental level (i.e. sum of exposure of all the investigated cities) – was on average 4.2 (IQR=0.9) billion person-days per year. Our projections (Figure 5.5a) show that this figure will increase under all scenario combinations, reaching from 20 (6) to 26 (7) billion person-days per year in
Fig. 5
.4 –
(a) Projections of HI averaged over the continent or regions under different R
CPs and
time-periods; (b
) Projections of the number of cities that exceed a given m
ean HI threshold, under
different RCPs and tim
e-periods. Error bars represent the IQR of the clim
ate models’ sim
ulations.
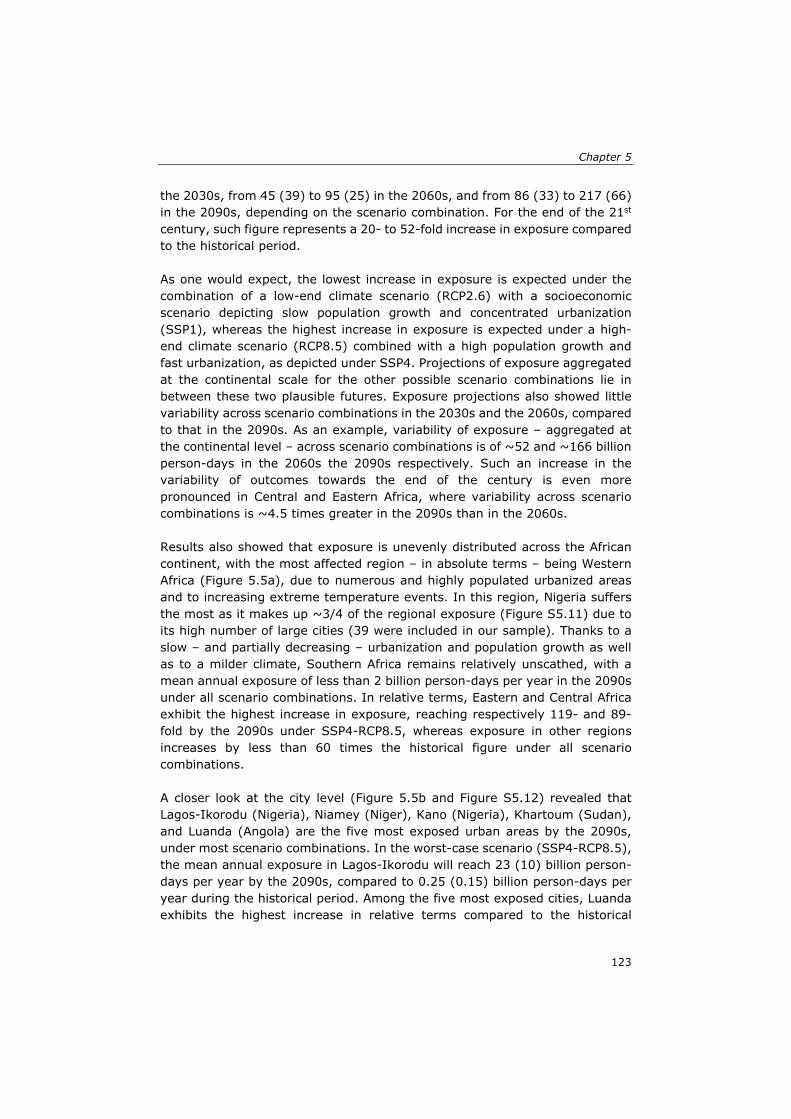
Chapter 5
123
the 2030s, from 45 (39) to 95 (25) in the 2060s, and from 86 (33) to 217 (66) in the 2090s, depending on the scenario combination. For the end of the 21st century, such figure represents a 20- to 52-fold increase in exposure compared to the historical period. As one would expect, the lowest increase in exposure is expected under the combination of a low-end climate scenario (RCP2.6) with a socioeconomic scenario depicting slow population growth and concentrated urbanization (SSP1), whereas the highest increase in exposure is expected under a high-end climate scenario (RCP8.5) combined with a high population growth and fast urbanization, as depicted under SSP4. Projections of exposure aggregated at the continental scale for the other possible scenario combinations lie in between these two plausible futures. Exposure projections also showed little variability across scenario combinations in the 2030s and the 2060s, compared to that in the 2090s. As an example, variability of exposure – aggregated at the continental level – across scenario combinations is of ~52 and ~166 billion person-days in the 2060s the 2090s respectively. Such an increase in the variability of outcomes towards the end of the century is even more pronounced in Central and Eastern Africa, where variability across scenario combinations is ~4.5 times greater in the 2090s than in the 2060s. Results also showed that exposure is unevenly distributed across the African continent, with the most affected region – in absolute terms – being Western Africa (Figure 5.5a), due to numerous and highly populated urbanized areas and to increasing extreme temperature events. In this region, Nigeria suffers the most as it makes up ~3/4 of the regional exposure (Figure S5.11) due to its high number of large cities (39 were included in our sample). Thanks to a slow – and partially decreasing – urbanization and population growth as well as to a milder climate, Southern Africa remains relatively unscathed, with a mean annual exposure of less than 2 billion person-days per year in the 2090s under all scenario combinations. In relative terms, Eastern and Central Africa exhibit the highest increase in exposure, reaching respectively 119- and 89-fold by the 2090s under SSP4-RCP8.5, whereas exposure in other regions increases by less than 60 times the historical figure under all scenario combinations. A closer look at the city level (Figure 5.5b and Figure S5.12) revealed that Lagos-Ikorodu (Nigeria), Niamey (Niger), Kano (Nigeria), Khartoum (Sudan), and Luanda (Angola) are the five most exposed urban areas by the 2090s, under most scenario combinations. In the worst-case scenario (SSP4-RCP8.5), the mean annual exposure in Lagos-Ikorodu will reach 23 (10) billion person-days per year by the 2090s, compared to 0.25 (0.15) billion person-days per year during the historical period. Among the five most exposed cities, Luanda exhibits the highest increase in relative terms compared to the historical
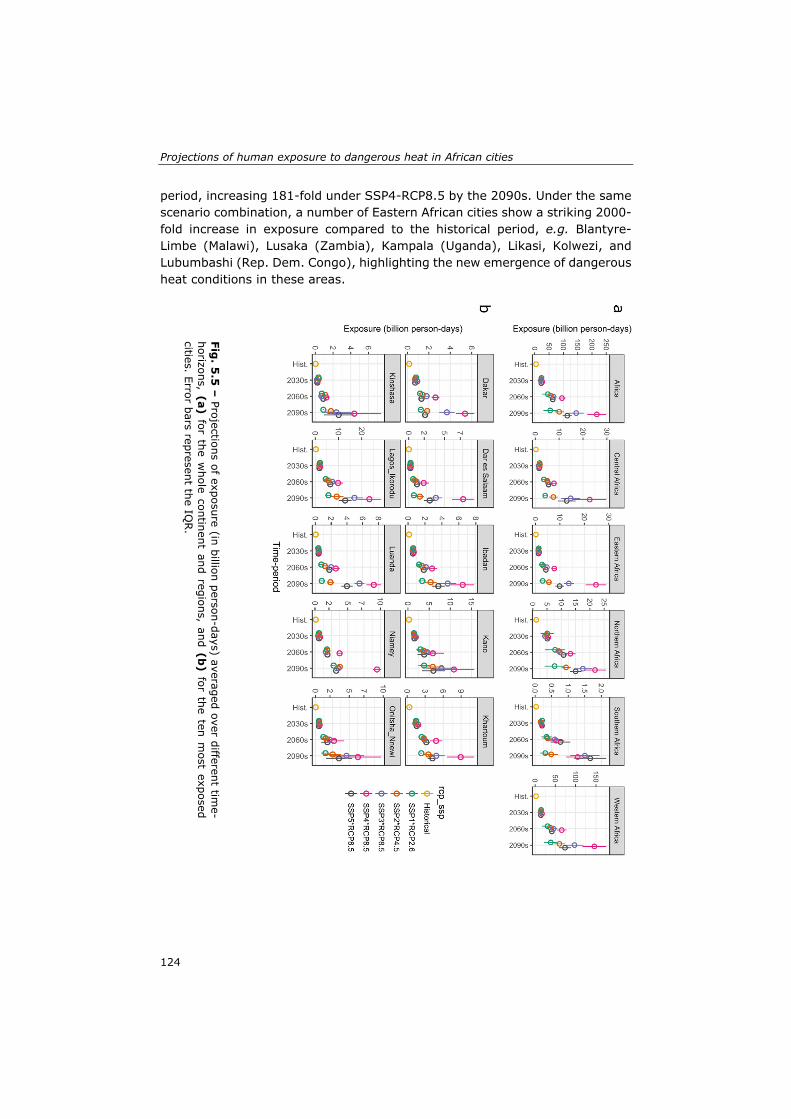
Projections of human exposure to dangerous heat in African cities
124
period, increasing 181-fold under SSP4-RCP8.5 by the 2090s. Under the same scenario combination, a number of Eastern African cities show a striking 2000-fold increase in exposure compared to the historical period, e.g. Blantyre-Limbe (Malawi), Lusaka (Zambia), Kampala (Uganda), Likasi, Kolwezi, and Lubumbashi (Rep. Dem. Congo), highlighting the new emergence of dangerous heat conditions in these areas.
Fig. 5
.5 –
Projections of exposure (in billion person-days) averaged over different time-
horizons, (a) for the whole continent and regions, and (b
) for the ten most exposed
cities. Error bars represent the IQR.
Chapter 5
125
5.3.4 Climate, population, and interaction effects
Combining both historical figures and projections of urban population and dangerous heat, we assessed the individual contribution of changes in climatic and socioeconomic conditions – respectively the population and climate effect – as well as the interaction effect (Figure 5.6). Results showed that at the continental level, exposure to dangerous heat is primarily driven by the population and interaction effects, with the climate effect alone being negligible in all cases, meaning that climate change has limited influence on future exposure if not accompanied by urban population growth. At the regional level, all regions follow similar patterns, excepting Northern Africa (to some extent) and Southern Africa, for which the climate effect plays a substantial role (particularly under RCP8.5), partly due to the relatively limited urban population growth expected in these regions. Eastern Africa shows the highest interaction effect, highlighting the synergistic interaction between the emergence of frequent dangerous heat – that was rarely experienced during the historical period – and rapid urban population growth. Dar es Salaam (Tanzania) clearly illustrates the interaction effect. While this city is not exposed to extreme heat conditions in the historical period and in the 2030s, the occurrence of such extreme conditions by the 2090s (under RCP4.5 and RCP8.5) combined with steady urban population growth will make Dar es Salaam one of the tenth most exposed cities by the end of the century (reaching 7.6 (3.1) billion person-days per year in the worst-case scenario). Conversely, future exposure in Western African cities such as Niamey (Niger) and Kano (Nigeria) is predominantly driven by the population effect (explaining between 65 and 98% of the multi-model mean exposure), due to the relatively low increase in the occurrence of dangerous heat conditions – which was already high in the historical period – compared to the fast and continuous increase in urban population expected under all SSPs.
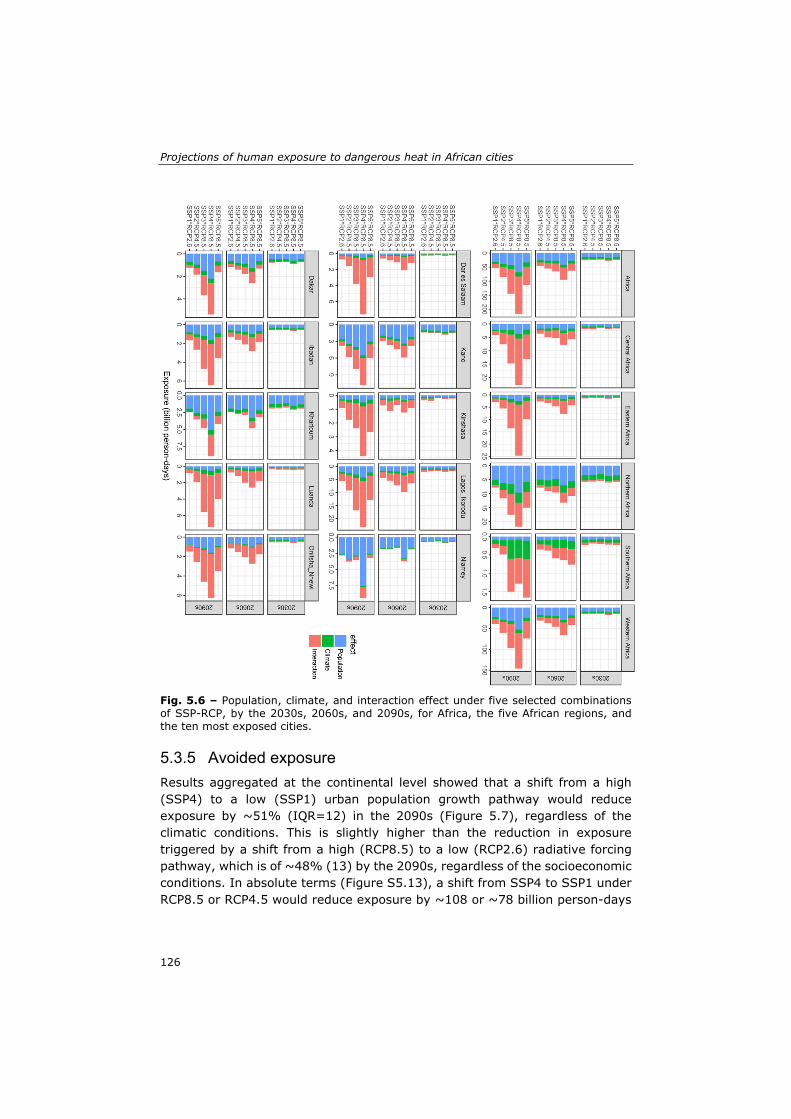
Projections of human exposure to dangerous heat in African cities
126
Fig. 5.6 – Population, climate, and interaction effect under five selected combinations of SSP-RCP, by the 2030s, 2060s, and 2090s, for Africa, the five African regions, and the ten most exposed cities.
5.3.5 Avoided exposure
Results aggregated at the continental level showed that a shift from a high (SSP4) to a low (SSP1) urban population growth pathway would reduce exposure by ~51% (IQR=12) in the 2090s (Figure 5.7), regardless of the climatic conditions. This is slightly higher than the reduction in exposure triggered by a shift from a high (RCP8.5) to a low (RCP2.6) radiative forcing pathway, which is of ~48% (13) by the 2090s, regardless of the socioeconomic conditions. In absolute terms (Figure S5.13), a shift from SSP4 to SSP1 under RCP8.5 or RCP4.5 would reduce exposure by ~108 or ~78 billion person-days
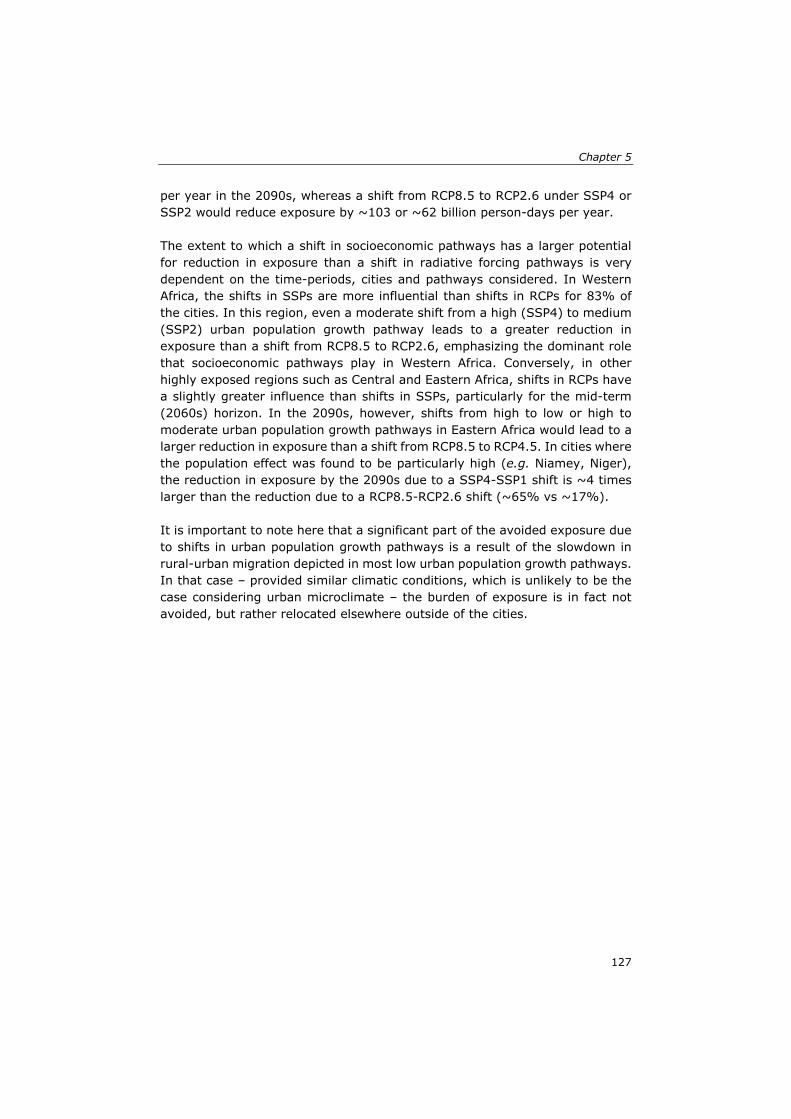
Chapter 5
127
per year in the 2090s, whereas a shift from RCP8.5 to RCP2.6 under SSP4 or SSP2 would reduce exposure by ~103 or ~62 billion person-days per year. The extent to which a shift in socioeconomic pathways has a larger potential for reduction in exposure than a shift in radiative forcing pathways is very dependent on the time-periods, cities and pathways considered. In Western Africa, the shifts in SSPs are more influential than shifts in RCPs for 83% of the cities. In this region, even a moderate shift from a high (SSP4) to medium (SSP2) urban population growth pathway leads to a greater reduction in exposure than a shift from RCP8.5 to RCP2.6, emphasizing the dominant role that socioeconomic pathways play in Western Africa. Conversely, in other highly exposed regions such as Central and Eastern Africa, shifts in RCPs have a slightly greater influence than shifts in SSPs, particularly for the mid-term (2060s) horizon. In the 2090s, however, shifts from high to low or high to moderate urban population growth pathways in Eastern Africa would lead to a larger reduction in exposure than a shift from RCP8.5 to RCP4.5. In cities where the population effect was found to be particularly high (e.g. Niamey, Niger), the reduction in exposure by the 2090s due to a SSP4-SSP1 shift is ~4 times larger than the reduction due to a RCP8.5-RCP2.6 shift (~65% vs ~17%). It is important to note here that a significant part of the avoided exposure due to shifts in urban population growth pathways is a result of the slowdown in rural-urban migration depicted in most low urban population growth pathways. In that case – provided similar climatic conditions, which is unlikely to be the case considering urban microclimate – the burden of exposure is in fact not avoided, but rather relocated elsewhere outside of the cities.
Projections of human exposure to dangerous heat in African cities
128
Fig. 5
.7 –
Relative reduction in exposure (%
) triggered by shifts in RCPs (high=
RCP8.5; m
edium=
RCP4.5;
low=
RCP2.6) and by shifts in S
SPs (high=
SSP4 (S
SP5 for S
outhern Africa); m
edium=
SSP2 (S
SP1 for S
outhern Africa); low
=SSP1 (S
SP4 for S
outhern Africa)). Error bars represent the IQ
R. N
ote that the relative reduction of shifts in S
SPs is sim
ilar under all RCPs, and the relative reduction of shifts in R
CPs is sim
ilar under all SSPs.
Chapter 5
129
5.4 Discussion
5.4.1 Diversity of outcomes
We have shown in this paper that exposure to dangerous heat in African cities will gradually increase throughout the 21st century to reach 86-217 billion person-days per year in 2090s at the continental-level, meaning a 20-52–fold increase compared to the historical period. Exposure will increase unevenly across the African continent, with most Western and Eastern African cities showing the largest increase in absolute and relative terms respectively. Exposure to dangerous heat in megacities located in tropical areas such as Kinshasa (Rep. Dem. Congo), Kano (Nigeria), and Lagos-Ikorodu (Nigeria) is likely to exceed 3, 5, and 10 billion person-days per year respectively by the 2090s. Employing twelve different SSP-RCP combinations, we explored the multitude of plausible futures and demonstrated that these yield levels of exposure that are (i) rather similar by the 2030s and the 2060s and (ii) very different in the 2090s. The low variability in outcomes across SSP-RCP combinations during the first half of the century sheds light on the unavoidable increase in exposure to extreme heat that African cities will experience in the next decades. Considering the high confidence in mid-century exposure projections, local policy-makers must start taking actions now to build urban resilience and to adapt to the inevitable increase in exposure throughout the next 40-50 years. At the same time, global climatic and socioeconomic pathways play a crucial role in shaping future levels of exposure towards the end of the century. As an example, in Western Africa exposure could reach 146 (46) billion person-days per year by the 2090s in the case of a high urban population growth pathway combined with a high-end climate pathway (SSP4-RCP8.5), but could also be limited to 39 (33) billion person-days per year in the case of a limited urban population growth pathway combined with a low-end climate scenario (SSP1-RCP2.6). Such a large range of possible outcomes highlights the direct implications that climate mitigation policies – limiting emissions to reach the level of radiative forcing depicted under RCP2.6 – and population and adaptation policies – limiting urban population growth and increasing adaptation as depicted under SSP1 – have on future exposure to dangerous heat.
5.4.2 Sources of uncertainty
The diversity of possible outcomes in future exposure to dangerous heat becomes even greater when considering the uncertainty associated with climate model simulations and population modelling approaches. While employing several climate models run is a common practice in climate impact assessments, using different sets of population projections is not. In this study,
Projections of human exposure to dangerous heat in African cities
130
we accounted for the uncertainty both in climate models simulation and in population modelling approaches. To explore these two sources of uncertainty separately, we computed the yearly exposure for all climate model runs with each set of population projections separately. Aggregated at the continental and regional scales, results (Figure 5.8) showed that the uncertainty in exposure due to the climate model simulations (represented here by the IQR) is wider than that related to the population modelling approaches in Central, Eastern, and Southern Africa. In the two former regions, this can be explained by the minimal difference across the population modelling approaches (see Figure 5.3a) as well as by the fairly wide climate spread under RCP8.5 – in Central Africa only (see Figure 5.4a). In Southern Africa, the large uncertainties in exposure due to climate model simulations are primarily related to the significant effect of climate change on exposure in this region, as shown by its substantial climate effect (see Figure 5.6). Conversely, in Western and Northern Africa as well as at the continental level, the uncertainty related to the choice of the population modelling approaches is greater than that due to the climate model simulations, particularly under SSP3 and SSP4. This is mostly explained by (i) the significant population effect in these regions and (ii) the large differences in urban population projections across the two modelling approaches (see Figure 5.3a). Compared to the SP approach, the NS approach generally leads to higher urban population projections – particularly in already highly urbanized areas such as Western and Northern Africa –, mainly because it assumes that (i) large cities will show a similar urban population growth rate to the national figure, (ii) there is no limit in population density (unlike the underlying population projections employed in the SP approach (Jones and O’Neill, 2016), which employed population density thresholds), and (iii) there are no barriers to growth (i.e. no adjacent cities, no country borders, and no natural barriers).
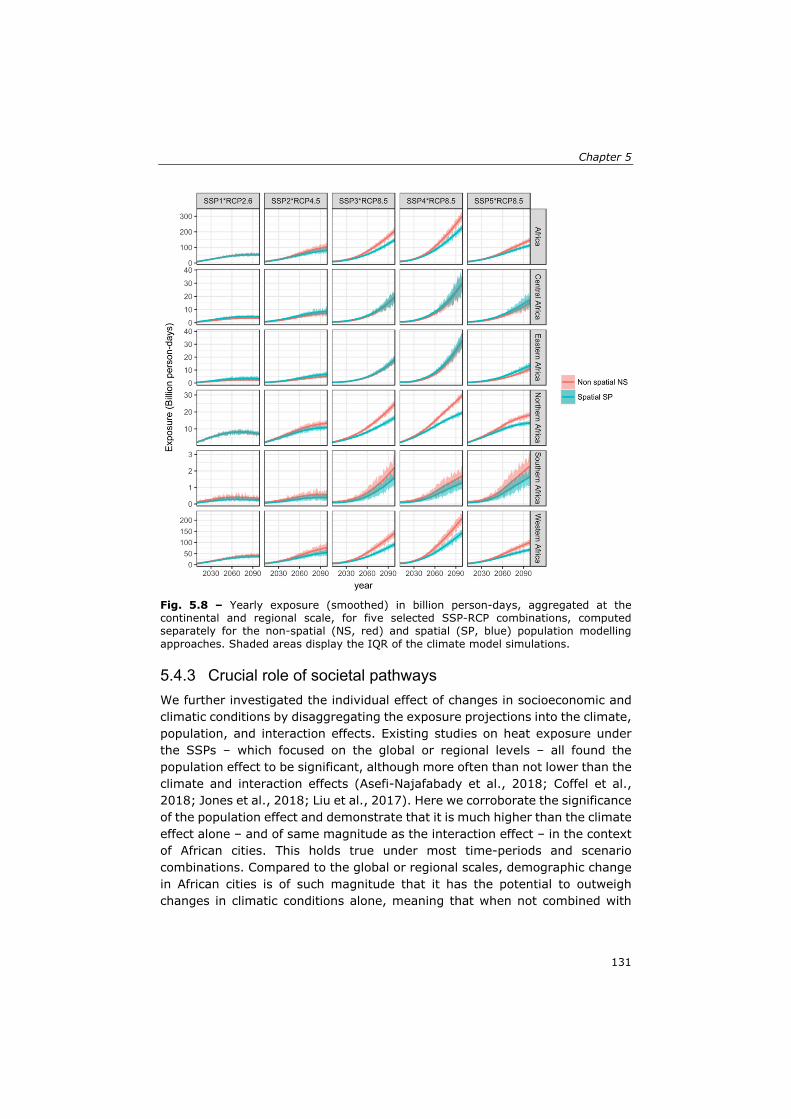
Chapter 5
131
Fig. 5.8 – Yearly exposure (smoothed) in billion person-days, aggregated at the continental and regional scale, for five selected SSP-RCP combinations, computed separately for the non-spatial (NS, red) and spatial (SP, blue) population modelling approaches. Shaded areas display the IQR of the climate model simulations.
5.4.3 Crucial role of societal pathways
We further investigated the individual effect of changes in socioeconomic and climatic conditions by disaggregating the exposure projections into the climate, population, and interaction effects. Existing studies on heat exposure under the SSPs – which focused on the global or regional levels – all found the population effect to be significant, although more often than not lower than the climate and interaction effects (Asefi-Najafabady et al., 2018; Coffel et al., 2018; Jones et al., 2018; Liu et al., 2017). Here we corroborate the significance of the population effect and demonstrate that it is much higher than the climate effect alone – and of same magnitude as the interaction effect – in the context of African cities. This holds true under most time-periods and scenario combinations. Compared to the global or regional scales, demographic change in African cities is of such magnitude that it has the potential to outweigh changes in climatic conditions alone, meaning that when not combined with
Projections of human exposure to dangerous heat in African cities
132
urban population growth, the increase in extreme-heat events has limited effect on future exposure to dangerous heat in most cases. Such a finding stresses the important role that urban population growth, and societal pathways more broadly, play in shaping future exposure to dangerous heat in African cities. We explored this role further by comparing the extent to which exposure could be avoided through shifts in socioeconomic or climatic pathways. The few existing studies that performed similar analysis found that a shift from a high to a low radiative forcing pathway led to greater reduction in exposure than a shift from a high to a low population growth pathway. This holds true at the global scale (Jones et al., 2018) but also (i) in the US, where Jones et al. (2015) found that a shift to a lower emission pathway or to a lower population growth pathway would reduce exposure by ~56% and ~45% respectively, (ii) in India, where Mishra et al. (2017) showed that a shift from high to low population growth has a lower influence on exposure than a shift from +2°C to +1.5°C, (iii) in Eastern Africa, where Harrington and Otto (2018) found that shifting from +2°C to +1.5°C would reduce exposure by ~81%, whereas shifting from a medium (SSP2) to low (SSP1) population growth pathway would reduce exposure by ~28%, and (iv) in North Africa/Middle East and Sub-Saharan Africa, where Jones et al. (2018) demonstrated that a shift from a high (SSP3) to low (SSP5) population growth pathway would lead to a lesser reduction in exposure than a shift from a high (RCP8.5) to low (RCP4.5) emission pathway (~33-39% vs ~47-57%). Our results – while not entirely comparable because based on different population projections, heat index, and scenarios range – differ slightly from those found in the literature in that a shift from a high to a low urban population growth pathway leads to a slightly greater reduction in exposure than a shift from a high to a low emission pathway (~51% vs ~48%). In other words, comprehensive socioeconomic and urban growth policies that would trigger the transition from a highly populous, urbanized, and regionally divided world (SSP4) to a less populous and highly equitable world (SSP1) may have the same influence on reduction in exposure to dangerous heat – at the continental scale – than very ambitious mitigation that would contain the global radiative forcing as low as RCP2.6 (instead of RCP8.5). The fact that we found the role of demographic change to be more influential than in existing studies is due to three different factors. First, we applied a fixed threshold (𝐴𝑇 > 40.6°C) to compute the 𝐻𝐼, whereas some of the existing studies employed relative thresholds (e.g. Coffel et al. 2018). When computed based on relative local thresholds of 𝐴𝑇 instead of a fixed threshold,
the 𝐻𝐼 differs significantly (Figure S5.14), particularly in regions where relative local thresholds are low (e.g. Southern and Central Africa) or very high (e.g.
Chapter 5
133
above 50°C). In most regions, the increase in a relative threshold-based 𝐻𝐼 from the historical to the future time-periods is from 2 to 10 times larger than that of the fixed threshold-based HI (Figure S5.15), hence resulting in a much stronger climate effect. Second, this study focuses on a particular type of environment – African cities – whereas existing studies considered a regionally (or globally) contiguous space. Since African cities are highly populated and are experiencing one of the highest population growth worldwide, the population effect in such areas is inevitably larger than it is in less populated and slower-growing regions. Third, we made use of the full range of SSPs – including a scenario of fast urbanization and high population growth (SSP4) –, whereas existing studies usually employed a subset of the five SSPs, e.g. SSP1/SSP2 in Harrington and Otto (2018). Using the five SSPs and/or including SSP4 (in the context of population growth in cities of developing countries) in the exposure assessment leads to a substantially larger difference in population outcomes – which partly determines the influence of shifts in SSPs on avoided exposure – than that of studies using less contrasted SSPs. It should also be noted that the degree to which we find the influence of demographic change on avoided exposure to be higher than that of climate change depends on the cities and scenarios considered. While the influence of socioeconomic pathways is reinforced in Western African cities – where the range of outcomes in future urban population size is much wider than the range of outcomes in dangerous heat conditions (which are already high in the historical period) –, it is of slightly lesser influence in Central and Eastern African cities where major changes in both urban population and dangerous heat are expected, and of minimal influence in Southern African cities where urban population growth is rather limited under all scenarios.
5.4.4 Vulnerability under the SSPs
African cities’ societal trajectories are not only important because they strongly influence future exposure to dangerous heat – through urban population growth –, but also because they shape future vulnerability of the urban populations (Rohat, 2018). Although we refrained from including vulnerability in this paper – as it is hardly quantifiable in a data-poor environment – we acknowledge the crucial role that it plays in leveraging future heat-related health risks in urban areas (IPCC, 2012) and altering mortality outcomes of extreme heat events in Africa (Burkart et al., 2014). Just as they lead to differing urban population sizes, the different SSPs lead to varying degrees of vulnerability, which has been shown to evolve over time (Rohat et al., 2019b; Sheridan and Allen, 2018). SSP1, depicting a world with high education, investments in health, social cohesion, effective institutions and rapid development and transfer of technology, would eventually lead to low vulnerability of African urban populations, further reducing the burden of heat-
Projections of human exposure to dangerous heat in African cities
134
related health risks, already limited due to a slow urban population growth. In contrast, SSP4, depicting unequal health investments and access to health facilities, low social cohesion and participation, low and unequal economic growth as well as inefficient institutions for the non-elites, would likely lead to a strong increase in vulnerability of African urban dwellers, worsening further heat-related health risks, already high to due to an exponential urban population growth.
5.4.5 Caveats
In addition to the specific limitations associated with the datasets that we employed – i.e. the urban extent delineations (IFPRI, 2015), the WUP estimates (United Nations, 2018), and the downscaled urban population projections (Gao, 2017) –, our two urban population modelling approaches also have their own drawbacks. Assuming that all the cities of a given country will share similar urbanization and population growth rate (under a given SSP), we neglected the different population dynamics of small-, mid-, and large-size cities (Birkmann et al., 2016). In addition, we excluded all drivers of urban population growth other than urbanization and demographic change, whereas recent research suggests that cities’ growth is highly correlated with private capital investment and that megacities need to be underpinned by mega-economies, which might not be the case for a number of African cities under some SSPs (Satterthwaite, 2017a). Future population projections that (i) account for both demographic and economic components (Li et al., 2019) and (ii) consider thresholds of population density and urban expansion – informed by spatial data on national borders, water bodies, slope, land cover, and protected areas – will likely improve our estimates of future urban population size. Another important component that is missing from our analysis is the urban heat island (UHI), which greatly increases surface temperature in the inner city – and in surrounding slums – during heat waves (Zhao et al., 2018), particularly in megacities (Papalexiou et al., 2018). Our estimates of exposure are therefore considered as conservative, as recent research suggests that the UHI – even under its current form – substantially increases future levels of exposure (Jones et al., 2018). Including the UHI in our analysis would be particularly useful to quantify the difference in heat exposure between urban and rural populations and to explore the impact of rural-urban migration on future exposure to extreme heat at the city scale. Nevertheless, accounting for the UHI in our analysis would require quantitative information on future urban land cover and morphologies under varying levels of socioeconomic development. While this has been achieved in a few local case studies (Houet et al., 2016; Lemonsu et al., 2015), it has yet to be conducted on a larger scale
Chapter 5
135
(e.g. multiple cities of a given region or continent) and in a data-poor environment. In addition, even though our sample of cities comprises ~53% of the current continental urban population and covers a wide range of city size across 43 different countries, it does not include cities with less than 300’000 inhabitants and is therefore biased towards large cities. Nonetheless, small and intermediate urban centers are likely to face similar heat-related health challenges to larger cities, as the former also showcase a fast urban population growth and deficits in urban infrastructure and governance (Birkmann et al., 2016; Satterthwaite, 2017b; Wisner et al., 2015). Furthermore, the reliability of the heat index that we employed is subject to a number of caveats. Combining daily maximum 𝑇 with daily mean 𝑅𝐻 to
compute 𝐴𝑇 may result in an overestimation of the 𝐻𝐼, as maximum 𝑇
typically occurs when 𝑅𝐻 is at its lowest value. Ideally, 𝐴𝑇 should be
computed from daily maximum 𝑇 combined with daily minimum 𝑅𝐻 – or at
best with simultaneous 𝑅𝐻 –, but such data is currently unavailable within the CORDEX-Africa climate simulations. In addition, by applying a fixed threshold (𝐴𝑇 > 40.6°C) to compute the 𝐻𝐼, any increase in 𝐴𝑇 over the threshold becomes irrelevant to our exposure assessment. This hinders the analysis of more extreme values of 𝐴𝑇, that are for instance associated with extreme
danger (when 𝐴𝑇 > 54°C). Due to the lack of epidemiological and in-situ evidence of heat-related mortality in Africa (Gasparrini et al., 2015a,b, 2017; Guo et al., 2018; Mora et al., 2017), it remains difficult to define appropriate local thresholds. Finally, the 𝐻𝐼 that we employed also does not account for the duration of the extreme heat event and for the minimum temperature during the night, which are both important determinants of heat-related health impacts (Li et al., 2015).
5.5 Conclusion Provided with estimates of future exposure under varying climate and socioeconomic scenarios, policy-makers can already grasp the extent to which urban populations will be impacted by dangerous heat in African cities, as well as pinpoint the kind of socioeconomic pathways that should be favored in order to mitigate heat-related health risks. Findings of this study therefore (i) raise awareness about the potential co-benefits – in terms of decrease in exposure to dangerous heat in urban areas and decline in vulnerability – of shifting toward a more sustainable, less populous, and less urbanized world, (ii) underline the necessity to mainstream climate change impacts and adaptation into spatial planning and urban development plans, and (iii) call for the
Projections of human exposure to dangerous heat in African cities
136
integration of population and urbanization policies into the wide range of potential climate adaptation options (Bongaarts and O’Neill, 2018) at the urban scale (Sheridan et al., 2012). Examples of such policies include educational and health investments to stimulate the demographic transition (KC and Lutz, 2017), incentives to establish economic activities in rural areas and to favor the growth of secondary cities (OECD, 2016; United Nations, 2016), and the strengthening of urban-rural linkages (UN-Habitat, 2015). Further studies focusing on a specific city and/or region would be better positioned to provide more concrete and context-based adaptation strategies to reduce future exposure to extreme heat (Filho et al., 2018). Particular attention should be paid to strengthening the implementation of adaptation strategies at the urban scale, which is often poor due to weak governance (Pelling et al., 2018). Further research is also needed to refine estimates of future heat-related health challenges, mainly by the use of improved methodologies to project future urban population growth – informed by projections of other socioeconomic parameters such as GDP and by a better delineation of future urban boundaries that account for geographic constraints such as slope, land cover, and protected areas – and by considering the current and future UHI and its influence on apparent temperature under different socioeconomic and climatic pathways (Georgescu et al., 2014). Future work should also aim at better characterizing the share of the population that is truly exposed to extreme heat – moving towards personal heat exposure research, which accounts for both indoor and outdoor environment and individual behaviors (Bernhard et al., 2015; Kuras et al., 2017). Finally, further research is certainly needed to go beyond exposure and to explore future vulnerability to heat under the different SSPs – employing the growing body of literature that extend and quantify the global SSPs’ narratives (e.g. Crespo Cuaresma et al., 2018; Kurniawan and Managi, 2018; Witmer et al., 2017) – and particularly their ability to shift the burden of heat-related health risks in African cities to lower levels, under varying degrees of exposure.

137
Chapter 6 Characterizing the role of socioeconomic pathways in shaping future urban heat-related challenges6
6This chapter is based on the article: Rohat G, Wilhelmi O, Flacke J, Monaghan A, Gao J, Dao H and van Maarseveen M (2019). Characterizing the role of socioeconomic pathways in shaping future urban heat-related challenges. Science of the Total Environment 695: 133941.
Characterizing the role of socioeconomic pathways
138
Abstract Urban dwellers worldwide are increasingly affected by more frequent and intense extreme temperature events, ongoing urbanization, and changes in socioeconomic conditions. Decades of research have shown that vulnerability is a crucial determinant of heat-related risk and mortality in cities, yet assessments of future urban heat-related challenges have largely overlooked the contribution of changes in socioeconomic conditions to future heat-related risk and mortality. The scenario framework for climate change research, made up of socioeconomic scenarios (Shared Socioeconomic Pathways – SSPs) combined with climate scenarios (Representative Concentration Pathways – RCPs), facilitates the integration of socioeconomic scenarios into climate risks assessments. In this study, we used Greater Houston (Texas) as a case study to implement the scenario framework at the intra-urban scale. Integrating locally extended SSPs along with a range of sectoral modeling approaches, we combined projections of urban extreme heat – which account for SSP-specific urban heat islands – with projections of future population and vulnerability. We then produced estimates of future heat-related risk and mortality for 2041-2060 (2050s) summers at Census tract level, for multiple combinations of climate and socioeconomic scenarios. Using a scenario matrix, we showed that the projected ~15,738 – 24,521 future summer excess mortalities compared to 1991-2010 are essentially driven by population growth and changes in vulnerability, with changes in climatic conditions alone being of little influence. We outline methods to apply the new scenario framework at intra-urban scale and to better characterize the contribution of socioeconomic pathways to future urban climate risks. This socio-climatic approach provides comprehensive estimates of future climate risks in urban areas, which are essential for adaptation planning under climatic and socioeconomic uncertainty.
Chapter 6
139
6.1 Introduction Extreme heat is a major cause of weather-related mortality worldwide (Guo et al., 2017; Hales et al., 2014). This is particularly the case in urban areas, where people and assets are concentrated (Romero-Lankao et al., 2012) and where extreme heat is further exacerbated by the characteristics of the built environment (Brazel et al., 2007; Li et al., 2017; Ward et al., 2016). Several studies have shown that heat-related deaths are unevenly distributed among the urban population, with a number of vulnerable groups being disproportionally impacted by extreme heat, such as elderly, low-income households, ethnic minorities, socially isolated persons, low-educated communities, and those with pre-existing medical conditions (e.g. Reid et al., 2009; Uejio et al., 2011; Wilhelmi and Hayden, 2010). Climate change will exacerbate extreme heat conditions worldwide (Mora et al., 2017), including in the United States (Oleson et al., 2018; Zobel et al., 2017). The metropolitan area of Houston, Texas (hereafter Greater Houston) is no exception; recent research suggests that climate change will lead to a large increase in high heat stress days and nights by the middle of twenty first century, in both urban and surrounding rural areas (Oleson et al., 2013). Greater Houston is particularly exposed to extreme heat events due to its (i) subtropical climate (warm and humid), (ii) rapidly increasing temperatures (Papalexiou et al., 2018), and (iii) intensifying urban heat island (UHI; Zhou et al., 2014), altogether causing excess in mortality every summer among the most vulnerable groups (Chien et al., 2016; Heaton et al., 2014; Zhang et al., 2015). In addition to changes in climatic conditions, Greater Houston is also facing drastic changes in socioeconomic conditions; it is one of the fastest growing metropolitan area of the country as well as one of the most increasingly diverse (Emerson et al., 2012). At the same time, the population is ageing as baby boomers enter into their senior years (HCAAA, 2016) and the social fabric is being transformed, with the growing income inequality, shrinking of the middle class, growing racial generation gap, increasing ethnic diversity in suburban areas, expanding urbanization, and increasing levels of education (PolicyLink, 2013). These trends will undoubtedly affect the future spatial distribution, characteristics, and size of the heat-vulnerable groups (Marsha et al., 2018) and will alter the future urban thermal characteristics – which in turn will influence future urban heat hazard (Conlon et al., 2016). Therefore, in order to better characterize future heat-related challenges in urban areas – such as in Greater Houston – it is crucial to explore how changes in both socioeconomic and climatic conditions will shape future patterns of vulnerability, heat hazard, and consequential mortality. Up until recently, the vast majority of assessments of future climate risks – including heat risk – were based on future climatic conditions superimposed on
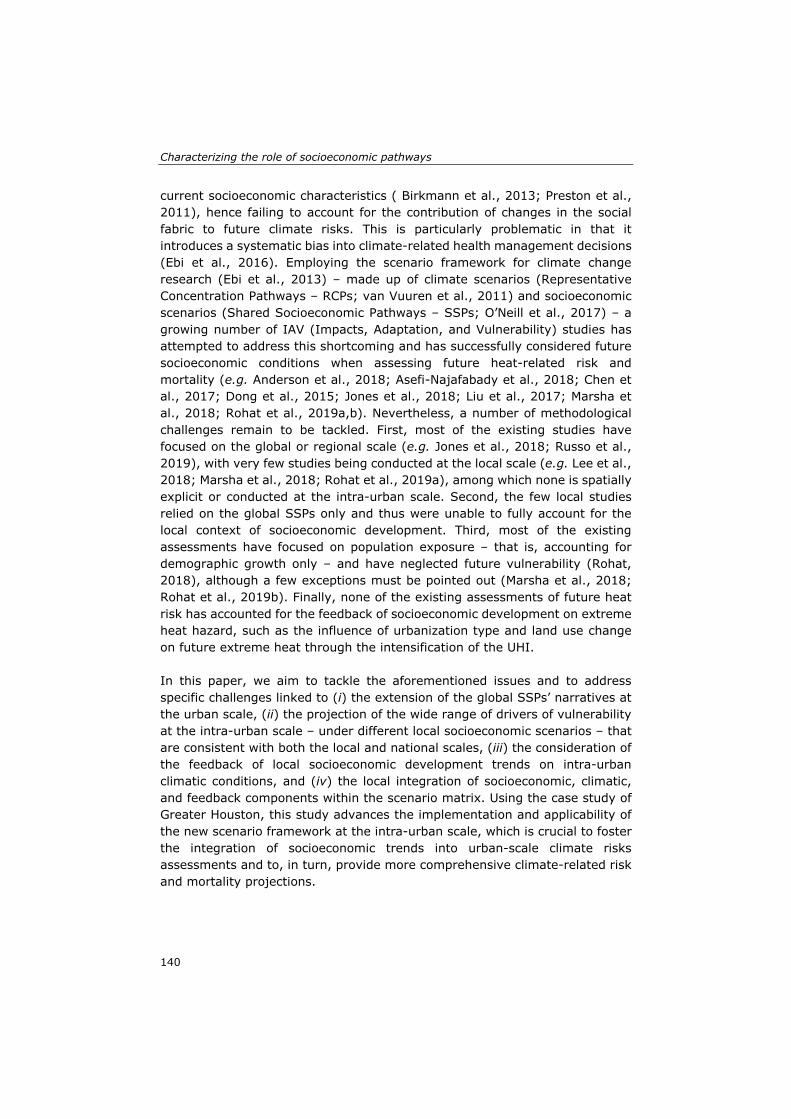
Characterizing the role of socioeconomic pathways
140
current socioeconomic characteristics ( Birkmann et al., 2013; Preston et al., 2011), hence failing to account for the contribution of changes in the social fabric to future climate risks. This is particularly problematic in that it introduces a systematic bias into climate-related health management decisions (Ebi et al., 2016). Employing the scenario framework for climate change research (Ebi et al., 2013) – made up of climate scenarios (Representative Concentration Pathways – RCPs; van Vuuren et al., 2011) and socioeconomic scenarios (Shared Socioeconomic Pathways – SSPs; O’Neill et al., 2017) – a growing number of IAV (Impacts, Adaptation, and Vulnerability) studies has attempted to address this shortcoming and has successfully considered future socioeconomic conditions when assessing future heat-related risk and mortality (e.g. Anderson et al., 2018; Asefi-Najafabady et al., 2018; Chen et al., 2017; Dong et al., 2015; Jones et al., 2018; Liu et al., 2017; Marsha et al., 2018; Rohat et al., 2019a,b). Nevertheless, a number of methodological challenges remain to be tackled. First, most of the existing studies have focused on the global or regional scale (e.g. Jones et al., 2018; Russo et al., 2019), with very few studies being conducted at the local scale (e.g. Lee et al., 2018; Marsha et al., 2018; Rohat et al., 2019a), among which none is spatially explicit or conducted at the intra-urban scale. Second, the few local studies relied on the global SSPs only and thus were unable to fully account for the local context of socioeconomic development. Third, most of the existing assessments have focused on population exposure – that is, accounting for demographic growth only – and have neglected future vulnerability (Rohat, 2018), although a few exceptions must be pointed out (Marsha et al., 2018; Rohat et al., 2019b). Finally, none of the existing assessments of future heat risk has accounted for the feedback of socioeconomic development on extreme heat hazard, such as the influence of urbanization type and land use change on future extreme heat through the intensification of the UHI. In this paper, we aim to tackle the aforementioned issues and to address specific challenges linked to (i) the extension of the global SSPs’ narratives at the urban scale, (ii) the projection of the wide range of drivers of vulnerability at the intra-urban scale – under different local socioeconomic scenarios – that are consistent with both the local and national scales, (iii) the consideration of the feedback of local socioeconomic development trends on intra-urban climatic conditions, and (iv) the local integration of socioeconomic, climatic, and feedback components within the scenario matrix. Using the case study of Greater Houston, this study advances the implementation and applicability of the new scenario framework at the intra-urban scale, which is crucial to foster the integration of socioeconomic trends into urban-scale climate risks assessments and to, in turn, provide more comprehensive climate-related risk and mortality projections.
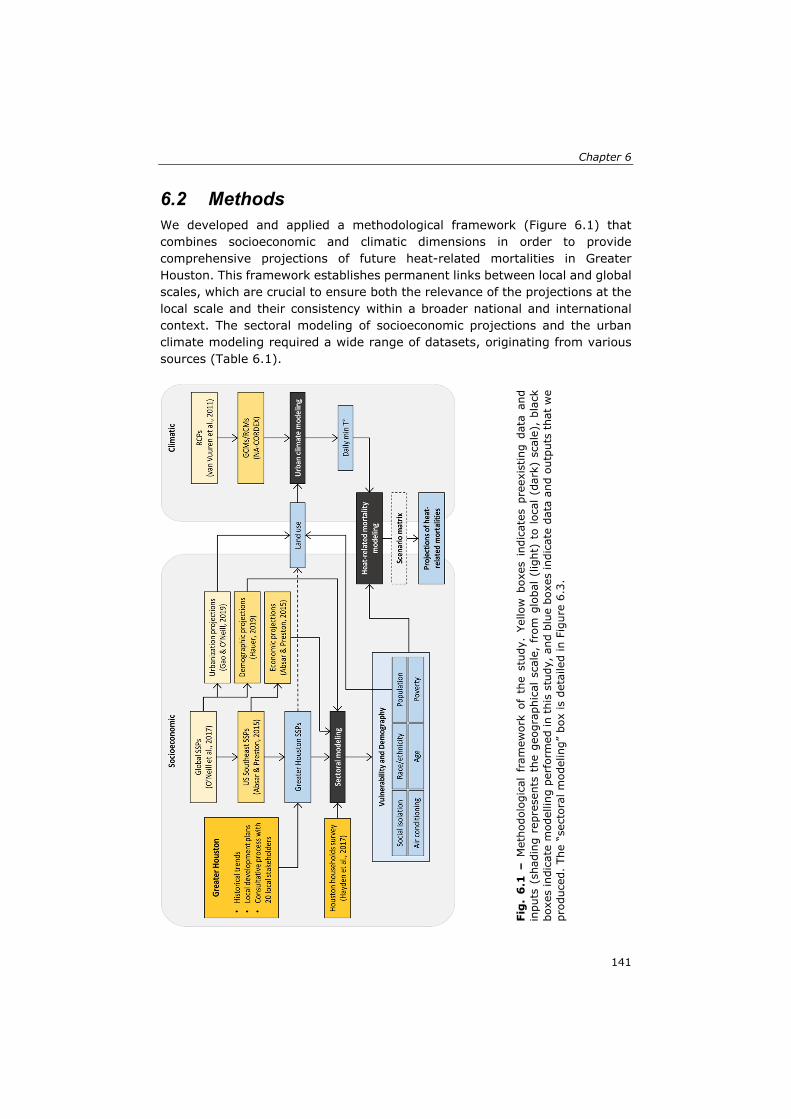
Chapter 6
141
6.2 Methods We developed and applied a methodological framework (Figure 6.1) that combines socioeconomic and climatic dimensions in order to provide comprehensive projections of future heat-related mortalities in Greater Houston. This framework establishes permanent links between local and global scales, which are crucial to ensure both the relevance of the projections at the local scale and their consistency within a broader national and international context. The sectoral modeling of socioeconomic projections and the urban climate modeling required a wide range of datasets, originating from various sources (Table 6.1).
Fig
. 6
.1 –
Met
hodo
logi
cal
fram
ewor
k of
the
stu
dy.
Yello
w b
oxes
ind
icat
es p
reex
istin
g da
ta a
nd
inpu
ts (
shad
ing
repr
esen
ts t
he g
eogr
aphi
cal sc
ale,
fro
m g
loba
l (l
ight
) to
loc
al (
dark
) sc
ale)
, bl
ack
boxe
s in
dica
te m
odel
ling
perf
orm
ed in
thi
s st
udy,
and
blu
e bo
xes
indi
cate
dat
a an
d ou
tput
s th
at w
e pr
oduc
ed.
The
“sec
tora
l mod
elin
g” b
ox is
det
aile
d in
Fig
ure
6.3.
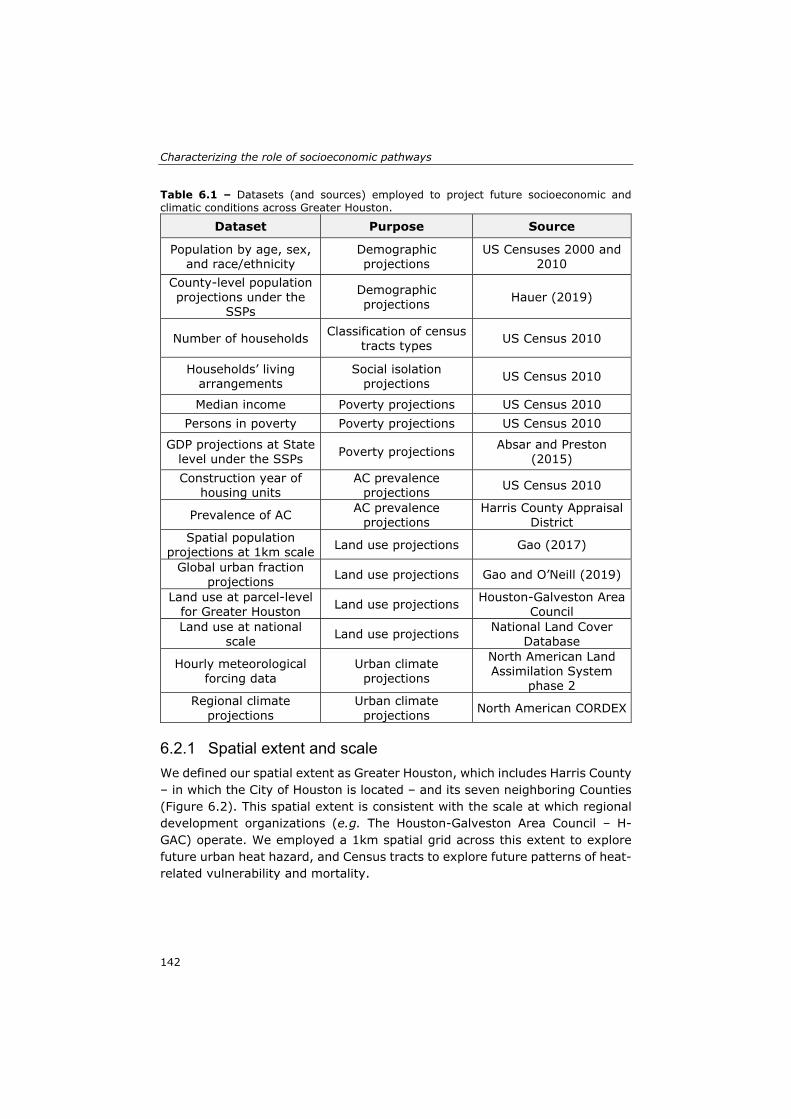
Characterizing the role of socioeconomic pathways
142
Table 6.1 – Datasets (and sources) employed to project future socioeconomic and climatic conditions across Greater Houston.
Dataset Purpose Source
Population by age, sex, and race/ethnicity
Demographic projections
US Censuses 2000 and 2010
County-level population projections under the
SSPs
Demographic projections Hauer (2019)
Number of households Classification of census tracts types US Census 2010
Households’ living arrangements
Social isolation projections US Census 2010
Median income Poverty projections US Census 2010 Persons in poverty Poverty projections US Census 2010
GDP projections at State level under the SSPs Poverty projections Absar and Preston
(2015) Construction year of
housing units AC prevalence
projections US Census 2010
Prevalence of AC AC prevalence projections
Harris County Appraisal District
Spatial population projections at 1km scale Land use projections Gao (2017)
Global urban fraction projections Land use projections Gao and O’Neill (2019)
Land use at parcel-level for Greater Houston Land use projections Houston-Galveston Area
Council Land use at national
scale Land use projections National Land Cover Database
Hourly meteorological forcing data
Urban climate projections
North American Land Assimilation System
phase 2 Regional climate
projections Urban climate
projections North American CORDEX
6.2.1 Spatial extent and scale
We defined our spatial extent as Greater Houston, which includes Harris County – in which the City of Houston is located – and its seven neighboring Counties (Figure 6.2). This spatial extent is consistent with the scale at which regional development organizations (e.g. The Houston-Galveston Area Council – H-GAC) operate. We employed a 1km spatial grid across this extent to explore future urban heat hazard, and Census tracts to explore future patterns of heat-related vulnerability and mortality.
Chapter 6
143
Fig 6.2 – Geographical extent of Greater Houston, its 8 Counties and its 1,067 Census tracts, and the spatial extent of the City of Houston.
6.2.2 Extension of the global SSPs for Greater Houston
The SSPs are global (O’Neill et al., 2017) and should be regionally and locally extended – i.e., contextualized (Kriegler et al., 2012) – to increase their suitability for regional studies (van Ruijven et al., 2014). A growing number of studies have developed extended SSPs for specific regions, e.g., the Mediterranean coast (Reimann et al., 2018), the Barents region (Nilsson et al., 2017), West Africa (Palazzo et al., 2017), Tokyo (Kamei et al., 2016), Europe (Rohat et al., 2018; Kok et al., 2019), Boston (Lino et al., 2019), and the US Southeast (Absar and Preston, 2015). Although regional extensions of the SSPs are mainly stand-alone publications, we consider as critical to include the scenario development step in this paper in order to provide a comprehensive and complete approach to assess future climate risks in urban areas under multiple plausible futures (that is, from the design of the scenarios to the assessment of future climate impacts). Existing methods to develop extended SSPs fall into three broad categories: (1) scenario development based on a highly participatory process with a strong bottom-up approach (e.g. Nilsson et al., 2017; Palazzo et al., 2017); (2) scenario development based on review of historical trends and existing scenarios, with no stakeholders or local experts involved (e.g. Absar and Preston, 2015; Mogollón et al., 2018; Reimann et al., 2018); and (3) a mix of the two above approaches, with scenario development based on review of
Characterizing the role of socioeconomic pathways
144
historical trends and existing scenarios, and subsequently refined through an iterative process with key local experts using individual interviews and/or questionnaires (e.g. Kamei et al., 2016; Kok et al., 2019). In this study, we employed the latter approach to develop extended SSPs for Greater Houston (hereafter H-SSPs) for the 2050s. The mid-century time-horizon is aligned with the vast majority of existing development plans and scenarios in Houston and in Texas (e.g. City of Houston, 2018; H-GAC, 2018; Lieberknecht, 2018; WHA, 2018). Informed by Greater Houston’s specific socioeconomic characteristics, historical trends, local development plans (e.g. City of Houston, 2018; H-GAC, 2018; Lieberknecht, 2018; WHA, 2018), and existing extended SSPs for the US Southeast (Absar and Preston, 2015), we extended four global SSPs – SSP1, SSP2, SSP3, and SSP5 – to Greater Houston for the 2050s and contextualized them for heat-related health challenges. We did not extend SSP4 because we largely relied on the four existing extended SSPs for US Southeast, which omitted SSP4 due to its low plausibility in developed countries such as the US. It is worth noting that a few specific aspects of the H-SSPs were found to diverge from the underlying global SSPs. We viewed these discrepancies as inevitable to ensure the local relevance and the internal consistency of the H-SSPs. For instance, while the social policies and capital increase globally under SSP5, we found them to be static under H-SSP5, due to the business-oriented focus of the local government depicted under this scenario. After having produced a first set of detailed narratives along with a synthesized table of trends, we engaged with local stakeholders to refine the scenarios and to create an ownership of the H-SSPs, which is crucial to ensure their saliency and legitimacy. We followed the stepwise approach suggested by Knol et al. (2010) and performed a transparent elicitation process in which we obtained feedbacks from 20 local stakeholders through an online survey (Text S6.1) with questions about the local relevance, pertinence, and internal consistency of the scenarios. Study participants were identified based on their professional experience on exploring current and future socioeconomic and urban-related patterns of development in Greater Houston. In particularly, we identified (i) generalists, i.e., those who have a multidisciplinary experience in the development of future socioeconomic trends and scenarios for Greater Houston, (ii) subject-matter experts, i.e., those who have a professional expertise of future trends and development in a given field, such as demography, urban planning, economy, and (iii) normative experts, i.e., those who have practical experience and knowledge about the socioeconomic dynamics and the environmental-related health issues in Houston area, but do not have extensive experience in future planning. The expert list was created through the review of peer-reviewed literature, grey literature (local, state and
Chapter 6
145
regional government reports), online documents, and websites of organizations operating in Greater Houston. Some experts/stakeholders were participants in previous stakeholder workshops on heat and health (Wilhelmi and Hayden, 2016). Out of the 78 invited experts, 20 filled the online survey. They represent the City of Houston, Harris County, regional government, regional organizations, NGOs, and academia, with various expertise in public health, demography, socioeconomic modeling, transportation planning, health equity, emergency management, and urban planning. Using the individual and aggregated results of the online survey (Figure S6.1), we subsequently revised the narratives and the table of qualitative trends to produce the final set of H-SSP narratives (Text S6.2) and trends (Table 6.2). The individual, qualitative suggestions (which are bound to a confidentiality agreement) on ways to improve both the consistency and policy-relevance of the scenarios proved to be the most useful to revise the scenarios’ narratives. It is worth mentioning that 40% of the stakeholders considered that one (or several) policy-relevant scenarios were missing from the original set of H-SSPs. Nevertheless, the majority of stakeholders (80-90%) considered the H-SSPs to be policy-relevant (Figure S6.1). We therefore decided not build other scenarios outside of the SSP framework, in order to restrain the number of scenarios and to anchor this study within the global SSP-RCP framework.
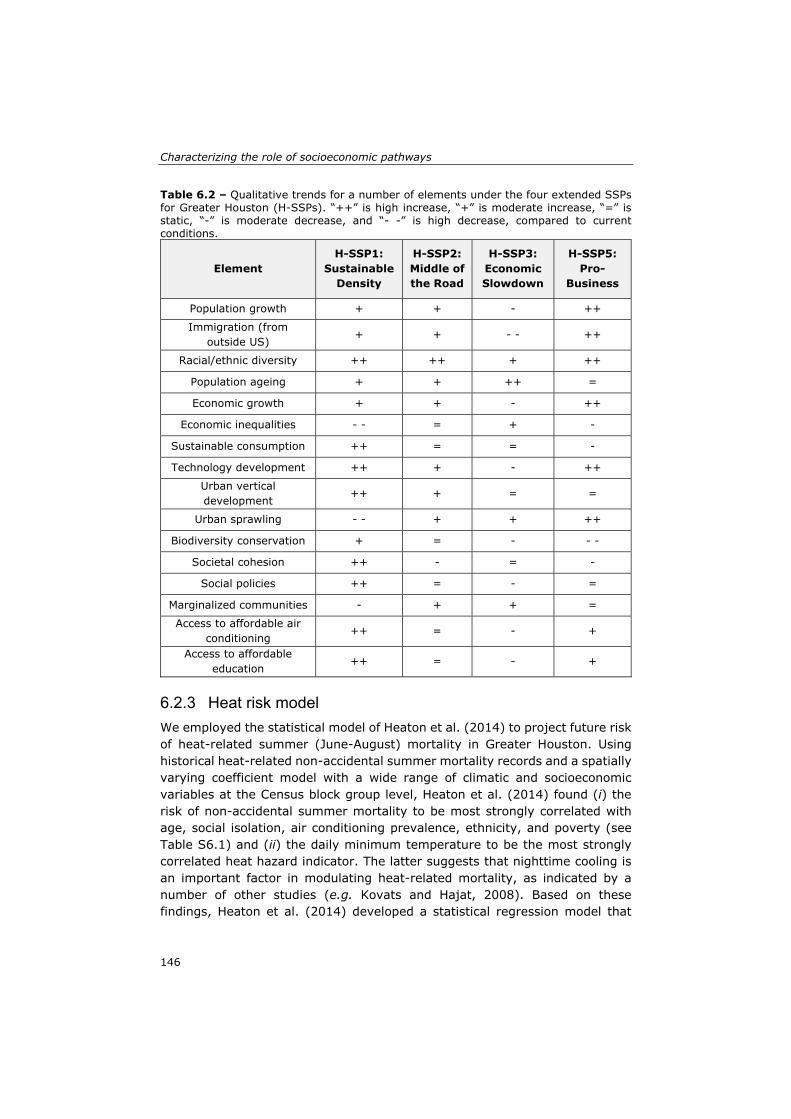
Characterizing the role of socioeconomic pathways
146
Table 6.2 – Qualitative trends for a number of elements under the four extended SSPs for Greater Houston (H-SSPs). “++” is high increase, “+” is moderate increase, “=” is static, “-” is moderate decrease, and “- -” is high decrease, compared to current conditions.
Element H-SSP1:
Sustainable Density
H-SSP2: Middle of the Road
H-SSP3: Economic Slowdown
H-SSP5: Pro-
Business
Population growth + + - ++
Immigration (from outside US)
+ + - - ++
Racial/ethnic diversity ++ ++ + ++
Population ageing + + ++ =
Economic growth + + - ++
Economic inequalities - - = + -
Sustainable consumption ++ = = -
Technology development ++ + - ++
Urban vertical development
++ + = =
Urban sprawling - - + + ++
Biodiversity conservation + = - - -
Societal cohesion ++ - = -
Social policies ++ = - =
Marginalized communities - + + =
Access to affordable air conditioning
++ = - +
Access to affordable education
++ = - +
6.2.3 Heat risk model
We employed the statistical model of Heaton et al. (2014) to project future risk of heat-related summer (June-August) mortality in Greater Houston. Using historical heat-related non-accidental summer mortality records and a spatially varying coefficient model with a wide range of climatic and socioeconomic variables at the Census block group level, Heaton et al. (2014) found (i) the risk of non-accidental summer mortality to be most strongly correlated with age, social isolation, air conditioning prevalence, ethnicity, and poverty (see Table S6.1) and (ii) the daily minimum temperature to be the most strongly correlated heat hazard indicator. The latter suggests that nighttime cooling is an important factor in modulating heat-related mortality, as indicated by a number of other studies (e.g. Kovats and Hajat, 2008). Based on these findings, Heaton et al. (2014) developed a statistical regression model that
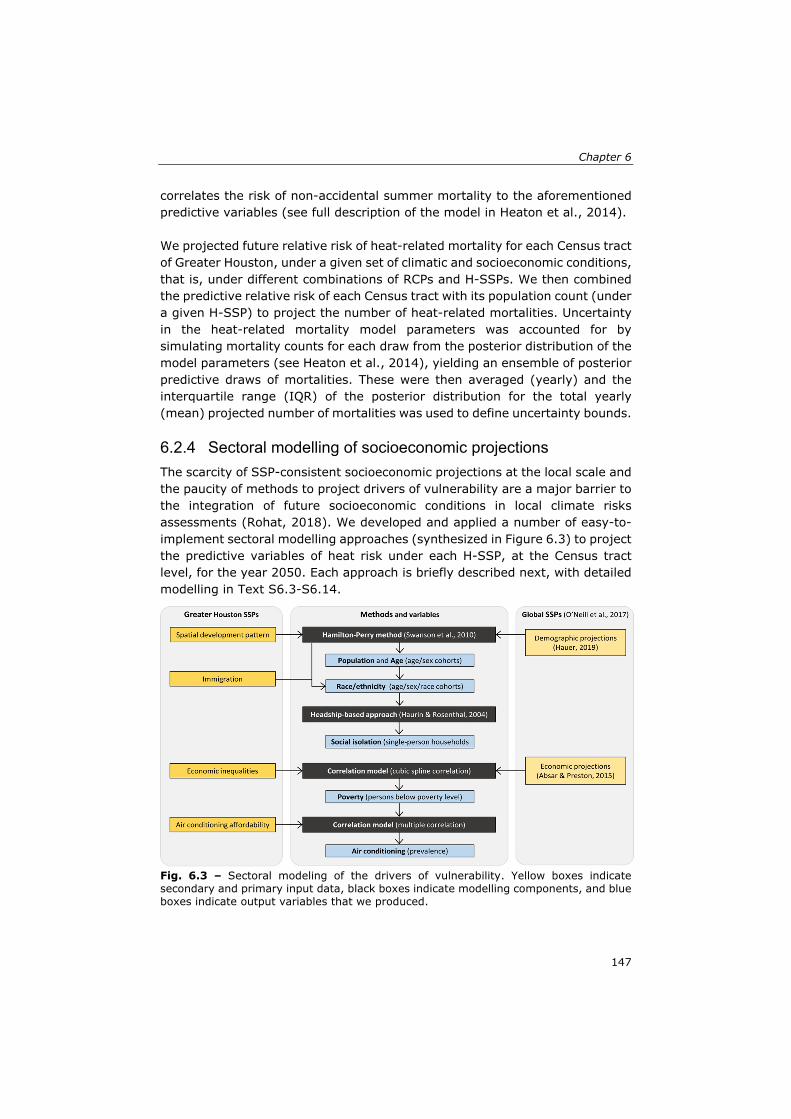
Chapter 6
147
correlates the risk of non-accidental summer mortality to the aforementioned predictive variables (see full description of the model in Heaton et al., 2014). We projected future relative risk of heat-related mortality for each Census tract of Greater Houston, under a given set of climatic and socioeconomic conditions, that is, under different combinations of RCPs and H-SSPs. We then combined the predictive relative risk of each Census tract with its population count (under a given H-SSP) to project the number of heat-related mortalities. Uncertainty in the heat-related mortality model parameters was accounted for by simulating mortality counts for each draw from the posterior distribution of the model parameters (see Heaton et al., 2014), yielding an ensemble of posterior predictive draws of mortalities. These were then averaged (yearly) and the interquartile range (IQR) of the posterior distribution for the total yearly (mean) projected number of mortalities was used to define uncertainty bounds.
6.2.4 Sectoral modelling of socioeconomic projections
The scarcity of SSP-consistent socioeconomic projections at the local scale and the paucity of methods to project drivers of vulnerability are a major barrier to the integration of future socioeconomic conditions in local climate risks assessments (Rohat, 2018). We developed and applied a number of easy-to-implement sectoral modelling approaches (synthesized in Figure 6.3) to project the predictive variables of heat risk under each H-SSP, at the Census tract level, for the year 2050. Each approach is briefly described next, with detailed modelling in Text S6.3-S6.14.
Fig. 6.3 – Sectoral modeling of the drivers of vulnerability. Yellow boxes indicate secondary and primary input data, black boxes indicate modelling components, and blue boxes indicate output variables that we produced.
Characterizing the role of socioeconomic pathways
148
6.2.4.1 Demographic projections
We employed the Hamilton-Perry method (Swanson et al., 2010) to project population and age structure at the Census tract level. This method is a fairly common alternative to the cohort-component method (Hauer, 2019) and only requires population counts by cohorts at two different time steps (e.g. the two most recent Census counts), hence making it an appropriate approach for demographic projections at the Census tract level. Noteworthy, this method should be accompanied with controlling factors (e.g. controlled by independent projections made at a higher spatial resolution) and limiting factors (maximum and minimum values of annual population growth/decline) to avoid unrealistically high (low) projections in rapidly growing (declining) places and in small-size cohorts (Hardy and Hauer, 2018). We first applied the Hamilton-Perry method with the two most recent US decadal Censuses, 2000 and 2010 – whose boundaries are normalized beforehand using the Longitudinal Tract Database’s conversion tool (Logan et al., 2014) – to project future decadal population counts in each Census tract for different age-sex cohorts (see Text S6.3). Second, to account for the different spatial patterns of population growth depicted under the H-SSPs, we (i) classified the Census tracts into three different types – namely urban, suburban, and rural (Kolko, 2015; Ybarra, 2017; see Text S6.3) – and (ii) subsequently applied a rescaling (which retains the demographic structure, i.e., the distribution of age-sex cohorts) with H-SSP- and Census tract type-specific limits of annual population growth over the period 2010-2050 in order to account for the H-SSP-specific assumptions of spatial development (see Text S6.4). As an example, limits of population growth in urban and rural Census tracts are set high and low respectively under H-SSP1 (which depicts a highly densified city, hence high population growth in urban areas and low growth in rural areas), and oppositely under H-SSP5 (which depicts a highly sprawling city). Third, to ensure the consistency of the resulting age-sex cohort projections with the national population projections under the global SSPs (KC and Lutz, 2017), we applied a second rescaling, using the SSPs’ county-level population projections developed by Hauer (2019) as higher-level control projections (see Text S6.5). This final rescaling ensures the quantitative consistency of our H-SSP-specific projections with the national SSP projections while preserving the underlying age structures, sex ratios, and spatial patterns of our projections. As for projections of race/ethnicity, we first defined four different race/ethnicity groups – White, Black, Hispanic, and Other – and retrieved from the US Census Bureau the Census-tract level population counts for each age-sex-race/ethnicity (ASRE) cohort for year 2000 and 2010. We then applied the
Chapter 6
149
Hamilton-Perry method with H-SSP- and race/ethnicity group-specific limits of population growth (based on the assumptions of immigration depicted in the scenarios) to project ASRE cohorts for each Census tract under the different H-SSPs (see Text S6.6).
6.2.4.2 Social isolation and poverty projections
We employed a headship-based approach (Bachman and Barua, 2015; Haurin and Rosenthal, 2004; McCue and Herbert, 2016) to project the future share of single-person households at the Census tract level (procedure fully detailed in Text S6.7). To project the future share of persons below poverty, we employed a correlation model (in form of a cubic smoothing spline) that correlates poverty levels with median income (see Text S6.8). Such a correlation model has already been applied in Houston (Marsha et al., 2018). Current estimates of households’ income and persons in poverty at the Census tract-level from the US Census Bureau, which uses different poverty thresholds based on the family size and composition (US Census Bureau, 2018). Historical trends show that the increase in median income is much smaller than the increase in GDP per capita – effect known as the decoupling between wage growth and productivity growth (Kenworthy, 2018) – partly owing to the increasing income inequality in the US (Nolan et al., 2018; Pessoa and Van Reenen, 2011). Considering the assumptions on economic inequalities depicted in both the global SSPs (Rao et al., 2019) and the H-SSPs, we established different assumptions of decoupling under the H-SSPs (see Text S6.9). Combining these assumptions with SSP-consistent projections of economic growth for the state of Texas – obtained from Absar and Preston (2015) – we computed future growth in median income in Greater Houston under each H-SSP. Assuming the growth in median income to be homogeneously spread across the region, we then projected the median income of households at the Census tract level for each H-SSP and subsequently used these projections as inputs into the correlation model to project the future share of persons below poverty at the Census tract level for each H-SSP.
6.2.4.3 Air conditioning projections
We acquired air conditioning (AC) data spanning 2005-2018 from the parcel-level tax-assessor database of the Harris County Appraisal District website (http://pdata.hcad.org/index.html). At the regional scale, the proportion of households without central AC (hereafter %NOAC) gradually decreases from ~16.3% in 2005 to ~10.4% in 2018, mainly because almost all (~97%) of the new construction in Greater Houston is equipped with central AC.
Characterizing the role of socioeconomic pathways
150
We correlated %NOAC with the households’ annual income and the proportion of housing units built after 1960. The resulting correlation model accurately predicted historical observed %NOAC (see Text S6.10). We then employed this correlation model to approximate current (2010) %NOAC in all Census tracts located outside Harris County – using Census tract-level data of income and ages of buildings from the US Census Bureau – and then employed H-SSP-specific projections of households’ annual income and projections of housing stock (see Text S6.11) as inputs into the correlation model to project %NOAC by Census tract for each H-SSPs for year 2050. An important distinction has to be made between the prevalence of AC and the ability of a given household to use AC, as households equipped with central AC may not necessarily have the financial resources to run it. To account for this aspect, we used results from a recent survey on adaptive capacity to heat stress in Houston (Hayden et al., 2017) – which showed that ~21% of households with total annual income less than $20,000 were not able to use AC because of its cost – and subsequently corrected the %NOAC projections, integrating H-SSP-specific assumptions in access to affordable AC (see Text S6.12).
6.2.5 Land use projections
Urban land use is an essential determinant of Greater Houston’s urban heat island (UHI; Conlon et al., 2016), and therefore we projected 2050 land use under each H-SSP on a ~1-km spatial grid (0.01°), to serve as inputs to the urban climate projections (see section 6.2.6.). We first disaggregated the Census tract-level population projections (depicted in section 6.2.4.1.) to the 1-km spatial grid, using 1-km global population projections under the global SSPs (Gao, 2017) as spatial weights. The disaggregated population projections then served as inputs to downscale existing 1/8° SSP-consistent global projections of urban land fraction (Gao and O'Neill, 2019). The downscaling process used the same spatial allocation algorithm as described in Gao and O'Neill (2019) to distribute Greater Houston’s area projected urban fraction change to the 1-km spatial grid (see Text S6.13). Using a parcel-level dataset of current land use for Greater Houston and a set of classification and transitions rules (see Text S6.14), we then translated the projections of urban fraction into projections of land use class. As a result of this process, each 1-km grid cell was associated with one of the four urban land use classes required for the urban climate projections (Monaghan et al., 2014), namely high density urban, low density urban, commercial urban, or vegetated.
Chapter 6
151
6.2.6 Urban climate projections
Historical daily minimum temperatures in Greater Houston were simulated using an offline version (i.e., uncoupled to an atmospheric model) of Noah land surface model (Chen and Dudhia, 2001) known as the High Resolution Land Data Assimilation System (HRLDAS; Chen et al., 2007). HRLDAS is coupled with a 1-layer urban canopy model (UCM) – a column model of energy and exchange between the urban surface and the atmosphere that differentiates three different land use classes and vegetation (Chen et al., 2011; Kusaka et al., 2001) – to approximate the UHI effect across Greater Houston. Baseline and projections of (i) urban fraction and (ii) urban land use class on the 1-km computational grid (depicted in section 2.5.) served as inputs to HRLDAS, which was driven at the upper boundary by hourly meteorological forcing data from phase 2 of the North American Land Assimilation System (NLDAS-2; Xia et al., 2012) for the period 1991-2010. Our computationally efficient process for projecting future high-resolution daily minimum temperature (Tmin) across Greater Houston and different climate scenarios (RCPs) and land use scenarios (H-SSPs) follows the methodology used in three recent studies conducted on Greater Houston (Conlon et al., 2016; Marsha et al., 2018; Monaghan et al., 2014). First, we employed the HRLDAS model – which was evaluated by Monaghan et al. (2014) over Greater Houston – forced with NLDAS-2 data for the period 1991-2010 to simulate the daily minimum temperature for June-August assuming historical or future H-SSP-specific urban land use. This first step yielded five sets of historical daily minimum temperatures for the summer months from 1991 to 2010 that account for Greater Houston’s current or future H-SSP-specific urban land use. Second, to project future minimum temperatures for the period centered on 2050 (aligned with the time-horizon of the projections of socioeconomic and demographic conditions), we retrieved simulations of daily minimum temperatures (averaged for Greater Houston) during the summer months of the historical period 1991-2010 and the future period 2041-2060 (i.e., 2050s), under RCP4.5 and RCP8.5 scenarios (representing respectively low and business-as-usual emissions), from 15 different regional climate model (RCM) simulations (see Table S6.2) conducted as part of the North-American CORDEX experiment (Mearns et al., 2017). Daily deltas were then computed by subtracting the daily temperatures for 2041-2060 from those for 1991-2010, for each RCM simulation. Third, we downscaled the daily deltas to the 1-km grid using the statistical downscaling procedure described in Marsha et al. (2018) (see Text S6.15). The procedure was applied to all possible combinations of RCMs, RCPs, and HRDLAS simulations, including combinations with current land use. The latter enables
Characterizing the role of socioeconomic pathways
152
isolating the sole influence of climate change on future heat-related mortality (see section 6.2.7.). Finally, we averaged the 1-km daily climate projections into Census tract-level projections, using the corresponding 1-km population projections as spatial weights.
6.2.7 Integrated heat-related mortality assessment
We integrated the aforementioned socioeconomic, land use, and climatic projections into the existing heat risk model (section 6.2.3.) to compute future heat-related mortality counts for the historical period (1991-2010, with baseline (year 2010) socioeconomic conditions) and for mid-century (2041-2060, with socioeconomic conditions set on that of the year 2050) under a number of combinations of socioeconomic and climate scenarios (hereafter named H-SSP-RCP). We discarded the inconsistent H-SSP-RCP combination (H-SSP1-RCP8.5) and employed the remaining seven combinations. Mortalities were computed at the Census tract-level for each summer and each RCM projection, and subsequently averaged into 20-year multi-model mean summer mortalities per Census tract. We made use of the full scenario matrix (Kriegler et al., 2012) and of different combinations of changes in land use and in socioeconomic and climatic conditions to disentangle the individual contribution of each driver of heat-related mortality (hereafter called climate, vulnerability, population, and urbanization effects) as well as the contribution of certain combinations, e.g., the combined climate and urbanization effect (Table 6.3). The climate effect refers to RCPs-driven changes in daily minimum temperature, the vulnerability effect refers to SSPs-driven changes in socioeconomic predictive variables described in the mortality model (that is, social isolation, shares of elderly and young, AC prevalence, race/ethnicity, and poverty), the population effect refers to SSPs-driven changes in size of the population, and the urbanization effect refers to SSPs-driven changes in daily minimum temperature due to land use change. We also computed the interaction effect, defined as the difference between the mortalities resulting from the integrated experiments and the sum of the mortalities resulting from the climate, vulnerability, population, and urbanization effects experiments.
Chapter 6
153
Table 6.3 – List of experiments conducted to disentangle the individual and combined contribution of each driver of heat-related mortality. Note that experiments involving RCPs are conducted for RCP4.5 and RCP8.5, experiments involving H-SSPs are conducted for all four H-SSPs, and experiments involving both RCPs and H-SSPs are conducted for all combinations listed in the text.
Experiment Climate Vulnerability Population Land use
Historical Historical Baseline Baseline Baseline
Climate effect RCPs Baseline Baseline Baseline
Vulnerability effect Historical H-SSPs Baseline Baseline
Population effect Historical Baseline H-SSPs Baseline
Urbanization effect Historical Baseline Baseline H-SSPs
Combined climate/urbanization effects
RCPs Baseline Baseline H-SSPs
Combined vulnerability/population
effects Historical H-SSPs H-SSPs Baseline
Integrated assessment RCPs H-SSPs H-SSPs H-SSPs
6.3 Results
6.3.1 Demographic growth and future vulnerability
Driven by high immigration under H-SSP5, the Greater Houston population nearly triples to 14.9 million people (M) in 2050, compared to 5.9M in 2010 (Figure 6.4a). Conversely, limited by a decrease in immigration due to unfavorable economic conditions, the population grows more slowly under H-SSP3, reaching 10.4M in 2050. Scenarios differ not only in terms of demographic growth, but also in terms of spatial patterns of population distribution (Figure 6.4b). While the population growth is concentrated in existing urban and suburban areas under H-SSP1 – due to a high increase in urban vertical development and the enforcement of strict zoning regulations to drastically limit urban land take – it is spread across the whole region under H-SSP5 (and under H-SSP3 to some extent, but limited by lower population growth) due to the absence of regulations. The contrast with other scenarios is particularly noticeable in Counties that are currently rural, such as Brazoria County; e.g., the population of the latter grows from 0.3M in 2010 to 1.4M in 2050 under H-SSP5, as opposed to 0.5-0.8M under the other H-SSPs (Figure S6.2). Due to the ageing of the existing population, the proportion of elderly (65 years and older) shows a large increase under all H-SSPs, shifting from ~7.7% in 2010 to ~19.3-21.9% in 2050 depending on the scenario, with H-SSP1 leading to the highest proportion of elderly at the regional scale and in most Counties.
Characterizing the role of socioeconomic pathways
154
Ageing is slightly tempered under H-SSP5 by the high immigration, which is mostly driven by families of Hispanic and Asian descent. In line with an ageing society, the share of persons living alone increases, as elderly are more likely to live alone. Because immigration is mostly driven by persons of Hispanic and Asian descent, the share of African-Americans decreases across Greater Houston in all scenarios, shifting from ~17% in 2010 to ~12.5% in 2050 under all scenarios, with the exception of H-SSP3 (~15%), which depicts slower immigration due to unfavorable economic conditions. Notably, there are large spatial disparities in the share of African-Americans among Census tracts, with a number of urban Census tracts being predominantly African-American (Figure S6.3). Poverty decreases under all scenarios, but shows large disparities across the scenarios and the Census tracts (Figure 6.4b). The lowest decrease in poverty is projected under H-SSP3 due to both slow economic growth and a large increase in economic inequality. Conversely, H-SSP1 and H-SSP5 lead to the largest decrease in poverty, thanks to a large decrease in inequality and strong economic growth respectively. In H-SSP2 and H-SSP3, large pockets of poverty persist, particularly in urban Census tracts located in northern and southeastern parts of the City of Houston. Finally, the share of households without central AC decreases in all scenarios, mainly driven by the systematic installation of central AC in all newly constructed buildings. Nevertheless, there remain a number of urban Census tracts within Harris County that have more than half of households unequipped with central AC, mainly owing to the minimal number of new buildings constructed in those already highly urbanized Census tracts, and further worsened under H-SSP3 by a large decrease in access to affordable AC.
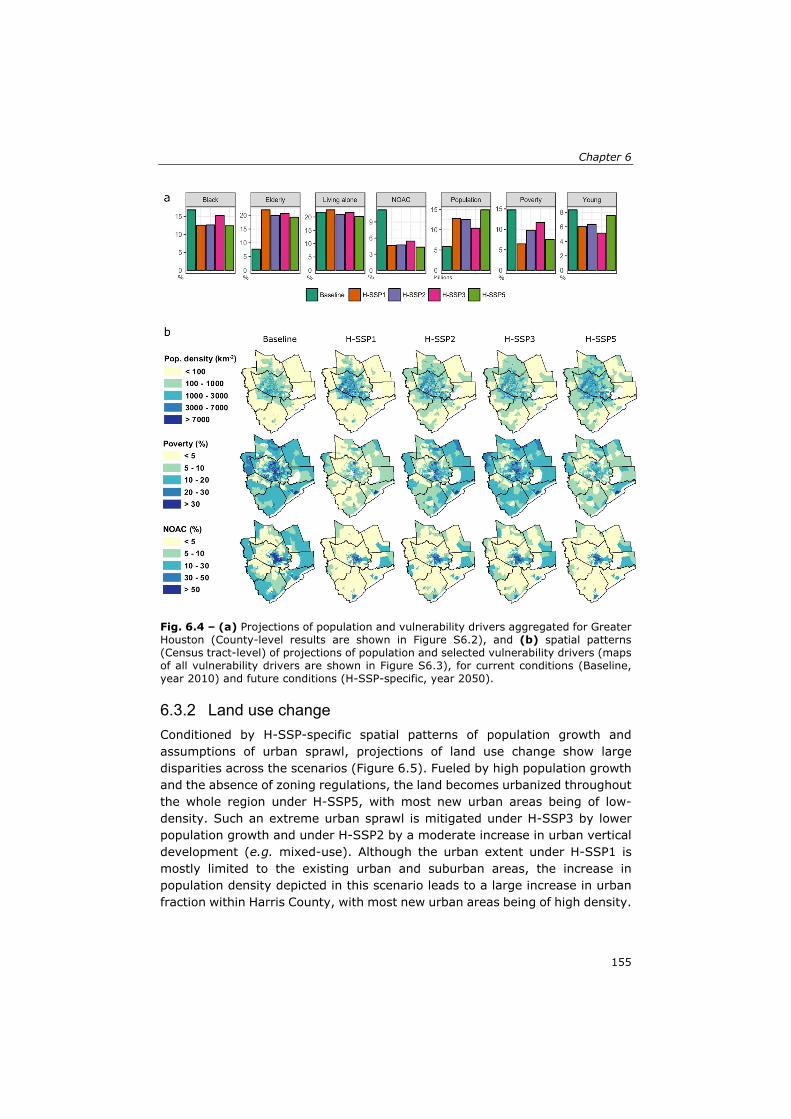
Chapter 6
155
Fig. 6.4 – (a) Projections of population and vulnerability drivers aggregated for Greater Houston (County-level results are shown in Figure S6.2), and (b) spatial patterns (Census tract-level) of projections of population and selected vulnerability drivers (maps of all vulnerability drivers are shown in Figure S6.3), for current conditions (Baseline, year 2010) and future conditions (H-SSP-specific, year 2050).
6.3.2 Land use change
Conditioned by H-SSP-specific spatial patterns of population growth and assumptions of urban sprawl, projections of land use change show large disparities across the scenarios (Figure 6.5). Fueled by high population growth and the absence of zoning regulations, the land becomes urbanized throughout the whole region under H-SSP5, with most new urban areas being of low-density. Such an extreme urban sprawl is mitigated under H-SSP3 by lower population growth and under H-SSP2 by a moderate increase in urban vertical development (e.g. mixed-use). Although the urban extent under H-SSP1 is mostly limited to the existing urban and suburban areas, the increase in population density depicted in this scenario leads to a large increase in urban fraction within Harris County, with most new urban areas being of high density.
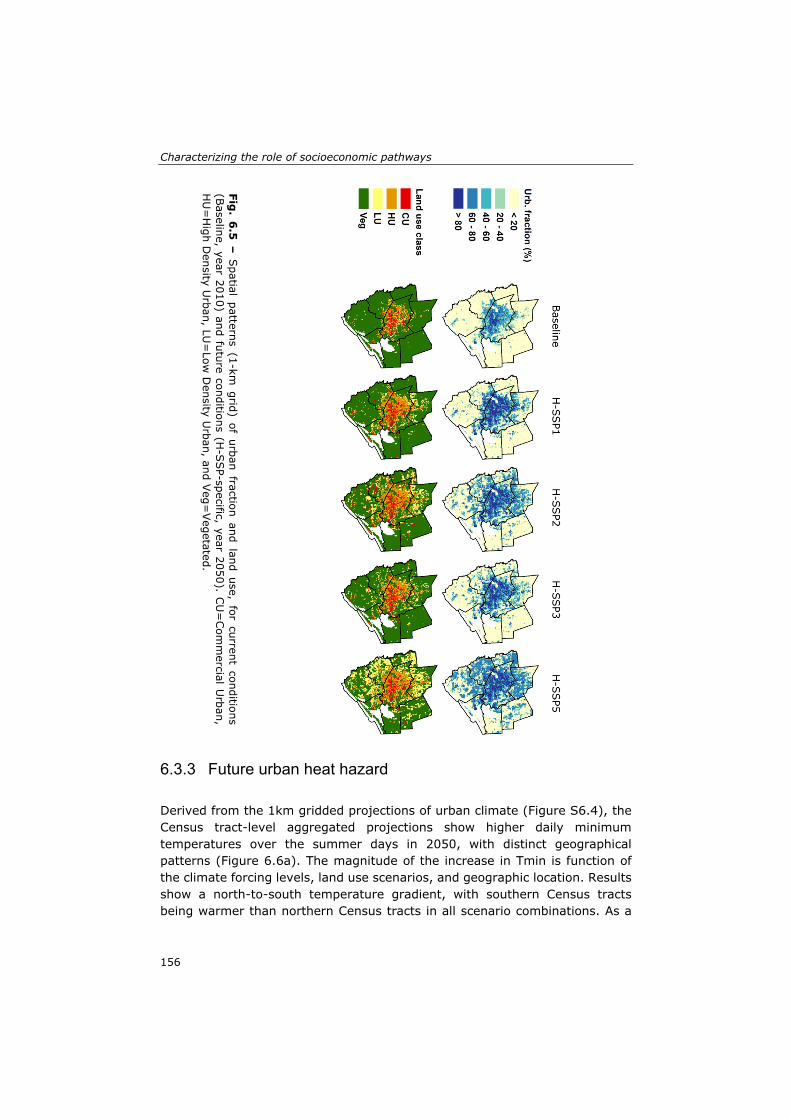
Characterizing the role of socioeconomic pathways
156
6.3.3 Future urban heat hazard
Derived from the 1km gridded projections of urban climate (Figure S6.4), the Census tract-level aggregated projections show higher daily minimum temperatures over the summer days in 2050, with distinct geographical patterns (Figure 6.6a). The magnitude of the increase in Tmin is function of the climate forcing levels, land use scenarios, and geographic location. Results show a north-to-south temperature gradient, with southern Census tracts being warmer than northern Census tracts in all scenario combinations. As a
Fig. 6
.5 –
Spatial patterns (1-km
grid) of urban fraction and land use, for current conditions (B
aseline, year 2010) and future conditions (H-S
SP-specific, year 2050). C
U=
Com
mercial U
rban, H
U=
High D
ensity Urban, LU
=Low
Density U
rban, and Veg=
Vegetated.
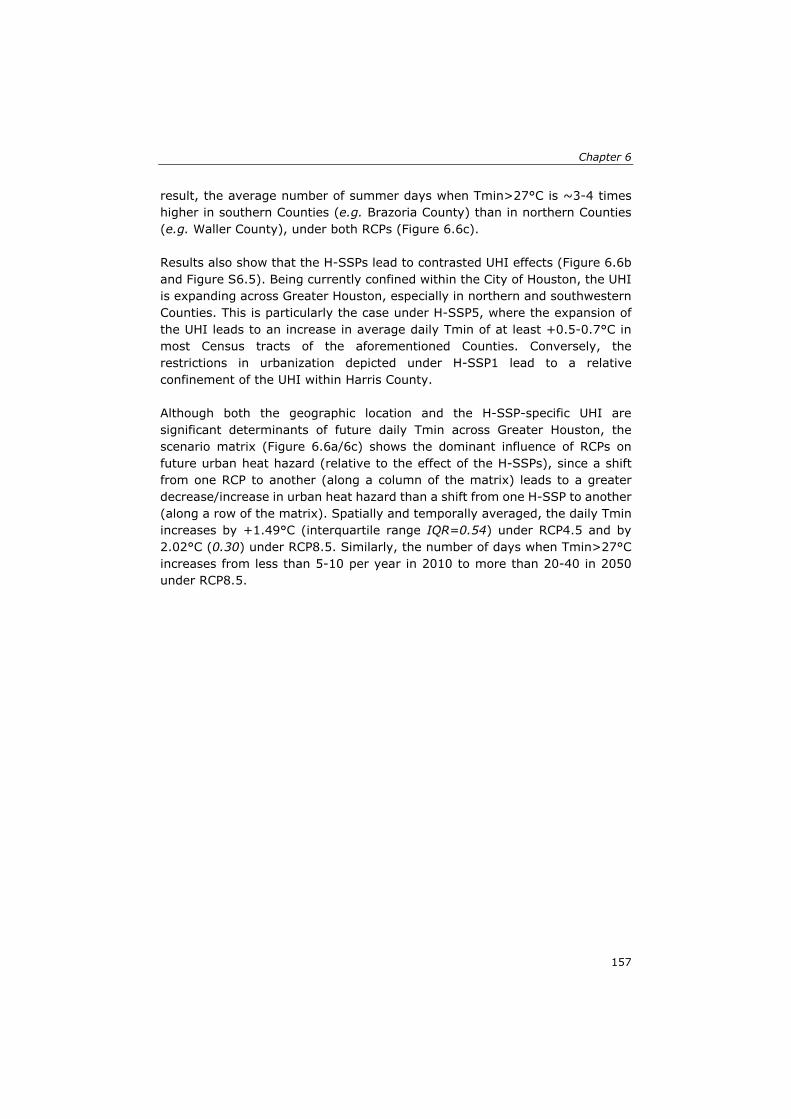
Chapter 6
157
result, the average number of summer days when Tmin>27°C is ~3-4 times higher in southern Counties (e.g. Brazoria County) than in northern Counties (e.g. Waller County), under both RCPs (Figure 6.6c). Results also show that the H-SSPs lead to contrasted UHI effects (Figure 6.6b and Figure S6.5). Being currently confined within the City of Houston, the UHI is expanding across Greater Houston, especially in northern and southwestern Counties. This is particularly the case under H-SSP5, where the expansion of the UHI leads to an increase in average daily Tmin of at least +0.5-0.7°C in most Census tracts of the aforementioned Counties. Conversely, the restrictions in urbanization depicted under H-SSP1 lead to a relative confinement of the UHI within Harris County. Although both the geographic location and the H-SSP-specific UHI are significant determinants of future daily Tmin across Greater Houston, the scenario matrix (Figure 6.6a/6c) shows the dominant influence of RCPs on future urban heat hazard (relative to the effect of the H-SSPs), since a shift from one RCP to another (along a column of the matrix) leads to a greater decrease/increase in urban heat hazard than a shift from one H-SSP to another (along a row of the matrix). Spatially and temporally averaged, the daily Tmin increases by +1.49°C (interquartile range IQR=0.54) under RCP4.5 and by 2.02°C (0.30) under RCP8.5. Similarly, the number of days when Tmin>27°C increases from less than 5-10 per year in 2010 to more than 20-40 in 2050 under RCP8.5.
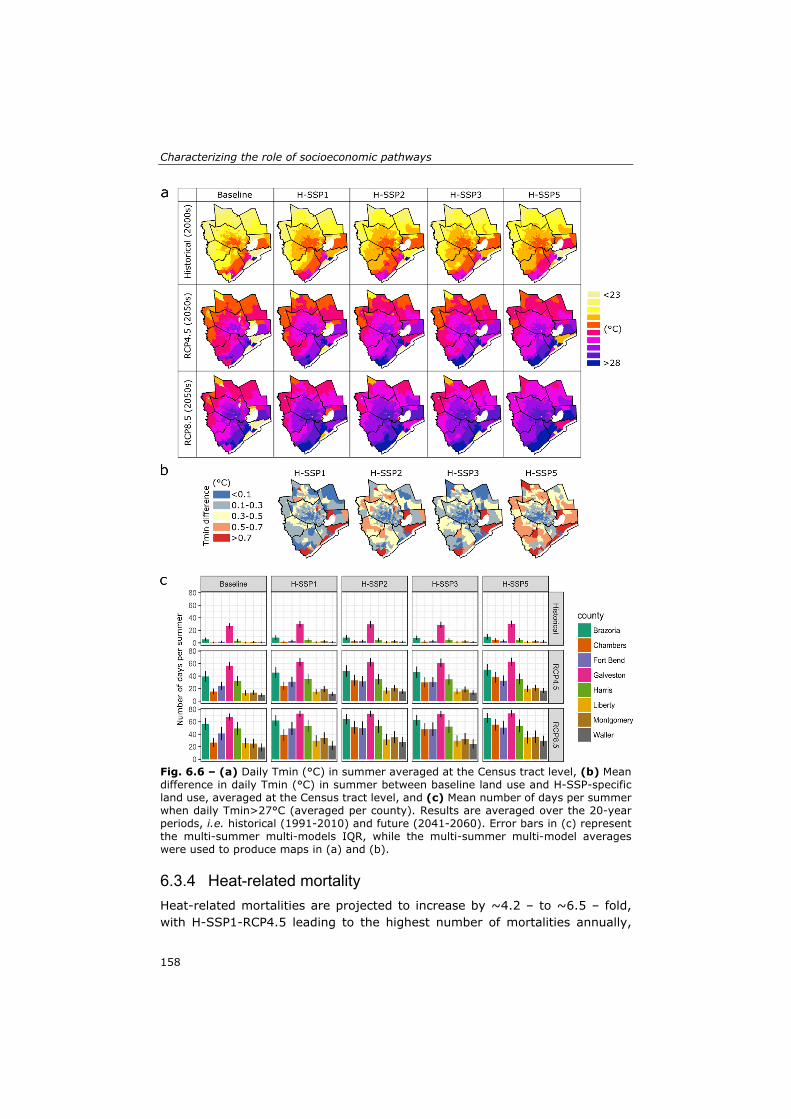
Characterizing the role of socioeconomic pathways
158
Fig. 6.6 – (a) Daily Tmin (°C) in summer averaged at the Census tract level, (b) Mean difference in daily Tmin (°C) in summer between baseline land use and H-SSP-specific land use, averaged at the Census tract level, and (c) Mean number of days per summer when daily Tmin>27°C (averaged per county). Results are averaged over the 20-year periods, i.e. historical (1991-2010) and future (2041-2060). Error bars in (c) represent the multi-summer multi-models IQR, while the multi-summer multi-model averages were used to produce maps in (a) and (b).
6.3.4 Heat-related mortality
Heat-related mortalities are projected to increase by ~4.2 – to ~6.5 – fold, with H-SSP1-RCP4.5 leading to the highest number of mortalities annually,
Chapter 6
159
28,598 (IQR=100) in average per summer in the 2050s (compared to 3,825 (15) in the baseline period), and H-SSP3-RCP4.5 leading to the lowest number of mortalities (19,738 (73)). The increase in mortalities is unevenly spread across Greater Houston, with highly contrasted spatial patterns (Figure 6.7a). Under most scenario combinations, the Census tracts showing the highest number of mortalities (>100) are located in Counties surrounding Harris County, with the exception of the combination H-SSP1-RCP4.5, under which most of the Census tracts with high mortalities are located within Harris County. While the population count of each Census tract plays an evident role in determining future mortalities, the great increase in relative risk (Figure 6.7c) – which is independent of the population count – and its contrasted spatial patterns (Figure S6.6) suggest that other determinants (e.g. vulnerability) play an important role in shaping future spatial patterns of heat-related mortality. The scenario matrix (Figure 6.7a) clearly highlights that changes in socioeconomic conditions (along a row of the matrix) have a much greater influence on future mortality than changes in climatic conditions (along a column of the matrix). Even when focusing only on the relative risk, results show that a shift from historical to future climatic conditions has comparatively little influence, regardless of the RCP and county (Figure 6.7c and Figure S6.7). Shifts in climatic conditions lead to ~175-325 (14) excess summer mortalities (Figure 6.7b), underlining the weak influence of changing climatic conditions on future mortality. This contrasts sharply with the shift from baseline to future socioeconomic conditions, which largely increases both relative risk and excess mortalities (regardless of the H-SSP) in all Counties (Figure S6.7) and lead to ~15,738-24,521 (98) excess summer mortalities.
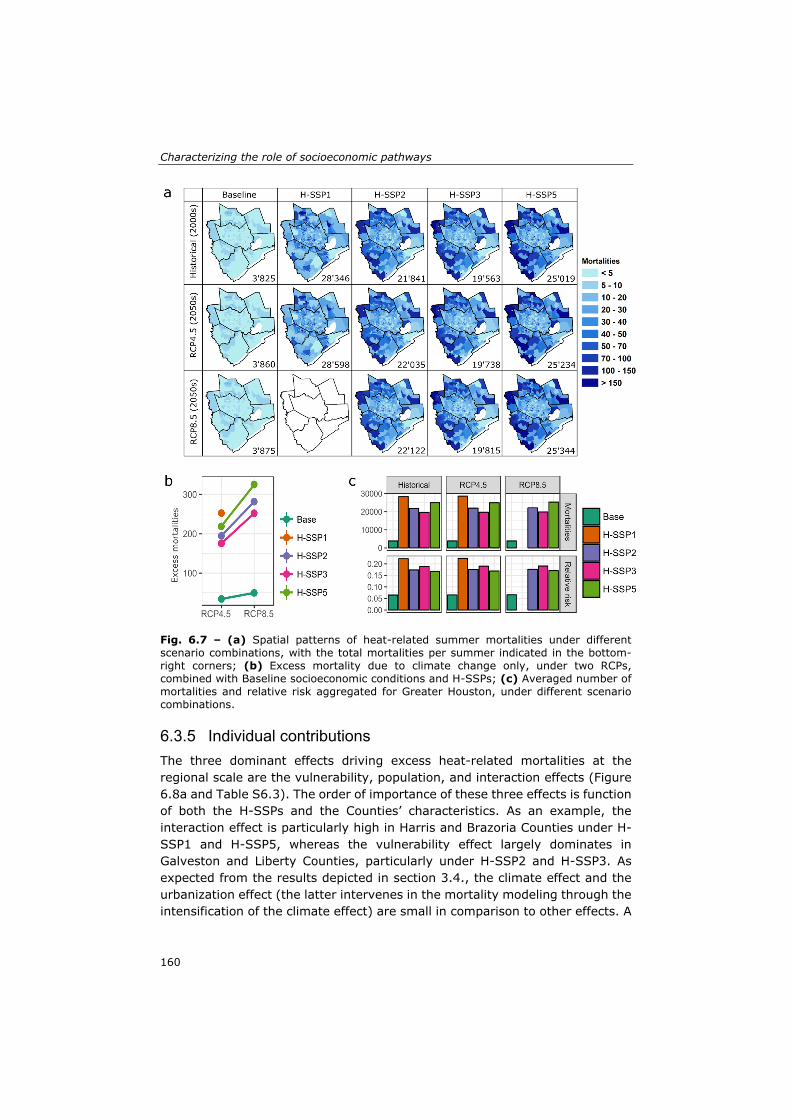
Characterizing the role of socioeconomic pathways
160
Fig. 6.7 – (a) Spatial patterns of heat-related summer mortalities under different scenario combinations, with the total mortalities per summer indicated in the bottom-right corners; (b) Excess mortality due to climate change only, under two RCPs, combined with Baseline socioeconomic conditions and H-SSPs; (c) Averaged number of mortalities and relative risk aggregated for Greater Houston, under different scenario combinations.
6.3.5 Individual contributions
The three dominant effects driving excess heat-related mortalities at the regional scale are the vulnerability, population, and interaction effects (Figure 6.8a and Table S6.3). The order of importance of these three effects is function of both the H-SSPs and the Counties’ characteristics. As an example, the interaction effect is particularly high in Harris and Brazoria Counties under H-SSP1 and H-SSP5, whereas the vulnerability effect largely dominates in Galveston and Liberty Counties, particularly under H-SSP2 and H-SSP3. As expected from the results depicted in section 3.4., the climate effect and the urbanization effect (the latter intervenes in the mortality modeling through the intensification of the climate effect) are small in comparison to other effects. A
Chapter 6
161
closer look at the interaction effect at the county scale (Figure S6.8) shows that it results almost exclusively from the interaction between vulnerability and population. Similar findings came out at the Census tract level, with vulnerability, population, and interaction effects being the dominating effects in all scenario combinations and all Census tracts (Figure 6.8b). We further disaggregated the vulnerability effect by computing the excess heat-related mortality under two additional vulnerability-driven experiments, namely one that considers historical levels in all vulnerability drivers except ageing, and another one that considers historical levels for ageing only (and employs projections for all other vulnerability drivers). Results clearly show that the effect of ageing on future mortalities at the county scale dominates that of all other changes in other vulnerability drivers (Figure S6.9).
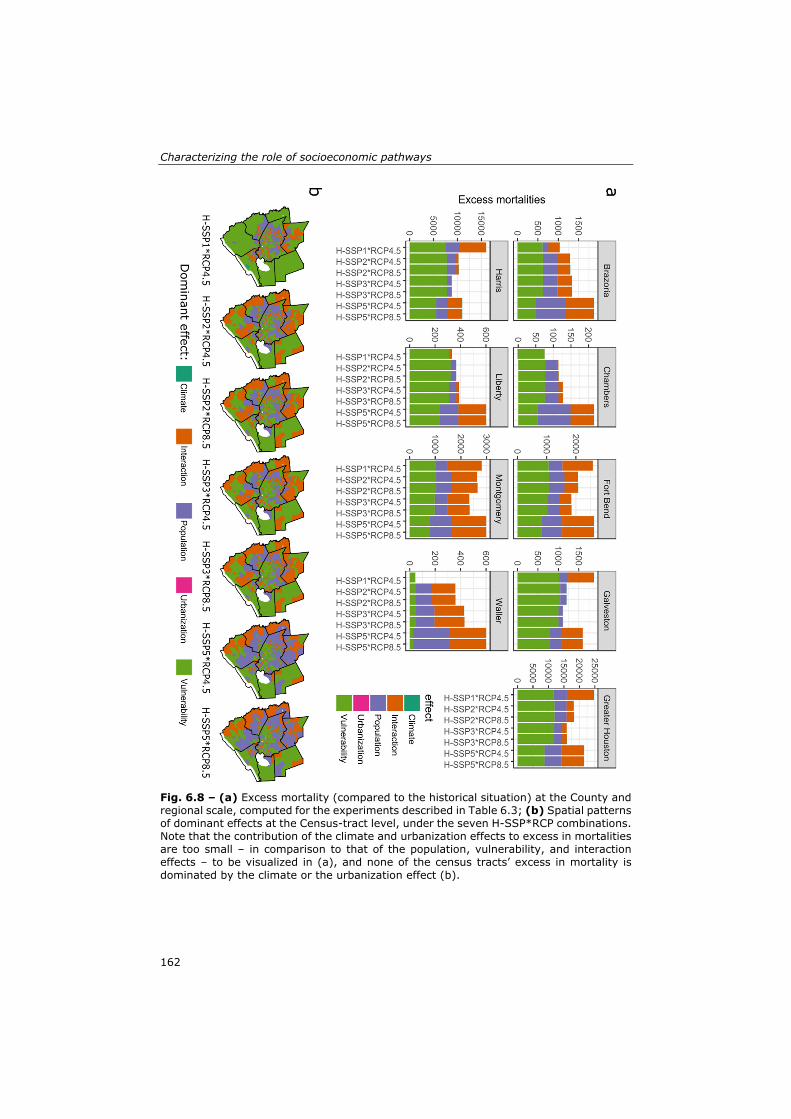
Characterizing the role of socioeconomic pathways
162
Fig. 6.8 – (a) Excess mortality (compared to the historical situation) at the County and regional scale, computed for the experiments described in Table 6.3; (b) Spatial patterns of dominant effects at the Census-tract level, under the seven H-SSP*RCP combinations. Note that the contribution of the climate and urbanization effects to excess in mortalities are too small – in comparison to that of the population, vulnerability, and interaction effects – to be visualized in (a), and none of the census tracts’ excess in mortality is dominated by the climate or the urbanization effect (b).
Chapter 6
163
6.4 Discussion
6.4.1 Crucial role of the socioeconomic pathways
Results showed that future heat-related risk and mortality in Greater Houston are largely driven by changes in socioeconomic conditions, as they are responsible for an excess mortality ~65 times greater than those due to changes in climatic conditions (Figure 6.7). Regardless of the Census tract and the H-SSP-RCP combination, changes in vulnerability and demography are the main contributors to excess heat-related mortality (Figure 6.8). This clearly emphasizes the crucial role that changes in socioeconomic conditions play in shaping future heat-related health challenges at the urban scale and the necessity to explore different socioeconomic pathways. Although all types of socioeconomic development depicted under the H-SSPs lead to a large increase in mortalities across Greater Houston, significant differences among them remain, with H-SSP1 and H-SSP3 leading to the highest and lowest regional mortalities respectively. The difference is 5,529 (69) mortalities between H-SSP5 and H-SSP3 (under RCP8.5) and 8,860 (73) mortalities between H-SSP1 and H-SSP3 (under RCP4.5). The H-SSPs also lead to different spatial patterns of mortality, particularly in the (currently) rural Counties, with future mortality under H-SSP1 in Waller and Chambers Counties being substantially smaller (up to ~6 times less) than that under H-SSP3. At the Census tract level, such difference in outcomes between the H-SSPs is even more pronounced, with H-SSP1, H-SSP2, and H-SSP5 depicting the highest mortalities in most of the urban, suburban, and rural Census tracts respectively (Figure S6.10). When focusing on relative risk only, H-SSP3 is the pathway that leads to the highest risk in most Census tracts. Such differences in spatial patterns of mortality (and risk) between the H-SSPs underline the necessity to explore future heat-related challenges under multiple plausible futures. This research also showed that among all drivers of vulnerability, ageing was the major contributor to the projected increase in relative risk. Such dominant role played by ageing in this case study is due to (i) its high explanatory power on historical heat-related mortality (Heaton et al., 2014) – which is consistent with existing literature (e.g. Anderson and Bell, 2009) – hence leading to an important weight in the heat risk model (from 3 to 10 times higher than other vulnerability drivers; see Table S6.1), and (ii) its great change compared to baseline conditions. In relative terms and averaged across Census tracts, ageing increases by ~187-225% (depending on the H-SSP) compared to current conditions, whereas the share of persons in poverty decreases by ~6-103% and the share of NOAC decreases by ~27-76%, and the share of African-American population decreases by ~10-41%. Due to the major role that ageing plays in shaping future heat-related mortality in this case study, the most
Characterizing the role of socioeconomic pathways
164
sustainable and socially equitable pathway (H-SSP1) leads to the highest mortalities at the regional scale, because of the increased ageing depicted under this scenario. The extent to which socioeconomic pathways play a crucial role in shaping future heat-related challenges is a function of (i) the explanatory power that changes in socioeconomic and demographic conditions have on heat risk – which might differ across time, case-study, and statistical and epidemiological approaches – relative to that of changes in climatic conditions, and (ii) the intensity of changes in socioeconomic and demographic conditions compared to baseline conditions. It is also worth mentioning that the influence of socioeconomic pathways – relative to that of climate change – might be lowered in the second half of the 21st century, as the magnitude of changes in climatic conditions (compared to the baseline) will considerably increase, particularly under high-end scenarios such as RCP8.5.
6.4.2 Applicability of the scenario framework at the urban scale Throughout the case study of future heat-related challenges in Greater Houston, we have implemented the scenario framework (that is, combinations of SSPs and RCPs) in IAV research at the intra-urban scale. We showed that such a framework is applicable in urban areas and that it enables exploring future urban climate risks and the contribution of individual effects. Throughout the process, we also identified a number of key elements that are of crucial importance to ensure a successful application of the SSPs into IAV studies in urban areas. These are summarized here.
6.4.2.1 Urban extended SSPs
We found the global SSPs to be inoperable at the urban scale, if not extended. Urban extension of the global SSPs proved crucial to resolve the local socioeconomic and demographic dynamics and to increase the saliency and legitimacy of the SSPs among local stakeholders. Since the publication of the global SSP narratives (O’Neill et al., 2017), regional extensions of the SSPs have flourished in the literature, altogether providing a wide range of methods to extend the SSPs in specific regions, including urban areas (Kamei et al., 2016; van Oort et al., 2015). This growing set of SSP-extension methods clearly facilitates the development of extended SSPs for future IAV research. We also consider local stakeholders’ inputs on the extended SSPs to be crucial at the urban scale, not only to promote ownership of the scenarios, but also to ensure that all the locally relevant elements are integrated in the scenarios and that their trends are accurately reported under each SSP. In the case study presented here, the stakeholders’ inputs (particularly the qualitative comments) proved essential in identifying inconsistencies in the scenarios. This
Chapter 6
165
is of utmost importance since the SSPs’ narratives and trends are the starting point for the quantification process.
6.4.2.2 Multi-scale quantification of vulnerability drivers
Because they play a critical role in shaping future climate risks in urban areas, vulnerability drivers should be quantified, and both the qualitative consistency with the extended SSPs and the quantitative consistency with the global SSPs should be ensured. Accounting for local socioeconomic and demographic dynamics (as described in the extended SSPs) while remaining consistent with the broader national and international socioeconomic trends (as described in the global SSPs) is the backbone of the local scale application of the scenario framework (van Ruijven et al., 2014) and allows for further comparative studies between multiple local-scale case studies (Ebi et al., 2013). The qualitative consistency of our socioeconomic projections with the H-SSPs was ensured by means of H-SSP-specific assumptions within the modelling approaches (e.g. assumptions on the decoupling, AC affordability, land use patterns, or immigration), while the quantitative consistency with the global SSPs was guaranteed by the use of national SSPs projections acting as top-down boundary conditions. The establishment of quantitative links between global and local scales under the SSPs is facilitated by the increasing sub-national quantification of the global SSPs, e.g., for population (Gao, 2017; Jones and O’Neill, 2016), age structure (Hauer, 2019), urban land use (Gao and O'Neill, 2019), or economic growth (Absar and Preston, 2015; Gidden et al., in review). We also showed that a number of easy-to-implement modelling approaches exist or can be developed in order to project vulnerability drivers such as age, social isolation, AC prevalence, poverty, and race/ethnicity, at the intra-urban scale. This was facilitated by the data-rich environment of Greater Houston, where (like many North American and European cities) historical socioeconomic and demographic data are available at high-spatial resolution. We recognize that such quantification at the intra-urban scale might prove much more challenging in data-poor environments.
6.4.2.3 Influence of SSPs-driven land use on urban climate
It is widely recognized that changes in urban land use patterns have a substantial effect on urban climatic hazards, for example through the contribution of urbanization to the UHI or flood risk. Therefore, the influence of SSP-driven land use changes on urban climate should be explored. In this study, we found the H-SSP-driven changes in land use influenced urban climate and the consequential urban heat hazard to some extent substantially (responsible of up to one quarter of the total increase in daily minimum
Characterizing the role of socioeconomic pathways
166
temperatures), particularly in newly urbanized areas. The growing number of urban climate modelling frameworks that account for changes in land use (Alfieri et al., 2015; Chen et al., 2007; De Ridder et al., 2015) make it increasingly easier to account for such feedbacks from SSPs on local urban climatic conditions.
6.4.2.4 Usefulness of the scenario matrix
Very few IAV studies that employ the scenario framework use the scenario matrix to its full potential (Kriegler et al., 2012). This includes (i) the combination of different SSPs with a single RCP – and vice-versa – to explore the influence on future climate risks of varying levels of socioeconomic development (or climate change) under given climatic (or socioeconomic) conditions; and (ii) the combinations of SSPs with historical climate and of RCPs with baseline socioeconomic conditions to isolate the individual contribution of socioeconomic and climatic drivers respectively. We regard the use of the scenario matrix to its full potential to be particularly useful to identify the dominant contributors of future climate risks, which is highly relevant at the urban scale. Cities are appropriate for the design of contextually-relevant adaptation options targeting locally influential determinants of urban climate risks revealed by the scenario matrix. In this study, the use of the scenario matrix highlighted the crucial role that socioeconomic pathways play in shaping projections of heat-related mortalities and enabled identifying the main drivers of excess mortality in each Census tract.
6.4.3 Caveats
In addition to the inherent limitations of the heat risk model that we employed (see Heaton et al., 2014), the sectoral modelling approaches that we applied also have a number of limitations. First, the projections of social isolation assume constant headship rates and shares of single-person households (for each county and ASRE cohort), meaning that behavioral-based changes in living arrangements are not accounted for. Although headship rates have been rather constant over the past decades (Haurin and Rosenthal, 2004), these could differ under the different H-SSPs. The share of persons living alone may also not cover all aspects of social isolation. Second, the existing dataset of air conditioning prevalence accounts only for central AC (hence neglecting window or wall AC). The current proportion of households without AC might then be overestimated, particularly in communities with older building stock where window or wall AC are common. Third, the projections of poverty do not account for changes in population structure and therefore lack spatial explicitness. By applying the same H-SSP-specific annual growth rate of median income household over all the Census tracts, we assumed all Census tracts’ median household income will grow/decline similarly. Moreover, although the poverty thresholds – as defined by the US Census Bureau – are
Chapter 6
167
revised annually (US Census Bureau, 2018), we did not project them and considered them to be similar to that of the year 2010. Fourth, the climate modeling approach that we employed does not take into account the synergistic effect of UHI and the increase in nighttime temperature (Zhao et al., 2018). The effect of SSP-specific land use change on future daily Tmin (that is, the urban heat hazard) might then be underestimated – although we would expect similar mortality estimates if the UHI effect was stronger, as heat-related mortality is predominantly driven by socioeconomic and demographic factors. Finally, due to the overlay of multiple sectoral models to create estimates of future heat-related mortality, there is a substantial risk of propagation of uncertainty – which primarily originates from the modelling of future socioeconomic and demographic conditions. While we relied on a single model of heat risk to provide mortality estimates, the use of several heat risk models – developed independently with different statistical approaches – would strengthen the findings of this study. Furthermore, because ageing and population growth both play a crucial role in shaping future heat-related mortality in the heat risk model that was employed here, the latter estimates provided in this study are highly dependent on the county-level age and population projections of Hauer (2019) that we employed to scale our projections at the Census tract level. Lastly, we considered the relationships between the predictive variables and the outcome (relative risk and mortality) to be the same in 2050 as it is currently depicted in the heat risk model and the same across the H-SSPs. This might not hold true, as recent research suggests that heat-related vulnerability is dynamic and declining over time (Sheridan and Allen, 2018). The H-SSPs narratives also suggest that the relationships between increase in the share of elderly and increase in relative risk might differ across the different scenarios, with for example the elderly being less vulnerable under H-SSP1 and H-SSP5 than under H-SSP3 and H-SSP2. Implementing such qualitative observations on future trends in a heat risk model grounded on historical mortality records remains challenging.
6.5 Conclusions Focusing on Greater Houston, we have provided a first implementation of the scenario framework at the intra-urban scale to explore future heat-related risk and mortality under multiple combinations of socioeconomic and climatic scenarios. We extended the global SSPs for Greater Houston and employed a number of easy-to-implement sectoral modeling approaches to project demography, vulnerability, and urbanization at the Census tract level. We showed that varying levels of socioeconomic development lead to different spatial patterns of vulnerability and population growth, and to some extent
Characterizing the role of socioeconomic pathways
168
influence future urban climate hazard through the modification of the UHI. Using a heat risk model and a scenario matrix, we demonstrated that the future increase in heat-related mortality is largely driven by changes in population and vulnerability, with changes in climatic conditions having much smaller influence. The different H-SSPs lead to various patterns of mortality and risk, with H-SSP3 leading to the highest relative risk in most Census tracts, but to comparatively low mortalities at the regional scale due to limited population growth. Conversely, H-SSP5 leads to the lowest relative risk in most Census tracts, mainly due to the relatively low ageing, but leads to a large increase in the number of mortalities at the regional scale, driven by a very high population growth. H-SSP1, depicting an ageing population with concentrated patterns of population growth, leads to high increase in mortalities in urban Census tracts. Such contrasted results emphasize the crucial role that socioeconomic pathways play in shaping future heat-related challenges in urban areas. In this regard, it appears of utmost importance to account for future socioeconomic conditions – using scenarios – when assessing future climate risks (van Ruijven et al., 2014) in urban areas, where socioeconomic conditions are rapidly changing (Garschagen and Romero-Lankao, 2013). The scenario framework proved useful in disentangling the individual contribution of drivers of climate risks, shows great potential to mainstream the use of socioeconomic scenarios in climate risks assessments at the urban scale, and constitutes a promising tool to provide policy-relevant information for local-scale climate adaptation planning under climatic and socioeconomic uncertainty (Ebi et al., 2016). This uncertainty – revealed by the use of scenarios – hints at the enormous potential for decision makers to help their cities adapt to greater future climate risks by developing local policies to reduce vulnerability. Further research is needed to explore the contribution of socioeconomic pathways to future urban climate risks in other settings (i.e., using different city case studies and different heat risk models). Further research is also needed to develop methods to incorporate changes in local adaptive capacity and in the health system under the SSPs (Sellers and Ebi, 2018), as these will differently influence future risk and mortality outcomes. Finally, the scenario matrix could be used to assess the potential efficiency of proposed adaptation options or strategies under multiple futures (Frame et al., 2018). Because adaptation options are often designed at the local scale, such use of the scenario matrix appears particularly critical in urban areas.
169
Chapter 7 Assessing urban heat-related adaptation strategies under multiple plausible futures
Assessing urban heat-related adaptation strategies under multiple plausible futures
170
Abstract Urban areas are increasingly affected by extreme heat in the face of climate change, while the size and vulnerability of exposed population is being transformed by economic development, demographic change, and urbanization. Besides the need for understanding and assessing future urban heat-related health risks, there is also an increasing need for designing urban adaptation strategies that are effective under varying levels of socioeconomic development and climate change. In this study, we use the case study of Houston, Texas, to develop and demonstrate a scenario-based approach to explore the effectiveness of both autonomous and planned heat-related adaptation under multiple plausible futures. We couple a heat risk model with urban climate projections (under the Representative Concentration Pathways) and vulnerability projections (under locally extended Shared Socioeconomic Pathways) to investigate the impact of different adaptation strategies under multiple scenario combinations. We demonstrate that, in the context of Houston, community-based adaptation strategies targeting social isolation are the most effective and the least challenging to implement, across all plausible futures. Scenario-based approaches show a great potential to provide local policy-makers with a context-specific assessment of adaptation strategies in an uncertain world.
Chapter 7
171
7.1 Introduction Extreme heat is one of the main cause of weather-related mortality worldwide (Hales et al., 2014), particularly in urban areas (Romero-Lankao et al., 2012), where people are concentrated and where the urban heat island (UHI) effect leads to higher inner-city temperatures (Oke, 1973). A wide range of studies have shown that climate change increases the intensity, frequency, duration, and spatial extent of extreme heat events (Dosio et al., 2018; Russo et al., 2017), population exposure to such events (Jones et al., 2018; Russo et al., 2019), and ultimately heat-related mortality worldwide (Gasparrini et al., 2017). However, not all population groups will be impacted similarly. Decades of research has demonstrated the greater heat-related vulnerability of certain population groups (Wilhelmi and Hayden, 2010), such as low-income communities, those without access to air conditioning, the elderly, ethnic minorities, those with pre-existing medical conditions, or socially isolated persons (Bao et al., 2015; Uejio et al., 2011). Planned adaptation shows great potential to reduce the future health burden of extreme heat, particularly among the most vulnerable groups (Hondula et al., 2015; Larsen, 2015; Liotta et al., 2018). Adaptation to climate change is a complex process that encompasses a broad range of actions that (i) take a wide range of forms, (ii) are triggered by different events, (iii) have different objectives, (iv) operate on a different spatial and temporal scales, (v) involve different actors, (vi) are associated with different constraints to implementation, and (vii) have context-specific effectiveness (Adger et al., 2005; Holman et al., 2019). Heat-related adaptation strategies are generally classified and categorized based on three major aspects (e.g. Boeckmann and Rohn, 2014; Fernandez Milan and Creutzig, 2015; Füssel, 2007b; Hondula et al., 2015; Wolf et al., 2009). First, they differ based on the aspect of heat risk that they target. Adaptation can target (i) the heat hazard, e.g. through urban design to mitigate the UHI, (ii) the vulnerability of individuals exposed to extreme heat, e.g. through community-based programs and outreach, or (iii) the adaptive capacity of the institutions, e.g. through improvements of early warning systems. Second, adaptation strategies are differentiated based on what it requires to implement them, with the distinction between (i) “hard” adaptation measures, which are physical measures relating to the built infrastructure, often costly to implement and with long-term ambitions, and (ii) “soft” adaptation measures, which are social- and institutional-based measures that necessitate little to no technological actions, generally easier to implement and more flexible than “hard” adaptation measures. Third, adaptation strategies vary based on the nature of the actors involved in their implementation, who can originate from governments (at multiple scales and across multiple agencies and departments), private sector businesses, local
Assessing urban heat-related adaptation strategies under multiple plausible futures
172
communities, and local formal or informal institutions (Juhola et al., 2011; Tompkins and Eakin, 2012). The new scenario framework for climate change research (hereafter SSP-RCP framework) consists of climate scenarios (Representative Concentration Pathways, RCPs; van Vuuren et al., 2011) and socioeconomic scenarios (Shared Socioeconomic Pathways, SSPs; O’Neill et al., 2017). The publication of this framework led to a growing body of literature that explores how different combinations of climatic and socioeconomic pathways influence future heat-related impacts (e.g. Jones et al., 2018; Marsha et al., 2018; Rohat et al., 2019a,b; Russo et al., 2019). Despite the fact that (i) the SSP-RCP framework offers new perspective to explore adaptation strategies and their associated costs and benefits (van Vuuren et al., 2014; Wilbanks and Ebi, 2014) and that (ii) adaptation is considered to be an important aspect in the majority of climate change impacts, adaptation, and vulnerability (IAV) studies (Barnett, 2010; Füssel, 2007b; Holman et al., 2019), very little use of the SSP-RCP framework has been made to inform adaptation planning until now. Among the ~30 heat-related IAV studies using the SSP-RCP framework, only Anderson et al. (2018) considered adaptation (through increase in individual-level adaptability). Adaptation is also rarely investigated in IAV assessments focusing on other climate impacts. A few notable exceptions can be found in flood-related studies (Alfieri et al., 2016; Hinkel et al., 2014; Scussolini et al., 2018; Ward et al., 2017), cross-sectoral and agricultural studies (Ausseil et al., 2019; Hasegawa et al., 2014; Hölscher et al., 2017; Rutledge et al., 2017), and in studies that propose conceptual SSP-RCP frameworks that account for adaptation (Cradock-Henry et al., 2018; Frame et al., 2018; Kebede et al., 2018). Building upon the aforementioned studies, this paper seeks to advance the consideration of adaptation within IAV studies that rely on the SSP-RCP framework. We use the case study of heat-health risk in Houston, Texas, to demonstrate how adaptation can be embedded within the SSP-RCP framework and to demonstrate the ways in which this framework can be used to assess the effectiveness of adaptation strategies under multiple plausible futures. The overarching goals of this paper are to (i) advance methodology for assessing adaptation strategies within the SSP-RCP framework and (ii) provide policy-relevant outcomes that pinpoint the range of plausible outcomes in future heat-related risk in Houston and highlight the potential effectiveness of different adaptation strategies.
Chapter 7
173
7.2 Adaptation within the SSP-RCP framework The SSP-RCP framework has been purposely designed to be combined with Shared Policy Assumptions (SPAs) – made of mitigation and adaptation strategies (Kriegler et al., 2014) – into a scenario matrix architecture (van Vuuren et al., 2014). However, their use has been limited so far (Kebede et al., 2018). Integrated in the SSP-RCP framework as a third axis (Figure 7.1), the effectiveness of adaptation strategies (represented by the SPAs) can be assessed across all SSP-RCP combinations (e.g. Anderson et al., 2018; Hasegawa et al., 2014; Hinkel et al., 2014). Going further, Hölscher et al. (2017) analyzed the consistency between adaptation-oriented SPAs and different SSP-RCP combinations and subsequently assessed qualitatively the effectiveness of different SPAs across their respective set of consistent SSP-RCP combinations. A few studies also linked a specific adaptation-oriented SPA with a given SSP-RCP combination in order to create integrated SSP-RCP-SPA scenarios (Ausseil et al., 2019; Reimann et al., 2019). The number of adaptation strategies assessed within a given study varies widely, from one (e.g. Hasegawa et al., 2014) to many (e.g. Hölscher et al., 2017). The complexity and level of detail of the adaptation strategies differ greatly as well, ranging from a straightforwardly-implied acclimation of the population (Anderson et al., 2018) to SPAs made of a combination of several context-specific adaptation strategies (Scussolini et al., 2018). In all IAV studies exploring adaptation under the SSP-RCP framework, the complexity of adaptation – with regard to its different forms, objectives, actors involved, actions required, and constraints – is largely underestimated. This may be due to the poor ability of climate change impact models to represent adaptation (Holman et al., 2019). It is also crucial to recognize the different degrees of autonomous adaptation assumed under each SSP (i.e., adaptation that is not a conscious response to climate change, but rather triggered by socioeconomic development) (Rothman et al., 2014). Globally, SSP1 and SSP5 depict low challenges to adaptation (i.e., high autonomous adaptation, through high education, high health investments, reduced inequality (particularly under SSP1), and effective international cooperation). SSP3 and SSP4 depict high challenges to adaptation (i.e., weak autonomous adaptation, due to low or unequal education, low or unequal access to health facilities, water, and sanitation, and high inequality). SSP2 depicts moderate challenges to adaptation. It is worth pointing out that these global assumptions of autonomous adaptation can unfold differently for a particular region and climate-related hazard because adaptation is largely context-specific.
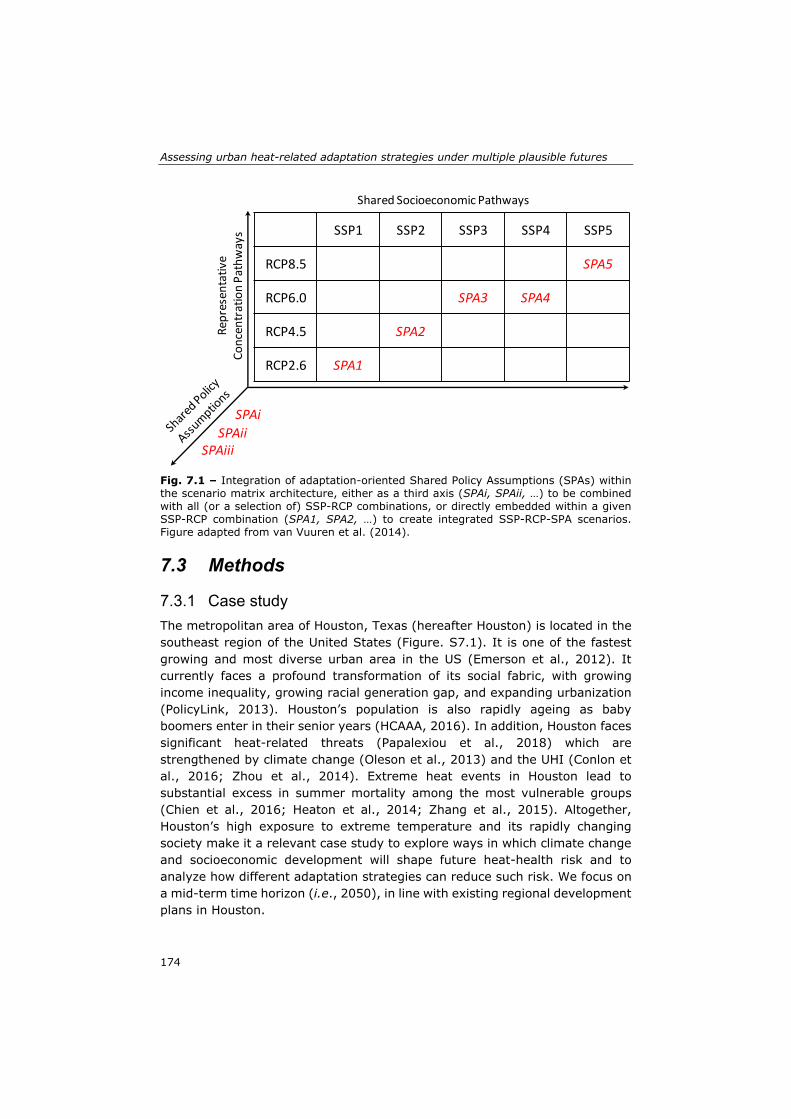
Assessing urban heat-related adaptation strategies under multiple plausible futures
174
Fig. 7.1 – Integration of adaptation-oriented Shared Policy Assumptions (SPAs) within the scenario matrix architecture, either as a third axis (SPAi, SPAii, …) to be combined with all (or a selection of) SSP-RCP combinations, or directly embedded within a given SSP-RCP combination (SPA1, SPA2, …) to create integrated SSP-RCP-SPA scenarios. Figure adapted from van Vuuren et al. (2014).
7.3 Methods
7.3.1 Case study
The metropolitan area of Houston, Texas (hereafter Houston) is located in the southeast region of the United States (Figure. S7.1). It is one of the fastest growing and most diverse urban area in the US (Emerson et al., 2012). It currently faces a profound transformation of its social fabric, with growing income inequality, growing racial generation gap, and expanding urbanization (PolicyLink, 2013). Houston’s population is also rapidly ageing as baby boomers enter in their senior years (HCAAA, 2016). In addition, Houston faces significant heat-related threats (Papalexiou et al., 2018) which are strengthened by climate change (Oleson et al., 2013) and the UHI (Conlon et al., 2016; Zhou et al., 2014). Extreme heat events in Houston lead to substantial excess in summer mortality among the most vulnerable groups (Chien et al., 2016; Heaton et al., 2014; Zhang et al., 2015). Altogether, Houston’s high exposure to extreme temperature and its rapidly changing society make it a relevant case study to explore ways in which climate change and socioeconomic development will shape future heat-health risk and to analyze how different adaptation strategies can reduce such risk. We focus on a mid-term time horizon (i.e., 2050), in line with existing regional development plans in Houston.
SSP1 SSP2 SSP3 SSP4 SSP5
RCP8.5 SPA5
RCP6.0 SPA3 SPA4
RCP4.5 SPA2
RCP2.6 SPA1
Shared Socioeconomic Pathways
Rep
resentative
Concentration Pathways
SPAi
SPAiiSPAiii
Chapter 7
175
7.3.2 Heat risk model
We rely on an existing heat risk model (Heaton et al., 2014) developed in Houston within the System for Integrated Modeling of Metropolitan Extreme heat Risk (SIMMER) project. Heaton et al. (2014) employed a hierarchical model with a spatially varying coefficient to draw statistical correlations between heat-related non-accidental summer mortality records and a wide range of spatially explicit (Census block group level) socioeconomic/demographic and climatic variables. Authors found the risk of heat-related summer mortality to be strongly correlated with (i) demographic factors such as age and ethnicity, (ii) socioeconomic factors such as social isolation, air conditioning prevalence, and poverty, and (iii) climatic determinants such as daily minimum temperature. The latter suggests that the inability to cool off at night is an important contributor to risk of heat-related mortality (Kovats and Hajat, 2008). On the basis of these findings, Heaton et al. (2014) established a multi-layers statistical regression model in which (i) demographic and socioeconomic predictive variables interact in a first layer (similarly to a generalized linear model) to influence the relative risk of summer heat-related mortality and (ii) the relative risk interacts with fluctuations of the daily minimum temperature within a second layer to spatially predict the number of summer heat-related mortalities (see Heaton et al. (2014) for a detailed description of the heat risk model). In this study, we use only one layer of the Heaton heat risk model to explore the future relative risk of heat-related mortality. The relative risk of mortality is referred to as “vulnerability” throughout the paper. We assume constant demographic conditions (that is, similar age structure and ethnic diversity as of year 2010) to focus only on the influence of predictive socioeconomic variables for which adaptation strategies can be designed (that is, social isolation, air conditioning, and poverty). Even though we do not make use of the second layer of the heat risk model, we still examine how different climatic and socioeconomic pathways influence the heat hazard (i.e., daily minimum temperature).
7.3.3 Scenario setting
The SSPs are global development trends and should be extended – that is, contextualized for a specific region and/or sector – to increase their suitability and relevance for local-scale IAV studies (Kriegler et al., 2012; van Ruijven et al., 2014). We used the four extended SSPs for Houston (H-SSPs) developed in Rohat et al. (2019c), which describe alternative development trends for Houston in the 2050s (Table 7.1 and Text S7.1).
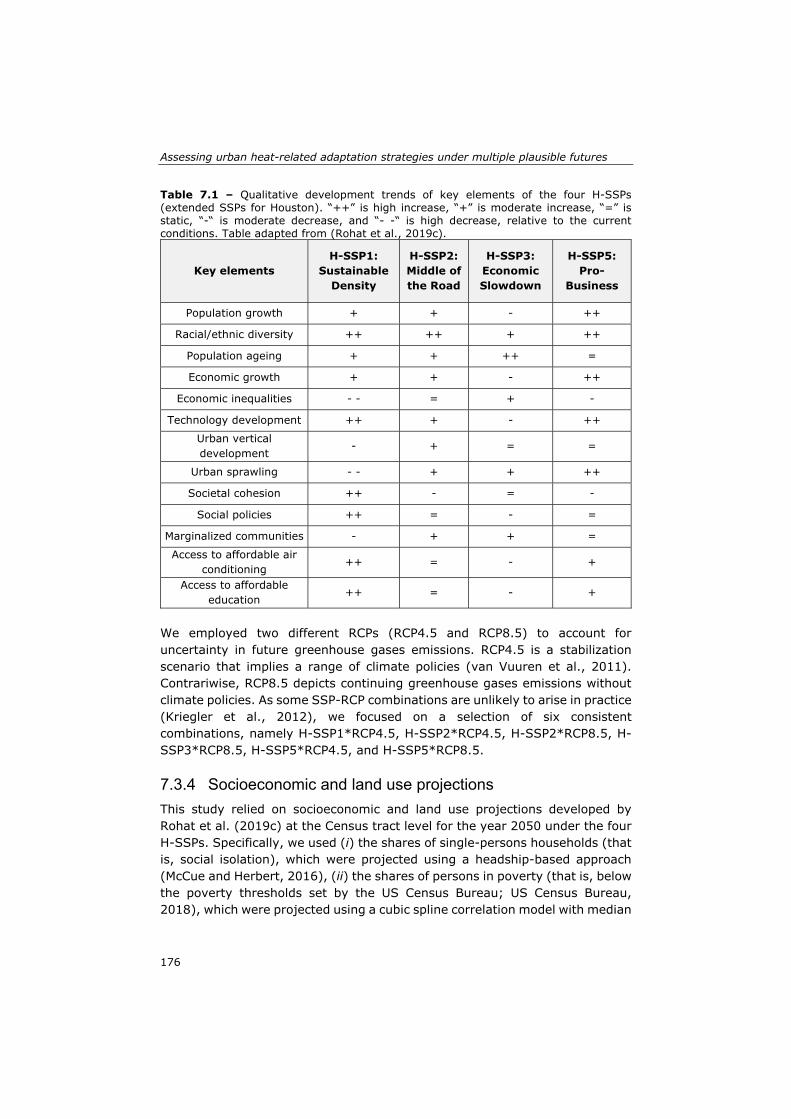
Assessing urban heat-related adaptation strategies under multiple plausible futures
176
Table 7.1 – Qualitative development trends of key elements of the four H-SSPs (extended SSPs for Houston). “++” is high increase, “+” is moderate increase, “=” is static, “-“ is moderate decrease, and “- -“ is high decrease, relative to the current conditions. Table adapted from (Rohat et al., 2019c).
Key elements H-SSP1:
Sustainable Density
H-SSP2: Middle of the Road
H-SSP3: Economic Slowdown
H-SSP5: Pro-
Business
Population growth + + - ++
Racial/ethnic diversity ++ ++ + ++
Population ageing + + ++ =
Economic growth + + - ++
Economic inequalities - - = + -
Technology development ++ + - ++
Urban vertical development
- + = =
Urban sprawling - - + + ++
Societal cohesion ++ - = -
Social policies ++ = - =
Marginalized communities - + + =
Access to affordable air conditioning
++ = - +
Access to affordable education
++ = - +
We employed two different RCPs (RCP4.5 and RCP8.5) to account for uncertainty in future greenhouse gases emissions. RCP4.5 is a stabilization scenario that implies a range of climate policies (van Vuuren et al., 2011). Contrariwise, RCP8.5 depicts continuing greenhouse gases emissions without climate policies. As some SSP-RCP combinations are unlikely to arise in practice (Kriegler et al., 2012), we focused on a selection of six consistent combinations, namely H-SSP1*RCP4.5, H-SSP2*RCP4.5, H-SSP2*RCP8.5, H-SSP3*RCP8.5, H-SSP5*RCP4.5, and H-SSP5*RCP8.5.
7.3.4 Socioeconomic and land use projections
This study relied on socioeconomic and land use projections developed by Rohat et al. (2019c) at the Census tract level for the year 2050 under the four H-SSPs. Specifically, we used (i) the shares of single-persons households (that is, social isolation), which were projected using a headship-based approach (McCue and Herbert, 2016), (ii) the shares of persons in poverty (that is, below the poverty thresholds set by the US Census Bureau; US Census Bureau, 2018), which were projected using a cubic spline correlation model with median
Chapter 7
177
income and state-level GDP projections (Absar and Preston, 2015; Marsha et al., 2018), and (iii) the shares of households without central air conditioning (AC), which were projected using a multiple correlation model with projections of households’ income and of the buildings stock (see Rohat et al. (2019c) for more details). Because urban land use is a critical determinant of Houston’s UHI (Conlon et al., 2016), we also retrieved from Rohat et al. (2019c) future land use projections under the four H-SSPs, which were purposely designed to serve as inputs for the urban climate model described next (Figure S7.2).
7.3.5 Urban climate projections
Daily minimum temperature (Tmin) in Houston was simulated using an offline version of the Noah land surface model – known as HRLDAS (High Resolution Land Data Assimilation System; Chen et al., 2007) – coupled with a 1-layer urban canopy model (UCM) depicting the urban surface to simulate the UHI effect across Houston. HRLDAS was driven at the upper boundary by NLDAS-2 (phase 2 of the North American Land Assimilation System; Xia et al., 2012) hourly meteorological forcing data for the period 1991-2010. Using the current and projected urban land use as input into the UCM, we simulated the baseline (1991-2010) summer daily Tmin metrics across Houston under current and future (H-SSP-specific) land use patterns. To account for the RCP-driven changes in climatic conditions, we employed the computationally efficient process described in (Conlon et al., 2016; Marsha et al., 2018; Rohat et al., 2019c). First, we retrieved daily Tmin for June, July, August from historical climate (1991-2010, referred hereafter as the 2000s) and future climate (2041-2060, referred hereafter as the 2050s) simulations using RCP4.5 and RCP8.5 from 6 Regional Climate Models (RCM, see Table S7.1). Second, we computed daily deltas between future and historical time-periods for each RCP and each RCM simulation. Third, we employed the statistical downscaling procedure described in Marsha et al. (2018) to adjust the historical HRLDAS simulations according to the RCM projections under RCP4.5 and RCP8.5, using the daily deltas (see Text S7.2). This process was repeated for each RCM, each RCP, and each HRLDAS historical simulations. Finally, we aggregated the resulting 1-km climate projections to the Census tract scale. This computationally efficient process resulted in a set of Census tract-level projections of summer daily Tmin across Houston, under different combinations of land use scenarios (baseline and four H-SSPs) and climate scenarios (two RCPs), for the 2050s. We used the multi-model mean to display the results. We also analyzed the climate projections in terms of the number of warm nights per summer, that is, the number of days where Tmin>27°C (~80°F) (Rohat et al., 2019c).
Assessing urban heat-related adaptation strategies under multiple plausible futures
178
7.3.6 Adaptation strategies
7.3.6.1 Design and quantification
There is a wide range of existing adaptation strategies to reduce heat-related health risk in urban areas. As already mentioned, adaptation strategies differ in (i) the aspect of heat risk they target, (ii) what is required to implement them, and (iii) the nature of actors involved. To explore the existing heat-related adaptation strategies in Houston, we reviewed Houston’s development plans, resilience plans, and climate action plans (City of Houston, 2018, 2019b; H-GAC, 2018; Mayoral Task Force on Equity, 2017; WHA, 2007, 2018). Although these plans do not explicitly focus on climate adaptation, they refer to fields that are related to heat stress risk, such as urban planning, social vulnerability, ageing, and marginalized communities. In addition, we reviewed 11 dedicated adaptation plans of North-American cities (see Table S7.2) to explore concrete heat-related adaptation options in the North-American context. We also used the results from a Houston household survey on extreme heat vulnerability and adaptive capacity (Hayden et al., 2017) to contextualize heat-related adaptive capacity of the households across Houston. Among other things, results revealed that (i) the most common measures taken by the Houstonian to protect themselves from extreme heat were staying indoors, drinking water, and using AC, (ii) there is little awareness about the existence of heat-related social policies (e.g. assistance program to help pay electricity bills) and cooling centers, and (iii) social networks are an important aspect of heat-related vulnerability in Houston. Finally, we also used the results from a Houston stakeholder survey on extreme heat vulnerability and adaptation (Wilhelmi and Hayden, 2016) to characterize the perception of Houston’s stakeholders about the effectiveness of current heat-related preparedness and response and of different strategies to reduce future heat-related vulnerability. Results showed that Houston’s stakeholders view improvements in preparedness and community-based adaptation as effective measures for reducing heat-related vulnerability. The review of plans and survey results was instrumental in creating a list of context-specific adaptation strategies, from which we created a subset of strategies that specifically target the predictive drivers of heat risk depicted in the model, i.e., heat hazard, social isolation, poverty, and AC prevalence (Table 7.2). The quantification of the list of adaptation strategies we identified was highly challenged by (i) the absence of quantification of the adaptation goals in the reviewed climate adaptation plans and (ii) the lack of empirical evidence on the effect of specific policies and strategies on a given adaptation target. Despite those challenges, we quantified the adaptation strategies as follows:
Chapter 7
179
Adaptation strategy targeting the heat hazard: we quantified its effect by assuming that the UHI will remain at the present level (year 2010).
Adaptation strategies targeting vulnerability: we quantified their effect by
assuming that they would lead to a decrease in the maximum Census tract-level values of their respective target variable (AC, poverty, or social isolation). We set the maximum values according to the ambitiousness of the adaptation strategy (high or low) and to the current Census tract-level distribution of the variables’ values. Specifically, we set the maximum values at the 50th and 75th percentiles (rounded to +/- 5%) for high- and low-ambitious adaptation strategies respectively.
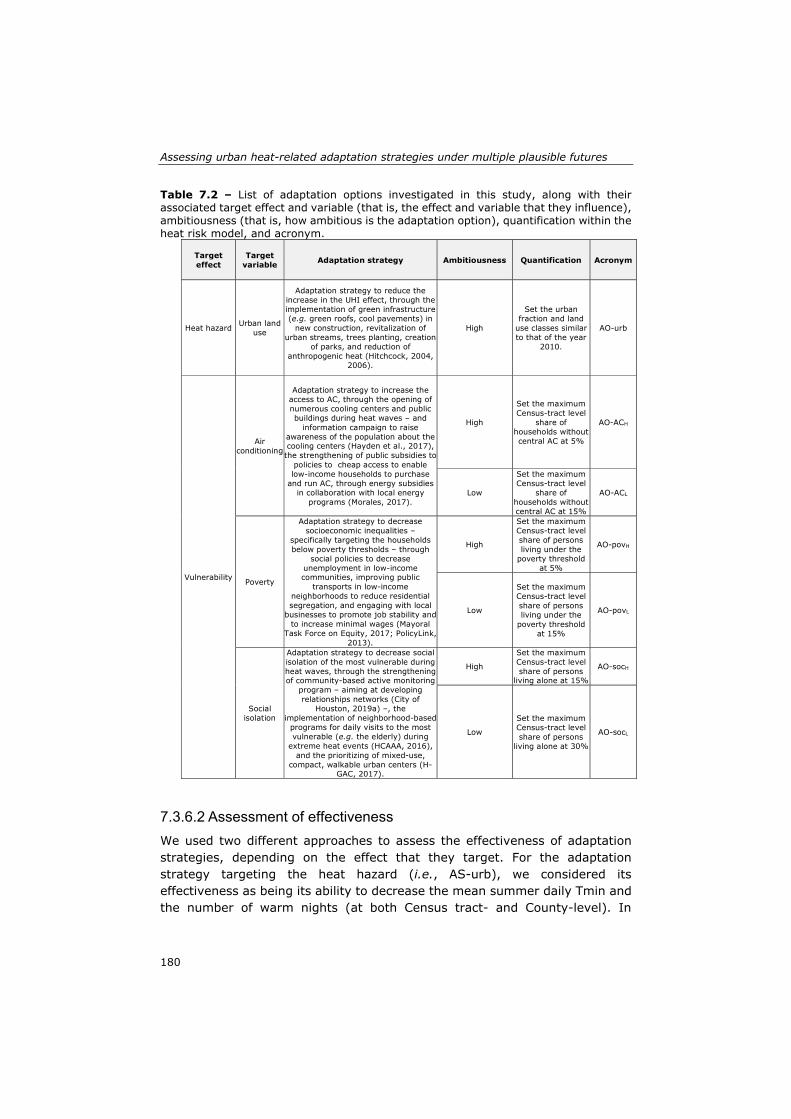
Assessing urban heat-related adaptation strategies under multiple plausible futures
180
Table 7.2 – List of adaptation options investigated in this study, along with their associated target effect and variable (that is, the effect and variable that they influence), ambitiousness (that is, how ambitious is the adaptation option), quantification within the heat risk model, and acronym.
7.3.6.2 Assessment of effectiveness
We used two different approaches to assess the effectiveness of adaptation strategies, depending on the effect that they target. For the adaptation strategy targeting the heat hazard (i.e., AS-urb), we considered its effectiveness as being its ability to decrease the mean summer daily Tmin and the number of warm nights (at both Census tract- and County-level). In
Target effect
Target variable Adaptation strategy Ambitiousness Quantification Acronym
Heat hazard Urban land use
Adaptation strategy to reduce the increase in the UHI effect, through the implementation of green infrastructure (e.g. green roofs, cool pavements) in
new construction, revitalization of urban streams, trees planting, creation
of parks, and reduction of anthropogenic heat (Hitchcock, 2004,
2006).
High
Set the urban fraction and land
use classes similar to that of the year
2010.
AO-urb
Vulnerability
Air conditioning
Adaptation strategy to increase the access to AC, through the opening of numerous cooling centers and public buildings during heat waves – and
information campaign to raise awareness of the population about the cooling centers (Hayden et al., 2017), the strengthening of public subsidies to
policies to cheap access to enable low-income households to purchase
and run AC, through energy subsidies in collaboration with local energy
programs (Morales, 2017).
High
Set the maximum Census-tract level
share of households without central AC at 5%
AO-ACH
Low
Set the maximum Census-tract level
share of households without central AC at 15%
AO-ACL
Poverty
Adaptation strategy to decrease socioeconomic inequalities –
specifically targeting the households below poverty thresholds – through
social policies to decrease unemployment in low-income communities, improving public
transports in low-income neighborhoods to reduce residential segregation, and engaging with local
businesses to promote job stability and to increase minimal wages (Mayoral
Task Force on Equity, 2017; PolicyLink, 2013).
High
Set the maximum Census-tract level share of persons living under the
poverty threshold at 5%
AO-povH
Low
Set the maximum Census-tract level share of persons living under the
poverty threshold at 15%
AO-povL
Social isolation
Adaptation strategy to decrease social isolation of the most vulnerable during heat waves, through the strengthening of community-based active monitoring
program – aiming at developing relationships networks (City of
Houston, 2019a) –, the implementation of neighborhood-based
programs for daily visits to the most vulnerable (e.g. the elderly) during
extreme heat events (HCAAA, 2016), and the prioritizing of mixed-use,
compact, walkable urban centers (H-GAC, 2017).
High
Set the maximum Census-tract level share of persons
living alone at 15%
AO-socH
Low
Set the maximum Census-tract level share of persons
living alone at 30%
AO-socL
Chapter 7
181
addition, we compared the effectiveness of AS-urb with that of mitigation (mitigation being defined by a shift from RCP8.5 to RCP4.5). As for the adaptation strategies targeting vulnerability (i.e., AS-AC, AS-pov, and AS-soc), we created the concept of “adaptation range” to assess their effectiveness in a standardized fashion. We defined the adaptation range as the percentage of decrease in vulnerability (at the Census tract-level, relative to the vulnerability in year 2010) when the socioeconomic predictive variables of heat-related vulnerability (i.e., lack of AC, poverty, and social isolation) were set to null. In other words, the adaptation range represents the maximum possible decrease in vulnerability – hence the maximum possible range of adaptation – for each Census tract. Across Houston, the adaptation range is ~17% in average (that is, a maximum mean decrease in vulnerability of 17%), with Census tract-level values ranging from 1% to 52% (Figure S7.3). We then considered the effectiveness of a given adaptation strategy as being its ability to “fill” the adaptation range, thus expressed in percentage (%). As an example, if the adaptation range of Census tracts A and B is 20% and 40% respectively and that an adaptation strategy leads to a decrease in 5% in vulnerability in Census tract A and 10% in Census tract B, then its effectiveness is of 25% (5/20 and 10/40) in both Census tracts. Such an approach enables exploring the effectiveness of adaptation strategies in a standardized way across Houston’s Census tracts.
7.4 Results and discussion
7.4.1 Heat hazard projection
Results of the urban climate simulations show that daily Tmin is projected to increase across Houston under all scenarios. The mean summer Tmin increases from 24.7°C in the 2000s to 26.2—27.1°C (interquartile range = 0.6) in the 2050s, depending on the H-SSP*RCP combination. Such an increase in temperature is unevenly distributed across Houston area, with the southern coastal counties showing both the highest temperatures and the largest increase (Figure S7.4a). Similarly, the number of warm nights also shows a large increase under all scenarios (Figure S7.4a), shifting from less than 1 night per summer in most counties to over 20 nights per summer under all scenarios in most counties. In half of the counties, the number of warm nights under RCP8.5 reaches over 50 per summer. Spatial patterns of Tmin (Figure S7.4b) highlight the substantial influence that the type of urbanization pathway has on the future urban climate, particularly in areas expected to shift from rural to urban. The compact urban development depicted in H-SSP1 leads to a much smaller increase in
Assessing urban heat-related adaptation strategies under multiple plausible futures
182
daily Tmin than the sprawling urban development depicted in H-SSP5. Assuming RCP4.5 climate, this difference in summer mean Tmin is of 0.27°C (0.02) in average across Houston, and reaches >0.7°C in numerous newly-urbanized Census tracts. In addition, to the urbanization type, the climate scenario is also an important determinant of future urban climatic conditions. The difference in summer mean Tmin between RCP4.5 and RCP8.5 is of ~0.51°C (0.09) in average and can reach >1°C in some Census tracts. The influence of the climate scenario on future temperature conditions is therefore, in most cases, greater than that of the socioeconomic/urbanization scenario.
7.4.2 Adaptation targeting the heat hazard
In addition to projecting the future heat hazard, we assessed the ability of a specific adaptation strategy (see Table 7.2) to reduce the future heat hazard, under different H-SSP*RCP combinations. Results show that this adaptation strategy leads to substantial reduction of the heat hazard, but with important differences in effectiveness across socioeconomic scenarios and counties (Figure 7.2a). Under a scenario of compact and sustainable city (H-SSP1), this adaptation strategy has very little influence (it leads to a decrease <0.05°C in most Counties), mainly because of the low increase in the UHI effect depicted under this scenario. Contrariwise, under a scenario depicting a sprawling city (H-SSP3 and H-SSP5) this adaptation strategy leads to large reduction of the heat hazard, with a mean decrease in daily Tmin of ~0.2—0.3°C in newly urbanized counties. Although significant, this adaptation-driven reduction of the heat hazard should be put in perspective with the potential mitigation-driven reduction of the mean minimum summer temperature, which attains at least ~0.5—0.6°C in most Census tracts. Similar results are found when using the number of warm nights as the representation of the heat hazard (Figure 7.2b). Under scenarios depicting a strong climate change and a sprawling city (e.g. H-SSP3*RCP8.5 and H-SSP5*RCP8.5), the adaptation-driven reduction in the number of warm nights can reach more than 7 days per summer in average across a few Counties, but is limited to a reduction <4 days per summer in average across most counties. In scenarios depicting a compact city (H-SSP1) or a city with mixed development patterns (H-SSP2), the adaptation-driven reduction in the number of warm nights is very low in average (<1 day per summer in most cases), even when considering RCP8.5 climate scenario. The mitigation-driven reduction (e.g. reaching RCP4.5 instead of RCP8.5 when considering H-SSP2 scenario) is higher in most cases (~5—20 days per summer in average
Chapter 7
183
depending on the county). Similar findings apply at the Census tract-level (Figure 7.2c). The adaptation-driven reduction in the number of warm nights is significant in the outskirts of Harris County – particularly under a scenario of sprawling city (H-SSP5) – but lesser than the mitigation-driven reduction in most Census tracts (Figure 7.2c). Overall, for the vast majority of Census tracts, achieving RCP4.5 instead of RCP8.5 (i.e., mitigation) would lead to a higher reduction in the heat hazard than that due to the adaptation strategy investigated here. However, the latter is far from negligible and plays a particularly important role in the reduction of the heat hazard in newly urbanized areas (e.g. Fort Bend, Montgomery, and Waller counties) under scenarios depicting a sprawling city (H-SSP3 and H-SSP5).
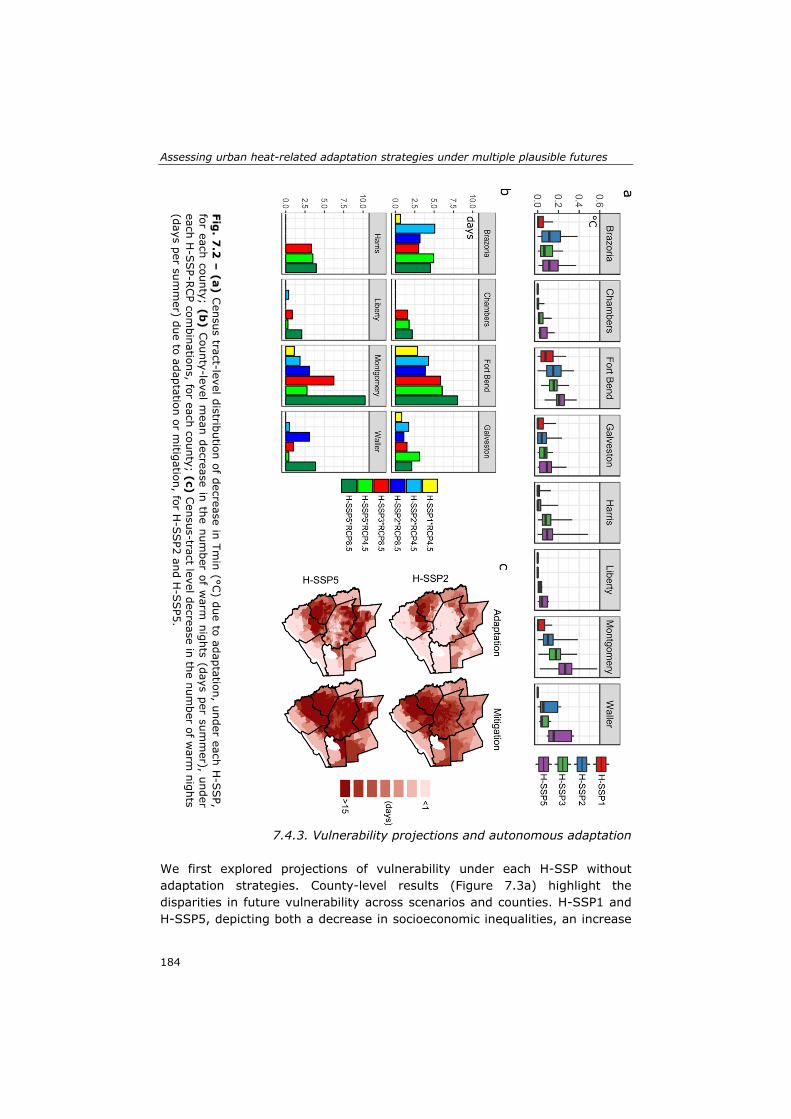
Assessing urban heat-related adaptation strategies under multiple plausible futures
184
7.4.3. Vulnerability projections and autonomous adaptation
We first explored projections of vulnerability under each H-SSP without adaptation strategies. County-level results (Figure 7.3a) highlight the disparities in future vulnerability across scenarios and counties. H-SSP1 and H-SSP5, depicting both a decrease in socioeconomic inequalities, an increase
Fig. 7
.2 –
(a) Census tract-level distribution of decrease in Tm
in (°C) due to adaptation, under each H
-SSP,
for each county; (b) C
ounty-level mean decrease in the num
ber of warm
nights (days per summ
er), under each H
-SSP-R
CP com
binations, for each county; (c) Census-tract level decrease in the num
ber of warm
nights (days per sum
mer) due to adaptation or m
itigation, for H-S
SP2 and H
-SSP5.
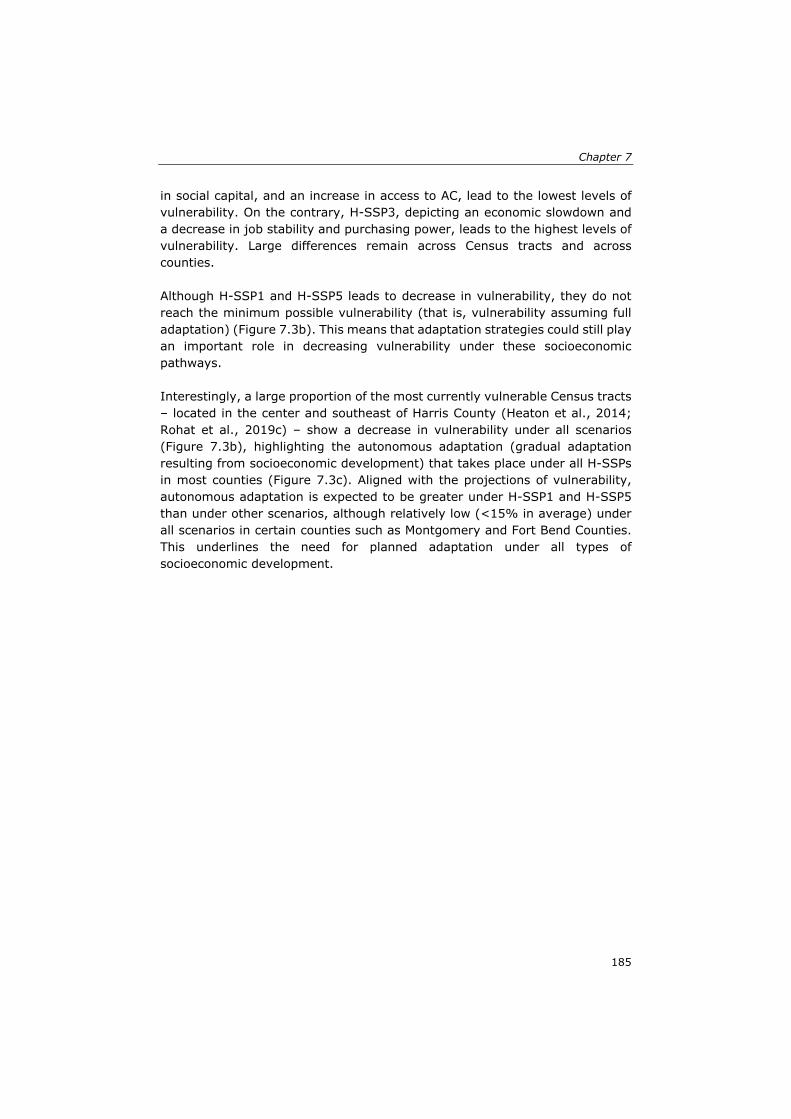
Chapter 7
185
in social capital, and an increase in access to AC, lead to the lowest levels of vulnerability. On the contrary, H-SSP3, depicting an economic slowdown and a decrease in job stability and purchasing power, leads to the highest levels of vulnerability. Large differences remain across Census tracts and across counties. Although H-SSP1 and H-SSP5 leads to decrease in vulnerability, they do not reach the minimum possible vulnerability (that is, vulnerability assuming full adaptation) (Figure 7.3b). This means that adaptation strategies could still play an important role in decreasing vulnerability under these socioeconomic pathways. Interestingly, a large proportion of the most currently vulnerable Census tracts – located in the center and southeast of Harris County (Heaton et al., 2014; Rohat et al., 2019c) – show a decrease in vulnerability under all scenarios (Figure 7.3b), highlighting the autonomous adaptation (gradual adaptation resulting from socioeconomic development) that takes place under all H-SSPs in most counties (Figure 7.3c). Aligned with the projections of vulnerability, autonomous adaptation is expected to be greater under H-SSP1 and H-SSP5 than under other scenarios, although relatively low (<15% in average) under all scenarios in certain counties such as Montgomery and Fort Bend Counties. This underlines the need for planned adaptation under all types of socioeconomic development.
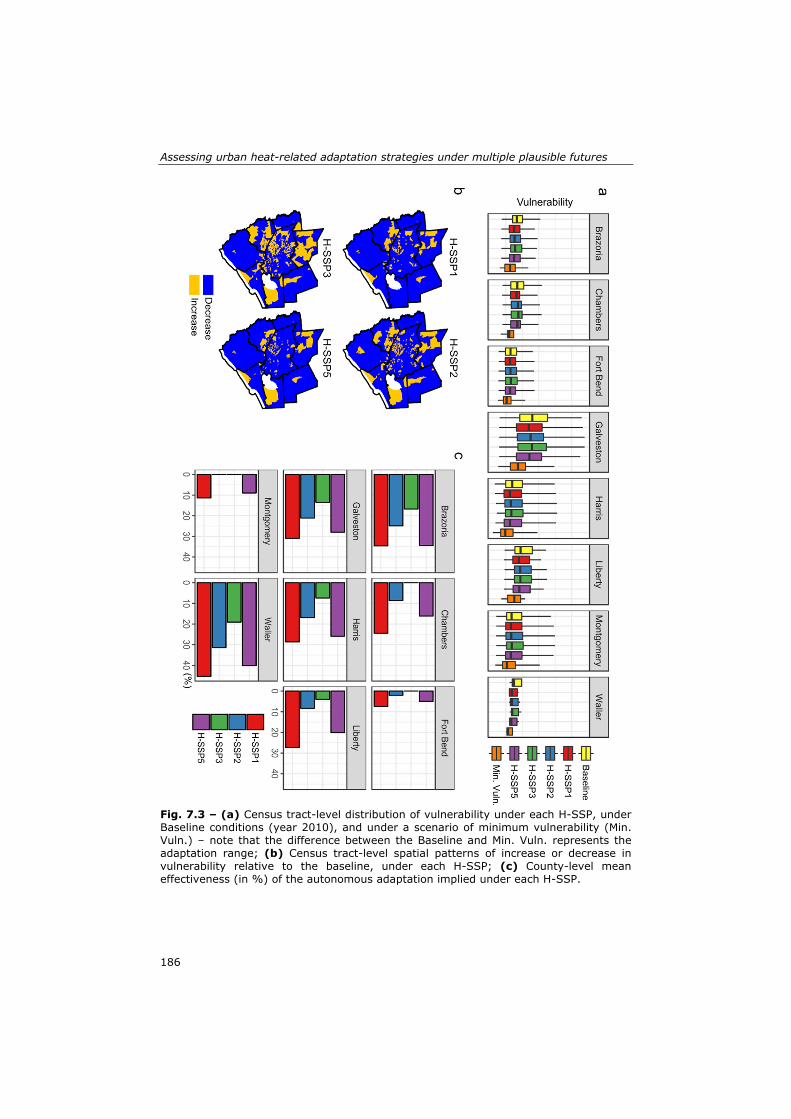
Assessing urban heat-related adaptation strategies under multiple plausible futures
186
Fig. 7.3 – (a) Census tract-level distribution of vulnerability under each H-SSP, under Baseline conditions (year 2010), and under a scenario of minimum vulnerability (Min. Vuln.) – note that the difference between the Baseline and Min. Vuln. represents the adaptation range; (b) Census tract-level spatial patterns of increase or decrease in vulnerability relative to the baseline, under each H-SSP; (c) County-level mean effectiveness (in %) of the autonomous adaptation implied under each H-SSP.
Chapter 7
187
7.4.4 Adaptation-driven decrease in vulnerability
We assessed the ability of different adaptation strategies to decrease future vulnerability, under each H-SSP separately. Results (Figure 7.4a) show that there is no one-size-fits all adaptation strategies (AS) and that the effectiveness of a given AS is highly dependent on (i) the place (here the County) it is implemented, (ii) the socioeconomic scenario considered, (iii) its ambitiousness, and (iv) its target. Overall, results show that a highly ambitious AS targeting social isolation (AS-soc-H) is the most effective across all counties (effectiveness >20% in most counties and reaching >30% in Liberty and Montgomery Counties) and under all scenarios. Nevertheless, in Harris County, where most of Houston’s population is located and where the shares of persons in poverty and of households without AC are the highest, AS targeting poverty (AS-pov) and prevalence of AC (AS-AC) are the most effective adaptation strategies (effectiveness ~15—25%), particularly under H-SSP2 and H-SSP3 scenarios. Under the latter scenarios, AS-pov and AS-AC have an effectiveness ~2 to 3 times higher than under H-SSP1 and H-SSP5, highlighting the different effectiveness of a same AS across multiple plausible futures. We also explored the adaptation of combinations of AS, respectively combinations of AS associated with low ambitiousness (AS-all-L) and with high ambitiousness (AS-all-H). Census tract-level effectiveness show great differences across Census tracts, highlighting the place-dependency of any AS’s effectiveness (Figure 7.4b). Both AS-all-L and AS-all-H show an effectiveness >40% in urban Census tracts of Harris County, while in most other Census tracts only AS-all-H appears to be an effective collection of adaptation strategies. In the same way as the effectiveness of a single AS, the effectiveness of combined AS varies across scenarios. It is crucial to point out that the effectiveness of planned adaptation strategies is complemented by the autonomous adaptation depicted under each H-SSP. We compared the mean total adaptation effectiveness (that is, the sum of autonomous and planned adaptation) across counties, H-SSPs, and ambitiousness of planned adaptation. Results highlight the effectiveness of highly ambitious planned adaptation, relative to that of autonomous adaptation (Figure 7.4c). Autonomous adaptation plays a secondary role in most counties and under all scenarios (particularly under H-SSP2 and H-SSP3). This underlines the ability of a highly ambitious adaptation strategy to decrease future vulnerability under multiple plausible socioeconomic trajectories, even under those that depict highly vulnerable populations with weak autonomous adaptation. On the contrary, planned adaptation with low ambitiousness will be much less effective than the spontaneous autonomous adaptation in most Counties and under most scenarios.
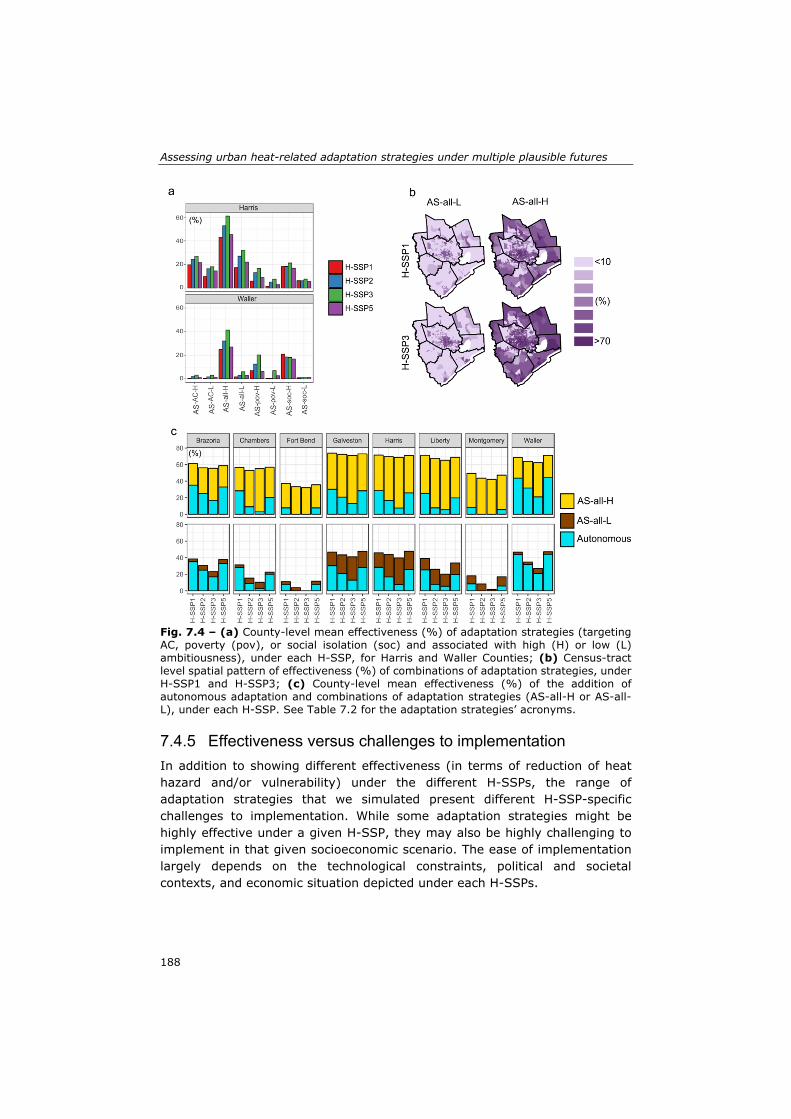
Assessing urban heat-related adaptation strategies under multiple plausible futures
188
Fig. 7.4 – (a) County-level mean effectiveness (%) of adaptation strategies (targeting AC, poverty (pov), or social isolation (soc) and associated with high (H) or low (L) ambitiousness), under each H-SSP, for Harris and Waller Counties; (b) Census-tract level spatial pattern of effectiveness (%) of combinations of adaptation strategies, under H-SSP1 and H-SSP3; (c) County-level mean effectiveness (%) of the addition of autonomous adaptation and combinations of adaptation strategies (AS-all-H or AS-all-L), under each H-SSP. See Table 7.2 for the adaptation strategies’ acronyms.
7.4.5 Effectiveness versus challenges to implementation
In addition to showing different effectiveness (in terms of reduction of heat hazard and/or vulnerability) under the different H-SSPs, the range of adaptation strategies that we simulated present different H-SSP-specific challenges to implementation. While some adaptation strategies might be highly effective under a given H-SSP, they may also be highly challenging to implement in that given socioeconomic scenario. The ease of implementation largely depends on the technological constraints, political and societal contexts, and economic situation depicted under each H-SSPs.
Chapter 7
189
We related the quantitative effectiveness of adaptation strategies (categorized into low, medium, and high effectiveness – see details in Table S7.3) with their challenges to implementation, under each H-SSPs. The resulting matrix – which focuses only on Harris County since we demonstrated that the effectiveness of adaptation strategies largely differs across counties – highlights the disparities of both effectiveness and challenges to implementation across scenarios (Figure 7.5). While most AS present low challenges to implementation under H-SSP1 (because of a large decrease in economic inequalities, increased access to affordable AC and increased societal cohesion and social policies), their effectiveness is low – with the exception of highly ambitious AS targeting the prevalence of AC and the social isolation. Contrariwise, most AS show a high effectiveness under H-SSP3, but are associated with high challenges to implementation (e.g. AS-AC-H, AS-urb, and AS-pov-H), due to the increased economic inequalities, decreased social policies, decreased access to affordable AC, and low technological development depicted under this scenario. Under H-SSP5 – which depicts large increase in technological development and strong economic growth – AS-urb and AS-AC-H are both highly effective and associated with low to medium challenges to implementation. The main goal of such an approach is to pinpoint adaptation strategies that are both effective and least challenging to implement under all plausible futures. In the case of Harris County – where most population lives – a highly ambitious adaptation strategy targeting social isolation is effective under all scenarios (medium or high effectiveness) and present low to medium challenges to implementation under all scenarios. This makes it the most tangible adaptation strategy. A strong increase in the prevalence of AC is also associated with a high effectiveness under all scenarios, but would be highly challenging to implement under a scenario of economic slowdown (H-SSP3). It is worth mentioning that because those adaptation strategies are targeting vulnerability, their effectiveness is independent to the climatic pathway (only the influence of adaptation strategies targeting urbanization (AS-urb) is RCP-dependent).
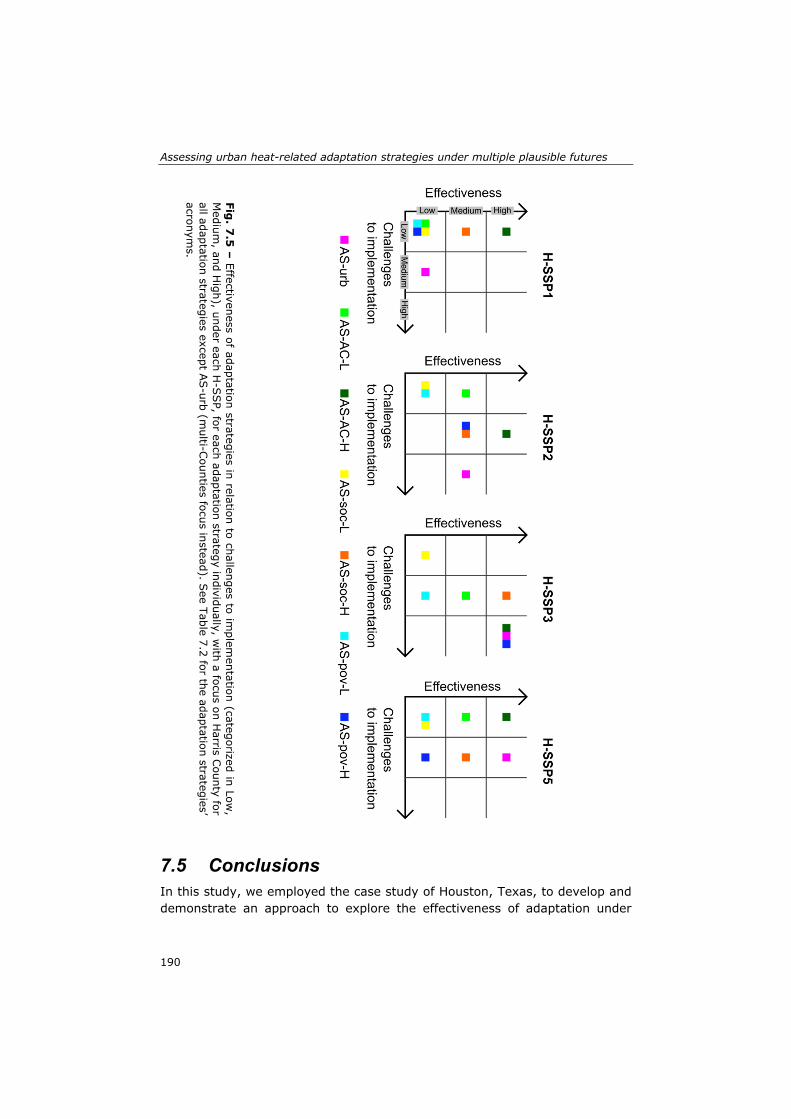
Assessing urban heat-related adaptation strategies under multiple plausible futures
190
7.5 Conclusions In this study, we employed the case study of Houston, Texas, to develop and demonstrate an approach to explore the effectiveness of adaptation under
Fig. 7
.5 –
Effectiveness of adaptation strategies in relation to challenges to implem
entation (categorized in Low,
Medium
, and High), under each H
-SSP, for each adaptation strategy individually, w
ith a focus on Harris C
ounty for all adaptation strategies except A
S-urb (m
ulti-Counties focus instead). S
ee Table 7.2 for the adaptation strategies’ acronym
s.
Chapter 7
191
multiple plausible futures. Using a heat risk model (Heaton et al., 2014) in combination with RCP-based urban climate projections and H-SSP-based projections of vulnerability, we assessed the effectiveness of both autonomous and planned adaptation (related to the reduction of the UHI, decrease in poverty, increase in AC prevalence, and decrease in social isolation) under each H-SSPs. Balancing the effectiveness of each adaptation with their challenges to implementation we demonstrated that a highly ambitious adaptation strategy targeting social isolation is a potentially effective for Houston area (especially Harris County, where most people are located) and easy-to-implement adaptation strategy under most scenarios. Such a result is in line with a Houston stakeholders survey (Wilhelmi and Hayden, 2016) which showed that, according to stakeholders, (i) community outreach and interventions are effective activities for extreme heat response and (ii) strengthening community-based adaptation is an effective pathway to decrease future heat-related vulnerability. We also demonstrated that adaptation strategies’ effectiveness is largely dependent on (i) the aspect of the heat risk it targets, (ii) the type of socioeconomic development, (iii) the level of climate change – only in the case of adaptation strategies targeting the heat hazard, (iv) the communities it targets, and (v) the area where it is implemented. The two latter aspects underline the need to design adaptation plans that offer diverse strategies and assistances. The SSP-RCP framework appears to be a useful tool to explore the effectiveness of adaptation strategies in a context of socioeconomic and climatic uncertainty (Cradock-Henry et al., 2018), particularly when embedded within the scenario matrix as a third axis. This particularly allows for comparing the effectiveness across multiple scenarios. When exploring adaptation strategies under all the H-SSPs, we viewed as critical to account for the challenges to implementation under each H-SSPs (which can be considered as the consistency between a given scenario and adaptation strategy), as adaptation is restrained and conditioned by technological and institutional capacities and availability of resources (Berkhout, 2012). Quantitative assessment of adaptation strategies in any heat-related risk is constrained by the current understanding of the relationships between urban heat hazard, vulnerability, and risk (Wilhelmi and Hayden, 2010). In this particular case study, our ability to explore the effectiveness of adaptation strategies quantitatively was limited by the low number of predictive variables of heat-health risk depicted in the Heaton et al. (2014) model. Future research could investigate adaptation strategies targeting other potential drivers of individual vulnerability (e.g. education and pre-existing medical conditions) and drivers of institutional adaptive capacity (e.g. effectiveness of early
Assessing urban heat-related adaptation strategies under multiple plausible futures
192
warning systems and inter-agencies cooperation). Further research would also benefit from the use of heat risk models that integrate a larger number of predictive variables upon which the effectiveness of a wider range of adaptation strategies could be assessed (Inostroza et al., 2016; Wolf and McGregor, 2013). In addition to being constrained by the predictive variables of the heat risk model we employed, our quantitative assessment of adaptation strategies was also largely limited by the absence of quantified targets within existing adaptation plans. We were also greatly limited by the lack of empirical evidence on the quantitative and practical effect of governmental policies and community-based programs targeting specific aspects of heat-related vulnerability. Therefore, we used a simplistic approach to quantify the influence of different adaptation strategies. This largely underestimates the complexity of adaptation with regard to its different actors involved, actions required, constraints, and time lag of implementation (Holman et al., 2019). Further research to enhance the ability of climate impact models to represent the multi-facet aspects of adaptation would be highly beneficial. To achieve this, we view stakeholders’ engagement to be a critical activity (Wilhelmi and Hayden, 2016). Local stakeholders are likely to provide valuable context-specific insights on adaptation strategies, particularly concerning (i) their local relevance, (ii) their influence on certain aspects of heat-health risk, and (iii) their associated requirements and constraints to implementation under different socioeconomic trajectories. The wide range of translation methods (Mallampalli et al., 2016) also shows great potential to quantify the stakeholders’ insights on the quantitative effect of adaptation strategies on certain aspects of heat-health risk. Building upon this work, further research could make use of the richness of existing urban climate models to assess the ability of specific “hard” adaptation measures (e.g. implementing green walls and vegetated rooftops, painting roofs in white, revitalizing urban streams) to decrease the UHI and the heat hazard under different climate scenarios. Further research could also make use of the SSP-RCP framework to assess the costs and benefits of adaptation strategies under multiple SSP-RCP combinations (van Vuuren et al., 2014), with particular attention given to SSP-specific costs of implementation of adaptation measures. Finally, further research could explore maladaptation and trade-offs between adaptation and mitigation (Juhola et al., 2016). This is particularly crucial when suggesting increase in AC prevalence as an adaptation strategy (Salamanca et al., 2014). Although challenging, these research activities are critical to provide local policy-makers and practitioners with more comprehensive and robust information about the adaptation strategies that are required to increase urban resilience under uncertain climatic and socioeconomic conditions.

193
Chapter 8 Conclusions and outlook
Conclusions and outlook
194
8.1 Main achievements and findings Throughout this 4-year doctoral thesis, I have advanced the use of socioeconomic scenarios in IAV studies and the operationalization of the SSP-RCP framework for assessments of future heat stress risk at multiple temporal and spatial scales and in various contexts. Moreover, I have demonstrated the role socioeconomic development plays in shaping future climate-related risks, and particularly the influence of different types of socioeconomic development on future heat stress risk in different regions, in a context of climate change. This section (i) synthesizes the main achievements of this doctoral thesis, (ii) scrutinizes how – and to which extent – this doctoral thesis has addressed the scholarly- and policy-relevant research goals outlined in section 1.3., and (iii) explores how this doctoral research fits within – and contributes to – the state-of-the-art literature in IAV studies.
8.1.1 Extending the global SSPs
The need to develop extended SSPs – that is, to contextualize the global SSPs for a given region and/or sector (van Ruijven et al., 2014) – to strengthen their suitability in regional and/or sectoral studies and to enhance their legitimacy and intake by local stakeholders has been widely acknowledged by the IAV community over the past few years. This has resulted in a flourishing literature on regional and sectoral extensions of the SSPs (see section 1.2.3.2. for a few examples), to which a part of this doctoral dissertation has contributed in the following way: (i) development of a new and innovative method to extend the SSPs and (ii) exemplification of extended SSPs at regional to intra-city scale. New and innovative method to extend the SSPs. Existing methods to extend the SSPs can be classified into three broad categories. First, there are scenario development methods based on a highly participatory process with the involvement of local stakeholders and/or population through workshops or other participatory activities (e.g. Nilsson et al. 2015, 2017). Such bottom-up approach usually leads to the development of local scenarios that are subsequently mapped against / matched with the global SSPs (Palazzo et al., 2017). While this approach allows detailed and highly-contextualized local socioeconomic scenarios to be developed, it is very time- and resources-intensive due to the need to convene workshops and other participatory activities and necessitates a careful post priori matching with the global SSPs to ensure consistency across scales (Kemp-Benedict et al., 2014; Palazzo et al., 2017). Second, there are scenario development methods based on the review of historical trends and existing scenarios to interpret the global SSPs’ narratives for a given sector and/or region (e.g. Absar and Preston, 2015; Mogollón et
Chapter 8
195
al., 2018; Reimann et al., 2018). These are quick to implement but fall short in using the full potential of existing scenarios and in accounting for local knowledge (Kemp-Benedict et al., 2014). Third, there are scenario development methods based on a mix of the two above approaches, in which the global SSPs are first extended using a review of historical trends and existing scenarios and are subsequently refined through an iterative process with key stakeholders through questionnaires and/or interviews (e.g. Kamei et al., 2016; Kok et al., 2019). In this doctoral thesis, I developed a new and innovative method to extend the SSPs that complements the aforementioned approaches. This method, detailed in Chapter 2, heavily relies on existing scenario studies, of which the potential usefulness has often been pointed out but the (re)use largely underestimated so far (Hunt et al., 2012; Kok et al., 2013). Such an approach offers the possibility to match several sets of existing scenarios – in a highly detailed, structured, and systematic manner – to develop extended SSPs for a given region and/or sector. Exemplifying this approach for Europe, I demonstrated its usefulness and produced extended SSPs for Europe that are highly consistent with the global SSPs and that contain very detailed narratives in multiple sectors pertaining to heat-related vulnerability in Europe, such as land use, demography, and territorial development. The obvious advantages of this innovative scenario development method lie in (i) its ease of implementation – provided that local socioeconomic scenarios already exist – which is low time- and resources-intensive (because no participatory processes are required) and (ii) its high level of quantification, readily enabled by the co-use of existing quantitative projections from the existing scenario sets used in the matching. Such high level of quantification proved very useful to project future heat-related vulnerability in Europe at the subnational scale (see Chapters 2 and 3) which subsequently facilitated the assessment of future heat stress risk under multiple SSP-RCP combinations, as described in Chapter 3. In view of the detailed narratives and of the high level of quantification it provides – combined with its cost efficiency and the great confidence in the consistency with the global SSPs – this approach shows great potential to be taken on board by the IAV community to develop regional and/or sectoral SSPs. It should be pointed out, however, that this approach has yet to be used by the IAV community, since no published studies has employed this approach as of mid-2019 (exception made of Lino et al. (2019) – which I co-authored).
Conclusions and outlook
196
Exemplification of extended SSPs at the city scale. Regional extensions of the global SSPs have rapidly expanded in the literature over the past few years, with for instance regional extended SSPs for the Barents region (Nilsson et al., 2017), the Baltic Sea (Zandersen et al., 2019), Southeast US (Absar and Preston, 2015), West-Africa (Palazzo et al., 2017), Europe (Rohat et al., 2018; Kok et al., 2019), and New Zealand (Frame et al., 2018). However, the extension of SSPs in urban areas have been very scarce until now, with to my knowledge only two published sets of extended at the city scale, in Tokyo, Japan (Kamei et al., 2016) and Boston, US (Lino et al., 2019) – although other city-scale extensions are currently ongoing, e.g. in the city of Flensburg, Germany (Reimann et al., 2019). This doctoral dissertation contributed to fill this lack of extended SSPs at the city scale by developing extended SSPs for the city of Houston, Texas. This set of city-scale SSPs, described in Chapter 6, was developed using an existing mixed approach in which global SSPs are first extended using a review of historical trends and local scenarios and subsequently refined through an iterative process with local stakeholders using an online questionnaire. Such an approach proved very useful to account for the local drivers of socioeconomic development, which are indispensable at the city scale. In the case of Houston, important city-level drivers of development are for instance the immigration of the Hispanic community, the oil and gas industries, and the potential implementation of urban zoning regulations – which are not depicted in the global SSPs. Other locally relevant elements for heat-related vulnerability were also extended under the scenarios, such as access to air conditioning, social isolation, and social policies. During the scenario development process, the engagement with local stakeholders (around 20) proved particularly useful to identify inconsistencies in the extended scenarios. Spotting and fixing inconsistencies is of utmost importance since the extended SSPs’ narratives are the starting point for the quantification process of certain variables. Altogether, the large difference between the global and city-scale SSPs – in terms of drivers of socioeconomic development and relevant elements – highlights the crucial need to develop extended SSPs when exploring future climate-related risk at the local- and city-scale under the SSP-RCP framework. Throughout the development of extended SSPs for Houston, this doctoral thesis presents a concrete example of extension of SSPs at the city-scale and paves the way towards more systematic extension of the SSPs in local IAV studies.
Chapter 8
197
8.1.2 Projecting future heat-related vulnerability
At the same time as recognizing the need to account for socioeconomic scenarios and projections in future IAV studies, the research community has also recognized the wide range of challenges in capturing the temporal dynamics of socioeconomic systems (Preston et al., 2011; Birkmann et al., 2013; de Sherbinin, 2014; van Ruijven et al., 2014). The short review of IAV studies using the SSP-RCP framework presented in Chapter 3 shows that the scarcity of socioeconomic projections consistent with the SSPs and the lack of methods to quantify the SSPs are the main reasons explaining the lack of use of socioeconomic projections in IAV studies and the little diversity in the socioeconomic variables accounted for (usually only population and GDP). Throughout this doctoral thesis, I developed, in addition to reviewing the existing approaches to project future socioeconomic conditions under the SSPs (see Chapter 3), a number of tools and innovative approaches to project both exposure and the wide range of drivers of heat-related vulnerability under the SSPs (or under extended SSPs) at multiple temporal and spatial scales and in different contexts. These tools, for the most part, make use of the large diversity of existing projection methods in other research fields (such as demography, economy, public health, social studies, and urban planning) – which I consider as being crucial in order to provide reliable tools and projections. The methods to project future exposure and heat-related vulnerability that were specifically developed and applied in this doctoral thesis are: Co-use of quantification of existing scenario set. This approach, which
requires to match existing scenarios with the global SSPs beforehand, enables to readily quantify the extend SSPs for a wide range of environmental (non-climatic) and socioeconomic variables. This approach, described in Chapter 2 and applied in Chapters 2 and 3, led to the quantification (at the subnational scale and up to 2050) of variables such as population growth, internal migration, life expectancy, migratory flows, accessibility per travel mode, urbanization, land use, water withdrawal, biodiversity index, and many more ecosystems-related variables that were not directly relevant for heat-related vulnerability. Such quantification of the European extended SSPs, readily available, proved useful to explore future vulnerability (rather a broader social vulnerability than heat-related vulnerability specifically) in Europe under varying levels of socioeconomic development, as depicted in Chapters 2 and 3.
Expert elicitation. For a certain number of drivers of heat-related
vulnerability – e.g. related to health conditions, governance efficiency, and
Conclusions and outlook
198
human behavior – projection methods are not available or not yet well developed. In such cases, an expert elicitation approach can prove very useful to obtain reliable and SSP-consistent projections for these variables. The expert elicitation approach presented in Chapter 3 made use of the fuzzy set theory (Eierdanz et al., 2008) to quantify experts’ opinions on future overweight prevalence and proportion of elderly living alone under the European extended SSPs. Combined with correlation analyses (using current observations), this quantitative input from experts proved crucial to project both future overweight prevalence and proportion of elderly living alone at the subnational scale up to 2050. These projections were crucially needed to assess future heat stress risk in Europe, as described in Chapter 4. The expert elicitation approach – using the fuzzy set theory or the wide range of other quantification techniques (Mallampalli et al., 2016) – shows great potential to quantify drivers of heat-related vulnerability for which models are lacking.
City scale modelling. Being quantified at the national scale, the global SSPs crucially lack of quantitative information at the city scale. Moreover, the development of cities – e.g. in terms of population and economic growth – often differs from the broader socioeconomic development in which the city is located, hence rendering difficult and misleading any simple city-level statistical downscaling of the national projections under the global SSPs. This highlights the need to develop methods at the city-scale to quantify key socioeconomic drivers of future heat stress risk in urban areas. In this doctoral dissertation, I developed a spatial and a non-spatial approach to project the future population size of large African cities under the SSPs, up to 2100. This ensemble of method, described in Chapter 5, can be replicable to any city worldwide if current estimates of its population size and spatial boundaries exist. The use of two distinct approaches enables to account for uncertainties in the modeling techniques as well as in the delimitation of cities’ boundaries (based on administrative areas or on the contiguity of the urban extent), which is an important issues when referring to urban areas. While several other approaches have been developed over the past few years to spatially project future population and urbanization under the SSPs (e.g. Jones and O’Neill, 2016; Gao and O’Neill, 2019; Li et al., 2019), none specifically focuses on cities and city-level projections, hence the city-scale method developed in Chapter 5 complements nicely other existing approaches.
Intra-city scale modelling. As pointed out in Chapter 1, cities are places
where the impact of extreme heat may be the greatest, mainly because they host most of the world’s populations and assets and contribute to an
Chapter 8
199
increased heat hazard through the urban heat island. It is therefore crucial to develop methods to project future heat-related exposure and vulnerability in city, and more specifically at the intra-city scale. In this doctoral dissertation, I built upon existing sectoral modelling approaches to develop an ensemble of tools to project future heat-related exposure and vulnerability at the Census tract level in the US, and exemplified these approaches for the city of Houston, Texas, up to 2050 under four extended SSPs. These methods, described in Chapter 6, consist of (i) adjustments of existing demographic approaches, e.g. the Hamilton-Perry method (Swanson et al., 2010) and the headship-based approach (Haurin and Rosenthal, 2004), and (ii) simple correlation models (e.g. linear, cubic, or multiple), relying on the data-rich environment of the US. These methods proved very useful to project the wide range of drivers of heat-related vulnerability at the intra-urban scale, such as race/ethnicity, age, social isolation, air conditioning prevalence, poverty, and urban land use. Another key aspect of these methods lies in that they ensure the quantitative consistency with the national-scale quantification of the global SSPs. Such a multi-scale consistency is the backbone of local-scale applications of the SSP-RCP framework (Ebi et al., 2013; van Ruijven et al., 2014). Finally, being readily available and easy-to-implement, this suite of sectoral modelling approaches shows great potential to be taken on board by the IAV community to explore future climate-related risk at the local and intra-urban scale. This is greatly needed since there is currently an outstanding gap between the large number of global and regional-scale risk assessments and the few number of local and city-scale risk assessments.
Altogether, this set of method to project future heat-related exposure and vulnerability under the SSPs – and their concrete exemplification in case studies spanning different scales and contexts – complements nicely the rapidly growing range of methods with similar goals depicted in the literature. This quickly expanding list of socioeconomic modelling approaches that can be readily used by IAV researchers to explore future exposure and vulnerability under the SSPs – at various temporal and spatial scales and in different contexts – shows great potential to strengthen the use of socioeconomic scenarios and projections in IAV studies and to support a more systematic and consistent consideration of future vulnerability.
8.1.3 Providing concrete application of the SSP-RCP framework
The number of IAV studies that employ the SSP-RCP framework to explore future climate-related risks has been rapidly growing since the publication of the global SSPs’ narratives and their national-scale quantification (O’Neill et al., 2014, 2017; IIASA, 2016). Up until now and to my knowledge, roughly 180
Conclusions and outlook
200
different IAV studies have explored future climate-related risks on public health using the SSP-RCP framework (Rohat et al., in prep.), with 28 different studies focusing specifically on future heat stress risk. Among these 28 studies, three are parts of this doctoral thesis and have been presented in Chapters 4, 5, and 6. More specifically, I first presented in Chapter 4 an assessment of the future number of persons at high risk of heat stress in Europe, at the subnational scale. I then presented in Chapter 5 an assessment of future population exposure to dangerous heat in 173 large African cities, and finally introduced in Chapter 6 an assessment of future heat-related mortality in Houston, Texas, at the intra-city scale. These three concrete applications of the SSP-RCP framework to explore future heat stress risk complement the current literature in two different ways. locations. Up until now, most of the existing studies has focused on the global scale (13 out of 28 – e.g. Dong et al., 2015; Liu et al., 2017; Coffel et al., 2018; Jones et al., 2018; Russo et al., 2019) or on the regional and national scale (e.g. Mishra et al., 2017; Harrington and Otto, 2018; Morefield et al., 2018), with only very few applications at the subnational- and city-scale (e.g. Dholakia et al., 2015; Anderson et al., 2018; Lee et al., 2018). The studies presented in this doctoral dissertation provides a first application at the European scale, in African cities, and at the intra-city scale in Houston (Figure 8.1). It is worth pointing out that Marsha et al. (2018) have also explored future heat stress risk in Houston, but this study was not spatially explicit and not conduced at the intra-city scale.
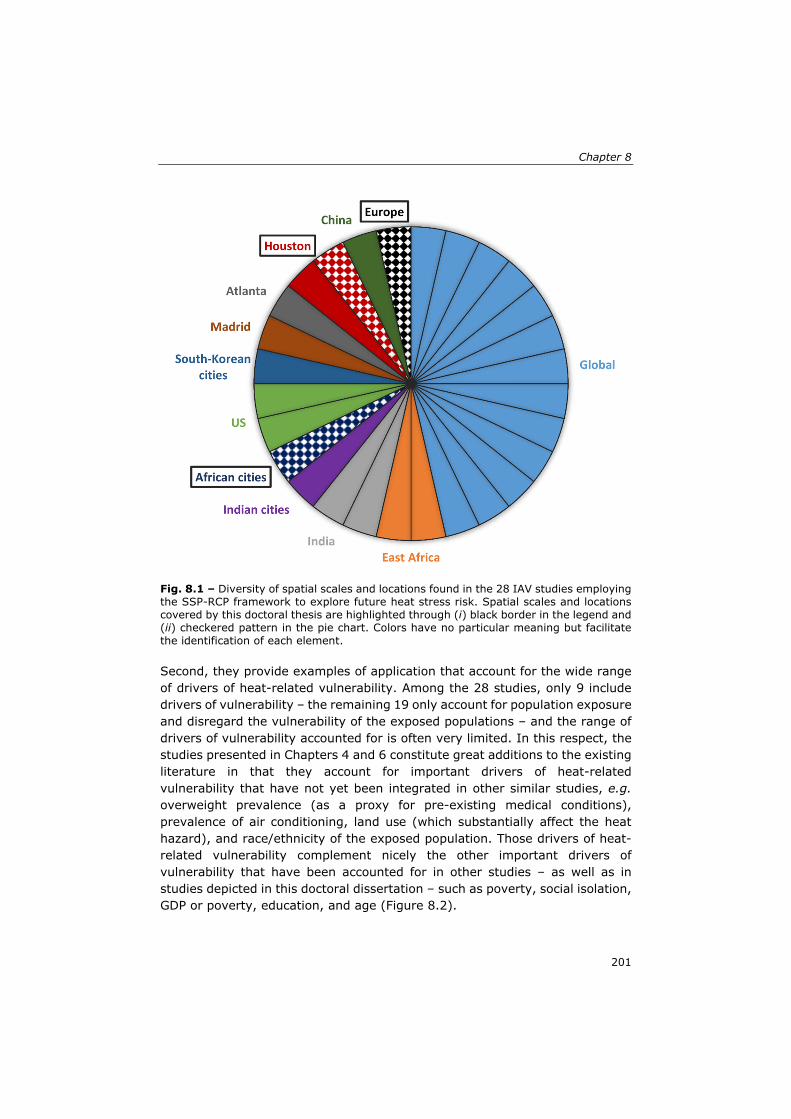
Chapter 8
201
Fig. 8.1 – Diversity of spatial scales and locations found in the 28 IAV studies employing the SSP-RCP framework to explore future heat stress risk. Spatial scales and locations covered by this doctoral thesis are highlighted through (i) black border in the legend and (ii) checkered pattern in the pie chart. Colors have no particular meaning but facilitate the identification of each element. Second, they provide examples of application that account for the wide range of drivers of heat-related vulnerability. Among the 28 studies, only 9 include drivers of vulnerability – the remaining 19 only account for population exposure and disregard the vulnerability of the exposed populations – and the range of drivers of vulnerability accounted for is often very limited. In this respect, the studies presented in Chapters 4 and 6 constitute great additions to the existing literature in that they account for important drivers of heat-related vulnerability that have not yet been integrated in other similar studies, e.g. overweight prevalence (as a proxy for pre-existing medical conditions), prevalence of air conditioning, land use (which substantially affect the heat hazard), and race/ethnicity of the exposed population. Those drivers of heat-related vulnerability complement nicely the other important drivers of vulnerability that have been accounted for in other studies – as well as in studies depicted in this doctoral dissertation – such as poverty, social isolation, GDP or poverty, education, and age (Figure 8.2).
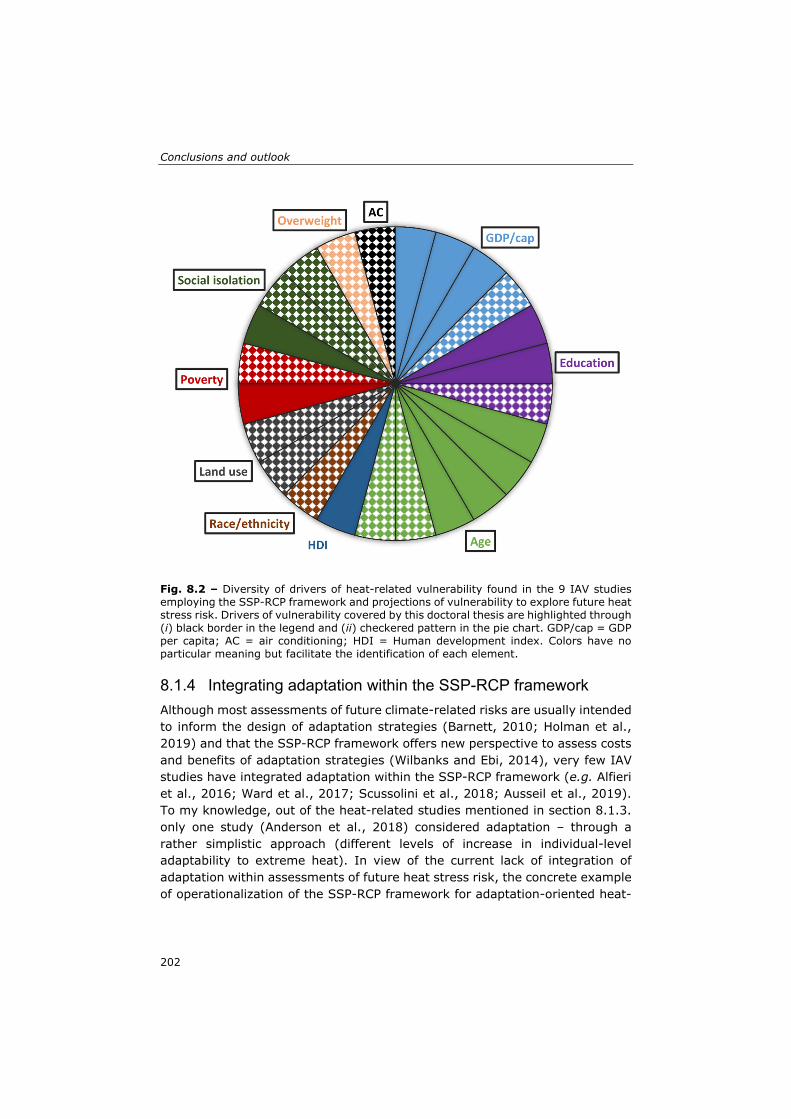
Conclusions and outlook
202
Fig. 8.2 – Diversity of drivers of heat-related vulnerability found in the 9 IAV studies employing the SSP-RCP framework and projections of vulnerability to explore future heat stress risk. Drivers of vulnerability covered by this doctoral thesis are highlighted through (i) black border in the legend and (ii) checkered pattern in the pie chart. GDP/cap = GDP per capita; AC = air conditioning; HDI = Human development index. Colors have no particular meaning but facilitate the identification of each element.
8.1.4 Integrating adaptation within the SSP-RCP framework
Although most assessments of future climate-related risks are usually intended to inform the design of adaptation strategies (Barnett, 2010; Holman et al., 2019) and that the SSP-RCP framework offers new perspective to assess costs and benefits of adaptation strategies (Wilbanks and Ebi, 2014), very few IAV studies have integrated adaptation within the SSP-RCP framework (e.g. Alfieri et al., 2016; Ward et al., 2017; Scussolini et al., 2018; Ausseil et al., 2019). To my knowledge, out of the heat-related studies mentioned in section 8.1.3. only one study (Anderson et al., 2018) considered adaptation – through a rather simplistic approach (different levels of increase in individual-level adaptability to extreme heat). In view of the current lack of integration of adaptation within assessments of future heat stress risk, the concrete example of operationalization of the SSP-RCP framework for adaptation-oriented heat-
Chapter 8
203
related risk depicted in Chapter 7 of this doctoral thesis is a substantial contribution to this research field. In the study described in Chapter 7, I used the case study of Houston to develop and demonstrate an approach to assess the effectiveness and challenges to implementation of different heat-related adaptation strategies under multiple plausible futures. This method proved very useful to demonstrate – in a quantitative manner – that the effectiveness of heat-related adaptation strategies in Houston is highly dependent on the targeted aspect of heat stress risk (i.e., hazard, exposure, or vulnerability), the type of socioeconomic development, the level of climate change, and the place where adaptation strategies are implemented. Throughout this example, I showed that the integration of adaptation strategies as a third matrix of the SSP-RCP framework (e.g. through SPAs) is a useful and promising approach to explore their effectiveness and challenges to implementation across multiple plausible futures. Although associated with a number of limitations and caveats (described in section 7.5.), this approach to explore the effectiveness and challenges to implementation of adaptation strategies in a context of climatic and socioeconomic uncertainty shows great potential to be taken on board by the IAV community, particularly in local-scale case studies where concrete heat-related adaptation strategies can be designed in adequacy with local institutional capacities and availability of resources (Berkhout, 2012; Cradock-Henry et al., 2018).
8.1.5 Detecting severe increase in heat stress risk
In addition to advancing the operationalization of the SSP-RCP framework in climate-related risks assessment – which is a scholarly-focused contribution – this doctoral thesis also contributes to a better understanding of the future impact of extreme heat. By projecting future heat stress risk in three different case studies – namely Europe (Chapter 4), African cities (Chapter 5), and Houston (Chapter 6) – this work sheds light on the forthcoming impacts of extreme heat in a context of climate change and socioeconomic development in these regions. More broadly, together with similar studies that focus on other regions of the globe and that use different approaches, this doctoral thesis strengthen our current understanding and characterization of future heat stress risk worldwide. Such a strong and robust knowledge of the forthcoming impacts of rising temperatures across the globe is of utmost importance to (i) raise awareness about the impacts, (ii) minimize them, and (iii) eventually cope with them.
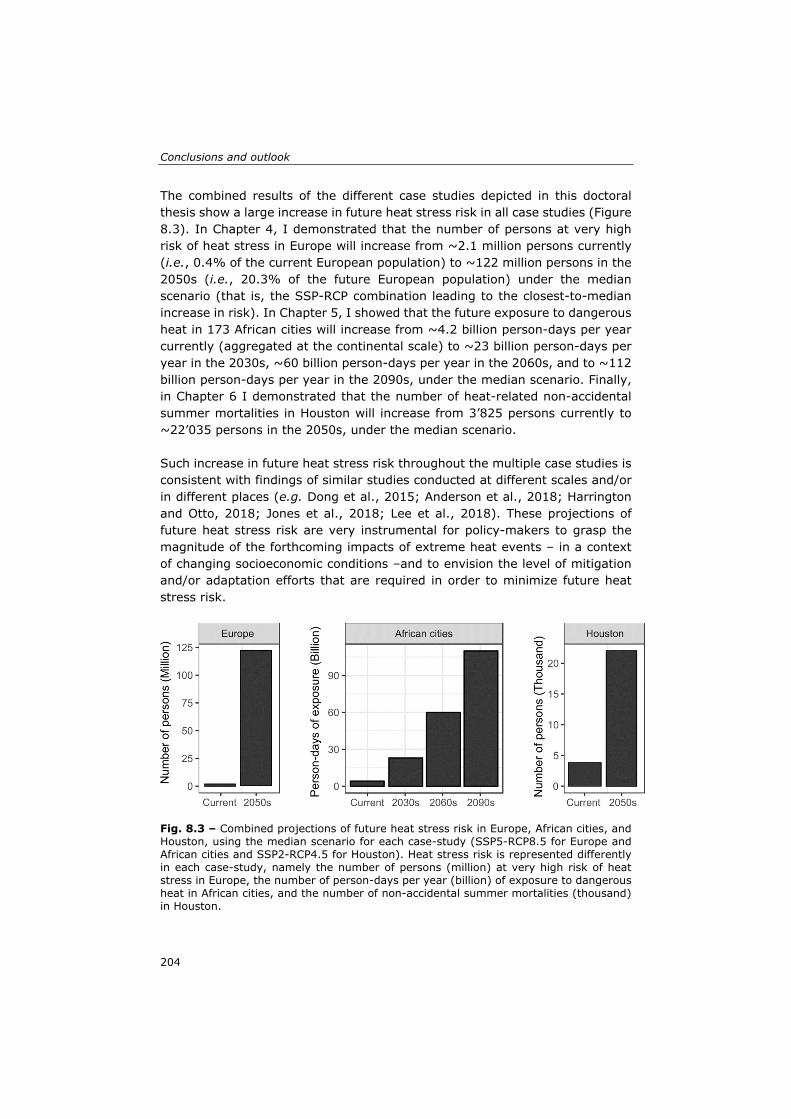
Conclusions and outlook
204
The combined results of the different case studies depicted in this doctoral thesis show a large increase in future heat stress risk in all case studies (Figure 8.3). In Chapter 4, I demonstrated that the number of persons at very high risk of heat stress in Europe will increase from ~2.1 million persons currently (i.e., 0.4% of the current European population) to ~122 million persons in the 2050s (i.e., 20.3% of the future European population) under the median scenario (that is, the SSP-RCP combination leading to the closest-to-median increase in risk). In Chapter 5, I showed that the future exposure to dangerous heat in 173 African cities will increase from ~4.2 billion person-days per year currently (aggregated at the continental scale) to ~23 billion person-days per year in the 2030s, ~60 billion person-days per year in the 2060s, and to ~112 billion person-days per year in the 2090s, under the median scenario. Finally, in Chapter 6 I demonstrated that the number of heat-related non-accidental summer mortalities in Houston will increase from 3’825 persons currently to ~22’035 persons in the 2050s, under the median scenario. Such increase in future heat stress risk throughout the multiple case studies is consistent with findings of similar studies conducted at different scales and/or in different places (e.g. Dong et al., 2015; Anderson et al., 2018; Harrington and Otto, 2018; Jones et al., 2018; Lee et al., 2018). These projections of future heat stress risk are very instrumental for policy-makers to grasp the magnitude of the forthcoming impacts of extreme heat events – in a context of changing socioeconomic conditions –and to envision the level of mitigation and/or adaptation efforts that are required in order to minimize future heat stress risk.
Fig. 8.3 – Combined projections of future heat stress risk in Europe, African cities, and Houston, using the median scenario for each case-study (SSP5-RCP8.5 for Europe and African cities and SSP2-RCP4.5 for Houston). Heat stress risk is represented differently in each case-study, namely the number of persons (million) at very high risk of heat stress in Europe, the number of person-days per year (billion) of exposure to dangerous heat in African cities, and the number of non-accidental summer mortalities (thousand) in Houston.
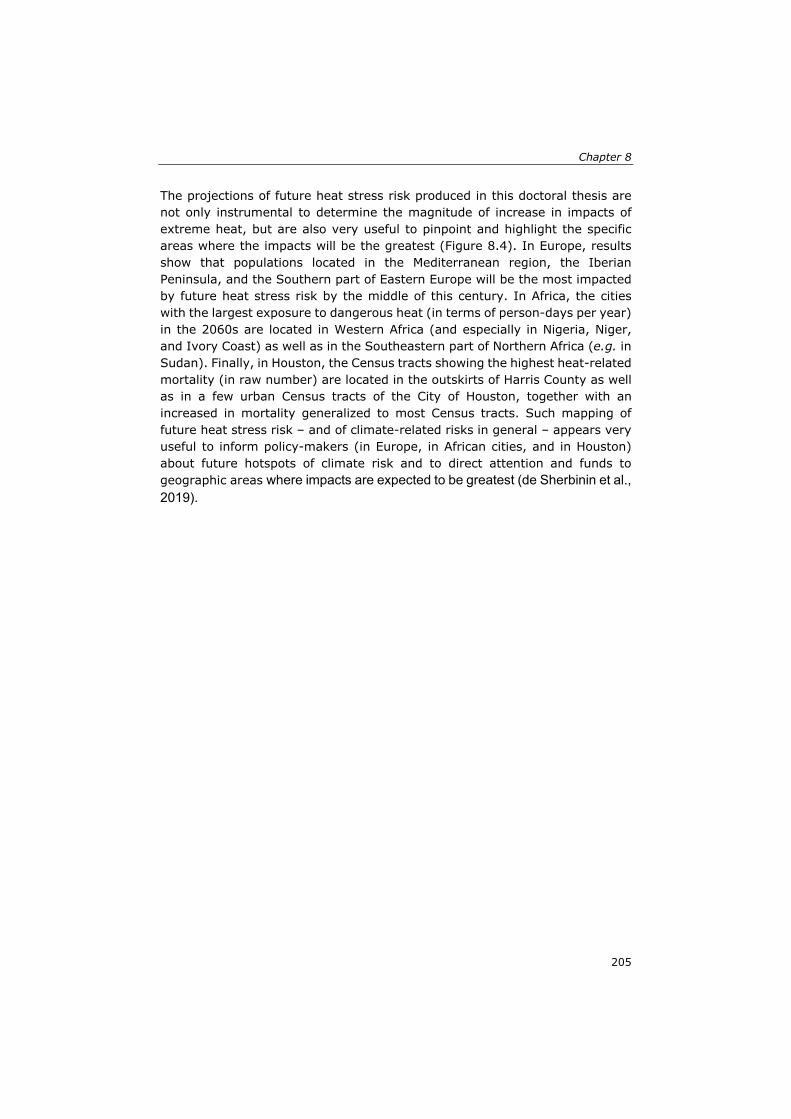
Chapter 8
205
The projections of future heat stress risk produced in this doctoral thesis are not only instrumental to determine the magnitude of increase in impacts of extreme heat, but are also very useful to pinpoint and highlight the specific areas where the impacts will be the greatest (Figure 8.4). In Europe, results show that populations located in the Mediterranean region, the Iberian Peninsula, and the Southern part of Eastern Europe will be the most impacted by future heat stress risk by the middle of this century. In Africa, the cities with the largest exposure to dangerous heat (in terms of person-days per year) in the 2060s are located in Western Africa (and especially in Nigeria, Niger, and Ivory Coast) as well as in the Southeastern part of Northern Africa (e.g. in Sudan). Finally, in Houston, the Census tracts showing the highest heat-related mortality (in raw number) are located in the outskirts of Harris County as well as in a few urban Census tracts of the City of Houston, together with an increased in mortality generalized to most Census tracts. Such mapping of future heat stress risk – and of climate-related risks in general – appears very useful to inform policy-makers (in Europe, in African cities, and in Houston) about future hotspots of climate risk and to direct attention and funds to geographic areas where impacts are expected to be greatest (de Sherbinin et al., 2019).
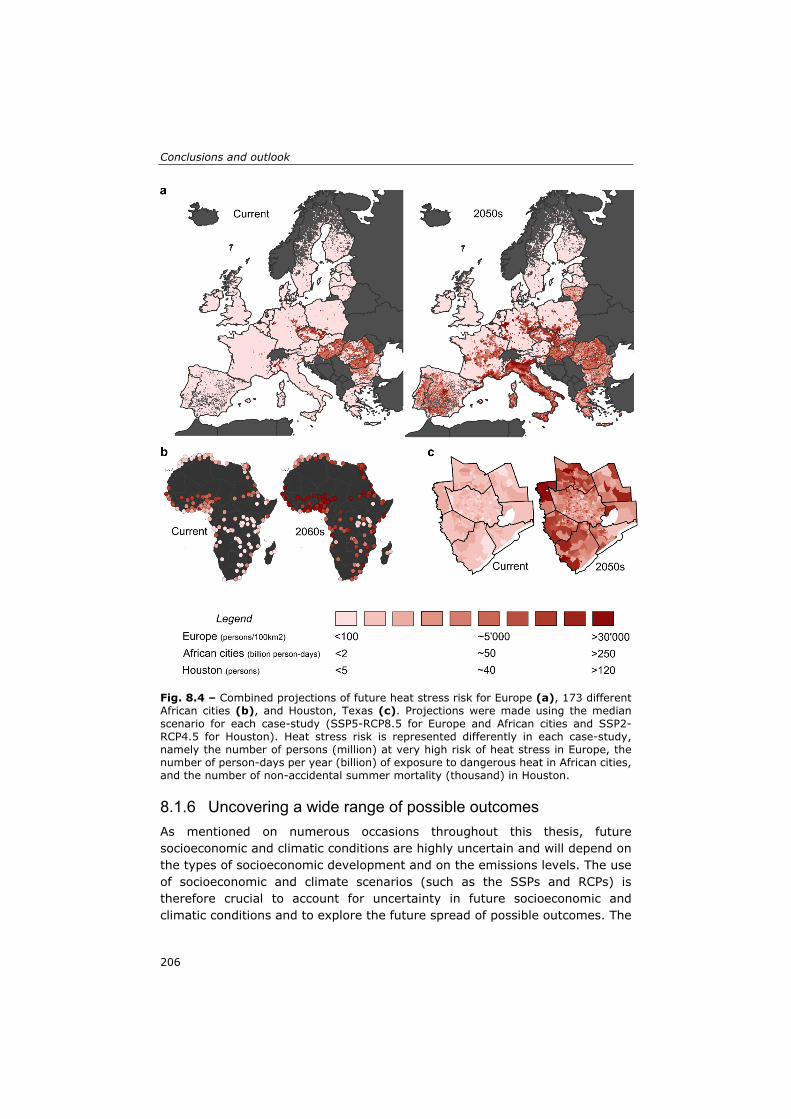
Conclusions and outlook
206
Fig. 8.4 – Combined projections of future heat stress risk for Europe (a), 173 different African cities (b), and Houston, Texas (c). Projections were made using the median scenario for each case-study (SSP5-RCP8.5 for Europe and African cities and SSP2-RCP4.5 for Houston). Heat stress risk is represented differently in each case-study, namely the number of persons (million) at very high risk of heat stress in Europe, the number of person-days per year (billion) of exposure to dangerous heat in African cities, and the number of non-accidental summer mortality (thousand) in Houston.
8.1.6 Uncovering a wide range of possible outcomes
As mentioned on numerous occasions throughout this thesis, future socioeconomic and climatic conditions are highly uncertain and will depend on the types of socioeconomic development and on the emissions levels. The use of socioeconomic and climate scenarios (such as the SSPs and RCPs) is therefore crucial to account for uncertainty in future socioeconomic and climatic conditions and to explore the future spread of possible outcomes. The
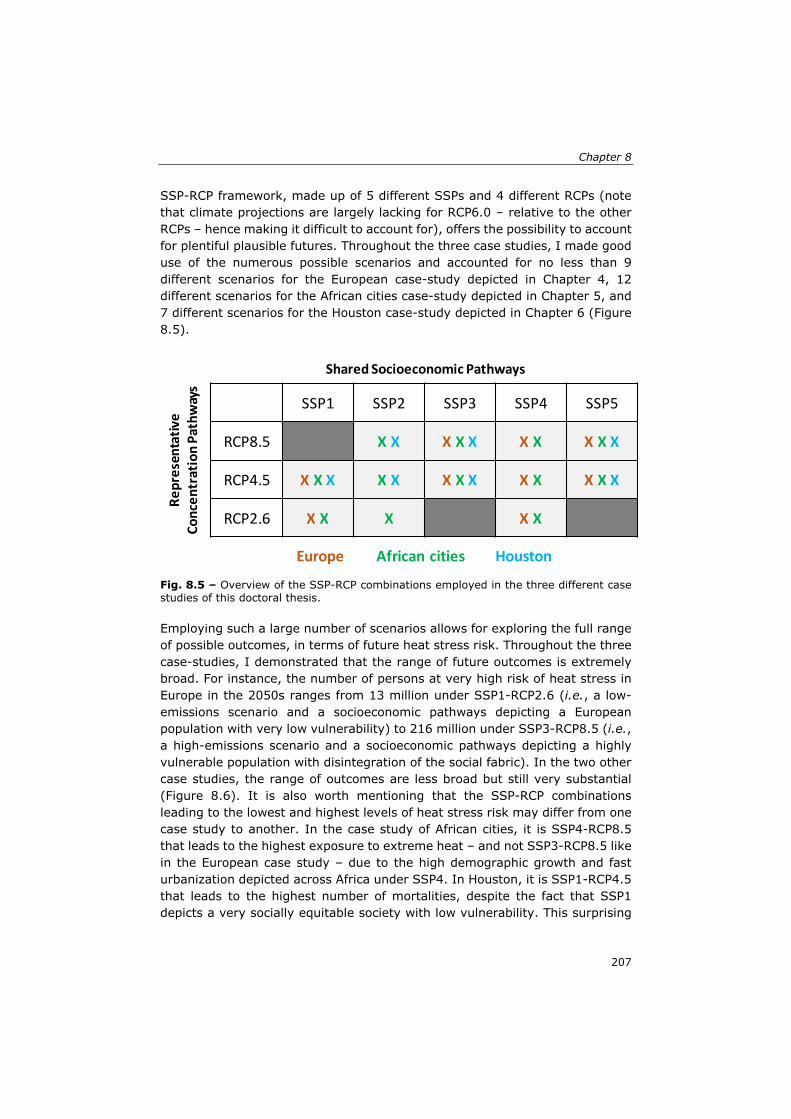
Chapter 8
207
SSP-RCP framework, made up of 5 different SSPs and 4 different RCPs (note that climate projections are largely lacking for RCP6.0 – relative to the other RCPs – hence making it difficult to account for), offers the possibility to account for plentiful plausible futures. Throughout the three case studies, I made good use of the numerous possible scenarios and accounted for no less than 9 different scenarios for the European case-study depicted in Chapter 4, 12 different scenarios for the African cities case-study depicted in Chapter 5, and 7 different scenarios for the Houston case-study depicted in Chapter 6 (Figure 8.5).
Fig. 8.5 – Overview of the SSP-RCP combinations employed in the three different case studies of this doctoral thesis. Employing such a large number of scenarios allows for exploring the full range of possible outcomes, in terms of future heat stress risk. Throughout the three case-studies, I demonstrated that the range of future outcomes is extremely broad. For instance, the number of persons at very high risk of heat stress in Europe in the 2050s ranges from 13 million under SSP1-RCP2.6 (i.e., a low-emissions scenario and a socioeconomic pathways depicting a European population with very low vulnerability) to 216 million under SSP3-RCP8.5 (i.e., a high-emissions scenario and a socioeconomic pathways depicting a highly vulnerable population with disintegration of the social fabric). In the two other case studies, the range of outcomes are less broad but still very substantial (Figure 8.6). It is also worth mentioning that the SSP-RCP combinations leading to the lowest and highest levels of heat stress risk may differ from one case study to another. In the case study of African cities, it is SSP4-RCP8.5 that leads to the highest exposure to extreme heat – and not SSP3-RCP8.5 like in the European case study – due to the high demographic growth and fast urbanization depicted across Africa under SSP4. In Houston, it is SSP1-RCP4.5 that leads to the highest number of mortalities, despite the fact that SSP1 depicts a very socially equitable society with low vulnerability. This surprising
SSP1 SSP2 SSP3 SSP4 SSP5
RCP8.5 X X X X X X X X X X
RCP4.5 X X X X X X X X X X X X X
RCP2.6 X X X X X
SharedSocioeconomic Pathways
Representative
Concentration Pathways
Europe African cities Houston
Conclusions and outlook
208
result is explained by the crucial role that ageing plays in shaping future heat-related mortality in Houston and the increased ageing depicted under SSP1 in Houston. This shows that the influence of a given SSP on future heat stress risk is highly context-dependent.
Fig. 8.6 – Synthesis of the current level (blue) and the future range (grey) of heat stress risk for each case study, for the 2050s (Europe and Houston) or the 2090s (African cities). Heat stress risk is represented differently in each case-study, namely the number of persons (million) at very high risk of heat stress in Europe, the number of person-days per year (billion) of exposure to dangerous heat in African cities, and the number of non-accidental summer mortality (thousand) in Houston. Overall, the wide range of outcomes in future heat stress risk is a crucial indicator of the uncertainty associated with projections of climate-related risks and hints at the enormous potential for policy-makers to minimize the future impacts of climate change by taking actions to reduce vulnerability and mitigate climatic hazards.
8.1.7 Demonstrating the central role of socioeconomic pathways
One of the main advantage of the SSP-RCP framework lies in that it offers the possibility to combine a given SSP with different RCP – and vice-versa –, which allows for disentangling the relative contribution of socioeconomic development and climate change to future climate-related risks (van Vuuren et al., 2013; van Ruijven et al., 2014). Using this feature of the SSP-RCP framework, one can explore the avoided impacts due to shifts in SSPs (that is, a shift from a SSP depicting high vulnerability and/or high exposure to a SSP depicting low vulnerability and/or low exposure) with that due to shifts in RCPs (that is, a shift from a high-emissions RCP to a low-emission RCP). Shifts in
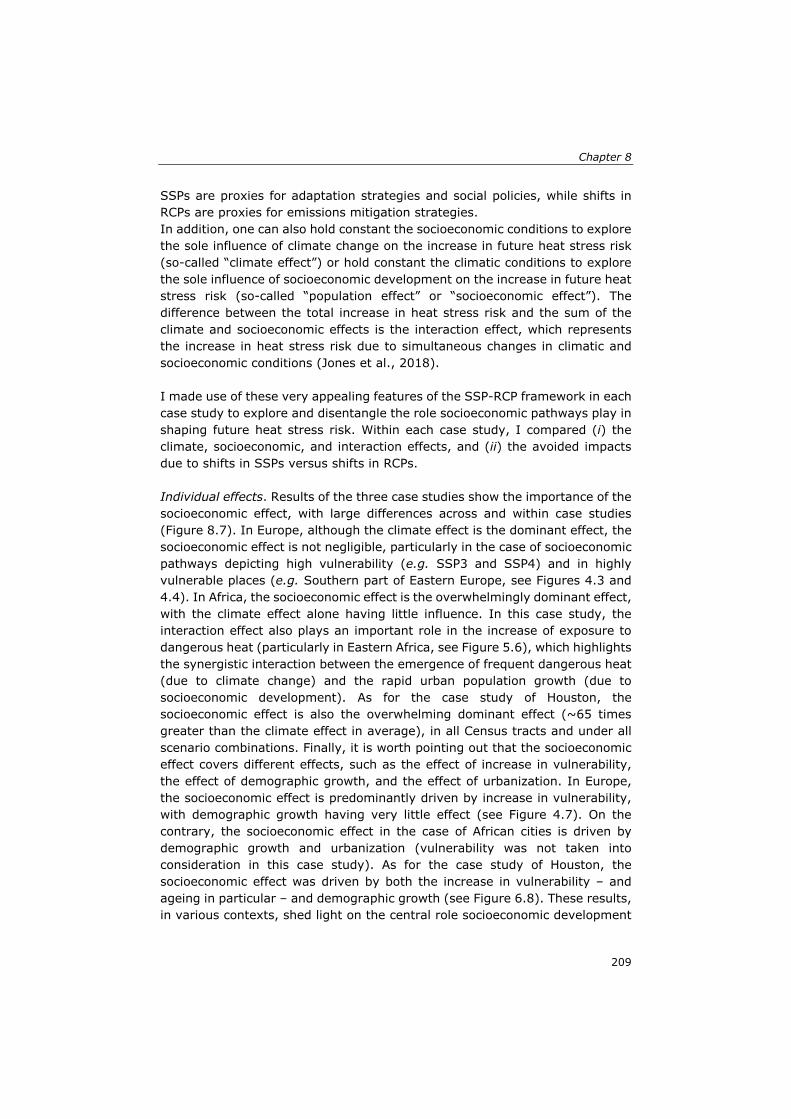
Chapter 8
209
SSPs are proxies for adaptation strategies and social policies, while shifts in RCPs are proxies for emissions mitigation strategies. In addition, one can also hold constant the socioeconomic conditions to explore the sole influence of climate change on the increase in future heat stress risk (so-called “climate effect”) or hold constant the climatic conditions to explore the sole influence of socioeconomic development on the increase in future heat stress risk (so-called “population effect” or “socioeconomic effect”). The difference between the total increase in heat stress risk and the sum of the climate and socioeconomic effects is the interaction effect, which represents the increase in heat stress risk due to simultaneous changes in climatic and socioeconomic conditions (Jones et al., 2018). I made use of these very appealing features of the SSP-RCP framework in each case study to explore and disentangle the role socioeconomic pathways play in shaping future heat stress risk. Within each case study, I compared (i) the climate, socioeconomic, and interaction effects, and (ii) the avoided impacts due to shifts in SSPs versus shifts in RCPs. Individual effects. Results of the three case studies show the importance of the socioeconomic effect, with large differences across and within case studies (Figure 8.7). In Europe, although the climate effect is the dominant effect, the socioeconomic effect is not negligible, particularly in the case of socioeconomic pathways depicting high vulnerability (e.g. SSP3 and SSP4) and in highly vulnerable places (e.g. Southern part of Eastern Europe, see Figures 4.3 and 4.4). In Africa, the socioeconomic effect is the overwhelmingly dominant effect, with the climate effect alone having little influence. In this case study, the interaction effect also plays an important role in the increase of exposure to dangerous heat (particularly in Eastern Africa, see Figure 5.6), which highlights the synergistic interaction between the emergence of frequent dangerous heat (due to climate change) and the rapid urban population growth (due to socioeconomic development). As for the case study of Houston, the socioeconomic effect is also the overwhelming dominant effect (~65 times greater than the climate effect in average), in all Census tracts and under all scenario combinations. Finally, it is worth pointing out that the socioeconomic effect covers different effects, such as the effect of increase in vulnerability, the effect of demographic growth, and the effect of urbanization. In Europe, the socioeconomic effect is predominantly driven by increase in vulnerability, with demographic growth having very little effect (see Figure 4.7). On the contrary, the socioeconomic effect in the case of African cities is driven by demographic growth and urbanization (vulnerability was not taken into consideration in this case study). As for the case study of Houston, the socioeconomic effect was driven by both the increase in vulnerability – and ageing in particular – and demographic growth (see Figure 6.8). These results, in various contexts, shed light on the central role socioeconomic development
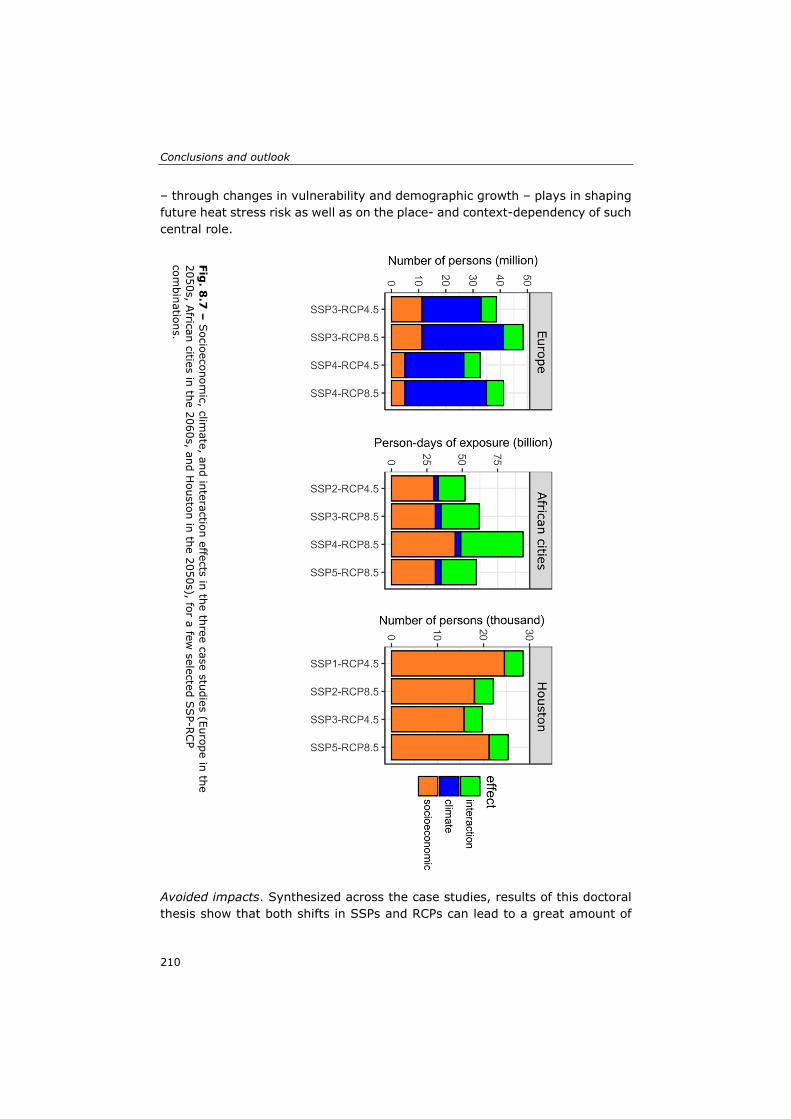
Conclusions and outlook
210
– through changes in vulnerability and demographic growth – plays in shaping future heat stress risk as well as on the place- and context-dependency of such central role.
Avoided impacts. Synthesized across the case studies, results of this doctoral thesis show that both shifts in SSPs and RCPs can lead to a great amount of
Fig. 8
.7 –
Socioeconom
ic, climate, and interaction effects in the three case studies (Europe in the
2050s, African cities in the 2060s, and H
ouston in the 2050s), for a few selected S
SP-R
CP
combinations.
Chapter 8
211
avoided impacts (Figure 8.8), in terms of number of persons at very high risk of heat stress in Europe, person-days of exposure to dangerous heat in African cities, and number of summer non-accidental mortalities in Houston. Interestingly, avoided impacts due to shifts in SSPs are of similar magnitude (or even of greater magnitude in some cases) to that due to shifts in RCPs. For instance, shifting towards a socioeconomic pathway depicting an equitable society with low vulnerability and a demographic growth and urbanization tempered by economic development and increased education (i.e., SSP1) would reduce the future number of persons at risk of heat stress in Europe by 62—67% (depending on the socioeconomic pathway of reference) and would reduce future exposure to dangerous heat in African cities by 19—51% (depending on the socioeconomic pathway of reference). This hints at the central role that the type of socioeconomic development plays in shaping future heat stress risk as well as at the efficiency of socioeconomic levers that policy-makers have (in addition to climate mitigation policies) to minimize future climate-related risks on public health.
Fig. 8.8 – Avoided impacts (in %) due to shifts in SSPs and to shifts in RCPs (from high to low, high to medium, or medium to low – see Chapters 4, 5, and 6 for references to low/medium/high SSPs and RCPs) across the three case studies (Europe in the 2050s, African cities in the 2090s, and Houston in the 2050s). Through these three different case studies, I showed that the crucial role socioeconomic development plays in shaping future heat stress risk is highly context-specific and is particularly function of (i) the explanatory power that changes in socioeconomic conditions – versus changes in climatic conditions – have on future heat stress risk, which depends on the case study and on the modeling and statistical approaches, and (ii) the intensity of changes in socioeconomic conditions versus changes in climatic conditions, relative to the baseline conditions. Overall, the findings of this doctoral dissertation are in line with the few other studies who used the SSP-RCP framework to disentangle the influence of socioeconomic development on future heat stress risk (e.g. Mishra et al., 2017; Harrington and Otto, 2018; Jones et al., 2018) and on other climate-related risks (e.g. Arnell and Lloyd-Hughes, 2014; Davenport et al., 2017; Chowdhury
Conclusions and outlook
212
et al., 2018; Messina et al., 2019). Such rapidly growing amount of evidence demonstrating that the influence of socioeconomic development on future climate-related risks may be comparable – and even greater – to that of climate change clearly shows the need to move from the old-fashioned climate-centric approach to an integrated socio-climatic approach (facilitated by the SSP-RCP framework) when assessing future climate-related risks.
8.2 Challenges and caveats Throughout this doctoral thesis, a number of challenges were faced when attempting to address the research goals, which led to a number of caveats (as described in each chapter individually). Those important challenges can be clustered in several broad categories that are described next.
8.2.1 Relevance of the global SSPs at the local scale
As mentioned multiple times in this thesis, the SSPs are global development trends that lack of regional and/or sectoral details and that must be extended in order to be relevant at the local scale and/or for specific sectors (van Ruijven et al., 2014; O’Neill et al., 2017). Ideally, extended SSPs should be both relevant at the local-scale and consistent with the global SSPs. In practice, however, finding the balance between the local-scale relevance and the consistency with the global SSPs proved challenging – which is a well-known challenge in multi-scale scenario development (e.g. Zurek and Henrichs, 2007; Neumann et al., 2011; Pedde, 2019). More specifically, the relevance of the entire set of global SSPs (i.e., five different SSPs) at the local scale can be questioned. In the case of Europe (Chapter 2), SSP2 and SSP5 could not be matched with any existing European scenario, highlighting the peculiarity of these two types of socioeconomic development for European countries. This is particularly the case for SSP5, which assumes a dichotomy between a high societal sustainability driven by a strong economic growth and a low environmental concern and low concern for natural capital. This is in contrast with most existing sets of European scenarios, in which scenarios depicting high societal sustainability also assume a high concern for environmental issues. Rather similarly, the global SSP4 was found by Absar and Preston (2015) to be irrelevant in North America and was therefore not extended in their study – and thus not included in the Houston case study depicted in Chapters 6 and 7. Additionally, when developing the extended for Houston – in collaboration with stakeholders – the local relevance of extended SSPs and their intake by local policy-makers was questioned. The inherent differences of perception at local versus global scale, the context-specific factors that cannot be scaled up (and therefore cannot be checked for consistency across scales), and the need to
Chapter 8
213
ensure the consistency with the global SSPs proved to be major challenges. The participatory process with stakeholders in Houston revealed that some SSPs were more locally relevant than others and that certain combinations of bits of SSPs were of interest to a certain number of stakeholders (i.e., new scenarios). Although stakeholders’ inputs were taken into consideration to revise the extended SSPs for Houston, I had to compromise between some of the stakeholders’ inputs that specifically went against the consistency with the global SSPs and the in-fine saliency of the extended SSPs for Houstonians. These compromises, highly subjective, led to both discrepancies between the Houston SSPs and the global SSPs for a few specific aspects and nonconsideration of certain of the stakeholders’ inputs (see section 6.2.2.). Altogether, although the SSP-RCP framework is a flexible enough framework to be downscaled and applied at the local scale, its relevance to specific local socioeconomic development can sometimes be questioned by local stakeholders and its multi-scale consistency can be challenging to ensure. Nevertheless, the global SSPs still appear extremely pertinent at the local scale in that they (i) provide very useful boundary conditions, (ii) prevent from designing scenarios from scratch, (iii) cover a wide range of plausible futures, and (iv) enable cross case studies comparisons.
8.2.2 Quantification of future exposure and vulnerability
In Chapter 3, I showed that the current lack of use of socioeconomic projections (and particularly projections of vulnerability) in IAV studies was mainly due to the scarcity of existing SSP-consistent socioeconomic projections and to the scarcity of methods to project future drivers of vulnerability under the SSPs. This doctoral thesis was no different from other IAV studies in the sense that I faced many challenges when attempting to project future heat-related exposure and vulnerability under the SSPs, at various spatial and temporal scales and in different contexts. The methods that I developed and the subsequent socioeconomic projections are therefore logically associated with a number of caveats. The first and most important caveat is the lack of consideration for subnational/local dynamics of socioeconomic development. Many times throughout the different modeling approaches, I assumed the rate of change of a given variable at a given spatial scale to be homogeneously spread across its constituent sub-scale spatial units, therefore neglecting the sub-scale dynamic of this given variable. For instance, when downscaling the national-level projections of education to the NUTS2 scale in Chapter 4, I assumed the NUTS2-scale education rate to follow that of the country, without accounting for the potential differences of changes in education across the NUTS2 regions (e.g. the rate of education in NUTS2 urban regions could increase faster than that in NUTS2 rural regions). Similarly, in the same Chapter, when downscaling
Conclusions and outlook
214
the NUTS2-level projections of age structure (Terama, 2016) to the 0.1° spatial grid, I assumed each grid cell of a given NUTS2 unit to have similar age structure than that of the NUTS2 unit, thus once again disregarding the potential sub-scale differences. This is particularly problematic in that it can subsequently lead to a homogenization of the future exposure and vulnerability within a given area. Another example lies in the projections of the future urban population size in African cities (described in Chapter 5), in which I assumed all cities of a given country to share similar urbanization and population growth rates (under a given SSP). This approach clearly neglects the population dynamics of small-, middle-, and large-size cities in Africa – which show great differences (Birkmann et al., 2016) – and may lead to an overestimation of the population size in large cities. In this particular case, grounding the downscaling approach on historical subnational dynamics could prove useful. The second caveat lies in that in many cases I assumed the current correlations and causal effects to remain stable in the future and across the SSPs. This assumption was made in all projections methods using correlation models. For instance, to project future overweight prevalence in Europe (Chapter 3), I assumed the current relationships between (i) overweight prevalence and age structure and (ii) overweight prevalence and urbanization to hold true in the future and across SSPs. In practice, these correlations are unlikely to remain constant, particularly considering that each European SSP depicts different access to healthcare and socioeconomic development of rural and urban regions, which will differently affect the causal effect between age structure, urbanization, and overweight prevalence. Similarly, for the case study of Houston depicted in Chapters 6 and 7, I assumed correlations between (i) prevalence of AC and age of the building, (ii) poverty and median income, and (iii) housing arrangements and age and race/ethnicity to hold true in the future under each extended SSP. Considering that the Houston SSPs depict very different levels of social policies, access to affordable housing, and economic inequalities, it is very unlikely that the aforementioned correlations remain constant and identical across the extended SSPs. More integrated modelling approaches may have the potential to address this caveat. Finally, the third and last main caveat associated to the quantification of future exposure and vulnerability is related to the data-intensity of the methods that I developed. These methods rely heavily on historical and current datasets of various socioeconomic variables (e.g. age structure, income, poverty, education, health conditions, air conditioning prevalence, etc.). These datasets were available in data-rich environment such as Europe (in which standardized data are made available by Eurostat) and US (in which Census tracts-level datasets are provided by the US Census Bureau), which enabled projecting future vulnerability in these regions. However, in data-scarce environment, such as the African continent, the methods developed in this doctoral thesis
Chapter 8
215
are not applicable. In the case study of African cities depicted in Chapter 5, data-scarcity was a major issue and has prevented from quantifying future vulnerability, which is a major limitation when assessing future heat stress risk. The ongoing development of satellite-based socioeconomic datasets may prove useful to overcome this challenge (de Sherbinin, 2017).
8.2.3 Quantification of heat stress risk
As defined in Chapter 1, heat stress risk can be characterized by heat exhaustion, heat stroke, and death. Concrete outcomes are therefore expressed in terms of morbidity or mortality. However, in many IAV studies, the lack of historical epidemiological data on heat-related morbidity and mortality prevents from exploring these specific outcomes. Instead, a large proportion of the IAV studies uses a risk-based approach in which heat stress risk is characterized by a dimensionless risk value. This approach is very useful to explore future trends under different scenarios and to pinpoint hotspots of future risk, but is limited in that it does not lead to concrete public health outcomes. In this doctoral dissertation, limited by the lack of comprehensive and fine-scale epidemiological data on heat-related mortality at the European level (despite the growing number of studies at the local scale, e.g. Ästrom et al., 2017), I employed a risk approach to characterize heat stress risk in Europe. Although the study proved useful to spatially identify the future number of persons at high risk of heat stress, the lack of concrete outcomes – in terms of morbidity or mortality – might limit the relevance of this study to public health policy-makers. The situation is even worse across the African continent, were only very few and sporadic records of heat-related mortality exist (Figure 8.9), which prevents from exploring any type of relationships between heat and morbidity/mortality outcomes. Because of such lack of existing epidemiological data, I relied on temperature thresholds from the US National Weather Service (NWS, 2014) to characterize dangerous heat. Although widely applied in the IAV literature (e.g. Matthews et al., 2017; Russo et al., 2017), this US-determined temperature thresholds are unlikely to properly characterize dangerous levels of extreme heat in African cities, where the population’s acclimatization to extreme heat certainly differs (Hanna and Tait, 2015).
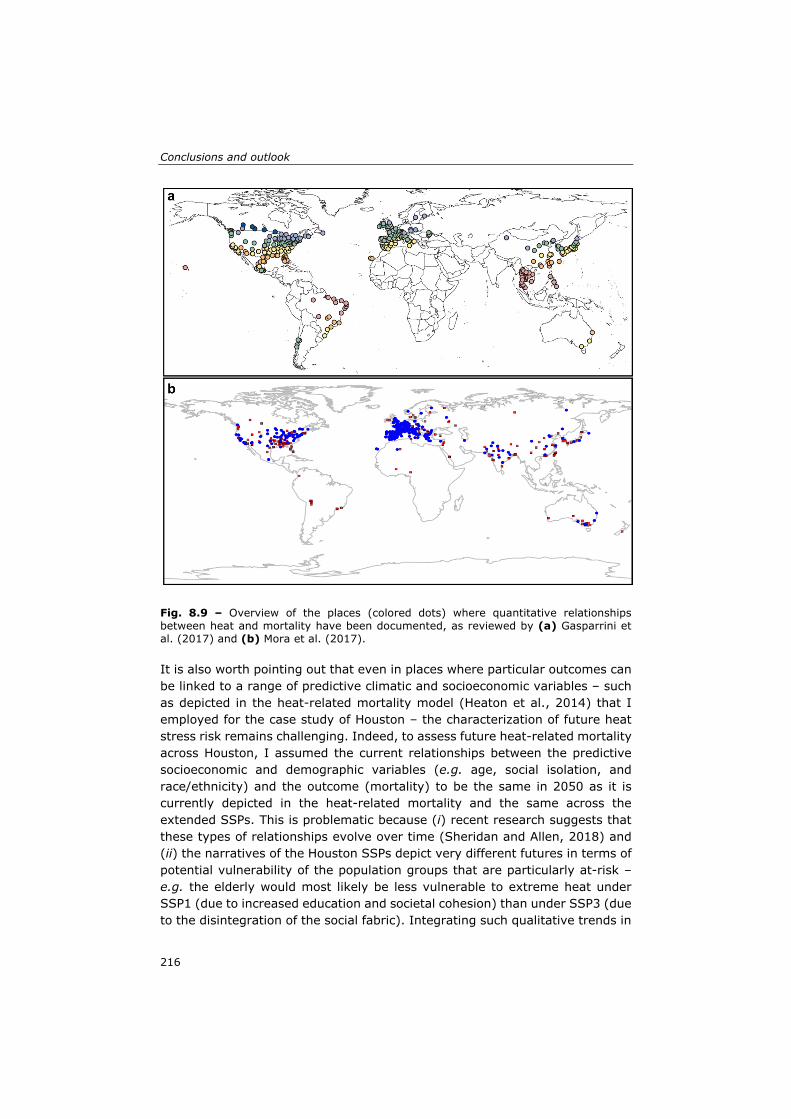
Conclusions and outlook
216
Fig. 8.9 – Overview of the places (colored dots) where quantitative relationships between heat and mortality have been documented, as reviewed by (a) Gasparrini et al. (2017) and (b) Mora et al. (2017). It is also worth pointing out that even in places where particular outcomes can be linked to a range of predictive climatic and socioeconomic variables – such as depicted in the heat-related mortality model (Heaton et al., 2014) that I employed for the case study of Houston – the characterization of future heat stress risk remains challenging. Indeed, to assess future heat-related mortality across Houston, I assumed the current relationships between the predictive socioeconomic and demographic variables (e.g. age, social isolation, and race/ethnicity) and the outcome (mortality) to be the same in 2050 as it is currently depicted in the heat-related mortality and the same across the extended SSPs. This is problematic because (i) recent research suggests that these types of relationships evolve over time (Sheridan and Allen, 2018) and (ii) the narratives of the Houston SSPs depict very different futures in terms of potential vulnerability of the population groups that are particularly at-risk – e.g. the elderly would most likely be less vulnerable to extreme heat under SSP1 (due to increased education and societal cohesion) than under SSP3 (due to the disintegration of the social fabric). Integrating such qualitative trends in
Chapter 8
217
a heat-related model grounded on the current reality was too challenging to be achieved in this doctoral thesis.
8.2.4 Influence of SSPs on climate hazard
Another main challenge raised by this doctoral thesis is the consideration of the differential influence that socioeconomic pathways have on future climate hazards. In the case of heat stress risk, it is well acknowledged that urbanization and anthropogenic heat emission greatly contribute to the heat hazard in urban areas. However, accounting for the influence of varying levels of socioeconomic development on future heat hazard was too challenging to be achieved in the large-scale case studies of this doctoral thesis (Europe and African cities). More specifically, in the European case study, accounting for the influence of urbanization and land use change (under the different SSPs) on future heat hazard would require the integration of a land use change model with a high-resolution climate model. This has been recently achieved for some specific regions (e.g. China; Dong et al., 2019) but remains to be conducted across Europe under the SSPs. However, because urbanization and land use change in Europe is rather limited – relative to other dynamic regions such as China –, not including the feedback effect of the SSPs on the heat hazard does not constitute a major drawback of the heat stress risk assessment depicted in Chapter 4. Quite the contrary, not accounting for the effect of SSPs on future urban heat hazard in the case study of African cities is a major limitation. Indeed, research has shown that the UHI plays a critical role in shaping future heat hazard in large cities (Papalexiou et al., 2018) and particularly in fast-growing cities. Accounting for the effect of different SSPs on the UHI – and therefore on the heat hazard – requires the use of an urban climate model coupled with high-resolution projections of urban land use and types. While this has been achieved in a few local case studies (e.g. Houston, see Chapter 6), it has yet to be conducted on a larger scale (i.e., multiple cities of a given continent) and in a data-poor environment such as African cities, where current datasets on urban land use and types are largely lacking. Integrating the effect of different SSPs on future heat-related hazard in African cities will further strengthen the role socioeconomic development plays in shaping future exposure to dangerous heat in this region. It is worth pointing out that a few ongoing studies are attempting to explore the influence of SSPs-based land use on future urban heat island and heat intensification at the global scale (e.g. Chen et al., in review; Huang et al., in review). These studies will likely constitute a considerable step forward towards
Conclusions and outlook
218
a better understanding of the influence of different types of socioeconomic development on the future urban heat hazard.
8.3 Recommendations for further research Based upon observations made throughout this 4-year doctoral thesis, I describe in this section a number of recommendations for further research. They particularly intend to (i) address some of the aforementioned main challenges and caveats, (ii) advance further the use of the SSP-RCP framework in IAV studies, and (iii) improve our understanding of the role socioeconomic development plays in shaping future climate-related risks. Use of computer-aided approaches for scenario development. Establishing balance between the local relevance of the extended SSPs and their consistency with the global SSPs is crucial to ensure the applicability of the SSP-RCP framework at the local scale. Computer-aided and structural scenario methods – e.g. the cross impact balance analysis (Schweizer and O’Neill, 2014; Schweizer and Kurniawan, 2016) – show great potential to (i) perform systematic consistency check between locally developed extended SSPs and the global SSPs and (ii) select the most relevant scenarios based on local stakeholders’ inputs (Carlsen et al., 2016a,b; Lamontagne et al., 2018). Possible revision of the SSPs. Although the SSPs are still relatively new, like most scenario sets, they will not age well and will likely need to be revised and updated in the next few years. In such event, feedbacks from the community that applied the SSPs and from the stakeholders and policy-makers that used SSPs-based studies will be crucially needed. A revision of the global SSPs should also include a reflection around the plausible futures that are not covered by the SSPs, such as disruptive scenarios, de-growth scenarios, and scenarios with high sustainability and low economic growth. Integration of dynamic interactions. The current use of the SSP-RCP framework by the IAV community is very static in that the dynamic interactions between the SSPs and the RCPs are almost never accounted for – the two systems (climatic and socioeconomic) being treated as two separate silos. In view of the current understanding of the interactions between these two systems (e.g. the socioeconomic development affects the heat hazard through the intensification of the UHI and affects the flood hazard due to increasing soil sealing; and climate change affects socioeconomic development in many ways – particularly in developing countries, e.g. Letta and Tol, 2018), further research is crucially needed to explore the dynamics and feedbacks between the SSPs and RCPs and to develop approaches to account for these dynamics when using the SSP-RCP framework in IAV studies. It appears particularly important to better understand how different SSPs will affect future climate-
Chapter 8
219
related hazards, as this would allow for a better and more complete characterization of the contribution of socioeconomic pathways to future climate-related risks. Increased collaboration with other social science disciplines. Projecting future vulnerability under the SSPs is key to better characterize future climate-related risks under multiple plausible futures. However, as showed throughout this thesis, projecting future socioeconomic conditions is highly challenging, particularly at the local scale and in data-poor environments. Social science disciplines such as economics, public health research, demography, and housing studies have a long tradition in forecasts, projections, and even scenarios. Although almost always disconnected from the climate change research community, these social science disciplines appear to be a great source of knowledge and expertise. An increased collaboration would undoubtedly enhance the availability and robustness of the projections of vulnerability under the SSPs, at multiple scales and in various environments. Moreover, inter- and trans-disciplinary approaches between the climate change research community and research communities from other social sciences disciplines could help developing (and quantifying) extended SSPs for important sectors that are lacking so far, such as governance, social behavior, and public health. Systematic review of bad and best practices. The rapidly expanding use of the SSP-RCP framework in IAV studies is accompanied by the propagation of a number of bad and best practices. Up until now, no review paper has been published to take stock of the IAV studies that use the SSP-RCP framework and to identify the current state of practice. Such review activity appears crucial to ensure a proper and better use of the SSP-RCP framework within IAV studies and to avoid further spread of bad practices, such as (i) considering the SSPs to be demographic scenarios only, (ii) using the global SSPs for local case studies, (iii) employing a simplistic downscaling of national-level projections, (iv) using only SSP, and (v) neglecting future vulnerability. A multi-disciplinary team is currently conducting such a review, but with a focus on health-related IAV studies only (Rohat et al., in prep.). Systematic stocktaking and compendiums. In line with the need to review the current use of the SSP-RCP framework by the IAV studies, there is also a crucial need to take stock of the wide range of extended SSPs that were developed over the past few years as well as of the broad variety of existing SSP-consistent socioeconomic projections. Such systematic stocktaking could take the form of compendiums managed by the International Committee On New Integrated Climate change assessment Scenarios (ICONICS). These compendiums would be very useful for the IAV community because they would allow to become readily aware of the existing extended SSPs, existing
Conclusions and outlook
220
quantitative projections of socioeconomic variables under the SSPs, and existing methods to quantify future vulnerability. In addition, such compendiums would be useful to identify areas and sectors where extended SSPs and quantitative socioeconomic projections are lacking. Having all this diversity of information in one place would undoubtedly facilitates the operationalization of the SSP-RCP framework in IAV studies in various contexts. Intercomparison project of existing projections. The increasing use of the SSP-RCP framework by the IAV community is associated with an increased redundancy of subnational projections of key drivers such as population, urbanization, and GDP. Although a nice problem to have, this redundancy might lead to discrepancies across studies and might lead to confusion among users of these projections. For instance, there is currently four different SSP-consistent sets of subnational population projections available in Europe (Murakami and Yamagata, 2016; Jones and O’Neill, 2016; Lückenkötter et al., 2017; Terama et al., 2019), with significant differences amongst them. In view of the increasing availability of projections, an intercomparison project comparing the different existing projections of key drivers such as population would be very useful to characterize the (di)similarities among the different sets of projections and to provide recommendations on their use in IAV studies. Applications in new climate-related research fields. While the SSP-RCP framework has been largely used in assessments of future risks related to extreme heat, flooding, food security, fire risk, and water scarcity, its operationalization in assessments of less common climate-related risks (e.g. air pollution and vector-borne diseases) has been scarce. For instance, in the field of climate-sensitive vector borne diseases studies, the overwhelming majority of risk assessments are still superimposing RCPs-based climate projections on the current state of the society (e.g. Ryan et al., 2019) – although a few recent exceptions must be pointed out (Monaghan et al., 2018; Messina et al., 2019; Rohat et al., 2019d). This is particularly problematic because socioeconomic development – and in particular migration, urbanization, economic development, and population growth – are thought to be key drivers of the spread of vector-borne diseases. Further effort should be made to operationalize SSP-RCP framework in this research fields (as well as in other understudied fields – with regards to socioeconomic scenarios) in order to provide a broader picture of the ways in which socioeconomic development pathways influence the multitude of future climate-related risks. Meta-analysis. One of the most useful features of the SSP-RCP framework lies in that it provides a common ground – in terms of socioeconomic and climate scenarios – for IAV studies conducted by different research teams, in various contexts. This use of a similar scenario framework across numerous case
Chapter 8
221
studies enables cross-case studies comparison. Although this has yet to be achieved, a cross-case studies comparison (in the form of a systematic review; Minx et al., 2017) making use of the wide range of IAV studies that rely on the SSP-RCP framework would be a great addition to the current literature and would strengthen our understanding of the relative role socioeconomic development and climate change play in shaping future climate-related risks. Such meta-analysis could specifically focus on synthesizing the effect of shifts in socioeconomic pathways on the avoided impacts, for the multitude of existing impacts (heat stress risk, flooding, water scarcity, food security, etc.) in various regions of the globe. Such a study would provide policy-makers with a global and comprehensive understanding of (i) the crucial role that socioeconomic development plays in shaping future climate-related risks and (ii) the socioeconomic levers that they have (in addition to generic climate change mitigation policies) to minimize the future impacts of climate change on public and global health.

Conclusions and outlook
222
223
References Abaurrea J, Asin J and Cebrián AC (2018). Modelling the occurrence of heat
waves in maximum and minimum temperatures over Spain and projections for the period 2013-2060. Global and Planetary Change 161: 244-260.
Absar SM and Preston BL (2015). Extending the shared socioeconomic pathways for sub-national impacts, adaptation, and vulnerability studies. Global Environmental Change 33: 83-96.
Adger WN (2006). Vulnerability. Global Environmental Change 16: 268-281. Adger WN, Arnell NW and Tompkins EL (2005). Successful adaptation to
climate change across scales. Global Environmental Change 15: 77-86. Aerts JC, Feyen L, Hochrainer-Stigler S, Brenden J, Hudson P et al. (2013).
Inventory of existing risk scenarios. Deliverable D3.1. ENHANCE Project. Alberini A, Gans W and Alhassan M (2011). Individual and public-program
adaptation: Coping with heat waves in five cities in Canada. International Journal of Environmental Research and Public Health 8: 4679-4701.
Alders MPC and Manting D (2001). Household scenarios for the European Union, 1995-2025. Genus 57: 17-47.
Alfieri L, Feyen L, Dottori F and Bianchi A (2015). Ensemble flood risk assessment in Europe under high end climate scenarios. Global Environmental Change 35: 199-212.
Alfieri L, Feyen L and Di Baldassarre G (2016). Increasing flood risk under climate change: A pan-European assessment of the benefits of four adaptation strategies. Climatic Change 136: 507-521.
Amengual A, Homar V, Romero R, Brooks HE, Ramis C et al. (2014). Projections of heat waves with high impact on human health in Europe. Global and Planetary Change 119: 71-84.
Anderson GB, Bell ML and Peng RD (2013). Methods to calculate the heat index as an exposure metric in environmental health research. Environmental Health Perspectives 121: 1111-1119.
Anderson GB, Oleson KW, Jones B and Peng RD (2018). Projected trends in high-mortality heatwaves under different scenarios of climate, population, and adaptation in 82 US communities. Climatic Change 146: 455-470.
Angel S, Parent J, Civco DL, Blei A and Potere D (2011). The dimensions of global urban expansion: Estimates and projections for all countries, 2000-2050. Progress in Planning 75: 53-107.
Angel S, Blei AM, Parent J, Lamson-Hall P, Galarza-Sanchez N et al. (2016). Atlas of urban expansion-2016 Edition. NYU Urban Expansion Program and Lincoln Institute of Land Policy : New York City, NY, United States.
Arnell NW and Lloyd-Hughes B (2014). The global-scale impacts of climate change on water resources and flooding under new climate and socio-economic scenarios. Climatic Change 122: 127-140.
References
224
Asefi-Najafabady S, Vandecar KL, Seimon A, Lawrence P and Lawrence D (2018). Climate change, population, and poverty: Vulnerability and exposure to heat stress in countries bordering the Great Lakes of Africa. Climatic Change 148: 561-573.
Äström C, Äström DO, Andersson C, Ebi KL and Forsberg B (2017). Vulnerability reduction needed to maintain current burdens of heat-related mortality in a changing climate-magnitude and determinants. International Journal of Environmental Research and Public Health 14: 741.
Äström DO, Äström C, Rekker K, Indermitte E and Orru H (2016). High summer temperatures and mortality in Estonia. PLoS ONE 11: e0155045.
Ausseil AGE, Daigneault AJ, Frame B and Teixeira EI (2019). Towards an integrated assessment of climate and socio-economic change impacts and implications in New Zealand. Environmental Modelling & Software 119: 1-20.
Bachman D and Barua A (2015). Single-person households: Another look at the changing American family. Available online at: https://www2.deloitte.com/insights/us/en/economy/behind-the-numbers/single-person-households-and-changing-american-family.html
Bao J, Li X and Yu C (2015). The construction and validation of the heat vulnerability index, a review. International Journal of Environmental Research and Public Health 12: 7220-7234.
Barnett J (2010). Adapting to climate change: Three key challenges for research and policy-an editorial essay. Wiley Interdisciplinary Reviews: Climate Change 1: 314-317.
Batista e Silva F, Dijkstra L, Martinez PV and Lavalle C (2016). Regionalisation of demographic and economic projections - Trend and convergence scenarios from 2015 to 2016. JRC Science for Policy Report, EUR-27924. Joint Research Center of the European Commission: Ispra, Italy.
Berkhout F (2012). Adaptation to climate change by organizations. Wiley Interdisciplinary Reviews: Climate Change 3: 91-106.
Bernhard MC, Kent ST, Sloan ME, Evans MB, McClure LA et al. (2015). Measuring personal heat exposure in an urban and rural environment. Environmental Research 137: 410-418.
Berry PM, Betts RA, Harrison PA and Sanchez-Arcilla A (2017). High-end climate change in Europe: Impacts, vulnerability, and adaptation. Pensoft Publishers: Sofia, Bulgaria.
Biewald A, Lotze-Campen H, Otto I, Brinckmann N, Bodirsky B et al. (2015). The Impact of Climate
Change on Costs of Food and People Exposed to Hunger at Subnational Scale. PIK Report n°128. Potsdam Institute for Climate Impact Research: Potsdam, Germany.
References
225
Birkmann J, Cutter SL, Rothman DS, Welle T, Garschagen M et al. (2013). Scenarios for vulnerability: Opportunities and constraints in the context of climate change and disaster risk. Climatic Change 133: 53-68.
Birkmann J, Welle T, Solecki W, Lwasa S and Garschagen M (2016). Boost resilience of small and mid-sized cities. Nature 537: 605-608.
Boeckmann M and Rohn I (2014). Is planned adaptation to heat reducing heat-related mortality and illness? A systematic review. BMC Public Health 14: 1112.
Böhmelt T (2017). Employing the shared socioeconomic pathways to predict CO2 emissions. Environmental Science & Policy 75: 56-64.
Bongaarts J and O'Neil BC (2018). Global warming policy: Is population left out in the cold? Science 361: 650-652.
Bouwer LM and Jonkman SN (2018). Global mortality from storm surges is decreasing. Environmental Research Letters 13: 014008.
Bradford K, Abrahams L, Hegglin M and Klima K (2015). A heat vulnerabilit index and adaptation solutions for Pittsburgh, Pennsylvania. Environmental Science & Technology 49: 11303-11311.
Brazel A, Gober P, Lee SJ, Grossman-Clarke S, Zehnder J et al. (2007). Determiants of changes in the regional urban heat island in metropolitan Phoenix (Arizona, USA) between 1990 and 2004. Climate Research 33: 171-182.
Burkart K, Khan MM, Schneider A, Breitner S, Langner M et al. (2014). The effects of season and meteorology on human mortality in tropical climates: A systematic review.Transactions of the Royal Society of Tropical Medicine & Hygiene 108: 393-401.
Busch G (2006). Future European agricultural landscapes - What can we learn from existing quantitative land use scenario studies? Agriculture, Ecosystems & Environment 114: 121-140.
Carlsen H, Eriksson EA, Dreborg KH, Johansson B and Bodin Ö (2016a). Systematic exploration of scenario spaces. Foresight 18: 59-75.
Carlsen H, Lempert R, Wikman-Svahn P and Schweizer V (2016b). Choosing small sets of policy-relevant scenarios by combining vulnerability and diversity approaches. Environmental Modelling & Software 84: 155-164.
Carter TR, Jones R, Lu X, Bhadwal S, Conde C et al. (2007). New assessment methods and the characterisation of future conditions. In: IPCC, ed. Climate Change 2007: Impacts, Adaptation and Vulnerability. Working Group II Contribution to the Fourth Assessment Report of the Intergovernmental Panel on Climate Change. Cambridge University Press: Cambridge, United Kingdom; New York City, NY, United States.
Carter TR, Fronzek S, Inkinen A, Lahtinen I, Lahtinen M et al. (2016). Characterising vulnerability of
the elderly to climate change in the Nordic region. Regional Environmental Change 16: 43-58. CDC (2017). Managing Diabetes. Centers for Disease
References
226
Control and Prevention. Available online at: https://www.cdc.gov/diabetes/managing/index.html
Chen F and Dudhia J (2001). Coupling an advanced land surface–hydrology model with the Penn State–NCAR MM5 modeling system. Part I: Model implementation and sensitivity. Monthly Weather Review 129: 569-585.
Chen F, Manning KW, LeMone MA, Trier SB, Alfieri JG et al. (2007). Description and evaluation of the characteristics of the NCAR high-resolution land data assimilation system. Journal of Applied Meteorology and Climatology 46: 694-713.
Chen F, Kusaka H, Bornstein R, Ching J, Grimmond CSB et al. (2011). The integrated WRF/urban modelling system: Development, evaluation, and applications to urban environmental problems. International Journal of Climatology 31: 273-288.
Chen J, Liu Y, Pan T, Liu Y, Sun F et al. (2018). Population exposure to droughts in china under 1.5°C global warming target. Earth System Dynamics 9: 1097-1106.
Chen K, Horton RM, Bader DA, Lesk C, Jiang L et al. (2017). Impact of climate change on heat-related mortality in Jiangsu Province, China. Environmental Pollution 224: 317-325.
Chen K, Flore AM, Chen R, Jiang L, Jones B et al. (2018). Future ozone-related acute excess mortality under climate and population change scenarios in China: A modeling study. PLoS Medicine 15: e1002598.
Chen G, Li X, Liu X, Liang X, Leng J et al. (In review). Global urban change and its environmental effects under the shared socioeconomic pathways. Nature Communication.
Chien LC, Guo Y and Zhang K (2016). Spatiotemporal analysis of heat and heat wave effects on elderly mortality in Texas, 2006-2011. The Science of the Total Environment 562: 845-851.
Chow WTL, Chuang W-C and Gober P (2012). Vulnerability to extreme heat in metropolitan Phoenix: Spatial, temporal, and demographic dimensions. The Professional Geographer 64: 286-302.
Chowdhury S, Dey S and Smith KR (2018). Ambient PM2.5 exposure and expected premature mortality to 2100 in India under climate change scenarios. Nature Communications 9: 318.
CIESIN (2011). Global rural-urban mapping project (GRUMP), version 1. NASA Socioeconomic Data and Applications Center: Palisades, NY, United States.
City of Houston (2018). Climate action plan - Resources. City of Houston, Office of Sustainability: Houston, TX, United States.
City of Houston (2019a). Complete communities. City of Houston: Houston, TX, United States.
City of Houston (2019b). Resilient Houston: Resilience assessment. City of Houston, Office of Sustainability: Houston, TX, United States.
References
227
Coffel ED, Horton RM and de Sherbinin A (2018). Temperature and humidity based projections of a rapid rise in global heat stress exposure during the 21st century. Environmental Research Letters 13: 014001.
Conlon K, Monaghan A, Hayden M and Wilhelmi O (2016). Potential impacts of future warming and land use changes in intra-urban heat exposure in Houston, Texas. PLoS ONE 11:e0148890.
Cradock-Henry NA, Frame B, Preston BL, Reisinger A and Rothman DS (2018). Dynamic adaptive pathways in downscaled climate change scenarios. Climatic Change 150: 333-341.
Crespo Cuaresma J (2017). Income projections for climate change research: A framework based on human capital dynamics. Global Environmental Change 42: 226-236.
Crespo Cuaresma J, Fengler W, Kharas H, Bekhtiar K, Brottrager M et al. (2018). Will the sustainable development goals be fulfilled? Assessing present and future global poverty. Palgrave Communications 4: 29.
Davenport F, Grace K, Funk C and Shukla S (2017). Child health outcomes in sub-saharan africa: A comparison of changes in climate and socio-economic factors. Global Environmental Change 46: 72-87.
Davis RE, McGregor GR and Enfield K (2016). Humidity: A review and primer on atmospheric moisture and human health. Environmental Research 144: 106-116.
Dee DP, Uppala SM, Simmons AJ, Berrisford P, Poli P et al. (2011). The ERA-Interim reanalysis: Configuration and performance of the data assimiliation system. Quarterly Journal of the Royal Meteorological Society 137: 553-597.
Dellink R, Chateau J, Lanzi E and Magné B (2017). Long-term economic growth projections in the shared socioeconomic pathways. Global Environmental Change 42: 200-214.
De Ridder K, Lauwaet D and Maiheu B (2015). UrbClim – A fast urban boundary layer climate model. Urban Climate 12: 21-48.
de Sherbinin A (2014a). Mapping the unmeasurable? Spatial analysis of vulnerability to climate change and climate variability. PhD dissertation. University of Twente - Faculty of Geo-Information Science and Earth Observation (ITC): Enschede, The Netherlands.
de Sherbinin A (2014b). Climate change hotspots mapping: What have we learned? Climatic Change 123: 23-37.
de Sherbinin A (2017). Remote sensing and socioeconomic data integration: Lessons from the NASA Socioeconomic Data and Applications Center. In Quattrochi DA, Wentz EA, Lam NS and Emerson CW, eds. Integrating scale in remote sensing and GIS. CRC Press: London, United Kingdom.
de Sherbinin A, Bukvic A, Rohat G, Gall M, McCusker B et al. (2019). Climate vulnerability mapping: A systematic review and future prospects. Wiley Interdisciplinary Reviews: Climate Change 10: e600.
References
228
Dholakia HH, Mishra AK and Garg A (2015). Predicted increases in heat related mortality under climate change in urban India. IIM Working Paper. Indian Institute of Management: Ahmedabad, India.
D'Ippoliti D, Michelozzi P, Marino C, de Donato F, Menne B et al. (2010). The impact on heat waves mortality in 9 European Cities: Results from the EuroHEAT project. Environmental Health 9: 37.
Dilling L, Daly ME, Travis WR, Wilhelmi O and Klein RA (2015). The dynamics of vulnerability: Why adapting to climate variability will not always prepare us for climate change. Wiley Interdisciplinary Reviews: Climate Change 6: 413-425.
Doblhammer G and Ziegler U (2006). Future elderly living conditions in Europe: Demographic insights. In: Backes GM, Lasch V, Reimann K, eds. Gender, health and ageing: European perspectives on life course, health issues and social challenges. VS Verlag für Sozialwissenschaften: Wiesbaden, Germany.
Donat MG, Alexander LV, Yang H, Durre I, Vose R et al. (2013). Updated analyses of temperature and precipitation extreme indices since the beginning of the twentieth century: The HadEX2 dataset. Journal of Geophysical Research: Atmpospheres 118: 2098-2118.
Dong W, Liu Z, Liao H, Tang Q and Li X (2015). New climate and socio-economic scenarios for assessing global human health challenges due to heat risk. Climatic Change 130: 505-518.
Dong N, Liu Z, Luo M, Fang C and Lin H (2019). The effects of anthropogenic land use changes on climate in China driven by global socioeconomic and emissions scenarios. Earth’s Future, 7(7): 784-804.
Dosio A (2016). Projections of climate change indices of temperature and precipitation from an ensemble of bias-adjusted high-resolution EURO-CORDEX regional climate models. Journal of Geophysical Research 121: 5488-5511.
Dosio A (2017). Projection of temperature and heat weaves for Africa with an ensemble of CORDEX Regional Climate Models. Climate Dynamics 49: 493-519.
Dosio A and Fischer EM (2018). Will half a degree make a difference? Robust projection of indices of mean and extreme climate in Europe under 1.5°C, 2°C and 3°C global warning. Geophysical Research Letters 45: 935-944.
Dosio A, Mentaschi L, Fischer EM and Wyser K (2018). Extreme heat waves under 1.5°C and 2°C global warning. Environmental Research Letters 13: 054006.
Dunford R, Harrison PA, Jäger J, Rounsevell MD and Tinch R (2015). Exploring climate change vulnerability across sectors and scenarios using indicators of impacts and coping capacity. Climatic Change 128: 339-354.
Eakin H and Luers AL (2006). Assessing the vulnerability of social-environmental systems. Annual Review of Environment and Resources 31: 365-394.
References
229
Ebi KL (2013). Health in the new scenarios for climate change research. International Journal of Environmental Research and Public Health 11: 30-46.
Ebi KL, Hallegatte S, Kram T, Arnell NW, Carter TR et al. (2013). A new scenario framework for climate change research: Background, process, and future directions. Climatic Change 122: 363-372.
Ebi KL, Kram T, van Vuuren DP, O'Neill BC and Kriegler E (2014). A new toolkit for developing scenarios for climate change research and policy analysis. Environment 56: 6-16.
Ebi KL, Hess JJ and Isaksen TB (2016). Using uncertain climate and development information in health adaptation planning. Current Environmental Health Reports 3: 99-105.
EEA (2011). Knowledge base for forward-looking information and services: Catalogue of scenario studies. EEA technical report n° 1-2011. European Environment Agency: Copenhagen, Denmark.
EEA (2012). Urban adaptation to climate change in Europe. EEA report n°2/2012. European Environment Agency: Copenhagen, Denmark.
EEA (2016). Climate change, impacts and vulnerability in Europe 2016: An indicator-based report. EEA report n°1/2017. European Environment Agency: Copenhagen, Denmark.
Eierdanz F, Alcamo J, Acosta-Michlik L, Krömker D and Tänzler D (2008). Using fuzzy set theory to address the uncertainty of susceptibility to drought. Regional Environmental Change 8: 197-205.
Emerson MO, Bratter J, Howell J, Jeanty W and Cline M (2012). Houston region grows more racially/ethnically diverse with small declines in segregation - A joint report analyzing census data from 1990, 2000, and 2010. Kinder Institute for Urban Research, Rice University: Houston, TX, United States.
Engström K, Olin S, Rounsevell MD, Brogaard S, Van Vuuren DP et al. (2016). Assessing uncertainties in global cropland futures using a conditional probabilistic modelling framework. Earth System Dynamics 7: 893-915.
Environment Canada (2019). Warm season weather hazards: Heat and humidity. Available online at: https://www.canada.ca/en/environment-climate-change/services/seasonal-weather-hazards/warm-season-weather-hazards.html#toc7
EPA (2008). Reducing urban heat islands: Compendium of strategies. US Environmental Protection Agency : Washington, DC, United States.
ESPON (2014). ET2050 territorial scenarios and visions for Europe. Final report - Main report. ESPON & MCRIT LTD.
Eurostat (2016a). NUTS – Nomenclature of territorial units for statistics. Available online at: http://ec.europa.eu/eurostat/web/nuts/background
Eurostat (2016b). Health: Health status and determinants data. Available online at: http://ec.europa.eu/eurostat/web/health/data/database
Eurostat (2017). People in the EU – Population projections. Available online at:https://ec.europa.eu/eurostat/statistics-
References
230
explained/index.php?title=People_in_the_EU_-_population_projections&oldid=417841#An_ageing_society
Eyring V, Bony S, Meehl GA, Senior CA, Stevens B et al. (2016). Overview of the coupled model intercomparison project phase 6 (CMIP6) experimental design and organization. Geoscientific Model Development 9: 1937-1958.
Fernandez Milan B and Creutzig F (2015). Reducing urban heat wave risk in the 21st century. Current Opinion in Environmental Sustainability 14: 221-231.
Filho WL, Balogun AL, Ayal DY, Bethurem EM, Murambadoro M et al. (2018). Strengthening climate change adaptation capacity in Africa - Case studies from six major African cities and policy implications. Environmental Science & Policy 86: 29-37.
Fischer EM and Schär C (2010). Consistent geographical patterns of changes in high-impact European heatwaves. Nature Geoscience 3: 398-403.
Fokkema T and Liefbroer AC (2008). Trends in living arrangements in Europe: Convergence or divergence? Demographic Research 19: 1351-1418.
Foroni M, Salvioli G, Rielli R, Goldoni CA, Orlandi G et al. (2007). A retrospective study on heat-related mortality in an elderly population during the 2003 heat wave in Modena, Italy: The Argento project. The Journals of Gerontology: Series A 62: 647-651.
Forzieri G, Feyen L, Russo S, Vousdoukas M, Alfieri L et al. (2016). Multi-hazard assessment in Europe under climate change. Climatic Change 137: 105-119.
Forzieri G, Cescatti A, Batista e Silva F and Feyen L (2017). Increasing risk over time of weather-related hazards to the European population: A data-driven prognostic study. The Lancet Planetary Health 1: 200-208.
Fouillet A, Rey G, Laurent F, Pavillon G, Bellec S et al. (2006). Excess mortality related to the August 2003 heat wave in France. International Archives of Occupational and Environmental Health 80: 16-24.
Fouillet A, Rey G, Wagner V, Laaidi K, Empereur-Bissonnet P et al. (2008). Has the impact of heat waves on mortality changed in France since the European heat wave of summer 2003? A study on the 2006 heat wave. International Journal of Epidemiology 37: 309-317.
Frame B, Lawrence J, Ausseil A, Reisinger A and Daigneault A (2018). Adapting global shared socioeconomic pathways for national and local scenarios. Climate Risk Management 21: 39-51.
Fuladlu K, Riza M and Ilkan M (2018). The effect of rapid urbanization on the physical modification of urban area. Proceedings of the 5th International conference on architecture and Built Environment: Venice, Italy.
Füssel H-M (2007a). Vulnerability: A generally applicable conceptual framework for climate change research. Global Environmental Change 17: 155-167.
References
231
Füssel H-M (2007b). Adaptation planning for climate change: Concepts, assessment approaches, and key lessons. Sustainability Science 2: 265-275.
Füssel H-M (2009). Review and quantitative analysis of indices of climate change exposure, adaptive capacity, sensitivity, and impacts. Background note. World Development Report 2010.
Füssel H-M and Klein RJT (2006). Climate change vulnerability assessments: An evolution of conceptual thinking. Climatic Change 75: 301-329.
GADM (2018). Database of global administrative areas - Version 3.6. Available online at: https://gadm.org/data.html
Gallopín GC (2006). Linkages between vulnerability, resilience, and adaptive capacity. Global Environmental Change 16: 293-303.
Gao J (2017). Downscaling global spatial population projections from 1/8-degree to 1-km grid cells. NCAR technical notes. National Center for Atmospheric Research: Boulder, CO, United States.
Gao J and O'Neill B (2019). Data-driven spatial modeling of long-term urban land development potential for global environmental change climatic impact assessment: The SELECT model. Environmental Modelling & Software 119: 458-471.
Garschagen M and Kraas F (2010). Assessing future resilience to natural hazards - The challenges of capturing dynamic changes under conditions of transformations and climate change. Proceedings of the International Disaster and Risk Conference: Davos, Switzerland.
Garschagen M and Romero-Lankao P (2013). Exploring the relationships between urbanization trends and climate change vulnerability. Climatic Change 133: 37-52.
Gasparrini A, Guo Y, Hashizume M, Kinney PL, Petkova EP et al. (2015a). Temporal variation in heat-mortality associations: A multicountry study. Environmental Health Perspectives 123: 1200-1207.
Gasparrini A, Guo Y, Hashizume M, Lavigne E, Zanobetti A et al. (2015b). Mortality risk attributable to high and low ambient temperature: A multicountry observational study. The Lancet 386: 369-375.
Gasparrini A, Guo Y, Sera F, Vicedo-Cabrera A, Huber V et al. (2017). Projections of temperature-related excess mortality under climate change scenarios. The Lancet Planetary Health 1: e360-e367.
Gaymu J, Ekamper P and Beets G (2008). Future trends in health and marital status: Effects on the structure of living arrangements of older Europeans in 2030. European Journal of Ageing 5: 5-17.
Georgescu M, Morefield PE, Bierwagen BG and Weaver CP (2014). Urban adaptation can roll back warming of emerging megapolitan regions. Proceedings of the National Academy of Sciences of the United States of America 111: 2909-2914.
Georgetown Climate Center (2019). State and local adaptation plans. Available online at: https://www.georgetownclimate.org/adaptation/plans.html
References
232
Gidden MJ, Rao ND, Parkinson SC and Riahi K (In review). Spatially explicit urban and rural poverty estimates under different global socioeconomic futures. Nature Sustainability.
Gosling SN, Hondula DM, Bunker A, Ibarreta D, Liu J et al. (2017). Adaptation to climate change: A comparative analysis of modeling methods for heat-related mortality. Environmental Health Perspectives 125: 087008.
Gramberger M, Kok K, Maes M, Stuch B, Harrison PA et al. (2012). Report on the second CLIMSAVE European stakeholder workshop. Available online at:http://www.climsave.eu/climsave/doc/Report_on_the_second_European_workshop.pdf
Gramberger M, Harrison PA, Jager J, Kok K, Libbrecht S et al. (2013). Report on the third CLIMSAVE European stakeholder workshop. Available online at:http://www.climsave.eu/climsave/doc/Report_on_the_third_European_workshop.pdf
Guivarch C, Rozenberg J and Schweizer V (2016). The diversity of socio-economic pathways and CO2 emissions scenarios: Insights from the investigation of a scenarios database. Environmental Modelling & Software 80: 336-353.
Guneralp B, Zhou Y, Urge-Vorsatz D, Gupta M, Yu S et al. (2017). Global scenarios of urban density and its impacts on building energy use through 2050. Proceedings of the National Academy of Sciences of the United States of America 114: 8945-8950.
Guo Y, Gasparrini A, Armstrong BG, Tawatsupa B, Tobias A et al. (2017). Heat wave and mortality: A multicountry, multicommunity study. Environmental Health Perspectives 125: 087006.
Guo Y, Gasparrini A, Li S, Sera F, Vicedo-Cabrera AM et al. (2018). Quantifying excess deaths related to heatwaves under climate change scenarios: A multicountry time series modelling study. PLOS Medicine 15: 1002629.
Hajat S and Kosatky T (2010). Heat-related mortality: A review and exploration of heterogeneity. Journal of Epidemiology and Community Health 64: 753-760.
Hales S, Kovats S, Lloyd S and Campbell-Lendrum D (2014). Quantitative risk assessment of the effects of climate change on selected causes of death, 2030s and 2050s. WHO report. World Health Organization: Geneva, Switzerland.
Hallegatte S, Przyluski V and Vogt-Schilb A (2011). Building world narratives for climate change impact, adaptation and vulnerability analyses. Nature Climate Change 1: 151-155.
Hanasaki N, Fujimori S, Yamamoto T, Yoshikawa S, Masaki Y et al. (2013). A global water scarcity assessment under shared socio-economic pathways - Part 2: Water availability and scarcity. Hydrology and Earth System Sciences 17: 2393–2413.
Hanna EG and Tait PW (2015). Limitations to thermoregulation and acclimatization challenge human adaptation to global warming.
References
233
International Journal of Environmental Research and Public Health, 12: 8034-8074.
Hardy RD and Hauer ME (2018). Social vulnerability projections improve sea-level rise risk assessments. Applied Geography 91: 10-20.
Harjanne A, Nurmi V, Perrels A and Votsis A (2014). Climate hazard and impact scenarios. ToPDAd project deliverable D2.1. Tool-Supported Policy Development for Regional Adaptation.
Harrington LJ and Otto FEL (2018). Changing population dynamics and uneven temperature emergence combine to exacerbate regional exposure to heat extremes under 1.5°C and 2°C of warming. Environmental Research Letters 13: 034011.
Hasegawa T, Fujimori S, Shin Y, Takahashi K, Masui T et al. (2014). Climate change impact and adaptation assessment on food consumption utilizing a new scenario framework. Environmental Science & Technology 48: 438-445.
Hasegawa T, Fujimori S, Takahashi K and Masui T (2015). Scenarios for the risk of hunger in the twenty-first century using shared socioeconomic pathways. Environmental Research Letters 10: 014010.
Hasegawa T, Fujimori S, Takahashi K, Yokohata T and Masui T (2016). Economic implications of climate change impacts on human health through undernourishment. Climatic Change 136: 189-202.
Hauer ME (2019). Population projections for U.S. counties by age, sex, and race controlled to shared socioeconomic pathway. Scientific Data 6: 190005.
Haurin DR and Rosenthal SS (2004). The influence of household formation on hownership rates across time and race. Report to the Office of Policy Development and Research. U.S. Department of Housing and Urban Development: Cambridge, MA, United States.
Hayden M, Wilhelmi O, Banerjee D, Greasby T, Cavanaugh JL et al. (2017). Adaptive capacity to extreme heat: Results from a household survey in Houston, Texas. Weather, Climate, and Society 9: 787-799.
HCAAA (2016). Progress report for Houston and Harris County: 2008-2016 ageing agenda. Harris County Area Agency on Ageing: Houston, TX, United States.
Heaton MJ, Sain SR, Greasby TA, Uejio CK, Hayden M et al. (2014). Characterizing urban vulnerability to heat stress using a spatially varying coefficient model. Spatial and Spatio-temporal Epidemiology 8: 23-33.
H-GAC (2017). Livable centers - more choices, great places. The Houson-Galveston Area Council: Houston, TX, United States.
H-GAC (2018). 2045 active transportation plan. The Houston-Galveston Area Council: Houston, TX, United States.
Hinkel J, Lincke D, Vafeidis AT, Perrette M, Nicholls RJ et al. (2014). Coastal flood damage and adaptation costs under 21st century sea-level rise.
References
234
Proceedings of the National Academy of Sciences of the United States of America 111: 3292-3297.
Hitchcock D (2004). Cool Houston! A plan for cooling the region. Houston Advanced Research Center: Houston, TX, United States.
Hitchcock D (2006). Strategic plan for urban heat island mitigation in the Houston region. Houston Advanced Research Center: Houston, TX, United States.
Holman I, Cojocaru G and Harrison PA (2013). Guidance report describing the final version of the CLIMSAVE integrated assessment platform. Available online at: http://www.climsave.eu/climsave/doc/Report_on_the_Final_IA_Platform.pdf
Holman IP, Brown C, Carter TR, Harrison PA and Rounsevell M (2019). Improving the representation of adaptation in climate change impact models. Regional Environmental Change 19: 711-721.
Hölscher K, Frantzeskaki N, Holman IP, Pedde S, Juhasz-Horvath L et al. (2017). Adaptation and mitigation pathways, and synergy mechanisms between them, for the case studies. Deliverable D4.2. EU FP7 IMPRESSIONS Project.
Hondula DM, Balling RC, Vanos JK and Georgescu M (2015). Rising temperatures, human health, and the role of adaptation. Current Climate Change Reports 1: 144-154.
Hoornweg D and Pope K (2017). Population predictions for the worlds largest cities in the 21st century. Environment & Urbanization 29: 195-216.
Huang K, Li X, Liu X and Seto K (In review). Forecasting global urban land expansion and heat island intensification through 2050. Nature Sustainability.
Hunt DVL, Lombardi DR, Atkinson S, Barber ARG, Barnes M et al. (2012). Scenario archetypes: Converging rather than diverging themes. Sustainability 4: 740-772.
Hunter LM and O'Neill BC (2014). Enhancing engagement between the population, environment, and climate research communities: The shared socio-economic pathway process. Population and Environment 35: 231-242.
Hurth F, Lückenkötter J and Schonlau M (2017). European GDP projections for 2015-2060: 10-km gridded data based on shared socioeconomic pathways (SSPs). IRPUD, TU Dortmund University: Dortmund, Germany.
Houet T, Marchadier C, Bretagne G, Moine MP, Aguejdad R et al. (2016). Combining narratives and modelling approaches to simulate fine scale and long-term urban growth scenarios for climate adaptation. Environmental Modelling & Software 86: 1-13.
IFPRI (2015). Urban Extent of Africa 2010. Dataverse, version 1.5. International Food Policy Research Institute.
References
235
IIASA (2016). Shared socioeconomic Pathways Database, Version 1.1. International Institute for Applied Systems Analysis. Available onlin e at: https://tntcat.iiasa.ac.at/SspDb/dsd?Action=htmlpage&page=about
Imada Y, Watanabe M, Kawase H, Shiogama H and Arai M (2019). The July 2018 high temperature event in Japan could not have happened without human-induced global warming. Scientific Online Letters on the Atmosphere 15a: 8-11.
Inbar O, Morris N, Epstein Y and Gass G (2004). Comparison of thermoregulatory responses to exercise in dry heat among prepubertal boys, young adults and older males. Experimental Physiology 89: 691-700.
Inostroza L, Palme M and de la Barrera F (2016). A heat vulnerability index: Spatial patterns of exposure, sensitivity and adaptive capacity for Santiago de Chile. PLoS ONE 11:e0162464
IPBES (2016). The methodological assessment report on scenarios and models of biodiversity and ecosystem services. Intergovernmental Science-Policy Platform on Biodiversity and Ecosystem Services: Bonn, Germany.
IPCC (2000). Special report on emission scenarios. A special report of Working Group II of the Intergovernmental Panel on Climate Change. Cambridge University Press: Cambridge, United Kingdom; New York City, NY, United States.
IPCC (2001). Climate Change 2001: Impacts, Adaptation and Vulnerability. Working Group II Contribution to the Third Assessment Report of the Intergovernmental Panel on Climate Change. Cambridge University Press: Cambridge, United Kingdom; New York City, NY, United States.
IPCC (2007). Climate Change 2007: Impacts, Adaptation and Vulnerability. Working Group II Contribution to the Fourth Assessment Report of the Intergovernmental Panel on Climate Change. Cambridge University Press: Cambridge, United Kingdom; New York City, NY, United States.
IPCC (2012). Managing the risks of extreme events and disasters to advance climate change adaptation. Special Report of Working Groups I and II of the Intergovernmental Panel on Climate Change. Cambridge University Press: Cambridge, United Kingdom; New York City, NY, United States.
IPCC (2013). Climate Change 2013: The physical science basis. Working Group I Contribution to the Fifth Assessment Report of the Intergovernmental Panel on Climate Change. Cambridge University Press: Cambridge, United Kingdom; New York City, NY, United States.
IPCC (2014). Climate change 2014: Impacts, adaptation, and vulnerability. Part A: Global and sectoral aspects. Working Group II Contribution to the Fifth Assessment Report of the Intergovernmental Panel on Climate Change. Cambridge University Press: Cambridge, United Kingdom; New York City, NY, United States.
Ishida H, Kobayashi S, Kanae S, Hasegawa T, Fujimori S et al. (2014). Global-scale projection and its sensitivity analysis of the health burden
References
236
attributable to childhood undernutrition under the latest scenario framework for climate change research. Environmental Research Letters 9: 064014.
Jacob D, Petersen J, Eggert B, Alias A, Christensen OB et al. (2014). Euro-cordex: New high-resolution climate change projections for European impact research. Regional Environmental Change 14: 563-578.
Jevrejeva S (2013). Structured set of scenarios and initial projections: Regionalised semi-empirical models and available set of RCPs and SSPs. RISES-AM Project Deliverable D2.1. Responses to coastal climate change: Innovative Strategies for high End Scenarios - Adaptation and Mitigation.
Jiang L and O’Neill BC (2017). Global urbanization projections for the shared socioeconomic pathways. Global Environmental Change 42: 193-199.
Jones B, O'Neill BC, McDaniel L, McGinnis S, Mearns LO et al. (2015). Future population exposure to US heat extremes. Nature Climate Change 5: 652-655.
Jones B and O’Neill BC (2016). Spatially explicit global population scenarios consistent with the shared socioeconomic pathways. Environmental Research Letters 11: 084003.
Jones B, Tebaldi C, O’Neill BC, Oleson K and Gao J (2018). Avoiding population exposure to heat-related extremes: Demographic change vs climate change. Climatic Change 146: 423-437.
Jongman B, Winsemius HC, Aerts JC, Coughlan de Perez E, van Aalst MK et al. (2015). Declining vulnerability to river floods and the global benefits of adaptation. Proceedings of the National Academy of Sciences of the United States of America 112: 2271-2280.
Juhola S, Keskitalo ECH and Westerhoff L (2011). Understanding the framings of climate change adaptation across multiple scales of governance in Europe. Environmental Politics 20: 445-463.
Juhola S, Glaas E, Linnér BO, Neset TS (2016). Redefining maladaptation. Environmental Sience & Policy 55: 135-140.
Jurgilevich A, Räsänen A, Groundstroem F and Juhola S (2017). A systematic review of dynamics in climate risk and vulnerability assessments. Environmental Research Letters 12: 013002.
Kamali B, Abbaspour KC, Wehrli B and Yang H (2018). Drought vulnerability assessment of maize in Sub Saharan Africa: Insights from physical and social perspectives. Global and Planetary Change 162: 266-274.
Kamei M, Hanaki K and Kurisu K (2016). Tokyo’s long-term socioeconomic pathways: Towards a sustainable future. Sustainable Cities and Society 27: 73-82.
KC S and Lutz W (2014). Demographic scenarios by age, sex and education corresponding to the SSP narratives. Population and Environment 35: 243-260.
References
237
KC S and Lutz W (2017). The human core of the shared socioeconomic pathways: Population scenarios by age, sex and level of education for all countries to 2100. Global Environmental Change 42: 181-192.
Kebede AS, Nicholls RJ, Allan A, Arto I, Cazcarro I et al. (2018). Applying the global RCP-SSP-SPA scenario framework at sub-national scale: A multi-scale and participatory scenario approach. The Science of the Total Environment 635: 659-672.
Kelly PM and Adger WN (2000). Theory and practice in assessing vulnerability to climate change and facilitating adaptation. Climatic Change 47: 325-352.
Kemp-Benedict E, de Jong W and Pacheco P (2014). Forest futures: Linking global paths to local conditions. International Union of Forest Research Organization World Series 32: 539-553.
Kenny GP, Yardley J, Brown C, Sigal RJ and Jay O (2010). Heat stress in older individuals and patients with common chronic diseases. Canadian Medical Association Journal 182: 1053-1060.
Kenworthy L (2018). America's great decoupling. In: Nolan B, ed. Inequality and inclusive growth in rich countries. Oxford University Press: Oxford, United Kingdom.
Kjellstrom T, Freyberg C, Lemke B, Otto M and Briggs D (2018). Estimating population heat exposure and impacts on working people in conjunction with climate change. International Journal of Biometeorology 62: 291-306.
Knol AB, Slottje P, van der Sluijs JP and Lebret E (2010). The use of expert elicitation in environmental health impact assessment: A seven step procedure. Environmental Health 9: 19.
Knorr W, Arneth A and Jiang L (2016). Demographic controls of future global fire risk. Nature Climate Change 6: 781-785.
Knorr W, Dentener F, Lamarque J-F, Jiang L and Arneth A (2017). Wildfire air pollution hazard during the 21st century. Atmospheric Chemistry and Physics 17: 9223-9236.
Knutti R and Sedláček J (2012). Robustness and uncertainties in the new CMIP5 climate model projections. Nature Climate Change 3: 369-373.
Kok K, Gramberger M, Zellmer K, Simon KH, Jager J et al. (2013). Report on the new methodology for scenario analysis and based on an analysis of past scenario exercises. Available online at: http://www.climsave.eu/climsave/doc/Report_on_the_scenario_methodology_updated.pdf
Kok K, Christensens JH, Madsen MS, Pedde S, Gramberger M et al. (2015a). Evaluation of existing climate and socio-economic scenarios including a detailed description of the final selection. Deliverale D2.1. EU FP7 IMPRESSIONS Project.
Kok K, Pedde S, Jäger J and Harrison PA (2015b). European shared socioeconomic pathways. EU FP7 IMPRESSIONS Project.
References
238
Kok K and Pedde S (2016). Socio-economic scenarios for all case-studies. Deliverable D2.2. EU FP7 IMPRESSIONS Project.
Kok K, Madsen MS, Pedde S, Christensen JH and Fronzek S (2018). Set of integrated high-end, multi-scale scenarios. Deliverable D2.4. EU FP7 IMPRESSIONS Project.
Kok K, Pedde S, Gramberger M, Harrison PA and Holman I (2019). New European socio-economic scenarios for climate change research: Operationalising concepts to extended the shared socioeconomic pathways. Regional Environmental Change 19: 643-654.
Kolko J (2015). How suburban are big American cities? Available online at: https://fivethirtyeight.com/features/how-suburban-are-big-american-cities/
Kotlarski S, Keuler K, Christensen OB, Colette A, Déqué M et al. (2014). Regional climate modeling on European scales: A joint standard evaluation of the EURO-CORDEX RCM ensemble. Geoscientific Model Development 7: 1297-1333.
Koutroulis AG, Grillakis MG, Daliakopoulos IN, Tsanis IK and Jacob D (2016). Cross sectoral impacts on water availability at +2°C and +3°C for east Mediterranean island states: The case of Crete. Journal of Hydrology 532: 16-28.
Koutroulis AG, Papadimitriou LV, Grillakis MG, Tsanis IK, Wyser K et al. (2018). Freshwater vulnerability under high end climate change. A pan-european assessment. Science of the Total Environment 613-614: 271-286.
Kovats RS and Hajat S (2008). Heat stress and public health: A critical review. Annual Review of Public Health 29: 41-55.
Kriegler E, O’Neill BC, Hallegatte S, Kram T, Lempert RJ et al. (2012). The need for and use of socio-economic scenarios for climate change analysis: A new approach based on shared socio-economic pathways. Global Environmental Change 22: 807-822.
Kriegler E, Edmonds J, Hallegatte S, Ebi KL, Kram T et al. (2014). A new scenario framework for climate change research: The concept of shared policy assumptions. Climatic Change 122: 401-414.
Kuras ER, Richardson MB, Calkins MM, Ebi KL, Hess JJ et al. (2017). Opportunities and challenges for personal heat exposures research. Environmental Health Perspectives 125: 085001.
Kurniawan R and Managi S (2018). Measuring long-term sustainability with shared socioeconomic patways using an inclusive wealth framework. Sustainable Development 26: 596-605.
Lamontagne JR, Reed PM, Link R, Calvin KV, Clarke LE et al. (2018). Large ensemble analytic framework for consequence-driven discovery of climate change scenarios. Earth’s Future 6: 488-504.
Larsen L (2015). Urban climate and adaptation strategies. Frontiers in Ecology and the Environment 13: 486-492.
References
239
Lee JY, Kim E, Lee WS, Chae Y and Kim H (2018). Projection of future mortality due to temperature and population changes under representative concentration pathways and shared socioeconomic pathways. International Journal of Environmental Research and Public Health 15.
Leimbach M, Kriegler E, Roming N and Schwanitz J (2017). Future growth patterns of world regions - A GDP scenario approach. Global Environmental Change 42: 215-225.
Lemonsu A, Viguié V, Daniel M and Masson V (2015). Vulnerability to heat waves: Impact of urban expansion scenarios on urban heat island and heat stress in Paris (France). Urban Climate 14: 586-605.
Letta M and Tol RSJ (2019). Weather, climate and total factor productivity. Environmental and Resource Economics, 73: 283-305.
Li M, Gu S, Bi P, Yang J and Liu Q (2015). Heat waves and morbidity: Current knowledge and further direction - A comprehensive literature review. International Journal of Environmental Research and Public Health 12: 5256-5283.
Li X, Zhou Y, Asrar GR, Imhoff M and Li X (2017). The surface urban heat island response to urban expansion: A panel analysis for the conterminous United States. The Science of the Total Environment 605-606: 426-435.
Li X, Zhou Y, Eom J, Yu S and Asrar GR (2019). Projecting global urban area growth through 2100 based on historical time-series data and future shared socioeconomic pathways. Earth's Future 7: 351-362.
Lieberknecht K (2018). Welcome to planet Texas 2050. University of Texas: Austin, TX, United States.
Lino, J., Rohat G, Kirshen P and Dao H (2019). Extended the shared socioeconomics pathways at the city scale to inform future vulnerablity assessments - The case of Boston, Massachusetts. In review in Journal of Extreme Events. Available as preprint in SocArXiv.
Liotta G, Inzerilli MC, Palombi L, Madaro O, Orlando S et al. (2018). Social interventions to prevent heat-related mortality in the older adult in Rome, Italy: A quasi-experimental study. International Journal of Environmental Research and Public Health 15.
Liu Z, Anderson B, Yan K, Dong W, Liao H et al. (2017). Global and regional changes in exposure to extreme heat and the relative contributions of climate and population change. Scientific Reports 7: 43909.
Logan JR, Xu Z and Stults BJ (2014). Interpolating U.S. decennial census tract data from as early as 1970 to 2010: A longitudinal tract database. The Professional Geographer 66: 412-420.
Lorenzoni I, Jordan A, Hulme M, Turner RK and O'Riordan T (2000). A co-evolutionary approach to climate change impact assessment: Part I. Integrating socio-economic and climate change scenarios. Global Environmental Change 10: 57-68.
Lückenkötter J, Hurth F and Schonlau M (2017). European population projections for 2015-2060: 10-km gridded data based on the Shared
References
240
Socioeconomic Pathways (SSPs). IRPUD, TU Dortmund University: Dortmund, Germany.
Lundgren L and Jonsson A (2012). Assessment of social vulnerability: A literature review of vulnerability related to climate change and natural hazards. CSPR Briefing n°9. Centre for Climate Science and Policy Research : Norrköping, Sweden.
Lundgren K and Kjellstrom T (2013). Sustainability challenges from climate change and air conditioning use in urban areas. Sustainability 5: 3116-3128.
Lung T, Lavalle C, Hiederer R, Dosio A and Bouwer LM (2013). A multi-hazard regional level impact assessment for Europe combining indicators of climatic and non-climatic change. Global Environmental Change 23: 522-536.
Lutz W, Muttarak R and Striessnig E (2014). Universal education is key to enhanced climate adaptation. Science 346: 1061-1062.
Lutz W and Muttarak R (2017). Forecasting societies' adaptive capacities through a demographic metabolism model. Nature Climate Change 7: 177-184.
Lwasa S, Buyana K, Kasaija P and Mutyaba J (2018). Scenarios for adaptation and mitigation in urban Africa under 1.5°C global warming. Current Opinion in Environmental Sustainability 30: 52-58.
Mallampalli VR, Mavrommati G, Thompson J, Duveneck M, Meyer S et al. (2016). Methods for translating narrative scenarios into quantitative assessments of land use change. Environmental Modelling & Software 82: 7-20.
Marangoni G, Tavoni M, Bosetti V, Borgonovo E, Capros P et al. (2017). Sensitivity of projected long-term CO2 emissions across the shared socioeconomic pathways. Nature Climate Change 7: 113-117.
Marsha A, Sain SR, Heaton MJ, Monaghan AJ and Wilhelmi O (2018). Influences of climatic and population changes on heat-related mortality in Houston, Texas, USA. Climatic Change 146: 471-485.
Mason-D'Croz D, Vervoort J, Palazzo A, Islam S, Lord S et al. (2016). Multi-factor, multi-state, multi-model scenarios: Exploring food and climate futures for southeast asia. Environmental Modelling & Software 83: 255-270.
Mathijs E, Deckers J, Kopainsky B, Nitzko S and Spiller A (2018). Report on scenarios for EU farming. Sure Farm Project Deliverable 1.2.
Matthews TKR, Wilby RL and Murphy C (2017). Communicating the deadly consequences of global warming for human heat stress. Proceedings of the National Academy of Sciences of the United States of America 114: 3861-3866.
Maury O, Campling L, Arrizabalaga H, Aumont O, Bopp L et al. (2017). From shared socio-economic pathways (SSPs) to oceanic system pathways
References
241
(OSPs): Building policy-relevant scenarios for global oceanic ecosystems and fisheries. Global Environmental Change 45: 203-216.
Mayoral Task Force on Equity (2017). Rising together: A roadmap to confront inequality in Houston. City of Houston: Houston, TX, United States.
McCue D and Herbert C (2016). Updated household projections, 2015-2035: Methodology and results. Working paper. Harvard Joint Center for Housing Studies: Cambridge, MA, United States.
MCRIT (2014). ET2050 territorial scenarios and visions for Europe. Volume 1 - Approach to Scenario Building and Storylines. ESPON & MCRIT LTD.
Mearns LO, McGinnis SA and Korytina D (2017). The NA-CORDEX dataset, version 1.0. NCAR Climate Data Gateway: Boulder, CO, United States.
Merkens J-L, Reimann L, Hinkel J and Vafeidis AT (2016). Gridded population projections for the coastal zone under the shared socioeconomic pathways. Global and Planetary Change 145: 57-66.
Messina JP, Brady OJ, Gold ing N, Kraemer MUG, Wint WGR et al. (2019). The current and future global distribution and population at risk of dengue. Nature Microbiology 4: 1508-1515.
Minx JC, Callaghan M, Lamb WF, Garard J and Edenhofer O (2017). Learning about climate change solutions in the IPCC and beyond. Environmental Science and Policy, 77: 252-259.
Mishra V, Mukherjee S, Kumar R and Stone D (2017). Heat wave exposure in India in current, 1.5 °C, and 2.0 °C worlds. Environmental Research Letters 12: 124012.
Mogollón JM, Beusen AHW, van Grinsven HJM, Westhoek H and Bouwman AF (2018). Future agricultural phosphorus demand according to the shared socioeconomic pathways. Global Environmental Change 50: 149-163.
Monaghan AJ, Hu L, Brunsell N, Barlage M and Wilhelmi O (2014). Evaluating the impact on urban morphology configurations on the accuracy of urban canopy model temperature simulations with MODIS. Journal of Geophysical Research: Atmospheres 119: 6376-6392.
Monaghan AJ, Sampson KM, Steinhoff DF, Ernst KC, Ebi KL et al. (2018). The potential impacts of 21st century climatic and population changes on human exposure to the virus vector mosquito aedes aegypti. Climatic Change 146: 487-500.
Mora C, Dousset B, Caldwell IR, Powell FE, Geronimo RC et al. (2017). Global risk of deadly heat. Nature Climate Change 7: 501-506.
Morales L (2017). Beat the heat program breathes cool air into Houston. CitySavvy: Houston, TX, United States.
Morefield PE, Fann N, Grambsch A, Raich W and Weaver C (2018). Heat-related health impacts under scenarios of climate and population change. International Journal of Environmental Research and Public Health, 15(11): 2438.
Moss RH, Babiker M, Brinkman S, Calvo E, Carter T et al. (2007). Towards new scenarios for analysis of emissions, climate change, impacts, and response
References
242
strategies. Expert meeting report of the Intergovernmental Panel on Climate Change: Noordwijkerhout, The Netherlands.
Moss RH, Edmonds JA, Hibbard KA, Manning MR, Rose SK et al. (2010). The next generation of scenarios for climate change research and assessment. Nature 463: 747-756.
Mouratiadou I, Biewald A, Pehl M, Bonsch M, Baumstark L et al. (2016). The impact of climate change mitigation on water demand for energy and food: An integrated analysis based on the Shared Socioeconomic Pathways. Environmental Science & Policy 64: 48-58.
Murakami D and Yamagata Y (2016). Estimation of gridded population and GDP scenarios with spatially explicit statistical downscaling. Available online at: https://arxiv.org/abs/1610.09041
Murray CJ and Lopez AD (2013). Measuring the global burden of disease. The New England Journal of Medicine 369: 448-457.
Muttarak R and Lutz W (2014). Is education a key to reducing vulnerability to natural disasters and hence unavoidable climate change? Ecology and Society 19: 42.
Nakicenovic N, Lempert RJ and Janetos AC (2014). A framework for the development of new socio-economic scenarios for climate change research: Introductory essay. Climatic Change 122: 351-361.
Nelson R, Kokic P, Crimp S, Meinke H and Howden SM (2010). The vulnerability of Australian rural communities to climate variability and change: Part I—Conceptualising and measuring vulnerability. Environmental Science & Policy 13: 8-17.
Nepal P, Korhonen J, Prestemon JP and Cubbage FW (2019). Projecting global planted forest area developments and the associated impacts on global forest product markets. Journal of Environmental Management 240: 421-430.
Nilsson AE, Carlsen H and van der Watt L-M (2015). Uncertain Futures: The Changing Global Context of the European Arctic. SEI working paper 2015-12. Stockholm Environment Institute: Stockholm, Sweden.
Nilsson AE, Bay-Larsen I, Carlsen H, van Oort B, Bjørkan M et al. (2017). Towards extended shared socioeconomic pathways: A combined participatory bottom-up and top-down methodology with results from the Barents region. Global Environmental Change 45: 124-132.
NOAA (2018). Climate change: Atmospheric carbon dioxide. National Oceanic and Atmospheric Administration. Available online at: https://www.climate.gov/news-features/understanding-climate/climate-change-atmospheric-carbon-dioxide
Nolan B, Roser M and Thewissen S (2018). GDP per capita versus median household income: What gives rise to divergence over time and how does this vary across OECD countries? Review of Income and Wealth.
References
243
NWS (2014). The heat equation index - Technical note. National Weather Service - Weather Prediction Center. Available online at: https://www.wpc.ncep.noaa.gov/html/heatindex_equation.shtml
O'Brien K, Eriksen S, Nygaard LP and Schjolden ANE (2007). Why different interpretations of vulnerability matter in climate change discourses. Climate Policy 7: 73-88.
O'Neill BC and Schweizer V (2011). Mapping the road ahead. Nature Climate Change 1: 352-353.
O’Neill BC, Kriegler E, Riahi K, Ebi KL, Hallegatte S et al. (2014). A new scenario framework for climate change research: The concept of shared socioeconomic pathways. Climatic Change 122: 387-400.
O’Neill BC, Kriegler E, Ebi KL, Kemp-Benedict E, Riahi K et al. (2017). The roads ahead: Narratives for shared socioeconomic pathways describing world futures in the 21st century. Global Environmental Change 42: 169-180.
OECD (2008). Handbook on constructing composite indicators - Methodology and user guide. Organisation for Economic Co-operation and Development: Paris, France.
OECD (2016). African economic outlook 2016: Sustainable cities and structure transformation. Organisation for Economic Co-operation and Development: Paris, France.
Oke TR (1973). City size and the urban heat island. Atmospheric Environment 7: 769-779.
Oke TR (1995). The heat island of the urban boundary layer: Characteristics, causes and effects. In Cermak JE, Davenport AG, Plate EJ and Viegas DX,eds. Wind Climate in Cities. Kluwer Academic Publisher: Dordrecht, The Netherlands.
Oleson KW, Monaghan A, Wilhelmi O, Barlage M, Brunsell N et al. (2013). Interactions between urbanization, heat stress, and climate change. Climatic Change 129: 525-541.
Oleson KW, Anderson GB, Jones B, McGinnis SA and Sanderson B (2018). Avoided climate impacts of urban and rural heat and cold waves over the U.S. using large climate model ensembles for RCP8.5 and RCP4.5. Climatic Change 146: 377-392.
Ooi GL and Phua KH (2007). Urbanization and slum formation. Journal of Urban Health 84: 27-34.
Paci D (2014). Human health impacts of climate change in Europe. JRC technical report for the PESETA II Project, EUR-2649EN. Joint Research Center: Ispra, Italy.
Palazzo A, Vervoort JM, Mason-D’Croz D, Rutting L, Havlík P et al. (2017). Linking regional stakeholder scenarios and shared socioeconomic pathways: Quantified West African food and climate futures in a global context. Global Environmental Change 45: 227-242.
Papalexiou SM, AghaKouchak A, Trenberth KE and Foufoula-Georgiou E (2018). Global, regional, and megacity trends in the highest temperature
References
244
of the year: Diagnostics and evidence for accelerating trends. Earth's Future 6: 71-79.
Parkinson SC, Johnson N, Rao ND, Jones B, van Vliet MTH et al. (2016). Climate and human development impacts on municipal water demand: A spatially-explicit global modeling framework. Environmental Modelling & Software 85: 266-278.
Patel RB and Burke TF (2009). Urbanization — An emerging humanitarian disaster. The New England Journal of Medicine 361: 741-743.
Pedde S (2019). Advancing the development and use of climate change scenarios: A multi-scaleanalysis to explore socio-economic European futures. PhD Thesis, Wageningen University, Wageningen, The Nerthelands.
Pedde S, Kok K, Onigkeit J, Brown C, Holman I et al. (2019). Bridging uncertainty concepts across narratives and simulations in environmental scenarios. Regional Environmental Change 19: 655-666.
Pelling M, Leck H, Pasquini L, Ajibade I, Osuteye E et al. (2018). Africa's urban adaptation transition under a 1.5°C climate. Current Opinion in Environmental Sustainability 31: 10-15.
Perkins SE (2015). A review on the scientific understanding of heatwaves - Their measurement, driving mechanisms, and changes at the global scale. Atmospheric Research 164-165: 242-267.
Pessoa JP and Van Reenen J (2011). Decoupling of wage growth and productivity growth? Myth and reality. LSE/Resolution Foundation Presentation. Centre for Economic Performamce, London School of Economics: London, United Kingdom.
Petkova EP, Vink JK, Horton RM, Gasparrini A, Bader DA et al. (2017). Towards more comprehensive projections of urban heat-related mortality: Estimates for New York City under multiple population, adaptation, and climate scenarios. Environmental Health Perspectives 125: 47-55.
PolicyLink (2013). An equity profile of the Houston-Galveston region. PolicyLink: Oakland, CA, United States.
Popp A, Calvin K, Fujimori S, Havlik P, Humpenöder F et al. (2017). Land-use futures in the shared socio-economic pathways. Global Environmental Change 42: 331-345.
Preston BL, Yuen EJ and Westaway RM (2011). Putting vulnerability to climate change on the map: A review of approaches, benefits, and risks. Sustainability Science 6: 177-202.
Rao ND, van Ruijven BJ, Riahi K and Bosetti V (2017). Improving poverty and inequality modelling in climate research. Nature Climate Change 7: 857-862.
Rao ND, Sauer P, Gidden M and Riahi K (2019). Income inequality projections for the shared socioeconomic pathways (SSPs). Futures 105: 27-39.
References
245
Reckien D (2018). What is an index? Constructin method, data metric, and weighting scheme determine the outcome of composite social vulnerability indices in New York City. Regional Environmental Change 18: 1439-1451.
Rees P, Boden P, Dennett A, Stillwell J, Jasinska M et al. (2010). Report on scenarios and a database of scenario drivers. Deliverable D6. ESPON DEMIFER Project.
Rees P, van der Gaag N, De Beer J and Heins F (2012). European regional populations: Current trends, future pathways, and policy options. European Journal of Population 28: 385-416.
Reid CE, O'Neill MS, Gronlund CJ, Brines SJ, Brown DG et al. (2009). Mapping community determinants of heat vulnerability. Environmental Health Perspectives 117: 1730-1736.
Reimann L, Merkens J-L and Vafeidis AT (2018). Regionalized shared socioeconomic pathways: Narratives and spatial population projections for the Mediterranean coastal zone. Regional Environmental Change 18: 235-245.
Reimann L, Jones B, Wolff C and Vafeidis AT (2019). Sea-level rise impacts on spatial population change under the SSP-RCP scenario framework. Scenarios Forum 2019: Denver, CO, United States.
Reimann L, Vollstedt B, Koerth J, Tsakiris M and Vafeidis A (2019). Developing local socioeconomic scenarios using a multi-scale co-production approach. Scenarios Forum 2019, Denver, CO. United-States.
Retief F, Bond A, Pope J, Morrison-Saunders A and King N (2016). Global megatrends and their implications for environmental assessment practice. Environmental Impact Assessment Review 61: 52-60.
Riahi K, van Vuuren DP, Kriegler E, Edmonds J, O’Neill BC et al. (2017). The shared socioeconomic pathways and their energy, land use, and greenhouse gas emissions implications: An overview. Global Environmental Change 42: 153-168.
Robine JM, Cheung SL, Le Roy S, Van Oyen H, Griffiths C et al. (2008). Death toll exceeded 70,000 in Europe during the summer of 2003. Comptes Rendus Biologies 331: 171-178.
Rocklöv J, Forsberg B, Ebi K and Bellander T (2014). Susceptibility to mortality related to temperature and heat and cold wave duration in the population of Stockholm County, Sweden. Global Health Action 7: 22737.
Rogelj J, Popp A, Calvin KV, Luderer G, Emmerling J et al. (2018). Scenarios towards limiting global mean temperature increase below 1.5 °C. Nature Climate Change 8: 325-332.
Rohat G, Flacke J and Dao H (2017). Assessment of future heat stress risk in european regions: Towards a better integration of socioeconomic scenarios. GI-Forum 1: 341-351.
Rohat G (2018). Projecting drivers of human vulnerability under the shared socioeconomic pathways. International Journal of Environmental Research and Public Health 15: 554.
References
246
Rohat G, Flacke J, Dao H and van Maarseveen M (2018). Co-use of existing scenario sets to extend and quantify the shared socioeconomic pathways. Climatic Change 151: 619-636.
Rohat G, Flacke J, Dosio A, Dao H and van Maarseveen M (2019a). Projections of human exposure to dangerous heat in African cities under multiple socioeconomic and climate scenarios. Earth's Future 7: 528-546.
Rohat G, Flacke J, Dosio A, Pedde S, Dao H et al. (2019b). Influence of changes in socioeconomic and climatic conditions on future heat-related health challenges in Europe. Global and Planetary Change 172: 45-59.
Rohat G, Wilhelmi O, Flacke J, Monaghan A, Gao J et al. (2019c). Characterizing the role of socioeconomic pathways in shaping future urban heat-related challenges. Science of the Total Environment 695: 133941.
Rohat G, Monaghan A, Hayden MH, Ryan SJ and Wilhelmi O (2019d). Intersecting vulnerabilities: Climatic and demographic contributions to future population exposure to Aedes-borne viruses in the United States. In review in Environmental Research Letters. Available as preprint on BioRxiv.
Romero-Lankao P and Qin H (2011). Conceptualizing urban vulnerability to global climate and environmental change. Current Opinion in Environmental Sustainability 3: 142-149.
Romero-Lankao P, Qin H and Dickinson K (2012). Urban vulnerability to temperature-related hazards: A meta-analysis and meta-knowledge approach. Global Environmental Change 22: 670-683.
Roser M and Nagdy M (2019). Projections of future education. Available online at: https://ourworldindata.org/projections-of-future-education
Roser M and Ortiz-Ospina E (2019). Global rise of education. Available online at: https://ourworldindata.org/global-rise-of-education
Rothman DS (2008). A survey of environmental scenarios. In: Alcamo J, ed. Environmental Futures: The Practice of Environmental Scenario Analysis. Elsevier: Amsterdam, The Netherlands.
Rothman DS, Romero-Lankao P, Schweizer VJ and Bee BA (2014). Challenges to adaptation: A fundamental concept for the shared socio-economic pathways and beyond. Climatic Change 122: 495-507.
Rozell D (2017). Using population projections in climate change analysis. Climatic Change 142: 521-529.
Russo S, Dosio A, Graversen RG, Sillmann J, Carrao H et al. (2014). Magnitude of extreme heat waves in present climate and their projection in a warming world. Journal of Geophysical Research: Atmospheres 119: 12.500-12.512.
Russo S, Sillmann J and Fischer EM (2015). Top ten European heatwaves since 1950 and their occurrence in the coming decades. Environmental Research Letters 10: 124003.
References
247
Russo S, Marchese AF, Sillmann J and Immé G (2016). When will unusual heat waves become normal in warming Africa? Environmental Research Lettters 11: 054016.
Russo S, Sillmann J and Sterl A (2017). Humid heat waves at different warning levels. Scientific Reports 7: 7477.
Russo S, Sillmann J, Sippel S, Barcikowska MJ, Ghisetti C et al. (2019). Half a degree and rapid socioeconomic development matter for heatwave risk. Nature Communications 10: 136.
Rutledge DT, Ausseil A and Baisden WT (2017). Identifying feedbacks, understanding cumulative impacts and recognising limits: A national integrated assessment. Synthesis Report RA3. Climate Changes, Impacts and Iéplications for New Zealand to 2100.
Ryan SJ, Carlson CJ, Mordecai EA and Johnson LR (2019). Global expansion and redistribution of
Aedes borne virus transmission risk with climate change. PLoS Neglected Tropical Diseases 13: e0007213
Salamanca F, Georgescu M, Mahalov A, Moustaoui M and Wang M (2014). Anthropogenic heating of the urban environment due to air conditioning. Journal of Geophysical Research: Atmospheres 119: 5949-5965.
Satterthwaite D (2017a). Will Africa have most of the world's largest cities in 2100? Environment & Urbanization 9: 217-220.
Satterthwaite D (2017b). The impact of urban development on risk in sub-Saharan Africa's cities with a focus on small and intermediate urban centres. International Journal of Disaster Risk Reduction 26: 16-23.
Schneider UA, Havlík P, Schmid E, Valin H, Mosnier A et al. (2011). Impacts of population growth, economic development, and technical change on global food production and consumption. Agricultural Systems 104: 204-215.
Schwartz J (2005). Who is sensitive to extremes of temperature?: A case-only analysis. Epidemiology 16: 67-72.
Schweizer VJ and O’Neill BC (2014). Systematic construction of global socioeconomic pathways using internally consistent element combinations. Climatic Change 122: 431-445.
Schweizer VJ and Kurniawan JH (2016). Systematically linking qualitative elements of scenarios across levels, scales, and sectors. Environmental Modelling & Software 79: 322-333.
Scussolini P, Tran VT, Diaz-Loaiza A, Ho PL and Lasage R (2018). Adaptation to sea level rise: A multidisciplinary analysis for Ho Chi Minh City, Vietnam. Water Resources Research 10: 841-857.
Sellers S and Ebi KL (2018). Climate change and health under the shared socioeconomic pathway framework. International Journal of Environmental Research and Public Health 15: 3.
Semenza JC, McCullough JE, Flanders WD, McGeehin MA and Lumpkin JR (1999). Excess hospital admissions during the July 1995 heat wave in Chicago. American Journal of Preventive Medicine 16: 269-277.
References
248
Seto KC, Guneralp B and Hutyra LR (2012). Global forecasts of urban expansion to 2030 and direct impacts on biodiversity and carbon pools. Proceedings of the National Academy of Sciences of the United States of America 109: 16083-16088.
Sheridan SC, Allen MJ, Lee CC and Kalkstein LS (2012). Future heat vulnerability in California, Part II: Projecting future heat-related mortality. Climatic Change 155: 311-326.
Sheridan SC and Allen MJ (2018). Temporal trends in human vulnerability to excessie heat. Environmental Research Letters 13: 043001.
Siddiqui K (2016). Will the growth of the BRICs cause a shift in the global balance of economic power in the 21st century? International Journal of Political Economy 45: 315-338.
Springmann M, Mason-D'Croz D, Robinson S, Garnett T, Godfray HCJ et al. (2016). Global and
regional health effects of future food production under climate change: A modelling study. The Lancet 387: 1937-1946.
Stafoggia M, Forastiere F, Agostini D, Biggeri A, Bisanti L et al. (2006). Vulnerability to heat related mortality : A multicity, population-based, case-crossover analysis. Epidemiology 17: 315-323.
Stafoggia M, Forastiere F, Agostini D, Caranci N, de Donato F et al. (2008). Factors affecting in-hospital heat-related mortality: A multi-city case-crossover analysis. Journal of Epidemiology and Community Health 62: 209-215.
Steenland K, Henley J and Thun M (2002). All-cause and cause-specific death rates by educational status for two million people in two American cancer society cohorts, 1959-1996. American Journal of Epidemiology 156: 11-21.
Stratigea A, Grammatikogiannis E and Giaoutzi M (2012). How to approach narratives in foresight studies: Qualitative data analysis. International Journal of Foresight and Innovation Policy 8: 236.
Streutker D (2003). Satellite-measured growth of the urban heat island of Houston, Texas. Remote Sensing of Environment 85: 282-289.
Suk JE, Ebi KL, Vose D, Wint W, Alexander N et al. (2014). Indicators for tracking European vulnerabilities to the risks of infectious disease transmission due to climate change. International Journal of Environmental Research and Public Health 11: 2218-2235.
Suk JE (2016). Climate change, malaria, and public health: Accounting for socioeconomic contexts in past debates and future research. Wiley Interdisciplinary Reviews: Climate Change 7: 551-568.
Swanson DA, Schlottmann A and Schmidt B (2010). Forecasting the population of census tracts by age and sex: An example of the Hamilton-Perry method in action. Population Research and Policy Review 29: 47-63.
Sylla MB, Faye A, Giorgi F, Diedhiou A and Kunstmann H (2018). Projected heat stress under 1.5°C and 2°C global warming scenarios creates
References
249
unprecedented discomfort for humans in West Africa. Earth's Future 6: 1029-1044.
Terama E (2016). European regional - NUTS2-Level - Population projections with age structure across SSPs. Available online at: https://dx.doi.org/10.6084/m9.figshare.3806478.v1
Terama E, Clarke E, Rounsevell MDA, Fronzek S and Carter TR (2019). Modelling population structure in the context of urban land use change in europe. Regional Environmental Change 19: 667-677.
Toimil A, Losada IJ, Díaz-Simal P, Izaguirre C and Camus P (2017). Multi-sectoral, high-resolution assessment of climate change consequences of coastal flooding. Climatic Change 145: 431-444.
Tompkins EL and Eakin H (2012). Managing private and public adaptation to climate change. Global Environmental Change 22: 3-11.
Uejio CK, Wilhelmi O, Golden JS, Mills DM, Gulino SP et al. (2011). Intra-urban societal vulnerability to extreme heat: The role of heat exposure and the built environment, socioeconomics, and neighborhood stability. Health & Place 17: 498-507.
UKCIP (2001). Socioeconomic scenarios for climate change impact assessment: A guide to their use inthe UK climate impacts programme. UK Climate Impacts Programme: Oxford, United Kingdom.
Ulied A, Biosca O and Rodrigol R (2010). Forecast and quantitative scenarios, as evolution of the qualitative. Deliverable D1.2. PASHMINA Project: MCRIT, Spain.
UN-DESA (2018). World Urbanization Prospects - 2018 Revision. United Nations - Department of Economic and Social Affairs. Available online at: https://population.un.org/wup/
UN-Habitat (2015). Towards an African urban agenda. United Nations Human Settlements Programme: Nairobi, Kenya.
UNDP (2003). Developing socio-economic scenarios: For use in vulnerability and adaptation assessments. National communications support unit handbook. United Nations Development Programme - Global Environment Facility.
UNDP (2010). Mapping climate change vulnerability and impact scenarios: A guide-book for sub-national planners. United Nations Development Programme: New-York city, NY, United States.
United Nations (2014). World urbanization prospects: The 2014 revision. United Nations Department of Economics and Social Affairs, Population Division: New-York city, NY, United States.
United Nations (2016). Policies on spatial distribution and urbanization: Data booklet. United Nations Department of Economics and Social Affairs, Population Division: New-York city, NY, United States.
United Nations (2018). World urbanization prospects: The 2018 revision. United Nations Department of Economics and Social Affairs, Population Division: New-York city, NY, United States.
References
250
US Census Bureau (2018). Poverty thresholds by size of family and number of children. Available online at: https://www.census.gov/data/tables/time-series/demo/income-poverty/historical-poverty-thresholds.html Vandentorren S, Bretin P, Zeghnoun A, Mandereau-Bruno L, Croisier A et al. (2006). August 2003 heat wave in France: Risk factors for death of elderly people living at home. European Journal of Public Health 16: 583-591.
van der Mensbrugghe D (2015). Shared socioeconomic pathways and global income distribution. Proceedings of the 18th Annual Conference on Global Economic Analysis: Melbourne, Australia.
van Oort B, Bjorkan M and Klyuchnikova EM (2015). Future narratives for two locations in the Barents region. Report 2015:06. Center for International Climate and Environmental Research: Oslo, Norway.
van Ruijven BJ, Levy MA, Agrawal A, Biermann F, Birkmann J et al. (2014). Enhancing the relevanceof shared socioeconomic pathways for climate change impacts, adaptation and vulnerability research. Climatic Change 122: 481-494.
van Vuuren DP, Edmonds J, Kainuma M, Riahi K, Thomson A et al. (2011). The representative concentration pathways: An overview. Climatic Change 109: 5-31.
van Vuuren DP, Kok MTJ, Girod B, Lucas PL and de Vries B (2012). Scenarios in global environmental assessments: Key characteristics and lessons for future use. Global Environmental Change 22: 884-895.
van Vuuren DP, Kriegler E, O’Neill BC, Ebi KL, Riahi K et al. (2013). A new scenario framework for climate change research: Scenario matrix architecture. Climatic Change 122: 373-386.
van Vuuren DP and Carter TR (2014). Climate and socio-economic scenarios for climate change research and assessment: Reconciling the new with the old. Climatic Change 122: 415-429.
van Vuuren DP, Kriegler E, O’Neill BC, Ebi KL, Riahi K et al. (2014). A new scenario framework for climate change research: Scenario matrix architecture. Climatic Change 122: 373-386.
Vautard R, Gobiet A, Jacob D, Belda M, Colette A et al. (2013).The simulation of European heat waves from an ensemble of regional climate models with the EURO-CORDEX project. Climate Dynamics 41: 2555-2575.
Velders GJM, Fahey DW, Daniel JS, Andersen SO and McFarland M (2015). Future atmospheric abundances and climate forcings from scenarios of global and regional hydrofluorocarbon (HFC) emissions. Atmospheric Environment 123: 200-209.
Veldkamp TIE, Wada Y, Aerts JCJH and Ward PJ (2016). Towards a global water scarcity risk assessment framework: Incorporation of probability distributions and hydro-climatic variability. Environmental Research Letters 11: 024006.
References
251
Vescovi L, Rebetez M and Rong F (2005). Assessing public health risk due to extremely high temperature events: Climate and social parameters. Climate Research 30: 71-78.
Vose RS, Easterling DR, Kunkel KE, LeGrande AN and Wehner MF (2017). Temperature changes inthe United States. In: Wuebbles DJ, Fahey DW, Hibbard KA, Dokken DJ, Stewart ID and Maycock TK, eds. Climate Science Special Report: Fourth National Climate Assessment, Volume I. US Global Change Research Program: Washington DC, United States.
Wada Y, Flörke M, Hanasaki N, Eisner S, Fischer G et al. (2016). Modeling global water use for the 21st century: The water futures and solutions (WFAS) initiative and its approaches. Geoscientific Model Development 9: 175-222.
Walsh J, Wuebbles D, Hayhoe K, Kossin J, Kunkel K et al. (2014). Chapter 2: Our changing climate. In J. M. Melillo, Richmond TC and Yohe GW, eds. Climate change impacts in the United States: The third national climate assessment. U.S. Global Change Research Program: Washington, DC, United States.
Ward K, Lauf S, Kleinschmit B and Endlicher W (2016). Heat waves and urban heat islands in Europe: A review of relevant drivers. The Science of the Total Environment 569-570: 527-539.
Ward PJ, Jongman B, Aerts JC, Bates PD, Botzen WJW et al. (2017). A global framework for future costs and benefits of river-flood protection in urban areas. Nature Climate Change 7: 642-646.
Webber L, Divajeva D, Marsh T, McPherson K, Brown M et al. (2014). The future burden of obesity-related diseases in the 53 WHO European-Region countries and the impact of effective interventions: A modelling study. BMJ Open 4: 004787.
Weber T, Haensler A, Rechid D, Pfeifer S, Eggert B et al. (2018). Analyzing regional climate change in Africa in a 1.5, 2, and 3° global warming world. Earth's Future 6: 643-655.
Westhoek HJ, van den Berg M and Bakkes JA (2016). Scenario development to explore the future of Europe's rural areas. Agriculture, Ecosystem & Environment 114: 7-20.
WHA (2007). West Houston plan 2050: Envisioning greater West Houston at mid-century. West Houston Association: Houston, TX, United States.
WHA (2018). West Houston 2060 plan. West Houston Association: Houston, TX, United States.
Wiebe K, Lotze-Campen H, Sands R, Tabeau A, van der Mensbrugghe D et al. (2015). Climate change impacts on agriculture in 2050 under a range of plausible socioeconomic and emissions scenarios. Environmental Research Letters 10: 085010.
Wilbanks TJ and Ebi KL (2014). SSPs from an impact and adaptation perspective. Climatic Change 122: 473-479.
References
252
Wilhelmi O and Hayden M (2010). Connecting people and place: A new framework for reducing urban vulnerability to extreme heat. Environmental Research Letters 5: 014021.
Wilhelmi O and Hayden M (2016). Reducing vulnerability to extreme heat through interdisciplinary research and stakeholder engagement. In: Steinberg SL and Sprigg WA, eds. Extreme weather, health, and communities. Interdisciplinary engagement strategies. Springer: New York City, NY, United States.
Wisner B, Pelling M, Masacarenhas A, Holloway A, Ndong B et al. (2015). Small cities and towns in Africa: Insights into adaptation challenges and potentials. In: Pauleit S, Coly A, Fohlmeister S, Gasparini P, Jørgensen G et al., eds. Urban vulnerability and climate change in Africa. Springer: New York City, NY, United States.
Witmer FDW, Linke AM, O'Loughlin J, Gettelman A and Laing A (2017). Subnational violent conflict forecasts for sub-Saharan Africa, 2015-65, using climate-sensitive models. Journal of Peace Research 54: 175-192.
Wolf J, Lorenzoni I, Few R, Abrahamson V and Raine R (2009). Conceptual and practical barriers to adaptation: Vulnerability and responses to heat waves in the UK. In: Lorenzoni I, O'Brien KL and Adger WN, eds. Adapting to climate change: Thresholds, values, governance. Cambridge University Press: Cambridge, United Kingdom.
Wolf T and McGregor G (2013). The development of a heat wave vulnerability index for London, United Kingdom. Weather and Climate Extremes 1: 59-68.
Xia Y, Mitchell K, Ek M, Cosgrove B, Sheffield J et al. (2012). Continental-scale water and energy flux analysis and validation for North American land data assimilation system project phase 2 (NLDAS-2): 2. Validation of model-simulated streamflow. Journal of Geophysical Research: Atmospheres 117.
Xing R, Hanaoka T, Kanamori Y, Dai H and Masui T (2015). An impact assessment of sustainable technologies for the chinese urban residential sector at provincial level. Environmental Research Letters 10: 065001.
Xu Y, Lamarque J-F and Sanderson BM (2018). The importance of aerosol scenarios in projections of future heat extremes. Climatic Change 146: 393-406.
Yao M, Tramberend S, Kabat P, Hutjes RWA and Werners SE (2017). Building regional water-use scenarios consistent with global shared socioeconomic pathways. Environmental Processes 4: 15-31.
Ybarra H (2017). How urban or suburban is sprawling Houston? Kinder Institute for Urban Research, Rice University: Houston, TX, United States.
Yoon DK (2012). Assessment of social vulnerability to natural disasters: A comparative study. Natural Hazards 63: 823-843.
Zandersen M, Hyytiäinen K, Meier HEM, Tomczak MT, Bauer B et al. (2019). Shared socio-economic pathways extended for the Baltic Sea: Exploring
References
253
long-term environmental problems. Regional Environmental Change 19: 1073-1086.
Zhang K, Chen T-H and Begley C (2015). Impact of the 2011 heat wave on mortality and emergency department visits in Houston, Texas. Environmental Health 14.
Zhao L, Oppenheimer M, Zhu Q, Baldwin JW, Ebi KL et al. (2018). Interactions between urban heat islands and heat waves. Environmental Research Letters 13: 034003.
Zhou W, Ji S, Chen TH, Hou Y and Zhang K (2014). The 2011 heat wave in Greater Houston: Effects of land use on temperature. Environmental Research 135: 81-87.
Zobel Z, Wang J, Wuebbles DJ and Kotamarthi VR (2017). High-resolution dynamical downscaling ensemble projections of future extreme temperature distributions for the United States. Earth's Future 5: 1234-1251.
Zurek MB and Henrichs T (2007). Linking scenarios across geographical scales in international environmental assessments. Technological Forecasting and Social Change 74: 1282-1295.

References
254
255
Summary Rationally, assessing future climate-related risks requires looking at the future states of both climate and socioeconomic systems. This has been widely acknowledged by the research community. However, up until recently, the integration of future socioeconomic conditions in assessments of future climate-related risks has been very limited. The vast majority of studies is based on climate projections superimposed on current socioeconomic conditions only, hence failing to account for the role socioeconomic development plays in shaping future climate-related risks. The overarching objective of this research is twofold. First, it aims to advance the use of socioeconomic scenarios in climate-related risk assessment studies. Particularly, the study investigates the operationalization of the SSP-RCP framework for the assessment of heat stress risk at multiple temporal and spatial scales and in various contexts. Second, it aims to explore the role of socioeconomic development in shaping future climate-related risks, and particularly the influence of different socioeconomic pathways on future heat stress risk in different contexts. In order to answer these research questions the study explores a wide range of regional contexts, geographical extents, and spatial resolutions in three different case studies. The research begins at the regional scale (i.e., continent) and subsequently zooms in from one case study to another in order to reach the intra-city scale. The first case study, Europe, is chosen because it is a region where extreme heat is one of the most impactful climate-related hazards and where policy-relevant information about future heat-related challenges is greatly needed. The second case study looks into large African cities, because these are currently experiencing unprecedented growth and are leading the global urbanization trend, while being mostly located in tropical and sub-tropical areas where the risk of heat stress is among the highest worldwide. The third case study, the city of Houston in the US, is chosen because the metropolitan area of Houston is severely exposed to extreme heat events due to its sub-tropical climate and its significant urban heat island. In summary, results obtained in this research show that future socioeconomic and climatic conditions are highly uncertain and will depend on the direction of socioeconomic development and on the emissions levels. The use of socioeconomic and climate scenarios is therefore crucial to account for uncertainty in future socioeconomic and climatic conditions and to explore the spread of possible outcomes. The SSP-RCP framework offers the possibility to account for plentiful plausible futures. Throughout the three case studies the range of future outcomes is extremely broad. For instance, the number of persons at very high risk of heat stress in Europe in the 2050s ranges from 13
Summary
256
million under SSP1-RCP2.6 (i.e., a low-emissions scenario and a socioeconomic pathways depicting a European population with very low vulnerability) to 216 million under SSP3-RCP8.5 (i.e., a high-emissions scenario and a socioeconomic pathways depicting a highly vulnerable population with disintegration of the social fabric). In the case study of African cities, it is SSP4-RCP8.5 that leads to the highest exposure to extreme heat due to the high demographic growth and fast urbanization depicted across Africa. In Houston, it is SSP1-RCP4.5 that leads to the highest number of mortalities, despite the fact that SSP1 depicts a very socially equitable society with low vulnerability. Based upon the results obtained in this research the following recommendations for further research can be made: (i) establishing a balance between the local relevance of the extended SSPs and their consistency with the global SSPs is crucial to ensure the applicability of the SSP-RCP framework at the local scale. Computer-aided and structural scenario methods show a great potential to perform systematic consistency check between locally developed extended SSPs and the global SSPs and to select the most relevant scenarios based on local stakeholders’ inputs. (ii) In view of the current understanding of the interactions between the SSPs and the RCPs further research is highly needed to explore the dynamics and feedbacks between these two systems to develop approaches to account for these dynamics when using the SSP-RCP framework in IAV studies. (iii) An increased collaboration with social science disciplines such as economics, public health research, demography, and housing studies would undoubtedly enhance the availability and robustness of the projections of vulnerability under the SSPs, at multiple scales and in various environments. Finally, one of the most useful features of the SSP-RCP framework is that it provides a common ground for IAV studies conducted by different research teams in various contexts. This use of a similar scenario framework across numerous case studies enables cross-case studies comparison. Although this has yet to be achieved, a cross-case studies comparison making use of the wide range of IAV studies that rely on the SSP-RCP framework would be a great addition to the current scientific literature and would strengthen our understanding of the relative role socioeconomic development and climate change play in shaping future climate-related risks.
257
Samenvatting Het beoordelen van toekomstige klimaat-gerelateerde risico’s vereist - rationeel gesproken - dat gekeken wordt naar de mogelijk toekomstige toestanden van zowel klimatologische als socio-economische systemen. Deze stelling wordt alom onderschreven in de wetenschappelijke wereld. Tot op heden is aan de integratie van toekomstige socio-economische condities binnen de evaluatie van klimaat-gerelateerde risico’s echter nauwelijks aandacht besteed. Het merendeel van de studies is gebaseerd op projecties van klimaat omstandigheden bovenop de huidige socio-economische condities, waardoor geen rekening wordt gehouden met de invloed die socio-economische ontwikkelingen hebben op toekomstige klimaat-gerelateerde risico’s. Het overkoepelend doel van dit onderzoek is tweeledig. Ten eerste beoogt de studie het ontwikkelen van het gebruik van socio-economische scenario’s in klimaat-gerelateerde risico-evaluatie studies. In het bijzonder onderzoekt deze studie de operationalisering van het SSP-RCP kader voor de evaluatie van hittestress risico op meerdere tijd en ruimte schalen en in verschillende contexten. Het tweede doel van de studie het verkennen van de rol die socio-economische ontwikkelingen hebben op het beïnvloeden van klimaat-gerelateerde risico’s, en met name de invloed van verschillende socio-economische ontwikkelingstrajecten op toekomstige hittestress risico’s in verschillende contexten. Om de onderzoeksvragen te beantwoorden verkent de studie een breed scala aan regionale contexten, van verschillende geografische omvang en ruimtelijke resolutie in een drietal case studies. Het onderzoek start op de regionale schaal (i.e., de schaal van een continent) en zoomt vervolgens in van de ene case studie naar de andere om te eindigen bij de intra-stedelijke schaal. De eerste case studie, Europa, is gekozen omdat het de regio is waar extreme hitte beschouwd wordt als één van de klimaat-gerelateerde risico’s met de grootste gevolgen, en waar sterke behoefte is aan beleidsrelevante informatie over toekomstige hitte-gerelateerde uitdagingen. De tweede case studie heeft als onderwerp grote Afrikaanse steden, omdat deze momenteel te kampen hebben met een ongekende groei en topposities innemen in de wereldwijde urbanisatie trend, terwijl de meeste gelegen zijn in tropische of subtropische gebieden waar het risico van hittestress wereldwijd gezien het grootst is. De derde case studie, de stad Houston in de Verenigde Staten, is gekozen omdat deze metropool geteisterd wordt door extreme hitte condities als gevolg van het subtropische klimaat, en in hoge mate functioneert als een stedelijk hitte eiland.
Samenvatting
258
Samenvattend tonen de verkregen resultaten in dit onderzoek aan dat toekomstige socio-economische en klimatologische condities zeer onzeker zijn, en afhankelijk zijn van de aard van de socio-economische ontwikkeling en van de emissie niveaus. Het gebruik van socio-economische en klimatologische scenario’s is daarom cruciaal om enerzijds rekenschap te geven van de onzekerheid in toekomstige socio-economische en klimatologische condities, en anderzijds om de verkenning van de spreiding van toekomstige, mogelijke gevolgen. Het SSP-RCP kader biedt de mogelijkheid om rekening te houden met een veelvoud aan mogelijke toekomstige uitkomsten. In alle drie case studies is de reikwijdte van toekomstige situaties en gevolgen uitzonderlijk groot. Het aantal personen met een zeer groot risico voor hittestress in Europa rond 2050 bijvoorbeeld varieert naar schatting van 13 miljoen onder SSP1-RCP2.6 (i.e., het scenario met lage emissies en een socio-economische ontwikkeling waarbij de Europese bevolking een zeer beperkte kwetsbaarheid heeft) tot 216 miljoen onder SSP3-RCP8.5 (i.e., een scenario met hoge emissies en een socio-economische ontwikkeling waarbij sprake is van een zeer kwetsbare bevolking en disintegratie van de sociale samenhang). In de case studie van de Afrikaanse steden leidt SSP4-RCP8.5 tot de hoogste blootstelling aan extreme hitte als gevolg van de hoge demografische groei en de snelle urbanisatie die plaatsvindt over geheel Afrika. In Houston heeft naar verwachting SSP1-RCP4.5 het grootste aantal sterfgevallen tot gevolg ondanks het feit dat SSP1 het beeld geeft van een zeer sociaal gelijkwaardige maatschappij met een lage kwetsbaarheid. Gebaseerd op de onderzoeksresultaten kunnen de volgende aanbevelingen worden gedaan voor vervolgonderzoek: (i) Het verkrijgen van evenwicht tussen de lokale relevantie van de uitgebreide SSPs en de consistentie met globale SSPs is doorslaggevend om de toepasbaarheid van het SSP-RCP kader op lokale schaal te waarborgen. Computergestuurde en structurele scenario methodes tonen een groot potentieel om systematische consistentie checks uit te voeren tussen lokaal ontwikkelde uitgebreide SSPs en de globale SSPs en om de meest relevante scenario’s te selecteren uitgaande van de input van lokale stakeholders. (ii) Met het oog op het huidige begrip van de interacties tussen de SSPs en de RCPs is vervolgonderzoek zeer noodzakelijk om de dynamiek en de feedbacks van deze twee systemen te verkennen teneinde een aanpak te ontwikkelen voor het incorporeren van deze dynamiek als gebruik wordt gemaakt van het SSP-RCP kader in IAV studies. (iii) Een meer intensieve samenwerking tussen sociale wetenschappen als economie, volksgezondheidsonderzoek, demografie en huisvestingsstudies zouden ongetwijfeld tot een verbetering leiden in de beschikbaarheid en robuustheid van projecties van kwetsbaarheid onder de SSPs, op meerdere schalen en in verschillende omgevingen.
Samenvatting
259
Tot slot, één van de meest handige kenmerken van het SSP-RCP kader is dat het een gemeenschappelijke basis verschaft voor IAV studies uitgevoerd door verschillende onderzoekteams in een verscheidenheid aan contexten. Het gebruik van eenzelfde scenario kader onder talrijke case studies maakt een comparatief onderzoek tussen case studies mogelijk. Hoewel dit nog niet verwezenlijkt is, zou zo’n comparatief onderzoek tussen case studies betreffende een breed scala aan IAV studies gebaseerd op het SSP-RCP kader een belangrijke toevoeging zijn aan de huidige wetenschappelijke literatuur en het inzicht vergroten in de relatieve rol socio-economische ontwikkeling en klimaatverandering spelen in omvang en aard van toekomstige klimaat-gerelateerde risico’s.


