Embed Size (px)
Citation preview

Dispersal patterns and status change in a co-operatively
breeding cichlid Neolamprologus pulcher: evidence frommicrosatellite analyses and behavioural observations
K. A. STIVER*†, P. DIERKES‡, M. TABORSKY‡§AND S. BALSHINE*
*Department of Psychology, McMaster University, Hamilton, Ontario, L8S 4K1,Canada, ‡Konrad Lorenz-Institut fur Vergleichende Verhaltensforschung (KLIVV),
A-1160 Vienna, Austria and §Department of Behavioural Ecology, Institute ofZoology, University of Bern, CH-3032 Hinterkappelen/Bern, Switzerland
(Received 11 July 2003, Accepted 18 March 2004)
Genetic techniques and long-term behavioural observations were combined to investigate
dispersal patterns and changes in social position in Neolamprologus pulcher, a co-operatively
breeding cichlid from Lake Tanganyika. Comparisons of genetic variance (FST) across sub-
populations demonstrated that fish were genetically more similar to individuals from proximate
sub-populations compared to individuals from distant sub-populations. Microsatellite analyses
revealed year-long philopatry for some individuals and that other individuals dispersed to new
territories and sub-populations. Individuals appeared to disperse farther (across many territories
in a sub-population or to new sub-populations) to achieve breeding status. Non-breeding group
members (or helpers) were observed to inherit breeding positions and male breeders were replaced
faster than female breeders. These results demonstrate that important and difficult to obtain life-
history information can be obtained from genetic sampling. # 2004 The Fisheries Society of the British Isles
Key words: Cichlidae; genetics; Lake Tanganyika; Lamprologines; social dynamics.
INTRODUCTION
Virtually all living organisms disperse. Patterns of dispersal differ betweenspecies, and several models have been proposed to explain how animals migrate.For example, Wright (1931, 1943) proposed a simplified model of dispersal,referred to as the infinite island model (Wright, 1943; Taylor et al., 2000), inwhich animals randomly disperse to any territory in a population and a moreconstrained model, in which animals are more likely to disperse to near-byterritories, resulting in genetic isolation by distance (Wright, 1943). Anothermodel, known as the stepping-stone model, expanded upon the second Wrightmodel, emphasizing the importance of dispersal distance and included the
†Author to whom correspondence should be addressed. Tel.: þ1 905 525 9140 (ext: 26042); fax:
þ1 905 529 6225; email: [email protected]
Journal of Fish Biology (2004) 65, 91–105
doi:10.1111/j.1095-8649.2004.00427.x,availableonlineathttp://www.blackwell-synergy.com
91# 2004TheFisheries Society of theBritish Isles

assumption that individuals can only disperse to neighbouring sites (Kimura,1994; Irwin & Taylor, 2000).To explain why animals disperse, cost and benefit analyses are commonly
employed. Benefits of dispersal include a potential increase in availableresources, avoidance of inbreeding and a reduction in competition betweenkin (Pusey, 1987). Dispersal, however, is usually risky and individuals need tobalance the risks of moving to a new location against these benefits. Typically,one sex disperses further than the other. For example, in most mammals, thereis male biased dispersal (Greenwood, 1980). It has been argued that this resultsfrom the fact that females (usually the primary if not the sole ‘care-givers’ inmammals) benefit most from philopatry as familiarity with food sources andshelter can strongly enhance female reproductive success (Pusey, 1987). Inaddition, since male mammals typically do not care, high quality males cansequester many females, leading to unequal reproductive success among males(Andersson, 1994). Under such conditions, it may pay a male to disperse in anattempt to gain new mates (Pusey, 1987). In contrast, birds, which are typicallybiparental, generally have a female biased pattern of dispersal. This femalebiased dispersal has been attributed to the strong influence of territory qualityon male reproductive success in birds. Males may benefit most from philopatryas the quality of a male’s territory can influence both mate attraction and thesurvival of young (Pusey, 1987).This study examined how and why dispersal occurs in Neolamprologus pulcher
(Trewavas & Poll), a co-operatively breeding cichlid from Lake Tanganyika. Thesefish live in social groups consisting of at least one dominant breeder of each sex andone to 14 helpers of both sexes (Balshine et al., 2001). Helpers assist breedersby defending the territory from predators and space competitors and maintainingthe territory and the brood chamber by digging and removing debris. They alsoperform direct brood care by fanning the eggs, preventing fungal build up on eggs,and by defending the larvae and free-swimming young (Taborsky & Limberger,1981; Taborsky & Grantner, 1998; Balshine et al., 2001). Neolamprologus pulchermainly feed on zooplankton in the water column, and do not compete over food.Occasionally, group independent individuals are observed, which are tolerated inparticular territories but do not help (S. Balshine & M. Taborsky, pers. obs.).At the study population at Kasakalawe Bay, each N. pulcher group defends a
territory (median size 3150 cm2) consisting of clusters of rocks (under which the fishshelter) on a sandy substratum (Balshine et al., 2001). Sub-populations are made upof clusters of adjoining territories inhabited by groups of fish. The sub-populationsconsist of two to 200 territories (Balshine et al., 2001; M. Taborsky, pers. obs.) andare separated by an average of 22� 3m of uninhabited sand and rock.In most co-operative breeding species, natal philopatry is common (Hatchwell
& Komdeur, 2000): in N. pulcher, it has been generally assumed that helpers arerelatives of the breeders (Taborsky, 1984, 1985) and that little dispersal occurs(Balshine et al., 2001) but no conclusive data to support this hypothesis havebeen collected previously. It was expected that if fish dispersed, they wouldmove in a stepping-stone fashion to nearby territories or sub-populations tominimize predation risk.Poor knowledge of dispersal patterns in N. pulcher has made it difficult
to compare these co-operatively breeding fish to other extensively studied
92 K. A . ST IVER ET AL .
# 2004TheFisheries Society of theBritish Isles, Journal of Fish Biology 2004, 65, 91–105

co-operative breeding species, such as the Florida scrub jay and the dwarfmongoose, for which dispersal information is known (Woolfenden & Fitzpatrick,1990; Creel, 1994). It was expected that individual N. pulcher would disperse inorder to obtain an immediate breeding position or to join a new group in a moredominant position than that previously enjoyed.As a result of N. pulcher’s small size [maximum body mass (wet mass of wild
caught fish)¼ 6�7 g; maximum body standard length (LS)¼ 6�6 cm], marking ortagging individuals permanently has proved challenging. To date, long-termstudies on individual dispersal and status change have not been possible.Using a combination of behavioural studies on marked individuals and genetictechniques (microsatellite markers), the above predictions about dispersal inN. pulcher were tested.
MATERIALS AND METHODS
STUDY AREA AND OBSERVATIONAL TECHNIQUES
The study site, on the Zambian shores of Lake Tanganyika, was in Kasakalawe Bay(8�460 S; 31�460 E), 100m east of Kasakalawe village. Forty seven N. pulcher groups in1997 (1 December 1996 to 9 April 1997) and 187 groups in 1998 (28 January to 7 May)were observed at this site. Only 38 of the original 47 groups were studied in 1998, asnine of the original groups had disappeared. In 1998, some new sub-populations with newgroups were located in the study area (Table I). Observations were recorded on PVC slateswhile scuba diving to depths of 7–12m (Balshine et al., 2001). Repeated visits (at least twicea week during both field seasons) to all territories revealed the group composition,reproductive status (indicated by presence of young), and length of breeder tenure.Individuals were identified as N. pulcher according to criteria give by Trewavas & Poll
(1952), Poll (1974) and Colombe & Allgayer (1985). The fish have a very characteristichead colouration pattern. There are two vertical stripes behind the eye: one of them startsright behind the eye and curves down onto the preoperculum while the other is situated atthe edge of the operculum and it runs past the operculum at the top. The study site is alsosituated in an area within the range distribution of N. pulcher (Konings, 1998).Individuals were captured on their territory using hand nets and transparent PVC
tubes and, after a brief handling period (1–3min), were immediately released in theiroriginal territory. Fish captured were measured and sexed by examination of the genitalpapilla (Balshine-Earn et al., 1998). A small fin tissue sample was cut from either thedorsal or anal fin and preserved in 95% ethanol for storage and transport. The tissuesample taken soon grew back and the fish appeared to be completely unaffected by thesmall clip in their fin. Fish were marked by injecting non-toxic acrylic paint subcutan-eously or into scale pockets (Balshine-Earn et al., 1998). These marks typically fadedafter a few weeks or months and also did not affect fish behaviour. The distances betweenterritories and sub-populations (for use with FST calculations) were measured withunderwater measuring tapes.Recapture and dispersal data were obtained as a result of a series of behavioural
experiments performed over a period of 2 years (Balshine-Earn et al., 1998; Balshineet al., 2001; Werner et al., 2003). Fifty-seven of the 187 groups in 1998 were sampledgenetically and thus could be examined for possible recaptures (Table I).
GENOTYPING
Tissue samples were placed in 500ml of an extraction buffer (25mM EDTA, 75mMNaCl, 10mM Tris, 3mg proteinase K and 10% SDS), incubated for 2 h at 56� C and furtherincubated at 37� C overnight. Three extractions with organic solvents followed, the firstwith the same volume of Tris-saturated phenol, the second with phenol/chloroform in a
DISPERSAL AND STATUS CHANGE IN A CICHLID FISH 93
# 2004TheFisheries Society of theBritish Isles, Journal of FishBiology 2004, 65, 91–105

1 : 1 ratio by volume, and the third with chloroform/isoamylalcohol in a 24 : 1 ratio byvolume. The DNA was precipitated using two volumes of cold ethanol, and chilled at�20� C for 2 h prior to pelleting by centrifugation.
The five microsatellite loci used for genetic analysis are summarized in Table II. Lociwere amplified in two 15ml reactions, using 40 ng of genomic DNA, 0�2mM dNTPs,0�5 mM of each primer (multiplexing), 1�5 ml 10� polymerase chain reaction (PCR) buffer,2�5mM MgCl and 0�15 ml (0�75 units) Taq polymerase. PCR was carried out using aPerkin Elmer Geneamp 3600 and forward primers were labelled with flourescent dyes.Initial denaturation occurred for 10min at 94� C, followed by 30 cycles of denaturation at94� C for 30 s, annealing at 56� C for 40 s and extension at 72� C for 70 s, followed by afinal 1 h extension at 72� C. Formamide solution (40 ml) was combined with 4ml of thePCR product before denaturation for 5–10min at 98� C. The solution was loaded intoan automatic capillary sequencer (ABI Prism 310 Genetic Analyser, Perkin Elmer).GENESCANTM500 TAMRA (red) (5 ml) was mixed with 150ml formamide for use as alength standard. ABI’s GENESCAN and GENOTYPER software (version 2.0) wereused for gel analysis and genotyping.
TABLE I. A summary of the total number of groups in each sub-population in the studysite, the number of groups that were sampled, the number of fish that were sampled per
sub-population and the number of fish successfully genotyped per sub-population
Sub-populationYear(s)studied
Total numberof groups
Number ofgroups sampled
Number of fishsampled
Number offish typed
1 1997 14 13 41 411998 10 1 4 2
2 1997 9 9 34 271998 11 2 5 3
3 1997 7 4 25 171998 11 7 31 25
4 1997 20 1 4 11998 20 20 91 84
5 1997 2 2 8 81998 0 0 0 –
6 1997 6 6 23 181998 5 5 29 22
7 1997 7 3 7 71998 5 5 15 13
A 1998 10 5 18 16B 1998 9 6 24 21C 1998 3 1 6 6D 1998 2 0 – –F 1998 18 0 – –G 1998 22 4 12 11H 1998 17 0 – –I 1998 8 0 – –J 1998 5 0 – –K 1998 22 1 3 2L 1998 9 0 – –
In 1997, seven sub-populations were studied and 142 individuals had tissue collected, of which 119
were successful genetically. In 1998, the number of sub-populations sampled increased to 18 and a
total of 238 fish had tissue taken for analysis, of which 205 were successfully analysed genetically.
94 K. A . ST IVER ET AL .
# 2004TheFisheries Society of theBritish Isles, Journal of Fish Biology 2004, 65, 91–105

Individuals were sorted by sex and size, and the allelic values generated from the peakvalues were compared between years to locate possible recaptured individuals. To assignrecapture status, individuals were tested for identical alleles at all five loci for both years(1997 and 1998). An individual was included as a recapture if the alleles were identical ateach available locus and the probability of such a match arising by chance was <1 in1000. The likelihood of the individuals being genetically identical by chance was calcu-lated by the formula: [p1q1� p2q2� . . .� pnqn], where n¼ number of loci typed, and p andq refer to the frequency of the specific allele at that locus (this formula is derived from theHardy-Weinberg equilibrium; Griffiths et al., 1996). Overall, the loci in this populationwere in equilibrium (Raymond & Rousset, 1995). In total, 119 fish from 1997 and 205fish from 1998 were genotyped.GENEPOP 3.1 (Raymond & Rousset, 1995) was used to determine allele frequencies
at the five loci and to calculate FST measures between pairs of sub-populations (Avise,1994). To ensure that FST calculations were representative of a sub-population, FST
values were calculated for only those sub-populations in which �20% of the individualsover 1�0 cm were sampled (the proportion of individuals within each sub-population thatwere genotyped at each locus ranged from 23 to 66%; Table III). The correlation betweenpair-wise FST estimates and physical distance was also estimated [following Rousset,1997, the metric FST (1�FST)
�1 was used in place of FST].To assess sex-biased dispersal further, the five microsatellite loci were analysed with the
programme KINSHIP 1.3.1 (Goodnight et al., 1997) to generate pair-wise relatednessvalues for every possible female and male breeder dyads. To reduce the effects ofpseudoreplication (Knight et al., 1999) the average relatedness of each individual to allother individuals of the same sex was calculated from the pair-wise values. A two-samplepermutation test [RUNDOM Projects 1.1 (Jadwiszczack, 2002)] was then conducted to
TABLE II. Summary of the five microsatellite loci used in this study. Expected (HE) andobserved (HO) heterozygosities as well as polymorphic information contents (PIC) werecalculated using CERVUS version 2.0 (Marshall et al., 1998). These values describe theestimated and actual allelic variation within a population and give a measure of howinformative a given locus is (Strachan & Read, 2000). For the HE, HO and PIC a value
of one is high and zero is low
Locus ReferenceNumberof alleles HE HO PIC
Number offish typed (%)
773 Derived fromTilapia cf. deckerti.(Schliewen et al., 2001)
19 0�434 0�432 0�421 308 (95%)
780 Derived fromTilapia cf. deckerti.(Schliewen et al., 2001)
41 0�933 0�918 0�927 304 (94%)
007 Developed forNeolamprologusmultifasciatus. (Kohler, 1997)
8 0�449 0�446 0�430 303 (94%)
Pzeb3 Developed forMaylandia zebra.(Parker & Kornfield, 1996)
39 0�926 0�921 0�920 305 (94%)
LOC101 Developed forLamprologus ocellatus.(Brandtmann et al., 1999)
29 0�847 0�752 0�830 290 (90%)
LOC101 was not in Hardy-Weinberg equilibrium. This heterozygote deficit, however, was found in
only three of the 10 sub-populations (where >20% of individuals were genotyped).
DISPERSAL AND STATUS CHANGE IN A CICHLID FISH 95
# 2004TheFisheries Society of theBritish Isles, Journal of FishBiology 2004, 65, 91–105

test for differences in average relatedness between breeding males and breeding females(Taylor et al., 2003). Permutation tests draw random values from the population andassign them to the groups (in this case, dyads of breeding males and breeding females).The difference between the means of these simulated groups is then calculated. Thisprocedure is repeated N times (N¼ 10 000 was used) and P values are obtained bycomparing the frequency distribution of the permutated data to the difference betweenthe two real group means. Similar analyses have been used to assess dispersal and geneticsubdivision in other species, e.g. brown trout Salmo trutta L. (Carlsson et al., 1999;Ruzzante et al., 2001) and white shrimp Litopenaeus setiferus (Ball & Chapman, 2003).
Other statistical analyses were conducted using STATVIEW 5.0 or NTSYS-pc 1.8 (forN� 20). When needed (N< 20, in Appendix; Mundry & Fischer, 1998), the U statisticwas calculated by hand (Siegel & Castellan, 1988). All statistics and P values werecorrected for ties, and the P values presented are two-tailed. As tests were based onsmall sample sizes, post hoc power tests were conducted using the G*Power Program(Erdfelder et al., 1996) to evaluate the strength of failing to reject the null hypothesis.
RESULTS
HOW MANY FISH DISPERSE AND WHERE DO THEY GO?
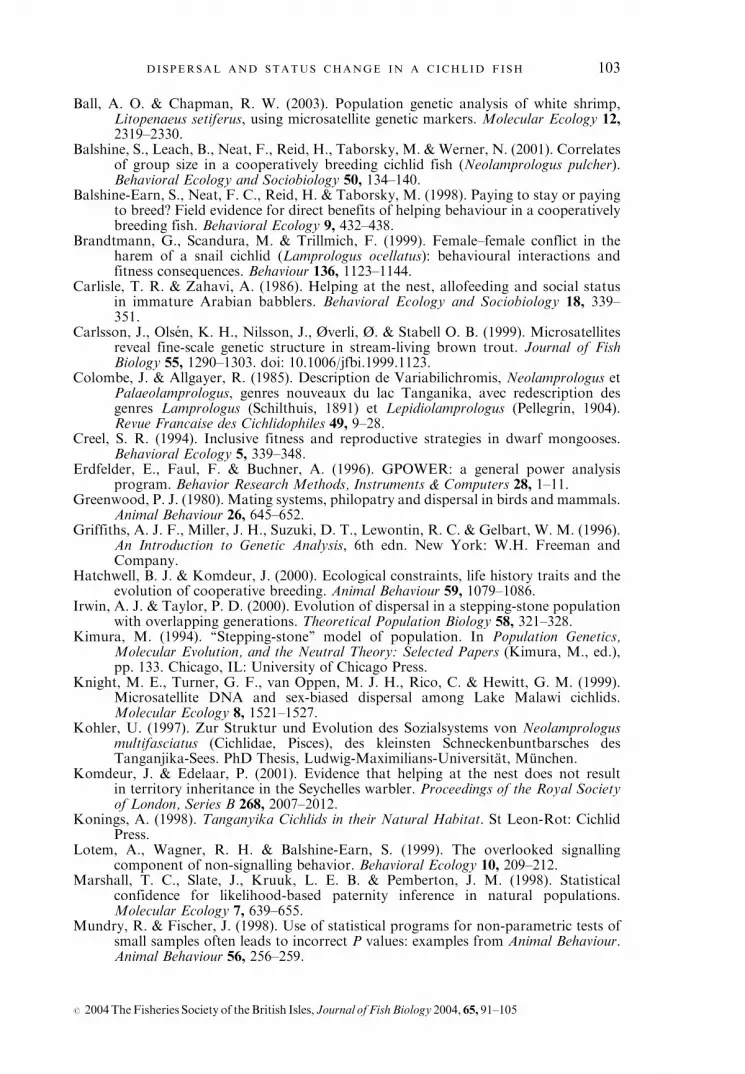
The FST values showed that there was little gene flow between sub-populationssuggesting limited dispersal. Nearby sub-populations were more similar in theirallele frequencies than more distant sub-populations (Mantel test, n¼ 9999permutations, R¼ 0�45, n¼ 21, P¼ 0�002; Fig. 1). Also, both female and malebreeders were more closely related to other same sex breeders within their sub-population than they were to same-sex breeders outside of their sub-population(two-sample permutation test, n¼ 10000 randomizations, females: within sub-population r¼ 0�08� 0�02, outside sub-population r¼�0�04� 0�01, P< 0�0001;males: within sub-population r¼ 0�12� 0�04, outside sub-population r¼ 0�02�0�02, P¼ 0�01). Future studies are required to address more fine-scale patterns ofgenetic subdivision (comparing FST values calculated between groups within asub-population to FST values calculated between sub-populations; see Table IVfor preliminary data).
TABLE III. Per cent of genetically sampled fish (by sub-population) in the FST analysisthat were genotyped at each locus
Year andPer cent fish typed by locus
sub-population Number of fish 773 780 007 003 101 Average
1997-1 41 100�0 97�6 97�6 95�1 87�8 95�61997-2 27 100�0 100�0 92�6 96�3 96�3 97�01997-3 17 100�0 94�1 94�1 94�1 94�1 95�31997-6 18 100�0 72�2 83�3 88�9 66�7 82�21998-3 25 88�0 92�0 88�0 92�0 96�0 91�21998-4 84 96�4 91�7 96�4 92�8 83�3 92�11998-6 22 100�0 100�0 95�5 90�9 95�5 96�41998-7 13 92�3 92�3 92�3 92�3 100�0 93�81998-A 16 75�0 100�0 81�3 93�8 93�8 88�81998-B 21 90�5 100�0 100�0 100�0 100�0 98�1
96 K. A . ST IVER ET AL .
# 2004TheFisheries Society of theBritish Isles, Journal of Fish Biology 2004, 65, 91–105

Of the 119 fish from 1997 that were analysed genetically, 14 individuals(five females and nine males) were found to be present again in the sample of205 genetically typed individuals from 1998. It should be noted that geneticsampling of individuals was not originally conducted for the purpose of identi-fying individuals present in both years. Genetic, sex and size data were used toconfirm these recaptures; the probability that of any of these matches arose bychance is extremely small (TableV). Many possible statistics have been excludedin this section as the power of statistical tests carried out using these 14individuals was low (power ranged from 0�054 to 0�501 based on the parametricequivalent of the non-parametric test; see Appendix for all statistics regardingthese recaptured individuals).The recapture data revealed that between years, six fish (43%) remained in
their original territories, while eight (57%) dispersed to new territories. Of theeight fish that dispersed, five moved to adjacent territories, one to a non-adjacent territory, and two (both male helpers in 1997) moved to territories indifferent adjacent sub-populations 10 and 12m away (TableV).
WHICH INDIVIDUALS DISPERSE?
Within a sub-population, there was no difference in relatedness between maledyads (r¼ 0�12� 0�04) and female dyads (r¼ 0�08� 0�02; two-sample per-mutation test, n¼ 10 000 randomizations, P¼ 0�29). These results suggest thatthere may not be a sex bias in dispersal. At the population level, however,breeding males were more related to one another than were breeding females(all male dyads: r¼ 0�03� 0�017, all female dyads: r¼�0�03� 0�01; P¼ 0�004),
0·00
0·01
0·02
0·03
0·04
0·05
0·06
0·07
0·08
0 50 100 150 200 250
Distance (m)
FST
(1
– F
ST)–1
FIG. 1. The distance between sub-populations plotted in relation to FST (1�FST)�1 values. The sub-
populations included in this figure and the related analyses involved only those in which at least
20% of the individuals in the sub-population were genotyped.
DISPERSAL AND STATUS CHANGE IN A CICHLID FISH 97
# 2004TheFisheries Society of theBritish Isles, Journal of FishBiology 2004, 65, 91–105

TABLEIV
.Comparison(for10sub-populations)
ofmeanFST�
S.E.betweengroups(w
ithin
asub-population)andbetweensub-populations.
Values
are
calculatedusingonly
those
groupsandsub-populationswhere>20%
oftheindividuals
weregenotyped
YearSub-population
Number
ofwithin
sub-populationcomparisons
Number
ofbetween
sub-populationcomparisonsFSTwithin
sub-population
(betweengroups)
FSTbetweensub-populations
1997
164
30� 062�0� 010
0� 030�0� 012
1997
228
30� 071�0� 013
0� 031�0� 013
1997
36
30� 064�0� 020
0� 038�0� 008
1997
66
30� 046�0� 027
0� 055�0� 003
1998
36
50� 022�0� 008
0� 030�0� 004
1998
4120
50� 051�0� 006
0� 036�0� 010
1998
66
50� 031�0� 016
0� 056�0� 007
1998
76
50� 041�0� 032
0� 041�0� 005
1998
A6
50� 001�0� 001
0� 029�0� 007
1998
B15
50� 020�0� 006
0� 040�0� 011
98 K . A . ST IVER ET AL .
# 2004TheFisheries Society of theBritish Isles, Journal of Fish Biology 2004, 65, 91–105

TABLEV.Summary
oftheindividuals
designated
asrecaptured
and
theprobabilitythateach
‘recapture’could
representtw
odistinct
individualsthatshare
thesamealleleateach
ofthecomparedloci.Asmanyloci
(ofthefivepossible)ascould
beresolved
from
thetissue
werecompared.Thesexandgrowth
data
are
consistentwiththegenetic
data
ineach
case
Sex
Year
Social
position
Ls(cm)
Growth
(cmyear�
1)
Sub-population
Distance
travelled(cm)
Group
Chance
ofbeing
differentindividual
1Fem
ale
1997
Helper
4� 9
0� 10
2102
G3� 8�10�08
1998
Helper
5� 0
2C
2Fem
ale
1997
Helper
4� 9
0� 10
60
p1� 1�10�04
1998
Helper
5� 0
6p
3Fem
ale
1997
Helper
5� 6
0� 00
30
I1� 1�10�07
1998
Breeder
5� 6
3I
4Fem
ale
1997
Helper
4� 9
0� 28
3245
III
1� 1�10�08
1998
Breeder
5� 2
3II
5Fem
ale
1997
Helper
5� 1
0� 11
356
III
1� 1�10�09
1998
Breeder
5� 2
3VIII
6Male
1997
Independent
4� 5
1� 29
30
III
1� 7�10�10
1998
Helper
5� 7
3III
7Male
1997
Helper
4� 4
0� 35
148
21� 5�10�08
1998
Helper
4� 8
14
8Male
1997
Helper
2� 7
2� 68
680
p1� 3�10�11
1998
Helper
5� 2
6b
9Male
1997
Helper
3� 3
0� 97
60
g2� 2�10�06
1998
Helper
4� 2
6g
10
Male
1997
Helper
3� 9
0� 86
60
p2� 2�10�09
1998
Helper
4� 7
6p
11
Male
1997
Helper
4� 5
1� 92
71200
T9� 3�10�06
1998
Breeder
6� 2
6e,
b,p
12
Male
1997
Helper
5� 3
0� 54
11000
41� 8�10�07
1998
Breeder
5� 8
421
13
Male
1997
Breeder
5� 6
0� 21
652
d1� 4�10�07
1998
Breeder
5� 8
6g
14
Male
1997
Breeder
5� 6
0� 70
70
X2� 3�10�10
1998
Breeder
6� 3
7X,T,U,Y,Z
D I SPERSAL AND STATUS CHANGE IN A CICHLID FISH 99
# 2004TheFisheries Society of theBritish Isles, Journal of FishBiology 2004, 65, 91–105

suggesting that males typically disperse. The recapture data also suggested thatboth males and females dispersed; no sex differences in dispersal were detectedusing this method of recapture (Appendix). In total, one breeder (male) andseven non-breeders (three female and four male helpers) dispersed or changedterritories between years (TableV). Dispersing male helpers (n¼ 4) appeared tomove further than dispersing female helpers (n¼ 3) (medians: 540 v. 102 cm).Repeated visits to each territory throughout the field season revealed that
c. 12% of male breeders were naturally replaced every 50 days compared to only5% of female breeders. This suggests that males tend to be replaced faster thanfemales (w2¼ 3�78, NM¼ 17/127, NF¼ 11/206, 0�10>P> 0�05).Dispersal does not seem to occur at a particular life stage in N. pulcher. The
largest dispersing fish was 5�6 cm LS in 1997 and had reached 5�8 cm in 1998.The smallest fish that dispersed was 2�7 cm in 1997 and had grown to 5�2 cm by1998 (TableV). There was no initial size difference between fish that dispersedor stayed, even when males and females were compared separately (Appendix).
WHY DO INDIVIDUALS DISPERSE?
Individuals that bred in 1998 appeared to disperse further (n¼ 5, mediandistance¼ 245 cm; range: 0–1200 cm) than those that did not (n¼ 7, mediandistance¼ 0 cm, range: 0–102 cm). Female helpers who achieved a breedingposition by 1998 (n¼ 3) travelled a median distance of 56 cm (range 0–245 cm),while male helpers becoming breeders in 1998 (n¼ 2) travelled 1100 cm (range:1000–1200 cm). Indeed, the only individuals that moved long distances (betweensub-populations) were the two helper males that became breeders in 1998.Six of the seven helpers that dispersed increased their status (by becoming a
breeder or by moving up in the dominance hierarchy). The one helper whoseposition decreased moved from a group where it was the only helper (groupsize¼ 3) to a group of eight where it was second in the helper dominance hierarchy.
STATUS DYNAMICS
The probability of male and female helpers becoming breeders was similar(3/5 females v. 2/7 males; Fisher’s exact test, n¼ 12, P¼ 0�27, Power¼ 0�13).Three of the five recaptured females (all helpers in 1997) became breeders in1998; two remained in helper status. Six of the nine recaptured males retainedtheir 1997 positions in 1998; the two male breeders were again found to bebreeders and four male helpers remained in their previous helper status. One ofthe male breeders expanded his range from breeder of only one territory (1997)to five territories (1998). Two male helpers became breeders. One male, a groupindependent who was accepted by a group but did not help in 1997, was foundto be an active helper in that group in 1998.One female (a helper in 1997) became a breeder in her previous territory
in 1998, confirming results from an experimental removal study that showedthat helpers can take over in the territory where they had previously helped(Balshine-Earn et al., 1998). Unfortunately, it remains unknown whether thisfemale took over because a vacancy arose (via breeder death) or as a result of asuccessful challenge of the previous breeder.
100 K. A . ST IVER ET AL .
# 2004TheFisheries Society of theBritish Isles, Journal of Fish Biology 2004, 65, 91–105

DISCUSSION
The positive relationship between FST and physical distance, coupled with thefact that male and female breeders were more closely related to breeders (of thesame sex) from their own sub-population than to breeders from other sub-populations, supports the notion that there is limited dispersal in N. pulcher.As expected, N. pulcher dispersal better fits a stepping stone (Kimura, 1994)than an infinite island (Wright, 1931, 1943) model of dispersal. This finding isalso significant in that it shows a genetic division of sub-populations over arelatively small geographical area (maximum distance between sub-populationswas 228m2). Selander (1970) found similar small-scale genetic structuring inwild populations of house mice Mus musculus; several genetically distinct tribesof mice existed within a single barn structure.The present study did not show conclusive evidence of sex-biased dispersal in
N. pulcher. Males and females were equally related within a sub-population andthe recapture data showed no overall difference in dispersal rates or distance bymales v. females. At the population level, however, male dyads were moreclosely related compared to female dyads suggesting that males may dispersefarther. Also, the only individuals that travelled between sub-populations weretwo male helpers who became breeders, suggesting that males may dispersefurther. Alternatively, the population results of more related males may havearisen because females actually disperse further (perhaps outside of the sampledstudy area). Admittedly, the small number of recaptured individuals and theconflicting recapture and genetic results weakens the ability to strongly ascer-tain which sex is dispersing.Dispersal patterns in other co-operatively breeding species are known. For
example, Florida scrub jay females tend to disperse earlier and further thanmales, as females almost always become breeders by taking an available breed-ing spot in a different territory, while male scrub jays usually inherit all or aportion of their natal territory (Woolfenden & Fitzpatrick, 1990). Seychelleswarblers delay dispersal until they can move to a territory of equal or higherquality to their natal territory (Hatchwell & Komdeur, 2000) and show a sexdifference in dispersal and breeding strategies. Female Seychelles warblers helpand occasionally breed on their natal territory and may disperse to a newterritory to gain a breeding position, while males tend to ‘bud-off’ a portionof their natal territory to breed in (Komdeur & Edelaar, 2001). Dwarfmongooses may become breeders in one of two ways: subordinates may disperseto a new pack, or remain in their natal pack and attain dominance and there-fore breeder status. Although both sexes disperse in mongoose, males dispersemore frequently and farther than females (Creel, 1994). This study shows thatthere are two strategies to become a breeder in N. pulcher: territory inheritanceand dispersing to fill a breeding vacancy. Further studies on dispersal are nowplanned to examine whether N. pulcher has sex-biased dispersal and whether thepattern is more similar to the female-biased dispersal of the Florida scrub-jay,or the more male-biased pattern of dwarf mongoose.The results hint at the possibility that individuals disperse in order to gain a
better position in the group. The idea of ‘trading-up’ in the hierarchy appears tobe reflected in those individuals that dispersed; six of seven helpers were
DISPERSAL AND STATUS CHANGE IN A CICHLID FISH 101
# 2004TheFisheries Society of theBritish Isles, Journal of FishBiology 2004, 65, 91–105

observed to move into a higher dominance position in their new group. Thepossibility that the dispersal occurred as a result of eviction from their formergroup, however, cannot be eliminated without further study. If helpers movevoluntarily between breeding groups, breeders may have to compete for helpersand offer reproductive incentives to bribe helpers to join their group (Reeve,1998). The helpers that changed groups but remained in helper status oftenmoved what would appear to be extremely small distances. As this species hasan extremely small substratum-based home range (Balshine et al., 2001; Werneret al., 2003), however, these small movements constitute true dispersal events.Another interesting social change was the group independent male in 1997
who became an active group helper in 1998. This individual held an independentshelter on the edge of a group’s territory and provided no help in 1997; in 1998he was strongly associated with this group and provided extensive help. Inlaboratory experiments using Neolamprologus brichardi (Poll), Taborsky (1985)showed that expelled helpers may be re-accepted in their group if the need forhelp (defence against a conspecific or space competitor) was increased. In thecase observed in this study, the reasons for the change in helping effort and newassociation cannot be directly determined; the breeders in this group were notgenetically sampled in 1998 so this helper’s relatedness to breeders cannot becompared between the 2 years. It is possible that increased helping behaviourmay be a method of securing better resources, such as shelter (Balshine et al.,2001), or a way to move up into a higher, more dominant social position inpreparation for future inheritance of a breeding vacancy (Carlisle & Zahavi,1986; Balshine-Earn et al., 1998; Lotem et al., 1999).These results provide a useful first step in understanding social change and
dispersal patterns in a co-operatively breeding fish. They show that geneticanalyses can be used to assess life-history variables such as growth, survivaland reproductive success. Additional work is now needed to determine preciselyhow dispersal varies with sex and size of individual, and further explore therelationship between status change and dispersal and ‘shed light’ on the factorsdriving dispersal patterns in N. pulcher.
We thank B. Leach, F. Neat, H. Reid and N. Werner for field assistance. A. Kuntz andM. Maan also assisted in collecting some tissue samples. R. Achmann helped with thegenetic techniques and H.L. Gibbs and J.S. Quinn provided direction and advice for thegenetic data analysis. In addition, we thank D. Ruzzante, two anonymous reviewers,E. Bressler, V. Chant, M. Daly, D. Earn, J. Galef, N. Goodwin, D. Hart, S. Houshmandi,S. Marsh, F. Neat and K. Sloman for helpful comments on the manuscript. The work wasfunded by grants from Fonds zur Forderung der wissenschaftlichen Forschung (P 10 916-Bio) toMT; and a NSERC research grant and a Royal Society of London fellowship to SB.This research was conducted under the guidelines of the Research and Ethics Board ofMcMaster University and with the permission and co-operation of the Leonard Mwapeand the Zambian Ministry of Agriculture, Food and Fisheries.
References
Andersson, M. (1994). Sexual Selection. Princeton, NJ: Princeton University Press.Avise, J. C. (1994). Molecular Markers, Natural History and Evolution. New York:
Chapman & Hall.
102 K. A . ST IVER ET AL .
# 2004TheFisheries Society of theBritish Isles, Journal of Fish Biology 2004, 65, 91–105
Ball, A. O. & Chapman, R. W. (2003). Population genetic analysis of white shrimp,Litopenaeus setiferus, using microsatellite genetic markers. Molecular Ecology 12,2319–2330.
Balshine, S., Leach, B., Neat, F., Reid, H., Taborsky, M. & Werner, N. (2001). Correlatesof group size in a cooperatively breeding cichlid fish (Neolamprologus pulcher).Behavioral Ecology and Sociobiology 50, 134–140.
Balshine-Earn, S., Neat, F. C., Reid, H. & Taborsky, M. (1998). Paying to stay or payingto breed? Field evidence for direct benefits of helping behaviour in a cooperativelybreeding fish. Behavioral Ecology 9, 432–438.
Brandtmann, G., Scandura, M. & Trillmich, F. (1999). Female–female conflict in theharem of a snail cichlid (Lamprologus ocellatus): behavioural interactions andfitness consequences. Behaviour 136, 1123–1144.
Carlisle, T. R. & Zahavi, A. (1986). Helping at the nest, allofeeding and social statusin immature Arabian babblers. Behavioral Ecology and Sociobiology 18, 339–351.
Carlsson, J., Olsen, K. H., Nilsson, J., Øverli, Ø. & Stabell O. B. (1999). Microsatellitesreveal fine-scale genetic structure in stream-living brown trout. Journal of FishBiology 55, 1290–1303. doi: 10.1006/jfbi.1999.1123.
Colombe, J. & Allgayer, R. (1985). Description de Variabilichromis, Neolamprologus etPalaeolamprologus, genres nouveaux du lac Tanganika, avec redescription desgenres Lamprologus (Schilthuis, 1891) et Lepidiolamprologus (Pellegrin, 1904).Revue Francaise des Cichlidophiles 49, 9–28.
Creel, S. R. (1994). Inclusive fitness and reproductive strategies in dwarf mongooses.Behavioral Ecology 5, 339–348.
Erdfelder, E., Faul, F. & Buchner, A. (1996). GPOWER: a general power analysisprogram. Behavior Research Methods, Instruments & Computers 28, 1–11.
Greenwood, P. J. (1980). Mating systems, philopatry and dispersal in birds and mammals.Animal Behaviour 26, 645–652.
Griffiths, A. J. F., Miller, J. H., Suzuki, D. T., Lewontin, R. C. & Gelbart, W. M. (1996).An Introduction to Genetic Analysis, 6th edn. New York: W.H. Freeman andCompany.
Hatchwell, B. J. & Komdeur, J. (2000). Ecological constraints, life history traits and theevolution of cooperative breeding. Animal Behaviour 59, 1079–1086.
Irwin, A. J. & Taylor, P. D. (2000). Evolution of dispersal in a stepping-stone populationwith overlapping generations. Theoretical Population Biology 58, 321–328.
Kimura, M. (1994). ‘‘Stepping-stone’’ model of population. In Population Genetics,Molecular Evolution, and the Neutral Theory: Selected Papers (Kimura, M., ed.),pp. 133. Chicago, IL: University of Chicago Press.
Knight, M. E., Turner, G. F., van Oppen, M. J. H., Rico, C. & Hewitt, G. M. (1999).Microsatellite DNA and sex-biased dispersal among Lake Malawi cichlids.Molecular Ecology 8, 1521–1527.
Kohler, U. (1997). Zur Struktur und Evolution des Sozialsystems von Neolamprologusmultifasciatus (Cichlidae, Pisces), des kleinsten Schneckenbuntbarsches desTanganjika-Sees. PhD Thesis, Ludwig-Maximilians-Universitat, Munchen.
Komdeur, J. & Edelaar, P. (2001). Evidence that helping at the nest does not resultin territory inheritance in the Seychelles warbler. Proceedings of the Royal Societyof London, Series B 268, 2007–2012.
Konings, A. (1998). Tanganyika Cichlids in their Natural Habitat. St Leon-Rot: CichlidPress.
Lotem, A., Wagner, R. H. & Balshine-Earn, S. (1999). The overlooked signallingcomponent of non-signalling behavior. Behavioral Ecology 10, 209–212.
Marshall, T. C., Slate, J., Kruuk, L. E. B. & Pemberton, J. M. (1998). Statisticalconfidence for likelihood-based paternity inference in natural populations.Molecular Ecology 7, 639–655.
Mundry, R. & Fischer, J. (1998). Use of statistical programs for non-parametric tests ofsmall samples often leads to incorrect P values: examples from Animal Behaviour.Animal Behaviour 56, 256–259.
DISPERSAL AND STATUS CHANGE IN A CICHLID FISH 103
# 2004TheFisheries Society of theBritish Isles, Journal of FishBiology 2004, 65, 91–105

Parker, A. & Kornfield, I. (1996). Polygynandry in Pseudotropheus zebra, a cichlid fishfrom Lake Malawi. Environmental Biology of Fishes 47, 345–352.
Poll, M. (1974). Contribution a la faune ichthyologique du lac Tanganika d’apres lesrecoultes de P. brichard. Revue de Zoologie africaine 88, 99–110.
Pusey, A. E. (1987). Sex-biased dispersal and inbreeding avoidance in birds andmammals. Trends in Ecology and Evolution 2, 295–299.
Raymond, M. & Rousset, R. (1995). GENEPOP (Version 1.2): population geneticssoftware for exact tests and ecumenicism. Journal of Heredity 86, 248–249.
Reeve, H. K. (1998). Game theory, reproductive skew and nepotism. In Game Theory andAnimal Behaviour (Dugatkin, L. & Reeve, H. K., eds), pp. 118–145. Oxford:Oxford University Press.
Rousset, F. (1997). Genetic differentiation and estimation of gene flow from F-statisticsunder isolation by distance. Genetics 145, 1219–1228.
Ruzzante, D. E., Hansen, M. M. & Meldrup, D. (2001). Distribution of individualinbreeding coefficients, relatedness and influence of stocking on nativeanadromous brown trout (Salmo trutta) population structure. Molecular Ecology10, 2107–2128.
Schliewen, U. K., Rassmann, K., Markmann, M., Markert, J., Kocher, T. D. & Tautz, D.(2001). Genetic and ecological divergence of a monophyletic cichlid species pairunder fully sympatric conditions in Lake Ejagham, Cameroon. Molecular Ecology10, 1471–1488.
Selander, R. K. (1970). Behavior and genetic variation in natural populations. AmericanZoologist 10, 53–66.
Siegel, S. & Castellan, N. J., Jr. (1988). Nonparametric Statistics for the BehavioralSciences, 2nd edn. New York: McGraw Hill.
Strachan, T. & Read, A. P. (2000). Human Molecular Genetics, 2nd edn. New York:Wiley-Liss.
Taborsky, M. (1984). Broodcare helpers in the cichlid fish Lamprologus brichardi: theircosts and benefits. Animal Behaviour 32, 1236–1252.
Taborsky, M. (1985). Breeder-helper conflict in a cichlid fish with broodcare helpers: anexperimental analysis. Behaviour 95, 45–75.
Taborsky, M. & Grantner, A. (1998). Behavioural time-energy budgets of cooperativelybreeding Neolamprologus pulcher (Pisces: Cichlidae). Animal Behaviour 56,1374–1382.
Taborsky, M. & Limberger, D. (1981). Helpers in fish. Behavioral Ecology andSociobiology 8, 143–145.
Taylor, M. I., Morley, J. I., Rico, C. & Balshine, S. (2003). Evidence for geneticmonogamy and female-biased dispersal in the biparental mouthbroodingcichlid Eretmodus cyanostictus from Lake Tanganyika. Molecular Ecology 12, 3173–3177.
Taylor, P. D., Irwin, A. J. & Day, T. (2000). Inclusive Fitness in finite deme-structuredand stepping-stone populations. Selection 1, 153–163.
Trewavas, E. & Poll, M. (1952). Three new species and two new sub-species of the genusLamprologus, cichlid fishes of Lake Tanganyika. Proceedings of the Royal Societyof London B 116, 240–246.
Werner, N. Y., Balshine-Earn, S., Leach, B. & Lotem, A. (2003). Helping opportunitiesand space segregation among helpers in cooperatively breeding cichlids. BehavioralEcology 14, 749–756.
Woolfenden, G. E. & Fitzpatrick, J. W. (1990). Florida Scrub Jays: a synopsis after 18years of study. In Cooperative Breeding in Birds: Long-term Studies of Ecologyand Behavior (Stacey, P. B. & Koenig, W. D., eds), pp. 241–266. New York:Cambridge University Press.
Wright, S. (1931). Evolution in Mendelian populations. Genetics 16, 97–159.Wright, S. (1943). Isolation by distance. Genetics 28, 114–138.
104 K. A . ST IVER ET AL .
# 2004TheFisheries Society of theBritish Isles, Journal of Fish Biology 2004, 65, 91–105

Electronic References
Goodnight, K. F., Queller, D. C. & Poznansky, T. (1997). KINSHIP 1.3.1. Available at:http://gsoftnet.us/GSoft.html.
Jadwiszczack, P. (2002). RUNDOM Projects 1.1. Available at: http://pjadw.tripod.com/rsite.htm.
APPENDIX. Statistics of the 14 recaptured individuals
Mann–Whitney U-test Power
A. Size (LS, cm in 1997) and dispersalDispersers (N¼ 8, median¼ 4�9). U¼ 24�5 0�054v. stayers (N¼ 6, median¼ 4�7). P> 0�20Male dispersers (N¼ 4, median¼ 4�5). U¼ 7�5 0�065v. male stayers (N¼ 3, median¼ 3�9)*. P> 0�20Female dispersers (N¼ 3, median¼ 4�9). U¼ 4 0�083v. female stayers (N¼ 2, median¼ 5�2)*. P> 0�20B. Sex and dispersalMales (N¼ 9) U¼ 24 0�118v. females (N¼ 5). P> 0�20Male dispersers (N¼ 4) U¼ 7 0�207v. female dispersers (N¼ 3).* P> 0�20C. Social changes and dispersalIndividuals that became breeders (N¼ 5) U¼ 28 0�411v. individuals that did not (N¼ 7).* 0�20>P> 0�10Males that became breeders (N¼ 2) U¼ 10 0�501v. males that did not (N¼ 5).* P¼ 0�10Females that became breeders (N¼ 3) U¼ 3�5 0�067v. females that did not (N¼ 2).* P> 0�20
*These comparisons involve only those individuals who were non-breeders in 1997.
DISPERSAL AND STATUS CHANGE IN A CICHLID FISH 105
# 2004TheFisheries Society of theBritish Isles, Journal of FishBiology 2004, 65, 91–105


