Embed Size (px)
Citation preview

i
i
Reproductive Decision Making among the Makushi of Guyana
By
RYAN NICHOLAS SCHACHT
B.S. (University of Nebraska, Lincoln) 2005
M.A. (University of California, Davis) 2009
DISSERTATION/THESIS
Submitted in partial satisfaction of the requirements for the degree of
DOCTOR OF PHILOSOPHY
in
Anthropology
in the
OFFICE OF GRADUATE STUDIES
of the
UNIVERSITY OF CALIFORNIA
DAVIS
Approved:
_____________________________________
Monique Borgerhoff Mulder, Chair
_____________________________________
Bruce Winterhalder
_____________________________________
Joanna Scheib
Committee in Charge
2014

All rights reserved
INFORMATION TO ALL USERSThe quality of this reproduction is dependent upon the quality of the copy submitted.
In the unlikely event that the author did not send a complete manuscriptand there are missing pages, these will be noted. Also, if material had to be removed,
a note will indicate the deletion.
Microform Edition © ProQuest LLC.All rights reserved. This work is protected against
unauthorized copying under Title 17, United States Code
ProQuest LLC.789 East Eisenhower Parkway
P.O. Box 1346Ann Arbor, MI 48106 - 1346
UMI 3637896Published by ProQuest LLC (2014). Copyright in the Dissertation held by the Author.
UMI Number: 3637896
ii
ii
Ryan Nicholas Schacht
May 2014
Anthropology
Reproductive Decision Making among the Makushi of Guyana
Abstract
Darwin’s characterization of coy females versus ardent males is based on increasingly outdated
evolutionary models. Evolutionary feedbacks can strongly influence the sex roles and subsequent
patterns of reproductive decision making. Using data from eight Makushi communities of
southern Guyana I see that, within a single ethnic group 1) male mating effort varies in
predictable ways with the adult sex ratio, 2) the importance individuals place on mate choice
cues varies by location, not sex, in ways generally unexplored and 3) patterns of parental
investment are robust and largely complementary. Through this dissertation I explore how
modern formulations of sexual selection theory can shed light on the diversity of human sex
roles and help us to move on from simple models based on biological predispositions. In this
way I highlight how conventional approaches are likely missing interesting patterns both within
and between groups and offer support for the behavioral ecological tenet that sex differences are
far from universal.

1
1
Introduction
In this dissertation, I examine factors, both social and environmental, that affect the
variability of human gender roles. Evolutionary theory has been applied to the analysis of
variations in human behavior for almost 30 years. Beginning with work on foraging decisions,
anthropologists and biologists began to apply behavioral ecology theory to the study of human
activities, using a combination of qualitative ethnographic and quantitative behavioral methods
(Winterhalder & Smith, 2000). By the late 1980’s, research expanded to test hypotheses
concerning sexual selection, inclusive fitness, and life history theory, addressing issues such as
mating patterns and parental investment decisions (Betzig, Borgerhoff Mulder and Turke 1988;
Borgerhoff Mulder 1991). Most of this early work was done in traditional ethnographic contexts
– the villages of the developing world, or with cross-cultural samples of anthropological
materials. By the early 1990’s, evolutionary analyses of human behavior were increasingly being
conducted on western populations by those within the field of evolutionary psychology (Barkow
et al. 1992), with particular attention focused on gender differences in mating preferences and
parental behavior (reviewed in Laland & Brown 2011). Typical studies focused on differences in
criteria for mate selection of long and short-term partners (e.g., Gangestad & Simpson 2000), the
influence of status and resources on partner choice (e.g., Buss 1989), the role of physiology in
mediating mate choice decisions (e.g., Goetz et al. 2007), and other factors, always with a strong
emphasis on male-female gender differences.
The work of evolutionary psychologists has achieved high visibility, bringing traditional
anthropological issues pertaining to human universals and human diversity into the
consciousness of readers of publications such as the New York Times, The Economist, and The
Atlantic Monthly. This is both good and bad for anthropology: good because of the visibility

2
2
given big questions about human behavior; bad because of weaknesses in the study design and
the data on which many of the more newsworthy generalizations are based.
A persistent finding to come out of modern evolutionary psychology is gender
differences in almost all aspects of mating behavior (Pillsworth 2008). Men are described to be
more eager and indiscriminate in their sexual behavior, and women as more coy and choosey.
Such stereotypes have disturbed not only feminist writers (e.g., Hrdy 1986, see also Gowaty’s
edited volume called Feminism and evolutionary biology) but also those committed to the power
of evolutionary theory to explain variation (Smith et al. 2001). Careful (re)analyses of
evolutionary psychological studies have shown, for example, that gender differences in mate
choice preferences are less pronounced than those contingent on cultural affiliation (Boyd & Silk
2006), or are dwarfed by other (often unanalyzed) patterns in the data (Buston and Emlen 2003).
With a few exceptions (e.g., Hill & Hurtado 1996, Ache; Marlowe 2005, Hadza; &
Pillsworth 2008, Shuar), almost all of the work on human mate preferences has been based on
samples drawn from undergraduate populations and their questionnaire responses (Griffiths
2001; Gray et al. 2003; Aspendorf & Penke 2005; Laland & Brown 2011), generally from the US
or western European nations. Anthropologists question the generalizability of findings based
upon such samples (and others; e.g., Smith et al. 2001). Students who attend colleges and take
courses in psychology are a biased sample of the general population. Even studies that purport to
be cross cultural (Buss 1989, Schmitt 2005) draw on university students in developing nations,
who may be even less representative of their local populations (Beckerman 2005).
Contrary to some psychological findings (e.g. Greiling & Buss 2000), mate choice is not
simply prescribed by a laundry list of choice criteria, but instead is a decision made under

3
3
constraints and with imperfect information (Miller 1997). Because of this virtual neglect of the
broader social context in most studies of mate choice, we still have little evolutionary
understanding of how variation in gender differentiated behavior arises from developmental
factors and features of social structure and culture (Eagly & Wood 2003). To understand the
sources of variation in mate choice, studies of individual preferences, decisions, and behavior
must be embedded within the demographic, economic, and cultural context that shapes every
decision an individual makes. Our (human) history of natural selection has not simply led to rigid
behavioral gender differences that men and women exhibit, but instead allows us to respond
flexibly to environmental conditions. While there may be general behavioral differences between
men and women at the aggregate level, there is considerable variation in behavior, both within
and between the sexes, rather than non-overlapping distributions of female care and male
competition (reviewed in Kokko & Jennions 2008). Thus, any research that seeks to study human
mate choice must take features of society and culture into consideration when attempting to
explain behavioral variability.
Evolutionary anthropologists’ concern with explaining variation in sex roles coincides
nicely with cultural anthropologists’ interest in the study of gender as a category distinct from
biology. “Sex differences” usually refers to biological factors that are genetically inherited, and
often shaped by a particular form of natural selection called “sexual selection” (e.g., Andersson
1994). Gender, by contrast, is a social identity, and is based on socially-learned information (e.g.,
Eagly & Wood 2003). Because cultures have different socially-learned gender roles and
expectations, there ought to be variation among societies in sex-related differences in
preferences. In this proposal I use sex when referring to the sexual selection literature, and
gender when making applications to human populations because of the critical importance of

4
4
socially transmitted information and expectations in shaping gender roles.
I examine variability in gender roles, specifically investment in mating effort, mate
choosiness, and parental investment (PI) in an ethnographic context (Guyana) where we know
there is marked variation across communities, demography, and economics. I focus on the adult
sex ratio (ASR), known to vary radically across Guyanese communities. The ASR is heavily
influenced by patterns of migration and mortality and has been found to have a large influence
on both mating patterns and preferences (Guttentag & Secord 1983, Pedersen 1991, Schmitt
2005). The number of available partners in an area has been referred to as the mating market
because the relative abundance of males and females influences the strategies available to an
individual seeking a mate (Noe and Hammerstein 1994). Therefore, I ask how the ASR of
individuals in the community affects sexual behavior, mate choosiness, and PI. Here I examine
the validity of conventional assumptions about Amerindian families in Guyana, and ask to what
extent variation in gender roles can be explained by an evolutionary logic. Ultimately, the
purpose of this dissertation is an attempt to better understand some of the factors that affect the
variability of human gender roles.

5
5
References
Andersson, M. 1994. Sexual Selection. Princeton University Press, Princeton.
Aspendorf, J.B. and L. Penke. 2005. Sex differences: empiricism, hypothesis testing, and other
virtues. Behavioral and Brain Sciences, 28, 275-276.
Beckerman, S. 2005. Sociosexual strategies in tribes and nations. Behavioral and Brain Sciences,
28, 276-277.
Barkow, J.H., L. Cosmides and J. Tooby (Eds.). 1992. The adapted mind: evolutionary
psychology and the generation of culture. Oxford University Press, Oxford, U.K.
Betzig, L., M. Borgerhoff Mulder, and P. Turke. 1987. Human reproductive behaviour: a
Darwinian perspective. New York, University Press.
Borgerhoff Mulder, M. 1991. Behavioural ecology of humans: Studies of foraging and
reproduction. In Behavioural Ecology, 3rd Edition, eds. J.R. Krebs and N. B. Davies.
Blackwell Scientific Publications, pp. 69-98.
Boyd, R. and J. Silk. 2006. How Humans Evolved, fourth edition. New York: W. W. Norton
Buss, D. M. 1989. Sex differences in human mate preferences: Evolutionary hypotheses tested in
37 cultures. Behavioral & Brain Sciences, 12: 1-49.
Buston, P. M., and S. T. Emlen. 2003. Cognitive processes underlying human mate choice: The
relationship between self-perception and mate preference in Western society.
Proceedings of the National Academy of Sciences 1000:8805-8810.
Eagly, A. and W. Wood. 2003. The origins of sex differences in human behavior: evolved
dispositions versus social roles, in Evolution, Gender, and Rape. C.B. Travis (ed.). MIT
Press, Boston, pp 265-304.
Gangestad, S. W. and J. A. Simpson. 2000. On the evolutionary psychology of human mating:
Trade-offs and strategic pluralism. Behavioral and Brain Sciences, 23, 573-587.
Goetz, A. T., T. K. Shackelford, S. M. Platek, V. G. Starratt, & W. F. McKibbin. 2007. Sperm
competition in humans: Implications for male sexual psychology, physiology, anatomy,
and behavior. Annual Review of Sex Research, 18, 1-22.
Gray, R.D., M. Heaney, S. Fairhall. 2003. Evolutionary Psychology and the challenge of
adaptive explanation. In: From Mating to Mentality: Evaluating Evolutionary
Psychology. K. Sterelny and J. Fitness (eds). Psychology Press (London & New York),
pp. 247-268.
Greiling, H., & Buss, D.M. (2000). Women's sexual strategies: The hidden dimension of extra-
pair mating. Personality and Individual Differences, 28, 929-963.
Griffiths, P.E. 2001. From Adaptive Heuristic to Phylogenetic Perspective: Some Lessons from
the Evolutionary Psychology of Emotion., in J. H. Fetzer (Series Ed.) & H. R. Holcomb
III (Vol. Ed.) Conceptual Challenges in Evolutionary Psychology, Innovative Research
Strategies: Studies in Cognitive Systems, Vol. 27 (pp.309-325). Dordrecht, Netherlands:
Kluwer Academic Publishers.
Guttentag, M. and P. Secord. 1983. Too many women? Beverly Hills, CA: Sage.
Gwynne, D.T. 1984. Sexual selection and sexual differences in Mormon crickets (Orthoptera:
Tettigoniidae, Anabrus simplex). Evolution 38, 1011-1022.
Hill, K., & Hurtado, A. M. (1996). Ache life history: The ecology and demography of a foraging
people. New York: Aldine de Gruyter.
Hrdy, S. B. 1986. Empathy, Polyandry, and the Myth of the Coy Female, in Feminist approaches
to science, The ATHENE series. Edited by R. Bleier. New York: Pergamon Press.

6
6
Kokko, H. & Jennions, M.D. 2008. Parental investment, sexual selection and sex ratios. Journal
of Evolutionary Biology 21:919-948
Laland, K.N. and G.R. Brown. 2011. Sense and nonsense: evolutionary perspectives on human
behaviour. Oxford University Press, Oxford, UK.
Marlowe, F. W. (2005). Mate preferences among Hadza hunter-gatherers. Human Nature, 15,
364–375.
Miller, G. F. 1997. Mate choice: from sexual cues to cognitive adaptations, in Characterizing
Human Psychological Adaptations. Edited by G. R. Bock and G. Cardew, pp. 71-87.
Chichester: John Wiley and Sons.
Noë, R. and P. Hammerstein. 1994. Biological markets: supply and demand determine the effect
of partner choice in cooperation, mutualism and mating. Behavioural Ecology and
Sociobiology, 35, 1-11.
Pedersen, F. A. 1991 Secular trends in human sex ratios: their influence on individual and family
behavior. Hum. Nat. Int. Bios. 2: 271–291.
Pillsworth, E.G. (2008) Mate preferences among the Shuar of Ecuador: trait rankings and peer
evaluations. Evolution and Human Behavior, 29, 256-67.
Schmitt, D.P. 2005. Sociosexuality from Argentina to Zimbabwe: A 48-nation study of sex,
culture, and strategies of human mating. Behavioral and Brain Sciences, 28: 247-311.
Smith, E. A., M. Borgerhoff Mulder, and K. Hill. 2001. Controversies in the evolutionary social
sciences: a guide for the perplexed. Trends in Ecology & Evolution 16:128-135.
Winterhalder, B., & Smith, E. A. (2000) Analizing adaptive strategies: Human behavioral
ecology at twenty-five. Evolutionary Anthropology, 9, 51-72.

7
7
Chapter 1
Cassava and the Makushi: a shared history of resiliency and transformation
Ryan Schacht
Anthropology
University of California, Davis

8
8
Introduction
For every society, there is no more important set of cultural traits than the one related to
subsistence. Food, and its necessary growth, gathering and preparation, is fundamental to the
existence of human life. If one would like to know what lies at the very heart of a people, then
surely food must be seen as its visible manifestation. Societies throughout time and the world
have developed complex ceremonies, rituals, rites, taboos and beliefs surrounding the growth,
harvest, preparation, and consumption of food. The Makushi of southwestern Guyana and their
staple foods are no exception. Cassava (Manihot esculenta Crantz, Euphorbiaceae) and its
products are inextricably tied to Makushi identity and are the outward expressions of what
defines them as a group.
Amerindian (the term used to describe Central and South America’s indigenous people)
societies and cultures have undergone profound transformations through colonization, disease
and missionization. Charles Schomburgk, a German explorer, painted a grim picture of the future
of Amerindians after his travels through Guyana in the 1830s.
Driven from their lands, now in possession of the Europeans and their
descendants, they have wandered from their ancient homes, strangers in their own
country, and diseases and vices introduced by the settlers and feuds among
themselves, have all but annihilated the rightful owners of the soil. It is a
melancholy fact, but too well founded that wherever Europeans have settled, the
extermination of the native tribes has succeeded their arrival (Schomburgk 1840:
48).

9
9
The Makushi represent a striking example of Schomburgk’s depiction because they were
nearly wiped out themselves by diseases introduced in the years following European contact with
South America (DeFillips, Maina & J. Crepin 2004). This was not alarming to the colonial
regime at the time because, as one British official stated, Amerindians held ‘little or no social
value and their early extinction must be looked upon as inevitable…’ (Rowland 1892: 56).
However, far from disappearing as victims of “progress,” the Makushi have rebounded to
become the second largest Amerindian group in Guyana and the fourth largest in Brazil (Forte
1996b, Conselho Indigena de Roraima 1993). This return from the brink has been nothing short
of amazing, and much of their resilience resides in their dietary staple: cassava.
Makushi men and women regularly refer to cassava and its associated products as “we
food.” This simple statement encapsulates a complicated history of conflict, colonization and
upheaval that has at times destabilized a people. This paper will explain the history of the
Makushi, their subsistence patterns as well as make arguments for the importance of cassava in
their daily lives. In the face of major social and political upheaval, the fact that this food staple
has remained integral to what it means to be Makushi is a testament to the importance of cassava
to both group livelihood and identity.
The Makushi
The Makushi are a Carib-speaking people living in the Rio Branco-Rupununi Savannahs
in northern Brazil and southwestern Guyana. Historical evidence dating back to the early 18th
century marks the earliest Makushi presence in the region (Hemming 1994). Settlement of the
area was a result of their southern neighbors, the Wapishana, an Arawakan group, driving them
north (Evans & Meggers 1960). The Wapishana were themselves responding to external forces,

10
10
pushed north and eastward as Brazilian settlers began populating the area (Riviere 1963). In
southwestern Guyana today, the forested Kanuku Mountains, which run east-west, provide a
natural dividing line of the Rupununi savannahs with the Makushi generally found in the north
and the Wapishana in the south.
Linguistic, cultural and ethnohistoric evidence places the Makushi in the tropical forest
culture complex (Myers 1993), with their origin centered in the Xingu basin of western
Amazonia (Evans and Meggers 1960). The groups from this area all share a complex of
subsistence traits that include hunting, fishing and gathering as well as the cultivation of cassava
through shifting (slash-and-burn), cultivation and a semi-nomadic lifestyle. Makushi settlements
historically were dispersed and politically decentralized (Whitehead 1994). Individuals and
households were highly mobile leading to temporary and distant settlements. A household was a
self-sufficient entity in terms of production of food and craft staples and could contain three to
four generations under one roof.
Although the Makushi are still alive and well today, much of their way of life has
changed since the Europeans first made contact in the Americas. Cassava and its products are
still central to the idea of what it means to be a “Makushi”, however, due to contact a greater
reliance has been placed on wage earnings and this has influenced the once strict gender division
of labor. Thus, in order to understand how this change came about as well as to understand the
importance of cassava to the contemporary Makushi, it is essential to understand Guyana’s
colonial history.
Guyana’s Colonial History

11
11
The first Europeans came to the Guianas in search of new trade routes, spices and gold.
Early voyagers initially saw little of consequence in the interior and often felt themselves in an
impenetrable and meaningless green blanket as they attempted to explore the rainforest. In stark
contrast, Amerindians in the Guianas lived in relative ecological synchrony with the forested
surroundings and had a thorough knowledge of plants and animals (DeFillips 2004). The
Europeans mostly stayed out, but they entered deeper into the forests of the interior with the
spread of stories about the golden city of Manoa and King El Dorado. They began working their
way into what was, at least for the European, uncharted territory, using rivers as highways into
the interior. Although they never did find El Dorado and Sir Walter Raleigh lost his head for
nearly bankrupting King James I in his series of misguided voyages in the late 16th
and early 17th
centuries, they did find areas ripe for colonial exploitation through the development of
plantations (Gillian 1963).
The Dutch were the first Europeans to develop permanent settlements in Guyana
beginning in 1616, putting their knowledge of building levees, canals and locks to “recover” the
earth from mangrove and tidally flooded swamps (Daly 1974). Initial contacts with Amerindian
populations were friendly and the Dutch expressed a keen interest and surprise in the amount of
food and crafts they could exchange for cheap European goods. However, this relationship
quickly changed as the colonists needed additional laborers to work in the ever expanding
sugarcane fields. The coastal tribes were first enlisted, with force if need be, but these overtures
were eventually met with resistance and abandonment of plantation life. Because of this, the
Dutch in 1686 named four tribes they had contact with immune from slavery and employed them
as slave-catchers (Forte 1996c). The Arawak, Carib, Warrau and Akawaio were not to be used as
slaves, but they were to bring other men and women from interior tribes to work in their place.

12
12
These slave-raiding exploits carried out by the four immune tribes led to what is known
to the locals as the “tribal wars.” Stories abound of Makushis being forced to retreat to higher,
more remote areas of the Pakaraima Mountains and deeper into the rainforest to avoid the slave-
raiding coastal tribes. The Makushi were at a disadvantage as they were not equipped with
European goods such as guns and cutlasses (local term for machetes). Their southern neighbors,
the Wapishana, were under the same pressure from the slave-raiders and there were reports that
they were living in the savannahs by day, but at night retiring to cliffs and caves which were
defended by palisades (Butt Colson and Morton 1982).
Accounts from Sir Walter Raleigh’s failed expedition in search of El Dorado may have
mentioned the Makushi living in the Rupununi savannahs as early as the 17th
century, but the
names of tribes and their descriptions are unclear (Gillian 1963). Before the European presence
in South America, the Rupununi Savannah likely was unpopulated and the movement of people
into the area was either as a consequence of colonizers pushing out tribes from their traditional
areas or those seeking refuge from slave-raiding, or both (Williams 1993). In 1793, however, the
Dutch government outlawed Amerindian slavery in Guyana and the Makushi subsequently drove
the Caribs out of the Rupununi (Forte 1996c). Then, shortly thereafter, the Dutch were
themselves driven out by the British at the turn of the 19th
century. The focus now was wholly on
African slaves providing the colonial workforce. This was not to last though as slavery was
abolished in 1834 and, without African slaves providing the workforce, the British sought out
other plantation workers. Initially the Portuguese were enlisted as indentured servants, but once
their period of servitude was completed they quickly began filling the merchant class and
expected the same rights as the British. The British had set up a system of social stratification by
race in Guyana (as they had in other colonies) and the Portuguese would not stay on as plantation

13
13
workers after their service period ended. Because the British were not looking to bring in those
who would expect equal standing in society, but instead were looking for lifetime laborers, the
next experiment was with the Chinese. However, the colony was unable to bring them over in
any sizeable numbers and it was at this time that the first boats of indentured East Indians began
arriving. In total, over 240,000 East Indians were brought to Guyana (Daly 1974). At this time
the colony of India also included Pakistan and as such both Hindus and Muslims were carried
over. The Africans had mostly been converted to Christianity (Anglican), as were the
Amerindians during the 20th
century, and thus a multi-ethnic colony composed of multiple
religions was produced.
As some colonists moved from the coast and into the interior they saw much that needed
changing in terms of the Amerindian population. This sentiment was felt most profoundly by the
missionaries. The intimate lives of the indigenous people – childcare, the home, sexuality,
marriage, gender relations and even bodily adornments - came under the scrutiny and
condemnation of the colonizers (see Jacobs 2009). This contributed to social and cultural
upheaval as missionaries worked to replace many of the local philosophies that formed Makushi
social organization with European Christianity. Polygyny (men taking multiple wives) was
banned, nuclear settlements were directed and men were expected to be the head of the family
(Myers 1993). This upheaval was further compounded by the new diseases people brought into
the area (even throughout the first half of the twentieth century epidemics were still killing large
numbers of Makushi people; Jones 1952).
Along with the colonists also came new opportunities for subsistence. Because of the
expansive savannahs, the Rupununi was looked to as an ideal area for cattle ranching. Initially
brought over from Brazil in the late 1800’s, grazing cattle in the open grasslands and savannahs

14
14
became a common sight in the area (Myers 1993). The balata bleeding industry also took off
during this time period (Baldwin 1946). Balata is a rubber substitute extracted from the bullet
wood tree (Manilkaria bidentata), which is generally found deep in primary rainforest. For these
two industries, workers were needed and recruited from local villages. Traditionally, men and
women stayed close to their families and homes, but with the advent of wage labor many young
adults moved to areas providing jobs. These industries and others had major demographic
consequences, affecting cassava demand and production throughout the Rupununi. Balata
bleeders, ranchers and vaqueiros (Portuguese word for cowboys) often spent weeks or months
alone or in small groups far from settlements (Myers 1993). As such, they needed a portable food
source and this led to a demand for the increased production of cassava. These industries also
concentrated the demand for cassava products in new population centers, resulting in many
farmers expanding their farms and producing more cassava than needed for their own
subsistence for the first time.
Contemporary Guyana and the Makushi
As a result of its colonial history, Guyana today is both a multi-ethnic and multi-religious
state. Of the nation’s roughly 750,000 people, ninety-percent live along the urbanized coastlands,
which is only about five-percent of country’s landmass. The remaining ninety-five-percent of the
country is either sparsely or completely unpopulated. Inland from the coast, Amerindians
compose the majority of the population. There are currently approximately 24,000 Makushi, with
9,000 living in Region 9 (Upper Takutu-Upper Essequibo, one of ten administrative regions) of
southwestern Guyana (Ricardo 1996, Forte 1996b). Throughout the region, there are twenty
seven principle Makushi villages as well as a number of smaller satellite communities (Forte
1996c).

15
15
Geographically, Guyana is part of the South American continent but culturally the major
population centers on the coast are Caribbean. Much of the interior, including the Rupununi, is
more closely connected with the markets and industries of Brazil. Partly this is the result of the
inland regions of Guyana being isolated from coastal populations. To this day there is only one
road that connects the coast to the interior and it is unpaved and frequently impassable during the
rainy season. Because of the interior’s remoteness from the coastland and the close ties to Brazil,
much of what happens in the interior is disconnected from the capital.
The racial politics on the coast, created by colonial policies, were (are) focused solely on
the competition between the Afro- and Indo-Guyanese groups for power. After independence in
1966, the paternalism of the colonial government was replaced by a strident nationalism colored
by racial overtones (Colchester, Rose & James 2002). This led to those in the interior, who were
neither Afro- or Indo-Guyanese feeling left out of the political sphere because their needs were
not being addressed by the coastally-focused government. A rebellion led by ranchers followed
in 1969 and was provoked by many reasons including ‘insecure pastoral leases, ambitious
government proposals for reallocating land in favor of settlers from the coast, racial suspicions,
lack of control of cattle rustling from Brazil, and ill-documented rumors of meddling from
neighboring countries (Colchester et al. 2002: 125).’ This uprising was quickly put down by the
Guyana Defense Force and the cattle heyday of the Rupununi was ended overnight as the
livestock that had not been rustled by Brazilians was taken by the government. A military base
was installed in the capital of Region 9, Lethem, and settlements of Coastlanders (primarily
Afro-Guyanese) were made in traditional Amerindian lands with the purpose of bringing the
coast to the interior (Forte 1996b).

16
16
This rebellion fueled suspicions that the Makushi were not loyal Guyanese and it
poisoned relations between inhabitants of the interior and the coast in a manner that endures to
this day. Many government services were suspended including veterinary, rangeland, abattoir
and refrigeration, and air transport. Because these connections with the coast were allowed to
deteriorate, the ranching economy went into decline (Colchester et al. 2002). As a consequence,
most of the Makushi of Guyana live in remote communities, removed from the national political
and economic power and have much more in common with the Makushi in Brazil than with
coastal Guyanese (Vereecke 1994, Forte 1996b). The result has been that the economy of the
Rupununi is more focused towards the Brazilian state capital of Boa Vista than to Georgetown.
Many Makushi in the region now move to Brazil for work because of the decline in the cattle
industry (as well as the balata industry around 1970). The Brazilian government has also
encouraged this movement of people by recently completing a bridge over the Takatu River
connecting the two countries near Lethem, making the trip to Brazil even easier. It is quite the
transformation to cross into Brazil over this bridge leaving behind the dusty (or muddy,
depending on the season), red, pitted, two-wheeled vehicle tracks of the Rupununi for the paved,
illuminated roads of Guyana’s more industrialized neighbor.
The geographical remoteness of the Makushi, as well as most of Guyana's Amerindian
population, exacerbates their status as a group socially, culturally, and economically marginal
within a country dominated by other ethnic groups (Henfry 2002). Throughout the Caribbean,
indigenous contributions to national identity and cultural diversity are rarely recognized, and
Guyana is no exception (Palacio 1995). The attention of the coastal Guyanese generally is
focused north in the direction of the Caribbean and North America. Very few ever even visit the
interior and as a consequence ignorance and misconceptions of the area abound among the

17
17
general public (Henfrey 2002). From the point of view of the coast, much of what happens in the
interior is unimportant and there is a sharp social and conceptual divide between the coastal
dwellers and those who live in the “hinterland” as it is known. Those in the interior are generally
viewed as poorer, less educated and uncultured and as such are viewed as having a lower social
status than the average Coastlander. As a Guyanese Anthropologist noted, ‘Amerindians
comprise the poorest and most neglected stratum of Guyanese society, both when measured in
terms of gross annual earnings and in the popular perception of where they fit in the local
hierarchical ranking – in both instances, on the very last rung (Forte 1996a: 5).’
Thus the contemporary Makushi people of Guyana are stuck in a land in-between. They
are Guyanese but viewed as less so than those from the coast. Consequently, most have removed
themselves even further from the politics of “Town”, as the capital city is called. There is little
chance that a remedy exists even within the current public education system. This system follows
a pan-Caribbean curriculum and as such does not hold much relevance to the requirements of
interior life. Thus, successful students in this system are more likely to be alienated from their
home areas rather than be equipped to help solve problems there (Forte 1996b; Lea 1968).
Traditional social organization of the Makushi has been characterized by individualistic
tendencies, loose social structures and lack of formal social groupings and this all lies in contrast
to the hierarchical and centralized systems of governmental decision making (Gillian 1963).
Thus, because of their lack of conforming to the national model, they are viewed as impediments
to development (Forte 1996b).
This coastal view of the Makushi being “impediments to development” can be best
described by the word the Coastlanders often use when referring to them (as well as other
Amerindians). It is not uncommon to hear the Makushi being referred to as “bucks” or “buck-

18
18
people.” When asked what this refers to the speaker will quickly point out that he is comparing
the Makushi with the term for male deer that are common in the hinterland. The use of this word
is not always meant to be an insult, however, it does have the effect of further exacerbating the
commonly held belief on the coast of the Amerindian as an uncultured, uneducated being.
Although the Makushi do feel left out of the politics of “Town” and are aware of the
stereotypical view an average Coastlander has of them this has, generally, led to a strong sense of
a shared identity both amongst themselves as well as other Guyanese Amerindians. Rather than
simply becoming victims to this term, many Makushi now embrace the word “buck” and refer to
themselves as “we buck people.” Many will also make statements about the importance of “we
food” (as mentioned earlier) and the pride they feel in knowing that their diet is much different
from the rice-based foods of the coastal populations (as well as the fact that Coastlanders
generally cannot stomach their food). In order to understand the source of this pride that the
Makushi feel of their subsistence staple, one must understand the shared spiritual origins of the
Makushi and cassava.
Cassava and Creation
Cassava is an extremely resilient plant that has many uses. Originally from South
America, today cassava is grown worldwide and is the third largest source of carbohydrates in
the world. A perennial woody shrub that produces long tapered tubers resembling sweet
potatoes, cassava can be classified as sweet or bitter depending of the amount of toxic
cyanogenic-glucosides in the tubers (Elias, Rival & McKey 2000). The bitter variety is quite
poisonous and the toxins must be extracted through a laborious process before the tubers can be

19
19
safely consumed. Although potentially toxic, bitter cassava is the staple crop throughout much of
the Amazon, and has been so for over 3,000 years (Renvoize 1972).
Because of colonization, and especially missionization, much of the Makushi’s original
oral histories and folklore have been lost, subsequently transforming Makushi cosmology and
notions of spirituality. Indeed, such “traditional” knowledge has been replaced with cosmologies
of Western religion and their concomitant cultural norms, despite the fact that these imposed
beliefs conflicted with traditional ideas related to gender relations, parenting, the family and
marriage (de Oliveira 1994). However, stories of the spiritual origins of cassava can be pieced
together from past accounts detailed by early explorers and ethnographers as well from
conversations with those still knowledgeable of these origin myths. This knowledge is needed to
appreciate the importance this food crop holds in the psyche of the contemporary Makushi.
Makushi folklore and their conception of creation indicate they were an animistic people
who did not believe in or worship a single omnipotent god. They instead saw their world
inhabited by spirits and, of these, there was one Great Spirit known as Makunaima (Roth 1915).
Makunaima had a twin brother Pia and these spirits were the result of the sun coupling with a
woman who had been carved from a tree by Alligator. Because both Makunaima and Pia
inhabited the same world the Makushi lived in, the spirits’ influence in peoples’ lives was both
expected and unavoidable. The folklore that surrounds Makunaima and Pia can be viewed in a
similar light to the stories from Greek Mythology regarding the gods and their exploits. They
were mischievous, fickle and cunning. The stories of their adventures abound in Makushi
folklore and, for example include: the killing of Tiger in retaliation for him killing their mother,
the burning of Tiger’s mother Frog, and the unfortunate hunting accident in which Makunaima

20
20
lost a leg while hunting Tapir – you can still see the stump of his leg to this day if you look into
the night sky at what we know as Orion’s belt (Roth 1915).
However, for the Makushi the most important tale involving Makunaima is their creation
story. As the legend goes, one day Makunaima climbed a large tree with his stone ax and began
to cut pieces of wood. He then cast these pieces into a nearby river and they, once wet, became
animate beings. These newly created people were the Makushi and they began to populate the
area. Yet Makunaima did not make their existence an easy one and they and all the other animals
were starving because they had nothing to eat. One animal, though, the tapir, always appeared
sleek and fat. The other animals noticed this and sent the opossum to follow him. The opossum
did what he was told, following the tapir deep into the forest. When he saw the tapir pause the
opossum found himself under an enormous tree bearing all of the food types any creature, man
or animal, could want. The opossum went back and reported this and then led the humans to the
tree. They picked up all they could, but once this food was consumed the only food remaining
was very high up in the branches of the tree. The tree trunk was too smooth to climb and, after a
brief discussion, they decided to cut it down. Yet this was a very large tree and took the people
many days of chopping with stone axes. The tree finally fell and, alongside the other animals, the
people gathered all that they wanted. However, the people were novices and had no idea how to
propagate and prepare some of the foods they had collected. Many were not poisonous, such as
corn, and others were edible raw, such as pineapple, but one in particular, bitter cassava required
special knowledge to become suitable for eating. A most helpful bird explained to the Makushi
how to grow each food type they collected and most importantly, how to prepare the bitter
cassava and extract its toxic juice (Roth 1915).

21
21
Since this time, it is said that bitter cassava has been the staple of the Makushi. Although
bitter cassava may seem like an odd choice for a dietary staple because it is so labor intensive to
process in comparison to sweet cassava, the Makushi and bitter cassava are well adapted to one
another. The bitter variety is preferred by the Makushi for a number of reasons but primarily
because the processing results in products that are resistant to spoilage in a tropical environment.
This is an important benefit because, in general, any food not consumed immediately will spoil
and go to waste. And, as will be described in more detail below, bitter cassava is an ideal crop
for the demanding and variable physical environment in which the Makushi live.
Farming
Makushi farming practices are in response to their environment, which is punctuated by
two seasons: the rainy and dry. During the rainy season (April through September), rains fall
heavily and the savannahs become flooded. During this time the Guiana Shield and the Amazon
Basin meet and along their confluence, there is a proliferation of plant and animal life. This is the
one time of year that the watershed of the largest river in South America, the Amazon, and the
third largest river, the Essequibo, connect, and lead to some of the highest levels and
concentrations of biodiversity in South America (Lowe-McConnel 2000). However, during the
dry season (October through March), rainfall is low and the temperatures rise causing the creeks
to stop flowing, savannahs to dry, and grasses to brown.
The Makushi generally make their homes in the savannah areas, but because of the poor
nature of the grassland soil and its exposure to weather extremes, including flooding in the rainy
season and severe parching in the dry, the savannahs are inadequate for growing crops. As such,
farming is primarily done at the foot of the jungle-covered Kanuku Mountains as well as in forest

22
22
galleries along rivers where the soil stays moist year round (Elias et al. 2000). This landscape has
remained largely unchanged since colonization and was described eloquently by Charles
Waterton:
The finest park that England boasts falls far short of this delightful scene. There
are about two thousand acres of grass, with here and there a clump of trees and a
few bushes and single trees scattered up and down by the hand of nature. The
ground is neither hilly nor level, but diversified with moderate rises and falls, so
gently running into one another that the eye cannot distinguish where they begin
nor where they end… The beautiful park of Nature is quite surrounded by lofty
hills, all arrayed in superbest garb of trees: some in the form of pyramids, other
like sugar-loaves, towering one above the other, some rounded off, and others as
though they had lost their apex… and ridges of others resemble the waves of an
agitated sea. Beyond these appear others, and others past them, others still farther
on, till they can scarcely be distinguished from the clouds. (1925: 30-31)
Farming practices do vary among the Makushi, but each household has at least one bitter
cassava field. Each field varies in size but they are generally no smaller one-half acre and rarely
larger than two acres (Elias et al. 2000). The Makushi have historically harvested only what they
needed for survival. Today, however, although most are still subsistence farmers, crop surpluses
are often carried to market to be sold. One main benefit of cassava, compared to a crop like corn,
is that there is no conflict between what is edible and what is needed for replanting because
cassava can be propagated vegetatively (without seeds) and the non-edible stalks are the sources
of new plants. In order to replant cassava, the stalks of the cassava plant are cut into roughly
twelve inch-segments and are planted at about a forty-five-degree angle one to three inches in the

23
23
ground. Many farmers have a second field where they grow plantains, bananas and other fruiting
trees such as papaya. This field also commonly includes additional root vegetables, pepper
plants, watermelon, pineapple, sugarcane and pumpkin.
Most cassava fields are only used for two or three years before being abandoned. The
reasons for this vary but the most common are that the soil fertility declines and produces smaller
and poorer quality cassava, weeding becomes an unmanageable chore as the forest begins to
reclaim the field and pests begin to cause more damage than what the plot produces. One of the
dreaded pests of every farmer is known locally as the acoushi ant (leaf-cutter ant, Atta spp.). The
ants are seen as the number one threat to any farm and there are a number of natural remedies
that range from introducing other ants and wasps that defend against the acoushi ant to the
pouring of fish poison made from local plants down their burrows (Forte 1996b, 1996c).
Depending on the size of the household and their occupant ages and associated needs, as
well as abiotic and biotic environmental factors, at least one new field is cut every year. This
provides each household with several fields of varying maturity at one time. These areas are
generally selected in the rainy season and then cut during the dry season. In preparation for the
arrival of the rains, farmers begin burning these cut areas. The fire consumes the vegetation
cover, reducing the labor time needed to weed the field and results in a layer of ash that provides
nutrients for the first crop. Some farms also include larger trees that were felled and failed to
burn through. These are left where they lay and act as ground protection from erosion as well
continuing to contribute nutrients to the farm as they decay. Some crops, such as watermelon and
pumpkin, are preferentially planted near tree stumps and fallen logs to take advantage of this
(Forte 1996a).

24
24
As mentioned above, these farming practices ensure that each household has two to three
fields at varying stages of maturity. Bitter cassava also comes in a staggering number of varieties
and each has varying times of maturity which further influences crop availability. A recent study
found that the Makushi in one community cultivate over seventy-six different varieties and that
each farm, on average, grew sixteen different varieties. This may seem like needless variation,
but having so many varieties serves quite a few purposes. Environments vary and what at one
time may do poorly may do quite well in another set of circumstances (Elias et al. 2000). For
example, some varieties are more drought tolerant while others are more flood tolerant. Although
there are two distinct seasons in the Rupununi, a year or two of drought may be quickly followed
by extensive flooding. In this sense, having only one type of bitter cassava growing at a farm is
quite risky in terms of supplying a growing and, often times, multi-generational family with
food. Diversity is also good for protection against disease and pests (Elias et al. 2000). Because
all varieties vary in their ability to grow and develop in spite of climatic or biotic factors, this
variation is important to maintain because at any point in time the environmental factors could
change, exposing the farm to new pressures.
Farmers are always on the lookout for new varieties and will willingly trade stalks from
their farm for a new variety. Cassava stalks may also be given as gifts to those just beginning
their first farm, those new to the area, or those who may have lost their farm to drought, flooding,
or pests. Thus, exchange networks are created, often beyond kinship ties, and are reinforced
through the reciprocal trade of cassava types. This trade leads to further bitter cassava diversity
maintained by farmers throughout their fields. Because of the varying rates of tuber development
of the different cassava varieties, as well as varying ages of farms, a family generally has
harvestable cassava available to them all year. Tubers of some varieties are ready in as little as

25
25
three to four months; whereas, other varieties require at least a year to develop and will still
produce edible tubers for up to two years. As such, the risk of crop failure is low because the risk
is spread out over various fields planted at different times of the year with numerous varieties,
each with its own speed of development. This adaptability and resiliency of the cassava tuber are
a source of pride for the Makushi. Although any one variety is not integral to an individual or
shared identity, the intrinsic flexibility of cassava is. An individual Makushi will speak of how
much has changed culturally over his or her lifespan, but point out that cassava is still “we food.”
The pride comes from the fact that as much as everything has changed, they and their food staple
have been able to adapt and survive.
Cassava Processing and Gender Specialization
For the Makushi, the process of turning bitter cassava into an edible food product has
resulted in a fairly rigid gender division of labor. These gender based differences are a
fundamental feature of the social, economic, political and ritual organization shared among all
societies in the Amazon (Berreman 1998). For most Amazonian groups, relationships between
the sexes are generally asymmetrical with the women in a subordinate position (Wilson 1999).
Although the Makushi have a well-defined division of labor between the sexes, with men as the
primary hunters and fishers and women as the producers of the products of cassava (Myers
1993), this general pattern of gender subordination does not seem to apply. Iris Myers, who
conducted the most extensive ethnography of the Makushi in the 1930s and 40s, described
women as having a high level of independence and high standing relative to their contemporaries
in other Amerindian societies (Myers 1993). This female independence within the household
arguably still holds true to this day. In order to better understand this division of labor as well as

26
26
the relationship between the sexes, it is important to understand the most fundamental aspect of
each household: the processing of cassava.
The most labor intensive aspect of cassava related work is the cutting of the field, which
is done by the males. Traditionally, this would have been conducted through a collective action
of sorts, called mayu, or self-help (Elias et al. 2000). In order to get other men to help cut a new
farm, the male head of household would have his wife make parakari, a beer-like beverage made
from the cassava tuber, and invite local men to participate. The men would gather, consume
some of the drink and then begin the work of clearing the farm. At various intervals throughout
the day, breaks would be taken and more parakari drunk. Although alcoholic, it is a filling
beverage and is quite often used as fuel to keep a farmer going even when not participating in a
mayu. Once the farm has been cut, and ideally not before, the men will then put down their tools
and celebrate together until the parakari is completely consumed. However, the importance of
this collective work has diminished, although it does still occur, because the Makushi have
become more market integrated and many expect to be paid for work provided. Therefore a man
today usually goes with his sons or brothers to cut a new field. Once the area is dried, the men
then burn the farm in anticipation of the rains. Either before or after the rains begin, the entire
family will clean the farm. The men then hoe the soil into mounds in which the women plant
freshly cut cassava stalks generally taken from a recently harvested field. The subsequent
weeding and care of the farm is up to the women, but the children help as well. When harvesting
the cassava tubers, the men and women work together and, if this were the first or second crop,
stalks would be planted in the same area in freshly hoed banks (field notes 2011). The more
fertile the soil, the more consecutive cassava crops can be planted in the same area before
moving to another field.

27
27
Gender specialization in cassava processing becomes apparent once the cassava is
brought home. Women are the processors of the cassava tuber – a labor-intensive procedure of
extracting the poison and transforming it into edible form. The finished cassava products range
in preparation, consistency, and use. However for all end goods, the initial steps of processing
are the same. The tuber is first scraped and washed. The cleaned tuber is then grated using a
grater that consists of a board about three feet tall embedded with small rock chips across one
side. More “modern” graters substitute thin metal strips for rock chips or, if possible, a
household will buy a grater from Brazil that can be powered by a bicycle. This latter method is
preferred as it saves hours of back-breaking up and down grating motions. In order to detoxify
the cassava, the grated pulp is placed into a three to five foot tall woven matapi, or what looks
like a giant finger trap. The top is hung from a branch or rafter and the bottom has a loop through
which a pole is passed. A woman will then sit on this pole and a container will be placed below
the matapi to collect the juice that escapes as the matapi is constricted. From this point forward,
further processing techniques are based on the desired product.
Yellow tubers will be made into toasted granules called farine (from the Portuguese
farinha, similar in size and texture to Grapenuts cereal). Once squeezed, the pulp from the
matapi will be passed through a woven sifter (approximately two by two feet) to remove any
larger pieces. The sifted mass will then be placed in a large pan over a hot fire and roasted until
all of the moisture has been parched from it. Farine will not spoil, unless wet, and acts as the
staple for the Makushi. A favorite snack is a quick scoop of farine, a dash of water, and spoonful
of sugar.
White cassava tubers provide the base for another essential product, cassava bread. The
processing of cassava to make bread differs in that the pulp from the matapi is pushed through a

28
28
sifter with smaller holes than for farine. This finer flour is placed on a hot pan and is shaped into
a circle about two feet across and when cooked resembles a crispy flatbread. This bread once
dried, normally on the thatched roof of the household, has a long shelf-life as well, which is
important in the tropics. It is often eaten with a Makushi dish known as tuma pot (described
below).
Parakari, the alcoholic drink mentioned above for the mayu, is made using cassava bread
that has been baked one-half inch thick and slightly blackened. These “loaves” are then torn into
pieces and placed on banana or other waterproof leaves, sometimes in the main area of the
household. Old cassava leaves that have been dried in the rafters of the house are then crushed
and sprinkled on each layer in order to introduce the yeast (Rhizopus spp.) that begins breaking
down the starch and producing alcohol. Once a thick layer of cotton white yeast has formed over
the bread (approximately 48 hours) and the mash is sweet to the taste, the parakari has “woken
up” as they say and can be added to water, strained and drunk. If strong parakari (higher alcohol
content) is called for then this mass will be placed in a container to continue fermenting and will
be consumed some days later.
The water collected from the squeezing of the matapi, known as the cassava water, will
not be thrown out, but will be further processed. The color is reminiscent of vehicle anti-freeze,
and if left unprocessed, can be even more deadly. The first step for processing this water is to let
it sit and then separate the liquid from the starch that has settled out at the bottom of the
container. This starch can be made into tapioca by roasting it in a similar manner to farine. The
remaining liquid is not thrown out either and is a favorite addition to two Makushi dishes. The
first is known as tuma pot and is regularly served with cassava bread as mentioned earlier. This
dish generally consists of the cassava water, fish, sweet cassava or other root vegetable and hot

29
29
peppers. The boiling makes the dish safe to eat and the cassava water helps to flavor the food.
The other option is to continually boil down the cassava water until it becomes thick syrup, like
molasses, called cassareep. This syrup is a necessary addition for a dish known as pepper pot,
which would include meat, hot peppers, and any root vegetables available. Some houses have a
constantly boiling pot to which they simply add more food and cassareep to from time to time.
At the beginning of the twentieth century, for the first time, more and more women were
now making cassava products not just for their families’ consumption but to sell to others.
Although this change may seem minor, it had fundamental cultural consequences. In light of the
equitable gender roles of the Makushi, this shift may have been what gave the women more
independence, value and control within the household. Women were the ones who supplied the
goods that provided money for the family. Although men still generally acted as the go-betweens
for trade, the women made it all possible. More men were also gone throughout the year working
and as a result it was up to women to provide for their families in their partners’ absence. In
addition, because of the increased demands for farine the men now spent considerable more time
processing cassava. The older generations laugh when asked if men parch farine or make cassava
bread, but younger men routinely identify themselves as capable of processing cassava. This
work is now seen less as “women’s work” but rather an important source of income for the
family.
Summary
The Makushi of today are living quite differently than those who came before them.
Because of the effects of contact with Europeans, they, as a people and culture, were
fundamentally changed. Initially, their population was decimated by disease, even before

30
30
physical contact with the colonizers. They were then pushed out of their traditional areas because
of pressures placed on them by both European settlers as well as from other tribes that were
themselves being displaced. For nearly 300 years slave-raiding was also a constant concern and
as a result was culturally damaging as it further scattered a reduced number of Makushi people
into ever more remote recesses of the mountains and forests to escape the superiorly equipped
coastal tribes. After slave-raiding ended, the Makushi were able to return to a more traditional
way of life, living in the savannahs and farming in the wet, fertile soil of the forests along
streams and at the foot of the mountains. However this return to their customary practices was
short-lived as colonizers began entering the area. New diseases were introduced and epidemics
occurred, even up until the 1950’s (Jones 1952). Part of this susceptibility to disease was due to
the effects of missionization. The Makushi were nearly wiped out as they began clustering
around densely populated mission settlements (Forte 1996b). These settlements provided the
perfect vectors for diseases to spread quickly through people accustomed to living in dispersed,
small, kin-based groups. Because of this decimation due to disease, as well as the conversion
process, Makushi culture itself was also nearly destroyed. As missionaries began conversion they
condemned many of their traditional beliefs and practices. The influence of church and mission
schools, with their ethnocentric disapproval of “savage” and “pagan” customs, led to the
disappearance of much of the Makushi material and cultural life (Forte 1996c). Family
composition, childcare, marriage, sex and many other aspects fundamental to the Makushi
identity were also changed under the scrutiny of the missionaries.
Although much has changed since initial European contact, one constant for the Makushi
has been the reliance on cassava and its associated elaborate processing techniques. Cassava, the
staple of the Makushi, and its resilience helped them weather the various storms that battered

31
31
them. Although traditional beliefs were replaced with (often conflicting) Christian teachings and
Western family models were imposed, the Makushi never lost the, arguably, fundamental aspect
of any culture – their food. Processing techniques of the bitter cassava are necessary for its
consumption and have been reliably passed down, generation to generation. As a result, so have
some fundamental stories related to creation, spirituality and subsistence. The efficient aspects of
gender specialization have also remained largely intact. The production of food out of bitter
cassava has stayed, for the most part, the work of the women, although men more commonly
help now than they once did. As a consequence of the increased importance of the work of
women through their increased economic productivity, female status within the household is
higher than other Amazonian groups.
Makushi people speak with pride and talk about cassava as “we food” which lies in stark
contrast to the non-Amerindian diet which is rice based. Most Makushi are proud that their diet
differs from those from the coast, as they have done little to endear themselves to those of the
interior. Governmental policies have focused on the acculturation of the Makushi, while at the
same time belittling them for their faults that were imposed by the very same government due to
lack of infrastructure, land rights, and economic opportunities. Although so much has been lost
because of enculturation, missionization, disease, and migration, the ability to process bitter
cassava into edible food and drink products has remained – including the associated tools, crafts,
and stories. In the face of overwhelming cultural change, the fact that this “complex” has
remained fully intact, while all other traditional practices and beliefs are fading, is a testament to
the importance of cassava to the Makushi in terms of group livelihood and identity.

32
32
References
Baldwin, R. (1946), The Rupununi Record, Barbados: The Barbados Advocate Co. Ltd.
Berreman, G.D. (1998), Social, ethnic and sexual differentiation and stratification, Current
Anthropology, 157-82.
Butt Colson, A. and Morton J. (1982), Early Missionary Work among the Taruma and Waiwai
of Southern Guiana: The Visits of Fr. Cuthbert Cary-Elwes, S.J. in 1919, 1922 & 1923.
Folk 24:203-61
Conselho Indigena de Roraima. (1993), Raposa Serra do Sol: os Indios no futuro de Roraima.
Boa Vista, Roraima, Brazil: Conselho Indigena de Roraima.
Colchester, M., Rose, J.L. and James, K. (2002), Mining and Amerindians in Guyana, in
Exploring Indigenous Perspective on Consultation and Engagement within the Mining
Sector in Latin America and the Caribbean. The North-South Institute.
Daly, V.T. (1974), The Making of Guyana, New York: Macmillan.
DeFillips, R.A., Maina, S.L., and Crepin, J. (2004), Medicinal Plants of the Guianas (Guyana,
Surinam, and French Guyana).Washington D.C.: Smithsonian Institution.
de Oliveira, A.E. (1994), The evidence for the nature of the process of indigenous deculturation
and destabilization in the Brazilian Amazon in the last three hundred years: preliminary
data, in A. Roosevelt (ed), Amazonian Indians from prehistory to present, Tucson :The
University of Arizona Press, pp. 95-119.
Elias, M., Rival, L., and McKey, D. (2000), Perception and management of cassava (Manihot
esculenta, Crantz) diversity among Makushi Amerindians of Guyana (South America),
Journal of Ethnobiology, 20(2): 239-65.
Evans, C. and Meggers, B.J. (1960), Archaeological investigations in British Guiana.
Washington D.C.: Government Publishing Office.
Forte, J. (1996a), Thinking about Amerindians, Georgetown: Janette Forte.
Forte, J. (1996b), About Guyanese Amerindians, Georgetown : Janette Forte.
Forte, J. (1996c), Makusipe Komanto Iseru: Sustaining Makushi way of Life, Georgetown: North
Rupununi District Development Board.
Gillian, J. (1963), Tribes of the Guianas and the Left Amazon Tributaries, in J.H. Steward (ed),
Handbook of South American Indians, Vol. 3 The Tropical Forest Tribes, New York:
Cooper Square Publishers, Inc., pp. 799-860.
Hemming, J. (1994), Indians, cattle and settlers: the growth of Roraima, In J. Hemming (ed),
Settlement and Change in Brazilian Roraima, New York: Routeledge, pp. 39-67.
Henfry, T.B. (2002), Ethnoecology, Resource Use, Conservation And
Development In A Wapishana Community In the South Rupununi, Guyana. PhD thesis,
University of Kent at Canterbury.
Jacobs, M.D. (2009), White Mother to a Dark Race, Lincoln: University of Nebraska Press.
Jones, C. R. (1952), Report of a Medical Survey of Amerindians in British Guiana, 1949-1951.
Colonial Development and Welfare-Scheme D 36.
Lea, D.A.M. 1968. A socio-demographic analysis of St. Ignatius-Kumu, Rupununi District.
McGill University Savannah Research Project, Savannah Research Series no. 10.
Lowe-McConnel, R.H. (2000), Land of waters: explorations in the natural history of Guyana,
South America, Sussex: The Book Guild.
Myers, I. (1993), The Makushi of the Guiana-Brazilian Frontier in 1944: A study of culture
contact, Antropologica, 80: 3-99.
Palacio, J.O. (1995), Aboriginal peoples - their struggle with cultural identity in the Caricom

33
33
Region, Bulletin of Eastern Caribbean Affairs, 20(4): 25-40.
Renvoize, B.S. (1972), The area of origin of Manihot esculenta as a crop plant – a review of the
evidence, Economic Botany, 26: 352-360.
Ricardo, C.A. (1996), Povo indegenas no Brazil: 1991-1995, Sao Paulo: Instituto
Socioambiental.
Riviere, P. (1963), An ethnographic survey of the Indians on the divide of the Guianese and
Amazon river systems, PhD thesis, Oxford: University of Oxford.
Riviere, P. (1984), Individual and Society in Guiana: A Comparative Study of Amerindian Social
Organisation, Cambridge: Cambrige University Press.
Roth, W.E. (1915), An Inquiry into the Animism and Folklore of the Guiana Indians,
Washington: 30th
Annual Report of the Bureau of American Ethnology, pp. 103-386.
Rowland, E.D. (1892), The census of British Guiana, Timehri, 6, 40-68.
Schomburgk, R.H. (1840), A Description of British Guiana, Geographical and Statistical:
Exhibiting its Resources and Capabilities, together with the present and future condition
and prospects of the colony, London: Simpkin, Marshall and Co.
Vereecke, J. (1994) National report on indigenous peoples and development. UNPD – Guyana,
Georgetown.
Waterton, C. (1825), Wanderings in South America, London: J.M. Dent and Sons Ltd.
Whitehead, N.L. (1994), The ancient Amerindian politics of the Amazon, the Orinoco, and the
Atlantic Coast: a preliminary analysis of their passage from antiquity to extinction, in A.
Roosevelt (ed), Amazonian Indians from prehistory to present, Tucson: The University of
Arizona Press, pp. 33-54.
Wilson, D.J. (1999), Indigenous South Americans of the past and present: an ecological
perspective, Oxford: Westview Press.

34
34
Chapter 2
Sex Ratio Effects on Reproductive Strategies
Ryan Schacht
Anthropology
University of California, Davis

35
35
Introduction
Recent advances in the evolutionary analysis of reproductive strategies suggest that the
adult sex ratio (ASR; Fromhage, et al. 2005; Kokko and Jennions 2008; McNamara, et al. 2000),
together with certainty of parentage (Houston and McNamara 2002; Queller 1997) and
intrasexual variability in quality (Wade and Shuster 2002) are key to generating predictions of
sex-differentiated mating and reproductive behavior. Here we explore how these current
formulations of sexual selection theory can shed light on the diversity of human sex roles. More
specifically, we use natural variation in ASR among different communities in an indigenous
Amerindian population in Guyana to explore how one particular aspect of human reproductive
effort, investment in mating (a key aspect of reproductive strategy insofar as effort invested in
mating trades off directly with parental effort (Low 1978; Magrath and Elgar 1997; but see
Stiver and Alonzo 2009), reflects an environmental gradient in the relative abundance of males
and females.
Darwin made a famous distinction between men’s and women's mating strategies,
between choosy, coy females and ardent, promiscuous males (Hrdy 1997). Bateman's support of
these ideas with his fruit fly experiments became central to sexual selection theory (Bateman
1948; Klug, et al. 2010; Krakauer, et al. 2011; but see Sutherland 1985) and Trivers’ attribution
of sex roles to sex differences in parental investment (PI; Trivers 1972); strongly shaped the
study of animal breeding systems (e.g., Clutton-Brock and Vincent 1991) as well as influential
work in the evolutionary social sciences (e.g., Buss 1988; Gangestad and Simpson 2000; Hawkes
1991). Yet, as also anticipated by Trivers (Trivers 1972), empirical studies of both nonhumans
and humans reveal extraordinary flexibility in mating and investment behavior, both within and

36
36
between the sexes. Reproductive strategies are clearly not an invariant, species-specific
characteristic, but rather facultative responses to individual- and population-level social and
ecological circumstances (e.g., Nettle 2009; Owens and Thompson 1994), under these
circumstances, conditional mating strategies will be optimal (Gangestad and Simpson 2000;
Nettle, et al. 2011).
Social scientists should welcome this attention to variable sex roles in so far as cross-
cultural variability in human reproductive and mating behavior seems to be the rule rather than
exception (Brown, et al. 2009). For example, across the ethnographic record, human societies
can range from polyandrous to polygynous mating patterns (Murdock 1981), same-sex marriage
can be institutionalized as with woman-to-woman unions in East Africa (Oboler 1980) and men
can spend considerable amounts of time and effort in beautifying themselves as in West Africa
(Masquelier 2002). As in nonhumans (Clutton-Brock 2007), patterns of sexual selection on men
and women can be highly variable (Borgerhoff Mulder 2009; Brown, et al. 2009; Scelza 2011).
Until recently, the study of sex-differentiated reproductive behavior has relied on the
long-standing model of sexual selection developed by Trivers (Trivers 1972). This model links
sex roles directly to the differential investment in young by males and females. In its simplest
form, this model posits that because males invest less initially (in sperm) they have a higher
potential reproductive rate (PRR; Clutton-Brock and Parker 1992) and benefit more from mating
multiply than do females. As a consequence, selection typically would favor mate-seeking and
competitive behavior in males, and heavy investment in parental care in females. In an extension
of this model, Emlen and Oring (Emlen and Oring 1977) claim that as the number of available
males to available females rises (an increasing operational sex ratio, OSR), so does competition
among males over the few available females. Predictions based on OSR have been used in many

37
37
studies of human mating systems to predict more violent and competitive male behavior when
males are in abundance (reviewed in Schacht, et al. 2014).
To explore variability in sex roles, we turn to a newer approach within sexual selection
theory in which patterns of care and competition coevolve, through evolutionary feedbacks, with
the sex- specific intensity of sexual selection (Kokko et al. 2012). A key feature of this approach
is the game theoretical approach it takes (Kokko and Jennions 2008) to modeling the sex-
structured payoffs to reproductive behavior according to the relative scarcity of the sexes (e.g.,
Fromhage, et al. 2005). While certainty of parenthood (Houston and McNamara 2002) and
variability in quality (Wade and Shuster 2002) play a role in structuring sex differences in
reproductive effort, a key claim of the newer approach is that that for males, under most
conditions, the profitability of investment in mating effort increases when there are more, not
fewer, mating opportunities available. Those males that pursue a mating effort intensive strategy
when mates are rare may find themselves spending longer periods in between reproductive
events than if they were to stay with their initial partner and provide parental care (Kokko and
Jennions 2008). Thus, when men are in abundance and surrounded by competitors, they should
reduce not increase mating effort (Lehtonen and Kokko 2012). In species with female choice of
mates, they should alter their behavior to match that which is desired by females and therefore
offer more, not less, parental investment. Note that this is a prediction more in line with mating
market models which take a frequency-dependent approach to sex roles (Guttentag and Secord
1983; Mayr 1939; Noe and Hammerstein 1994). It depends on the dynamics of evolutionary
feedbacks between scarcity, sex-structured payoffs to mating strategies, time spent in providing
parental care, and the mortality associated with parental care and mating competition.

38
38
In the behavioral ecology of other species, both empirical work (Gwynne 1984; Liker, et
al. 2013; Mills and Reynolds 2003) and modeling (Gowaty and Hubbell 2005; Hubbell and
Johnson 1987; Kokko, et al. 2006; Kokko and Monaghan 2001) have demonstrated the
importance of scarcity (Noe and Hammerstein 1994) of one sex in relation to the other. For
example, in soapberry bugs (Jadera haematoloma) Carroll and Corneli (Carroll and Corneli
1995) find that male behavior responds facultatively to the availability of females; when males
are in abundance and females in demand, males practice mate guarding as a means to ensure
paternity certainty rather than seeking multiple mates through intrasexual competition. Similarly,
Liker, Freckelton and Szekely (Liker, et al. 2013) recently showed that in shorebirds with male-
biased ASRs, female–female competition and male paternal care (and even polyandry) are
present, as in the jacanas (Jacanidae) and greater painted-snipe (Rostratula benghalensis).
Whereas species with polygyny, such as the ruff (Philomachus pugnax), have female-biased
ASRs. More generally, across animal taxa, monogamy is associated with male-biased sex ratios
and low variance in male reproductive success, whereas polygyny is associated with low sex
ratios and high variance in male reproductive success (Kokko and Jennions 2008).
Here we explore how investment in mating effort differs between the sexes in a human
population. We test two models. The first (Model 1) tests the hypothesis that men should
consistently invest more in mating effort than women due to their higher PRR and greater
benefits they receive from pursuing multiple mates [H1]. Following Trivers (Trivers 1972), it is
argued that higher mating effort in men than women “should be consistently observed across
cultures, in part because of the fundamental differences in evolved reproductive strategies of men
and women (Schmitt 2005, p.249).” Furthermore, according to this line of thinking (following
Emlen and Oring 1977) males should invest more in mating effort when they outnumber females

39
39
in the mating pool. We use the second model (Model 2), which includes terms for sex, ASR and
their interaction, to test the more specific prediction that the differences between the sexes in
their reproductive strategies are conditioned on the availability of partners, or market principles
of supply and demand; males and females are both expected to invest more in mating effort when
scarce because members of the rarer sex have more potential partners to mate with (Liker, et al.
2014).
To test these models we capitalize on natural variation in ASR within a single ethnic
group, the Makushi of Guyana living in the Rupununi Savannah (Fig. 1), where the relative
numbers of men and women in a village (Table 1) depends on variable patterns of outmigration
for employment opportunities. The principle drivers of outmigration for men are mining, cattle
ranching, agricultural work and logging, activities which occur mainly in more remote areas of
the Rupununi or in the forested regions at the centre of the country, whereas women are attracted
to urban areas (such as the capital of Roraima in neighboring Brazil) and the larger interior
Guyanese towns (such as Lethem) in search of shop and domestic work (Gafar 2004). Marriage
among the Makushi is endogamous, with mates usually selected from within the village
community. Thus community ASR strongly structures marital options. Marriage is also
monogamous. Prior to marriage a man must perform bride service, typically garden labor and
fishing, for the household of his prospective bride’s parents. After marriage residence is
matrilocal in close proximity to bride’s family (Myers 1993).
We focus on investment in mating effort, which we measure using the Sociosexual
Orientation Inventory (SOI; Simpson and Gangestad 1991; Simpson and Gangestad 1989). The
SOI is a tool that been shown in previous work (e.g., Campbell, et al. 2009; Gangestad and
Thornhill 2008; Simpson and Gangestad 1991) to be a reliable indicator of individual allocation

40
40
of effort to mating as opposed to parental care. Individuals who score high on the SOI scale
(termed “less restricted”) evince a reproductive strategy of multiple short-term relationships and
low parental investment; those scoring low on the SOI scale (“more restricted”) prefer longer-
term relationships with higher parental investment (Barta and Kiene 2005; Gangestad and
Thornhill 1999; Seal and Agostinelli 1994). We explore how an individual’s sex (Model 1), and
the ASR of his or her community (Model 2), contributes to an understanding of the reproductive
strategies of men and women among the Makushi as measured by SOI. In so doing we make the
first explicit evaluation of the theoretical perspective for gender variability in reproductive
strategies among humans.
Results
Our sample of eight rural communities in the Rupununi region of Guyana exhibited a
wide range in ASR values (.9 – 1.4; see Table 1), resulting from spatially heterogeneous
employment opportunities for men and women. We first test the hypothesis that men have a less
restricted sociosexuality than women (Model 1). Our statistical model includes a fixed effect for
sex and a random effect for community, and is constructed to assess the evidence for consistent
sex differences in reproductive strategy as measured by SOI score. The fixed effect measures a
stable contrast between males and females and the random effect allows for community-to-
community heterogeneity in SOI scores, as dictated by the multilevel structure of the dataset (see
Methods). Analysis of this model finds that men generally have higher SOI scores (are less
restricted) across communities, indicating that in general Makushi men show a greater
willingness to engage in uncommitted sex than do women. This provides initial support for
Model 1 (Fig. 2a).

41
41
Our second model incorporates community level ASR (Model 2). It entails the
expectation that when one sex is in oversupply, variations in male and female reproductive
strategies will respond as expected by market principles of supply and demand. Specifically we
predict that when men are in short supply (low ASR) they can be more demanding, that is they
will have a less restricted sociosexuality than when they are in oversupply (high ASR).
Conversely when women are in oversupply (low ASR) they will be more restricted in their
sociosexuality than women at high ASR. The statistical model includes as a predictor the
community-level ASR, as well as the interaction of ASR and sex. We include this interaction to
allow the relationship between SOI scores and ASR to be different for men and women.
Analysis of this model shows diversity in SOI scores across ASR. When there are fewer
men (low ASR), men’s SOI scores are not only higher than women’s, but are also higher than
those of men living in communities where men are relatively abundant (Fig. 2b). Men show
higher SOI scores when they are in the minority, as predicted by Model 2. For women there is no
effect of ASR on SOI (Table 2). In short, men appear to increase their willingness to engage in
uncommitted sex in response to a surfeit of women, and to become less keen to engage in
uncommitted sex when men are abundant; women by contrast appear indifferent to changes in
the ASR. It is notable that at high ASR, male and female SOI scores are indistinguishable.
Adding ASR (Model 2) greatly improves our understanding of the diversity in SOI scores
across the 8 communities over the model which only includes sex (Model 1). The AIC model
score is lowered by 10 (Table 2). To counter the possibility that the ASR effect is confounded by
relationship status, with the large number of single men in high ASR communities unable to find
partners and thus disproportionately influencing community SOI scores, we added relationship
status as a main effect to both models (we term these Model 1+ and Model 2+). As might be
42
42
expected, single individuals have higher SOI scores than those that are partnered; nevertheless
the association of sociosexuality with community ASR and sex remains, and the relative
evidence for Model 2+ is much stronger than for Model 1+ (lowered by an AIC difference of 13;
Table 3).
Discussion
Our findings show, among the Makushi, the mating and investment behavior of men
varies in predictable ways with the adult sex ratio. In particular we demonstrate that at high sex
ratios when men are in abundance, men’s and women’s willingness to engage in uncommitted
sex are indistinguishable and that when men are in the minority they are more inclined towards
indiscriminate mating than when in the majority. This is not to conclude that sex differences are
not important in Makushi reproductive strategies, after all a term for sex is maintained in the best
fit model, but to highlight the fact that the reproductive strategies of men are strongly affected by
the ASR. Here we discuss (1) the implications of this approach for the evolutionary study of
gender, (2) the relationship of our work with previous work, (3) the importance of studying
within-population variation, (4) the issue of time scales, and (5) outstanding questions.
First, with respect to implications for the evolutionary study of gender, our findings reject
simplistic labeling of reproductive roles by gender based on inherent sex differences in parental
investment. In this respect, contemporary evolutionary anthropology is advanced well beyond
the view expressed by Darwin and interpretations based on Bateman (Bateman 1948; Trivers
1972). Our results challenge sexual stereotyping that can arise from models inappropriately
linking men’s and women’s reproductive strategies to the constraints of parental care (Eagly and

43
43
Wood 1999; Gowaty 1997; Hrdy 1997). We advance these concerns by bringing a rigorous
theoretical model predicated on coevolutionary dynamics to the study of reproductive strategy.
Second, previous evolutionary analyses of human sexual strategies have acknowledged
the existence of variability in reproductive strategies (Gangestad and Simpson 2000; Schmitt
2005; Tovee, et al. 2006). In some cases they have attributed inter- or intra-population variability
in mating effort to exogenous variables such as pathogen prevalence (Penton-Voak, et al. 2004).
For example, in a study of men’s and women’s preferences when exposed to indicators of
pathogens, both genders were more concerned with attractiveness and symmetry in high disease
rather than low disease conditions. They appear to use attractiveness as an indicator of
underlying health and immune functioning (Little, et al. 2010). In other cases investigators
attribute intrasexual variation in mating strategies to “strategic pluralism”(Gangestad and
Simpson 2000), providing often innovative arguments about how multiple factors, including
relationship length, individual quality variation and social context affect the optimal reproductive
strategies for men and women.
Where such evolutionary studies have considered sex ratio, they nevertheless assume that
sex ratios will impact mating strategies as proposed in older models (Emlen and Oring 1977),
namely that men will invest more in mating effort when they are more numerous than women. In
this way they ignore the dynamics that emerge when sex ratios, sex-structured pay-offs to mating
strategies, time spent in parental care and sex-biased mortality differentials coevolve. For
example, Henrich, Boyd and Richerson (Henrich, et al. 2012) argue that when men are in
abundance they will invest more in indiscriminate competition over mates and provide less
parental care than when they are scarce. In an ancillary prediction they suggest that levels of

44
44
violence increase cross-culturally as sex ratios rise, although this claim finds little support in the
published literature (Schacht, et al. 2014).
Economists, demographers and sociologists, less familiar with the parental investment
models that have dominated evolutionary social science for so long, have found results consistent
with those reported here. Indeed the relative abundance of men and women influences various
other aspects of behavior (Becker 1981; Guttentag and Secord 1983; Pedersen 1991). For
example, marriage and marital fertility rates are higher when men are abundant but when the sex
ratio is low marriage incidence declines, female-headed households increase, and nonmarital
fertility rates increase as men pursue concurrent relationships (Lane, et al. 2004). Additional
evidence comes from the ethnographic record where an association of polygyny with low human
sex ratios was identified over 40 years ago (Ember 1974). These findings lend support to the
theoretical model (Model 2) explored here.
Third, a major methodological advance of our work over much of the earlier work on
gender variability is its focus on within-population variation. While between-population
comparisons are immensely valuable for flagging interesting lines of investigation(Nettle 2009),
they are typically marred by confounding factors such as religion, levels of economic
development, political ideologies, legally observed marriage rules, and disease levels, all of
which might affect sex-specific mating strategies. Our work, in contrast, places the evolutionary
analysis of sex-role variability firmly in an ethnographic and cultural context, and finds little
support for consistent differences in SOI scores between men and women across communities
within a single cultural group. We maintain that looking at individual variability, where selection
on phenotypic flexibility in mating and parental behavior most likely takes place, is more

45
45
persuasive than between-population comparisons, given the danger of committing an ecological
fallacy (Robinson 1950).
Furthermore, by conducting our study within a single ethnic group we provide some
control for additional unmeasured and potentially confounding factors. This is particularly
important in that we know that ASR is likely to shape sex differences in mating effort in
conjunction with other factors, such as levels of paternity certainty, sex differences in the extent
of parental care, and variation in quality across males and females that might reliably indicate
future mating success.
Fourth, the ASR model that we test here derives from a model (Kokko and Jennions
2008) in which sex ratios influence the reproductive strategies of males and females as a result of
feedbacks over evolutionary time, subject ultimately to Fisherian equilibrium. However, our
study focuses on plasticity over an ecological time scale, and more specifically among
communities that vary in ASR as a result of differential outmigration over a generation or less.
Given the pronounced variability in human reproductive strategies, we maintain that
evolutionary predictions are valid on shorter time scale if the behaviors of interest are
sufficiently facultative and the independent variables sufficiently varied, although for the most
part the accuracy of predictions made over different time scales has been given insufficient
attention(Cant 2012). We both demonstrate plasticity in human sex roles and suggest that this
plasticity is adaptive with respect to community adult sex ratios.
Finally, we turn to outstanding questions. First, we do not know which cues in the
environment individual Makushi are responding to – do they gauge community sex ratios
directly or are there other more salient social cues (Bereczkei and Dunbar 1997; Lummaa, et al.

46
46
1998; Watkins, et al. 2012)? Second, why do women show no effect? Do women here benefit
less from increasing mating effort in response to ASR than men? Are women instead remaining
restricted in their sociosexuality to signal paternity certainty as a strategy to receive more
paternal care? Recent evidence from birds suggests that this is possible (Liker, et al. 2014). Or
are women responding in other ways, such as varying the traits they use to select partners?
Finally, does culturally transmitted information condition the appropriate responses of women
more so than of men, such that women’s options are more constrained? The answers to these
questions, either in general or specifically for the Makushi, are still unknown, but continued
attention to developments in evolutionary theory will help provide insights into the
environmental and/or culturally transmitted cues with which this variation is associated.
Conclusion
We show first that when men outnumber women (high ASR), men’s and women’s
willingness to engage in uncommitted sex are indistinguishable, a result challenging some
persistent views on sexual behavior. We also find that when men are in the minority (low ASR)
they are more willing to engage in uncommitted sex (less restricted sexual behavior) than when
they are numerous. As men become more abundant, they appear to reduce their mating effort and
modify their behavior to the desires of the limiting sex in response to the mating market and their
place within it. This finding highlights an important point often overlooked in studies of sex
differences. Because women pay higher reproductive costs (through gestation and lactation) it is
argued that they are less likely to desert a mate or be interested in concurrent relationships. What
is unrecognized is that males may also face steep reproductive costs that can constrain their
willingness to pursue additional mates. When the pool of males is large, finding a female partner
can be difficult such that existing partners become a valued resource. Thus the frequency-

47
47
dependent nature of optimal behavior can, as shown here, have a major impact on sex-
differentiated reproductive strategies.
Methods
Population
The Makushi inhabit the Rupununi savannas of south-western Guyana, Region 9 (Fig. 1).
Living along the border with Brazil, this ethnic group shares cultural traits with other groups
from the Xingu basin. They include shifting cultivation, a focus on bitter cassava, matrilocal
marriage, the performance of bride service before marriage and fairly egalitarian gender
relationships (Schacht 2013). Whereas premarital sex is not disapproved of, and is an expected
avenue to secure a partner (Myers 1993), the Makushi generally marry monogamously and
extended families typically share one residential area (Forte 1996). Makushi marriages are
endogamous, with mates are usually selected from within the village community (Myers 1993).
As elsewhere in Guyana, differential migration affects family dynamics, and has led to
considerable between community variation in ASR, as men and women search for economic
opportunities.
Such migration strongly affects the availability of potential mates for endogamous
marriage but men are still expected to perform bride-service in order to marry. This traditionaly
involved a year of service by the prospective husband in which he cleared and farmed fields for
his in-laws while building a new dwelling nearby for himself and his wife. Men and women
typically marry only once or twice, and conventions are similar across all marriages, with men
providing bride service and thereafter bearing considerable responsibility to provide for their
wives and children (including stepchildren who are valuable helpers) through farming, fishing
48
48
and various forms of wage labor (Myers 1993). At divorce, children remain largely the
responsibility of the mother and her family, although they are provided for by a stepfather if she
remarries.
Assessment of mating effort
Although sexual mores in most populations within Guyana, including Amerindian
communities, are generally relaxed, direct quantitative measures of mating effort are potentially
difficult to obtain. Accordingly we used the Sociosexual Orientation Inventory (SOI). The SOI is
a 7-question instrument with proven reliability and validity (Simpson and Gangestad 1991;
Simpson and Gangestad 1989). It assesses sexual preferences and behavior. In previous
work(e.g.Campbell, et al. 2009; Gangestad and Thornhill 2008; Simpson and Gangestad 1991),
the SOI has been shown to be an indicator of indiscriminate mating, low parental care and high
mating effort. Individuals who score high on this instrument are more willing to engage in
uncommitted sex (unrestricted sociosexuality) and those who score low are less willing
(restricted sociosexuality)(Simpson and Gangestad 1991). Previous studies have confirmed that
the SOI is a predictor of individual mating strategies - with those scoring high being more
interested in short-term relationships (a mating-effort intensive strategy) and those scoring low
more interested in long-term relationships(Barta and Kiene 2005; Gangestad and Thornhill 1999;
Seal and Agostinelli 1994).
We used ethnographic and demographic methods to conduct a full census of 8 villages in
order to determine the ASR (Table 1). We then administered the SOI to a randomly sampled
minimum of 30 individuals (15 men and 15 women), aged between 18 and 45 years, from each
village (see Table 1). Questions of a sensitive nature are found within the SOI and this has the

49
49
potential to generate a response bias. In order to counter such bias we took three steps: a) a long
(16 month) period of fieldwork during which community rapport could be built within each of
the villages, b) gender-matched interviewers and interviewees and c) the use of a nonverbal
response card method(Lindstrom, et al. 2010) to ensure the privacy of the interviewee’s
response, even from the interviewer.
Statistical approach
We fit Gaussian models after applying a log transformation to the response SOI score and
predictor ASR. The log transformation is variance-stabilizing for SOI, and the quantile-quantile
plot for logSOI is consistent with a Gaussian distribution. A corresponding log transformation
for the predictor ASR produced compatible scalings in the 2-dimensional scatter plot (Fig. 2b).
Because the data set is structured with individuals nested within communities that differ in ASR,
we use multilevel modeling (Gelman and Hill 2007). Our model-fitting approach employs the
Akaike information criterion (AIC; Akaike 1981) to summarize the support for a given
hypothesis by evaluating the relative evidence in favor of a corresponding model fitted to the
data (Model 1, Model 2, or some combination; see Towner and Luttbeg 2007 for a discussion on
how to draw inferences from data in evaluating hypotheses). The AIC measures a goodness-of-fit
versus complexity trade-off for each model, with lower values of AIC indicating better models.
A model with an AIC of 10 or greater than that of the best model under consideration has
essentially no support and may be omitted from further consideration because it fails to explain
substantial variation in the data (Burnham and Anderson 2002).

50
50
Table 1: Descriptive statistics of each community.
Community ASR Men:Women (18-45)
# Men Interviewed
# Women Interviewed
Community Population
A 0.93 125:135 29 29 745
H 1.11 70:63 15 15 415
F 1.13 70:62 15 15 407
E 1.16 87:75 18 19 596
G 1.22 73:60 20 20 432
D 1.33 80:60 19 19 406
B 1.35 27:20 15 15 162
C 1.43 57:40 18 20 310
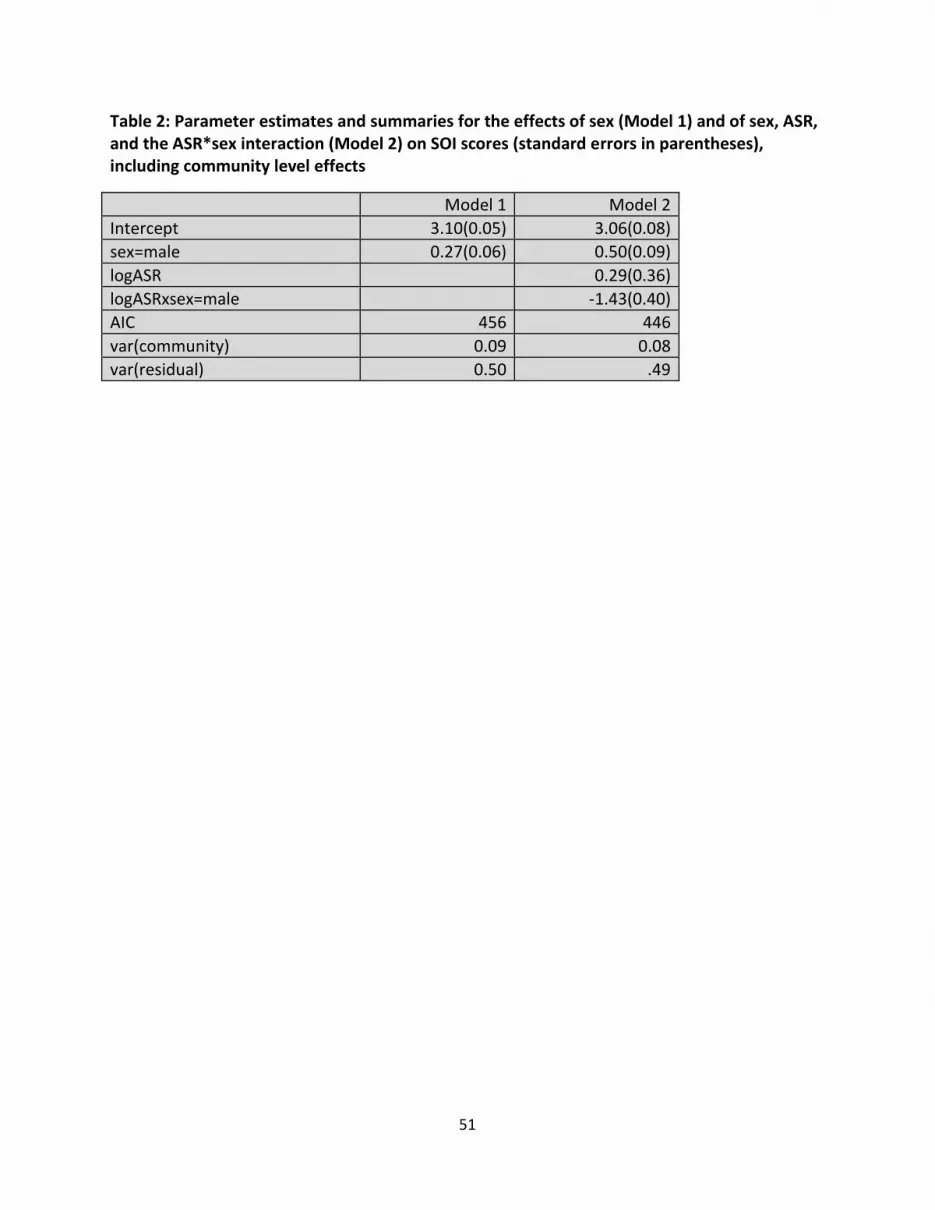
51
51
Table 2: Parameter estimates and summaries for the effects of sex (Model 1) and of sex, ASR, and the ASR*sex interaction (Model 2) on SOI scores (standard errors in parentheses), including community level effects
Model 1 Model 2
Intercept 3.10(0.05) 3.06(0.08)
sex=male 0.27(0.06) 0.50(0.09)
logASR 0.29(0.36)
logASRxsex=male -1.43(0.40)
AIC 456 446
var(community) 0.09 0.08
var(residual) 0.50 .49

52
52
Table 3: Parameter estimates and summaries for the effects of sex and relationship status (Model 1+), and of sex, ASR, the ASR*sex interaction and relationship status (Model 2+) on SOI scores (standard errors in parentheses), including community level effects.
Traditional+ Reformulated+
Intercept 3.06(0.05) 3.00(0.08)
sex=male 0.25(0.06) 0.49(0.08)
logASR 0.42(0.36)
logASRxsex=male -1.52(0.39)
Relationship Status 0.30(0.07) 0.31(0.07)
AIC 445 433
var(community) 0.09 0.09
var(residual) 0.49 0.48

53
53
Figure 1: Map of Guyana and field site locations

54
54
Figure 2: Sociosexual orientation index (SOI) scores by sex and community (Model 1, Fig. 2a) and by sex and community adult sex ratio (Model 2, Fig. 2b).
We use the natural log transformation of SOI scores (logSOI) and ASR (logSOI). Model 1 includes a fixed effect for sex (men as triangles and women as circles) and random effects for community (anonymized letters). Model 2 adds the community level predictor logASR and includes an interaction between sex and logASR. The solid lines (blue and pink) show men’s and women’s population mean SOI scores, respectively. Figure 2a shows that men, on average, have a more unrestricted sociosexuality (high SOI scores) compared to women, while Figure 2b shows that men exhibit greater unrestricted sociosexuality (high SOI scores) compared to women, only where they are in the minority. Shaded areas depict 95% confidence intervals for the population means. AIC scores (see Table 2 for details) suggest that Model 1 has relatively little support in these data compared to Model 2.

55
55
References
Akaike H. 1981. Citation Classic - a New Look at the Statistical-Model Identification. Cc/Eng
Tech Appl Sci(51):22-22.
Barta WD, Kiene SM. 2005. Motivations for infidelity in heterosexual dating couples: The roles
of gender, personality differences, and sociosexual orientation. Journal of Social and
Personal Relationships 22(3):339-360.
Bateman AJ. 1948. Intra-sexual selection in Drosophila. Heredity 2:349-368.
Becker G. 1981. A treatise on family. Cambridge, MA: Harvard University Press.
Bereczkei T, Dunbar RIM. 1997. Female-biased reproductive strategies in a Hungarian Gypsy
population. Proceedings of the Royal Society of London Series B: Biological Sciences
264(1378):17-22.
Borgerhoff Mulder M. 2009. Serial Monogamy as Polygyny or Polyandry? Marriage in the
Tanzanian Pimbwe. Human Nature 20(2):130-150.
Brown GR, Laland KN, Borgerhoff Mulder M. 2009. Bateman's principles and human sex roles.
Trends in Ecology & Evolution 24(6):297-304.
Burnham KP, Anderson DR. 2002. Model Selection and Multimodel Inference: A Practical
Information-Theoretical Approach. New York, NY: Springer-Verlag.
Buss DM. 1988. The evolution of human intrasexual competition: tactics of mate attraction. J
Pers Soc Psychol 54(4):616-628.
Campbell L, Cronk L, Simpson JA, Milroy A, Wilson CL, Dunham B. 2009. The association
between men’s ratings of women as desirable long-term mates and individual differences
in women’s sexual attitudes and behaviors. Personality and Individual Differences
46(4):509-513.
Cant MA. 2012. Cooperative breeding systems. In: Royle N, Smiseth PT, Kölliker M, editors.
The evolution of parental care. Oxford: Oxford University Press. p 206-225.
Carroll SP, Corneli PS. 1995. Divergence in Male Mating Tactics between 2 Populations of the
Soapberry Bug: Genetic Change and the Evolution of a Plastic Reaction Norm in a
Variable Social-Environment. Behav Ecol 6(1):46-56.
Clutton-Brock T. 2007. Sexual Selection in Males and Females. Science 318(5858):1882-1885.
Clutton-Brock TH, Parker GA. 1992. Potential Reproductive Rates and the Operation of Sexual
Selection. The Quarterly Review of Biology 67(4):437-456.
Clutton-Brock TH, Vincent ACJ. 1991. Sexual selection and the potential reproductive rates of
males and females. Nature 351:58-60.
Eagly AH, Wood W. 1999. The origins of sex differences in human behavior - Evolved
dispositions versus social roles. Am Psychol 54(6):408-423.
Ember M. 1974. Warfare, Sex Ratio, and Polygyny. Ethnology 13(2):197-206.
Emlen S, Oring L. 1977. Ecology, sexual selection, and the evolution of mating systems. Science
197(4300):215-223.
Forte JA. 1996. About Guyanese Amerindians. Georgetown, Guyana: J. Forte.
Fromhage L, Elgar MA, Schneider JM. 2005. Faithful without Care: The Evolution of
Monogyny. Evolution 59(7):1400-1405.
Gafar J. 2004. The performance of the labour market in Guyana. Can J Dev Stud 25(4):663-685.
Gangestad SW, Simpson JA. 2000. The evolution of human mating: Trade-offs and strategic
pluralism. Behavioral and Brain Sciences 23(4):573-587.

56
56
Gangestad SW, Thornhill R. 1999. Individual differences in developmental precision and
fluctuating asymmetry: a model and its implications. Journal of Evolutionary Biology
12(2):402-416.
Gangestad SW, Thornhill R. 2008. The evolutionary biology of human female sexuality. New
York, NY: Oxford University Press.
Gelman A, Hill J. 2007. Data Analysis using Regression and Multilevel/Hierarchical Models.
Cambridge: Cambridge University Press.
Gowaty PA, editor. 1997. Feminism and Evolutionary Biology - Boundaries, Intersections and
Frontiers. New York: Springer.
Gowaty PA, Hubbell SP. 2005. Chance, time allocation, and the evolution of adaptively flexible
sex role behavior. Integrative and Comparative Biology 45(5):931-944.
Guttentag M, Secord P. 1983. Too Many Women? Beverly Hills: Sage.
Gwynne DT. 1984. Sexual Selection and Sexual Differences in Mormon Crickets (Orthoptera:
Tettigoniidae, Anabrus simplex). Evolution 38(5):1011-1022.
Hawkes K. 1991. Showing Off - Tests of an Hypothesis About Mens Foraging Goals. Ethol
Sociobiol 12(1):29-54.
Henrich J, Boyd R, Richerson PJ. 2012. The puzzle of monogamous marriage. Philosophical
Transactions of the Royal Society B: Biological Sciences 367(1589):657-669.
Houston AI, McNamara JM. 2002. A self-consistent approach to paternity and parental effort.
Philosophical Transactions of the Royal Society of London Series B-Biological Sciences
357(1419):351-362.
Hrdy SB. 1997. Raising Darwin’s consciousness. Human Nature 8(1):1-49.
Hubbell SP, Johnson LK. 1987. Environmental Variance in Lifetime Mating Success, Mate
Choice, and Sexual Selection. American Naturalist 130(1):91-112.
Klug H, Heuschele J, Jennions MD, Kokko H. 2010. The mismeasurement of sexual selection.
Journal of Evolutionary Biology 23(3):447-462.
Kokko H, Jennions MD. 2008. Parental investment, sexual selection and sex ratios. Journal of
Evolutionary Biology 21(4):919-948.
Kokko H, Jennions MD, Brooks R. 2006. Unifying and testing models of sexual selection. Annu
Rev Ecol Evol S 37:43-66.
Kokko H, Klug H, Jennions MD. 2012. Unifying cornerstones of sexual selection: operational
sex ratio, Bateman gradient and the scope for competitive investment. Ecol Lett
15(11):1340-1351.
Kokko H, Monaghan P. 2001. Predicting the direction of sexual selection. Ecol Lett 4(2):159-
165.
Krakauer AH, Webster MS, Duval EH, Jones AG, Shuster SM. 2011. The opportunity for sexual
selection: not mismeasured, just misunderstood. Journal of Evolutionary Biology
24(9):2064-2071.
Lane SD, Rubinstein RA, Keefe RH, Webster N, Cibula DA, Rosenthal A, Dowdell J. 2004.
Structural violence and racial disparity in HIV transmission. J Health Care Poor U
15(3):319-335.
Lehtonen J, Kokko H. 2012. Positive feedback and alternative stable states in inbreeding,
cooperation, sex roles and other evolutionary processes. Philos T R Soc B
367(1586):211-221.
Liker A, Freckleton RP, Szekely T. 2013. The evolution of sex roles in birds is related to adult
sex ratio. Nat Commun 4:1587.

57
57
Liker A, Freckleton Robert P, Székely T. 2014. Divorce and Infidelity Are Associated with
Skewed Adult Sex Ratios in Birds. Curr Biol 24(8):880-884.
Lindstrom DP, Belachew T, Hadley C, Hattori MK, Hogan D, Tessema F. 2010. Nonmarital sex
and condom knowledge among Ethiopian young people: improved estimates using a
nonverbal response card. Studies in Family Planning 41(4):251-262.
Little AC, DeBruine LM, Jones BC. 2010. Exposure to visual cues of pathogen contagion
changes preferences for masculinity and symmetry in opposite-sex faces. Proceedings of
the Royal Society B: Biological Sciences.
Low BS. 1978. Environmental Uncertainty and the Parental Strategies of Marsupials and
Placentals. The American Naturalist 112(983):197-213.
Lummaa V, Merila J, Kause A. 1998. Adaptive sex ratio variation in pre-industrial human
(Homo sapiens) populations? P Roy Soc B-Biol Sci 265(1396):563-568.
Magrath MJL, Elgar MA. 1997. Paternal care declines with increased opportunity for extra–pair
matings in fairy martins. Proceedings of the Royal Society of London Series B:
Biological Sciences 264(1389):1731-1736.
Masquelier A. 2002. Nomads who cultivate beauty: Wo'daa'be dances and visual arts. Int J Afr
Hist Stud 35(1):157-159.
Mayr E. 1939. The Sex Ratio in Wild Birds. The American Naturalist 73(745):156-179.
McNamara JM, SzÉKely T, Webb JN, Houston AI. 2000. A Dynamic Game-theoretic Model of
Parental Care. Journal of Theoretical Biology 205(4):605-623.
Mills S, Reynolds J. 2003. Operational sex ratio and alternative reproductive behaviours in the
European bitterling, Rhodeus sericeus. Behav Ecol Sociobiol 54(2):98-104.
Murdock GP. 1981. Atlas of World Cultures. Pittsburgh: The University of Pittsburgh Press.
Myers I. 1993. The Makushi of the Guiana-Brazilian Frontier in 1944: A study of culture
contact. Antropologica 80:3-99.
Nettle D. 2009. Ecological influences on human behavioural diversity: a review of recent
findings. Trends in Ecology & Evolution 24(11):618-624.
Nettle D, Coall DA, Dickins TE. 2011. Early-life conditions and age at first pregnancy in British
women. P Roy Soc B-Biol Sci 278(1712):1721-1727.
Noe R, Hammerstein P. 1994. Biological Markets - Supply-and-Demand Determine the Effect of
Partner Choice in Cooperation, Mutualism and Mating. Behav Ecol Sociobiol 35(1):1-11.
Oboler RS. 1980. Is the Female Husband a Man? Woman/Woman Marriage among the Nandi of
Kenya. Ethnology 19(1):69-88.
Owens IPF, Thompson DBA. 1994. Sex Differences, Sex Ratios and Sex Roles. Proceedings:
Biological Sciences 258(1352):93-99.
Pedersen F. 1991. Secular trends in human sex ratios. Human Nature 2(3):271-291.
Penton-Voak IS, Jacobson A, Trivers R. 2004. Populational differences in attractiveness
judgements of male and female faces: Comparing British and Jamaican samples.
Evolution and Human Behavior 25(6):355-370.
Queller DC. 1997. Why do females care more than males? Proceedings of the Royal Society of
London Series B: Biological Sciences 264(1388):1555-1557.
Robinson WS. 1950. Ecological Correlations and the Behavior of Individuals. Am Sociol Rev
15(3):351-357.
Scelza BA. 2011. Female choice and extra-pair paternity in a traditional human population. Biol
Lett 7(6):889-891.

58
58
Schacht R. 2013. Cassava and the Makushi: A Shared History of Resiliency and Transformation.
In: Garth H, editor. Food and Identity in the Caribbean. London: Berg Publishers. p 15-
29.
Schacht R, Rauch KL, Borgerhoff Mulder M. 2014. Too many men: the violence problem?
Trends in Ecology & Evolution 29(4):214-222.
Schmitt DP. 2005. Sociosexuality from Argentina to Zimbabwe: A 48-nation study of sex,
culture, and strategies of human mating. Behavioral and Brain Sciences 28(2):247-311.
Seal DW, Agostinelli G. 1994. Individual-Differences Associated with High-Risk Sexual-
Behavior - Implications for Intervention Programs. Aids Care-Psychological and Socio-
Medical Aspects of Aids/Hiv 6(4):393-397.
Simpson J, Gangestad S. 1989. Two month test-retest reliability of the Sociosexual Orientation
Inventory. Texas A&M University.
Simpson JA, Gangestad SW. 1991. Individual differences in sociosexuality: evidence for
convergent and discriminant validity. Journal of Personality and Social Psychology
60(6):870-883.
Stiver KA, Alonzo SH. 2009. Parental and Mating Effort: Is There Necessarily a Trade-Off?
Ethology 115(12):1101-1126.
Sutherland WJ. 1985. Chance can produce a sex difference in variance in mating success and
explain Bateman's data. Animal Behaviour 33(4):1349-1352.
Tovee MJ, Swami V, Furnham A, Mangalparsad R. 2006. Changing perceptions of attractiveness
as observers are exposed to a different culture. Evolution and Human Behavior
27(6):443-456.
Towner MC, Luttbeg B. 2007. Alternative statistical approaches to the use of data as evidence
for hypotheses in human behavioral ecology. Evolutionary Anthropology 16(3):107-118.
Trivers RL. 1972. Parental investment and sexual selection. In: Campbell B, editor. Sexual
selection and the Descent of Man, 1871-1971. Chicago: Aldine. p 136-179.
Wade MJ, Shuster SM. 2002. The evolution of parental care in the context of sexual selection: A
critical reassessment of parental investment theory. American Naturalist 160(3):285-292.
Watkins CD, Jones BC, Little AC, DeBruine LM, Feinberg DR. 2012. Cues to the sex ratio of
the local population influence women's preferences for facial symmetry. Animal
Behaviour 83(2):545-553.

59
59
Chapter 3
Partner choice decision making and the integration of multiple cues
Ryan Schacht
Anthropology
University of California, Davis

60
60
Introduction
In sexually reproducing species the choice of a mate is key to fitness (Andersson, 1994;
Bateson, 1983). Research on mate choice has primarily focused on identifying preferred traits
insofar as these serve as signals of the potential benefits a mate may offer (reviewed in
Andersson, 1994), be they direct (e.g., parental investment) or indirect (e.g.,
immunocompetence). Far from involving simple decisions, selection of a mate likely requires
paying attention to multiple, potentially competing, signals. It is an open question how
individuals utilize this information, from multiple cues, to make an adaptive mate choice
decision. In general, signals are thought be organized in one of two ways: 1) as a collection of
relevant traits in which each reflects a single property of an individual that can arranged as a
prioritized list (reviewed in Candolin, 2003) or 2) as integrated suites of interrelated characters
(i.e., it is not simply about the individual traits themselves, but instead their relationship; e.g
Jennions & Petrie, 1997). Patterns of choice within these approaches generally rely on the long-
standing model of sexual selection which links differential investment to sex-differences in
optimal mating rates (Trivers, 1972). A newer approach pays attention to evolutionary feedbacks
that can strongly influence the sex roles and subsequent patterns of sex differentiated behavior
(Hanna Kokko & Jennions, 2008). In this paper we will explore mate choice decision making by
testing the relative empirical support for these two approaches (prioritized vs. integrated traits) as
a function of sex and population-level parameters.
Why multiple cues?
The emphasis, historically, within the study of mate choice was on the experimental
manipulation of a single cue in homogenous environments (reviewed in Gerhardt, 1992). This

61
61
work, while usefully highlighting the traits which could serve as cues in mate choice, poorly
reflected actual animal displays that consisted of multiple cues (e.g., Dale & Slagsvold, 1996;
Hill, Enstrom, Ketterson, Nolan, & Ziegenfus, 1999; Kodric-Brown & Nicoletto, 2001).
Additionally, studies revealed that individual reproductive decisions change by age, condition,
experience and context (reviewed in C. W. Miller & Svensson, 2014). For example, in a well-
known study among lark buntings, Chaine and Lyon (2008) found the traits associated with male
pairing success to be highly variable from year to year, highlighting temporal flexibility in
female choice. Thus, fluctuations in the social and ecological environment, as well as among
individuals, influence which traits are potentially fitness enhancing, thereby favoring multiple
signals and reinforcing the need to pay attention to multiple traits (Bro-Jorgensen, 2010).
Additionally, organisms have to make decisions under uncertainty and individual traits
may not be a reliable signal of underlying quality or individual condition (Brunswik, 1955).
Because of this uncertainty, several traits, each related to underlying condition but likely only
offering a partial representation of what will make a good mate, must be paid attention. Thus,
variation either in trait priorities or in covariations between trait preferences may arise due to
individual and contextual factors (reviewed in Bro-Jorgensen, 2010).
Mate choice interactions are likely even more dynamic and sensitive to individual and
contextual level variables in species with mutual mate choice and biparental investment
(Bergstrom & Real, 2000; Hooper & Miller, 2008; Johnstone, Reynolds, & Deutsch, 1996; H.
Kokko & Johnstone, 2002). For example, in humans, cues that may signal underlying male
quality may also be associated with lower levels of parental investment (due to that male’s
attractiveness to a larger number of mates) causing females to make trade-offs over multiple cues
when selecting a mate (Scheib, 2001).

62
62
Patterning of Choice (prioritized traits vs. integrated traits)
Mate choice studies of humans have successfully documented many important individual
traits used in selecting partners (e.g., body mass index, waist to hip ratio, physical attractiveness,
social status, kindness, and honesty; reviewed in Gangestad & Scheyd, 2005). The prioritized
trait approach is useful for understanding mate choice decisions in terms of which traits are more
or less important in a potential partner. However, there is a concern that patterns in preferences
are being lost in trait by trait comparisons (G. F. Miller, 1997). An interaction between traits
could cause the relationship between cues and preferences to be more complex because, for
example, the preference for one trait may depend on the expression of another. Moller et al.
(Moller, Saino, Taramino, Galeotti, & Ferrario, 1998) find when looking to male traits of song-
rate and tail length among barn swallows (Hirundo rustica), that females do not simply have a
greater preference for one trait over the other. Instead, the importance females place on male
song-rate depends on male tail length (see Kodric-Brown & Nicoletto, 2001; Scheib, 2001 for
similar findings in guppies and humans respectively).
In general, studies of mate choice take the (i) prioritized trait approach, treating each cue
as one of a list of independently relevant individual characteristics in a potential partner that can
be arranged hierarchically (e.g., Lippa, 2007). However, there is a growing call in the literature
to explore the how traits interact in a synergistic manner (Jennions & Petrie, 1997), looking to
variation and covariation in trait preferences. This has led to the (ii) integrated trait approach (G.
F. Miller, 1997), which argues that the relationship among traits is more important for our
understanding of mate choice decision making than a simple prioritized list of traits.
Variables influencing mate choice

63
63
The study of reproductive decision-making typically relies on the long-standing model of
sexual selection developed by Trivers (Trivers, 1972). This model links mate choice preferences
directly to the differential investment in young by males and females. We will compare
assumptions from this sex-based model to a newer framework within sexual selection in which
evolutionary feedbacks can strongly influence the sex roles and subsequent patterns of sex
differentiated investment in mating effort (H. Kokko, Klug, & Jennions, 2012). A key feature of
this framework is the game theoretical approach it takes (Hanna Kokko & Jennions, 2008),
rendering the relative scarcity of the sexes an important influence on sex roles (e.g. Fromhage,
Elgar, & Schneider, 2005). In this way, sex-structured pay-offs to reproductive behavior
dependent on the adult sex ratio (ASR) are key to generating predictions of sex-differentiated
behavior.
The predictive variables and contrasting approaches for patterning choice can be thought
of as existing in distinct theoretical domains. The traditional sex-based and newer evolutionary
feedback frameworks are both compatible with either the prioritized or integrated trait
approaches. For example, integrated traits may be strongly patterned by sex alone, or prioritized
traits may be best explained by both sex and ASR.
We will test frameworks for mate choice involving nested combinations of a)
community, b) sex, and c) ASR, in two ways (prioritized vs. integrated traits; Table 2). In this
way we not only examine variables that influence mate choice but also tackle the newer issue of
how humans evaluate traits in potential partners: as separate pieces of information or as
integrated characteristics.
Methods

64
64
Study Population
The Makushi inhabit the Rupununi savannas of south-western Guyana, Region 9. Living
along the border with Brazil, this ethnic group shares many cultural traits with other groups from
the Xingu Basin. They include shifting cultivation, a focus on bitter cassava, matrilocal marriage,
the performance of bride service before marriage, and fairly egalitarian gender relationships
(Schacht, 2013). While premarital sex is not disapproved, and is an expected avenue to secure a
partner (Myers, 1993), the Makushi generally marry monogamously and extended families
typically share one residential area (Forte, 1996). Makushi marriages are generally endogamous,
in other words mates are usually selected from within the village community (Myers, 1993). As
elsewhere in Guyana, outmigration has led to considerable between community variation in
ASR, as men and women search for economic opportunities. Principle activities for men are
mining, cattle ranching, agricultural work and logging, activities which occur mainly in the more
remote areas of the Rupununi or in the forested regions at the center of the country, whereas
women are attracted to urban areas (such as the capital of Roraima in neighboring Brazil) and the
larger interior Guyanese towns (such as Lethem) in search of shop and domestic work (Gafar,
2004).
Community ASR strongly structures marital options for endogamous marriage, but men
are still expected to perform bride-service in order to marry. This traditionaly involved a year of
service by the prospective husband in which he clears and farms fields for his in-laws while
building a new dwelling nearby for himself and his wife. Men and women typically marry only
once or twice, and conventions are similar across all marriages, with men providing bride service
and thereafter bearing considerable responsibility to provide for their wives and children
(including stepchildren who are valuable helpers) through farming, fishing and various forms of

65
65
wage labor (Myers, 1993). At divorce, children remain largely the responsibility of the mother
and her family (although a father may take sons) but are expected to be provided for by a
stepfather if she remarries.
Data Collection
We conducted the mate choice preference survey across eight Makushi communities
(Figure 1). We first conducted a full census to determine the community composition. We then
randomly sampled a minimum of 30 individuals from each village for a total 149 men and 152
women aged 18-45 (Table 3). We asked respondents to answer questions regarding the
importance of partner traits operationalized through 10 items: financial resources, physical
attractiveness, faithfulness, parenting qualities, social status, health, desire for children,
devotion, hardworking, and strength of family bonds. Respondents rated each item (item score)
by using a five-point scale (1 = not at all important through 5 = very important). In order to
counter response bias we took three steps: a) a long (16 month) period of fieldwork during which
community rapport could be built across each of the villages, b) gender-matched interviewers
and interviewees and c) the use of a nonverbal response card method (Lindstrom et al., 2010) to
guarantee the privacy of the interviewee’s response, even from the interviewer. Furthermore, we
asked questions in ways that were locally understandable, which were pilot tested prior to data
collection. In this way we tried to make sure respondents knew what was being asked of them.
Statistical approach
Our statistical approach outlined below allows us to evaluate the support for the theories
regarding the cognition underlying mate choice by competing theoretically informed models
fitted to data. Below we present our analytical approach to test the prioritized trait models (I-III)

66
66
against the integrated trait models (IV-IX). All models were fitted by computationally intensive
Bayesian methods.
Prioritized traits
Within the prioritized trait approach we test three nested ordered logit models
(Community, Sex, and ASR; Table 2). Ordered logit regression models are used when the
responses - here, item scores - are ordered categories. All items and individuals are included in
each model. The direction and magnitude of effects in these models are allowed to freely vary
and are unique to each item. For example, we do not require sex specific differences in the
importance of social status and financial resources to conform to expected patterns of strong
female preference (e.g., Buss, 1989; Shackelford, Schmitt, & Buss, 2005; Stewart, Stinnett, &
Rosenfeld, 2000). However, if those preferences do exist in the sample they will be reflected by
the estimated effects. We do this in order to allow the model the greatest latitude to find sex
effects if they exist.
Integrated Traits
Here we test six models by taking a dimension reduction approach. In doing dimension
reduction we assume that an individual’s response profile expresses interrelated preferences
across items that can be reduced to a smaller number of variables. These variables are
unobserved and we refer to them as latent traits. A latent trait here is a theoretical construct
analogous to intelligence or leadership ability (e.g., Gardner, 1983; Stogdill & Coons, 1957). It is
unclear whether dimension reduction of interrelated preferences should aim for a unidimensional
or multidimensional trait. For example, is one axis ranging from low to high adequate to explain
variation in response profiles? Previous findings suggest that this may be overly simplistic

67
67
(Botwin, Buss, & Shackelford, 1997) and that there may be multiple axes in play (e.g.,
individuals may be placed low on one axis and yet high on another). Accordingly we use a one
and two dimensional approach.
A traditional dimension reduction approach used in psychometrics is factor analysis. This
is most suitable when the observed variables – here items – have Gaussian distributions.
However, a preliminary check showed that ordinary factor analysis would be a poor choice for
our sample: the item score distributions are discrete and very skewed; and the
variance/covariance matrix computed from the item scores had several negative eigenvalues. A
slightly better option is to base a factor analysis on the polychoric correlation matrix, which
treats the item scores as thresholded continuous variables. However, again the matrix was ill-
conditioned and it was clear that an approach better suited to our ordinal variables was needed.
Item response models were developed by quantitative psychologists due to the need for
appropriate dimension reduction techniques for data sets sharing the features of ours
(Hambleton, Swaminathan, & Rogers, 1991). Like factor analysis, item response models contain
a linear prediction equation involving one or more latent variables, and aim to connect variation
and covariation in the observed variables to the latent variables. However, unlike factor analysis,
an appropriate link function is required to transform the linear prediction to the scale of the
manifest variables. The item response model establishes the position of each individual in a
latent space and derives the probability of responses to multiple observed manifest variables as a
function of the individual’s position and item parameters. Essential, to the questions at hand, is
the potential to include fixed effects, such as sex and ASR, as well as contextual (“random”)
effects in the linear predictor. Thus, we can estimate the effects of community, sex and ASR on

68
68
placement along the latent trait (i.e. low or high). Bayesian methods built on MCMC algorithms
make it possible to fit these item response models (structured as in Table 2; Zhu & Stone, 2012).
Model comparisons
We perform posterior predictive calculations, consequently producing evidence ratios and
model weights, in order to compare the relative support for models I-IX (see Ntzoufras, 2009
sections 10.4, 11.10). Gelfand, Dey and Chang (Gelfand, Dey, & Chang, 1992) give a rationale
for this approach and pointed to computational advantages provided by MCMC estimation. The
basic quantity calculated is a conditional predictive ordinate (CPO) for each observed person-
and-item score1. CPOs are specific to each model, and can be combined across persons and items
to produce model-wide summaries broadly analogous to information measures such as the
deviance information criterion (DIC; Spiegelhalter, Best, Carlin, & van der Linde, 2002). Like
DIC, CPOs have theoretically-supported uses for model comparison2. For discrete item scores
and comparison of models I-IX, we prefer the posterior predictive approach based on CPOs to
DIC: the CPOs are straightforward to estimate from MCMC realizations, are well-behaved
numerically and have direct probabilistic interpretations. In contrast, DIC is a more synthetic
1 The CPO for item i, person j in model m is CPOij(m) = Pr(yij | Y-(ij), m), the predicted probability under model m of
person-item score yij, conditional on all other person-item scores Y-(ij). A Monte Carlo estimate of CPOij based on R
posterior samples from model m is 1
1
1 ))(|Pr(/1
R
r ij ryR , where (r) is the vector of parameters of
model m from the rth
posterior sample (see Gelfand, 1996; Ntzoufras, 2009 section 10.4). Under models I-IX, yij is
conditionally independent of all other person-item scores Y-(ij) given the parameter vector . Explicit conditioning on Y-(ij) can be circumvented in the Monte Carlo setting, leading to significant computational savings for estimation of CPOs (see Gelfand, 1996). 2 The natural logarithm of the pseudo-Bayes factor (a type of evidence ratio) for model m versus model m’ is
))'(logCPO)((logCPO )m' PSB(m,log iji j ij mm (Gelfand, 1996; Ntzoufras, 2009 section 11.10). A
model weight characterizing the relative support for model m’ in a set containing M models can be calculated as
M
mmmPSBmmPSBmw
1*),(/*),'()'( , where m* is the best-supported model in the set (the model
having the largest model-wide CPO, i j ijlogCPO ) (Ntzoufras, 2009 section 11.10) In practice, Monte Carlo
estimates of CPOij are used in these expressions.

69
69
measure of model support, which displayed some numerical instability in preliminary analysis of
these data.
Results
Visual patterns in prioritized traits
To begin our investigation we examine the item score distributions by sex (Figure 2).
What is initially striking is that the modal response for all items, except desire for children, is
“very important”, the highest category. A visual inspection suggests that preferences vary by sex
(males in light gray, females in dark gray) for at least some traits: more men than women rate
physical attractiveness as “very important” and more women than men rate financial resources
and strength of family bonds as “very important”. In the following sections we present our
overall results under the two theoretical approaches as they relate to these observations. We
provide the details regarding trait preferences and how they unfold under the two approaches.
Model comparisons
In Table 4 we display pseudo Bayes model weights. The model weights, as mentioned
above (section 2.4), allow us to compare the relative support for each model. Our principle
finding is that the prioritized trait models (I-III) and unidimensional (1-D) integrated trait models
(IV-VI) are not competitive when compared to the two dimensional (2-D) integrated trait models
(VII-IX; Table 4). Of the 2-D models, model VII, with random effects for community, is the best
model3. While sex has been shown to be important in many previous studies of mate choice it is
not here. An additional surprise is that the adult sex ratio is not competitive either in spite of
3 Model weights likely exaggerate the weight in favor of model VII. The 2-D models’ logCPO scores are all quite
similar if we look to ∆log CPOs in Table 4. However model VII is the best model, albeit by a small amount.
70
70
recent findings showing a relationship between mating effort and ASR in this population
(Schacht & Borgerhoff Mulder, in review).
What about sex differences?
In the next sections we walk through the analysis that led to our results. In the literature,
sex is argued to be a primary determinant of reproductive strategies. Here we examine this claim,
look to what is happening within models that include sex as a predictor and offer an explanation
as to why it was excluded from our best model.
Prioritized trait models
According to the prioritized trait approach, each trait is one of a list of independently
relevant individual characteristics. Within this approach we test the effect of three variables
(community, sex, and ASR; Table 3). Based on the model CPO values (Table 4), the model with
a unique sex effect for each item is the best of the three prioritized trait models (models I-III).
This is a reassuring finding, given the apparent sex differences in several item score distributions
(Figure 2). In Figure 3 we display the linear predictors for item rankings by item and community.
For a given item the linear predictor is the sum of a community effect and a male-female
contrast. Items rated higher by males have positive linear predictors whereas those rated higher
by females have negative linear predictors. Although most of the variation in an item’s ranking is
attributable to community effects, we nonetheless recover sex differences for three items:
strength of family bonds, financial resources, and physical attractiveness (the first two have a
higher female rating and the last has a higher male rating). For each of these items, the male-
female contrast (αi), an additive term in the linear predictor, is statistically well supported and
distinguishable from zero.
71
71
Integrated Trait Models: One latent dimension
Under the 1-D approach, item responses are functions of a single latent variable capturing
interrelated preferences. The model with community and sex effects (model V) has the largest
CPO by a very small amount, and is therefore the best among the 1-D models (Table 2). This
resembles our finding from the prioritized trait approach.
To continue our evaluation of sex and its effects on preferences, we turn to Figure 4. Here
we show the response probability curves for the item physical attractiveness in the top panel and
densities of the latent variable by sex and location in the bottom. Physical attractiveness was
selected because of its robust sex difference across the literature as well as our findings of a sex
effect for this item using the prioritized trait approach. For each value on the axis (lower panel),
the curves of the upper panel give the probabilities of each response option. Therefore a person
with a position close to 0 on the latent trait will respond “very important” with probability near
0.5, and “fairly important” with probability near 0.3. The superimposed densities show where
male and female respondents of each community lie on the axis. Differences in position of the
densities reflect sex and community differences in placement along the axis. The response
probability curves for other items will vary depending on item specific parameters; but because
the latent variable and the male-female contrast α are shared across items in the 1-D model, the
lower panel is the same for all items.
We see considerable overlap in the distributions of males and females across
communities. If male-female differences were large and communities were not important sources
of variation, we would see two sets of distributions, well separated by sex but indistinguishable
by community. Instead, demanding individuals of either sex find physical attractiveness “very

72
72
important” in a partner. Thus, if the goal is to predict the importance of physical attractiveness,
the sex of the respondent is of limited value.
Integrated Trait Models: Two latent dimensions
Figure 5 shows response probability curves for physical attractiveness and kernel
densities for the two latent dimensions of the 2-D model with sex. As is noticeable, the response
probability curves for physical attractiveness, as well as the kernel densities, are different for
dimensions one and two. As for the 1-D model, within a dimension the latent variable and the
male-female contrast are shared across all items, while the response probability curves vary
across items as a function of item specific parameters. A slight separation between male and
female densities is present in dimension 1, but sex differences are difficult to detect in dimension
2. Physical attractiveness is “very important” to individuals positive on dimension 1, but not
dimension 2. Again, as in the 1-D model, sex is of limited value in predicting placement along
the axes.
The “best” model: 2-dimensions with community effect
While we have been focusing on the variable sex, our best model (Model VII) does not
include it. To seek a visual confirmation we look to Figure 6. Here we plot individual placement
along the two dimensions for the 2-D model with random effects for community. We do not see
distinct grouping by sex across the quadrants. In Figure 7 we plot individual points with shading
as a property of community membership, with shading indicating proximity to the regional
capital. As is observable, there is quite a bit of individual variation but we do see darker points
localized in the northern quadrants, something we will return to.
Discussion

73
73
Our findings offer explanations for the two questions we outlined in the beginning of the
paper: 1) What is the process underlying mate choice decision making (prioritized vs. integrated
traits)? and 2) How is this process patterned (community, sex or ASR)? In answer to question 1,
and in line with researcher calls for the exploration of the interaction of multiple cues (e.g.,
Miller & Svenson 2014), we find support for cue integration and variability in preferences. In the
one-dimensional model, we find that, in general, the underlying latent trait separates choosy from
unchoosy individuals – individuals placed positively are more demanding across traits than are
individuals placed negatively.
The best model, however, includes two dimensions underlying mate choice preferences.
As is observable from Figure 6, all individuals lie in one of four quadrants based on their
placement across the two dimensions. If we look to response profiles of individuals in each
quadrant we can explore the implications of a positive or negative placement along a dimension.
We label the horizontal dimension (D-1) “general demand” because positively placed individuals
are more likely to use the response option “very important” when rating items. However,
individuals negatively placed are not simply undemanding – we observe trade-offs dependent on
their placement (either positively or negatively) along the second axis. Therefore the two
dimensions should not be interpreted separately. We label the vertical dimension (D-2), “natal
tendencies”, with individuals positive on the dimension rating the desire for children as “very
important”. Below we offer interpretations of mate preferences based on response profiles of
“typical” individuals across the four quadrants (displayed in Figure 8).
In general, individuals positive on D-1 rate traits “very important”. Here are our
interpretations of these individuals based on their placement along D-2:

74
74
(1,1) Individuals positive on both dimensions find all items “very important”. These are
demanding individuals who want a partner to have it all.
(1,-1) Individuals positive on D-1 but negative on D-2 find all items “very important”
except desire for children, which is “not at all important”. A desire for a family is not
driving these individuals’ mate choice decisions, partner quality is.
Unlike above, individuals negative on D-1, are not demanding across all items. This is not to say
that they are generally unchoosy - devotion, parenting qualities, health and hardworking are
consistently rated as “very important”. However the importance of other traits depends on their
placement on D-2:
(-1,1) Individuals negative on D-1 but positive on D-2, find, in addition to the traits
outlined above, desire for children and faithfulness in a partner “very important”. We
label what drives preference ratings among these individuals as “Partner and Child
Commitment”.
(-1,-1) Individuals negative on both dimensions, find family bonds “very important” and
desire for children “not at all important”. We label what drives preference ratings among
these individuals as “Kin Support”.
What we uncover through an examination of the typical individuals in each quadrant is that this
is not a simple story about choosy vs. unchoosy individuals. Instead, and especially for those
negative on D-1, we see trait preference trade-offs, with some key traits being “very important”
while others are not. As a consequence, four different “types” of preference patterns emerge.

75
75
In response to question 2, we find that community best explains patterning in preferences.
Sex is often argued to be a primary determinant of reproductive strategies, due to potential
differences in optimal mating rates, leading women to place a greater importance on cues that
signal ability to acquire resources and men to place a greater importance on cues that signal
fertility and reproductive value (e.g., Buss, 1989). Had we concluded our analysis after testing
our prioritized trait models we would report a confirmation of the importance of sex (Model II).
Sex differences in three traits align in the direction predicted (see Figure 2).
Sex differences are not unimportant in Makushi reproductive strategies, but they are not
as straight-forward as argued more widely in literature. The Makushi offer a useful comparison
to “typical” studies of mate choice focusing on the Western undergraduate. In the West, cultural
institutions create traditional sex roles where males control most of the resources.
Unsurprisingly, this is also associated with robust and consistent sex differences across mate
choice studies. However, culturally, the Makushi are quite different. Kinship is matrilineal,
marriage is matrilocal, and men must perform brideservice in order to marry (Schacht, 2013). Of
additional relevance is that women generally provide most of the calories for subsistence and as
a consequence the sex roles are quite egalitarian with women having considerable power in
making household decisions. Due to female economic autonomy among the Makushi, sex
differences in preferences are not robust and instead we see evidence for situationally dependent
trade-offs emerging, resulting in differing “types” preference patterns (Figure 8).
Newer models within sexual selection show as well that sex does not automatically act as
a predictor of behavior because sex roles coevolve with sex-structured pay-offs to mating
strategies, time spent in parental care and sex-biased mortality differentials (H. Kokko et al.,
2012). Based on earlier work (Schacht & Borgerhoff Mulder, in review) we predicted that sex

76
76
might be important in conjunction with ASR, given that a model with ASR was the best for
predicting mating effort among males. However, ASR added nothing to the model here.
There are also additional theoretically informed variables likely associated with variation
in preferences. We first explored two individual-level variables, age and income, but found no
patterning with response profiles. Next, we turned to additional community level variables. If we
again look to Figure 8, patterning by individual shading is apparent. Individual points are shaded
by a community measure of market integration (i.e. reliance on wage labor) - distance to the
regional capital. Looking to the southwest quadrant we see lighter shading, these are generally
individuals who are further from wage labor opportunities. These are also individuals who are
characterized by desiring kin support (i.e. they rate the strength of family bonds to be “very
important”). Familial connections may be important due to the potential of resource fluctuations
and shortages without wage labor to help to smooth them out, making kin very important. If we
look to the opposite quadrant in the northeast, where individuals rate all items to be “very
important”, we find a greater concentration of darker points (these individuals are generally in
greater proximity wage labor). Work suggest that novel environments favor paying attention to
multiple traits and individuals therefore may be responding to relatively recent market
integration in this way because of uncertainty around traits and their relation to mate quality.
And lastly, individuals in communities closer to the regional capital are generally more pronatal.
This is surprising and is counter to typical predictions from both competitive market and
demographic transition models (e.g., Kaplan 1996). Generally, as population measures of market
integration increase, natal preferences decrease due to the importance of education and rising
costs to having multiple children. However, among the Makushi, success is largely independent
of education. Most jobs available for men and women are low-skill, wage labor positions. These

77
77
jobs therefore are new found sources of wealth that can be used to support more children.
However, over time, as success becomes more tightly-linked to education, predictions from
competitive market and demographic transition models may hold, as individuals begin investing
more in fewer children as opposed to many.
In sum, neither sex nor its interaction with ASR are found within the best model (Model
VII) and this appears to be because of the overwhelming effects of community. While what is
driving community variability is still an open question, we do uncover “types” of preferences
emerging from our multidimensional model. Some individuals make very few concessions when
choosing a partner and others are quite selective, trading off the importance of the 10 traits.
Additional, or more precise, measures of individual- (e.g. mate value) and population-level (e.g.
market integration) variables may help to more clearly explain trait preferences and their
integration into the patterns we observe.
Conclusion
By exploring integrative trait models we open up the possibility for examining how trait
preferences relate not simply to individual or contextual variables but also to how trait
preferences relate to each other. We recover two underlying dimensions that best explain
individual differences in trait preferences. Individual placement along the general demand
dimension (D-1) and the pronatal dimension (D-2) offers us insight into how individuals are
making mate choice decisions through the “types” of individuals that emerge. The uncertainty
surrounding traits, as well as individual and environmental heterogeneity, may lead to varying
combinations of cues to get at a desired underlying quality of importance in a partner. This
uncertainty and resultant ‘noise’ in preferences may help to shed light on the unexplained
78
78
variance and low repeatability we see across mate choice studies (Candolin, 2003; Jennions &
Petrie, 1997). Additionally, this study highlights the need to pay attention to many individual and
contextual level variables which could influence mate choice decision making.
Optimal mating strategies are likely influenced by sex-structured pay-offs to a behavior,
but situationally dependent factors could result in the lack of apparent sex differences in
preferences. The robust literature surrounding sex differences is largely due to a prioritized trait
approach that may miss much of the relevant complexity underlying partner choice decision
making. We do not claim that sex differences in previous studies are ‘wrong’, so far as they go.
But, as we have shown here, they are methodologically incapable of revealing the rich tapestry
of factors necessary to predicting situationally specific mating behavior.
We have demonstrated a method for looking at an alternative model for mate choice in
humans (the integrated trait model), compared to the more conventional prioritized trait
approach, using Bayesian model comparison. Results suggest that in this particular case the
integrative model performs markedly better than the prioritized trait approach. We believe it is
still an open question with respect to the design of the underlying psychology shaping mate
choice, however, we offer the integrative approach as an alternative way of thinking about mate
choice. With respect to our null findings regarding sex differences, we are unsurprised, given our
previous findings for this population, and the background ethnography. Perhaps most interesting
is the fact that the patterning of mate choice appears to be strongly affected by community
membership, and perhaps access to the market economy, suggesting future research directions.

79
79
Table 2. Models and their Predictions
Cognition underlying Mate Choice
Prioritized Traits Integrated Traits
Inte
rven
ing V
aria
ble
s (v
aria
ble
s pat
tern
ing
the
var
iati
on)
Com
munit
y Differences in importance of
individual traits by context
Suites of traits variably important by
community
Sex
Differences in importance of
individual traits by sex
Suites of traits important by sex
AS
R x
Sex
Differences in importance of
individual traits by sex and ASR
Suites of traits variably important by sex
and ASR
A community effect is included in all models, and the fixed effect for Sex is included in models
containing the ASR x Sex interaction. Thus, a nested sequence of increasingly complex models
is produced by moving from top to bottom in the table.

80
80
Table 3. Descriptive statistics of each community.
Community ASR Men:Women
(18-45)
# Men
Interviewed
# Women
Interviewed
Community
Population
A 0.93 125:135 29 29 745
H 1.11 70:63 15 15 415
F 1.13 70:62 15 15 407
E 1.16 87:75 18 19 596
G 1.22 73:60 20 20 432
D 1.33 80:60 19 19 406
B 1.35 27:20 15 15 162
C 1.43 57:40 18 20 310

81
81
Table 4. Posterior predictive calculations and model weights
LogCPO is calculated for each model as described in the section Model Comparison. Models are
nested within classes. For example, model IV is nested within models V and VI in the class of
Integrative 1-Dimension models. ∆log CPO is the natural logarithm of the pseudo Bayes factor
(a type of evidence ratio) for each model compared to model VII, the best-supported model in
the set. Pseudo Bayes weights are calculated from ∆log CPO as described in the section Model
Comparison

82
82
Figure 1. Map of Guyana and field site locations

83
83
Figure 2. Raw Data Display: Side by side histograms of item frequencies. The x-axis indicates
the frequency in the sample of each response option by sex (males in light gray and females in
dark gray). Axis scaling varies by item in order to accommodate different levels of variation.

84
84
Figure 3. Model II, Prioritized Traits by Sex: Posterior means and 95% credibility intervals
for the linear predictor of trait prioritization (ζij ) in Model II, evaluated for male subjects. For
each item the uncertainty about the male-female contrast has two components: 1) uncertainty
about the sex effect and 2) uncertainty about the community random effect. Here we distinguish
these sources of uncertainty: the dark gray segment shows the 95% credibility interval for the sex
effect and the lighter gray segment shows the 95% credibility interval for the community random
effect, averaged across communities. We recover sex differences for three items: male subjects
value physical attractiveness in a partner more than female subjects, but the converse holds for
strength of family bonds and financial resources. For these items the credibility intervals are
bounded away from zero.

85
85
Figure 4. Model V, 1-D Sex: Response probability curves for the item physical attractiveness
along with community- and sex-specific densities for the latent trait. For each value on the axis,
the curves of the upper panel give the probabilities of each response option; these probabilities
sum to 1. To obtain the lower panel we calculated the posterior mean for each individual (λj)
from Model V (individual position represent by ticks along the axis, females in black and males
in gray). We then estimated kernel densities of the λj’s for the two sexes in each community (16
densities in all, females in black and males in gray) and superimposed them. In model V there is
a single axis and a single male-female contrast α, therefore the lower panel is the same for all
traits. The item response curves displayed in the upper panel will vary in appearance across
items, depending on the discrimination (βi) and cut point parameters.

86
86
Figure 5. Model VIII, 2-D Sex: Response probability curves for the item physical attractiveness along with community- and sex-
specific densities for the latent variables on dimensions 1 and 2. These graphs display model VIII but details of their construction are
as in Figure 4.

87
87
Figure 6. Model VII, 2-D Community
Here individuals are plotted by their position across the two dimensions and shaded by sex.

88
88
Figure 7. Individual placement by community membership
Here individuals are plotted across the two dimensions. The darker the circle, the closer the
community is to the regional capital.

89
89
Figure 8. Quadrant Groupings
Here we plot phrases describing typical individuals in each of the four quandrants across the two
dimensions. The more positive an individual is on D1, the more they are to find nearly all traits
“very important”. The more positive an individual is on D2, the more likely they are to find
desire for children as “very important trait” in a partner.

90
90
Appendix: Models
Prioritized Trait Models
Our base model
Pr(yij ≤ d) = F(τid – ζij)
yij {1,…, n} is the ordinal score given by subject j to item i
d is a generic rating on the rating scale
F is the cumulative distribution function of the logistic distribution
τid is the threshold for item i, rating d; for each item i, the thresholds are ordered
according to τi1 < τi2 < τi3 < τi4
ζij includes item and subject specific variables
Model I. Unstructured model with random effects for location:
ζij = Ai,c(j)
Ai,c(j) is a random effect for item i for the community in which subject j resides (this
effect is shared by all residents of a given community)
Model II. Fixed effects for sex:
ζij = Ai,c(j) + αi*sexj
αi measures the contrast between men and women on item i
sexj = 1 if the subject is male
Model III. Structured context model:
ζij = Ai,c(j) + αi*sexj + γi*logASRc(j) + δi*sexj*logASRc(j)
γi measures the effect of logASR on item i and δi measures the interaction of sex and
logASR
Dimension Reduction Models
Our base 1-dimensional model:
Pr(yij ≤ d) = F(τid – λjβi)
λj = subject specific latent variable
βi = discrimination parameter of item i
Below we outline the models for the subject-specific latent variable (λj), which are linear
random-effects (I & IV) or linear mixed effects (sex and ASR;II, III, V & VI) models. The latter
models are regressions of the subject-specific latent variable on theoretically-informed
predictors.
Model IV. 1-dimensional model with random effects for community:

91
91
λj = Xj + Ac(j)
Xj is a random effect for subject j
Ac(j) is a random effect for the community in which subject j resides (this effect is shared
by all residents of a given community)
Model V. 1-dimensional model with fixed effects for sex:
λj = Xj + Ac(j) + α*sexj
α measures the contrast between males and females on the first dimension
Model VI. 1-dimensional model with fixed effects for sex and ASR, along with their interaction:
λj = Xj + Ac(j) + α*sexj + γ*logASRc(j) + δ*sexj*logASRc(j)
γ measures the slope of logASR on the first dimension
δ measures the interaction of sex and logASR on the first dimension
logASRc(j) is the natural logarithm of the ASR for the community in which subject j
resides
Our base 2-dimensional model
Pr(yij ≤ d) = F(τid – λjβi - φjηi)
τid are as before and are shared across the two dimensions
λj and βi are as defined for the appropriate choice of the 1-dimensional model
φj = subject specific latent variable for dimension 2
ηi = discrimination parameter of item i on dimension 2
Model VII. 2-dimensional model with random effects for location:
λj = Xj + Ac(j)
φj = Zj + Bc(j)
Zj is a random effect for subject j on dimension 2
Bc(j) is a random effect on dimension 2 for the community in which subject j resides (this
effect is shared by all residents of a given community)
Model VIII. 2-dimensional model with fixed effects for sex:
λj = Xj + Ac(j) + α*sexj
φj = Zj + Bc(j) + ζ*sexj
ζ measures the contrast between males and females on the second dimension
Model IX. 2-dimensional model with fixed effects for sex, along with ASR and their interaction:
λj = Xj + Ac(j) + α*sexj + γ*logASRc(j) + δ*sexj*logASRc(j)

92
92
φj = Zj + Bc(j) + ζ*sexj + ξ*logASRc(j) + ψ*sexj*logASRc(j)
ξ measures the slope of logASR on the second dimension
ψ measures the interaction of sex and logASR on the second dimension

93
93
Andersson, M. (1994). Sexual Selection. Princeton, NJ: Princeton University Press.
Bateson, P. (1983). Mate Choice. New York: Cambridge University Press.
Bergstrom, C. T., & Real, L. A. (2000). Towards a theory of mutual mate choice: Lessons from
two-sided matching. Evolutionary Ecology Research, 2(4), 493-508.
Botwin, M. D., Buss, D. M., & Shackelford, T. K. (1997). Personality and Mate Preferences:
Five Factors In Mate Selection and Marital Satisfaction. Journal of Personality, 65(1),
107-136. doi: 10.1111/j.1467-6494.1997.tb00531.x
Bro-Jorgensen, J. (2010). Dynamics of multiple signalling systems: animal communication in a
world in flux. Trends in Ecology & Evolution, 25(5), 292-300. doi: DOI
10.1016/j.tree.2009.11.003
Brunswik, E. (1955). Representative Design and Probabilistic Theory in a Functional
Psychology. Psychological Review, 62(3), 193-217. doi: Doi 10.1037/H0047470
Buss, D. M. (1989). Sex-Differences in Human Mate Preferences - Evolutionary Hypothesis
Tested in 37 Cultures. Behavioral and Brain Sciences, 12(1), 1-14.
Candolin, U. (2003). The use of multiple cues in mate choice. Biological Reviews, 78(4), 575-
595. doi: Doi 10.1017/S1464793103006158
Dale, S., & Slagsvold, T. (1996). Mate choice on multiple cues, decision rules and sampling
strategies in female pied flycatchers. Behaviour, 133, 903-944. doi: Doi
10.1163/156853996x00305
Forte, J. A. (1996). About Guyanese Amerindians. Georgetown, Guyana: J. Forte.
Fromhage, L., Elgar, M. A., & Schneider, J. M. (2005). Faithful without Care: The Evolution of
Monogyny. Evolution, 59(7), 1400-1405. doi: 10.2307/3449163
Gafar, J. (2004). The performance of the labour market in Guyana. Canadian Journal of
Development Studies-Revue Canadienne D Etudes Du Developpement, 25(4), 663-685.
Gangestad, S. W., & Scheyd, G. J. (2005). The evolution of human physical attractiveness.
Annual Review of Anthropology, 34, 523-548. doi: DOI
10.1146/annurev.anthro.33.070203.143733
Gardner, H. (1983). Frames of mind: The theory of multiple intelligences. New York: Basic
Books.
Gelfand, A. E. (1996). Model determination using sampling-based methods. In W. R. Gilks, S.
Richardson & D. J. Spiegelhalter (Eds.), Markov Chain Monte Carlo in Practice (pp.
144-161). London: Chapman and Hall.
Gelfand, A. E., Dey, D. K., & Chang, H. (1992). Model determination using predictive
distributions with implementation via sampling-based methods. In J. M. Bernardo, J. O.
Berger, A. P. Dawid & A. F. M. Smith (Eds.), Bayesian Statistics 4 (pp. 147-167).
Oxford: Oxford University Press.
Gerhardt, H. C. (1992). Conducting playback experiments and interpreting their results. In M.
P.K. (Ed.), Playbacks and Studies of Animal Communication. New York: Plenum Press.
Hambleton, R. K., Swaminathan, H., & Rogers, H. J. (1991). Fundamentals of Item Response
Theory. Newbury Park, CA: Sage Press.
Hill, J. A., Enstrom, D. A., Ketterson, E. D., Nolan, V., & Ziegenfus, C. (1999). Mate choice
based on static versus dynamic secondary sexual traits in the dark-eyed junco. Behavioral
Ecology, 10(1), 91-96. doi: DOI 10.1093/beheco/10.1.91
Hooper, P. L., & Miller, G. F. (2008). Mutual Mate Choice Can Drive Costly Signaling Even
Under Perfect Monogamy. Adaptive Behavior, 16(1), 53-70. doi:
10.1177/1059712307087283

94
94
Jennions, M. D., & Petrie, M. (1997). Variation in mate choice and mating preferences: A review
of causes and consequences. Biological Reviews of the Cambridge Philosophical Society,
72(2), 283-327. doi: Doi 10.1017/S0006323196005014
Johnstone, R. A., Reynolds, J. D., & Deutsch, J. C. (1996). Mutual Mate Choice and Sex
Differences in Choosiness. Evolution, 50(4), 1382-1391.
Kodric-Brown, A., & Nicoletto, P. F. (2001). Female choice in the guppy (Poecilia reticulata):
the interaction between male color and display. Behavioral Ecology and Sociobiology,
50(4), 346-351. doi: DOI 10.1007/s002650100374
Kokko, H., & Jennions, M. D. (2008). Parental investment, sexual selection and sex ratios.
Journal of Evolutionary Biology, 21(4), 919-948. doi: 10.1111/j.1420-9101.2008.01540.x
Kokko, H., & Johnstone, R. A. (2002). Why is mutual mate choice not the norm? Operational
sex ratios, sex roles and the evolution of sexually dimorphic and monomorphic
signalling. Philosophical Transactions of the Royal Society of London Series B-
Biological Sciences, 357(1419), 319-330. doi: DOI 10.1098/rstb.2001.0926
Kokko, H., Klug, H., & Jennions, M. D. (2012). Unifying cornerstones of sexual selection:
operational sex ratio, Bateman gradient and the scope for competitive investment.
Ecology Letters, 15(11), 1340-1351. doi: DOI 10.1111/j.1461-0248.2012.01859.x
Lindstrom, D. P., Belachew, T., Hadley, C., Hattori, M. K., Hogan, D., & Tessema, F. (2010).
Nonmarital sex and condom knowledge among Ethiopian young people: improved
estimates using a nonverbal response card. Studies in Family Planning, 41(4), 251-262.
Lippa, R. A. (2007). The preferred traits of mates in a cross-national study of heterosexual and
homosexual men and women: An examination of biological and cultural influences.
Archives of Sexual Behavior, 36(2), 193-208. doi: DOI 10.1007/s10508-006-9151-2
Miller, C. W., & Svensson, E. I. (2014). Sexual Selection in Complex Environments. Annual
Review of Entomology, 59(1), 427-445. doi: doi:10.1146/annurev-ento-011613-162044
Miller, G. F. (1997). Mate choice: from sexual cues to cognitive adaptations. In C. Foundation
(Ed.), Characterizing Human Psychological Adaptations (Vol. 208, pp. 71-82): Wiley.
Moller, A. P., Saino, N., Taramino, G., Galeotti, P., & Ferrario, S. (1998). Paternity and multiple
signaling: Effects of a secondary sexual character and song on paternity in the barn
swallow. American Naturalist, 151(3), 236-242. doi: Doi 10.1086/286114
Myers, I. (1993). The Makushi of the Guiana-Brazilian Frontier in 1944: A study of culture
contact. Antropologica, 80, 3-99.
Ntzoufras, I. (2009). Bayesian modeling using WinBugs. New Jersey: John Wiley & Sons.
Schacht, R. (2013). Cassava and the Makushi: A Shared History of Resiliency and
Transformation. In H. Garth (Ed.), Food and Identity in the Caribbean (pp. 15-29).
London: Berg Publishers.
Scheib, J. E. (2001). Context-specific mate choice criteria: Women's trade-offs in the contexts of
long-term and extra-pair mateships. Personal Relationships, 8(4), 371-389. doi: DOI
10.1111/j.1475-6811.2001.tb00046.x
Shackelford, T. K., Schmitt, D. P., & Buss, D. M. (2005). Universal dimensions of human mate
preferences. Personality and Individual Differences, 39(2), 447-458. doi: DOI
10.1016/j.paid.2005.01.023
Spiegelhalter, D. J., Best, N. G., Carlin, B. R., & van der Linde, A. (2002). Bayesian measures of
model complexity and fit. Journal of the Royal Statistical Society Series B-Statistical
Methodology, 64, 583-616. doi: Doi 10.1111/1467-9868.00353

95
95
Stewart, S., Stinnett, H., & Rosenfeld, L. B. (2000). Sex differences in desired characteristics of
short-term and long-term relationship partners. Journal of Social and Personal
Relationships, 17(6), 843-853. doi: Doi 10.1177/0265407500176008
Stogdill, R. M., & Coons, A. E. (Eds.). (1957). Leader behavior: Its description and
measurement. Columbus: Ohio State University Press.
Trivers, R. L. (1972). Parental investment and sexual selection. In B. Campbell (Ed.), Sexual
selection and the Descent of Man, 1871-1971 (pp. 136-179). Chicago: Aldine.
Zhu, X. W., & Stone, C. A. (2012). Bayesian Comparison of Alternative Graded Response
Models for Performance Assessment Applications. Educational and Psychological
Measurement, 72(5), 774-799. doi: Doi 10.1177/0013164411434638