Embed Size (px)
Citation preview

Cerebral Cortex April 2010;20:953--965
doi:10.1093/cercor/bhp157
Advance Access publication August 14, 2009
Distinct and Overlapping Functional Zonesin the Cerebellum Defined by RestingState Functional Connectivity
Jill X. O’Reilly1, Christian F. Beckmann1,2,
Valentina Tomassini1,3, Narender Ramnani4 and Heidi Johansen-
Berg1
1FMRIB Centre, Department of Clinical Neurology, University
of Oxford, OX1 9DU Oxford, UK, 2Division of Neuroscience
and Mental Health, Imperial College, SW7 2AZ London, UK,3Department of Neurological Sciences, ‘‘La Sapienza’’
University, 00185 Rome, Italy and 4Department of Psychology,
Royal Holloway, University of London, TW20 0EX London, UK
Jill X. O’Reilly and Christian F. Beckmann contributed equally
to the work.
The cerebellum processes information from functionally diverseregions of the cerebral cortex. Cerebellar input and output nucleihave connections with prefrontal, parietal, and sensory cortex aswell as motor and premotor cortex. However, the topography of theconnections between the cerebellar and cerebral cortices remainslargely unmapped, as it is relatively unamenable to anatomicalmethods. We used resting-state functional magnetic resonanceimaging to define subregions within the cerebellar cortex based ontheir functional connectivity with the cerebral cortex. We mappedresting-state functional connectivity voxel-wise across the cere-bellar cortex, for cerebral--cortical masks covering prefrontal,motor, somatosensory, posterior parietal, visual, and auditorycortices. We found that the cerebellum can be divided into atleast 2 zones: 1) a primary sensorimotor zone (Lobules V, VI, andVIII), which contains overlapping functional connectivity maps fordomain-specific motor, somatosensory, visual, and auditory corti-ces; and 2) a supramodal zone (Lobules VIIa, Crus I, and II), whichcontains overlapping functional connectivity maps for prefrontaland posterior-parietal cortex. The cortical connectivity of thesupramodal zone was driven by regions of frontal and parietalcortex which are not directly involved in sensory or motorprocessing, including dorsolateral prefrontal cortex and the frontalpole, and the inferior parietal lobule.
Keywords: cerebellum, fMRI, functional connectivity, networks, resting-state
Introduction
The cerebellum, traditionally considered a motor structure, is
increasingly understood to play a broader role by virtue of its
interactions with association cortex such as the parietal and
prefrontal lobes. This shift has been driven by functional
imaging and patient work in humans, and by anatomical studies
in monkeys. Since the earliest days of functional imaging,
cerebellar activations have been observed, often unexpectedly,
in experiments with minimal motor demands including sensory
(Gao et al. 1996; Blakemore et al. 1999) and linguistic tasks
(Roskies et al. 2001; Noppeney and Price 2002; Xiang et al.
2003; Ravizza et al. 2006) and in executive function (e.g.,
Desmond et al. 1997, 1998; for review see Stoodley and
Schmahmann 2009). In parallel, patient studies indicate wide-
ranging cognitive deficits following cerebellar damage, in-
cluding altered social and emotional behavior and a slowing of
mental performance (e.g., Schmahmann and Sherman 1998;
Schmahmann and Caplan 2006).
The functional heterogeneity of the cerebellum is reflected in
its connectional heterogeneity: The cerebellum has both afferent
and efferent connections with diverse regions of cerebral cortex
including the somatosensory (Glickstein et al. 1985; Schmahmann
and Pandya 1992), visual (Schmahmann and Pandya 1992, 1993;
Glickstein et al. 1994), auditory (Schmahmann and Pandya 1991,
1992), parietal (Schmahmann and Pandya 1993; Clower et al.
2005), and prefrontal areas (Schmahmann and Pandya 1997;
Middleton and Strick 2001; Kelly and Strick 2003) as well as
primary motor and premotor cortex.
Anatomical studies in monkeys suggest that different
cerebral--cortical projections form discrete ‘‘channels’’ and
should therefore map onto different regions of the cerebellar
cortex. Afferent fibers destined for the pontine nuclei (the
cerebellar input nuclei) are segregated within their white-
matter bundles by cortical region of origin (Schmahmann and
Pandya 1992), and retain this segregation in the pontine nuclei
(Brodal 1978). Similarly, cerebellar efferents arising in the
dentate nucleus are organized according to the functional
topography of the cerebral cortex (Dum and Strick 2003). In
one particularly important study in monkeys, Kelly and Strick
(2003) identified the polysynaptic connections between 2
cerebral--cortical areas, the primary motor cortex and area 46
of the prefrontal cortex, and specific territories in the
cerebellar cortex. Cerebellar lobules HIV, HV, HVI, and HVIII
were found to be interconnected with the primary motor
cortex (a later study by Lu et al. (2007) indicated that M1 also
receives projections from Crus I). (We have followed the
nomenclature of Schmahmann et al. (2000), ‘‘MRI Atlas of the
Human Cerebellum’’ in which the cerebellar lobules are labeled
I-X from the anterior/superior border of the cerebellum,
through posterior, to the anterior/inferior border. Schmah-
mann’s nomenclature was partly based on that of Larsell [e.g.,
Larsell and Jansen 1972], in which the cerebellar hemispheres
were distinguished from the vermis with the prefix H. We have
included the H prefix where we are referring specifically to
activity in the hemispheres, and the prefix ‘‘vermal’’ where we
are referring specifically to vermal activity. Where we are
referring to the whole lobule, we use no prefix.) In contrast,
parts of Lobule VIIa, especially Crus II, were interconnected
with prefrontal area 46. Importantly, the cerebellar-cortical
regions which received input from each cortical area were
found to send output back to the same cerebral area, forming
parallel connectivity loops. In view of these results, Strick and
colleagues have proposed that cerebro-cerebellar connectivity
is characterized by discrete ‘‘parallel circuits,’’ reciprocally
linking different parts of the cerebellum with their correspond-
ing cerebral--cortical functional areas (e.g., Dum et al. 2002).
However, despite extensive work mapping cortical connec-
tions with the pontine nuclei and dentate, the connectional
� The Author 2009. Published by Oxford University Press. All rights reserved.
For permissions, please e-mail: [email protected]

topography of the cerebellar cortex itself (in relation to the
cerebral cortex) remains largely unmapped. Anatomical tracer
studies of cerebro-cerebellar connectivity have almost exclu-
sively focused on the input and output nuclei of the cerebellum,
because of the difficulty in tracing the multisynaptic circuits
which link cerebellar and cerebral cortices (Kelly and Strick
2000). Projections from the cerebral cortex synapse in the
pontine nuclei, then the cerebellar cortex; reciprocal connec-
tions synapse first in the cerebellar dentate, then the thalamus,
before reaching the cerebral cortex. Very few studies have
successfully traced connections trans-synaptically from cerebral
to cerebellar cortex (Kelly and Strick 2003; Lu et al. 2007).
Furthermore, diffusion tractography, an imaging method that
can provide information on anatomical connectivity in the
human brain, is at present problematic between the cerebellum
and the cerebral cortex for 3 reasons. First, cerebellar afferents
and efferents decussate in regions of dense crossing fibers in the
brainstem. Second, cerebellar efferents pass through a ‘‘bottle-
neck’’ in the superior cerebellar peduncle which is so narrow
that its subregions cannot clearly be distinguished with the
spatial resolution of diffusion imaging. Third, cerebellar-efferents
synapse in areas of gray matter (notably the thalamus) before
reaching the cerebral cortex. Finally, all anatomical studies face
the difficulty that each region of cerebellar cortex receives
inputs via at least 2 routes, relayed by either the pontine nuclei
or the inferior olive.
Given the difficulty of tracing cortico-cerebellar anatomical
connections ‘‘cortex to cortex,’’ it is at present difficult to relate
our knowledge of the connectivity of the cerebellar input and
output nuclei to a functional topography of the cerebellar
cortex. In accordance with the anatomical data of Kelly and
Strick (2003), sensorimotor representations of the body have
been found in the superior/anterior-most part of the cerebellum
(lobules III--V or VI) and in lobule HVIII (MacKay and Murphy
1973; Ojakangas and Ebner 1994; Gao et al. 1996; Jueptner et al.
1997; Thickbroom et al. 2003). However, using functional
methods it is much more difficult to be specific about which
areas of association cortex (prefrontal and posterior-parietal
cortex) are linked with a cerebellar subregion because the
functional roles of the cerebral--cortical areas in question are less
clearly defined—there is probably no single task we could give
to a monkey which, if associated with activity in a cerebellar
neuron, would allow us to conclude that we had found
a ‘‘cerebellar prefrontal’’ or ‘‘posterior-parietal’’ cell. Indeed,
functional imaging studies indicate that the prefrontal cortex
is generally active as part of a broad network of association
cortex. Based on patient work, Schmahmann and colleagues
(Schmahmann 1996, 2004; Schmahmann and Sherman 1998)
have described a schema in which the posterior lobe of the
cerebellum is involved with cognitive or executive functions:
‘‘in patients with lesions involving the posterior lobe of
the cerebellum. . .[they observed] impairment of executive
functions such as planning, set-shifting, verbal fluency, abstract
reasoning and working memory; difficulties with spatial cogni-
tion including visual--spatial organization and memory. . .’’(Schmahmann and Sherman 1998)—but again, the executive
functions described are not exclusively associated with one
region of the cerebral cortex.
Despite these difficulties, an understanding of connectivity
with the cerebral cortex is particularly important in the case of
the cerebellum because the function of its subregions may be
defined by their connectivity. The combination of the
connectional diversity of the cerebellum with the extreme
uniformity of cerebellar microcircuits fits a model in which the
cerebellum applies a particular computational function to
information from a range of cortical areas, rather than having
a functional specialization itself—motor, cognitive, or other-
wise (Eccles et al. 1967; Bloedel 1992; Schmahmann and
Sherman 1998; Ramnani 2006; Ito 2008).
In the present study, we used resting-state functional
magnetic resonance imaging (fMRI) to probe the topography
of cerebral--cortical connectivity in the cerebellar cortex. This
functional connectivity approach uses fMRI data acquired
while the subject is at rest. The concept behind resting-state
fMRI is that when the brain is ‘‘free-wheeling’’ (not involved in
an externally cued task), correlations in slowly fluctuating
spontaneous brain activity tend to reflect the intrinsic
functional networks of the brain (Biswal et al 1995; see Fox
and Raichle 2007 for review). For example, cortical areas
typically associated with motor function show a significant
degree of covariation and are therefore thought to form
a particular ‘‘resting state network’’ (RSN) while cortical areas
associated with visual processing form a separate RSN
(Beckmann et al. 2005). Independent components analysis
indicates that a large percentage of the fMRI signal in the
resting human brain can be explained in terms of just a few (8--
10) RSNs (Damoiseaux et al. 2006). These primary RSNs are
highly consistent across time and space and between individ-
uals, suggesting they represent something fundamental about
the functional organization of the brain. Further discussion of
the resting-state approach and its advantages and caveats is
given in the Discussion.
We mapped resting-state functional connectivity voxel-wise
across the cerebellar cortex for a set of cortical regions or
masks. The result of this analysis was a set of correlation maps
across the cerebellar cortex, representing resting functional
connectivity with each of a number of cortical regions. The
approach used in this study is particularly useful for in-
vestigating whether subdivisions exist within a structure,
because mapping within the structure of interest is voxel-
wise. We defined a set of cerebral--cortical masks representing
known functional systems, and tested the correlation of each
cerebellar voxel with these cortical masks. In contrast, a typical
resting-state approach would be to divide the cerebellum into
regions a priori, and then use the cortical RSNs associated with
each cerebellar region to infer its function or connectivity. The
present approach is similar to that introduced by Zhang et al.
(2008) to map thalamo-cortical connectivity. We used the
method to address a series of specific hypotheses about
cerebro-cerebellar connectivity.
First, we asked whether separate motor and prefrontal zones
could be defined in the cerebellar cortex, based on resting
functional connectivity. The motivation for this analysis was to
replicate the findings of Kelly and Strick (2003, described
above) with the resting state method; the division between
motor and prefrontal also reflects the broad distinction
between motor and executive zones proposed by Schmahmann
(Schmahmann and Sherman 1998).
Second, we further probed the validity of the resting-state
approach through the lateralization of correlations. The white
matter connections between the cerebellum and the cerebral
cortex are crossed, so if resting-state correlations reflect neural
connectivity, the correlation maps should show a contralateral
organization, with voxels in the left cerebellum correlating
954 Resting Functional Connectivity of the Cerebellum d O’Reilly et al.

more strongly with right cortical regions and vice versa. Such
contralateral relationships are much more likely to be neural
than vascular in origin. We might a priori expect artifactual
(non-neurally generated) correlations to be stronger in the
nearer, ipsilateral hemisphere. We therefore compared the
correlation maps for left- and right-hemisphere cortical masks
(using motor and prefrontal cortical masks as above).
Third, we asked how the broad distinction between motor
and prefrontal zones related to other cortical areas. We
extended the set of cortical masks to 6 large zones, represent-
ing different functional systems (prefrontal cortex, motor and
premotor cortex, somatosensory cortex, posterior-parietal
cortex, superior temporal cortex, and visual area middle
temporal [MT]). Between them, the masks covered the regions
of cortex reported to have significant cerebellar-afferent
connections with neurons in the pontine nuclei or cerebel-
lar-efferent connections with the dentate in nonhuman
primates (see above).
Finally, we focused on the connectivity of the cerebellum
with supramodal association cortex (prefrontal and posterior-
parietal cortex), and asked which subregions within the
prefrontal and posterior-parietal masks contributed to the
correlation patterns we observed in the cerebellum. The
motivation for this analysis was that some researchers
(Glickstein 2007) have suggested that only the subregions of
prefrontal and parietal cortex which are involved in motor
control are linked to the cerebellum. If this were the case, we
would expect to see the strong correlation with the cerebellar
supramodal zone in the frontal eye fields and/or area 8 in the
case of the prefrontal cortex mask, and for the parietal cortex,
the anterior intraparietal cortex (aIP), which is involved in
grasping, and superior parietal lobule which contains many
regions involved in the planning of action, thought to be the
homologs of monkey intraparietal sulcus (IPS) regions (see
Culham and Valyear 2006 for review) including lateral intra-
parietal area (LIP; eye movements), medial intraparietal area
(MIP; reaching), and ventral intraprietal area (VIP; movements
in head centered space).
In the Supplementary Information, we present additional
analyses mapping correlation with the Eigen time series of each
mask across the cerebral cortex. These additional analyses give
a picture of which regions within each mask contribute most
strongly to the correlations described below, and indicate the
strength of correlation between the cortical masks.
Materials and Methods
We performed a series of analyses investigating the contrasts between
different sets of masks. These are presented as Analyses 1--4 below. The
procedures which were common to all analyses are presented only in
Analysis 1.
Analysis 1. Motor and Prefrontal Zones in Cerebellar Cortex
Data Acquisition
We collected resting-state fMRI data and anatomical scans for 12 healthy
volunteers (9 females, age range [mean ± SD] 43.08 ± 9.17, range 31--61)
who participated in the experiment in accordance with ethical approval
from the UK Central Office for Research Ethics Committees.
During the 11-min scan, participants lay supine in a 1.5 T Siemens
Sonata MR scanner. They were instructed to close their eyes and lie
still. Cushions were used to reduce head motion. Whole-brain blood
oxygen level--dependent (BOLD) fMRI data sets were collected, using
the following parameters: 45 axial slices, in-plane resolution 3 3 3 mm,
slice thickness 3 mm, no gap, repetition time = 3400 ms, echo time = 41
ms, 200 volumes.
A structural scan was acquired for each participant, in the same
session, using a T1-weighted 3D FLASH sequence (repetition time = 12
ms, echo time = 5.65 ms, and flip angle = 19�, with elliptical sampling of
k space, giving a voxel size of 1 3 1 3 1 mm in 5 min and 5 s).
Data Preprocessing
Data processing was carried out using tools from FMRIB Software
Library, FSL (Smith et al. 2004). The first 6 volumes were discarded,
then the following prestatistics processing was applied: motion
correction using MCFLIRT (Jenkinson and Smith 2001); spatial
smoothing using a Gaussian kernel of FWHM 6 mm; grand-mean
intensity normalization of the entire 4D data set by a single
multiplicative factor; high-pass temporal filtering (Gaussian-weighted
least-squares straight line fitting, with sigma = 50.0 s, that is, at least half-
power was retained for frequencies down to 0.01 Hz).
Masks
Cerebral--cortical and cerebellar masks were created in Montreal
Neurological Institute (MNI) space by combining anatomical masks
from the Harvard--Oxford Structural Atlas or Julich Probabilistic
Histological Atlas. The Harvard--Oxford atlas is a probabilistic atlas
covering 48 cortical and 21 subcortical structural areas, available as
a toolbox in FSLview. To create the atlas, T1-weighted images of 21
healthy male and 16 healthy female subjects (ages 18--50) were
individually segmented by researchers at the Harvard Centre for
Morphometric Analysis using semiautomated tools developed in-house.
The T1-weighted images were affine-registered to MNI152 space using
FLIRT (Jenkinson and Smith 2001), and the transforms then applied
to the individual labels. These were combined across subjects to
form population probability maps for each label. The Julich Atlas is
a probabilistic atlas created by averaging multisubject post-mortem
cyto- and myelo-architectonic segmentations (Eickhoff et al. 2005). The
atlas is based on the microscopic and quantitative histological
examination of 10 human post-mortem brains. The histological volumes
of these brains were 3D reconstructed and spatially normalized into
MNI space. The Julich atlas is also available as a toolbox in FSLview.
Cortical masks were transformed into the space of individual
anatomical scans using nonlinear registration implemented with FNIRT
(Andersson et al. 2007), and then into individual functional space using
affine registration implemented with FLIRT (Jenkinson and Smith 2001).
In Analysis 1, masks were created for the prefrontal and motor/
premotor cortex. The prefrontal mask included the entire lateral
frontal convexity anterior to the precentral sulcus, including superior,
middle, and inferior frontal gyri and the frontal pole. It included the
medial aspect of the superior frontal gyrus and the medial aspect of the
frontal pole. It excluded orbitofrontal cortex, the anterior cingulate and
paracingulate gyrus, and the insula. The motor mask included the entire
lateral cortex posterior to the precentral sulcus and anterior to the
fundus of the central sulcus, and extended onto the medial surface as
far as the paracingulate sulcus. The masks are shown in the top panel of
Figure 1.
Voxel-wise Correlation Mapping
We used a voxel-wise approach to map resting-state functional
connectivity across the cerebellar cortex, between each voxel in the
cerebellar mask and characteristic time series associated with the
cortical regions. First, we calculated the major Eigen time series
representing activity in each of the cortical masks. The major Eigen
time series is the single time series which best reflects coherent activity
across the mask in that it represents the largest amount of variance
across the set of voxels within the mask. We also calculated the major
Eigen time series in masks representing the white-matter and cerebro-
spinal fluid (CSF; across the whole brain volume), which were derived
using FSL tissue segmentation tool FAST (Zhang et al. 2001). Time
series representing head motion were extracted using MCFLIRT
(Jenkinson and Smith 2001). These 8 confound time series (white
matter and CSF Eigen time series, plus 6 time series representing head
motion) were regressed out prior to each analysis. The reason for
regressing out white matter and CSF time series was to minimize the
potential confounding effect of including non--gray-matter voxels in
Cerebral Cortex April 2010, V 20 N 4 955

cerebellar and cortical masks, and to remove any non--tissue-specific
confound effects such as global signal change.
Taking the preprocessed functional data, for each voxel in the
cerebellar mask we calculated the partial correlation scores between its
BOLD time series and the major Eigen time series for each cortical
region, in each case regressing out the time series of all other cortical
regions, so that the resulting correlation maps represented only
correlations specific to the cortical mask in question. The output of
the analysis took the form of correlation maps (across the cerebellum)
in individual functional space, pertaining to each cortical mask.
The approach was similar to that used by Zhang et al. (2008) to map
thalamocortical connectivity, with the exception that we used the first
Eigenvariate to represent the time series of each cortical mask, whereas
Zhang and colleagues used the mean time series of the mask. The Eigen
time series approach has the advantage in terms of robustness, in that it
represents the dominant time series (i.e., a time series which best
Figure 1. Correlation maps for motor and prefrontal cortex. Top panel: the cortical masks in standard (MNI) space. (Left 2 columns a--h) Correlation maps for the bilateral corticalmasks in standard space, showing the voxel-wise significance (Z-score) of the correlation with prefrontal and motor regions in the cerebral cortex. Maps are thresholded at Z[1.6 (equivalent of P\ 0.05 uncorrected) and presented with the left cerebellar hemisphere to the left of the image. Note the clear division of the cerebellar cortex into prefrontaland motor zones. Right 2 columns show the lobular structure of the cerebellum, after Schmahmann (2000), for the slices shown to the left. Note the correspondence betweenLobules IV--VI and VIII (red and green) with the motor zone, and Lobule VII (blue) with the prefrontal cortex. Abbreviations: crI, Lobule VIIa Crus I; crII, Lobule VIIa crus II; V, VI, VIII,Lobules V, VI, and VIII.
956 Resting Functional Connectivity of the Cerebellum d O’Reilly et al.

characterizes the majority of observed signal variation within the
mask)—see Friston et al. (1996). As a Gedankenspiel, imagine 2
perfectly anticorrelated voxels of identical variance: in this case the
mean would be constant and therefore fail to characterize the observed
variations, whereas the Eigen time series fully describes the signal
dynamics. Furthermore, it minimizes the danger that imprecise mask
boundaries could allow tissue from adjacent regions with distinct
functional profiles to contribute to the mask time course. In order to
calculate this quantity, all voxels’ time series within a given masks are
assembled within a time 3 voxels matrix which, after removing the
mean value per voxel, is then subjected to a Singular Values
Decomposition in order to obtain the Eigen vectors of this matrix.
Group Analysis
Individual correlation maps were converted back into MNI space, first
using an affine transformation from the space of individual functional to
anatomical scans, then into MNI space using nonlinear registration
implemented using FNIRT (as above). The standard-space correlation
maps were entered into a group General Linear Model analysis using a
fixed-effects approach. The resulting images (see Fig. 1) showZ-scores for
the group correlation. Z-scores of peak voxels (see Tables 1--3) ranged
from Z = 1.96 (P < 0.025) to Z = 4.85 (P < 10–7). In order to estimate the
full extent of overlap and segregation between the correlation maps for
different cortical masks, a low threshold of Z > 1.6 was used (the
equivalent of P < 0.05 uncorrected) for the images in Figures 1--3.
Analysis 2: Lateralization of Cerebro-cerebellar ConnectivityWe divided the motor and prefrontal masks from Analysis 1 into left-
and right-hemisphere masks. The 4 resulting masks were entered into
a voxelwise correlation mapping as in Experiment 1. The data set was
the same one used in Analysis 1. Preprocessing and analysis techniques
were as in Analysis 1.
In addition to the voxelwise correlation mapping, we quantitatively
probed the lateralization of connectivity in the following way. First we
defined 4 anatomical regions of interest (ROIs) in the cerebellum—left-
and right superior cerebellum (Lobules IV--VI) and left- and right Crus
I/II. These regions were selected on the basis of the results of Analysis
1. We then calculated the mean correlation between voxels in the left-
and right-superior cerebellum and the left- and right motor cortex, and
between voxels in the left- and right Crus I/II and left and right
prefrontal cortex. Correlations were calculated for each subject,
excluding voxels with negative or zero correlation.
To test for significant lateralization of correlations, we compared the
correlation of each cerebellar hemisphere with its 2 corresponding
cortical masks (e.g., left Crus I/II with left prefrontal cortex vs. left Crus
I/II with right prefrontal cortex). We then ascertained the statistical
significance of the lateralization effect by a permutation test in which
the data for the 2 cortical masks were randomly permuted 10 000 times
(with each permutation representing an exchange of data for the left-
and right-cortical masks in a random subset of subjects).
Analysis 3: Six Cortical MasksWe created 6 cortical masks, covering the regions of cerebral cortex in
which connectivity with the cerebellum has been reported in
anatomical tracer studies. The masks, which were bilateral, represented
Table 1Peak correlation coordinates: motor and prefrontal target masks
Cerebellarlobule
x y z Z-score
Prefrontal cortexCrus I L �36 �74 �46 4.46
R 42 �72 �48 4.17Crus II L �34 �66 �32 3.45
R 28 �68 �30 4.25Paravermal lobule VIIa L �6 �86 �32 3.42
R 6 �82 �28 3.36Lobule HIX (tonsil) L �8 �58 �56 2.29
R 6 �58 �54 3.35Motor/premotor cortexLobule V L �14 �48 �14 3.68
R 14 �46 �14 3.31Lobule VI L �20 �60 �16 3.65
R 18 �58 �14 4.00Lobule VIII L �24 �54 �60 2.48
R 28 �56 �58 2.54
Note: This table gives MNI coordinates for the voxel with the peak Z-score in each cluster for the
correlation maps corresponding to motor and prefrontal cortex, that is, the results of Analysis 1.
Z-scores were calculated using a between-subjects fixed-effects GLM on all 12 subjects’
individual correlation maps, in standard (MNI) space.
Table 2Peak correlation coordinates: 6 cortical regions
Anatomicallabel
x y z Z-score
Visual area MT correlationsV/VI L �18 �72 �18 3.92
R 16 �68 �16 3.81VIII L �14 �74 �52 2.81
Superior temporal/auditory correlationsV/VI L �20 �64 �16 2.80
R 18 �60 �16 2.11Somatosensory correlationsV/VI L �20 �58 �18 3.40
R 20 �64 �18 2.52VIII L �22 �52 �60 2.49
R 24 �62 �58 1.97Motor/premotor correlationsV/VI L �20 �52 �20 3.36
R 34 �48 �26 2.48VIII L �22 �54 �60 2.13
R 30 �58 �62 2.64Posterior-parietal correlationsVIIa (paravermal) L �10 �88 �34 3.09
R 14 �86 �42 2.60Crus II L �44 �68 �52 3.64
R 42 �70 �50 2.40Prefrontal correlationsVIIa (paravermal) L �8 �86 �44 3.24
R 12 �88 �42 2.75Crus I L �32 �64 �32 2.48
R 28 �70 �30 3.32Crus II L �42 �74 �48 3.74
R 38 �72 �50 3.95
Note: This table gives MNI coordinates for the voxel with the peak Z-score in each cluster for the
correlation maps corresponding to 6 cortical regions, that is, the results of Analysis 3. Z-scores
were calculated using a between-subjects fixed-effects GLM on all 12 subjects’ individual
correlation maps, in standard (MNI) space.
Table 3Peak correlation coordinates within the prefrontal and posterior-parietal cortex
Anatomicallabel
x y z Z-score
Correlations in prefrontal cortexPosterior medial frontal gyrus (area 8) L �36 14 56 3.76
R 38 16 54 4.02Middle medial frontal gyrus (area 9/46) L �36 28 46 3.85
R 24 28 48 3.29Frontal pole L �26 56 24 4.17
R 40 54 16 4.42Correlations in posterior-parietal cortexInferior parietal lobule L �48 �64 50 4.18
R 48 �62 50 4.72Medial superior parietal lobule (area 7b, M) M 4 �72 44 4.74Posterior cingulate M �2 �28 38 3.90
Note: This table shows the regions in the prefrontal and posterior-parietal cortex which were
most strongly correlated with a subregion of the cerebellum: that is, the results of Analysis 4. The
subregions of the cerebellum used comprised those voxels identified as having significant
correlation with the prefrontal and parietal masks as a whole, in Analysis 3. MNI coordinates are
given for the voxel with the peak Z-score in each cluster; Z-scores were calculated using
a between-subjects fixed-effects GLM on all 12 subjects’ individual correlation maps, in standard
(MNI) space.
Cerebral Cortex April 2010, V 20 N 4 957
different broad functional zones of cerebral cortex. As in Analysis 1,
they were created by combining masks from the Harvard--Oxford
structural atlas. The masks were prefrontal cortex (as described in
Analysis 1, above); motor/premotor cortex (as described in Analysis 1,
above); somatosensory cortex (all the lateral cortex lying posterior to
the fundus of the central sulcus and anterior to the fundus of the
postcentral sulcus), posterior-parietal cortex (all the lateral cortex
posterior to the postcentral sulcus and anterior to the parieto-occipital
sulcus, and the corresponding tissue on the medial surface extending
to the paracingulate sulcus on the medial surface); visual area MT/V5
(this mask was taken from the Julich Histological atlas, using the voxels
for which MT was the classification with the highest probability);
superior temporal cortex including auditory cortex and adjacent
association cortex (temporal lobe cortex superior to the superior
temporal sulcus, including the planum temporale).
The data set and preprocessing were as in Analysis 1. The voxelwise
correlation mapping procedure was as described in Analysis 1, but each
cortical mask was processed in a separate analysis run, with the effect
that at each cerebellar voxel the correlation with each cortical mask
was calculated separately: the correlations with other cortical masks
were not partialled out as in Analyses 1 and 2 (although the confound
time series relating to white matter, CSF, and motion were partialled
out as in Analysis 1). Thus, the correlation maps generated in this
analysis could include voxels which have a high resting state
correlation with more than one cortical mask. The reason for this
approach was to visualize overlap between the RSNs of different
cortical systems as well as the difference between them (e.g.,
somatosensory and motor regions of the cerebellum are known to
overlap—see Discussion).
Analysis 4: Projecting Correlations Back on Prefrontal andParietal CortexTo do this we reversed the strategy of the previous analyses. We
defined prefrontal and parietal zones in the cerebellar cortex, based on
the results of Analysis 3, and extracted the first Eigen time series from
these masks. The original prefrontal and posterior-parietal cerebral--
cortical masks now took the role of voxels to be classified. This reverse
approach allowed us to probe which voxels within the cerebral--
cortical masks drove the correlation with the cerebellum.
The cerebellar masks were defined from the group Z-score maps
from Analysis 3, corresponding to the prefrontal and posterior-parietal
cerebral--cortical masks. Voxels with a Z-score above 1.6 (equivalent of
P < 0.05 uncorrected) were included in the cerebellar masks—that is,
all those voxels shown in the correlation map for prefrontal or parietal
cortex in Figure 3 were included. The cerebellar masks were not
binarized, so those voxels with a stronger Z-statistic for correlation
with the cortical masks contributed more strongly to the calculation of
the Eigen time series. The cerebellar ‘‘prefrontal zone’’ mask included
a large part of Crus II, a smaller area in Crus I, and a third peak in
paravermal Lobule HVIIa. The cerebellar ‘‘posterior-parietal zone’’ mask
was similar, except that the contribution of Crus I was much weaker
(see Fig. 3 and Table 2).
The data set was the same one used in Analysis 1. Preprocessing and
analysis techniques were as in Analysis 1, but note the reversal of roles
of cortical and cerebellar masks.
Note that this approach is roughly equivalent to correlating the
original Eigen time series derived from the prefrontal and posterior-
parietal ROIs with each voxel in the cortex, as in the Supplementary
Information, and the results of the 2 analyses are correspondingly similar.
Results
Results 1. Motor and Prefrontal Zones in CerebellarCortex
The cerebellar correlation maps generated by this analysis are
shown in Figure 1; peaks of correlation are given in Table 1.
Voxels which had strong resting functional connectivity with
the prefrontal cortex were found mostly in the posterior
cerebellum and particularly in Lobule HVIIa, Crus II, with
a smaller region in Crus I and a few significantly correlated
voxels in Lobule HIX (i.e., the tonsil). For the motor mask, the
strongest resting state functional connectivity was in Lobule
HVI, extending into Lobule HV and (marginally) Lobule HIV. A
second motor-correlated region was present in Lobule HVIII. In
all cases the zones of correlation were largely symmetrical
across the left- and right-cerebellar hemispheres.
Results 2: Lateralization of Cerebro-cerebellarConnectivity
The results of this analysis are shown in Figure 2. The
lateralized correlation analysis indicated a contralateral map-
ping between cortical masks and strength of correlation in the
cerebellum. That is, for the right-hemisphere cortical masks,
correlation was stronger in the left cerebellum and vice versa.
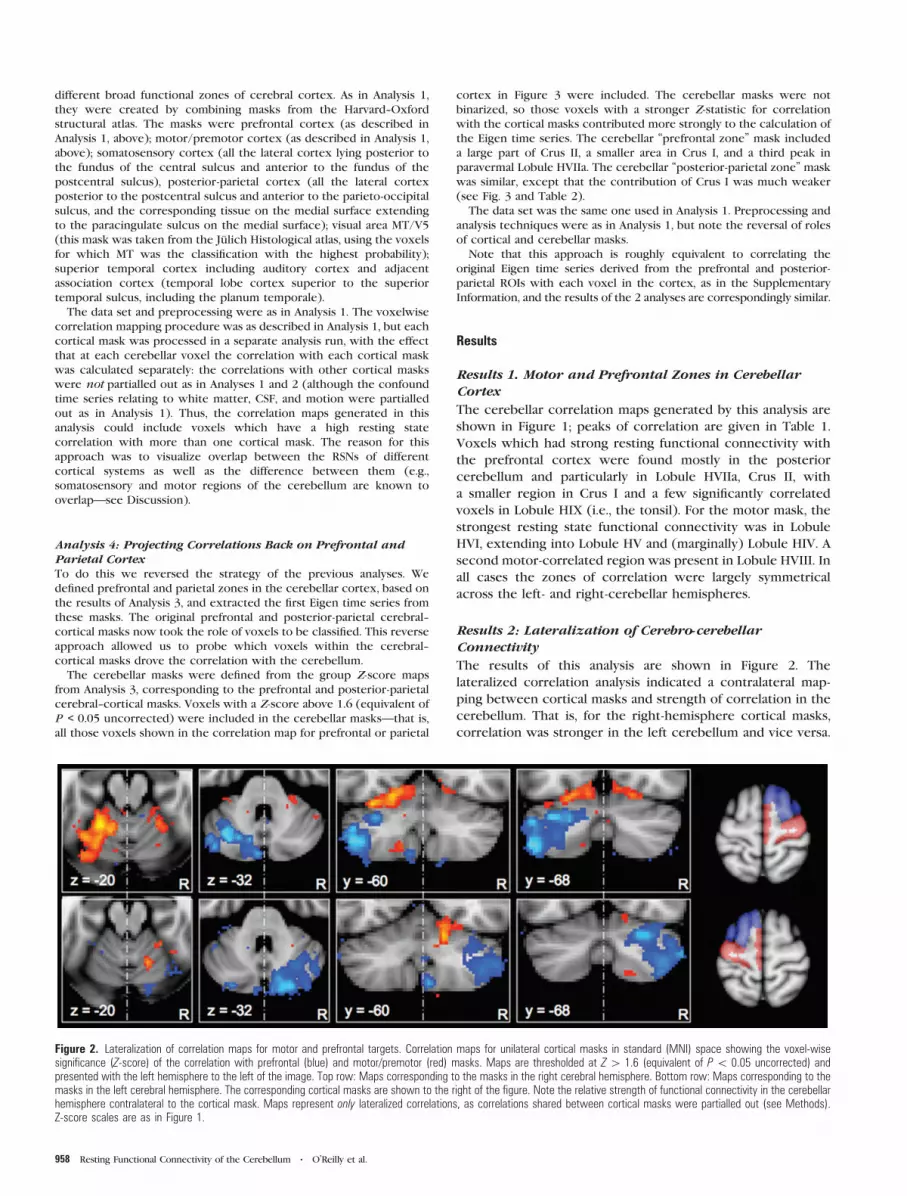
Figure 2. Lateralization of correlation maps for motor and prefrontal targets. Correlation maps for unilateral cortical masks in standard (MNI) space showing the voxel-wisesignificance (Z-score) of the correlation with prefrontal (blue) and motor/premotor (red) masks. Maps are thresholded at Z[ 1.6 (equivalent of P\ 0.05 uncorrected) andpresented with the left hemisphere to the left of the image. Top row: Maps corresponding to the masks in the right cerebral hemisphere. Bottom row: Maps corresponding to themasks in the left cerebral hemisphere. The corresponding cortical masks are shown to the right of the figure. Note the relative strength of functional connectivity in the cerebellarhemisphere contralateral to the cortical mask. Maps represent only lateralized correlations, as correlations shared between cortical masks were partialled out (see Methods).Z-score scales are as in Figure 1.
958 Resting Functional Connectivity of the Cerebellum d O’Reilly et al.

Figure 3. Correlation maps for 6 cortical regions. Presented in panels (a--f) are group correlation maps in standard (MNI) space, showing the voxel-wise significance(Z-score) of the correlation with each of 6 cortical masks in the cerebral cortex—from top to bottom, (a) visual area MT, (b) superior temporal cortex, (c) somatosensorycortex, (d) motor and premotor cortex, (e) posterior-parietal cortex, and (f) prefrontal cortex. Maps are thresholded at Z[ 1.6 (equivalent of P\ 0.05 uncorrected) andpresented with the left cerebellar hemisphere to the left of the image. Each row corresponds to one cortical mask; the mask is shown to the right of the row. The set ofcortical masks are shown together in the top panel. Note that the correlation maps fall into 2 patterns, shown in blue and red colorways above: the correlation maps forvisual, auditory, somatosensory, and motor cortices were highly similar, and different from the correlation maps for prefrontal and posterior-parietal cortex, which in turn weresimilar to each other.
Cerebral Cortex April 2010, V 20 N 4 959
In each case, within the active cerebellar hemisphere, the
pattern of activity was observed as in Analysis 1: that is, Lobules
HV, HVI, and HVIII correlated with the motor cortex and Crus I
and II correlated with the prefrontal mask.
Quantitative comparison of the strength of correlation
between cerebellar ROIs and the 2 cortical hemispheres
revealed a highly significant lateralization effect for the
connectivity of Crus I/II in both cerebellar hemispheres (i.e.,
the correlation between each Crus I/II mask and the
contralateral prefrontal mask was much greater than the
correlation with the ipsilateral mask)—P < 0.00001 in both
cases. For the superior cerebellar ROIs, the pattern was
statistically weaker—contralateral correlations were signifi-
cantly stronger than ipsilateral correlations for the left
cerebellar region of interest (P < 0.00001), but, although
contralateral correlations were greater than ipsilateral correla-
tions for the right superior cerebellum (see Fig. 2), this
lateralization was not statistically significant (P = 0.245).
Results 3: Six Cortical Masks
The correlation maps corresponding to the 6 cortical regions
are shown in Figure 4; coordinates of peak correlations are
given in Table 2. The correlation maps for visual area MT,
auditory (superior temporal), somatosensory, and motor/
premotor cortex were similar: in each case, Lobule HVI
showed the strongest correlation with the cortical region.
For the motor/premotor, visual, and somatosensory masks,
correlations were also observed in Lobule HVIII. The correla-
tion maps for prefrontal and posterior-parietal masks had peaks
in Crus II, with further peaks in Crus I for the prefrontal cortex.
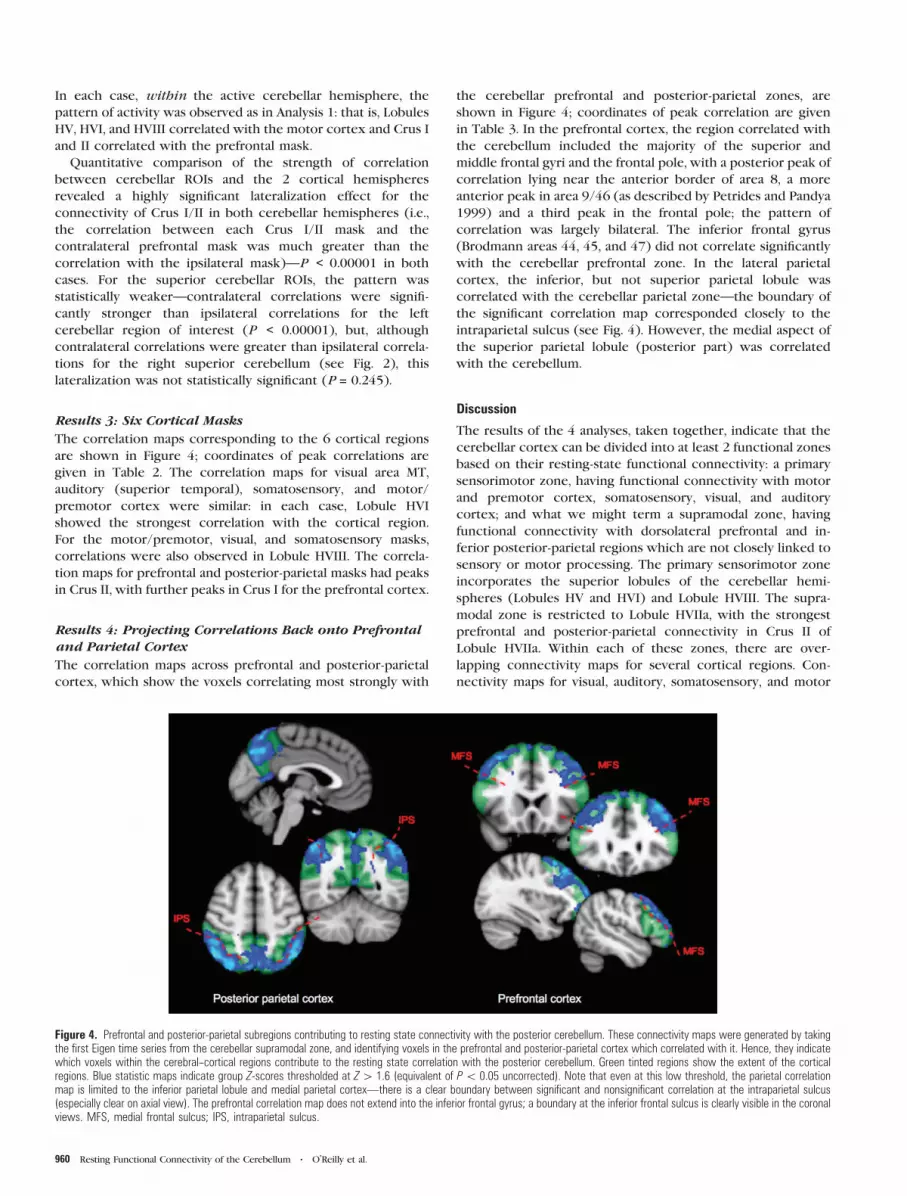
Results 4: Projecting Correlations Back onto Prefrontaland Parietal Cortex
The correlation maps across prefrontal and posterior-parietal
cortex, which show the voxels correlating most strongly with
the cerebellar prefrontal and posterior-parietal zones, are
shown in Figure 4; coordinates of peak correlation are given
in Table 3. In the prefrontal cortex, the region correlated with
the cerebellum included the majority of the superior and
middle frontal gyri and the frontal pole, with a posterior peak of
correlation lying near the anterior border of area 8, a more
anterior peak in area 9/46 (as described by Petrides and Pandya
1999) and a third peak in the frontal pole; the pattern of
correlation was largely bilateral. The inferior frontal gyrus
(Brodmann areas 44, 45, and 47) did not correlate significantly
with the cerebellar prefrontal zone. In the lateral parietal
cortex, the inferior, but not superior parietal lobule was
correlated with the cerebellar parietal zone—the boundary of
the significant correlation map corresponded closely to the
intraparietal sulcus (see Fig. 4). However, the medial aspect of
the superior parietal lobule (posterior part) was correlated
with the cerebellum.
Discussion
The results of the 4 analyses, taken together, indicate that the
cerebellar cortex can be divided into at least 2 functional zones
based on their resting-state functional connectivity: a primary
sensorimotor zone, having functional connectivity with motor
and premotor cortex, somatosensory, visual, and auditory
cortex; and what we might term a supramodal zone, having
functional connectivity with dorsolateral prefrontal and in-
ferior posterior-parietal regions which are not closely linked to
sensory or motor processing. The primary sensorimotor zone
incorporates the superior lobules of the cerebellar hemi-
spheres (Lobules HV and HVI) and Lobule HVIII. The supra-
modal zone is restricted to Lobule HVIIa, with the strongest
prefrontal and posterior-parietal connectivity in Crus II of
Lobule HVIIa. Within each of these zones, there are over-
lapping connectivity maps for several cortical regions. Con-
nectivity maps for visual, auditory, somatosensory, and motor
Figure 4. Prefrontal and posterior-parietal subregions contributing to resting state connectivity with the posterior cerebellum. These connectivity maps were generated by takingthe first Eigen time series from the cerebellar supramodal zone, and identifying voxels in the prefrontal and posterior-parietal cortex which correlated with it. Hence, they indicatewhich voxels within the cerebral--cortical regions contribute to the resting state correlation with the posterior cerebellum. Green tinted regions show the extent of the corticalregions. Blue statistic maps indicate group Z-scores thresholded at Z[ 1.6 (equivalent of P\ 0.05 uncorrected). Note that even at this low threshold, the parietal correlationmap is limited to the inferior parietal lobule and medial parietal cortex—there is a clear boundary between significant and nonsignificant correlation at the intraparietal sulcus(especially clear on axial view). The prefrontal correlation map does not extend into the inferior frontal gyrus; a boundary at the inferior frontal sulcus is clearly visible in the coronalviews. MFS, medial frontal sulcus; IPS, intraparietal sulcus.
960 Resting Functional Connectivity of the Cerebellum d O’Reilly et al.

cortex overlap in the primary sensorimotor zone; connectivity
maps for prefrontal and posterior-parietal cortex overlap in the
supramodal zone.
Compatibility with Previous Models
The results described here are largely compatible with
Schmahmann’s schema in which the cerebellum can be divided
into motor and executive zones (e.g., Schmahmann and
Sherman 1998), and with the parallel circuits model of Strick
and colleagues (e.g., Dum and Strick 2003), which also suggests
that separate functional zones should be present within
cerebellar cortex. However, there are some aspects of the
present findings which should be discussed in relation to the
models of Schmahmann (e.g., Schmahmann and Sherman 1998;
Schmahmann and Caplan 2006) and Strick (e.g., Middleton and
Strick 1997; Dum et al. 2002).
First, the precise location of primary and supramodal zones:
Schmahmann describes a relationship between the anterior lobe
of the cerebellum and motor function, and between the
posterior lobe and executive function (see Introduction). The
anterior lobe of the cerebellum is, strictly speaking, limited to
the lobules anterior to the primary fissure (that is Lobles I--V),
and the posterior lobe comprises Lobules VI--X. In contrast, we
observed the anterior boundary between sensorimotor and
supramodal zones to lie at the superior-posterior fissure, that is,
between Lobule VI and Lobule VIIa/Crus I. We also observed
a second primary sensorimotor zone within the posterior
cerebellum, in Lobule HVIII. Thus, our supramodal zone was
limited to Lobule HVIIa, Crus I and II, not the whole posterior
cerebellum.
The pattern of functional connectivity observed in the
present study is, however, compatible with longstanding
observations that there are sensori-motor representations of
the body in both the superior cerebellum (Lobules IV--VI) and
inferior cerebellum (Lobules HVIIb and HVIII)—evoked
potentials following peripheral tactile stimulation were first
observed in the 1940s (Adrian 1943; Snider and Stowell 1944),
and later it was confirmed that the representations could be
activated by stimulating the cerebral-cortical motor and
somatosensory areas (Allen et al. 1974; Allen et al. 1979; Snider
and Eldred 1952). More recently, the same pattern has been
confirmed in the human brain in functional imaging studies
(e.g., Jueptner et al. 1997; Bushara et al. 2001; Grodd et al. 2001;
Thickbroom et al. 2003), and white matter connections from
motor cortex to Lobles HIV--HVI and HVIII have been traced in
the monkey (Kelly and Strick 2003, Lu et al. 2007). The
concentration of supramodal projections in Crus II was
confirmed by the anatomical work of Kelly and Strick (in the
case of prefrontal cortex), whereas in an electrophysiological
study, stimulation of parietal association cortex in the cat
excited cells in Crus I and II, whereas cells in Lobules IV--VI and
HVIII were more readily excited by stimulation of motor cortex
(Sasaki et al. 1975).
In relating the present work to patient studies, however, it is
worth noting that in the human brain Crus I and II make up the
large majority of the volume of the cerebellum posterior to
Lobule VI. Thus, in terms of the tissue lost in lesions of the
posterior cerebellum in human patients, motor representations
in Lobule HVIII would be a relatively minor component.
Second, although our results support Strick’s model of
parallel circuits for prefrontal and motor cerebro-cerebellar
connectivity, we also observed considerable overlap between
the functional connectivity maps for some cortical regions:
that is, sensory and motor cortical regions roughly shared one
cerebellar map, whereas prefrontal and posterior-parietal
cortex shared a second, separate cerebellar map. This overlap
was observed when partial correlations between cortical
masks were not removed from the data—indicating that some
voxels had correlations with 2 sensory (or 2 supramodal)
cortical masks. How can this overlap be reconciled with the
parallel circuits model? First, note that the parallel circuits
observed by Strick and colleagues pertained to motor and
prefrontal connections, not to sensory connections (which
were not traced). When Clower et al. (2005) investigated
the dentate connectivity of a parietal region, aIP, they noted
that instead of having a discrete output channel from the
cerebellum, aIP also received connections from regions of the
dentate projecting to other areas of cerebral cortex, including
M1 and ventral premotor cortex. In other words, they ob-
served a degree of overlap between cortico-cerebellar circuits
when cerebellar outputs were going to functionally related
cerebral areas.
The present results suggest that although there are parallel
circuits for supramodal/executive and motor functions, in-
formation from sensory and motor areas of cerebral cortex is
actually brought together in the sensorimotor zone of the
cerebellum—at least, the same set of voxels share connections
with several cortical systems (note that the resolution of fMRI
is insufficient to determine how the inputs are integrated at
a microcircuit level). This is in accordance with electrophys-
iological studies, in which evoked potentials were observed in
Lobules V and VI following peripheral visual, auditory and
somatosensory stimulation (Snider and Eldred 1952). In
a popular model of cerebellar function, the cerebellum
computes forward models of motor behavior (Wolpert and
Miall 1996); sensory feedback is required to set up and refine
such a model. Furthermore, output from an internal forward-
model can be used to ‘‘cancel out’’ sensory feedback caused by
one’s own actions—for example, in self-tickling, increased
activity in the superior cerebellum is associated with decreased
activity in somatosensory cortex and decreased ticklish
sensation (Blakemore et al. 1999). Indeed, it has been proposed
that sensory processing, not motor control, is the main
function of cerebellar sensorimotor circuits (Bower 1997). It
seems, therefore, that the cerebellum brings together motor
and sensory information to predict the effects of motor
commands on both body position and sensory processing.
(Strick and colleagues [e.g., Dum and Strick 2003] observed
separate output channels in the dentate nucleus for different
effectors [i.e., within the channel for M1, they observed
separate channels for connections to hand, face, and leg areas].
It is tempting to suggest that connections with somatosensory
cortex should overlap with these motor output channels, but
keeping the same strict somatotopy. However, note that the
present study only indicates correlations between cerebral and
cerebellar-cortical activity, which must be mediated by multi-
synaptic circuits. The method used here cannot indicate how
sensory and motor information enters the cerebellum—e.g.,
some computational models of cerebellar microcircuits suggest
that sensory information used to refine forward models [i.e., as
an error signal] would be carried in climbing fibers, arising in
the inferior olive [i.e., it would bypass the pons]. Therefore, the
presence of overlapping resting-state networks does not
Cerebral Cortex April 2010, V 20 N 4 961
necessarily predict a certain organization of cells in the pons or
dentate nucleus.) This cancellation, or error detection, may
arise from the convergence of mossy fiber inputs from cerebral
cortex, climbing fiber inputs via the inferior olive, and feedback
from the peripheral nervous system—all of these inputs are
thought to converge on a similar somatotopic map in the
sensorimotor part of the cerebellum (Provini et al. 1968;
Andersson and Nyquist 1983); the resting state connectivity
observed in the present study could arise from the cortico-
pontine or cortico-olivary pathway, or likely both.
Visual and Auditory Functional Connectivity
As well as somatosensory and motor/premotor cortex, the
primary sensorimotor zone has resting functional connectivity
with visual area MT and the superior temporal cortex,
including auditory cortex and auditory association cortex.
Connections from both areas have been traced to the pons
(MT: Glickstein et al. 1994; superior temporal cortex:
Schmahmann and Pandya 1991, 1992). This probably reflects
the importance of visual and auditory information in motor
control. For example, the cerebellum is essential to calibrate
the relationship between visual and somatosensory/motor
information—this can be seen in experiments with prismatic
glasses (Pisella et al. 2005; Luaute et al. 2009). In terms of
superior-temporal connectivity, the cerebellum may be in-
volved in relating auditory feedback to motor control in speech
(Watkins et al. 2008). Interestingly, although present, the
connections from superior temporal cortex to the pons were
relatively weak in the monkey (Schmahmann and Pandya
1991). We might hypothesize that cerebellar-auditory con-
nections would be stronger in the human, reflecting the role of
the cerebellum in speech production.
The Supramodal Zone of the Cerebellum
Using resting state functional connectivity, we identified
a ‘‘supramodal zone’’ in the posterior cerebellum, largely in Crus
II. This region of the cerebellum had strong functional
connectivity with the prefrontal and posterior-parietal cere-
bral--cortical regions.
It has been argued (Glickstein 2007) that frontal and parietal
connections with the cerebellum are dominated by subregions
involved in motor control, such as the frontal eye fields.
However, when we mapped the strength of resting state
correlation with the posterior cerebellum across our prefrontal
and parietal masks (Analysis 4), the regions with the strongest
cerebellar correlation were those which are not closely
involved in sensory or motor processing. In the prefrontal
cortex, the entire middle and superior frontal gyri, and the
frontal pole, showed strong correlation with the posterior
cerebellar supramodal zone. In contrast, no significant corre-
lation was observed in the region at the posterior border of
prefrontal cortex (area 8/6 border), described by Paus (1996)
to contain the human frontal eye fields, although a peak was
observed toward the anterior border of area 8. Neither did the
inferior frontal gyrus, containing Broca’s area (which is
implicated in fine motor control) show significant correlation
with the posterior cerebellum—this is in accordance with
tracer work in monkeys (Glickstein et al. 1985; Schmahmann
and Pandya 1997) and degeneration studies in humans (Beck
1950), in which pontine projections were found to be much
stronger from the dorsolateral than ventrolateral prefrontal
cortex in the monkey (although Schmahmann and Pandya did
observe weak connections from Broca’s area to the pons, so the
present results may reflect the dominant rather than exclusive
connectivity pattern).
In the parietal cortex, the significant correlation with the
posterior cerebellum was limited to the inferior parietal lobule
(Fig. 4). The inferior parietal cortex has been implicated in
executive functions such as attentional orienting (Corbetta
et al. 2000; Kincade et al. 2005) and theory of mind (Saxe and
Kanwisher 2003; Young and Saxe 2009). In contrast, the
superior parietal cortex (which was not significantly correlated
with the posterior cerebellum in the present analysis) is
thought to contain regions homologous to the monkey IPS
areas involved in the planning of movement such as LIP, MIP,
and VIP (see Culham and Valyear 2006 for review).
Are these supramodal connections supported by prior
anatomical evidence? Tracer studies indicate that connections
between the dorsolateral prefrontal cortex and cerebellum do
exist in monkeys: Glickstein et al. (1985) first observed
prefrontal-pontine projections, and Schmahmann and Pandya
(1997) confirmed that cells in the pontine nuclei were labeled
even after injections of tracer into anterior parts of dorsolateral
prefrontal cortex which were distant from the frontal eye fields.
Several studies from Strick’s group have indicated connections
from the ventral dentate (Dum et al. 2002; Middleton and Strick
2001) or Crus II of cerebellar cortex (Kelly and Strick 2003) to
dorsolateral prefrontal cortex. Meanwhile, electrical stimulation
of parietal association cortex elicits evoked potentials in the cat
cerebellum, Crus I and II (Sasaki et al. 1975).
In the monkey, the prefrontal cortex makes up a relatively
minor proportion of cerebellar input compared with motor and
premotor cortex. However, supramodal cortico-cerebellar
connections may be more substantial in the human brain than
the monkey: The region of cerebellar cortex which connects
with prefrontal cortex is enlarged in monkeys compared with
cats, and is much larger in humans than in monkeys (Ramnani
2006). In parallel, the proportion of white matter in the
cerebral peduncle (a major tract from the cerebral cortex to
the cerebellum) arising from the prefrontal cortex is larger in
humans than in macaque monkeys (Ramnani et al. 2006).
Therefore, although the proportion of the cerebellum falling in
the supramodal zone in the present study is strikingly large
(see Fig. 2), in fact the difference from known monkey anatomy
is quantitative—the same lobules are involved in both species
(Lobule HVIIa, mainly Crus II).
Our findings indicate that the posterior cerebellar supra-
modal zone is genuinely associated with ‘‘higher order’’
association cortex. Nonetheless, note that in the analysis of
which parietal and prefrontal areas drive the connectivity with
posterior cerebellum (Analysis 4), we explicitly looked for
those voxels correlating with an Eigen time series derived from
the posterior cerebellum (Crus II). The mask from which that
time series was obtained was defined as the voxels having
a significant correlation with the first Eigen time course of the
prefrontal- or posterior-parietal cortical mask. Therefore,
although our results confirm that a region of the cerebellum
exists which has strong resting functional connectivity with
nonmotor regions of prefrontal and parietal cortex, it does not
rule out the possibility that regions of the parietal and
prefrontal cortex which are more closely involved in sensori-
motor function also participate in a separate RSN with
a different cerebellar subregion.
962 Resting Functional Connectivity of the Cerebellum d O’Reilly et al.

Regions Not Correlated with Any Mask
Some parts of the cerebellum did not show significant
correlation with any mask in our analyses—notably, Lobules I--
III and most of Lobule IV, parts of Lobule VIII, medial Lobule IX
(the uvula) and the entire vermis. The masks used here do not
cover the entire brain, but rather represent some functionally
distinct systems which are known to have significant connec-
tions with the cerebellum. It is therefore possible that the
unlabeled parts of the cerebellum receive input from parts of the
cerebral cortex which were not included in the masks.
Alternatively, these areas may have connections limited to
subcortical nuclei, or inputs dominated by peripheral receptors
(the body and sense organs). It is also possible that some cortical
time series, which would have contributed to cortico-cerebellar
functional connectivity, were ‘‘swamped’’ by the inclusion of
more than one functional region in a cortical mask. In future,
approaches may be developed in which the cortical subdivisions
and cerebellar subdivisions are both defined in a data-driven way;
such a data-driven approach would allow a more comprehensive
parcellation of the cerebellum.
Caveats and Benefits of the Resting State FunctionalConnectivity Method
Resting-state functional connectivity is not a direct measure of
anatomical connectivity. Although anatomical connectivity
(assessed with diffusion weighted imaging tractography) is
strongly correlated with resting state functional connectivity
(Hagmann et al. 2008), both diffusion tractography and resting-
state connectivity can reflect multisynaptic connections. Thus,
there are 3 important caveats in the interpretation of resting
state ‘‘connectivity.’’ First, we do not know the direction of
information flow between cerebral and cerebellar cortices (the
parallel circuits model suggests that cerebro-cerebellar con-
nections are likely to be bidirectional so the flow of information
could be either way). Second, some of the cerebral--cortical
areas having strong resting state functional connectivity with
the cerebellum may only share information with the cerebel-
lum via a mediating cortical or subcortical area (although all
areas described in this paper are known to have anatomical
connections with the pons or dentate). Third, resting-state
correlations cannot indicate the route which multisynaptic
connections take from the cortex to the cerebellum or vice
versa. The anatomical connections linking cerebral- and
cerebellar cortex in a RSN could be afferents via the pons or
the inferior olive, or efferents via the dentate, or indeed all 3 (as
we might expect from the parallel circuits model).
Despite these limitations, it is a strength of the resting state
approach that RSNs give an immediate measure of functional
cohesion—even if this is mediated by multisynaptic pathways—
and thus anatomical and functional measures might be
regarded as complimentary. For example, say a cortical area
X has anatomical connections with 4 other cortical regions A,
B, C, and D. Should these 5 regions be viewed as a single
network, or is it possible that the central ‘‘node’’ participates in
2 functionally distinct networks, AXB and CXD? Resting state
analysis can distinguish between these 2 hypotheses because it
takes account of the changing pattern of relationships between
areas over time.
In the specific case of the cerebellum, the resting-state
approach is particularly valuable for 2 reasons. First, because of
the difficulty in mapping connections of the cerebellar cortex
with traditional anatomical methods (discussed above). Second,
using fMRI allows us to study the functional organization of the
cerebellum in the human brain. This is interesting because
there are morphological differences between the human
cerebellum and those of other species—quantitatively, the
supramodal zone (Crus I and II) of the cerebellum is much
bigger in humans than macaques—the difference is compara-
ble to the difference in size between the human and monkey
prefrontal cortices (Ramnani 2006). There are also topograph-
ical differences in the organization of cortico-pontine projec-
tions between cats and monkeys (Brodal 1978). In primates,
the cerebellum is important in fine motor control and tactile
exploration with the fingertips (Gao et al. 1996). In humans, it
is possible the cerebellum also plays a role in the production of
speech (another behavior requiring fine motor control). Thus,
although it seems likely that the computational function of
cerebellar microcircuits is conserved across species, the
relative importance of different cortical inputs might be
expected to differ between species in line with differences in
behavior and sensory acuity.
Using the resting-state approach, we were able to replicate
the pattern of connectivity between cerebellar- and cerebral
cortex observed by Kelly and Strick (2003), and found the
expected pattern of lateralization of connections. Having
validated the method against existing data, we went on to
expand our analysis to more cortical regions, and to identify
which parts of our cortical masks drove cerebellar connectiv-
ity. Overall, the results provide further support for the growing
body of anatomical, clinical, and neuroimaging findings which
suggest regional differences within the cerebellum.
Conclusions
The human cerebellum can be divided into at least 2 zones
based on resting-state functional connectivity: 1) A primary
sensorimotor zone, having strong functional connectivity with
motor and premotor cortex, somatosensory cortex, and some
visual and auditory regions. 2) A supramodal zone, having
strong resting state functional connectivity with the prefrontal
and parietal cortex. Each of these zones contains overlapping
connectivity maps for different cortical areas—primary sen-
sory and motor zones, and supramodal association cortex,
respectively.
Supplementary Material
Supplementary material can be found at: http://www.cercor.
oxfordjournals.org/.
Funding
Biotechnology and Biological Sciences Research Council grant
(BBS/B/16313 to H.J.B.); Wellcome Trust grant (070204/z/05/z
to H.J.B.); NIHR Biomedical research centre funding (to C.B.);
MS Society Italy and UK grant (to V.T. and H.J.B.).
Notes
Thank you also to Paul Matthews. Conflict of Interest : None declared.
Address correspondence to Jill O’Reilly, BA, MSc, DPhil, FMRIB
Centre, John Radcliffe Hospital, Headley Way, Headington, Oxford OX3
9DU, UK. Email: [email protected].
Cerebral Cortex April 2010, V 20 N 4 963
References
Adrian ED. 1943. Afferent areas in the cerebellum connected with the
limbs. Brain. 66:289--315.
Allen GI, Azzena GB, Ohno T. 1974. Cerebellar Purkyne cell re-
sponses to inputs from sensorimotor cortex. Exp Brain Res.
20(3):239--254.
Allen GI, Azzena GB, Ohno T. 1979. Pontine and non-pontine pathways
mediating early mossy fiber responses from sensorimotor cortex to
cerebellum in the cat. Exp Brain Res. 36(2):359--374.
Andersson G, Nyquist J. 1983. Origin and sagittal termination areas of
cerebro-cerebellar clibing fibre paths in the cat. J Physiol.
337:257--285.
Andersson JLR, Jenkinson M, Smith SM. 2007. Non-linear registra-
tion, aka Spatial normalisation. FMRIB technical report TR07JA2,
2007.
Beck E. 1950. The origin, course and termination of the prefronto-
pontine tract in the human brain. Brain. 73(3):368--391.
Beckmann CF, DeLuca M, Devlin JT, Smith SM. 2005. Investigations into
resting-state connectivity using independent component analysis.
Philos Trans R Soc Lond B Biol Sci. 360(1457):1001--1013.
Biswal B, Yetkin FZ, Haughton VM, Hyde JS. 1995. Functional
connectivity in the motor cortex of resting human brain using
echo-planar MRI. Magn Reson Med. 34(4):537--541.
Blakemore SJ, Wolpert DM, Frith CD. 1999. The cerebellum contributes
to somatosensory cortical activity during self-produced tactile
stimulation. Neuroimage. 10(4):448--459.
Bloedel JR. 1992. Functional heterogeneity with structural homogeneity:
how does the cerebellum operate? Behav Brain Sci. 15:666--678.
Bower JM. 1997. Is the cerebellum sensory for motor’s sake, or motor
for sensory’s sake: the view from the whiskers of a rat? Prog Brain
Res. 114:463--496.
Brodal P. 1978. The corticopontine projection in the rhesus monkey:
origin and principles of organization. Brain. 101:251--283.
Bushara KO, Wheat JM, Khan A, Mock BJ, Turski PA, Sorenson J,
Brooks BR. 2001. Multiple tactile maps in the human cerebellum.
Neuroreport. 12(11):2483--2486.
Clower DM, Dum RP, Strick PL. 2005. Basal ganglia and cerebellar
inputs to ‘AIP’. Cereb Cortex. 15(7):913--920.
Corbetta M, Kincade JM, Ollinger JM, McAvoy MP, Shulman GL. 2000.
Voluntary orienting is dissociated from target detection in human
posterior parietal cortex. Nat Neurosci. 3(3):292--297.
Damoiseaux JS, Rombouts SA, Barkhof F, Scheltens P, Stam CJ, Smith SM,
Beckmann CF. 2006. Consistent resting-state networks across
healthy subjects. Proc Natl Acad Sci USA. 103(37):13848--13853
Epub 2006 Aug 31.
Culham JC, Valyear KF. 2006. Human parietal cortex in action. Curr
Opin Neurobiol. 16(2):205--212.
Desmond JE, Gabrieli JD, Wagner AD, Ginier BL, Glover GH. 1997.
Lobular patterns of cerebellar activation in verbal working-memory
and finger-tapping tasks as revealed by functional MRI. J Neurosci.
17(24):9675--9685.
Desmond JE, Gabrieli JD, Glover GH. 1998. Dissociation of frontal and
cerebellar activity in a cognitive task: evidence for a distinction
between selection and search. Neuroimage. 7(4 Pt 1):368--376.
Dum RP, Li C, Strick PL. 2002. Motor and nonmotor domains in the
monkey dentate. Ann N Y Acad Sci. 978:289--301.
Dum RP, Strick PL. 2003. An unfolded map of the cerebellar dentate
nucleus and its projections to the cerebral cortex. J Neurophysiol.
89(1):634--639.
Eccles JC, Ito M, Szentagothai J. 1967. The cerebellum as a neuronal
machine. Berlin: Springer-Verlag.
Eickhoff SB, Stephan KE, Mohlberg H, Grefkes C, Fink GR, Amunts K,
Zilles K. 2005. A new SPM toolbox for combining probabilistic
cytoarchitectonic maps and functional imaging data. Neuroimage.
25(4):1325--1335.
Fox MD, Raichle ME. 2007. Spontaneous fluctuations in brain activity
observed with functional magnetic resonance imaging. Nat Rev
Neurosci. 8(9):700--711.
Friston KJ, Poline J, Holmes AP, Frith CD, Frackowiak. 1996. A
multivariate analysis of PET activation studies. Hum Brain Mapp.
4(2):140--151.
Gao JH, Parsons LM, Bower JM, Xiong J, Li J, Fox PT. 1996. Cerebellum
implicated in sensory acquisition and discrimination rather than
motor control. Science. 272(5261):545--547.
Glickstein M. 2007. What does the cerebellum really do? Curr Biol.
17(19):R824--R827.
Glickstein M, May JG, 3rd, Mercier BE. 1985. Corticopontine projection
in the macaque: the distribution of labelled cortical cells after large
injections of horseradish peroxidase in the pontine nuclei. J Comp
Neurol. 235(3):343--359.
Glickstein M, Gerrits N, Kralj-Hans I, Mercier B, Stein J, Voogd J. 1994.
Visual pontocerebellar projections in the macaque. J Comp Neurol.
349(1):51--72.
Grodd W, Hulsmann E, Lotze M, Wildgruber D, Erb M. 2001.
Sensorimotor mapping of the human cerebellum: fMRI evidence
of somatotopic organization. Hum Brain Mapp. 13:55--73.
Hagmann P, Cammoun L, Gigandet X, Meuli R, Honey CJ, Wedeen VJ,
Sporns O. 2008. Mapping the structural core of human cerebral
cortex. PLoS Biol. 6(7):e159.
Ito M. 2008. Control of mental activities by internal models in the
cerebellum. Nat Rev Neurosci. 9(4):304--313.
Jenkinson M, Smith SM. 2001. A global optimisation method for
robust affine registration of brain images. Med Image Anal. 5(2):
143--156.
Jueptner M, Ottinger S, Fellows SJ, Adamschewski J, Flerich L, Muller SP,
Diener HC, Thilmann AF, Weiller C. 1997. The relevance of sensory
input for the cerebellar control of movements. Neuroimage.
5(1):41--48.
Kelly RM, Strick PL. 2000. Rabies as a transneuronal tracer of circuits in the
central nervous system (review). J Neurosci Methods. 103(1):63--71.
Kelly RM, Strick PL. 2003. Cerebellar loops with motor cortex and
prefrontal cortex of a nonhuman primate. J Neurosci. 23(23):
8432--8444.
Kincade JM, Abrams RA, Astafiev SV, Shulman GL, Corbetta M. 2005. An
event-related functional magnetic resonance imaging study of
voluntary and stimulus-driven orienting of attention. J Neurosci.
25(18):4593--4604.
Larsell O, Jansen J. 1972. The comparative anatomy and histology of the
cerebellum. The human cerebellum, cerebellar connections and
cerebellar cortex. Minneapolis (MN): The University of Minnesota
Press.
Lu X, Miyachi S, Ito Y, Namby A, Takada M. 2007. Topographic
distribution of output neurons in cerebellar nuclei and cortex to
somatotopic map of primary motor cortex. Eur J Neurosci.
25:2374--2383.
Luaute J, Schwartz S, Rossetti Y, Spiridon M, Rode G, Boisson D,
Vuilleumier P. 2009. Dynamic changes in brain activity during prism
adaptation. J Neurosci. 29(1):169--178.
MacKay WA, Murphy JT. 1973. Activation of anterior interpositus
neurons by forelimb muscle stretch. Brain Res. 56:335--339.
Middleton FA, Strick PL. 1997. Cerebellar output channels. Int Rev
Neurobiol. 41:61--82.
Middleton FA, Strick PL. 2001. Cerebellar projections to the prefrontal
cortex of the primate. J Neurosci. 21(2):700--712.
Noppeney U, Price CJ. 2002. A PET study of stimulus- and task-induced
semantic processing. Neuroimage. 15(4):927--935.
Ojakangas CL, Ebner TJ. 1994. Purkinje cell complex spike activity
during voluntary motor learning: relationship to kinematics. J
Neurophysiol. 72(6):2617--2630.
Paus T. 1996. Location and function of the human frontal eye-field:
a selective review. Neuropsychologia. 34(6):475--483.
Petrides M, Pandya DN. 1999. Dorsolateral prefrontal cortex: compar-
ative cytoarchitectonic analysis in the human and the macaque
brain and corticocortical connection patterns. Eur J Neurosci.
11(3):1011--1036.
Pisella L, Rossetti Y, Michel C, Rode G, Boisson D, Pelisson D, Tilikete C.
2005. Ipsidirectional impairment of prism adaptation after unilateral
lesion of anterior cerebellum. Neurology. 65(1):150--152.
Provini L, Redman S, Strata P. 1968. Mossy and climbing fibre
organization on the anterior lobe of the cerebellum activated by
forelimb and hindlimb areas of sensorimotor cortex. Exp Brain Res.
6:216--233.
964 Resting Functional Connectivity of the Cerebellum d O’Reilly et al.

Ramnani N. 2006. The primate cortico-cerebellar system: anatomy and
function. Nat Rev Neurosci. 7(7):511--522.
Ramnani N, Behrens TE, Johansen-Berg H, Richter MC, Pinsk MA,
Andersson JL, Rudebeck P, Ciccarelli O, Richter W, Thompson AJ,
et al. 2006. The evolution of prefrontal inputs to the cortico-pontine
system: diffusion imaging evidence from Macaque monkeys and
humans. Cereb Cortex. 16(6):811--818.
Ravizza SM, McCormick CA, Schlerf JE, Justus T, Ivry RB, Fiez JA. 2006.
Cerebellar damage produces selective deficits in verbal working
memory. Brain. 126:306--320.
Roskies AL, Fiez JA, Balota DA, Raichle ME, Petersen SE. 2001.
Task-dependent modulation of regions in the left inferior frontal
cortex during semantic processing. J Cogn Neurosci. 13(6):
829--843.
Sasaki K, Oka H, Matsuda Y, Shimano T, Mizuno N. 1975. Electrophys-
iological studies of the projections from the parietal association
areas to the cerebellar cortex. Exp. Brain Res. 23:91--102.
Saxe R, Kanwisher N. 2003. People thinking about thinking people. The
role of the temporo-parietal junction in ‘‘theory of mind’’. Neuro-
image. 19(4):1835--1842.
Schmahmann JD. 1996. From movement to thought: anatomic
Substrates of the cerebellar contribution to cognitive processing.
Hum Brain Mapp. 4:174--198.
Schmahmann JD. 2004. Disorders of the cerebellum: ataxia, dysmetria
of thought, and the cerebellar cognitive affective syndrome.
J Neuropsychiatry Clin Neurosci. 16(3):367--378.
Schmahmann JD, Caplan D. 2006. Cognition, emotion and the
cerebellum. Brain. 129(Pt 2):290--292.
Schmahmann JD, Doyon J, Toga AW, Petrides M, Evans A. 2000. MRI
atlas of the human cerebellum. San Diego (CA): Academic Press.
Schmahmann JD, Pandya DN. 1992. Course of the fiber pathways to
pons from parasensory association areas in the rhesus monkey.
J Comp Neurol. 326(2):159--179.
Schmahmann JD, Pandya DN. 1991. Projections to the basis pontis from
the superior temporal sulcus and superior temporal region in the
rhesus monkey. J Comp Neurol. 308(2):224--248.
Schmahmann JD, Pandya DN. 1992. Course of the fiber pathways to
pons from parasensory association areas in the rhesus monkey.
J Comp Neurol. 326(2):159--179.
Schmahmann JD, Pandya DN. 1993. Prelunate, occipitotemporal, and
parahippocampal projections to the basis pontis in rhesus monkey.
J Comp Neurol. 337(1):94--112.
Schmahmann JD, Pandya DN. 1997. Anatomic organization of the basilar
pontine projections from prefrontal cortices in rhesus monkey. J
Neurosci. 17(1):438--458.
Schmahmann JD, Sherman JC. 1998. The cerebellar cognitive affective
syndrome. Brain. 121(Pt 4):561--579.
Smith SM, Jenkinson M, Woolrich MW, Beckmann CF, Behrens TE,
Johansen-Berg H, Bannister PR, De Luca M, Drobnjak I, Flitney DE,
et al. 2004. Advances in functional and structural MR image analysis
and implementation as FSL.. Neuroimage. 23(Suppl. 1):S208--S219.
Snider RS, Eldred E. 1952. Cerebro-cerebellar relationships in the
monkey. J Neurophysiol. 15:27--40.
Snider RS, Stowell A. 1944. Receiving areas of the tactile, auditory and
visual systems in the cerebellum. J Neurophysiol. 7:331--357.
Stoodley CJ, Schmahmann JD. 2009. Functional topography in the
human cerebellum: a meta-analysis of neuroimaging studies. Neuro-
image. 44(2):489--501Epub 2008 Sep 16.
Thickbroom GW, Byrnes ML, Mastaglia FL. 2003. Dual representation of
the hand in the cerebellum: activation with voluntary and passive
finger movement. Neuroimage. 18(3):670--674.
Watkins KE, Smith SM, Davis S, Howell P. 2008. Structural and functional
abnormalities of the motor system in developmental stuttering.
Brain. 131(1):50--59Epub 2007 Oct 10.
Wolpert DM, Miall RC. 1996. Forward models for physiological motor
control. Neural Netw. 9(8):1265--1279.
Young L, Saxe R. 2009. An fMRI investigations of spontaneous mental
state inference for moral judgement. J Cogn Neurosci. 21(7):
1396--1340.
Xiang H, Lin C, Ma X, Zhang Z, Bower JM, Weng X, Gao JH. 2003.
Involvement of the cerebellum in semantic discrimination: an fMRI
study. Hum Brain Mapp. 18(3):208--214.
Zhang Y, Brady M, Smith S. 2001. Segmentation of brain MR images
through a hidden Markov random field model and the expectation
maximization algorithm. IEEE Trans Med Imaging. 20(1):45--57.
Zhang D, Snyder AZ, Fox MD, Sansbury MW, Shimony JS, Raichle ME.
2008. Intrinsic functional relations between human cerebral cortex
and thalamus. J Neurophysiol. 100:1740--1748.
Cerebral Cortex April 2010, V 20 N 4 965


