Embed Size (px)
Citation preview

117
Distortion Correctionof Videobased Laryngoscopic Images
Christoph Palm, Annegret Pelkmann, Thomas Lehmann, Klaus Spitzer
Institut für Medizinische InformatikUniversitätsklinikum der RWTH Aachen,Pauwelsstr. 30, 52074 Aachen, Germany
Laryngoscopic images of the vocal tract are used for diagnostic purposes. Quantitative mea-surements like changes of the glottis size or the surface of the vocal cords during an imagesequence can be helpful to describe the healing process or to compare the findings of diffe-rent patients. Typically the endoscopic images are circulary symmetric distorted (barrel di-stortion). Therefore measurements of geometric dimensions depend on the object´s position inthe image. In this paper an algorithm is presented which allows the computation of thetranslational invariant „ real“ object size by correcting the image distortion without usingadditional calibration of the optical environment.
Keywords: image distortion, camera calibration, multiple regression analysis
1 IntroductionIn digital image processing camera calibration is the prior condition to make statements notonly on the objects in the image domain but in real world coordinates [1]. Quantitative measu-rements in laryngoscopy, e.g. changes of the glottis size or the area of the vocal cords duringan image sequence depend on the position and orientation of the camera and the camera mo-del, which can be described in parameters like image center, scale factor and focal length. The-refore, camera calibration is required to describe the patient’s healing process over periods oftime or to compare different patients.
Although the ideal pinhole camera, which is not an adequate model for real camera systems[2], is used to simplificate the calibration process, many parameters have to be determined.Additionally in laryngoscopy two optical systems, the endoscope and the CCD-camera, worktogether, which results in a more complicated image formation procedure. In other investiga-tions, the image distortion, described by the geometric nonlinearities of the camera, is integra-ted into the camera model [3]. The most common approaches base on calibration objects withdistance measures and point-to-point mapping procedures between the 2D-image points andthe 3D-world coordinates [4].
To avoid these mapping problems the distortion correction can be separated from the cali-bration process, computation of the distortion parameters can be done within the image planeand without additional information about the recording geometry [2,5].
In this paper, a method is presented to correct the image distortion of laryngoscopic imagesresulting from endoscope and camera distortion. For this purpose an equidistant grid is recor-

118
ded, which results in the barrel distorted image shown in Fig. 2. Following the basic idea of thisalgorithm straight lines in the world coordinates have to appear as straight lines in the imagedomain. Radial symmetric distortion can be assumed and described by the radius dependentpolynomial function in equation (3). The coefficients of this function and the center of distorti-on have to be estimated using the grid points. Afterwards, these estimations are used tostraighten the lines and correct the image (Fig. 1).
2 MethodAssuming the perspective projection model [6] for image formation, straight lines in the objectspace should appear as straight lines in the distortion-free image domain. Capturing images ofa rectangular grid using a common laryngoscope, the images have conspicusously circularysymmetric distortion (barrel distortion) caused by the wide viewing angle of the used imaginglens. This distortion can be described by a polynominal function (for detail see Section 2.2) andthe center of distortion. In order to correct the laryngoscopic image the following steps arenecessary [5]:• Extraction of the crossing points of the vertical and horizontal lines of a grid pattern out of
the image.• Estimation of the model parameters using an iterative gradient descending method.• Correction of the image according to the determined model parameters making use of mul-
tiple regression analysis and interpolation methods.
(a) (b)
Figure 1: Simulated barrel distortion (a); corrected version with straightened lines (b)

119
2.1 Extraction of Crossing PointsThe starting point of the algorithm is a grid consisting of several straight lines in horizontal andvertical direction which is recorded by a common laryngoscope with connected CCD-camera.The digitized images show the distortion produced by the imaging lenses of endoscope andcamera (Fig. 2).
To extract the crossing points of the grid lines, Haneishi et al. achieved the enhancement ofthe lines by Prewitt filtering [5]. Thereafter, the vertical and horizontal lines are extracted by anot specified procedure. Because the line enhancement of our recorded images did not showencouraging results we modified Haneishi’s method by using morphological operations.
For this purpose the color image is transformed into a grayscale and thereafter into a binaryimage applying the histogram threshold selection method of Otsu [7] on the grayscale imagelocal adaptive. The window size is given by the distance of the parallel lines and was set to19x19 for 256x384 images. After this transformation morphological operations are used toextract the vertical and horizontal lines independly. The binary image is eroded with a smallstructuring element of two adjacent pixels in vertical and horizontal direction, respectively.Two images of thin lines in the respective direction consisting of more or less one pixel widthare achieved (Fig. 2).The crossing points are determined by an AND operation of these twoimages. Because of the line curvatures in the distorted image the erosion procedure do notprovide ideal crossing points but crossing areas. Therefore, the center of gravity of each area iscalculated as crossing point. These crossing points have to be alli gned to their grid line in orderto straighten the lines. Following the lines, the crossing points on each line are collected. The-refore, the crossing points on each line are extracted automatically.
Figure 2: First row: Grayscale image recorded by a common laryngoscoype (left), binaryimage after applying Otsu’s histogram thresholding local adaptive (right).Second row: vertical (left) and horizontal (middle) lines, extracted by morphological operators.The image on the right shows the crossing areas after logical AND-operation.

120
2.2 Estimation of Model ParametersAfter selecting the crossing points the parameters of the warping polynome to correct the di-stortion have to be estimated. Let (x,y) be the coordinate of a certain point in the distortedimage and (x’ ,y’ ) the corresponding point in the corrected image, (xc,yc) the center of distorti-on and (xc’ ,yc’ ) the center of the corrected image. Then, each point (x,y) is represented in polarcoordinates by its radial distance to the center of distortion
r x x y yc c= − + −( ) ( )2 2 (1)
and its angle
θ =−−
−tan ( )1 y y
x xc
c
, (2)
respectively. The corrected radius r’ is given by a polynomial function
r r a r a r a rnn′ += + + + +1
22
3 1... . (3)
Hence, the corresponding point (x’,y’) yields
x x r
y y r
c
c
′ ′ ′
′ ′ ′
= +
= +
cos
sin
θ
θ(4)
This model has some unkown parameters: the center of distortion (xc, yc) and the coefficientsand the order of the polynomial function (a1,..,an). Following the basic idea of the algorithm tocorrect the barrel distortion, straight lines in the object space should appear as straight lines inthe image. Obviously the distorted lines in the recorded images are curved. To describe thecurvature it is necessary to declare an objective criterion: For a set of certain points represen-ting one line the degree of straightness is given by the smallest eigenvalue of the first momentmatrix [5]. If this eigenvalue is zero the line is straight. Consequently the goal is to minimizethe smallest eigenvalue of the covariance matrix for every line. The sum of all eigenvalues isused as objective minimization criterion and the algorithm terminates if the value of this sumconverges to a small value. For minimization of the smallest eigenvalue the steepest descendgradient method is chosen [5]. Let L be the number of lines and pk = (a1,...,aK)t the estimatedcoeffients after the kth iteration. Then, pk+1 is given by
p p pk k k k+ = − ∇1 ε λ( ) (5)
with ( ) ( )λ λp pk l kl
L
==
∑1
. (6)
121
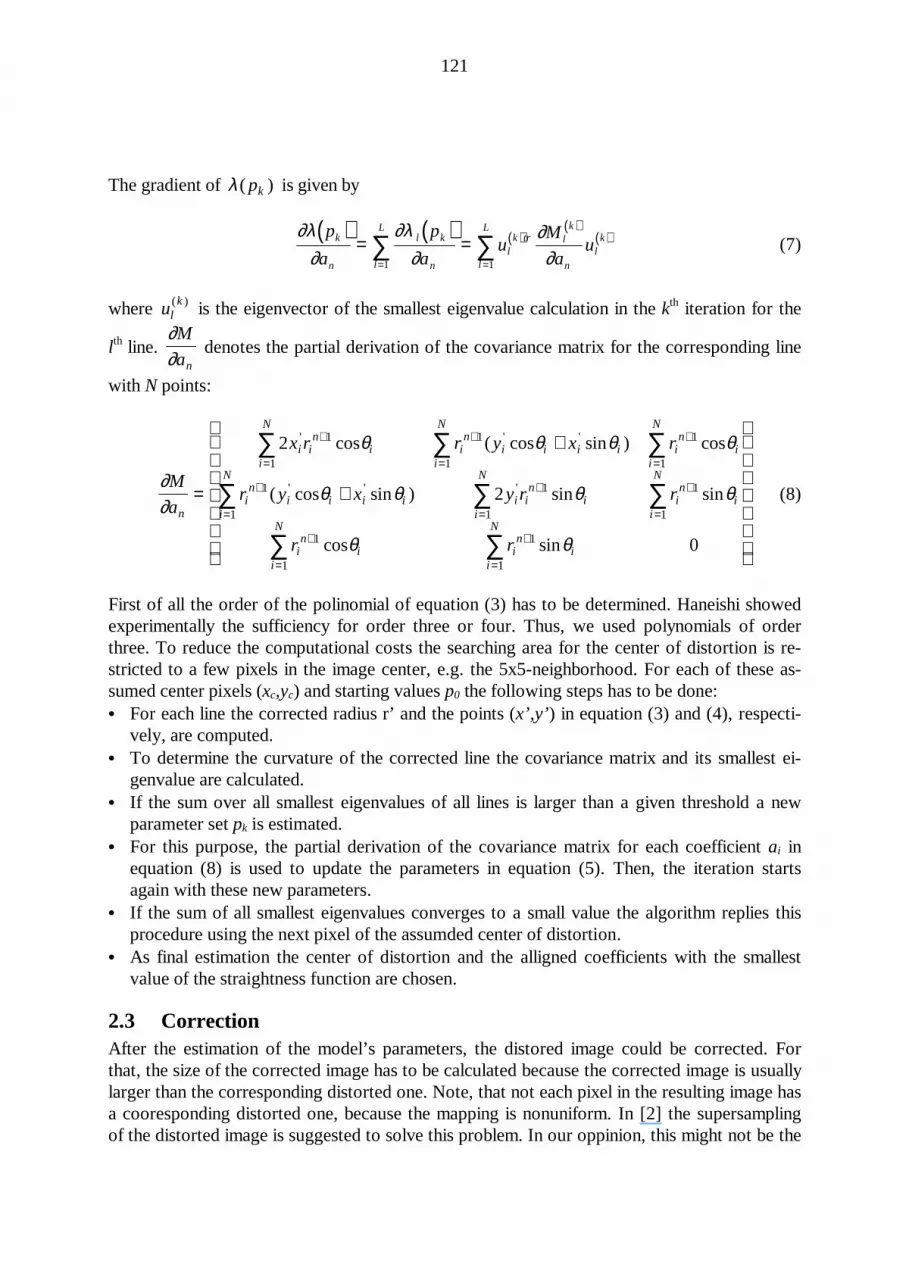
The gradient of λ( )pk is given by
( ) ( ) ( )( )
( )∂λ∂
∂λ∂
∂∂
p
a
p
au
M
auk
n
l k
nlk tr l
k
nlk
l
L
l
L
= ===
∑∑11
(7)
where ulk( ) is the eigenvector of the smallest eigenvalue calculation in the kth iteration for the
l th line. ∂∂M
an
denotes the partial derivation of the covariance matrix for the corresponding line
with N points:
∂∂
θ θ θ θ
θ θ θ θ
θ θ
M
a
x r r y x r
r y x y r r
r r
n
i in
ii
N
in
i i i ii
N
in
ii
N
in
i i i ii
N
i in
ii
N
in
ii
N
in
ii
N
in
ii
N
=
+
+
+
=
+
=
+
=
+
=
+
=
+
=
+
=
+
=
∑ ∑ ∑
∑ ∑ ∑
∑ ∑
2
2
0
1
1
1
1
1
1
1
1
1
1
1
1
1
1
1
1
' ' '
' ' '
cos ( cos sin ) cos
( cos sin ) sin sin
cos sin
(8)
First of all the order of the polinomial of equation (3) has to be determined. Haneishi showedexperimentally the sufficiency for order three or four. Thus, we used polynomials of orderthree. To reduce the computational costs the searching area for the center of distortion is re-stricted to a few pixels in the image center, e.g. the 5x5-neighborhood. For each of these as-sumed center pixels (xc,yc) and starting values p0 the following steps has to be done:• For each line the corrected radius r’ and the points (x’ ,y’ ) in equation (3) and (4), respecti-
vely, are computed.• To determine the curvature of the corrected line the covariance matrix and its smallest ei-
genvalue are calculated.• If the sum over all smallest eigenvalues of all li nes is larger than a given threshold a new
parameter set pk is estimated.• For this purpose, the partial derivation of the covariance matrix for each coefficient ai in
equation (8) is used to update the parameters in equation (5). Then, the iteration startsagain with these new parameters.
• If the sum of all smallest eigenvalues converges to a small value the algorithm replies thisprocedure using the next pixel of the assumded center of distortion.
• As final estimation the center of distortion and the alli gned coefficients with the smallestvalue of the straightness function are chosen.
2.3 CorrectionAfter the estimation of the model’s parameters, the distored image could be corrected. Forthat, the size of the corrected image has to be calculated because the corrected image is usuallylarger than the corresponding distorted one. Note, that not each pixel in the resulting image hasa cooresponding distorted one, because the mapping is nonuniform. In [2] the supersamplingof the distorted image is suggested to solve this problem. In our oppinion, this might not be the

122
best way, because the holes are not equally distributed. So the supersampling has to be greaterat the border of the image than at the center.
The inverse method is to determine for each pixel in the corrected image its correspondingdistorted coordinates [5]. In general, those coordinates reach sub-pixel resolution and an inter-polation method has to be used. Likewise Haneishi et al. we used the nearest neighbor inter-polation to give first results. Nevertheless, other methods like linear, Lagrange or spline inter-polation should give significant better results [8]. Note, that these grayscale interpolation me-thods cannot be transferred directly to color images in the RGB color space, because they re-sult in a kind of pseudocoloring. Other color spaces like HSV (Hue, Saturation, Value) seemsto be more suitable.
In order to determine the parameters of the inverse polynomial r = r’ -1 in equation (9) multi-ple regression analysis [9] is applied. The crossing points of the distorted image serve forlandmarks with the corresponding points in the corrected image. Advantageously the land-marks are fairly distributed with higher density at the border where the distortion gets evident.
r r a r a r a rnn= + + + + +' ' ' '( )....1
22
3 1 (9)
To avoid this second parameter estimation procedure, we propose to invert the polynomial inequation (3) directly. This can be done up to the order of four. For order three this inversefunction is shown in equation (10), which was used to simulate the barrel distortion, too.Subsequently, for each pixel of the corrected image the corresponding point is calculated usingan interpolation method.
After estimating the center of distortion, the polynominal function and the inverse functionevery image recorded by the same laryngoscopic system can be corrected in the way describedabove.
3 Results and Discussion
3.1 Synthetic ImagesIn order to verify the results of the algorithm correcting the distortion of laryngoscopies syn-thetic images are produced. Using artificial data the model parameters like the center of distor-tion and the order and coeffients of the polynomial function are well kown which enables thecomparison between the exact and the estimated parameters. To distore an image the inversefunction of the general polynomial function (3) is determined. In our experiments we used apolynomial of order three, which is sufficient to produce barrel distortion. The inverse functionis given by:
ra
a
a a
a
a
a
r
a
a
a
a a a a r r a r a
a
= −−
−
= + − +− + + −
αα
α
1
3 9
3
6 2 27
3 4 18 27 4
18
2
12
22
1
2
1
22
2
13
23
2 12
1 22
22
13
22
3
with
' ' ' '
(10)

123
Figure 1(a) shows the result of the distortion of an image ( 301 301⋅ pixel) where the center ofdistortion is equal to the center of the image with the coefficients a1
510 10= ⋅ − and
a251 10= ⋅ − . Figure 1(b) visualizes the corrected image. Evidently the correction is well done
for the estimated model parameters (xc,yc) = (151,151), a1519415 10= ⋅ −. and a2
59675 10= ⋅ −.
(first row in Table 1). Although the degree of straightness λ(pk) gets near zero, the error forcoefficient a1 is quite high. So the most important parameter for image distortion seems to bea2 representing the cubic term in equation (3). Table 1 shows the results of parameter estimati-on for different synthetic images.
Original values Estimated valuesa1 / 105 a2 / 105 (xc,yc) a1 / 105 a2 / 105 (xc,yc) λ(pk) / 102
10 1 (150,150) 19.4 0.97 (151,151) 6.6120 1 (150,150) 19.6 0.97 (150,150) 6.6110 1 (100,100) 40.2 0.94 (100,100) 1.71
Table 1: Original and estimated values for image of size301 301⋅ . The algorithm stopped after105 iterations without reaching the threshold for λ(pk) of 10-3.
3.2 Real ImagesFor the application on real data several grids are recorded with a common laryngoscope. A 3-chip CCD-camera (Lemke TC 804, Germany) and digital videorecorder (JVC DigitalS BR-D85 E, Japan) were used for image acquisition. The images differ in two parameters. The di-stance between the lines of the grid as well the distance between the laryngoscope and the gridpattern, is varied.Some of the lines are not completly figured in the image and so important points are missing(Fig. 3). In order to straighten the lines, the algorithm tries to minimize the sum of the smallesteigenvalues by using the steepest descent method. For each coefficient we choose the step-by-step size which depends on the power of the corresponding radius in equation (3).Further diff iculties are caused by local minima in the coefficient gradient image. The smoothergradient for the simulated data simplifies the steepest descent calculation. Nevertheless, thecorrection shown in Figure 3 seems well done, although the barrel distortion is not eliminatedperfectly. Possible errors can occur in estimating the parameters caused by local minima or infixing the order of the distortion polynomial.
Figure 3: (left) Recorded grid. (right) Corrected image.

124
The algorithm was applied to laryngoscopic images (Fig. 4). This image is recorded with acommon laryngoscope used in clinicial praxis. Conspicously the area of the vocal cords and thesize of the glottis is magnified. Because of the distortion correction the proportions of themorphological structures have changed.
3.3 DiscussionIn this paper an algorithm which corrects the barrel distortion typically for videobased larynos-copic images was presented.
The distortion is described by a polynomial function. To estimate their coefficients and thecenter of distortion a grid image is recorded. The crossing points are extracted and alli gned tolines automatically. For each line a curvature criterion as the smallest eigenvalue of the covari-ance matrix of the line points has to be minimized. This is done by a gradient descending me-thod. Multiple regression analysis in combination with image interpolation is used to correctthe distorted image straightening the grid lines. The algorithm was tested on synthetic and realimages allowing the discussion on ability and problems of this method.
In contrast to Haneishi et al. we used morphological operations to detect the crossing pointsof the grid. In spite of the nonuniform illumination this yields robust results. The gradient de-scending algorithm is modified by variation the step size depending on the power of the corre-sponding radius in the distortion polynomial. Using constant step sizes the algorithm diverges.Furthermore, we propose the inversion of the distortion polynomial up to order four instead ofusing the multiple regression analysis. Therefore, only the coefficient estimation of the distorti-on polynomial can produce inaccuracy and estimation errors.
Figure 4: Example of a laryngoscopic image: (left) distorted, (right) corrected.

125
The nearest neighbor interpolation of color images has to be improved by using more sophi-sticated methods instead. Furthermore, the effect of the interpolation on texture analysis has tobe investigated.
Nevertheless, to calculate quantitative measures like the area of the vocal cords the distorti-on correction ensures translational invariance and comparabili ty. The method is applicable toboth grayscale and color images. The time consuming parameter estimation has to be doneonly once for one imaging configuration. While the parameter estimation has to be run hoursthe correcting procedure itselves takes less than seconds. So the algorithm is suitable for clini-cial praxis.
References[1] Lenz RK, Tsai RY: Techniques for Calibration of the Scale Factor and Image Center for
High Accuracy 3D Machine Vision Metrology, IBM Research Report RC 54867, 1986.
[2] Prescott B, McLean GF: Line-Based Correction of Radial Lens Distortion. GraphicalModels and Image Processing, 59(1), 39-47, 1997.
[3] Grosky WI, Tamburino LA: A unified approach to the linear camera calibration problem.IEEE Transactions on Pattern Analysis and Machine Intelligence, 12(7), 663-671, 1990.
[4] Weng J, Cohen P, Herniou M: Camera calibration with distortion models and accuracyevaluation. IEEE Transactions on Pattern Analysis and Machine Intelli gence, 13(4), 370-376, 1992.
[5] Haneishi H, Yagihashi Y, Miyake Y: A New Method for Distortion Correction ofElectronic Endoscope Images. IEEE Transactions on Medical Imaging, 14(3), 548-555,1995.
[6] Hasegawa JK, Tozzi C: Shape from Shading with perspective Projection and CameraCalibration. Computers & Graphics, 20(3), 351-364, 1996.
[7] Otsu N: A threshold selection method from gray-level histogramms. IEEE SMC 9,62,1979
[8] Lehmann T, Oberschelp W, Pelikan E, Repges R: Bildverarbeitung für die Medizin.Springer Verlag, Berlin, 1997.
[9] Hartung J, Elpelt B: Multivariate Statistik, Lehr- und Handbuch der angewandten Stati-stik, 2. Auflage, R. Oldenbourg, München, 1986.

126


