Embed Size (px)
Citation preview
Phytochemistry 72 (2011) 1889–1895
Contents lists available at ScienceDirect
Phytochemistry
journal homepage: www.elsevier .com/locate /phytochem
Distribution of lignin and its coniferyl alcohol and coniferyl aldehyde groupsin Picea abies and Pinus sylvestris as observed by Raman imaging
Tuomas Hänninen, Eero Kontturi ⇑, Tapani VuorinenDepartment of Forest Products Technology, School of Science and Technology, Aalto University, P.O. Box 16300, 00076 Aalto, Finland
a r t i c l e i n f o
Article history:Received 11 February 2011Received in revised form 27 April 2011Available online 31 May 2011
Keywords:Chemical distributionConiferyl alcoholConiferyl aldehydePicea abiesPinus sylvestrisRaman imaging
0031-9422/$ - see front matter � 2011 Elsevier Ltd. Adoi:10.1016/j.phytochem.2011.05.005
⇑ Corresponding author. Tel.: +358 9470 24250; faxE-mail address: [email protected] (E. Kontturi)
a b s t r a c t
Wood cell wall consists of several structural components, such as cellulose, hemicelluloses and lignin,whose concentrations vary throughout the cell wall. It is a composite where semicrystalline cellulosefibrils, acting as reinforcement, are bound together by amorphous hemicelluloses and lignin matrix.Understanding the distribution of these components and their functions within the cell wall can provideuseful information on the biosynthesis of trees.
Raman imaging enables us to study chemistry of cell wall without altering the structure by staining thesample or fractionating it. Raman imaging has been used to analyze distributions of lignin and cellulose,as well as the functional groups of lignin in wood.
In our study, we observed the distribution of cellulose and lignin, as well as the amount of coniferylalcohol and aldehyde groups compared to the total amount of lignin in pine (Pinus sylvestris) and spruce(Picea abies) wood samples. No significant differences could be seen in lignin and cellulose distributionbetween these samples, while clear distinction was observed in the distribution of coniferyl alcoholsand coniferyl aldehyde in them. These results could provide valuable insight on how two similar woodspecies control biosynthesis of lignin differently during the differentiation of cell wall.
� 2011 Elsevier Ltd. All rights reserved.
1. Introduction
Lignin in the wood cell wall has several functions. While being abinding component between individual cells, it also controls thewater content inside the cell wall enabling transport of waterand providing protection against pathogens as well as strength toload-bearing structures (Iiyama et al., 1994; Boerjan et al., 2003).
Lignin is commonly defined as a complex hydrophobic networkof phenylpropanoid units derived from the oxidative polymeriza-tion of one or more of the three types of hydroxycinnamyl alcoholprecursors (p-hydroxyphenyl, guaiacyl and syringyl units). Suchdefinition, however, has been shown to be insufficient, for it islikely that no plant lignin derives solely from the three precursors(Sederoff et al., 1999).
Hypothetically, the structure of lignin is determined by the rel-ative abundance of the precursors in the lignifying zone. This iscontrolled by genetic and environmental factors (Boerjan et al.,2003). One of the functional groups that has received relatively lit-tle attention from a structural perspective is coniferyl aldehyde(lignin-CAld), the reduction of which is considered to be the finalstep in the biosynthesis of coniferyl alcohols (lignin-CAlc) in lignin(Boerjan et al., 2003). Lignin-CAld groups prevail in native lignin
ll rights reserved.
: +358 9470 24259..
since the activity of some coniferyl aldehyde dehydrogenase(CAD) enzymes is reduced during lignin biosynthesis (Boerjanet al., 2003). Coniferyl aldehydes have been shown to inhibit cellwall degradation by enzymes (Grabber, 2005), and they have beenproposed to be a plant’s response to a wound (Kim et al., 2003) orbiotic and abiotic stress (Barakat et al., 2009).
To better understand the structure and function of lignin, a lookat the broader composition of the wood cell wall is useful. Lignin isassociated with other cell wall polymers, namely cellulose, hemi-cellulose and pectin. The latter two polymers combine with ligninto form the individual cell binding matrix known as the middlelamella whereas cellulose is the most important load-bearing com-ponent of the cell wall. Cellulose in plants is found as semi-crystal-line aggregates, microfibrils, whose orientation along the fiber axisvaries depending on their location in the cell wall.
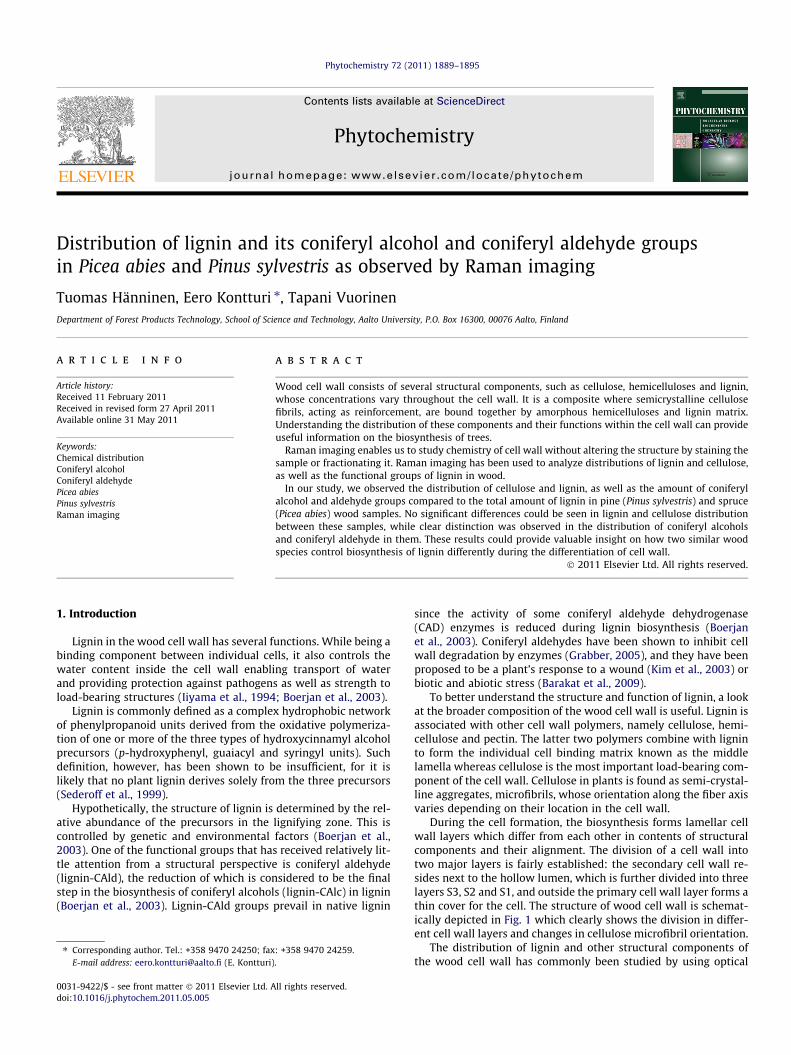
During the cell formation, the biosynthesis forms lamellar cellwall layers which differ from each other in contents of structuralcomponents and their alignment. The division of a cell wall intotwo major layers is fairly established: the secondary cell wall re-sides next to the hollow lumen, which is further divided into threelayers S3, S2 and S1, and outside the primary cell wall layer forms athin cover for the cell. The structure of wood cell wall is schemat-ically depicted in Fig. 1 which clearly shows the division in differ-ent cell wall layers and changes in cellulose microfibril orientation.
The distribution of lignin and other structural components ofthe wood cell wall has commonly been studied by using optical
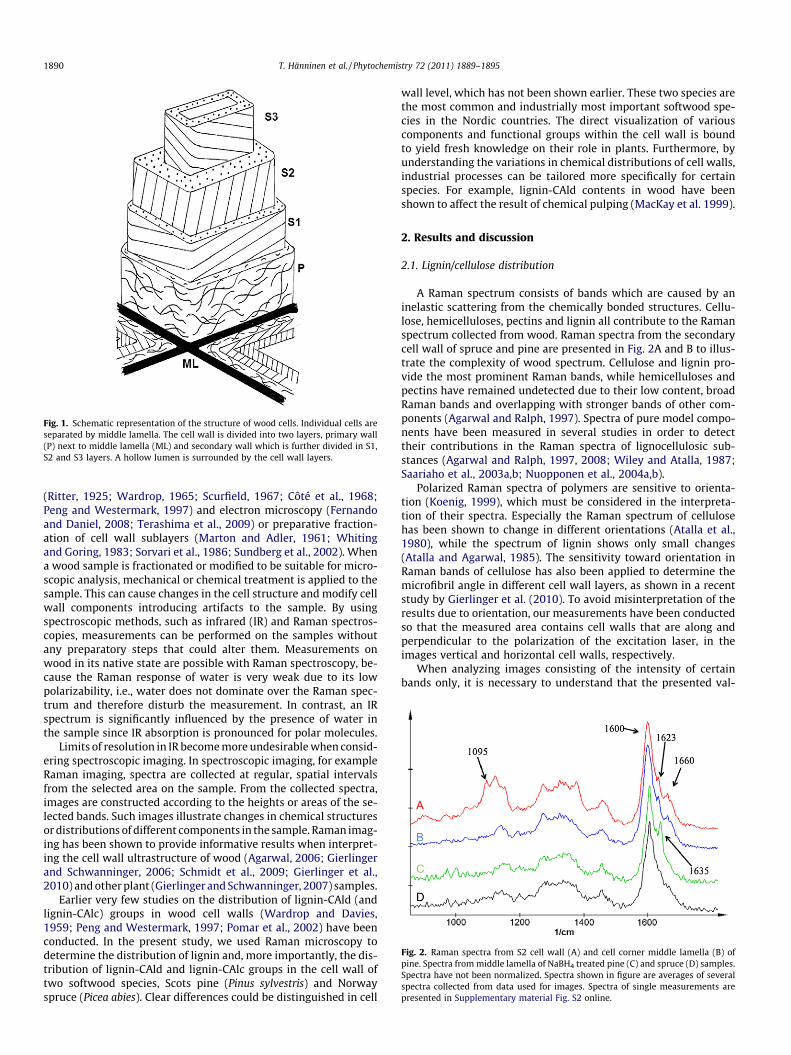
Fig. 1. Schematic representation of the structure of wood cells. Individual cells areseparated by middle lamella. The cell wall is divided into two layers, primary wall(P) next to middle lamella (ML) and secondary wall which is further divided in S1,S2 and S3 layers. A hollow lumen is surrounded by the cell wall layers.
Fig. 2. Raman spectra from S2 cell wall (A) and cell corner middle lamella (B) ofpine. Spectra from middle lamella of NaBH4 treated pine (C) and spruce (D) samples.Spectra have not been normalized. Spectra shown in figure are averages of severalspectra collected from data used for images. Spectra of single measurements arepresented in Supplementary material Fig. S2 online.
1890 T. Hänninen et al. / Phytochemistry 72 (2011) 1889–1895
(Ritter, 1925; Wardrop, 1965; Scurfield, 1967; Côté et al., 1968;Peng and Westermark, 1997) and electron microscopy (Fernandoand Daniel, 2008; Terashima et al., 2009) or preparative fraction-ation of cell wall sublayers (Marton and Adler, 1961; Whitingand Goring, 1983; Sorvari et al., 1986; Sundberg et al., 2002). Whena wood sample is fractionated or modified to be suitable for micro-scopic analysis, mechanical or chemical treatment is applied to thesample. This can cause changes in the cell structure and modify cellwall components introducing artifacts to the sample. By usingspectroscopic methods, such as infrared (IR) and Raman spectros-copies, measurements can be performed on the samples withoutany preparatory steps that could alter them. Measurements onwood in its native state are possible with Raman spectroscopy, be-cause the Raman response of water is very weak due to its lowpolarizability, i.e., water does not dominate over the Raman spec-trum and therefore disturb the measurement. In contrast, an IRspectrum is significantly influenced by the presence of water inthe sample since IR absorption is pronounced for polar molecules.
Limits of resolution in IR become more undesirable when consid-ering spectroscopic imaging. In spectroscopic imaging, for exampleRaman imaging, spectra are collected at regular, spatial intervalsfrom the selected area on the sample. From the collected spectra,images are constructed according to the heights or areas of the se-lected bands. Such images illustrate changes in chemical structuresor distributions of different components in the sample. Raman imag-ing has been shown to provide informative results when interpret-ing the cell wall ultrastructure of wood (Agarwal, 2006; Gierlingerand Schwanninger, 2006; Schmidt et al., 2009; Gierlinger et al.,2010) and other plant (Gierlinger and Schwanninger, 2007) samples.
Earlier very few studies on the distribution of lignin-CAld (andlignin-CAlc) groups in wood cell walls (Wardrop and Davies,1959; Peng and Westermark, 1997; Pomar et al., 2002) have beenconducted. In the present study, we used Raman microscopy todetermine the distribution of lignin and, more importantly, the dis-tribution of lignin-CAld and lignin-CAlc groups in the cell wall oftwo softwood species, Scots pine (Pinus sylvestris) and Norwayspruce (Picea abies). Clear differences could be distinguished in cell
wall level, which has not been shown earlier. These two species arethe most common and industrially most important softwood spe-cies in the Nordic countries. The direct visualization of variouscomponents and functional groups within the cell wall is boundto yield fresh knowledge on their role in plants. Furthermore, byunderstanding the variations in chemical distributions of cell walls,industrial processes can be tailored more specifically for certainspecies. For example, lignin-CAld contents in wood have beenshown to affect the result of chemical pulping (MacKay et al. 1999).
2. Results and discussion
2.1. Lignin/cellulose distribution
A Raman spectrum consists of bands which are caused by aninelastic scattering from the chemically bonded structures. Cellu-lose, hemicelluloses, pectins and lignin all contribute to the Ramanspectrum collected from wood. Raman spectra from the secondarycell wall of spruce and pine are presented in Fig. 2A and B to illus-trate the complexity of wood spectrum. Cellulose and lignin pro-vide the most prominent Raman bands, while hemicelluloses andpectins have remained undetected due to their low content, broadRaman bands and overlapping with stronger bands of other com-ponents (Agarwal and Ralph, 1997). Spectra of pure model compo-nents have been measured in several studies in order to detecttheir contributions in the Raman spectra of lignocellulosic sub-stances (Agarwal and Ralph, 1997, 2008; Wiley and Atalla, 1987;Saariaho et al., 2003a,b; Nuopponen et al., 2004a,b).
Polarized Raman spectra of polymers are sensitive to orienta-tion (Koenig, 1999), which must be considered in the interpreta-tion of their spectra. Especially the Raman spectrum of cellulosehas been shown to change in different orientations (Atalla et al.,1980), while the spectrum of lignin shows only small changes(Atalla and Agarwal, 1985). The sensitivity toward orientation inRaman bands of cellulose has also been applied to determine themicrofibril angle in different cell wall layers, as shown in a recentstudy by Gierlinger et al. (2010). To avoid misinterpretation of theresults due to orientation, our measurements have been conductedso that the measured area contains cell walls that are along andperpendicular to the polarization of the excitation laser, in theimages vertical and horizontal cell walls, respectively.
When analyzing images consisting of the intensity of certainbands only, it is necessary to understand that the presented val-
T. Hänninen et al. / Phytochemistry 72 (2011) 1889–1895 1891
ues do not necessarily correspond to the actual amounts of thatcompound in the sample. Many factors, such as an unevensurface, cracks in the sample and changes in the intensity of exci-tation laser, can affect spectra, thus introducing artifacts toimages. Images constructed solely according to the intensity ofRaman bands are presented in the Supplementary materialFig. S1 online.
The images constructed according to 1600 cm�1 band repre-senting lignin (Supplementary material Fig. S1A and D), indicaterather even distributions in the secondary cell wall while the pri-mary cell wall and the middle lamella contain higher concentra-tions of lignin in all of the wood samples. Images of cellulosedistribution, constructed according to 1095 cm�1 band (Supple-mentary material Fig. S1B and E), show an even distribution inthe secondary cell wall while the cellulose content in the middlelamella is significantly lower. The region of S1 and primary cellwall exhibit changes in the intensity in vertical and horizontal cellwalls which is an artifact caused by the changes in the orientationof cellulose with respect to excitation light polarization. This
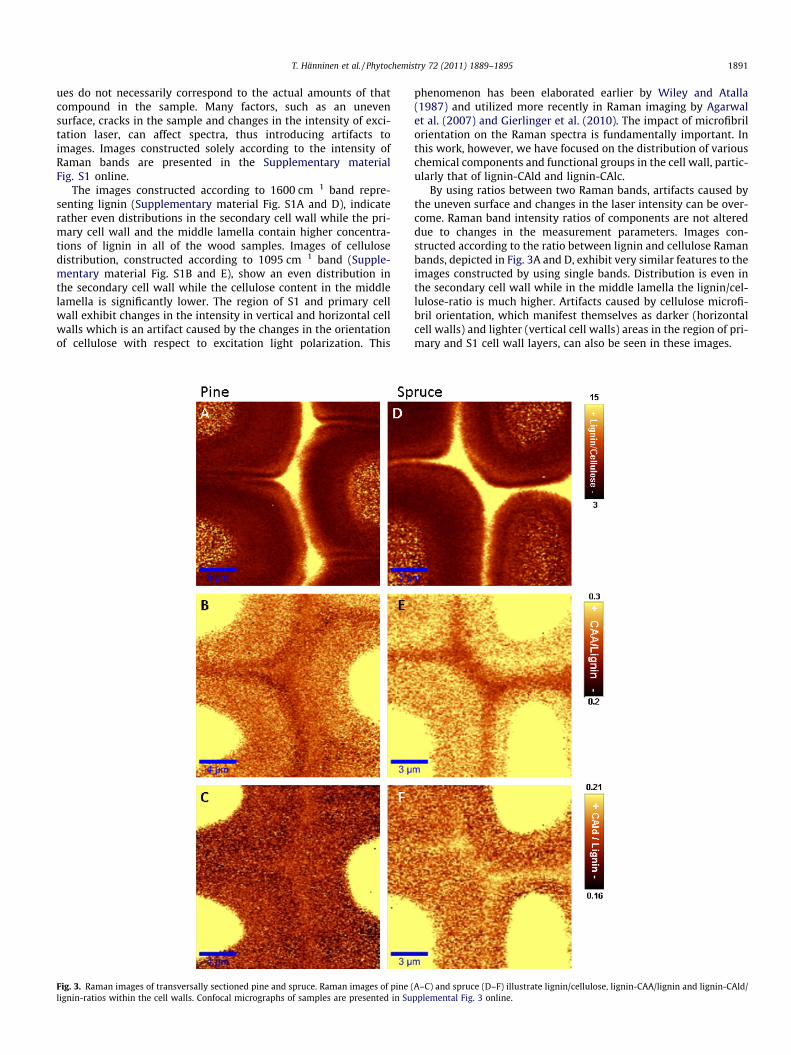
Fig. 3. Raman images of transversally sectioned pine and spruce. Raman images of pine (lignin-ratios within the cell walls. Confocal micrographs of samples are presented in Su
phenomenon has been elaborated earlier by Wiley and Atalla(1987) and utilized more recently in Raman imaging by Agarwalet al. (2007) and Gierlinger et al. (2010). The impact of microfibrilorientation on the Raman spectra is fundamentally important. Inthis work, however, we have focused on the distribution of variouschemical components and functional groups in the cell wall, partic-ularly that of lignin-CAld and lignin-CAlc.
By using ratios between two Raman bands, artifacts caused bythe uneven surface and changes in the laser intensity can be over-come. Raman band intensity ratios of components are not altereddue to changes in the measurement parameters. Images con-structed according to the ratio between lignin and cellulose Ramanbands, depicted in Fig. 3A and D, exhibit very similar features to theimages constructed by using single bands. Distribution is even inthe secondary cell wall while in the middle lamella the lignin/cel-lulose-ratio is much higher. Artifacts caused by cellulose microfi-bril orientation, which manifest themselves as darker (horizontalcell walls) and lighter (vertical cell walls) areas in the region of pri-mary and S1 cell wall layers, can also be seen in these images.
A–C) and spruce (D–F) illustrate lignin/cellulose, lignin-CAA/lignin and lignin-CAld/pplemental Fig. 3 online.
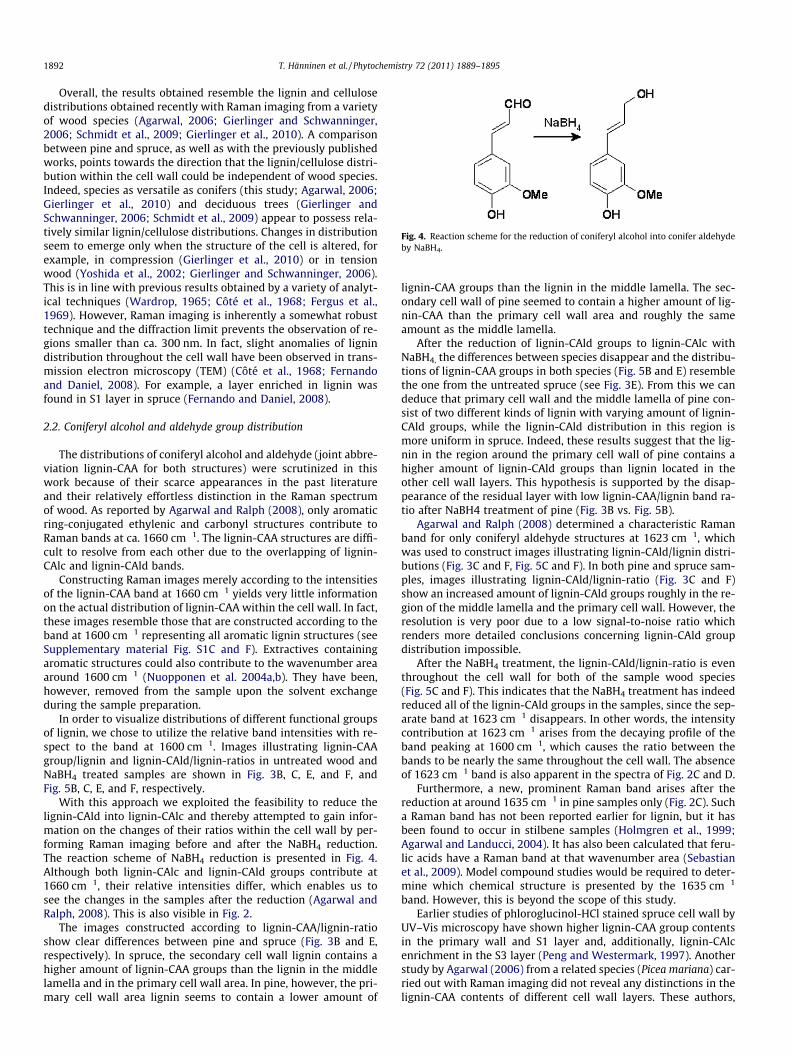
Fig. 4. Reaction scheme for the reduction of coniferyl alcohol into conifer aldehydeby NaBH4.
1892 T. Hänninen et al. / Phytochemistry 72 (2011) 1889–1895
Overall, the results obtained resemble the lignin and cellulosedistributions obtained recently with Raman imaging from a varietyof wood species (Agarwal, 2006; Gierlinger and Schwanninger,2006; Schmidt et al., 2009; Gierlinger et al., 2010). A comparisonbetween pine and spruce, as well as with the previously publishedworks, points towards the direction that the lignin/cellulose distri-bution within the cell wall could be independent of wood species.Indeed, species as versatile as conifers (this study; Agarwal, 2006;Gierlinger et al., 2010) and deciduous trees (Gierlinger andSchwanninger, 2006; Schmidt et al., 2009) appear to possess rela-tively similar lignin/cellulose distributions. Changes in distributionseem to emerge only when the structure of the cell is altered, forexample, in compression (Gierlinger et al., 2010) or in tensionwood (Yoshida et al., 2002; Gierlinger and Schwanninger, 2006).This is in line with previous results obtained by a variety of analyt-ical techniques (Wardrop, 1965; Côté et al., 1968; Fergus et al.,1969). However, Raman imaging is inherently a somewhat robusttechnique and the diffraction limit prevents the observation of re-gions smaller than ca. 300 nm. In fact, slight anomalies of lignindistribution throughout the cell wall have been observed in trans-mission electron microscopy (TEM) (Côté et al., 1968; Fernandoand Daniel, 2008). For example, a layer enriched in lignin wasfound in S1 layer in spruce (Fernando and Daniel, 2008).
2.2. Coniferyl alcohol and aldehyde group distribution
The distributions of coniferyl alcohol and aldehyde (joint abbre-viation lignin-CAA for both structures) were scrutinized in thiswork because of their scarce appearances in the past literatureand their relatively effortless distinction in the Raman spectrumof wood. As reported by Agarwal and Ralph (2008), only aromaticring-conjugated ethylenic and carbonyl structures contribute toRaman bands at ca. 1660 cm�1. The lignin-CAA structures are diffi-cult to resolve from each other due to the overlapping of lignin-CAlc and lignin-CAld bands.
Constructing Raman images merely according to the intensitiesof the lignin-CAA band at 1660 cm�1 yields very little informationon the actual distribution of lignin-CAA within the cell wall. In fact,these images resemble those that are constructed according to theband at 1600 cm�1 representing all aromatic lignin structures (seeSupplementary material Fig. S1C and F). Extractives containingaromatic structures could also contribute to the wavenumber areaaround 1600 cm�1 (Nuopponen et al. 2004a,b). They have been,however, removed from the sample upon the solvent exchangeduring the sample preparation.
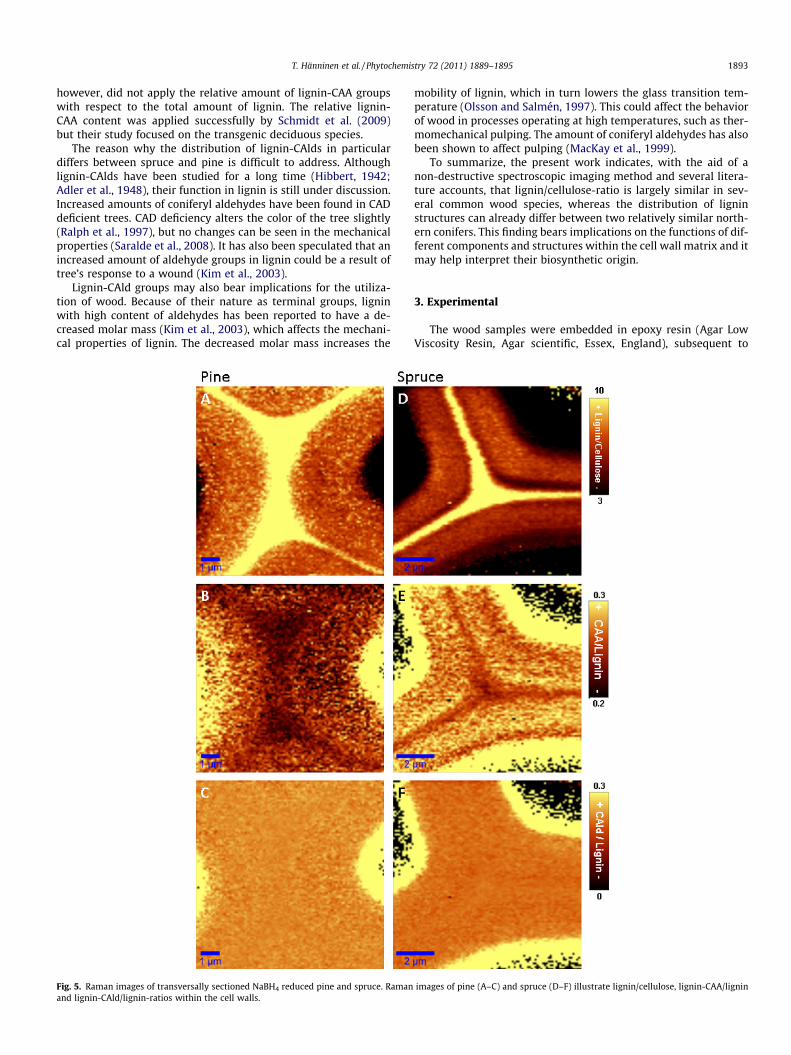
In order to visualize distributions of different functional groupsof lignin, we chose to utilize the relative band intensities with re-spect to the band at 1600 cm�1. Images illustrating lignin-CAAgroup/lignin and lignin-CAld/lignin-ratios in untreated wood andNaBH4 treated samples are shown in Fig. 3B, C, E, and F, andFig. 5B, C, E, and F, respectively.
With this approach we exploited the feasibility to reduce thelignin-CAld into lignin-CAlc and thereby attempted to gain infor-mation on the changes of their ratios within the cell wall by per-forming Raman imaging before and after the NaBH4 reduction.The reaction scheme of NaBH4 reduction is presented in Fig. 4.Although both lignin-CAlc and lignin-CAld groups contribute at1660 cm�1, their relative intensities differ, which enables us tosee the changes in the samples after the reduction (Agarwal andRalph, 2008). This is also visible in Fig. 2.
The images constructed according to lignin-CAA/lignin-ratioshow clear differences between pine and spruce (Fig. 3B and E,respectively). In spruce, the secondary cell wall lignin contains ahigher amount of lignin-CAA groups than the lignin in the middlelamella and in the primary cell wall area. In pine, however, the pri-mary cell wall area lignin seems to contain a lower amount of
lignin-CAA groups than the lignin in the middle lamella. The sec-ondary cell wall of pine seemed to contain a higher amount of lig-nin-CAA than the primary cell wall area and roughly the sameamount as the middle lamella.
After the reduction of lignin-CAld groups to lignin-CAlc withNaBH4, the differences between species disappear and the distribu-tions of lignin-CAA groups in both species (Fig. 5B and E) resemblethe one from the untreated spruce (see Fig. 3E). From this we candeduce that primary cell wall and the middle lamella of pine con-sist of two different kinds of lignin with varying amount of lignin-CAld groups, while the lignin-CAld distribution in this region ismore uniform in spruce. Indeed, these results suggest that the lig-nin in the region around the primary cell wall of pine contains ahigher amount of lignin-CAld groups than lignin located in theother cell wall layers. This hypothesis is supported by the disap-pearance of the residual layer with low lignin-CAA/lignin band ra-tio after NaBH4 treatment of pine (Fig. 3B vs. Fig. 5B).
Agarwal and Ralph (2008) determined a characteristic Ramanband for only coniferyl aldehyde structures at 1623 cm�1, whichwas used to construct images illustrating lignin-CAld/lignin distri-butions (Fig. 3C and F, Fig. 5C and F). In both pine and spruce sam-ples, images illustrating lignin-CAld/lignin-ratio (Fig. 3C and F)show an increased amount of lignin-CAld groups roughly in the re-gion of the middle lamella and the primary cell wall. However, theresolution is very poor due to a low signal-to-noise ratio whichrenders more detailed conclusions concerning lignin-CAld groupdistribution impossible.
After the NaBH4 treatment, the lignin-CAld/lignin-ratio is eventhroughout the cell wall for both of the sample wood species(Fig. 5C and F). This indicates that the NaBH4 treatment has indeedreduced all of the lignin-CAld groups in the samples, since the sep-arate band at 1623 cm�1 disappears. In other words, the intensitycontribution at 1623 cm�1 arises from the decaying profile of theband peaking at 1600 cm�1, which causes the ratio between thebands to be nearly the same throughout the cell wall. The absenceof 1623 cm�1 band is also apparent in the spectra of Fig. 2C and D.
Furthermore, a new, prominent Raman band arises after thereduction at around 1635 cm�1 in pine samples only (Fig. 2C). Sucha Raman band has not been reported earlier for lignin, but it hasbeen found to occur in stilbene samples (Holmgren et al., 1999;Agarwal and Landucci, 2004). It has also been calculated that feru-lic acids have a Raman band at that wavenumber area (Sebastianet al., 2009). Model compound studies would be required to deter-mine which chemical structure is presented by the 1635 cm�1
band. However, this is beyond the scope of this study.Earlier studies of phloroglucinol-HCl stained spruce cell wall by
UV–Vis microscopy have shown higher lignin-CAA group contentsin the primary wall and S1 layer and, additionally, lignin-CAlcenrichment in the S3 layer (Peng and Westermark, 1997). Anotherstudy by Agarwal (2006) from a related species (Picea mariana) car-ried out with Raman imaging did not reveal any distinctions in thelignin-CAA contents of different cell wall layers. These authors,
T. Hänninen et al. / Phytochemistry 72 (2011) 1889–1895 1893
however, did not apply the relative amount of lignin-CAA groupswith respect to the total amount of lignin. The relative lignin-CAA content was applied successfully by Schmidt et al. (2009)but their study focused on the transgenic deciduous species.
The reason why the distribution of lignin-CAlds in particulardiffers between spruce and pine is difficult to address. Althoughlignin-CAlds have been studied for a long time (Hibbert, 1942;Adler et al., 1948), their function in lignin is still under discussion.Increased amounts of coniferyl aldehydes have been found in CADdeficient trees. CAD deficiency alters the color of the tree slightly(Ralph et al., 1997), but no changes can be seen in the mechanicalproperties (Saralde et al., 2008). It has also been speculated that anincreased amount of aldehyde groups in lignin could be a result oftree’s response to a wound (Kim et al., 2003).
Lignin-CAld groups may also bear implications for the utiliza-tion of wood. Because of their nature as terminal groups, ligninwith high content of aldehydes has been reported to have a de-creased molar mass (Kim et al., 2003), which affects the mechani-cal properties of lignin. The decreased molar mass increases the
Fig. 5. Raman images of transversally sectioned NaBH4 reduced pine and spruce. Ramanand lignin-CAld/lignin-ratios within the cell walls.
mobility of lignin, which in turn lowers the glass transition tem-perature (Olsson and Salmén, 1997). This could affect the behaviorof wood in processes operating at high temperatures, such as ther-momechanical pulping. The amount of coniferyl aldehydes has alsobeen shown to affect pulping (MacKay et al., 1999).
To summarize, the present work indicates, with the aid of anon-destructive spectroscopic imaging method and several litera-ture accounts, that lignin/cellulose-ratio is largely similar in sev-eral common wood species, whereas the distribution of ligninstructures can already differ between two relatively similar north-ern conifers. This finding bears implications on the functions of dif-ferent components and structures within the cell wall matrix and itmay help interpret their biosynthetic origin.
3. Experimental
The wood samples were embedded in epoxy resin (Agar LowViscosity Resin, Agar scientific, Essex, England), subsequent to
images of pine (A–C) and spruce (D–F) illustrate lignin/cellulose, lignin-CAA/lignin
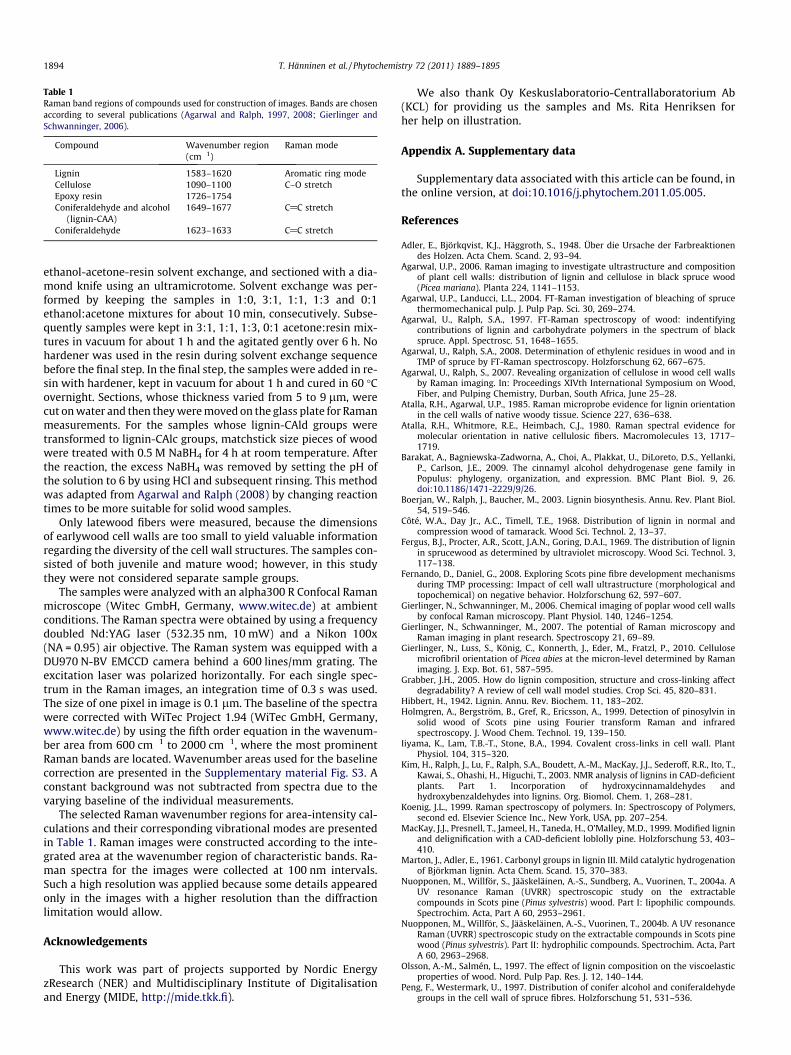
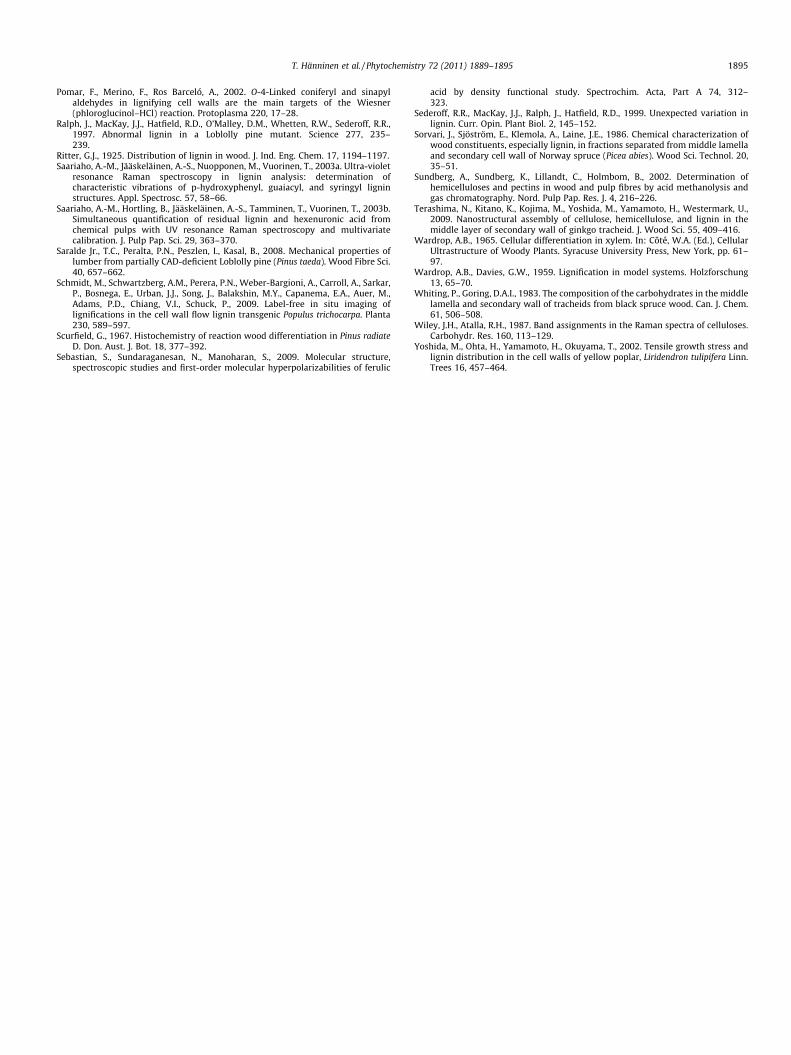
Table 1Raman band regions of compounds used for construction of images. Bands are chosenaccording to several publications (Agarwal and Ralph, 1997, 2008; Gierlinger andSchwanninger, 2006).
Compound Wavenumber region(cm�1)
Raman mode
Lignin 1583–1620 Aromatic ring modeCellulose 1090–1100 C–O stretchEpoxy resin 1726–1754Coniferaldehyde and alcohol
(lignin-CAA)1649–1677 C@C stretch
Coniferaldehyde 1623–1633 C@C stretch
1894 T. Hänninen et al. / Phytochemistry 72 (2011) 1889–1895
ethanol-acetone-resin solvent exchange, and sectioned with a dia-mond knife using an ultramicrotome. Solvent exchange was per-formed by keeping the samples in 1:0, 3:1, 1:1, 1:3 and 0:1ethanol:acetone mixtures for about 10 min, consecutively. Subse-quently samples were kept in 3:1, 1:1, 1:3, 0:1 acetone:resin mix-tures in vacuum for about 1 h and the agitated gently over 6 h. Nohardener was used in the resin during solvent exchange sequencebefore the final step. In the final step, the samples were added in re-sin with hardener, kept in vacuum for about 1 h and cured in 60 �Covernight. Sections, whose thickness varied from 5 to 9 lm, werecut on water and then they were moved on the glass plate for Ramanmeasurements. For the samples whose lignin-CAld groups weretransformed to lignin-CAlc groups, matchstick size pieces of woodwere treated with 0.5 M NaBH4 for 4 h at room temperature. Afterthe reaction, the excess NaBH4 was removed by setting the pH ofthe solution to 6 by using HCl and subsequent rinsing. This methodwas adapted from Agarwal and Ralph (2008) by changing reactiontimes to be more suitable for solid wood samples.
Only latewood fibers were measured, because the dimensionsof earlywood cell walls are too small to yield valuable informationregarding the diversity of the cell wall structures. The samples con-sisted of both juvenile and mature wood; however, in this studythey were not considered separate sample groups.
The samples were analyzed with an alpha300 R Confocal Ramanmicroscope (Witec GmbH, Germany, www.witec.de) at ambientconditions. The Raman spectra were obtained by using a frequencydoubled Nd:YAG laser (532.35 nm, 10 mW) and a Nikon 100x(NA = 0.95) air objective. The Raman system was equipped with aDU970 N-BV EMCCD camera behind a 600 lines/mm grating. Theexcitation laser was polarized horizontally. For each single spec-trum in the Raman images, an integration time of 0.3 s was used.The size of one pixel in image is 0.1 lm. The baseline of the spectrawere corrected with WiTec Project 1.94 (WiTec GmbH, Germany,www.witec.de) by using the fifth order equation in the wavenum-ber area from 600 cm�1 to 2000 cm�1, where the most prominentRaman bands are located. Wavenumber areas used for the baselinecorrection are presented in the Supplementary material Fig. S3. Aconstant background was not subtracted from spectra due to thevarying baseline of the individual measurements.
The selected Raman wavenumber regions for area-intensity cal-culations and their corresponding vibrational modes are presentedin Table 1. Raman images were constructed according to the inte-grated area at the wavenumber region of characteristic bands. Ra-man spectra for the images were collected at 100 nm intervals.Such a high resolution was applied because some details appearedonly in the images with a higher resolution than the diffractionlimitation would allow.
Acknowledgements
This work was part of projects supported by Nordic EnergyzResearch (NER) and Multidisciplinary Institute of Digitalisationand Energy (MIDE, http://mide.tkk.fi).
We also thank Oy Keskuslaboratorio-Centrallaboratorium Ab(KCL) for providing us the samples and Ms. Rita Henriksen forher help on illustration.
Appendix A. Supplementary data
Supplementary data associated with this article can be found, inthe online version, at doi:10.1016/j.phytochem.2011.05.005.
References
Adler, E., Björkqvist, K.J., Häggroth, S., 1948. Über die Ursache der Farbreaktionendes Holzen. Acta Chem. Scand. 2, 93–94.
Agarwal, U.P., 2006. Raman imaging to investigate ultrastructure and compositionof plant cell walls: distribution of lignin and cellulose in black spruce wood(Picea mariana). Planta 224, 1141–1153.
Agarwal, U.P., Landucci, L.L., 2004. FT-Raman investigation of bleaching of sprucethermomechanical pulp. J. Pulp Pap. Sci. 30, 269–274.
Agarwal, U., Ralph, S.A., 1997. FT-Raman spectroscopy of wood: indentifyingcontributions of lignin and carbohydrate polymers in the spectrum of blackspruce. Appl. Spectrosc. 51, 1648–1655.
Agarwal, U., Ralph, S.A., 2008. Determination of ethylenic residues in wood and inTMP of spruce by FT-Raman spectroscopy. Holzforschung 62, 667–675.
Agarwal, U., Ralph, S., 2007. Revealing organization of cellulose in wood cell wallsby Raman imaging. In: Proceedings XIVth International Symposium on Wood,Fiber, and Pulping Chemistry, Durban, South Africa, June 25–28.
Atalla, R.H., Agarwal, U.P., 1985. Raman microprobe evidence for lignin orientationin the cell walls of native woody tissue. Science 227, 636–638.
Atalla, R.H., Whitmore, R.E., Heimbach, C.J., 1980. Raman spectral evidence formolecular orientation in native cellulosic fibers. Macromolecules 13, 1717–1719.
Barakat, A., Bagniewska-Zadworna, A., Choi, A., Plakkat, U., DiLoreto, D.S., Yellanki,P., Carlson, J.E., 2009. The cinnamyl alcohol dehydrogenase gene family inPopulus: phylogeny, organization, and expression. BMC Plant Biol. 9, 26.doi:10.1186/1471-2229/9/26.
Boerjan, W., Ralph, J., Baucher, M., 2003. Lignin biosynthesis. Annu. Rev. Plant Biol.54, 519–546.
Côté, W.A., Day Jr., A.C., Timell, T.E., 1968. Distribution of lignin in normal andcompression wood of tamarack. Wood Sci. Technol. 2, 13–37.
Fergus, B.J., Procter, A.R., Scott, J.A.N., Goring, D.A.I., 1969. The distribution of ligninin sprucewood as determined by ultraviolet microscopy. Wood Sci. Technol. 3,117–138.
Fernando, D., Daniel, G., 2008. Exploring Scots pine fibre development mechanismsduring TMP processing: Impact of cell wall ultrastructure (morphological andtopochemical) on negative behavior. Holzforschung 62, 597–607.
Gierlinger, N., Schwanninger, M., 2006. Chemical imaging of poplar wood cell wallsby confocal Raman microscopy. Plant Physiol. 140, 1246–1254.
Gierlinger, N., Schwanninger, M., 2007. The potential of Raman microscopy andRaman imaging in plant research. Spectroscopy 21, 69–89.
Gierlinger, N., Luss, S., König, C., Konnerth, J., Eder, M., Fratzl, P., 2010. Cellulosemicrofibril orientation of Picea abies at the micron-level determined by Ramanimaging. J. Exp. Bot. 61, 587–595.
Grabber, J.H., 2005. How do lignin composition, structure and cross-linking affectdegradability? A review of cell wall model studies. Crop Sci. 45, 820–831.
Hibbert, H., 1942. Lignin. Annu. Rev. Biochem. 11, 183–202.Holmgren, A., Bergström, B., Gref, R., Ericsson, A., 1999. Detection of pinosylvin in
solid wood of Scots pine using Fourier transform Raman and infraredspectroscopy. J. Wood Chem. Technol. 19, 139–150.
Iiyama, K., Lam, T.B.-T., Stone, B.A., 1994. Covalent cross-links in cell wall. PlantPhysiol. 104, 315–320.
Kim, H., Ralph, J., Lu, F., Ralph, S.A., Boudett, A.-M., MacKay, J.J., Sederoff, R.R., Ito, T.,Kawai, S., Ohashi, H., Higuchi, T., 2003. NMR analysis of lignins in CAD-deficientplants. Part 1. Incorporation of hydroxycinnamaldehydes andhydroxybenzaldehydes into lignins. Org. Biomol. Chem. 1, 268–281.
Koenig, J.L., 1999. Raman spectroscopy of polymers. In: Spectroscopy of Polymers,second ed. Elsevier Science Inc., New York, USA, pp. 207–254.
MacKay, J.J., Presnell, T., Jameel, H., Taneda, H., O’Malley, M.D., 1999. Modified ligninand delignification with a CAD-deficient loblolly pine. Holzforschung 53, 403–410.
Marton, J., Adler, E., 1961. Carbonyl groups in lignin III. Mild catalytic hydrogenationof Björkman lignin. Acta Chem. Scand. 15, 370–383.
Nuopponen, M., Willför, S., Jääskeläinen, A.-S., Sundberg, A., Vuorinen, T., 2004a. AUV resonance Raman (UVRR) spectroscopic study on the extractablecompounds in Scots pine (Pinus sylvestris) wood. Part I: lipophilic compounds.Spectrochim. Acta, Part A 60, 2953–2961.
Nuopponen, M., Willför, S., Jääskeläinen, A.-S., Vuorinen, T., 2004b. A UV resonanceRaman (UVRR) spectroscopic study on the extractable compounds in Scots pinewood (Pinus sylvestris). Part II: hydrophilic compounds. Spectrochim. Acta, PartA 60, 2963–2968.
Olsson, A.-M., Salmén, L., 1997. The effect of lignin composition on the viscoelasticproperties of wood. Nord. Pulp Pap. Res. J. 12, 140–144.
Peng, F., Westermark, U., 1997. Distribution of conifer alcohol and coniferaldehydegroups in the cell wall of spruce fibres. Holzforschung 51, 531–536.
T. Hänninen et al. / Phytochemistry 72 (2011) 1889–1895 1895
Pomar, F., Merino, F., Ros Barceló, A., 2002. O-4-Linked coniferyl and sinapylaldehydes in lignifying cell walls are the main targets of the Wiesner(phloroglucinol–HCl) reaction. Protoplasma 220, 17–28.
Ralph, J., MacKay, J.J., Hatfield, R.D., O’Malley, D.M., Whetten, R.W., Sederoff, R.R.,1997. Abnormal lignin in a Loblolly pine mutant. Science 277, 235–239.
Ritter, G.J., 1925. Distribution of lignin in wood. J. Ind. Eng. Chem. 17, 1194–1197.Saariaho, A.-M., Jääskeläinen, A.-S., Nuopponen, M., Vuorinen, T., 2003a. Ultra-violet
resonance Raman spectroscopy in lignin analysis: determination ofcharacteristic vibrations of p-hydroxyphenyl, guaiacyl, and syringyl ligninstructures. Appl. Spectrosc. 57, 58–66.
Saariaho, A.-M., Hortling, B., Jääskeläinen, A.-S., Tamminen, T., Vuorinen, T., 2003b.Simultaneous quantification of residual lignin and hexenuronic acid fromchemical pulps with UV resonance Raman spectroscopy and multivariatecalibration. J. Pulp Pap. Sci. 29, 363–370.
Saralde Jr., T.C., Peralta, P.N., Peszlen, I., Kasal, B., 2008. Mechanical properties oflumber from partially CAD-deficient Loblolly pine (Pinus taeda). Wood Fibre Sci.40, 657–662.
Schmidt, M., Schwartzberg, A.M., Perera, P.N., Weber-Bargioni, A., Carroll, A., Sarkar,P., Bosnega, E., Urban, J.J., Song, J., Balakshin, M.Y., Capanema, E.A., Auer, M.,Adams, P.D., Chiang, V.I., Schuck, P., 2009. Label-free in situ imaging oflignifications in the cell wall flow lignin transgenic Populus trichocarpa. Planta230, 589–597.
Scurfield, G., 1967. Histochemistry of reaction wood differentiation in Pinus radiateD. Don. Aust. J. Bot. 18, 377–392.
Sebastian, S., Sundaraganesan, N., Manoharan, S., 2009. Molecular structure,spectroscopic studies and first-order molecular hyperpolarizabilities of ferulic
acid by density functional study. Spectrochim. Acta, Part A 74, 312–323.
Sederoff, R.R., MacKay, J.J., Ralph, J., Hatfield, R.D., 1999. Unexpected variation inlignin. Curr. Opin. Plant Biol. 2, 145–152.
Sorvari, J., Sjöström, E., Klemola, A., Laine, J.E., 1986. Chemical characterization ofwood constituents, especially lignin, in fractions separated from middle lamellaand secondary cell wall of Norway spruce (Picea abies). Wood Sci. Technol. 20,35–51.
Sundberg, A., Sundberg, K., Lillandt, C., Holmbom, B., 2002. Determination ofhemicelluloses and pectins in wood and pulp fibres by acid methanolysis andgas chromatography. Nord. Pulp Pap. Res. J. 4, 216–226.
Terashima, N., Kitano, K., Kojima, M., Yoshida, M., Yamamoto, H., Westermark, U.,2009. Nanostructural assembly of cellulose, hemicellulose, and lignin in themiddle layer of secondary wall of ginkgo tracheid. J. Wood Sci. 55, 409–416.
Wardrop, A.B., 1965. Cellular differentiation in xylem. In: Côté, W.A. (Ed.), CellularUltrastructure of Woody Plants. Syracuse University Press, New York, pp. 61–97.
Wardrop, A.B., Davies, G.W., 1959. Lignification in model systems. Holzforschung13, 65–70.
Whiting, P., Goring, D.A.I., 1983. The composition of the carbohydrates in the middlelamella and secondary wall of tracheids from black spruce wood. Can. J. Chem.61, 506–508.
Wiley, J.H., Atalla, R.H., 1987. Band assignments in the Raman spectra of celluloses.Carbohydr. Res. 160, 113–129.
Yoshida, M., Ohta, H., Yamamoto, H., Okuyama, T., 2002. Tensile growth stress andlignin distribution in the cell walls of yellow poplar, Liridendron tulipifera Linn.Trees 16, 457–464.


