Embed Size (px)
Citation preview
Do analyst recommendations reflect shareholder rights?
Don M. Autore Florida State University
Tunde Kovacs
Northeastern University
Vivek Sharma University of Michigan – Dearborn
April 2008
Abstract
We examine whether sell-side analyst recommendations reflect shareholder rights. Our rationale is that analysts should be influenced by external governance only if market participants do not efficiently price its value. We find that stronger shareholder rights are associated with more favorable recommendations. Further analysis reveals that analysts favor firms with strong shareholder rights only when strong rights appear to be warranted, but do not penalize firms for having strong rights when not needed. These findings occupy middle ground in the debate on the pricing efficiency of shareholder rights. Moreover, we find that firm value is positively associated with the strength of shareholder rights regardless of the expected external governance structure. The latter result is consistent with a “one-size-fits-all” interpretation, and implies that firms across the board could increase share value by reducing their number of anti-takeover provisions.
JEL Classifications: G24, G34, G14
Keywords: analyst recommendations, corporate governance, shareholder rights, anti-takeover provisions, market efficiency
Do analyst recommendations reflect shareholder rights?
April 2008
Abstract
We examine whether sell-side analyst recommendations reflect shareholder rights. Our rationale is that analysts should be influenced by external governance only if market participants do not efficiently price its value. We find that stronger shareholder rights are associated with more favorable recommendations. Further analysis reveals that analysts favor firms with strong shareholder rights only when strong rights appear to be warranted, but do not penalize firms for having strong rights when not needed. These findings occupy middle ground in the debate on the pricing efficiency of shareholder rights. Moreover, we find that firm value is positively associated with the strength of shareholder rights regardless of the expected external governance structure. The latter result is consistent with a “one-size-fits-all” interpretation, and implies that firms across the board could increase share value by reducing their number of anti-takeover provisions.
1
1. Introduction
Whether stock prices efficiently reflect public information is a topic of continuing
interest and debate. One example is the growing literature on corporate governance and
stock returns. Several studies debate whether differences across firms in the quality of
corporate governance are efficiently reflected in stock prices. In their widely cited and
ground breaking paper, Gompers, Ishii, and Metrick (2003) (hereafter GIM) develop a
governance index (G-index) based on 24 anti-takeover provisions, and find that firms with
strong shareholder rights earn risk-adjusted annual returns during 1990-1999 that are 8.5%
greater than firms with weak shareholder rights. Cremers and Nair (2005) and Bebchuk,
Cohen, and Ferrell (2005) also provide evidence that the value of corporate governance is
not efficiently incorporated into equity prices. In contrast, Core, Guay, and Rusticus (2006)
and Johnson, Moorman, and Sorescu (2006) argue that although good governance adds
value, investors incorporate this value quickly and efficiently. In short, the evidence is
mixed on whether governance is priced efficiently.
We add to this debate by studying the recommendations of sell-side analysts.1 One
of the main functions of sell-side analysts is evaluating securities with the purpose of
making a judgment and recommending explicit action on the part of investors.2 Grossman
and Stiglitz (1980) argue that pricing inefficiencies must exist to compensate investors for
the costly information gathering process. Security analysts are arguably among the first to
uncover these inefficiencies. Prior to issuing recommendations, analysts spend
considerable resources trying to identify mispricing and it seems reasonable that their
recommended course of action (i.e. buy, sell, hold) reflects their beliefs regarding pricing
1 Sell-side analysts work with brokerage firms in contrast to buy-side analysts who are primarily associated with financial institutions. 2 See Schipper (1991) for an excellent discussion of analysts’ functions.
2
efficiency. Favorable recommendations reflect analysts’ belief that a stock is currently
undervalued by market participants, and unfavorable recommendations reveal their opinion
that a stock is overvalued. Indeed, the literature finds that stocks receiving favorable
recommendations outperform those receiving unfavorable recommendations (e.g. Stickel
(1995), Womack (1996), Barber, Lehavy, McNichols, and Trueman (2001, 2006),
Jegadeesh, Kim, Krische, and Lee (2004) (hereafter JKKL), and Jegadeesh and Kim
(2006)).
To the extent that a firm’s governance structure influences valuation, analysts
should consider the strength of corporate governance in issuing recommendations. We
argue that if shareholder rights influence valuation favorably but are not efficiently
reflected in stock prices, analysts will recognize this mispricing and issue more favorable
recommendations to well-governed firms and less favorable recommendations to poorly-
governed firms. Alternatively, if strong shareholder rights either have no effect on
valuation or are quickly and accurately reflected in stock prices, analysts will place little
importance on differences in governance across firms. It is not our purpose to take a stand
on whether governance is a risk factor that should be priced in the financial markets.
Rather, we address the question of market efficiency. Essentially, our study examines the
following question: Are sell-side analyst recommendations associated with the strength of
shareholder rights?
This approach has a distinct advantage over prior studies in that it allows us to
investigate the pricing efficiency of shareholder rights without relying on differences in
long-term abnormal returns. This avoids the problem of having to identify all influential
risk factors and / or matching criteria. We argue that the pricing efficiency of shareholder
3
rights should be associated with the significance that analysts place on the G-index in
issuing their recommendations. Of course, our examination of recommendations also has a
joint hypothesis embedded, since we are simultaneously testing the pricing efficiency of
shareholder rights and analysts’ ability to recognize pricing inefficiencies with respect to
shareholder rights.3 Nonetheless, studying the recommendations of investment
professionals provides a new and interesting angle to the pricing efficiency debate, since
the above mentioned drawback is arguably no more severe than the problem of measuring
long-term abnormal returns given that we cannot positively identify the true pricing model.
Moreover, improving our knowledge of the information that analysts use in issuing
recommendations is interesting on its own right (i.e. aside from pricing efficiency) because
a large number of market participants follow the advice of these investment professionals.
We find that during our sample period 1995 – 2004 there is a significant positive
association between the G-index and consensus recommendations. The median firm
associated with strong shareholder rights (below median G-index) receives a consensus
recommendation, 1.87, that is significantly more favorable than that of the median firm
associated with weak shareholder rights (above median G-index), 2.00.4 Similarly, the
median “democracy” (G-index <= 5, GIM) receives a consensus recommendation of 1.67
whereas the median “dictatorship” (G-index >= 14) receives 1.91. This relation remains
significant in regression specifications that include several variables shown by JKKL to
influence analyst recommendations. In short, better governance is associated with more
3 One possibility is that shareholder rights are efficiently priced, but analysts became aware of GIM and subsequently issued more favorable recommendations to well-governed firms. Thus we might observe that recommendations reflect shareholder rights even though shareholder rights are priced efficiently. However, our main results are robust to using only the period prior to 2001, the time when the GIM paper was first circulated. The findings are also robust to using only post-2001 data. 4 As discussed later, we code strong buy and buy recommendation as 1, hold as 3, and sell and strong sell as 5. Thus, higher values of consensus recommendations are less favorable.
4
favorable recommendations, suggesting that analysts believe strong external governance is
not priced efficiently by market participants.
Is it always better to have strong shareholder rights? Or is there an optimal
governance structure, determined endogenously based on firm-specific characteristics? The
literature provides evidence that firms with stronger governance are associated with greater
idiosyncratic risk [Ferreira and Laux (2007), Demsetz and Lehn (1985)5], smaller firm
size, lower stock prices, and lower institutional ownership [GIM]. Moreover, there is
evidence that governance mechanisms such as insider ownership and board characteristics
are correlated with firm characteristics [Smith and Watts (1992), Demsetz and Villalonga
(2001), Himmelberg, Hubbard, and Palia (1999), Hermalin and Weisbach (2003), Lehn,
Patro and Zhao (2003), and Boone, Field, Karpoff, and Raheja (2008)].
In our sample we find that firms with relatively stronger shareholder rights are
typically characterized by lower market values, less likelihood of S&P 500 inclusion, more
share turnover, greater idiosyncratic volatility, lower institutional ownership, lower
leverage, and less board oversight. Apparently, on average the strength of shareholder
rights is determined endogenously and is commensurate with the inherent need (or lack
thereof) for external governance.
It is possible, however, that not all firms have external governance structures that
are in line with what appears to be warranted based on firm characteristics. This could
potentially be damaging for firms that are expected to have strong shareholder rights but
that, in reality, have weak shareholder rights. Similarly, there could be a penalty for firms
whose shareholder rights are “too strong” relative to expectations, since having strong
5 Demsetz and Lehn (1985) argue that a firm’s operating environment can influence its optimal governance structure. Firms in unpredictable environments are harder to monitor and require better governance, and vice versa.
5
rights when not needed could unnecessarily cause managers to burn resources fending off
takeover attempts. Essentially, it could be harmful to deviate in either direction from the
governance structure that appears to be optimal.
To capture these effects, we predict the level of shareholder rights that might be
expected based on firm-specific traits, and control for this level in tests of the relation
between recommendations and shareholder rights. First, using an OLS regression we
predict the strength of shareholder rights (G-index) and categorize the top half of sample
firms as having weak predicted governance and the bottom half as firms with strong
predicted governance. Using two-way sorts, we find that the actual level of governance
influences recommendations only for firms that have strong predicted governance, that is,
only for firms whose characteristics are typical of well-governed firms. For these firms,
analysts rate well-governed firms significantly better than poorly-governed firms
(consensus recommendations of 1.89 vs. 2.02, respectively). Among firms that have weak
predicted governance, analysts do not distinguish between well-governed and poorly-
governed firms (2.05 vs. 2.02).
Second, using OLS we decompose the G-index into the portion associated with
firm traits (we term this “predicted G-index”) and the portion that is orthogonal to traits
(termed “residual G-index”). The residual G-index is defined as the actual G-index of the
firm minus the predicted G-index. Using OLS and Fama-MacBeth (1973) regressions that
control for the variables JKKL identify as significant predictors of analyst
recommendations, we provide evidence that both the predicted and residual G-index
influence recommendations. This indicates that recommendations are influenced by firm
traits that are associated with the strength of governance, but importantly,
6
recommendations are also explained by the portion of external governance that is
orthogonal to these firm traits. However, these relations are driven by the sample of firms
that have strong predicted governance, which is consistent with the results of our two-way
sorts.
Finally, we use propensity-score matching to pair firms that differ in shareholder
rights, but that ex-ante might be expected to have similar shareholder rights. The findings
again indicate that analysts are influenced by shareholder rights only for firms expected to
have strong external governance. Our findings are robust to using the entrenchment index
of Bebchuk, Cohen, and Ferrell (2005), the Alternative Governance Index (ATI) of
Cremers and Nair (2005), five-tier rather than three-tier recommendations, and separate
pre-2001 and post-2001 samples.
In the last section of the paper we examine the impact of shareholder rights on
valuation (Tobin’s Q). The consensus in the literature is that better governed firms are
valued higher based on Tobin’s Q [e.g. GIM, Chi (2005), Johnson, Moorman, and Sorescu
(2006)]. We re-examine this relation using tests that control for the predicted / expected
level of governance. The evidence reveals that stronger governance is associated with
higher firm valuation, irrespective of the predicted governance. Apparently even firms with
weak predicted governance can improve firm value by strengthening shareholder rights.
One interpretation of our results is consistent with a “one-size-fits-all”
categorization of shareholder rights, in which all firms should opt for strong external
governance. An alternative, and less aggressive, interpretation is that shareholder rights
matter most when a firm’s internal environment is difficult to monitor (e.g. high
idiosyncratic risk, small in size, low institutional ownership). For these firms, analyst
7
recommendations favor well-governed over poorly-governed firms, implying that strong
external governance is expected / needed. When a firm’s internal environment is relatively
easier to monitor (e.g. low idiosyncratic risk, large in size, high institutional ownership),
analyst recommendations are not significantly influenced by shareholder rights, but firm
value is greater given stronger rights, implying that external governance is important for
valuation but is priced efficiently. These findings occupy middle ground in the debate on
the pricing efficiency of shareholder rights.
Our study is related to Core, Guay, and Rusticus (2006), who use analyst forecast
error to assess whether the market is surprised by the poor operating performance of poorly
governed firms. They find no difference between the surprises in well- and poorly
governed firms’ earnings announcements, suggesting that shareholder rights have little
impact on the expectation of accounting performance. The key distinction between our
study and Core, Guay, and Rusticus is that they focus on accounting data (i.e. earnings)
while we analyze recommendations regarding future stock performance. In this sense, our
study adopts a methodology that fosters an interpretation regarding pricing efficiency.
The remainder of the article is organized as follows. Section 2 discusses the data
and variables. Section 3 presents the main findings. Section 4 concludes.
2. Data and variables
Our dataset consists of firms for which both external governance data and analyst
recommendations are available. Our external governance data is obtained from
RiskMetrics (formerly IRRC, the Investor Responsibility Research Center) and includes 24
anti-takeover provisions that Gompers, Ishii, and Metrick (2003) use to construct the G-
8
index. These provisions relate to voting rights, delaying hostile bidders, director / officer
protection, other takeover defenses and state laws. The G-index is formed by adding one
point for each anti-takeover provision that a firm has in place. Thus higher values
correspond to weaker shareholder rights. The G-index is available starting in 1990 and is
updated every 2 or 3 years (1990, 1993, 1995, 1998, 2000, 2002, and 2004).
Analyst recommendations are taken from IBES and intersect with the G-index
beginning in 1995. We measure analyst recommendations on a three-tier scale since
recently many analysts follow this convention. We assign 1 to buy or strong buy, 3 to hold,
and 5 to sell or strong sell recommendations.6 Following JKKL (2004), we define the
consensus recommendation as the average of all outstanding recommendations no more
than a year old, at the end of each month. Thus the consensus recommendation is a
continuous variable taking values in the range [1, 5].7 Our analyst recommendation data
consists of observations during the month directly following the G-index calculation. Our
final sample includes 7042 firm month observations for which we have non-missing data
on analyst recommendations and the G-index.
Our control variables have been identified by prior researchers as factors related to
the G-index or recommendations. We use data from CRSP, COMPUSTAT, Thomson
Financial, and RiskMetrics. Variable definitions are presented in the Appendix.
Table 1 presents descriptive statistics for the overall sample. The mean (median) G-
index is 9.18 (9), which is close to the figure reported by GIM. The mean (median) firm
6 Rule NASD 2711, implemented in 2002, requires analysts to issue recommendations as buy, sell or hold on a 3 point scale. However, we find that in IBES recommendation files, some analysts continue to use older 5 points scale. Thus we also provide tests using a five-tier scale. 7 Since analyst recommendations are censored at 1 and 5 (i.e. an analyst is not able to distinguish between two ”buy” recommended firms by issuing, for example, 0.5 to an exceptionally strong buy) we also repeat our regression analyses using a censored Tobit model (Woolridge (2002)). The results are qualitatively similar to those reported in the paper.
9
receives a consensus recommendation of 1.98 (1.93), which according to our coding is
roughly halfway between buy and hold. Only 5.33% of firms have a consensus sell
recommendation (i.e. above 3). This is expected given the known optimistic bias in sell-
side analyst recommendations. Since analyst recommendations are heavily concentrated
below 3, small differences in consensus recommendations could potentially have
considerable economic importance.
[Insert Table 1 about here]
3. Results
3.1. Consensus recommendations and external governance
To the extent that analysts account for shareholder rights in issuing
recommendations, we should observe an association between G-index and consensus
recommendations. Panel A of Table 2 partitions the sample into groups based on G-index.
Firms with strong shareholder rights (below median G-index) receive a mean (median)
consensus recommendation of 1.95 (1.87), which is significantly more favorable than that
of firms with weak shareholder rights, 2.02 (2.00). Moreover, democracy firms (G-index
<= 5) receive a mean (median) recommendation of 1.88 (1.67), while dictatorship firms (G
>= 14) receive a mean (median) recommendation of 1.99 (1.91). The findings suggest that
firms with stronger external governance are viewed more favorably by analysts.
[Insert Table 2 about here]
This relation implies that either: (i) analysts recognize that shareholder rights are
not priced efficiently or (ii) the apparent relation is driven by other firm characteristics that
are known to influence recommendations. JKKL report that analyst recommendations are
associated with momentum and contrarian variables. Panel B of Table 2 reports the results
10
of Fama-MacBeth (1973) OLS estimations that test the influence of the G-index on
analysts’ consensus recommendations while controlling for factors shown by JKKL to
influence analysts. These factors include market-adjusted returns over the past six months
(RETP) and market-adjusted return over the second preceding six months (RET2P) to
capture momentum effects, and average daily turnover, sales growth, earnings / price, and
book / price to capture contrarian effects. Additionally, we include the size of the firm
defined as the natural logarithm of market capitalization.8
Model 1 includes only the G-index as an explanatory variable and indicates a
positive association between external governance and analyst recommendations. This
suggests a potential market mispricing, since analysts apparently issue more favorable
recommendations to firms with stronger governance. In model 2 we control for factors
known to influence analyst recommendations. Consistent with the findings of JKKL, we
find that analysts issue more favorable recommendations to stocks with positive price
momentum (RETP and RETP2), higher sales growth, greater turnover, lower book / price
ratios, and higher earnings / price ratios. The inclusion of these variables does not alter the
significance of the relation between analyst recommendations and the G-index. From the
security analysts’ perspective, firms with fewer anti-takeover provisions are better buys
than those with more anti-takeover provisions. This suggests that external governance is
not priced efficiently and supports the finding of GIM (2003) that well-governed firms are
good long-term investments.
We test for robustness using (i) the entrenchment index (E-index) of Bebchuck,
Cohen, and Ferrell (2005) which focuses on six provisions, (ii) the alternative governance
index (ATI) of Cremers and Nair (2005) which focuses on three key anti-takeover 8 The inclusion of the other variables employed by JKKL would substantially reduce our sample size.
11
provisions - the presence of staggered boards, of a preferred blank check (poison pill), and
of restrictions on shareholder voting to call special meetings or act through written consent
- and (iii) five-tier recommendations rather than three-tier. Models 3, 4 and 5, respectively,
of Table 2 report the results. Our findings remain unchanged: shareholder rights
significantly influence analyst recommendations.
3.2. Recommendations, external governance, and the expected level of governance
The strength of governance could be endogenous with the need for governance
(Demsetz and Lehn (1985)). Prior studies identify several factors that are associated with
both G-index and the ease with which firms can be monitored, such as firm size,
idiosyncratic risk and institutional holdings (GIM, Ferreira and Laux (2007), and Cremers
and Nair (2005)). In our sample, Pearson correlations indicate that stronger external
governance (i.e. lower G-index) is significantly associated with weaker sales growth, lower
market values, less likelihood of inclusion in the S&P 500, more share turnover, greater
idiosyncratic volatility, lower institutional ownership, lower leverage, fewer independent
board members, and more insiders on the board. These relations suggest that when
monitoring through these mechanisms is relatively difficult, the typical firm will have
relatively stronger external governance.
It is possible however, that some firms adopt a level of governance that is not in
line with the level adopted by firms with similar characteristics. The extent to which
deviations from expectations are priced can be captured by the extent to which analysts
seem to care about such deviations in issuing recommendations. To test such an effect, we
predict the strength of shareholder rights and control for this in tests of the relation
between recommendations and shareholder rights. We predict external governance using
12
an OLS specification of the G-index regressed on sales growth, market value, S&P 500
inclusion, share turnover, idiosyncratic volatility, Tobin’s Q, institutional holdings,
leverage, a binary variable indicating whether the CEO is the board chair, a variable
representing the percentage of independent board members, a variable indicating the
percentage of board members that are insiders, and a binary variable indicating missing
board data.9
We categorize the best 50% of governed firms as strong predicted governance (i.e.
below median predicted G-index) and the worst 50% as weak predicted governance (i.e.
above median predicted G-index). At the same time we independently split the sample into
two groups based on the actual strength of governance. Panel A of Table 3 presents the
mean consensus analyst recommendation within groups.10 The panel illustrates that the
actual level of external governance is associated with recommendations only when there is
an expectation of strong governance. Otherwise, the actual level of governance is not
associated with consensus recommendations. Recommendations take values between 2.02
and 2.05 in all groups except the one in which both the predicted and actual level of
governance are strong (1.89). The results suggest that shareholder rights are not efficiently
priced in the subset of firms that are expected to have (and arguably need) strong external
governance, since analysts rate well-governed firms more favorably than poorly-governed
firms.11 Shareholder rights, however, appear to be priced efficiently when there is an
expectation of weak governance.
9 Board data is not available in the RiskMetrics database for about 14% of our sample observations. Observations with missing board data have significantly less favorable recommendations, and thus excluding these observations would impart a systematic sample bias. So, we include these observations and use a binary variable to indicate the non-availability of board data. 10 Using median values yields qualitatively similar results. 11 To illustrate the economic magnitude of these numbers, consider the following example. Suppose there are 100 firms, of which 50 have “buy” recommendations (i.e. 1) and 50 have “hold” recommendations (i.e. 3).
13
[Insert Table 3 about here]
We provide tests using alternative definitions of the predicted strength of
governance. Panel B reports that analysts rate democracies better than dictatorships only in
the sub-sample of firms that have strong predicted governance, and Panel C shows similar
results using the entrenchment index (E-index) of Bebchuck, Cohen, and Ferrell (2005).12
In Panel D we include all months available instead of only the month immediately
following the publication of the G-index. The drawback to this approach is that it could
increase the staleness of the G-index, since we do not have precise information on when a
new provision is adopted. The results indicate that firms with weak external governance
receive relatively less favorable recommendations regardless of their need for external
governance, although the differences are relatively small in magnitude. Panel E reports
consistent evidence using five-tier rather than three-tier recommendations. Finally, Panel F
shows that the indicated relation is robust to using post-2001 data. In sum, Table 3
provides evidence that well-governed firms that are predicted to have strong governance
are recommended more favorably than other firms. Moreover, analysts’ recommendations
are not less favorable for firms with strong governance when weak governance is expected.
We also examine the relations between recommendations, governance, and the
expected level of governance after controlling for variables identified by JKKL as factors
influencing analysts’ decisions. We specify regressions that explain consensus analyst
The average recommendation is 2.0. Suppose that in another group of 100 firms, 57 are buys and 43 are holds, so the average is 1.86. In the first group analysts are evenly split, whereas in the second group 14 more firms have a buy rather than a hold recommendation. This example is illustrative of the differences we observe in Table 3. 12 We also use the alternative governance index (ATI) of Cremers and Nair (2005). We find that, keeping the level of predicted shareholder rights constant, consensus analyst recommendations increase as the actual number of provisions increase, although the results are not significant across groups. However, this index involves only three provisions, and 38% of our sample firms have adopted all of these provisions. Thus partitioning into high / low groups could be problematic, and caution should be used in interpreting the result.
14
recommendations with two G-index related variables, predicted G-index and residual G-
index, and include RETP, RET2P, turnover, sales growth, earnings / price, price / book,
and firm size. We decompose the G-index into predicted and residual components using
the same OLS estimation that we use to calculate the predicted governance; from this
estimation we obtain the part of G-index associated with firm characteristics and the part
orthogonal to firm traits. The residual G-index is calculated as the actual G-index minus
the predicted G-index, and represents the deviation of the actual G-index from that
predicted by firm characteristics.
Table 4 presents the results. The regressions in Panel A are estimated using the
Fama-MacBeth (1973) method (t-statistics are in parentheses). The estimates from
specification 1 indicate that in the full sample both parts of the G-index significantly
influence recommendations. Firms that have characteristics typically associated with poor
governance (high predicted G-index) are rated less favorably, indicating that analysts
apparently care about factors that are typically associated with external governance.
Moreover, the higher is a firm’s G-index above its predicted G-index (i.e. higher residual
G-index), the worse the recommendation it receives. This indicates that firms with poorer
quality governance than expected, based on firm traits, receive less favorable
recommendations compared to firms with better governance than expected. Specifications
2 and 3 reveal that this relation between recommendations and the predicted and residual
components of G-index holds only when the predicted G-index is below median (i.e.
strong predicted governance). Panel B of Table 4 presents similar results using OLS panel
15
regressions controlling for firm clustering (Petersen (2008)).13 These findings imply that
analysts rate firms with strong shareholder rights better than firms with weak shareholder
rights, but only where there is an expectation of strong external governance. Moreover,
there is no evidence that analysts take a negative view of strong governance when weak
governance is expected.
[Insert Table 4 about here]
We additionally test these associations with characteristics based matching, using
matched pairs of firms that include one firm with above median G-index and one firm with
below median G-index. The pairs are formed using a propensity score based approach [see
Rosenbaum and Robin (1983)], where the probability that a firm will have above / below
median G-index is estimated with a logistic regression using the same regressors as those
used in decomposing the G-index. Then we match firms based on the propensity of having
weak / strong governance. For each well-governed firm, we identify all poorly governed
firms with the same propensity within 0.00001 of the propensity of the well-governed firm
and choose one of them randomly. If no matches exist at this propensity level, we attempt
to match within 0.0001, then 0.001, 0.01, and finally 0.1 precision.14 We repeat this
process for each poorly governed firm, for which we find well governed matches.
Essentially we form pairs of firms that differ in shareholder rights, but that ex-ante might
be expected to have similar shareholder rights. This matched firm approach is similar in
13 We also conduct (i) estimations that include all observations and interactions on the right-hand side between the G-index variables and dummies for good or poor predicted governance and (ii) estimations using a censored Tobit model. The results are qualitatively similar to those reported. 14 For example, for a firm with a 0.60 propensity (60%) to be poorly-governed, a match on the 0.1 level would require the matched firm to have a propensity in the range of 0.50 to 0.70. This 0.1 precision level is fairly imprecise. For robustness, we eliminate pairs matched on this level and find similar results.
16
spirit to the approach of Johnson, Moorman, and Sorescu (2006) who identify pseudo-
dictatorship and pseudo-democracy firms.
In our full sample we have 2414 matched pairs of similar propensity. Panel A of
Table 5 reports the mean difference in consensus analyst recommendations for the matched
pairs along with the associated t-statistic. Holding the propensity to have strong / weak
governance constant, firms with weak governance have consensus analyst
recommendations that are, on average, 0.0468 less favorable than their counterparts with
strong governance (5% significance level).
Next, we partition the sample of matched pairs based on the expected / predicted
strength of external governance. We do not alter the matched pairs, but rather split the
sample of propensity matched pairs into two groups based on whether the propensity to
have “above median G-index” is below or above the sample median propensity. Panel B of
Table 5 reports the results. There are 1285 pairs where the propensity to have weak
governance is above the median propensity (i.e. weak predicted governance) and 1129
pairs where the propensity to have weak governance is below the median propensity (i.e.
strong predicted governance). Using our propensity matches, recommendations differ
across high and low G-index firms only in the sub-sample of firms that have strong
predicted governance. In this group, the average firm with above median G-index has a
consensus recommendation that is 0.0759 less favorable than the typical firm with below
median G-index (5% significance level). Alternatively stated, given two firms with the
same ex-ante propensity to have good governance, the one that has good governance
receives a better consensus recommendation than the one that has poor governance. In
contrast, in the sub-sample with weak predicted governance we find no difference in
17
analyst consensus recommendations. The results provide additional evidence that the G-
index is associated with sell-side recommendations only when strong external governance
is predicted and arguably needed.
[Insert Table 5 about here]
The evidence in section 3.2 supports prior studies that shareholder rights are not
efficiently priced. Analysts rate well-governed firms significantly better than poorly-
governed firms. However, further analysis indicates that this relation exists only when
there is an expectation of strong governance. We find no relation between consensus
recommendations and shareholder rights when there is no expectation of strong
governance, suggesting that in these circumstances either (i) firms do not need strong
external governance and thus the number of anti-takeover provisions is not important or
(ii) the level of governance is efficiently priced. Below we attempt to distinguish between
these possibilities.
3.3 Firm value and external governance
The consensus in the literature is that better governed firms have higher Tobin’s Q
[e.g. GIM, Chi (2005), Johnson, Moorman, and Sorescu (2006)]. While most of these
studies interpret this as a causal relationship pointing from shareholder rights to firm value,
Lehn, Patro, and Zhao (2006) question the direction of causality. We do not address
causality, but rather test how the predicted strength of governance affects the association
between the G-index and Tobin’s Q. We predict the strength of governance using the same
logistic specifications as before, except that we exclude Tobin’s Q as a predictor.
Panel A of Table 6 provides two-way sorts of the G-index / Q relation within
subsamples of strong and weak predicted governance. Industry-adjusted values of Tobin’s
18
Q are significantly higher for well-governed firms relative to poorly-governed firms within
both groups, although the differences are somewhat larger in magnitude for firms that
appear to warrant strong shareholder rights.15 Panel B reports Fama-MacBeth regressions
that are similar to those in Table 4 except that the dependent variable is the industry mean-
adjusted Tobin’s Q, and control variables are chosen based on GIM and Chi (2005). Again,
industry-adjusted values of Tobin’s Q are significantly higher for well-governed firms
relative to poorly-governed firms within both groups of predicted governance.16 This
evidence suggests that having strong shareholder rights when warranted increases firm
value, but having strong rights when not warranted does not decrease (and actually also
increases) value. Furthermore, the evidence here, together with the evidence that analysts
do not take a negative view on firms that have an external governance structure that
appears to be “too strong”, pushes a one-size-fits-all interpretation of shareholder rights, in
which strong rights are preferable.
[Insert Table 6 about here]
4. Conclusions
We examine whether the market efficiently prices shareholder rights by examining
the recommendations of sell-side security analysts. We argue that if external governance is
not priced efficiently, analysts will detect this mispricing and issue more favorable
recommendations to well-governed firms and less favorable recommendations to poorly-
governed firms. However, if a firm’s governance is efficiently reflected in its stock price,
analysts will place little importance on differences in governance across firms.
15 Using only democracies (G<=5) and dictatorships (G>=14) provides similar results. 16 Similar results are obtained in OLS panel regressions adjusted for firm clustering and in models that include all observations and interaction terms of the G-index with dummies for good and poor governance.
19
Our findings indicate that firms associated with strong shareholder rights receive
more favorable recommendations, but only in the subsample of firms for which strong
external governance appears to be warranted. When weak governance is predicted, analysts
do not favor (but also do not penalize) well-governed firms. Moreover, higher firm values
are observed for well-governed firms regardless of the predicted level of governance.
Together, firms that are hard to monitor (e.g. high idiosyncratic risk, small in size,
low institutional ownership) and have strong external governance enjoy better analyst
ratings and higher market valuations relative to similar firms with weak external
governance. Moreover, firms that are relatively easier to monitor and (contrary to
expectation) have strong external governance experience analyst ratings that are no worse
and market valuations that are higher than similar firms with weak external governance.
Two implications stand out. First, shareholder rights are priced inefficiently,
according to analysts, only when strong external governance is needed. Second, the results
suggest a “one-size-fits-all” external governance structure in which stronger shareholder
rights are more desirable. From a practical viewpoint, the findings indicate that firms
across the board should reduce their number of anti-takeover provisions.
20
References
Barber, B., Lehavy, R., McNichols, M., Trueman, B., 2001. Can Investors Profit from the Prophets? Security Analyst Recommendations and Stock Returns. Journal of Finance 56, 531-564. Barber, B., Lehavy, R., McNichols, M., Trueman, B., 2006. Buys, Holds, and Sells: The Distribution of Investment Banks' Stock Ratings and the implications for the Profitability of Analysts' Recommendations. Journal of Accounting Research 41, 87-117. Bebchuk, L., Cohen, A., Ferrell, A., 2005. What Matters in Corporate Governance? Working paper, Harvard Law School. Boone, A., Field, L., Karpoff, J., Raheja, C., 2008. The Determinants of Board Size and Composition: An Empirical Analysis. Journal of Financial Economics, forthcoming. Chi, J., 2005. Understanding the Endogeneity between Firm Value and Shareholder Rights. Financial Management 34, 65-76. Core, J., Guay, W., Rusticus, T., 2006. Does Weak Governance Cause Weak Stock Returns? An Examination of Firm Operating Performance and Investors’ Expectations. Journal of Finance 61, 655-687. Cremers, M., Nair, V., 2005. Governance Mechanisms and Equity Prices. Journal of Finance 60, 2859-2894. Demsetz, H., Lehn, K., 1985. The Structure of Corporate Ownership: Causes and Consequences. Journal of Political Economy 93, 1155-1177. Demsetz, H., Villalonga, B., 2001. Ownership Structure and Corporate Performance. Journal of Corporate Finance 7, 209-233. Fama, E., MacBeth, J., 1973. Risk, Return, and Equilibrium: Empirical Tests. Journal of Political Economy 81, 607-636. Ferreira, M., Laux, P. 2007. Corporate Governance, Idiosyncratic Risk, and Information Flow. Journal of Finance 62, 951-989. Gompers, P., Ishii, J., Metrick, A., 2003. Corporate Governance and Equity Prices. Quarterly Journal of Economics 118, 107-155. Grossman, S., Stiglitz, J., 1980. On the Impossibility of Informationally Efficient Markets. American Economic Review 70, 393-408.
21
Himmelberg, C., Hubbard, R., Palia, D., 1999. Understanding the Determinants of Managerial Ownership and the link between Ownership and Performance. Journal of Financial Economics 53, 353-384. Hermalin, B., Weisbach, M., 2003. Boards of Directors as an Endogenously Determined Institution: a Survey of Economic Literature. Economic Policy Review 9, 7-26. Jegadeesh, N., Kim, J., Krische, S., Lee, C., 2004. Analyzing the Analysts: When do Recommendations Add Value? Journal of Finance 59, 1083-1124. Jegadeesh, N., Kim, W., 2006. Value of Analyst Recommendations: International evidence. Journal of Financial Markets 9, 274-309. Johnson, S., Moorman, T., Sorescu, S., 2006. A Reexamination of Corporate Governance and Equity Prices. Working paper, Texas A&M University. Lehn, K., Patro, S., Zhao, M., 2006. Governance Indices and Valuation Multiples: Which Causes Which? Working Paper, University of Pittsburg. Lehn, K., Patro, S., Zhao, M., 2003. Determinants of the Size and Structure of Corporate Boards: 1935-2000. Working Paper, University of Pittsburgh. Petersen, M. A., 2008, Estimating standard errors in finance panel data sets: Comparing approaches. Review of Financial Studies, forthcoming Rosenbaum, P., Robin, D., 1983. Central Role of the Propensity Score in Observational Studies for Causal Effects. Biometrika 70, 41-55. Schipper, K., 1991. Commentary on Analysts’ Forecasts. Accounting Horizons 54, 105-122. Smith, C., Watts, R., 1992. The Investment Opportunity Set and Corporate Financing, Dividend, and Compensation Policies. Journal of Financial Economics 32, 263- 292. Stickel, S., 1995. The Anatomy of the Performance of Buy and Sell Recommendations. Financial Analysts Journal 51, 25-39. Womack, K., 1996. Do Brokerage Analysts’ Recommendations have Investment Value? Journal of Finance 51, 137-167. Woolridge, J. M., 2002, Econometric analysis of cross section and panel data. The MIT Press, Cambridge.
22
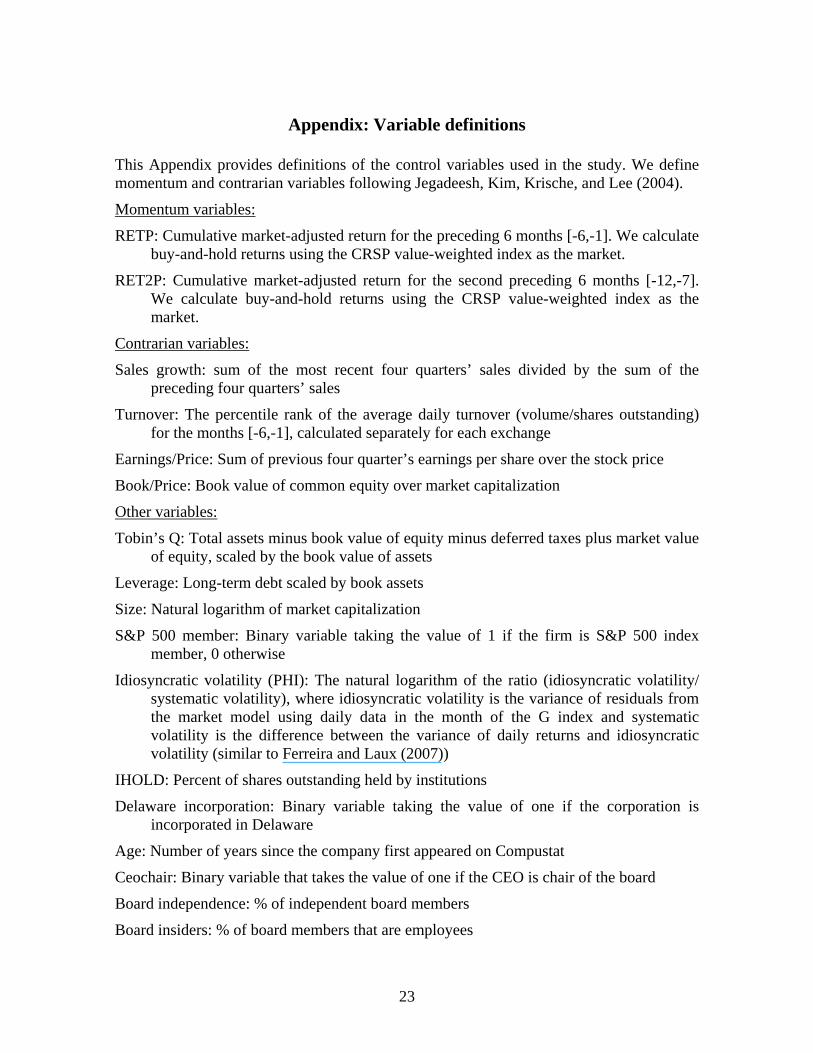
Appendix: Variable definitions
This Appendix provides definitions of the control variables used in the study. We define momentum and contrarian variables following Jegadeesh, Kim, Krische, and Lee (2004).
Momentum variables:
RETP: Cumulative market-adjusted return for the preceding 6 months [-6,-1]. We calculate buy-and-hold returns using the CRSP value-weighted index as the market.
RET2P: Cumulative market-adjusted return for the second preceding 6 months [-12,-7]. We calculate buy-and-hold returns using the CRSP value-weighted index as the market.
Contrarian variables:
Sales growth: sum of the most recent four quarters’ sales divided by the sum of the preceding four quarters’ sales
Turnover: The percentile rank of the average daily turnover (volume/shares outstanding) for the months [-6,-1], calculated separately for each exchange
Earnings/Price: Sum of previous four quarter’s earnings per share over the stock price
Book/Price: Book value of common equity over market capitalization
Other variables:
Tobin’s Q: Total assets minus book value of equity minus deferred taxes plus market value of equity, scaled by the book value of assets
Leverage: Long-term debt scaled by book assets
Size: Natural logarithm of market capitalization
S&P 500 member: Binary variable taking the value of 1 if the firm is S&P 500 index member, 0 otherwise
Idiosyncratic volatility (PHI): The natural logarithm of the ratio (idiosyncratic volatility/ systematic volatility), where idiosyncratic volatility is the variance of residuals from the market model using daily data in the month of the G index and systematic volatility is the difference between the variance of daily returns and idiosyncratic volatility (similar to Ferreira and Laux (2007))
IHOLD: Percent of shares outstanding held by institutions
Delaware incorporation: Binary variable taking the value of one if the corporation is incorporated in Delaware
Age: Number of years since the company first appeared on Compustat
Ceochair: Binary variable that takes the value of one if the CEO is chair of the board
Board independence: % of independent board members
Board insiders: % of board members that are employees
23
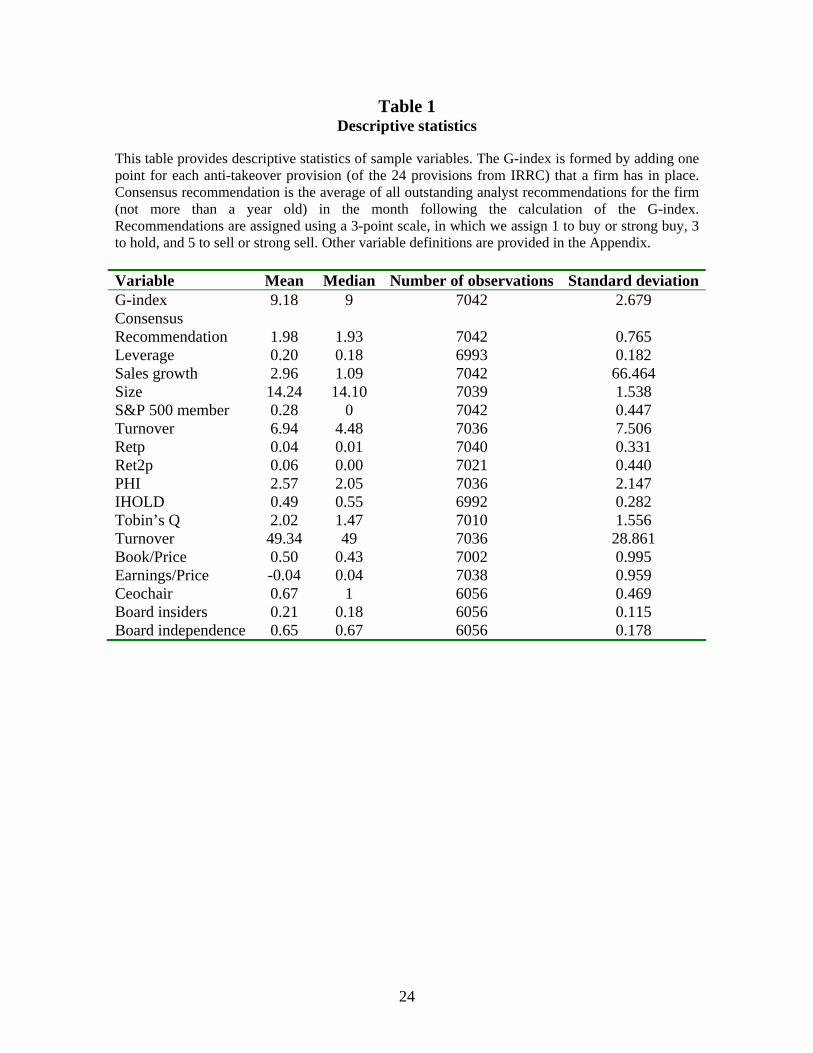
Table 1 Descriptive statistics
This table provides descriptive statistics of sample variables. The G-index is formed by adding one point for each anti-takeover provision (of the 24 provisions from IRRC) that a firm has in place. Consensus recommendation is the average of all outstanding analyst recommendations for the firm (not more than a year old) in the month following the calculation of the G-index. Recommendations are assigned using a 3-point scale, in which we assign 1 to buy or strong buy, 3 to hold, and 5 to sell or strong sell. Other variable definitions are provided in the Appendix. Variable Mean Median Number of observations Standard deviationG-index 9.18 9 7042 2.679 Consensus Recommendation 1.98 1.93 7042 0.765 Leverage 0.20 0.18 6993 0.182 Sales growth 2.96 1.09 7042 66.464 Size 14.24 14.10 7039 1.538 S&P 500 member 0.28 0 7042 0.447 Turnover 6.94 4.48 7036 7.506 Retp 0.04 0.01 7040 0.331 Ret2p 0.06 0.00 7021 0.440 PHI 2.57 2.05 7036 2.147 IHOLD 0.49 0.55 6992 0.282 Tobin’s Q 2.02 1.47 7010 1.556 Turnover 49.34 49 7036 28.861 Book/Price 0.50 0.43 7002 0.995 Earnings/Price -0.04 0.04 7038 0.959 Ceochair 0.67 1 6056 0.469 Board insiders 0.21 0.18 6056 0.115 Board independence 0.65 0.67 6056 0.178
24
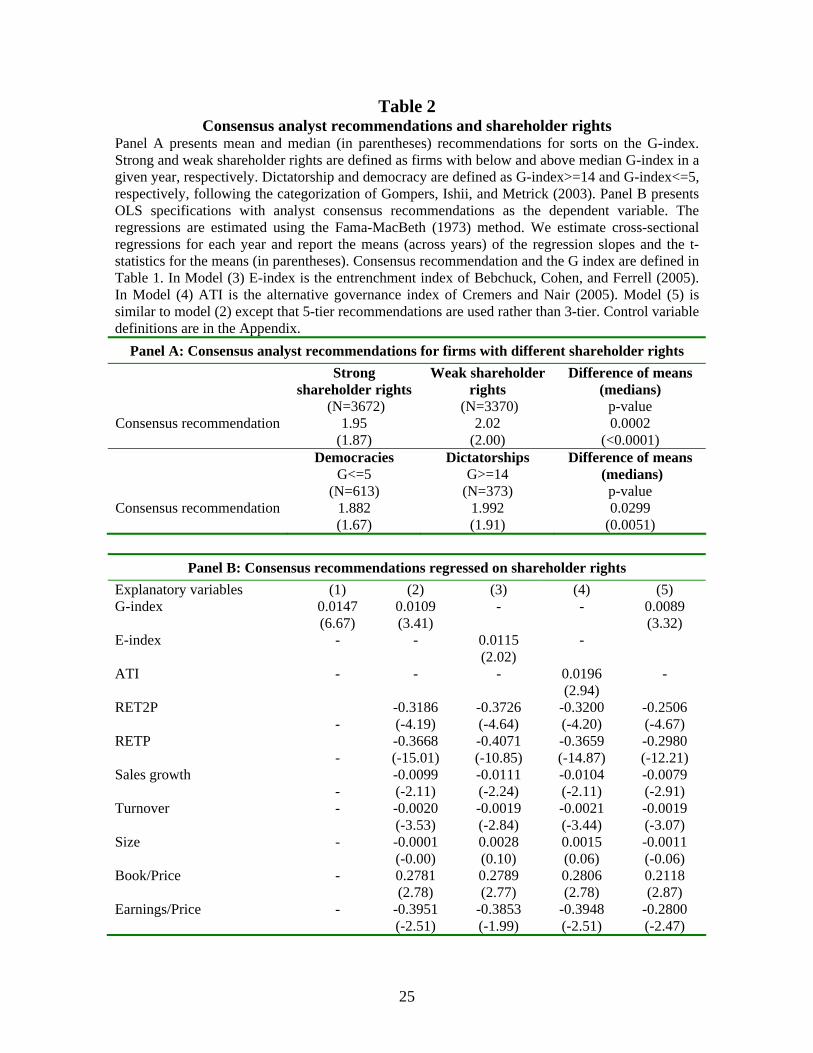
Table 2 Consensus analyst recommendations and shareholder rights
Panel A presents mean and median (in parentheses) recommendations for sorts on the G-index. Strong and weak shareholder rights are defined as firms with below and above median G-index in a given year, respectively. Dictatorship and democracy are defined as G-index>=14 and G-index<=5, respectively, following the categorization of Gompers, Ishii, and Metrick (2003). Panel B presents OLS specifications with analyst consensus recommendations as the dependent variable. The regressions are estimated using the Fama-MacBeth (1973) method. We estimate cross-sectional regressions for each year and report the means (across years) of the regression slopes and the t-statistics for the means (in parentheses). Consensus recommendation and the G index are defined in Table 1. In Model (3) E-index is the entrenchment index of Bebchuck, Cohen, and Ferrell (2005). In Model (4) ATI is the alternative governance index of Cremers and Nair (2005). Model (5) is similar to model (2) except that 5-tier recommendations are used rather than 3-tier. Control variable definitions are in the Appendix.
Panel A: Consensus analyst recommendations for firms with different shareholder rights Strong
shareholder rights (N=3672)
Weak shareholder rights
(N=3370)
Difference of means (medians)
p-value Consensus recommendation 1.95
(1.87) 2.02
(2.00) 0.0002
(<0.0001) Democracies
G<=5 (N=613)
Dictatorships G>=14
(N=373)
Difference of means (medians)
p-value Consensus recommendation 1.882
(1.67) 1.992 (1.91)
0.0299 (0.0051)
Panel B: Consensus recommendations regressed on shareholder rights
Explanatory variables (1) (2) (3) (4) (5) G-index 0.0147
(6.67) 0.0109 (3.41)
- - 0.0089 (3.32)
E-index - - 0.0115 (2.02)
-
ATI
- - - 0.0196 (2.94)
-
RET2P -
-0.3186 (-4.19)
-0.3726 (-4.64)
-0.3200 (-4.20)
-0.2506 (-4.67)
RETP -
-0.3668 (-15.01)
-0.4071 (-10.85)
-0.3659 (-14.87)
-0.2980 (-12.21)
Sales growth -
-0.0099 (-2.11)
-0.0111 (-2.24)
-0.0104 (-2.11)
-0.0079 (-2.91)
Turnover - -0.0020 (-3.53)
-0.0019 (-2.84)
-0.0021 (-3.44)
-0.0019 (-3.07)
Size - -0.0001 (-0.00)
0.0028 (0.10)
0.0015 (0.06)
-0.0011 (-0.06)
Book/Price - 0.2781 (2.78)
0.2789 (2.77)
0.2806 (2.78)
0.2118 (2.87)
Earnings/Price - -0.3951 (-2.51)
-0.3853 (-1.99)
-0.3948 (-2.51)
-0.2800 (-2.47)
25
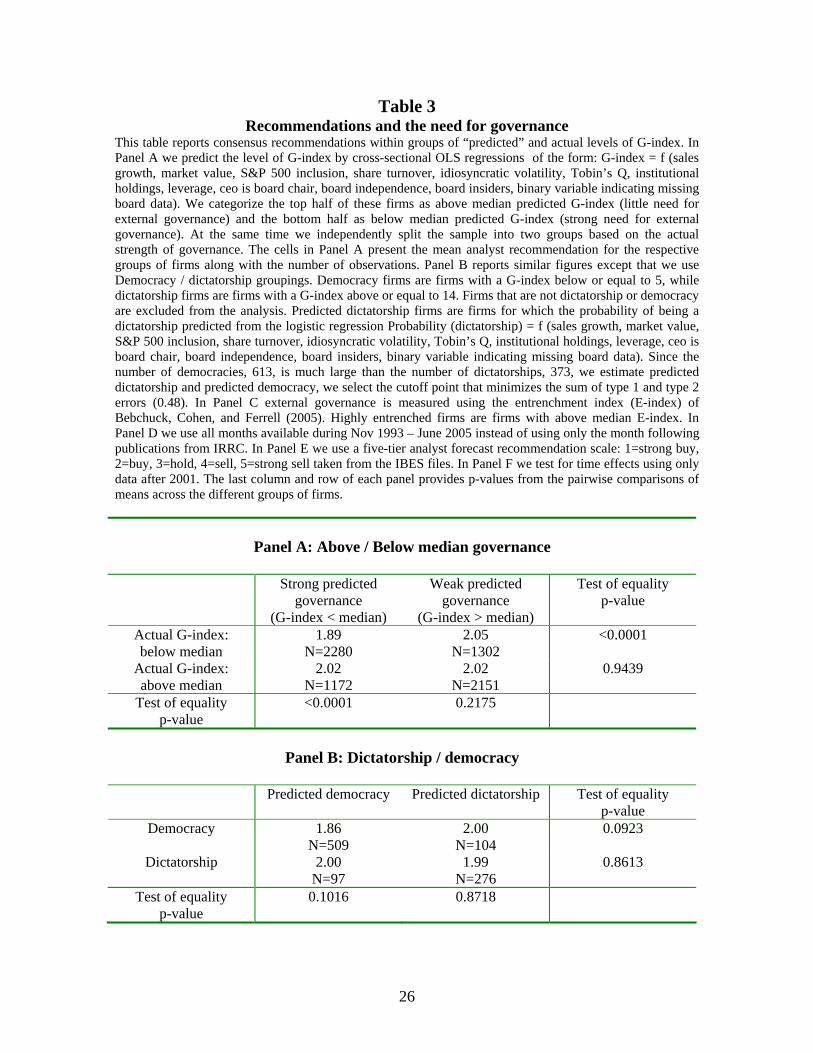
Table 3 Recommendations and the need for governance
This table reports consensus recommendations within groups of “predicted” and actual levels of G-index. In Panel A we predict the level of G-index by cross-sectional OLS regressions of the form: G-index = f (sales growth, market value, S&P 500 inclusion, share turnover, idiosyncratic volatility, Tobin’s Q, institutional holdings, leverage, ceo is board chair, board independence, board insiders, binary variable indicating missing board data). We categorize the top half of these firms as above median predicted G-index (little need for external governance) and the bottom half as below median predicted G-index (strong need for external governance). At the same time we independently split the sample into two groups based on the actual strength of governance. The cells in Panel A present the mean analyst recommendation for the respective groups of firms along with the number of observations. Panel B reports similar figures except that we use Democracy / dictatorship groupings. Democracy firms are firms with a G-index below or equal to 5, while dictatorship firms are firms with a G-index above or equal to 14. Firms that are not dictatorship or democracy are excluded from the analysis. Predicted dictatorship firms are firms for which the probability of being a dictatorship predicted from the logistic regression Probability (dictatorship) = f (sales growth, market value, S&P 500 inclusion, share turnover, idiosyncratic volatility, Tobin’s Q, institutional holdings, leverage, ceo is board chair, board independence, board insiders, binary variable indicating missing board data). Since the number of democracies, 613, is much large than the number of dictatorships, 373, we estimate predicted dictatorship and predicted democracy, we select the cutoff point that minimizes the sum of type 1 and type 2 errors (0.48). In Panel C external governance is measured using the entrenchment index (E-index) of Bebchuck, Cohen, and Ferrell (2005). Highly entrenched firms are firms with above median E-index. In Panel D we use all months available during Nov 1993 – June 2005 instead of using only the month following publications from IRRC. In Panel E we use a five-tier analyst forecast recommendation scale: 1=strong buy, 2=buy, 3=hold, 4=sell, 5=strong sell taken from the IBES files. In Panel F we test for time effects using only data after 2001. The last column and row of each panel provides p-values from the pairwise comparisons of means across the different groups of firms.
Panel A: Above / Below median governance
Strong predicted
governance (G-index < median)
Weak predicted governance
(G-index > median)
Test of equality p-value
Actual G-index: below median
1.89 N=2280
2.05 N=1302
<0.0001
Actual G-index: above median
2.02 N=1172
2.02 N=2151
0.9439
Test of equality p-value
<0.0001 0.2175
Panel B: Dictatorship / democracy
Predicted democracy
Predicted dictatorship Test of equality
p-value Democracy 1.86
N=509 2.00
N=104 0.0923
Dictatorship 2.00 N=97
1.99 N=276
0.8613
Test of equality p-value
0.1016 0.8718
26
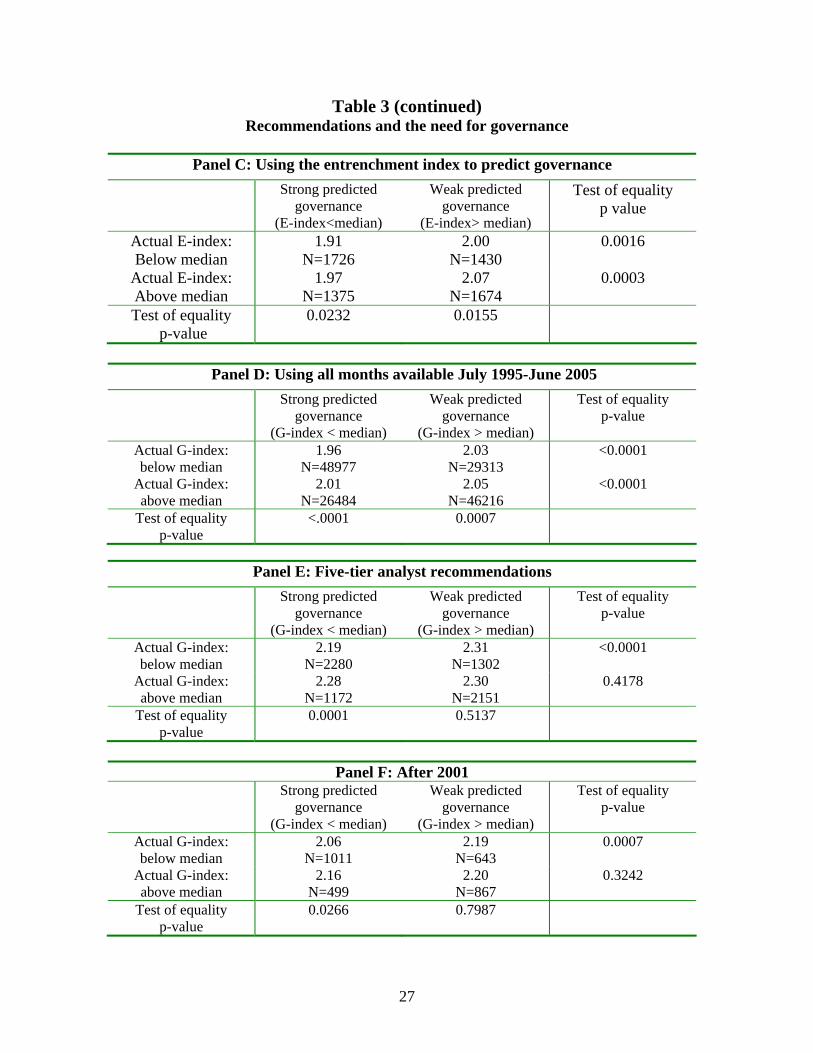
Table 3 (continued) Recommendations and the need for governance
Panel C: Using the entrenchment index to predict governance
Strong predicted governance
(E-index<median)
Weak predicted governance
(E-index> median)
Test of equality p value
Actual E-index: Below median
1.91 N=1726
2.00 N=1430
0.0016
Actual E-index: Above median
1.97 N=1375
2.07 N=1674
0.0003
Test of equality p-value
0.0232 0.0155
Panel D: Using all months available July 1995-June 2005
Strong predicted governance
(G-index < median)
Weak predicted governance
(G-index > median)
Test of equality p-value
Actual G-index: below median
1.96 N=48977
2.03 N=29313
<0.0001
Actual G-index: above median
2.01 N=26484
2.05 N=46216
<0.0001
Test of equality p-value
<.0001 0.0007
Panel E: Five-tier analyst recommendations Strong predicted
governance (G-index < median)
Weak predicted governance
(G-index > median)
Test of equality p-value
Actual G-index: below median
2.19 N=2280
2.31 N=1302
<0.0001
Actual G-index: above median
2.28 N=1172
2.30 N=2151
0.4178
Test of equality p-value
0.0001 0.5137
Panel F: After 2001
Strong predicted governance
(G-index < median)
Weak predicted governance
(G-index > median)
Test of equality p-value
Actual G-index: below median
2.06 N=1011
2.19 N=643
0.0007
Actual G-index: above median
2.16 N=499
2.20 N=867
0.3242
Test of equality p-value
0.0266 0.7987
27
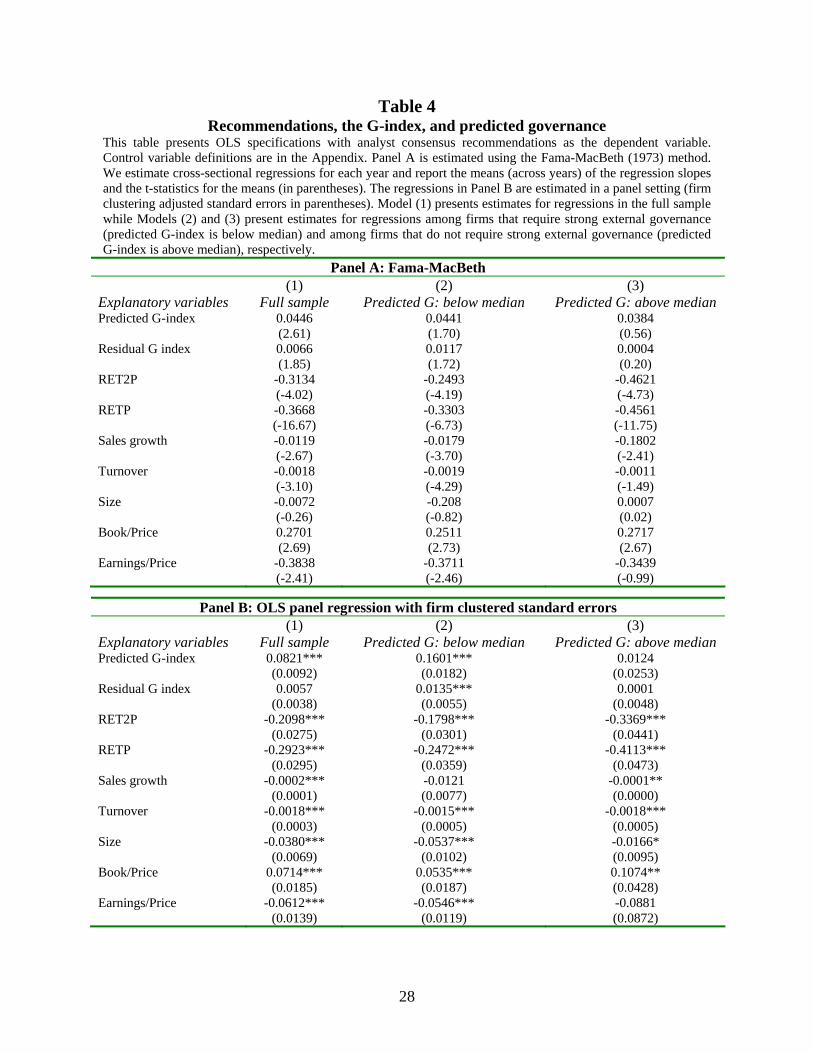
Table 4 Recommendations, the G-index, and predicted governance
This table presents OLS specifications with analyst consensus recommendations as the dependent variable. Control variable definitions are in the Appendix. Panel A is estimated using the Fama-MacBeth (1973) method. We estimate cross-sectional regressions for each year and report the means (across years) of the regression slopes and the t-statistics for the means (in parentheses). The regressions in Panel B are estimated in a panel setting (firm clustering adjusted standard errors in parentheses). Model (1) presents estimates for regressions in the full sample while Models (2) and (3) present estimates for regressions among firms that require strong external governance (predicted G-index is below median) and among firms that do not require strong external governance (predicted G-index is above median), respectively.
Panel A: Fama-MacBeth (1) (2) (3) Explanatory variables Full sample Predicted G: below median Predicted G: above median Predicted G-index 0.0446
(2.61) 0.0441 (1.70)
0.0384 (0.56)
Residual G index 0.0066 (1.85)
0.0117 (1.72)
0.0004 (0.20)
RET2P -0.3134 (-4.02)
-0.2493 (-4.19)
-0.4621 (-4.73)
RETP -0.3668 (-16.67)
-0.3303 (-6.73)
-0.4561 (-11.75)
Sales growth -0.0119 (-2.67)
-0.0179 (-3.70)
-0.1802 (-2.41)
Turnover -0.0018 (-3.10)
-0.0019 (-4.29)
-0.0011 (-1.49)
Size -0.0072 (-0.26)
-0.208 (-0.82)
0.0007 (0.02)
Book/Price 0.2701 (2.69)
0.2511 (2.73)
0.2717 (2.67)
Earnings/Price -0.3838 (-2.41)
-0.3711 (-2.46)
-0.3439 (-0.99)
Panel B: OLS panel regression with firm clustered standard errors (1) (2) (3) Explanatory variables Full sample Predicted G: below median Predicted G: above median Predicted G-index 0.0821***
(0.0092) 0.1601*** (0.0182)
0.0124 (0.0253)
Residual G index 0.0057 (0.0038)
0.0135*** (0.0055)
0.0001 (0.0048)
RET2P -0.2098*** (0.0275)
-0.1798*** (0.0301)
-0.3369*** (0.0441)
RETP -0.2923*** (0.0295)
-0.2472*** (0.0359)
-0.4113*** (0.0473)
Sales growth -0.0002*** (0.0001)
-0.0121 (0.0077)
-0.0001** (0.0000)
Turnover -0.0018*** (0.0003)
-0.0015*** (0.0005)
-0.0018*** (0.0005)
Size -0.0380*** (0.0069)
-0.0537*** (0.0102)
-0.0166* (0.0095)
Book/Price 0.0714*** (0.0185)
0.0535*** (0.0187)
0.1074** (0.0428)
Earnings/Price -0.0612*** (0.0139)
-0.0546*** (0.0119)
-0.0881 (0.0872)
28
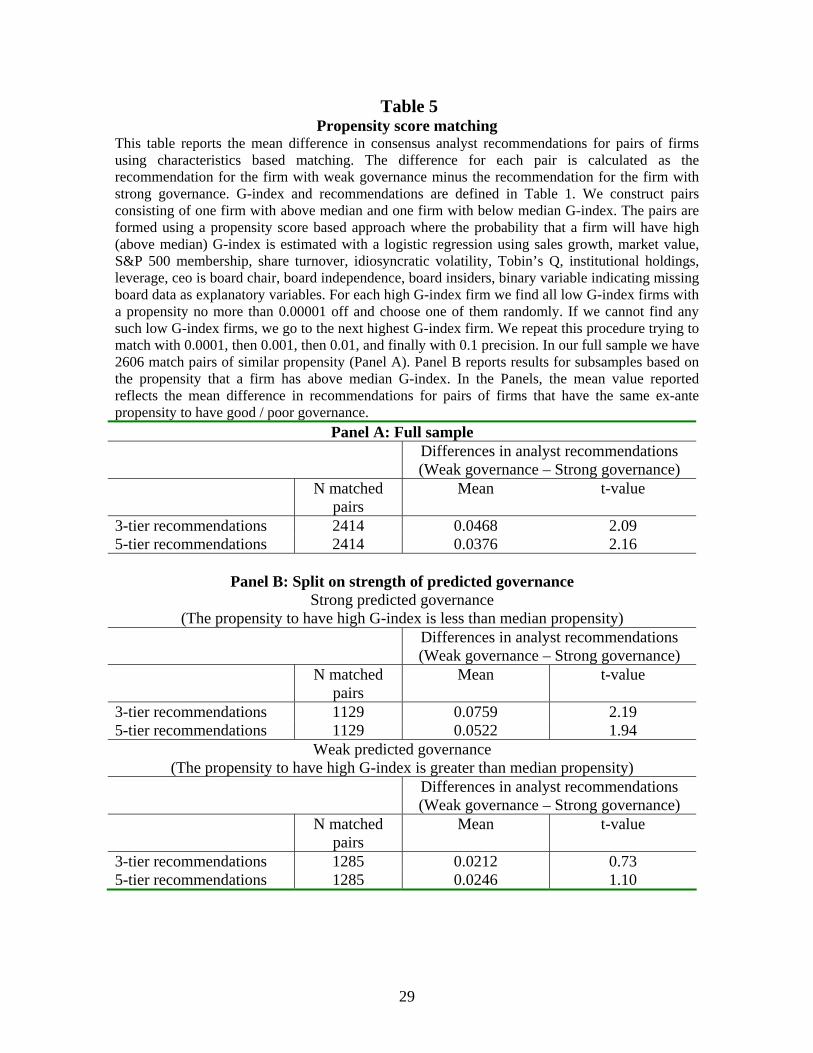
Table 5 Propensity score matching
This table reports the mean difference in consensus analyst recommendations for pairs of firms using characteristics based matching. The difference for each pair is calculated as the recommendation for the firm with weak governance minus the recommendation for the firm with strong governance. G-index and recommendations are defined in Table 1. We construct pairs consisting of one firm with above median and one firm with below median G-index. The pairs are formed using a propensity score based approach where the probability that a firm will have high (above median) G-index is estimated with a logistic regression using sales growth, market value, S&P 500 membership, share turnover, idiosyncratic volatility, Tobin’s Q, institutional holdings, leverage, ceo is board chair, board independence, board insiders, binary variable indicating missing board data as explanatory variables. For each high G-index firm we find all low G-index firms with a propensity no more than 0.00001 off and choose one of them randomly. If we cannot find any such low G-index firms, we go to the next highest G-index firm. We repeat this procedure trying to match with 0.0001, then 0.001, then 0.01, and finally with 0.1 precision. In our full sample we have 2606 match pairs of similar propensity (Panel A). Panel B reports results for subsamples based on the propensity that a firm has above median G-index. In the Panels, the mean value reported reflects the mean difference in recommendations for pairs of firms that have the same ex-ante propensity to have good / poor governance.
Panel A: Full sample Differences in analyst recommendations
(Weak governance – Strong governance) N matched
pairs Mean t-value
3-tier recommendations 2414 0.0468 2.09 5-tier recommendations 2414 0.0376 2.16
Panel B: Split on strength of predicted governance
Strong predicted governance (The propensity to have high G-index is less than median propensity)
Differences in analyst recommendations (Weak governance – Strong governance)
N matched pairs
Mean t-value
3-tier recommendations 1129 0.0759 2.19 5-tier recommendations 1129 0.0522 1.94
Weak predicted governance (The propensity to have high G-index is greater than median propensity)
Differences in analyst recommendations (Weak governance – Strong governance)
N matched pairs
Mean t-value
3-tier recommendations 1285 0.0212 0.73 5-tier recommendations 1285 0.0246 1.10
29
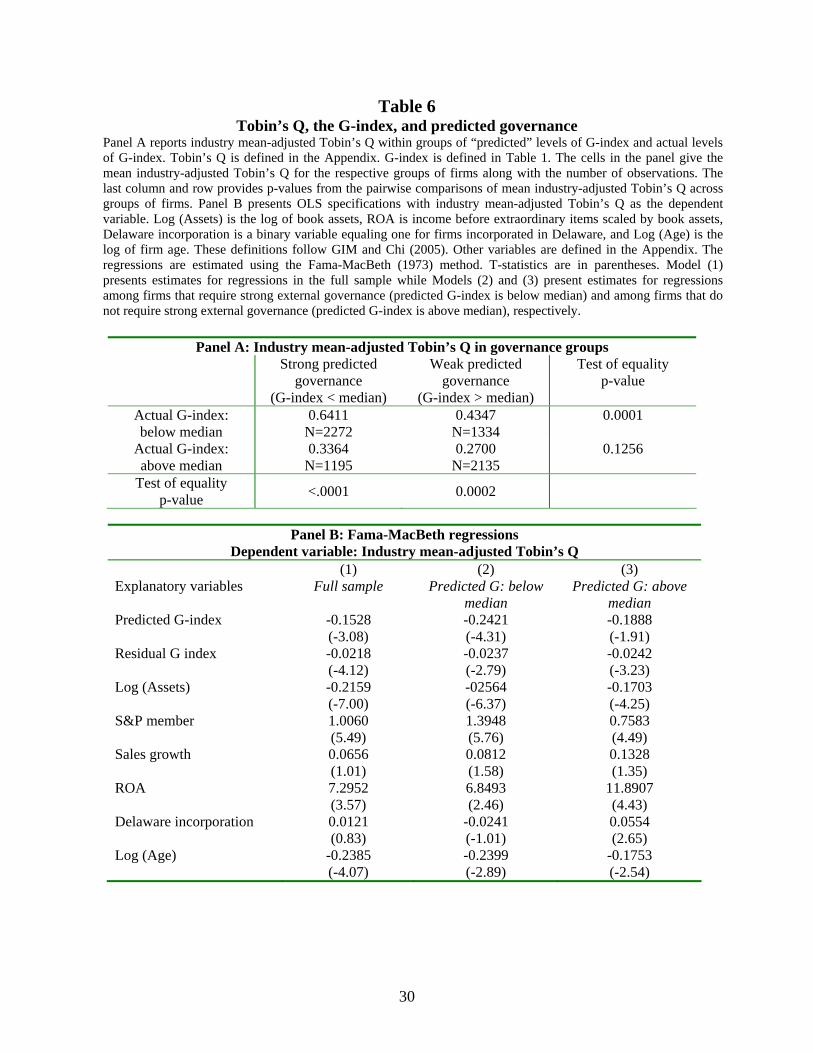
Table 6 Tobin’s Q, the G-index, and predicted governance
Panel A reports industry mean-adjusted Tobin’s Q within groups of “predicted” levels of G-index and actual levels of G-index. Tobin’s Q is defined in the Appendix. G-index is defined in Table 1. The cells in the panel give the mean industry-adjusted Tobin’s Q for the respective groups of firms along with the number of observations. The last column and row provides p-values from the pairwise comparisons of mean industry-adjusted Tobin’s Q across groups of firms. Panel B presents OLS specifications with industry mean-adjusted Tobin’s Q as the dependent variable. Log (Assets) is the log of book assets, ROA is income before extraordinary items scaled by book assets, Delaware incorporation is a binary variable equaling one for firms incorporated in Delaware, and Log (Age) is the log of firm age. These definitions follow GIM and Chi (2005). Other variables are defined in the Appendix. The regressions are estimated using the Fama-MacBeth (1973) method. T-statistics are in parentheses. Model (1) presents estimates for regressions in the full sample while Models (2) and (3) present estimates for regressions among firms that require strong external governance (predicted G-index is below median) and among firms that do not require strong external governance (predicted G-index is above median), respectively.
Panel A: Industry mean-adjusted Tobin’s Q in governance groups
Strong predicted governance
(G-index < median)
Weak predicted governance
(G-index > median)
Test of equality p-value
Actual G-index: below median
0.6411 N=2272
0.4347 N=1334
0.0001
Actual G-index: above median
0.3364 N=1195
0.2700 N=2135
0.1256
Test of equality p-value <.0001 0.0002
Panel B: Fama-MacBeth regressions
Dependent variable: Industry mean-adjusted Tobin’s Q (1) (2) (3) Explanatory variables Full sample Predicted G: below
median Predicted G: above
median Predicted G-index -0.1528
(-3.08) -0.2421 (-4.31)
-0.1888 (-1.91)
Residual G index -0.0218 (-4.12)
-0.0237 (-2.79)
-0.0242 (-3.23)
Log (Assets) -0.2159 (-7.00)
-02564 (-6.37)
-0.1703 (-4.25)
S&P member 1.0060 (5.49)
1.3948 (5.76)
0.7583 (4.49)
Sales growth 0.0656 (1.01)
0.0812 (1.58)
0.1328 (1.35)
ROA 7.2952 (3.57)
6.8493 (2.46)
11.8907 (4.43)
Delaware incorporation 0.0121 (0.83)
-0.0241 (-1.01)
0.0554 (2.65)
Log (Age) -0.2385 (-4.07)
-0.2399 (-2.89)
-0.1753 (-2.54)
30