Embed Size (px)
Citation preview
DOCUMENT RESUME
ED 412 292 TM 027 834
AUTHOR Selfa, Lance A.; Suter, Natalie; Myers, Sharon; Koch, Shaun;Johnson, Robert A.; Zahs, Daniel A.; Kuhr, Brian D.;Abraham, Sameer Y.; Zimbler, Linda J.
TITLE 1993 National Study of Postsecondary Faculty (NSOPF-93).Methodology Report.
INSTITUTION National Opinion Research Center, Chicago, IL.SPONS AGENCY National Center for Education Statistics (ED), Washington,
DC.
REPORT NO NCES-97-467PUB DATE 1997-10-00NOTE 719p.PUB TYPE Reports Evaluative (142) Tests/Questionnaires (160)EDRS PRICE MF04/PC29 Plus Postage.DESCRIPTORS *College Faculty; Colleges; Data Analysis; Data Collection;
*Higher Education; *Institutional Characteristics; NationalSurveys; Reliability; *Research Methodology; Sample Size:Sampling; *Teacho_r,Characteristics; Valiu_Lty
IDENTIFIERS *National Study of Postsecondary Faculty
ABSTRACTThe 1988 National Survey of Postsecondary Faculty
(NSOPF-88), later named the National Study of Postsecondary Faculty, was thefirst comprehensive study of higher education instructional faculty conductedby the National Center for Education Statistics since 1963. This reportprovides a description of the 1993 NSOPF and the data generated by itsmethodology. The report is organized into 11 chapters and begins byintroducing NSOPF-93 in the context of the earlier study in 1988. Chapter 2details the data collection instruments, while chapter 3 discusses theNSOPF-93 sample design and implementation. Chapter 4 reviews institutionalrecruitment procedures and their results. Data collection procedures arediscussed in chapter 5, and chapter 6 discusses data processing and control.Chapters 7 and 8 deal with institution and faculty response and nonresponseand questionnaire item response. Chapter 9 examines data quality in terms ofvalidity and reliability. Chapter 10 examines faculty counts and summarizesthe procedures used to reconcile discrepancies and to calculate bestestimates for the NSOPF-93 faculty dataset. Recommendations for future NSOPFstudies are found in chapter 11. The full-scale NSOPF-93 included aninstitution-level survey of 817 colleges and universities in the UnitedStates and a survey completed by 25,780 faculty members. Eighteen appendixescontain survey instruments, cover letters, and additional details about theresearch methodology. (Contains 61 exhibits.) (SLD)
********************************************************************************
Reproductions supplied by EDRS are the best that can be madefrom the original document.
********************************************************************************
A.Irt ur us I CRC. I rwr
he ERIC Facility has assigned:is document for processing
our judgment this documentalso of interest to the Clear
(Mouses noted to the nghtclosing should reflect their)ecial points of view
kae
I I
so
N . I
a
LA os o oik ''11
k
U S DEPARTMENT OF EDUCATIONOffice of Educational Research and Improvement
EDUCATIONAL RESOURCES INFORMATIONCENTER (ERIC)
Erlhis document has been reproduced asreceived from the person or organizationoriginating itMinor changes have been made toImprove reproduction quality
.61:6rtr,
Points of view or opinions stated in thisdocument do not necessarily represent
Iofficial OERI position or policy
Ca()
1%71
C-11
45C:)
r--BES AILABLE
I is S I .
1 I . . 9 I I 8
SCOPE-OF INTEREST NOTICE
The ERIC Facility has assignedthis document for processingto:
In our judgment, this documentis also of interest to the Clear-inghouses noted to the right.Indexing should reflect theirspecial points of view.
NATIONAL CENTER FOR EDUCATION STATISTICS
Methodology Report October 1997
1993 National Study of Postsecondary Faculty(NSOPF-93)
Methodolo 12A':74 Report
Lance A. SelfaNatalie SuterSharon MyersShaun KochRobert A. JohnsonDaniel A. ZahsBrian D. KuhrSameer Y. AbrahamNational Opinion Research Center (NORC)University of Chicago
Linda J. Zimbler, Project OfficerNational Center for Education Statistics
U.S. Department of EducationOffice of Educational Research and Improvement NCES 97-467
EST COPY AVAILAI LE
U.S. Department of EducationRichard W. RileySecretary
Office of Educational Research and ImprovementRicky T. TakaiActing Assistant Secretary
National Center for Education StatisticsPascal D. Forgione, Jr.Commissioner
The National Center for Education Statistics (NCES) is the primary federal entity for collecting, analyzing,and reporting data related to education in the United States and other nations. It fulfills a congressionalmandate to collect, collate, analyze, and report full and complete statistics on the condition of education in
the United States; conduct and publish reports and specialized analyses of the meaning and significance ofsuch statistics; assist state and local education agencies in improving their statistical systems; and review
and report on education activities in foreign countries.
NOES activities are designed to address high priority education data needs; provide consistent, reliable,complete, and accurate indicators of education status and trends; and report timely, useful, and high quality
data to the U.S. Department of Education, the Congress, the states, other education policymakers,practitioners, data users, and the general public.
We strive to make our products available in a variety of formats and in language that is appropriate to a varietyof audiences. You, as our customer, are the best judge of our success in communicating informationeffectively. If you have any comments or suggestions about this or any other NOES product or report, wewould like to hear from you. Please direct your comments to:
National Center for Education StatisticsOffice of Educational Research and ImprovementU.S. Department of Education555 New Jersey Avenue NWWashington, DC 20208-5574
October 1997
The NCES World Wide Web Home Page address ishttp://www.ed.gov/NCES/
Suggested CitationU.S. Department of Education. National Center for Education Statistics. [1993 National Study ofPostsecondary Faculty (NSOPF-93)] Methodology Report, NCES 97-467, by Lance A. Selfa, Natalie Suter,
Sharon Myers, Shaun Koch, Robert A. Johnson, Daniel A. Zahs, Brian D. Kuhr, and Sameer Y. Abraham.
Project Officer: Linda J. Zimbler. Washington, DC: 1997.
Contact:Linda J. Zimbler(202) 219-1834
BEST COPY AVAILABLE)11 r
4
1993 National Study of Postsecondary FacultyMethodology Report
Acknowledgments
The authors wish to thank the many individuals who contributed to the success of the 1992-93 NationalStudy of Postsecondary Faculty (NSOPF-93).
The NSOPF-93 National Technical Review Panel (NTRP) played an important role'in advising the NationalCenter for Education Statistics (NCES) and its contractor for NSOPF-93the National Opinion ResearchCenter (NORC) at the University of Chicagoon questionnaire development and related design issues. Alist of individual NTRP members can be found in Appendix Q.
Additional support for NSOPF-93 was provided by the National Science Foundation (NSF) and the NationalEndowment for the Humanities (NEH). Both agencies are co-sponsors of the study, and both have supportedthe field test and the full-scale study. Our special thanks are extended to NSF's Larry Suter, Jim Dietz,Mary Golladay, Joan Burrelli and Roger Baldwin (the latter currently at the College of William andMary), and to NEWs Jeff Thomas for their unstinting efforts on behalf of NSOPF-93.
The study was overseen by NCES staff. Paul D. Planchon is the Associate Commissioner, Surveys andCooperative Systems Group. Roslyn Korb and Daniel Kasprzyk provided additional oversight. LindaZimbler is.the NCES Project Officer responsible for NSOPF-93. Other NCES staff who assisted in variousaspects of the study include Sue Ahmed, Sam Barbette, Robert Burton, Michael Cohen, Steve Kaufman,Edith McArthur, Marilyn McMillen, Sam Peng, Mary Rollefson, Dennis Carroll, and Larry Bobbitt.
Sameer Abraham was the Project Director for NSOPF-93 until April, 1996. Natalie Suter, the currentProject Director, served as Associate Project Director, Task Leader for Questionnaire Development, andCoordinator of Data Collection and Data File Preparation. Other principal members, of the NSOPF-93 teaminclude the following NORC staff: Bruce Spencer, Task Leader for Sampling; Tracy Berckmans, TaskLeader for Faculty Data Collection; Brian Kuhr, Task Leader for Institution Data Collection; SharonMyers, Coordinator of List Processing; Robert Bailey, Task Leader for Data Preparation; Karen Grigorianand Belinda Willis, Data Preparation Supervisors; Suzanne Turner, David Kusinitz, and Marek Pietrzyk,Data Processing Managers; Shaun Koch, Task Leader for Data Delivery; Lance Selfa, Task Leader forSurvey Documentation; Kirk M. Wolter, Senior Vice President, Statistics and Methodology; RobertJohnson, Senior Survey Methodologist; Daniel Zahs and Hee Choon Shin, Survey Methodologists; JiaheQian, Statistician; Terry Callier, Programmer; Hiroaki Minato, Kelly Daley, Patrick Smillie and KristenPetzinger, Research Assistants; Jamie Friedman, Telephone Center Supervisor; and Daniel Sichelski,Meredith Roat, and Robert Dustin, Budget Monitors. Sally Murphy and Ezella Pickett coordinatedrefusal conversion and locating efforts during data collection. Jim Wolf served as a consultant in thepreparation of the institution data file. Suzanne Erfurth and Karen Rosenthal provided editorialassistance. Additional assistance and support was generously provided by: Norman Bradburn, PatriciaGreen, Bernard Dugoni, Gloria Evenson, Marilyn Ford, Jay Goddard, Steven Ingels, Donald Kotecki,Richard Kulka, Kenneth Rasinski, Karen Sutherlin, and Lisa Thalji.
Under a subcontract from the National Opinion Research Center (NORC), Rita Kirshstein of PelavinResearch Institute assisted in development of the questionnaires, designed and conducted most of the dataanalysis, and assisted in related project tasks. Valerie Martin Conley of Synectics, Inc., provided technicalguidance on various aspects of the study. Steve Wenck of Synectics, Inc., provided technical support.Additional support was provided by project consultants: James Fairweather of Pennsylvania StateUniversity, Robert Blackburn and Janet Lawrence of the University of Michigan, and Kathryn Moore ofMichigan State University.
BEST COPY AVAILABLE liir
1993 National Study of Postsecondary FacultyMethodology Report
The authors wish to express their gratitude to NCES reviewers and other reviewers of this document. The
following individuals served as the principal reviewers, and provided valuable feedback and helpful
suggestions: Daniel Kasprzyk, Roslyn Korb, Linda Zimbler, Robert Burton, Michael Cohen, Steve
Kaufman, and Marilyn McMillen, NCES; Valerie Conley, Synectics, Inc.; Jeff Thomas, NEH; and Jay
Chronister, University of Virginia.
Finally, the authors would like to express their gratitude to the thousands of Institutional Coordinators,
institution respondents, Chief Administrative Officers and individual faculty members who participated in the
study. Without their cooperation, NSOPF-93 could never have been completed.
1993 National Study of Postsecondary FacultyMethodology Report
Table of Contents
1. Introduction1
1.1 Organization of the Methodology Report1
1.2 Background: NSOPF-881
1.3 Background: NSOPF-93 21.4 NSOPF-93 Field Test 31.5 NSOPF-93 Full-Scale Study 31.6 Restricted-use Data File and Documentation 41.7 Public-use Data Files and Documentation 41.8 Derived Variables 41.9 Electronic Codebooks on CD-ROM and Documentation 51.10 Data Analysis System on CD-ROM and Documentation 51.11 How to Obtain NSOPF-93 Products 6
2. Data Collection Instruments 92.1 Overview 92.2 Development of Questionnaire Items 92.3 Faculty Questionnaire 102.4 Institution Questionnaire 11
3. Sample Design and Implementation 253.1 NSOPF-93 Sample Design 253.2 Institution Universe 253.3 Faculty Universe 263.4 Sampling Frame 263.5 First Stage Sampling: Institution-Level 303.6 Institution Nonresponse 313.7 Institution Replacements 323.8 Second Stage Sampling: Faculty-Level 323.9 Subsampling of Faculty 343.10 Calculation of Weights 343.11 First-Stage Institution Weights 353.12 Calculation of Faculty Weights 373.13 Calculation of Weights for Institution Questionnaires 403.14 Design Effects and Approximate Standard Errors 413.15 Calculating Estimates for Institutions Selected with Certainty 513.16 Using Replicate Weights with the NSOPF-93 Datasets 51
3.16.1 Faculty File Replicate Weights 523.16.2 Institution File Replicate Weights 52
4. Institutional Recruitment: Procedures and Results 554.1 OMB Clearance and Mail Procedures 56
4.1.1 Initial Mai lout and Remailings 574.1.2 Mail Follow-up Procedures 584.1.3 Mai louts to Supplemental Sample 58
4.2 Telephone Follow-up Procedures:1 584.2.1 Selection and Training of Prompters 584.2.2 Initial Telephone Contact and Follow-up 59
BEST COPY AVAILABLE
1993 National Study of Postsecondary FacultyMethodology Report
Table of Contents (cont.)
4,2.3 Additional Telephone Follow-up for Nonresponse4.2.4 Refusals and Problem Cases4.2.5 Telephone Follow-up of List Discrepancies/Retrieval
4.3 Revised Data Collection Plan4.4 Results of Institution Recruitment
5. Data Collection Procedures and Implementation
5960606062
65
5.1 Overview 65
5.2 Faculty Survey 66
5.2.1 Faculty Mail and Telephone Follow-up 66
5.2.2 Faculty Locating and Eligibility Screening Procedures 68
5.2.3 Faculty Refusal Conversion 69
5.2.4 Follow-up with Specific Subgroups of Faculty 69
5.2.5 Faculty Follow-up by Institutional Coordinators 70
5.2.6 Faculty Telephone Interviews 70
5.2.7 Field Interviewing and Locating 70
5.2.8 Faculty Data Retrieval 71
5.3 Data Collection Results: Faculty Questionnaire 71
5.4 Institution Survey 75
5.4.1 Initial Mailing to Institution Respondent 75
5.4.2 Postcard Prompts to Institutions 75
5.4.3 Second Questionnaire Mailing to Institutions 76
5.4.4 Telephone Prompting and Follow-up of Institutions 76
5.4.5 Third Questionnaire Mailing to Institutions 76
5.4.6 Interviewer-Assisted Data Collection at Institutions 77
5.4.7 Data Abstraction at Institutions 77
5.4.8 Institution Data Retrieval 78
5.5 Data Collection Results: Institution Questionnaire 78
6. Data Control and Data Processing 81
6.1 Overview 81
6.2 Faculty List Processing and Preparation for Sampling 81
6.3 Receipt Control and Monitoring of Institution and Faculty Questionnaires 82
6.4 Data Entry and Coding 83
6.4.1 Data Entry 83
6.4.2 Faculty Questionnaire Coding 83
6.4.3 Faculty Questionnaire Eligibility Review 87
6.4.4 Institution Questionnaire Coding 87
6.5 Scan Editing, Machine Editing, and Imputation 90
6.5.1 Faculty Questionnaire Editing and Imputation 90
6.5.2 Institution Questionnaire Editing and Imputation 92
6.6 Retrieval of Missing Data 93
6.7 Storage and Protection of Completed Instruments 94
1
7. Institution and Faculty Unit Response and NOnresponse 95
7.1 Institution Response Rates and:Participation Rates 95
7.2 Characteristics of Institution Questionnaire Response and Nonresponse 95
BEST COPY AVAHLABLE
1993 National Study of Postsecondary FacultyMethodology Report
Table of Contents (cont.)
7.3 Faculty Questionnaire Response Rates 977.4 Faculty Eligibility 987.5 Summary: An Assessment of NSOPF-93 Faculty Response Rates 99
8. Questionnaire Item Nonresponse 1038.1 Item Nonresponse: Definition and Considerations 1038.2 Faculty Questionnaire Item Nonresponse 104
8.2.1 Nonresponse by Item Placement, Item Topic, and Administration Mode 1048.2.2 Items with High Item Nonresponse 108
8.3 Institution Questionnaire Item Nonresponse 1088.3.1 Item Nonresponse by Questionnaire Position and Topic 1098.3.2 Items with High Item Nonresponse 110
9. Faculty Questionnaire Data Quality 1139.1 Validity and Reliability in the NSOPF-93, Field Test 1139.2 Changes to the 1993 Full Scale Study 1149.3 Validity in the 1993 Full Scale Study 1159.4 An Assessment of Validity for the 1993. Full Scale Study 1209.5 Data Quality and Faculty Population Estimates 121
10. Institution Recontact, Best Estimates, and Post-Stratification 12310.1 Accuracy of National Population Estimates 12310.2 Discrepancies in Faculty Counts , 12510.3 Obtaining Verification from Institutions 13110.4 Deriving Unweighted "Best Estimates". of NSOPF-93 Faculty 13410.5 The Impact of the "Best Estimates" 13610.6 Poststratification to Best Estimates 13810.7 Comparability Issues Regarding NSOPF-93 Faculty Questionnaire Data 140
10.7.1 Definition of Instructional Faculty 14010.7.2 Comparison of NSOPF-93 with Other Survey Data 14110.7.3 A Special Note about Estimates of Health Sciences Faculty 143
11. Recommendations 14511.1 Changing Data Collection Time Frames and Commencing List Collection Later 14511.2 Increasing the Use of Telephone Interviews 14611.3 Providing Institutions with an Information Sheet at the Time of List Collection 14611.4 Coordinating Institution Questionnaire Mailing and List Collection 14711.5 Routing Institutional Coordinator Packet to Institutional Research Director 14811.6 Changing Institution Questionnaire Instructions and Questions 14811.7 Eliminating Option of Sending Computer Tapes 14911.8 Providing Diskette or List Layout Example 14911.9 Scanning Hardcopy Faculty Lists 15011.10 Using the Internet 15011.11 Maximizing Early Awareness of the Study .1 15011.12 Requesting Address Updates from Institutional' Coordinator 15111.13 Requesting System-wide Data 15111.14 Cognitive Research to Aid Institution Data Collection 151
BEST COPY AVAILABLEvii
r .
1993 National Study of Postsecondary FacultyMethodology Report
Table of Contents (cont.)
11.15 Changes to Faculty Questionnaire 151
11.16 Nonresponse Adjustment by Faculty Discipline 152
11.17 Number of Replicate Weights 152
11.18 Poststratification to Institution Questionnaire Counts 152
11.19 Overlap Sample Design for Future NSOPF Cycles 153
viii
BEST COPY AVAILABLE
1993 National Study of Postsecondary FacultyMethodology Report
Exhibits
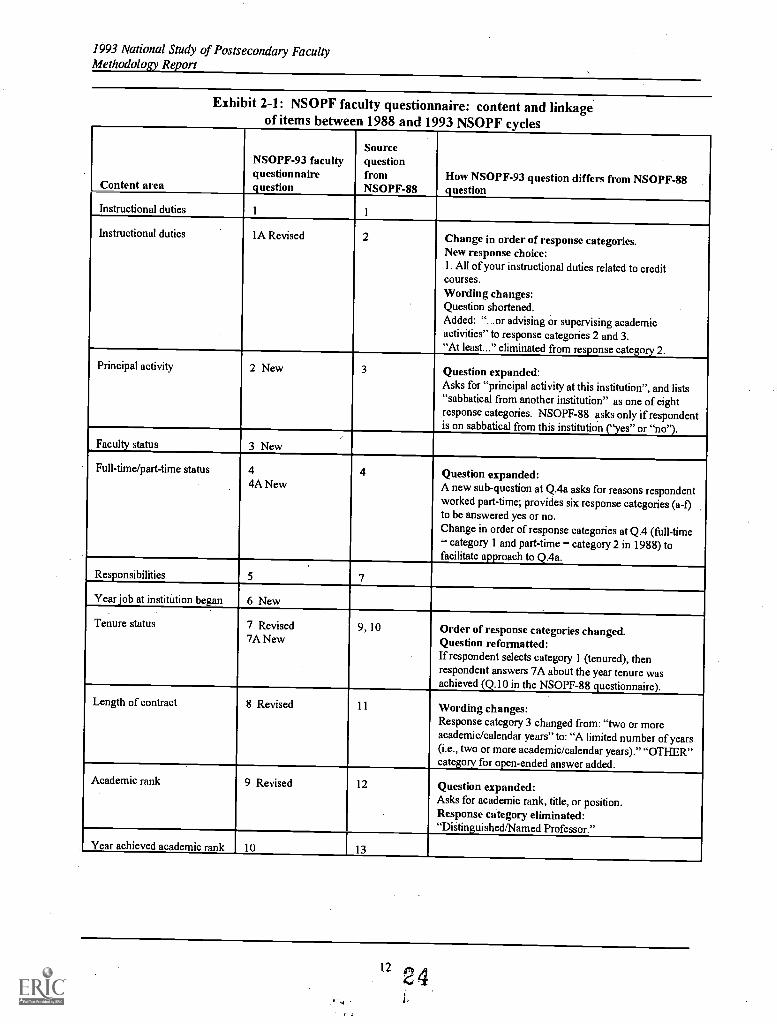
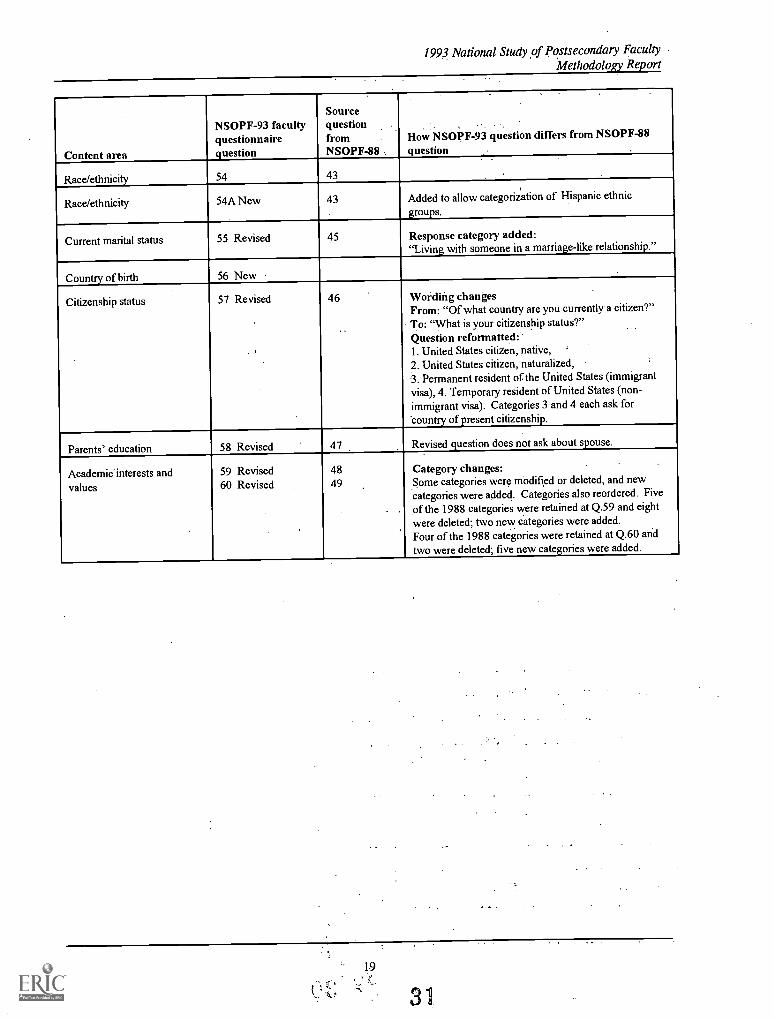
Exhibit 2-1: NSOPF faculty questionnaire: content and linkage of items between 1988 and1993 NSOPF cycles 12
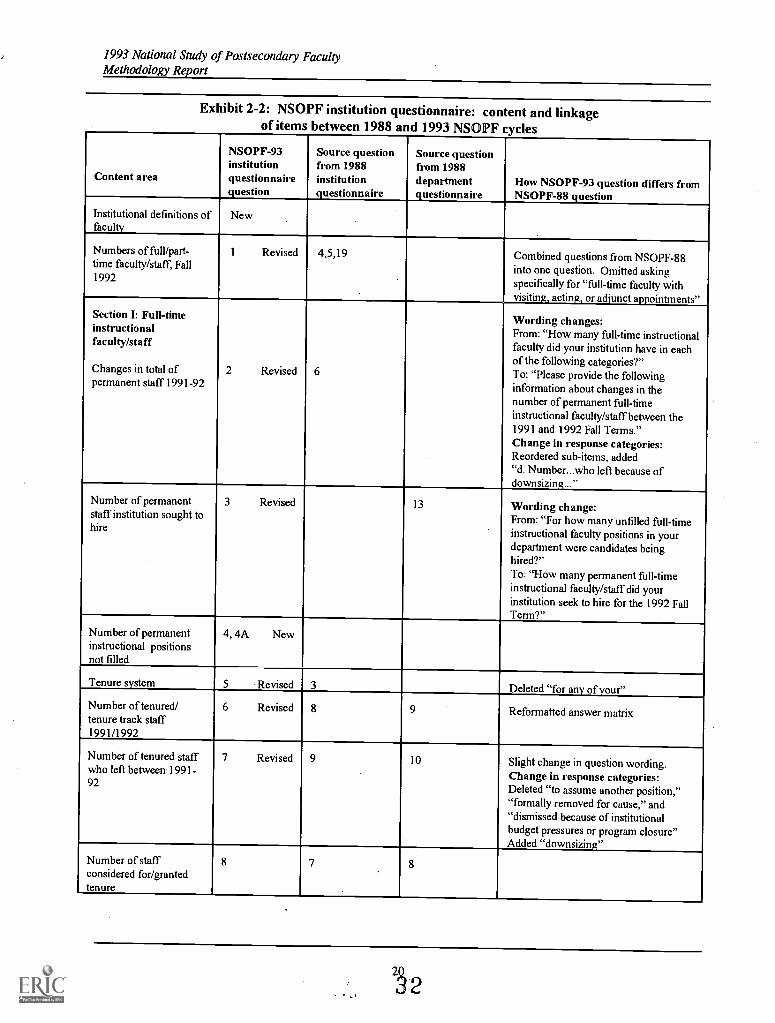
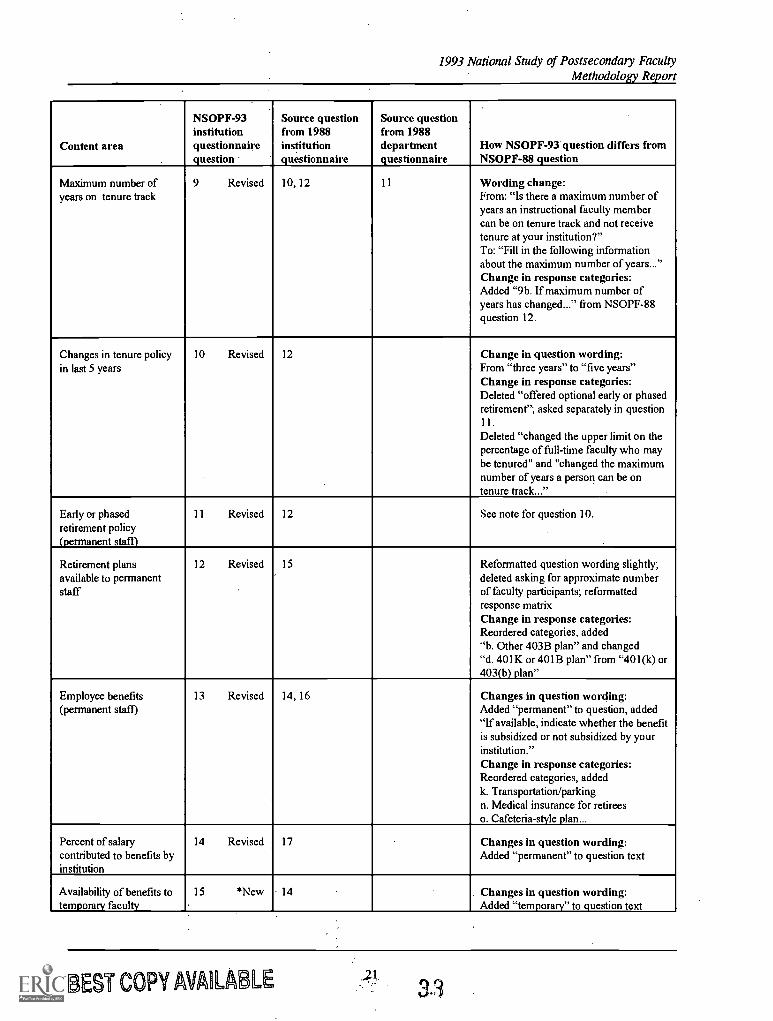
Exhibit 2-2: NSOPF institution questionnaire: content and linkage of items between 1988 and1993 NSOPF cycles 20
Exhibit 3-1: Institutional sample 1988 design, 1993 design, and NSOPF-93 frame 29Exhibit 3-2: Classification of institutions by eligibility and cooperation 37Exhibit 3-3: Profile of faculty sampling lists 39Exhibit 3-4: Summary statistics for NSOPF-93 faculty and institution weights 41Exhibit 3-5: NSOPF-93 faculty questionnaire: standard errors and design effects 45Exhibit 3-6: NSOPF-93 institution questionnaire standard errors and design effects 47Exhibit 3-7: Mean design effects (DEFF) and root design effects (DEFT) for NSOPF-93 faculty
subgroups 50Exhibit 3-8: Finite population correction factors (fpc) for each institution stratum 54Exhibit 4-1: Institutional participation rates for NSOPF cycles 62Exhibit 4-2: NSOPF-93 institution participation rates by type of institution 63Exhibit 4-3: Items provided by participating institutions 63Exhibit 4-4: NSOPF-93 faculty list content 64Exhibit 5-1: Chronology of NSOPF-93 data collection 66Exhibit 5-2: NSOPF-93 faculty questionnaire mail and telephone schedule (dates mailed and
percent of original sample targeted) 67Exhibit 5-3: Faculty response rates by initial mailing date 72Exhibit 5-4: Faculty response rates by level and control of institution 72Exhibit 5-5: Faculty response rates by institution sampling stratum 73Exhibit 5-6: Faculty response rates by faculty sampling characteristics 74Exhibit 5-7: Response rates for faculty members whose institutions supplied their home address,
by employment status 75Exhibit 5-8: Institution questionnaire response rates by institution sampling stratum 79Exhibit 5-9: Institution questionnaire response rates by mode of administration 80Exhibit 5-10: Institution response rates by cycle 80Exhibit 7-1: Institution questionnaire and faculty list response rates (unweighted) by sample
component 95Exhibit 7-2: Institution questionnaire response rate and faculty list participation rate (weighted)
by institution type and control 96Exhibit 7-3: Institution questionnaire response rate and faculty list participation rate (weighted)
by institution sampling stratum 97Exhibit 7-4: Faculty response rates (unweighted) by NSOPF cycle 98Exhibit 7-5: Faculty response and nonresponse status 99Exhibit 7-6: Faculty questionnaire and overall response rates by institutional characteristics 101Exhibit 7-7: Faculty response rates by individual characteristics 102Exhibit 8-1: Mean item nonresponse rates for faculty questionnaire by thirds (unweighted data) 105Exhibit 8-2: Mean item nonresponse rates for faculty questionnaire by topic (unweighted data) 106Exhibit 8-3: Mean item nonresponse rates for critical items on the faculty questionnaire
(unweighted data) 106Exhibit 8-4: Mean item nonresponse rates for faculty questionnaire, by questionnaire third and mode
(unweighted data) 107Exhibit 8-5: Mean item nonresponse rates for faculty questionnaire by section and mode
(unweighted data) r, 108
BEST COPY AVAILABLE
1993 National Study of Postsecondary FacultyMethodology Report
Exhibits (cont.)
Exhibit 8-6: Mean item nonresponse rates for institution questionnaire by content area(unweighted data) 109
Exhibit 8-7: Mean item nonresponse rates for institution questionnaire by questionnaire third(unweighted data) 109
Exhibit 8-8: Mean item nonresponse rates for critical items on the institution questionnaire(unweighted data). 110
Exhibit 9-1: Comparison of faculty list data and faculty questionnaire data, by gender 116Exhibit 9-2: Comparison of faculty list data and faculty questionnaire data,
by full-time/part-time status 117.
Exhibit 9-3: Comparison of faculty list data and faculty questionnaire data,by faculty discipline 118
Exhibit 9-4: Comparison of faculty list data and faculty questionnaire data,by race/ethnicity 119
Exhibit 9-5: Comparison of faculty and institution data, NSOPF-93: various measures 120Exhibit 9-6: Measures of reliability and validity (unweighted data) 121
Exhibit 10-1: Estimates of total, full-time and part-time faculty teaching for-credit courses fromfour NSOPF sources (weighted) 123
Exhibit 10-2: Changes in health sciences faculty between.NSOPF-88 and NSOPF-93 (weighted) 124Exhibit 10-3: NSOPF counts of total faculty (unweighted) by source and year 126Exhibit 10-4: Discrepancies by institution characteristics: size, type and control mean differences
(matched pairs t-tests), fall 1992 128Exhibit 10-5: Discrepancies by sampling stratum mean differences (matched pairs t-tests), fall 1992 . . . 129Exhibit 10-6: A comparison of matched institutions and the 100 institutions with the largest
discrepancies (unweighted frequencies) 130Exhibit 10-7: Sources for verified estimates from reconciliation effort, fall 1992 (n=492) 132Exhibit 10-8: Explanations institutions gave for discrepancies between LIST and QUEX,
fall 1992 (n=492) (unweighted frequencies) 133Exhibit 10-9: Difference between verified data and original faculty list by first reason for
discrepancy, fall 1992 (weighted data) 138Exhibit 10-10: NSOPF-93 faculty questionnaire best estimates 139Exhibit 10-11: Estimates of total, full-time and part-time faculty teaching for-credit courses from
four NSOPF sources 140Exhibit 10-12: Number of instructional faculty (X01_1=1), by modified NSOPF-88 stratum 141
Exhibit 10-13: Percent of instructional faculty by institution type (X01_1=1), by modifiedN S 0 PF -88 stratum 141
Exhibit 10-14: Comparison of 1992-93 salaries between NSOPF and AAUP surveys 142Exhibit 10-15: Comparison of 1992-93 salaries among AAUP, NSOPF-93 and IPEDS surveys 143Exhibit 11-1: Sample data collection schedule 146
HST COPY MAU = LE
-'11 2
1993 National Study of Postsecondary FacultyMethodology Report
Appendices
Appendix A: 1988 NSOPF Questionnaire for DepartmentsAppendix B: 1988 NSOPF Faculty QuestionnaireAppendix C: 1988 NSOPF Institution QuestionnaireAppendix D: 1993 NSOPF Faculty Questionnaire and Reinterview QuestionnairePilot TestAppendix E: 1993 NSOPF Institution QuestionnairePilot TestAppendix F: 1993 NSOPF Faculty QuestionnaireAppendix G: 1993 NSOPF Institution QuestionnaireAppendix H: 1993 NSOPF Abbreviated Faculty QuestionnaireAppendix I: Critical Items and Nonresponse: 1993 NSOPF Faculty QuestionnaireAppendix J: Critical Items and Nonresponse: 1993 NSOPF Institution QuestionnaireAppendix K: Letters and Forms for Institution Recruitment:
Letter to Chief Administrative OfficerLetter to Institutional OfficialConfirmation FormFaculty List Documentation FormChecklist (reverse side of Faculty List Documentation Form)Instructions for Preparing Lists of FacultyInstructions for Preparing Machine-Readable Lists of FacultyAffidavit of Nondisclosure1993 NSOPF Brochure
Appendix L: Letters to Faculty Questionnaire RespondentsInitial Cover Letter to FacultySecond Faculty Questionnaire MailingThird Faculty Questionnaire Mailing
Appendix M: Letters to Institution Questionnaire RespondentsInitial Cover Letter to Institutions that Provided Faculty ListsInitial Cover Letter to Institutions that Did Not Provide Faculty ListsFollow-up Postcard
Appendix N: Letter to Institution Coordinator for Faculty Follow-upAppendix 0: Derived Variables
Exhibit 071: Discipline Crosswalk, NSOPF 1988-1993Exhibit 0-2: Derived Variable Crosswalk to NSOPF-88
Appendix P: Imputation Flags for the Institution Data File (Public-use)Imputation Flags for the Faculty Data File (Restricted-use)
Appendix Q: NSOPF-1993 National Technical Review Panel (NTRP) MembersAppendix R: Technical Report: Discrepancies in Faculty Estimates in the 1992-93 National Study of
Postsecondary Faculty
BEST COPY AVAILABLE xi
1993 National Study of Postsecondary FacultyMethodology Report
1. Introduction
1.1 Organization of the Methodology Report
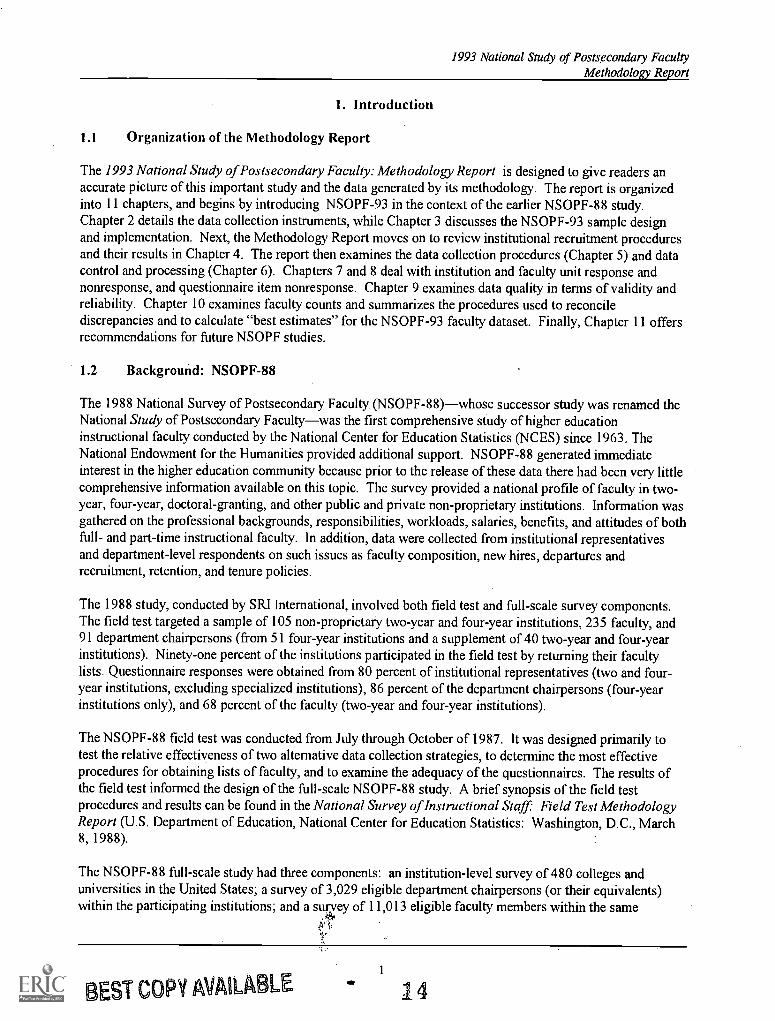
The 1993 National Study of Postsecondary Faculty: Methodology Report is designed to give readers anaccurate picture of this important study and the data generated by its methodology. The report is organizedinto 11 chapters, and begins by introducing NSOPF-93 in the context of the earlier NSOPF-88 study.Chapter 2 details the data collection instruments, while Chapter 3 discusses the NSOPF-93 sample designand implementation. Next, the Methodology Report moves on to review institutional recruitment proceduresand their results in Chapter 4. The report then examines the data collection procedures (Chapter 5) and datacontrol and processing (Chapter 6). Chapters 7 and 8 deal with institution and faculty unit response andnonresponse, and questionnaire item nonresponse. Chapter 9 examines. data quality in terms of validity andreliability. Chapter 10 examines faculty counts and summarizes the procedures used to reconcilediscrepancies and to calculate "best estimates" for the NSOPF-93 faculty dataset. Finally, Chapter 11 offersrecommendations for future NSOPF studies.
1.2 Background: NSOPF-88
The 1988 National Survey of Postsecondary Faculty (NSOPF-88)whose successor study was renamed theNational Study of Postsecondary Facultywas the first comprehensive study of higher educationinstructional faculty conducted by the National Center for Education Statistics (NCES) since 1963. TheNational Endowment for the Humanities provided additional support. NSOPF-88 generated immediateinterest in the higher education community because prior to the release of these data there had been very littlecomprehensive information available on this topic. The survey provided a national profile of faculty in two-year, four-year, doctoral-granting, and other public and private non-proprietary institutions. Information wasgathered on the professional backgrounds, responsibilities, workloads, salaries, benefits, and attitudes of bothfull- and part-time instructional faculty. In addition, data were collected from institutional representativesand department-level respondents on such issues as faculty composition, new hires, departures andrecruitment, retention, and tenure policies.
The 1988 study, conducted by SRI International, involved both field test and full-scale survey components.The field test targeted a sample of 105 non - proprietary two-year and four-year institutions, 235 faculty, and91 department chairpersons (from 51 four-year institutions and a supplement of 40 two-year and four-yearinstitutions). Ninety-one percent of the institutions participated in the field test by returning their facultylists. Questionnaire responses were obtained from 80 percent of institutional representatives (two and four-year institutions, excluding specialized institutions), 86 percent of the department chairpersons (four-yearinstitutions only), and 68 percent of the faculty (two-year and four-year institutions).
The NSOPF-88 field test was conducted from July through October of 1987. It was designed primarily totest the relative effectiveness of two alternative data collection strategies, to determine the most effectiveprocedures for obtaining lists of faculty, and to examine the adequacy of the questionnaires. The results ofthe field test informed the design of the full-scale NSOPF-88 study. A brief synopsis of the field testprocedures and results can be found in the National Survey of Instructional Staff Field Test MethodologyReport (U.S. Department of Education, National Center for Education Statistics: Washington, D.C., March8, 1988).
The NSOPF-88 full-scale study had three components: an institution-level survey of 480 colleges anduniversities in the United States; a survey of 3,029 eligible department chairpersons (or their equivalents)within the participating institutions; and a survey of 11,013 eligible faculty members within the same
A.
BEST COPY AVAILABLE 14
1993 National Study of Postsecondary FacultyMethodology Report
participating institutions. Data were collected for these three surveys between December 1987 and October1988. Non-proprietary higher education institutions (two-year, four-year, or advanced degree) were stratifiedby size and assigned to strata adapted from the higher education institution classification system developedby the Carnegie Foundation for the Advancement of Teaching.' Within each stratum, institutions wererandomly selected. Lists of faculty employed as of October 15, 1987 were requested from participatinginstitutions, and of the 480 institutions selected, 449 (94 percent) agreed to participate and provided lists oftheir fall 1987 instructional faculty and department chairpersons. Within four-year institutions, faculty anddepartment chairpersons were stratified by program area and selected; within two-year institutions, simplerandom samples of faculty and department chairpersons were selected; and within specialized institutions(religious, medical, etc.), only faculty were sampled. At all institutions, instructional faculty were stratifiedon the basis of employment statusfull-time and part-time. Questionnaires that asked about activitiesduring the 1987 fall term were mailed in 1988. Questionnaire responses were obtained from 424 institutions(88 percent), 2,427 department chairpersons (80 percent), and 8,383 instructional faculty (76 percent).
A discussion of the procedures and results of the 1988 full-scale study appears in 1988 National Survey ofPostsecondary Faculty: Methodology Report (U.S. Department of Education, National Center forEducation Statistics: Washington, D.C., May 18, 1990). Four analytical reports were also prepared usingNSOPF-88 data: Faculty in Higher Education Institutions, 1988 [NCES 90-365]; Institutional Policies andPractices Regarding Faculty in Higher Education [NCES 90-333]; A Descriptive Report of AcademicDepartments in Higher Education Institutions [NCES 90-339]; and Profiles of Faculty in HigherEducation Institutions, 1988 [NCES 91-389].
1.3 Background: NSOPF-93
Like its predecessor, NSOPF-93 was designed to provide a national profile of faculty in two-year, four-year(and above), doctoral-granting, public and private non-proprietary institutions, and to gather information on
. the backgrounds, responsibilities, workloads, salaries, benefits, and attitudes of both full- and part-timefaculty. NSOPF-93 was conducted by the National Opinion Research Center (NORC), a social scienceresearch center at the University of Chicago. NSOPF-93 was sponsored by the National Center for EducationStatistics (NCES), with additional support from two co-sponsoring agencies, the National Endowment for theHumanities (NEH) and the National Science Foundation (NSF). NEH and NSF sponsored sampleaugmentations for both the field test and full-scale study, and provided support for the study in its entirety.The sample augmentations were designed to provide higher levels of precision for faculty overall and toprovide oversamples of specific subgroups of faculty, particularly full-time females; black, non-Hispanics;Asian/Pacific Islanders; Hispanics; and faculty in the humanities.
The second cycle of the National Study of Postsecondary Faculty (NSOPF-93) was conducted in response toa continuing need for data on faculty and other instructional personnel, all of whom directly affect the quality,of education in postsecondary institutions. Faculties determine curriculum content, performance standards .
for students, and the quality of students' preparation for careers. In addition, faculty members performresearch and development work upon which the nation's technological and economic advancement depend.For these reasons, it is essential to understand who they are; what they do; and whether, how, and why thenation's faculty are changing.
Data collected for the second cycle of NSOPF expand the current information base about faculty in severalimportant ways. First, the data allow for comparisons to be made over time. Second, more detailed
'See A Classification of Institutions of Higher Education, The Carnegie Foundation for the Advancement ofTeaching (Princeton, N.J., 1987).
2
REST COPY AMIABLE
1993 National Study of Postsecondary FacultyMethodology Report
comparisons can be made because of the increase in both the institutional and faculty sample sizes. Third,these data examine critical issues surrounding faculty that have developed since the 1988 study. Fourth, toget a clearer and more accurate picture of faculty and instruction, NSOPF-93 expanded the definition offaculty to include both non-instructional faculty and non-faculty instructional personnel in higher educationinstitutions. Henceforth, the term "faculty" will be used in its broadest sense to designate both non-instructional and instructional faculty and other instructional staff. Chapter 3 discusses the definitions ofeligible faculty in greater detail.
1.4 NSOPF-93 Field Test
A field test of NSOPF-93 data collection instruments and survey procedures with a national probabilitysample of 136 institutions (54 core institutions, and 82 institutions selected to augment the core sample,funded by NSF) and 636 faculty was conducted between February and September 1992. The generalpurposes of the field test were to evaluate the adequacy of the faculty and institution questionnaires and totest key procedures to be used in the full-scale study.
Institutional cooperation was sought from all 136 institutions and a faculty list was solicited from eachinstitution. The overall participation rate for faculty list collection was 89 percent (93 percent for the coresample and 87 percent for the augmented sample). The field test faculty sample consisted of 636 facultyselected from 53 participating core institutions. A total of 495 faculty participated, for a response rate of 82percent. The institution survey was limited to the 120 participating institutions that had provided lists offaculty and/or confirmed their participation prior to September 1, 1992. Ninety four of these institutionsresponded to the institution questionnaire for a response rate of 78 percent (82 percent for the coreinstitutions and 78 percent for the augmented sample).
The results of the field test informed the design of the full-scale study. A detailed discussion of theprocedures and results of the 1992 field test appears in the 1992-93 National Study of PostsecondaryFaculty Field Test Report (U.S. Department of Education, National Center for Education Statistics,Washington, D.C., February 1994 [NCES 93-390]).
1.5 NSOPF-93 Full-Scale Study
For the NSOPF-93 full-scale study, the sample sizes were increased from 480 institutions and 11,013 faculty(in 1988), to 974 institutions and 31,354 faculty. The larger sample sizes allowed for more detailedcomparisons and higher levels of precision at both the institution and faculty levels. The sample was alsoaugmented to provide data about faculty in the humanities; faculty in these disciplines were oversampled, aswere black, non-Hispanic; Hispanic; Asian/Pacific Islander; and full-time female faculty. As in the 1988study, the sample consisted of non-proprietary two- and four-year (and above) higher education institutionsstratified by a modified Carnegie classification and by faculty size. Institutional recruitment for the full-scalestudy began in October, 1992, when recruitment packets were mailed to the Chief Administrative Officers of789 institutions. A supplemental sample of 185 institutions was added to ensure adequate representationacross all strata. Of the 974 institutions in the total sample, 12 were found to be ineligible. Of the 962eligible institutions, 817 institutions (85 percent) agreed to participate in the study (i.e., to provide lists offaculty employed during the 1992 Fall Term, that is, the term in progress on October 15, 1992). The facultysample was selected from these 817 institutions. In 1993, questionnaires that asked primarily about the 1992Fall term were mailed to institutions and faculty. (Specific questionnaire items are discussed in Chapter 2.)
3
16
1993 National Study of Postsecondary FacultyMethodology Report
The target sample for the faculty survey consisted of 31,354 faculty selected from 817 participatinginstitutions. Of these, 1,590 were found to be ineligible. Of the 29,764 eligible faculty, 25,780 (87 percent)completed questionnaires either by self-administration or by a computer-assisted telephone interview (CATI).
Institution questionnaires were mailed to institution representatives at all 962 eligible institutions, includingthose that did not supply a list of faculty. Of the eligible institutions, 872 (91 percent) completed aninstitution questionnaire.
A survey report summarizing key results from the faculty survey is available: Faculty and InstructionalStaff Who Are They and What Do They Do? [NCES 94-346]. Other reports based on data from theNSOPF-93 faculty survey include: Instructional Faculty and Staff in Higher Education Institutions: Fall1987 and Fall 1992 [NCES 97-470] and Characteristics and Attitudes ofInstructional Faculty and Steinthe Humanities [NCES 97-973]. Another report, Institutional Policies and Practices Regarding Faculty inHigher Education [NCES 97-080] is based on the NSOPF-93 institution survey. These and futurepublications will also be available on the Internet on NCES's World Wide Web site at:http://www.ed.gov/NCES.
1.6 Restricted-use Data File and Documentation
A restricted-use data file has been produced for the NSOPF-93 faculty component on magnetic tape and onCD-ROM. The 1993 National Study of Postsecondary Faculty Data File User's Manual [NCES 97-466]accompanies the NSOPF-93 data files appearing on magnetic tape and on CD-ROM.
The restricted-use data file has been released through individual licensing agreements to analysts who requireaccess to the complete NCES data files for their research. Users agree, under penalty of law, that they shallnot release any information that may lead to disclosure of a respondent's identity. The restricted-use data filecontains data for 25,780 respondents from 817 participating institutions.
1.7 Public-use Data Files and Documentation
Public-use institution and faculty data files are also available on diskette or CD-ROM. The institution filecontains data from the 872 postsecondary institutions that completed an institution questionnaire.
The public-use faculty data file contains data for 25,780 respondents from 817 participating institutions.Because multi-level micro data carry some risk of statistical disclosure of institutional or individual identities,the faculty data were subjected to an extensive deductive disclosure analysis to determine which items, usedalone, in conjunction with other key variables, or in conjunction with public external sources such as NCES'sIntegrated Postsecondary Education Data System (IPEDS) files, have significant disclosure potential. Tominimize the possible risk of disclosure of individual respondents, in compliance with the NationalEducation Statistics Act, Public Law 103-382 [20 USC 9001 et seq.], the Carl D. Perkins VocationalEducation Act, and the Privacy Act of 1974 [5 U.S.C. 552a], variables found to pose significant disclosurerisks were modified or suppressed to remove or to substantially reduce such risks.
1.8 Derived Variables
For NSOPF-93, a total of 36 institution-level and 107 faculty-level derived variables were created in order tosimplify access to standard queries useful to analysts: as well as to enhance substantive analysis. Sinceresearch questions frequently require independent or control variables, this set of derived variables has beencarefully constructed and added to the faculty and institution data files. The faculty restricted-use file
4
1993 National Study of Postsecondary FacultyMethodology Report
includes all 143 derived variables. The institution file contains only the 36 institution-level derived variables.
The public-use faculty file contains selected derived variables that were found not to pose significant
disclosure risks.
Multiple sources of data were used to create institution-level derived variables including: the 1991-92 IPEDS,
the "Carnegie classification" system, and NSOPF-93 sampling information. Documentation for all derived
variables appears in Appendix 0.
1.9 Electronic Codebooks on CD-ROM and Documentation
In addition to hardcopy codebooks that accompany the various releases of NSOPF-93 data, three NSOPF-93electronic codebooks (ECBs) are also available to users. One ECB consists of the public-use institution file,another consists of the restricted-use faculty data file, and the other consists of the faculty restricted-use file
merged with the public-use institution file. The ECBs feature windows with unweighted frequencies and
percentages. A README.TXT file on the CD-ROM describes how to install the ECBs. Extensive "help"
files and menus explain ECB features.
The ECB combines the convenience, simplicity, and cost efficiencies of personal computers (PCs) with CD-
ROM technology. ECBs permit users to search for variables based on key words and names. The ECB
displays full question text and unweighted frequencies for each variable in order to assist users in deciding
which data elements may be useful for their analyses. The ECB can also be used as a tool for selectingvariables for subsequent analysis, writing SAS or SPSS-PC code for file construction of the designated
variables, and for generating a codebook of the chosen set of variables. More detailed information on the
features of the NSOPF-93 ECBs appears in the 1993 National Study ofPostsecondary Faculty: Data FileUser's Manual [NCES 97-466] and in the ECB "help" files and menus onthe CD-ROM.
1.10 Data Analysis System on CD-ROM and Documentation
A NSOPF-93 faculty Data Analysis System (DAS) is also available. The DAS provides a convenient, menu-
driven system allowing researchers to produce tables of frequencies and cross tabulations and correlation
matrices. The NSOPF-93 sample is not a simple random sample. Therefore, simple random sampletechniques for estimating sampling error cannot be applied to these data. The DAS takes into account the
complexity of the sampling procedures and calculates standard errors appropriate for such samples. DASsoftware provides all information necessary for a user to set up and run a variety of analyses. Each DAS isself-documenting, with weighted data distributions and full descriptions for each variable. The DAS allows
users to select variables for rows, columns, and subgroups for tables from the list of available variables,
many of which have been computed to simplify analysis. Continuous variables, such as income, can be
recoded into categories for rows, column percentages, or subgroup definitions. Categorical variables, such as
race, can be grouped or "lumped" in various ways for analysis. Table titles as well as variable labels can be
edited by the user, and DAS output is compatible with most spreadsheet software. In addition to the table
estimates, the DAS calculates proper standard errors and weighted sample sizes for these estimates. If the
number of valid cases does not meet the minimum requirement based on NCES statistical standards, the DAS
prints the message "low-N." Users can also define variables for use in a correlation matrix, which can be
imported into standard statistical packages for more complex analysis. More detailed information on the
features of the NSOPF-93 DAS appears in the "help" files and menus on the DAS/CD-ROM.
Is
1993 'National Study of Postsecondary FacultyMethodology Report
1.11 How to Obtain NSOPF-93 Pfoducts
Restricted-use faculty data are available at no charge on a restricted loan basis to organizations that obtain anapproved licensing agreement from NCES. To request a licensing agreement, the individual and/or institutionmust provide the following information:
The title of the survey to which access is desired.
A detailed discussion of the statistical research project that requiresaccessing the restricted NCES survey data.
The name and title of the most senior official who has the authority to bind the organizationto the provisions of the licensing agreement.
The name and title of the project officer who will oversee the daily operations.
The name, telephone number, and title of professional and technical staff who will access thesurvey database. Each professional or technical staff member with access to the data isrequired to sign and to have notarized an Affidavit of Nondisclosure.
The estimated loan period necessary for accessing the NCES survey database.
The desired computer product specifications, such as medium (9-track tape, CD-ROM),code convention (ASCII, EBCDIC, SAS), etc.
To obtain further details and a licensing agreement form please write to:
Data Security OfficerStatistical Standards and Services GroupU.S. Department of EducationOffice of Educational Research and ImprovementNational Center for. Education Statistics555 New Jersey Avenue, N.W., Room 408Washington, D.C. 20208(202) 219-1831
Individuals who obtain restricted-use faculty data after signing a licensing agreement with NCES can receivethe following products on one CD-ROM: the NSOPF-88 and NSOPF-93 faculty data files; the NSOPF-93institution data file; the NSOPF-93 faculty ECB, the 1993 merged faculty and institution ECB; the user'smanual for the institution and restricted-use faculty data files; and the faculty and institution questionnaires.
For those individuals who do not wish to obtain a licensing agreement, a public-use faculty data file (whichcontains a reduced number of variables to avoid disclosure) can be ordered from the National Education DataResource Center (see address below). The public-use institution file can also be ordered from the NationalEducation Data Resource Center. Individuals who order the public-use faculty file on CD-ROM will receivethe NSOPF-93 public-use faculty and institution data files; the institution ECB, a user's guide for the public-use faculty and institution files, and the faculty and institution questionnaires.
6
1993 National Study of Postsecondary FacultyMethodology Report
The DAS can be accessed also through the Internet on NCES's World Wide Web site at http://www.ed.gov/
NCES. DAS procedures can be performed over the World Wide Web. The DAS CD-ROM for PC use (in
DOS and Windows versions) can also be ordered by contacting:
National Education Data Resource Centerdo Pinkerton Computer Consultants, Inc.1900 N. Beauregard Street, Suite 200Alexandria, VA 22311-1722Phone: (703) 845-3151FAX: (703) 820-7465E-mail: nedrc@ineted .gov.
Feedback and suggestions on the products and other features of NSOPF-93 are welcome. Please address
your comments to:
Linda ZimblerNSOPF Project OfficerU.S. Department of EducationOffice of Educational Research and ImprovementNational Center for Education Statistics555 New Jersey Avenue, N.W.Room 422AWashington, D.C. 20208Phone: (202) 219-1834E-mail: [email protected].
20
1993 National Study of Postsecondary FacultyMethodology Report
2. Data Collection Instruments
2.1 Overview
This chapter provides a brief description of the two survey instruments developed and used in NSOPF-93:the faculty questionnaire and the institution questionnaire. Both instruments were designed as self-administered questionnaires (SAQs). A CATI (computer-assisted telephone interview) version of the faculty
questionnaire was also developed and used during the follow-up data collection effort. Copies of theNSOPF-93 self-administered instruments appear in Appendix F and Appendix G.
2.2 Development of Questionnaire Items
Several research and policy concerns guided questionnaire development. One of the overriding objectives
was to preserve as many of the 1988 items as were relevant and feasible. But this goal had to be balancedwith the need to address recent policy issues that had emerged since the previous study. In order to balance
these aims, it was necessary to identify, to revise, or to eliminate some questionnaire items that were either
problematic or were no longer relevant to the broader issues.
For both the field test and the full-scale study, questionnaire items were constructed based on input from
several sources, including the 1988 questionnaires, other postsecondary education surveys, the NSOPF-93National Technical Review Panel (NTRP), and project staff and consultants. Questionnaire items for the full-
scale study were further revised (or deleted) based on the results of the 1992 NSOPF field test and
recommendations from the NTRP.
The 1988 institution and faculty questionnaires were used as a point of departure in determining which itemsshould initially be preserved, expanded, or revised for the NSOPF-93 field test and later for the full-scale
study. One major change was the definition of faculty used in the 1993 cycle of NSOPF. While the 1988
survey collected data from full- and part-time faculty who provided instruction for credit, the 1993 sample
was expanded to include non-instructional faculty, as well as instructional faculty and staff. The consensusresulting from the NTRP meetings was that the population of non-instructional personnel with faculty status
was too important to exclude from the study. Deans, college and university administrators, librarians anddirectors of university resource centers are included in this population of non-instructional faculty.
In addition, NSOPF-93 eliminated the Departmental Chairperson survey (a major part of the 1988 cycle) in
favor of larger faculty and institution samples.' Because the items in this survey werebest addressed by thedepartment chairperson, it was deemed advisable to incorporate only a few of the questionnaire items from
this earlier survey into the NSOPF-93 faculty or institution questionnaire.
A variety of related postsecondary education studies were reviewed in the process of developing thequestionnaires,3 and some of their items were incorporated into the questionnaires for the field test and the
'The final status of the department chairperson survey has not been determined for future NSOPF cycles.
'Institute of Social Research, York University, The Academic Profession in Canada (York, Ontario: Institute
of Social Research, 1986); Harvard University, 1967 Survey of Faculty (Cambridge, Mass.: Harvard University,
1967); Higher Education Research Institute, 1989 Faculty Survey (Los Angeles: Higher Education Research Institute,
1989); National Center for Research to Improve Postsecondary Teaching and Learning, Faculty at Work: A Survey of
Motivations, Expectations, and Satisfactions (Ann Arbor, Mich.: University of Michigan, 1987); Carnegie Foundation
for the Advancement of Teaching, National Survey of Faculty, (Princeton, N.J.: Carnegie Foundation for the
BEST COPY AVAILABLE9
21
1993 National Study of Postsecondary FacultyMethodology Report
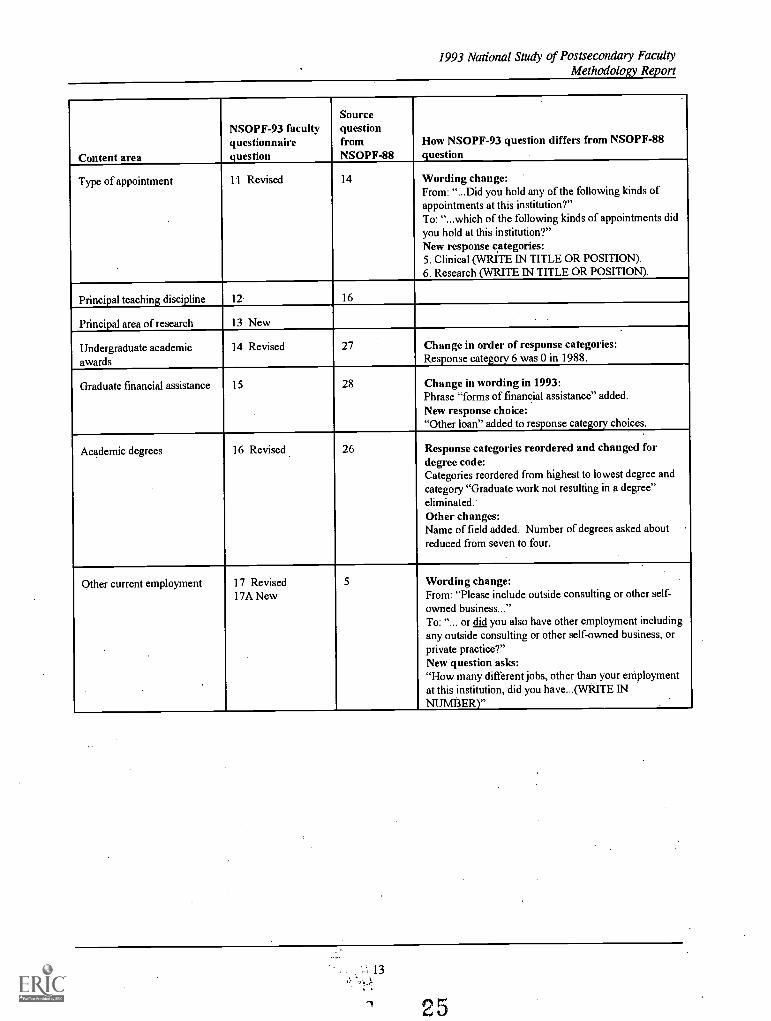
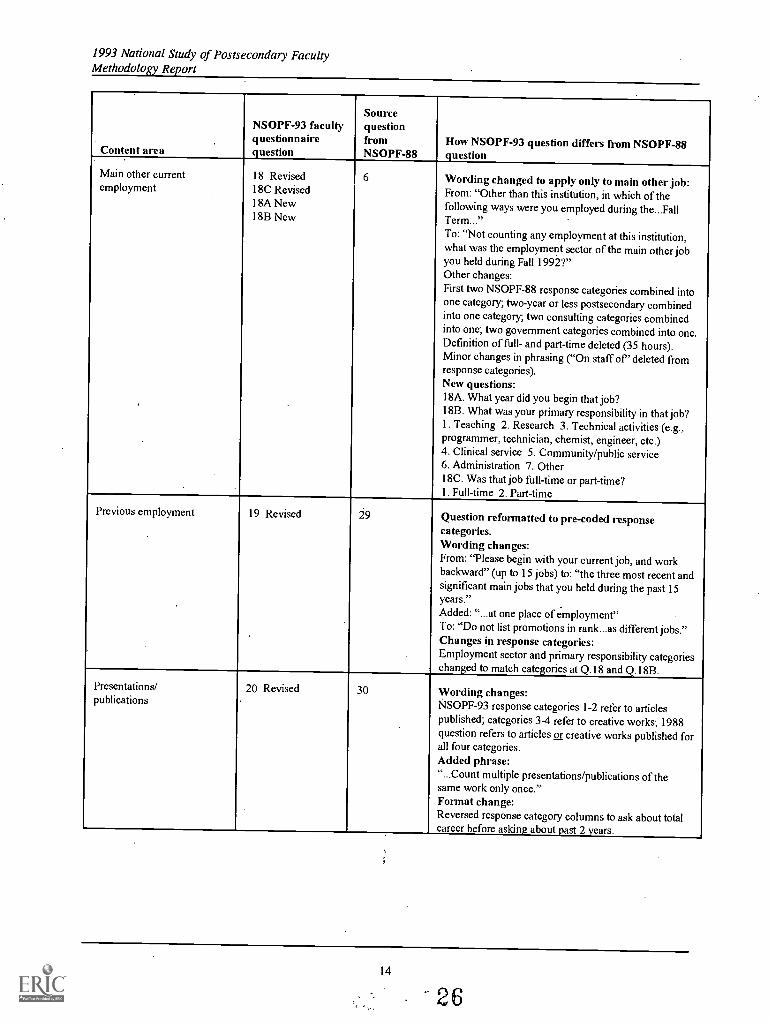
full-scale study. .Exhibits 2-1 and 2-2 describe the items in the faculty and institution questionnaires bycontent area and link specific questions to the 1988 instruments. Copies of the 1988 questionnaires appear inAppendices A-C.
2.3 Faculty Questionnaire
The faculty questionnaire was designed to address a variety of policy-relevant issues about higher educationfaculty and their institutions, including: (1) the background characteristics and current activities ofinstructional and non-instructional faculty; (2) the supply of, and demand for, faculty in postsecondaryinstitutions; (3) faculty as both a resource and a consumer of resources; and (4) faculty attitudes andbehaviors about key aspects of the higher education environment.
Given the changed definition of faculty, questions were added about research-only and other non-instructionalfaculty members to an instrument that had previously sought information only about instructional faculty.The faculty questionnaire was also revised to emphasize behavioral rather than attitudinal questions in orderto collect data on who the faculty are; what they do; and whether, how, and why the composition of thenation's faculty is changing. The questionnaire addressed:
background characteristics and academic credentials;
workloads and time allocation between classroom instruction and other activities such asresearch, course preparation, consulting, public service, doctoral or student advising,conferences, and curriculum development;
compensation, and the importance of other sources of income, such as consulting fees,royalties, etc., or income-in-kind;
roles and differences, if any, between full- and part-time faculty in their participation ininstitutional policy-making and planning;
faculty attitudes toward their jobs, their institutions, higher education, and studentachievement in general;
changes in teaching methods, and the impact of new technologies on teaching techniques;
career and retirement plans;
differences between those who have instructional responsibilities and those who have noinstructional responsibilities, such as those engaged only in research; and
differences between those with teaching responsibilities but no faculty status and those withteaching responsibilities and faculty status.
The design of the full-scale study questionnaire required input from NCES, the National Science Foundation(NSF), the National Endowment for the Humanities (NEH), and the NSOPF-93 National Technical ReviewPanel (NTRP), as well as an analysis of the data collected using the field test questionnaire. Respondentcomments collected during the field test were reviewed and a debriefing was held with field test interviewers.
Advancement of Teaching, 1984 and 1989).
10
1993 National Study of Postsecondary FacultyMethodology Report
Respondent and interviewer comments are summarized in the 1992-93 National Study of PostsecondaryFaculty Field Test Report [NCES 93-930]. Many questions, or subparts of questions, were deleted from thefield test questionnaire based on high nonresponse or low reliability. Questions which were retained weresometimes modified to be clearer or more understandable. Some new items were added based on NTRP
recommendations.
2.4 Institution Questionnaire
The institution questionnaire for the full-scale study was divided into three major sections, dealing with full-time instructional faculty and staff, part-time instructional faculty and staff, and full-time non-instructionalfaculty, respectively. As noted above, the inclusion of non-instructional faculty was new to NSOPF-93.Because institutional definitions of faculty vary widely, a question asked each institution for its owndefinitions of full- and part-time faculty, both instructional and non-instructional. The institutionquestionnaire obtained information on:
the numbers of full- and part-time instructional and non-instructional faculty, as well asinstructional personnel without faculty status, and their distributions by employment status(i.e. full-time, part-time) and tenure status (based on the definitions provided by theinstitution);
institutional tenure policies and changes in policies on granting tenure to faculty members;
the impact of tenure policies on the influx of new faculty and on career development;
the growth and promotion potential for existing non-tenured junior faculty;
the benefits and retirement plans available to faculty; and
the turnover rates of faculty at the institution.
The institution questionnaire used in the full-scale study was quite different in content from the field testquestionnaire. The results of the field test were reviewed by NCES, the NSOPF-93 NTRP and members ofthe Association for Institutional Research (AIR) in order to revise the questionnaire to capture as much dataas possible while minimizing respondent burden. One of the major changes between the field test and thefull-scale study was the elimination of items that asked for counts of minority and female faculty. Based onfield test results and discussions with the NTRP, it was apparent that many institutions could not provideaccurate information. Others refused to respond. In addition, the full-scale questionnaire included a glossaryto highlight the operational definitions being used in the survey (e.g., instructional faculty versus non-instructional faculty) but also asked for the respondent to provide institutional definitions of permanent,temporary, full- and part-time faculty. Separate benefits questions were added for temporary full-time facultyand instructional staff. Another set of questions on institution subsidization of benefits was added as well.
Other changes between the field test and full-scale study included the addition of items asking aboutinstitutional downsizing. These items were included because of recommendations from NTRP and AIRmembers, and because institutions were reporting the loss of faculty due to fiscal constraints. Anotherrecommendation of the NTRP was to collect data on the percentage of full- and part-time faculty representedby a union for purposes of collective bargaining. For more discussion of the field test, see the 1992-93National Study ofPostsecondary Faculty Field Test Report [NCES 93-390].
.11
23
1993 National Study of Postsecondary FacultyMethodology Report
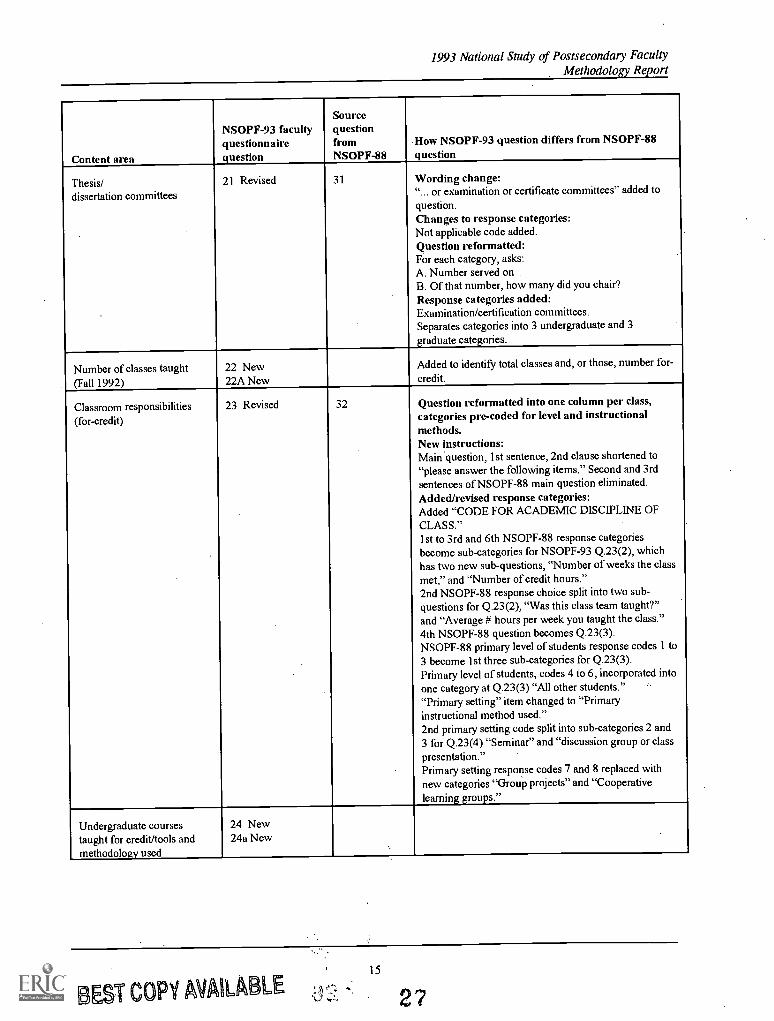
Exhibit 2-1: NSOPF faculty questionnaire: content and linkageof items between 1988 and 1993 NSOPF cycles
Content area
NSOPF-93 facultyquestionnairequestion
SourcequestionfromNSOPF-88
How NSOPF-93 question differs from NSOPF-88question
Instructional duties 1 1
Instructional duties lA Revised 2 Change in order of response categories.New response choice:1. All of your instructional duties related to creditcourses.Wording changes:Question shortened.Added: "...or advising or supervising academicactivities" to response categories 2 and 3."At least..." eliminated from response category 2.
Principal activity 2 New 3 Question expanded:Asks for "principal activity at this institution", and lists"sabbatical from another institution" as one of eightresponse categories. NSOPF-88 asks only if respondentis on sabbatical from this institution ("yes" or "no").
Faculty status 3 New
Full-time/part-time status 44A New
4 Question expanded:A new sub-question at Q.4a asks for reasons respondentworked part-time; provides six response categories (a -f)to be answered yes or no.Change in order of response categories at Q.4 (full-time= category 1 and part-time = category 2 in 1988) tofacilitate approach to Q.4a.
Responsibilities 5 7
Year job at institution began 6 New
Tenure status 7 Revised7A New
9, 10 Order of response categories changed.Question reformatted:If respondent selects category 1 (tenured), thenrespondent answers 7A about the year tenure wasachieved (Q.10 in the NSOPF-88 questionnaire).
Length of contract 8 Revised 11 Wording changes:Response category 3 changed from: "two or moreacademic/calendar years" to: "A limited number ofyears(i.e., two or more academic/calendar years)." "OTHER"category for open-ended answer added.
Academic rank 9 Revised 12 Question expanded:Asks for academic rank, title, or position.Response category eliminated:"Diitinguished/Named Professor."
Year achieved academic rank 10 13
1993 National Study of Postsecondary FacultyMethodology Report
Content area
NSOPF-93 facultyquestionnairequestion
SourcequestionfromNSOPF-88
How NSOPF-93 question differs from NSOPF-88question
Type of appointment 11 Revised 14 Wording change:From: "...Did you hold any of the following kinds ofappointments at this institution?"To: "...which of the following kinds of appointments didyou hold at this institution?"New response categories:5. Clinical (WRITE IN TITLE OR POSITION).6. Research (WRITE IN TITLE OR POSITION).
Principal teaching discipline 12 16
Principal area of research 13 New
Undergraduate academicawards
14 Revised 27 Change in order of response categories:Response category 6 was 0 in 1988.
Graduate financial assistance 15 28 Change in wording in 1993:Phrase "forms of financial assistance" added.New response choice:"Other loan" added to response category choices.
Academic degrees 16 Revised 26 Response categories reordered and changed fordegree code:Categories reordered from highest to lowest degree andcategory "Graduate work not resulting in a degree"eliminated.Other changes:Name of field added. Number of degrees asked aboutreduced from seven to four.
Other current employment 17 Revised17A New
5 Wording change:From: "Please include outside consulting or other self-owned business..."To: "... or did you also have other employment includingany outside consulting or other self-owned business, orprivate practice?"New question asks:"How many different jobs, other than your employmentat this institution, did you have...(WRITE INNUMBER)"
13
1
1993 National Study of Postsecondary FacultyMethodology Report
Content area
NSOPF-93 facultyquestionnairequestion
SourcequestionfromNSOPF-88
How NSOPF-93 question differs from NSOPF-88question
Main other currentemployment
18 Revised18C Revised18A New18B New
6 Wording changed to apply only to main other job:From: "Other than this institution, in which of thefollowing ways were you employed during the...FallTerm..."To: "Not counting any employment at this institution,what was the employment sector of the main other jobyou held during Fall 1992?"Other changes:First two NSOPF-88 response categories combined intoone category; two-year or less postsecondary combinedinto one category; two consulting categories combinedinto one; two government categories combined into one.Definition of full- and part-time deleted (35 hours).Minor changes in phrasing ("On staff of deleted fromresponse categories).New questions:18A. What year did you begin that job?18B. What was your primary responsibility in that job?1. Teaching 2. Research 3. Technical activities (e.g.,programmer, technician, chemist, engineer, etc.)4. Clinical service 5. Community/public service6. Administration 7. Other18C. Was that job full-time or part-time?1. Full-time 2. Part-time
Previous employment 19 Revised 29 Question reformatted to pre-coded responsecategories.Wording changes:From: "Please begin with your current job, and workbackward" (up to 15 jobs) to: "the three most recent andsignificant main jobs that you held during the past 15years."Added: "...at one place of employment"To: "Do not list promotions in rank...as different jobs."Changes in response categories:Employment sector and primary responsibility categorieschanged to match categories at Q.18 and Q.18B.
Presentations/publications
20 Revised 30 Wording changes:NSOPF-93 response categories 1-2 refer to articlespublished; categories 3-4 refer to creative works; 1988question refers to articles or creative works published forall four categories.Added phrase:"..Count multiple presentations/publications of thesame work only once."Format change:Reversed response category columns to ask about totalcareer before asking about past 2 years.
14
1993 National Study of Postsecondary FacultyMethodology Report
Content area
NSOPF-93 facultyquestionnairequestion
SourcequestionfromNSOPF-88
.How NSOPF-93 question differs from NSOPF-88
question
Thesis/dissertation committees
21 Revised 31 Wording change:"... or examination or certificate committees" added toquestion.Changes to response categories:Not applicable code added.Question reformatted:For each category, asks:A. Number served onB. Of that number, how many did you chair?Response categories added:Examination/certification committees.Separates categories into 3 undergraduate and 3graduate categories.
Number of classes taught(Fall 1992)
22 New22A New
Added to identify total classes and, or those, number for-credit.
Classroom responsibilities(for-credit)
23 Revised 32
.
Question reformatted into one column per class,categories pre-coded for level and instructionalmethods.New instructions:Main question, 1st sentence, 2nd clause shortened to"please answer the following items." Second and 3rdsentences of NSOPF-88 main question eliminated.Added/revised response categories:Added "CODE FOR ACADEMIC DISCIPLINE OFCLASS."1st to 3rd and 6th NSOPF-88 response categoriesbecome sub-categories for NSOPF-93 Q.23(2), whichhas two new sub-questions, "Number of weeks the classmet," and "Number of credit hours."2nd NSOPF-88 response choice split into two sub-questions for Q.23(2), "Was this class team taught?"and "Average # hours per week you taught the class"4th NSOPF-88 question becomes Q.23(3).NSOPF-88 primary level of students response codes 1 to3 become I st three sub-categories for Q.23(3).Primary level of students, codes 4 to 6, incorporated intoone category at Q.23(3) "All other students.""Primary setting" item changed to "Primaryinstructional method used."2nd primary setting code split into sub-categories 2 and3 for Q.23(4) "Seminar" and "discussion group or classpresentation."Primary setting response codes 7 and 8 replaced withnew categories "Group projects" and "Cooperativelearning groups."
Undergraduate coursestaught for credit/tools andmethodology used
24 New24a New
18:::r COPY AVAILABLE
15
27
1993 National Study of Postsecondary FacultyMethodology Report
Content area
NSOPF-93 facultyquestionnairequestion
Source .%
questionfromNSOPF-88
.
How NSOPF-93 question differs from NSOPF-88question
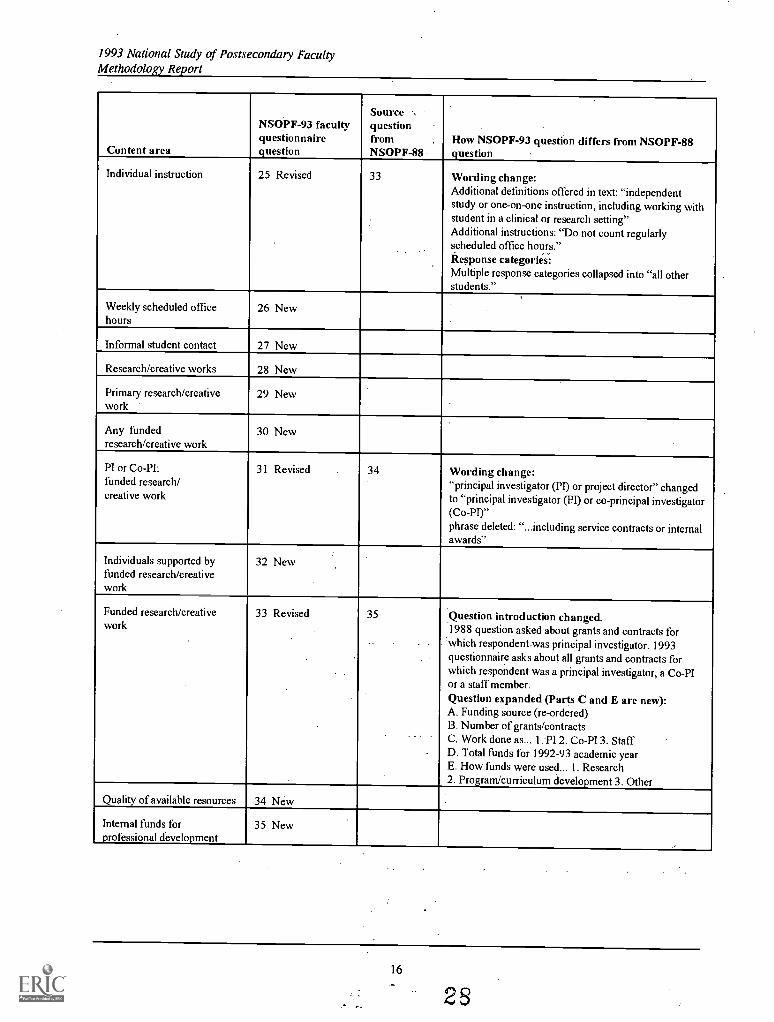
Individual instruction 25 Revised 33 Wording change:Additional definitions offered in text: "independentstudy or one-on-one instruction, including working withstudent in a clinical or research setting"Additional instructions: "Do not count regularlyscheduled office hours."Response categories:Multiple response categories collapsed into "all otherstudents."
Weekly scheduled officehours
26 New
Informal student contact 27 New
Research/creative works 28 New
Primary research/creativework
29 New
Any fundedresearch/creative work
30 New
PI or Co-PI:funded research/creative work
31 Revised 34 Wording change:"principal investigator (PI) or project director" changedto "principal investigator (PI) or co-principal investigator(Co-PI)"phrase deleted: "...including service contracts or internalawards"
Individuals supported byfunded research/creativework
32 New
Funded research/creativework
33 Revised
.
35 Question introduction changed.1988 question asked about grants and contracts forwhich respondent was principal investigator. 1993questionnaire asks about all grants and contracts forwhich respondent was a principal investigator, a Co-PIor a staff member.Question expanded (Parts C and E are new):A. Funding source (re-ordered)B. Number of grants/contractsC. Work done as... 1.-PI 2. Co-PI 3. StaffD. Total funds for 1992-93 academic yearE. How funds were used... 1. Research2. Program/curriculum development 3. Other
Quality of available resources 34 New
Internal funds forprofessional development
35 New
16
2S
1993 National Study of Postsecondary FacultyMethodology Report
Content area
NSOPF-93 facultyquestionnairequestion
SourcequestionfromNSOPF-88
How NSOPF-93 question differs from NSOPF-88question
Faculty activities/workload
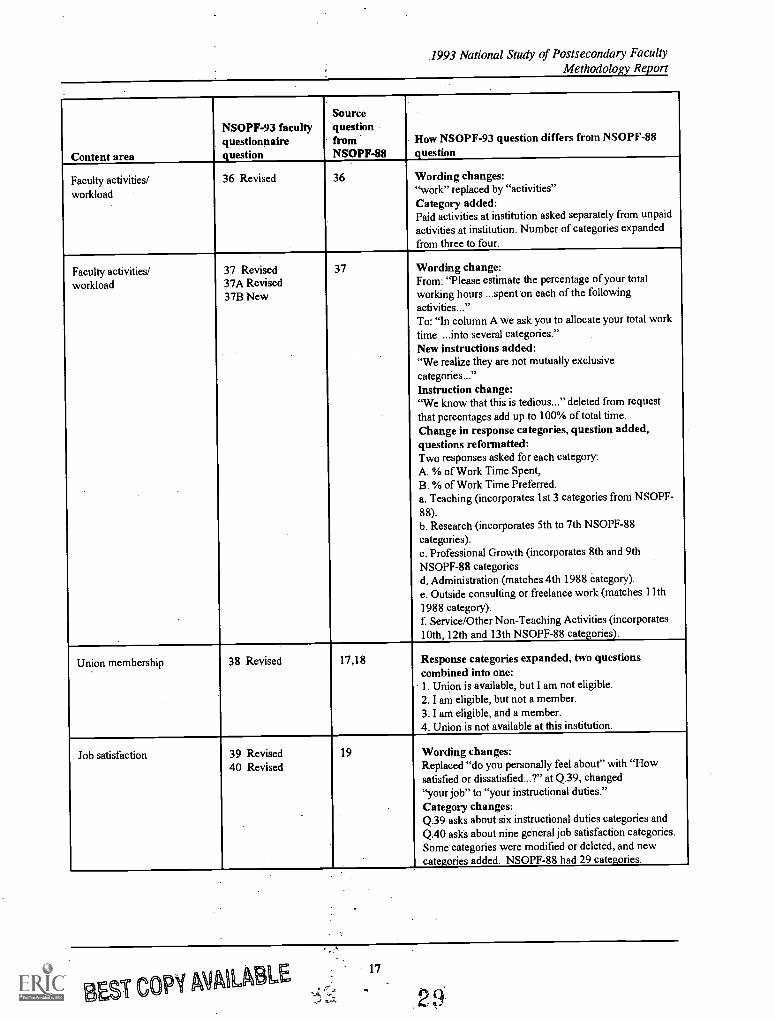
36 Revised 36 Wording changes:"work" replaced by "activities"Category added:Paid activities at institution asked separately from unpaidactivities at institution. Number of categories expandedfrom three to four.
Faculty activities/workload
37 Revised37A Revised37B New
37 Wording change:From: "Please estimate the percentage of your totalworking hours ...spent cm each of the followingactivities..."To: "In column A we ask you to allocate your total worktime ...into several categories."New instructions added:"We realize they are not mutually exclusivecategories..."Instruction change:"We know that this is tedious..." deleted from requestthat percentages add up to 100% of total time.Change in response categories, question added,questions reformatted:Two responses asked for each category:A. % of Work Time Spent,B. % of Work Time Preferred.a. Teaching (incorporates 1st 3 categories from NSOPF-88).b. Research (incorporates 5th to 7th NSOPF-88categories).c. Professional Growth (incorporates 8th and 9thNSOPF-88 categoriesd. Administration (matches 4th 1988 category).e. Outside consulting or freelance work (matches 11th1988 category).f. Service/Other Non-Teaching Activities (incorporates10th, 12th and 13th NSOPF-88 categories).
Union membership 38 Revised 17,18 Response categories expanded, two questionscombined into one:1. Union is available, but I am not eligible.2. I am eligible, but not a member.3. I am eligible, and a member.4. Union is not available at this institution.
Job satisfaction 39 Revised40 Revised
19 Wording changes:Replaced "do you personally feel about" with "Howsatisfied or dissatisfied...?" at Q.39, changed"your job" to "your instructional duties."Category changes:Q.39 asks about six instructional duties categories andQ.40 asks about nine general job satisfaction categories.Some categories were modified or deleted, and newcategories added. NSOPF-88 had 29 categories.
B 11 COPY AVAILABLE,."7.?
17
2 9
1993 National Study of Postsecondary FacultyMethodology Report
Content area
NSOPF-93 facultyquestionnairequestion
SourcequestionfromNSOPF-88
How NSOPF-93' question differs from NSOPF-88question
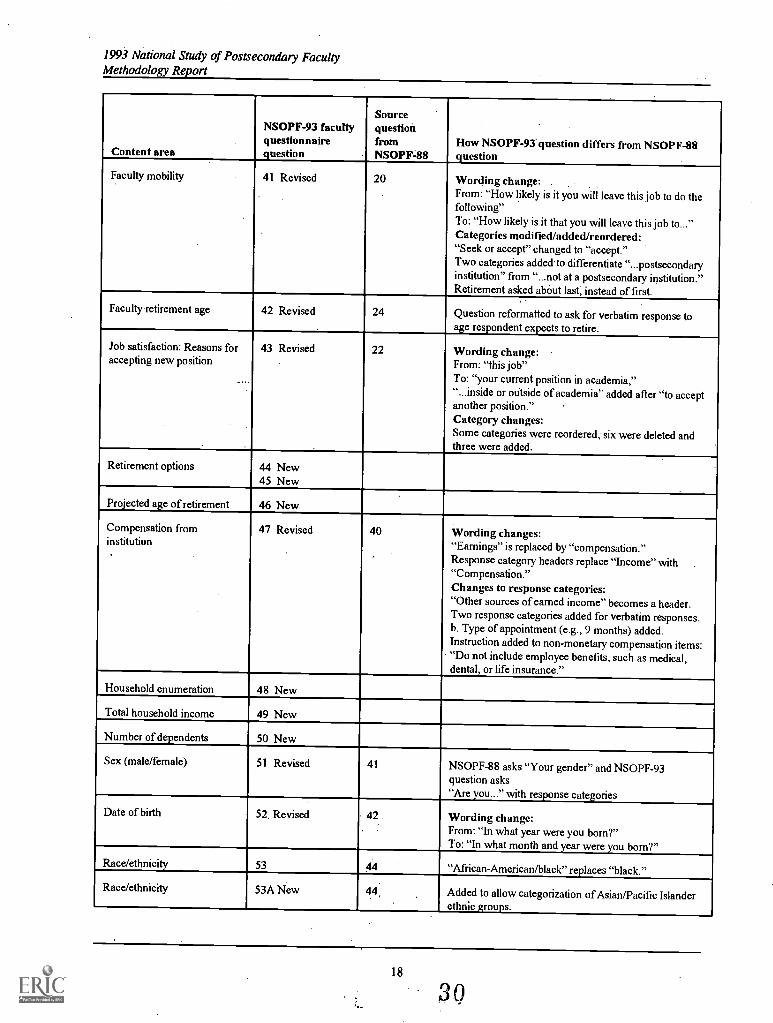
Faculty mobility 41 Revised 20 Wording change: .
From: "How likely is it you will leave this job to do thefollowing"To: "How likely is it that you will leave this job to..."Categories modified/added/reordered:"Seek or accept" changed to "accept."Two categories addedto differentiate "...postsecondaryinstitution" from "...not at a postsecondary institution."Retirement asked abPut last, instead of first.
Faculty retirement age 42 Revised 24 Question reformatted to ask for verbatim response toage respondent expects to retire.
Job satisfaction: Reasons foraccepting new position
.
43 Revised 22 Wording change:From: "this job"To: "your current position in academia,""...inside or outside of academia" added after "to acceptanother position."Category changes:Some categories were reordered six were deleted andthree were added.
Retirement options 44 New45 New
Projected age of retirement 46 New
Compensation frominstitution
47 Revised 40 Wording changes:"Earnings" is replaced by "compensation."Response category headers replace "Income" with"Compensation."Changes to response categories:"Other sources of earned income" becomes a header.Two response categories added for verbatim responses.b. Type of appointment (e.g., 9 months) added.Instruction added to non-monetary compensation items:"Do not include employee benefits, such as medical,dental, or life insurance."
Household enumeration 48 New
Total household income 49 New
Number of dependents 50 New
Sex (male/female) 51 Revised 41 NSOPF-88 asks "Your gender" and NSOPF-93question asks"Are you..." with response categories
Date of birth 52. Revised 42 Wording change:From: "In what year were you born?"To: "In what month and year were you born?"
Race/ethnicity 53 44 "African-American/black" replaces "black."
Race/ethnicity 53A New 44,. Added to allow categorization of Asian/Pacific Islander
ethnic groups.
18
30
1993 National Study of Postsecondary FacultyMethodology Report
Content area
NSOPF-93 facultyquestionnairequestion
SourcequestionfromNSOPF-88
How NSOPF-93 question differs from NSOPF-88
question ,
Race/ethnicity 54 43
Race/ethnicity 54A New 43 Added to allow categorization of Hispanic ethnicgroups.
Current marital status 55 Revised 45 Response category added:"Living with someone in a marriage-like relationship."
Country of birth 56 New
Citizenship status 57 Revised 46 Wording changesFrom: "Of what country are you currently a citizen?"To: "What is your citizenship status?"Question reformatted:I. United States citizen, native,2. United States citizen, naturalized,3. Permanent resident of the United States (immigrantvisa), 4. Temporary resident of United States (non-immigrant visa). Categories 3 and 4 each ask for'country of present citizenship.
Parents' education 58 Revised 47 Revised question does not ask about spouse.
Academic interests andvalues
59 Revised60 Revised
4849
Category changes:Some categories were modified or deleted, and newcategories were added. Categories also reordered. Fiveof the 1988 categories were retained at Q.59 and eightwere deleted; two new categories were added.Four of the 1988 categories were retained at Q.60 andtwo were deleted; five new categories were added.
1.9r.
31
1993 National Study of Postsecondary FacultyMethodology Report
Exhibit 2-2: NSOPF institution questionnaire: content and linkageof items between 1988 and 1993 NSOPF cycles
Content area
NSOPF-93institutionquestionnairequestion
Source questionfrom 1988institutionquestionnaire
Source questionfrom 1988departmentquestionnaire
How NSOPF-93 question differs fromNSOPF-88 question
Institutional definitions offaculty
New
Numbers of full/part-time faculty/staff, Fall1992
1 Revised 4,5,19 Combined questions from NSOPF-88into one question. Omitted askingspecifically for "full-time faculty withvisiting, acting, or adjunct appointments"
Section I: Full-timeinstructionalfaculty/staff
Changes in total ofpermanent staff 1991-92
2 Revised 6
Wording changes:From: "How many full-time instructionalfaculty did your institution have in eachof the following categories?"To: "Please provide the followinginformation about changes in thenumber of permanent full-timeinstructional faculty/staff between the1991 and 1992 Fall Terms."Change in response categories:Reordered sub-items, added"d. Number...who left because ofdownsizing..."
Number of permanentstaff institution sought tohire
3 Revised 13 Wording change:From: "For how many unfilled full-timeinstructional faculty positions in yourdepartment were candidates beinghired?"To: "How many permanent full-timeinstructional faculty/staff did yourinstitution seek to hire for the 1992 FallTerm?"
Number of permanentinstructional positionsnot filled
4, 4A New
Tenure system 5 Revised 3 Deleted "for any of your"
Number of tenured/tenure track staff1991/1992
6 Revised 8 9 Reformatted answer matrix
Number of tenured staffwho left between 1991-92
7 Revised 9 10 Slight change in question wording.Change in response categories:Deleted "to assume another position,""formally removed for cause," and"dismissed because of institutionalbudget pressures or program closure"Added "downsizing"
Number of staffconsidered for/grantedtenure
8 7 8
20
2
1993 National Study of Postsecondary FacultyMethodology Report
Content area
NSOPF-93institutionquestionnairequestion
Source questionfrom 1988institutionquestionnaire
Source questionfrom 1988departmentquestionnaire
How NSOPF-93 question differs fromNSOPF-88 question
Maximum number ofyears on tenure track
9 Revised 10, 12 11 Wording change:From: "Is there a maximum number ofyears an instructional faculty membercan be on tenure track and not receivetenure at your institution?"To: "Fill in the following informationabout the maximum number of years..."Change in response categories:Added "9b. If maximum number ofyears has changed..." from NSOPF-88question 12.
Changes in tenure policyin last 5 years
10 Revised 12 Change in question wording:From "three years" to "five years"Change in response categories:Deleted "offered optional early or phasedretirement"; asked separately in question11.Deleted "changed the upper limit on thepercentage of full-time faculty who maybe tenured" and "changed the maximumnumber of years a person can be ontenure track..."
Early or phasedretirement policy(permanent staff)
11 Revised 12 See note for question 10.
Retirement plansavailable to permanentstaff
12 Revised 15 Reformatted question wording slightly;deleted asking for approximate numberof faculty participants; reformattedresponse matrixChange in response categories:Reordered categories, added"b. Other 403B plan" and changed"d. 401K or 401B plan" from "401(k) or403(b) plan"
Employee benefits(permanent staff)
13 Revised 14, 16 Changes in question wording:Added "permanent" to question, added"If available, indicate whether the benefitis subsidized or not subsidized by yourinstitution."Change in response categories:Reordered categories, addedk. Transportation/parkingn. Medical insurance for retireeso. Cafeteria-style plan...
Percent of salarycontributed to benefits byinstitution
14 Revised 17 Changes in question wording:Added "permanent" to question text
Availability of benefits totemporary faculty
15 New 14 Changes in question wording:Added "temporary" to question text
BEST COPY AVAILABLE 3 .3
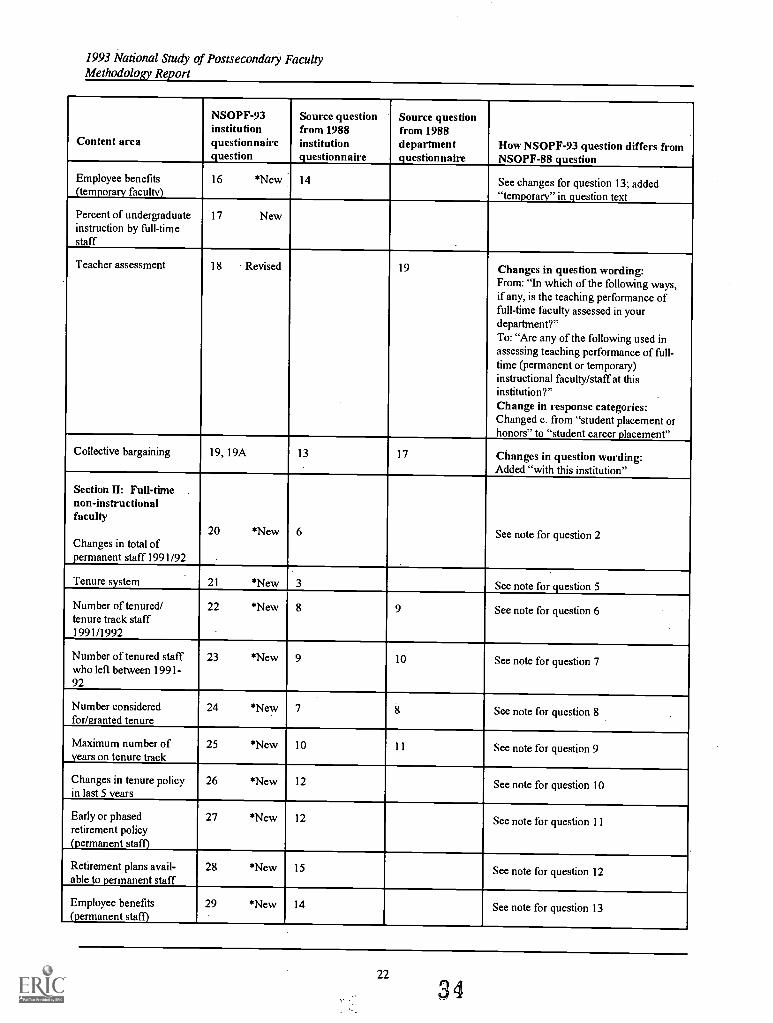
1993 National Study of Postsecondary FacultyMethodology Report
Content area
NSOPF-93institutionquestionnairequestion
Source questionfrom 1988institutionquestionnaire
Source questionfrom 1988departmentquestionnaire
How NSOPF-93 question differs fromNSOPF-88 question
Employee benefits(temporary faculty)
16 *New 14 See changes for question 13; added"temporary" in question text
Percent of undergraduateinstruction by full-timestaff
17 New
Teacher assessment 18 Revised 19 Changes in question wording:From: "In which of the following ways,if any, is the teaching performance offull-time faculty assessed in yourdepartment?"To: "Are any of the following used inassessing teaching performance of full-time (permanent or temporary)instructional faculty/staff at thisinstitution?"Change in response categories:Changed c. from "student placement orhonors" to "student career placement"
Collective bargaining 19, 19A 13 17 Changes in question wording:Added "with this institution"
Section II: Full-timenon-instructionalfaculty
Changes in total ofpermanent staff 1991/92
20 New 6 See note for question 2
Tenure system 21 *New 3 See note for question 5
Number of tenured/tenure track staff1991/1992
22 *New 8 9 See note for question 6
Number of tenured staffwho left between 1991-92
23 *New 9 10 See note for question 7
Number consideredfor/granted tenure
24 *New 7 8 See note for question 8
Maximum number ofyears on tenure track
25 *New 10 11 See note for question 9
Changes in tenure policyin last 5 years
26 *New 12 See note for question 10
Early or phasedretirement policy(permanent staff)
27 *New 12 See note for question 11
Retirement plans avail-able to permanent staff
28 *New 15 See note for question 12
Employee benefits(permanent staff)
29 *New 14 See note for question 13
22
34
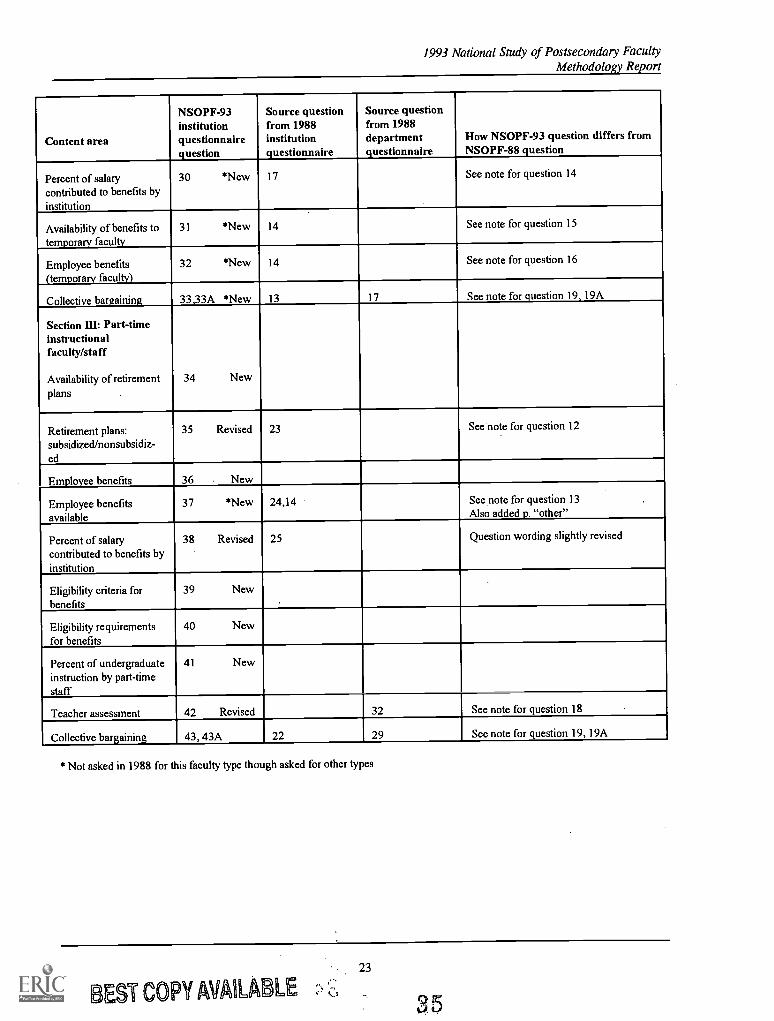
1993 National Study of Postsecondary FacultyMethodology Report
Content area
NSOPF-93institutionquestionnairequestion
Source questionfrom 1988institutionquestionnaire
Source questionfrom 1988departmentquestionnaire
How NSOPF-93 question differs fromNSOPF-88 question
Percent of salarycontributed to benefits byinstitution
30 *New 17 See note for question 14
Availability of benefits totemporary faculty
31 *New 14 See note for question 15
Employee benefits(temporary faculty)
32 *New 14 See note for question 16
Collective bargaining 33,33A *New 13 17 See note for question 19, 19A
Section III: Part-timeinstructionalfaculty/staff
Availability of retirementplans
34 New
Retirement plans:subsidized/nonsubsidiz-ed
35 Revised 23 See note for question 12
Employee benefits 36 New
Employee benefitsavailable
37 *New 24,14 See note for question 13Also added p. "other"
Percent of salarycontributed to benefits byinstitution
38 Revised 25 Question wording slightly revised
Eligibility criteria forbenefits
39 New
Eligibility requirementsfor benefits
40 New
Percent of undergraduateinstruction by part-timestaff
41 New
Teacher assessment 42 Revised 32 See note for question 18
Collective bargaining 43, 43A 22 29 See note for question 19, I9A
* Not asked in 1988 for this faculty type though asked for other types
23
BST COPY AVAILABLE
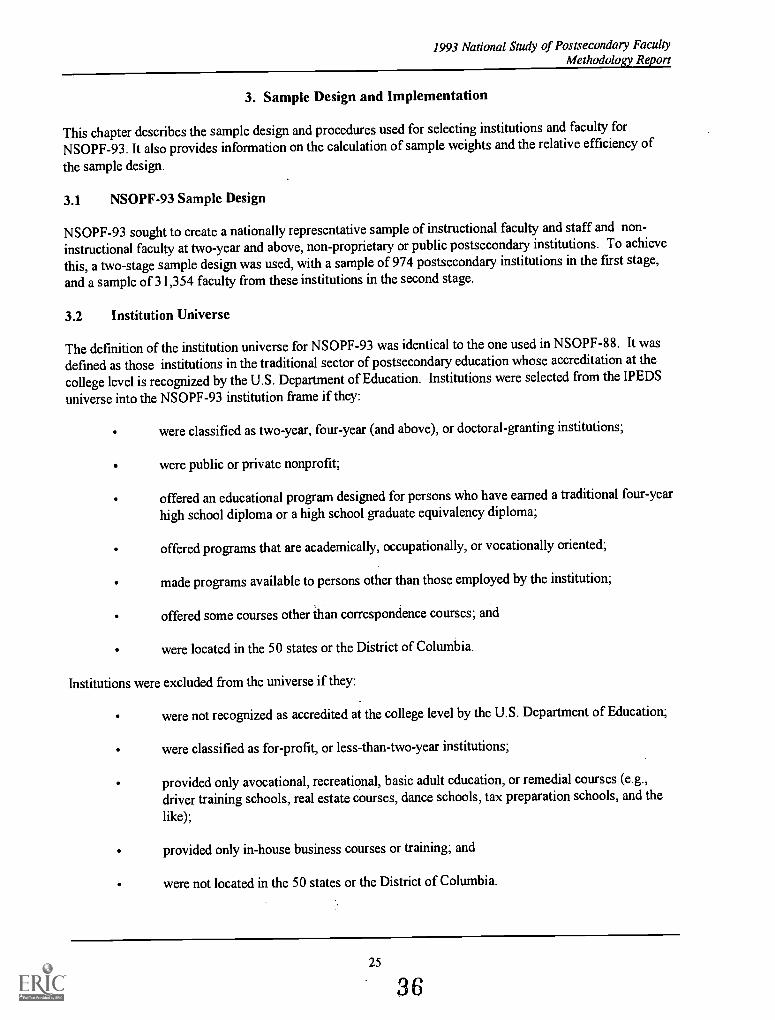
1993 National Study of Postsecondary FacultyMethodology Report
3. Sample Design and Implementation
This chapter describes the sample design and procedures used for selecting institutions and faculty for
NSOPF-93. It also provides information on the calculation of sampleweights and the relative efficiency of
the sample design.
3.1 NSOPF-93 Sample Design
NSOPF-93 sought to create a nationally representative sample of instructional faculty and staff and non-
instructional faculty at two-year and above, non-proprietary or public postsecondary institutions. To achieve
this, a two-stage sample design was used, with a sample of 974 postsecondary institutions in the first stage,
and a sample of 31,354 faculty from these institutions in the second stage.
3.2 Institution Universe
The definition of the institution universe for NSOPF-93 was identical to the one used inNSOPF-88. It was
defined as those institutions in the traditional sector ofpostsecondary education whose accreditation at the
college level is recognized by the U.S. Department of Education. Institutions were selected from the IPEDS
universe into the NSOPF-93 institution frame if they:
were classified as two-year, four-year (and above), or doctoral-granting institutions;
were public or private nonprofit;
offered an educational program designed for persons who have earned a traditional four-yearhigh school diploma or a high school graduate equivalency diploma;
offered programs that are academically, occupationally, or vocationally oriented;
made programs available to persons other than those employed by the institution;
offered some courses other thanan correspondence courses; and
were located in the 50 states or the District of Columbia.
Institutions were excluded from the universe if they:
were not recognized as accredited at the college level by the U.S. Department of Education;
were classified as for-profit, or less-than-two-year institutions;
provided only avocational, recreational, basic adult education, or remedial courses (e.g.,
driver training schools, real estate courses, dance schools, tax preparation schools, and the
like);
provided only in-house business courses or training; and
were not located in the 50 states or the District of Columbia.
25
36
1993 National Study of Postsecondary FacultyMethodology Report
3.3 Faculty Universe
Unlike NSOPF-88, which was limited to instructional faculty, the faculty universe forNSOPF-93 wasexpanded to include all who were designated as faculty, whether or not their responsibilities included for-credit instruction. Under this definition, researchers and administrators and other institutional staff who heldfaculty positions, but who did not instruct, were included in the sample. Instructional staff without facultystatus were also included. Teaching assistants and teaching fellows were excluded in both NSOPF-88 andNSOPF-93. In instructions for preparing lists from which the NSOPF-93 faculty sample was drawn,institutions were asked to use the following eligibility criteria to determine which faculty members to includeon the lists.
Eligibility criteria for faculty. The eligible universe of postsecondary faculty was defined to include:
full- and part-time personnel whose regular assignment included instruction;
full- and part-time individuals with faculty status whose regular assignment did not includeinstruction;
permanent and temporary personnel with any instructional duties, including adjunct,acting,or visiting status; and
faculty and instructional personnel on sabbatical leave.
Excluded from the NSOPF-93 universe of faculty were:
faculty and other personnel with instructional duties outside the U.S. (but not onsabbatical leave);
temporary replacements for faculty and other instructional personnel;
faculty and other instructional and non-instructional personnel on leave without pay;
graduate teaching assistants;
military personnel who taught only ROTC courses; and
instructional personnel supplied by independent contractors.
3.4 Sampling Frame
An explicit or an implicit list of the elements to be sampled can be used in designing a sampling frame.Creating an explicit list of all faculty and staff working at every institution in the frame of eligible institutionswould have been an impossible task. Therefore, NCES elected to use an implicit list of facultyacomprehensive list of faculty constructed from lists provided by the sampled postsecondary institutions. Thislist of faculty from sampled institutions needed to be comprehensive, accurate, and able to provide completedata for variables to be used in the subsequent stratification of the faculty sampling list.
26
37
1993 National Study of Postsecondary FacultyMethodology Report
The most appropriate and readily accessible source for a complete and accurate frame of institutions is theIntegrated Postsecondary Education Data System ( IPEDS),' a recurring set of surveys developed andmaintained by NCES. IPEDS defines postsecondary eduCation as "the provision of a formal instructional
program whose curriculum is designed primarily for students who have completed the requirements for a highschool diploma or its equivalent." This includes programs whose purpose is academic, vocational, andcontinuing professional education, and excludes avocational and adult basic education. IPEDS encompassesall institutional providers of postsecondary education in the United States and its outlying areas. The finalIPEDS universe for 1991-92 consisted of 10,144 known entities: 4,390 nonproprietary or public highereducation (two-year and four-year) institutions, 932 proprietary higher education institutions, and 4,822 lessthan two-year institutions. The NSOPF sample frame was drawn from IPEDS higher educationnonproprietary or public institutions, following the institutional eligibility criteria described above. Aftereliminating 1,077 unaccredited nonproprietary or public higher education institutions and an additional 57
accredited nonproprietary or public higher education institutions located outside of the 50 states and theDistrict of Columbia, the first-stage NSOPF-93 sampling frame was limited to a subset of 3,256 1991-92IPEDS institutions: all accredited nonproprietary or public higher education institutions in the 50 states and
the District of Columbia.
The NSOPF-93 universe of institutions was stratified using a modified Carnegie classification system,' based
on the highest degree institutions offer and the amount of federal research dollars they receive. For NSOPF-93, there were two levels of control, public and private, and nine types of institutions, based on 1987
Carnegie classifications, as follows:
Research universities : This is a combination of the categories Research Universities I and II.Carnegie defines Research Universities I as those institutions which "offer a full range ofbaccalaureate programs, are committed to graduate education through the doctorate degree, andgive high priority to research. They receive annually $33.5 million or more in federal supportand award at least 50 or more doctoral degrees each year." .The definition of ResearchUniversities II is identical to that of Research Universities I except for the condition that "theyreceive annually between $12.5 million and $33.5 million in federal support for research anddevelopment . . ."
Other Ph.D.: This is a combination of the categories Doctorate-Granting Universities I and II.Doctorate-Granting Universities I is defined as including institutions "offering a full range ofbaccalaureate programs [and] the mission of these institutions includes a commitment tograduate education through the doctorate degree. They award at least 40 Ph.D. degrees annuallyin five or more disciplines." The definition of Doctorate-Granting Universities II is identical tothat of Doctorate-Granting Universities I, except that these institutions "award annually 20 ormore Ph.D. degrees in at least one discipline or 10 or more Ph.D. degrees in three or more
disciplines."
°For more information on IPEDS data used in this study, see National Center for Education Statistics, IPEDSManual for Users (Washington, D.C.: National Center for EdUcation Statistics, 1991 [NCES 95-724]). Thismanual is
also distributed with IPEDS data on CD-ROM.
'See A Classification of Institutions of Higher Education, The Carnegie Foundation for the Advancement ofTeaching (Princeton, N.J., 1987), pp. 7-8.
27
1993 National Study of Postsecondary FacultyMethodology Report
Comprehensive colleges and universities: Offer liberal arts and professional programs.Master's degrees are the highest degrees offered. This is a combination of the categoriesComprehensive Universities and Colleges I and II. Carnegie defines Comprehensive Universitiesand Colleges I as institutions that "offer baccalaureate programs and, with few exceptions,graduate education through the master's degree. More than half of their baccalaureate degreesare awarded in two or more occupational or professional disciplines such as engineering orbusiness administration. All of the institutions in this group enroll at least 2,500 students." Thedefinition of Comprehensive Universities and Colleges II is identical to that of ComprehensiveUniversities and Colleges I, except for the qualification that they enroll between 1,500 and 2,500students.
Liberal arts colleges: Smaller and generally more selective than comprehensive colleges anduniversities. Primarily offer bachelor's degrees, although some offer master's degrees. Thisdefinition combines the categories Liberal Arts Colleges I and II. Carnegie defines Liberal ArtsColleges I as "primarily undergraduate colleges that award more than half of their baccalaureatedegrees in arts and science fields." The definition of Liberal Arts Colleges II is identical toLiberal Arts Colleges I, except it also "includes a group of colleges that award less than half oftheir degrees in liberal arts fields but, with fewer than 1,500 students, are too small to beconsidered comprehensive."
Independent medical schools: Those not considered as part of a four-year college or university.Includes medical schools and medical centers.
Religious colleges: Includes theological seminaries, bible colleges, and other institutionsoffering degrees in religion. There are no public religious colleges in the U.S.
Non-profit, two-year colleges: Offer certificate or degree programs through the Associate ofArts level and with few exceptions, offer no baccalaureate degrees.
Other: A wide range of professional and other specialized degree-granting colleges anduniversities. Includes other separate health professional schools, schools of law, schools ofengineering and technology, schools of business and management, schools of art, music, anddesign, teachers colleges, and other specialized schools.
Unknown: Carnegie classification was unknown at the time of sample selection.
Exhibit 3-1 compares the 1993 and 1988 NSOPF sample designs. It also provides a comparison with the1991-92 IPEDS frame used for NSOPF-93.
28
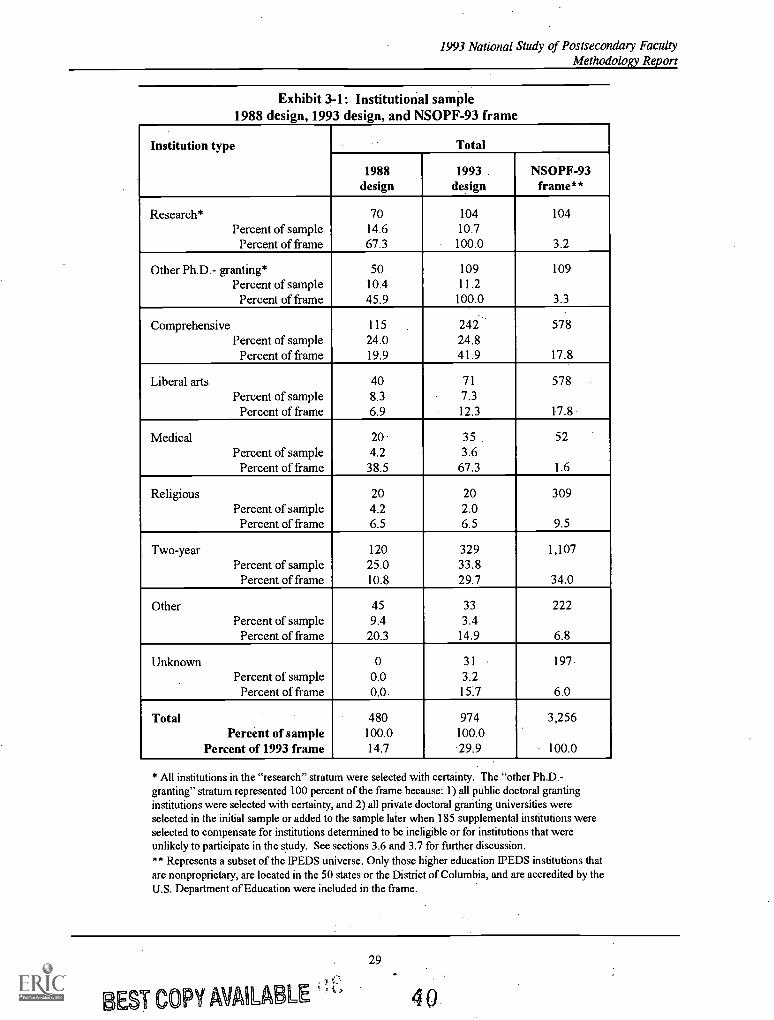
1993 National Study of Postsecondary FacultyMethodology Report
Exhibit 3-1: Institutional sample1988 design, 1993 design, and NSOPF-93 frame
Institution type Total
1988design
1993.design
NSOPF-93frame**
Research* 70 104 104Percent of sample 14.6 10.7
Percent of frame 67.3 100.0 3.2
Other Ph.D.- granting* 50 109 109Percent of sample 10.4 11.2
Percent of frame 45.9 100.0 3.3
Comprehensive 115 242 578Percent of sample 24.0 24.8
Percent of frame 19.9 41.9 17.8
Liberal arts 40 71 578Percent of sample 8.3 7.3
Percent of frame 6.9 12.3 17.8
Medical 20 35 . 52Percent of sample 4.2 3.6
Percent of frame 38.5 67.3 1.6
Religious 20 20 309Percent of sample 4.2 2.0
Percent of frame 6.5 6.5 9.5
Two-year 120 329 1,107Percent of sample 25.0 33.8
Percent of frame 10.8 29.7 34.0
Other 45 33 222Percent of sample 9.4 3.4
Percent of frame 20.3 14.9 6.8
Unknown 0 31 197
Percent of sample 0.0 3.2Percent of frame 0.0. 15.7 6.0
Total 480 974 3,256Percent of sample 100.0 100.0
Percent of 1993 frame 14.7 29.9 100.0
* All institutions in the "research" stratum were selected with certainty. The "other Ph.D.-granting" stratum represented 100 percent of the frame because: 1) all public doctoral grantinginstitutions were selected with certainty, and 2) all private doctoral granting universities wereselected in the initial sample or added to the sample later when 185 supplemental institutions wereselected to compensate for institutions determined to be ineligible or for institutions that wereunlikely to participate in the study. See sections 3.6 and 3.7 for further discussion.** Represents a subset of the IPEDS universe. Only those higher education IPEDS institutions thatare nonproprietary, are located in the 50 states or the District of Columbia, and are accredited by theU.S. Department of Education were included in the frame.
29
BEST COPY AVAILABLE 4 0
1993 National Study of Postsecondary FacultyMethodology Report
3.5 First Stage Sampling: Institution-Level
At the time of sample selection, 278 (8.5 percent) of the 3,256 institutions in the sample frame could not beclassified using the 1987-88 Carnegie crosswalk file. Updates were supplied for 81 of these institutions byCarnegie staff, leaving 197 institutions unclassified. This remaining group of unclassified institutions wasdesignated as "unknown" in the sample frame. In addition, NCES requested that 25 institutions betransferred from the "Other" Carnegie classification into "Liberal Arts." These institutions includedTeachers' Colleges (Carnegie code=58) and Schools of Art, Music, and Design (Carnegie code=56) whosehighest level of offering was a Bachelor's degree. This adjustment was made under the assumption that theseinstitutions more closely approximated Liberal Arts colleges than other specialized schools.
Institutions were stratified according to a cross-classification of control by type. There were two levels ofcontrol, public and private, and nine types, as discussed in section 3.4: research, other Ph.D., comprehensive,liberal arts, medical, religious, two-year institutions, other, and unknown. Since there are no public religiousinstitutions, the cross-classification has 17 cells. The desired sampling rates for three of the cells, publicresearch, private research, and public "other Ph.D.," were so close to 100 percent that it was appropriate tosample all of the institutions in those cells. A separate sampling stratum was constructed for theseinstitutions, "stratum 15"; all institutions in this stratum were selected (i.e. selected with certainty). Groupingthe institutions together in stratum 15 makes sense from a sampling design and selection standpoint, althoughthis stratum does not comprise a grouping of analytical interest. Institutions in the other 14 strata are referredto as noncertainty institutions. The 15 sampling strata are described below:
Stratum 1Stratum 2Stratum 3Stratum 4Stratum 5Stratum 6Stratum 7Stratum 8
= Private, other Ph.D.= Public, comprehensive= Private, comprehensive= Public, liberal arts= Private, liberal arts= Public, medical= Private, medical= Private, religious
Stratum 9 = Public, two-yearStratum 10 = Private, two-yearStratum 11 = Public, otherStratum 12 = Private, otherStratum 13 = Public, unknownStratum 14 = Private, unknownStratum 15 includes all Public, research;-Private,research; Public, other Ph.D. institutions
The stratum sample sizes for the noncertainty institutions, determined by a preliminary pass through the 14strata, were allocated proportional to the total estimated number of faculty and instructional staff in eachstratum. In those strata, the first-stage selections were made using stratified sampling with probabilitieswithin each stratum proportional to the expected numbers of faculty and instructional staff. Variouscombinations of first-stage (institution) sampling rates and second-stage (faculty) sampling rates may be usedto achieve equal selection probabilities for faculty. However, under reasonable assumptions, such as constantintraclass correlation within institutions in a stratum, setting first-stage probabilities proportional to thenumber of faculty in the institution and choosing a constant sized cluster of faculty from each selectedinstitution is optimal in the sense of minimizing variance of sample means.
The sampling requirements for NSOPF-93 were developed using a dynamic standard error model thatsimulated various sampling scenarios at the institution and faculty levels. After numerous simulations of themodel were performed, it was determined that acceptable levels of precision for most faculty subgroups couldbe obtained with an institutional sample of 789 institutions. To meet the study's analytical objectives, thesample design also required oversampling certain subgroups of faculty including: full-time females; black,non-Hispanics and Hispanics; Asian/Pacific Islanders; and faculty in four disciplines of particular interest(philosophy/religion, foreign languages, English language and literature, and history). An average cluster sizeof 41.5 faculty was targeted for each. Systematic probability proportional to size (PPS) sampling with a
30
41
1993 National Study of Postsecondary FacultyMethodology Report
measure of size (MOS) equal to 41 or the estimated number of faculty, whichever was larger, was used to
select institutions.
MOS was defined as the total number of faculty as specified in the most recent IPEDS available at the time(the 1991 Fall Staff survey). Of the 3,256 institutions listed on the sample frame, 3,106 had a MOSavailable. For the remaining 150 (4.6 percent) institutions for which faculty data were missing, MOS wasimputed using one of two methods. After imputation, the MOS was available for each institution in theframe, whether selected or not.
The first imputation method involved 123 of the 150 institutions for which only student enrollment data wereavailable from the most recent IPEDS file. A student-faculty (S-F) ratio was first calculated for the 3,106institutions for which information on both variables was available. The S-F ratio was then arrayed by typeand control for these institutions. A MOS for the 123 institutions was determined using the followingformula: (number of students)/(S-F ratio for that institution's cell). The second method of imputationinvolved the 27 remaining institutions for which neither student nor faculty enrollment data were available.The average number of faculty for the 3,106 institutions was calculated by type and control and the 27institutions were given an imputed MOS based on the average number of faculty for their respective cells.
In systematic sampling, the order in which the institutions are listed on the frame is important because itreflects an implicit stratification. Within each stratum the institutions were sorted by MOS in a "serpentine"manner, i.e., if one stratum was sorted in ascending order by MOS, the next was sorted in descending order,the one after that was sorted in ascending order, and so on. This procedure helped to balance the sample withrespect to institution size (based on number of faculty). A total of 789 institutions was initially selected andlater supplemented with 185 institutions for a total of 974 selected in the first stage (see section 3.6 below).
Institutions were selected in two replicates. The first replicate, "Pool 1," contained the initial sample of 789noncertainty and certainty institutions. The second replicate, "Pool 2," was sorted into random order withinstrata and contained 606 noncertainty institutions. Pool 2 provided a source of institutions available so thatlike institutions could be selected to replace nonparticipating Pool 1 institutions.
3.6 Institution Nonresponse
Nonresponse is likely to increase sample variance by causing departures from strict PPS selection.Nonresponse is also likely to cause some bias, the extent of which is difficult to measure. Nonresponse rateswere used to serve as simple indicators of the magnitude of nonresponse.6 Institutions that were determinedineligible or which could not be recruited after extensive follow-up were replaced at random by institutionswithin the same explicit stratum in Pool 2.7 Since, by definition, all institutions in stratum 15 were selected,they did not have replacements within stratum 15.
However, research institution non-participation posed a problem with attaining sufficient samples of some ofthe important faculty groups targeted for oversampling. Thus, a decision was made to include additional
Nonresponse rates were calculated separately for Pool 1 selections and for the combined selections from PoolI and Pool 2 (excluding nonselections from Pool 2).
'The first replicate, "Pool 1," contained the original sample. If 100 percent response could be achieved, thesecond replicate, "Pool 2," would not have been used at all. The response rate was not 100 percent, however. Pool 2was sorted into random order within stratum. When a nonresponse was encountered in stratum x (1 <x < 14)n Pool 1,the first nonselected institution from stratum x in Pool 2 was selected as a replacement institution.
31
42
1993 National Study of Postsecondary FacultyMethodology Report
institutions from similar strata. "Private, other Ph.D.," "Public comprehensive" and "Private comprehensive"sampling strata were used for this purpose. Sixteen nonresponding certainty institutions were compensatedfor in this manner. More on nonresponse rates can be found in Chapters 4 and 7.
The sampling plan assumed an institutional participation rate of 95 percent and a faculty response rate of 85percent, for a yield of approximately 750 institutions and 27,750 faculty. However, the fmal institutionparticipation rate (i.e., provided faculty lists) was 85 percent, based on the total institution sample (theoriginal sample plus 185 supplemental institutions). The lower-than-anticipated institutional participationrate did not, however, noticeably hamper the representativeness of the sample. NCES performed adiscriminant analysis comparing faculty characteristics reported on a sample of the NSOPF-93 facultysampling lists with the faculty characteristics detailed in the IPEDS universe. The analysis showed nosignificant differences between the NSOPF-93 sampling lists and the IPEDS universe.
3.7 Institution Replacements
Based largely on the field test experience, it was initially anticipated that 20 to 25 percent of the sampledinstitutions would ultimately refuse to participate in the full-scale study. Between October 1992 and earlyMarch 1993, 26 institutions in the original sample were replaced by randomly selected comparableinstitutions (from Pool 2): five because they were ineligible and 21 because they were determined to be fmalrefusals. After trying to gain cooperation from the initial sample of 789 institutions for almost six months, itwas determined that a certain number of other institutions were unlikely to participate in the study. Theseinstitutions were identified in March 1993 and 159 additional institutions were randomly selected within therelevant strata (from Pool 2). Thus, a total of 185 institutions, equivalent to 23 percent of the initial sample(n=789), was selected to compensate for institutions determined to be ineligible or for institutions that wereunlikely to participate in the study. Replacement selections were made to achieve two objectives: to assureadequate representation across strata, and to achieve an institution participation rate of 85 percent. Projectstaff tried to gain cooperation from both the original and replacement samples simultaneously. The fmalparticipation rate for list collection was 85 percent for both the original sample and the additional sample.
Typically, an institution that initially refused to participate was recontacted by key members of the projectstaff, usually by one of the project supervisors. After determining the reasons for their refusal, a specific planwas proposed to respond to the institution's concerns. In some instances, this meant Providing compensationto prepare the list; in other instances, it required accepting a list without some of the requested sampling oraddress information. If the proposed plan proved unacceptable to the institution, other senior members of theproject staff or the NCES project officer recontacted the institution to try once again to win theirparticipation. If following these repeated attempts the institution still decided not to participate, theinstitution was considered a final refusal.
3.8 Second Stage Sampling: Faculty-Level
At the second stage of sample selection, the NSOPF-93 sampling frame consisted of lists of faculty andinstructional staff obtained from 817 participating institutions. The sampling of faculty was handled by amulti-step program developed specifically for NSOPF-93. The program was designed to ensure the adequaterepresentation in the sample of particular faculty groups, according to NSF and NEH analytical objectives.These faculty groups were: full-time females; black, non-Hispanics and Hispanics; Asian/Pacific Islanders;and faculty in four NEH-designated disciplines: philosophy/religion, foreign languages, English languageand literature, and history. The sampling program proceeded through the following steps in sampling aninstitution's faculty:
3243
1993 National Study of Postsecondary FacultyMethodology Report
(1) Each institution was randomly assigned a target total sample size, say 11, of either 41 or 42 to yieldthe desired average cluster size of 41.5. Whenever an institution employed fewer than 42individuals, all faculty were selected.
(2) Depending on the composition of an institution's faculty, the program oversampled to achieve thefollowing average oversample sizes' per institution:
(3)
Black, non-Hispanic/HispanicFull-time femaleFaculty in NEH disciplinesAsian/Pacific IslanderNone of the above
5.60813.36492.24321.12160.0000 (no oversampling)
The oversample sizes in each institution were randomly rounded to integers; the rounding wasindependent across institutions.
Some faculty belonged to more than one of the oversampled groupstermed "multi-group"members. For example, a full-time faculty member who was a Hispanic female would belong to twoof the groups. To use stratified sampling to select the faculty, it was necessary to classify eachfaculty member into just one of the groups. Once this was accomplished, the groups would beexhaustive and mutually exclusive and hence they would be true strata. Although simplerandomization could have been used to assign multi-group members to a single group, alternativemethods of assignment can lead to more efficient samples. Thus, it was decided to make theassignments so as to minimize the oversampling rates.' Specifically, the faculty lists were processedsequentially, so that in a given institution a multi-group member was assigned to the group for whichthe oversampling rate (defined as the oversample size divided by the number of individuals in thatinstitution which could qualify for the group) was largest. As the program proceeded through thelist, the oversampling rates varied depending on how many multi-group members there were and howthey were classified into single groups. At the end of this step, each faculty member was classifiedinto one group. The oversample size for each group was then checked to ensure that it did not exceedthe number of members of the group; any oversample sizes that did were reduced accordingly.
(4) The final sampling rate for a group was set equal to the sum of the oversampling rate and the ratethat would have been used if no oversampling was done. Using these final sampling rates, stratifiedsampling was performed with the groups as strata.
(5) The residual sample size (n minus the sum of the oversample sizes) was allocated across the fivestrata in proportion to the number of faculty in the strata. Then the total sample in each stratum(consisting of the oversample size plus the proportionally allocated residual) was specified by simplerandom sampling without replacement, with the sampling independent from one faculty stratum tothe next.
8The oversample size for a group is the difference between the expected sample size for the group and theexpected sample size that would have been attained if all faculty had been sampled at the same rate, i.e., in the absenceof oversampling.
8The oversampling rate is the ratio of the oversample size to the size of the group. Increasing the size of thegroup decreases the oversampling rate. The lower the oversampling rate, the smaller the design effect due to unequalweighting. Oversample sizes were not affected.
33
44
1993 National Study of Postsecondary FacultyMethodology Report
Among the 789 initial sample institutions, it was determined that 48 (6.1 percent) institutions overlappedwith the NSOPF-93 field test sample. Six of the institutions from the replacement pool also overlapped withthe field test sample for a combined overlap (initial and replacement) of 54 institutions or 5.5 percent of the974 selections. Faculty who were selected into both the field test and the full-scale study samples wereexcluded from the latter in accordance with OMB requirements.
3.9 Subsampling of Faculty
As a cost-saving measure, 2,000 faculty were subsampled from the overall sample of faculty in August,1993. This reduced the sample size for the NSOPF-93 faculty sample from 33,354 to 31,354. These facultywere subsampled at random. First, all completed cases were excluded from the subsample. Second, allremaining cases were assigned a "wave" indicator, taking integer values from 1 to 6, indicating which of thesix survey waves the case belonged to. Because all faculty in any institution belonged to the same wave,subsampling then proceeded according to the following specifications. (For further explanation of thefielding of the faculty survey in waves, see section 5.3.)
For wave j, let Nj denote the number of faculty selected, let n3 denote the number of faculty cases completed,and let 4= n3 denote the number of cases not yet completed. Let A, denote the sum of the .4 terms, i.e.,
= A, +A2 + . . . +A6. Subsampling proceeded in two steps. First the number ofcases to be excluded(subsampled out) of wave j, say m1, was calculated. Second, these cases were subsampled out.
Set m3 = 2000(4 /A+) for each wave j. For each wave j, 1 s j s 6, 4 noncompleted cases from wave j weresorted by institution. Thus, all faculty in an institution appeared consecutively in the file. Then a randomstart was chosen and systematic sampling taking every kth record from stratum j was performed. This yieldeda sample of in, records. These cases were removed from the sample.
The 4 mj cases in wave j that were not excluded by this sampling received a flag indicating that they wereeligible for exclusion at this point but were not excluded. Their raw sampling weights were inflated by afactor equal to 1/(1 m/A).
3.10 Calculation of Weights
The sample was weighted to produce national estimates of institutions and faculty by using weights designedto adjust for differential probabilities of selection and nonresponse at the institution and faculty levels. Afterexcluding ineligible institutions from the institution sample, the adjusted weights for institutions sum to3,188.' Likewise, after excluding ineligible members from the faculty sample, the adjusted weights forfaculty sum to 1,033,966, the estimated total number of faculty in the target population. This numberincludes instructional staff who did not have faculty status and whose instructional duties related only tononcredit courses or advising, or to supervising noncredit academic activities.
Three weights were computed for the NSOPF-93 sample: a first-stage institution-level weight and finalinstitution and faculty weights. The first-stage institution-level weights accounted for the institutions.thatparticipated in the study by submitting a faculty sampling list and permitted faculty members to be sampled.The two final weightsweights for the sample faculty, and institution-level weights for those institutions that
'Twelve institutions in the sample were found to be ineligible. When ineligible institutions were excludedfrom the sample, the sum of weights for eligible institutions was 3,188, rather than the 3,256 institutionsspecified in thesampling frame.
4534
1993 National Study of Postsecondary FacultyMethodology Report
returned institution questionnaireswere adjusted for nonresponse. The final faculty weights werepoststratified to the "best" estimates of the number of faculty.
A poststratification adjustment to the IPEDS population was not calculated. The IPEDS and NSOPF-93faculty population definitions and estimates, although similar in many respects, are not identical nor are theyintended to correspond directly. IPEDS defines as Faculty (Instruction/Research) "all persons whose specificassignments customarily are made for the purpose of conducting instruction, research or public service as aprinciple activity (or activities) and who hold academic-rank titles of professor, associate professor, assistantprofessor, instructor, lecturer, or the equivalent of any of these academic ranks. If their principle activity isinstructional [this category also includes] deans, directors, or the equivalent, as well as associate deans,assistant deans and executive officers of academic departments . . ." While NSOPF-93's definition ofinstructional faculty parallels the IPEDS definition, many of the job titles that NSOPF considers non-instructional faculty are classified in IPEDS under other non-faculty categories. For example, in itsinstructions to IPEDS respondents, NCES lists "librarians" as an example of a "Professional Non-Faculty"position. Yet, NSOPF-93 institution questionnaire respondents listed "librarians" as the largest single groupof non-instructional faculty. Because of such definitional differences between the NSOPF and IPEDSpopulations, a poststratification adjustment to IPEDS estimates was ruled out.
3.11 First-Stage Institution Weights
The first-stage institution weights for the NSOPF-93 faculty survey were constructed in three steps. First, theinstitution's base weight was calculated as the reciprocal of its selection probability. Second, the initial baseweights were adjusted for institutions that had merged and so were effectively listed multiple times in thesampling frame. Finally, nonresponse adjustment factors were applied to the weights to compensate forinstitution-level nonresponse.
Base weights. The selection probability for an institution's selection into the sample, P ",,,, was calculated bydividing the institution's MOS by the product of the total number of faculty members in the institutionsampling stratum which included that institution and the reciprocal of the desired sample of institutions forthat stratum. The first-stage base weight for institution i in stratum h, W1.171, is the reciprocal of the first-stageselection probability, P*,. These initial weights reflect the several steps used to select the institutions. In thefirst step, a stratified sample was drawn, with extra selections from each stratum. The selections were thensorted into two groups, Pool 1 and Pool 2, so that (i) all certainty selections were put into Pool 1, and (ii) thenoncertainty selections within each stratum were systematically randomly allocated to Pool 1 or Pool 2. ThePool 1 institutions were those selected for initial fielding in the survey, and the Pool 2 institutions were extrainstitutions to compensate for nonresponse among Pool 1 institutions. Thus, although all of Pool 1institutions were selected for the sample, most of the Pool 2 selections were not selected. Within eachstratum, Pool 2 institutions were sorted into random order and then selected as needed for inclusion in thesurvey.
For institution i, in stratum h, with a desired sample size of nh, the selection probability is
P * hi
MOShi
nh
MOShii=1
nh
35
46
1993 National Study of Postsecondary FacultyMethodology Report
For institution i, in stratum h, the first-stage base weight is
= UP* hi,
with P* hi representing the probability that institution i in stratum h was selected for fielding. The selectionprobability for institution i in pool g and in stratum h was 1 for certainty institutions and Phi(/'1,, a Jib for2rr h
noncertainty institutions, with
agh = number of noncertainty selections in Pool g, stratum h that were actually fieldedbgh = total number of noncertainty selections in Pool g, stratum hbh = the total number of noncertainty selections in either pool (= b b2h)Ph, = probability that institution i in stratum h was selected into either Pool 1 or Pool 2.
Note that a sh = b ,h. The probability that noncertainty institution./ in stratum h was selected into Pool 1 andfielded is Ph,b,h/bh (all Pool 1 institutions were fielded); the probability for a certainty institution is 1. Theprobability that institution i in stratum h was selected into Pool 2 and surveyed is Ph,a21/bh. The probabilitythat institution i in stratum h was selected for fielding is the sum of these two probabilities.
Adjustment for multiplicity. After the sample had been selected and institutions were contacted, it waslearned that a few of the institutions in the sample had merged with other institutions on the sampling frame.Since a merged institution would be in the sample if either listing of the institution was selected from theframe, its sampling weight had to be reduced. Let A denote the listing of the institution that was selected andlet B denote the other listing. If P*A and P*B denote the respective selection probabilities, the probability ofsurveying either institution was approximately P*A P*B P*A x P*B. (This approximation rests on theassumption of independence of selection, whichhas a trivial numerical effect.) Thus, the weights for such aninstitution were modified accordingly. Specifically, the base weight for institution A was changed to
V1,4 = WI.AXWLB [WLA WI.B 1]
if institution A was identified with institution B, and W = W1, otherwise. We will use the notation W 'Li,' todenote the weight for institution i in stratum h after modifications of the weights for multiplicity.
Adjustment for nonresponse. Prior to computing the nonresponse adjustment, two indicators were createdto flag cooperating and eligible institutions. The first indicator, Au, was given the value of 1 if institution i instratum h cooperated in the survey and 0 if the institution did not cooperate. Similarly, the second indicatorvariable, ./h was set to 1 if the surveyed institution i in stratum h was found to be eligible and to 0 if it wasfound to be ineligible. Institutions that turned out to be ineligible as cooperators were classified; thus, it ispossible that 1h, = 1 and Jhi = 0. Institutions were classified according to Exhibit 3-2, in which iip denotes aweighted number of institutions in the sample (weighted by W;.h,).
36
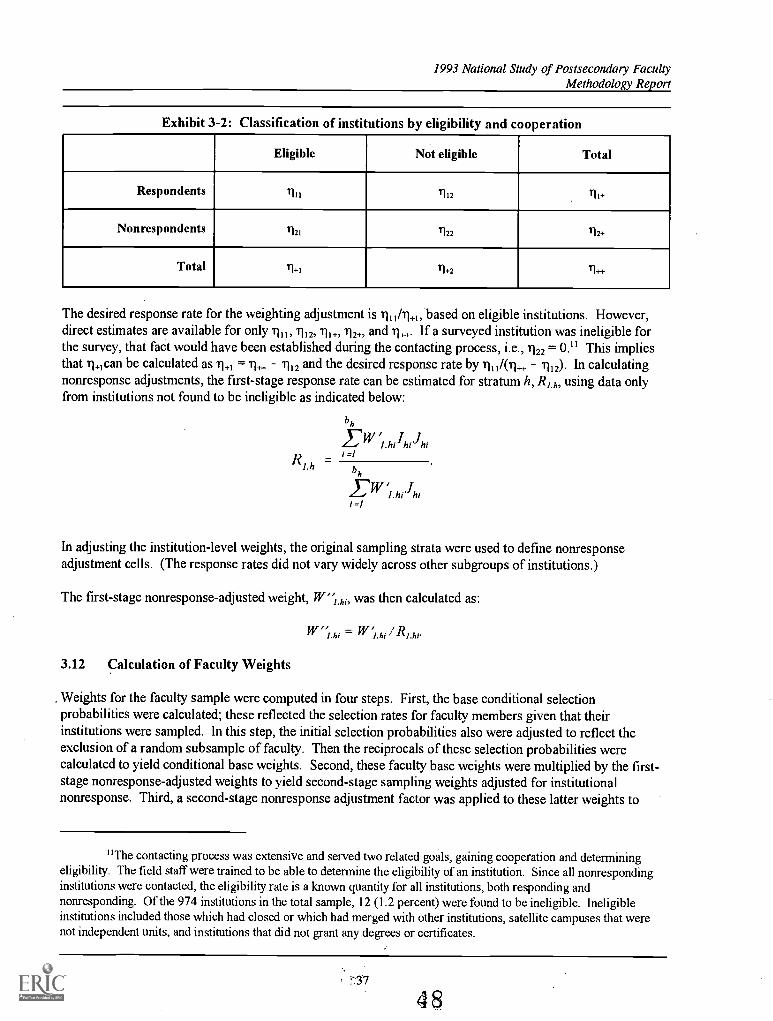
1993 National Study of Postsecondary FacultyMethodology Report
Exhibit 3-2: Classification of institutions by eligibility and cooperation
Eligible Not eligible Total
Respondents 111 12 11+
Nonrespondents 121 122 12+
Total 1+1 1+2 T1++
The desired response rate for the weighting adjustment is /1111.11+1, based on eligible institutions. However,direct estimates are available for only in 1 1 11 1, T .1 2, 'n.1+, 1 and 1 If a surveyed institution was ineligible forthe survey, that fact would have been established during the contacting process, i.e., 122 = O. 11 This impliesthat 1,1can be calculated as rh., = 11,2 and the desired response rate by T11/01, 11,2). In calculatingnonresponse adjustments, the first-stage response rate can be estimated for stratum using data onlyfrom institutions not found to be ineligible as indicated below:
bh
W
Rl.hi =1
bh
1.hiJhii
In adjusting the institution-level weights, the original sampling strata were used to define nonresponseadjustment cells. (The response rates did not vary widely across other subgroups of institutions.)
The first-stage nonresponse-adjusted weight, W"Lh, was then calculated as:
F .hi = R1.hi
3.12 Calculation of Faculty Weights
Weights for the faculty sample were computed in four steps. First, the base conditional selectionprobabilities were calculated; these reflected the selection rates for faculty members given that theirinstitutions were sampled. In this step, the initial selection probabilities also were adjusted to reflect theexclusion of a random subsample of faculty. Then the reciprocals of these selection probabilities werecalculated to yield conditional base weights. Second, these faculty base weights were multiplied by the first-stage nonresponse-adjusted weights to yield second-stage sampling weights adjusted for institutionalnonresponse. Third, a second-stage nonresponse adjustment factor was applied to these latter weights to
"The contacting process was extensive and served two related goals, gaining cooperation and determiningeligibility. The field staff were trained to be able to determine the eligibility of an institution. Since all nonrespondinginstitutions were contacted, the eligibility rate is a known quantity for all institutions, both responding andnonresponding. Of the 974 institutions in the total sample, 12 (1.2 percent) were found to be ineligible. Ineligibleinstitutions included those which had closed or which had merged with other institutions, satellite campuses that werenot independent units, and institutions that did not grant any degrees or certificates.
:37
4
1993 National Study of Postsecondary FacultyMethodology Report
compensate for nonresponse by faculty members. Fourth, the nonresponse-adjusted weights werepoststratified to the best estimates of total, full-, and part-time faculty by sampling stratum.
Second-stage weights. Faculty members in the surveyed institutions were selected by stratified randomsampling within five strata per institution. The strata were based on classification of faculty as (i) black, non-Hispanic/ Hispanic (ii) full-time female faculty, (iii) faculty in one of the NEH disciplines, (iv) Asian/PacificIslander faculty, and (v) all other faculty. The classification was unique, so that any faculty member on theinstitution's roster was assigned to only one stratum. Letting Nf denote the number of faculty on the rosterwho were assigned to stratum f, and of denote the number of faculty in stratum f in the institution who weresampled, the initial second-stage raw conditional selection probability weight for faculty member kin stratumf was calculated as n f/Nf.
Each faculty member in the sample was classified into one of six "waves," denoted by the subscript j, andeach faculty member was identified as being a respondent (or "initial respondent") or not by that point in thefielding of the sample. The first wave consisted of faculty who were contacted early on in the survey, andsecond wave faculty were contacted somewhat later, and the sixth wave faculty were contacted last. Thus, sic,was set to 1 if faculty member k in wave j was an initial respondent and was 0 otherwise. If T, denotes thenumber of initial nonrespondents in wave j, then
T. = E -Ski )kcwave
As discussed in section 3.9, 2,000 of the selected faculty were deliberately dropped from the sample duringfielding of the sample. The exclusions were made randomly but the exclusion probabilities were not constant.Overall, 2,000 initial nonrespondents were dropped after subsampling. Let nil denote the number of suchexcluded nonrespondents in wave j. The conditional probability that a faculty member was retained in thesample (i.e., not excluded), given that he or she was in wave j, equaled 1 if the faculty member was an initialrespondent in that wave (i.e., if sk, = 1), and it equaled (1 ing) if the faculty member was an initialnonrespondent (Sig = 0).
Thus, for initial respondents in each wave, the second-stage base weight (Wzik for faculty member k infaculty-stratum j) was given by
W2.fk = Nf / nf
For initial nonrespondents in wave j, the base weight was
Wzbk = Nf / [n f(1 nif/
Adjustment for institution-level selection and nonresponse. The second-stage weights were adjusted forinstitutional sampling and nonresponse by multiplying the raw second-stage faculty weight by the finalinstitution-level weight. Thus, for faculty member k in faculty stratum f in institution i in institution-levelstratum h, the adjusted weight (W i fkti;) is given by
W 2Jkhi = W2 fkW "Lhi or W2s.K W
depending on whether the respondent was classified as an initial respondent or initial nonrespondent.
38
49
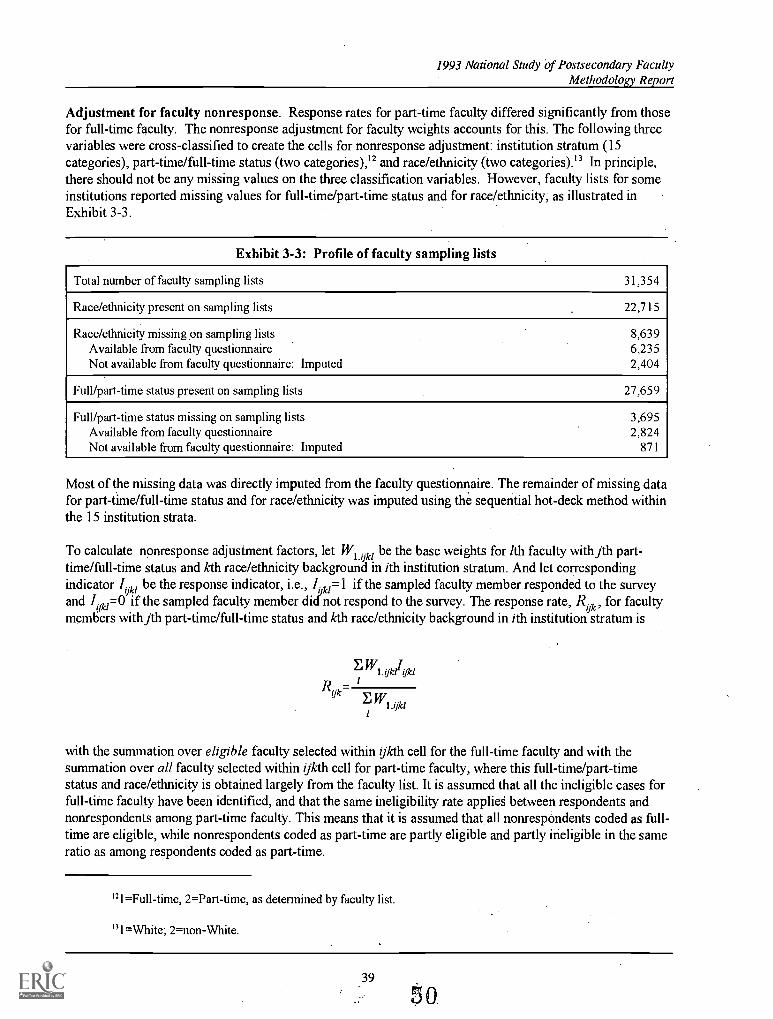
1993 National Study of Postsecondary FacultyMethodology Report
Adjustment for faculty nonresponse. Response rates for part-time faculty differed significantly from thosefor full-time faculty. The nonresponse adjustment for faculty weights accounts for this. The following threevariables were cross-classified to create the cells for nonresponse adjustment: institution stratum (15categories), part-time/full-time status (two eategories),12 and race/ethnicity (two categories).13 In principle,there should not be any missing values on the three classification variables. However, faculty lists for someinstitutions reported missing values for full-time/part-time status and for race/ethnicity, as illustrated inExhibit 3-3.
Exhibit 3-3: Profile of faculty sampling lists
Total number of faculty sampling lists 31,354
Race/ethnicity present on sampling lists 22,715
Race/ethnicity missing on sampling lists 8,639Available from faculty questionnaire 6,235Not available from faculty questionnaire: Imputed 2,404
Full/part-time status present on sampling lists 27,659
Full/part-time status missing on sampling lists 3,695Available from faculty questionnaire 2,824Not available from faculty questionnaire: Imputed 871
Most of the missing data was directly imputed from the faculty questionnaire. The remainder of missing datafor part-time/full-time status and for race/ethnicity was imputed using the sequential hot-deck method withinthe 15 institution strata.
To calculate nonresponse adjustment factors, let Wijim be the base weights for lth faculty with jth part-time/full-time status and kth race/ethnicity background in ith institution stratum. And let correspondingindicator /uki be the response indicator, i.e., I k1 =1 if the sampled faculty member responded to the surveyand /ykl =0 if the sampled faculty member didnot respond to the survey. The response rate, R.. for facultymembers with jth part-time/full-time status and kth race/ethnicity background in ith institution stratum is
EW1.ijki;ivR I
gkEWl.ijkl
1
with the summation over eligible faculty selected within ijkth cell for the full-time faculty and with thesummation over all faculty selected within ijkth cell for part-time faculty, where this full-time/part-timestatus and race/ethnicity is obtained largely from the faculty list. It is assumed that all the ineligible cases forfull-tithe faculty have been identified, and that the same ineligibility rate applieS between respondents andnonrespondents among part-time faculty. This means that it is assumed that all nonrespondents coded as full-time are eligible, while nonrespondents coded as part-time are partly eligible and partly ineligible in the sameratio as among respondents coded as part-time.
121=Full-time, 2=Part-time, as determined by faculty list.
'31=White; 2=non-White.
.39
1993 National Study of Postsecondary FacultyMethodology Report
The faculty weight adjusted for the nonresponse, W21 1 , was
WW
I .ykl"2. ijkl
R
Within each cell, if there were at least 15 cases and the weighted response rate was not less than two-thirds ofthe overall weighted response rate, the nonresponse adjustment factor was computed. When a given cell didnot meet these criteria, it was collapsed with a neighboring cell. Collapsing on race/ethnicity occurred first,followed by collapsing on part-time/full-time status. SuCh collapsing is intended to limit the large increase invariability that could be associated with large adjustment factors (i.e., large R- ) .
Poststratification to "best estimates." To create the final faculty weights, nonresponse-adjusted facultyweights were poststratified to "best estimates" of the national population of full-time and part-time faculty.Chapter 10 describes the procedures used to derive best estimates. Let ti.j. be the best estimate for the totalnumber of faculty with jth part-time/full-time status in ith institution stratum. The post-stratified weights,W are .3.0k/,
T.W =W3.ijkl 2.ijk1 Ez
2.0k1k1
with the summation over all respondents within ijth cell. These poststratified final faculty weights producethe weighted national population estimates for the NSOPF-93 faculty questionnaire dataset.
The poststratification adjustment should reduce sampling variability, and more importantly reduce anyreporting biases and bias due to undercoverage of the faculty sampling frame. Poststratification provides ameans of weighting the faculty respondents to represent all faculty on the original faculty sampling frame aswell as faculty missed on the frame. The method is entirely analogous to the nonresponse adjustment, wherefaculty respondents are weighted up to represent themselves as well as the faculty nonrespondents. While thenonresponse adjustment is based upon the assumption that the means of respondents and nonrespondents aresimilar, the poststratification adjustment is based upon the assumption that the means of covered faculty andmissed faculty are similar. Neither assumption is perfect, but the resulting estimates are thought to be moreaccurate than they would be in the absence of the adjustments.
3.13 Calculation of Weights for Institution Questionnaires
The weights for institution questionnaires were calculated in the same manner as the first-stage weights forinstitutions from which faculty were selected (see section 3.11), the only difference being the definition of"respondent." For calculating the weights for institutions with institution questionnaires, a respondent wasdefined as any institution from which an acceptable institution questionnaire was received. For mostinstitutions, the response classification was identical under the two criteria. As a result, the weighting cellsfor the first-stage weights were used without change for the weights for institution questionnaires. Exhibit 3-4 provides summary statistics of the faculty and institution weights.
40
51
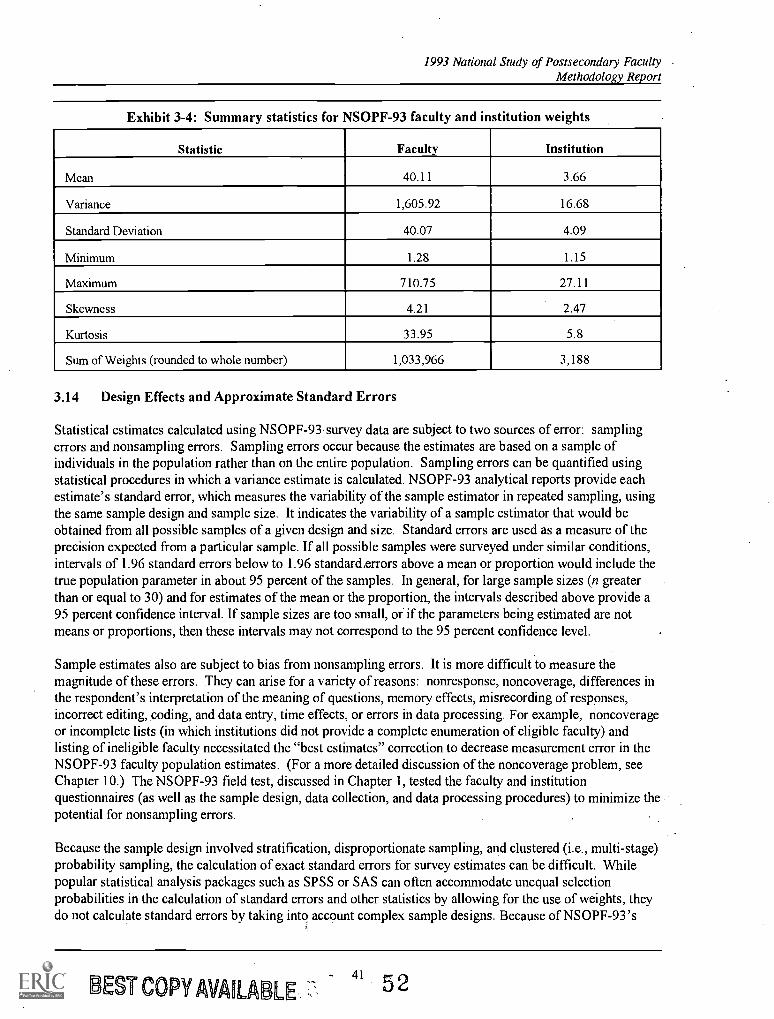
1993 National Study of Postsecondary FacultyMethodology Report
Exhibit 3-4: Summary statistics for NSOPF-93 faculty and institution weights
Statistic Faculty Institution
Mean 40.11 3.66
Variance 1,605.92 16.68
Standard Deviation 40.07 4.09
Minimum 1.28 1.15
Maximum 710.75 27.11
Skewness 4.21 2.47
Kurtosis 33.95 5.8
Sum of Weights (rounded to whole number) 1,033,966 3,188
3.14 Design Effects and Approximate Standard Errors
Statistical estimates calculated using NSOPF-93 survey data are subject to two sources of error: samplingerrors and nonsampling errors. Sampling errors occur because the estimates are based on a sample ofindividuals in the population rather than on the entire population. Sampling errors can be quantified usingstatistical procedures in which a variance estimate is calculated. NSOPF-93 analytical reports provide eachestimate's standard error, which measures the variability of the sample estimator in repeated sampling, usingthe same sample design and sample size. It indicates the variability of a sample estimator that would beobtained from all possible samples of a given design and size. Standard errors are used as a measure of theprecision expected from a particular sample. If all possible samples were surveyed under similar conditions,intervals of 1.96 standard errors below to 1.96 standard,errors above a mean or proportion would include thetrue population parameter in about 95 percent of the samples. In general, for large sample sizes (n greaterthan or equal to 30) and for estimates of the mean or the proportion, the intervals described above provide a95 percent confidence interval. If sample sizes are too small, or if the parameters being estimated are notmeans or proportions, then these intervals may not correspond to the 95 percent confidence level.
Sample estimates also are subject to bias from nonsampling errors. It is more difficult to measure themagnitude of these errors. They can arise for a variety of reasons: nonresponse, noncoverage, differences inthe respondent's interpretation of the meaning of questions, memory effects, misrecording of responses,incorrect editing, coding, and data entry, time effects, or errors in data processing. For example, noncoverageor incomplete lists (in which institutions did not provide a complete enumeration of eligible faculty) andlisting of ineligible faculty necessitated the "best estimates" correction to decrease measurement error in theNSOPF-93 faculty population estimates. (For a more detailed discussion of the noncoverage problem, seeChapter 10.) The NSOPF-93 field test, discussed in Chapter 1, tested the faculty and institutionquestionnaires (as well as the sample design, data collection, and data processing procedures) to minimize thepotential for nonsampling errors.
Because the sample design involved stratification, disproportionate sampling, and clustered (i.e., multi-stage)probability sampling, the calculation of exact standard errors for survey estimates can be difficult. Whilepopular statistical analysis packages such as SPSS or SAS can often accommodate unequal selectionprobabilities in the calculation of standard errors and other statistics by allowing for the use of weights, theydo not calculate standard errors by taking into account complex sample designs. Because of NSOPF-93's
BEST COPY AVAILABLE- 41 52
1993 National Study of Postsecondary FacultyMethodology Report
complex sample design, standard errors generated by SPSS and SAS will usually underestimate the samplingvariability of statistical estimates such as population means, percentages, and more complex statistics such ascorrelations and regression coefficients. Several procedures are available for calculating precise estimates ofsampling errors for complex samples. Procedures such as Taylor series approximation, balanced half-samplereplication (BHS), and jackknife repeated replication (JRR) produce similar results." Consequently it islargely a matter of convenience which approach is taken. For BHS, 32 replicate weights are provided on theNSOPF-93 faculty and institution data files. The Data Analysis System (DAS), available on CD-ROM,calculates variances with the Taylor series approximation method.
The institution sampling stratum variable, ISTRATUM, and the primary sampling unit variable, PSU, areprovided on the data files to facilitate calculation of standard errors using the Taylor series approximationmethod.' This method was used to calculate standard errors reported in NSOPF-93 analytical reports.Standard errors reported in the NSOPF-93 institution report, Institutional Policies and Practices RegardingFaculty in Higher Education [NCES 97-080] were produced with SUDAAN software using a "withoutreplacement" design to handle the certainty stratum and the large sampling fractions in certain strata. Thesevariance estimates assume a zero variance for the stratum of institutions selected with certainty. (Section3.15 discusses in greater detail variance estimation for institutions selected with certainty.) In using theTaylor-series approximation method to calculate variances for the faculty report Instructional Faculty andStein Higher Education Institutions: Fall 1987 and Fall 1992, [NCES 97-470] based on the NSOPF-93faculty dataset, a "with replacement" design was utilized.
The impact of departures from simple random sampling on the precision of sample estimates is oftenmeasured by the design effect. For any statistical estimator (for example, a mean or a proportion), the designeffect is the ratio of the estimate of the variance of a statistic derived from consideration of the sample designto that obtained from the formula for simple random samples.
Exhibits 3-5 through 3-7 present standard errors and design effects for the NSOPF-93 faculty and institutiondata, calculated with SUDAAN's Taylor series approximation method. These standard errors and designeffects used weighted data and took into account NSOPF-93's complex sample design. Faculty questionnairestandard errors and design effects, presented in Exhibit 3-5, were calculated using a "with replacement"design. Institution questionnaire standard errors and design effects, presented in Exhibit 3-6, useSUDAAN's "without replacement" design with finite population correction factors. The standard errors anddesign effects presented in Exhibits 3-5 through 3-7 take into account the features of the sampling design: 1)stratification in the selection of institutions; and, 2) clustering (i.e., the use of institutions as first-stagesampling units).
Exhibits 3-5 and 3-6 present standard errors and design effects ("DEFF") for 30 randomly selecteddichotomized items from the faculty and institution questionnaires. In selecting items from eachquestionnaire, 30 questions were randomly selected, using systematic selection from the beginning of thequestionnaire. Response categories for each selected survey question were dichotomized for the purpose of
"Frankel, M., Inference from Survey Samples: An Empirical Investigation (Ann Arbor: Institute for SocialResearch, 1971).
"Two widely available variance estimation software packages, SUDAAN and CENVAR, use the Taylor seriesapproximation method to calculate variances. For'more information on SUDAAN, see Shah, Babubhai V., Beth G.Barnwell and Gayle S. Bieler, SUDAAN User's Manual Release 6.4 (Research Triangle Park, N.C.: Research TriangleInstitute, 1995). For information on CENVAR, see U.S. Bureau of the Census, CENVAR IMPS Version 3.1(Washington D.C.: U.S. Bureau of the Census, 1995).
53.4?
1993 National Study of Postsecondary FacultyMethodology Report
representing the full range of levels which percentages can assume, i.e., the range from one percent(equivalently, 99 percent) to 50 percent.
The column titled "Questionnaire item" in these exhibits gives a brief description of the dichotomous item.A separate column titled "Question response number" gives the questionnaire numbers of the question and
response categories which were used to construct this dichotomous item. For example, the first item inExhibit 3-5 pertains to the percent of faculty who said they were hired by the institution for which theyworked in 1981 or before. Similarly, the second item in Exhibit 3-6 refers to the percentage of institutionrespondents who selected response categories 0 or 1 in response to subitem A of Question 7 in questionnairesection B, i.e., "B7a:0,1". Thus, 49.35 percent of institution respondents answered that one or no tenuredfull-time faculty members who left the institution between Fall 1991 and Fall 1992 retired.
Exhibit 3-7 presents average design effects ("DEFF") for the faculty sample and questionnaire treated in
Exhibit 3-5. Exhibit 3-7 also presents the average of the square roots of DEFFs ("DEFT") for the same setsof dichotomous items. This exhibit presents mean DEFFs and mean DEFTs not only for total respondents butalso for 30 subgroups: two genders (male and female), five racial/ethnic groups, and subgroups based ontenure status, faculty rank, employment status, and type and control of institution. Because of small samplesizes within each Carnegie classification stratum in the institution sample, a similar exhibit of mean DEFFsand DEFTs was not produced for the institution sample.
Researchers who do not have access to software for computing estimates of standard errors can use the meandesign effects presented in Exhibit 3-7 to approximate the standard errors of statistics based on the NSOPF-93 data. Design-corrected standard errors for a proportion can be approximated from the standard errorcomputed using the formula for the standard error of a proportion based on a simple random sample and theappropriate mean root design effect (DEFT):
SE = DEFT x [(p (1-p)In)] 12 (1)
where p is the weighted proportion of respondents giving a particular response, n is the size of the sample,and DEFT is the mean root design effect.
Similarly, the design-corrected standard error of a mean can be approximated from the standard error basedon simple random sampling and the appropriate mean DEFT:
SE = DEFT x (Var /n) "2 (2)
where Var is the simple random sample variance, n is the size of the sample, and DEFT is the mean rootdesign effect. Exhibit 3-7 makes clear that the design effects and root design effects vary considerably bysubgroup. It is therefore important to use the mean DEFT for the relevant subgroup in calculatingapproximate standard errors for subgroup statistics.
Standard error estimates may be needed for subgroups that are not tabulated here.. One rule of thumb may beuseful in such situations: design effects will generally be smaller for groups that are formed by subdividingthe subgroups listed in the tables. This is because smaller subgroups will be less affected by clustering thanlarger subgroups. Estimates for minority respondents, for example, will generally have smaller design effectsthan the corresponding estimates for all respondents. For this reason, it will usually be conservative to use thesubgroup mean DEFT to approximate standard errors for estimates concerning a portion of the subgroup.This rule applies only when the variable used to subdivide a subgroup crosscuts institutions. Gender is one
43 54
1993 National Study of Postsecondary FacultyMethodology Report
such variable, since most institutions include faculty of both sexes. It will not reduce the average cluster sizeto form groups that are based on subsets of institutions.
Standard errors may also be needed for other types of estimates than the simple means and proportions thatare the basis for the results presented here. A second rule of thumb can be used to estimate approximatestandard errors for comparison between subgroups. If the subgroups crosscut institutions, then the designeffect for the difference between the subgroup means will be somewhat smaller than the design effect for theindividual means. The variance of the difference estimate will be less than the sum of the variances of the twosubgroup means from which it is derived:
Var(b-a) s Var(b) + Var(a) (3)
in which Var(b-a) refers to the variance of the estimated difference between the subgroup means, and Var(a)and Var(b) refer to the variances of the two subgroup means. It follows from equation (3) that Var(a) +Var(b) can be used in place of Var(b-a) with conservative results.
A final rule of thumb is that some complex estimators show smaller design effects than simple estimators.'Thus, correlation and regression coefficients tend to have smaller design effects than subgroup comparisons,and subgroup comparisons have smaller design effects than means. This implies that it will be conservativeto use the mean root design effects presented here in calculating approximate standard errors for multipleregression coefficients. The procedure for calculating such approximate standard errors is the same as withsimpler estimates. First, a standard error is calculated using the formula for data from a simple randomsample; then, the simple random sample standard error is multiplied by the appropriate mean root designeffect. This rule of thumb may not apply to other complex estimators," and analysts should use caution inapplying it to complex estimators other than regression coefficients.
'Kish, L., and Frankel, M., "Inference from Complex Samples," Journal of the Royal Statistical Society:Series B (Methodological), 36 (1974): 2-37.
"Skinner, C.J., Holt, D., and Smith, T.F.M., eds., Analysis of Complex Surveys (Chichester, England: Wiley,1989): 70.
5'5
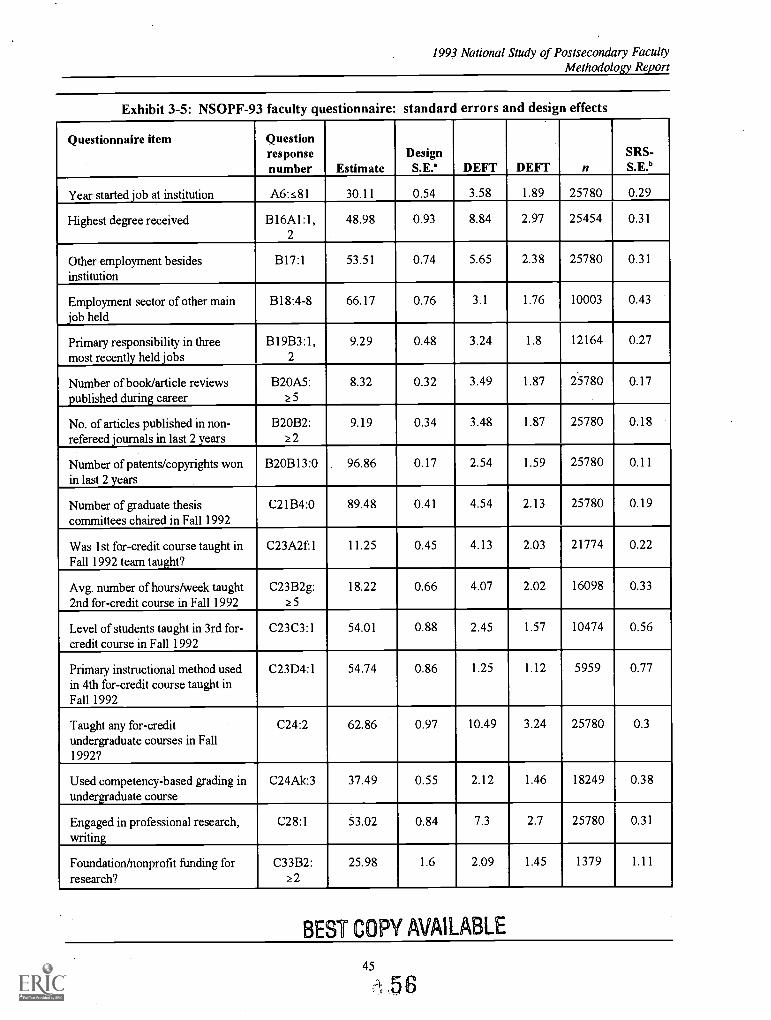
1993 National Study of Postsecondary FacultyMethodology Report
Exhibit 3-5: NSOPF-93 faculty questionnaire: standard errors and design effects
Questionnaire item Questionresponsenumber Estimate
DesignS.E. * DEFT DEFT n
SRS-S.E.'
Year started job at institution A6:s81 30.11 0.54 3.58 1.89 25780 0.29
Highest degree received B16A1:1,2
48.98 0.93 8.84 2.97 25454 0.31
Other employment besidesinstitution
B17:1 53.51 0.74 5.65 2.38 25780 0.31
Employment sector of other mainjob held
B18:4-8 66.17 0.76 3.1 1.76 10003 0.43
Primary responsibility in threemost recently held jobs
B19B3:1,2
9.29 0.48 3.24 1.8 12164 0.27
Number of book/article reviewspublished during career
B20A5:z 5
8.32 0.32 3.49 1.87 25780 0.17
No. of articles published in non-refereed journals in last 2 years
B20B2:z 2
9.19 0.34 3.48 1.87 25780 0.18
Number of patents/copyrights wonin last 2 years
B20B13:0 96.86 0.17 2.54 1.59 25780 0.11
Number of graduate thesiscommittees chaired in Fall 1992
C21B4:0 89.48 0.41 4.54 2.13 25780 0.19
Was 1st for-credit course taught inFall 1992 team taught?
C23A2f:1 11.25 0.45 4.13 2.03 21774 0.22
Avg. number of hours/week taught2nd for-credit course in Fall 1992
C23B2g:z 5
18.22 0.66 4.07 2.02 16098 0.33
Level of students taught in 3rd for-credit course in Fall 1992
C23C3:1 54.01 0.88 2.45 1.57 10474 0.56
Primary instructional method usedin 4th for-credit course taught inFall 1992
C23D4:1 54.74 0.86 1.25 1.12 5959 0.77
Taught any for-creditundergraduate courses in Fall1992?
C24:2 62.86 0.97 10.49 3.24 25780 0.3
Used competency-based grading inundergraduate course
C24Ak:3 37.49 0.55 2.12 1.46 18249 0.38
Engaged in professional research,writing
C28:1 53.02 0.84 7.3 2.7 25780 0.31
Foundation/nonprofit funding forresearch?
C33B2:z 2
25.98 1.6 2.09 1.45 1379 1.11
BEST COPY AVAILABLE
45
56
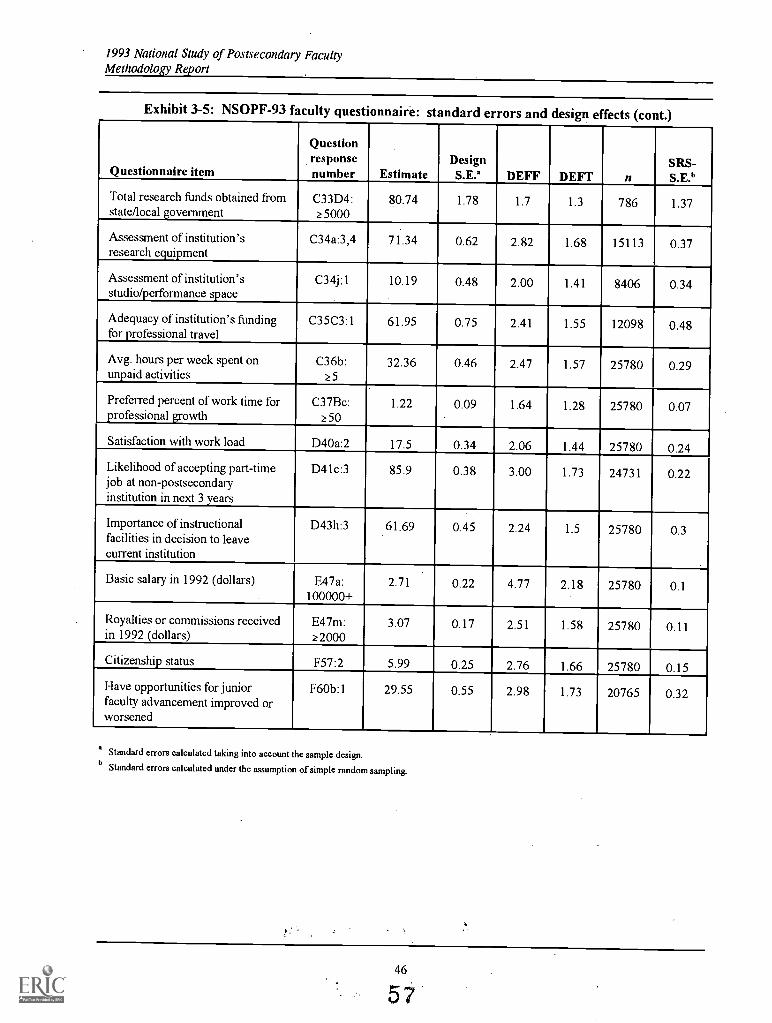
1993 National Study of Postsecondary FacultyMethodology Report
Exhibit 3-5: NSOPF-93 faculty questionnaire: standard errors and design effects (cont.)
Questionnaire item
Questionresponsenumber Estimate
DesignS.E.° DEFF DEFT n
SRS-s.E.b
Total research funds obtained fromstate/local government
C33D4:z 5000
80.74 1.78 1.7 1.3 786 1.37
Assessment of institution'sresearch equipment
C34a:3,4 71.34 0.62 2.82 1.68 15113 0.37
Assessment of institution'sstudio/performance space
C34j :1 10.19 0.48 2.00 1.41 8406 0.34
Adequacy of institution's fundingfor professional travel
C35C3:1 61.95 0.75 2.41 1.55 12098 0.48
Avg. hours per week spent onunpaid activities
C36b:z 5
32.36 0.46 2.47 1.57 25780 0.29
Preferred percent of work time forprofessional growth
C37Bc:z 50
1.22 0.09 1.64 1.28 25780 0.07
Satisfaction with work load D40a:2 17.5 0.34 2.06 1.44 25780 0.24
Likelihood of accepting part-timejob at non-postsecondaryinstitution in next 3 years
D41c:3 85.9 0.38 3.00 1.73 24731 0.22
Importance of instructionalfacilities in decision to leavecurrent institution
D43h:3 61.69 0.45 2.24 1.5 25780 0.3
Basic salary in 1992 (dollars) E47a:100000+
2.71 0.22 4.77 2.18 25780 0.1
Royalties or commissions receivedin 1992 (dollars)
E47m:z 2000
3.07 0.17 2.51 1.58 25780 0.11
Citizenship status F57:2 5.99 0.25 2.76 1.66 25780 0.15
Have opportunities for juniorfaculty advancement improved orworsened
F60b:1 29.55 0.55 2.98 1.73 20765 0.32
° Standard errors calculated taking into account the sample design.b
Standard errors calculated under the assumption of simple random sampling.
46
57
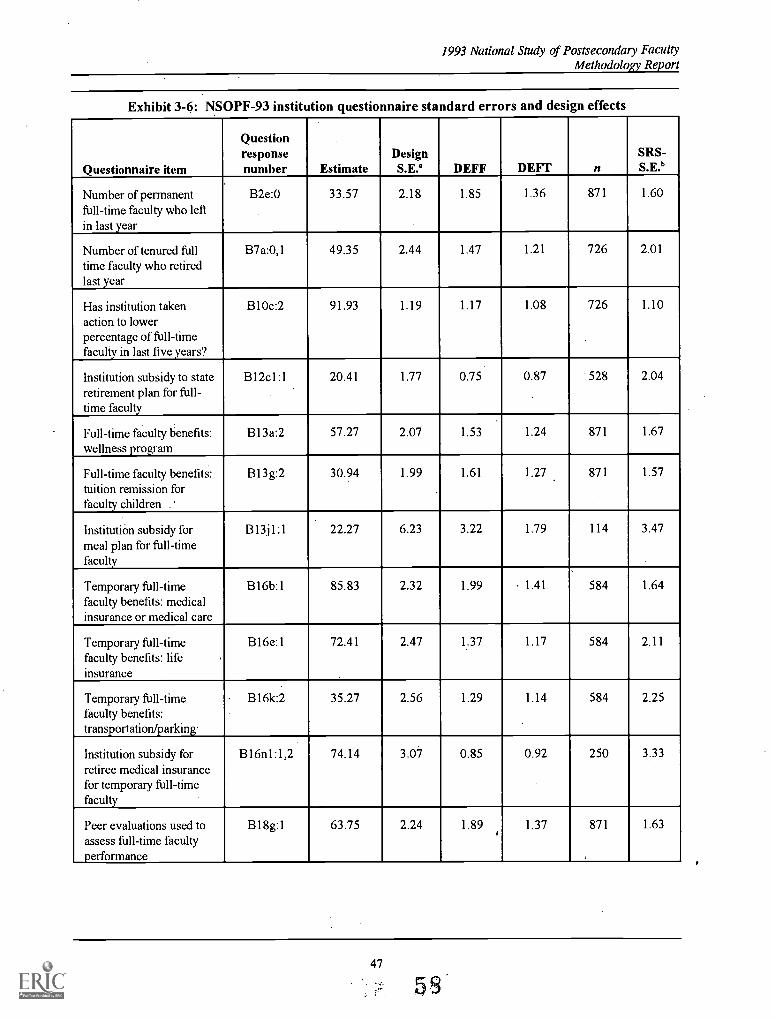
1993 National Study of Postsecondary FacultyMethodology Report
Exhibit 3-6: NSOPF-93 institution questionnaire standard errors and design effects
Questionnaire item
Questionresponsenumber Estimate
DesignS.E.° DEFF DEFT n
SRS-S.E.°
Number of permanentfull-time faculty who leftin last year
B2e:0 33.57 2.18 1.85 1.36 871 1.60
Number of tenured fulltime faculty who retiredlast year
B7a:0,1 49.35 2.44 1.47 1.21 726 2.01
Has institution takenaction to lowerpercentage of full-timefaculty in last five years?
BlOc:2 91.93 1.19 1.17 1.08 726 1.10
Institution subsidy to stateretirement plan for full-time faculty
B12c1:1 20.41 1.77 0.75 0.87 528 2.04
Full-time faculty benefits:wellness program
B13a:2 57.27 2.07 1.53 1.24 871 1.67
Full-time faculty benefits:tuition remission forfaculty children .
B13g:2 30.94 1.99 1.61 1.27 871 1.57
Institution subsidy formeal plan for full-timefaculty
B13j1:1 22.27 6.23 3.22 1.79 114 3.47
Temporary full-timefaculty benefits: medicalinsurance or medical care
B16b:1 85.83 2.32 1.99 1.41 584 1.64
Temporary full-timefaculty benefits: lifeinsurance
B16e:1 72.41 2.47 1.37 1.17 584 2.11
Temporary ftill-timefaculty benefits:transportation/parking.
B16k:2 35.27 2.56 1.29 1.14 584 2.25
Institution subsidy forretiree medical insurancefor temporary full-timefaculty
B16n1:1,2 74.14 3.07 0.85 0.92 250 3.33
Peer evaluations used toassess full-time facultyperformance
Bl8g:1 63.75 2.24 1.89 1.37 871 1.63
47
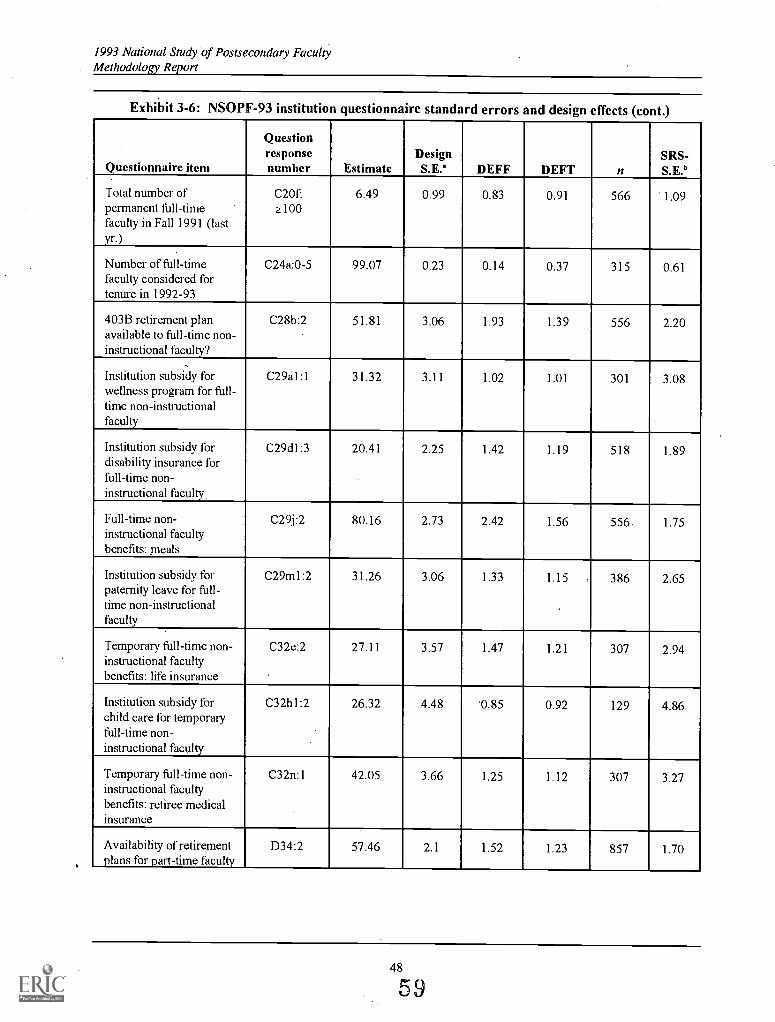
1993 National Study of Postsecondary FacultyMethodology Report
Exhibit 3-6: NSOPF-93 institution questionnaire standard errors and design effects (cont.)
Questionnaire item
Questionresponsenumber Estimate
DesignS.E. ' DEFF DEFT n
SRS-S.E.°
Total number ofpermanent full-timefaculty in Fall 1991 (lastyr.)
C20f:z 100
6.49 0.99 0.83 0.91 566 1.09
Number of full-timefaculty considered fortenure in 1992-93
C24a:0-5 99.07 0.23 0.14 0.37 315 0.61
403B retirement planavailable to full-time non-instructional faculty?
C28b:2 51.81 3.06 1.93 1.39 556 2.20
Institution subsidy forwellness program for full-time non-instructionalfaculty
C29a1:1 31.32 3.11 1.02 1.01 301 3.08
Institution subsidy fordisability insurance forfull-time non-instructional faculty
C29d1:3 20.41 2.25 1.42 1.19 518 1.89
Full-time non-instructional facultybenefits: meals
C29j:2 80.16 2.73 2.42 1.56 556 1.75
Institution subsidy forpaternity leave for full-time non-instructionalfaculty
C29m1:2 31.26 3.06 1.33 1.15
,
386 2.65
Temporary full-time non-instructional facultybenefits: life insurance
C32e:2 27.11 3.57 1.47 1.21 307 2.94
Institution subsidy forchild care for temporaryfull-time non-instructional faculty
C32h1:2 26.32 4.48 0.85 0.92 129 4.86
Temporary full-time non-instructional facultybenefits: retiree medicalinsurance
C32n:1 42.05 3.66 1.25 1.12 307 3.27
Availability of retirementplans for part-time faculty
D34:2 57.46 2.1 1.52 1.23 857 1.70
48
59
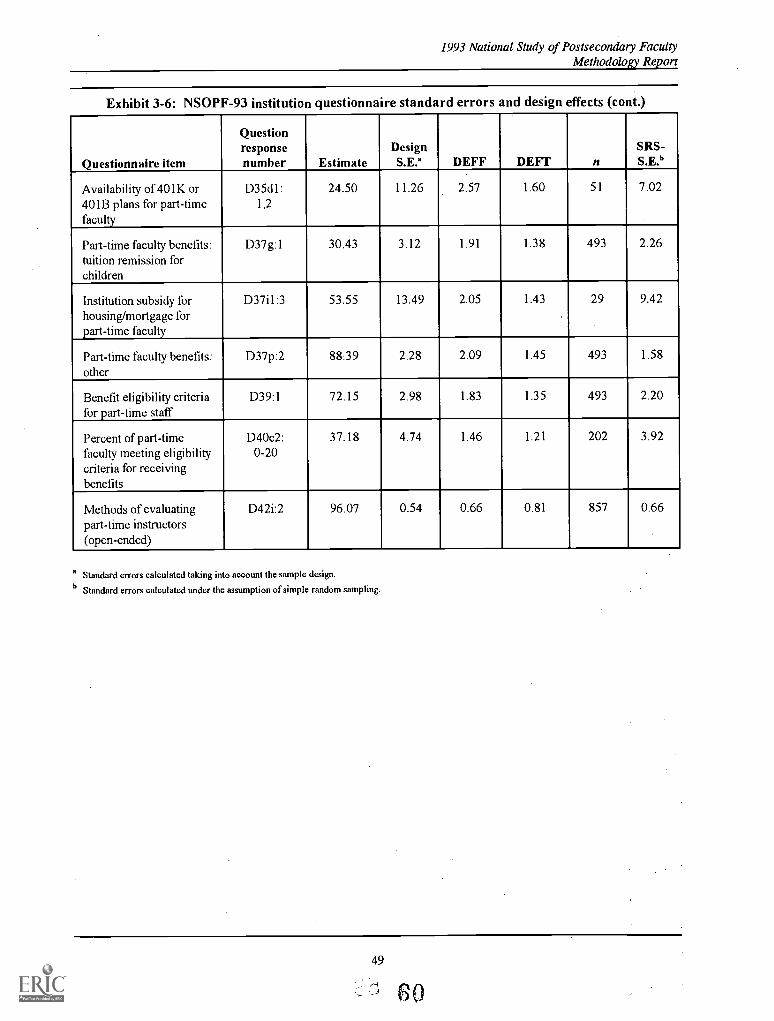
1993 National Study of Postsecondary FacultyMethodology Report
Exhibit 3-6: NSOPF-93 institution questionnaire standard errors and design effects (cont.)
Questionnaire item
Questionresponsenumber Estimate
DesignS.E.° DEFF DEFT n
SRS-S.E.°
Availability of 401K or401B plans for part-timefaculty
D35d1:1,2
24.50 11.26 2.57 1.60 51 7.02
Part-time faculty benefits:tuition remission forchildren
D37g:1 30.43 3.12 1.91 1.38 493 2.26
Institution subsidy forhousing/mortgage forpart-time faculty
D37i1:3 53.55 13.49 2.05 1.43 29 9.42
Part-time faculty benefits:other
D37p:2 88.39 2.28 2.09 1.45 493 1.58
Benefit eligibility criteriafor part-time staff
D39:1 72.15 2.98 1.83 1.35 493 2.20
Percent of part-timefaculty meeting eligibilitycriteria for receivingbenefits
D40c2:0-20
37.18 4.74 1.46 1.21 202 3.92
Methods of evaluatingpart-time instructors(open-ended)
D42i:2 96.07 0.54 0.66 0.81 857 0.66
° Standard errors calculated taking into account the sample design.
Standard errors calculated under the assumption of simple random sampling.
49
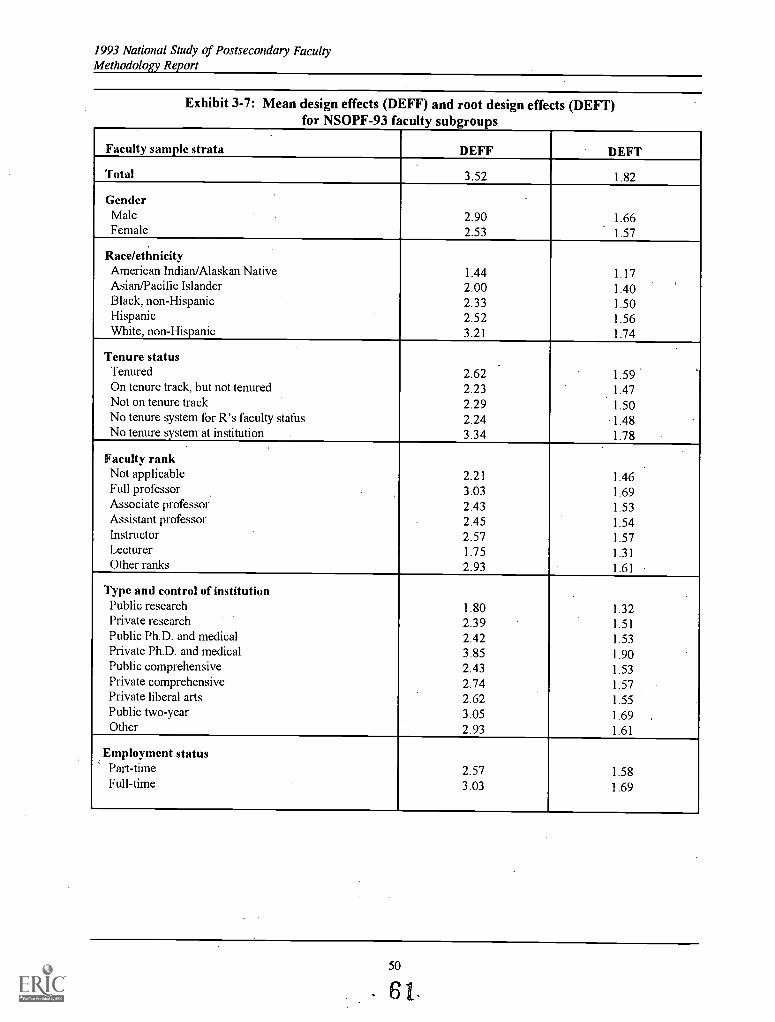
1993 National Study of Postsecondary FacultyMethodology Report
Exhibit 3-7: Mean design effects (DEFF) and root design effects (DEFT)for NSOPF-93 faculty sub rou s
Faculty sample strata DEFF DEFT
Total 3.52 1.82
GenderMale 2.90 1.66Female 2.53 1.57
Race/ethnicityAmerican Indian/Alaskan Native 1.44 1.17Asian/Pacific Islander 2.00 1.40Black, non-Hispanic 2.33 1.50Hispanic 2.52 1.56White, non-Hispanic 3.21 1.74
Tenure statusTenured 2.62 1.59
.
On tenure track, but not tenured 2.23 1.47Not on tenure track 2.29 1.50No tenure system for R's faculty stalls 2.24 1.48No tenure system at institution . 3.34 1.78
Faculty rankNot applicable 2.21 1.46Full professor 3.03 1.69Associate professor 2.43 1.53Assistant professor 2.45 1.54Instructor 2.57 1.57Lecturer 1.75 1.31Other ranks 2.93 1.61
Type and control of institutionPublic research 1.80 1.32Private research 2.39 1.51Public Ph.D. and medical 2.42 1.53Private Ph.D. and medical 3.85 1.90Public comprehensive 2.43 1.53Private comprehensive 2.74 1.57Private liberal arts 2.62 1.55Public two-year 3.05 1.69Other 2.93 1.61
Employment status' Part-time 2.57 1.58
Full-time 3.03 1.69
50
- 61-
1993 National Study of Postsecondary FacultyMethodology Report
3.15 Calculating Estimates for Institutions Selected with Certainty
All 168 institutions in the certainty stratum were selected into the institution sample. One hundred and fifty-two (152) of them returned faculty sampling lists and 144 of them responded to the institution questionnaire.Thus, aside from a small nonresponse variance, the variability associated with this stratum in the institutionquestionnaire dataset is essentially zero.
Analysts should take note of two cautions about calculating estimates of sampling variability from theNSOPF-93 institution questionnaire dataset. First, if a comparison is to be made between the class ofinstitutions in the certainty stratum and other classes of institutions, then (as an approximation) either thevariance of the estimator for the certainty stratum should be set equal to zero, or a without-replacement typevariance formula should be used for the certainty stratum with an appropriate fmite population correctionfactor to account for random nonresponse variance. The former recommendation is equivalent to setting thevariance of the estimated difference equal to the variance of the estimator for the noncertainty class.
Second, if analysis calls for certainty and noncertainty institutions to be combined, then appropriate standarderrors should be calculated. For example, in most tables in NSOPF-93 analytical reports, noncertaintyinstitutions are divided into seven (out of nine) modified Carnegie strata, and institutions selected withcertainty are divided into three strata: "Public research," "Private research," and "Public doctoral."' Thetwo research strata include only certainty institutions, and thus any estimators of variance for these stratashould follow the recommendations presented above. Standard errors must be calculated for estimators forthe public doctoral stratum, however, because it includes both certainty and noncertainty institutions (i.e.medical schools).
Even in the case of the 14 noncertainty strata, many of the sampling fractions are important. Thus, a without-replacement type variance formulaincorporating appropriate finite population correction factorsshouldbe used for these strata also.
3.16 Using Replicate Weights with the NSOPF-93 Datasets
Both the NSOPF-93 institution and faculty datasets include 32 replicate weights for variance estimation.These weights implement the balanced half-sample (BHS) method of variance estimation.' Two widelyavailable software packages, WesVarPC®,' and PC CARP," have capabilities to use replicate weights toestimate variances.
Analysts who use either the faculty file or the institution file should be cautious about cross-classifying dataso deeply that the resulting estimates are based upon a very small number of observations. Analysts shouldinterpret the accuracy of NSOPF-93 statistics in light of estimated standard errors and in light of the number
'In the institution stratum variable used in most NSOPF-93 analytical reports, the stratum labeled "Publicdoctoral" is not equivalent to the set of "Public, other Ph.D." institutions which form part of the certainty stratum in thesampling variable, since the "Public doctoral" stratum includes medical institutions.
"For a discussion of the balanced half-sample (BHS) method of variance estimation, see Wolter, Kirk M.,Introduction to Variance Estimation (New York: Springer-Verlag, 1985), pp. 110-152.
"Westat, Inc., A User's Guide to WesVarPC®, Version 2.0 (Rockville, Md.: Westat, Inc., 1996).
'Tuner, Wayne C., et al, PC CARP IV. (Ames, Iowa: Statistical Laboratory, Iowa State University, 1986).
51
'62
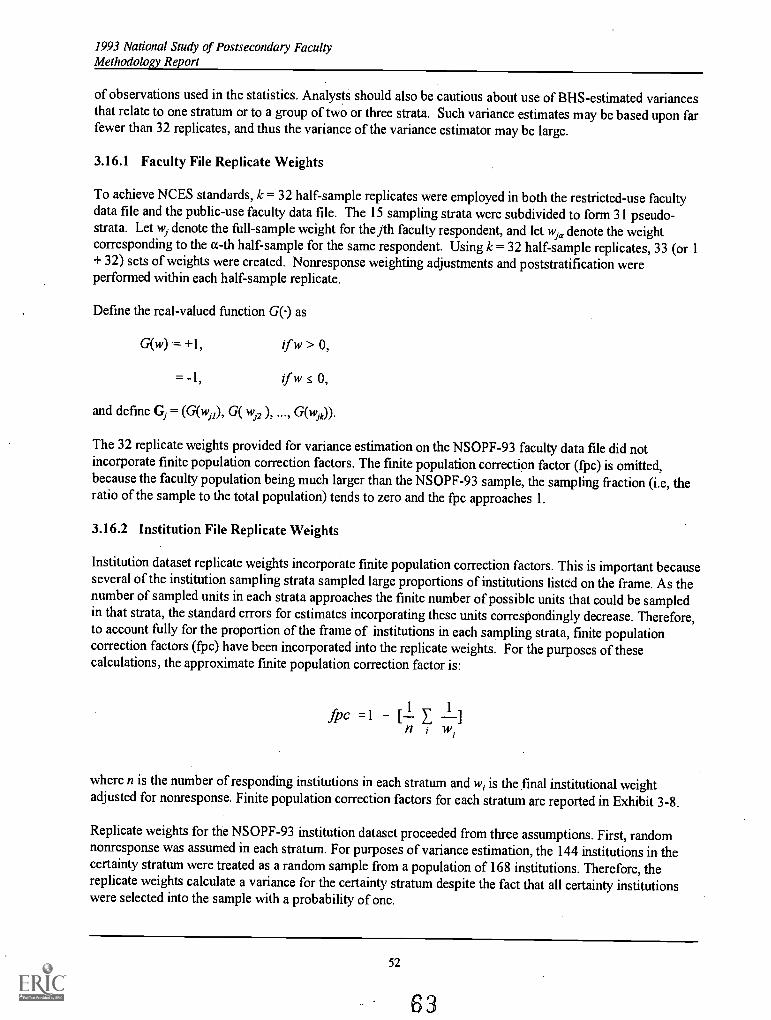
1993 National Study of Postsecondary FacultyMethodology Report
of observations used in the statistics. Analysts should also be cautious aboutuse of BHS-estimated variancesthat relate to one stratum or to a group of two or three strata. Such variance estimates may be based upon farfewer than 32 replicates, and thus the variance of the variance estimator may be large.
3.16.1 Faculty File Replicate Weights
To achieve NCES standards, k = 32 half-sample replicates were employed in both the restricted-use facultydata file and the public-use faculty data file. The 15 sampling strata were subdivided to form 31 pseudo-strata. Let w. denote the full-sample weight for the jth faculty respondent, and let w/o. denote the weightcorresponding to the cc-th half-sample for the same respondent. Using k = 32 half-sample replicates, 33 (or 1+ 32) sets of weights were created. Nonresponse weighting adjustments and poststratificationwereperformed within each half-sample replicate.
Define the real-valued function GO as
G(w) = +1, If w > 0,
= -1, if w s 0,
and define G., = (G(vii), G( W./2 )) G(wJk)).
The 32 replicate weights provided for variance estimation on the NSOPF-93 faculty data file did notincorporate finite population correction factors. The finite population correction factor (fpc) is omitted,because the faculty population being much larger than the NSOPF-93 sample, the sampling fraction (i.e, theratio of the sample to the total population) tends to zero and the fpc approaches 1.
3.16.2 Institution File Replicate Weights
Institution dataset replicate weights incorporate finite population correction factors. This is important becauseseveral of the institution sampling strata sampled large proportions of institutions listed on the frame. As thenumber of sampled units in each strata approaches the finite number of possible units that could be sampledin that strata, the standard errors for estimates incorporating these units correspondingly decrease. Therefore,to account fully for the proportion of the frame of institutions in each sampling strata, finite populationcorrection factors (fpc) have been incorporated into the replicate weights. For the purposes of thesecalculations, the approximate finite population correction factor is:
fpc =1 [-1 E 1n w1
where n is the number of responding, institutions in each stratum and w, is the final institutional weightadjusted for nonresponse. Finite population correction factors for each stratum are reported in Exhibit 3-8.
Replicate weights for the NSOPF-93 institution dataset proceeded from three assumptions. First, randomnonresponse was assumed in each stratum. For purposes of variance estimation, the 144 institutions in thecertainty stratum were treated as a random sample from a population of 168 institutions. Therefore, thereplicate weights calculate a variance for the certainty stratum despite the fact that all certainty institutionswere selected into the sample with a probability of one.
52
63
1993 National Study of Postsecondary FacultyMethodology Report
Second, all replicate weights incorporate finite population correction factors for each stratum reported inExhibit 3-8. This approach reflects the "near-certainty" (144 out of 168 institutions) status of the certaintystratum in the NSOPF-93 institution survey. It also includes the important fpc in stratum 1 ("Private, OtherPh.D.") and other noncertainty strata. Standard errors calculated using these replicate weights are smallerthan standard errors calculated by other means, such as Taylor series standard errors presented in NCES'sreport, Institutional Policies and Practices Regarding Faculty in Higher Education [NCES 97-080].
To incorporate finite population corrections in variance calculations, a half-sample estimator was used:
fa, = E (fie, Y.
where the U-weights are defined by
(a = 1, k)
= (w. w)
is the approximate finite population correction factor for the stratum in which institution i was sampled,and the summation is over all respondents in the full sample. The U-weight can be rewritten as
Uhr = Wi(1 F), for institutions not in the a-th half sample
141, ( 1 + ), for institutions in the a-th half sample.
Thus, the final replicate weights, i.e., the U-weights, are larger than the full-sample weights for institutions inthe half sample and smaller for institutions not in the half sample.
The standard BHS (balanced half-sample) formula for variance calculations applies here, namely
v(Y) = E k)2 ,
and Y is equal to the mean of the across the k half samples. For NSOPF, k = 32 for both theinstitution and the faculty files.
Third, to produce the NCES-required 32 replicate weights, institutions in each pseudo-stratum were separatedinto two random groups and specified 32 balanced half samples. Replicate weights for each half sample and aset of weights for the full sample were then calculated. Nonresponse weighting was performed independently
within each half-sample.
53
64
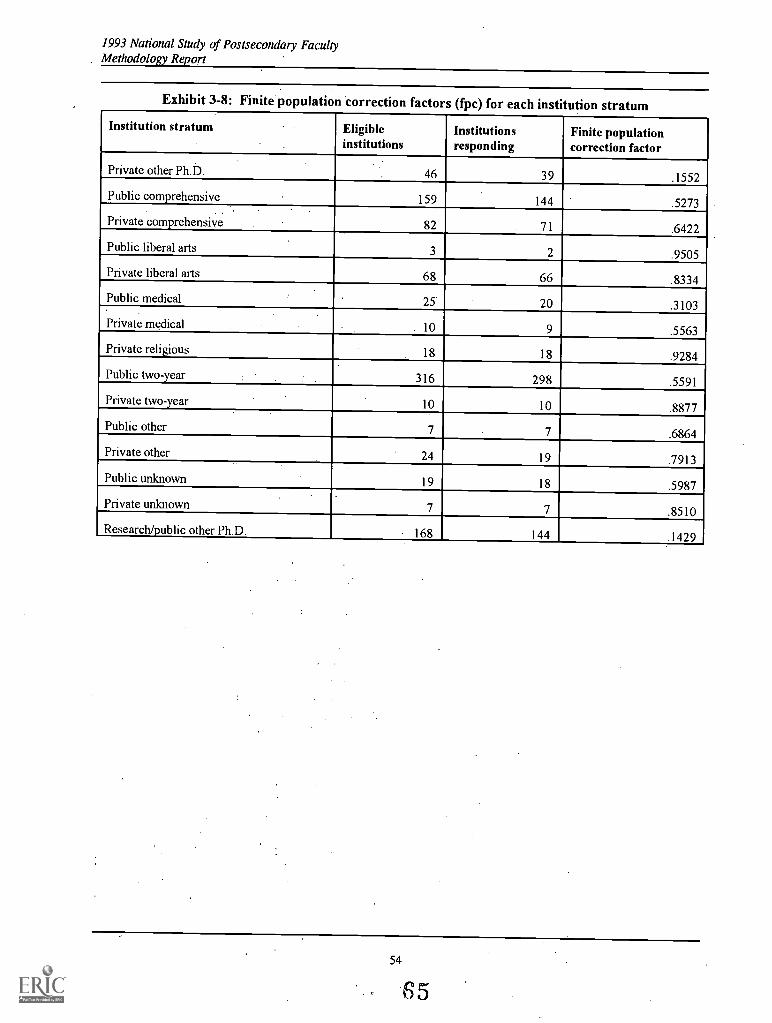
1993 National Study of Postsecondary FacultyMethodology Report
Exhibit 3-8: Finite population correction factors (fpc) for each institution stratum
Institution stratum Eligibleinstitutions
Institutionsresponding
Finite populationcorrection factor
Private other Ph.D. 46 39 .1552
Public comprehensive 159 144 .5273
Private comprehensive 82 71 .6422
Public liberal arts 3 2 .9505
Private liberal arts 68 66 .8334
Public medical 25 20 .3103
Private medical 10 9 .5563
Private religious 18 18 .9284
Public two-year . 316 298 .5591
Private two-year 10 10 .8877
Public other 7 7 .6864
Private other 24 19 .7913
Public unknown 19 18 .5987
Private unknown 7 7 .8510
Research/public other Ph.D. 168 144 .1429
54
65
1993 National Study of Postsecondary FacultyMethodology Report
4. Institutional Recruitment: Procedures and Results
NSOPF-93 differed in a number of significant ways from NSOPF-88. This chapter reviews procedures used
for recruiting sampled institutions and collecting faculty lists and related information used for sampling and
data collection. Sampling procedures were discussed in Chapter 3. Key changes to the sample frame are
outlined below.
Institution sample size was increased, from 480 in 1988, to a final sample of 974 institutions
in 1993. The larger sample allowed for more detailed comparisons both at the faculty and
institutional levels. The faculty sample was also augmented to provide data about faculty in
key disciplines.
The criteria for defining faculty were broadened to include non-instructional faculty.Institutions were given a complete set of instructions for preparing the list, including detailed
criteria for determining who should be included and excluded from the list. (See Appendix K
for list preparation instructions sent to institutions.)
Representation of certain subgroups of faculty in the sample (full-time females; faculty in
NEH-specified disciplines; black, non-Hispanics; Asian/Pacific Islanders; and Hispanics)
was increased by oversampling. This required institutions to provide race and gender
information not requested in 1988.
Due to institutional downsizing and increased research demands on institutions, participation
in NSOPF and other large-scale surveys was problematic for some institutions (see section
4.3). Institutions are taking longer to comply with research requests, and are far more likely
to refuse-participation than in years past. Hence, the initial sample of 789 was supplemented
by a pool of 185 institutions that were selected to replace non-participating institutions, and
to augment the sample by ensuring adequate representation of institutions across strata. At
the same time, extensive follow-up and refusal conversion campaigns were conducted with
the original sample, as well as with the supplemental sample.
Based on the results of the 1992 field test, the following procedures were implemented in the full-scale study:
The 1992 field test results clearly demonstrated that institutions that provided the home
addresses of faculty had a higher completion rate than those that did not. A majority ofinstitutions were willing to release these data when given assurance that the data would
remain confidential. Therefore, institutions were asked to provide home addresses, if
possible, while recognizing that some institutions have institutional policies prohibiting the
release of this information. Home addresses were used to mail questionnaires and to follow-
up with nonrespondents to the faculty survey.
Institutional Coordinatorsthe institution staff who agreed to provide the sample lists and
work with NORC to implement the surveywere enlisted to prompt nonresponding faculty
for the return of their questionnaires. The role of coordinators was crucial given the
necessity of extending the field period into the summer of 1993, particularly since manyinstitutions were unable to provide home telephone numbers. The names of sampled faculty
were released only to those coordinators who signed the NCES Affidavit of Nondisclosureand had it notarized. Under penalty of fines and imprisonment, the affidavit affirms that the
signatory will maintain the confidentiality of any information released which identifies
55
66
1993 National Study of Postsecondary FacultyMethodology Report
individual respondents. Again, the field test demonstrated that two-thirds of the InstitutionalCoordinators were willing to sign the affidavit, enabling them to prompt faculty.
To facilitate processing and quality control of the lists, both hardcopy and machine-readable(tape or floppy diskette) versions of the list were requested. To standardize list formats asmuch as possible, the institution was given detailed specifications for producing machine-readable faculty lists.
Employee ID numbers were requested from the institution to facilitate quality control of thelists (e.g., checking for duplicate faculty entries) and locating efforts. Again, institutions withprovisions against the release of such data were assured they could omit it.
Other forms and informational materials were provided to assist institutions in preparinglists in a workable, easy-to-read format. These included instructions for formatting themachine-readable versions of the lists, and forms to document the format of the lists and toprovide the names, titles, and telephone numbers of individuals involved in preparing thelists. The number of documents in the packet was reduced from eight in the field test, to sixin the full-scale study to streamline the process of compliance for the institution.
Supplementary information was requested in order to help the list processing staff interpretthe lists and, if necessary, institution staff were recontacted for clarification of discrepancies.Course catalogs and faculty directories were also requested. The course catalog wasrequested separately, from the Director of Admissions, to minimize burden to theInstitutional Coordinator.
4.1 OMB Cleaiance and Mail Procedures
The U.S. Department of Education Information Management Compliance Division/Office of Managementand Budget (OMB) list collection clearance package for the full scale study was submitted to OMB onSeptember 4, 1992, with a request for expedited review. On September 14, 1992, an amendment to the listcollection OMB package was submitted, providing an analysis of the discrepancies in field test facultycounts. A second amendment described the sampling requirements for the study and the NEH and NSFsample augmentation. OMB clearance of the list collection process was given on October 5, 1992.
The initial mailing to sampled institutions was conducted on October 7, 1992. The mailing was directed tothe institution's Chief Administrative Officer (CAO). In this first mailing, the CAO was asked to designatetwo individuals: an Institutional Coordinator to act as a liaison to the project and to assume responsibility forpreparing the faculty list; and an institution respondent, who'would be responsible for completing theinstitution questionnaire. Copies of all institutional contacting materials appear in Appendix K.
The initial mailing contained the following materials:
Cover letter. The cover letter was printed on NCES letterhead and signed by Emerson J. Elliott,then Commissioner of NCES. It explained the purpose of the study, detailed NCES' confidentialitylaws and protections, requested the CAO's participation, and provided an estimate of institutionalburden. It asked the CAO to return the enclosed confirmation form within five days. It alsoencouraged the CAO to call the Project Director at'a toll-free number with any questions or concernsabout the study.
56
1993 National Study of Postsecondary FacultyMethodology Report
Confirmation form. The three-ply confirmation form asked the CAO to provide the name, title,institutional address, and telephone number of the administrative officials designated as theInstitutional Coordinator and as the institution respondent. The form noted that the same personcould be designated to perform both roles. Fewer than one-half (44.2 percent) of the InstitutionalCoordinators in the full-scale study were also named as institution respondents. The InstitutionalCoordinator was often an academic officer, provost, dean, institutional researcher, personnelmanager, or budget officer.
NSOPF-93 informational brochure. The brochure explained the purpose and content of the studyand listed key findings from the 1988 study.
Institution folder. This was to be forwarded by the CAO to the individual designated as theInstitutional Coordinator. It contained a cover letter to the Institutional Coordinator, similar incontent to the letter directed to the CAO (the major difference was that the letter presumed that theCAO had agreed to participate in the study). The folder also contained instructions for preparing thefaculty list. These included concise definitions of personnel to be included in and excluded from thelists. Unlike the 1988 study, which required institutions to screen out faculty with no instructionalresponsibilities, NSOPF-93 requested a list of all faculty and other instructional personnel for theacademic term including October 15, 1992. The following information was requested for eachfaculty member on the list: full name, department/program (or equivalent), teaching discipline,campus mailing address and telephone number, employment status (full- orpart-time), anddemographic and stratification variables (race/ethnicity, gender). To facilitate contacting andlocating activities, home addresses, telephone numbers, and employee IDs were also requested, inaddition to an up-to-date faculty directory. A deadline of October 30, 1992 was given for return ofthe faculty list.
The packet to the Institutional Coordinator also included a checklist to be used by the CAO or InstitutionalCoordinator to ensure that all of the information, documents, and forms requested were included in the returnenvelope. Finally, the folder contained two prepaid business reply envelopes for the return of theconfirmation form, faculty list, and supplementary materials, and an NCES Affidavit of Nondisclosure, whichthe Institutional Coordinator was instructed to sign and have notarized, affirming that he or she would notdivulge the names and identifying information of faculty respondents released to him or her.
The contractor's fax number was provided on the cover letter and all other materials directed to the CAO andcoordinator in order to allow institutions to expedite the return of certain materials. Because fax legibilityvaries, institutions who faxed materials were also encouraged to mail the original hardcopy.
A toll-free NSOPF-93 telephone number was prominently displayed on all forms and informational materialsto ensure that institution staff had timely access to project staff to answer questions and resolve problemsencountered in preparing the lists. Incoming calls were handled by the project's Task Coordinator, andforwarded to the Project Director when necessary. During the list collection process, 679 calls were received.Questions were asked about the instructions and problems encountered in preparing the lists, including staffshortages, scheduling problems, and difficulties in providing all the requested faculty information.
4.1.1 Initial Mailout and Remailings
All 789 initial recruitment packets were sent via first-class mail on October 7, 1992. None of the listcollection packages were returned as undeliverable; however, 465 of the 974 institutions (48 percent) in thetotal sample requested a remail of the initial packet of CAO materials. In some instances, remails were
57
68
1993 National Study of Postsecondary FacultyMethodology Report
requested because of a change in CAO or a minor address correction; for the most part, however, the remailswere necessary because the mail intended for the CAO was frequently routed to other institution staff and,therefore, never received by the CAO. To minimize further delays, all remails were sent by two-day prioritymail, and directed whenever possible to the Institutional Coordinator (if identifiedat the time of the remailrequest) or to the attention of a gatekeeper or other institutional contact.
Concurrently with the mailouts to the CAO, postcards requesting course catalogs were mailed to the Office ofAdmissions at each institution. In a small number of instances, institutions requested payment for mailing acourse catalog. Whenever it was requested, a payment (generally less than $5) was mailed to theseinstitutions. Information on the number of institutions submitting catalogs is found in section 4.4.
4.1.2 Mail Follow-up Procedures
About two weeks after the initial mail-out, a follow-up postcard was sent to all CAOs, thanking them fortheir cooperation if they had already returned the Confirmation Form, or if they had not returned the form,urging them to fax or mail the form by the deadline. Once again, they were encouraged to call the NSOPF-93toll-free number with any questions or concerns.
On January 4, 1993, a follow-up packet was sent via two-day priority mail to the CAOs of approximately250 nonresponding institutions, containing a letter signed by the Project Director reiterating the importance ofthe study, and an additional Confirmation Form. It asked once again that the CAO return the ConfirmationForm, and call the Project Director at the toll-free number with any questions or concerns.
4.1.3 Mailouts to Supplemental Sample
Twenty-six institutions were finalized as refusals and replaced in the sample prior to March 1, 1993. Aninitial mailout to seven replacement institutions was done on December 1, 1992 and 19 replacementinstitutions were mailed packets on January 22, 1993. On March 9, 1993, 159 additional institutions wereselected to ensure an adequate sample of institutions across strata, given an anticipated non-participation rateof up to 20 percent. An initial mailing to these institutions was conducted on March 10, 1993. All mailoutsto supplemental institutions were sent by two-day priority mail. Telephone follow-up for supplementalinstitutions took place one week after the initial mailing to speed response time.
4.2 Telephone Follow-up Procedures
Telephone follow-up was coordinated with mail follow-up to minimize unnecessary calls to the CAOs andcoordinators. The starting date for telephone follow-up was November 9, 1992, approximately one weekafter the follow-up postcards to the CAO were mailed. Full-scale telephone follow-up continued throughJune 1, 1993, at which time the follow-up effort focused on institutions in under-represented strata.Telephone follow-up efforts concluded on June 25, 1993.
4.2.1 Selection and Training of Prompters
Prompters were selected for the CAO prompting effort on the basis of their telephone skills and ability towork with a professional population. A training manual was developed by project staff that contained anoverview of the project, and scripts for communicating with CAOs, coordinators, gatekeepers, and otherinstitutional staff. A five-hour training was conducted on November 9, 1992.
58
..E9
1993 National Study of Postsecondary FacultyMethodology Report
4.2.2 Initial Telephone Contact and Follow-up
Telephone prompting of approximately 635 institutions commenced on November 8, 1992, two weeks afterthe prompting postcard had been mailed. The prompting effort concentrated on nonresponding institutions aswell as those who had agreed to participate but for whom a faculty list had not been received. The generalpurpose of this first telephone contact was to confirm receipt of the recruitment and list collection packet andto urge the institution's CAO to comply promptly with NCES' request. Prompters weretrained to do the
following:
Confirm receipt of the recruitment packet
Introduce the CAO to NSOPF-93 and to the contractor's role
Answer any questions about NSOPF-93, the confidentiality provisions, and related questionsabout the study
Obtain institutional cooperation and request the names of the Institutional Coordinator andinstitution respondent for the institution questionnaire
Avert potential refusals
Establish an expected date for the return of the Confirmation Form or complete the formover the telephone
Identify any institutional restrictions or problems that could hinder timely compliance withthe request for faculty lists
Remind institutional staff to follow the instructions for compiling the faculty lists andreviewing the checklist in completing the return envelope
Request the supplementary information (e.g., institution catalog or bulletin, staff directory)
Prompt the Institutional Coordinator for completion of the list of faculty (i.e., if the packethad been forwarded to him or her by the CAO)
If an institution had not yet received the recruitment packet, the prompter noted any necessary addresscorrections and submitted a request for remailing. Requests for remails were usually processed on the sameday they were received.
4.2.3 Additional Telephone Follow-up for Nonresponse
Follow-up of nonresponding institutions was resumed once the expected date for receipt of the institution'smaterials had passed. During this call, the telephone prompter once again prompted for the return ofmaterials (or offered to collect the Institutional Coordinator and institution respondent names over thetelephone), attempted to establish an anticipated date for receipt of the materials, and answered questions.Prompters were trained to identify and avert "hidden" refusals (i.e., CAOs who verbally agreed to complywith the request, but who in fact had no intention of doing so) and to document explicit refusals forconversion efforts.
59
70
1993 National Study of Postsecondary FacultyMethodology Report
4.2.4 Refusals and Problem Cases
Initial refusals were reviewed by the Task Coordinator, who called refusing institutions, forwarded them toanother supervisor, prompter, or senior staff, or in some instances, to the NCES Project Officer. The mostoften cited reasons for refusing to participate include multiple survey requests, fiscal constraints, anddecreases in staff. The overall conversion rate, if all nonresponding institutions are considered as finalrefusals, was 42 percent; 103 refusals were successfully converted for an overall participation rate of 85percent.
When necessary,. special arrangements were made with individual institutions to enlist their participation. Forexample, nine institutions agreed to participate only if the institution released faculty information by anidentifying number only, rather than releasing the names of sampled faculty. In these instances, theinstitution was responsible for mailing questionnaires and conducting follow-up with faculty.
4.2.5 Telephone Follow-up of List Discrepancies/Retrieval
Upon receipt, each list of faculty was reviewed for completeness and adequacy. Although almost 70 percentof the faculty lists were submitted in electronic form (see Exhibit 4-3), intensive effort was still required tocorrect problems in the electronic lists before they could be processed and sampled. The most prevalentproblems were lists that could not be read or were incorrectly formatted. Other serious obstacles to samplingwere lists that were missing key sampling data, appeared with incorrect information, or contained facultynames more than once. Programming staff were needed to create utilities to deal with the most frequentlyoccurring problems, and to assist in reading, evaluating, and de-duplicating machine-readable lists. Ifsampling or address information was missing from the lists, sampling staff consulted the course catalog, ifavailable, or any other material sent by the institution to attempt to retrieve the information before calling theinstitution. However, approximately 10 percent of the institutions had to be recontacted to resolve errors intheir faculty lists.
Once the faculty lists were processed, and prior to sampling, theywere reviewed to compare the faculty totalsfrom the list supplied by the institution with numbers of faculty from IPEDS data. The lists were initiallysubjected to a rigorous review; institutions whose list counts were discrepant by more than five percent werecalled and an attempt was made to reconcile the numbers. However, after 71 institutions were contacted, only15 percent of these calls were effective in reducing the difference between institution and IPEDS counts.Even then, discrepancies could not be resolved altogether. Due to the ineffectiveness of these calls, and theincrease in list processing time needed to wait for institutionpersonnel to resolve these problems, furtherreview was made more lenient. List counts were compared with IPEDS numbers and only very gross andobvious errors were resolved, such as full-time and part-time staff being lumped together as full-time, part-time staff being omitted completely, or full-time and part-timecounts being reversed. Sampling staffforwarded systematic discrepancies clearly requiring explanation or correction to telephone staff. Twoprompters were trained expressly to handle recontacting institution staff to retrieve missing information andresolve list discrepancies.
4.3 Revised Data Collection Plan
An overall institutional participation rate of 85 percent for list collection was achieved for NSOPF-93. Theoverall participation rate dropped from 89 percent in the NSOPF-93 field test (and 94 percent in the 1988NSOPF study). The recruitment effort required almost 34 weeks to completealmost 6 weeks longer than inthe field test. The longer field period can be partly accounted for by the interruption of winter breaknofollow-up was conducted for two weeks between December 23, 1992 and January 7, 1993. More significant,
60
71
1993 National Study of Postsecondary FacultyMethodology Report
however, was the continuation of a trend that was evident in the field test results: compared to 1988,
institutions were simply taking longer to prepare faculty lists, and were initially more resistant toparticipating in large-scale research projects. Prominent among the factors causing this were:
Survey saturation. A wide array of studies compete for the attention of already overburdenedinstitution staff. (This is particularly true of large institutions, which have a higher probability ofbeing selected into national samples.) Some institution personnel complained that they were being
asked to participate in "too many surveys." Others required assurance that NSOPF-93 did not
duplicate other studies, and did not burden faculty unnecessarily.
Fiscal constraints. NSOPF-93 went into the field at a time when many institutions wereexperiencing severe financial constraints and downsizing. As a result, a large proportion of theinstitutional representatives complained that, because of downsizing or other fiscal constraints, there
were no staff available to process theNSOPF request on time. They typically reported that they werealready overburdened with their own work and that external requests would not receive priority.
Uncertain faculty/administration relations. As a result of the fiscal constraints cited above, some
institutions had asked faculty to perform more worksometimes at less pay. Many of theseinstitutions had expressed concern that requesting faculty participation in a study at a time when
many faculty were overworked would strain relations between faculty and administration.Ameliorating this concern, particularly at larger institutions, was the fact thatNSOPF-93 only
sampled an average of 41.5 faculty at each institution.
Difficulties in compiling lists of part-time faculty. Despite increasing reliance on part-time facultyat many institutions, readily accessible files of part-time and temporary faculty and instructional staffdo not exist at many institutions. At some institutions, these faculty are listed only in personnel fileswhere they are not easily distinguishable from other kinds of institutional staff. Many institutionsrequired additional time to compile this data; others were simply unwilling or unable to commit staff
time and resources to this effort.
Additional information requested. As indicated earlier,NSOPF-93 requested more detailedinformation about each faculty member, including home telephone number and address, and
employee IDs along with a machine-readable version of the faculty list. This information provedvital to the success of the faculty component of the study. For institutions unable to provide suchinformation easily, however, these requests often slowed response time for providing a faculty list. In
addition, requests for identifying information, such as home addresses and employee IDs, sometimeshad to be cleared through legal departments, or occasionally, voted on by a faculty senate. Theseinstitutions were concerned not merely about applicable federal law, but also about a growingnumber of state and local regulations, as well as the individual institution's own policies and
agreements with faculty. Institutions were assured that lists would be accepted without data itemswhose release was prohibited by institutional policy; however, the decision-making process ateach
institution about whether to include such items sometimes considerably delayed receipt of the list.
To adjust for the slow rate of participation, a total supplemental sample of 185 institutions was drawn toreplace and supplement institutions whose characteristics were comparable to those ofnon-participating
institutions.
Telephone staff continued follow-up and refusal conversion activities with institutions in theoriginal sample,while, at the same time: recruiting institutions in the supplemental sample with the goal ofobtaining a
61
72
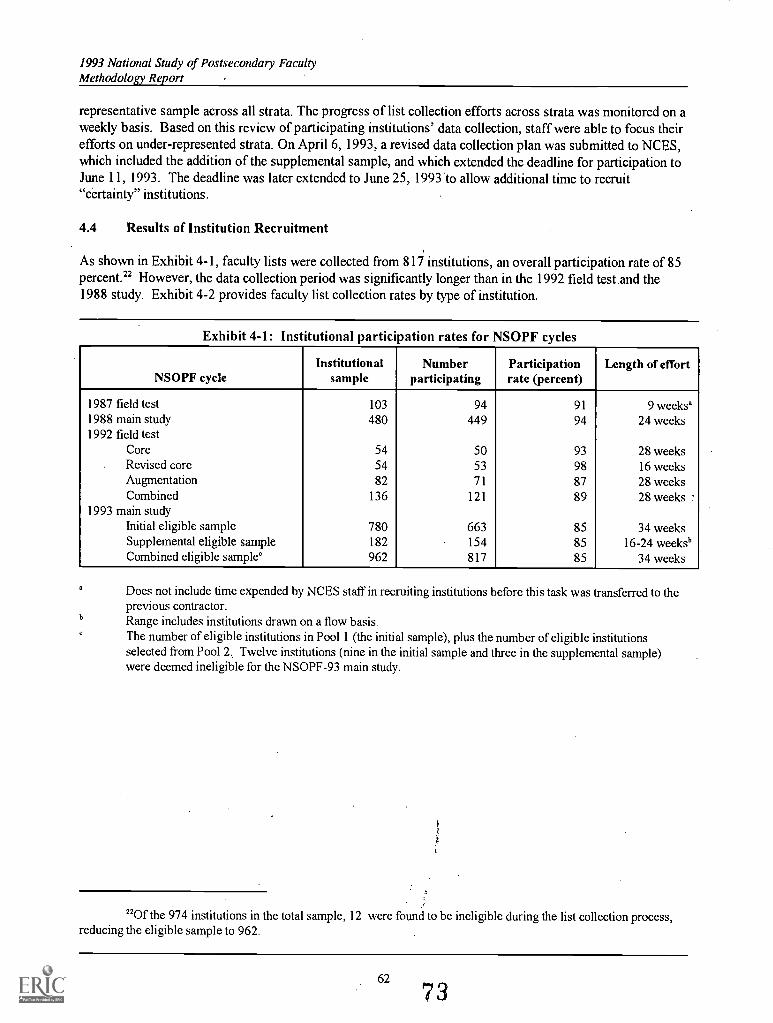
1993 National Study of Postsecondary FacultyMethodology Report
representative sample across all strata. The progress of list collection efforts across strata was monitored on aweekly basis. Based on this review of participating institutions' data collection, staff were able to focus theirefforts on under-represented strata. On April 6, 1993, a revised data collection plan was submitted to NCES,which included the addition of the supplemental sample, and which extended the deadline for participation toJune 11, 1993. The deadline was later extended to June 25, 1993 to allow additional time to recruit"certainty" institutions.
4.4 Results of Institution Recruitment
As shown in Exhibit 4-1, faculty lists were collected from 817 institutions, an overall participation rate of 85percent.' However, the data collection period was significantly longer than in the 1992 field test and the1988 study. Exhibit 4-2 provides faculty list collection rates by type of institution.
Exhibit 4-1: Institutional participation rates for NSOPF cycles
NSOPF cycleInstitutional
sampleNumber
participatingParticipationrate (percent)
Length of effort
1987 field test 103 94 91 9 weeks'1988 main study 480 449 94 24 weeks1992 field test
Core 54 50 93 28 weeksRevised core 54 53 98 16 weeksAugmentation 82 71 87 28 weeksCombined 136 121 89 28 weeks
1993 main studyInitial eligible sample 780 663 85 34 weeksSupplemental eligible sample 182 154 85 16-24 weeks'Combined eligible sample' 962 817 85 34 weeks
Does not include time expended by NCES staff in recruiting institutions before this task was transferred to theprevious contractor.Range includes institutions drawn on a flow basis.The number of eligible institutions in Pool 1 (the initial sample), plus the number of eligible institutionsselected from Pool 2. Twelve institutions (nine in the initial sample and three in the supplemental sample)were deemed ineligible for the NSOPF-93 main study.
220f the 974 institutions in the total sample, 12 were found to be ineligible during the list collection process,reducing the eligible sample to 962.
62
73
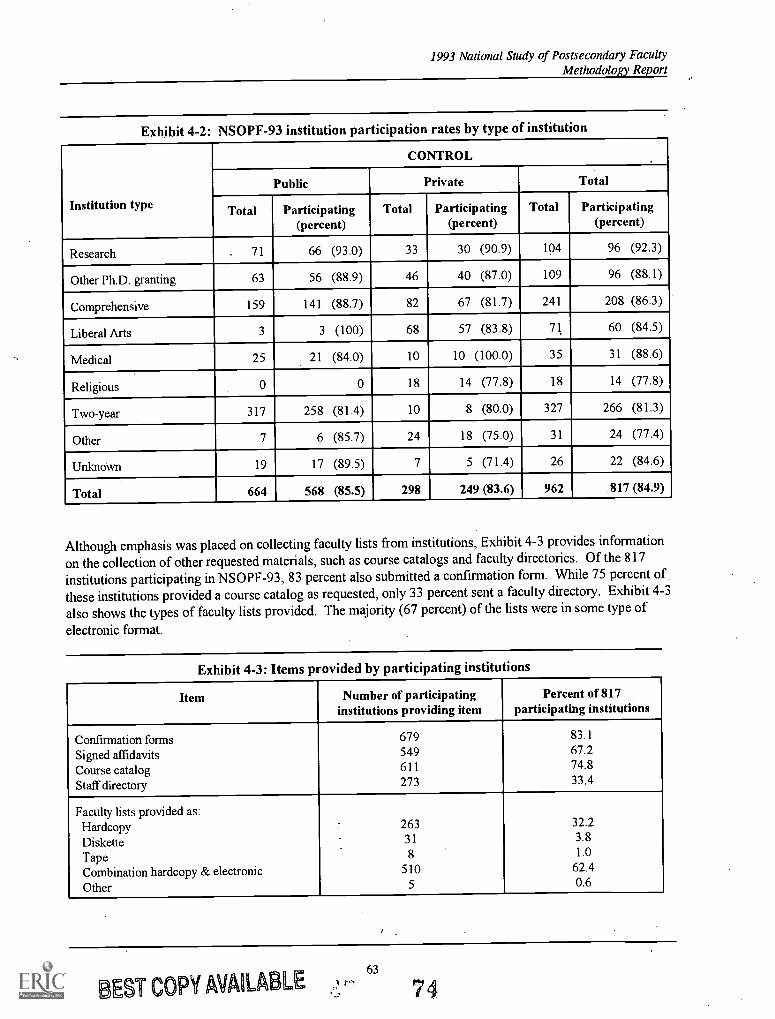
1993 National Study of Postsecondary FacultyMethodology Report
Exhibit 4-2: NSOPF-93 institution participation rates by type of institution
Institution type
CONTROL
Public Private Total
Total Participating(percent)
Total Participating(percent)
Total Participating(percent)
Research . 71 66 (93.0) 33 30 (90.9) 104 96 (92.3)
Other Ph.D. granting 63 56 (88.9) 46 40 (87.0) 109 96 (88.1)
Comprehensive 159 141 (88.7) 82 67 (81.7) 241 208 (86.3)
Liberal Arts 3 3 (100) 68 57 (83.8) 71 60 (84.5)
Medical 25 21 (84.0) 10 10 (100.0) 35 31 (88.6)
Religious 0 0 18 14 (77.8) 18 14 (77.8)
Two-year 317 258 (81.4) 10 8 (80.0) 327 266 (81.3)
Other 7 6 (85.7) 24 18 (75.0) 31 24 (77.4)
Unknown 19 17 (89.5) 7 5 (71.4) 26 22 (84.6)
Total 664 568 (85.5) 298 249 (83.6) 962 817 (84.9)
Although emphasis was placed on collecting faculty lists from institutions, Exhibit 4-3 provides information
on the collection of other requested materials, such as course catalogs and faculty directories. Of the 817institutions participating in NSOPF-93, 83 percent also submitted a confirmation form. While 75 percent of
these institutions provided a course catalog as requested, only 33 percent sent a faculty directory. Exhibit 4-3
also shows the types of faculty lists provided. The majority (67 percent) of the lists were in some type of
electronic format.
Exhibit 4-3: Items provided by participating institutions
Item Number of participatinginstitutions providing item
Percent of 817participating institutions
Confirmation forms 679 83.1
Signed affidavits 549 67.2
Course catalog 611 74.8
Staff directory 273 33.4
Faculty lists provided as:Hardcopy 263 32.2
Diskette 31 3.8
Tape 8 1.0
Combination hardcopy & electronic 510 62.4
Other 5 0.6
BEST COPY AVAILABLE 74
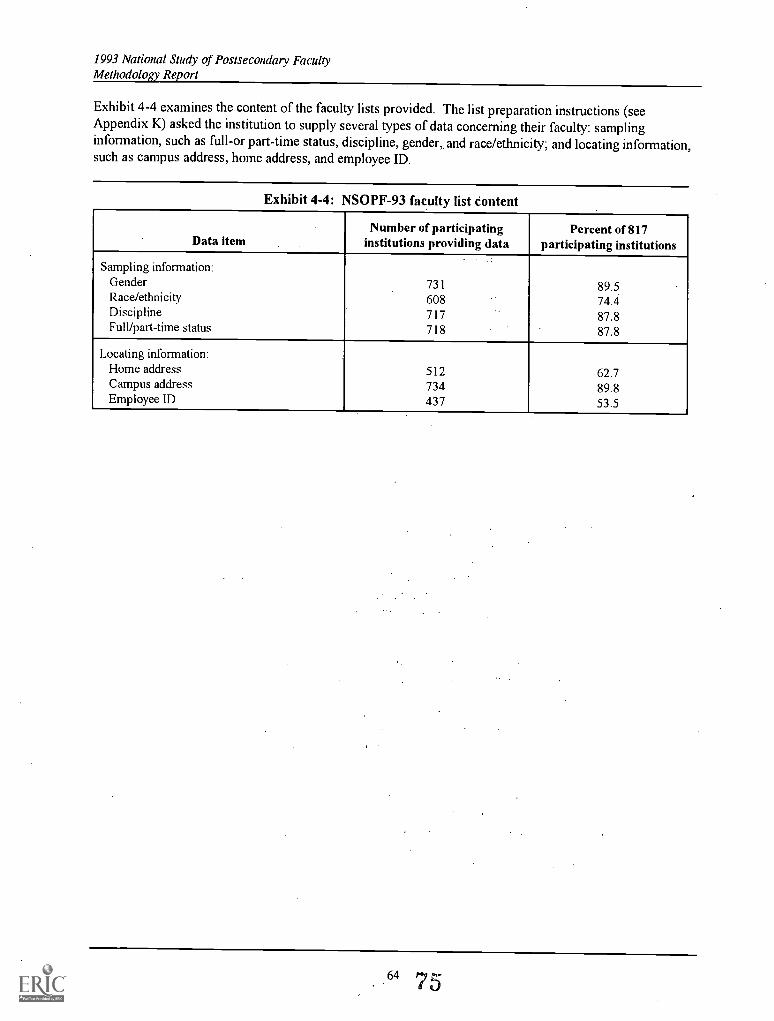
1993 National Study of Postsecondary FacultyMethodology Report
Exhibit 4-4 examines the content of the faculty lists provided. The list preparation instructions (seeAppendix K) asked the institution to supply several types of data concerning their faculty: samplinginformation, such as full-or part-time status, discipline, gender, and race/ethnicity; and locating information,such as campus address, home address, and employee ID.
Exhibit 4-4: NSOPF-93 faculty list content
Data itemNumber of participating
institutions providing dataPercent of 817
participating institutions
Sampling information:Gender 731 89.5Race/ethnicity 608 74.4Discipline 717 87.8Full/part-time status 718 87.8
Locating information:Home address 512 62.7Campus address 734 89.8Employee ID 437 53.5
64 75
1993 National Study of Postsecondary FacultyMethodology Report
5. Data Collection Procedures and Implementation
5.1 Overview
Institutions were recruited for NSOPF-93 from an initial sample of 974 postsecondary institutions. (SeeChapter 3 for a discussion of sample selection and eligibility. See Chapter 4 for a discussion of therecruitment process and results.) Of these 974 institutions, 962 were eligible and 817 agreed to participate inthe study by supplying a list of their faculty. The NSOPF-93 faculty questionnaire collected data from asample of full- and part-time faculty, both instructional and non-instructional, and other staff withinstructional duties at participating institutions. The final sample of faculty was 31,354 (the original sampleof 33,354 less the subsample Of 2,000) drawn from lists supplied by the 817 participating institutions. TheNSOPF-93 institution questionnaire collected data from eligible institutions. The institution sampleconsisted of the 817 institutions who supplied faculty lists and 145 who did not provide lists. Exhibit 5-1contains the final schedule for all three NSOPF-93 study components; list collection, faculty questionnairesand institution questionnaires.
A supplemental memorandum describing changes to the faculty questionnaire was submitted to OMB onDecember 18, 1992 and OMB approval was received on January 7, 1993. A multi-modal data collectiondesign was approved. This involved a mailed, self-administered questionnaire, followed by mail andtelephone prompting, and supplemented by computer-assisted telephone interviewing (CATI) fornonresponding faculty. The self-administered faculty questionnaire took about 45 minutes on average tocomplete. A commercial software package called AutoQuest was used to program the CATI version, whichinvolved minor wording and format changes to the self-administered instrument in order to facilitateinterviewing by telephone. The CATI version also took about 45 minutes to complete.
A supplemental memorandum describing changes to the institution questionnaire, along with respondentcover letters, was submitted to OMB on June 28, 1993 with a request for expedited approval. OMBapproval was received on July 30, 1993. Revisions to the institution questionnaire were finalized inconsultation with NCES at the request of OMB. The NSOPF institution questionnaire was mailed toinstitutional representatives at all 962 eligible institutions, including those that did not supply a list of facultyfor the study. Data were collected principally by self-administered questionnaires, although a small numberof cases were completed with interviewer assistance.
The Chief Administrative Officer (CAO) of each institution named the Institutional Coordinator as institutionrespondent for the institution questionnaire at 44.2 percent of the sampled institutions. The number ofinstitution staff required to complete the self-administered institution questionnaire varied from a low of oneto a high of five, with an average of slightly fewer than two respondents (1.78) per institution. Over one-half(460) of the institutions had a single representative complete the questionnaire; over one-quarter (229) werecompleted by two respondents; 116 by three respondents; 47 by four respondents; and 20 by fiverespondents.
For the faculty and institution questionnaires, the response rate is defined as the ratio of the number ofcompleted questionnaires to the number of sample units minus the number of ineligible units. For faculty, theresponse rate is calculated as 25,780/(31,354 1,590 ineligibles) = 86.6 percent (84.4 percent, weighted).The response rate for the institution questiOnnaire is: 872/(974 12 ineligibles) = 90.6 percent (93.5percent, weighted). The overall faculty response rate (institution list participation multiplied by facultyquestionnaire response rate) was 73.5 percent, and 70.4 percent, weighted.
65
76
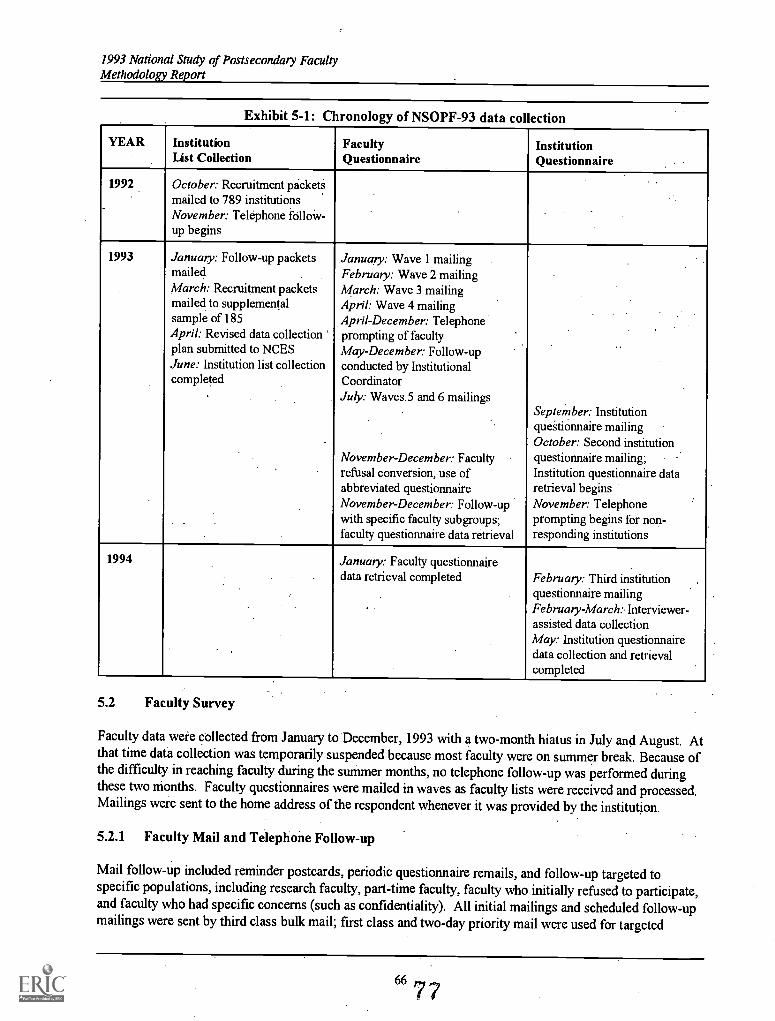
1993 National Study of Postsecondary FacultyMethodology Report
Exhibit 5-1: Chronology of NSOPF-93 data collection
YEAR InstitutionList Collection
FacultyQuestionnaire
InstitutionQuestionnaire
1992
.
October: Recruitment packetsmailed to 789 institutionsNovember: Telephone iiilloW-up begins
1993 January: Follow-up packetsmailedMarch: Recruitment packetsmailed to supplementalsample of 185April: Revised data collectionplan submitted to NCESJune: Institution list collectioncompleted
.
January: Wave 1 mailingFebruary: Wave 2 mailingMarch: Wave 3 mailingApril: Wave 4 mailingApril-December: Telephoneprompting of facultyMay-December: Follow-upconducted by InstitutionalCoordinatorJuly: Waves.5 and 6 mailings
November-December: Facultyrefusal conversion, use ofabbreviated questionnaireNovember-December: Follow-upwith specific faculty subgroups;faculty questionnaire data retrieval
.
.
September: Institutionqu6tionnaire mailingOctober: Second institutionquestionnaire mailing;Institution questionnaire dataretrieval beginsNovember: Telephoneprompting begins for non-responding institutions
1994.
January: Faculty questionnairedata retrieval completed February: Third institution
questionnaire mailingFebruary-March:, Interviewer-assisted data collectionMay: Institution questionnairedata collection and retrievalcompleted
5.2 Faculty Survey
Faculty data were collected from January to December, 1993 with a two-month hiatus in July and August. Atthat time data collection was temporarily suspended because most faculty were on summer break. Because ofthe difficulty in reaching faculty during the summer months, no telephone follow-up was performed duringthese two months. Faculty questionnaires were mailed in waves as faculty lists were received and processed.Mailings were sent to the home address of the respondent whenever it was provided by the institution.
5.2.1 Faculty Mail and Telephone Follow-up
Mail follow-up included reminder postcards, periodic questionnaire remails, and follow-up targeted tospecific populations, including research faculty, part-time faculty, faculty who initially refused to participate,and faculty who had specific concerns (such as confidentiality). All initial mailings and scheduled follow-upmailings were sent by third class bulk mail; first class and two-day priority mail were used for targeted
6677
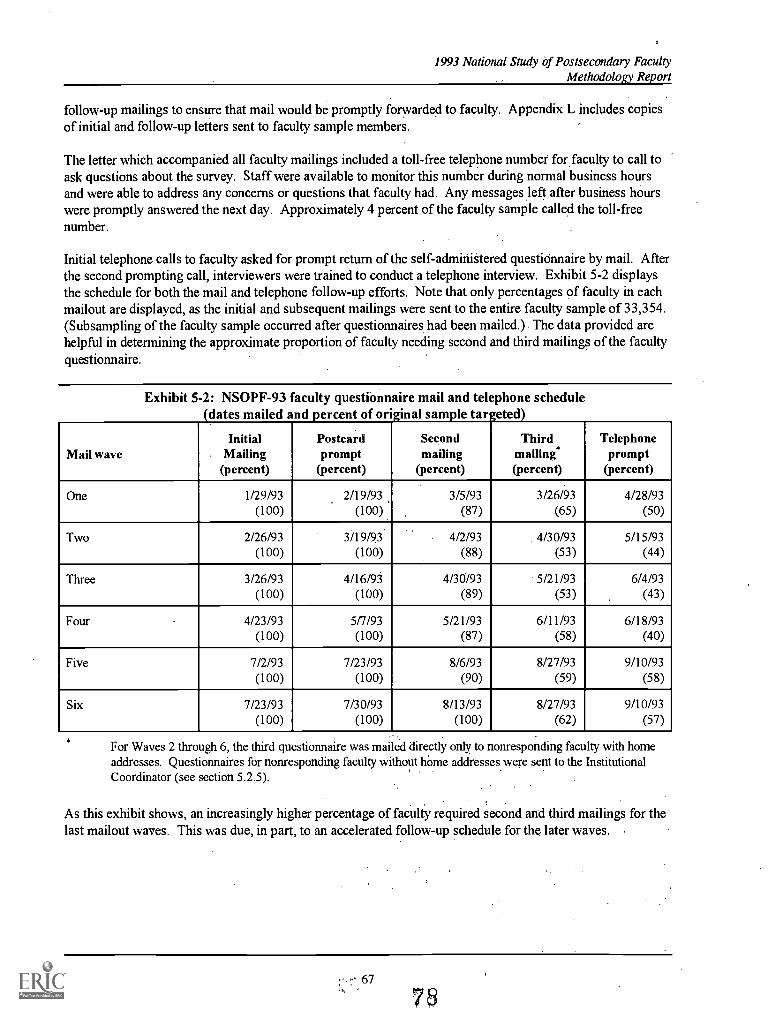
1993 National Study of Postsecondary FacultyMethodology Report
follow-up mailings to ensure that mail would be promptly forwarded to faculty. Appendix L includes copiesof initial and follow-up letters sent to faculty sample members.
The letter which accompanied all faculty mailings included a toll-free telephone number for faculty to call toask questions about the survey. Staff were available to monitor this number during normal business hoursand were able to address any concerns or questions that faculty had. Any messages left after business hourswere promptly answered the next day. Approximately 4 percent of the faculty sample called the toll-freenumber.
Initial telephone calls to faculty asked for prompt return of the self-adminiStered questionnaire by mail. Afterthe second prompting call, interviewers were trained to conduct a telephone interview. Exhibit 5-2 displaysthe schedule for both the mail and telephone follow-up efforts. Note that only percentages of faculty in eachmailout are displayed, as the initial and subsequent mailings were sent to the entire faculty sample of 33,354.(Subsampling of the faculty sample occurred after questionnaires had been mailed.) The data provided arehelpful in determining the approximate proportion of faculty needing second and third mailings of the facultyquestionnaire.
Exhibit 5-2: NSOPF-93 faculty questionnaire mail and telephone scheduledates mailed and percent of original sample targeted
Mail waveInitial
Mailing(percent)
Postcardprompt
(percent)
Secondmailing
(percent)
Thirdmailing*(percent)
Telephoneprompt
(percent)
One 1/29/93 2/19/93 3/5/93 3/26/93 4/28/93(100) (100) (87) (65) (50)
Two 2/26/93 3/19/93 4/2/93 4/30/93 5/15/93(100) (100) (88) (53) (44)
Three 3/26/93 4/16/93 4/30/93 5/21/93 6/4/93(100) (100) (89) (53) (43)
Four 4/23/93 5/7/93 5/21/93 6/11/93 6/18/93(100) (100) (87) (58) (40)
Five 7/2/93 7/23/93 8/6/93 8/27/93 9/10/93(100) (100) (90) (59) (58)
Six 7/23/93 7/30/93 8/13/93 8/27/93 9/10/93(100) (100) (100) (62) (57)
For Waves 2 through 6, the third questionnaire was mailed directly only to nonresponding faculty with homeaddresses. Questionnaires for nonresponding faculty without hOme addresses were sent to the InstitutionalCoordinator (see section 5.2.5).
As this exhibit shows, an increasingly higher percentage of faculty required second and third mailings for thelast mailout waves. This was due, in part, to an accelerated follow-up schedule for the later waves.
67
78
1993 National Study of Postsecondary FacultyMethodology Report
5.2.2 Faculty Locating and Eligibility Screening Procedures
Locating of faculty was performed by specially trained interviewers. Locators were trained to follow aprotocol for each respondent for which no productive contact was made. The following sources ofinformation were used to find hard-to-reach respondents:
name of the institution at which the individual was employed in the fall of 1992any available home or campus address or telephone numbersfaculty member's departmentemployee ID (oftentimes the employee's social security number)
Cases selected for the locating staff included cases to locate and refusals, as well as any respondent who hadnot received a successful prompt or who had not made firm arrangements to complete a telephone interview.The locating team compiled institution-by-institution lists of pending respondents. The folder for eachinstitution (including course catalogs, faculty directories, lists and print-outs of locating information) wassearched for any helpful information, and these data were entered onto a hardcopy call record for each facultymember. Commercially published directories of faculty were also searched for this information. Institutionswhich did not supply home phone numbers were prioritized for look-up. Locators were then instructed toattempt to contact sampled faculty using any of the available addresses or telephone numbers, calling theinstitution directly, calling the Institutional Coordinator, or calling the appropriate department secretary orchairperson.
In the event that these sources were not helpful in locating faculty, alternate sources were used, such asdirectory assistance and the state department of motor vehicles. When necessary, the locating teamperformed CBI/Trans Union searches of locating information. As information was found and confirmed, thecase was forwarded for data entry and placed into the telephone center calling queue. Locators were trained toconduct telephone interviews (on hardcopy) with respondents they located.
In order to concentrate locating efforts on eligible faculty, calls were initiated to institution personnel toconfirm eligibility of pending faculty. Institutions with large numbers of pending part-time faculty andinstitutions likely to have large numbers of ineligibles (medical schools, institutions with low participationrates, etc.) were prioritized. All interviewers and locating staff (including data entry specialists) receivedbrief training in determining eligibility and were provided with a job aid to assist them in assessingrespondent eligibility.
Interviewers were supplied with a list of Institutional Coordinators and the status of each institution'sAffidavit of Nondisclosure. If a signed affidavit was currently on file for the coordinator, the interviewer wasinstructed to call the coordinator directly and ask for the eligibility status, the current employment status, and,if possible, additional locating information (such as home addresses or phone numbers, forwardinginformation, etc.) for all pending faculty listed on the "look-up" sheet provided by the locating shop.Interviewers could only request information from coordinators who had signed the affidavit and had itnotarized. If no affidavit was on file, the interviewer had the option of asking for completion of the affidavit,or contacting personnel or payroll for further information. Contacts to institution personnel other than thecoordinator were conducted within confidentiality constraints. To protect respondent confidentiality,interviewers were not allowed to identify themselves as representing NSOPF-93, or to reveal that the peoplethey were asking about were in the NSOPF-93 faculty sample.
Combined institution questionnaire prompts and eligibility calls. To maximize efficiency and tominimize the number of calls to each institution, eligibility calling was combined with the institutionquestionnaire prompt. This occurred with those institutions where the institution respondentwas the same as
68 79
1993 National Study of Postsecondary FacultyMethodology Report
the Institutional Coordinator, and an institution questionnaire prompt was required. Combined callscontinued until the first round of institution questionnaire prompting was completed on December 18, 1993.
Eligibility calls to institutions with low faculty participation rates. After January 3, 1994 eligibility callswere resumed only to those 75 institutions with a faculty participation rate of 60 percent or less. These callswere combined with institution questionnaire prompts whenever a prompt to the institution was required.However, all institutions with a participation rate of less than 60 percent were contactednot merely thosefor whom a prompt was required.
5.2.3 Faculty Refusal Conversion
During November and December, 1993, a number of new strategies were employed. A team of field staffespecially skilled in working with refusals and hard-to-locate cases, and with experience working withinstitutions, were recruited for this phase of the data collection effort. Call histories were produced forrespondents who initially refused to answer the survey. Refusals were reviewed, grouped, and appropriatefollow-up strategies and supervisor reinforcement put into place for field and office interviewers. Specialtools were designed to aid in refusal conversion. One was a fact sheet to help refusal conversion specialistsanswer refusers' specific objections to participation in the study. Issues on which the fact sheet focusedincluded the survey's confidentiality and purpose and concerns of particular groups of faculty (part-timefaculty, retired faculty, research faculty, faculty at religious institutions and faculty who said they were nottypical of faculty at their institution).
Another tool that aided refusal conversion was an abbreviated faculty questionnaire designed foruse in atelephone interview. This questionnaire consisted of critical items and other items selected on the basis ofanalytical needs where NCES required unimputed data for the faculty questionnaire. The abbreviatedquestionnaire was specifically used only for refusal conversion. It was not designed for refusal aversion.During the intensive data collection period of November 11, 1993 and December 31, 1993, 636 abbreviatedquestionnaires were completed with respondents who initially refused to participate in the NSOPF-93 facultysurvey. After gaining respondent cooperation in answering the abbreviated faculty questionnaire, refusalconversion specialists were trained to ask respondents for their cooperation in completing the fullquestionnaire.
For purposes of data entry and imputation, completed abbreviated questionnaires were treated like all otherquestionnaires. Items excluded from the abbreviated questionnaire were considered missing data. A copy ofthe abbreviated questionnaire appears in Appendix H.
5.2.4 Follow-up with Specific Subgroups of Faculty
Throughout the follow-up phase of the data collection process, special attention was paid to increasingabsolute numbers of respondents in particular faculty subgroups: for black, non-Hispanics; Hispanics;Asian/Pacific Islanders; those whose race was unknown (i.e. missing a racial identification on the facultysampling list); research institution faculty; and part-time faculty. In order to focus on the research target,case lists prioritizing these faculty subgroups were provided to field staff and to phone shop staff. Inaddition, a special mailing was sent in November, 1993 to the following subgroups of nonresponding faculty:Wave 5 and Wave 6 faculty; and Wave 1 through Wave 4 faculty in medical or research schools and two-year colleges. These special efforts, particularly those taken in November and December, 1993, increasedresponse rates for minority and part-time faculty, largely because of an increase in completed cases in whichrace or part-time/full-time status was initially unknown.
69 80
1993 National Study of Postsecondary FacultyMethodology Report
5.2.5 Faculty Follow-up by Institutional Coordinators
All Institutional Coordinators who had signed the NCES' Affidavit of Nondisclosure and had it notarizedwere asked to carry out three tasks vis-a-vis nonresponding faculty. Coordinators who did not supply homeaddresses for their faculty were asked to mail the third questionnaire packet to the home (or summer) addressof nonresponding faculty. The questionnaire packets were prepackaged and prestamped in advance, so thatthe coordinator's task was limited to writing in the faculty member's address. Coordinators who suppliedhome addresses were given a list of nonresponding faculty and asked to prompt them for the return of theirquestionnaires. Coordinators were also asked to identify faculty who were listed in error and not eligible forthe study. The initial mailout of these materials, for institutions in faculty mailout Waves 1-4, occurred onMay 7, 1993. These materials were mailed in August, 1993 for institutions in all faculty mailout waves.Appendix N includes a copy of the letter accompanying the packet mailed to Institutional Coordinators.
To assure that these follow-up requests received prompt attention from coordinators, telephone promptingstaff contacted each coordinator's office to alert them to the packet and its contents and to answer anyquestions about their role. Additional contact with coordinators to confirm eligibility of nonrespondingfaculty continued through January, 1994.
For the May mailing, out of 439 coordinators, 131 were asked to prompt and to send questionnaires to thehomes of 3,355 nonresponding faculty. The other 308 coordinators were asked only to prompt 7,475nonresponding faculty.
The second mailing to coordinators occurred prior to the resumption of interviewer follow-up. Coordinatorsfor Waves 1-4 institutions were mailed follow-up packets on August 18-19, 1993; the coordinators forWaves 5-6 received similar packets on August 23, 1993. The telephone center staff contacted coordinators tonotify them of the scheduled mailout and to request their assistance. Telephone notification began on August11, 1993 and was completed by September 3, 1993. Of the coordinators who received packets, 109confirmed either by telephone or in writing that they had followed up with nonresponding faculty at theirinstitutions. Only nine coordinators explicitly refused to implement the request for help.
5.2.6 Faculty Telephone Interviews
Telephone interviewing was conducted using a CATI (computer-assisted telephone interviewing) system.Telephone prompting and interviewing of nonresponding faculty began on April 28, 1993 and ended onDecember 18, 1993, with a suspension of activities in the months of July and August. A total of 4,995faculty, or 19 percent of all completed cases, completed the CATI questionnaire. The CATI version of thefaculty questionnaire was programmed in AutoQuest, a commercially available software package. Telephonefollow-up activities were coordinated with mail follow-up. Cases were activated for telephone follow-up inwaves, according to their initial mailing date (see Exhibit 5-3). Interviewers were instructed to conduct aCATI interview only after the second telephone prompt, but were given greater discretion to conduct atelephone interview for cases mailed late in the field period.
5.2.7 Field Interviewing and Locating
Approximately 20 field interviewers who were expert locators and refusal converters and two field managerswere employed during November and December, 1993, to assist with the end of the data collection effort.Almost 1,200 temporary refusal and unlocatable cases were assigned to field staff. Field production wasmonitored daily, and regular feedback was given in order to keep production levels high. Staffing wasreconfigured and adjusted based on the caseload and last known location of the cases. Field staff completed
70
81
1993 National Study of Postsecondary FacultyMethodology Report
approximately 500 questionnaires with faculty as telephone interviews. These interviews were then data-entered using the data entry program for self-administered questionnaires.
5.2.8 Faculty Data Retrieval
A subset of telephone interviewers were trained to conduct retrieval of missing critical information fromcompleted faculty self-administered questionnaires. Twenty-seven percent of the 20,785 self-administeredquestionnaires were identified for retrieval because of missing data in one or more of the critical items.Respondents were called and asked to supply the missing data for these items. In approximately 84 percentof the cases, respondents were able to provide some or all of the missing information. The remaining 16percent were determined to be complete based on policy decisions reviewed with NCES. All facultyquestionnaire retrieval activities were completed on January 29, 1994. (Retrieval is discussed further inChapter 6. A list of faculty questionnaire critical items appears in Appendix I.)
5.3 Data Collection Results: Faculty Questionnaire
Exhibits 5-3 through 5-6 provide a summary of the NSOPF-93 data collection results for the facultyquestionnaire. These exhibits report unweighted response rates.
Exhibit 5-3 illustrates the faculty response rates for each wave of questionnaires by initial mailing date. Asfaculty lists were received and processed, and faculty were sampled, questionnaires were assembled into largebatches for mailing. The initial questionnaire packets were followed by at least two follow-up questionnairemailingi. Telephone prompting and interviewing followed for nonrespondents. As indicated, the responserates varied from a high of 90.1 percent for Wave 1 to a low of 77.9 percent for Wave 6. These data suggestthat faculty who received their questionnaires early in the field periodusually when classes were still insession had a greater likelihood of responding than faculty who received a later mailing.
BEST COPY IINAILA
71,7. S2
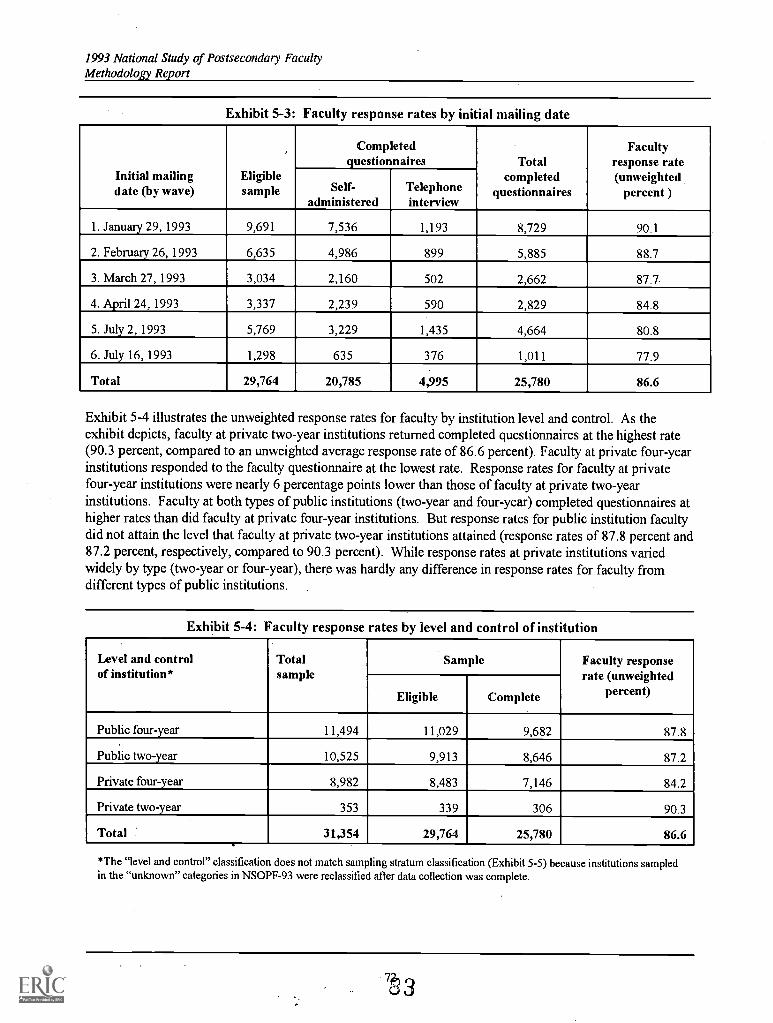
1993 National Study of Postsecondary FacultyMethodology Report
Exhibit 5-3: Faculty response rates by initial mailing date
Initial mailingdate (by wave)
Eligiblesample
Completedquestionnaires Total
completedquestionnaires
Facultyresponse rate(unweighted
percent )Self-administered
Telephoneinterview
1. January 29, 1993 9,691 7,536 1,193 8,729 90.1
2. February 26, 1993 6,635 4,986 899 5,885 88.7
3. March 27, 1993 3,034 2,160 502 2,662 87.7.
4. April 24, 1993 3,337 2,239 590 2,829 84.8
5. July 2, 1993 5,769 3,229 1,435 4,664 80.8
6. July 16, 1993 1,298 635 376 1,011 77.9
Total 29,764 20,785 4,995 25,780 86.6
Exhibit 5-4 illustrates the unweighted response rates for faculty by institution level and control. As theexhibit depicts, faculty at private two-year institutions returned completed questionnaires at the highest rate(90.3 percent, compared to an unweighted average response rate of 86.6 percent). Faculty at private four-yearinstitutions responded to the faculty questionnaire at the lowest rate. Response rates for faculty at privatefour-year institutions were nearly 6 percentage points lower than those of faculty at private two-yearinstitutions. Faculty at both types of public institutions (two-year and four-year) completed questionnaires athigher rates than did faculty at private four-year institutions. But response rates for public institution facultydid not attain the level that faculty at private two-year institutions attained (response rates of 87.8 percent and87.2 percent, respectively, compared to 90.3 percent). While response rates at private institutions variedwidely by type (two-year or four-year), there was hardly any difference in response rates for faculty fromdifferent types of public institutions.
Exhibit 5-4: Faculty response rates by level and control of institution
Level and controlof institution*
Totalsample
Sample Faculty responserate (unweighted
percent)Eligible Complete
Public four-year 11,494 11,029 9,682 87.8
Public two-year 10,525 9,913 8,646 87.2
Private four-year 8,982 8,483 7,146 84.2
Private two-year 353 339 306 90.3
Total : 31,354 29,764 25,780 86.6
*The "level and control" classification does not match sampling stratum classification (Exhibit 5-5) because institutions sampledin the "unknown" categories in NSOPF-93 were reclassified after data collection was complete.
73
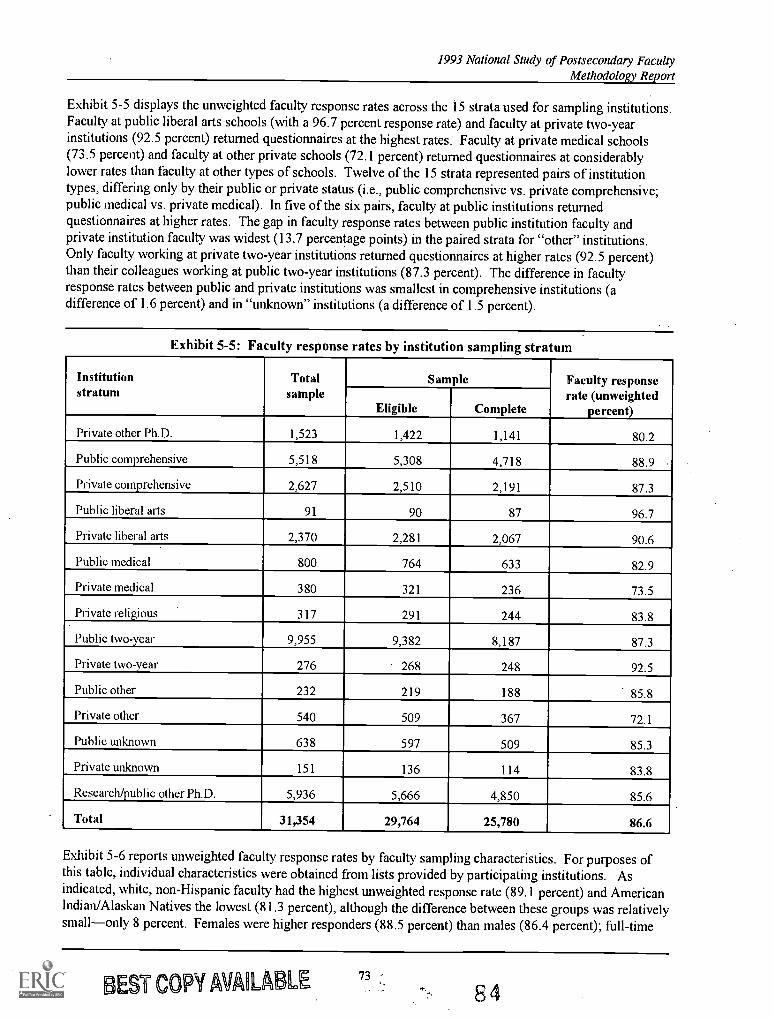
1993 National Study of Postsecondary FacultyMethodology Report
Exhibit 5-5 displays the unweighted faculty response rates across the 15 strata used for sampling institutions.Faculty at public liberal arts schools (with a 96.7 percent response rate) and faculty at private two-yearinstitutions (92.5 percent) returned questionnaires at the highest rates. Faculty at private medical schools(73.5 percent) and faculty at other private schools (72.1 percent) returned questionnaires at considerablylower rates than faculty at other types of schools. Twelve of the 15 strata represented pairs of institutiontypes, differing only by their public or private status (i.e., public comprehensive vs. private comprehensive;public medical vs. private medical). In five of the six pairs, faculty at public institutions returnedquestionnaires at higher rates. The gap in faculty response rates between public institution faculty andprivate institution faculty was widest (13.7 percentage points) in the paired strata for "other" institutions.Only faculty working at private two-year institutions returned questionnaires at higher rates (92.5 percent)than their colleagues working at public two-year institutions (87.3 percent). The difference in facultyresponse rates between public and private institutions was smallest in comprehensive institutions (adifference of 1.6 percent) and in "unknown" institutions (a difference of 1.5 percent).
Exhibit 5-5: Faculty response rates by institution sampling stratum
Institutionstratum
Totalsample
Sample Faculty responserate (unweighted
percent)Eligible Complete
Private other Ph.D. 1,523 1,422 1,141 80.2
Public comprehensive 5,518 5,308 4,718 88.9
Private comprehensive 2,627 2,510 2,191 87.3
Public liberal arts 91 90 87 96.7
Private liberal arts 2,370 2,281 2,067 90.6
Public medical 800 764 633 82.9
Private medical 380 321 236 73.5
Private religious 317 291 244 83.8
Public two-year 9,955 9,382 8,187 87.3
Private two-year 276 268 248 92.5
Public other 232 219 188 85.8
Private other 540 509 367 72.1
Public unknown 638 597 509 85.3
Private unknown 151 136 114 83.8
Research/public other Ph.D. 5,936 5,666 4,850 85.6
Total 31,354 29,764 25,780 86.6
Exhibit 5-6 reports unweighted faculty response rates by faculty sampling characteristics. For purposes ofthis table, individual characteristics were obtained from lists provided by participating institutions. Asindicated, white, non-Hispanic faculty had the highest unweighted response rate (89.1 percent) and AmericanIndian/Alaskan Natives the lowest (81.3 percent), although the difference between these groups was relativelysmallonly 8 percent. Females were higher responders (88.5 percent) than males (86.4 percent); full-time
BEST COPY AVAILABLE73
84
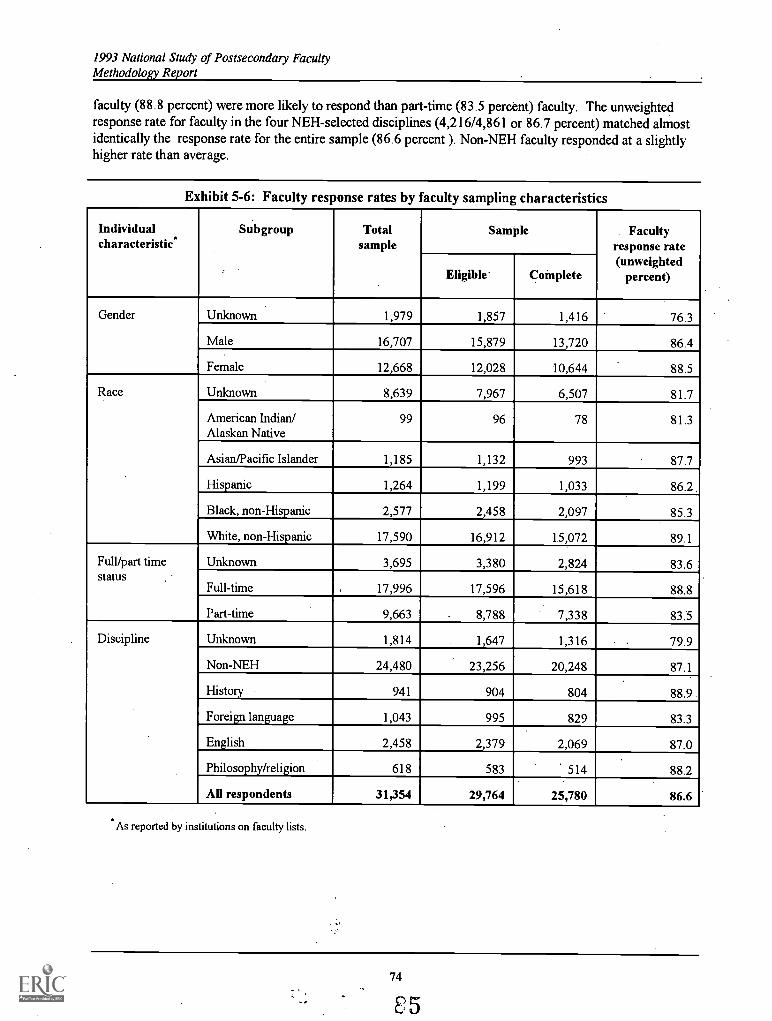
1993 National Study of Postsecondary FacultyMethodology Report
faculty (88.8 percent) were more likely to respond than part-time (83.5 percent) faculty. The unweightedresponse rate for faculty in the four NEH-selected disciplines (4,216/4,861 or 86.7 percent) matched almostidentically the response rate for the entire sample (86.6 percent ). Non-NEH faculty responded at a slightlyhigher rate than average.
Exhibit 5-6: Faculty response rates by faculty sampling characteristics
Individualcharacteristic*
Subgroup Totalsample
Sample Facultyresponse rate(unweighted
percent)Eligible' Complete
Gender Unknown 1,979 1,857 1,416 76.3
Male 16,707 15,879 13,720 86.4
Female 12,668 12,028 10,644 88.5
Race Unknown 8,639 7,967 6,507 81.7
American Indian/Alaskan Native
99 96 78 81.3
Asian/Pacific Islander 1,185 1,132 993 87.7
Hispanic 1,264 1,199 1,033 86.2 ,
Black, non-Hispanic 2,577 2,458 2,097 85.3
White, non-Hispanic 17,590 16,912 15,072 89.1
Full/part timestatus
Unknown 3,695 3,380 2,824 83.6
Full-time 17,996 17,596 15,618 88.8
Part-time 9,663 8,788 7,338 83.5
Discipline Unknown 1,814 1,647 1,316 79.9
Non-NEH 24,480 23,256 20,248 87.1
History 941 904 804 88.9.
Foreign language 1,043 995 829 83.3
English 2,458 2,379 2,069 87.0
Philosophy/religion 618 583 514 88.2
All respondents 31,354 29,764 25,780 86.6
As reported by institutions on faculty lists.
74
E5
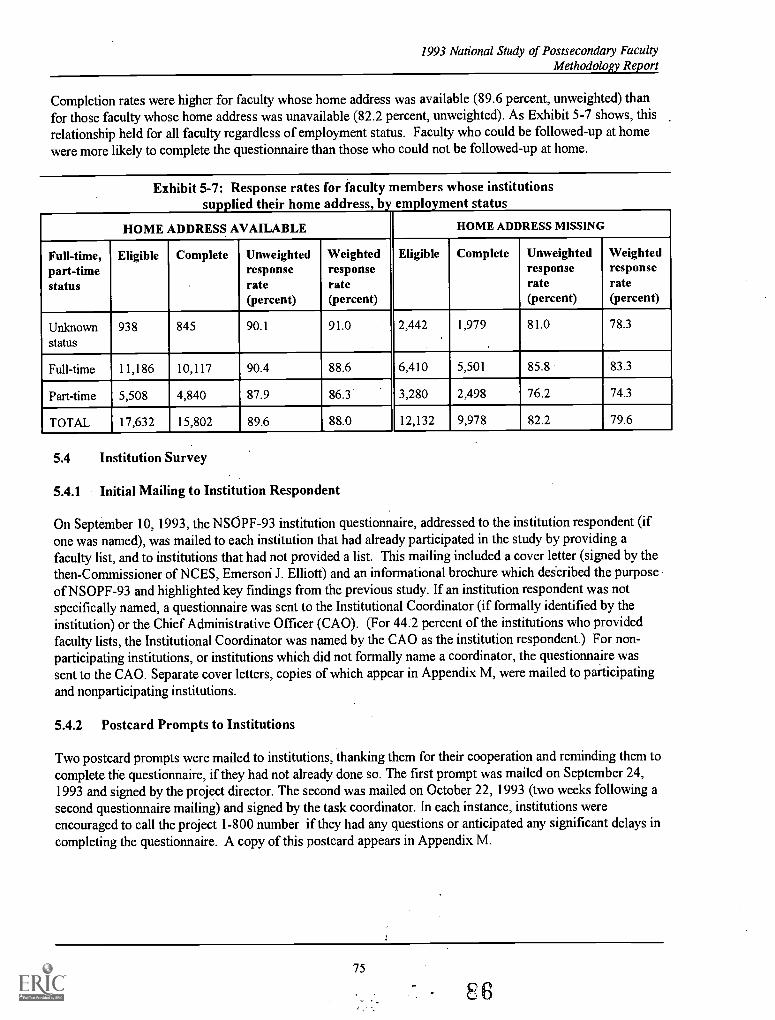
1993 National Study of Postsecondary FacultyMethodology Report
Completion rates were higher for faculty whose home address was available (89.6 percent, unweighted) thanfor those faculty whose home address was unavailable (82.2 percent, unweighted). As Exhibit 5-7 shows, thisrelationship held for all faculty regardless of employment status. Faculty who could be followed-up at homewere more likely to complete the questionnaire than those who could not be followed-up at home.
Exhibit 5-7: Response rates for faculty members whose institutionssupplied their home address, by employment status
HOME ADDRESS AVAILABLE HOME ADDRESS MISSING
Full-time,part-timestatus
Eligible Complete Unweightedresponserate(percent)
Weightedresponserate(percent)
Eligible Complete Unweightedresponserate(percent)
Weightedresponserate(percent)
Unknownstatus
938 845 90.1 91.0 2,442 1,979 81.0 78.3
Full-time 11,186 10,117 90.4 88.6 6,410 5,501 85.8 83.3
Part-time 5,508 4,840 87.9 86.3 3,280 2,498 76.2 74.3
TOTAL 17,632 15,802 89.6 88.0 12,132 9,978 82.2 79.6
5.4 Institution Survey
5.4.1 Initial Mailing to Institution Respondent
On September 10, 1993, the NSOPF-93 institution questionnaire, addressed to the institution respondent (ifone was named), was mailed to each institution that had already participated in the study by providing afaculty list, and to institutions that had not provided a list. This mailing included a cover letter (signed by thethen-Commissioner of NCES, Emerson J. Elliott) and an informational brochure which dekribed the purposeof NSOPF-93 and highlighted key findings from the previous study. If an institution respondent was notspecifically named, a questionnaire was sent to the Institutional Coordinator (if formally identified by theinstitution) or the Chief Administrative Officer (CAO). (For 44.2 percent of the institutions who providedfaculty lists, the Institutional Coordinator was named by the CAO as the institution respondent.) For non-participating institutions, or institutions which did not formally name a coordinator, the questionnaire wassent to the CAO. Separate cover letters, copies of which appear in Appendix M, were mailed to participatingand nonparticipating institutions.
5.4.2 Postcard Prompts to Institutions
Two postcard prompts were mailed to institutions, thanking them for their cooperation and reminding them tocomplete the questionnaire, if they had not already done so. The first prompt was mailed on September 24,1993 and signed by the project director. The second was mailed on October 22, 1993 (two weeks following asecond questionnaire mailing) and signed by the task coordinator. In each instance, institutions wereencouraged to call the project 1-800 number if they had any questions or anticipated any significant delays incompleting the questionnaire. A copy of this postcard appears in Appendix M.
75
E6
1993 National Study of Postsecondary FacultyMethodology Report
5.4.3 Second Questionnaire Mailing to Institutions
A second questionnaire was mailed to non-responding institutions on October 8, 1993, by regular first classmail. A cover letter from the project director accompanied the questionnaire. The letter assured institutionsthat there was still time to complete the questionnaire, and encouraged completion within the next few weeks.
5.4.4 Telephone Prompting and Follow-up of Institutions
Interviewers were given assignments from one of two groups of participating institutions: institutions whichnamed the Institutional Coordinator as respondent, and institutions which named a separate institutionrespondent. Telephone prompting began on November 11, 1993. In those instances where the InstitutionalCoordinator was the same as the institution respondent, follow-up calls for the institution questionnaire werecombined with other institutional contacts related to the faculty component of the study, including calls todetermine the eligibility of nonresponding faculty, and calls to encourage coordinators to prompt faculty.Interviewers were trained in each type of follow-up activity before calling. By combining these contacts, itwas hoped that any added burden to the coordinator would be minimized. Interviewers were trained to reviewall previous contact information (including the Record of Calls from the list collection phase of the study)prior to each call. If neither an Institutional Coordinator nor institution respondent had been designated by aparticipating institution, the initial call was made to the CAO's office.
The first wave of telephone prompting ended on December 23, 1993 prior to the holiday break. Promptingresumed on January 7, 1994 and continued until May 25, 1994. Institutions that failed to provide a list offaculty were treated as possible refusals. Initial follow-up to institutions which did not provide a list of facultywas conducted by the project Task Coordinator, beginning on November 10, 1993. Once the institutionconfirmed that they would complete the questionnaire, the Record of Calls was forwarded to interviewingstaff for any additional follow-up.
Remails were requested by 226 institutions (23 percent). To eliminate unnecessary mail delays,questionnaires and other materials were faxed to institutions whenever possible. Institutions were encouragedto fax questionnaires as soon as they were completed, in addition to mailing the hardcopy. Institutionrespondents were also given a toll-free number to call with questions or comments; approximately 390 callswere made to the toll-free number.
The project task coordinator reviewed all refusals, and based on this review either called the institutionpersonally, or forwarded the case to field staff for data collection by telephone. When appropriate, an offerwas made to assist the institution by abstracting data from other information supplied by the institution.
5.4.5 Third Questionnaire Mailing to Institutions
On February 2, 1994 a third questionnaire mailing was sent by two-day priority mail to 383 nonrespondinginstitutions. The third questionnaire mailing was necessary for two reasons. One was that the interruption ofthe holiday break, followed by the beginning of a new academic term, made it likely that the original requestwould be forgotten or lost. The second was that adverse weather conditions (including earthquakes on theWest Coast and severe snowstorms and below-zero temperatures in the Midwest and East Coast) had causedsome institutions to close for extended periods of time, further exacerbating staffing problems at theseinstitutions. The letter informed institutions that the data collection period would be extended toaccommodate institutions which had been affected by adverse conditions; other institutions were encouragedto complete and return the questionnaire by February 18, 1994. A personal, handwritten note was added toeach letter, as appropriate, thanking respondents for their cooperation and addressing any concerns theinstitution may have previously expressed about the study.
76
87
1993 National Study of Postsecondary FacultyMethodology Report
The Association for Institutional Research (AIR) disseminated a project update memo in February to its
membership through its electronic newsletter, underscoring AIR endorsement of the study and encouraging
participation of sampled institutions. The memo noted that the deadline for participation had been extended
to accommodate institutions affected by severe weather conditions, and thanked those institutions that had
participated in NSOPF.
5.4.6 Interviewer-Assisted Data Collection at Institutions
In February and March, 1994 three experienced field interviewers were trained to collect data directly from
institutions by telephone (or, in select instances, by visits to the institution). Field staff were selected on the
basis of previous success in interviewing faculty on the faculty questionnaire. Individual training, including a
walkthrough of the questionnaire, was conducted with each interviewer by the task coordinator. Each training
lasted two hours, with an additional two hours provided for self-study. Interviewers were trained to work with
the designated respondent or coordinator to identify offices within each institution that could provide specific
kinds of data, and to contact those offices directly to provide the data. Difficulties experienced by institutions
in coordinating data collection between different offices was a major source of delay; direct intervention by
field staff eliminated that delay, and, as a result, was very successful.
Collecting data over the telephone was considered likely tobe more problematic for larger institutionsparticularly those with large numbers of research faculty or a wide range of types of faculty. Therefore, only
small-to-medium sized institutions from nonresearch strata were targeted for telephone data collection.
Within this group, institutions from strata with comparatively low response rates were specifically targeted,
including public two-year and private religious institutions. Refusals and other nonparticipating institutions
were targeted as well. Four nonresponding religious institutions clustered in the same city were selected for
in-person field visits to collect data. Overall, 99 interviewer assisted questionnaires (95 telephone and four in-
person) were completed. Although no attempt was made to validate interviews directly with the institution,
data collected by interviewers was periodically validated by comparison to other institutional data.
5.4.7 Data Abstraction at Institutions
When an institution indicated it lacked the resources to supply key questionnaire data, or indicated that to do
so would pose an unrealistic burden, an offer was made to assist the institution, if possible, by abstracting
information from other data the institution provided, including:
lists of faculty
most recent IPEDS data, if available from the institution
policy handbooks (containing benefits information andinstitutional definitions of faculty)
At institutions that were confirmed to be part of a state-wide, city-wide, or multi-campus system in which
institutional benefits policy was the same for all institutions in the system, benefits data could sometimes be
supplied by a system-wide source; system-wide benefits information could also be abstracted from common
elements of data provided by sister institutions in the system. Thetask coordinator reviewed lists used to
compile faculty counts for completeness of relevant information. The accuracy of any data abstracted was
confirmed with the institution.
77 88
1993 National Study of Postsecondary FacultyMethodology Report
5.4.8 Institution Data Retrieval
All data retrieval was conducted by trained project staff. Retrieval was conductedon a flow basis, beginningon October 5, 1993, and ending on May 26, 1994. One interviewer was trained to perform both the initialcase edit, which identified cases requiring retrieval, and the retrieval call. As the initial case edit wasperformed, cases with missing critical items were flagged for retrieval. "Don't know" and "refused" wereconsidered legitimate responses and not retrieved. Additional cases were flagged for retrieval when inter-itemdiscrepancies or out-of-range responses involving critical items were discovered during a second editperformed by the task coordinator prior to computer assisted data entry (CADE), or during CADE (which ranseveral consistency checks as part of its program). The data abstraction procedures outlined abovewereutilized when the information was otherwise unavailable from the institution. One hundred seventy-eightcases (20 percent) were identified as requiring retrieval. Retrieval calls were completed for 172 institutionquestionnaires (97 percent).
5.5 Data Collection Results: Institution Questionnaire
Exhibits 5-8 to 5-10 provide a summary of the NSOPF-93 data collection results for the institutionquestionnaire. These exhibits report unweighted response rates.
Exhibit 5-8 illustrates the unweighted institution questionnaire response rates by institution stratum and bytype and control of institution. In general, the response rate of institutions to the institution questionnaire wasquite high, with an unweighted response rate of 90.6 percent for all institutions. All eligible private two-year,private religious and public "other" institutions completed the questionnaire. Public institutions respondedto the institution questionnaire at lower rates than did private institutions. The lowest response rate (66.7percent), found in the public liberal arts stratum, affects so few institutions as to have little impact on theoverall rate of response to the questionnaire. The stratum that included the largest number of institutions, thepublic two-year stratum (with 316 eligible institutions) showed one of the highest rates of response (94.3percent) among the 15 strata.
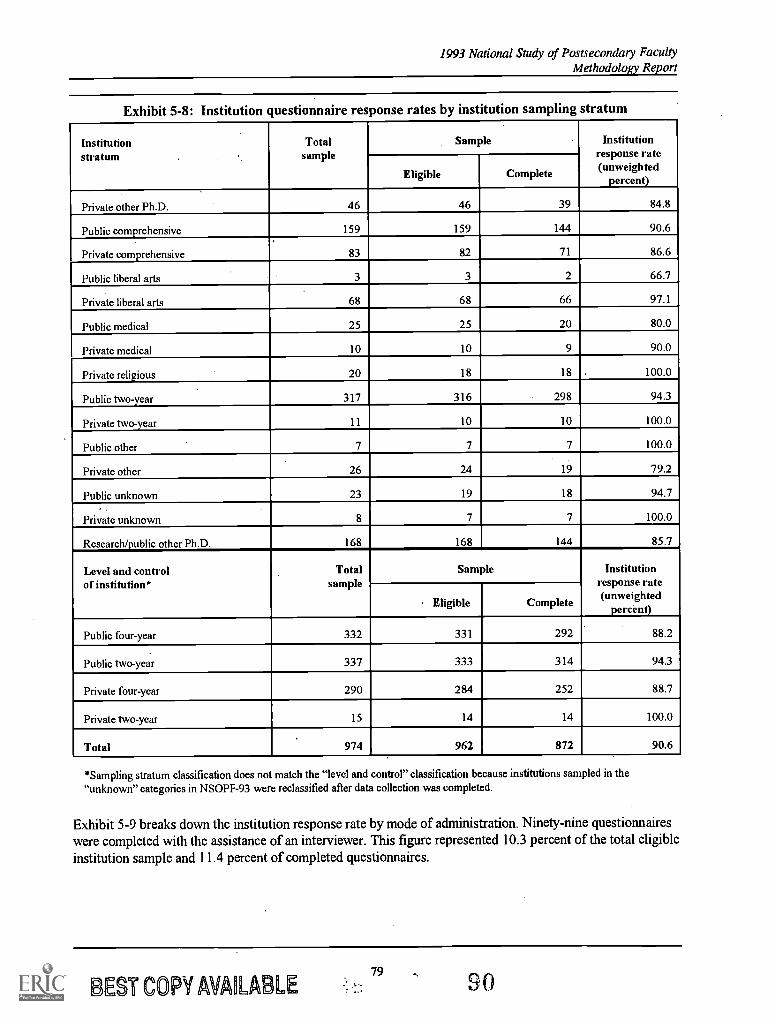
1993 National Study of Postsecondary FacultyMethodology Report
Exhibit 5-8: Institution questionnaire response rates by institution sampling stratum
Institutionstratum
Totalsample
Sample Institutionresponse rate(unweighted
percent)Eligible Complete
Private other Ph.D. 46 46 39 84.8
Public comprehensive 159 159 144 90.6
Private comprehensive 83 82 71 86.6
Public liberal arts 3 3 2 66.7
Private liberal arts 68 68 66 97.1
Public medical 25 25 20 80.0
Private medical 10 10 9 90.0
Private religious 20 18 18 100.0
Public two-year 317 316 298 94.3
Private two-year 11 10 10 100.0
Public other 7 7 7 100.0
Private other 26 24 19 79.2
Public unknown 23 19 18 94.7
Private unknown 8 7 7 100.0
Research/public other Ph.D. 168 168 144 85.7
Level and controlof institution*
Totalsample
Sample Institutionresponse rate(unweighted
percent)Eligible Complete
Public four-year 332 331 292 88.2
Public two-year 337 333 314 94.3
Private four-year 290 284 252 88.7
Private two-year 15 14 14 100.0
Total 974 962 872 90.6
*Sampling stratum classification does not match the "level and control" classification because institutions sampled in the"unknown" categories in NSOPF-93 were reclassified after data collection was completed.
Exhibit 5-9 breaks down the institution response rate by mode of administration. Ninety-nine questionnaireswere completed with the assistance of an interviewer. This figure represented 10.3 percent of the total eligibleinstitution sample and 11.4 percent of completed questionnaires.
BEST COPY AVAILABLE79
90
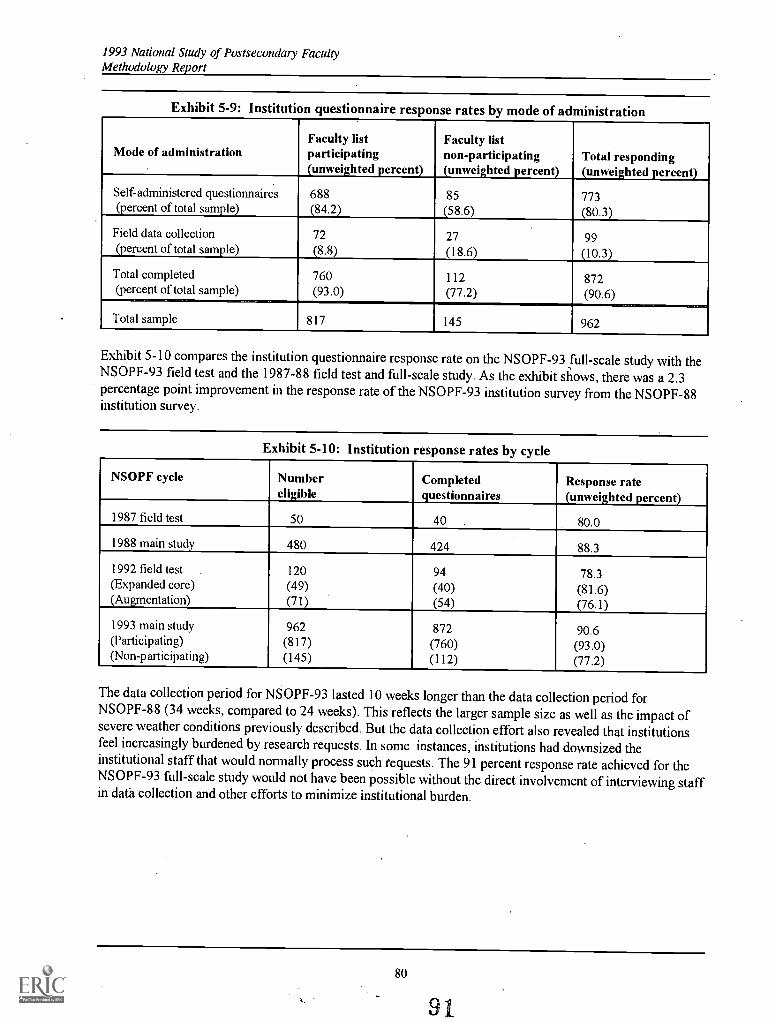
1993 National Study of Postsecondary FacultyMethodology Report
Exhibit 5-9: Institution questionnaire response rates by mode of administration
Mode of administrationFaculty listparticipating(unweighted percent)
Faculty listnon-participating(unweighted percent)
Total responding(unweighted percent)
Self-administered questionnaires 688 85 773(percent of total sample) (84.2) (58.6) (80.3)
Field data collection 72 27 99(percent of total sample) (8.8) (18.6) (10.3)
Total completed 760 112 872(percent of total sample) (93.0) (77.2) (90.6)
Total sample 817 145 962
Exhibit 5-10 compares the institution questionnaire response rate on the NSOPF-93 full-scale study with theNSOPF-93 field test and the 1987-88 field test and full-scale study. As the exhibit shows, there was a 2.3
percentage point improvement in the response rate of the NSOPF-93 institution survey from the NSOPF-88institution survey.
Exhibit 5-10: Institution response rates by cycle
NSOPF cycle Numbereligible
Completedquestionnaires
Response rate(unweighted percent)
1987 field test 50 40 80.0
1988 main study 480 424 88.3
1992 field test 120 94 78.3(Expanded core) (49) (40) (81.6)(Augmentation) (71) (54) (76.1)
1993 main study 962 872 90.6(Participating) (817) (760) (93.0)(Non-participating) (145) (112) (77.2)
The data collection period for NSOPF-93 lasted 10 weeks longer than the data collection period forNSOPF-88 (34 weeks, compared to 24 weeks). This reflects the larger sample size as well as the impact ofsevere weather conditions previously described. But the data collection effort also revealed that institutionsfeel increasingly burdened by research requests. In some instances, institutions had downsized theinstitutional staff that would normally process such requests. The 91 percent response rate achieved for theNSOPF-93 full-scale study would not have been possible without the direct involvement of interviewing staffin data collection and other efforts to minimize institutional burden.
80
9 11
1993 National Study of Postsecondary FacultyMethodology Report
6. Data Control and Data Processing
6.1 Overview
This chapter describes the procedures used to process and to prepare faculty list data for sampling and totransform responses from the faculty and institution questionnaires into computerized data files. A total of872 institution questionnaires (all hardcopy) and 25,780 faculty questionnaires were processed, including20,785 self-administered and 4,995 computer-assisted telephone interviews. NORC used commercially-available software, Auto Quest, for all data capture.
The procedures to be discussed include: receipt control and processing of faculty list data for sampling,monitoring the receipt of completed questionnaires, preparing self-administered questionnaires for data entry,editing self-administered questionnaires for overall adequacy and completeness, data-entry, flagging caseswith missing or inconsistent data through automated consistency checks, retrieving missing data, codingresponses, quality control of data entry, and preparing documents for archival storage.
6.2 Faculty List Processing and Preparation for Sampling
The sampling frame for the faculty survey was drawn from faculty lists provided by 817 participatinginstitutions. Each participating institution was asked to provide a hard-copy list, a machine-readable list,documentation of the list format, and the names of institution staff involved in preparing the list. Uponreceipt, each list was subjected to a cursory review for completeness and adequacy. Project staff were trainedexpressly to recontact institution staff to retrieve missing information and to resolve list discrepancies. Thesestaff used the Faculty List Documentation Form (see Appendix K) provided by the institution to contact thosepersons involved in preparing the faculty list. If the institution did not provide this form, staff recontacted theInstitutional Coordinator. In the event that the faculty list was incompletethat is, some level of locating orsampling information was missingstaff explained the importance of these data to the sampling design andhandled any concerns or questions which arose regarding release of these data. Special efforts were made todescribe confidentiality procedures and the sampling methodology used. The missing information was thenretrieved in the way most accommodating for the Institutional Coordinator (through the mail, fax, or via theInternet).
Once the list of faculty (and supporting documentation about the format and preparation of the list) wasreviewed, it was receipted as complete into the NSOPF contractor's survey monitoring system (SMS), amicrocomputer-based system used to track all sampled institutions and their status. A folder that containedall of the relevant materials was prepared for each institution. Processing of hardcopy lists required moreeffort than processing electronic faculty lists. If an institution provided a hardcopy list only, sampling stafffollowed these steps to create an electronic file in the required format:
1. Each line (or each faculty member listed) was numbered sequentially. Lists were inspectedto see if all sampling variables were included. If not, other materials in the sampling folderwere inspected to see if any information could be gleaned from them and included on thehardcopy list.
2. All sampling variables were then coded to match specifications for sampling (e.g., genderwas coded as 1=male/2=female; race/ethnicity was coded numerically). The codingspecifications followed the same specifications in the list preparation instructions sent to theinstitution (see Appendix K). In addition, faculty discipline was coded numerically toindicate NEH and non-NEH status.
BEST COPY AVAOLABLE81
92
1993 National Study of Postsecondary FacultyMethodology Report
3. The sampling variables, along with faculty names, addresses, and telephone numbers, weredata-entered into an electronic file for that institution. (If addresses were not already on thehardcopy file, but were available elsewhere, this information was not entered until thesampling step had been completed and then only for the sampled faculty.)
If an institution provided an electronic file, sampling staff inspected the file on-line to ensure that all codingspecifications were followed for the sampling variables and that the file layout was correct. Programmingstaff created utilities which enabled the automated reformatting of those files with incorrect layouts, and therecoding of sampling variables when necessary. In addition, an automated utility was employed to streamlinethe coding of NEH/non-NEH teaching disciplines, although this step still required more detailed effort on thepart of sampling staff. This utility searched the electronic file for the verbatim entry of teaching discipline,and created a collapsed codeframe of each unique discipline along with the number ofoccurrences (or,number of faculty in each discipline). Sampling staff then inspected the codeframe and assigned a numericalcode to each unique teaching discipline to indicate its NEH/non-NEH status. Once the collapsed frame wascoded in this way, the utility then assigned these numerical codes to each faculty member on the faculty list.
When all sampling data were coded, an automated program captured list counts and entered them into adiscrepancy module of the SMS. Sampling staff then reviewed discrepancy reports, comparing the facultytotals from the lists with data from the most recent IPEDS (NCES's Integrated Postsecondary EducationDataSystem). In some instances, the numbers of faculty on the list differed greatly from those from the IPEDS.The discrepancy reports allowed sampling staff to investigate possible areas of discrepancy by breaking downthe faculty totals by gender and full- or part-time status. In this way, it was easy to identify, for example,institutions who had left part-time staff completely off of their list, or those who had reversed the gendercode. Resolution of list discrepancies also involved recontacting the listpreparer or Institutional Coordinator(see section 4.2.5). If the source of the discrepancy was identified by sampling staff, an attempt was made toconfirm the diagnosis of the source of the discrepancy and to retrieve from the institution corrected samplinginformation. On the other hand, if no obvious source of error was identified, the staff explained the problemto the Institutional Coordinator and attempted to find a reason for the discrepancy.
Machine-readable lists (whether data-entered from hardcopy or provided on diskette or tape) which hadpassed through discrepancy review were uploaded directly into an electronic sampling program, whichselected the sample members based on programmed selection algorithms. Lists of sampled faculty atparticipating institutions in the field test were cross-checked against lists of field test participants at thoseinstitutions to ensure that they were not selected again. To minimize respondent burden, OMB restrictionsprohibited NSOPF-93 from resampling and reinterviewing individuals who participated in the 1992 field test.
Sampling and data collection information for sampled respondents was uploaded into an AutoQuest program,which then generated respondent tracking files for coordinated mail and telephone follow-up. The programassigned a unique identification number to each sampled record. All pertinent information was also uploadedinto the Survey Monitoring System (SMS)faculty IDs, names and locating data, and samplinginformationfor purposes of tracking and case management.
6.3 Receipt Control and Monitoring of Institution and Faculty Questionnaires
When completed faculty and institution self-administered questionnaires (SAQs) were received, receiptcontrol staff checked each document for completeness and assigneda disposition code indicating that the casewas complete. If a questionnaire was returned as undeliverable, faculty directories and/or addressinformation supplied by each institution were reviewed for an alternate address. If none was available, it wasforwarded to telephone staff for locating. If a package was returned as undeliverable with a forwardingaddress, the new address was entered into the SMS tracking and monitoring system for future follow-up.
BEST COPY MAO ,e) LE 82
93
1993 National Study of Postsecondary FacultyMethodology Report
Case dispositions for the faculty questionnaire were updated directly into the TNMS (Telephone NumberManagement System) component of AutoQuest, which delivered pending cases to interviewers for telephoneprompting and interviewing. Respondents who had completed self-administered questionnaires (SAQs) were,
therefore, removed from the queue for telephone follow-up once the questionnaire was receipted. Casedispositions were updated to indicate whether the questionnaire was complete or contained items that requiredretrieval. The TNMS was linked through weekly updates to the SMS tracking and monitoring system.
Computer-assisted telephone interviewing was not used for the institution questionnaire; therefore, institutionquestionnaire dispositions were entered directly into the SMS tracking and monitoring system.
6.4 Data Entry and Coding
6.4.1 Data Entry
Both CADE (computer-assisted data entry) and CATI (computer-assisted telephone interviewing) wereperformed using AutoQuest. Separate CADE programs were developed for the self-administered faculty andinstitution questionnaires. A CATI program, equivalent to CADE, was also developed for the facultyquestionnaire, allowing online data entry of telephone interviews by interviewers. The CADE/CATI systems
were designed to:
ensure that all entries conformed to valid ranges ofcodes defined for the particular question
stem;
enforce skip patterns automatically;
conduct inter-item consistency checks where appropriate; and
display the full question and answer texts for verbatim responses.
As part of the statistical quality control program, 100 percent verification was conducted of a randomlyselected subsample of 10 percent of all faculty and institution questionnaires entered in CADE. These caseswere randomly pre-selected before each set of questionnaires was data-entered. When a questionnaire wasflagged for verification, it was then re-keyed by a different data entry operator than had originally keyed thedata. A data entry supervisor then independently reviewed and compared the results of both data entryevents; any discrepancies were resolved by referring to the hardcopy questionnaire and making corrections tothe final questionnaire data. The error rate was less than one-half of one percent for all items keyed.
Quality assurance for faculty interviews entered in CATI consisted of random online monitoring bysupervisors. On a daily basis, a set of times for monitoring and stations to be monitored was automaticallygenerated for each monitor. The program for creating these lists took as inputs the IDs of active prompting,retrieval, and CATI stations; the duration of each monitoring session; the sampling rate; and the total lengthof time to schedule. The monitor station allowed the supervisor to listen to the interview and to view the datathe interviewer entered on screen. Any errors or omissions (including deviations in reading questions, failureto probe or follow instructions, or errors in recording of data) were recorded. The outcome of eachmonitoring event was entered into the system via an AutoQuest application.
6.4.2 Faculty Questionnaire Coding
Coding of faculty questionnaires was conducted using a computer-assisted coding (CAC) system, which alsoused AutoQuest software. Coding of academic discipline was performed online during interviewing or data
83
94
1993 National Study of Postsecondary FacultyMethodology Report
entry. All other faculty questionnaire coding was performed as a post-processing step. Three kinds of codingwere performed for the faculty questionnaire:
Academic discipline. Coding of academic discipline for the respondent's principal teaching field, principalarea of research, degree fields, and courses taught (Questions Al2, A13, B16C, and C23A-E) was performedonline during interviewing or data entry. Online coding for the self-administered questionnaires took placeonly if the respondent had not already provided a code, but had written some sort of codable text. In thesecases, the data entry clerk was prompted to enter verbatim the name of the discipline and follow the sameprocedure as telephone interviewers who performed online coding of academic discipline.
A two-step coding process was designed so that interviewers and data entry staff would not have to pagedown through the entire list to find an appropriate code. The first step was to select the major category orarea. Categories included were those shown in upper case letters on the hardcopy questionnaire, many ofwhich have subcategories. After the major category was selected, the second step was to select the specificdiscipline from the subcategories displayed in the second screen. The appropriate code was then selected andentered next to the verbatim entry.
Quality assurance checks for coding.of academic discipline were performed as part of the regular qualitycontrol procedures for CADE and CATI. However, coding of academic discipline for CADE cases in whichthe respondent had not supplied a code was subjected to a 100 percent verification. Erroneous codes wererecoded to a valid code after examination of the case and its verbatim entry. Cases in which the respondent(or interviewer) had selected a code of "900" ("Other") were also reviewed and coded to a more specificvalue whenever possible.
IPEDS codes. Coding of institution names from which respondents received their academic degrees was amulti-stage process performed after data entry in CADE or CATI was complete. Institution names werereported at Question Bl6E, where respondents had the opportunity to report as many as four academicdegrees received. Coding was performed using an electronic file of the 1991-92 IPEDS directory, whichincluded IPEDS code, city, two-letter state abbreviation, and institutionname for 10,258 less-than-two-year,two-year, and four-year or more institutions. After both CADE and CATI production had been completed, afile of responses to institution name and location was created for each of the four opportunities to report onan academic degree. These files contained a total of 61,759 institution name mentions. The respondent datafile from the first line of Question B16, highest degree, was electronically compared to the IPEDS directoryfile and all exact matches on both institution name and city were automatically coded. Thirty-four percent ofthe institutions in this file were matched and automatically coded.
A combination of techniques was used to code the remaining institutions. First, the uncodable institutionswere sorted by state and institution name, and obvious variations of institution names, for which IPEDScodes were available, were identified and coded. In addition, an automated system was designed for coders toaccess IPEDS data by city or by institution name. The coders entered a search string at each level, and theprogram searched each database for possible matches: This combination of techniques enabled the coding ofan additional 61 percent of the highest degree institutions, bringing the total to 95 percent. Finally, theremaining five percent of highest degree institution mentions were reviewed individually and coded whenpossible. The final total coding rate was 97.8 percent. The remaining 2.2 percent of highest degreeinstitutions remained uncoded or received codes for "Non-U.S. unknown" or for "U.S. not listed."
After confirming the accuracy of coding in this file, the verbatim responses and their selected IPEDS codeswere added to the IPEDS directory. The expanded frame was used to code the remaining responses (QuestionB16, lines 2-4). This increased the frequency of finding exact matches for the automated coding of the
84
95
1993 National Study of Postsecondary FacultyMethodology Report
remaining files. After all four degree files had been coded, the remaining institution names that had not yetbeen coded were examined individually and coded when possible.
If respondents reported the name of a multi-campus university system without specifying the particularbranch from which the degree was obtained, the flagship institution of that system was coded. For example,if respondents wrote "University of Wisconsin" without specifying a branch campus, their institution wascoded as the University of Wisconsin at Madison. If respondents reported the nameof a graduate orprofessional institution without specifying the name of the larger IPEDS institution of whichit was a part
(e.g. "John F. Kennedy School of Government" rather than "Harvard University"), other means wereemployed. Staff consulted reference books, university catalogs and cross-checked respondents' answers tofind the name of the institution to which to assign the answer. NCES materials were consulted to check for
institutions which had closed or had changed their names.
The file was then sorted by 1PED$ code and checked against an NCES-supplied electronic master list ofIPEDS codes. The file was scanned to find discrepancies between verbatims and expected IPEDS codes.Discrepancies were reconciled by attaching the correct IPEDS code to the verbatim naming the institution.
After the entire coding effort was completed, all institution data were exported and sortedby IPEDS code.
All institutions were checked in this manner and corrected whenever errors were encountered. The final
product contains a negligible error rate of 0.2 percent or less.
Coding of foreign institutions was also handled automatically. During the coding process described above,institutions outside the U.S. were identified as uncodable using the IPEDS frame and flagged as foreigninstitutions in the database. The verbatim text for the name of country was then electronically compared tothe list of codes for countries in the NSOPF-88 faculty data file. Nearly all non-U.S. institutions wereautomatically coded in this manner. The remaining uncodable institutions were manually coded afterhardcopy inspection by coding staff. The weighted proportions of respondents who received degrees fromnon-U.S. institutions were as follows: 5.3 percent for the highest degree listed, 6.3 percent for the second
highest degree, 10.9 percent for the third highest degree, and 19.9 percent for fourth highest degree.
Country. Country was coded at Question B16E(1-4) when the institution reported was foreign and could notbe coded within the IPEDS codeframe and at Questions F56 and F57, which asked for the respondent'scountry of birth and/or citizenship. Geo-coding of foreign countries was also performed automatically afterdata entry of the questionnaire in CADE or CATI was complete. The codeframe was constructed using thecodes compiled for NSOPF-88, with additional codes added as necessary. A few foreign institutions weremanually coded based on city (for example, Moscow) or institution name (for example, The Sorbonne).
"Other specify" and verbatim text. Coding of text entered at Questions A2, A9, E47P, wasperformed afterCADE and CATI were complete. In most cases, the text was coded to the existing codes. For Questions A2,
A9, and E47P, the codeframes were expanded to accommodate verbatim responses that could not be coded to
the existing options.
85
96
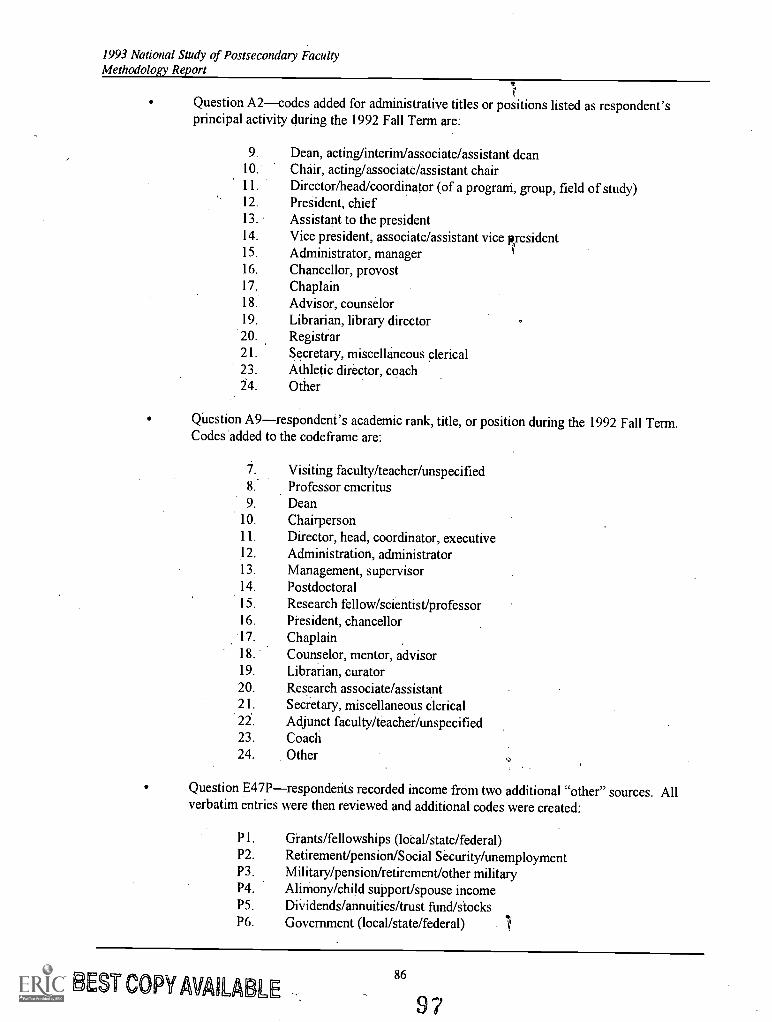
1993 National Study of Postsecondary FacultyMethodology Report
7t.
Question A2-codes added for administrative titles or positions listed as respondent'sprincipal activity during the 1992 Fall Term are:
9. Dean, acting/interim/associate/assistant dean10. Chair, acting/associate/assistant chair11. Director/head/coordinator (of a prograni, group, field of study)12. President, chief13. Assistant to the president14. Vice president, associate/assistant vice president15. Administrator, manager16. Chancellor, provost17, Chaplain18. Advisor, counselor19. Librarian, library director20. Registrar21. Secretary, miscellan' eous clerical23. Athletic director, coach24. Other
Question A9-respondent's academic rank, title, or position during the 1992 Fall Term.Codes added to the codeframe are:
7. Visiting faculty/teacher/unspecified8. Professor emeritus9. Dean
10. Chairperson11. Director, head, coordinator, executive12. Administration, administrator13. Management, supervisor14. Postdoctoral15. Research fellow/scientist/professor16. Pi-esident, chancellor17. Chaplain18. Counselor, mentor, advisor19. Librarian, curator20. Research associate/assistant21. Secretary, miscellaneous clerical22. Adjunct faculty/teacher/unspecified23. Coach24. Other
Question E47P-respondents recorded income from two additional "other" sources. Allverbatim entries were then reviewed and additional codes were created:
P 1. Grants/fellowships (local /state /federal)P2. Retirement/pension/Social Security/unemploymentP3. Military/pension/retirement/other militaryP4. Alimony/child support/spouse incomeP5. DiVidends/annuities/trust fund/stocksP6. Government (local/state/federal) "I
BEST COPY MLA tM LE86
97
1993 National Study of Postsecondary FacultyMethodology Report
P7. LoansP8. Real estate, rental propertiesP9. Other income
An additional 28 items with "other specify" response choices were eligible for coding based on verbatimresponses, but were not coded. Several of these items retained only a small percentage of codable items.Others had key data missing, making them impossible to code. One question, F53B, which included verbatimresponses to the "other specify" option for respondent race/ethnicity, was left unchanged on the data file. Noeffort was made to code the verbatim responses for Question F53B.
6.4.3 Faculty Questionnaire Eligibility Review
At the close of data collection for the faculty survey, all completed faculty questionnaires were reviewed todetermine if any respondents were ineligible. This review was done on several levels. First, the responses toQuestion A9 in the faculty questionnaire, "Which of the following best describes your academic rank, title, orposition at this institution during the 1992 Fall Tenn?" were examined. Verbatim responses to Question A9were reviewed for evidence of ineligibility. These generally consisted of cases in which the respondent hadgiven a title such as research assistant, graduate assistant, lab assistant, or teaching or research fellow. If aquestionable case showed any sign of eligibility (for example, providing responses to the question on classestaught or indicating faculty status) the respondent was assumed to be eligible. This review uncovered 23respondents who were deemed to be ineligible and their questionnaire data were deleted.
The second, more automated, review was performed on cases in which the respondent answered "no" toQuestion 1 ("Did you have any instructional duties?") and Question 3 ("Did you have faculty status?"). Allsuch records were examined, using additional data from the questionnaire to guide the determination ofeligibility. As a result of this review, some additional respondents were deemed ineligible and theirquestionnaire data were deleted.
6.4.4 Institution Questionnaire Coding
Coding for the institution questionnaire was performed for verbatim defmitions of full-time and part-timefaculty, both instructional and non-instructional, and permanent and temporary faculty listed on page 2 of thequestionnaire. The codeframe used to code institutional definitions of faculty was constructed based onresponses from a sample of 100 questionnaires, selected to represent all institutional strata. Codes were thenfine tuned for each individual category to include relevant variations and responses unique to each category.
Once the codeframe was created, a computer-assisted coding system was used to code the verbatim responsesto faculty definitions for all completed institution questionnaires. Verbatim responses were data-entered intothe system, and then coded on a case-by-case basis using the established codeframe. Responses toquestionnaire items A1A-D and A2A-D (numbers of different types of staff employed during the 1992 FallTerm) and B15 and C31 (availability of benefits to temporary staff) appeared on-screen to assist in theinterpretation of responses, particularly when a category was left blank.
Once all definitions were coded, a hardcopy printout of responses by category was reviewed for accuracy andconsistency. Errors were marked on the printout and corrections were made to the file. After all correctionswere made, the code file was merged with the institution questionnaire datafile.
Faculty codeframe. Most responses made reference to workload (number of hours worked, etc.) as part ofthe definition for full or part-time faculty. However, a response was coded as "defined by workload" only
87
9S
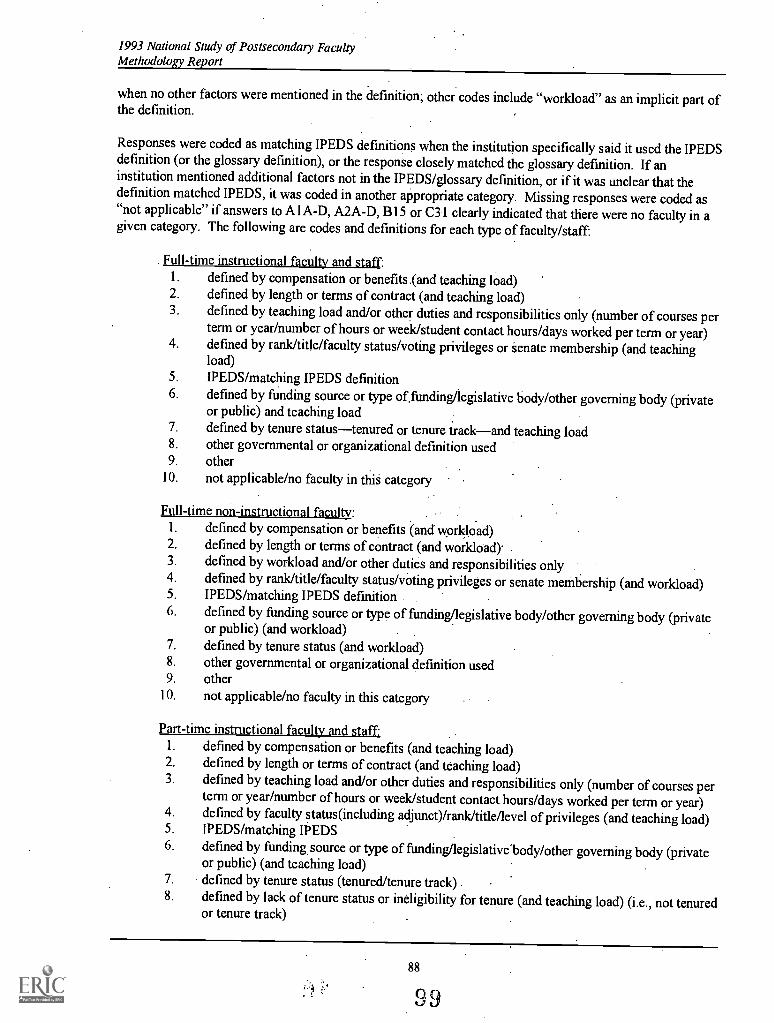
1993 National Study of Postsecondary FacultyMethodology Report
when no other factors were mentioned in the definition; other codes include "workload" as an implicit part ofthe definition.
Responses were coded as matching IPEDS definitions when the institution specifically said it used the IPEDSdefinition (or the glossary definition), or the response closely matched the glossary definition. If aninstitution mentioned additional factors not in the IPEDS/glossary definition, or if it was unclear that thedefinition matched IPEDS, it was coded in another appropriate category. Missing responses were coded as"not applicable" if answers to A1A-D, A2A-D, B15 or C31 clearly indicated that there were no faculty in agiven category. The following are codes and defmitions for each type of faculty/staff:
Full-time instructional faculty and staff:1. defined by compensation or benefits.(and teaching load)2. defined by length or terms of contract (and teaching load)3. defined by teaching load and/or other duties and responsibilities only (number of courses per
term or year/number of hours or week/student contact hours/days workedper term or year)4. defined by rank/title/faculty status/voting privileges or senate membership (and teaching
load)5. IPEDS/matching IPEDS definition6. defined by funding source or type of, funding/legislative body/other governing body (private
or public) and teaching load7. defined by tenure statustenured or tenure trackand teaching load8. other governmental or organizational definition used9. other
10. not applicable/no faculty in this category
Full-time non-instructional faculty:1. defined by compensation or benefits (and workload)2. defined by length or terms of contract (and workload)3. defined by workload and/or other duties and responsibilities only4. defined by rank/title/faculty status/voting privileges or senate membership (and workload)5. IPEDS/matching IPEDS definition6. defined by funding source or type of funding/legislative body/other governing body (private
or public) (and workload)7. defined by tenure status (and workload)8. other governmental or organizational definition used9. other
10. not applicable/no faculty in this category
Part-time instructional faculty and staff;1. defined by compensation or benefits (and teaching load)2. defined by length or terms of contract (and teaching load)3. defined by teaching load and/or other duties and responsibilities only (number of courses per
term or year/number of hours or week/student contact hours/days worked per term or year)4. defined by faculty status(including adjunct) /rank/title/level of privileges (and teaching load)5. IPEDS/matching IPEDS6. defined by funding.source or type of funding/legislative'body/other governing body (private
or public) (and teaching load)7. defined by tenure status (tenured/tenure track)8. defined by lack of tenure status or ineligibility for tenure (and teaching load) (i.e., not tenured
or tenure track)
88
99
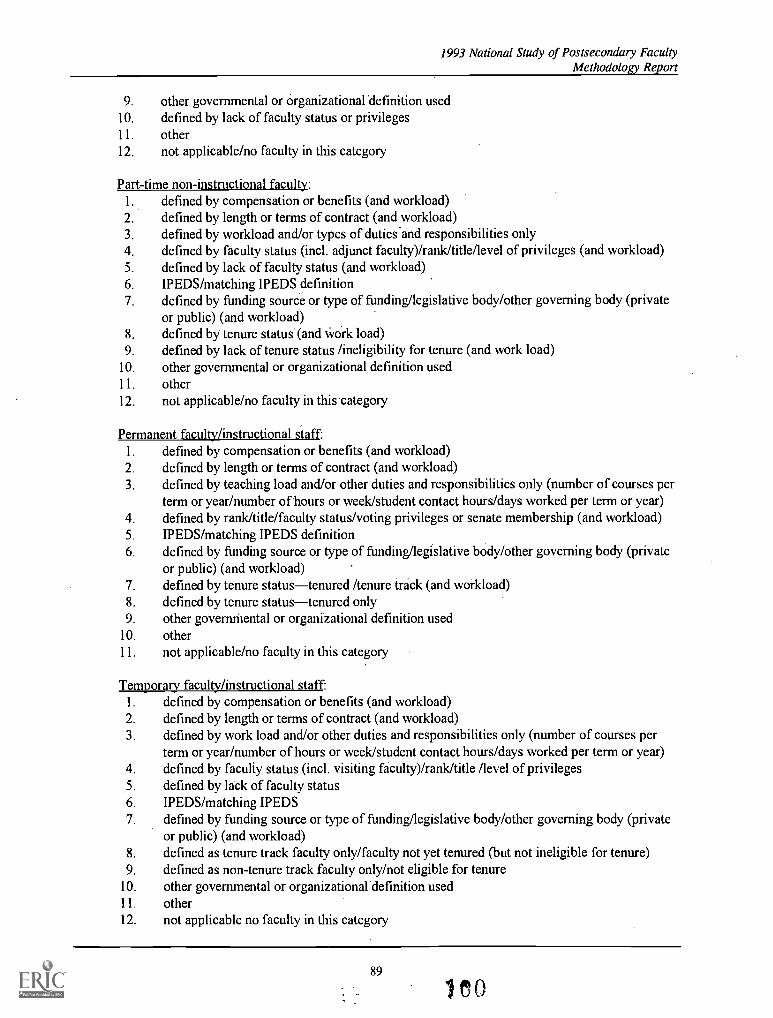
1993 National Study of Postsecondary FacultyMethodology Report
9. other governmental or organizational definition used10. defined by lack of faculty status or privileges11. other12. not applicable/no faculty in this category
Part-time non-instructional faculty:1. defined by compensation or benefits (and workload)2. defined by length or terms of contract (and workload)3. defined by workload and/or types of duties .and responsibilities only4. defined by faculty status (incl. adjunct faculty)/rank/title/level of privileges (and workload)5. defined by lack of faculty status (and workload)6. IPEDS/matching IPEDS definition7. defined by funding source or type of funding/legislative body/other governing body (private
or public) (and workload)8. defined by tenure status (and work load)9. defined by lack of tenure status /ineligibility for tenure (and work load)
10. other governmental or organizational definition used11. other12. not applicable/no faculty in this category
Permanent faculty/instructional staff:1. defined by compensation or benefits (and workload)2. defined by length or terms of contract (and workload)3. defined by teaching load and/or other duties and responsibilities only (number of courses per
term or year/number of hours or week/student contact hours/days worked per term or year)4. defined by rank/title/faculty status/voting privileges or senate membership (and workload)5. IPEDS/matching IPEDS definition6. defined by funding source or type of funding/legislative body/other governing body (private
or public) (and workload)7. defined by tenure status-tenured /tenure track (and workload)8. defined by tenure status-tenured only9. other governmental or organizational definition used
10. other11. not applicable/no faculty in this category
Temporary faculty/instructional staff:1. defined by compensation or benefits (and workload)2. defined by length or terms of contract (and workload)3. defined by work load and/or other duties and responsibilities only (number of courses per
term or year/number of hours or week/student contact hours/days worked per term or year)4. defined by faculty status (incl. visiting faculty)/rank/title /level of privileges5. defined by lack of faculty status6. IPEDS/matching IPEDS7. defined by funding source or type of funding/legislative body/other governing body (private
or public) (and workload)8. defined as tenure track faculty only/faculty not yet tenured (but not ineligible for tenure)9. defined as non-tenure track faculty only/not eligible for tenure
10. other governmental or organizational-definition used11. other12. not applicable no faculty in this category
89
e 0
1993 National Study of Postsecondary FacultyMethodology Report
"Other specify" and verbatim text. In addition to the six questions from which the faculty codeframe wasdeveloped, six other institution questionnaire items were eligible for verbatim or "other specify" responses.Of these, only the answers to Questions BlOC1 and C26C1, which asked for a description of "any otheractions" taken to lower the percent of tenured faculty (for full-time instructional faculty and for full-time non-instructional faculty, respectively) provided consistent verbatim responses. For both Questions BlOC1 andC26C1, the most frequently cited actions taken to reduce the percent of tenured faculty involved downsizing,redefining positions as non-tenured, and offering early retirement incentives. The complete listing ofall"other specify" and verbatim responses is stored in electronic text form at NCES.
6.5 Scan Editing, Machine Editing, and Imputation
6.5.1 Faculty Questionnaire Editing and Imputation
Prior to data entry, editors scanned faculty questionnaires for readability, completeness, and overall adequacy.Problems (e.g., eligibility questions, incomplete questionnaires, etc.) were identified and forwarded to anedit/coding supervisor for resolution.
Range errors, logical inconsistencies, erroneous skip patterns, and any missing critical items were identifiedby a computer-based cleaning and editing system specifically developed for NSOPF-93. Whenever a casehad one or more critical items missing, CADE operators were notified of the specific items that requiredretrieval and prompted to route the case to the telephone retrieval supervisor for follow-up. Moreover, theprogram identified out-of-range responses during data-entry and did not allow them to be keyed withoutconfirmation that the response was accurately entered.
For erroneous skip patterns, values were logically assigned as feasible on the basis of the presence or absenceof responses within the skip pattern, given the responses provided. For errors that could not be corrected inthis fashion, the hardcopy questionnaire was inspected and if necessary, the respondent was called to try toresolve the problem. Questionnaires with missing critical items were forwarded to telephone interviewers forretrieval.
Range errors were examined and corrected through hardcopy examination, which involved reviewing asample of cases with out-of-range responses in order to determine whether the responses were caused bysomething other than random variation or unique respondent situations. Following the examination, variableswere treated in one of two ways. In some cases, the out-of-range response was topped off at the highest valueencompassing 99.9 percent of the responses. There were no out-of-range values at the low end of the valuerange. As part of the cleaning and editing process, out-of-range values in a seriesor set of related items were"scaled" proportionally to an overall total.
On the fewer than 1 percent of the cases for which data on gender, race, and employment status of facultywere missing, the data were directly imputed whenever possible. This information had already been collectedfor most faculty on the sampling lists supplied by participating institutions. Additional editing andconsistency checks were run to enforce ranges, skip pattern rules, and logical consistency amongquestionnaire items.
, Because of the large amount of questionnaire data, a system of algorithms was developed to check and, ifpossible, to correct the validity of data elements. The principal rulewas to preserve data collected from thequestionnaires while correcting logical inconsistencies between related data elements. After cleaning, thosedata elements that remained missing were subsequently imputed.
90
11 t
1993 National Study of Postsecondary FacultyMethodology Report
Depending on the scale of the variable being imputed, one of two methods were used: 1) Regressionimputation was used for continuous and dichotomous variables; and 2) Hotdeck imputation was used forunordered polytomous variables. The regression method incorporated in NCES's PROC IMPUTE was usedto impute missing values for approximately 90 percent of the 395 items on the faculty questionnaire'. Of thetotal of 395 items, 353 were imputed using the regression-based imputation procedures only.
After a first round of imputation using PROC IMPUTE, the distributions and values of imputed items werecompared to distributions and values for recorded items (i.e. non-missing data). These comparisons helped topinpoint variables needing special treatment in order to produce credible imputed values. Special steps weretaken to address particular problems arising during imputation. These were:
"Spikes" at zero values. A number of variables showed "spikes," where the same value was imputed to anumber of cases within an imputation cell. To address the problem of spikes at the zero value, these variableswere reimputed in two steps. First, a dummy variable to flag cases as containing a zero value or a valuegreater than zero was modeled. Second, only those cases which received the imputed dummy value greaterthan zero were modeled using the standard regression-based imputation procedures. This two-step process"smoothed out" the distribution of imputed values, eliminating the spikes at zero.
Illogical/implausible imputed values. The first round of regression-based imputation assigned values toitems 1320A and 820B (faculty productivity measures, i.e. books and articles published, presentations,patents, etc.). However, this imputation produced inappropriate imputations for particular types of faculty.For example, records of faculty members whose reported teaching and research fields had nothing to do withartistic performance were imputed to have performed artistic presentations. Likewise, faculty members whosereported areas of activity included teaching, but no research, were imputed to have performed researchactivities. In order to address these cases, another regression model including eight more predictorsinaddition to the five "core predictors"was specified for PROC IMPUTE to impute values for questionnairesections whose items depended on proper specifications of teaching and research activities.
Imputing DKs. Two imputations were performed for selected items in the faculty questionnaire with "don'tknow" responses, where this caused 30 percent or more of the responses to be eligible for imputation. In thefirst imputation, "don't knows" were treated as legitimate responses. For these items, in the first imputation,missing responses were imputed across all response categories, including the "don't know" category. In thesecond imputation, "don't knows" were set to "missing" before imputation was performed. Two imputationswere done to allow researchers to choose how to treat "don't knows" in their analyses. Two variables wereused to signal these different approaches to imputation. The first, the survey variable, preserved "don'tknow" as a legitimate response. The second, identified by the letter "Y" preceding the variable name, includesimputation for "don't know" as well as "missing." The following faculty variables had two imputationsperformed:
"For a description of this technique, see American Institutes of Research, Guidebook for Imputation ofMissing Data (August, 1980). AIR prepared this guidebook for the National Center for Education Statistics, undercontract #300-78-150.
91
102
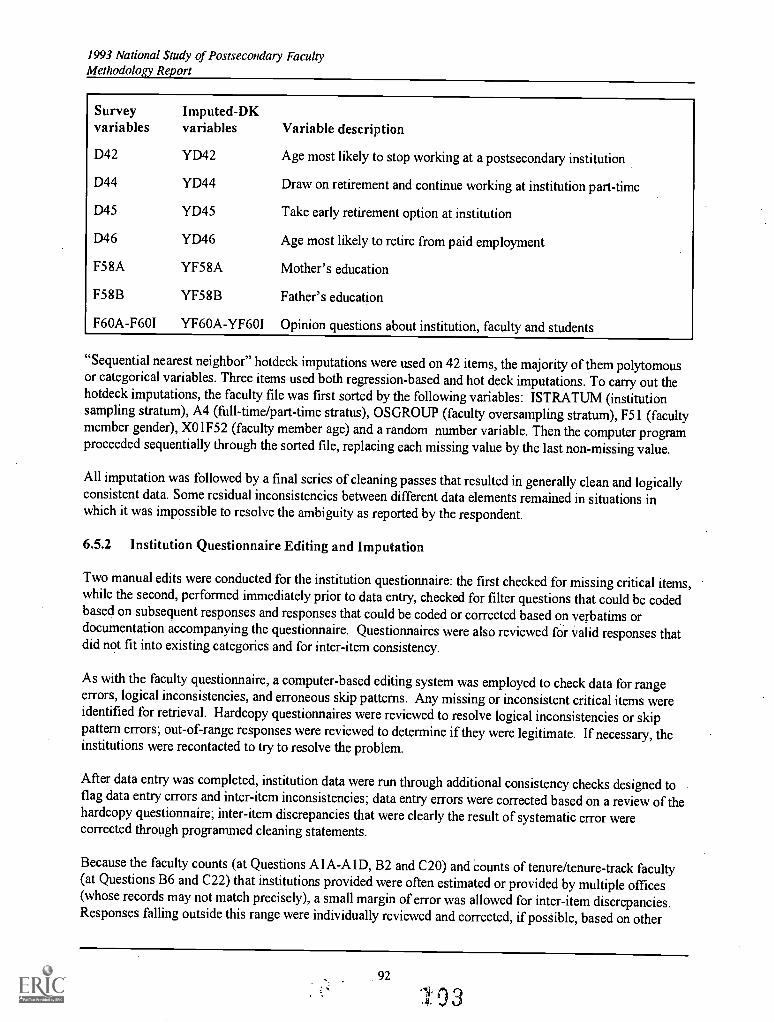
1993 National Study of Postsecondary FacultyMethodology Report
Survey Imputed-DKvariables variables
D42
D44
D45
D46
F5 8A
F58B
F60A-F601
YD42
YD44
YD45
YD46
YF58A
YF58B
YF60A-YF60I
Variable description
Age most likely to stop working at a postsecondary institution
Draw on retirement and continue working at institution part-time
Take early retirement option at institution
Age most likely to retire from paid employment
Mother's education
Father's education
Opinion questions about institution, faculty and students
"Sequential nearest neighbor" hotdeck imputations were used on 42 items, the majority of them polytomousor categorical variables. Three items used both regression-based and hot deck imputations. To carry out thehotdeck imputations, the faculty file was first sorted by the following variables: ISTRATUM (institutionsampling stratum), A4 (full-time/part-time stratus), OSGROUP (faculty oversampling stratum), F51 (facultymember gender), X01F52 (faculty member age) and a random number variable. Then the computer programproceeded sequentially through the sorted file, replacing each missing value by the last non-missing value.
All imputation was followed by a final series of cleaning passes that resulted in generally clean and logicallyconsistent data. Some residual inconsistencies between different data elements remained in situations inwhich it was impossible to resolve the ambiguity as reported by the respondent.
6.5.2 Institution Questionnaire Editing and Imputation
Two manual edits were conducted for the institution questionnaire: the first checked for missing critical items,while the second, performed immediately prior to data entry, checked for filter questions that could be codedbased on subsequent responses and responses that could be coded or corrected based on verbatims ordocumentation accompanying the questionnaire. Questionnaires were also reviewed for valid responses thatdid not fit into existing categories and for inter-item consistency.
As with the faculty questionnaire, a computer-based editing system was employed to check data for rangeerrors, logical inconsistencies, and erroneous skip patterns. Any missing or inconsistent critical items wereidentified for retrieval. Hardcopy questionnaires were reviewed to resolve logical inconsistencies or skippattern errors; out-of-range responses were reviewed to determine if they were legitimate. If necessary, theinstitutions were recontacted to try to resolve the problem.
After data entry was completed, institution data were run through additional consistency checks designed toflag data entry errors and inter-item inconsistencies; data entry errors were corrected based on a review of thehardcopy questionnaire; inter-item discrepancies that were clearly the result of systematic error werecorrected through programmed cleaning statements.
Because the faculty counts (at Questions A1A-A1D, B2 and C20) and counts of tenure/tenure-track faculty(at Questions B6 and C22) that institutions provided were often estimated or provided by multiple offices(whose records may not match precisely), a small margin of error was allowed for inter-item discrepancies.Responses falling outside this range were individually reviewed and corrected, if possible, based on other
92
103
1993 National Study of Postsecondary FacultyMethodology Report
questionnaire data. Discrepancies outside this margin of error were reviewed again, and, as appropriate, set to
missing.
On the NSOPF-93 institution file, substantive responses were imputed for missing data using the regression
method. "Don't know" responses were also imputed to distribute "don't know" across all responsecategories. Following imputation, a number of inter-item consistency checks and post-imputation cleaning
procedures were implemented to produce logically consistent and valid data.
Imputed values at A2A-2F (counts for instructional faculty) and C20A-F (counts for non-instructional
faculty) were corrected whenever possible by performing the math for non-imputed values to arrive at a
contextually accurate amount. When multiple items were imputed, variables were corrected by using mean
values to arrive at values proportionate to faculty totals. Errors in counts of tenured/tenure track faculty
were similarly cleaned by using mean values to arrive at values proportionate to the total number ofpermanent faculty (at Question A2A) in the questionnaire. Those values replaced imputed values that
caused the total number of tenured/tenure track faculty to be larger than the total number of temporary and
permanent faculty reported at Question AlA.
A small number of discrepancies at Questions A2A-F and C20-F resulting from non-imputed data were
allowed to stand. In these instances, discrepancies could not be corrected by using relevant questionnaire
data. Hardcopy data for each case was reviewed to check for data-entry errors, or other problemsindicating whether the value should be corrected or set to missing and imputed.
Answers at Question B17 (percent of undergraduate instruction carried out by full-time faculty) were
cleaned so that the total of Questions B17 and D41 (percent of undergraduate instruction carried out by
part-time faculty) was not greater than 100 percent. Responses totaling less or more than 100 percent werereviewed individually and cleaned on a case-by-case basis.
6.6 Retrieval of Missing Data
Appendices I and J contain lists of the items deemed critical for both survey questionnaires. If one or more of
these items were missing, calls were made to retrieve the missing information. For the faculty questionnaire,
out of the 20,785 self-administered instruments, approximately 5,705 (27 percent) were identified forretrieval. Retrieval was completed for 5,483 (96 percent) of these questionnaires. Of the 5,483 cases forwhich retrieval was completed, respondents provided some or all ofthe missing data required inapproximately 84 percent of the cases. The remaining 16 percent of the 5,483 cases were determined to be
complete without retrieval based on policy decisions reviewed with NCES. All faculty retrieval activities
were completed by January 29, 1994.
Faculty self-administered questionnaires (SAQs) identified through theedit program as having missing data
on critical items were forwarded to interviewers for additional follow-up. Case records were routed to a
special location within CADE. Telephone retrievers were provided with the hardcopy SAQ, accompanied by a
retrieval form listing items to be retrieved. The interviewer reviewed the hardcopy before calling to confirm
that the case needed retrieval. "Don't knows" and "refusals" were considered legitimate responses for
retrieval purposes and not followed up. Interviewers accessed contact information and updated case
dispositions through the CATI system. New data were recorded directly on the hardcopy questionnaire and
entered by data preparation staff.
For the institution questionnaires, 178 (20 percent) were identified for retrieval. Retrieval was completed for
172 (97 percent) of these cases. All institution retrieval activities were completed by June 8, 1994.
93
104
1993 National Study of Postsecondary FacultyMethodology Report
Retrievals for the institution questionnaire were identified largely through the two manual edits prior to dataentry; again, "don't knows" and "refusals" were considered legitimate responses and not retrieved.Information was obtained both over the telephone and by fax. Once retrieval efforts fora case had beencompleted, the questionnaire was sent to data entry. If a retrieval was identified during the data entry process,the operator discontinued data entry on that case and routed it to a supervisor for review; if the informationcould not be obtained from existing documentation, the supervisor then forwarded the case to an interviewerfor telephone retrieval.
6.7 Storage and Protection of Completed Instruments
Whenever questionnaires were not being processed, they were stored in a restricted area; access was limitedto authorized project staff who had signed the NCES Affidavit of Nondisclosure and had it notarized. Theroom was locked at night and protected by a surveillance system.
Data integrity was further ensured through a combination of electronic systemaccess restrictions, screenupdate rules, and system maintenance and backup procedures that protected against unauthorized systemaccess, mistakes in case information entry, and data loss. Every night all files used by the system were copiedto tape and stored in a secure location. Information that identified individuals was maintained in physicallyseparate files accessible only to authorized project staff.
Long-term storage of hardcopy documents is maintained in secure facilities with 24-hour surveillance, both atthe contractor's Central Office and off-site, with access limited to authorized project staff who signed and hadthe NCES Affidavit of Nondisclosure notarized.
94X05
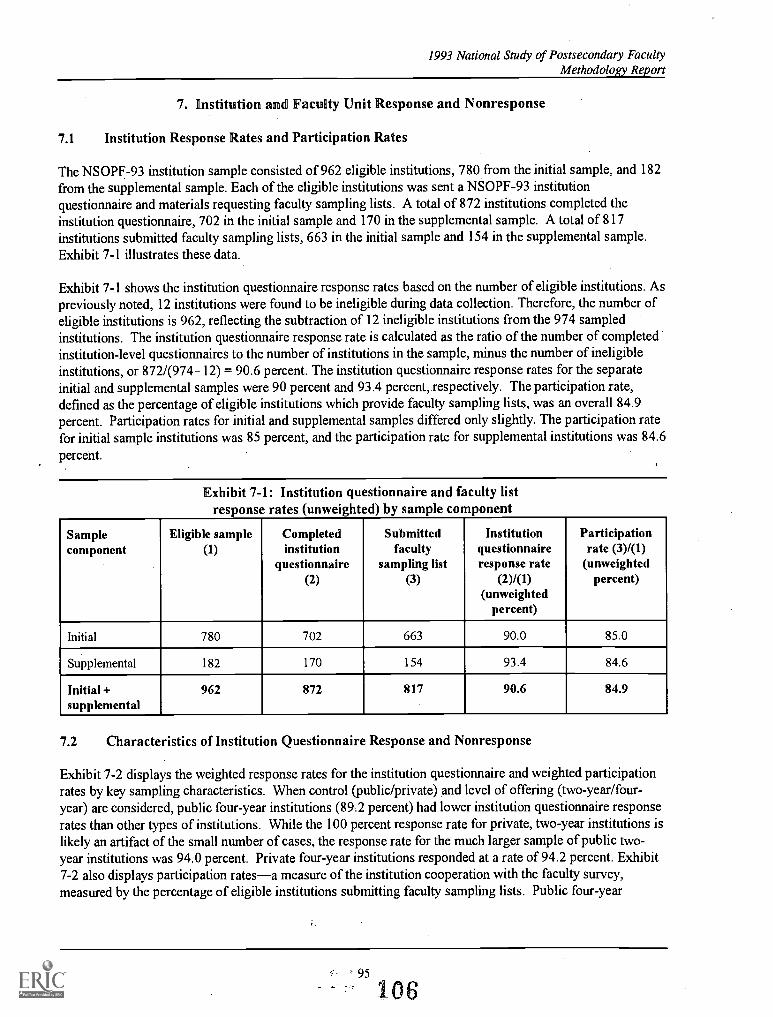
1993 National Study of Postsecondary FacultyMethodology Report
7. Institution and Faculty Unit Response and Nonresponse
7.1 Institution Response Rates and Participation Rates
The NSOPF-93 institution sample consisted of 962 eligible institutions, 780 from the initial sample, and 182from the supplemental sample. Each of the eligible institutions was sent a NSOPF-93 institutionquestionnaire and materials requesting faculty sampling lists. A total of 872 institutions completed theinstitution questionnaire, 702 in the initial sample and 170 in the supplemental sample. A total of 817institutions submitted faculty sampling lists, 663 in the initial sample and 154 in the supplemental sample.Exhibit 7-1 illustrates these data.
Exhibit 7-1 shows the institution questionnaire response rates based on the number of eligible institutions. Aspreviously noted, 12 institutions were found to be ineligible during data collection. Therefore, the number ofeligible institutions is 962, reflecting the subtraction of 12 ineligible institutions from the 974 sampledinstitutions. The institution questionnaire response rate is calculated as the ratio of the number of completedinstitution-level questionnaires to the number of institutions in the sample, minus the number of ineligibleinstitutions, or 872/(974-12) = 90.6 percent. The institution questionnaire response rates for the separateinitial and supplemental samples were 90 percent and 93.4 percent, respectively. The participation rate,defined as the percentage of eligible institutions which provide faculty sampling lists, was an overall 84.9percent. Participation rates for initial and supplemental samples differed only slightly. The participation ratefor initial sample institutions was 85 percent, and the participation rate for supplemental institutions was 84.6percent.
Exhibit 7-1: Institution questionnaire and faculty listresponse rates (unweighted) by sample component
Samplecomponent
Eligible sample(1)
Completedinstitution
questionnaire
Submittedfaculty
sampling list
Institutionquestionnaireresponse rate
Participationrate (3)41)
(unweighted(2) (3) (2)/(1) percent)
(unweightedpercent)
Initial 780 702 663 90.0 85.0
Supplemental 182 170 154 93.4 84.6
Initial +supplemental
962 872 817 90.6 84.9
7.2 Characteristics of Institution Questionnaire Response and Nonresponse
Exhibit 7-2 displays the weighted response rates for the institution questionnaire and weighted participationrates by key sampling characteristics. When control (public/private) and level of offering (two-year/four-year) are considered, public four-year institutions (89,2 percent) had lower institution questionnaire responserates than other types of institutions. While the 100 percent response rate for private, two-year institutions islikely an artifact of the small number of cases, the response rate for the much larger sample of public two-year institutions was 94.0 percent. Private four-year institutions responded at a rate of 94.2 percent. Exhibit7-2 also displays participation ratesa measure of the institution cooperation with the faculty survey,measured by the percentage of eligible institutions submitting faculty sampling lists. Public four-year
95
106
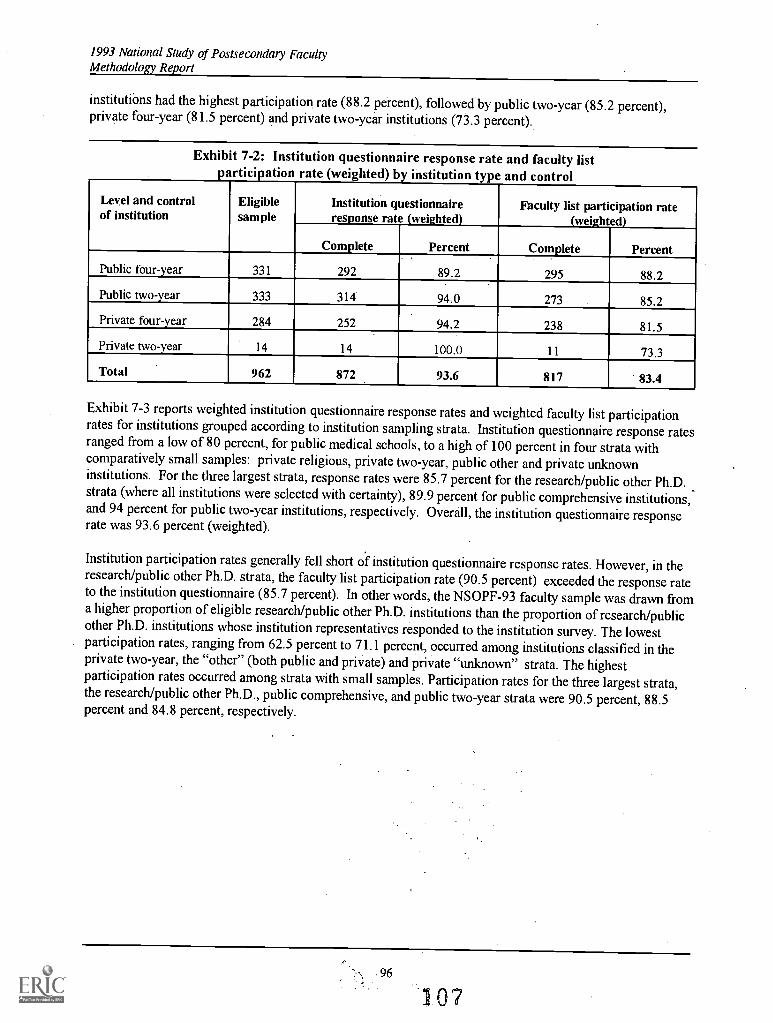
1993 National Study of Postsecondary FacultyMethodology Report
institutions had the highest participation rate (88.2 percent), followed by public two-year (85.2 percent),private four-year (81.5 percent) and private two-year institutions (73.3 percent).
Exhibit 7-2: Institution questionnaire response rate and faculty listartici ation rate (weighted) by institution type and control
Level and controlof institution
Eligiblesample
Institution questionnaireresponse rate (weighted)
Faculty list participation rate(weighted)
Complete Percent Complete Percent
Public four-year 331 292 89.2 295 88.2
Public two-year 333 314 94.0 273 85.2
Private four-year 284 252 94.2 238 81.5
Private two-year 14 14 100.0 11 73.3
Total 962 872 93.6 817 83.4
Exhibit 7-3 reports weighted institution questionnaire response rates and weighted faculty list participationrates for institutions grouped according to institution sampling strata. Institution questionnaire response ratesranged from a low of 80 percent, for public medical schools, to a high of 100 percent in four strata withcomparatively small samples: private religious, private two-year, public other and private unknowninstitutions. For the three largest strata, response rates were 85.7 percent for the research/public other Ph.D.strata (where all institutions were selected with certainty), 89.9 percent for public comprehensive institutions,and 94 percent for public two-year institutions, respectively. Overall, the institution questionnaire responserate was 93.6 percent (weighted).
Institution participation rates generally fell short of institution questionnaire response rates. However, in theresearch/public other Ph.D. strata, the faculty list participation rate (90.5 percent) exceeded the response rateto the institution questionnaire (85.7 percent). In other words, the NSOPF-93 faculty sample was drawn froma higher proportion of eligible research/public other Ph.D. institutions than the proportion of research/publicother Ph.D. institutions whose institution representatives responded to the institution survey. The lowestparticipation rates, ranging from 62.5 percent to 71.1 percent, occurred among institutions classified in theprivate two-year, the "other" (both public and private) and private "unknown" strata. The highestparticipation rates occurred among strata with small samples. Participation rates for the three largest strata,the research/public other Ph.D., public comprehensive, and public two-year strata were 90.5 percent, 88.5percent and 84.8 percent, respectively.
96
07
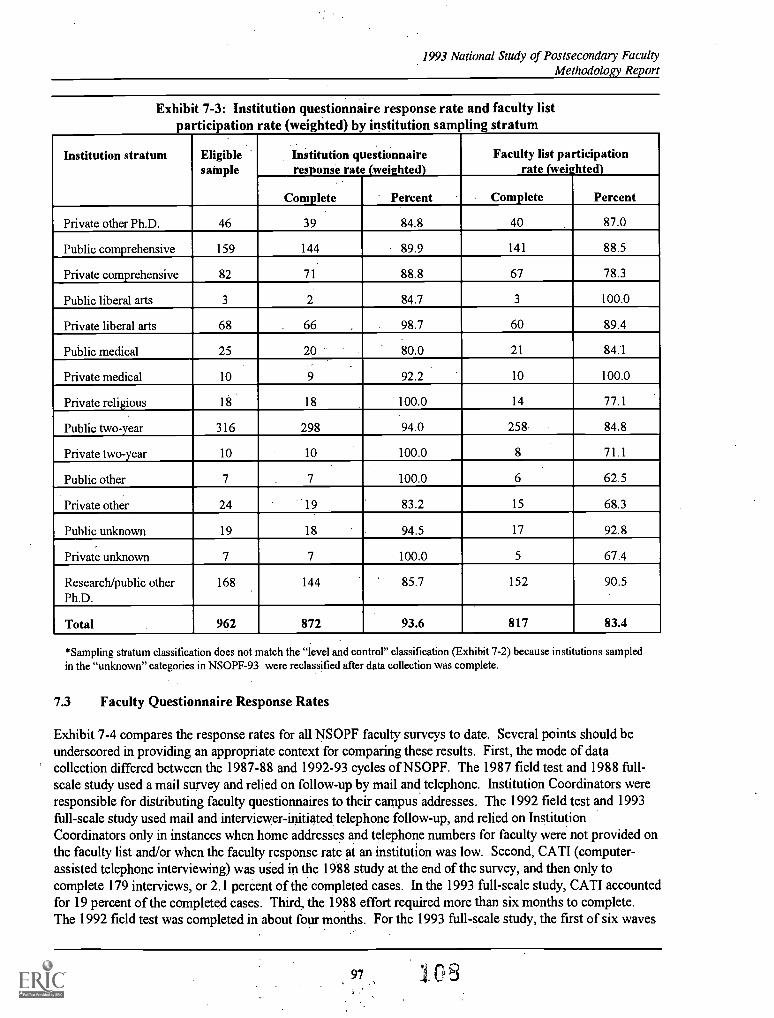
1993 National Study of Postsecondary FacultyMethodology Report
Exhibit 7-3: Institution questionnaire response rate and faculty listartici ation rate (weighted) by institution sampling stratum
Institution stratum Eligiblesample
Institution questionnaireresponse rate (weighted)
Percent
Faculty list participationrate (weighted)
Complete PercentComplete
Private other Ph.D. 46 39 84.8 40 87.0
Public comprehensive 159 144 89.9 141 88.5
Private comprehensive 82 71 88.8 67 78.3
Public liberal arts 3 2 84.7 3 100.0
Private liberal arts 68 66 98.7 60 89.4
Public medical 25 20 80.0 21 84:1
Private medical 10 9 92.2 10 100.0
Private religious 18 18 100.0 14 77.1
Public two-year 316 298 94.0 258 84.8
Private two-year 10 10 100.0 8 71.1
Public other 7 7 100.0 6 62.5
Private other 24 19 83.2 15 68.3
Public unknown 19 18 94.5 17 92.8
Private unknown 7 7 100.0 5 67.4
Research/public otherPh.D.
168 144 85.7 152 90.5
Total 962 872 93.6 817 83.4
*Sampling stratum classification does not match the "level and control" classification (Exhibit 7-2) because institutions sampledin the "unknown" categories in NSOPF-93 were reclassified after data collection was complete.
7.3 Faculty Questionnaire Response Rates
Exhibit 7-4 compares the response rates for all NSOPF faculty surveys to date. Several points should beunderscored in providing an appropriate context for comparing these results. First, the mode of datacollection differed between the 1987-88 and 1992-93 cycles of NSOPF. The 1987 field test and 1988 full-scale study used a mail survey and relied on follow-up by mail and telephone. Institution Coordinators wereresponsible for distributing faculty questionnaires to their campus addresses. The 1992 field test and 1993full-scale study used mail and interviewer-initiated telephone follow-up, and relied on InstitutionCoordinators only in instances when home addresses and telephone numbers for faculty were not provided onthe faculty list and/or when the faculty response rate at an institution was low. Second, CATI (computer-assisted telephone interviewing) was used in the 1988 study at the end of the survey, and then only tocomplete 179 interviews, or 2.1 percent of the completed cases. In the 1993 full-scale study, CATI accountedfor 19 percent of the completed cases. Third, the 1988 effort required more than six months to complete.The 1992 field test was completed in about four months. For the 1993 full-scale study, the first of six waves
97 103
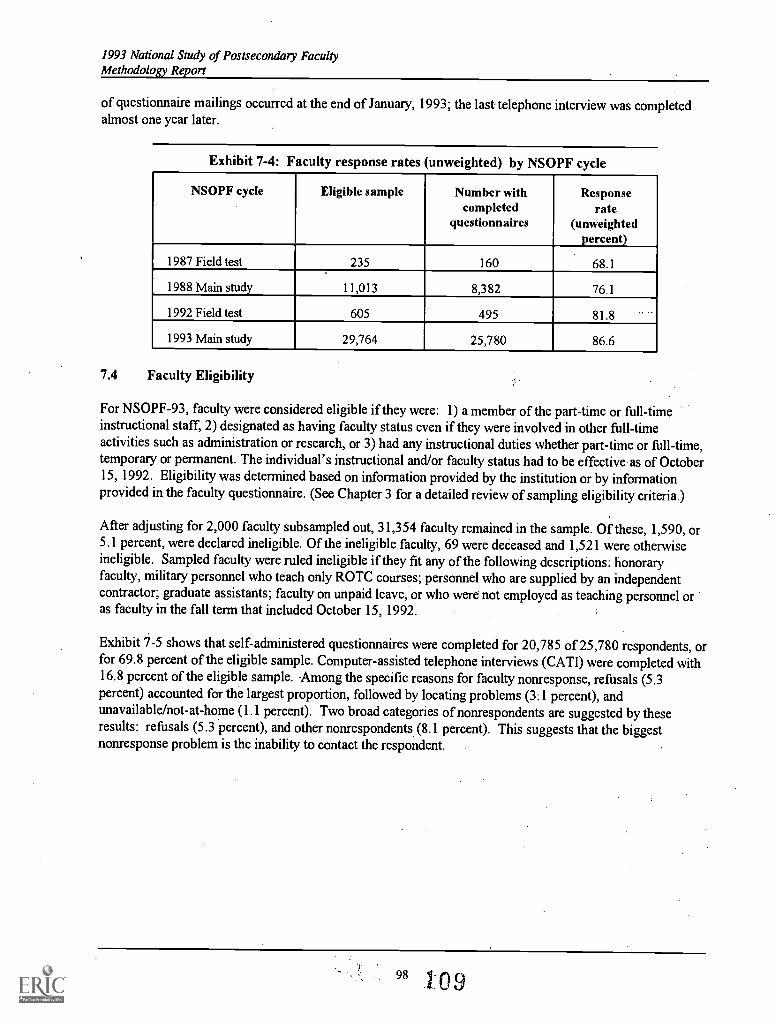
1993 National Study of Postsecondary FacultyMethodology Report
of questionnaire mailings occurred at the end of January, 1993; the last telephone interview was completedalmost one year later.
Exhibit 7-4: Faculty response rates (unweighted) by NSOPF cycle
NSOPF cycle Eligible sample Number withcompleted
questionnaires
Responserate
(unweightedpercent)
1987 Field test 235 160 68.1
1988 Main study 11,013 8,382 76.1
1992 Field test 605 495 81.8
1993 Main study 29,764 25,780 86.6
7.4 Faculty Eligibility
For NSOPF-93, faculty were considered eligible if they were: 1) a member of the part-time or full-timeinstructional staff, 2) designated as having faculty status even if they were involved in other full-timeactivities such as administration or research, or 3) had any instructional duties whether part-time or full-time,temporary or permanent. The individual's instructional and/or faculty status had to be effective as of October15, 1992. Eligibility was determined based on information provided by the institution or by informationprovided in the faculty questionnaire. (See Chapter 3 for a detailed review of sampling eligibility criteria.)
After adjusting for 2,000 faculty subsampled out, 31,354 faculty remained in the sample. Of these, 1,590, or5.1 percent, were declared ineligible. Of the ineligible faculty, 69 were deceased and 1,521 were otherwiseineligible. Sampled faculty were ruled ineligible if they fit any of the following descriptions: honoraryfaculty, military personnel who teach only ROTC courses; personnel who are supplied by an independentcontractor; graduate assistants; faculty on unpaid leave, or who were not employed as teaching personnel oras faculty in the fall term that included October 15, 1992.
Exhibit 7-5 shows that self-administered questionnaires were completed for 20,785 of 25,780 respondents, orfor 69.8 percent of the eligible sample. Computer-assisted telephone interviews (CATI) were completed with16.8 percent of the eligible sample. Among the specific reasons for faculty nonresponse, refusals (5.3percent) accounted for the largest proportion, followed by locating problems (3:1 percent), andunavailable/not-at-home (1.1 percent). Two broad categories of nonrespondents are suggested by theseresults: refusals (5.3 percent), and other nonrespondents (8.1 percent). This suggests that the biggestnonresponse problem is the inability to contact the respondent. .
98 1- 0
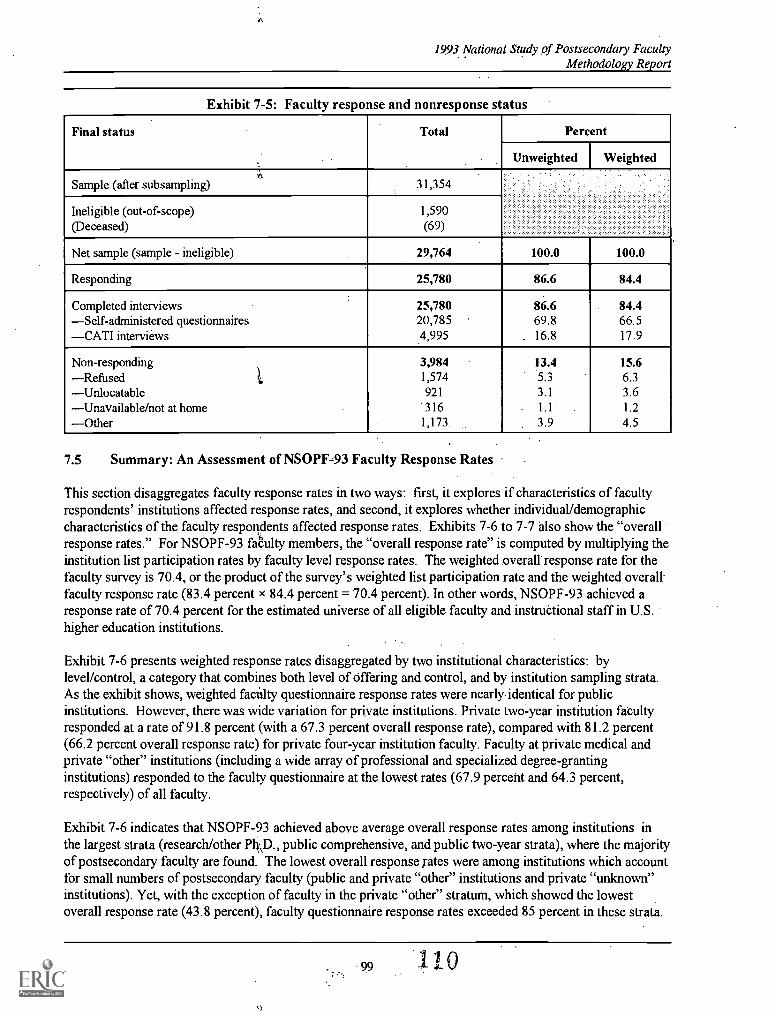
1993 National Study of Postsecondary FacultyMethodology Report
Exhibit 7-5: Faculty response and nonresponse status
Final status Total Percent
Unweighted Weighted
Sample (after subsampling) 31,354
Ineligible (out-of-scope) 1,590(Deceased) (69)
Net sample (sample - ineligible) 29,764 100.0 100.0
Responding 25,780 86.6 84.4
Completed interviews 25,780 86.6 84.4-Self-administered questionnaires 20,785 69.8 66.5-CATI interviews 4,995 16.8 17.9
Non-responding 3,984 13.4 15.6-Refused 1 1,574 5.3 6.3-Unlocatable 921 3.1 3.6-Unavailable/not at home 316 1.1 1.2
-Other 1,173 3.9 4.5
7.5 Summary: An Assessment of NSOPF-93 Faculty Response Rates
This section disaggregates faculty response rates in two ways: first, it explores if characteristics of facultyrespondents' institutions affected response rates, and second, it explores whether individual/demographiccharacteristics of the faculty respondents affected response rates. Exhibits 7-6 to 7-7 also show the "overallresponse rates." For NSOPF-93 faCulty members, the "overall response rate" is computed by multiplying theinstitution list participation rates by faculty level response rates. The weighted overall response rate for thefaculty survey is 70.4, or the product of the survey's weighted list participation rate and the weighted overall-faculty response rate (83.4 percent x 84.4 percent = 70.4 percent). In other words, NSOPF-93 achieved aresponse rate of 70.4 percent for the estimated universe of all eligible faculty and instructional staff in U.S.higher education institutions.
Exhibit 7-6 presents weighted response rates disaggregated by two institutional characteristics: bylevel/control, a category that combines both level of offering and control, and by institution sampling strata.As the exhibit shows, weighted facti' lty questionnaire response rates were nearly identical for publicinstitutions. However, there was wide variation for private institutions. Private two-year institution facultyresponded at a rate of 91.8 percent (with a 67.3 percent overall response rate), compared with 81.2 percent(66.2 percent overall response rate) for private four-year institution faculty. Faculty at private medical andprivate "other" institutions (including a wide array of professional and specialized degree-grantinginstitutions) responded to the faculty questionnaire at the lowest rates (67.9 percent and 64.3 percent,respectively) of all faculty.
Exhibit 7-6 indicates that NSOPF-93 achieved above average overall response rates among institutions inthe largest strata (research/other Pflp., public comprehensive, and public two-year strata), where the majorityof postsecondary faculty are found. The lowest overall response Tates were among institutions which accountfor small numbers of postsecondary faculty (public and private "other" institutions and private "unknown"institutions). Yet, with the exception of faculty in the private "other" stratum, which showed the lowestoverall response rate (43.8 percent), faculty questionnaire response rates exceeded 85 percent in these strata.
99 10 0
1993 National Study of Postsecondary FacultyMethodology Report
Therefore, the low institution faculty list participation rates explained the low overall response rates in thepublic "other" and private "unknown" strata.
Exhibit 7-7 indicates how specific individual-level characteristics (gender, race/ethnicity, academic discipline,and employment status) affected weighted response rates. In interpreting these data, two points should bekept in mind. First, categorization of individual faculty members depended on information each participatinginstitution provided on the faculty sampling lists. These lists' validity is discussed in Chapter 9. Second,overall faculty response rates are calculated by multiplying the overall weighted institution faculty listparticipation rate (83.4 percent) by weighted response rates for each faculty-level category. Therefore, noadjustment to overall faculty response rates is made for institution-level variables such as institutional leveland control or institutional sampling strata.
Sampled female faculty were slightly more likely to respond to the questionnaire than sampled male faculty.White, non-Hispanics showed the highest response rates among the racial and ethnic groups: 86.7 percent ofwhite, non-Hispanic faculty members surveyed responded to the questionnaire, followed by Asian/PacificIslanders (85.5 percent), Hispanics (84.5 percent), black, non-Hispanics (83.9 percent) and AmericanIndian/Alaskan Natives (70.2 percent).
Academic disciplines were divided between non-National Endowment for the Humanities (NEH) disciplinesand four NEH disciplines: philosophy/religion, foreign languages, English language and literature, andhistory. Sampled faculty in the NEH disciplines responded to the survey at a slightly higher rate than facultyin the non-NEH disciplines (85.1 percent, compared to 84.7 percent, weighted data). Therefore, the responserate for faculty in the four NEH disciplines slightly exceeded the response rate for all faculty in the sample.Faculty in the history discipline responded at 88.2 percent, nearly four percentage points higher than theaverage response rate for all faculty. Foreign language faculty responded at a lower-than average rate of 81.8percent, 2.6 percentage points less than the average response rate for all faculty. Finally, sampled full-timefaculty were more likely to respond to the questionnaire than part-time faculty.
As the exhibit also points out, respondents whose gender, race/ethnicity, and discipline were unknownshowed the lowest response rates among each of those subgroups. Respondents whose employment statuswas unknown responded at about the same rate as part-time faculty. Overall response rates followed thepatterns set in faculty questionnaire response rates. All categories of faculty attained a 70 percent or higheroverall response rate except faculty members whose individual characteristics were unknown, AmericanIndian/Alaskan Natives, foreign language faculty, and part-time faculty.
100
I 1 I
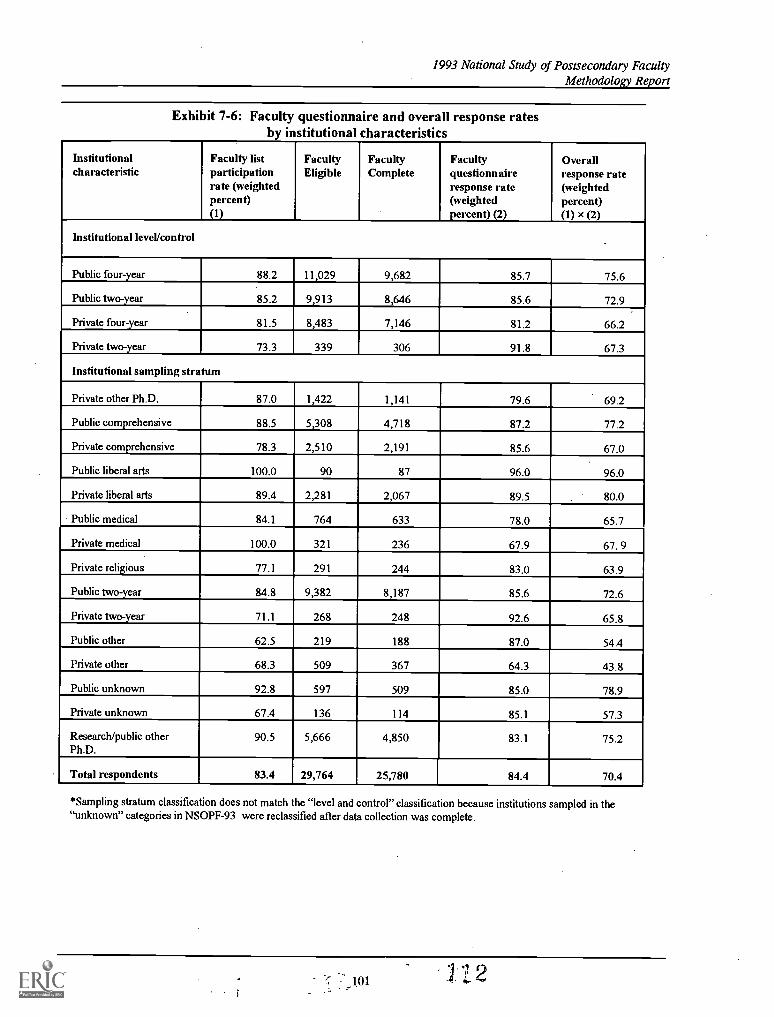
1993 National Study of Postsecondary FacultyMethodology Report
Exhibit 7-6: Faculty questionnaire and overall response ratesby institutional characteristics
Institutionalcharacteristic
Faculty listparticipationrate (weightedpercent)(1)
FacultyEligible
FacultyComplete
Facultyquestionnaireresponse rate(weightedpercent) (2)
Overallresponse rate(weightedpercent)(1) x (2)
Institutional level/control
Public four-year 88.2 11,029 9,682 85.7 75.6
Public two-year 85.2 9,913 8,646 85.6 72.9
Private four-year 81.5 8,483 7,146 81.2 66.2
Private two-year 73.3 339 306 91.8 67.3
Institutional sampling stratum
Private other Ph.D. 87.0 1,422 1,141 79.6 69.2
Public comprehensive 88.5 5,308 4,718 87.2 77.2
Private comprehensive 78.3 2,510 2,191 85.6 67.0
Public liberal arts 100.0 90 87 96.0 96.0
Private liberal arts 89.4 2,281 2,067 89.5 80.0
Public medical 84.1 764 633 78.0 65.7
Private medical 100.0 321 236 67.9 67. 9
Private religious 77.1 291 244 83.0 63.9
Public two-year 84.8 9,382 8,187 85.6 72.6
Private two-year 71.1 268 248 92.6 65.8
Public other 62.5 219 188 87.0 54.4
Private other 68.3 509 367 64.3 43.8
Public unknown 92.8 597 509 85.0 78.9
Private unknown 67.4 136 114 85.1 57.3
Research/public otherPh.D.
90.5 5,666 4,850 83.1 75.2
Total respondents 83.4 29,764 25,780 84.4 70.4
*Sampling stratum classification does not match he "level and control" classification because institutions sampled in the"unknown" categories in NSOPF-93 were reclassified after data collection was complete.
101
. .01 4
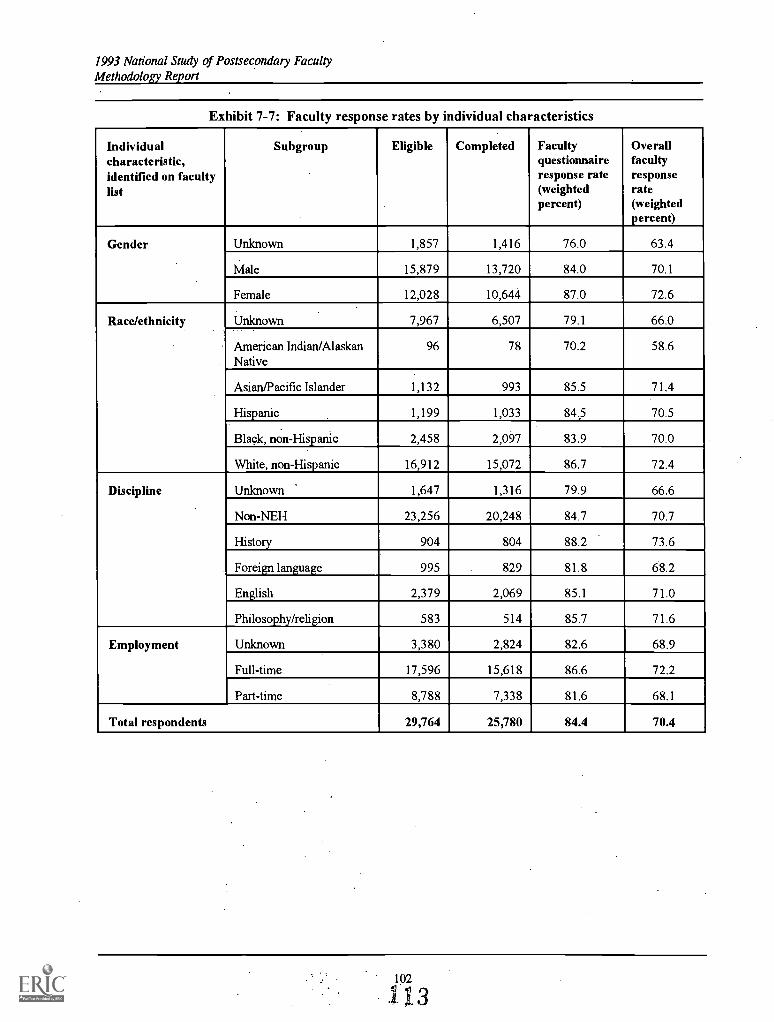
1993 National Study of Postsecondary FacultyMethodology Report
Exhibit 7-7: Faculty response rates by individual characteristics
Individualcharacteristic,identified on facultylist
Subgroup Eligible Completed Facultyquestionnaireresponse rate(weightedpercent)
Overallfacultyresponserate(weightedpercent)
Gender Unknown 1,857 1,416 76.0 63.4
Male 15,879 13,720 84.0 70.1
Female 12,028 10,644 87.0 72.6
Race/ethnicity Unknown 7,967 6,507 79.1 66.0
American Indian/AlaskanNative
96 78 70.2 58.6
Asian/Pacific Islander 1,132 993 85.5 71.4
Hispanic 1,199 1,033 84.5 70.5
Black, non-Hispanic 2,458 2,097 83.9 70.0
White, non-Hispanic 16,912 15,072 86.7 72.4
Discipline Unknown 1,647 1,316 79.9 66.6
Non-NEH 23,256 20,248 84.7 70.7
History 904 804 88.2 73.6
Foreign language 995 829 81.8 68.2
English 2,379 2,069 85.1 71.0
Philoso_phy/religion 583 514 85.7 71.6
Employment Unknown 3,380 2,824 82.6 68.9
Full-time 17,596 15,618 86.6 72.2
Part-time 8,788 7,338 81.6 68.1
Total respondents 29,764 25,780 84.4 70.4
102
113
1993 National Study of Postsecondary FacultyMethodology Report
8. Questionnaire Item Nonresponse
Item nonresponse may create two impediments to the successful analysis of survey data. Item nonresponsemay bias survey data if the values of the missing data differ from those of the known data. Item nonresponsecan also diminish the number of observations that can be used in calculating statistics from affected dataelements and can thus increase sampling variances. Since item nonresponse is an important source ofpotential bias, it is necessary to measure its extent so that analysts can properly take potential response biasesinto account when developing their analysis plans. This chapter reviews the item nonresponse rates forNSOPF-93 for both the faculty and institution questionnaires.
8.1 Item Nonresponse: Definition and Considerations
Item nonresponse occurs when a respondent fails to complete certain items on a survey instrument. Whilebias associated with unit nonresponse has been controlled by adjusting case weights, item nonresponse hasgenerally been addressed with imputation in the NSOPF-93 faculty and institution datasets. Machine editingrectified nonresponse problems for some items by imposing inter-item consistency, particularly by forcinglogical agreement between filter and dependent questions. For example, the missing response to a filterquestion can often be inferred if dependent questions have been answered. Because the edited files were usedin the nonresponse analysis reported below, this adjustment to item nonresponse is reflected in the results ofthe analysis.
Note that unit nonresponse is a further source of missing item datanonparticipating sample memberscomplete no questionnaire items. Weights adjust for nonresponse by projecting questionnaire data to the fullpopulation, with appropriate adjustments for defined subgroups. However, nonresponse-adjusted weightscannot compensate for the bias that arises if nonrespondents and respondents would have answered the .
questionnaire differently. Hence "total response" to a specific item could actually be thought of as the overallsurvey (unit) response rate multiplied by the item response rate.
Two main objectives guide the following item nonresponse analysis. One objective is to quantify meanquestionnaire nonresponse overall as well as nonresponse for the faculty and institution sampleson keyvariables. A second objective is to describe nonresponse patterns in terms of item characteristics. In order torealize the first objective, nonresponse rates were calculated for each survey item, and average rates ofnonresponse were calculated for each instrument. To fulfill the second objective, nonresponse was measuredas a function of two item characteristics: position in the questionnaire and topic. The characteristics ofquestions with item nonresponse rates greater than or equal to 10 percent were further examined. For thefaculty questionnaire, the effect of questionnaire administration modeself-administered versus interviewer-administered (telephone and in-person)on item nonresponse was also analyzed.
The item nonresponse rate is defined as the ratio of the total number ofnonresponses among eligiblerespondents to the number of respondents eligible to respond to a questionnaire item. In the notation of theexhibits listing nonresponse rates, the item nonresponse rate, RATE, equals the number of item nonresponsesdivided by the number of eligible unit respondents ("n"). The standard error of the item nonresponse rate,STDERR, equals the square root of RATE x (1 - RATE)/n. In general, the larger the n, (i.e., the greater thenumber of eligible unit respondents for a particular item), and the further the RATE is from .5, the lower theSTDERR. The standard errors assume simple random sampling. For a question composed of multiplesubparts, each subpart eliciting a distinct response is counted as an item for item nonresponse purposes.
ES COPY AVAILABLE1 I4
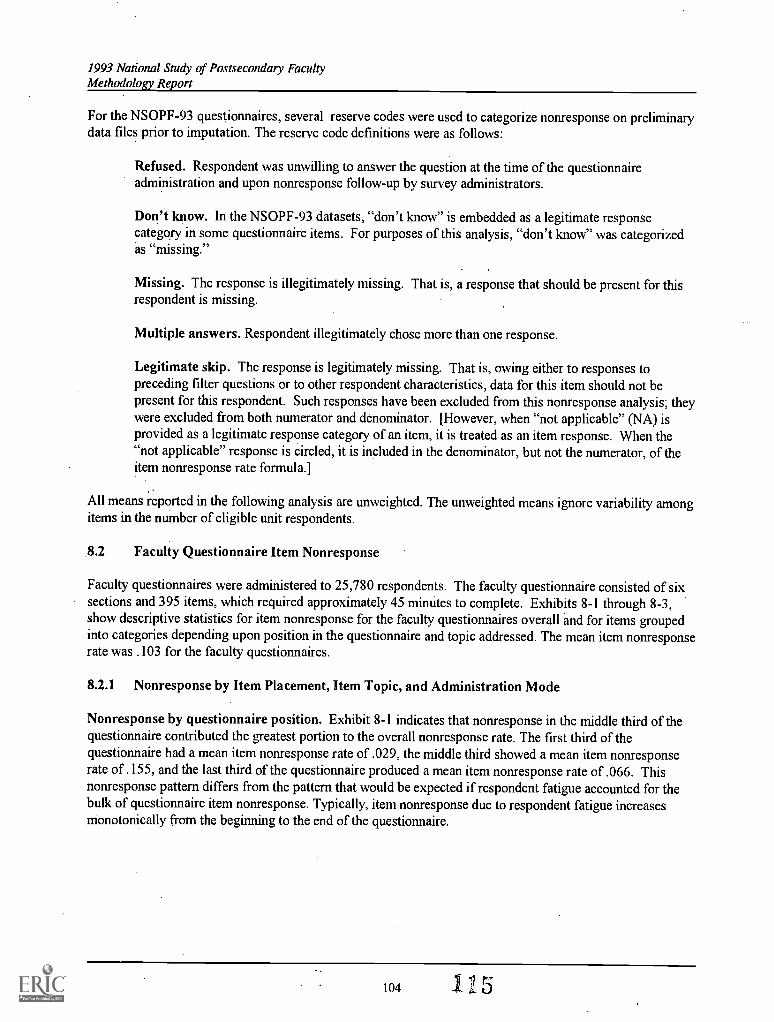
1993 National Study of Postsecondary FacultyMethodology Report
For the NSOPF-93 questionnaires, several reserve codes were used to categorize nonresponse on preliminarydata files prior to imputation. The reserve code definitions were as follows:
Refused. Respondent was unwilling to answer the question at the time of the questionnaireadministration and upon nonresponse follow-up by survey administrators.
Don't know. In the NSOPF-93 datasets, "don't know" is embedded as a legitimate responsecategory in some questionnaire items. For purposes of this analysis, "don't know" was categorizedas "missing."
Missing. The response is illegitimately missing. That is, a response that should be present for thisrespondent is missing.
Multiple answers. Respondent illegitimately chose more than one response.
Legitimate skip. The response is legitimately missing. That is, owing either to responses topreceding filter questions or to other respondent characteristics, data for this item should not bepresent for this respondent. Such responses have been excluded from this nonresponse analysis; theywere excluded from both numerator and denominator. [However, when "not applicable" (NA) isprovided as a legitimate response category of an item, it is treated as an item response. When the"not applicable" response is circled, it is included in the denominator, but not the numerator, of theitem nonresponse rate formula.]
All means reported in the following analysis are unweighted. The unweighted means ignore variability amongitems in the number of eligible unit respondents.
8.2 Faculty Questionnaire Item Nonresponse
Faculty questionnaires were administered to 25,780 respondents. The faculty questionnaire consisted of sixsections and 395 items, which required approximately 45 minutes to complete. Exhibits 8-1 through 8-3,show descriptive statistics for item nonresponse for the faculty questionnaires overall and for items groupedinto categories depending upon position in the questionnaire and topic addressed. The mean item nonresponserate was .103 for the faculty questionnaires.
8.2.1 Nonresponse by Item Placement, Item Topic, and Administration Mode
Nonresponse by questionnaire position. Exhibit 8-1 indicates that nonresponse in the middle third of thequestionnaire contributed the greatest portion to the overall nonresponse rate. The first third of thequestionnaire had a mean item nonresponse rate of .029, the middle third showed a mean item nonresponserate of .155, and the last third of the questionnaire produced a mean item nonresponse rate of .066. Thisnonresponse pattern differs from the pattern that would be expected if respondent fatigue accounted for thebulk of questionnaire item nonresponse. Typically, item nonresponse due to respondent fatigue increasesmonotonically from the beginning to the end of the questionnaire.
104 115
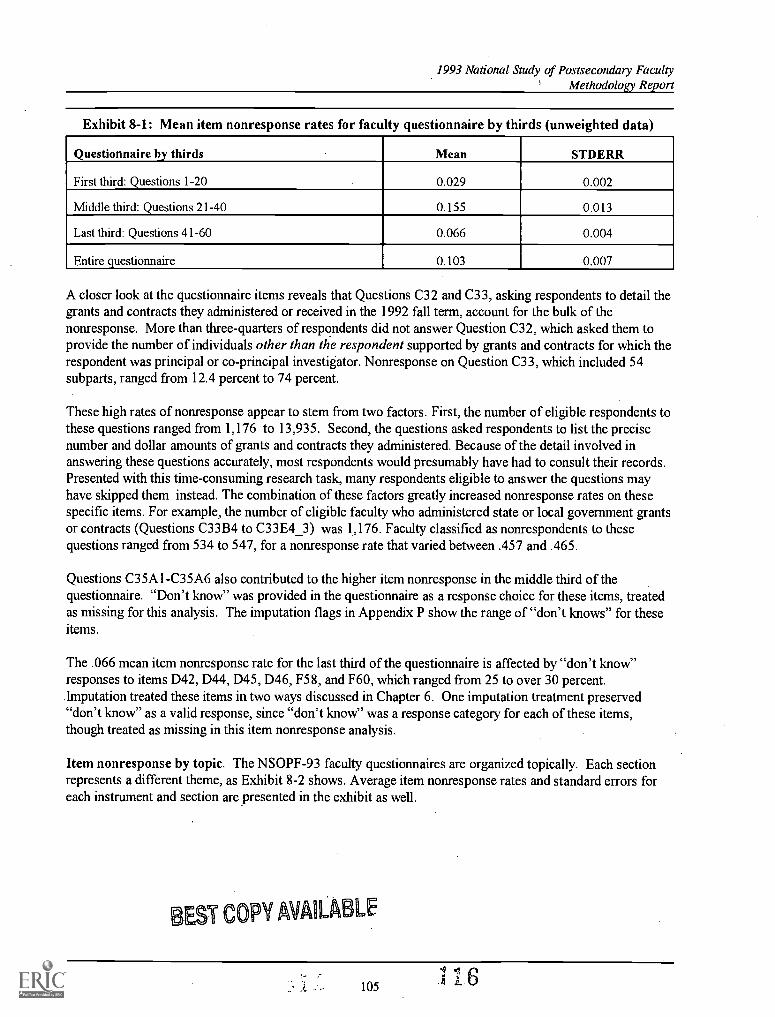
1993 National Study of Postsecondary Faculty' Methodology Report
Exhibit 8-1: Mean item nonresponse rates for faculty questionnaire by thirds (unweighted data)
Questionnaire by thirds Mean STDERR
First third: Questions 1-20 0.029 0.002
Middle third: Questions 21-40 0.155 0.013
Last third: Questions 41-60 0.066 0.004
Entire questionnaire 0.103 0.007
A closer look at the questionnaire items reveals that Questions C32 and C33, asking respondents to detail thegrants and contracts they administered or received in the 1992 fall term, account for the bulk of thenonresponse. More than three-quarters of respondents did not answer Question C32, which asked them toprovide the number of individuals other than the respondent supported by grants and contracts for which therespondent was principal or co-principal investigator. Nonresponse on Question C33, which included 54subparts, ranged from 12.4 percent to 74 percent.
These high rates of nonresponse appear to stem from two factors. First, the number of eligible respondents tothese questions ranged from 1,176 to 13,935. Second, the questions asked respondents to list the precisenumber and dollar amounts of grants and contracts they administered. Because of the detail involved inanswering these questions accurately, most respondents would presumably have had to consult their records.Presented with this time-consuming research task, many respondents eligible to answer the questions mayhave skipped them instead. The combination of these factors greatly increased nonresponse rates on thesespecific items. For example, the number of eligible faculty who administered state or local government grantsor contracts (Questions C33B4 to C33E4_3) was 1,176. Faculty classified as nonrespondents to thesequestions ranged from 534 to 547, for a nonresponse rate that varied between .457 and .465.
Questions C35A1-C35A6 also contributed to the higher item nonresponse in the middle third of thequestionnaire. "Don't know" was provided in the questionnaire as a response choice for these items, treatedas missing for this analysis. The imputation flags in Appendix P show the range of "don't knows" for theseitems.
The .066 mean item nonresponse rate for the last third of the questionnaire is affected by "don't know"responses to items D42, D44, D45, D46, F58, and F60, which ranged from 25 to over 30 percent.Imputation treated these items in two ways discussed in Chapter 6. One imputation treatment preserved"don't know" as a valid response, since "don't know" was a response category for each of these items,though treated as missing in this item nonresponse analysis.
Item nonresponse by topic. The NSOPF-93 faculty questionnaires are organized topically. Each sectionrepresents a different theme, as Exhibit 8-2 shows. Average item nonresponse rates and standard errors foreach instrument and section are presented in the exhibit as well.
EST COPY MLA LE
105 1 6
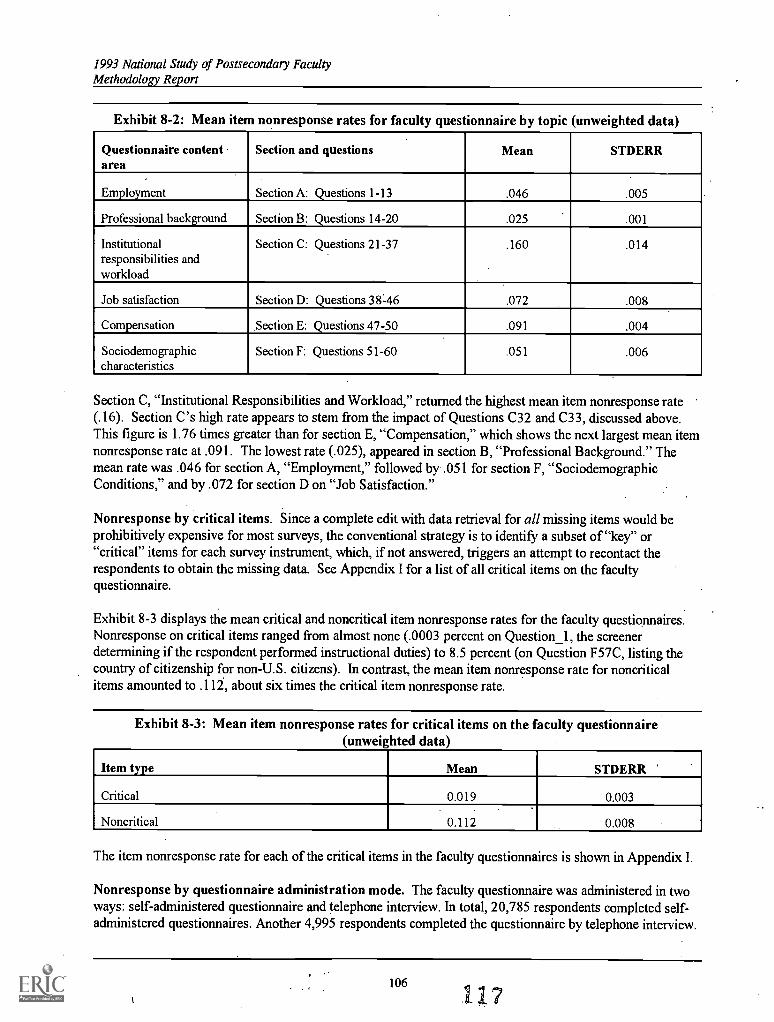
1993 National Study of Postsecondary FacultyMethodology Report
Exhibit 8-2: Mean item nonresponse rates for faculty questionnaire by topic (unweighted data)
Questionnaire contentarea
Section and questions Mean STDERR
Employment Section A: Questions 1-13 .046 .005
Professional background Section B: Questions 14-20 .025 .001
Institutionalresponsibilities andworkload
Section C: Questions 21-37 .160 .014
Job satisfaction Section D: Questions 38:46 .072 .008
Compensation Section E: Questions 47-50 .091 .004
Sociodemographiccharacteristics
Section F: Questions 51-60 .051 .006
Section C, "Institutional Responsibilities and Workload," returned the highest mean item nonresponse rate(.16). Section C's high rate appears to stem from the impact of Questions C32 and C33, discussed above.This figure is 1.76 times greater than for section E, "Compensation," which shows the next largest mean itemnonresponse rate at .091. The lowest rate (.025), appeared in section B, "Professional Background." Themean rate was .046 for section A, "Employment," followed by .051 for section F, "SociodemographicConditions," and by .072 for section D on "Job Satisfaction."
Nonresponse by critical items. Since a complete edit with data retrieval for all missing items would beprohibitively expensive for most surveys, the conventional strategy is to identify a subset of "key" or"critical" items for each survey instrument, which, if not answered, triggers an attempt to recontact therespondents to obtain the missing data. See Appendix I for a list of all critical items on the facultyquestionnaire.
Exhibit 8-3 displays the mean critical and noncritical item nonresponse rates for the faculty questionnaires.Nonresponse on critical items ranged from almost none (.0003 percent on Question_l, the screenerdetermining if the respondent performed instructional duties) to 8.5 percent (on Question F57C, listing thecountry of citizenship for non-U.S. citizens). In contrast, the mean item nonresponse rate for noncriticalitems amounted to .112, about six times the critical item nonresponse rate.
Exhibit 8-3: Mean item nonresponse rates for critical items on the faculty questionnaire( unweighted data
Item type Mean STDERR
Critical 0.019 0.003
Noncritical 0.112 0.008
The item nonresponse rate for each of the critical items in the faculty questionnaires is shown in Appendix I.
Nonresponse by questionnaire administration mode. The faculty questionnaire was administered in twoways: self-administered questionnaire and telephone interview. In total, 20,785 respondents completed self-administered questionnaires. Another 4,995 respondents completed the questionnaire by telephone interview.
106
117
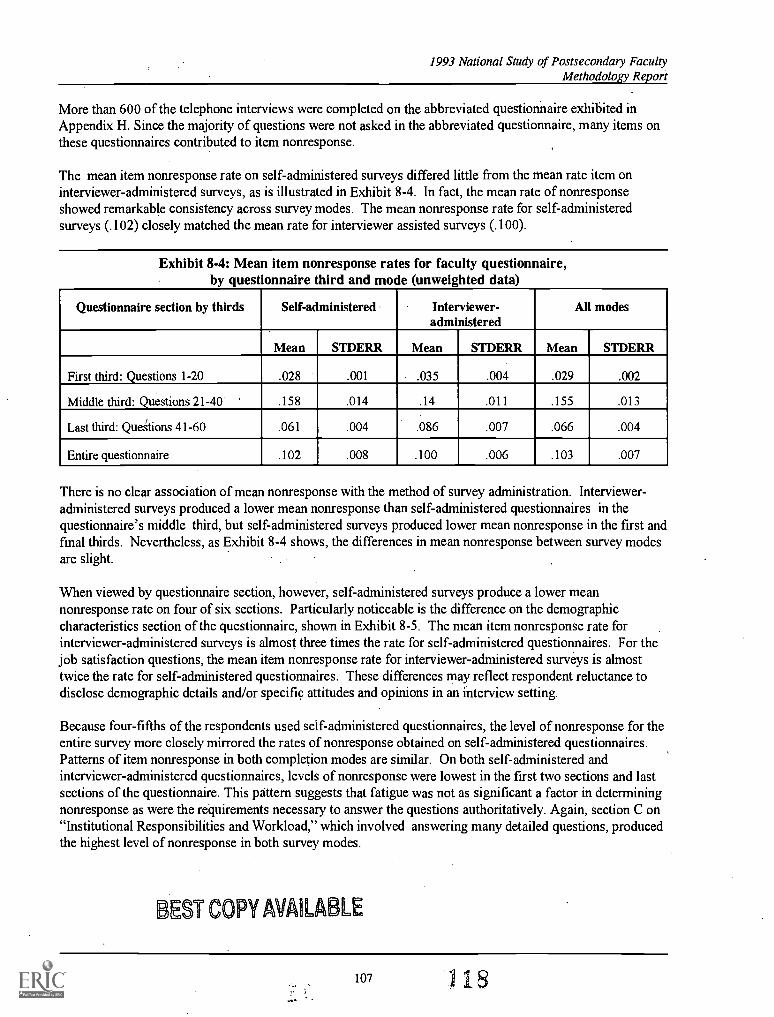
1993 National Study of Postsecondary FacultyMethodology Report
More than 600 of the telephone interviews were completed on the abbreviated questionnaire exhibited inAppendix H. Since the majority of questions were not asked in the abbreviated questionnaire, many items onthese questionnaires contributed to item nonresponse.
The mean item nonresponse rate on self-administered surveys differed little from the mean rate item oninterviewer-administered surveys, as is illustrated in Exhibit 8-4. In fact, the mean rate of nonresponseshowed remarkable consistency across survey modes. The mean nonresponse rate for self-administeredsurveys (.102) closely matched the mean rate for interviewer assisted surveys (.100).
Exhibit 8-4: Mean item nonresponse rates for faculty questionnaire,by questionnaire third and mode (unweighted data)
Questionnaire section by thirds Self-administered Interviewer-administered
All modes
Mean STDERR Mean STDERR Mean STDERR
First third: Questions 1-20 .028 .001 .035 .004 .029 .002
Middle third: Questions 21-40 .158 .014 .14 .011 .155 .013
Last third: Quetions 41-60 .061 .004 .086 .007 .066 .004
Entire questionnaire .102 .008 .100 .006 .103 .007
There is no clear association of mean nonresponse with the method of survey administration. Interviewer-administered surveys produced a lower mean nonresponse than self-administered questionnaires in thequestionnaire's middle third, but self-administered surveys produced lower mean nonresponse in the first andfinal thirds. Nevertheless, as Exhibit 8-4 shows, the differences in mean nonresponse between survey modesare slight.
When viewed by questionnaire section, however, self-administered surveys produce a lower meannonresponse rate on four of six sections. Particularly noticeable is the difference on the demographiccharacteristics section of the questionnaire, shown in Exhibit 8-5. The mean item nonresponse rate forinterviewer-administered surveys is almost three times the rate for self-administered questionnaires. For thejob satisfaction questions, the mean item nonresponse rate for interviewer-administered surveys is almosttwice the rate for self-administered questionnaires. These differences may reflect respondent reluctance todisclose demographic details and/or specific attitudes and opinions in an interview setting.
Because four-fifths of the respondents used self-administered questionnaires, the level of nonresponse for theentire survey more closely mirrored the rates of nonresponse obtained on self-administered questionnaires.Patterns of item nonresponse in both completion modes are similar. On both self-administered andinterviewer-administered questionnaires, levels of nonresponse were lowest in the first two sections and lastsections of the questionnaire. This pattern suggests that fatigue was not as significant a factor in determiningnonresponse as were the requirements necessary to answer the questions authoritatively. Again, section C on"Institutional Responsibilities and Workload," which involved answering many detailed questions, producedthe highest level of nonresponse in both survey modes.
BEST COPY AVAILABLE
107
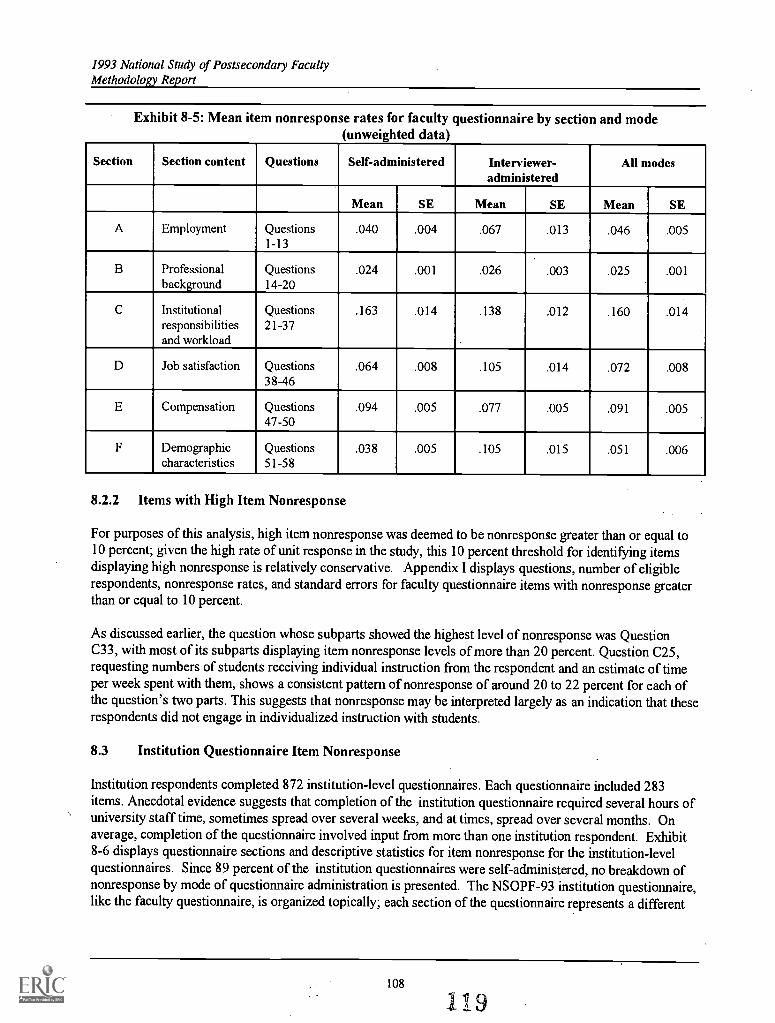
1993 National Study of Postsecondary FacultyMethodology Report
Exhibit 8-5: Mean item nonresponse rates for faculty questionnaire by section and mode(unweighted data)
Section Section content Questions Self-administered Interviewer-administered
All modes
Mean SE Mean SE Mean SE
A Employment Questions1-13
.040 .004 .067 .013 .046 .005
B Professionalbackground
Questions14-20
.024 .001 .026 .003 .025 .001
C Institutionalresponsibilitiesand workload
Questions21-37
.163 .014 .138 .012 .160 .014
D Job satisfaction Questions38-46
.064 .008 .105 .014 .072 .008
E Compensation Questions47-50
.094 .005 .077 .005 .091 .005
F Demographiccharacteristics
Questions51-58
.038 .005 .105 .015 .051 .006
8.2.2 Items with High Item Nonresponse
For purposes of this analysis, high item nonresponse was deemed to be nonresponse greater than or equal to10 percent; given the high rate of unit response in the study, this 10 percent threshold for identifying itemsdisplaying high nonresponse is relatively conservative. Appendix I displays questions, number of eligiblerespondents, nonresponse rates, and standard errors for faculty questionnaire items with nonresponse greaterthan or equal to 10 percent.
As discussed earlier, the question whose subparts showed the highest level of nonresponse was QuestionC33, with most of its subparts displaying item nonresponse levels of more than 20 percent. Question C25,requesting numbers of students receiving individual instruction from the respondent and an estimate of timeper week spent with them, shows a consistent pattern of nonresponse of around 20 to 22 percent for each ofthe question's two parts. This suggests that nonresponse may be interpreted largely as an indication that theserespondents did not engage in individualized instruction with students.
8.3 Institution Questionnaire Item Nonresponse
Institution respondents completed 872 institution-level questionnaires. Each questionnaire included 283items. Anecdotal evidence suggests that completion of the institution questionnaire required several hours ofuniversity staff time, sometimes spread over several weeks, and at times, spread over several months. Onaverage, completion of the questionnaire involved input from more than one institution respondent. Exhibit8-6 displays questionnaire sections and descriptive statistics for item nonresponse for the institution-levelquestionnaires. Since 89 percent of the institution questionnaires were self-administered, no breakdown ofnonresponse by mode of questionnaire administration is presented. The NSOPF-93 institution questionnaire,like the faculty questionnaire, is organized topically; each section of the questionnaire represents a different
108
1 9
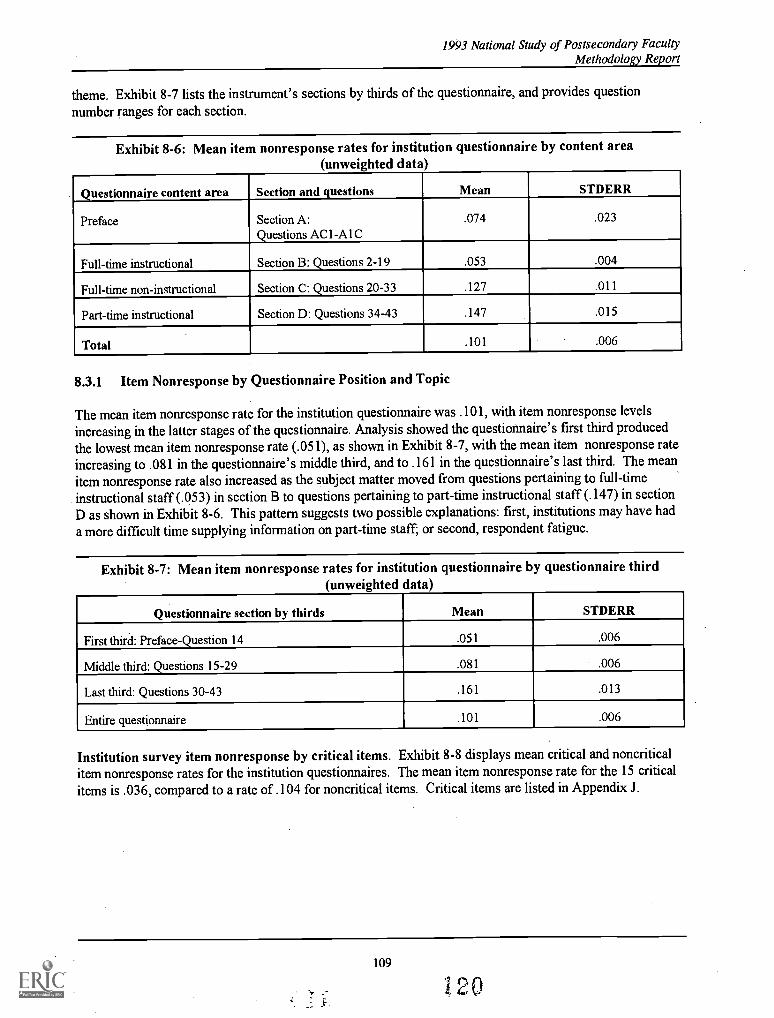
1993 National Study of Postsecondary FacultyMethodology Report
theme. Exhibit 8-7 lists the instrument's sections by thirds of the questionnaire, and provides question
number ranges for each section.
Exhibit 8-6: Mean item nonresponse rates for institution questionnaire by content area(unweighted data)
Questionnaire content area Section and questions Mean STDERR
Preface Section A:Questions AC1-A 1 C
.074 .023
Full-time instructional Section B: Questions 2-19 .053 .004
Full-time non-instructional Section C: Questions 20-33 .127 .011
Part-time instructional Section D: Questions 34-43 .147 .015
Total .101 .006
8.3.1 Item Nonresponse by Questionnaire Position and Topic
The mean item nonresponse rate for the institution questionnaire was .101, with item nonresponse levels
increasing in the latter stages of the questionnaire. Analysis showed the questionnaire's first third producedthe lowest mean item nonresponse rate (.051), as shown in Exhibit 8-7, with the mean item nonresponse rateincreasing to .081 in the questionnaire's middle third, and to .161 in the questionnaire's last third. The meanitem nonresponse rate also increased as the subject matter moved from questions pertaining to full-time
instructional staff (.053) in section B to questions pertaining to part-time instructional staff (.147)in sectionD as shown in Exhibit 8-6. This pattern suggests two possible explanations: first, institutions may have had
a more difficult time supplying information on part-time staff; or second, respondent fatigue.
Exhibit 8-7: Mean item nonresponse rates for institution questionnaire by questionnaire third(unweighted data)
Questionnaire section by thirds Mean STDERR
First third: Preface-Question 14 .051 .006
Middle third: Questions 15-29 .081 .006
Last third: Questions 30-43 .161 .013
Entire questionnaire .101 .006
Institution survey item nonresponse by critical items. Exhibit 8-8 displays mean critical and noncriticalitem nonresponse rates for the institution questionnaires. The mean item nonresponse rate for the 15 criticalitems is .036, compared to a rate of .104 for noncritical items. Critical items are listed in Appendix J.
109
120
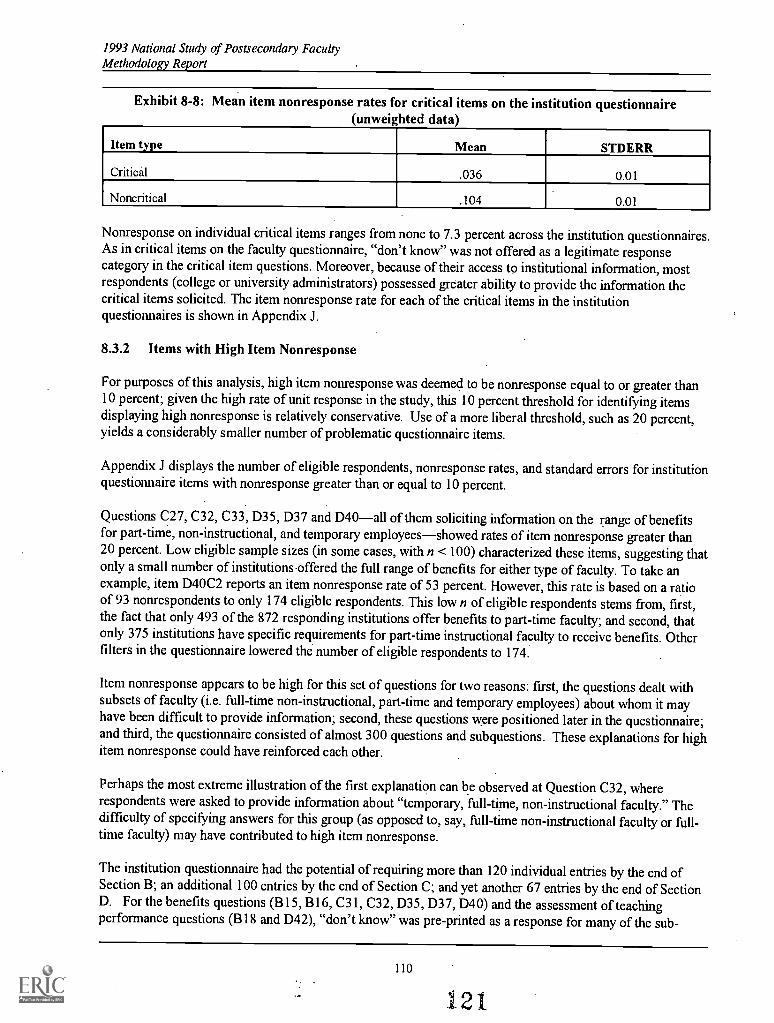
1993 National Study of Postsecondary FacultyMethodology Report
Exhibit 8-8: Mean item nonresponse rates for critical items on the institution questionnaire(unweighted data)
Item type Mean STDERR
Critical .036 0.01
Noncritical .104 0.01
Nonresponse on individual critical items ranges from none to 7.3 percent across the institution questionnaires.As in critical items on the faculty questionnaire, "don't know" was not offered as a legitimate responsecategory in the critical item questions. Moreover, because of their access to institutional information,mostrespondents (college or university administrators) possessed greater ability to provide the information thecritical items solicited. The item nonresponse rate for each of the critical items in the institutionquestionnaires is shown in Appendix J.
8.3.2 Items with High Item Nonresponse
For purposes of this analysis, high item nonresponse was deemed to be nonresponse equal to or greater than10 percent; given the high rate of unit response in the study, this 10 percent threshold for identifying itemsdisplaying high nonresponse is relatively conservative. Use of a more liberal threshold, such as 20 percent,yields a considerably smaller number of problematic questionnaire items.
Appendix J displays the number of eligible respondents, nonresponse rates, and standard errors for institutionquestionnaire items with nonresponse greater than or equal to 10 percent.
Questions C27, C32, C33, D35, D37 and D40all of them soliciting information on the range of benefitsfor part-time, non-instructional, and temporary employeesshowed rates of item nonresponse greater than20 percent. Low eligible sample sizes (in some cases, with n < 100) characterized these items, suggesting thatonly a small number of institutionsoffered the full range of benefits for eithertype of faculty. To take anexample, item D40C2 reports an item nonresponse rate of 53 percent. However, this rate is based on a ratioof 93 nonrespondents to only 174 eligible respondents. This low n of eligible respondents stems from, first,the fact that only 493 of the 872 responding institutions offer benefits to part-time faculty; and second, thatonly 375 institutions have specific requirements for part-time instructional faculty to receive benefits. Otherfilters in the questionnaire lowered the number of eligible respondents to 174.
Item nonresponse appears to be high for this set of questions for two reasons: first, the questions dealt withsubsets of faculty (i.e. full-time non-instructional, part-time and temporary employees) about whom it mayhave been difficult to provide information; second, these questions were positioned later in the questionnaire;and third, the questionnaire consisted of almost 300 questions and subquestions. These explanations for highitem nonresponse could have reinforced each other.
Perhaps the most extreme illustration of the first explanation can be observed at Question C32, whererespondents were asked to provide information about "temporary, full-time, non-instructional faculty." Thedifficulty of specifying answers for this group (as opposed to, say, full-time non-instructional faculty or full-time faculty) may have contributed to high item nonresponse.
The institution questionnaire had the potential of requiring more than 120 individual entries by the end ofSection B; an additional 100 entries by the end of Section C; and yet another 67 entries by the end of SectionD. For the benefits questions (B15, B16, C31, C32, D35, D37, D40) and theassessment of teachingperformance questions (B18 and D42), "don't know" was pre-printed as a response for many of the sub-
110
121
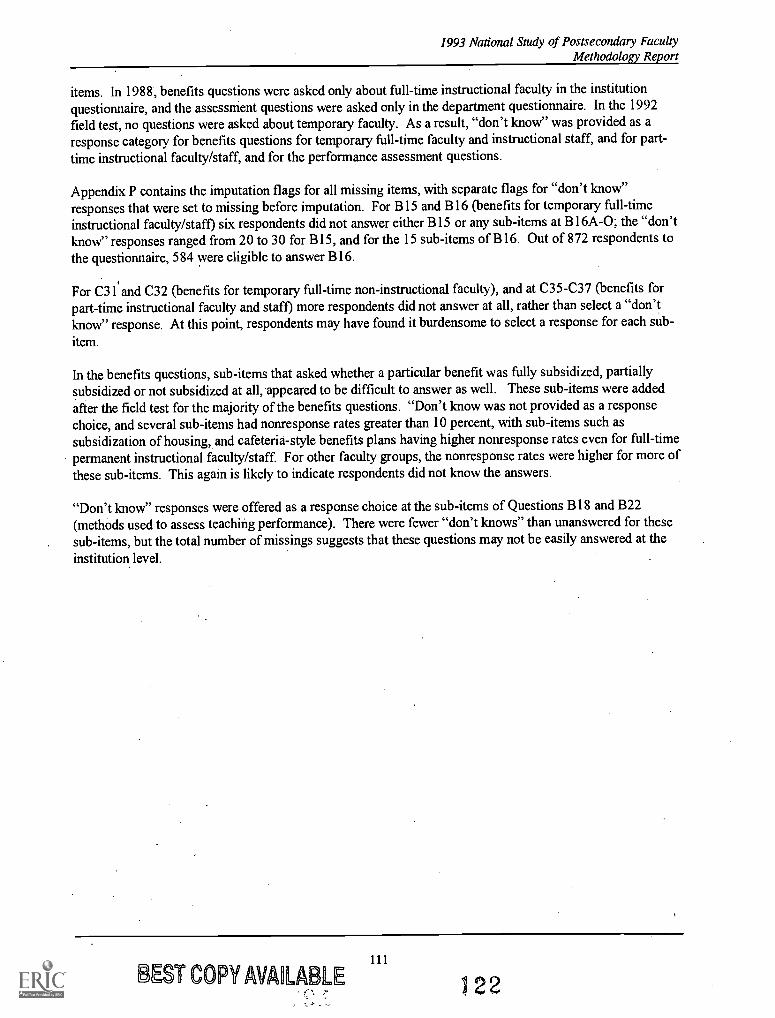
1993 National Study of Postsecondary FacultyMethodology Report
items. In 1988, benefits questions were asked only about full-time instructional faculty in the institutionquestionnaire, and the assessment questions were asked only in the department questionnaire. In the 1992field test, no questions were asked about temporary faculty. As a result, "don't know" was provided as aresponse category for benefits questions for temporary full-time faculty and instructional staff, and for part-time instructional faculty/staff, and for the performance assessment questions.
Appendix P contains the imputation flags for all missing items, with separate flags for "don't know"responses that were set to missing before imputation. For B15 and B16 (benefits for temporary full-timeinstructional faculty/staff) six respondents did not answer either B15 or any sub-items at B16A-0; the "don'tknow" responses ranged from 20 to 30 for B15, and for the 15 sub-items of B16. Out of 872 respondents tothe questionnaire, 584 were eligible to answer B16.
For C31 and C32 (benefits for temporary full-time non-instructional faculty), and at C35-C37 (benefits forpart-time instructional faculty and staff) more respondents did not answer at all, rather than select a "don'tknow" response. At this point, respondents may have found it burdensome to select a response for each sub-item.
In the benefits questions, sub-items that asked whether a particular benefit was fully subsidized, partiallysubsidized or not subsidized at all, appeared to be difficult to answer as well. These sub-items were addedafter the field test for the majority of the benefits questions. "Don't know was not provided as a responsechoice, and several sub-items had nonresponse rates greater than 10 percent, with sub-items such assubsidization of housing, and cafeteria-style benefits plans having higher nonresponse rates even for full-timepermanent instructional faculty/staff. For other faculty groups, the nonresponse rates werehigher for more ofthese sub-items. This again is likely to indicate respondents did not know the answers.
"Don't know" responses were offered as a response choice at the sub-items of Questions B18 and B22(methods used to assess teaching performance). There were fewer "don't knows" than unanswered for thesesub-items, but the total number of missings suggests that these questions may not be easily answered at theinstitution level.
BEST COPY MLA LP) LE111
1 2 2
1993 National Study of Postsecondary FacultyMethodology Report
9. Faculty Questionnaire Data Quality
This chapter reviews the results of a validity and reliability evaluation of faculty questionnaire items. Forpurposes of NSOPF-93, "validity" is defined as the correlation or association between the measured and truevalues of a characteristic or attribute. "Reliability" expresses the correlation or association between repeatedmeasurements of the same item.24 The goals of the validity and reliability evaluations are to identify facultyquestionnaire items that yield data of low quality and to identify characteristics of items (question wording,context, and unclear or ambiguous response categories) that cause response problems. The NSOPF-93 fieldtest used different research designs to evaluate the validity and reliability of faculty questionnaire items.Validity was also evaluated for the full-scale study.
9.1 Validity and Reliability in the NSOPF-93 Field Test
To evaluate validity in the NSOPF-93 field test, faculty responses to selected items of the facultyquestionnaire were compared with data obtained from the postsecondary institution in which the facultymember was employed during the fall of 1991 for the field test. Each sampled institution was requested toprovide data on the gender, race/ethnicity, employment status (full-time versus part-time), principal field orteaching discipline, and tenure status (tenured versus not tenured) of sample faculty at their institution(Tenure status was used only in the field test). These institutional data were used to evaluate facultymembers' self-reports of the same characteristics.
To evaluate reliability for the field test, a subsample of faculty who responded to the original interview werereinterviewed. The reinterview was conducted via telephone, while all field test faculty were asked, initially,to complete a self-administered questionnaire. A small number of respondents who failed to complete a self-administered interview completed a computer-assisted telephone interview (CATI). The reinterviewquestionnaire (see Appendix D) included a subset of the same items that were administered in the originalinterview, including items on instructional duties, principal activities, field or discipline, degrees and honors,previous jobs, publications and presentations, funded research, allocation of time, and salary. These itemswere selected in part because they were identified to be potentially problematic for respondents. Thereliability of each reinterview item was evaluated by comparing faculty members' responses to thereinterview with their responses to the original interview. The sample size for the reliability evaluation was117 cases.
The conclusions of the field test validity evaluation were as follows:
For gender, race/ethnicity, and employment status, the faculty questionnaire and institutional datawere consistent in more than 90 percent of the sample cases.
For principal discipline or field, the percentage of consistent cases for the field test was slightlybelow 70 percent.
"See Robert M. Groves, Survey Errors and Survey Costs (New York: John Wiley, 1989), pp. 19, 22. Theterms validity and reliability are variously defined in the scientific literature. For other definitions, see Edward G.Carmines and Richard A. Zeller, Reliability and Validity Assessment (Beverly Hills: Sage Publications, 1979); andJudith T. Lessler and William D. Kalsbeek, Nonsampling Error in Surveys (New York: John Wiley, 1992), pp..238-239.
113
23
1993 National Study of Postsecondary FacultyMethodology Report
Inconsistencies between the institutional and questionnaire data do not necessarily point to lowvalidity of the questionnaire data. This is true for several reasons: errors are possible in both datasources; the questions that were posed to faculty and to institutions were not exactly identical; andhigh rates of missing data, especially missing institutional data, vitiate several of the comparisons.In particular, and as might be expected, institutions reported principal discipline as "unknown"much more frequently than do faculty.
The conclusions of the field test reliability evaluation are as follows:
For each of eight categorical variables that were evaluated, that is, instructional duties (Question1), credit or noncredit courses (Question 1 [A]), principal activity (Question 2), principal field(Question 14), last degree (Question 18), level of students in classes (Question 23), and fundedresearch (Question 29), the interview and reinterview responses are consistent in more than 70percent of the cases. Given the high standard errors associated with a sample of 117 cases, we donot have evidence of poor reliability.
Most of 19 continuous variables that were evaluated have correlations greater than .70 betweenthe original and reinterview responses. The interview-reinterview correlations are low for thefollowing variables:
Hours per weekunpaid activities (Question 37[C]):Percentage of hoursprofessional growth (Question 38[E-F]):Percentage of hoursresearch (Question 38[G-J]):Percentage of hoursother activities (Question 38[K-P]):Income from outside consulting (Question 51[H]):
r = .31.r .13.r = .29.r = .47.r = .40.
Low associations or correlations between interview and reinterview responses do not necessarilyindicate poor reliability of the self-administered questionnaire (SAQ), because the reinterviewwasconducted by telephone rather than by SAQ. It is plausible that some of the characteristics weremeasured more reliably by SAQ than by telephone. The different questionnaire contexts of theitems in the interview and reinterview may be an additional cause of discrepancies, since thereinterview asked only a subset of the original items. Finally, the small sample size and highratesof missing data also attenuate some of the conclusions based on the reliability evaluation.
A more detailed description of validity and reliability tests performed during the field test is available in the1992-92 National Study of Postsecondary Faculty Field Test Report [NCES 93-390].
9.2 Changes to the 1993 Full Scale Study
The low reliability noted on a number of items in Question 38 on the field test faculty questionnaire resultedin a decision to revise this question for the full-scale study. This question, asking respondents to documentthe percentage of their time they spent performing 16 different job-related and non-teaching activities, wasrevised to reduce to six the number of job-related and non-teaching activities.
For purposes of cost-saving and efficiency, only five faculty discipline codes were recorded on the electronicfaculty list. These were the National Endowment,for the Humanities-designated disciplines (philosophy/religion, foreign languages, English language and literature, and history) andone "non-NEH" category. Datawere coded in this form because the NSOPF-93 oversampled four specific humanities departments. Thevalidity tests discussed in the following, section take this change in the faculty list into account.
114
1'4K.,
1993 National Study of Postsecondary FacultyMethodology Report
9.3 Validity in the 1993 Full Scale Study
The sample size for the field test validity study was 495 cases. The full-scale study validity sample sizesvaried from 19,273 pairs of cases (on the comparison of racial/ethnic data) to 24,362 pairs of cases (for thecomparison of faculty gender). Data obtained from the NSOPF-93 instrument and data supplied byinstitutions were compared on four respondent characteristics: gender, race/ethnicity, employment status(full-time or part-time) and academic discipline. Exhibits 9-1 to 9-4 summarize the direct comparisons offaculty list data with faculty questionnaire data. Exhibit 9-5 compares these data and assesses theconsistency in responses between faculty list and questionnaire data. Measures of association (chi square,Cramer's V) and measures of inconsistency (percent inconsistent and the index of inconsistency) were used.All statistical tests of validity indicated that the data obtained from the NSOPF-93 instrument provided validmeasures of respondent gender, race/ethnicity, employment status and academic discipline.
The inconsistency index is defined as "the ratio of [simple response variance] to the total variance of the[characteristic being measured], where 'total variance' includes the variability in the population of thecharacteristic being measured."' The index of inconsistency gives a more accurate reading of data qualitythan the percent inconsistent, because it adjusts for the prevalence of an attribute in the population. The indexis standardized by adjusting for marginal distributions of responses in the two datasets.(institution-providedand NSOPF-93 faculty questionnaire data). It is more accurately comparable across different items allowinggeneralizations about levels of inconsistency observed. Index values of .20 or lower are considered torepresent low inconsistency, values between .20 and .50 are considered moderate, and values of .50 andhigher are considered to represent high levels of inconsistency.
Exhibits 9-1 to 9-4 report comparisons on four faculty characteristics: gender, full-time/part-time status,discipline and race/ethnicity. In each table, the row variable is the faculty list variable and the columnvariable is the faculty questionnaire variable. In general, each exhibit shows a high degree of correspondencebetween faculty list and faculty questionnaire data. The measures of association reported in the tables aregenerally high (greater than .70)even for multiple-cell comparisons (e.g., race/ethnicity).
The consistency noted between the faculty list data and faculty questionnaire data equal or exceed theconsistency of faculty list and faculty questionnaire data noted in the 1992-93 National Study ofPostsecondary Faculty Field Test Report [NCES 93-390]. For example, faculty list data and facultyquestionnaire data for employment status (full-time/ part-time) diverged only in 5.7 percent of the cases in theNSOPF-93 full-scale study, compared to a 8.2 percent of the cases that were inconsistent in the field testdata. On the race/ethnicity comparison, faculty list data and faculty questionnaire data results were almostidentical, showing agreement between the faculty list and the faculty questionnaire 96.1 percent of the time inthe full-scale study compared to 96.6 percent in the field test.
The faculty sampling list showed great accuracy in accounting for the employment status of sampled faculty,with 94.3 percent of faculty self-reports of status matching their institutions' reports. Of the 5.7 percent ofcases that did not match, 870 faculty whose institutions identified them as part-timers classified themselvesas full-timers. In contrast, 437 faculty whose institutions identified them as full-timers classified themselvesas part-timers.
Nevertheless, Exhibit 9-2 illustrates higher reporting variability with regard to part-time faculty. Institutionsand full-time faculty agreed on their classification of employment status 97.2 percent of the time. In
251J.S. Bureau of the Census, Evaluating Censuses of Population and Housing (Washington, D.C.,1985), p. 70.
115
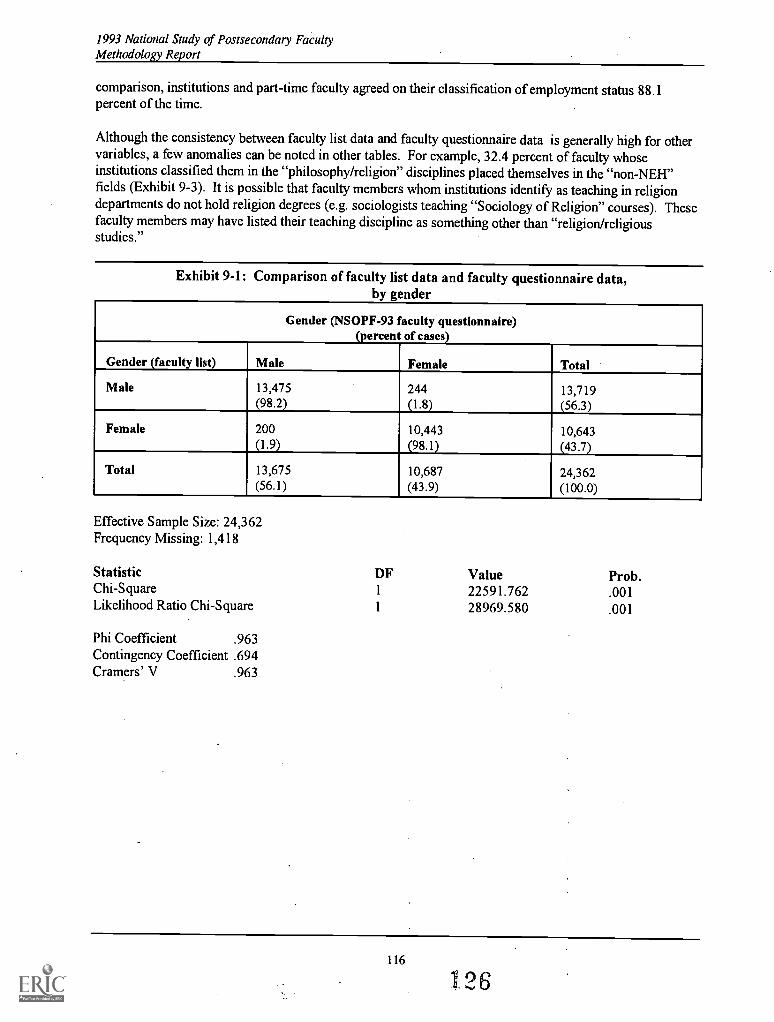
1993 National Study of Postsecondary FacultyMethodology Report
comparison, institutions and part-time faculty agreed on their classification of employment status 88.1percent of the time.
Although the consistency between faculty list data and faculty questionnaire data is generally high for othervariables, a few anomalies can be noted in other tables. For example, 32.4 percent of faculty whoseinstitutions classified them in the "philosophy/religion" disciplines placed themselves in the "non-NEH"fields (Exhibit 9-3). It is possible that faculty members whom institutions identify as teaching in religiondepartments do not hold religion degrees (e.g. sociologists teaching "Sociology of Religion" courses). Thesefaculty members may have listed their teaching discipline as something other than "religion/religiousstudies."
Exhibit 9-1: Comparison of faculty list data and faculty questionnaire data,by gender
Gender (NSOPF-93 faculty questionnaire)(percent of cases)
Gender (faculty list) Male Female Total
Male 13,475 244 13,719(98.2) (1.8) (56.3)
Female 200 10,443 10,643(1.9) (98.1) (43.7)
Total 13,675 10,687 24,362(56.1) (43.9) (100.0)
Effective Sample Size: 24,362Frequency Missing: 1,418
Statistic DF Value Prob.Chi-Square 1 22591.762 .001Likelihood Ratio Chi-Square 1 28969.580 .001
Phi Coefficient .963Contingency Coefficient .694Cramers' V .963
116
126
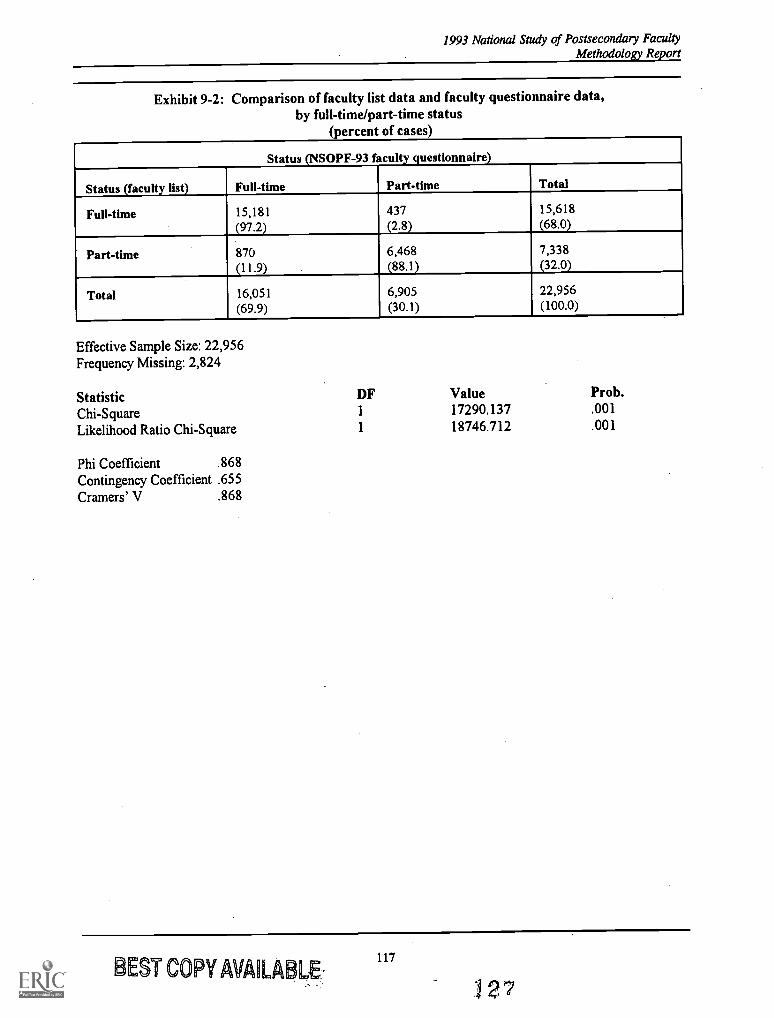
1993 National Study of Postsecondary FacultyMethodology Report
Exhibit 9-2: Comparison of faculty list data and faculty questionnaire data,by full-time/part-time status
(percent of cases)
Status (NSOPF-93 faculty questionnaire)
Status (faculty list) Full-time Part-time Total
Full-time 15,181 437 15,618
(97.2) (2.8) (68.0)
Part-time 870 6,468 7,338
(11.9) (88.1) (32.0)
Total 16,051 6,905 22,956(69.9) (30.1) (100.0)
Effective Sample Size: 22,956Frequency Missing: 2,824
Statistic DF Value Prob.
Chi-Square 1 17290.137 .001
Likelihood Ratio Chi-Square 1 18746.712 .001
Phi Coefficient .868Contingency Coefficient .655Cramers' V .868
BEST COPY AVAILABLE117
X27
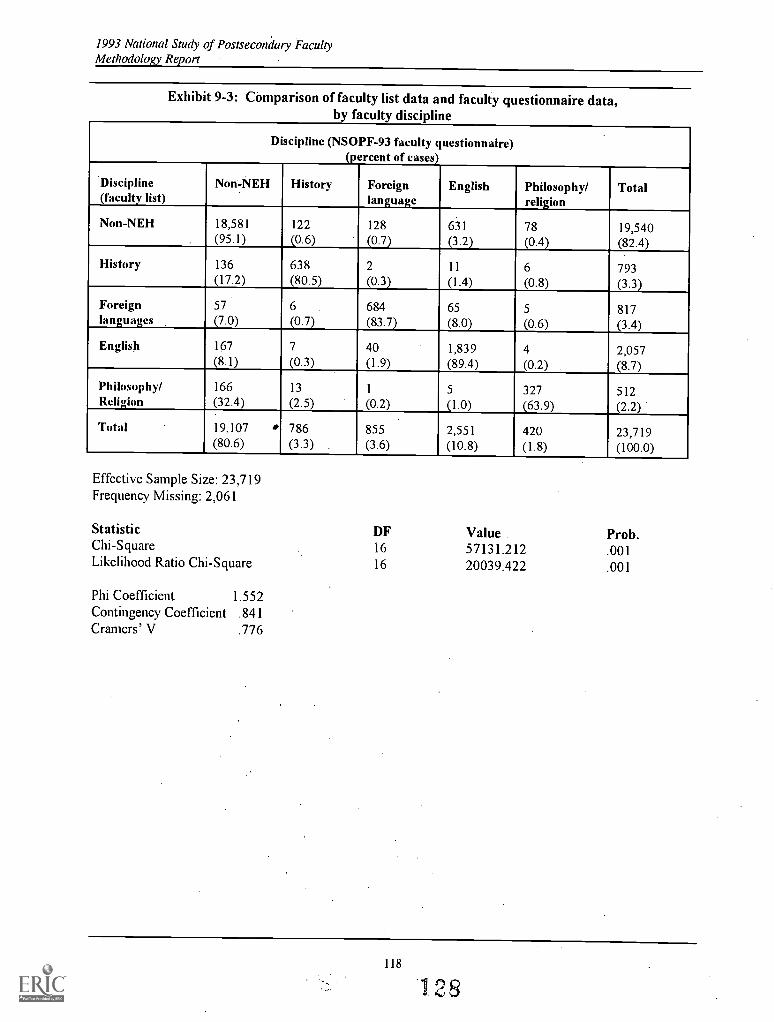
1993 National Study of Postsecondary FacultyMethodology Report
Exhibit 9-3: Comparison of faculty list data and faculty questionnaire data,by faculty discipline
Discipline (NSOPF-93 faculty questionnaire)(percent of cases)
Discipline(faculty list)
Non -NEH History Foreignlanguage
English Philosophy/religion
Total
Non-NEH 18,581 122 128 631 78 19,540. (95.1) (0.6) (0.7) (3.2) (0.4) (82.4)
History 136 638 2 11 6 793(17.2) (80.5) (0.3) (1.4) (0.8) (3.3)
Foreign 57 6 684 65 5 817languages (7.0) (0.7) (83.7) (8.0) (0.6) (3.4)
English 167 7 40 1,839 4 2,057(8.1) (0.3) (1.9) (89.4) (0.2) (8.7)
Philosophy/ 166 13 1 5 327 512Religion (32.4) (2.5) (0.2) (1.0) (63.9) (2.2)
Total 19,107 786 855 2,551 420 23,719(80.6) (3.3) (3.6) (10.8) (1.8) (100.0)
Effective Sample Size: 23,719Frequency Missing: 2,061
Statistic DF Value Prob.Chi-Square 16 57131.212 .001Likelihood Ratio Chi-Square 16 20039.422 .001
Phi Coefficient 1.552Contingency Coefficient .841Cramers' V .776
118
128
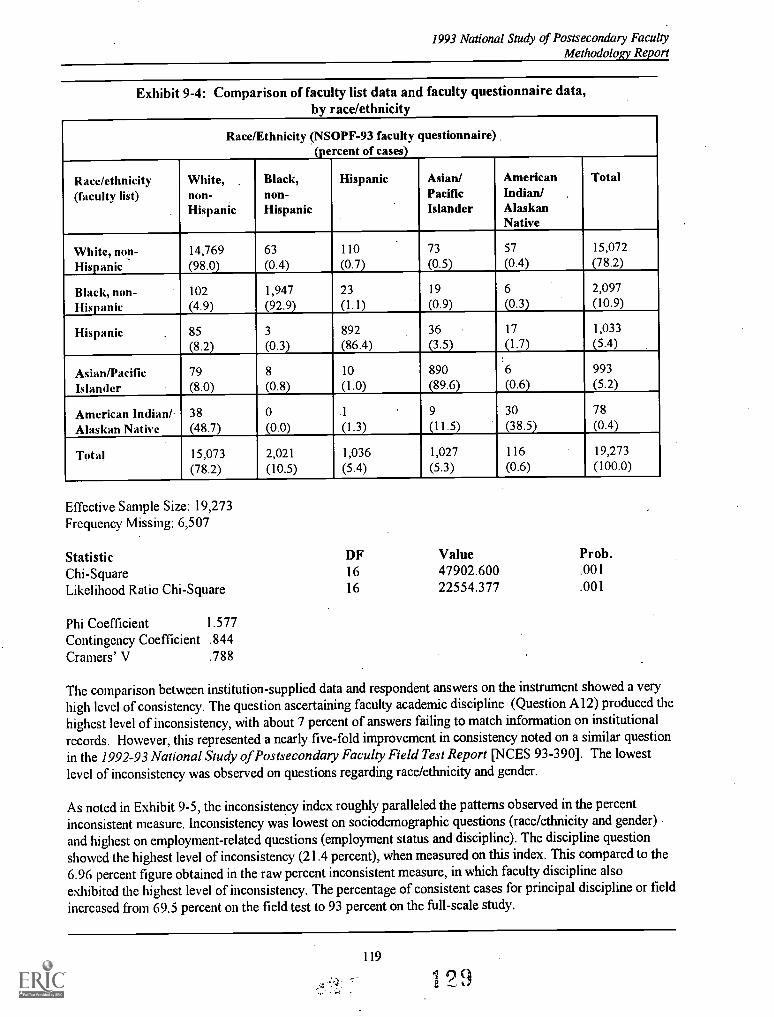
1993 National Study of Postsecondary FacultyMethodology Report
Exhibit 9-4: Comparison of faculty list data and faculty questionnaire data,by race/ethnicity
Race/Ethnicity (NSOPF-93 faculty questionnaire)(percent of cases)
Race/ethnicity(faculty liSt)
White,non-
Black,non-
Hispanic Asian/Pacific
AmericanIndian/
Total
Hispanic Hispanic Islander AlaskanNative
White, non- 14,769 63 110 73 57 15,072
Hispanic (98.0) (0.4) (0.7) (0.5) (0.4) (78.2)
Black, non- 102 1,947 23 19 6 2,097
Hispanic (4.9) (92.9) (1.1) (0.9) (0.3) (10.9)
Hispanic 85 3 892 36 17 1,033
(8.2) (0.3) (86.4) (3.5) (1.7) (5.4)
Asian/Pacific 79 8 10 890 6 993
Islander (8.0) (0.8) (1.0) (89.6) (0.6) (5.2)
American Indian/ 38 0 .1 9 30 78
Alaskan Native (48.7) (0.0) (1.3) (11.5) (38.5) (0.4)
Total 15,073 2,021 1,036 1,027 116 19,273
(78.2) (10.5) (5.4) (5.3) (0.6) (100.0)
Effective Sample Size: 19,273Frequency Missing: 6,507
Statistic DF Value Prob.
Chi-Square 16 47902.600 .001
Likelihood Ratio Chi-Square 16 22554.377 .001
Phi Coefficient 1.577Contingency Coefficient .844Cramers' V .788
The comparison between institution-supplied data and respondent answers on the instrument showed a very
high level of consistency. The question ascertaining faculty academic discipline (Question Al2) produced thehighest level of inconsistency, with about 7 percent of answers failing to match information on institutionalrecords. However, this represented a nearly five-fold improvement in consistency noted on a similar questionin the 1992-93 National Study of Postsecondary Faculty Field Test Report [NCES 93-390]. The lowestlevel of inconsistency was observed on questions regarding race/ethnicity and gender.
As noted in Exhibit 9-5, the inconsistency index roughly paralleled the patterns observed in the percentinconsistent measure. Inconsistency was lowest on sociodemographic questions (race/ethnicity and gender)
and highest on employment-related questions (employment status and discipline). The discipline questionshowed the highest level of inconsistency (21.4 percent), when measured on this index. This compared to the
6.96 percent figure obtained in the raw percent inconsistent measure, in which faculty discipline alsoexhibited the highest level of inconsistency. The percentage of consistent cases for principal discipline or field
increased from 69.5 percent on the field test to 93 percent on the full-scale study.
119
?9
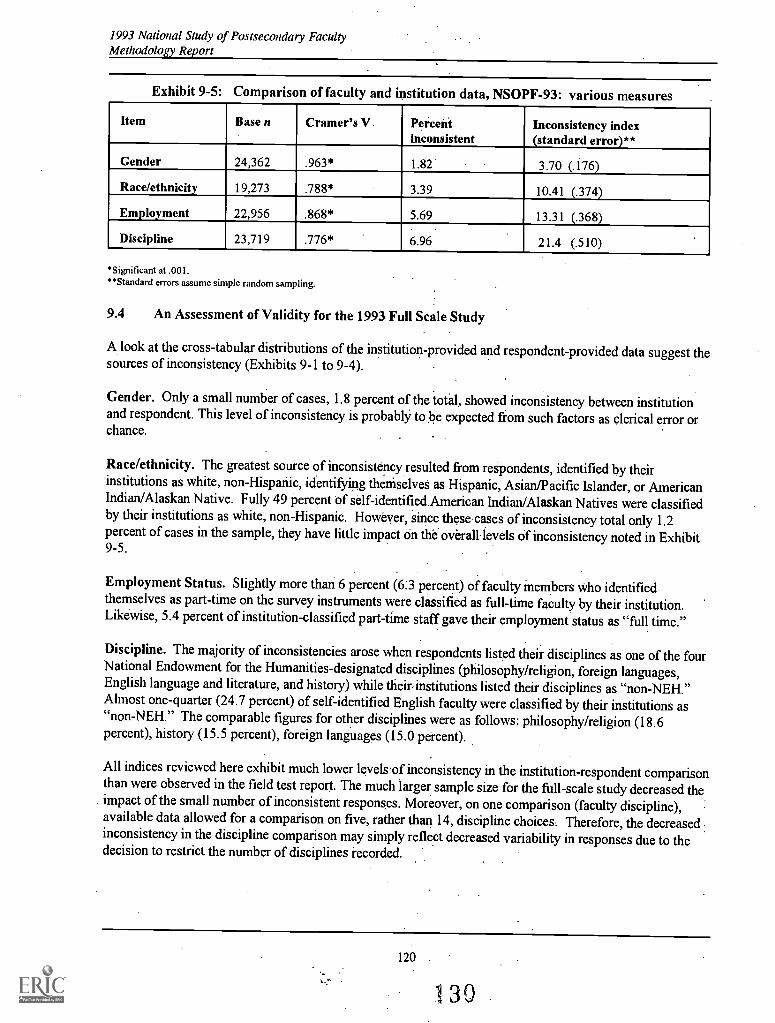
1993 National Study of Postsecondary FacultyMethodology Report
Exhibit 9-5: Comparison of faculty and institution data, NSOPF-93: various measures
Item Base n Cramer's V Percentinconsistent
Inconsistency index(standard error)**
Gender 24,362 .963* 1.82 3.70 (.176)
Race/ethnicity 19,273 .788* 3.39 10.41 (.374)
Employment 22,956 .868* 5.69 13.31 (.368)
Discipline 23,719 .776* 6.96 21.4 (.510)
*Significant at .001.**Standard errors assume simple random sampling.
9.4 An Assessment of Validity for the 1993 Full Scale Study
A look at the cross-tabular distributions of the institution-provided and respondent-provided data suggest thesources of inconsistency (Exhibits 9-1 to 9-4).
Gender. Only a small number of cases, 1.8 percent of the total, showed inconsistency between institutionand respondent. This level of inconsistency is probably to be expected from such factors as clerical errororchance.
Race/ethnicity. The greatest source of inconsistency resulted from respondents, identified by theirinstitutions as white, non-Hispanic, identi6iing theniselifes as Hispanic, Asian/Pacific Islander, or AmericanIndian/Alaskan Native. Fully 49 percent of self- identified. American Indian/Alaskan Natives were classifiedby their institutions as white, non-Hispanic. However, since these cases of inconsistency total only 1.2percent of cases in the sample, they have little impact on the.overaltievels ofinconsistency noted in Exhibit9-5.
Employment Status. Slightly more than 6 percent (6:3 percent) of faculty members who identifiedthemselves as part-time on the survey instruments were classified as full-time faculty by their institution.Likewise, 5.4 percent of institution-classified part-time staffgave their employment status as "full time."
Discipline. The majority of inconsistencies arose when respondents listed their disciplines as one of the fourNational Endowment for the Humanities-designated disciplines (philosophy/religion, foreign languages,English language and literature, and history) while theirinstitutions listed their disciplines as "non-NEH."Almost one-quarter (24.7 percent) of self-identified English faculty were classified by their institutions as"non-NEH." The comparable figures for other disciplines were as follows: philosophy/religion (18.6percent), history (15.5 percent), foreign languages (15.0 percent).
All indices reviewed here exhibit much lower levelsof inconsistency in the institution-respondent comparisonthan were observed in the field test report. The much larger sample size for the full-scale study decreased theimpact of the small number of inconsistent responses. Moreover, on one comparison (faculty discipline),available data allowed for a comparison on five, rather than 14, discipline choices. Therefore, the decreased
:
inconsistency in the discipline comparison may simply reflect decreased variability in responses due to thedecision to restrict the number of disciplines recorded.
120 .
130
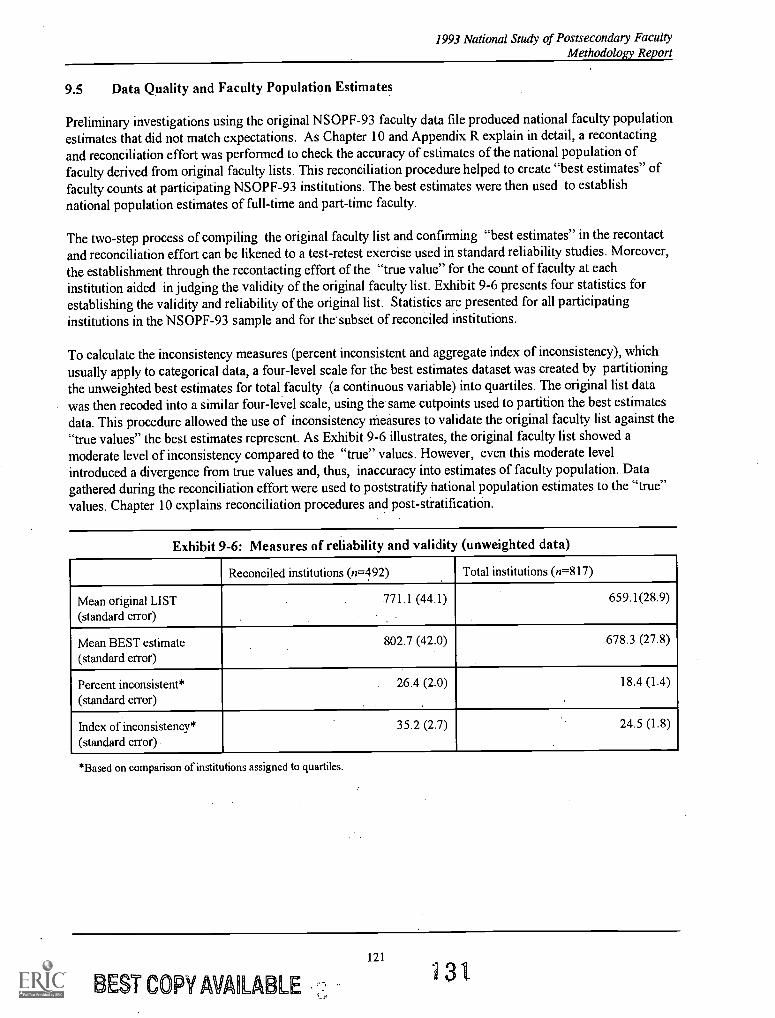
1993 National Study of Postsecondary FacultyMethodology Report
9.5 Data Quality and Faculty Population Estimates
Preliminary investigations using the original NSOPF-93 faculty data file produced national faculty populationestimates that did not match expectations. As Chapter 10 and Appendix R explain in detail, a recontactingand reconciliation effort was performed to check the accuracy of estimates of the national population offaculty derived from original faculty lists. This reconciliation procedure helped to create "best estimates" offaculty counts at participating NSOPF-93 institutions. The best estimates were then used to establishnational population estimates of full-time and part-time faculty.
The two-step process of compiling the original faculty list and confirming "best estimates" in the recontactand reconciliation effort can be likened to a test-retest exercise used in standard reliability studies. Moreover,the establishment through the recontacting effort of the "true value" for the count of faculty at eachinstitution aided in judging the validity of the original faculty list. Exhibit 9-6 presents four statistics forestablishing the validity and reliability of the original list. Statistics are presented for all participatinginstitutions in the NSOPF-93 sample and for the subset of reconciled institutions.
To calculate the inconsistency measures (percent inconsistent and aggregate index ofinconsistency), whichusually apply to categorical data, a four-level scale for the best estimates dataset was created by partitioningthe unweighted best estimates for total faculty (a continuous variable) into quartiles. The original listdatawas then recoded into a similar four-level scale, using the same cutpoints used to partition the best estimatesdata. This procedure allowed the use of inconsistency measures to validate the original faculty list against the"true values" the best estimates represent. As Exhibit 9-6 illustrates, the original faculty list showed amoderate level of inconsistency compared to the "true" values. However, even this moderate levelintroduced a divergence from true values and, thus, inaccuracy into estimates of faculty population. Datagathered during the reconciliation effort were used to poststratify national population estimates to the "true"values. Chapter 10 explains reconciliation procedures and post-stratification.
Exhibit 9-6: Measures of reliability and validity (unweighted data)
Reconciled institutions (n =492) Total institutions (n=817)
Mean original LIST(standard error)
771.1 (44.1) 659.1(28.9)
Mean BEST estimate(standard error)
802.7 (42.0) 678.3 (27.8)
Percent inconsistent*(standard error)
26.4 (2.0) 18.4 (1.4)
Index of inconsistency*(standard error)
35.2 (2.7) 24.5 (1.8)
Based on comparison of institutions assigned to quartiles.
121
BEST COPY AVAILABLE
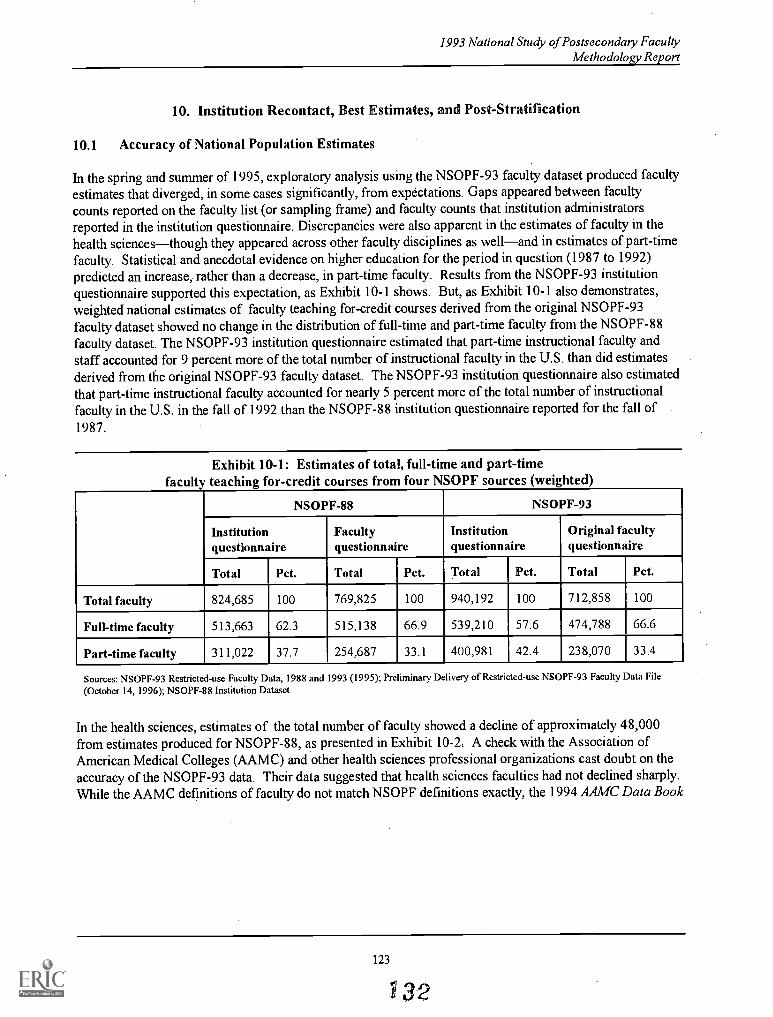
1993 National Study of Postsecondary FacultyMethodology Report
10. Institution Recontact, Best Estimates, and Post-Stratification
10.1 Accuracy of National Population Estimates
In the spring and summer of 1995, exploratory analysis using the NSOPF-93 faculty dataset produced facultyestimates that diverged, in some cases significantly, from expectations. Gaps appeared between facultycounts reported on the faculty list (or sampling frame) and faculty counts that institution administratorsreported in the institution questionnaire. Discrepancies were also apparent in the estimates of faculty in thehealth sciencesthough they appeared across other faculty disciplines as welland in estimates of part-timefaculty. Statistical and anecdotal evidence on higher education for the period in question (1987 to 1992)predicted an increase, rather than a decrease, in part-time faculty. Results from the NSOPF-93 institutionquestionnaire supported this expectation, as Exhibit 10-1 shows. But, as Exhibit 10-1 also demonstrates,weighted national estimates of faculty teaching for-credit courses derived from the original NSOPF-93faculty dataset showed no change in the distribution of full-time and part-time faculty from the NSOPF-88faculty dataset. The NSOPF-93 institution questionnaire estimated that part-time instructional faculty andstaff accounted for 9 percent more of the total number of instructional faculty in the U.S. than did estimatesderived from the original NSOPF-93 faculty dataset. The NSOPF -93 institution questionnaire also estimatedthat part-time instructional faculty accounted for nearly 5 percent more of the total number of instructionalfaculty in the U.S. in the fall of 1992 than the NSOPF-88 institution questionnaire reported for the fall of1987.
Exhibit 10-1: Estimates of total, full-time and part-timefaculty teaching for-credit courses from four NSOPF sources (weighted)
NSOPF-88 NSOPF-93
Institutionquestionnaire
Facultyquestionnaire
Institutionquestionnaire
Original facultyquestionnaire
Total Pct. Total Pct. Total Pct. Total Pct.
Total faculty 824,685 100 769,825 100 940,192 100 712,858 100
Full-time faculty 513,663 62.3 515,138 66.9 539,210 57.6 474,788 66.6
Part-time faculty 311,022 37.7 254,687 33.1 400,981 42.4 238,070 33.4
Sources: NSOPF-93 Restricted-use Faculty Data, 1988 and 1993 (1995); Preliminary Delivery of Restricted-use NSOPF-93 Faculty Data File(October 14, 1996); NSOPF-88 Institution Dataset
In the health sciences, estimates of the total number of faculty showed a decline of approximately 48,000from estimates produced for NSOPF-88, as presented in Exhibit 10-2. A check with the Association ofAmerican Medical Colleges (AAMC) and other health sciences professional organizations cast doubt on theaccuracy of the NSOPF-93 data. Their data suggested that health sciences faculties had not declined sharply.While the AAMC definitions of faculty do not match NSOPF definitions exactly, the 1994 AAMC Data Book
123
32
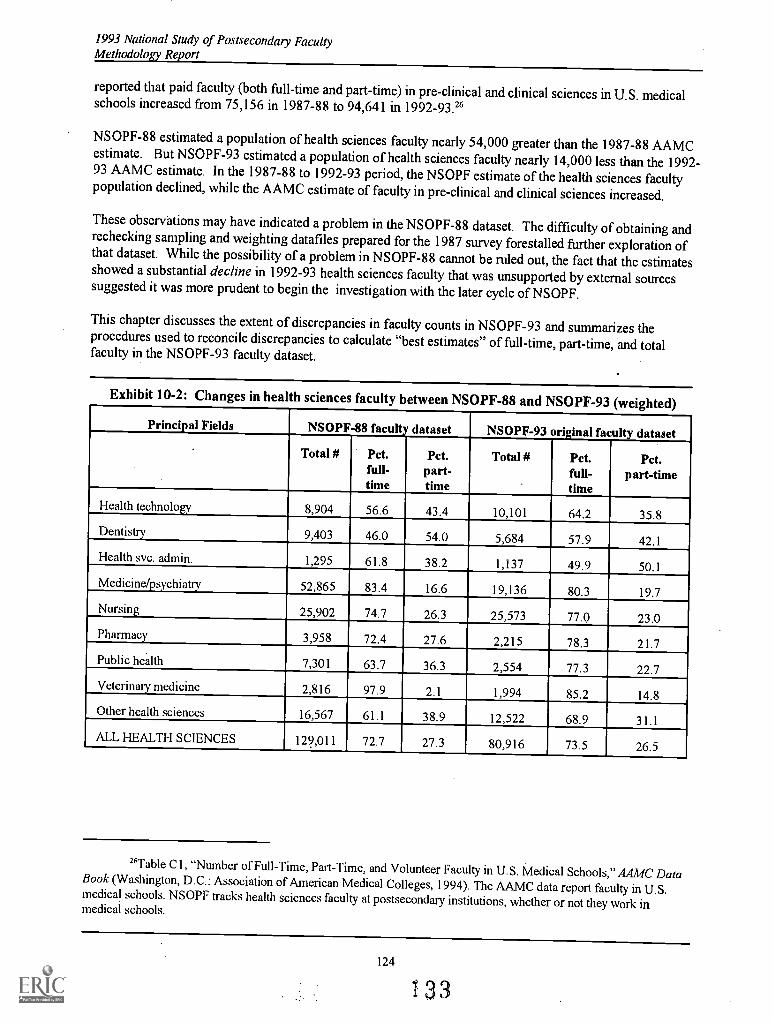
1993 National Study of Postsecondary FacultyMethodology Report
reported that paid faculty (both full-time and part-time) in pre-clinical and clinical sciences in U.S. medicalschools increased from 75,156 in 1987-88 to 94,641 in 1992-93.2'
NSOPF-88 estimated a population of health sciences faculty nearly 54,000 greater than the 1987-88 AAMCestimate. But NSOPF-93 estimated a population of health sciences faculty nearly 14,000 less than the 1992-93 AAMC estimate. In the 1987-88 to 1992-93 period, the NSOPF estimate of the health sciences facultypopulation declined, while the AAMC estimate of faculty in pre-clinical and clinical sciences increased.
These observations may have indicated a problem in the NSOPF-88 dataset. The difficulty of obtaining andrechecking sampling and weighting datafiles prepared for the 1987 survey forestalled further exploration ofthat dataset. While the possibility of a problem in NSOPF-88 cannot be ruled out, the fact that the estimatesshowed a substantial decline in 1992-93 health sciences faculty that was unsupported by external sourcessuggested it was more prudent to begin the investigation with the later cycle of NSOPF.
This chapter discusses the extent of discrepancies in faculty counts in NSOPF-93 and summarizes theprocedures used to reconcile discrepancies to calculate "best estimates" of full-time, part-time, and totalfaculty in the NSOPF-93 faculty dataset.
Exhibit 10-2: Changes in health sciences faculty between NSOPF-88 and NSOPF-93 (weighted)
Principal Fields NSOPF-88 facult dataset NSOPF-93 original faculty dataset
Total # Pct.full-time
Pct.part-time
Total # Pct.full-time
Pct.part-time
Health technology 8,904 56.6 43.4 10,101 64.2 35.8Dentistry 9,403 46.0 54.0 5,684 57.9 42.1
Health svc. admin. 1,295 61.8 38.2 1,137 49.9 50.1
Medicine/psychiatry 52,865 83.4 16.6 19,136 80.3 19.7Nursing 25,902 74.7 26.3 25,573 77.0 23.0Pharmacy 3,958 72.4 27.6 2,215 78.3 21.7Public health 7,301 63.7 36.3 2,554 77.3 22.7Veterinary medicine 2,816 97.9 2.1 1,994 85.2 14.8Other health sciences 16,567 61.1 38.9 12,522 68.9 31.1
ALL HEALTH SCIENCES 129,011 72.7 27.3 80,916 73.5 26.5
26Table Cl, "Number of Full-Time, Part-Time, and Volunteer Faculty in U.S. Medical Schools," AAMC DataBook (Washington, D.C.: Association of American Medical Colleges, 1994). The AAMC data report faculty in U.S.medical schools. NSOPF tracks health sciences faculty at postsecondary institutions, whether or not they work inmedical schools.
124
1 3 3
1993 National Study of Postsecondary FacultyMethodology Report
10.2 Discrepancies in Faculty Counts'
Estimates of the total number of faculty in the target population were based on reports from two differentsources within the same sampled institutions. One of these sources was the faculty lists provided by theparticipating institutions for sampling purposes (hereafter, referred to as "LIST"). Another source was theinstitutional representatives' survey responses to the NSOPF-93 institution questionnaire (hereafter, referredto as "QUEX") regarding the number of faculty in these same institutions. A third source of validation, theNational Center for Education Statistics' Integrated Postsecondary Education Data System (hereafter referredto as "IPEDS'''), provided a benchmark by which to check faculty estimates from the other two sources. Thestudy intended to enumerate eligible faculty employed in the academic term including October 15, 1992.
Discrepancies in faculty estimates from the three sources (LIST, QUEX, and IPEDS) were to some extentinevitable because of variations in definitions used by IPEDS and the two NSOPF-93 sources. NSOPF-93used a broader and more inclusive definition of postsecondary faculty than IPEDS uses. See the discussionon comparisons between NSOPF and IPEDS in section 3.10 and in Appendix R, section 1.2. Moreover,postsecondary institutions use different data systems to account for faculty. To check the quality of thefaculty lists during the 1992 list collection effort, discrepancies between the numbers of total facultyenumerated among these three sources were monitored. This institution-level comparison of unweighted datafound that faculty counts from the LIST and QUEX data generally exceeded those reported on IPEDS. Thispattern was in the anticipated direction, indicating that the original listing operation accounted for a greaternumber of faculty than institutions reported in the 1991-92 IPEDS (the most current data available when thestudy was fielded). Exhibit 10-3 summarizes the total number of faculty enumerated on these datasets.
"The analysis presented here concentrates on the discrepancy in faculty counts between those reported on thefaculty list provided for sampling purposes and those reported on the NSOPF-93 institution questionnaire. For a moredetailed discussion of the discrepancy analysis and of the recontacting effort, see Appendix R: Technical Report:Discrepancies in Faculty Estimates in the 1992-93 National Study of Postsecondary Faculty.
'The National Center for Education Statistics (NCES) coordinates with the Equal Employment OpportunityCommission (EEOC) to obtain biennial data (such as race, gender, salary levels, job classifications, etc.) frompostsecondary institutions on their employees. NCES publishes these data in its Integrated Postsecondary EducationData System (IPEDS).
.-1251 3 4
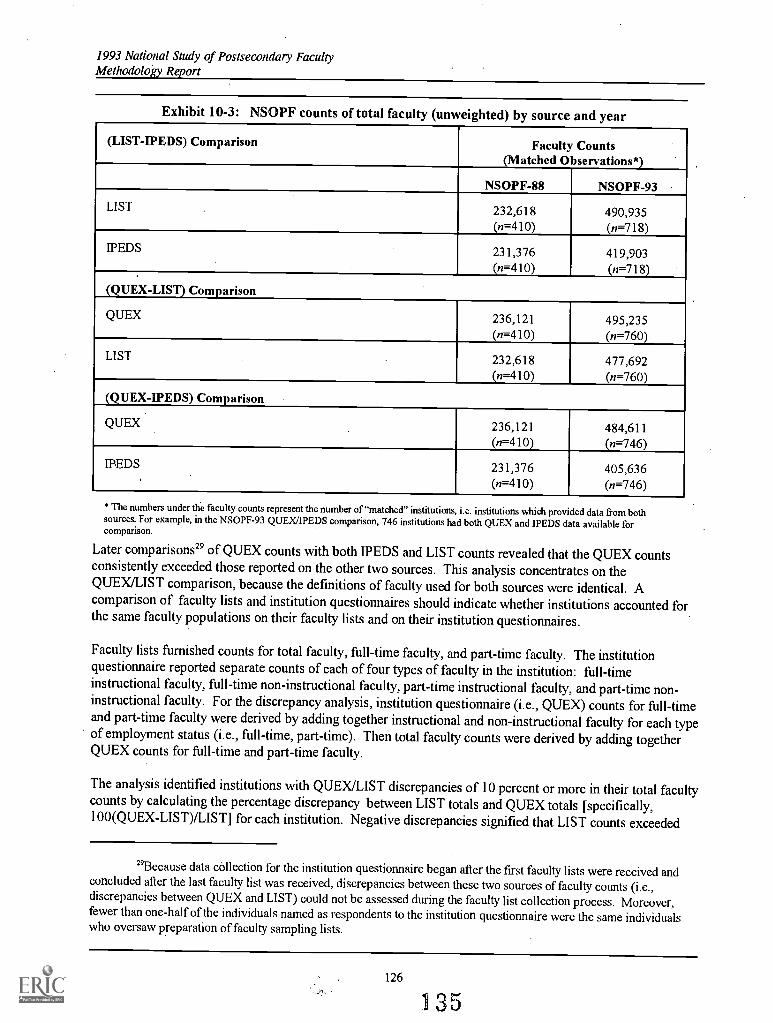
1993 National Study of Postsecondary FacultyMethodology Report
Exhibit 10-3: NSOPF counts of total faculty (unweighted) by source and year
(LIST-1PEDS) Comparison Faculty Counts(Matched Observations*)
NSOPF-88 NSOPF-93
LIST 232,618 490,935(n=410) (n=718)
IPEDS 231,376 419,903(n=410) (n=718)
(QUEX-LIST) Comparison
QUEX 236,121 495,235(n=410) (n=760)
LIST 232,618 477,692(n=410) (n=760)
(QUEX- IPEDS) Comparison
QUEX 236,121 484,611(n=410) (n=746)
WEDS 231,376 405,636(n=410) (n=746)
The numbers under the faculty counts represent the number of "matched" institutions, i.e. institutionswhich prov'cled data from bothsources. For example, in the NSOPF-93 QUEX/IPEDS comparison, 746 institutions had both QUEX and IPEDS data available forcomparison.
Later comparisons' of QUEX counts with both IPEDS and LIST counts revealed that the QUEX countsconsistently exceeded those reported on the other two sources. This analysis concentrates on theQUEX/LIST comparison, because the definitions of faculty used for both sources were identical. Acomparison of faculty lists and institution questionnaires should indicate whether institutions accounted forthe same faculty populations on their faculty lists and on their institution questionnaires.
Faculty lists furnished counts for total faculty, full-time faculty, and part-time faculty. The institutionquestionnaire reported separate counts of each of four types of faculty in the institution: full-timeinstructional faculty, full-time non-instructional faculty, part-time instructional faculty, and part-time non-instructional faculty. For the discrepancy analysis, institution questionnaire (i.e., QUEX) counts for full-timeand part-time faculty were derived by adding together instructional and non-instructional faculty for each typeof employment status (i.e., full-time, part-time). Then total faculty counts were derived by adding togetherQUEX counts for full-time and part-time faculty.
The analysis identified institutions with QUEX/LIST discrepancies of 10 percent or more in their total facultycounts by calculating the percentage discrepancy between LIST totals and QUEX totals [specifically,100(QUEX-LIST) /LIST] for each institution. Negative discrepancies signified that LIST counts exceeded
'Because data collection for the institution questionnaire began after the first faculty lists were received andconcluded after the last faculty list was received, discrepancies between these two sources of faculty counts (i.e.,discrepancies between QUEX and LIST) could not be assessed during the faculty list collection process. Moreover,fewer than one-half of the individuals named as respondents to the institution questionnaire were the same individualswho oversaw preparation of faculty sampling lists.
126
135
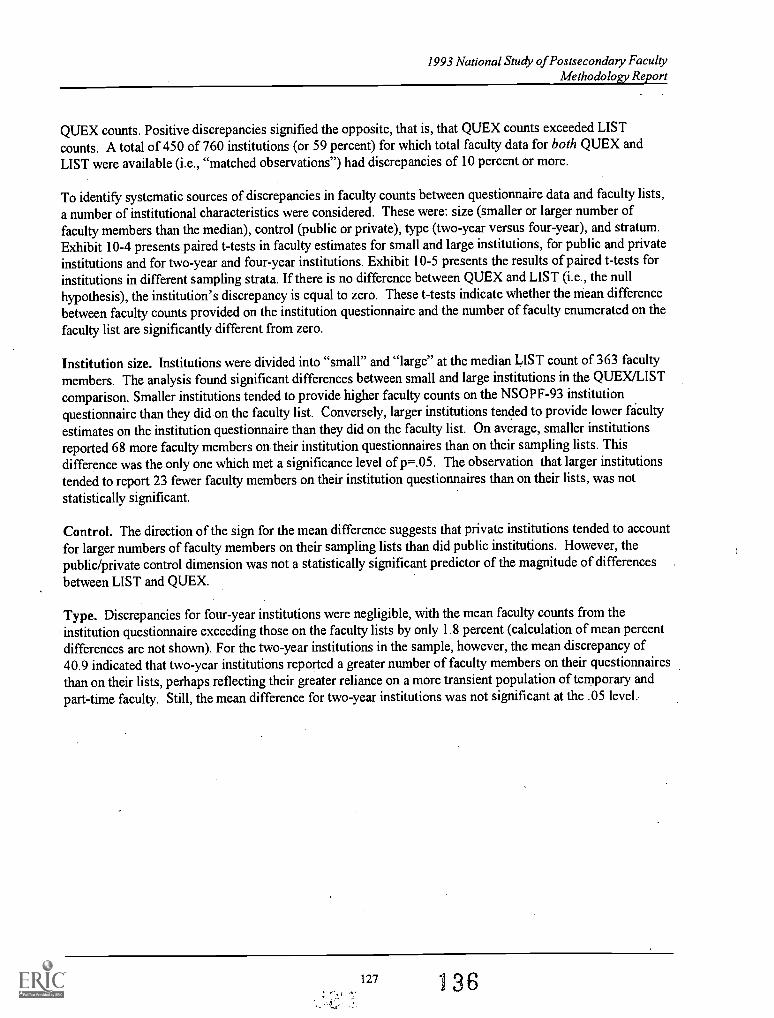
1993 National Study of Postsecondary FacultyMethodology Report
QUEX counts. Positive discrepancies signified the opposite, that is, that QUEX counts exceededLISTcounts. A total of 450 of 760 institutions (or 59 percent) for which total faculty data for both QUEX andLIST were available (i.e., "matched observations") had discrepancies of 10 percent or more.
To identify systematic sources of discrepancies in faculty counts between questionnaire data and faculty lists,
a number of institutional characteristics were considered. These were: size (smaller or larger number offaculty members than the median), control (public or private), type (two-year versus four-year), and stratum.Exhibit 10-4 presents paired t-tests in faculty estimates for small and large institutions, for public and privateinstitutions and for two-year and four-year institutions. Exhibit 10-5 presents the results of paired t-tests forinstitutions in different sampling strata. If there is no difference between QUEX and LIST (i.e., the nullhypothesis), the institution's discrepancy is equal to zero. These t-tests indicate whether the mean differencebetween faculty counts provided on the institution questionnaire and the number of faculty enumerated on the
faculty list are significantly different from zero.
Institution size. Institutions were divided into "small" and "large" at the median LIST count of 363 facultymembers. The analysis found significant differences between small and large institutions in the QUEX/LISTcomparison. Smaller institutions tended to provide higher faculty counts on the NSOPF-93 institutionquestionnaire than they did on the faculty list. Conversely, larger institutions tended to provide lower facultyestimates on the institution questionnaire than they did on the faculty list. On average, smaller institutionsreported 68 more faculty members on their institution questionnaires than on their sampling lists. Thisdifference was the only one which met a significance level of p=.05. The observation that largerinstitutionstended to report 23 fewer faculty members on their institution questionnaires than on their lists, was notstatistically significant.
Control. The direction of the sign for the mean difference suggests that private institutions tended to accountfor larger numbers of faculty members on their sampling lists than did public institutions. However, thepublic/private control dimension was not a statistically significant predictor of the magnitude of differencesbetween LIST and QUEX.
Type. Discrepancies for four-year institutions were negligible, with the mean faculty counts from theinstitution questionnaire exceeding those on the faculty lists by only 1.8 percent (calculation of mean percentdifferences are not shown). For the two-year institutions in the sample, however, the mean discrepancy of40.9 indicated that two-year institutions reported a greater number of faculty members on their questionnairesthan on their lists, perhaps reflecting their greater reliance on a more transient population of temporary andpart-time faculty. Still, the mean difference for two-year institutions was not significant at the .05 level.
127 38
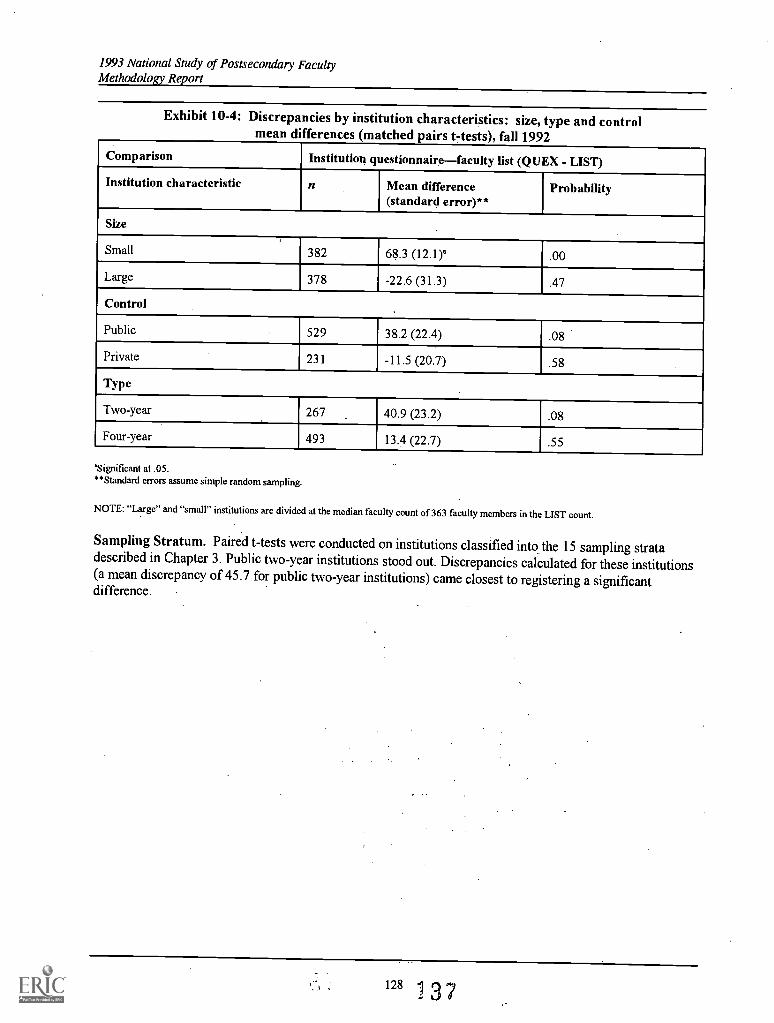
1993 National Study of Postsecondary FacultyMethodology Report
Exhibit 10-4: Discrepancies by institution characteristics: size, type and controlmean differences (matched pairs t-tests), fall 1992
Comparison Institution questionnairefaculty list (QUEX - LIST)
Institution characteristic n Mean difference(standard error)**
Probability
Size
Small 382 68.3 (12.1)a .00
Large 378 -22.6 (31.3) .47
Control
Public 529 38.2 (22.4) .08
Private 231 -11.5 (20.7) .58
Type
Two-year 267 40.9 (23.2) .08
Four-year 493 13.4 (22.7) .55
'Significant at .05.**Standard errors assume simple random sampling.
NOTE: "Large" and "small" institutions are divided at the median faculty count of 363 faculty members in the LIST count.
Sampling Stratum. Paired t-tests were conducted on institutions classified into the 15 sampling stratadescribed in Chapter 3. Public two-year institutions stood out. Discrepancies calculated for these institutions(a mean discrepancy of 45.7 for public two-year institutions) came closest to registering a significantdifference.
128 9 37
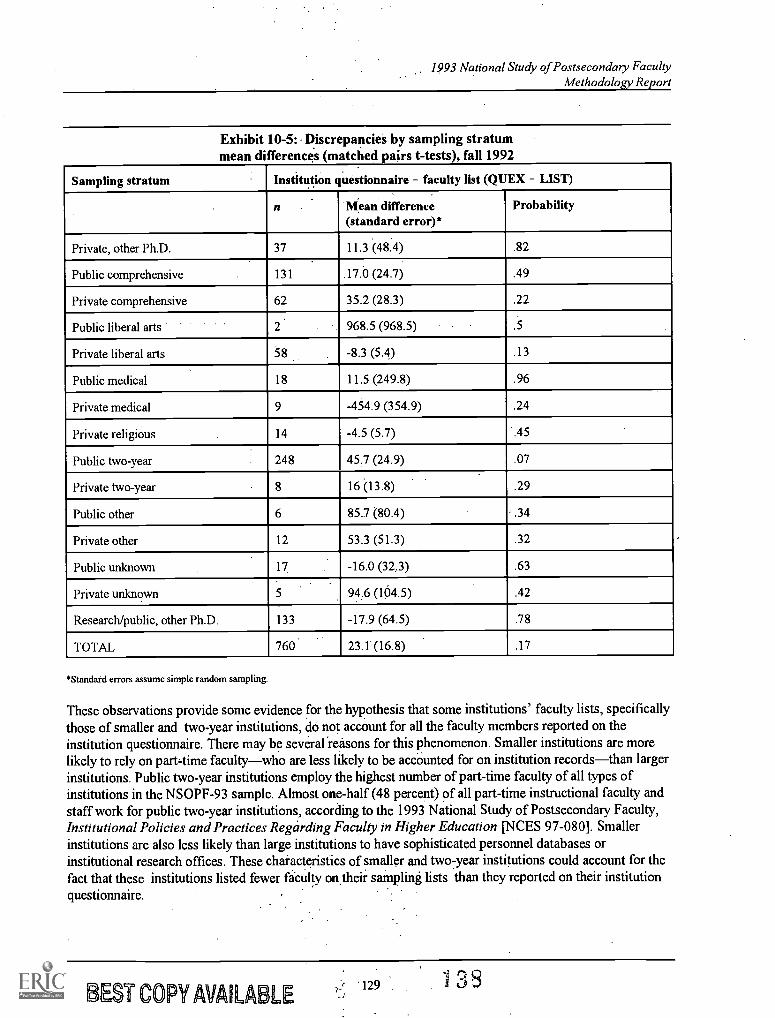
1993 National Study of Postsecondary FacultyMethodology Report
Exhibit 10-5: Discrepancies by sampling stratummean differences (matched pairs t-tests , fall 1992
Sampling stratum Institution questionnaire faculty list (QUEX LIST)
n Mean difference(standard error)*
Probability
Private, other Ph.D. 37 11.3 (48.4) .82
Public comprehensive 131 .17.0 (24.7) .49
Private comprehensive 62 35.2 (28.3) .22
Public liberal arts 2 968.5 (968.5) .5
Private liberal arts 58 -8.3 (5.4) .13
Public medical 18 11.5 (249.8) .96
Private medical 9 -454.9 (354.9) .24
Private religious 14 -4.5 (5.7) .45
Public two-year 248 45.7 (24.9) .07
Private two-year - 8 16 (13.8) .29
Public other 6 85.7 (80.4) :.34
Private other 12 53.3 (51.3) .32
Public unknown 17 -16.0 (32.3) .63
Private unknown 5 94.6 (104.5) .42
Research/public, other Ph.D. 133 -17.9 (64.5) .78
TOTAL 760. 23.1' (16.8) .17
''Standard errors assume simple random sampling.
These observations provide some evidence for the hypothesis that some institutions' faculty lists, specificallythose of smaller and two-year institutions, do not account for all the faculty members reported on theinstitution questionnaire. There may be several reasons for this phenomenon. Smaller institutions are morelikely to rely on part-time faculty-who are less likely to be accounted for on institution records-than largerinstitutions. Public two-year institutions employ the highest number of part-time faculty of all types ofinstitutions in the NSOPF-93 sample. Almost one-half (48 percent) of all part-time instructional faculty andstaff work for public two-year institutions, according to the 1993 National Study of Postsecondary Faculty,Institutional Policies and Practices Regarding Faculty in Higher Education [NCES 97-080]. Smallerinstitutions are also less likely than large institutions to have sophisticated personnel databases orinstitutional research offices. These characteristics of smaller and two-year institutions could account for thefact that these institutions listed fewer faculty ontheir sampling lists than they reported on their institutionquestionnaire.
IE ST COPY AVAILABLE'129 3 8
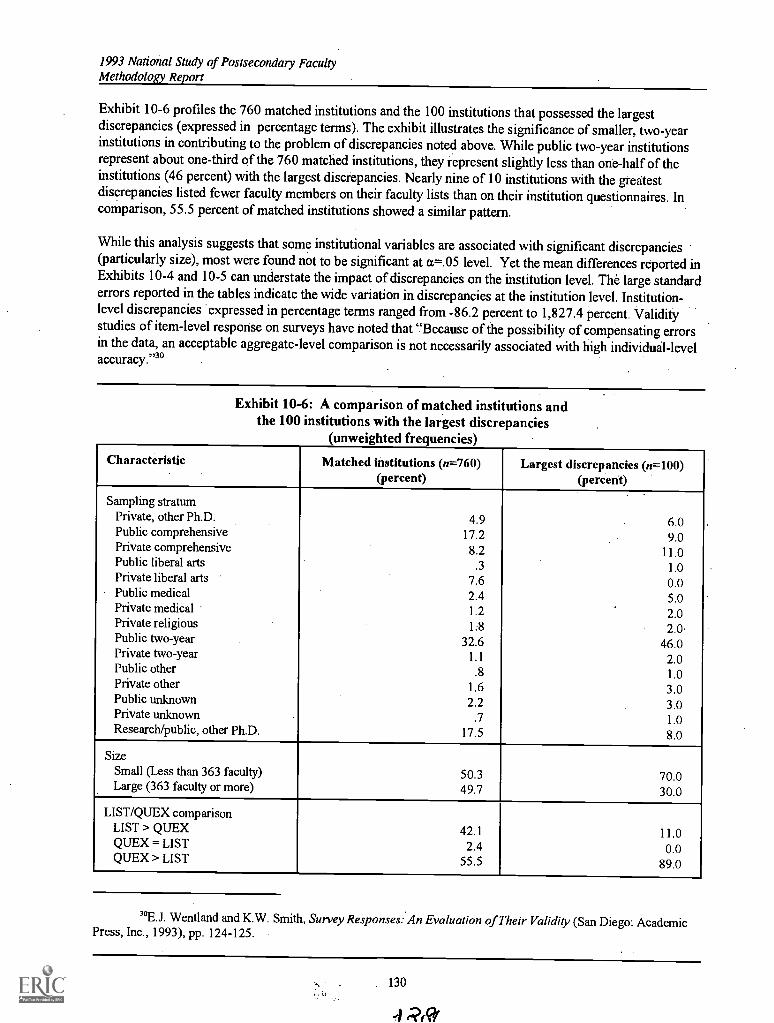
1993 National Study of Postsecondary FacultyMethodology Report
Exhibit 10-6 profiles the 760 matched institutions and the 100 institutions that possessed the largestdiscrepancies (expressed in percentage terms). The exhibit illustrates the significance of smaller, two-yearinstitutions in contributing to the problem of discrepancies noted above. While public two-year institutionsrepresent about one-third of the 760 matched institutions, they represent slightly less than one-half of theinstitutions (46 percent) with the largest discrepancies. Nearly nine of 10 institutions with the gredtestdiscrepancies listed fewer faculty members on their faculty lists than on their institution questionnaires. Incomparison, 55.5 percent of matched institutions showed a similar pattern.
While this analysis suggests that some institutional variables are associated with significant discrepancies(particularly size), most were found not to be significant at a=.05 level. Yet the mean differences reported inExhibits 10-4 and 10-5 can understate the impact of discrepancies on the institution level. The large standarderrors reported in the tables indicate the wide variation in discrepancies at the institution level. Institution-level discrepancies 'expressed in percentage terms ranged from -86.2 percent to 1,827.4 percent. Validitystudies of item-level response on surveys have noted that "Because of the possibility of compensating errorsin the data, an acceptable aggregate-level comparison is not necessarily associated with high individual-levelaccuracy.' ,30
Exhibit 10-6: A comparison of matched institutions andthe 100 institutions with the largest discrepancies
(unweighted frequencies)
Characteristic Matched institutions (n=760)(percent)
Largest discrepancies (n=100)(percent)
Sampling stratumPrivate, other Ph.D. 4.9 6.0Public comprehensive 17.2 9.0Private comprehensive 8.2 11.0Public liberal arts .3 1.0Private liberal arts 7.6 0.0Public medical 2.4 5.0Private medical 1.2 2.0Private religious 1:8 2.0.Public two-year 32.6 46.0Private two-year 1.1 2.0Public other .8 1.0Private other 1.6 3.0Public unknown 2.2 3.0Private unknown .7 1.0Research/public, other Ph.D. 17.5 8.0
SizeSmall (Less than 363 faculty) 50.3 70.0Large (363 faculty or more) 49.7 30.0
LIST/QUEX comparisonLIST > QUEX 42.1 11.0QUEX = LIST 2.4 0.0QUEX > LIST 55.5 89.0
"E.J. Wentland and K.W. Smith, Survey Responses: An Evaluation ofTheir Validity (San Diego: AcademicPress, Inc., 1993), pp. 124-125.
130
RR/
1993 National Study of Postsecondary FacultyMethodology Report
10.3 Obtaining Verification from Institutions
To determine which faculty counts more accurately reflected institutions' "true" population estimates, a largesubset of institutions were recontacted. Institutions that showed a difference of 10 percent or greater betweentheir QUEX faculty totals and their LIST faculty totals were selected. As. mentioned earlier, 450 of the 760"matched" institutions' (59 percent) showed a discrepancy of 10 percent or more between the institutionquestionnaire and the faculty list. Moreover, to document institutions' accounting for their health sciencesfaculty, all 120 institutions which NCES identified as operating medical schools or hospitals were.alsoincluded in the recontacting effort. Of those 120 institutions, 61 were already included among the 450institutions with discrepancies of 10 percent or greater.
The objective in recontact was to determine which set of faculty counts was correct (QUEX, LIST or, insome instances, a third set of counts), and to determine the reasons for the original reporting discrepancies. Intelephone follow-up calls, institution administrators were presented with QUEX and LIST figures and askedto choose which of the two most accurately reflected the true population estimate of their faculty in the fallterm of 1992. In most cases, administrators were able to choose either the QUEX or the LIST figure.However, in some cases, administrators supplied a different set of estimates.
Of the total of 509 institutions selected for recontact, verification was obtained for 492 (or 96.7 percent) ofthe institutions. A total of 402 (81.7 percent) of the institutions reported, at a minimum, which set ofcountsthose from the faculty sampling list or those from the institution questionnaireprovided the mostaccurate faculty estimates. In 280 of the 492 (56.9 percent) cases, institutions reported that the institutionquestionnaire data provided the most accurate faculty estimates.
One hundred twenty-two (24.8 percent) institutions reported that the faculty list they supplied for samplingpurposes (i.e., LIST) provided the most accurate accounting of their faculty and instructional staff population.Only 56 of the 492 institutions (11.4 percent) provided an entirely different set of estimates that did notcorrespond either to the list or to the questionnaire estimates originally submitted. Five institutions (1percent)all institutions operating medical schools or hospitalschose IPEDS as their best estimate. Theremaining 29 institutions (5.9 percent) were unable to provide a definitive rationale for changing theiroriginal LIST estimates. For these, the original LIST estimate was used to derive best estimates.Exhibit 10-7 illustrates the results of the recontacting effort for the 492 institutions providing verified data.
'Although 817 institutions provided faculty enumerations in the NSOPF-93 full-scale study, only 760 (93percent) of this total had matched data available (i.e., also completed an institution questionnaire).
131
140
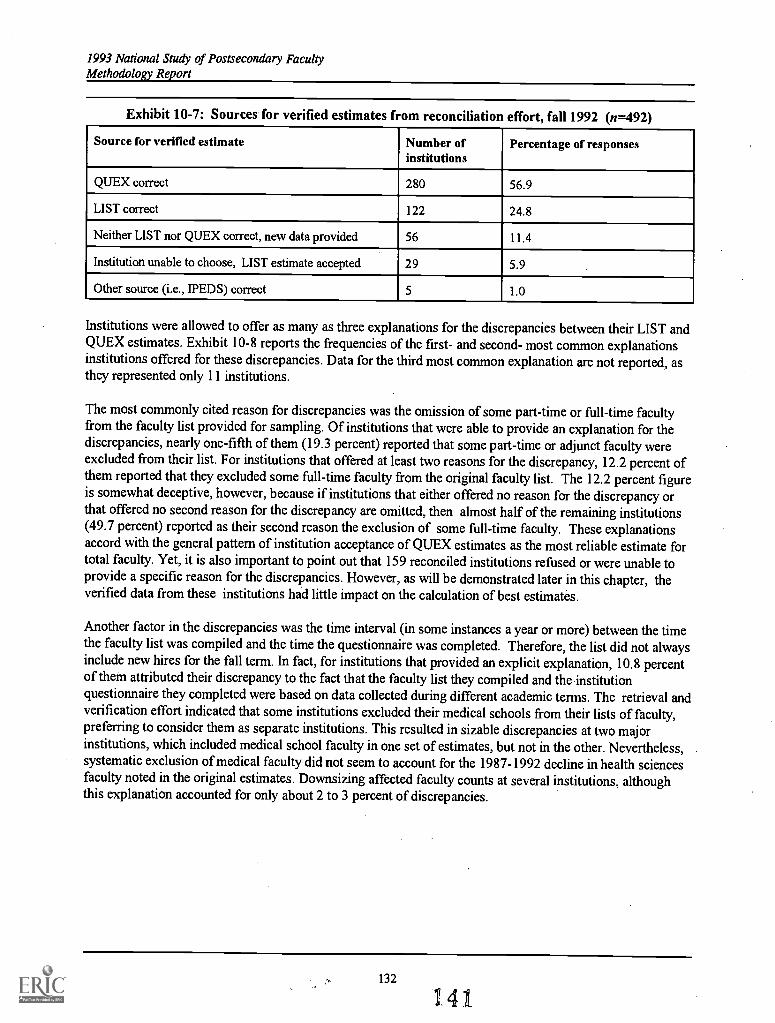
1993 National Study of Postsecondary FacultyMethodology Report
Exhibit 10-7: Sources for verified estimates from reconciliation effort, fall 1992 (n=492)
Source for verified estimate Number ofinstitutions
Percentage of responses
QUEX correct 280 56.9
LIST correct 122 24.8
Neither LIST nor QUEX correct, new data provided 56 11.4
Institution unable to choose, LIST estimate accepted 29 5.9
Other source (i.e., IPEDS) correct 5 1.0
Institutions were allowed to offer as many as three explanations for the discrepancies between theirLIST andQUEX estimates. Exhibit 10-8 reports the frequencies of the first- and second- most common explanationsinstitutions offered for these discrepancies. Data for the third most common explanation are not reported, asthey represented only 11 institutions.
The most commonly cited reason for discrepancies was the omission of some part-time or full-time facultyfrom the faculty list provided for sampling. Of institutions that were able to provide an explanation for thediscrepancies, nearly one-fifth of them (19.3 percent) reported that some part-time or adjunct faculty wereexcluded from their list. For institutions that offered at least two reasons for the discrepancy, 12.2 percent ofthem reported that they excluded some full-time faculty from the original faculty list. The 12.2 percent figureis somewhat deceptive, however, because if institutions that either offeredno reason for the discrepancy orthat offered no second reason for the discrepancy are omitted, then almost half of the remaining institutions(49.7 percent) reported as their second reason the exclusion of some full-time faculty. These explanationsaccord with the general pattern of institution acceptance of QUEX estimates as the most reliable estimate fortotal faculty. Yet, it is also important to point out that 159 reconciled institutions refused or were unable toprovide a specific reason for the discrepancies. However, as will be demonstrated later in this chapter, theverified data from these institutions had little impact on the calculation of best estimates.
Another factor in the discrepancies was the time interval (in some instances a year or more) between the timethe faculty list was compiled and the time the questionnaire was completed. Therefore, the list did not alwaysinclude new hires for the fall term. In fact, for institutions that provided an explicit explanation, 10.8 percentof them attributed their discrepancy to the fact that the faculty list they compiled and the-institutionquestionnaire they completed were based on data collected during different academic terms. The retrieval andverification effort indicated that some institutions excluded their medical schools from their lists of faculty,preferring to consider them as separate institutions. This resulted in sizable discrepancies at two majorinstitutions, which included medical school faculty in one set of estimates, but not in the other. Nevertheless,systematic exclusion of medical faculty did not seem to account for the 1987-1992 decline inhealth sciencesfaculty noted in the original estimates. Downsizing affected faculty counts at several institutions, althoughthis explanation accounted for only about 2 to 3 percent of discrepancies.
132
41
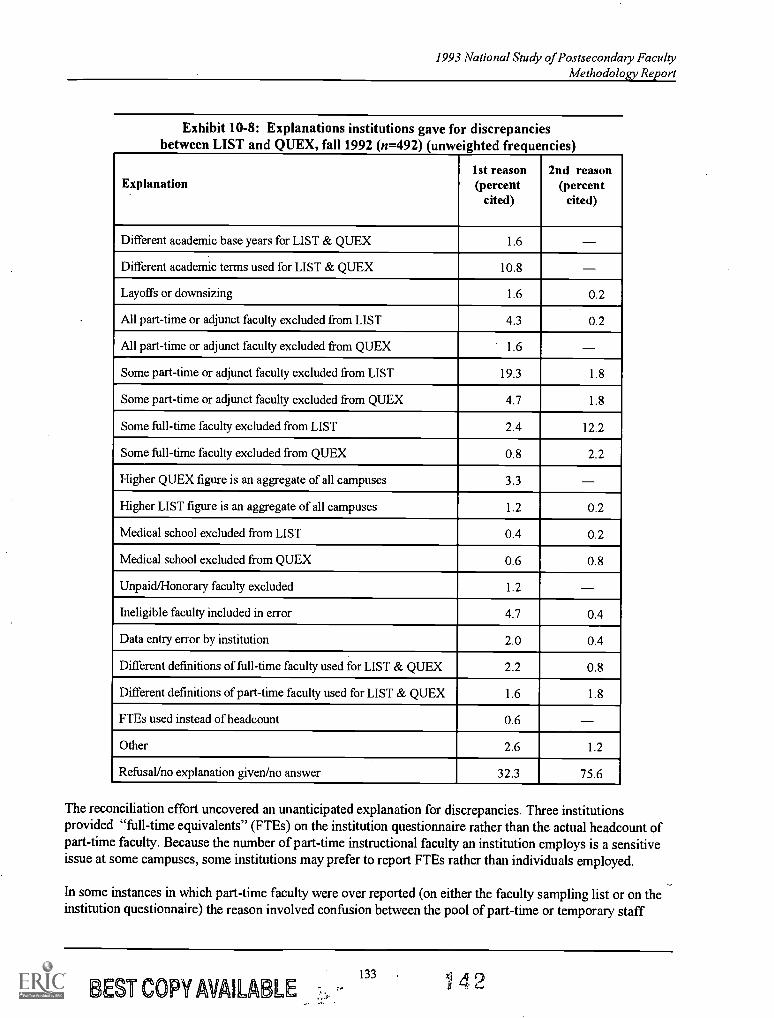
1993 National Study of Postsecondary FacultyMethodology Report
Exhibit 10-8: Explanations institutions gave for discrepanciesbetween LIST and QUEX, fall 1992 (n=492) (unweighted frequencies)
Explanation1st reason(percent
cited)
2nd reason(percent
cited)
Different academic base years for LIST & QUEX 1.6 -Different academic terms used for LIST & QUEX 10.8
Layoffs or downsizing 1.6 0.2
All part-time or adjunct faculty excluded from LIST 4.3 0.2
All part-time or adjunct faculty excluded from QUEX 1.6 -Some part-time or adjunct faculty excluded from LIST 19.3 1.8
Some part-time or adjunct faculty excluded from QUEX 4.7 1.8
Some full-time faculty excluded from LIST 2.4 12.2
Some full-time faculty excluded from QUEX 0.8 2.2
Higher QUEX figure is an aggregate of all campuses 3.3
Higher LIST figure is an aggregate of all campuses 1.2 0.2
Medical school excluded from LIST 0.4 0.2
Medical school excluded from QUEX 0.6 0.8
Unpaid/Honorary faculty excluded 1.2 -Ineligible faculty included in error 4.7 0.4
Data entry error by institution 2.0 0.4
Different definitions of full-time faculty used for LIST & QUEX 2.2 0.8
Different definitions of part-time faculty used for LIST & QUEX 1.6 1.8
FTEs used instead of headcount 0.6
Other 2.6 1.2
Refusal/no explanation given/no answer 32.3 75.6
The reconciliation effort uncovered an unanticipated explanation for discrepancies. Three institutionsprovided "full-time equivalents" (FTEs) on the institution questionnaire rather than the actual headcount ofpart-time faculty. Because the number of part-time instructional faculty an institution employs is a sensitiveissue at some campuses, some institutions may prefer to report FTEs rather than individuals employed.
In some instances in which part-time faculty were over reported (on either the faculty sampling list or on theinstitution questionnaire) the reason involved confusion between the pool of part-time or temporary staff
133
EST COPY AVAILABLE42
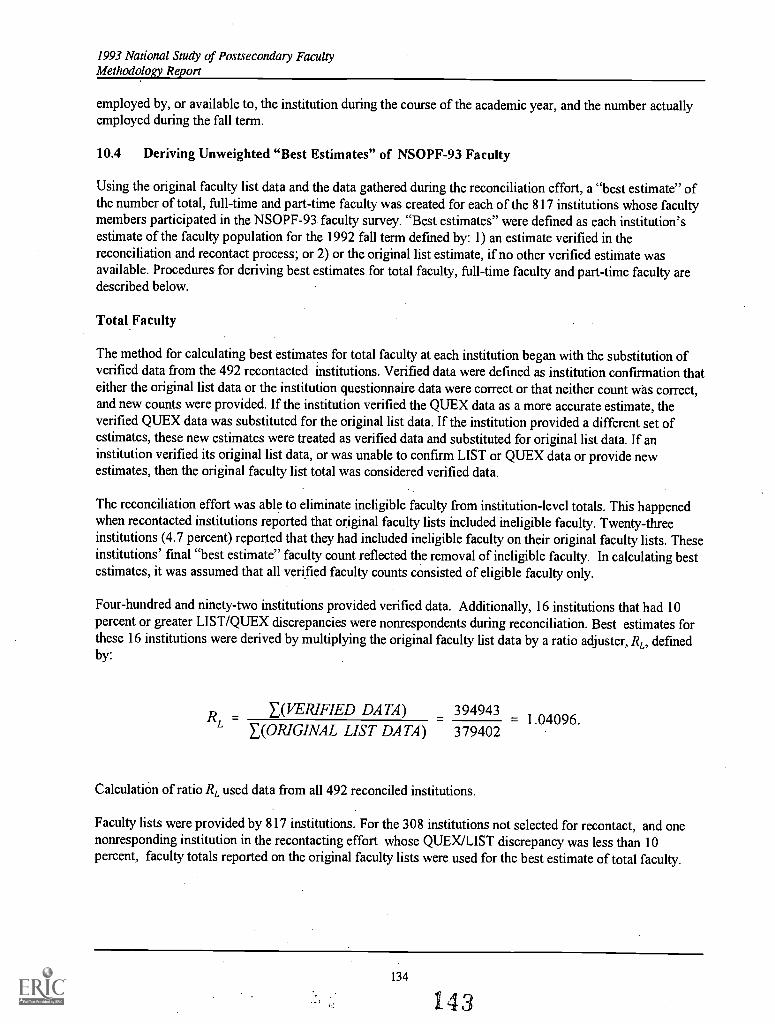
1993 National Study of Postsecondary FacultyMethodology Report
employed by, or available to, the institution during the course of the academic year, and the number actuallyemployed during the fall term.
10.4 Deriving Unweighted "Best Estimates" of NSOPF-93 Faculty
Using the original faculty list data and the data gathered during the reconciliation effort, a "best estimate" ofthe number of total, full-time and part-time faculty was created for each of the 817 institutions whose facultymembers participated in the NSOPF-93 faculty survey. "Best estimates" were defined as each institution'sestimate of the faculty population for the 1992 fall term defined by: 1) an estimate verified in thereconciliation and recontact process; or 2) or the original list estimate, if no other verified estimate wasavailable. Procedures for deriving best estimates for total faculty, full-time faculty and part-time faculty aredescribed below.
Total Faculty
The method for calculating best estimates for total faculty at each institution began with the substitution ofverified data from the 492 recontacted institutions. Verified data were defined as institution confirmation thateither the original list data or the institution questionnaire data were correct or that neither count was correct,and new counts were provided. If the institution verified the QUEX data as a more accurate estimate, theverified QUEX data was substituted for the original list data. If the institution provided a different set ofestimates, these new estimates were treated as verified data and substituted for original list data. If aninstitution verified its original list data, or was unable to confirm LIST or QUEX data or provide newestimates, then the original faculty list total was considered verified data.
The reconciliation effort was able to eliminate ineligible faculty from institution-level totals. This happenedwhen recontacted institutions reported that original faculty lists included ineligible faculty. Twenty-threeinstitutions (4.7 percent) reported that they had included ineligible faculty on their original faculty lists. Theseinstitutions' final "best estimate" faculty count reflected the removal of ineligible faculty. In calculating bestestimates, it was assumed that all verified faculty counts consisted of eligible faculty only.
Four-hundred and ninety-two institutions provided verified data. Additionally, 16 institutions that had 10percent or greater LIST/QUEX discrepancies were nonrespondents during reconciliation. Best estimates forthese 16 institutions were derived by multiplying the original faculty list data by a ratio adjuster, RL, definedby:
E(VERIFIED DATA) 394943R 1.04096.L E(ORIGINAL LIST DATA) 379402
Calculation of ratio RL used data from all 492 reconciled institutions.
Faculty lists were provided by 817 institutions. For the 308 institutions not selected for recontact, and onenonresponding institution in the recontacting effort whose QUEX/LIST discrepancy was less than 10percent, faculty totals reported on the original faculty lists were used for the best estimate of total faculty.
134
143
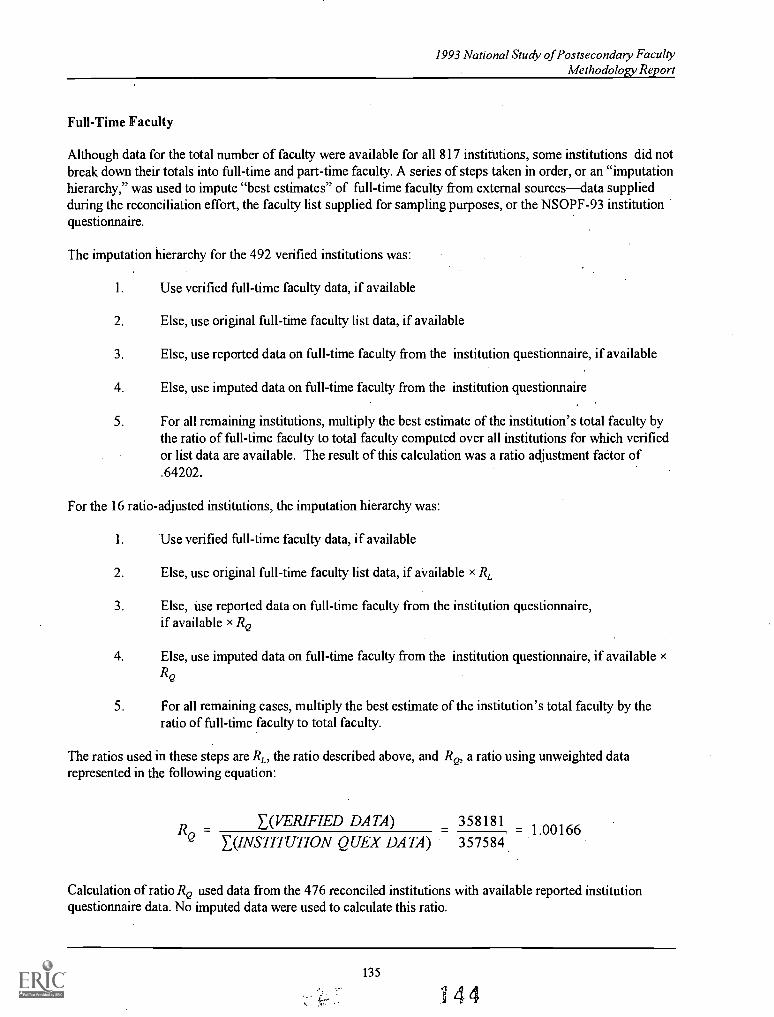
1993 National Study of Postsecondary FacultyMethodology Report
Full-Time Faculty
Although data for the total number of faculty were available for all 817 institutions, some institutions did notbreak down their totals into full-time and part-time faculty. A series of steps taken in order, or an "imputationhierarchy," was used to impute "best estimates" of full-time faculty from external sourcesdata suppliedduring the reconciliation effort, the faculty list supplied for sampling purposes, or the NSOPF-93 institutionquestionnaire.
The imputation hierarchy for the 492 verified institutions was:
1. Use verified full-time faculty data, if available
2. Else, use original full-time faculty list data, if available
3. Else, use reported data on full-time faculty from the institution questionnaire, if available
4. Else, use imputed data on full-time faculty from the institution questionnaire
5. For all remaining institutions, multiply the best estimate of the institution's total faculty bythe ratio of full-time faculty to total faculty computed over all institutions for which verifiedor list data are available. The result of this calculation was a ratio adjustment factor of.64202.
For the 16 ratio-adjusted institutions, the imputation hierarchy was:
1. Use verified full-time faculty data, if available
2. Else, use original full-time faculty list data, if available x RL
3. Else, use reported data on full-time faculty from the institution questionnaire,if available x RQ
4. Else, use imputed data on full-time faculty from the institution questionnaire, if available xRQ
5. For all remaining cases, multiply the best estimate of the institution's total faculty by theratio of full-time faculty to total faculty.
The ratios used in these steps are RL, the ratio described above, and RQ, a ratio using unweighted datarepresented in the following equation:
E(VERIFIED DATA) 358181R 1.00166
'(INSTITUTION QUEX DATA) 357584
Calculation of ratio RQ used data from the 476 reconciled institutions with available reported institutionquestionnaire data. No imputed data were used to calculate this ratio.
135
*I44
1993 National Study of Postsecondary FacultyMethodology Report
The imputation hierarchy for the 309 remaining institutions was:
1.: Use original full-time faculty list data, if available
2. Else, use reported data on full-time faculty from the institution questionnaire, if available
3. Else, use imputed data on full-time faculty from the institution questionnaire, if available
4.. For all remaining institutions, multiply the best estimate of the institution's total faculty bythe ratio of full-time faculty to total faculty.
In summary, four data sources were used to derive best estimates of full-time faculty. A total of 481 casesused verified data; 307 cases used original list data; 12 cases used reported institution questionnaire data.Finally, 17 cases"were assigned a best estimate for full-time faculty derived by multiplying the institution'sbest estimate of total faculty by the ratio adjustment factor of .64202. No imputed institution questionnairedata were used to create best estimates for full-time faculty because no cases met the selection criteria for thattreatment.
Part-Time Faculty
Best estimates of part-time faculty were calculated simply by subtracting the best estimate of full-time facultyfrom the best estimate of total faculty at each institution.
10.5 The Impact of the "Best Estimates"
The recontacting and verification effort increased the unweighted total number of faculty enumerated by15,541. When these best estimates were weighted by the first-stage institution weight for institutions thatprovided faculty sampling lists, they produced an increase in the estimate of total faculty population in the492 reconciled institutions of 54,298 faculty members nationwide. Exhibit 10-9 illustrates this increase. Itshows the difference between weighed estimates of total faculty from the original faculty list and weightedestimates of total faculty calculated from the "best estimates" based on the verified data for all reconciledinstitutions. Moreover, differences in weighted estimates are crossed with the explanations institutionsprovided for their discrepancies. The figures cited in the column marked "institutions" are the weightedfrequencies of figures cited under "1st reason" in Exhibit 10-8. Therefore, Exhibit 10-9 provides a graphicillustration of the relative importance of each explanation to the increase or decrease in the faculty populationfor the reconciled institutions.
By far, the most significant contribution to this increase in total faculty came from those institutions thatreported they had failed to enumerate some part-time or adjunct faculty on their original faculty lists. As theexhibit illustrates, these institutions accounted for an increase of 37,183 faculty members in the nationalfaculty population estimate. The institutions that reported they had excluded all part-time faculty from theiroriginal lists contributed an additional estimated 14,544 faculty members to the weighted total.
The reconciliation effort also called attention to institutions that included ineligible faculty on their originalfaculty lists. Almost 6 percent of institutions reported that they included ineligible faculty on either the list orthe questionnaire. As a result, these institutions lowered their "best estimate" of total faculty, producing adrop in weighted population estimates for these institutions of 6,167 faculty members. Definitionalproblemsaccounting for different populations of full-time faculty on the list and on the institutionquestionnairemeant that, for 2.4 percent of the institutions, the original list included ineligible faculty. Thebest estimate correction lowered the national population estimate derived from these institutions by 4,475. An
136
14 5
1993 National Study of Postsecondary FacultyMethodology Report
almost identical number of faculty (4,514) were dropped from total population estimates due to institutiondownsizing.
Even more striking were the institutions that explained their discrepancy by reporting that unpaid or honoraryfaculty were excluded from either their institution questionnaire or their faculty list. Although theseinstitutions accounted for fewer than 1 percent of the weighted total number of reconciled institutions, theyaccounted for subtraction of an estimate of 9,597 faculty members from the original faculty list. Theseinstitutions tended to depend on large numbers of faculty employed by other institutions, such as hospitals orthe military. Future cycles of NSOPF-93 will need to take special cases, such as these institutions, intoaccount when describing faculty eligibility rules for institution list preparers.
More than one in four institutions (29.7 percent, weighted) could not supply an explanation for thediscrepancy. However, these institutions accounted for a weighted estimate of only 3,206 faculty memberstoward the net increase of 54,298 in faculty population estimated.
137
1 4 f
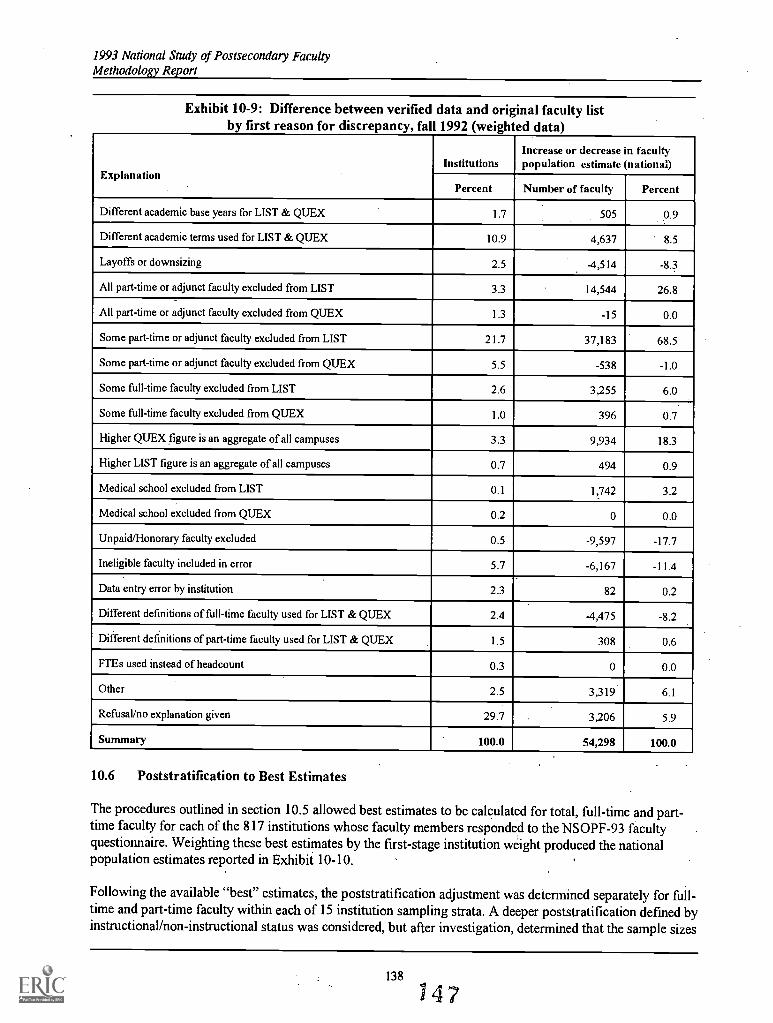
1993 National Study of Postsecondary FacultyMethodology Report
Exhibit 10-9: Difference between verified data and original faculty listby first reason for discrepancy, fall 1992 (weighted data)
ExplanationInstitutions
Increase or decrease in facultypopulation estimate national)
Percent Number of faculty Percent
Different academic base years for LIST & QUEX 1.7 505 0.9
Different academic terms used for LIST & QUEX 10.9 4,637 8.5
Layoffs or downsizing 2.5 -4,514 -8.3
All part-time or adjunct faculty excluded from LIST 3.3 14,544 26.8
All part-time or adjunct faculty excluded from QUEX 1.3 -15 0.0
Some part-time or adjunct faculty excluded from LIST 21.7 37,183 68.5
Some part-time or adjunct faculty excluded from QUEX 5.5 -538 -1.0
Some full-time faculty excluded from LIST 2.6 3,255 6.0
Some full-time faculty excluded from QUEX 1.0 396 0.7
Higher QUEX figure is an aggregate of all campuses 3.3 9,934 18.3
Higher LIST figure is an aggregate of all campuses 0.7 494 0.9
Medical school excluded from LIST 0.1 1,742 3.2
Medical school excluded from QUEX 0.2 0 0.0
Unpaid/Honorary faculty excluded 0.5 -9,597 -17.7
Ineligible faculty included in error 5.7 -6,167 -11.4
Data entry error by institution 2.3 82 0.2
Different definitions of full-time faculty used for LIST & QUEX 2.4 -4,475 -8.2
Different definitions of part-time faculty used for LIST & QUEX 1.5 308 0.6
FTEs used instead of headcount 0.3 0 0.0
Other 2.5 3,319 6.1
Refusal/no explanation given 29.7 3,206 5.9
Summary 100.0 54,298 100.0
10.6 Poststratification to Best Estimates
The procedures outlined in section 10.5 allowed best estimates to be calculated for total, full-time and part-time faculty for each of the 817 institutions whose faculty members responded to the NSOPF-93 facultyquestionnaire. Weighting these best estimates by the first-stage institution weight produced the nationalpopulation estimates reported in Exhibit 10-10.
Following the available "best" estimates, the poststratification adjustmentwas determined separately for full-time and part-time faculty within each of 15 institution sampling strata. A deeper poststratification defined byinstructional/non- instructional status was considered, but after investigation, determined that the sample sizes
138
147
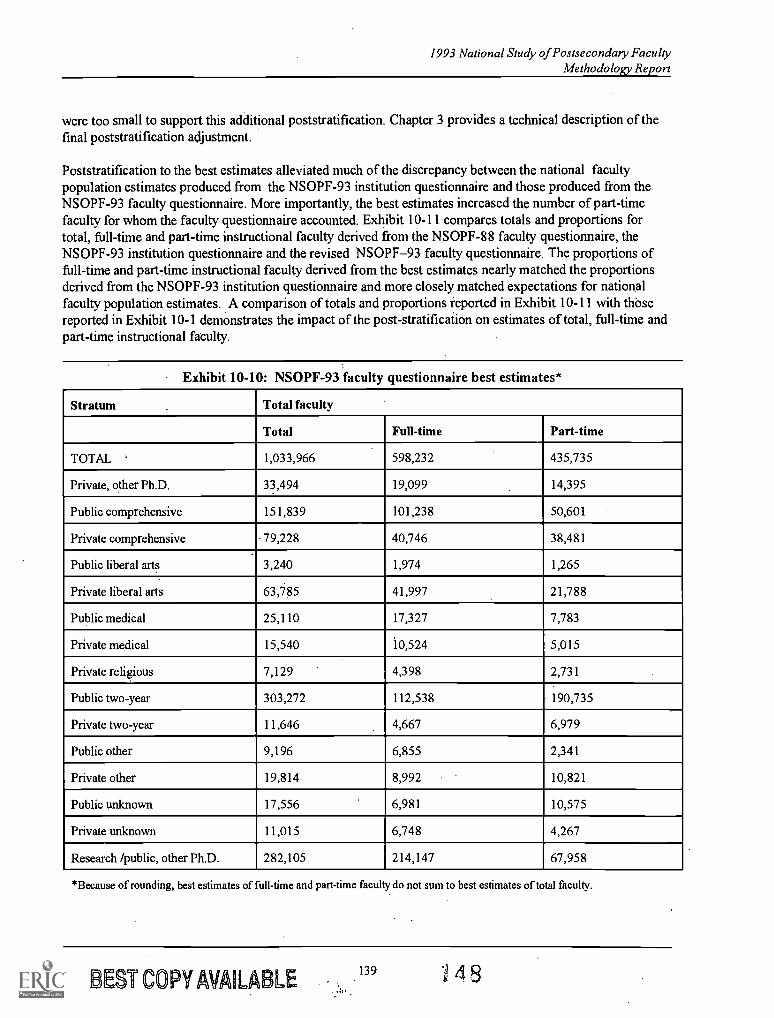
1993 National Study of Postsecondary FacultyMethodology Report
were too small to support this additional poststratification. Chapter 3 provides a technical description of thefinal poststratification adjustment.
Poststratification to the best estimates alleviated much of the discrepancy between the national facultypopulation estimates produced from the NSOPF-93 institution questionnaire and those produced from theNSOPF-93 faculty questionnaire. More importantly, the best estimates increased the number of part-timefaculty for whom the faculty questionnaire accounted. Exhibit 10-11 compares totals and proportions fortotal, full-time and part-time instructional faculty derived from the NSOPF-88 faculty questionnaire, theNSOPF-93 institution questionnaire and the revised NSOPF-93 faculty questionnaire. The proportions offull-time and parktime instructional faculty derived from the best estimates nearly matched the proportionsderived from the NSOPF-93 institution questionnaire and more closely matched expectations for nationalfaculty population estimates. A comparison of totals and proportions reported in Exhibit 10-11 with thosereported in Exhibit 10-1 demonstrates the impact of the post-stratification on estimates of total, full-time andpart-time instructional faculty.
Exhibit 10-10: NSOPF-93 faculty questionnaire best estimates*
Stratum Total faculty
Total Full-time Part-time
TOTAL ' 1,033,966 598,232 435,735
Private, other Ph.D. 33,494 19,099 14,395
Public comprehensive 151,839 101,238 50,601
Private comprehensive 79,228 40,746 38,481
Public liberal arts 3,240 1,974 1,265
Private liberal arts 63,785 41,997 21,788
Public medical 25,110 17,327 7,783
Private medical 15,540 10,524 5,015
Private religious 7,129 4,398 2,731
Public two-year 303,272 112,538 190,735
Private two-year 11,646 4,667 6,979
Public other 9,196 6,855 2,341
Private other 19,814 8,992 10,821
Public unknown 17,556 6,981 10,575
Private unknown 11,015 6,748 4,267
Research /public, other Ph.D. 282,105 214,147 67,958
*Because of rounding, best estimates of full-time and part-time faculty do not sum to best estimates of total faculty.
BEST COPY AVAILABLE139 11, 4 8
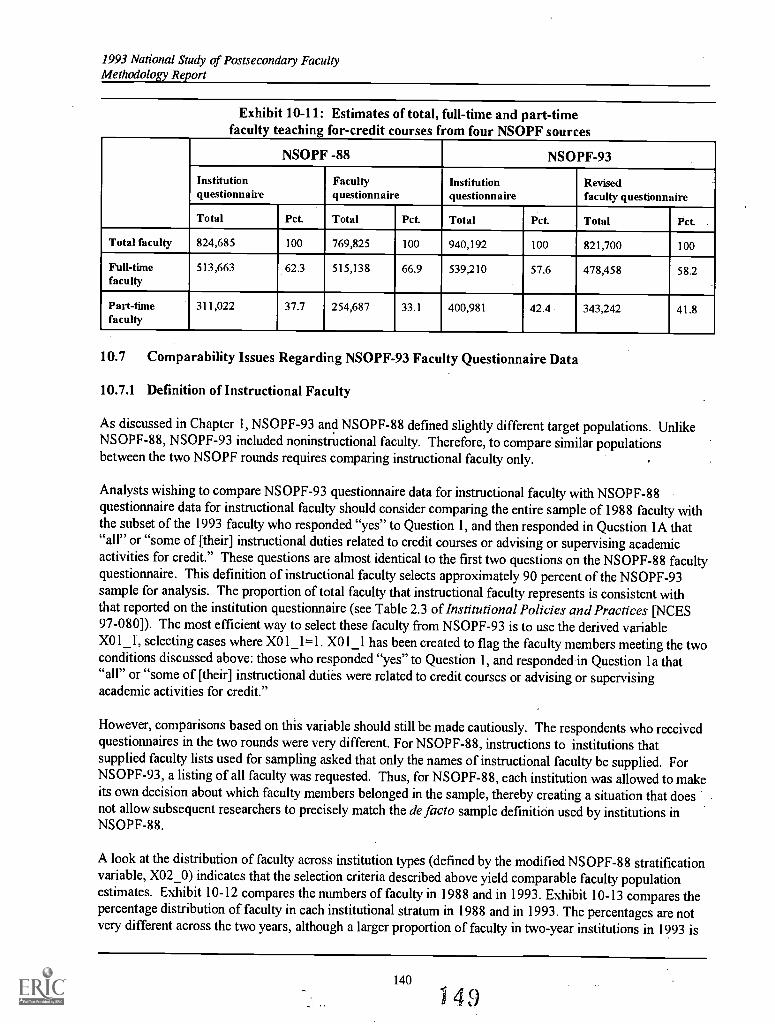
1993 National Study of Postsecondary FacultyMethodology Report
Exhibit 10-11: Estimates of total, full-time and part-timefaculty teaching for-credit courses from four NSOPF sources
NSOPF -88 NSOPF-93
Institutionquestionnaire
Facultyquestionnaire
Institutionquestionnaire
Revisedfaculty questionnaire
Total Pct. Total Pct. Total Pct. Total Pct.
Total faculty 824,685 100 769,825 100 940,192 100 821,700 100
Full-timefaculty
513,663 62.3 515,138 66.9 539,210 57.6 478,458 58.2
Part-timefaculty
311,022 37.7 254,687 33.1 400,981 42.4 343,242 41.8
10.7 Comparability Issues Regarding NSOPF-93 Faculty Questionnaire Data
10.7.1 Definition of Instructional Faculty
As discussed in Chapter 1, NSOPF-93 and NSOPF-88 defined slightly different target populations. UnlikeNSOPF-88, NSOPF-93 included noninstructional faculty. Therefore, to compare similar populationsbetween the two NSOPF rounds requires comparing instructional faculty only.
Analysts wishing to compare NSOPF-93 questionnaire data for instructional faculty with NSOPF-88questionnaire data for instructional faculty should consider comparing the entire sample of 1988 faculty withthe subset of the 1993 faculty who responded "yes" to Question 1, and then responded in Question lA that"all" or "some of [their] instructional duties related to credit courses or advising or supervising academicactivities for credit." These questions are almost identical to the first two questions on the NSOPF-88 facultyquestionnaire. This definition of instructional faculty selects approximately 90 percent of the NSOPF-93sample for analysis. The proportion of total faculty that instructional faculty represents is consistent withthat reported on the institution questionnaire (see Table 2.3 of Institutional Policies and PractiCes [NCES97-080]). The most efficient way to select these faculty from NSOPF-93 is to use the derived variableX01_1, selecting cases where X01_1=1. X01_1 has been created to flag the faculty members meeting the twoconditions discussed above: those who responded "yes" to Question 1, and responded in Question la that"all" or "some of [their] instructional duties were related to credit courses or advising or supervisingacademic activities for credit."
However, comparisons based on this variable should still be made cautiously. The respondentswho receivedquestionnaires in the two rounds were very different. For NSOPF-88, instructions to institutions thatsupplied faculty lists used for sampling asked that only the names of instructional faculty be supplied. ForNSOPF-93, a listing of all faculty was requested. Thus, for NSOPF-88, each institution was allowed to makeits own decision about which faculty members belonged in the sample, thereby creating a situation that doesnot allow subsequent researchers to precisely match the de facto sample definition used by institutions inNSOPF-88.
A look at the distribution of faculty across institution types (defined by the modified NSOPF-88 stratificationvariable, X02_0) indicates that the selection criteria described above yield comparable faculty populationestimates. Exhibit 10-12 compares the numbers of faculty in 1988 and in 1993. Exhibit 10-13 compares thepercentage distribution of faculty in each institutional stratum in 1988 and in 1993. The percentages are notvery different across the two years, although a larger proportion of faculty in two-year institutions in 1993 is
140
49
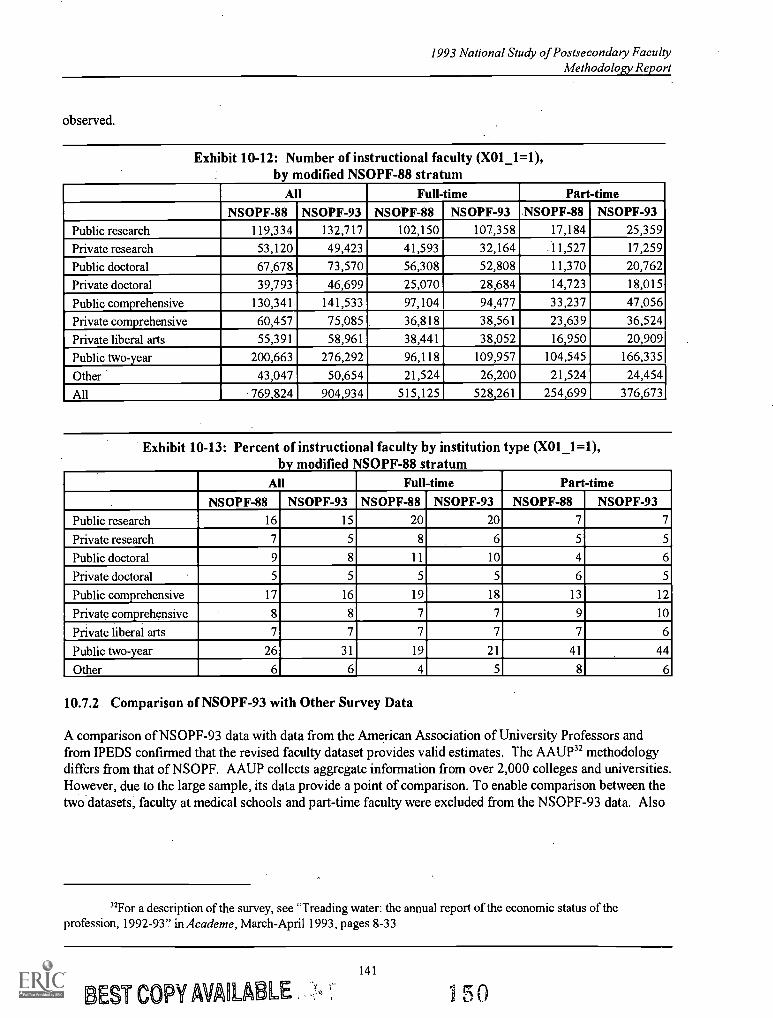
1993 National Study of Postsecondary FacultyMethodology Report
observed.
Exhibit 10-12: Number of instructional faculty (X01_1=1),by modified NSOPF-88 stratum
All Full-time Part-timeNSOPF-88 NSOPF-93 NSOPF-88 NSOPF-93 NSOPF-88 NSOPF-93
Public research 119,334 132,717 102,150 107,358 17,184 25,359
Private research 53,120 49,423 41,593 32,164 11,527 17,259
Public doctoral 67,678 73,570 56,308 52,808 11,370 20,762
Private doctoral 39,793 46,699 25,070 28,684 14,723 18,015
Public comprehensive 130,341 141,533 97,104 94,477 33,237 47,056
Private comprehensive 60,457 75,085. 36,818 38,561 23,639 36,524
Private liberal arts 55,391 58,961 38,441 38,052 16,950 20,909
Public two-year 200,663 276,292 96,118 109,957 104,545 166,335
Other 43,047 50,654 21,524 26,200 21,524 24,454
All 769,824 904,934 515,125 528,261 254,699 376,673
Exhibit 10-13: Percent of instructional faculty by institution type (X01_1=1),by modified NSOPF-88 stratum
All Full-time Part-timeNSOPF-88 NSOPF-93 NSOPF-88 NSOPF-93 NSOPF-88 NSOPF-93
Public research 16 15 20 20 7 7
Private research 7 5 8 6 5 5
Public doctoral 9 8 11 10 4 6
Private doctoral 5 5 5 5 6 5
Public comprehensive 17 16 19 18 13 12
Private comprehensive 8 8 7 7 9 10
Private liberal arts 7 7 7 7 7 6
Public two-year 26 31 19 21 41 44
Other 6 6 4 5 8 6
10.7.2 Comparison of NSOPF-93 with Other Survey Data
A comparison of NSOPF-93 data with data from the American Association of University Professors andfrom IPEDS confirmed that the revised faculty dataset provides valid estimates. The AAUP" methodologydiffers from that of NSOPF. AAUP collects aggregate information from over 2,000 colleges and universities.However, due to the large sample, its data provide a point of comparison. To enable comparison between thetwo datasets, faculty at medical schools and part-time faculty were excluded from the NSOPF-93 data. Also
"For a description of the survey, see "Treading water: the annual report of the economic status of theprofession, 1992-93" in Academe, March-April 1993, pages 8-33
BEST COPY AVAILA
141
LE 1 50
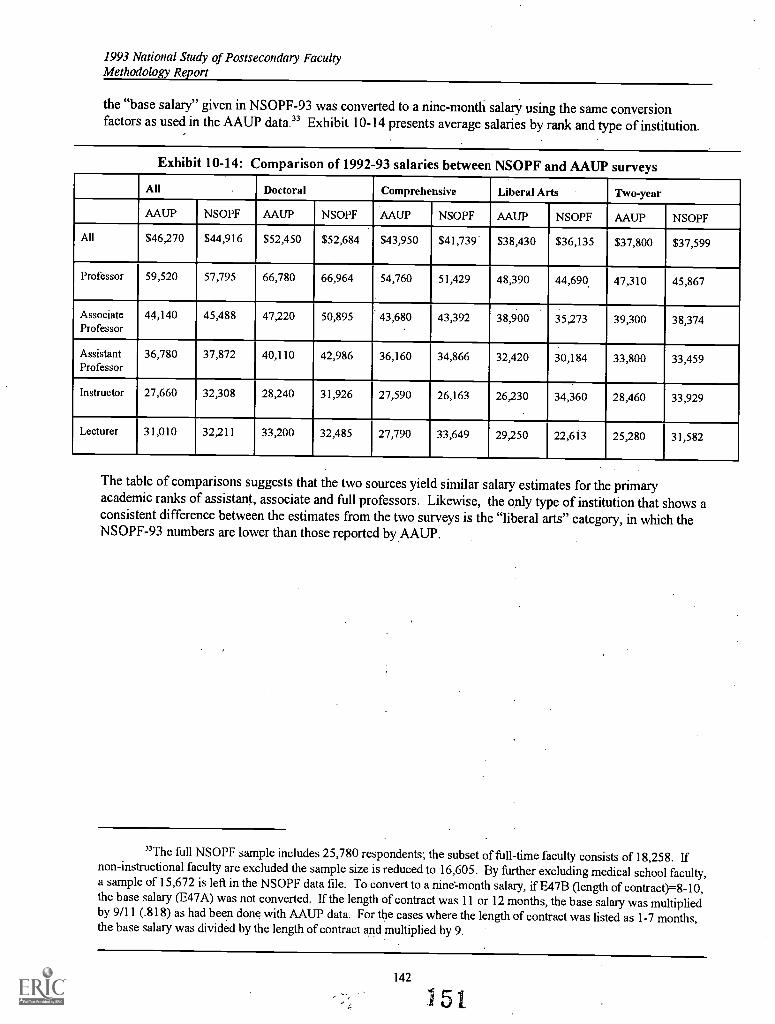
1993 National Study of Postsecondary FacultyMethodology Report
the "base salary" given in NSOPF-93 was converted to a nine-month salary using the same conversionfactors as used in the AAUP data." Exhibit 10-14 presents average salaries by rank and type of institution.
Exhibit 10-14: Comparison of 1992-93 salaries between NSOPF and AAUP surveys
All Doctoral Comprehensive Liberal Arts Two-year
AAUP NSOPF AAUP NSOPF AAUP NSOPF AAUP NSOPF AAUP NSOPF
All $46,270 $44,916 $52,450 $52,684 $43,950 $41,739 $38,430 $36,135 $37,800 $37,599
Professor 59,520 57,795 66,780 66,964 54,760 51,429 48,390 44,690. 47,310 45,867
AssociateProfessor
44,140 45,488 47,220 50,895 43,680 43,392 38,900 35,273 39,300 38,374
AssistantProfessor
36,780 37,872 40,110 42,986 36,160 34,866 32,420 30,184 33,800 33,459
Instructor 27,660 32,308 28,240 31,926 27,590 26,163 26,230 34,360 28,460 33,929
Lecturer 31,010 32,211 33,200 32,485 27,790 33,649 29,250 22,613 25,280 31,582
The table of comparisons suggests that the two sources yield similar salary estimates for the primaryacademic ranks of assistant, associate and full professors. Likewise, the only type of institution that shows aconsistent difference between the estimates from the two surveys is the "liberal arts" category, in which theNSOPF-93 numbers are lower than those reported by AAUP.
"The full NSOPF sample includes 25,780 respondents; the subset of full-time faculty consists of 18,258. Ifnon-instructional faculty are excluded the sample size is reduced to 16,605. By further excluding medical school faculty,a sample of 15,672 is left in the NSOPF data file. To convert to a nine'-month salary, if E47B (length of contract)=8-10,the base salary (E47A) was not converted. If the length of contract was 11 or 12 months, the base salary was multipliedby 9/11 (.818) as had been done with AAUP data. For the cases where the length of contract was listed as 1-7 months,the base salary was divided by the length of contract and multiplied by 9.
142
151
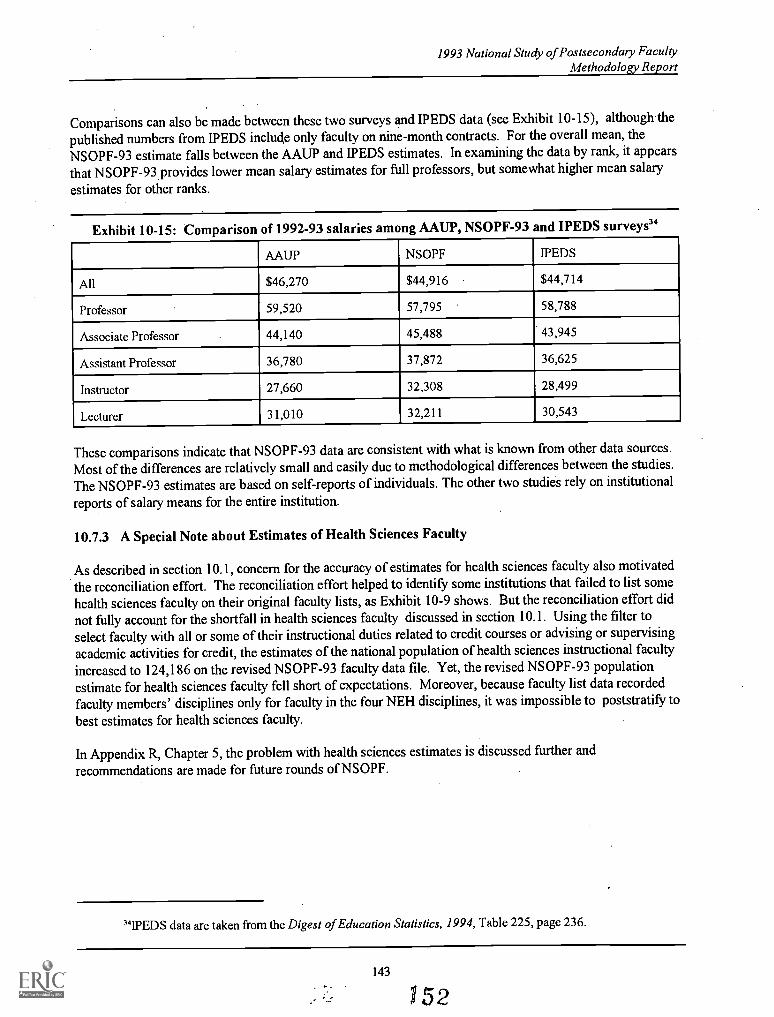
1993 National Study of Postsecondary FacultyMethodology Report
Comparisons can also be made between these two surveys and IPEDS data (see Exhibit 10-15), although thepublished numbers from IPEDS include only faculty on nine-month contracts. For the overall mean, theNSOPF-93 estimate falls between the AAUP and IPEDS estimates. In examining the data by rank, it appears
that NSOPF-93 provides lower mean salary estimates for full professors, but somewhat higher mean salary
estimates for other ranks.
Exhibit 10-15: Comparison of 1992-93 salaries among AAUP, NSOPF-93 and IPEDS surveys'
AAUP NSOPF WEDS
All $46,270 $44,916 $44,714
Professor 59,520 57,795 58,788
Associate Professor 44,140 45,488 43,945
Assistant Professor 36,780 37,872 36,625
Instructor 27,660 32,308 28,499
Lecturer 31,010 32,211 30,543
These comparisons indicate that NSOPF-93 data are consistent with what is known from other data sources.
Most of the differences are relatively small and easily due to methodological differences between the studies.
The NSOPF-93 estimates are based on self-reports of individuals. The other two studies rely on institutional
reports of salary means for the entire institution.
10.7.3 A Special Note about Estimates of Health Sciences Faculty
As described in section 10.1, concern for the accuracy of estimates for health sciences faculty also motivatedthe reconciliation effort. The reconciliation effort helped to identify some institutions that failed to list somehealth sciences faculty on their original faculty lists, as Exhibit 10-9 shows. But the reconciliation effort did
not fully account for the shortfall in health sciences faculty discussed in section 10.1. Using the filter toselect faculty with all or some of their instructional duties related to credit courses or advising or supervisingacademic activities for credit, the estimates of the national population of health sciences instructional faculty
increased to 124,186 on the revised NSOPF-93 faculty data file. Yet, the revisedNSOPF-93 populationestimate for health sciences faculty fell short of expectations. Moreover, because faculty list data recordedfaculty members' disciplines only for faculty in the four NEH disciplines, it was impossible to poststratify to
best estimates for health sciences faculty.
In Appendix R, Chapter 5, the problem with health sciences estimates is discussed further andrecommendations are made for future rounds of NSOPF.
'IPEDS data are taken from the Digest of Education Statistics, 1994, Table 225, page 236.
143
152
1993 National Study of Postsecondary FacultyMethodology Report
11. Recommendations
This chapter summarizes NORC's recommendations for future NSOPF studies, based on the results of thefield test and full-scale study, and feedback from a variety of sources: NTRP members, institutional staff
(coordinators and respondents), faculty respondents, project staff, and the sponsoring agencies (NCES, NEH,
and NSF). These recommendations are designed to reduce institutional and faculty burden, to increaseinstitutional and faculty participation, to enhance the quality of the data, and to make the study more cost-
effective.
11.1 Changing Data Collection Time Frames and Commencing List Collection Later
To ensure that part-time staff are not missed in the list enumeration, one member of the NSOPF-93 NationalTechnical Review Panel (NTRP) suggested beginning the list collection effort at the end of the fall term
rather than its start as NSOPF-93 did. Sampled institutions would be asked to compile a list of faculty for
their fall term (encompassing October 15 to ensure comparability between NSOPF cycles). The emphasisshould be on the fall term rather than on a specific date. This recommendation should be field-tested prior to
the next cycle of NSOPF. One set of sampled institutions, assigned at random, could be asked to compile a
list of faculty for their fall term. Another set of randomly assigned sampled institutions could be asked to
compile a list of faculty employed at their institution on October 15. Discrepancies between institution listsand institution questionnaire counts of faculty could be compared to determine whether one set of lists
systematically enumerates a greater number of faculty than the other.
If a later deadline for list collection is established, the institution recruitment phase of data collection could bescheduled earlier: the spring before the fall term for which faculty will be sampled. In both the field test andthe full-scale study, relatively few institutions could devote resources necessary to meet the deadline of
October 15 given a late August/early September mailout date. The beginning of the academic year is a
particularly inopportune time for institutions to make staff resources available to prepare lists of faculty.
Given the constraints imposed on faculty data collection by the academic year, it is vital that list collectionand processing be completed as early as possible. Therefore, the institutional recruitment phase of datacollection could begin in April, with follow-up in May. Institutional staff, unlike faculty, are normally.available for most of the summer months, and often have more time and resources to conunit toreqUests for
data during these months than during the regular academic year. Exhibit 11-1 presents asample data
collection schedule incorporating these recommendations.
A later start in the list collection effort has multiple implications. A delay of three to four months would meandelaying the faculty survey accordingly. Pushing back the date of the faculty survey, while maintaining the
fall term as the time frame for the questionnaire, has the potential to create methodological problenis for dataquality. The NSOPF-93 faculty data collection effort spanned almost 11 calendar months(from the end ofJanuary to January, 1994 with a two-month hiatus during the summer). The data collectionscheanle is bound
up with the list collection effort, which, in the case of NSOPF-93, spanned almost nine calendar months(October, 1992 through June, 1993).35 These scheduling and potential methodologicalprobleths would have
to be considered in changing the start date for list collection.
"There is a real possibility of reducing the amount of time needed, possibly from nine months to six, since thenine months required for the NSOPF-93 list collection to a large extent reflected the need to augment the NSOPF-93
sample on two separate occasions.
145 153
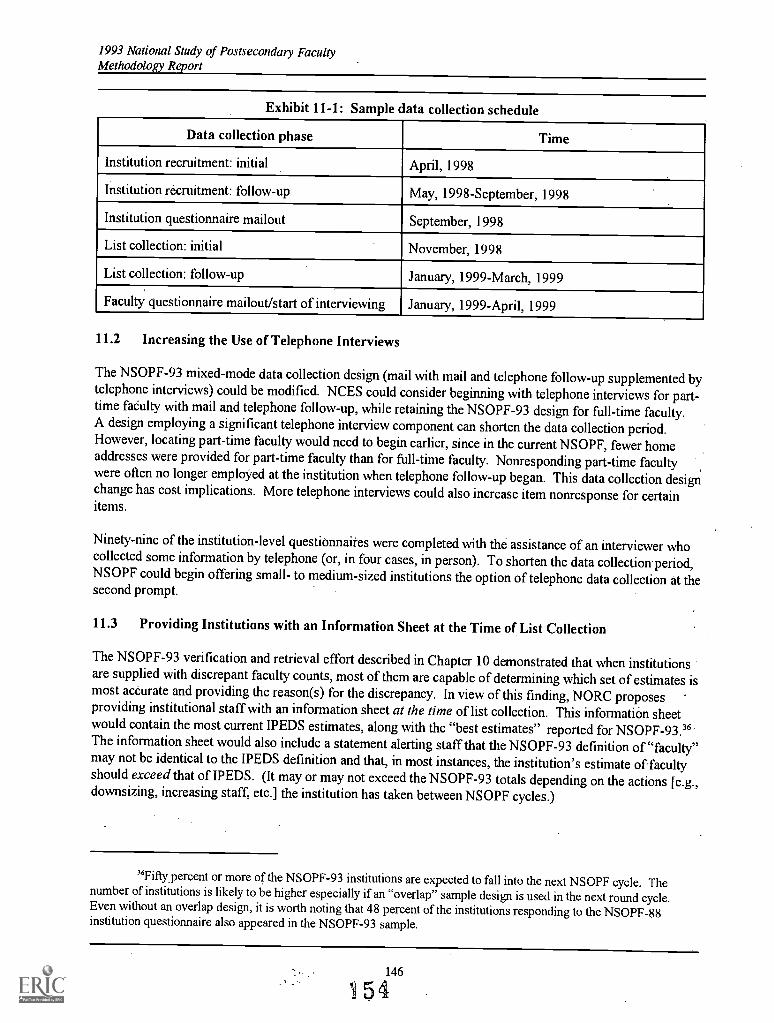
1993 National Study of Postsecondary FacultyMethodology Report
Exhibit 11-1: Sample data collection schedule
Data collection phase Time
Institution recruitment: initial April, 1998
Institution recruitment: follow-up May, 1998-September, 1998
Institution questionnaire mailout September, 1998
List collection: initial November, 1998
List collection: follow-up January, 1999-March, 1999
Faculty questionnaire mailout/start of interviewing January, 1999-April, 1999
11.2 Increasing the Use of Telephone Interviews
The NSOPF-93 mixed-mode data collection design (mail with mail and telephone follow-up supplemented bytelephone interviews) could be modified. NCES could consider beginning with telephone interviews for part-time faCulty with mail and telephone follow-up, while retaining the NSOPF-93 design for full-time faculty.A design employing a significant telephone interview component can shorten the data collection period.However, locating part-time faculty would need to begin earlier, since in the current NSOPF, fewer homeaddresses were provided for part-time faculty than for full-time faculty. Nonresponding part-time facultywere often no longer employed at the institution when telephone follow-up began. This data collection designchange has cost implications. More telephone interviews could also increase item nonresponse for certainitems.
Ninety-nine of the institution-level questionnaires were completed with the assistance of an interviewer whocollected some information by telephone (or, in four cases, in person). To shorten the data collectionperiod,NSOPF could begin offering small- to medium-sized institutions the option of telephone data collection at thesecond prompt.
11.3 Providing Institutions with an Information Sheet at the Time of List Collection
The NSOPF-93 verification and retrieval effort described in Chapter 10 demonstrated that when institutionsare supplied with discrepant faculty counts, most of them are capable of determining which set of estimates ismost accurate and providing the reason(s) for the discrepancy. In view of this finding, NORC proposesproviding institutional staff with an information sheet at the time of list collection. This information sheetwould contain the most current IPEDS estimates, along with the "best estimates" reported for NSOPF-93.36The information sheet would also include a statement alerting staff that the NSOPF-93 definition of "faculty"may not be identical to the IPEDS definition and that, in most instances, the institution's estimate of facultyshould exceed that of IPEDS. (It may or may not exceed the NSOPF-93 totals depending on the actions [e.g.,downsizing, increasing staff, etc.] the institution has taken between NSOPF cycles.)
36FiftKpercent or more of the NSOPF-93 institutions are expected to fall into the next NSOPF cycle. Thenumber of institutions is likely to be higher especially if an "overlap" sample design is used in the next round cycle.Even without an overlap design, it is worth noting that 48 percent of the institutions responding to the NSOPF-88institution questionnaire also appeared in the NSOPF-93 sample.
146
154
1993 National Study of Postsecondary FacultyMethodology Report
Institution staff should be asked to check their reported faculty list totals against the IPEDS and/or NSOPF-93 totals. Discrepancies among estimates beyond a specified threshold (say 10 percent) should be explainedin a "Comments" section of the information sheet.' A sample information sheet, serving as a guide, could be
provided . Once received, the institution's faculty list totals (both from the information sheet and from thelist) could then be data-entered into a discrepancy module that would be preprogrammed with IPEDS andNSOPF-93 faculty counts to compare faculty counts. Unexplained discrepancies beyond a specified thresholdwould trigger a retrieval and reconciliation call to the Institutional Coordinator before faculty sample
selection.
The information sheet will provide the Institutional Coordinator with a means of checking the work of otherstaff who are usually responsible for preparing the list. This new procedure will encourage the coordinator tocheck the list compiler's work and to produce an accurate and complete faculty list. Discrepancies can beresolved at the institution level, and this will allow the institutions, in some instances, to correct obviouserrors (e.g., exclusion of non-tenure-track faculty or part-time staff) before mailing the list of faculty back tothe NSOPF contractor. In other instances, where the institution is simply not equipped to provide a complete
or wholly accurate list of faculty, it would alert the institutionand the NSOPF contractorto any omissionsor erroneous inclusions much earlier in the list collection process. Even under this changed procedure theNSOPF contractor would continue to recontact institutions to retrieve data and to reconcile discrepanciesduring the list. collection operation.
Preparation for the data collection phase of NSOPF should include training of a team specializing in resolvingdiscrepancies between faculty lists and institution questionnaires. This team would be prepared to performnecessary reconciliation between divergent faculty counts and to ascertain explanations from institutionofficials for discrepancies in faculty counts.
11.4 Coordinating Institution Questionnaire Mailing and List Collection
The recommendation in section 11.3 hinges on the availability of institution questionnaires at the time of listcollection so that potential discrepancies can be checked and reconciled at this early stage of the operation.This recommendation offers other advantages as well. Discrepancies can be substantially reduced by mailingthe institution questionnaire and the list request in the same packet, or at least timing it so that both individualrequests are received at the institution at about the same time. By coordinating these requests, NCES canexplicitly indicate in the instructions that the estimates requested to certain questions should be identical orvery close. Whenever discrepancies are identified, the institution staff would be required to resolve or toexplain them. By coupling the timing for both of these requests, the NSOPF data collection contractor will beable to enter the list and questionnaire counts (along with the IPEDS counts) into a discrepancy/verificationmodule to immediately check for discrepancies.'
Though this procedure may increase the initial appearance of respondent burden to the institution, it also
"A form in duplicate (or triplicate) could be used so that the institution could maintain a copy for its ownrecords and submit the completed one-page form with its list. Of course, the form and procedures recommended shouldbe field-tested prior to their incorporation into the next cycle of NSOPF.
38NORC's Survey Management System (SMS) was customized expressly for NSOPF-93 to permit it to checkfor discrepancies between list and IPEDS faculty totals and to check specific subgroup totals (i.e., part-time, full-time;racial/ethnic categories). The discrepancy module was initially created to cheCk list, questionnaire, and IPEDS totalsagainst each other, but because the NSOPF-93 institution questionnaire was delayed, only the LIST/IPEDS check waspossible.
147 1 55r. r
1993 National Study of Postsecondary FacultyMethodology Report
makes it much more likely that institution staff preparing the list and those completing the questionnaire (whoare often not the same person) will consult each other and will resolve any discrepancies internally. Thisprocedure is more likely to reduce respondent burden at many institutions by eliminating duplication ofefforts by separate offices, and by minimizing the number of callback requests.'
11.5 Routing Institutional Coordinator Packet to Institutional Research Director
NSOPF-93 experience showed that the individual most familiar with the data requested on the facultysampling lists, and, therefore, the most appropriate Institutional Coordinator, is the director of institutionalresearch. Moreover, directors of institutional research often have a high level of interest in the research topicscovered by NSOPF. Therefore, whenever an institution employs an individual in the capacity of director ofinstitutional research, the cover letter (currently sent to the institution's chiefadministrative officer) and theaccompanying Confirmation Form could be sent directly to that person, with a copy sent to the institution'sChief Administrative Officer (CAO). Only in the absence of a director of institutional research wouldanother individual (such as an academic dean) be named to serve as coordinator. This should speed routingof mail, reduce the number of remails required, and, in many cases, assure a knowledgeable and sympatheticreview of the request.
Misrouting and delays in routing of the institutional coordinator packet were frequent problems in the listcollection effort, as evidenced by the high rate of remailsover 40 percentto CAOs and coordinators. Insome instances, a CAO with limited time to personally review mail reported the package as not having beenreceived, although it had been sent to the correct address. Often, a "gatekeeper" routed the package toanother institutional official before the CAO could review the materials. Although this official may be bestsuited to serve as Institutional Coordinator, there is no guarantee that this is the case. If the package is routedto a person who is either unfamiliar with or unsympathetic to the aims of research studies such as NSOPF, orwho lacks knowledge of what faculty data the institution has available, it becomes much more difficult toobtain the institution's participation, as well as to obtain high-quality data within set time constraints.
11.6 Changing Institution Questionnaire Instructions and Questions
Some of the questionnaire instructions and questions in the institution questionnaire may have inadvertentlycontributed to the discrepancies in faculty estimates noted in Chapter 10. To avoid confusion in Questions1A-D between the total pool of part-time and temporary faculty available to an institution and the totalemployed (an unintended ambiguity that caused problems for some institutions because of how part-time andtemporary staff are treated), we would recommend amending this question or creating separate questions toask for both the total number of available staff and the number employed during the fall term. Thisseparation would allow institutions to report the status of their temporary and part-time staff more accuratelyand without the confusion some institutions experienced. Even though some institutions may only be able toprovide one set of these estimates, it will at least be completely clear which set of figures the institution isproviding.
Another area of ambiguity appeared in the actual estimate of faculty. Some institutions provided estimates offull-time equivalents (FTEs) rather than the requested headcount of individuals. We would recommendamending the instructions to the institution questionnaire to make clear that we are seeking a headcount offaculty, and not a count of FTEs (or positions) unless it is expressly stated in the question. (Although we
"It would be prudent to explain the reasons for this procedure to the institution in the introductory letter andmaterials at the time of list collection. The more participants understand at the outset, the more likely they are to "buyin" to survey procedures.
148
1 6
1993 National Study of Postsecondary FacultyMethodology Report
would not recommend it, alternatively we could ask for both FTEs and a headcount. This approach might
increase respondent burden slightly; however, some institutions may feel more comfortable providing a
headcount if it is accompanied by the total number of FTEs.)
A number of institutions excluded medical or professional institutions or satellite campuses that should have
been included. Explicit instructions should be provided in both the questionnaire and the list collection packet
to include all such institutions and campuses that do not file separately for IPEDS; if possible, a list ofinstitutions and campuses to be included could be printed in the packet given each institution, based onIPEDS information. The institution would be instructed to notify the data collection contractor about any
changes in the status of the listed institutions and satellite campuses. If an institution has any questions about
which institutions and campuses to include, that institution would be instructed to contact the data collection
contractor for assistance.
A small number of institutions erroneously included all staff (including maintenance and clerical staff) at
Questions 1A-D. We believe this error could have been avoided had the respondents carefully read the
glossary on the front inside cover of the questionnaire. Since these individuals clearly did not make this
effort, we recommend including an additional instruction to accompany Questions 1A-D and other questions
that ask for counts of "faculty/staff," that would briefly repeat the general instruction and reference the
glossary.
Other changes should be made to the institution questionnaire to reduce respondent burden. Information on
benefits available to faculty should not be asked as part of the institution questionnaire that is mailed with the
list collection packet. In NSOPF-93, these items elicited highitem nonresponse, as discussed in Chapter 8.
In the next NSOPF, benefits questions could be asked separately, at a later time. Ideally, such informationcould be obtained directly from the staff or department responsible for administering benefits programs at
each participating institution, or in some cases, at the parent institution. This recommendation should be
field-tested.
11.7 Eliminating Option of Sending Computer Tapes
Due to the level of effort required in their processing, we recommend deleting any reference to computer tapes
in the list preparation materials. Although we do recognize that many institutions, especially those with large
numbers of faculty, may need to submit their lists on computer tape,processing NSOPF-93 faculty lists in
computer tape format was costly both in time and effort, and required higher levels of staff to complete. In
order to load computer tapes, a programmer had to be available to convert the tape into a format that could be
loaded, if necessary, and to monitor the loading process. Seven percent (61 out of 817) of the institutions senttheir faculty lists as computer tapes; 8 sent only the tape and 53 sent a tape and a hardcopy printout. Ingeneral, lists submitted on computer tape either required retrieval to obtain a usable list, or the hardcopy list
was used in place of the tape.
11.8 Providing Diskette or List Layout Example
List preparation instructions, which were developed in conjunction with NORC programmers and systems
specialists, provided institutions with a standard layout with which to format their lists (see Appendix K). Byproviding this convention, the number of unique problems and types of lists encountered by list processing
staff were greatly reduced, thus decreasing list processing time. These changes to list preparation materialsdramatically increased the ease and speed by which faculty lists were processed.
149
X57
1993 National Study of Postsecondary FacultyMethodology Report
However, even with these conventions in place, institutions still varied in the individual layout of their facultylists. Various programs were used to reformat electronic files that were not laid out correctly, or wereotherwise formatted in such a way that they could not be sampled. In addition, many institutions sentdiskettes that other computers were unable to read.
For the next NSOPF, list preparation instructions should be augmented by providing institutions with aformatted diskette that contains an example of the file layout requested. This diskette could also include asimple interactive database management program that could run diagnostic checks on the list data to assurethat data are supplied according to specifications. Even though not all institutions are equipped with thesame hardware and/or software, we believe that the availability of this aid will enhance the probability of ourreceiving electronic files in the preferred format. Institutions should also be given the option of submittingtheir faculty lists on CD-ROM.
11.9 Scanning Hardcopy Faculty Lists
NORC recommends investigating the possibility of using computer scanners to convert hardcopy lists into aneasier format. With the development of new and more efficient scanning devices, it is conceivable that theneed for keying/manual data entry of hardcopy lists could be eliminated by the next survey wave. Time spenton coding and keying information from hardcopy lists was reduced substantially from the field test, but wasstill greater than the time required to process most electronic files. Some institutions had large and time-consuming hardcopy lists of faculty that could have been electronically processed in a fraction of the time.With scanning devices, printed data could be scanned and converted into an electronic format that could thenbe used to sample faculty.
11.10 Using the Internet
As the use and accessibility of the "information superhighway" is increasing across organizationsespeciallyacademic institutionsthe use of the Internet as a mode of transmitting and receiving information should beexamined. Even though transmitting faculty lists via the Internet was not formally given as an option in theinstitution recruitment and list collection materials in the main study, some institutions chose to submit theirlists in that fashion. NORC believes that providing this service will greatly enhance the efficiency andtimeliness of list collection in the next survey wave. The NSOPF data collection contractor could setup asecure World Wide Web or "gopher" site that would include an "FAQ" (for "frequentlyasked questions")screen and examples of the standard faculty list that institutions should provide. NORC's experience with aWeb site constructed for another education study suggests that this option facilitates list collection andinsures data confidentiality and security. Institutions "upload" their lists to the site server, from which listcollection is conducted. With the Internet becoming a much more common tool for research andcommunication, it is likely that persons ultimately responsible for creating electronic datafiles would be adeptat handling, and would prefer using, this mode of information transfer.
11.11 Maximizing Early Awareness of the Study
In a time of fiscal constraints, and many competing research demands, some institutions fmd it necessary tolimit their participation in research projects to those they deem most in their interest. It is vital thatinstitutional officials be provided with enough information about NSOPF to make an informed decision ontheir participation before institutional resources are committed to other projects. Therefore, we recommendthat appropriate organizations (e.g., the Association for Institutional Research, the National EducationAssociation) be provided with ongoing information about study plans and results well in advance of thenextfield period. This information can be disseminated to members through newsletters, bulletins, and NCES'participation in conferences.
150
155
1993 National Study of Postsecondary FacultyMethodology Report
11.12 Requesting Address Updates from Institutional Coordinator
The lists obtained from institutions are often out-of-date, particularly with regard to address information forpart-time faculty, many of whom may have moved to other institutions. However, Institutional Coordinators
are often able to update address information on sampled faculty, and can confirm their current status at theinstitution (as well as their faculty status as of the previous fall term). Hence, prior to telephone follow-up, we
recommend sending the lists of sampled faculty back to coordinators for confirmation of locating information
and faculty status. In this way, the level of locating effort required to reach faculty can be substantially
reduced.
11.13 Requesting System-wide Data
Faculty benefits policies in state and city college systems (and large institutions with autonomous, but related,
"satellite" institutions) are generally uniform across institutions. NSOPF should ask for (and use)system-wide sources for these institutions to minimize the burden on individual institutions. NSOPF staff can
identify these sources in the initial mailing or follow-up phone call. This kind of information can also be
collected earlier by assigning staff to investigate centralized sources for system-wide benefits policies.
11.14 Cognitive Research to Aid Institution Data Collection
One method to inform the next NSOPF round may be the use of cognitive research, such as focus groups, on
a crossectional sample of institution officials who would be charged with completing NSOPF facultysampling lists, institution questionnaires and other materials. The purpose of this research would be toascertain what procedures institutions follow to gather the data that NSOPF requires and to discoverproblems institutions face when complying with NSOPF requests. A special effort might be focused on
smaller, two-year institutions, those which showed the greatest discrepancies between their faculty lists and
their institution questionnaires. The results of this cognitive research could help the NSOPF contractor to
devise.procedures and instructions to institutions which maximize institutionparticipation and which
minimize error.
11.15 Changes to Faculty Questionnaire
In order to develop a more complete profile of faculty, we recommend adding items that obtain more
information on what constitutes advising or supervising academic activities for credit, non-credit courses, and
advising or supervising noncredit academic activities. These questions should be field tested, and focus
groupsparticularly with health sciences facultyshould also be conductedbefore being incorporated in the
next full-scale NSOPF. An option "none of the above" should be added to the code for academic degree forthose faculty respondents who do not have a degree or formal award (Question C16).
For the Question C23 and its subparts on credit courses, some respondents in the current NSOPF reported"0" credit hours, "0" hours per week, or "0" students enrolled. Other respondents reported high numbers for
these and other items at Question C23. Some respondents also reported "0" basic salary from the institution
at E47, or much higher than average salaries for their academic rank. Instructions for Questions C23 and
E47 may need to be modified. Focus group discussion could determine what modifications should be made
for the next NSOPF field test, or if individual items in each question should be modified and field-tested.
Subparts of Question C33 and C35 had high item nonresponse in the current survey. Consideration should
be given to combining funding sources for the next NSOPF, such as combining business/industry with
"other" sources, and state /local government with federal government. Items requesting information on
151
1993 National Study of Postsecondary FacultyMethodology Report
research funding (the respondent's role as investigator or staff, total funds for the 1992-93 institution year,and how funds were used (subitems of C33) had high itemnonresponse. For the next NSOPF, someconsideration should be given to obtaining this information elsewhere. At Question C35, considerationshould be given to asking only if different types of institution funding were used, and deleting the itemsasking if such funding was available.
11.16 Nonresponse Adjustment by Faculty Discipline
For NSOPF-93, nonresponse adjustments on the faculty. dataset were performed for two main facultyvariables: race/ethnicity and full-time/part-time status. Another possible nonresponse adjustment could beperformed for faculty discipline. This recommendation should be carefully considered. It would improve theaccuracy of estimates of faculty population in one of the chief means by which analysts classify faculty. Sucha nonresponse adjustment would also help to overcome problenis noted in suchprogram areas as healthsciences if it could be established that nonresponse, contributed to shortfalls in expected estimates of facultypopulation in those areas. To properly carry out a nonresponse adjustment by discipline, faculty samplinglists will have to code faculty discipline for every faculty member listed. This requirement could increaseinstitution burden. This requirement could also introduce a level of confusion into institutions' classificationof their faculty members' disciplines, as institutions would have to decide how to classify faculty memberswith joint appointments in more than one dep-artment and other like cases. To lessen institution burden,institutions could be asked to code faculty sampling lists only on the 10 piogram areas reported at the facultyquestionnaire derived variable X0Al2. No matter how discipline codes are recorded on faculty samplinglists, they would still require very detailed and specific instructions to list preparers.
11.17 Number of Replicate Weights
Analysts should be cautious about use of BHS estimated variances that relate to one stratum or to a group oftwo or three strata. Such variance estimates may be based upon far fewer than 32 replicates, and thus thevariance of the variance estimator may be large. Analysts whouse either the faculty file or the institution fileshould also be cautious about cross-classifying data so deeply that the resulting estimates are based upon avery small number of observations. The accuracy of NSOPF-93 statistics should be interpreted in light ofestimated standard errors and of the number of observations used in the statistics. In light of these issues,future NSOPFs may consider creating a greater number of replicate weights (i.e: greater than 32) for BHSvariance estimation.
11.18 Poststratification to Institution 'Questionnaire Counts
The recontacting and reconciliation effort detailed in Chapter 10 and Appendix R showed that recontactedinstitutions most often chose institution questionnaire faculty counts as the most accurate enumeration oftheir faculty. The poststratification adjustment performed on the NSOPF-93 faculty questionnaire datafilebrought national population estimates for the faculty file more in line with the national population estimatesthe institution questionnaire produced. Therefore, to reduce measurement error on the faculty datafile and toensure consistency between the institution and faculty datasets, the NSOPF contractor could poststratifyfaculty questionnaire datafiles to faculty population estimates prcduced from the institution questionnaire.This recommendation has the added attraction of allowing for a prompt estimation of national facultypopulation totals without having to conduct an extensive reconciliation effort, as discussed in Chapter 10. Ofcourse, if recommendation 11.3 helps to decrease the discrepancy between institution questionnaire totals andfaculty list totals during data collection, there may be no need for poststratification.
152 -
160
1993 National Study of Postsecondary FacultyMethodology Report
11.19 Overlap Sample Design for Future NSOPF Cycles
Composite estimation is not possible when comparing estimates between NSOPF-88 and NSOPF-93. An
overlap design for future NSOPF cycles will increase the precision for estimates of change since NSOPF-93,
even if change is estimated simply by differences between the statistics for two time points. Even greaterprecision can be achieved by relying on a composite estimator, which can be viewed as a weighted average of
two estimates of change, one based on the overlapping institutions and one based on the nonoverlappinginstitutions. The amount of weight given to the overlap-based estimate of change varies directly with the
correlation over time for the characteristic of interest. Overlap can be built into the next cycle of the study.
At that point, it will be possible to calculate the correlations and to confidently predict the gains achievable
from composite estimation, both for estimating change and also for makingcross-sectional estimates. Theprecision of the estimates can be enhanced even if composite estimation is not used. Building in overlap will
allow the use of composite estimation if desired. To that end, a machine-readable copy of the sampling frame
for the NSOPF-93 institutional sample has been produced. This data file includes, for all institutions in theframe, (a) selection probabilities, (b) stratum codes, (c) indicators as to whether the institution was or was notselected, and (d) indicators as to whether the institution did or did not participate. Items (a), (b), and (c) are
crucial for designing the overlap, and (d) is necessary for improving the efficiency of the overlap.
153
161
1993 National Study of Postsecondary FacultyMethodology Report
Appendix A
1988 NSOPF Questionnaire for Departments
162
UNITED STATES DEPARTMENT OF EDUCATION
OFFICE OF THE ASSISTANT SECRETARYFOR EDUCATIONAL RESEARCH AND IMPROVEMENT
CENTER FOR EDUCATION STATISTICSApril 1988
Dear Colleague:
There is very little current and comprehensive information about higher education
faculty in this country. For this reason, the Center for Education Statistics of theU.S. Department of Education is conducting a national survey of faculty in American
colleges and universities. This study, which is cosponsored by the National Endowmentfor the Humanities, is designed to provide reliable and current data for higher-
education researchers, as well as planners and policymakers at all levels (institu-
tional and governmental). The Center has contracted with SRI International (formerlyStanford Research Institute) and the Center for the Study of Higher Education at PennState University to conduct the study.
This National Survey of Postsecondary Faculty (NSOPF) is the most comprehensive studyof faculty in postsecondary educational institutions ever undertaken. It will provide
national profiles of faculty members regarding their backgrounds, responsibilities,career and retirement plans, compensation, benefits, and attitudes about their jobs
and various academic issues. Additionally, information on institutional and depart-mental characteristics, policies, and practices that affect faculty will be collectedfrom institutional spokespersons and chairpersons of selected departments (or compar-able academic units).
Your institution has been randomly selected to participate in the 1987-88 NSOPF.Although your participation is voluntary, it is particularly important because thissurvey will establish a baseline for any future profiles of faculty.
Individual responses and all information that would permit identification of indi-viduals will be kept strictly confidential, in accordance with the provisions of theFamily Educational Rights and Privacy Acts of 1976. Responses will be used only instatistical summaries and will not be disclosed to any group or individual.
Please complete. this questionnaire as soon as possible and return it directly to SRIin the enclosed business-reply envelope. When the study is completed, the Center willprovide your institution with a summary report of the findings. Study reports anddata tapes also will be available upon request to researchers who wish to explore thestudy issues further. If you have any questions or comments concerning this study,please telephone Dr. Susan Russell, Project Director, of SRI International(415-859-4164).
Thank you in advance for your cooperation.
OMB Clearance 0 1850-0608Expiration Elate: 7/89
163
Sincerely,
to4(Emerson J. Elliott, Director
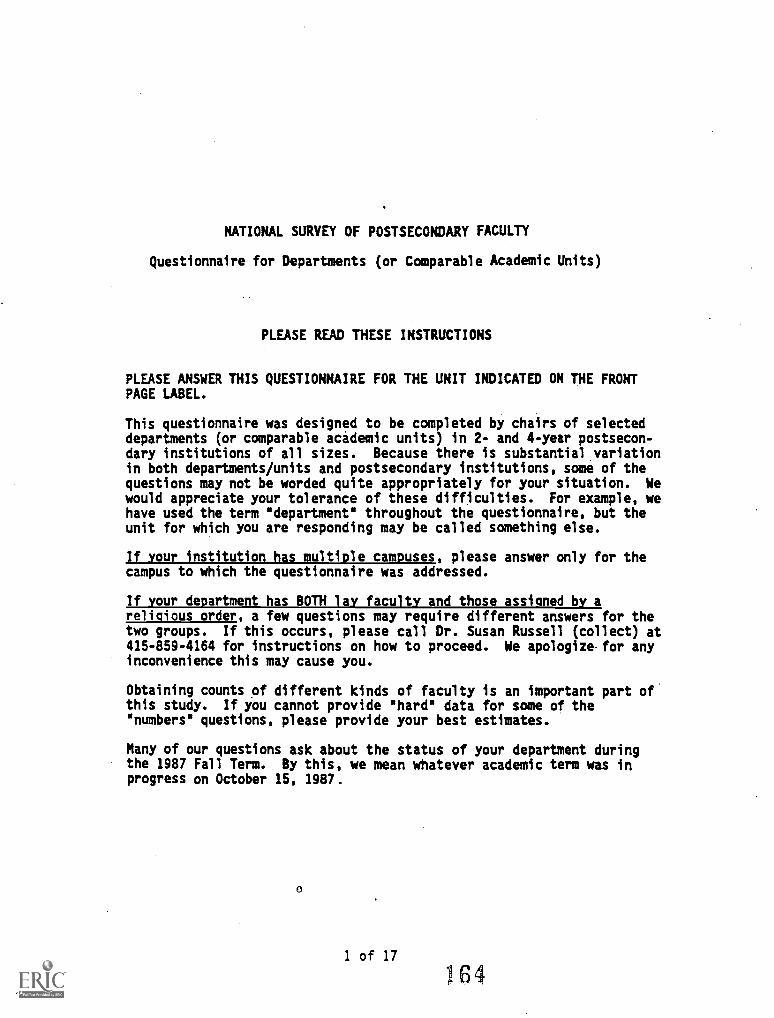
NATIONAL SURVEY OF POSTSECONDARY FACULTY
Questionnaire for Departments (or Comparable Academic Units)
PLEASE READ THESE INSTRUCTIONS
PLEASE ANSWER THIS QUESTIONNAIRE FOR THE UNIT INDICATED ON THE FRONTPAGE LABEL.
This questionnaire was designed to be completed by chairs of selecteddepartments (or comparable academic units) in 2- and 4-year postsecon-dary institutions of all sizes. Because there is substantial variationin both departments/units and postsecondary institutions, some of thequestions may not be worded quite appropriately for your situation. Wewould appreciate your tolerance of these difficulties. For example, wehave used the term 'department' throughout the questionnaire, but theunit for which you are responding may be called something else.
If your institution has multiple campuses, please answer only for thecampus to which the questionnaire was addressed.
If your department has BOTH lay faculty and those assigned by areligious order, a few questions may require different answers for thetwo groups. If this occurs, please call Dr. Susan Russell (collect) at415-859-4164 for instructions on how to proceed. We apologize for anyinconvenience this may cause you.
Obtaining counts of different kinds of faculty is an important part ofthis study. If you cannot provide 'hard' data for some of the'numbers" questions, please provide your best estimates.
Many of our questions ask about the status of your department duringthe 1987 Fall Term. By this, we mean whatever academic term was inprogress on October 15, 1987.
1 of 17
164
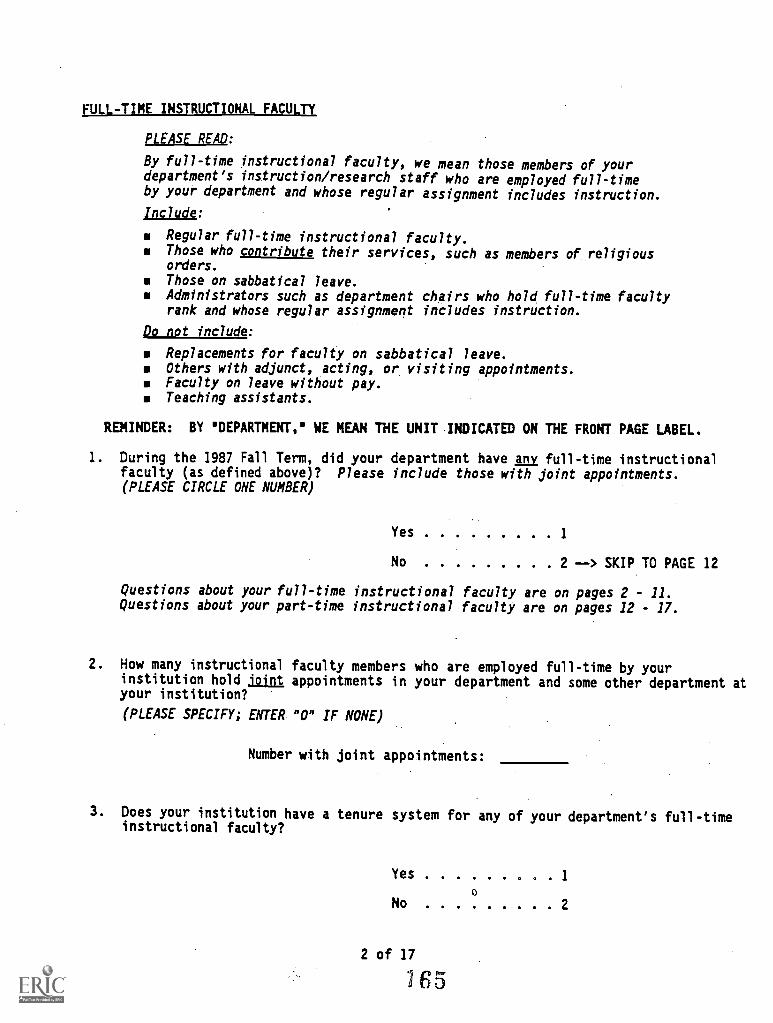
FULL-TIME INSTRUCTIONAL FACULTY
PLEASE READ:
By full-time instructional faculty, we mean those members of yourdepartment's instruction/research staff who are employed full-timeby your department and whose regular assignment includes instruction.
Include:
Regular full-time instructional faculty.Those who contribute their services, such as members of religiousorders.
Those on sabbatical leave.Administrators such as department chairs who hold full-time facultyrank and whose regular assignment includes instruction.
po not include:
Replacements for faculty on sabbatical leave.Others with adjunct, acting, or visiting appointments.Faculty on leave without pay.Teaching assistants.
REMINDER: BY 'DEPARTMENT,' WE MEAN THE UNIT INDICATED ON THE FRONT PAGE LABEL.
1. During the 1987 Fall Term, did your department have an full-time instructionalfaculty (as defined above)? Please include those with joint appointments.(PLEASE CIRCLE ONE NUMBER)
Yes 1
No 2 > SKIP TO PAGE 12
Questions about your full-time instructional faculty are on pages 2 - 11.Questions about your part-time instructional faculty are on pages 12 - 17.
2. How many instructional faculty members who are employed full-time by yourinstitution hold joint appointments in your department and some other department atyour institution?
(PLEASE SPECIFY; ENTER "0" IF NONE)
Number with joint appointments:
3. Does your institution have a tenure system for any of your department's full-timeinstructional faculty?
Yes 1
0
No 2
2 of 17
165
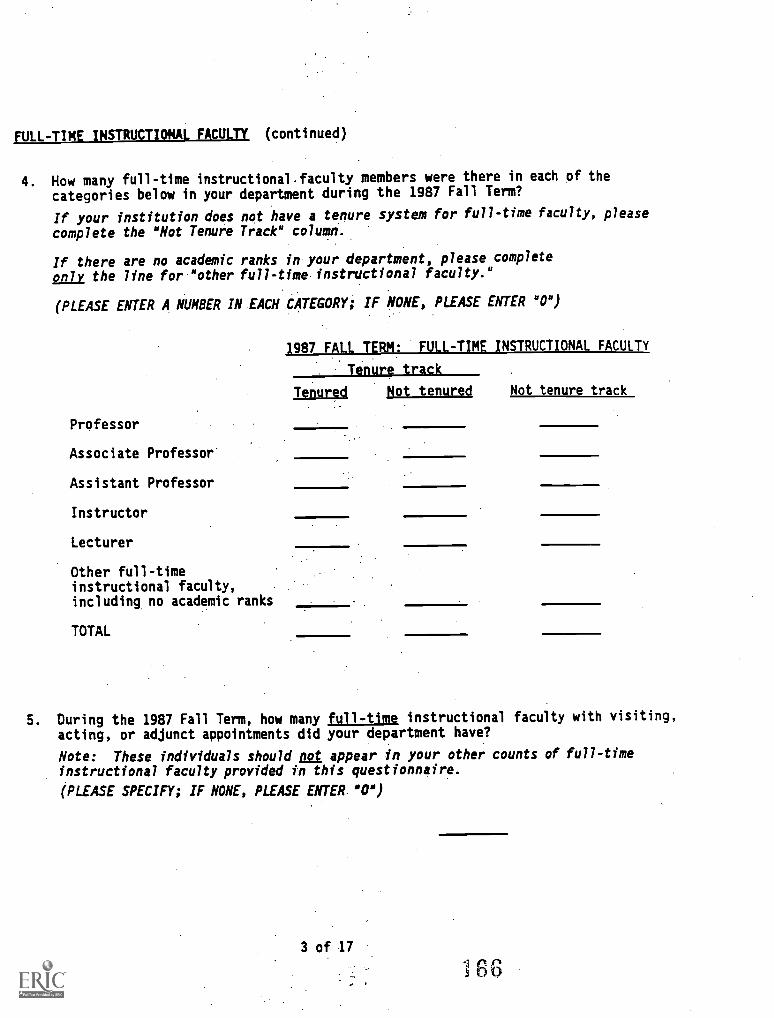
BULL -TIME INSTRUCTIONAL FACULTY (continued)
4. How many full-time instructional faculty members were there in each of the
categories below in your department during the 1987 Fall Term?
If your institution does not have a tenure system for full-time faculty, please
complete the "Not Tenure Track" column.
If there are no academic ranks in your department, please complete
only, the line for "other full-time instructional faculty."
(PLEASE ENTER A NUMBER IN EACH CATEGORY; IF NONE, PLEASE ENTER "0")
Professor
Associate Professor
Assistant Professor
Instructor
Lecturer
Other full-timeinstructional faculty,including no academic ranks
TOTAL
1987 FALL TERM FULL-TIME INSTRUCTIONAL FACULTY
Tenure track
Tenured Not tenured Not tenure track
5. During the 1987 Fall Term, how many full-time instructional faculty with visiting,acting, or adjunct appointments did your department have?
Note: These individuals should Ad appear in your other counts of full-timeinstructional faculty provided in this questionnaire.
(PLEASE SPECIFY; IF NONE, PLEASE ENTER "0")
3 of 17
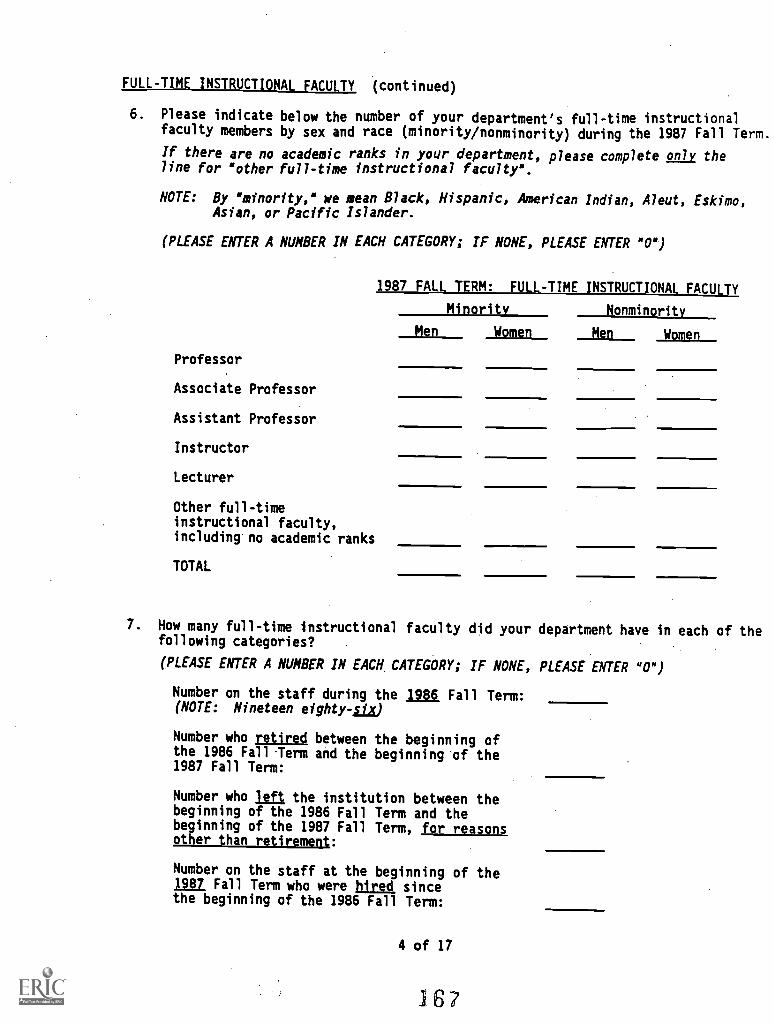
FULL-TIME INSTRUCTIONAL FACULTY (continued)
6. Please indicate below the number of your department's full-time instructionalfaculty members by sex and race (minority/nonminority) during the 1987 Fall Term.
If there are no academic ranks in your department, please complete only theline for "other full-time instructional faculty".
NOTE: By "minority," we mean Black, Hispanic, American Indian, Aleut, Eskimo,Asian, or Pacific Islander.
(PLEASE ENTER A NUMBER IN EACH CATEGORY; IF NONE, PLEASE ENTER "0")
Professor
Associate Professor
Assistant Professor
Instructor
Lecturer
Other full-timeinstructional faculty,including no academic ranks
TOTAL
1987 FALL TERM: FULL-TIME INSTRUCTIONAL FACULTY
Minority Nonminority
Men Women Men Women
7. How many full-time instructional faculty did your department have in each of thefollowing categories?
(PLEASE ENTER A NUMBER IN EACH CATEGORY; IF NONE, PLEASE ENTER "0")
Number on the staff during the ;986 Fall Term:(NOTE: Nineteen eighty -)
Number who retired between the beginning ofthe 1986 Fall -Term and the beginning of the1987 Fall Term:
Number who lei the institution between thebeginning of the 1986 Fall Term and thebeginning of the 1987 Fall Term, for reasonsother than retirement:
Number on the staff at the beginning of the1987 Fall Term who were hired, sincethe beginning of the 1986 Fall Term:
4 of 17
167
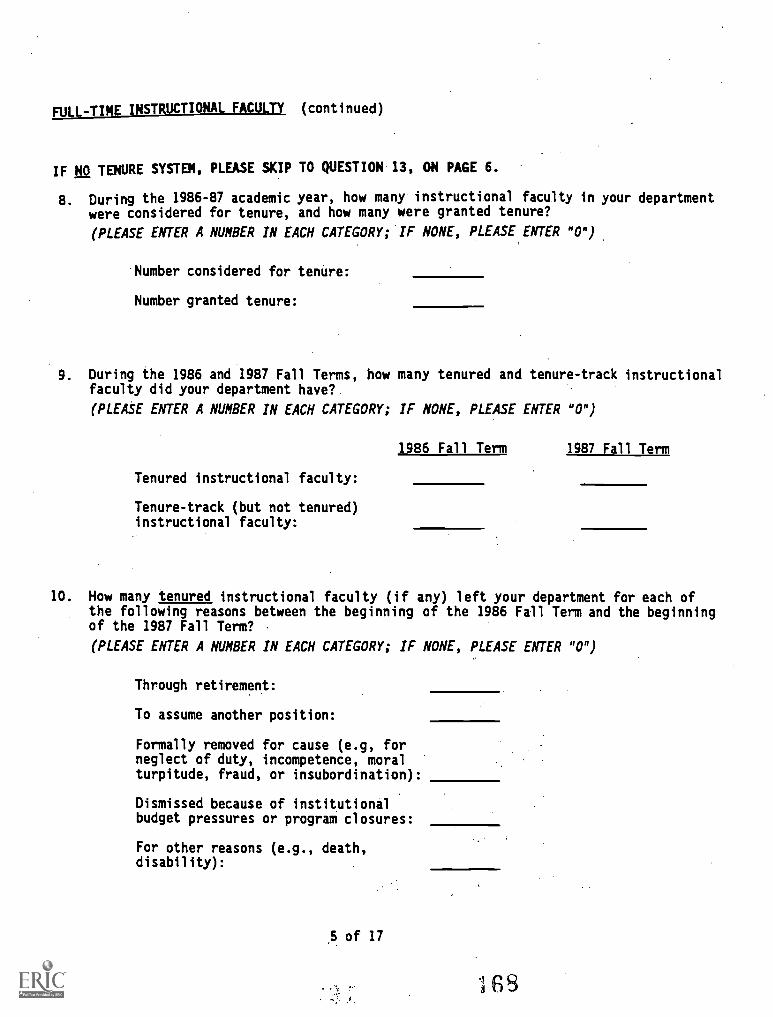
FULL-TIME INSTRUCTIONAL FACULTY (continued)
IF NO TENURE SYSTEM, PLEASE SKIP TO QUESTION 13, ON PAGE 6.
8. During the 1986-87 academic year, how many instructional faculty in your departmentwere considered for tenure, and how many were granted tenure?
(PLEASE ENTER A NUMBER IN EACH CATEGORY; IF NONE, PLEASE ENTER "0")
Number considered for tenure:
Number granted tenure:
9. During the 1986 and 1987 Fall Terms, how many tenured and tenure-track instructionalfaculty did your department have?
(PLEASE ENTER A NUMBER IN EACH CATEGORY; IF NONE, PLEASE ENTER "0")
Tenured instructional faculty:
Tenure-track (but not tenured)instructional faculty:
1986 Fall Term 1987 Fall Term
10. How many tenured instructional faculty (if any) left your department for each ofthe following reasons between the beginning of the 1986 Fall Term and the beginningof the 1987 Fall Term?
(PLEASE ENTER A NUMBER IN EACH CATEGORY; IF NONE, PLEASE ENTER "0")
Through retirement:
To assume another position:
Formally removed for cause (e.g, forneglect of duty, incompetence, moralturpitude, fraud, or insubordination):
Dismissed because of institutionalbudget pressures or program closures:
For other reasons (e.g., death,disability):
5 of 17
168
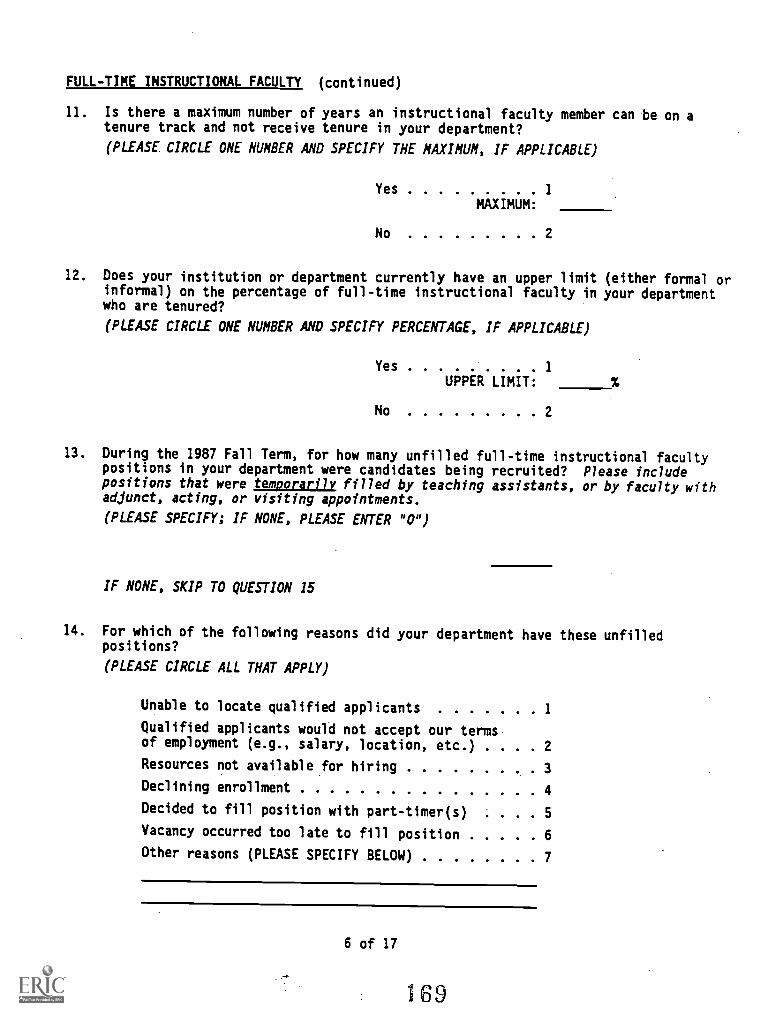
FULL-TIME INSTRUCTIONAL FACULTY (continued)
11. Is there a maximum number of years an instructional faculty member can be on atenure track and not receive tenure in your department?
(PLEASE CIRCLE ONE NUMBER AND SPECIFY THE MAXIMUM, IF APPLICABLE)
Yes 1
MAXIMUM:
No 2
12. Does your institution or department currently have an upper limit (either formal orinformal) on the percentage of full-time instructional faculty in your departmentwho are tenured?
(PLEASE CIRCLE ONE NUMBER AND SPECIFY PERCENTAGE, IF APPLICABLE)
Yes..... . . . . 1
UPPER LIMIT:
No 2
13. During the 1987 Fall Term, for how many unfilled full-time instructional facultypositions in your department were candidates being recruited? Please includepositions that were temporarily filled by teaching assistants, or by faculty withadjunct, acting, or visiting appointments.
(PLEASE SPECIFY; IF NONE, PLEASE ENTER "0")
IF NONE, SKIP TO QUESTION 15
14. For which of the following reasons did your department have these unfilledpositions?
(PLEASE CIRCLE ALL THAT APPLY)
Unable to locate qualified applicants 1
Qualified applicants would not accept our termsof employment (e.g., salary, location, etc.) . . . 2
Resources not available for hiring 3
Declining enrollment 4
Decided to fill position with part-timer(s). . . 5
Vacancy occurred too late to fill position 6
Other reasons (PLEASE SPECIFY BELOW) 7
6 of 17
169
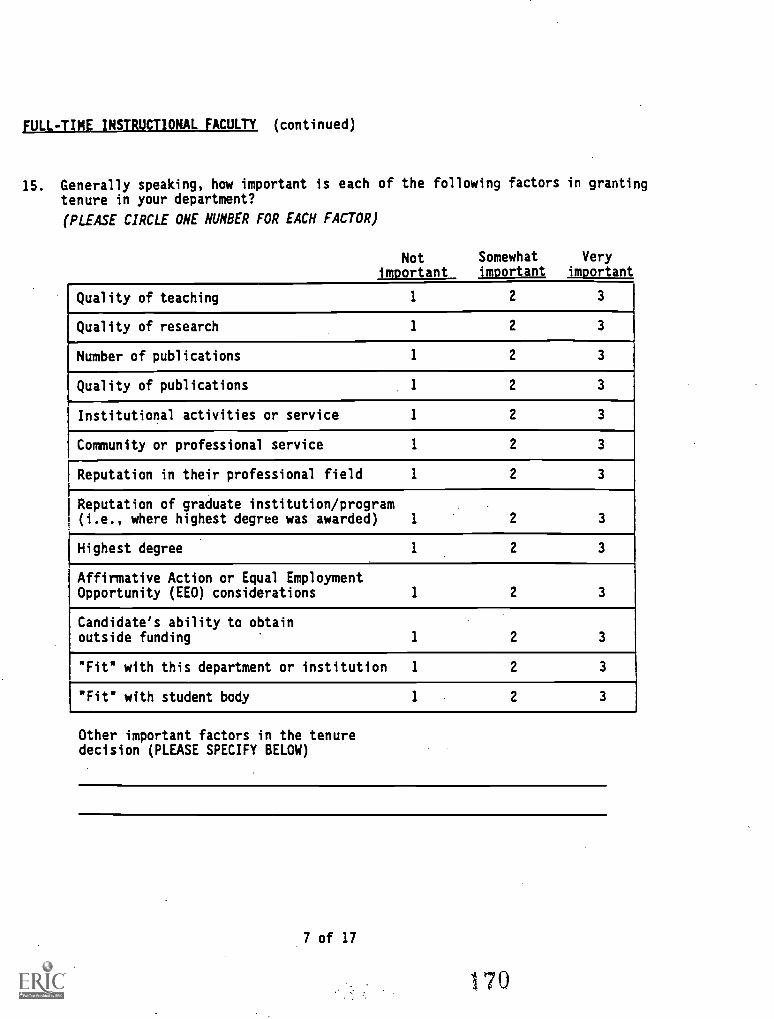
fULL -TIME INSTRUCTIONAL FACULTY (continued)
15. Generally speaking, how important is each of the following factors in grantingtenure in your department?
(PLEASE CIRCLE ONE NUMBER FOR EACH FACTOR)
Notimportant
Somewhat Veryiffpgrunt important
Quality of teaching 1 2 3
Quality of research 1 2 3
Number of publications 1 2 3
Quality of publications 1 2 3
Institutional activities or service 1 2 3
Community or professional service 1 2 3
Reputation in their professional field 1 2 3
Reputation of graduate institution/program(i.e., where highest degree was awarded) 1 2 3
Highest degree 1 2 3
Affirmative Action or Equal EmploymentOpportunity (EEO) considerations 1 2 3
Candidate's ability to obtainoutside funding 1 2 3
"Fit" with this department or institution 1 2 3
"Fit" with student body 1 2 3
Other important factors in the tenuredecision (PLEASE SPECIFY BELOW)
7 of 17
170
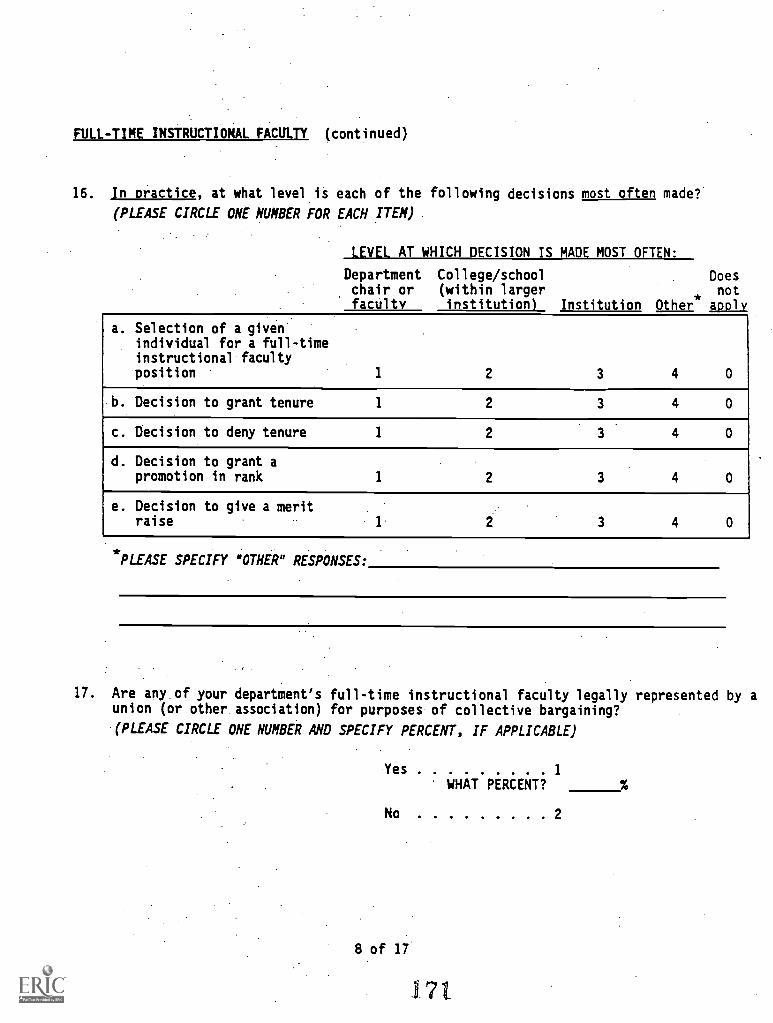
FULL-TIME INSTRUCTIONAL FACULTY (continued)
16. In practice, at what level is each of the following decisions most often made?
(PLEASE CIRCLE ONE NUMBER FOR EACH ITEM)
LEVEL AT WHICH DECISION IS MADE MOST OFTEN:
Department College/schoolchair or (within largerfaculty institution)
Doesnot
nstitution Other amply
a. Selection of a givenindividual for a full-timeinstructional facultyposition 1 2 3 4 0
b. Decision to grant tenure 1 2 3 4 0
c. Decision to deny tenure 1 2 3 4 0
d. Decision to grant apromotion in rank 1 2 3 4 0
e. Decision to give a meritraise 1 2 3 4 0
*PLEASE SPECIFY "OTHER" RESPONSES:
17. Are any.of your department's full-time instructional faculty legally represented by a
union (or other association) for purposes of collective bargaining?
(PLEASE CIRCLE ONE NUMBER AND SPECIFY PERCENT, IF APPLICABLE)
Yes .... . . . . 1
WHAT PERCENT?
2
8 of 17
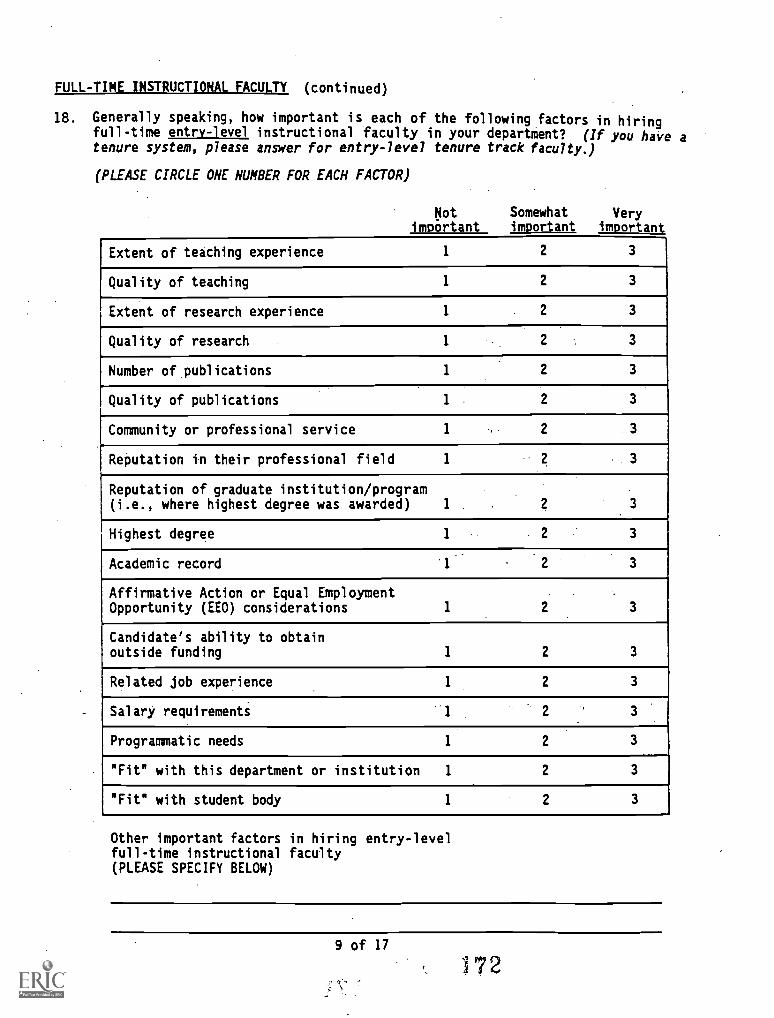
FULL-TIME INSTRUCTIONAL FACULTY (continued)
18. Generally speaking, how important is each of the following factors in hiringfull-time entry -level instructional faculty in your department? (If you have atenure system, please answer for entry-level tenure track faculty.)
(PLEASE CIRCLE ONE NUMBER FOR EACH FACTOR)
Not Somewhat Veryimportant important important
Extent of teaching experience 1 2 3
Quality of teaching 1 2 3
Extent of research experience 1 2 3
Quality of research 1 . 3
Number of publications 1 2
Quality of publications
Community or professional service 1
Reputation in their professional field 1
Reputation of graduate institution/program(i.e., where highest degree was awarded) 1 . 3
Highest degree 1 2 3
Academic record 3
Affirmative Action or Equal EmploymentOpportunity (EEO) considerations 1 2 3
Candidate's ability to obtainoutside funding 1 2 3
Related job experience 1 2 3
Salary requirements 1 2 3
Programmatic needs 1 2 3
"Fit" with this department or institution 1 2 3
"Fit" with student body 1 2 3
Other important factors in hiring entry-levelfull-time instructional faculty(PLEASE SPECIFY BELOW)
9 of 17
172
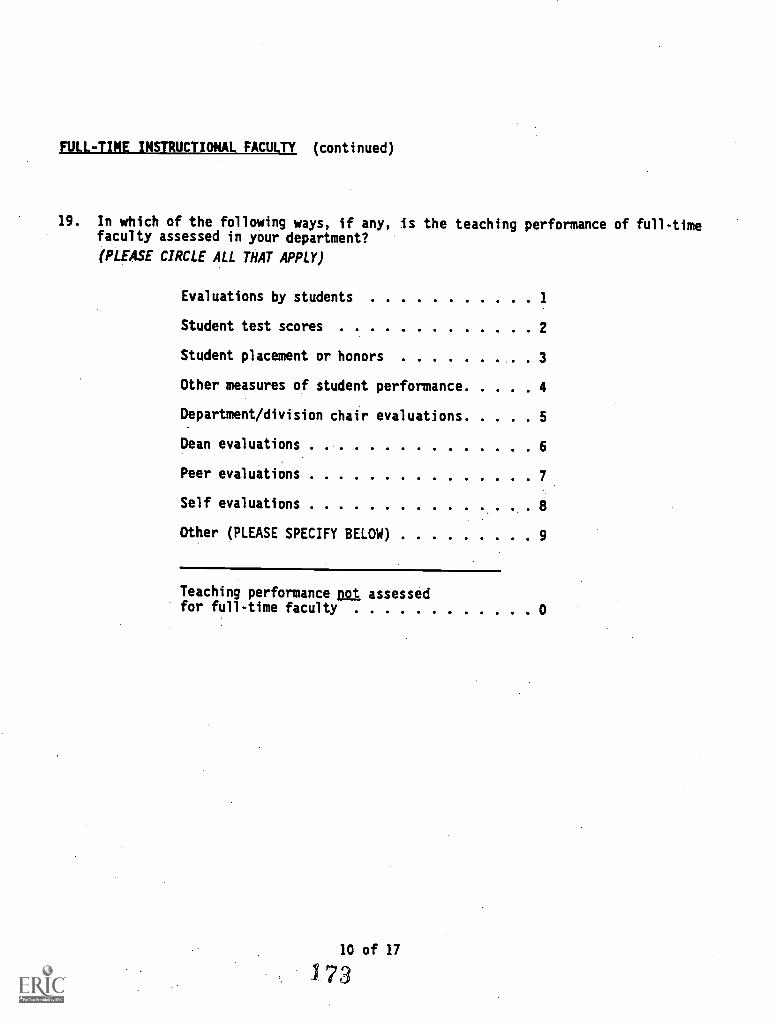
FULL-TINE INSTRUCTIONAL FACULTY (continued)
19. In which of the following ways, if any, is the teaching performance of full-timefaculty assessed in your department?
(PLEASE CIRCLE ALL THAT APPLY)
Evaluations by students 1
Student test scores 2
Student placement or honors 3
Other measures of student performance 4
Department/division chair evaluations
Dean evaluations 6
Peer evaluations 7
Self evaluations 8
Other (PLEASE SPECIFY BELOW) 9
Teaching performance D_Qi. assessedfor full-time faculty 0
10 of 17
1
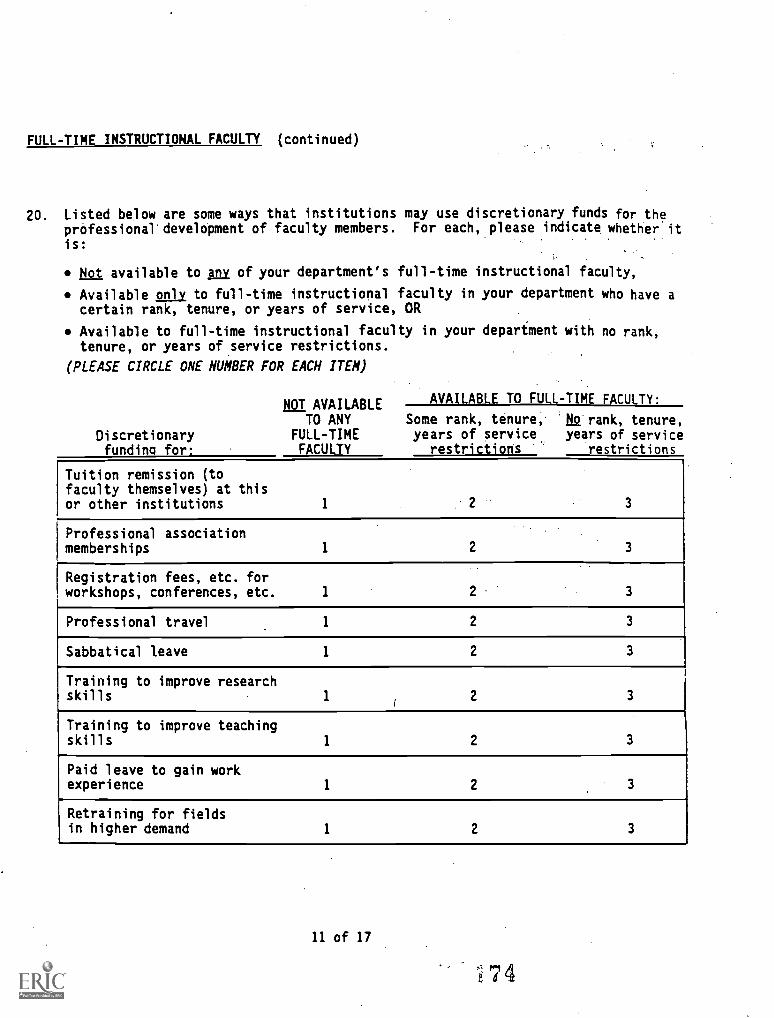
FULL-TIME INSTRUCTIONAL FACULTY (continued)
20. Listed below are some ways that institutions may use discretionary funds for theprOfessionaldevelopment of faculty members. For each, please indicate whether it
is:
Nof available to Any of your department's full-time instructional faculty,
Available only to full-time instructional faculty in your department who have acertain rank, tenure, or years of service, OR
Available to full-time instructional faculty in your department with no rank,tenure, or years of service restrictions.
(PLEASE CIRCLE ONE NUMBER FOR EACH ITEM)
NE AVAILABLEAVAILABLE TO FULL-TIME FACULTY:
TO ANY Some rank, tenure, 'No rank, tenure,FULL-TIME years of service years of serviceFACULTY restrictions restrictions
Discretionaryfunding for:
Tuition remission (tofaculty themselves) at thisor other institutions 1 2 3
Professional associationmemberships 1 2 3
Registration fees, etc. forworkshops, conferences, etc. 1 2 3
Professional travel 1 2 3
Sabbatical leave 1 2 3
Training to improve researchskills 1 2 3
Training to improve teachingskills 1 2 3
Paid leave to gain workexperience 1 2 3
Retraining for fieldsin higher demand 1 2 3
11 of 17
V74
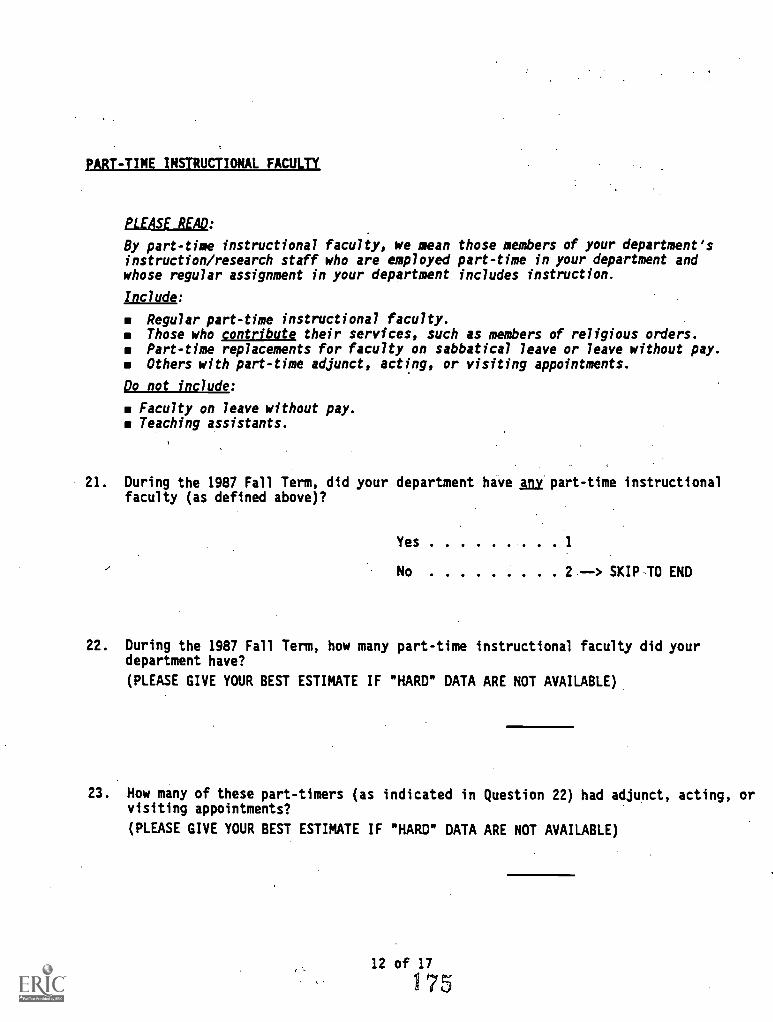
PART -TIME INSTRUCTIONAL FACULTY
PLEASE READ:
By part-time instructional faculty, we mean those members of your department'sinstruction/research staff who are employed part-time in your department andwhose regular assignment in your department includes instruction.
Include:
Regular part-time instructional faculty.Those who contribute their services, such as members of religious orders.Part-time replacements for faculty on sabbatical leave or leave without pay.Others with part-time adjunct, acting, or visiting appointments.
Do not include:
Faculty on leave without pay.Teaching assistants.
21. During the 1987 Fall Term, did your department have Any part-time instructionalfaculty (as defined above)?
Yes...... . . .
No 2 --> SKIP TO END
22. During the 1987 Fall Term, how many part-time instructional faculty did yourdepartment have?
(PLEASE GIVE YOUR BEST ESTIMATE IF "HARD" DATA ARE NOT AVAILABLE)
23. How many of these part-timers (as indicated in Question 22) had adjunct, acting, orvisiting appointments?
(PLEASE GIVE YOUR BEST ESTIMATE IF "HARD" DATA ARE NOT AVAILABLE)
12 of 17
75
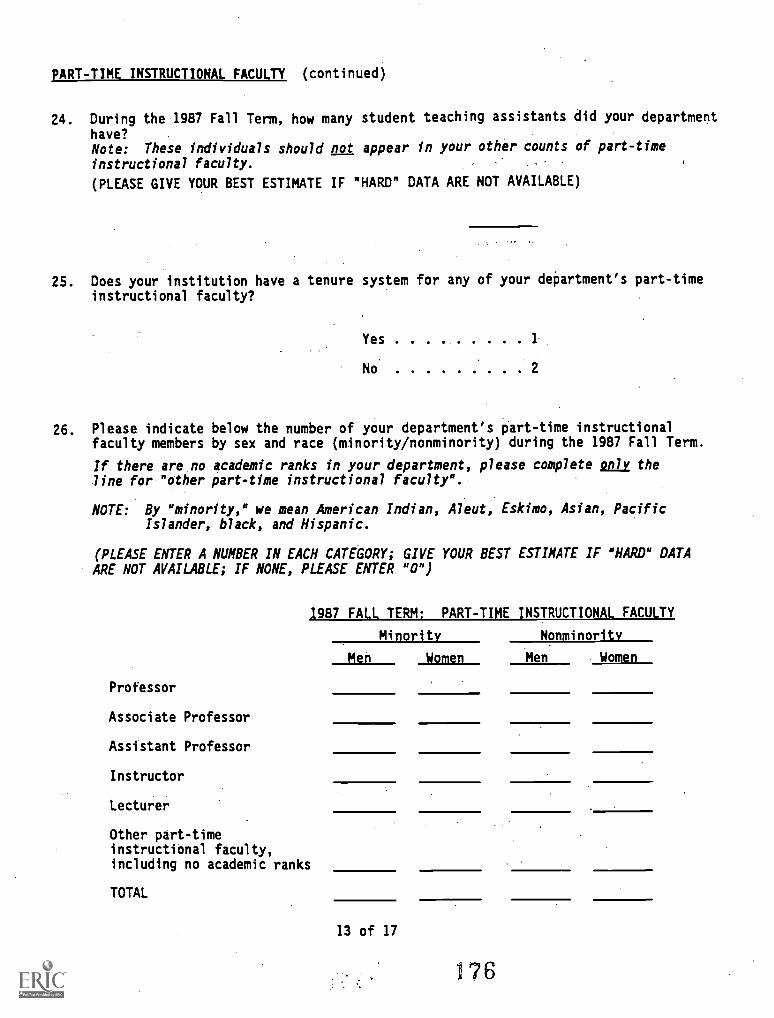
PART-TIME INSTRUCTIONAL FACULTY (continued)
24. During the 1987 Fall Term, how many student teaching assistants did your departmenthave?Note: These individuals should not appear in your other counts of part-time
instructional faculty.
(PLEASE GIVE YOUR BEST ESTIMATE IF "HARD" DATA ARE NOT AVAILABLE)
25. Does your institution have a tenure system for any of your department's part-timeinstructional faculty?
Yes . . . . ..... 1
No
26. Please indicate below the number of your department's part-time instructionalfaculty members by sex and race (minority/nonminority) during the 1987 Fall Term.
If there are no academic ranks in your department, please complete only theline for "other part-time instructional faculty".
NOTE: By "minority," we mean American Indian, Aleut, Eskimo, Asian, PacificIslander, black, and Hispanic.
(PLEASE ENTER A NUMBER IN EACH CATEGORY; GIVE YOUR BEST ESTIMATE IF "HARD" DATAARE NOT AVAILABLE; IF NONE, PLEASE ENTER "0")
Professor
Associate Professor
Assistant Professor
Instructor
Lecturer
Other part-timeinstructional faculty,including no academic ranks
TOTAL
1987 FALL TERM: PART-TIME INSTRUCTIONAL FACULTY
Minority Nonminoritv
Men Women Men Women
13 of 17
176
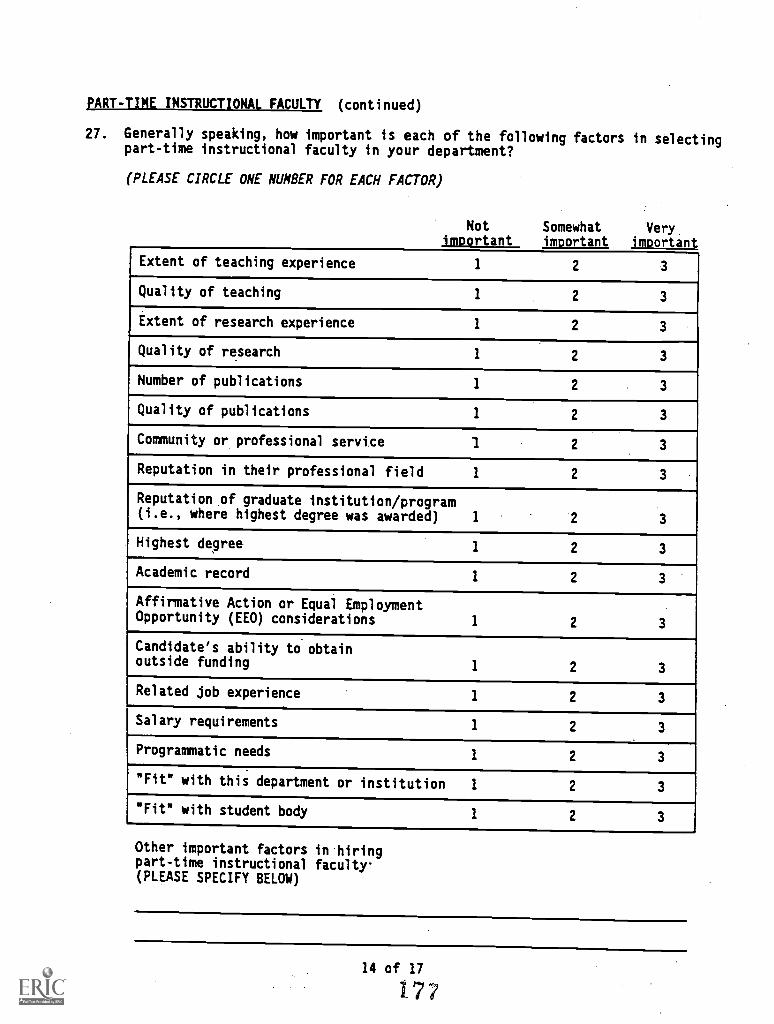
PART-TIME INSTRUCTIONAL FACULTY (continued)
27. Generally speaking, how important is each of the following factors in selectingpart-time instructional faculty in your department?
(PLEASE CIRCLE ONE NUMBER FOR EACH FACTOR)
Notimportant
Somewhat Veryimmtaill important
Extent of teaching experience 1 2 3
Quality of teaching 1 2 3
Extent of research experience 1 2 3
Quality of research 1 2 3
Number of publications 1 2 3
Quality of publications 1 2 3
Community or professional service 1 2 3
Reputation in their professional field 1 2 3
Reputation of graduate institution/program(i.e., where highest degree was awarded) 1 2 3
Highest degree 1 2 3
Academic record 1 2 3
Affirmative Action or Equal EmploymentOpportunity (EEO) considerations 1 2 3
Candidate's ability to obtainoutside funding 1 2 3
Related job experience 1 2 3
Salary requirements 1 2 3
Programmatic needs 1 2 3
"Fit" with this department or institution 1 2 3
"Fit" with student body 1 2 3
Other important factors in hiringpart-time instructional faculty.(PLEASE SPECIFY BELOW)
14 of 17
1.77
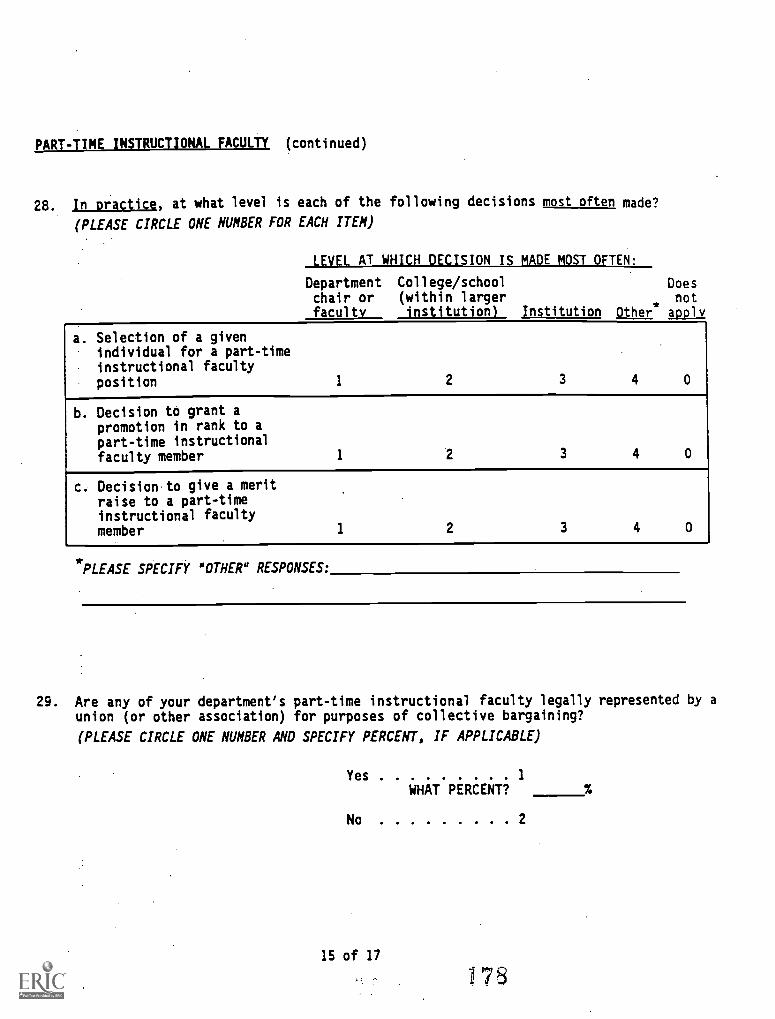
PART-TIME INSTRUCTIONAL FACULTY (continued)
28. In practice, at what level is each of the following decisions most often made?
(PLEASE CIRCLE ONE NUMBER FOR EACH ITEM)
LEVEL AT WHICH DECISION IS MADE MOST OFTEN:
Department College/school Doeschair or (within larger not
faculty institution) Institution Other apply
a. Selection of a givenindividual for a part-timeinstructional facultyposition
b. Decision to grant apromotion in rank to apart-time instructionalfaculty member
c. Decision to give a meritraise to a part-timeinstructional facultymember
1 2 3 4 0
1 3 4 0
1 2 3 4 0
*PLEASE SPECIFY "OTHER" RESPONSES:
29. Are any of your department's part-time instructional faculty legally represented by aunion (or other association) for purposes of collective bargaining?
(PLEASE CIRCLE ONE NUMBER AND SPECIFY PERCENT, IF APPLICABLE)
Yes ..... . . . . I
WHAT PERCENT?
No 2
IS of 17
175
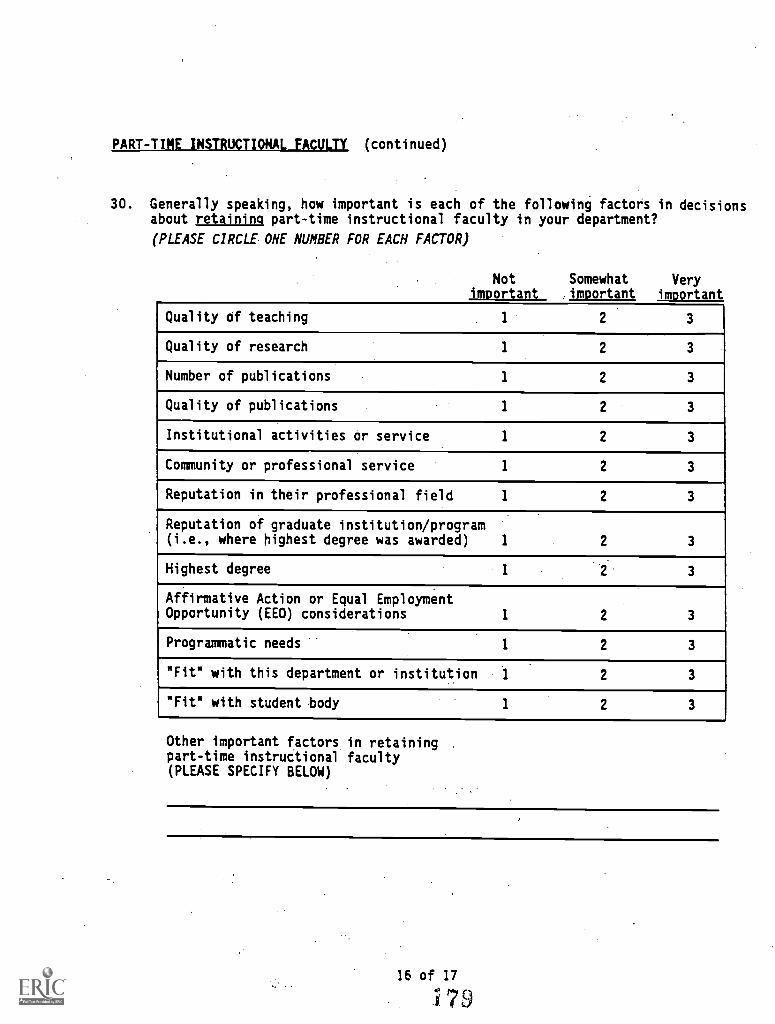
PART-TINE INSTRUCTIONAL FACULTY (continued)
30. Generally speaking, how important is each of the following factors in decisionsabout retaining part-time instructional faculty in your department?
(PLEASE CIRCLE ONE NUMBER FOR EACH FACTOR)
Not Somewhat Veryimportant important important
Quality of teaching 1 2 3
Quality of research 1 2 3
Number of publications 1 2 3
Quality of publications 1 2 3
Institutional activities or service 1 2 3
Community or professional service 1 2 3
Reputation in their professional field 1 2 3
Reputation of graduate institution/program(i.e., where highest degree was awarded) 1 2 3
Highest degree 1 2 3
Affirmative Action or Equal EmploymentOpportunity (EEO) considerations 1 2 3
Programmatic needs 1 2 3
"Fit" with this department or institution 1 2 3
"Fit" with student body 1 2 3
Other important factors in retainingpart-time instructional faculty(PLEASE SPECIFY BELOW)
16 of 17
179
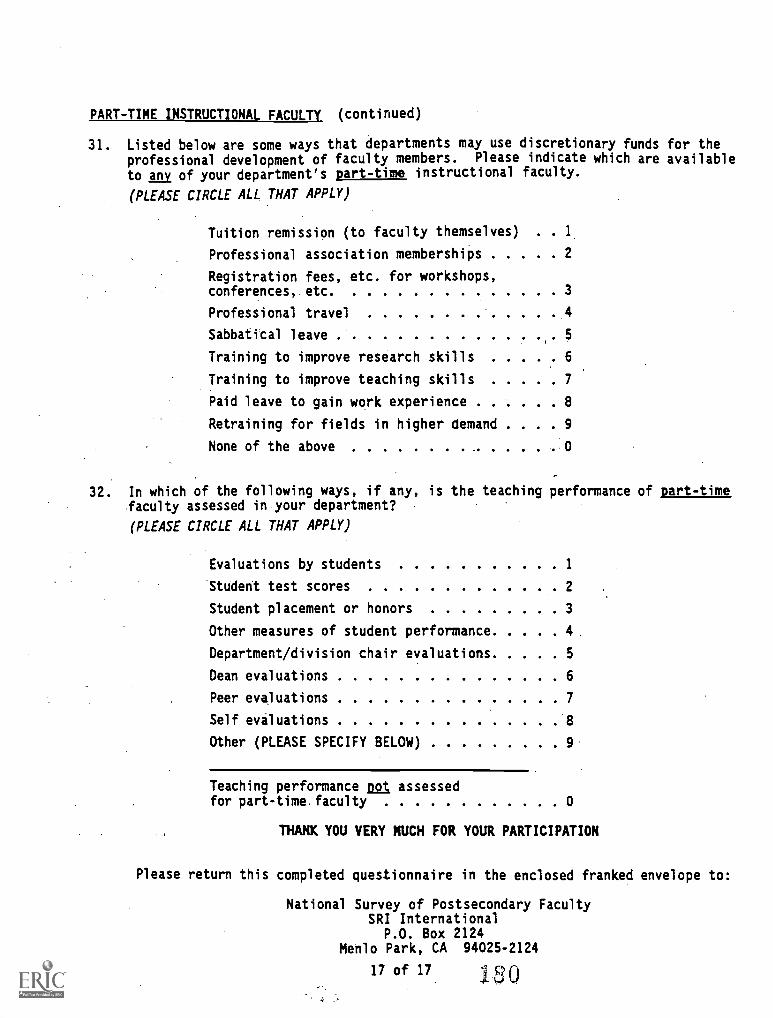
PART-TIME INSTRUCTIONAL FACULTY (continued)
31. Listed below are some ways that departments may use discretionary funds for theprofessional development of faculty members. Please indicate which are available
to Any of your department's part-time instructional faculty.
(PLEASE CIRCLE ALL THAT APPLY)
Tuition remission (to faculty themselves) .
Professional association memberships 2
Registration fees, etc. for workshops,conferences,. etc. 3
Professional travel 4
Sabbatical leave 5
Training to improve research skills 6
Training to improve teaching skills 7
Paid leave to gain work experience 8
Retraining for fields in higher demand . . . 9
None of the above 0
32. In which of the following ways, if any, is the teaching performance of part-timefaculty assessed in your department?
(PLEASE CIRCLE ALL THAT APPLY)
Evaluations by students 1
*Student test scores 2
Student placement or honors 3
Other measures of student performance 4
Department/division chair evaluations 5
Dean evaluations 6
Peer evaluations 7
Self evaluations 8
Other (PLEASE SPECIFY BELOW) 9
Teaching performance ng assessedfor part-time.faculty 0
THANK YOU VERY MUCH FOR YOUR PARTICIPATION
Please return this completed questionnaire in the enclosed franked envelope to:
National Survey of Postsecondary FacultySRI International
P.O. Box 2124Menlo Park, CA 94025-2124
17 of 17
1993 National Study of Postsecondary FacultyMethodology Report
Appendix B
1988 NSOPF Faculty Questionnaire
181
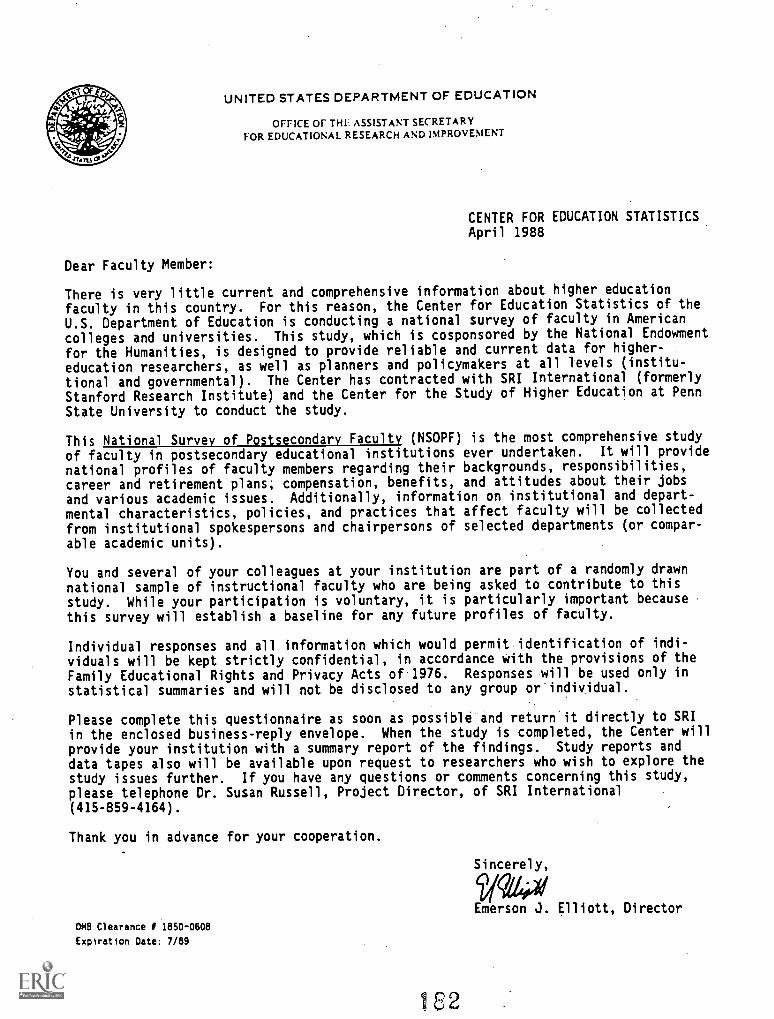
UNITED STATES DEPARTMENT OF EDUCATION
OFFICE OF THE ASSISTANT SECRETARYFOR EDUCATIONAL RESEARCH AND IMPROVEMENT
CENTER FOR EDUCATION STATISTICSApril 1988
Dear Faculty Member:
There is very little current and comprehensive information about higher education
faculty in this country. For this reason, the Center for Education Statistics of theU.S. Department of Education is conducting a national survey of faculty in American
colleges and universities. This study, which is cosponsored by the National Endowmentfor the Humanities, is designed to provide reliable and current data for higher-
education researchers, as well as planners and policymakers at all levels (institu-
tional and governmental). The Center has contracted with SRI International (formerlyStanford Research Institute) and the Center for the Study of Higher Education at Penn
State University to conduct the study.
This National Survey of Postsecondary Faculty (NSOPF) is the most comprehensive study
of faculty in postsecondary educational institutions ever undertaken. It will provide
national profiles of faculty members regarding their backgrounds, responsibilities,
career and retirement plans, compensation, benefits, and attitudes about their jobs
and various academic issues. Additionally, information on institutional and depart-mental characteristics, policies, and practices that affect faculty will be collected
from institutional spokespersons and chairpersons of selected departments (or compar-
able academic units).
You and several of your colleagues at your institution are part of a randomly drawn
national sample of instructional faculty who are being asked to contribute to this
study. While your participation is voluntary, it is particularly important becausethis survey will establish a baseline for any future profiles of faculty.
Individual responses and all information which would permit identification of indi-viduals will be kept strictly confidential, in accordance with the provisions of the
Family Educational Rights and Privacy Acts of 1976. Responses will be used only instatistical summaries and will not be disclosed to any group or individual.
Please complete this questionnaire as soon as possible and return'it directly to SRIin the enclosed business-reply envelope. When the study is completed, the Center willprovide your institution with a summary report of the findings. Study reports anddata tapes also will be available upon request to researchers who wish to explore thestudy issues further. If you have any questions or comments concerning this study,please telephone Dr. Susan Russell, Project Director, of SRI International(415-859-4164).
Thank you in advance for your cooperation.
OMB Clearance I 1850-0608
Expiration Date: 7/89
L82
Sincerely,
q441Emerson J. Elliott, Director
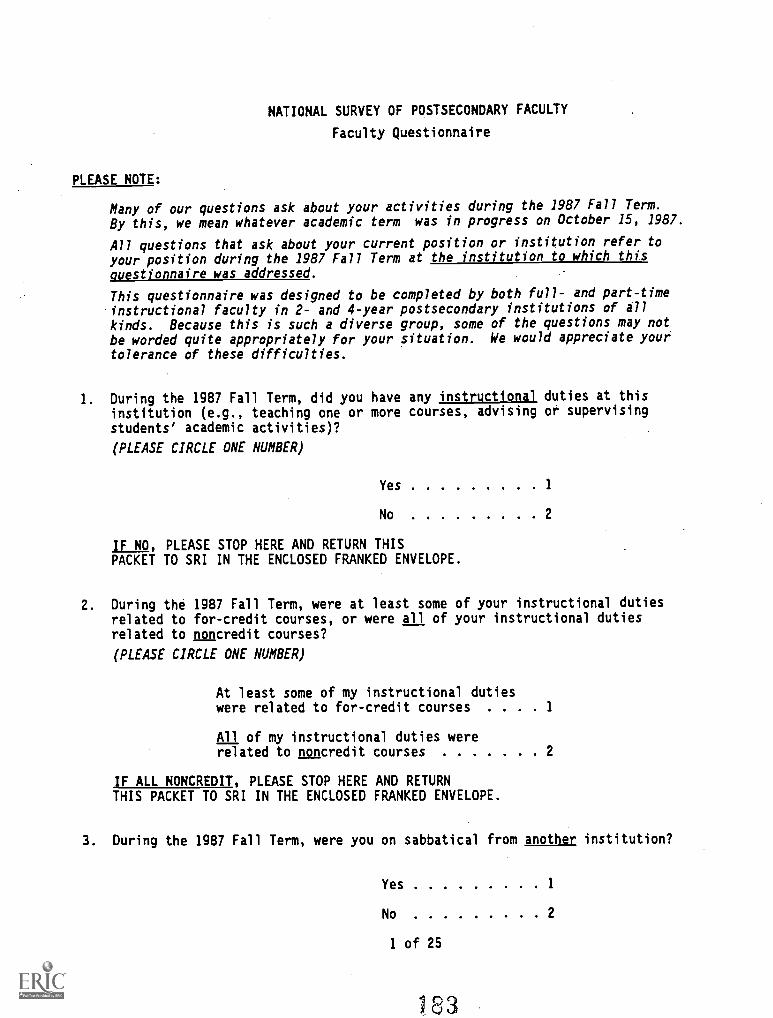
NATIONAL SURVEY OF POSTSECONDARY FACULTY
Faculty Questionnaire
PLEASE NOTE:
Many of our questions ask about your activities during the 1987 Fall Term.
By this, we mean whatever academic term was in progress on October 15, 1987.
All questions that ask about your current position or institution refer to
your position during the 1987 Fall Term at the institution to which this
questionnaire was addressed.
This questionnaire was designed to be completed by both full- and part-time
instructional faculty in 2- and 4-year postsecondary institutions of allkinds. Because this is such a diverse group, some of the questions may notbe worded quite appropriately for your situation. We would appreciate your
tolerance of these difficulties.
1. During the 1987 Fall Term, did you have any instructional duties at thisinstitution (e.g., teaching one or more courses, advising or supervisingstudents' academic activities)?
(PLEASE CIRCLE ONE NUMBER)
Yes 1
No 2
IF NO, PLEASE STOP HERE AND RETURN THISPACKET TO SRI IN THE ENCLOSED FRANKED ENVELOPE.
2. During the 1987 Fall Term, were at least some of your instructional dutiesrelated to for-credit courses, or were all of your instructional dutiesrelated to noncredit courses?
(PLEASE CIRCLE ONE NUMBER)
At least some of my instructional dutieswere related to for-credit courses . . . . 1
All of my instructional duties wererelated to noncredit courses 2
IF ALL NONCREDIT, PLEASE STOP HERE AND RETURNTHIS PACKET TO SRI IN THE ENCLOSED FRANKED ENVELOPE.
3. During the 1987 Fall Term, were you on sabbatical from another institution?
Yes 1
No 2
1 of 25
183
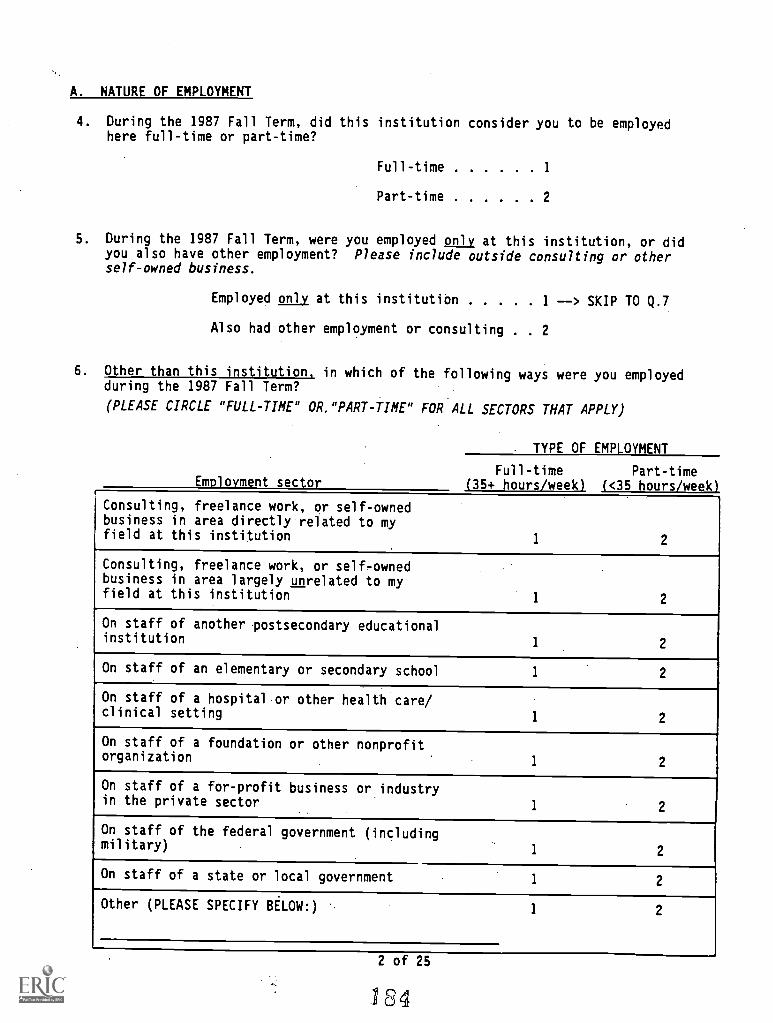
A. NATURE OF EMPLOYMENT
4. During the 1987 Fall Term, did this institution consider you to be employedhere full-time or part-time?
Full-time 1
Part-time 2
5. During the 1987 Fall Term, were you employed only at this institution, or didyou also have other employment? Please include outside consulting or otherself-owned business.
Employed only at this institution 1 --> SKIP TO Q.7
Also had other employment or consulting . 2
6. Other than this institution, in which of the following ways were you employedduring the 1987 Fall Term?
(PLEASE CIRCLE "FULL-TIME" OR."PART-TIME" FOR ALL SECTORS THAT APPLY)
Employment sector
TYPE OF EMPLOYMENT
Full-time Part-time(35+ hours/week) (<35 hours/week)
Consulting, freelance work, or self-ownedbusiness in area directly related to myfield at this institution 1 2
Consulting, freelance work, or self-ownedbusiness in area largely unrelated to myfield at this institution 1 2
On staff of another postsecondary educationalinstitution 1 2
On staff of an elementary or secondary school 1 2
On staff of a hospital or other health care/clinical setting
1 2
On staff of a foundation or other nonprofitorganization
1 2
On staff of a for-profit business or industryin the private sector
1 2
On staff of the federal government (includingmilitary)
1 2
On staff of a state or local government1 2
Other (PLEASE SPECIFY BELOW:) 1 2
2 of 25
184
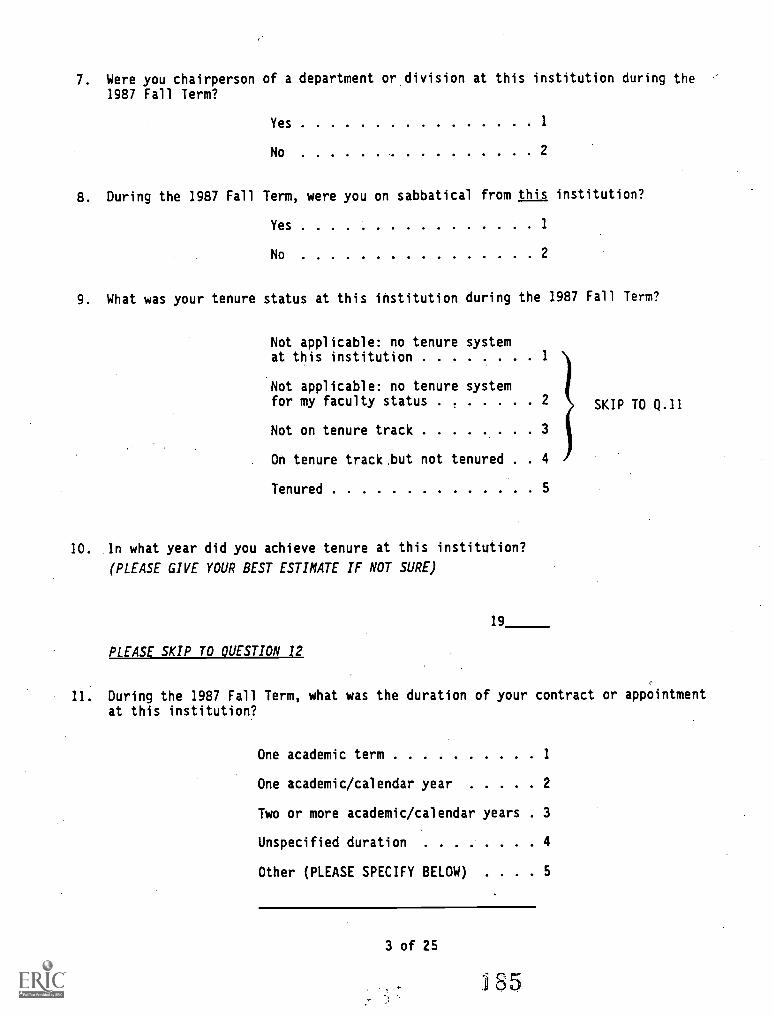
7. Were you chairperson of a department or division at this institution during the1987 Fall Term?
Yes 1
No 2
8. During the 1987 Fall Term, were you on sabbatical from this institution?
Yes 1
No 2
9. What was your tenure status at this institution during the 1987 Fall Term?
Not applicable: no tenure systemat this institution 1
Not applicable: no tenure systemfor my faculty status 2 SKIP TO Q.11
Not on tenure track 3
On tenure track.but not tenured 4
Tenured 5
10. In what year did you achieve tenure at this institution?
(PLEASE GIVE YOUR BEST ESTIMATE IF NOT SURE)
19
PLEASE SKIP TO QUESTION 12
11. During the 1987 Fall Term, what was the duration of your contract or appointmentat this institution?
One academic term
One academic/calendar year 2
Two or more academic/calendar years 3
Unspecified duration 4
Other (PLEASE SPECIFY BELOW) . . . . 5
3 of 25
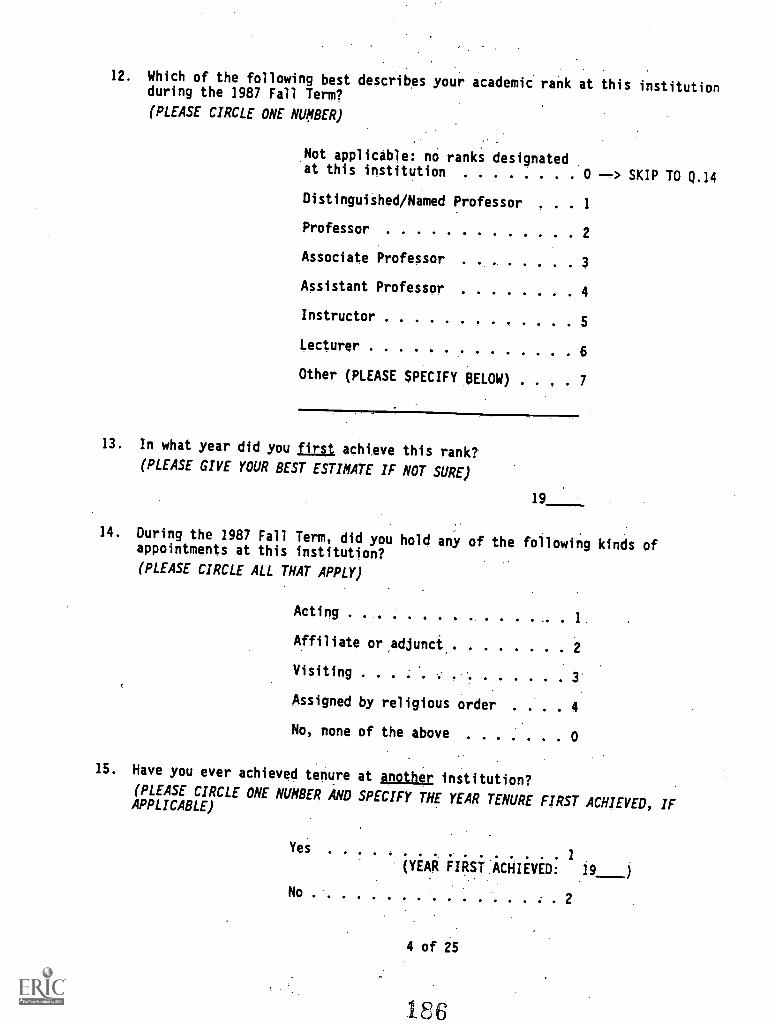
12. Which of the following best describes your academic rank at this institutionduring the 1987 Fall Term?
(PLEASE CIRCLE ONE NUMBER)
Not applicable: no ranks designatedat this institution 0 --> SKIP TO Q.14
Distinguished/Named Professor . 1
Professor 2
Associate Professor . 3
Assistant Professor 4
Instructor5
Lecturer 6
Other (PLEASE SPECIFY BELOW) . . 7
13. In what year did you first achieve this rank?(PLEASE GIVE YOUR BEST ESTIMATE IF NOT SURE)
19
14. During the 1987 Fall Term, did you hold any of the following kinds ofappointments at this institution?
(PLEASE CIRCLE ALL THAT APPLY)
Acting . ....... . . 1,
Affiliate or adjunct 2
Visiting3'
Assigned by religious order . . . 4
No, none of the above 0
15. Have you ever achieved tenure at another institution?(PLEASE CIRCLE ONE NUMBER AND SPECIFY THE YEAR TENURE FIRST ACHIEVED, IFAPPLICABLE)
Yes.... . .. . . . . . . . . . 1
(YEAR FIRST ACHIEVED: 19
No2
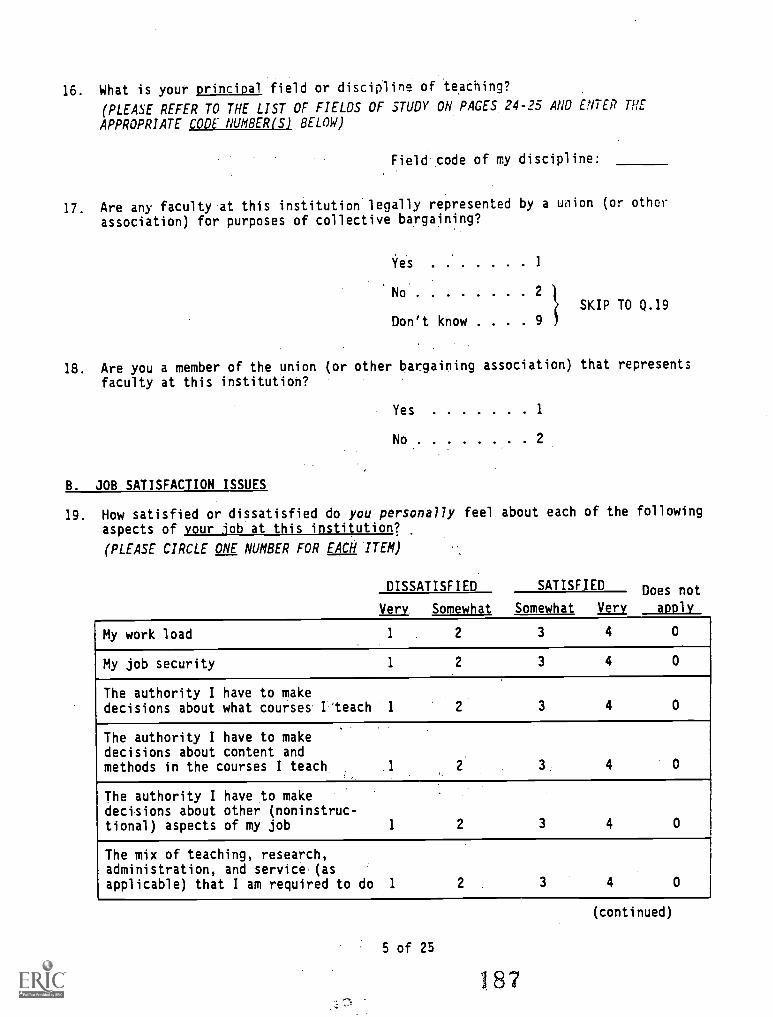
16. What is your principal field or discipline of teaching?
(PLEASE REFER TO THE LIST OF FIELDS OF STUDY ON PAGES 24-25 AND ENTER THE
APPROPRIATE CODE NUMBER(Sl BELOW)
Field ,code of my discipline:
17. Are any faculty at this institution legally represented by a union (or other
association) for purposes of collective bargaining?
Yes 1
No 2
SKIP TO Q.19
Don't know . . . 9
18. Are you a member of the union (or other bargaining association) that represents
faculty at this institution?
Yes 1
No
B. JOB SATISFACTION ISSUES
19. How satisfied or dissatisfied do you personally feel about each of the following
aspects of your job at this institution?
(PLEASE CIRCLE ONE NUMBER FOR EACH ITEM)
DISSATISFIED SATISFIED Does not
Very Somewhat Somewhat Very apply
My work load 1 2 3 4 0
My job security 1 2 3 4 0
The authority I have to makedecisions about what courses I 'teach 1 2 3 4 0
The authority I have to makedecisions about content andmethods in the courses I teach 4 0
The authority I have to makedecisions about other (noninstruc-tional) aspects of my job 1 2 3 4 0
The mix of teaching, research,administration, and service (asapplicable) that I am required to do 1 2 3 4 0
5 of 25
187
(continued)
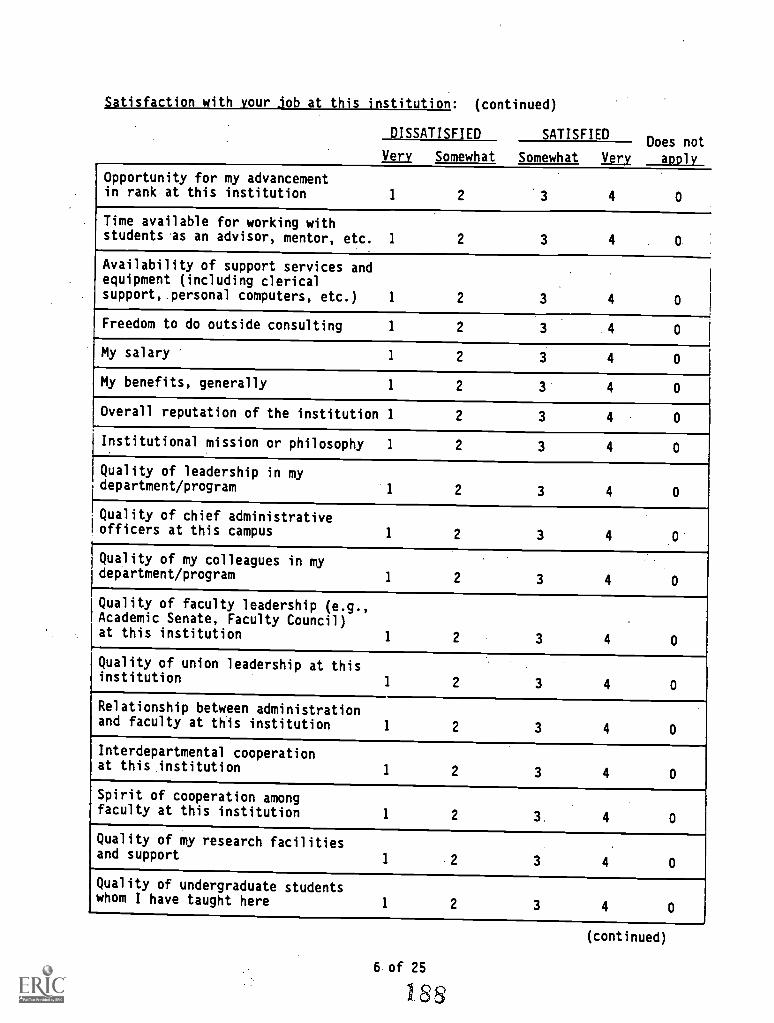
Satisfaction with your lob at this institution: (continued)
DISSATISFIED
Very Somewhat
SATISFIEDDoes not
Somewhat Very apply
Opportunity for my advancementin rank at this institution 1 2 '3 4 0
Time available for working withstudents as an advisor, mentor, etc. 1 2 3 4
Availability of support services andequipment (including clericalsupport,. personal computers, etc.) 1 2
.
3 4 0
Freedom to do outside consulting 1 2 3 4 0
My salary 1 2 3 4 0
My benefits, generally 1 2 3 4 0
Overall reputation of the institution 1 2 3 4 0
Institutional mission or philosophy 1 2 3 4 0
Quality of leadership in mydepartment/program 1 2 3 4 0
Quality of chief administrativeofficers at this campus 1 2 3 4
Quality of my colleagues in mydepartment/program 1 2 3 4
Quality of faculty leadership (e.g.,Academic Senate, Faculty Council)at this institution
1 2 3 4 0
Quality of union leadership at thisinstitution
1 2 3 4 0
Relationship between administrationand faculty at this institution 1 2 3 4 0
Interdepartmental cooperationat this institution
1 2 3 4 0
Spirit of cooperation amongfaculty at this institution
1 2 3. 4 0
Quality of my research facilitiesand support
1 2 3 4 0
Quality of undergraduate studentswhom I have taught here
1 2 3 4 0
(continued)
6.of 25
I SS
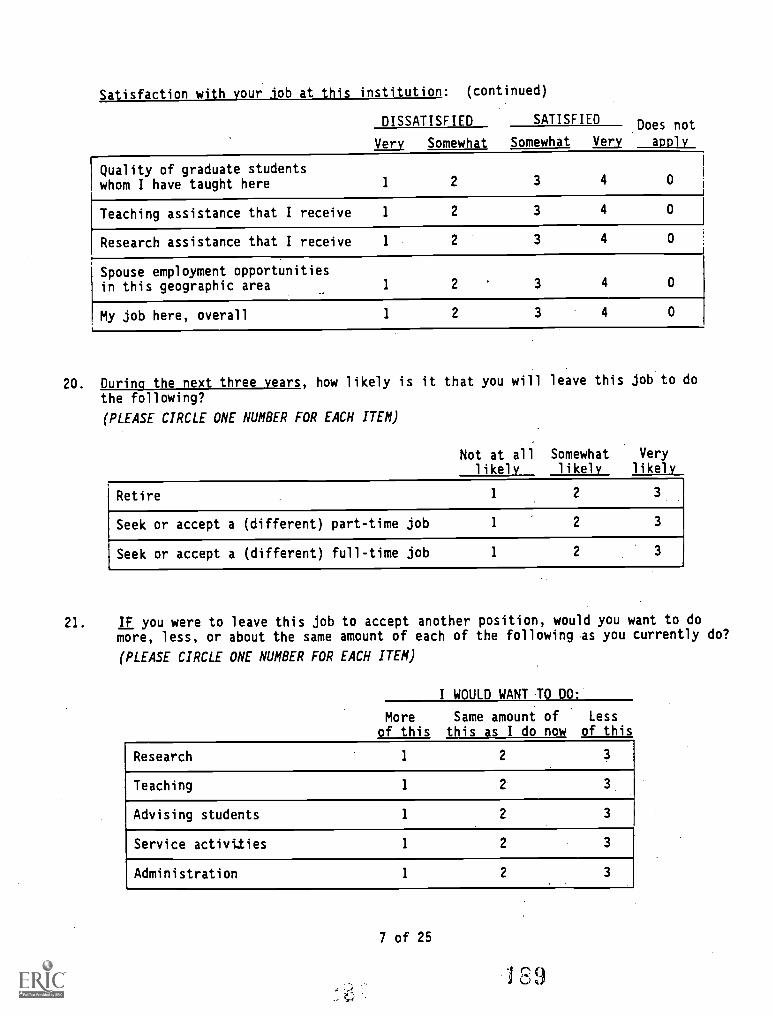
Satisfaction with your lob at this institution: (continued)
DISSATISFIED SATISFIED
Very Somewhat Somewhat Very
Does not
apply
Quality of graduate studentswhom I have taught here 1 2 3 4 0
Teaching assistance that I receive 1 2 3 4 0
Research assistance that I receive 1 2 3 4 0
Spouse employment opportunitiesin this geographic area 1 2 3 4 0
My job here, overall 1 2 3 4 0
20. During the next three years, how likely is it that you will leave this job to do
the following?
(PLEASE CIRCLE ONE NUMBER FOR EACH ITEM)
Not at all Somewhat Very
likely likely likely
Retire 1 2
Seek or accept a (different) part-time job 1 2 3
Seek or accept a (different) full-time job 2 3
21. IF you were to leave this job to accept another position, would you want to domore, less, or about the same amount of each of the following as you currently do?
(PLEASE CIRCLE ONE NUMBER FOR EACH ITEM)
I WOULD WANT TO DO:
More Same amount of Less
of this this as I do now of this
Research 1 2
Teaching 1 2 3.
Advising students 1 2 3
Service activities 1 2 3
Administration 1 2 3
7 of 25
,0
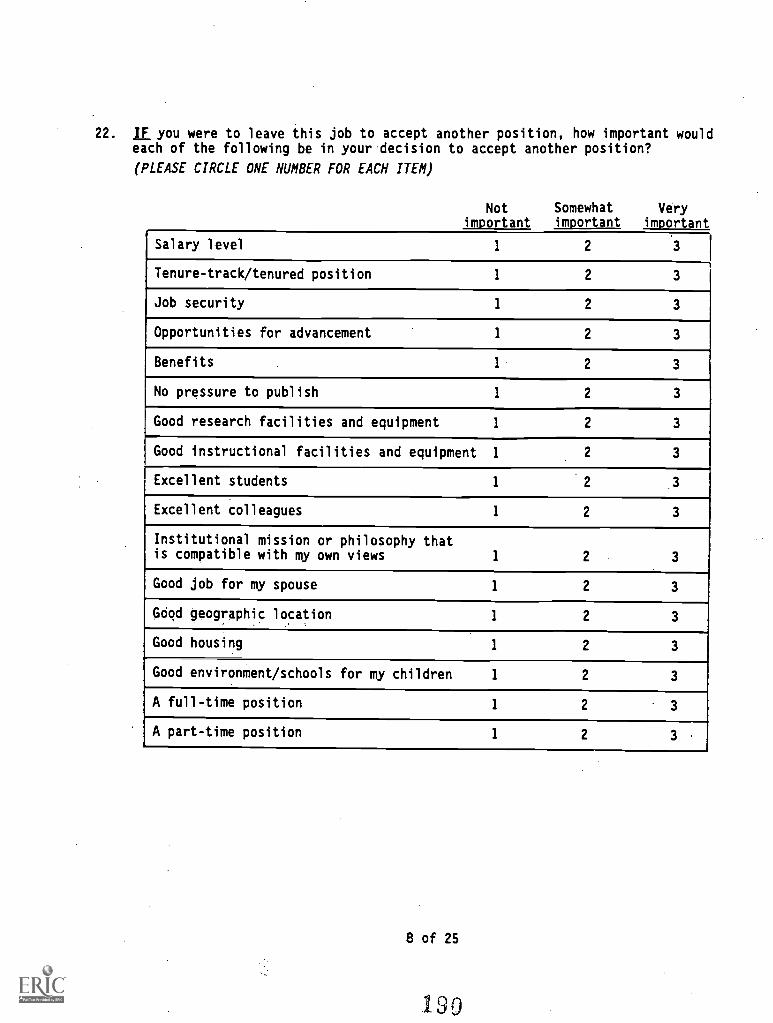
22. I.E. you were to leave this job to accept another position, how important wouldeach of the following be in your decision to accept another position?
(PLEASE CIRCLE ONE NUMBER FOR EACH ITEM)
Not Somewhat Veryimportant important important
Salary level 1 2 3
Tenure-track/tenured position 1 2 3
Job security 1 2 3
Opportunities for advancement 1 2 3
Benefits 1 2 3
No pressure to publish 1 2 3
Good research facilities and equipment 1 2 3
Good instructional facilities and equipment 1 2 3
Excellent students 1 '2 3
Excellent colleagues 1 2 3
Institutional mission or philosophy thatis compatible with my own views 1 2 3
Good job for my spouse 1 2 3
Good geographic location 1 2 3
Good housing 1 2 3
Good environment/schools for my children 1 2 3
A full-time position 1 2 3
A part-time position 1 2 3
8 of 25
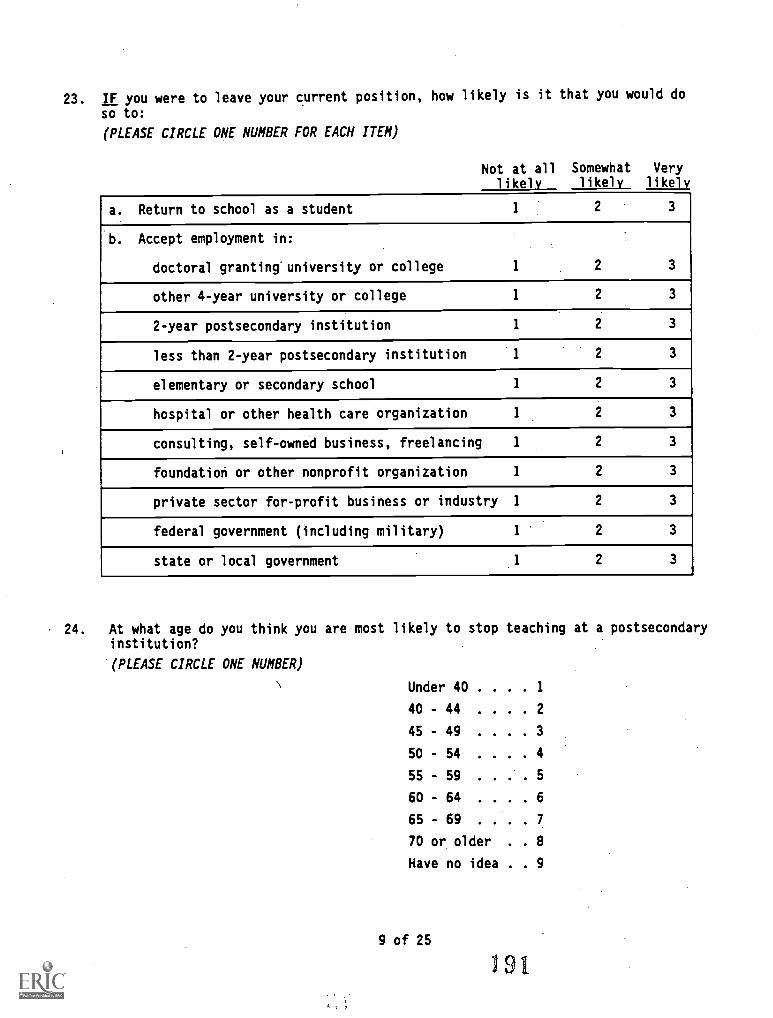
23. IF you were to leave your current position, how likely is it that you would do
so to:
(PLEASE CIRCLE ONE NUMBER FOR EACH ITEM)
Not at all Somewhat Verylikely likely likely
a. Return to school as a student 1 2 3
b. Accept employment in:
doctoral granting'university or college 1 2 3
other 4-year university or college 1 2 3
2-year postsecondary institution 1 2 3
less than 2-year postsecondary institution 1 2 3
elementary or secondary school 1 2 3
hospital or other health care organization 1 2 3
consulting, self-owned business, freelancing 1 2 3
foundation or other nonprofit organization 1 2 3
private sector for-profit business or industry 1 2 3
federal government (including military) 1 2 3
state or local government 1 2 3
24. At what age do you think you are most likely to stop teaching at a postsecondaryinstitution?
(PLEASE CIRCLE ONE NUMBER)
Under 40 . . . . 1
40 - 44 . . . . 2
45 - 49 . . . . 3
50 - 54 . . . . 4
55 - 59 . . . . 5
60 - 64 . . . 6
65 - 69 . . . . 7
70 or older . . 8
Have no idea . . 9
9 of 25
191.
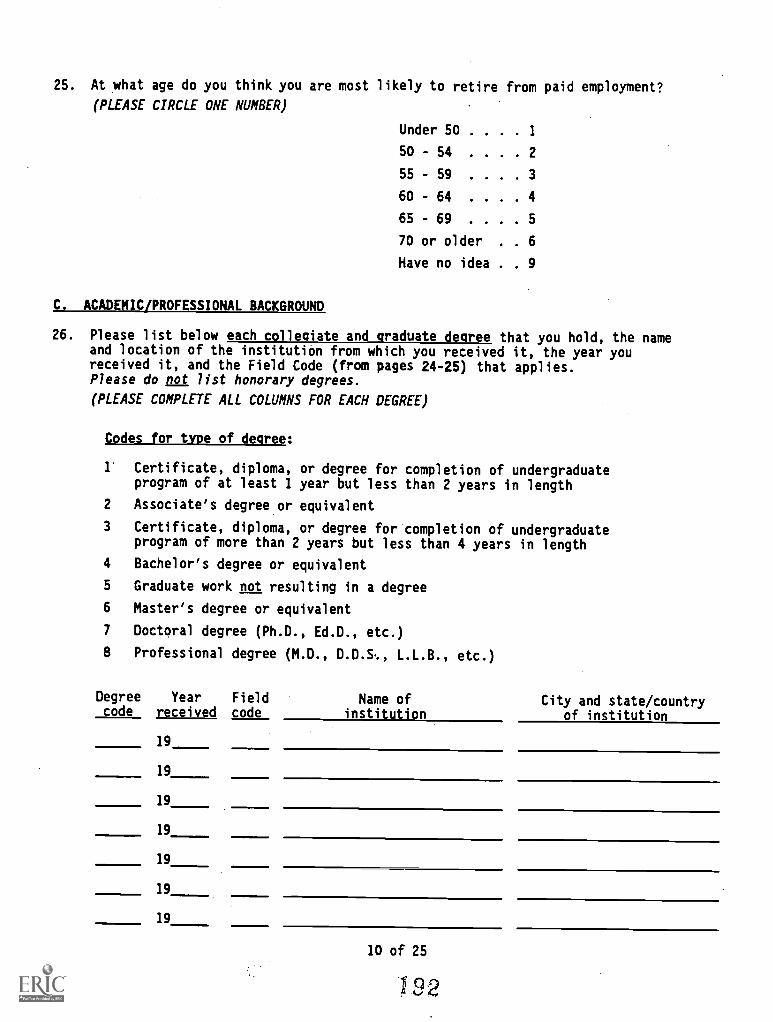
25. At what age do you think you are most likely to retire from paid employment?
(PLEASE CIRCLE ONE NUMBER)
Under 50 . . . . 1
50 - 54 . . . . 2
55 - 59 . . . .3
60 - 64 . . . . 4
65 - 69 . . . . 5
70 or older . . 6
Have no idea . . 9
C. ACADEMIC/PROFESSIONAL BACKGROUND
26. Please list below each collegiate and graduate degree that you hold, the nameand location of the institution from which you received it, the year youreceived it, and the Field Code (from pages 24-25) that applies.Please do Dot list honorary degrees.
(PLEASE COMPLETE ALL COLUMNS FOR EACH DEGREE)
Codes for type of degree:
1' Certificate, diploma, or degree for completion of undergraduateprogram of at least 1 year but less than 2 years in length
2 Associate's degree or equivalent
3 Certificate, diploma, or degree for completion of undergraduateprogram of more than 2 years but less than 4 years in length
4 Bachelor's degree or equivalent
5 Graduate work not resulting in a degree
6 Master's degree or equivalent
7 Doctoral degree (Ph.D., Ed.D., etc.)
8 Professional degree (M.D., D.D.S., L.L.B., etc.)
Degree Year Fieldcode received code
19
19
19
19
19
19
19
Name ofinstitution
10 of 25
92
City and state/countryof institution
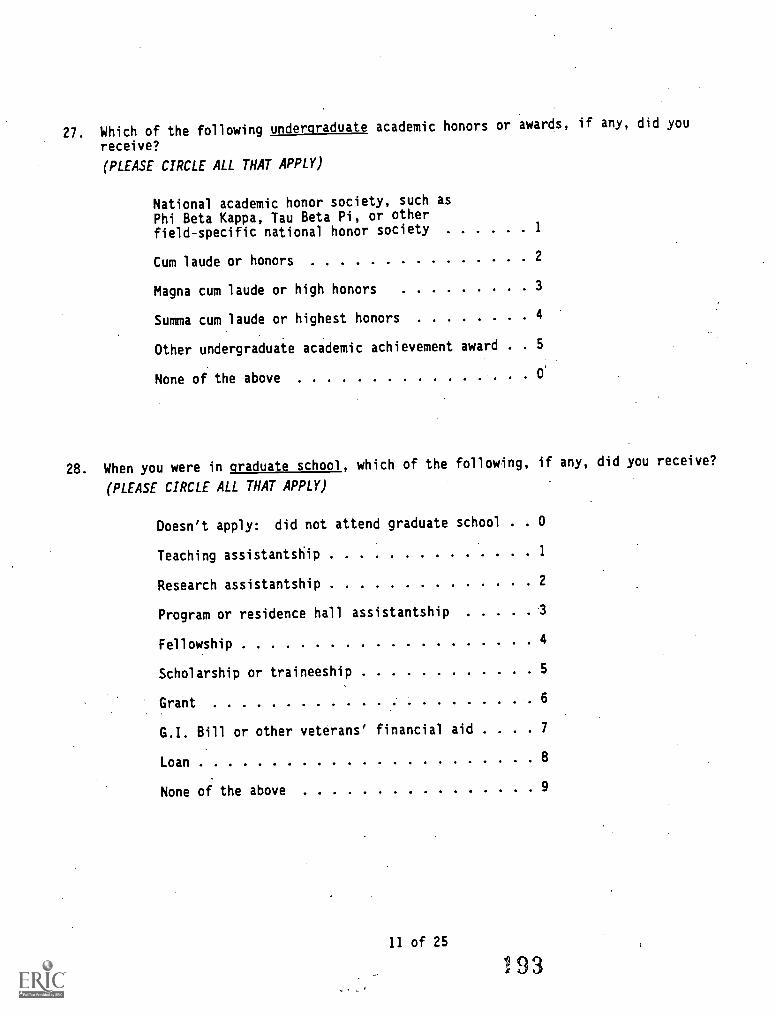
27. Which of the following undergraduate academic honors or awards, if any, did you
receive?
(PLEASE CIRCLE ALL THAT APPLY)
National academic honor society, such as
Phi Beta Kappa, Tau Beta Pi, or other
field-specific national honor society
Cum laude or honors 2
Magna cum laude or high honors 3
Summa cum laude or highest honors 4
Other undergraduate academic achievement award . 5
None of the above 0'
28. When you were in graduate school, which of the following, if any, did you receive?
(PLEASE CIRCLE ALL THAT APPLY)
Doesn't apply: did not attend graduate school . 0
Teaching assistantship
Research assistantship 2
Program or residence hall assistantship
Fellowship 4
Scholarship or traineeship 5
Grant 6
G.I. Bill or other veterans' financial aid . . . 7
Loan 8
None of the above 9
11 of 25
193
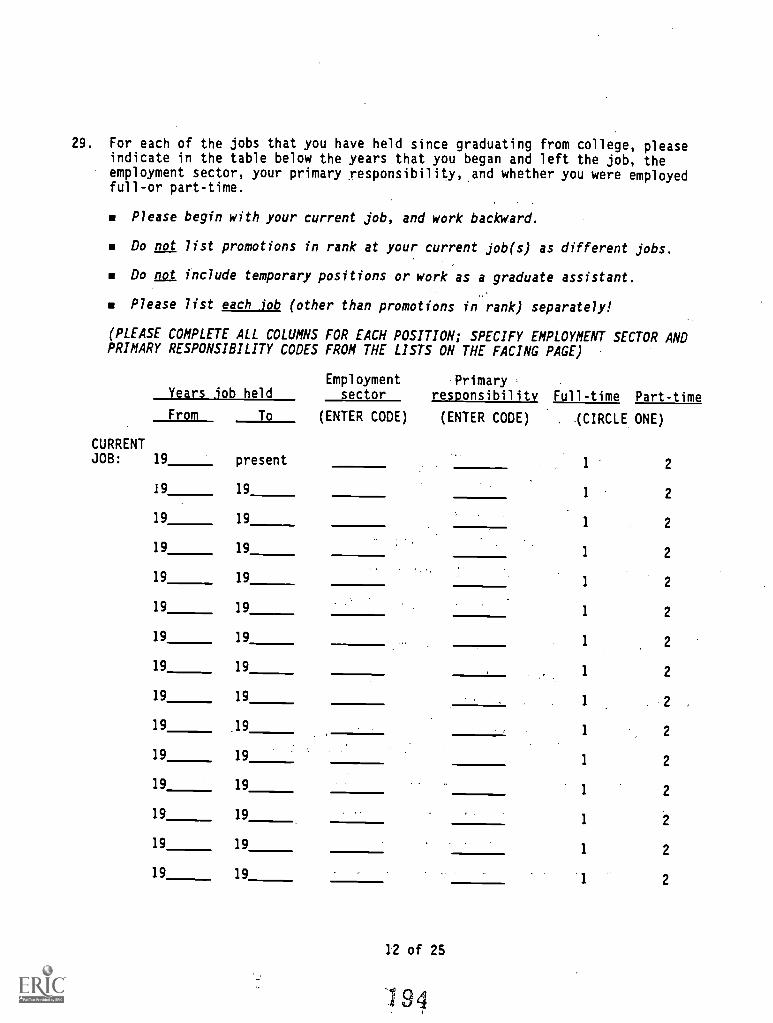
29. For each of the jobs that you have held since graduating from college, pleaseindicate in the table below the years that you began and left the job, theemployment sector, your primary responsibility, and whether you were employedfull-or part-time.
Please begin with your current job, and work backward.
Do not list promotions in rank at your current job(s) as different jobs.
Do not include temporary positions or work as a graduate assistant.
Please list each job (other than promotions in rank) separately!
(PLEASE COMPLETE ALL COLUMNS FOR EACH POSITION; SPECIFY EMPLOYMENT SECTOR ANDPRIMARY RESPONSIBILITY CODES FROM THE LISTS ON THE FACING PAGE)
Employment PrimaryYears lob held sector responsibility Full-time Part-time
From To (ENTER CODE) (ENTER CODE). (CIRCLE ONE)
CURRENTJOB: 19 present 1 2
19 191 2
19 191 2
19 19 1 2
19 19 1 2
19 19 1 2
19 19 1 2
19 191 2
19 191 2
19 191 2
19 191 2
19 191 2
19 191 2
19 191 2
19 191 2
12 of 25
X94
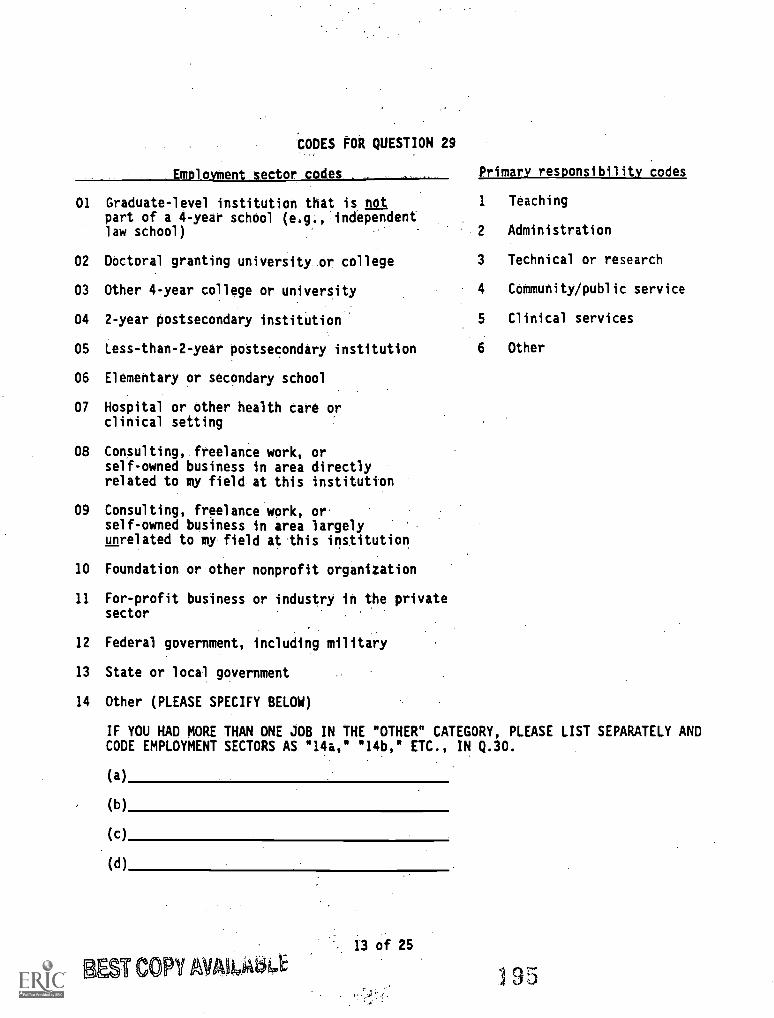
CODES FOR QUESTION 29
Em lo ent ector codes Primary responsibility codes
01 Graduate-level institution that is ngpart of a 4-year school (e,g;,Andependentlaw school)
1 Teaching
2 Administration
02 Doctoral granting university_or college 3 Technical or research
03 Other 4-year college or university 4 CoMmunity/public service
04 2-year postsecondary institution 5 Clinical services
05 Less-than-2-year postsecondary institution 6 Other
06 Elementary or secondary school
07 Hospital or other health care orclinical setting
08 Consulting,'.freelance work, orself-owned business in area directlyrelated to my field at this institution
09 Consulting, freelance work, or.self-owned business in area largelyunrelated to my field at 'this institution
10 Foundation or other nonprofit organization
11 For-profit business or industry in the privatesector
12 Federal government, including military
13 State or local government
14 Other (PLEASE SPECIFY BELOW)
IF YOU HAD MORE THAN ONE JOB IN THE "OTHER" CATEGORY, PLEASE LIST SEPARATELY ANDCODE EMPLOYMENT SECTORS AS "14a," "14b," ETC., IN Q.30.
(a)
(b)
(c)
(d)
13 of 25
12 COPY AVAO,A6i,E 95
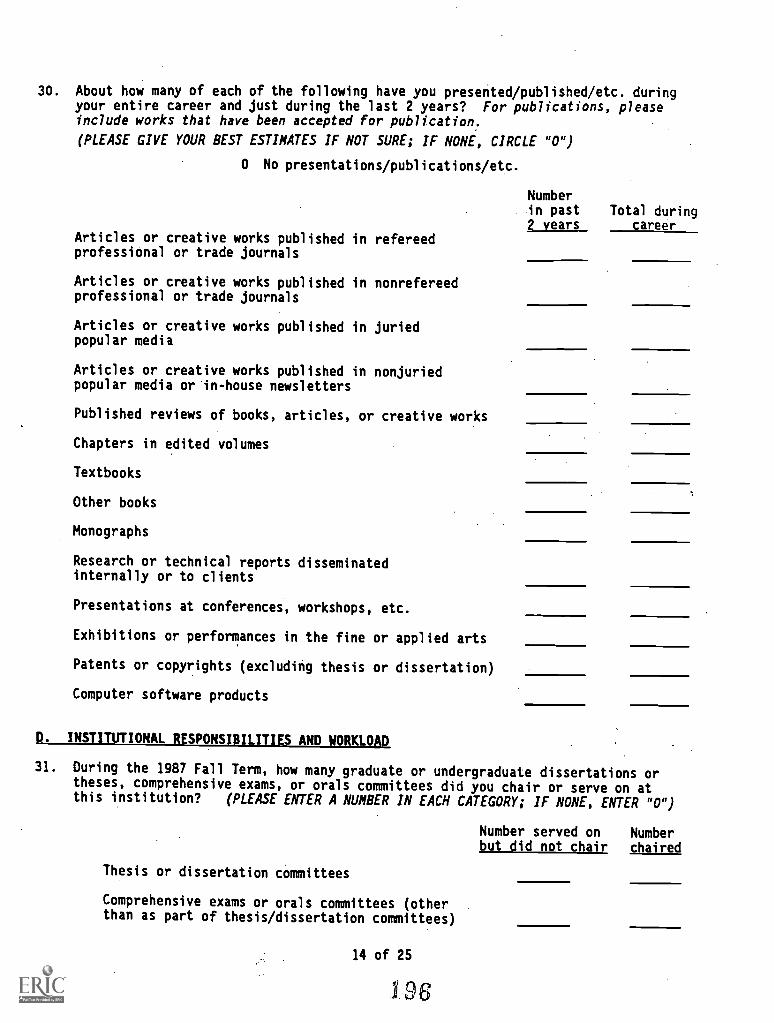
30. About how many of each of the following have you presented/published/etc. duringyour entire career and just during the last 2 years? For publications, pleaseinclude works that have been accepted for publication.
(PLEASE GIVE YOUR BEST ESTIMATES IF NOT SURE; IF NONE, CIRCLE "0")
0 No presentations/publications/etc.
Articles or creative works published in refereedprofessional or trade journals
Articles or creative works published in nonrefereedprofessional or trade journals
Articles or creative works published in juriedpopular media
Articles or creative works published in nonjuriedpopular media or in-house newsletters
Published reviews of books, articles, or creative works
Chapters in edited volumes
Textbooks
Other books
Monographs
Research or technical reports disseminatedinternally or to clients
Presentations at conferences, workshops, etc.
Exhibitions or performances in the fine or applied arts
Patents or copyrights (excluding thesis or dissertation)
Computer software products
Numberin past Total during2 years career
p. INSTITUTIONAL RESPONSIBILITIES AND WORKLOAD
31. During the 1987 Fall Term, how many graduate or undergraduate dissertations ortheses, comprehensive exams, or orals committees did you chair or serve on atthis institution? (PLEASE ENTER A NUMBER IN EACH CATEGORY; IF NONE, ENTER "0")
Thesis or dissertation committees
Comprehensive exams or orals committees (otherthan as part of thesis/dissertation committees)
14 of 25
196
Number served on Numberbut did not chair chaired
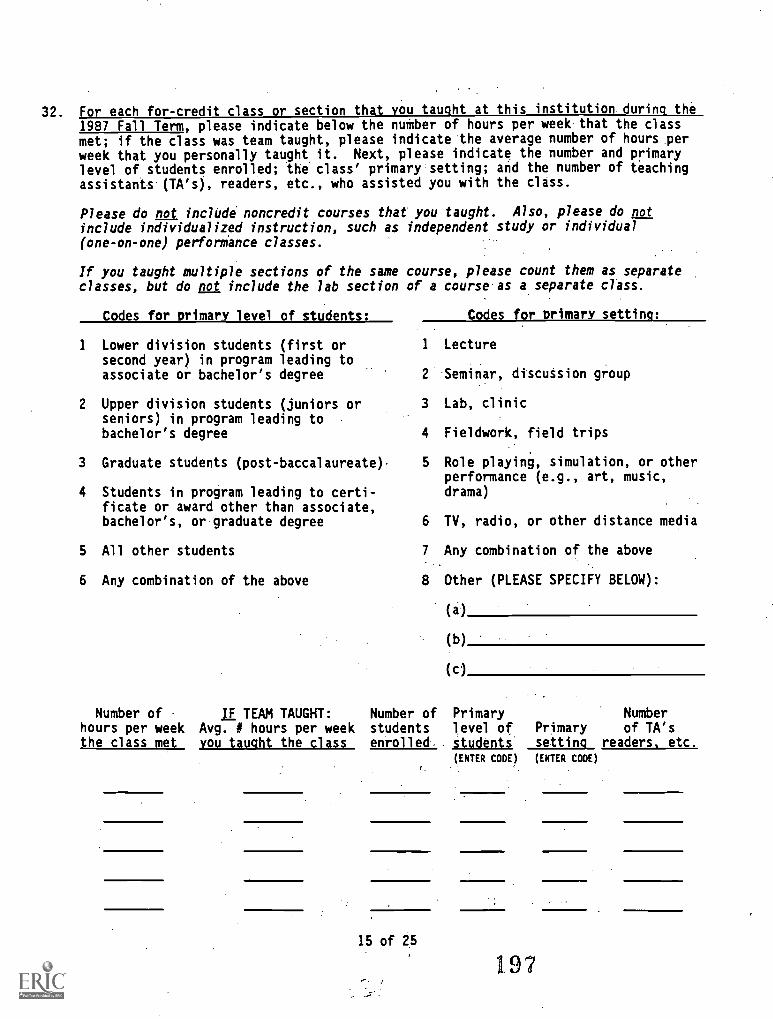
32. For each for-credit class or section that you taught at this institution during the1987 Fall Term, please indicate below the nuMber of hours per week that the classmet; if the class was team taught, please indicate the average number of hours perweek that you personally taught it. Next, please indicate the number and primarylevel of students enrolled; the class' primary setting; and the number of teachingassistants (TA's), readers, etc., who assisted you with the class.
Please do not include noncredit courses that you taught. Also, please do notinclude individualized instruction, such as independent study or individual(one-on-one) perforiance classes.
If you taught multiple sections of the same course, please count them as separateclasses, but do not include the lab section of a course as a separate class.
Codes for Drimary level of students:
1 Lower division students (first orsecond year) in program leading toassociate or bachelor's degree
2 Upper division students (juniors orseniors) in program leading tobachelor's degree
3 Graduate students (post-baccalaureate)
4 Students in program leading to certi-ficate or award other than associate,bachelor's, or graduate degree
5 All other students
6 Any combination of the above
Codes for primary setting:.
1 Lecture
2 Seminar, discussion group
3 Lab, clinic
4 Fieldwork, field trips
5 Role playing, simulation, or otherperformance (e.g., art, music,drama)
6 TV, radio, or other distance media
7 Any combination of the above
8 Other (PLEASE SPECIFY BELOW):
(a)
(b)
(c)
Number of IE TEAM TAUGHT: Number of Primary Numberhours per week Avg. # hours per week students level of Primary of TA'sthe class met you taught the class enrolled. students setting readers. etc.
(ENTER CODE) (ENTER CODE)
15 of 25
197
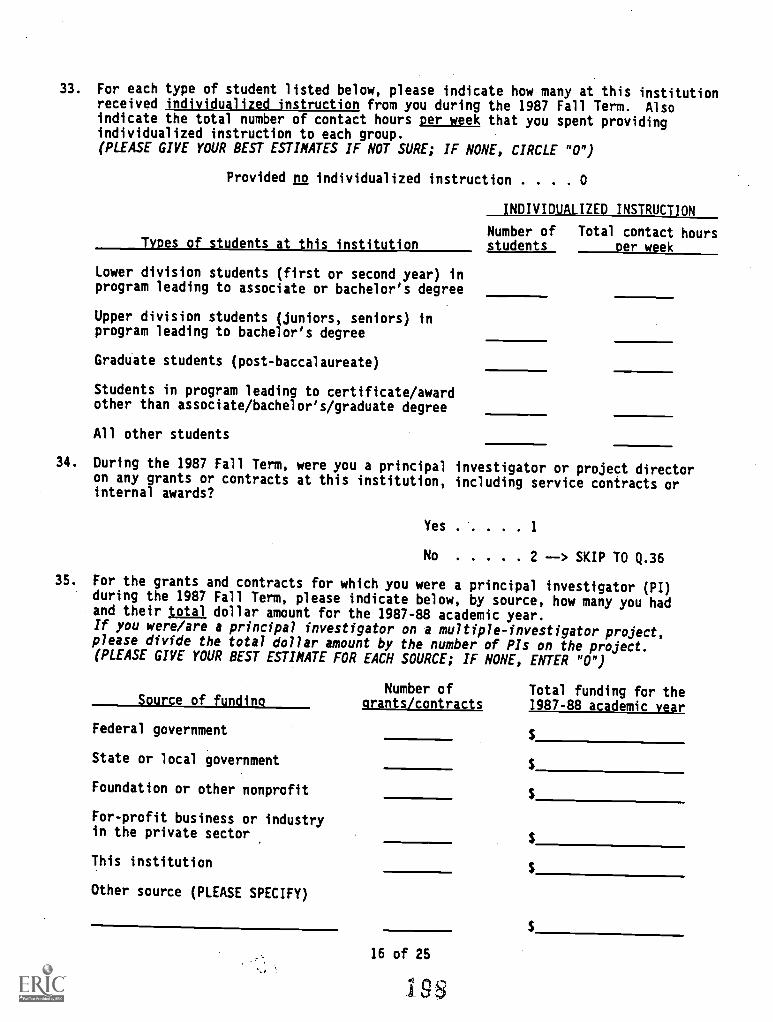
33. For each type of student listed below, please indicate how many at this institutionreceived individualized instruction from you during the 1987 Fall Term. Alsoindicate the total number of contact hours per week that you spent providingindividualized instruction to each group.(PLEASE GIVE YOUR BEST ESTIMATES IF NOT SURE; IF NONE, CIRCLE "0")
Provided no individualized instruction . . . . 0
Types of students at this institution
Lower division students (first or second year) inprogram leading to associate or bachelor's degree
Upper division students (juniors, seniors) inprogram leading to bachelor's degree
Graduate students (post-baccalaureate)
Students in program leading to certificate/awardother than associate/bachelor's/graduate degree
All other students
INDIVIDUALIZED INSTRUCTION
Number of Total contact hoursstudents per week
34. During the 1987 Fall Term, were you a principal investigator or project directoron any grants or contracts at this institution, including service contracts orinternal awards?
Yes 1
No 2 --> SKIP TO Q.36
35. For the grants and contracts for which you were a principal investigator (PI)during the 1987 Fall Term, please indicate below, by source, how many you hadand their total dollar amount for the 1987-88 academic year.If you were/are a principal investigator on a multiple-investigator project,please divide the total dollar amount by the number of PIs on the project.(PLEASE GIVE YOUR BEST ESTIMATE FOR EACH SOURCE; IF NONE, ENTER "0")
Source of fundingNumber of Total funding for the
grants/contracts 1987-88 academic year
Federal government $
State or local government
Foundation or other nonprofit$
For-profit business or industryin the private sector
$
This institution$
Other source (PLEASE SPECIFY)
16 of 25
198
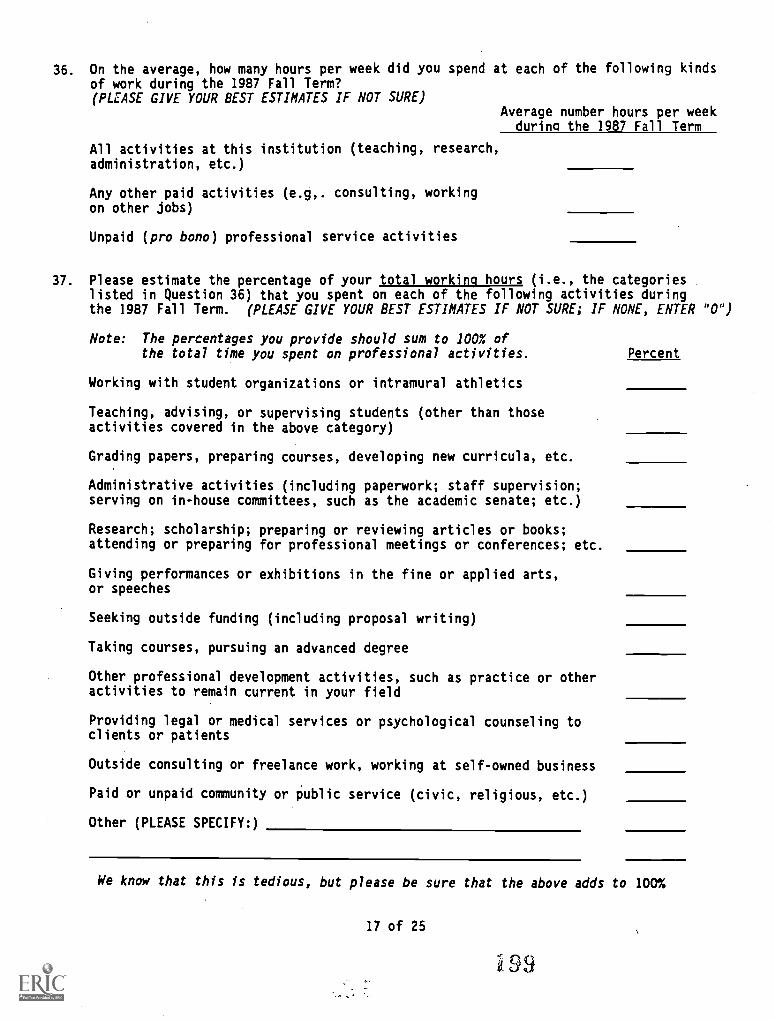
36. On the average, how many hours per week did you spend at each of the following kindsof work during the 1987 Fall Term?(PLEASE GIVE YOUR BEST ESTIMATES IF NOT SURE)
All activities at this institution (teaching, research,administration, etc.)
Any other paid activities (e . consulting, workingon other jobs)
Unpaid (pro bono) professional service activities
Average number hours per weekduring the 1987 Fall Term
37. Please estimate the percentage of your total working hours (i.e., the categorieslisted in Question 36) that you spent on each of the following activities duringthe 1987 Fall Term. (PLEASE GIVE YOUR BEST ESTIMATES IF NOT SURE; IF NONE, ENTER "0")
Note: The percentages you provide should sum to 100% ofthe total time you spent on professional activities. Percent
Working with student organizations or intramural athletics
Teaching, advising, or supervising students (other than thoseactivities covered in the above category)
Grading papers, preparing courses, developing new curricula, etc.
Administrative activities (including paperwork; staff supervision;serving on in-house committees, such as the academic senate; etc.)
Research; scholarship; preparing or reviewing articles or books;attending or preparing for professional meetings or conferences; etc.
Giving performances or exhibitions in the fine or applied arts,or speeches
Seeking outside funding (including proposal writing)
Taking courses, pursuing an advanced degree
Other professional development activities, such as practice or otheractivities to remain current in your field
Providing legal or medical services or psychological counseling toclients or patients
Outside consulting or freelance work, working at self-owned business
Paid or unpaid community or public service (civic, religious, etc.)
Other (PLEASE SPECIFY:)
We know that this is tedious, but please be sure that the above adds to 100%
17 of 25
99
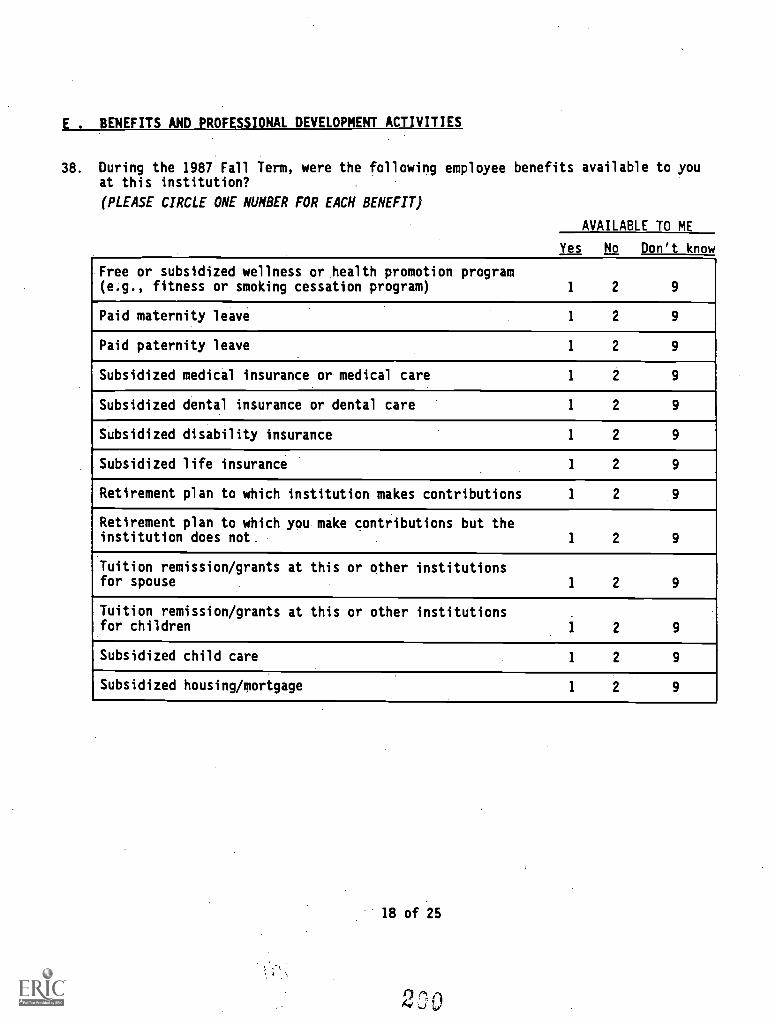
g . BENEFITS AND PROFESSIONAL DEVELOPMENT ACTIVITIES
38. During the 1987 Fall Term, were the following employee benefits available to youat this institution?
(PLEASE CIRCLE ONE NUMBER FOR EACH BENEFIT)
AVAILABLE TO ME
Yes No Don't know
Free or subsidized wellness or health promotion program(e.g., fitness or smoking cessation program) 1 2 9
Paid maternity leave 1 2 9
Paid paternity leave 1 2 9
Subsidized medical insurance or medical care 1 2 9
Subsidized dental insurance or dental care 1 2 9
Subsidized disability insurance 1 2 9
Subsidized life insurance 1 2 9
Retirement plan to which institution makes contributions 1 2
Retirement plan to which you make contributions but theinstitution does not. 1 2 9
Tuition remission/grants at this or other institutionsfor spouse 1 2 9
Tuition remission/grants at this or other institutionsfor children 1 2 9
Subsidized child care 1 2 9
Subsidized housing/mortgage 1 2 9
18 of 25
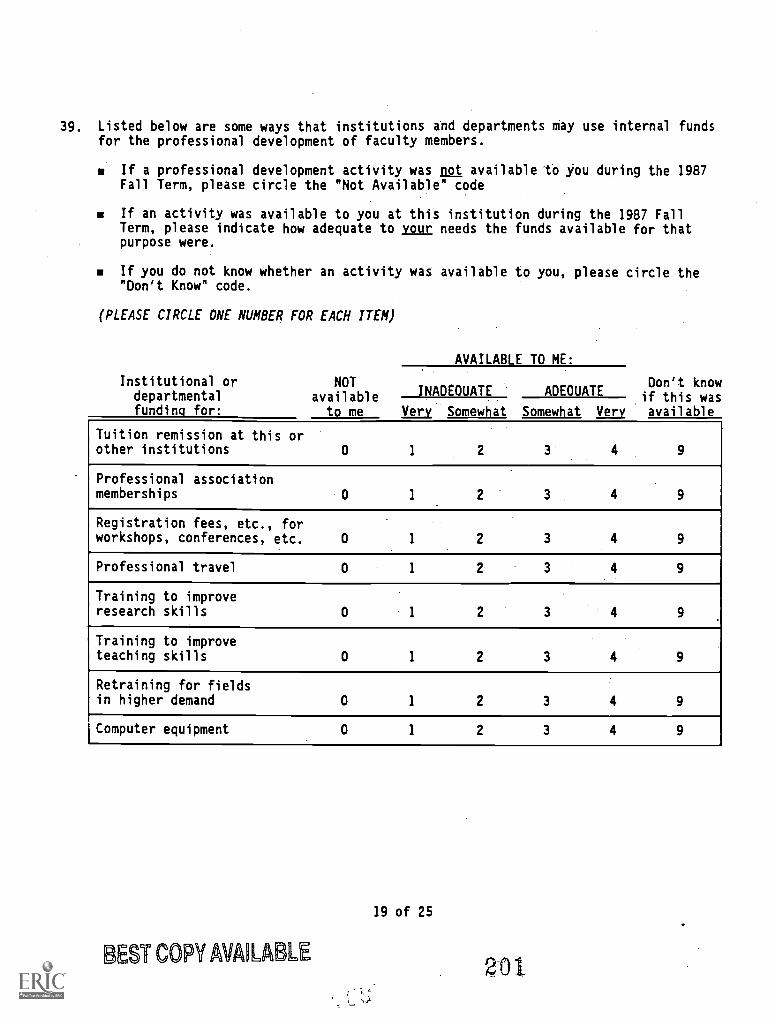
39. Listed below are some ways that institutions and departments may use internal fundsfor the professional development of faculty members.
m If a professional development activity was not available 'to you during the 1987Fall Term, please circle the "Not Available" code
If an activity was available to you at this institution during the 1987 FallTerm, please indicate how adequate to your needs the funds available for thatpurpose were.
If you do not know whether an activity was available to you, please circle the"Don't Know" code.
(PLEASE CIRCLE ONE NUMBER FOR EACH ITEM)
Institutional ordepartmentalfunding for:
AVAILABLE TO ME:
NOTavailable INADEQUATE ADEOUATE
to me Very Somewhat Somewhat Very
Don't knowif this wasavailable
Tuition remission at this orother institutions 0 1 2 3 4 9
Professional associationmemberships 0 1 2 3 4
Registration fees, etc., forworkshops, conferences, etc. 0 1 2 3 4 9
Professional travel 0 1 2 3 4 9
Training to improveresearch skills 0 1 2 3 4 9
Training to improveteaching skills 0 1 2 3 4 9
Retraining for fieldsin higher demand 0 1 2 3 4 9
Computer equipment 0 1 2 3 4 9
19 of 25
BEST COPY MAKABLE 201
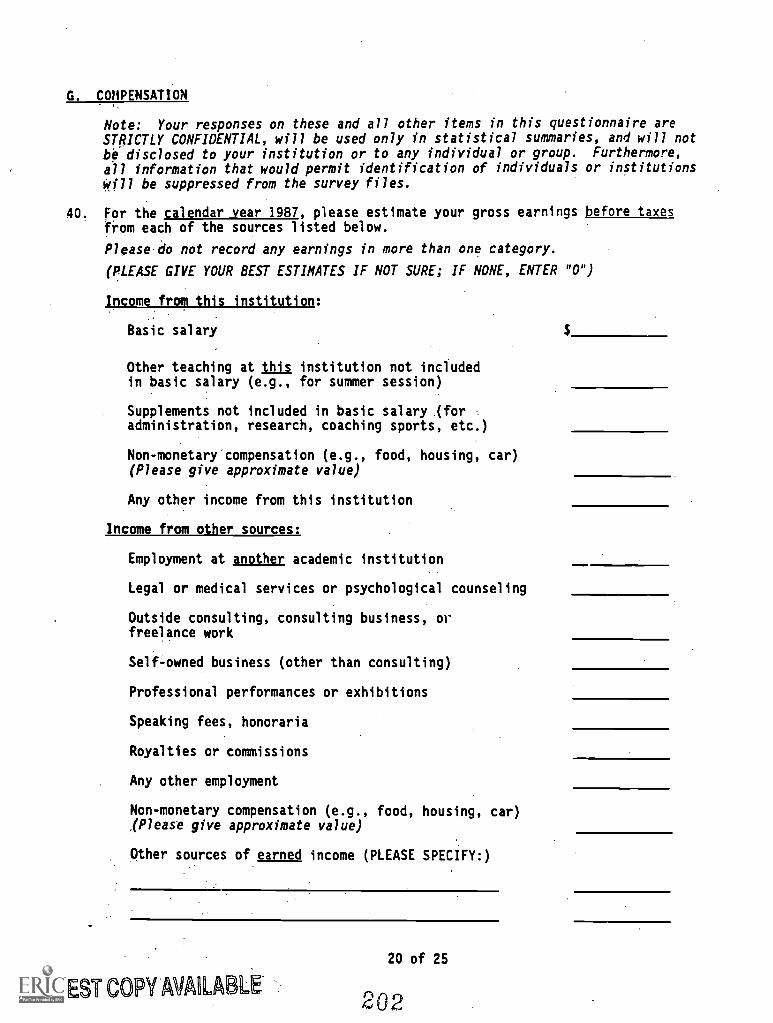
G. COP$PENSATION
Note: Your responses on these and all other items in this questionnaire areSTRICTLY CONFIDENTIAL, will be used only in statistical summaries, and will notbe disclosed to your institution or to any individual or group. Furthermore,
all information that would permit identification of individuals or institutionswill be suppressed from the survey files.
40. For the calendar year 1987, please estimate your gross earnings before taxesfi-om each of the sources listed below.
Please do not record any earnings in more than one category.
(PLEASE GIVE YOUR BEST ESTIMATES IF NOT SURE; IF NONE, ENTER "0")
Income from this institution:
Basic salary
Other teaching at this institution not includedin basic salary (e.g., for summer session)
Supplements not included in basic salary (foradministration, research, coaching sports, etc.)
Non-monetary"compensation (e.g., food, housing, car)(Please give approximate value)
Any other income from this institution
Income from other sources:
Employment at another academic institution
Legal or medical services or psychological counseling
Outside consulting, consulting business, orfreelance work
Self-owned business (other than consulting)
Professional performances or exhibitions
Speaking fees, honoraria
Royalties or commissions
Any other employment
Non-monetary compensation (e.g., food, housing, car)1Please give approximate value)
Other sources of earned income (PLEASE SPECIFY:)
EST COPY AVAILABLE
20 of 25
202
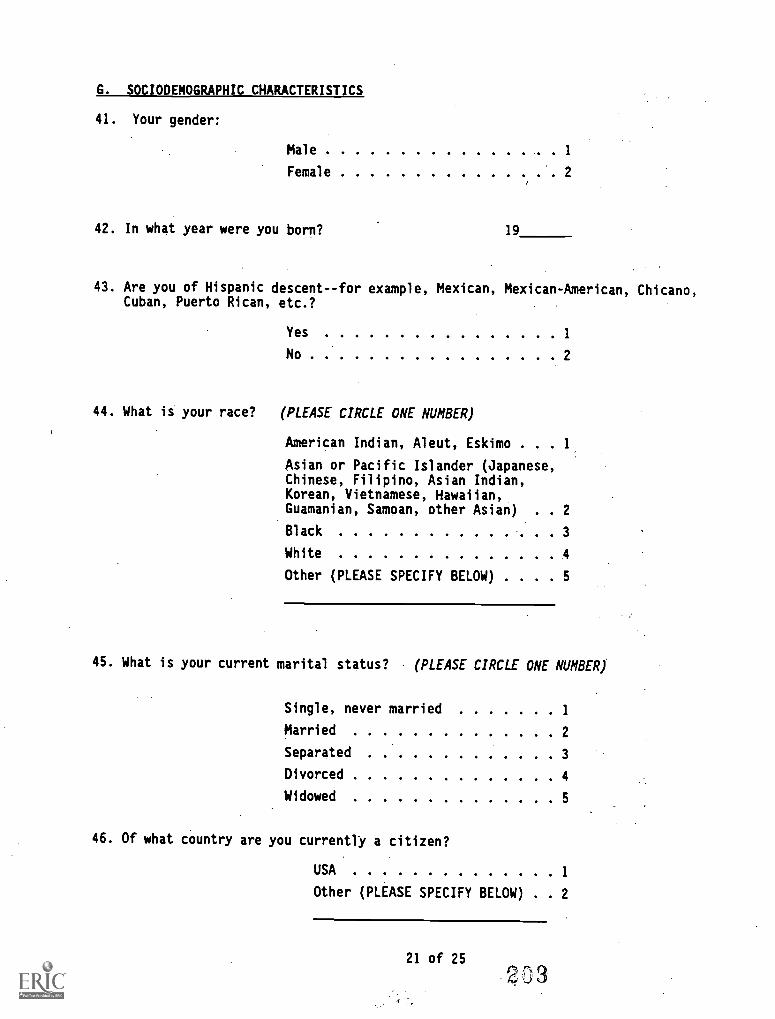
G. SOCIODEMOGRAPHIC CHARACTERISTICS
41. Your gender:
Male
Female
42. In what year were you born? 19
43. Are you of Hispanic descent--for example, Mexican, Mexican-American, Chicano,Cuban, Puerto Rican, etc.?
Yes 1
No 2
44. What is your race? (PLEASE CIRCLE ONE NUMBER)
American Indian, Aleut, Eskimo . . . 1
Asian or Pacific Islander (Japanese,Chinese, Filipino, Asian Indian,Korean, Vietnamese, Hawaiian,Guamanian, Samoan, other Asian) . 2
Black 3
White 4
Other (PLEASE SPECIFY BELOW) . . . 5
45. What is your current marital status? (PLEASE CIRCLE ONE NUMBER)
Single, never married 1
Married 2
Separated 3
Divorced 4
Widowed 5
46. Of what country are you currently a citizen?
USA 1
Other (PLEASE SPECIFY BELOW) . 2
21 of 25
D'3
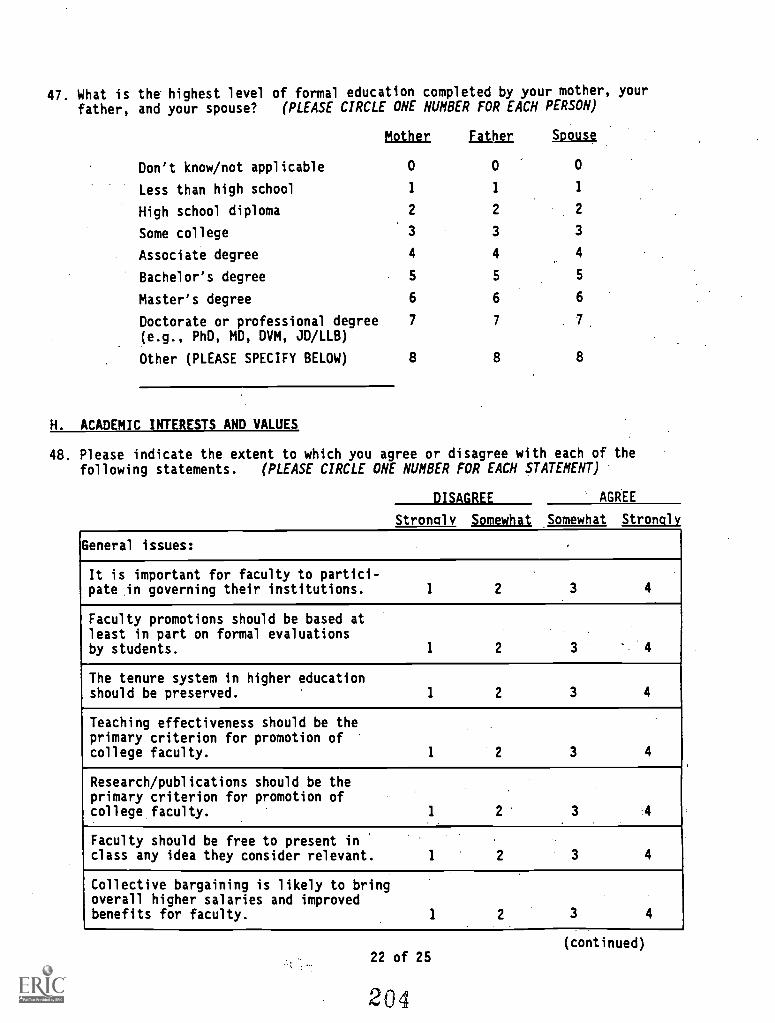
47. What is the highest level of formal education completed by your mother, your
father, and your spouse? (PLEASE CIRCLE ONE NUMBER FOR EACH PERSON)
Mother father Spouse
Don't know/not applicable 0 0 0
Less than high school 1 1 1
High school diploma 2 2 2
Some college 3 3 3
Associate degree 4 4 4
Bachelor's degree 5 5 5
Master's degree 6 6 6
Doctorate or professional degree(e.g., PhD, MD, DVM, JD/LLB)
7 7 7
Other (PLEASE SPECIFY BELOW) 8 8 8
H. ACADEMIC INTERESTS AND VALUES
48. Please indicate the extent to which you agree or disagree with each of thefollowing statements. (PLEASE CIRCLE ONE NUMBER FOR EACH STATEMENT)
DISAGREE AGREE
Strongly Somewhat Somewhat Strongly
General issues:
It is important for faculty to partici-pate in governing their institutions. 1 2 3 4
Faculty promotions should be based atleast in part on formal evaluationsby students. 1 2 3
The tenure system in higher educationshould be preserved. 1 2 3 4
Teaching effectiveness should be theprimary criterion for promotion ofcollege faculty. 1 2 3 4
Research/publications should be theprimary criterion for promotion ofcollege faculty. 1 2 3 4
Faculty should be free to present inclass any idea they consider relevant. 1 2 3 4
Collective bargaining is likely to bringoverall higher salaries and improvedbenefits for faculty. 1 2 3
22 of 25
204
(continued)
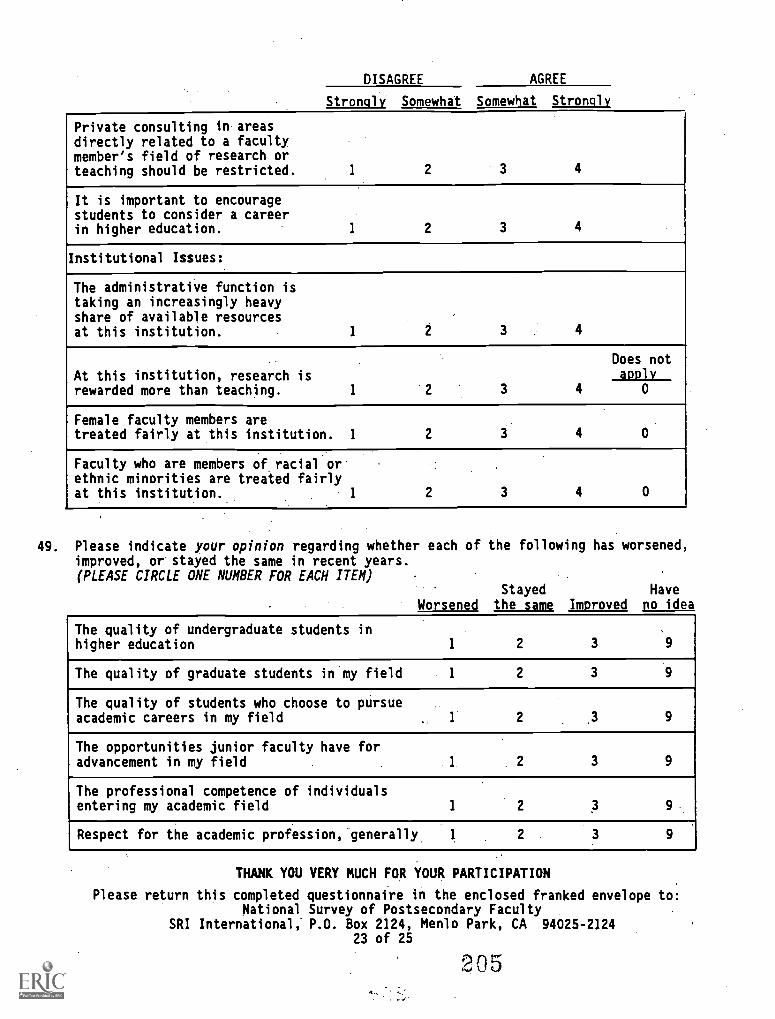
DISAGREE AGREE
Strongly Somewhat Somewhat Strongly
Private consulting in areasdirectly related to a facultymember's field of research orteaching should be restricted. 1 2 3 4
It is important to encouragestudents to consider a careerin higher education. 1 2 3 4
Institutional Issues:
The administrative function istaking an increasingly heavyshare of available resourcesat this institution. 1 2 3 4
At this institution, research isrewarded more than teaching. 1 2 3 4
Does notapply
0
Female faculty members aretreated fairly at this institution. 1 2 3 4 0
Faculty who are members of racial orethnic minorities are treated fairlyat this institution. 1 2 3 4 0
49. Please indicate your opinion regarding whether each of the following has worsened,improved, or-stayed the same in recent years.(PLEASE CIRCLE ONE NUMBER FOR EACH ITEM)
Stayed HaveWorsened the same Improved no idea
The quality of undergraduate students inhigher education 1 2 3 9
The quality of graduate students in my field 1 2
The quality of students who choose to pursueacademic careers in my field 1 2 .3
The opportunities junior faculty have foradvancement in my field 1 2 3 9
The professional competence of individualsentering my academic field 1
Respect for the academic profession, generally 1 2 3 9
THANK YOU VERY MUCH FOR YOUR PARTICIPATION
Please return this completed questionnaire in the enclosed franked envelope to:National Survey of Postsecondary Faculty
SRI International, P.O. Box 2124, Menlo Park, CA 94025-212423 of 25
205
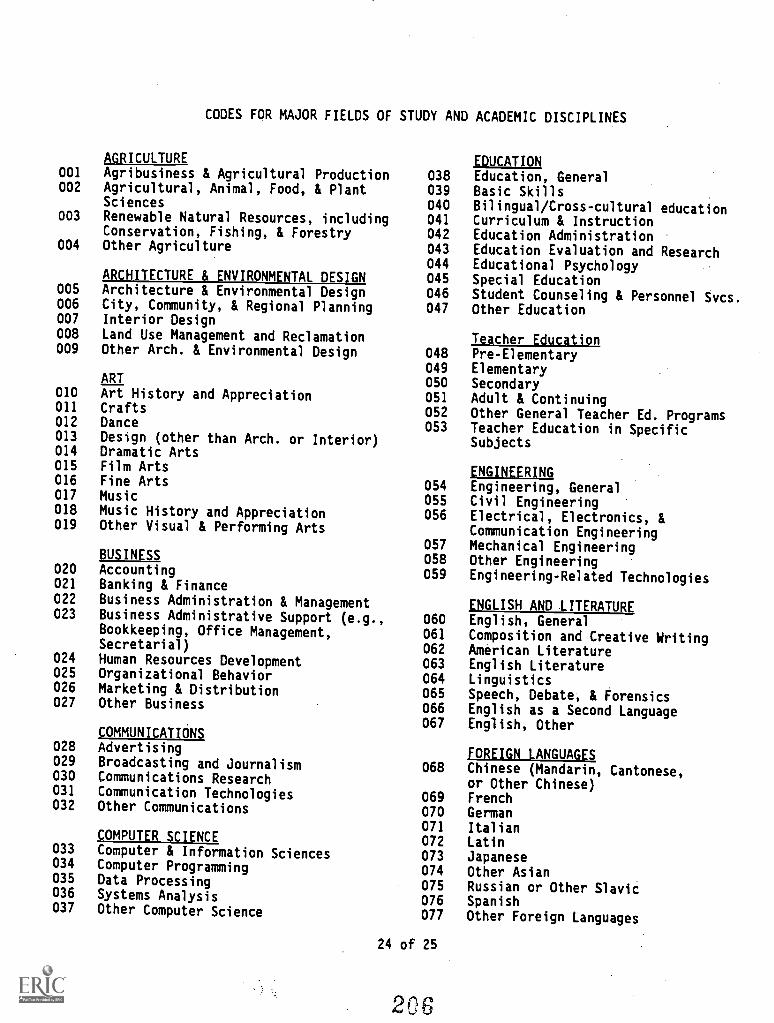
CODES FOR MAJOR FIELDS OF STUDY AND ACADEMIC DISCIPLINES
001002
003
004
AGRICULTURE
038039040041042043044045
EDUCATIONAgribusiness & Agricultural ProductionAgricultural, Animal, Food, & PlantSciencesRenewable Natural Resources, includingConservation, Fishing, & ForestryOther Agriculture
ARCHITECTURE & ENVIRONMENTAL DESIGN
Education, GeneralBasic Skills
Bilingual/Cross-cultural educationCurriculum & InstructionEducation AdministrationEducation Evaluation and ResearchEducational PsychologySpecial Education
005 Architecture & Environmental Design 046 Student Counseling & Personnel Svcs.006 City, Community, & Regional Planning 047 Other Education007 Interior Design008 Land Use Management and Reclamation Teacher Education009 Other Arch. & Environmental Design 048 Pre-Elementary
049 ElementaryART 050 Secondary
010 Art History and Appreciation 051 Adult & Continuing011 Crafts 052 Other General Teacher Ed. Programs012 Dance 053 Teacher Education in Specific013 Design (other than Arch. or Interior) Subjects014 Dramatic Arts015 Film Arts gNGINEERING016 Fine Arts 054 Engineering, General017 Music 055 Civil Engineering018 Music History and Appreciation 056 Electrical, Electronics, &019 Other Visual & Performing Arts Communication Engineering
057 Mechanical EngineeringBUSINESS 058 Other Engineering
020 Accounting 059 Engineering-Related Technologies021 Banking & Finance022 Business Administration & Management ENGLISH AND LITERATURE023 Business Administrative Support (e.g., 060 English, General
Bookkeeping, Office Management, 061 Composition and Creative WritingSecretarial) 062 American Literature
024 Human Resources Development 063 English Literature025 Organizational Behavior 064 Linguistics026 Marketing & Distribution 065 Speech, Debate, & Forensics027 Other Business 066 English as a Second Language
067 English, OtherCOMMUNICATIONS
028 Advertising FOREIGN LANGUAGES029 Broadcasting and Journalism 068 Chinese (Mandarin, Cantonese,030 Communications Research or Other Chinese)031 Communication Technologies 069 French032 Other Communications 070 German
071 ItalianCOMPUTER SCIENCE 072 Latin
033 Computer & Information Sciences 073 Japanese034 Computer Programming 074 Other Asian035 Data Processing 075 Russian or Other Slavic036 Systems Analysis 076 Spanish037 Other Computer Science 077 Other Foreign Languages
24 of 25
206
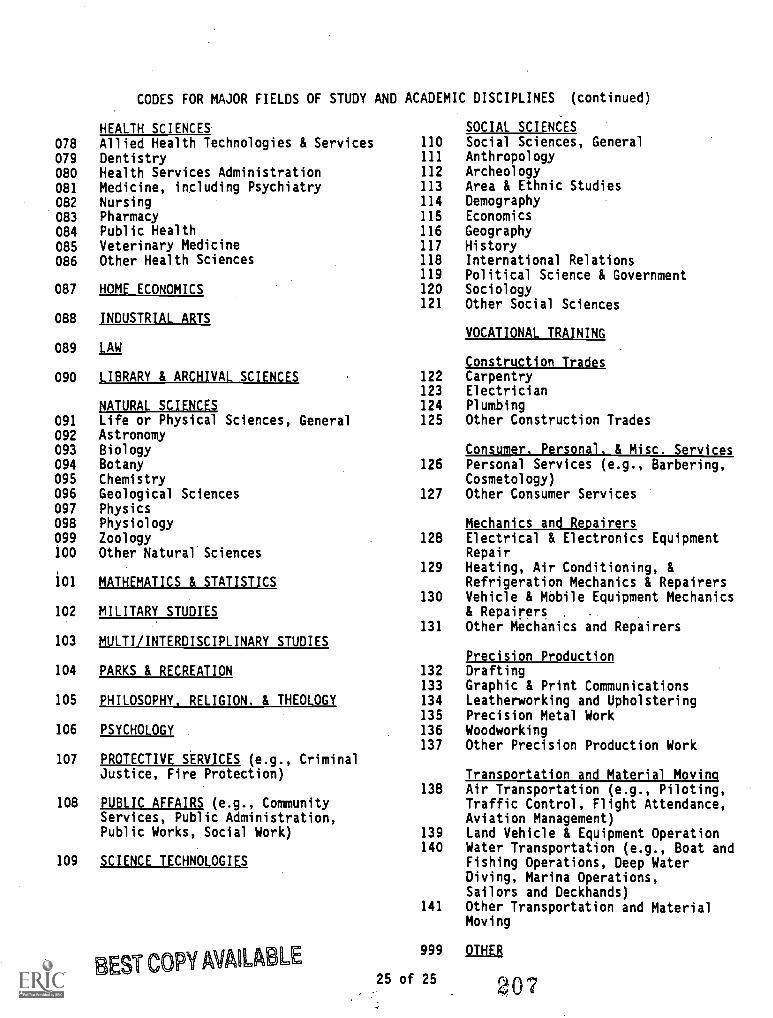
CODES FOR MAJOR FIELDS OF STUDY AND ACADEMIC DISCIPLINES (continued)
HEALTH SCIENCES078 Allied Health Technologies & Services079 Dentistry080 Health Services Administration081 Medicine, including Psychiatry082 Nursing083 Pharmacy084 Public Health
085 Veterinary Medicine086 Other Health Sciences
087 HOME ECONOMICS
088 INDUSTRIAL ARTS
089 SAW
090 OBRARY & ARCHIVAL SCIENCES
091
092093094095096097098099100
101
102
103
104
105
106
107
NATURAL SCIENCESLife or Physical Sciences, GeneralAstronomyBiologyBotanyChemistryGeological SciencesPhysicsPhysiologyZoologyOther Natural Sciences
MATHEMATICS & STATISTICS
MILITARY STUDIES
MULTI/INTERDISCIPLINARY STUDIES
PARKS & RECREATION
PHILOSOPHY. RELIGION. & THEOLOGY
PSYCHOLOGY
PROTECTIVE SERVICES (e.g., CriminalJustice, Fire Protection)
108 PUBLIC AFFAIRS (e.g., CommunityServices, Public Administration,Public Works, Social Work)
109 SCIENCE TECHNOLOGIES
EST COPY MAU LE
SOCIAL SCIENCES110 Social Sciences, General111 Anthropology112 Archeology113 Area & Ethnic Studies114 Demography115 Economics116 Geography117 History118 International Relations119 Political Science & Government120 Sociology121 Other Social Sciences
VOCATIONAL TRAINING
Construction Trades122 Carpentry123 Electrician124 Plumbing125 Other Construction Trades
Consumer. Personal. & Misc. Services126 Personal Services (e.g., Barbering,
Cosmetology)127 Other Consumer Services
Mechanics and Repairers128 Electrical & Electronics Equipment
Repair129 Heating, Air Conditioning, &
Refrigeration Mechanics & Repairers130 Vehicle & Mobile Equipment Mechanics
& Repairers .
131 Other Mechanics and Repairers
Precision Production132 Drafting133 Graphic & Print Communications134 Leatherworking and Upholstering135 Precision Metal Work136 Woodworking137 Other Precision Production Work
Transportation and Material Moving138 Air Transportation (e.g., Piloting,
Traffic Control, Flight Attendance,Aviation Management)
139 Land Vehicle & Equipment Operation140 Water Transportation (e.g., Boat and
Fishing Operations, Deep WaterDiving, Marina Operations,Sailors and Deckhands)
141 Other Transportation and MaterialMoving
999 OTHER
25 of 25 207
1993 National Study of Postsecondary FacultyMethodology Report
Appendix C
1988 NSOPF Institution Questionnaire
208
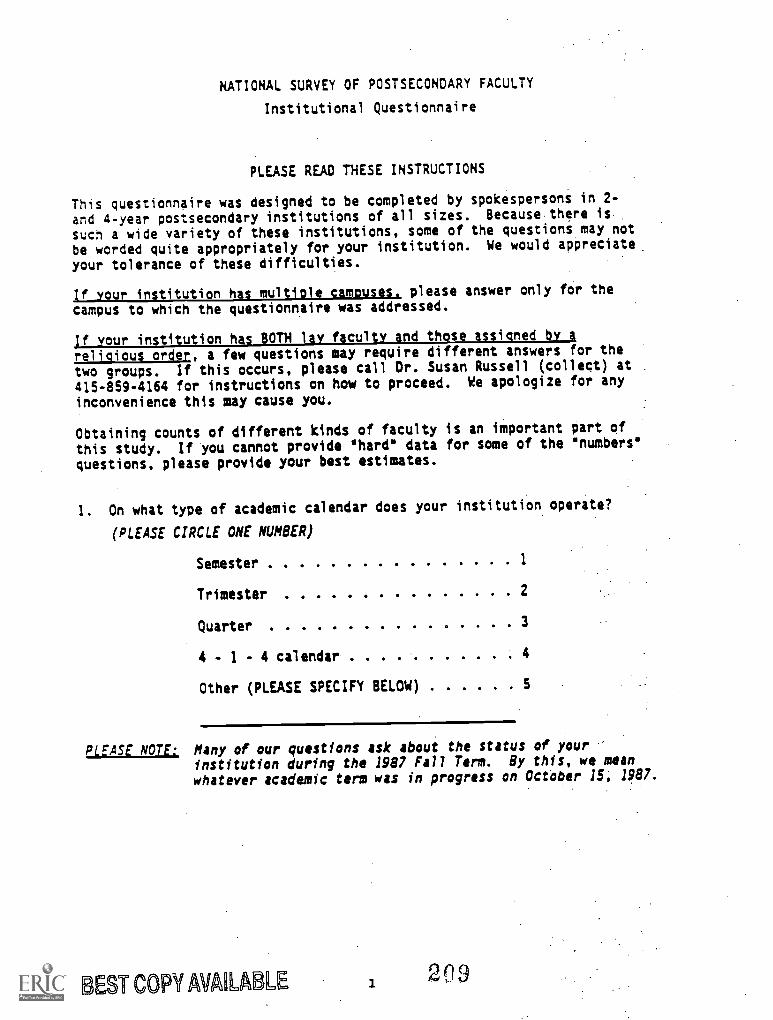
NATIONAL SURVEY OF POSTSECONDARY FACULTY
Institutional Questionnaire
PLEASE READ THESE INSTRUCTIONS
This questionnaire was designed to be completed by spokespersons in l-
and 4-year postsecondary institutions of all sizes. Because there is-
sucn a wide variety of these institutions, some of the questions may not
be worded quite appropriately for your institution. We would appreciate
your tolerance of these difficulties.
If your institution has multiple campuses. please answer only for the
campus to which the questionnaire was addressed.
If your institution has BOTH lay faculty and those assigned by a
religious order, a few questions may require different answers for the
two groups. If this occurs, please call Or. Susan Russell (collect) at .
415-859-4164 for instructions on how to proceed. We apologize for any
inconvenience this may cause you.
Obtaining counts of different kinds of faculty is an important part of
this study. If you cannot provide 'hard' data for some of the 'numbers°
questions, please provide your best estimates.
1. On what type of academic calendar does your institution operate?
(PLEASE CIRCLE ONE NUMBER)
Semester 1
Trimester 2
Quarter 3
4 - 1 - 4 calendar 4
Other (PLEASE SPECIFY BELOW)
PLEASE NOTE: Many of our questions ask about the status of your
institution during the 1987 Pall Term. By this, we mean
whatever academic term was in progress on October 15; 1987.
LE, T COPY AVAIL it LE 1 209
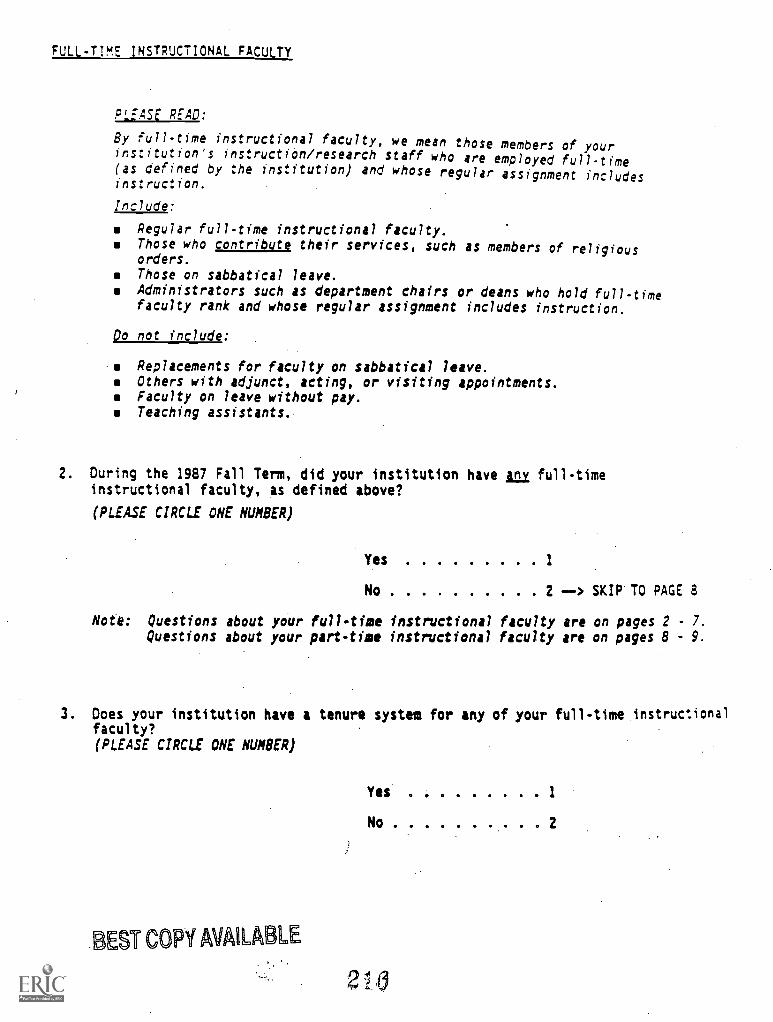
FULL-TIME INSTRUCTIONAL FACULTY
P'EASE READ:
By full-time instructional faculty, we mean those members of yourins:itution's instruction/research staff who are employed full-time(as defined by the institution) and whose regular assignment includesinstruction.
Include:
Regular full-time instructional faculty.Those who contribute their services, such as members of religiousorders.
Those on sabbatical leave.Administrators such as department chairs or deans who hold full-timefaculty rank and whose regular assignment includes instruction.
go not include:
Replacements for faculty on sabbatical leave.Others with adjunct, acting, or visiting appointments.Faculty on leave without pay.Teaching assistants.
2. During the 1987 Fall Term, did your institution have lay full-timeinstructional faculty, as defined above?
(PLEASE CIRCLE ONE NUMBER)
Yes 1
No 2 > SKIP* TO PAGE 8
Note: Questions about your full-time instructional faculty are on pages 2 - 7.
Questions about your part-time instructional faculty are on pages 8 - 9.
3. Does your institution have a tenure system for any of your full-time instructionalfaculty?(PLEASE CIRCLE ONE NUMBER)
BEST COPY AVAILABLE
Yes
No 2
2 10
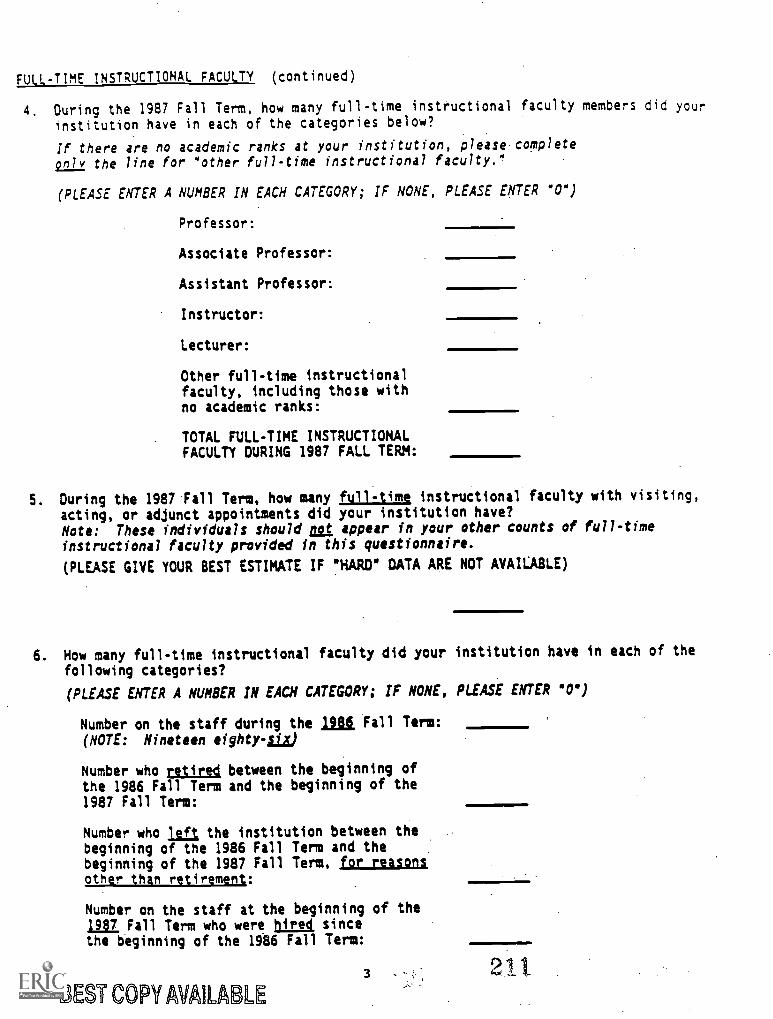
FULL-TIME INSTRUCTIONAL FACULTY (continued)
4. During the 1987 Fall Term, how many full-time instructional faculty members did your
institution have in each of the categories below?
If there are no academic ranks at your institution, please complete
only the line for "other full-time instructional faculty."
(PLEASE ENTER A NUMBER IN EACH CATEGORY; IF NONE, PLEASE ENTER "0")
Professor:
Associate Professor:
Assistant Professor:
Instructor:
Lecturer:
Other full-time instructionalfaculty, including those withno academic ranks:
TOTAL FULL-TIME INSTRUCTIONALFACULTY DURING 1987 FALL TERM:
S. During the 1987'Fall Term, how many full-time instructional faculty with visiting,
acting, or adjunct appointments did your institution have?Note: These individuals should at appear in your other counts of full-time
instructional faculty provided in this questionnaire.
(PLEASE GIVE YOUR BEST ESTIMATE IF 'HARD" DATA ARE NOT AVAILABLE)
6. How many full-time instructional faculty did your institution have in each of the
following categories?
(PLEASE ENTER A NUMBER IN EACH CATEGORY; IF NONE, PLEASE ENTER 60°)
Number on the staff during the 1311, Fall Term:
(NOTE: Nineteen eighty -La)
Number who retire4 between the beginning ofthe 1986 Fall Term and the beginning of the1987 Fall Term:
Number who Ila the institution between thebeginning of the 1986 Fall Term and thebeginning of the 1987 Fall Term, for reasonsother than retirement:
Number on the staff at the beginning of the1987 Fall Term who were hired sincethe beginning of the 1986 Fall Term:
3
BEST COPY AVAILABLE
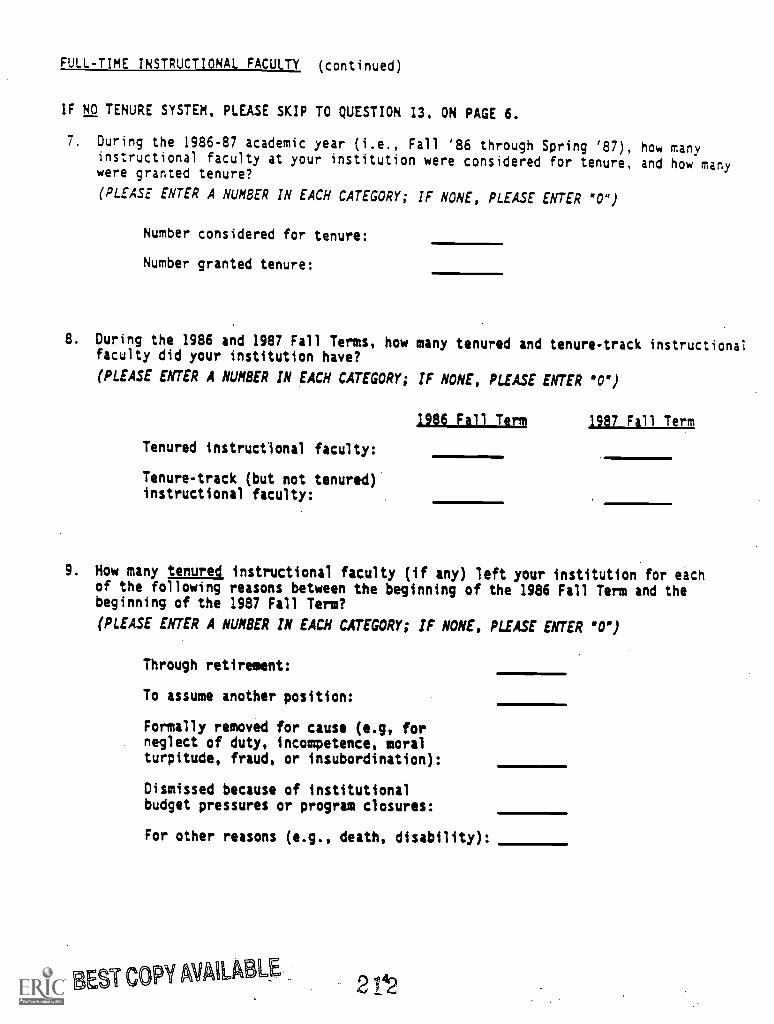
FULL-TIME INSTRUCTIONAL FACULTY (continued)
IF NO TENURE SYSTEM, PLEASE SKIP TO QUESTION 13, ON PAGE 6.
7. During the 1986-87 academic year (i.e., Fall '86 through Spring '87), how manyinstructional faculty at your institution were considered for tenure, and how manywere granted tenure?
(PLEASE ENTER A NUMBER IN EACH CATEGORY; IF NONE, PLEASE ENTER "0")
Number considered for tenure:
Number granted tenure:
8. During the 1986 and 1987 Fall Terms, how many tenured and tenure-track instructionalfaculty did your institution have?
(PLEASE ENTER A NUMBER IN EACH CATEGORY; IF NONE, PLEASE ENTER '0")
Tenured instructional faculty:
Tenure-track (but not tenured)instructional faculty:
1986 Fall Term 1987 Fall Term
9. How many tenured, instructional faculty (if any) left your institution for eachof the following reasons between the beginning of the 1986 Fall Term and thebeginning of the 1987 Fall Term?
(PLEASE ENTER A NUMBER IN EACH CATEGORY; IF NONE, PLEASE ENTER '0")
Through retirement:
To assume another position:
Formally removed for cause (e.g, forneglect of duty, incompetence, moralturpitude, fraud, or insubordination):
Dismissed because of institutionalbudget pressures or program closures:
For other reasons (e.g., death, disability):
BEST COPY MIAILPLa2 142
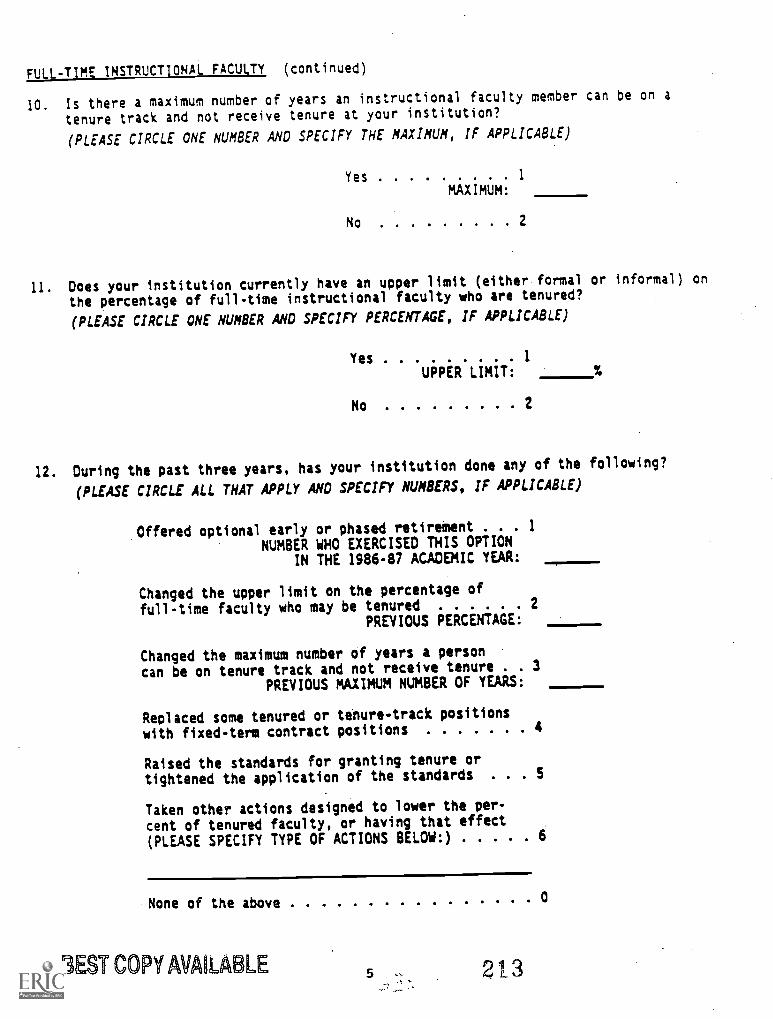
FULL-TIME INSTRUCTIONAL FACULTY (continued)
10. Is there a maximum number of years an instructional faculty member can be on a
tenure track and not receive tenure at your institution?
(PLEASE CIRCLE ONE NUMBER AND SPECIFY THE MAXIMUM, IF APPLICABLE)
Yes 1
MAXIMUM:
No 2
11. Does your institution currently have an upper limit (either formal or informal) on
the percentage of full-time instructional faculty who are tenured?
(PLEASE CIRCLE ONE NUMBER AND SPECIFY PERCENTAGE, IF APPLICABLE)
Yes..... . . . . 1
UPPER LIMIT:
No 2
12. During the past three years, has your institution done any of the following?
(PLEASE CIRCLE ALL THAT APPLY AND SPECIFY NUMBERS, IF APPLICABLE)
Offered optional early or phased retirement . . . 1
NUMBER WHO EXERCISED THIS OPTIONIN THE 1986-87 ACADEMIC YEAR:
Changed the upper limit on the percentage of
full-time faculty who may be tenured . . . . . . 2
PREVIOUS PERCENTAGE:
Changed the maximum number of years a person
can be on tenure track and not receive tenure . . 3
PREVIOUS MAXIMUM NUMBER OF YEARS:
Replaced some tenured or tenure-track positions
with fixed-term contract positions 4
Raised the standards for granting tenure ortightened the application of the standards . . . 5
Taken other actions designed to lower the per-
cent of tenured faculty, or having that effect
(PLEASE SPECIFY TYPE OF ACTIONS BELOW:)
None of the above 0
BEST COPY AWL BLE 5 213
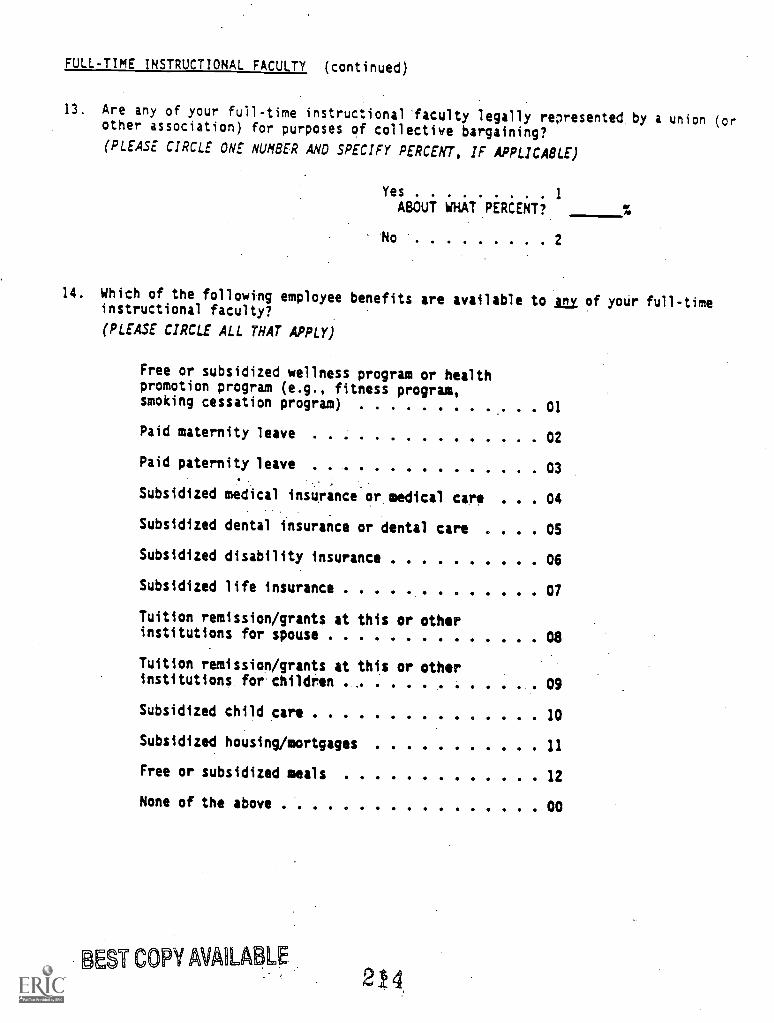
FULL-TIME INSTRUCTIONAL FACULTY (continued)
13. Are any of your full-time instructionalfaculty legally represented by a union (or
other association) for purposes of collective bargaining?
(PLEASE CIRCLE ONE NUMBER AND SPECIFY PERCENT, IF APPLICABLE)
Yes ......... 1ABOUT WHAT PERCENT?
No 2
14. Which of the following employee benefits are available to j of yoUr full-timeinstructional faculty?
(PLEASE CIRCLE ALL THAT APPLY)
Free or subsidized wellness program or healthpromotion program (e.g., fitness program,smoking cessation program) 01
Paid maternity leave 02
Paid paternity leave 03
Subsidized medical insurance or medical care 04
Subsidized dental insurance or dental care . OS
Subsidized disability insurance 06
Subsidized life insurance 07
Tuition remission/grants at this or otherinstitutions for spouse 08
Tuition remission/grants at this or otherinstitutions.forchildivn . , . . . .. . .... . 09
Subsidized child care 10
Subsidized housing/mortgages 11
Free or subsidized meals 12
None of the above 00
BEST COPY VAILABLE2.4
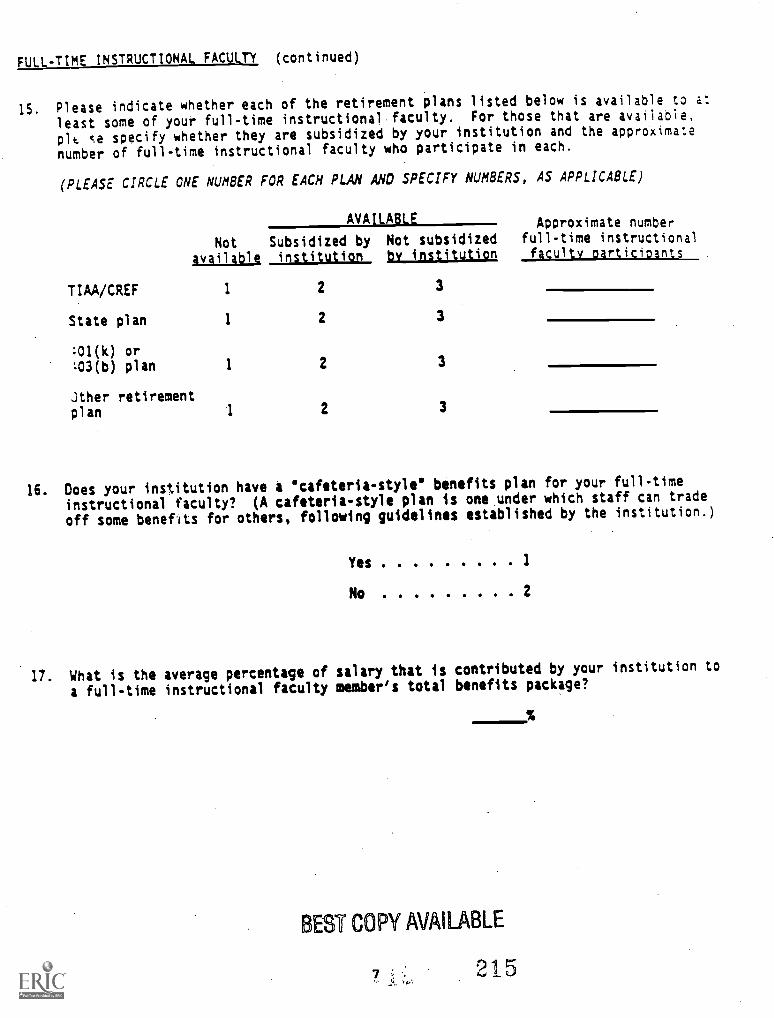
FULL-TIME INSTRUCTIONAL FACULTY (continued)
15. Please indicate whether each of the retirement plans listed below is available to a:
least some of your full-time instructional faculty. For those that are available,
ce specify whether they are subsidized by your institution and the approximate
number of full-time instructional faculty who participate in each.
(PLEASE CIRCLE ONE NUMBER FOR EACH PLAN AND SPECIFY NUMBERS, AS APPLICABLE)
AVAILABLE Approximate
Not Subsidized by
availablq institution
number
Not subsidized full-time instructional
by institution faculty Participants
TIAA/CREF 1 2 3
State plan 1 2 3
:01(k) or103(b) plan 1 2 3
Jther retirementplan 1 2 3
16. Does your institution have a 'cafeteria-style' benefits plan for your full-time
instructional faculty? (A cafeteria-style plan is one under which staff can trade
off some benefits for others, following guidelines established by the institution.)
Yes 1
No 2
17. What is the average percentage of salary that is contributed by your institution to
a full-time instructional faculty member's total benefits package?
BEST COPY AVAILABLE
215
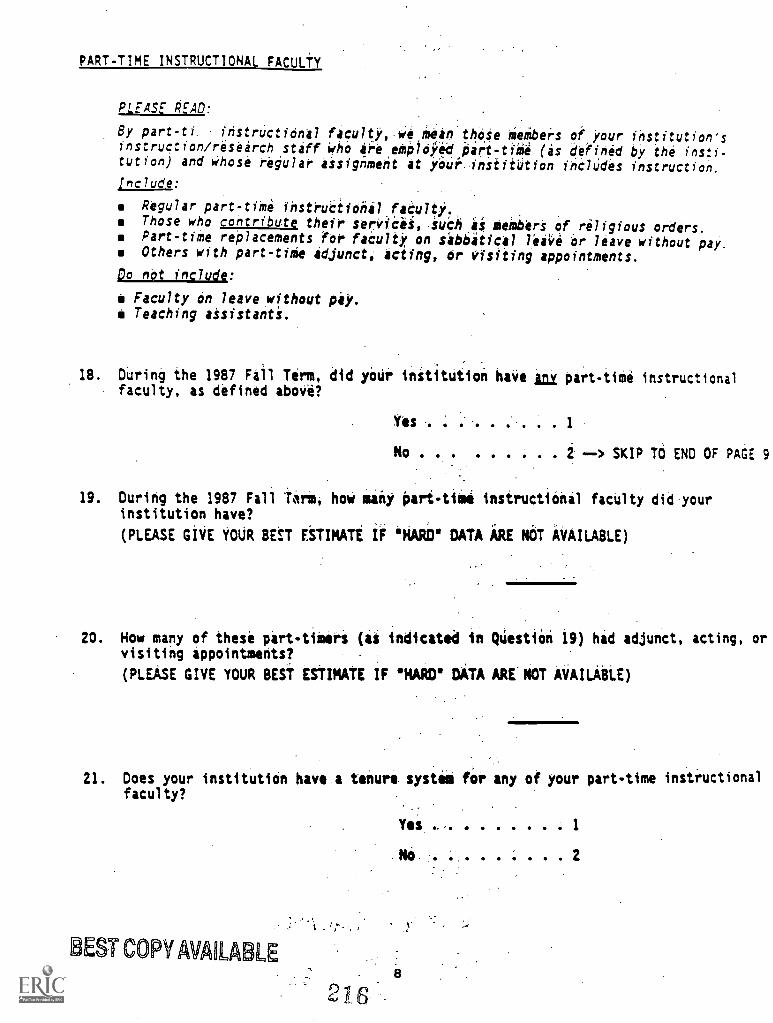
PART-TIME INSTRUCTIONAL FACULTY
PLEASE READ:. .
By part-ti. instructional faculty, we mean those members of your institution'sinstruction/research staff who are eApidied Part-tim e (as defined by the insti-tution) and whose regular assignment at yOui.-insiittItion includes instruction.
Include:
Regular part7tiOe ihstruCtidnalfaCulti.,Those who contribute their servicis, such as Memberi,of.riligious orders.Part-time replacements for faculty on sabbatical 1.aé or have without pay.Others with part -tithe adjunct, acting, Or Visiting appointments.
Do not include:
Faculty on leave without ply.Teaching assistants.
18. During the 1987 Fill Term, did yOui- Institution have la/ part-tithe instructionalfaculty, as defined above?
Yes,
No
1
2 > SKIP TO ENO OF PAGE 9
19. During the 1987 Fall 4.arii hoi many Part-time instructional faculty did yourinstitution have?
(PLEASE GIVE YOUR BE!T ESTIMATE IF 'HARD' DATA ARE NOT AVAILABLE)
20. How many of these part-tillers (it indicated in QUestiOn 19) hid adjunct, acting, orvisiting appointments?
(PLEASE GIVE YOUR BEST ESTIMATE IF 'HARD' DATA ARE NOT AVAILABLE)
21. Does your institutiOn have.a tenure systii for any of your part-time instructionalfaculty?
Yes 1
. No. 2
BEST COPY AVAILABLE
2 1 68
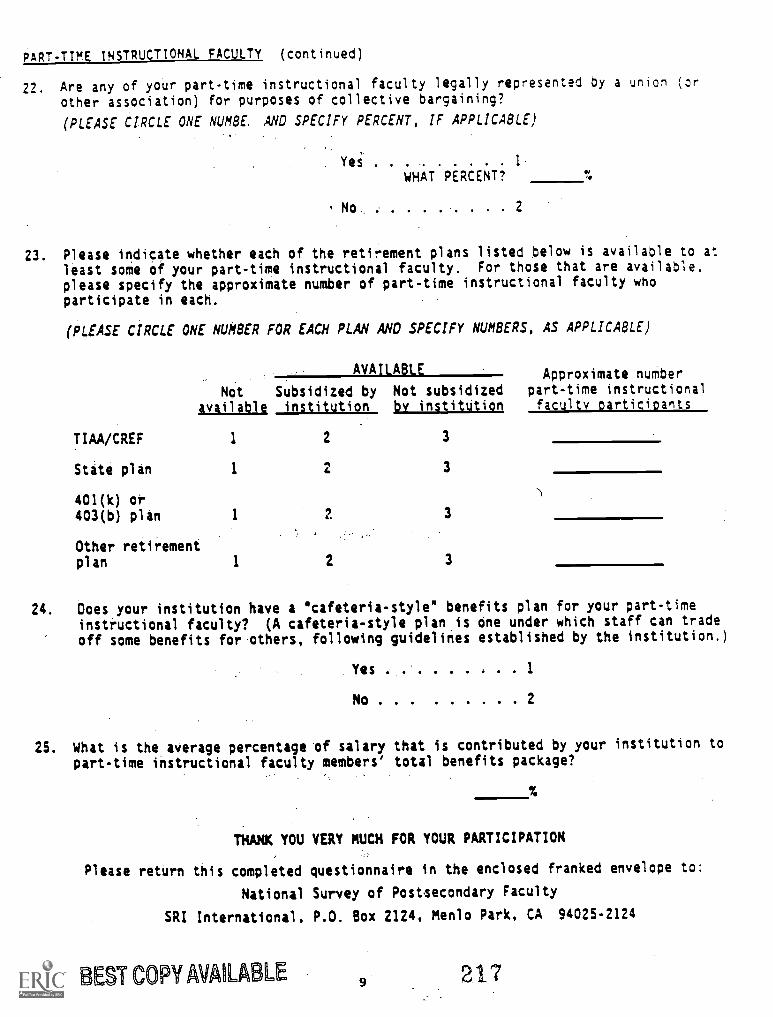
PART-TIME INSTRUCTIONAL FACULTY (continued)
22. Are any of your part-time instructional faculty legally represented by a union (or
other association) for purposes of collective bargaining?
(PLEASE CIRCLE ONE NUMBE AND SPECIFY PERCENT, IF APPLICABLE)
Yes . . . . . . . . . 1.
WHAT PERCENT?
, No 2
0//0
23. Please indicate whether each of the retirement plans listed below is available to at
least some of your part-time instructional faculty. For those that are available,
please specify the approximate number of part-time instructional faculty whoparticipate in each.
(PLEASE CIRCLE ONE NUMBER FOR EACH PLAN AND SPECIFY NUMBERS, AS APPLICABLE)
available
AVAILABLE Approximate
Not Subsidized byinstitution
number
Not subsidized part-time instructional
by institution faculty oarticioants
TIAA/CREF 1 2 3
State plan 1 3
401(k) or403(b) plan 1 2 3
Other retirementplan 1 2 3
24. Does your institution have a "cafeteria-style" benefits plan for your part-timeinstructional faculty? (A cafeteria-style plan is one under which staff can tradeoff some benefits for others, following guidelines established by the institution.)
Yes 1
No 2
25. What is the average percentage of salary that is contributed by your institution toPart-time instructional faculty members' total benefits package?
THANK YOU VERY MUCH FOR YOUR PARTICIPATION
Please return this completed questionnaire in the enclosed franked envelope to:
National Survey of Postsecondary Faculty
SRI International, P.O. Box 2124, Menlo Park, CA 94025-2124
BEST COPY VAILA LE a 217
1993 National Study of Postsecondary FacultyMethodology Report
Appendix D
1993 NSOPF Faculty Questionnaire andReinterview Questionnaire Pilot Test
2t8
U.S. Department of EducationOffice of Educational Research and Improvement
National Center for Education Statistics
1993 NATIONAL STUDY OF POSTSECONDARY FACULTY
Pilot Test
FACULTYQUESTIONNAIRE
Co-sponsored by:
Contractor:
All information on this form will be kept confidential and will not bedisclosed or released to your institution or any other group or individual.
National Science FoundationNational Endowment for the Humanities
National Opinion Research Center (NORC)University of Chicago1155 East 60th StreetChicago, Illinois 60637Toll-Free Number: 1-800-733-NORC
2
OMB: No. 1850-0608Expiration Date: 12/93
NATIONAL STUDY OF POSTSECONDARY FACULTYInstructions for Completing Faculty Questionnaire
Many of our questions ask about your activities during the 1991 Fall Term. By this, we mean whatever
academic term was in progress on October 15, 1991.
All questions that ask about your current position or "this" institution refer to your position during the 1991
Fall Term at the institution listed on the label on the back cover of the questionnaire.
This questionnaire was designed to be completed by both full- and pan -time instructional and non-instructional faculty in 2- and 4-year postsecondary institutions of all types and sizes. Please read eachquestion carefully and follow all instructions. Some of the questions may not appear to fit your situationprecisely; if you have a response other than those listed for a particular question, write in that response.
Most questions ask you to circle a number to indicate your response. Circle the number in front of yourresponse and not the response itse1f Other questions ask you tofill in information; write in the information
in the space provided.
Please keep track of how long it takes you to fill out the questionnaire and indicate the time on page 27.Mailing instructions for returning the completed questionnaire are also on page 27.
If you have any questions on how to proceed, please call NORC toll-free at 1-800-733-NORC.
BEST COPY AVAILABLE
2.20
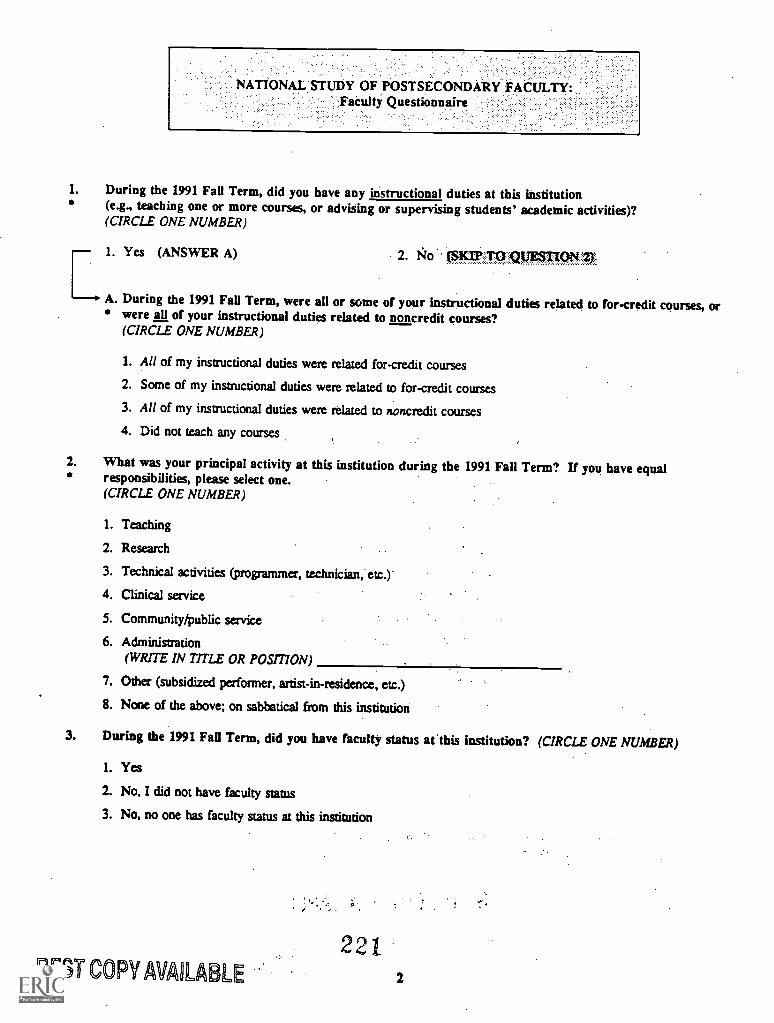
.11.
NATIONAL STUDY OF POSTSECONDARY FACULTY:Faculty Questionnaire
During the 1991 Fall Term, did you have any instructional duties at this institution(e.g., teaching one or more courses, or advising or supervising students' academic activities)?(CIRCLE ONE NUMBER)
1. Yes (ANSWER A) 2. No a, poggI
-- A. During the 1991 Fall Term, were all or some of your instructional duties related to for-credit courses, orwere all of your instructional duties related to noncredit courses?(CIRCLE ONE NUMBER)
1. All of my instructional duties were related for-credit courses
2. Some of my instructional duties were related to for-credit courses
3. All of my instructional duties were related to noncredit courses
4. Did not teach any courses
2. What was your principal activity at this institution during the 1991 Fall Term? If you have equalresponsibilities, please select one.(CIRCLE ONE NUMBER)
1. Teaching
2. Research
3. Technical activities (programmer, technician, etc.)"
4. Clinical service
5. Community/public service
6. Administration(WRITE IN TITLE OR POSITION)
7. Other (subsidized performer, artist-in-residence, etc.)
8. None of the above; on sabbatical from this institution
3. During the 1991 Fall Term, did you have faculty status at this institution? (CIRCLE ONE NUMBER)
1. Yes
2. No, I did not have faculty status
3. No, no one has faculty status at this institution
221BEST COPY MALAWI 2
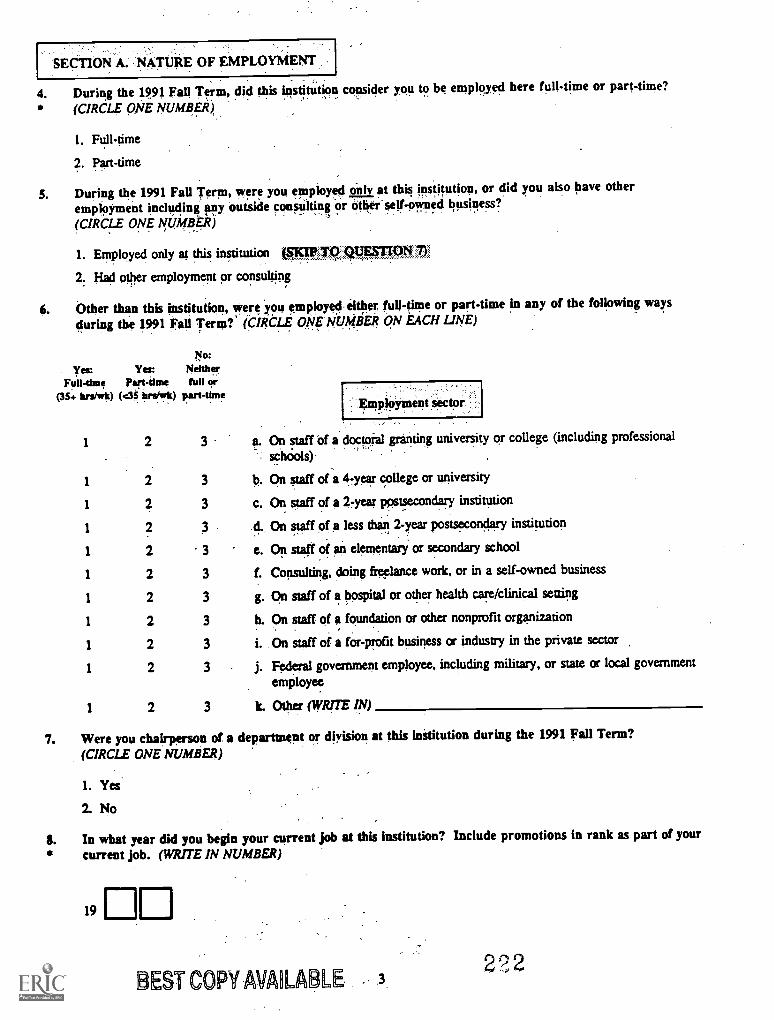
4. During the 1991 Fall Term, did this institution consider you to be employed here full-time or part-time?
(CIRCLE ONE NUMBER),
1. Full-time
2. Part-time
5. During the 1991 Fall Term, were you employed only at this institution, or did you also have otheremployment including any outside consulting or other self-owned business?
(CIRCLE ONE NUMBER)
1. Employed only at this institution (SKIP TO QUOIT 7)
2. Had other employment or consulting
6. Other than this institution, were you employed either full-time or part-time in any of the following waysemployedduring the 1991 Fall Term?' (CIRCLE ONE NUMBER ON EACH LINE)
No:
Y. Yes: NeitherFull-time )'art -time full or
(35+ luso") (45 hr!Iwk) part-timeXIDPI9Ymer0 sector.
1 2 3 a. On staff of a doctoral granting university or college (including professional
schools)-
1 2 3 b. On staff of a 4 -year college or university
1 2 3 c. On staff of a 2 -year postsecondary institution
1 2 3 d. On staff of a less than 2-year postsecondary institution
1 2 3 e. On staff of an elementary or secondary school
1 2 3 L Consulting, doing freelance work, or in a self-owned business
1 2 3 g. On staff of a hospital or other health care/clinical setting
1 2 3 h. On staff of a foundation or other nonprofit organization
1 2 3 i. On staff of a for - profit business or industry in the private sector
1 2 3 j. Federal government employee, including military, or state or local government
employee
1 2 3 k. Other (WRITE IN)
7. Were you chairperson of a department or diyision at this institution during the 1991 Fall Term?(CIRCLE ONE NUMBER)
1. Yes
2. No
8. In what year did you begin your current job at this institution? Include promotions in rank as part of yourcurrent job. (WRITE IN NUMBER)
19
BEST COPY AVAILABLE222
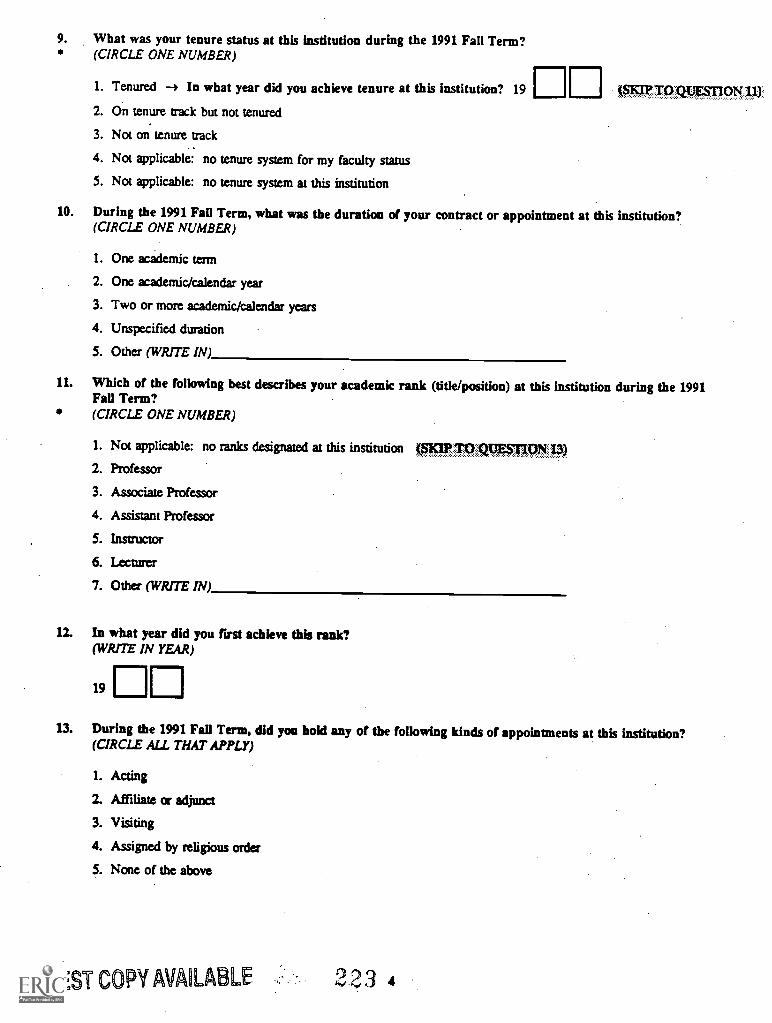
9. What was your tenure status at this institution during the 1991 Fall Term?(CIRCLE ONE NUMBER)
1. Tenured -4 In what year did you achieve tenure at this institution? 19
2. On tenure track but not tenured
3. Not on tenure track
4. Not applicable: no tenure system for my faculty status
5. Not applicable: no tenure system at this institution
WEST ox,:m
10. During the 1991 Fall Term, what was the duration of your contract or appointment at this institution?(CIRCLE ONE NUMBER)
1. One academic term
. 2. One academic/calendar year
3. Two or more academic/calendar years
4. Unspecified duration
5. Other (WRITE IN)
11. Which of the following best describes your academic rank (title/position) at this institution during the 1991Fall Term?(CIRCLE ONE NUMBER)
1. Not applicable: no ranks designated at this institution
2. Professor
3. Associate Professor
4. Assistant Professor
5. Instructor
6. Lecturer
7. Other (WRITE IN)
12. In what year did you first achieve this rank?(WRITE IN YEAR)
19
13. During the 1991 Fall Term, did you hold any of the following kinds of appointments at this institution?(CIRCLE ALL THAT APPLY)
rik
1. Acting
2. Affiliate or adjunct
3. Visiting
4. Assigned by religious order
5. None of the above
EST COPY AVAILABLE 223 4
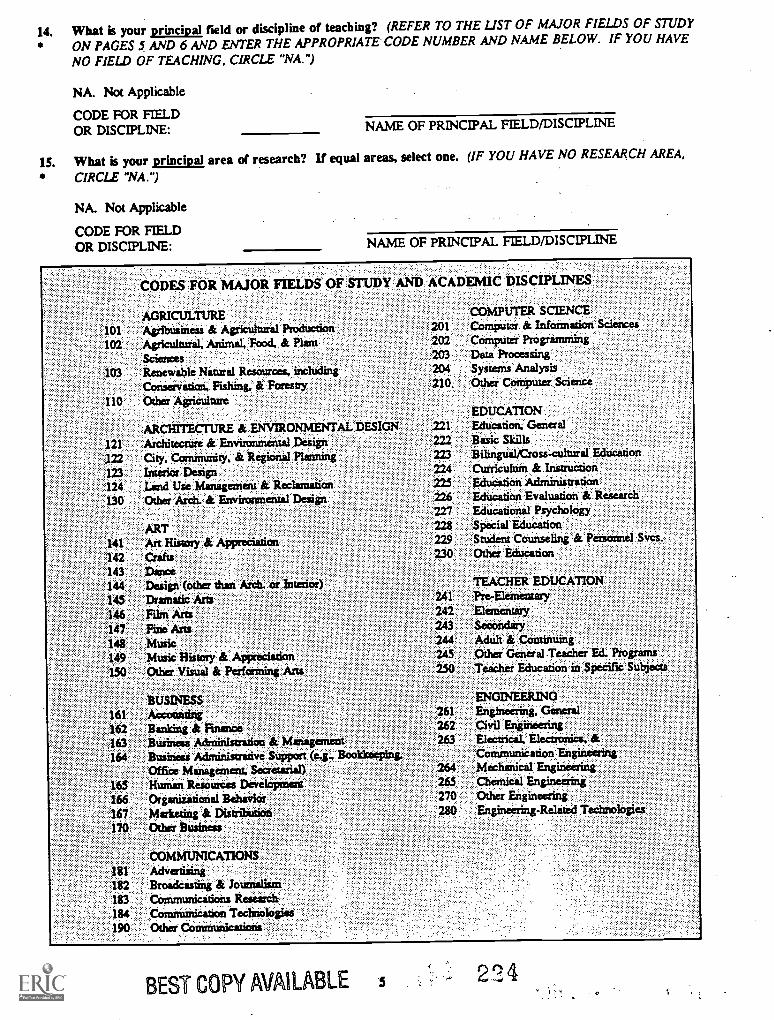
14. What is your principal field or discipline of teaching? (REFER TO THE LIST OF MAJOR FIELDS OF STUDY
ON PAGES 5 AND 6 AND ENTER THE APPROPRIATE' CODE NUMBER AND NAME BELOW. IF YOU HAVE
NO FIELD OF TEACHING, CIRCLE "NA.")
NA. Not Applicable
CODE FOR FIELDOR DISCIPLINE: NAME OF PRINCIPAL FIELD/DISCIPLINE
15. What is your principal area of research? If equal areas, select one.
CIRCLE "NA.")
NA. Not Applicable
CODE FOR FIELDOR DISCIPLINE:
(IF YOU HAVE NO RESEARCH AREA,
NAME OF PRINCIPAL FIELD/DISCIPLINE
CODES FOR MAJOR FIELDS OF STUDY AND ACADEMIC DISCIPLINES
AGRICULTURE101 Agribusiness & Agricultural Production102 Agricultural, Animal, Food, & Plant
Sciences103 Renewable Natural Resources, including
Conservation, Fishing, & Forestry,110 Other Agriculave
ARCHITECTURE & ENVIRONMENTAL DESIGN121 Architecture & Environmental Design122 City, Community. & Regional Planning123 battier Design124 Land Use Management & Reclamation130 Other Arch. & Environmental Design
ART141 Art History & Appreciation142 Crafts143 Dance144 Design (other than Arch. or Interior)145 Dramatic Arts146 Film Arts147 Fine Arts148 Music149 Music 'History & Appreciation150 Other Visual & Performing Arts
BUSINESS161 Accounting162 Banking & Finance163 Business Administration & Management164 Business Administrative Support (e.g., Bookkeeping.
Office Management, Secretarial)165 Human Resources Development166 Organizational Behavior167 Marketing & Distribution170 Other Business
COMMUNICATIONS181 Advertising182 Broadcasting & Journalism183 Communications Research184 Communication Technologies190 Other Conummications
COMPUTER SCIENCE201 Computer & Information Sciences202 Computer Programming203 Data Processing204 Systems Analysis210, Other Computer Science
EDUCATION:Education. GeneralBasic SkillsBilingual/Cross-cultural EducationCurriculum & InstructionEducation AdministrationEducation Evaluation & ResearchEducational PsychologySpecial EducationStudent Counseling & Personnel Svcs.Other Education
TEACHER EDUCATION241 Pre-Elementary242 Elementary243 Secondary244 Adult & Continuing245 Other General Teacher Ed. Programs250 Teacher Education in Specific Subjects
ENGINEERING261 Engineering. General262 Civil Engineering263 Electrical.' Electronics. &
Communication Engineering264 Mechanical Engineering265 Chemical Engineering270 Other Engineering280 Engineering-Related Technologies
BEST COPY AVAILABLE 's 274
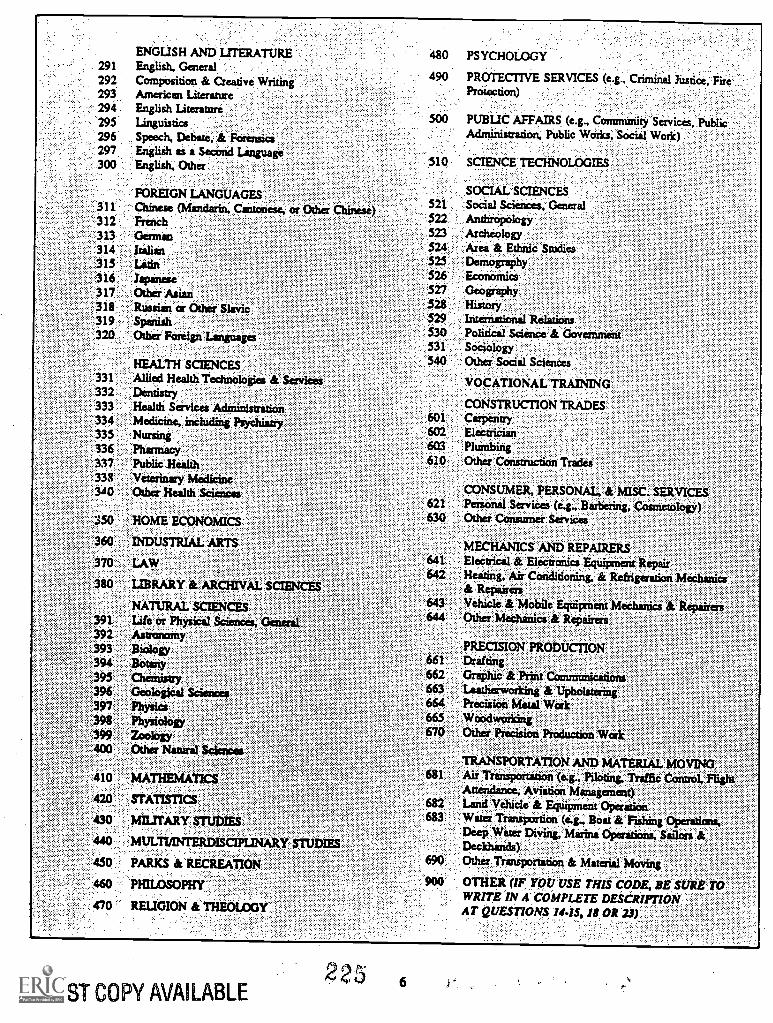
291292293294295.296297
. 300
311312313314315316317318319320
331332333334335336337338340
350
360
370
380
391392393394395396397398399400
410
420
430
440
450
460
470
ENGLISH AND LITERATUEnglish. GeneralComposition & Creative WritingAmerican LiteratureEnglish LiteranueLinguisticsSpeech, Debate, & ForensicsEnglish as a Second LanguageEnglish, Other
480 PSYCHOLOGY
490 PROTECTIVE SERVICES (e.g., Criminal Tintiee.-FireProtection)
FOREIGN LANGUAGESChinese (Mandarin. Cantonese, or Other Chinese)FrenchGommItalianLatin43111ISCOther AsianRussian or Other SlavicSpanishOther Foreign Languages
HEALTH SCIENCESAllied Health Tecinsologies & ServicesDentistryHealth Services AdministrationMedicine, inchrding PsychiatryNursingPharmacyPublic HealthVeterinary MedicineOther Health Sciences
HOME ECONOMICS
INDUSTRIAL ARTS
LAW
LIBRARY & ARCHIVAL SCIENCES
NATURAL SCIENCESLife or Physical Sciences, GeneralAstronomyBiologyBotanyChemistryGeological Science;PhysitnPhysiologyZoologyOther Nature) Sciences
MATHEMAIX:S
STATISTICS
MILITARY STUDIES
MULTI/INTERDISCIPLINARY STUDIES
PARKS & RECREATION
PHILOSOPHY
RELIGION & THEOLOGY
PUBLIC AFFAIRS (e.g., CommtinitY Services, F'uAdminiatrad'on, Public Maks; Work)
510 SCIENCE TECHNOLOGIES
SOCIAL SCIENCES521 Social Sciences, General522 Anthropology523 Archeology524 Area & Ethnic Studies525 Demography526 Economics527 Geography528 History529 International Relations530 Political Science & Government531 Sociology540 Other Social Sciences
VOCATIONAL TRAINING
CONSTRUCTION TRADES601 Carpentry602. Electrician603 Plumbing610 Other Construction Trades
CONSUMER, PERSONAL. & MISC. SERVICES621 Personal Services (e.g.. Barbering, Cosmetology)630 Other Consumer Services
MECHANICS AND REPAIRERS641 Electrical & Electronics Equipment 'Repair642 Heating. Air Conditioning. & Refrigeration Mechanics
& Repairers643 Vehicle & Mobile Equipment Mechanics & Repairers644 Other Mechanics & Repairers
PRECISION PRODUCTION661 Drafting662 Graphic & Print Corrununications663 Leatherworking & Upholstering664 Precision Metal Week665 Woodworking670 Other Precision Production Work
TRANSPORTATION AND MATERIAL MOVING681 Air Transportation (e.g., Piloting. Traffic Coning, Flight
Attendance, Aviation Management)682 Land Vehicle & Equipment Operation683 Water Transpordon (e.g.. Boat & Fishing Operations.
Deep Water Diving, Marina Operations, Sailors &Deckhands)
690 Other Transportation & Material Moving
900 OTHER (IF YOU USE THIS CODE, BE SURE TOWRITE IN A COMPLETE DESCRIPTIONAT QUESTIONS 1445, Is OR 23)
BEST COPY AVAILABLE225 6
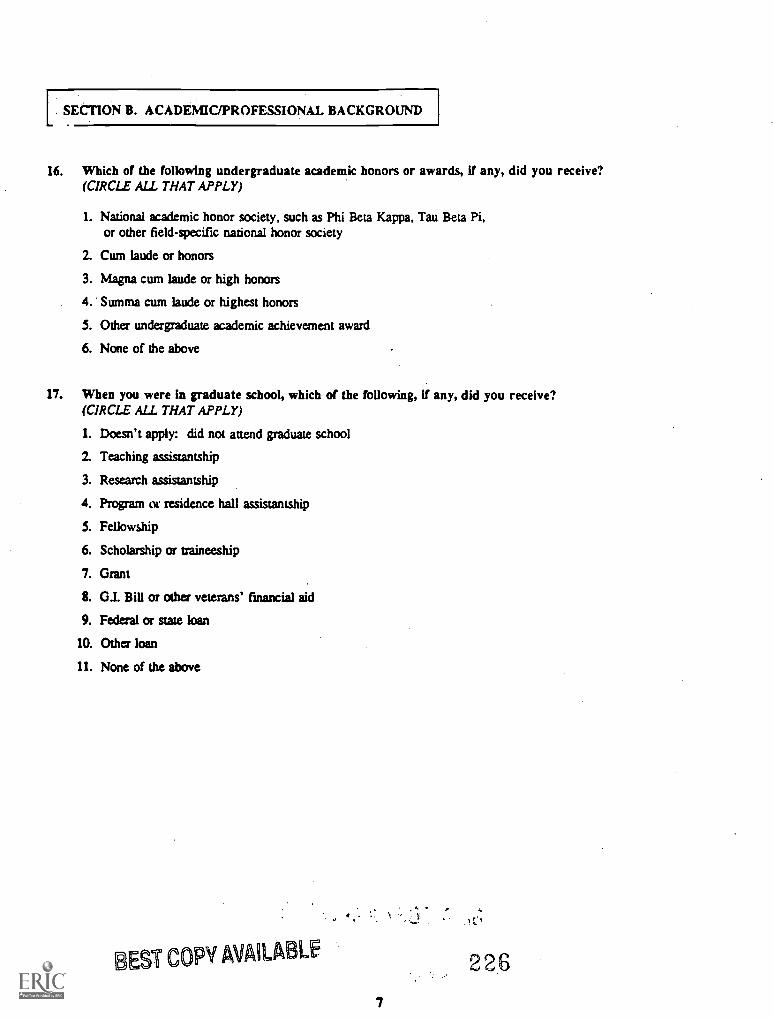
SECTION B. ACADEMIC/PROFESSIONAL BACKGROUND
16. Which of the following undergraduate academic honors or awards, if any, did you receive?(CIRCLE ALL THAT APPLY)
1. National academic honor society, such as Phi Beta Kappa, Tau Beta Pi,or other field-specific national honor society
2. Cum laude or honors
3. Magna cum laude or high honors
4. Summa cum laude or highest honors
S. Other undergraduate academic achievement award
6. None of the above
17. When you were in graduate school, which of the following, if any, did you receive?(CIRCLE ALL THAT APPLY)
1. Doesn't apply: did not attend graduate school
2. Teaching assistantship
3. Research assistantship
4. Program or residence hall assistantship
S. Fellowship
6. Scholarship or traineeship
7. Grant
8. G.I. Bill or other veterans' financial aid
9. Federal or state loan
10. Other loan
11. None of the above
BEST COPY AVAILABLE 226
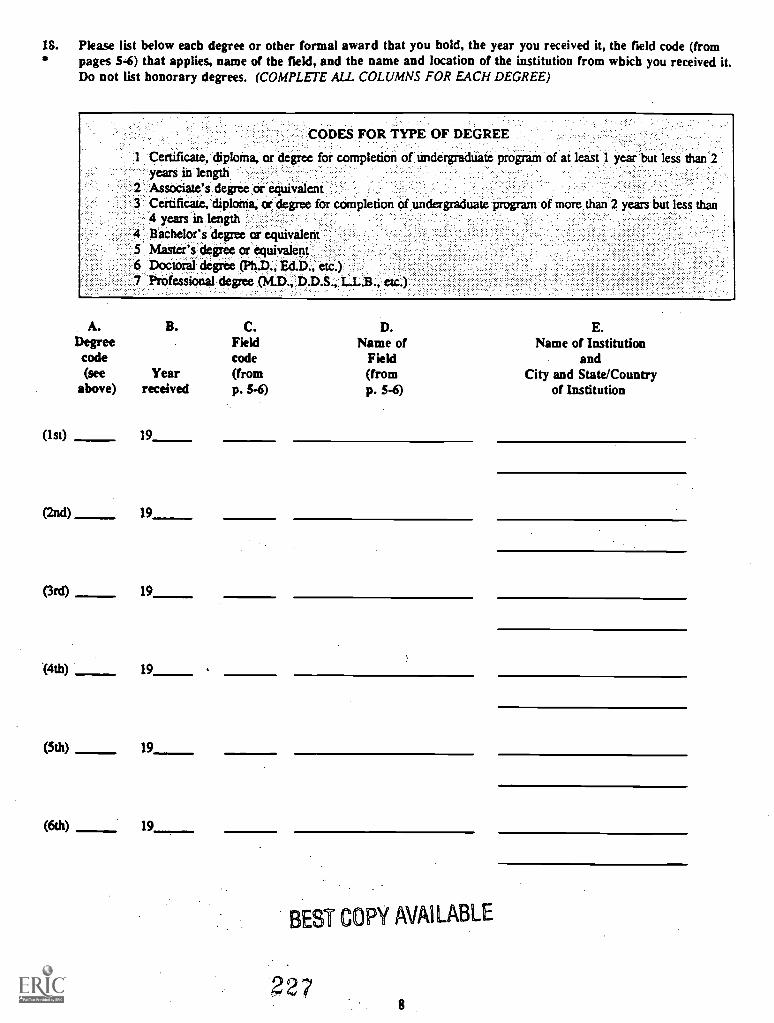
18. Please list below each degree or other formal award that you hold, the year you received it, the field code (frompages S-6) that applies, name of the field, and the name and location of the institution from which you received it.Do not list honorary degrees. (COMPLETE ALL COLUMNS FOR EACH DEGREE)
CODES FOR TYPE OF DEGREE
1 Certificate, diploma, or degree for completion of Undergraduate program of at least 1 year but less than 2years in length
..Associate's degree cir equivalentCertificate, diploma, or degree for completion of under4 years in length .
Bachelor's degree or equivalentMaster's degree or equivalentDoctoral degree (PhD., Ed.D., etc.)Professional degree (M.D.;.D.D.S.;.LL B., etc.)
program of more than 2 years.but less than
A.Degreecode(see
above)
B. C. D. E.Field Name of Name of Institutioncode Field and
Year (from (from City and State/Countryreceived p. S-6) p. 5-6) of Institution
(1st) 19
(2nd)_ 19
(3rd)- 19
(4th) 19
(5th) 19
(6th) 19
BEST COPY AVAILABLE
227
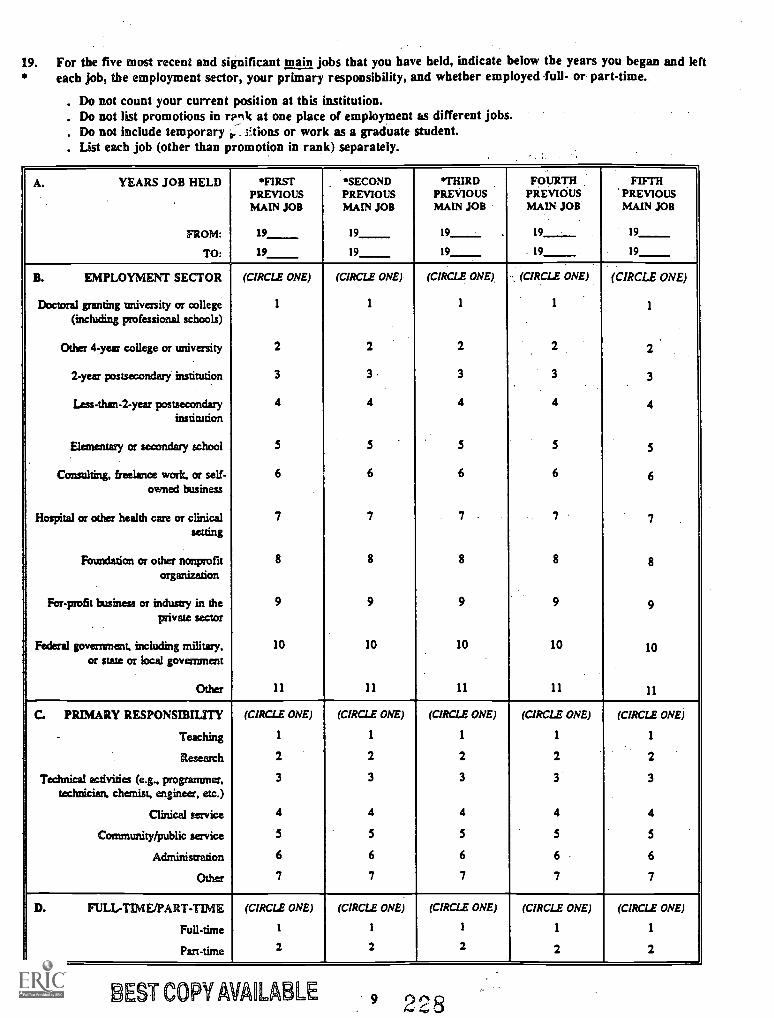
19. For the five most recent and significant main jobs that you have held, indicate below the years you began and lefteach job, the employment sector, your primary responsibility, and whether employed full- or part- time..
. Do not count your current position at this institution.
. Do not list promotions in rprili at one place of employment as different jobs.
. Do not include temporary ,,,..3itions or work as a graduate student.
. List each job (other than promotion in rank) separately.
A. YEARS JOB HELD
FROM:
TO:
FIRSTPREVIOUSMAIN JOB
19
SECONDPREVIOUSMAIN JOB
19
*THIRDPREVIOUSMAIN JOB
19
FOURTHPREVIOUSMAIN JOB
19
FIFTHPREVIOUSMAIN JOB
19
19 19 19 19 19
B. EMPLOYMENT SECTOR
Doctoral granting university or college(including professional schools)
Other 4-year college or university
2-year postsecondary institution
Less-than-2-year postsecondaryinstitution
Elementary or secondary school
Consulting, freelance work, or self-owned business
Hospital or other health care or clinicalsetting
Foundation or other nonprofitorganization
For-profit business or industry in theprivate sector
Federal government, including military,or state or local government
Other
(CIRCLE ONE)
1
2
3
4
5
6
7
8
9
10
11
(CIRCLE ONE)
1
2
34
S
6
7
8
9
10
11
(CIRCLE ONE)
1
2
3
4
5
6
7 .
8
9
10
11
, (CIRCLE ONE)
1
2
3
4
5
6
7
8
9
10
11
(CIRCLE ONE)
1
23
4
5
6
7
8
9
10
11
C. PRIMARY RESPONSIBILITY
Teaching
Research
Technical activities (e.g., programmer,tecimician, chemist, engineer, etc.)
Clinical service
Community/public service
Administration
Other
(CIRCLE ONE)
1
2
3
4
5
6
'7
(CIRCLE ONE)
1
2
3
4
5
6
7
(CIRCLE ONE)
1
2
3
4
5
6
7
(CIRCLE ONE)
1
2
3
4
5
6
7
(CIRCLE ONE)
1
2
3
4
5
6
7
D. FULL- TIME/PART -TIME
Full-time
Part-time
(CIRCLE ONE)
1
2
(CIRCLE ONE)
1
2
(CIRCLE ONE)
1
2
(CIRCLE ONE)
1
2
(CIRCLE ONE)
1
2
BEST COPY MAILABLE
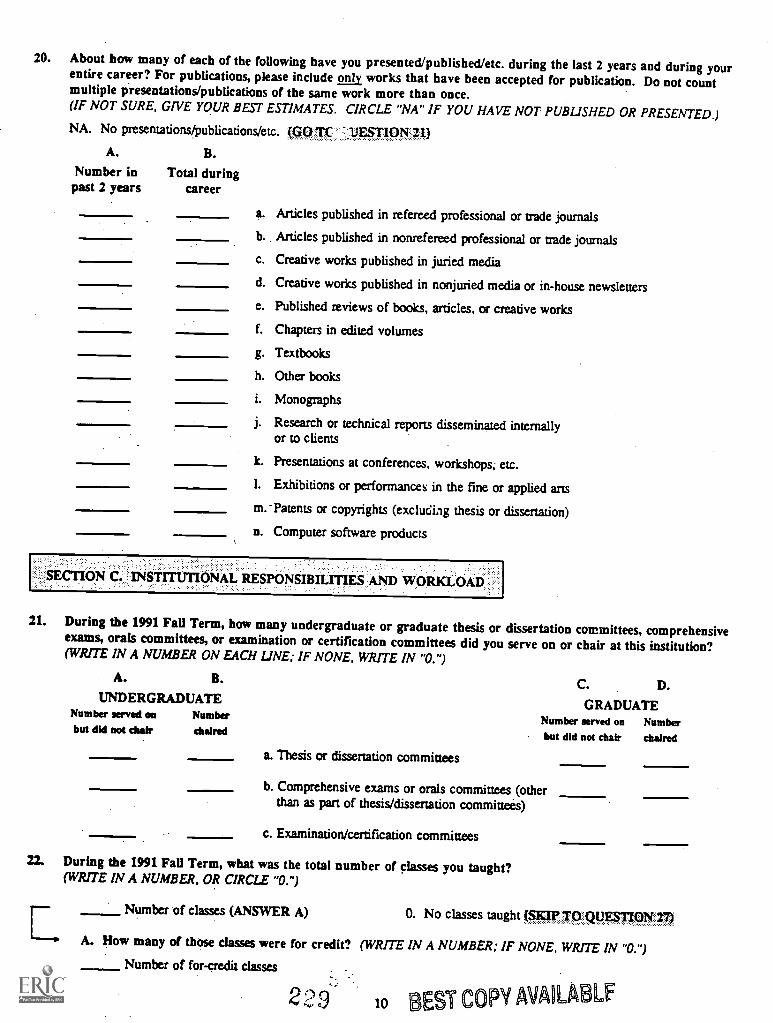
20. About how many of each of the following have you presented/published/etc. during the last 2 years and during yourentire career? For publications, please include only works that have been accepted for publication. Do not countmultiple presentations/publications of the same work more than once.(IF NOT SURE, GIVE YOUR BEST ESTIMATES. CIRCLE "NA" IF YOU HAVE NOT PUBLISHED OR PRESENTED.)
NA. No presentations/publications/etc. (GO TT -13ESTION 21)
A. B.
Number in Total duringpast 2 years career
a. Articles published in refereed professional or trade journals
b.. Articles published in nonrefereed professional or trade journals
c. Creative works published in juried media
d. Creative works published in nonjuried media or in-house newsletters
e. Published reviews of books, articles, or creative works
f. Chapters in edited volumes
g. Textbooks
h. Other books
i. Monographs
j. Research or technical reports disseminated internallyor to clients
k. Presentations at conferences, workshops, etc.
1. Exhibitions or performances in the fine or applied arts
m.-Patents or copyrights (excluding thesis or dissertation)
n. Computer software products
ON C. INSTITUTIONAL RESPONSIBILITIES AND WORKLOAD
21. During the 1991 Fall Term, how many undergraduate or graduate thesis or dissertation committees, comprehensiveexams, orals committees, or examination or certification committees did you serve on or chair at this institution?(WRITE IN A NUMBER ON EACH LINE; IF NONE, WRITE IN "O.")
A. B.
UNDERGRADUATENumber served on Numberbut did not chair chaired
C. D.
GRADUATENumber served on Numberbut did not chair chaired
a. Thesis or dissertation committees
b. Comprehensive exams or orals committees (otherthan as part of thesis/dissertation committees)
c. Examination/certification committees
22. During the 1991 Fall Term, what was the total number of classes you taught?(WRITE IN A NUMBER, OR CIRCLE "O.")
Number of classes (ANSWER A) 0. No classes taught (
A. How many of those classes were for credit? (WRITE IN A NUMBER; IF NONE, WRITE IN "0. ")Number of for-credit classes
229 10 EST COPY OKA LE'
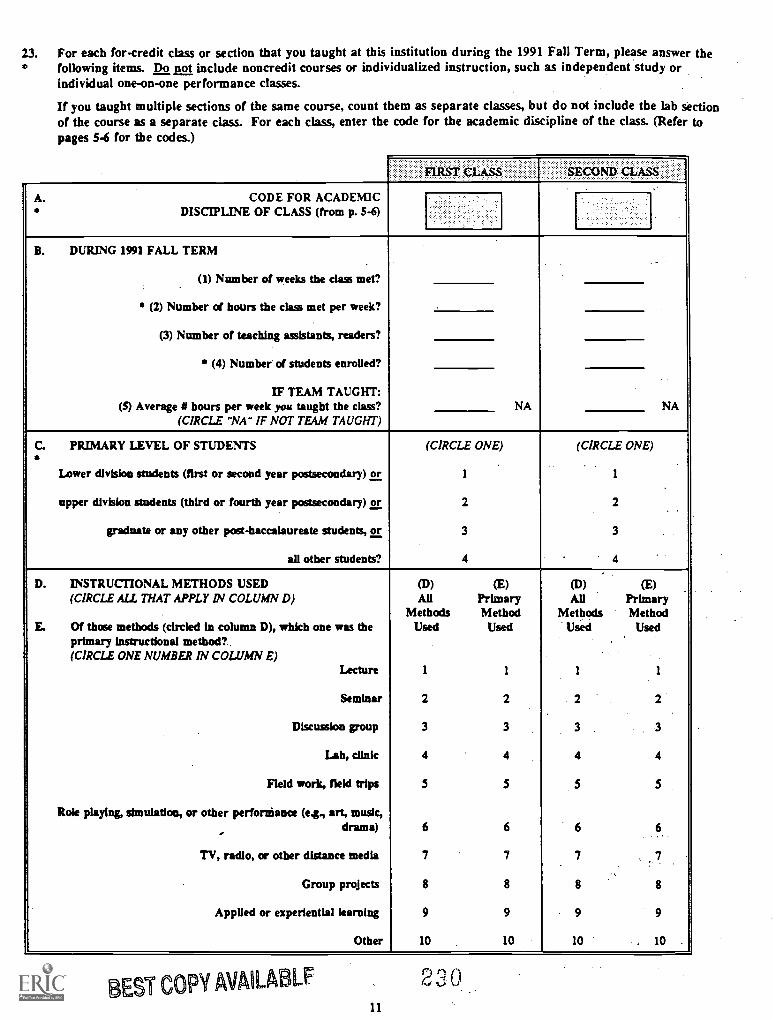
23. For each for-credit class or section that you taught at this institution during the 1991 Fall Term, please answer thefollowing items. Do not include noncredit courses or individualized instruction, such as independent study orindividual one-on-one performance classes.
If you taught multiple sections of the same course, count them as separate classes, but do not include the lab sectionof the course as a separate class. For each class, enter the code for the academic discipline of the class. (Refer topages 5-6 for the codes.)
FIRST CLASS SECOND CLASS
A. CODE FOR ACADEMICDISCIPLINE OF CLASS (from p. 5-6)
B. DURING 1991 FALL TERM
(1) Number of weeks the class met?
(2) Number of hours the class met per week?
(3) Number of teaching assistants, readers?
(4) Number of students enrolled?
IF TEAM TAUGHT:(5) Average # hours per week you taught the class? NA NA
(CIRCLE "NA" IF NOT TEAM TAUGHT)
C. PRIMARY LEVEL OF STUDENTS (CIRCLE ONE) (CIRCLE ONE)
Lower division students (first or second year postsecondary) or
upper division students (third or fourth year postsecondary) or
graduate or any other post-baccalaureate students, or
all other students?
1
2
3
4
1
2
3
4
D. INSTRUCTIONAL METHODS USED (D) (E) (D) (E)(CIRCLE ALL THAT APPLY IN COLUMN D) All Primary All Primary
Methods Method Methods MethodE. Of those methods (circled In column D), whkh one was the
primary instructional method?Used Used Used Used
(CIRCLE ONE NUMBER IN COLUMN E)Lecture 1 1 1 1
Seminar 2 2 2
Discussion group 3 3
Lab, clinic 4 4 4 4
Field work, field trips 5 5 5 5
Role playing, simulation, or other perforniance (e4, art, music,drama) 6 6
TV, radio, or other distance media 7 7 7
Group projects 8 8 8 8
AppUed or experiential learning 9 9 9 9
Other 10 10 10 . 10
BEST COPY AVAILABLF11
230
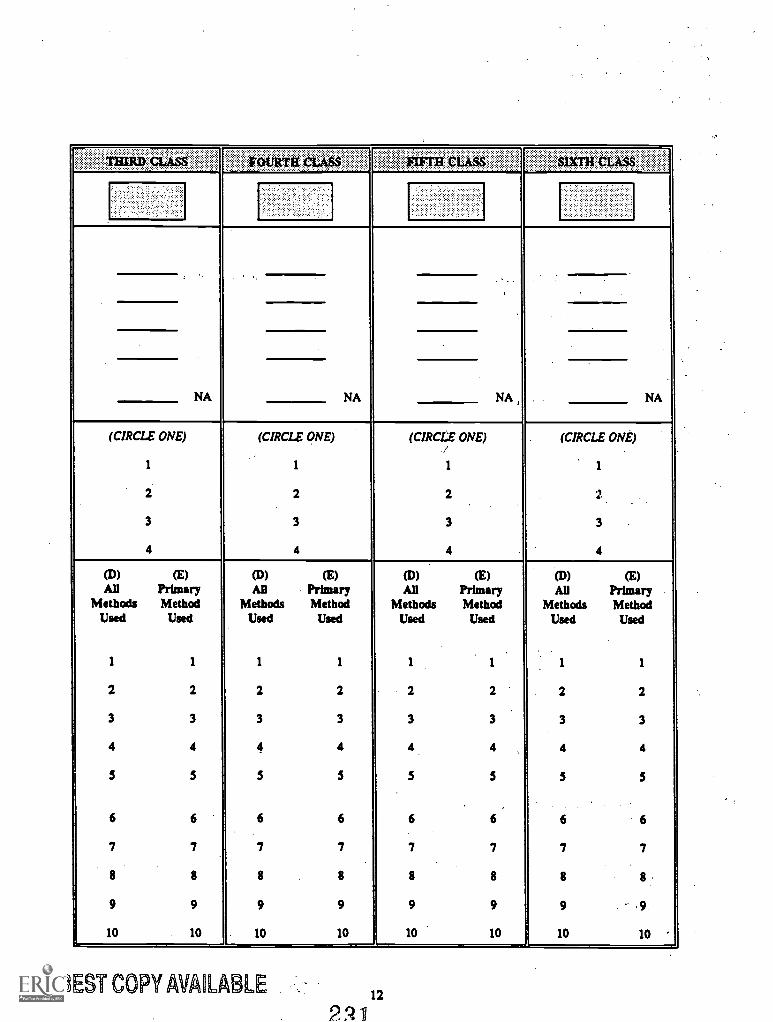
THIRD CLASS FOURTH CLASS MTH CLASS SIXTH CLASS
NA NA NA NA
(CIRCLE ONE)
1
2
3
4
(CIRCLE ONE)
1
2
3
4
(CIRCLE ONE)
1
2
3
4
(CIRCLE ONE)
1
2
3
4
(D) (E)All Primary
Methods MethodUsed Used
1 1
2 2
3 3
4 4
5 5
6 6'7 7
8 8
9 9
10 10
(D) (E)All Primary
Methods MethodUsed Used
1 1
2 2
3 3
4 4
5 5
6 6
7 7
8 8
9 9
10 10
(D) (E)All Primary
Methods MethodUsed Used
1 1
2 2'3 3
4 4
5 5
6 6
7 7
8 8
9 9
10 10
(D) (E)All Primary
Methods MethodUsed Used
1 1
2 2
3 3
4 4
5 5
6 6
7 7
8
9 .9.
10 10
BEST COPY AVAOLABLE12
2R1
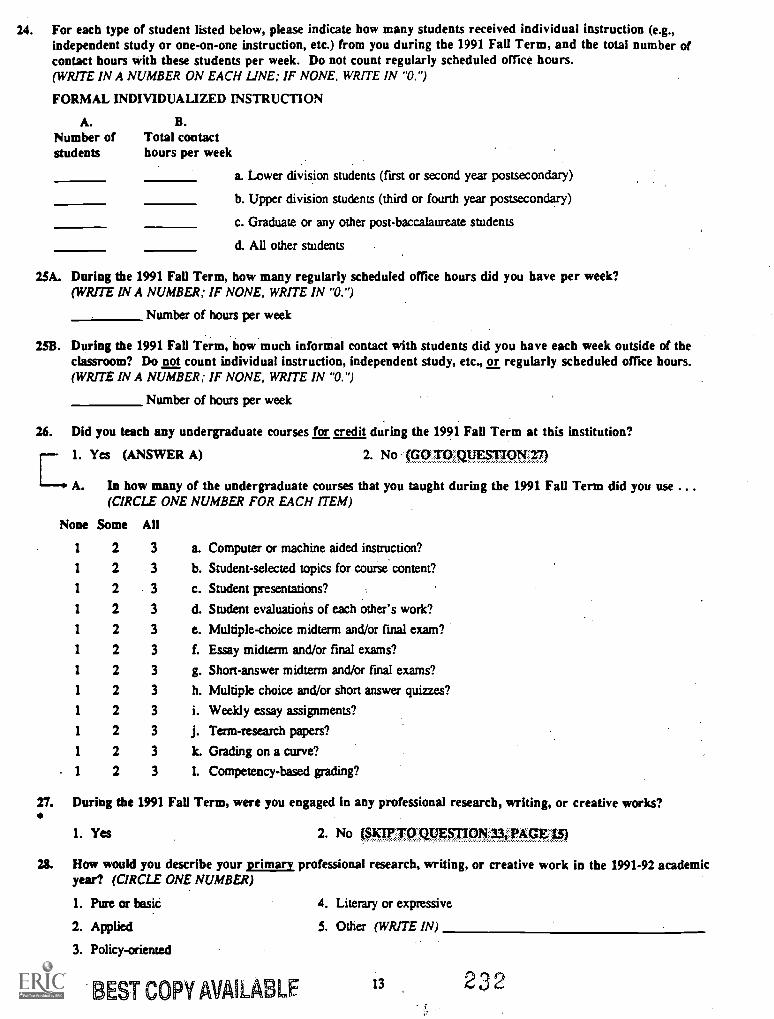
24. For each type of student listed below, please indicate how many students received individual instruction (e.g.,independent study or one-on-one instruction, etc.) from you during the 1991 Fall Term, and the total number ofcontact hours with these students per week. Do not count regularly scheduled office hours.(WRITE IN A NUMBER ON EACH LINE; IF NONE, WRITE IN "O.")
FORMAL INDIVIDUALIZED INSTRUCTION
A. B.Number of Total contactstudents hours per week
a. Lower division students (first or second year postsecondary)
b. Upper division students (third or fourth year postsecondary)
c. Graduate or any other post-baccalaureate students
d. All other students
25A. During the 1991 Fall Term, bow many regularly scheduled office hours did you have per week?(WRITE IN A NUMBER; IF NONE, WRITE IN "O.")
Number of hours per week
2SB. During the 1991 Fall Term, how much informal contact with students did you have each week outside of theclassroom? Do not count individual instruction, independent study, etc., or regularly scheduled office hours.(WRITE IN A NUMBER; IF NONE, WRITE IN "O.")
Number of hours per week
26. Did you teach any undergraduate courses for credit during the 1991 Fall Term at this institution?
1. Yes (ANSWER A) 2. No (GO TO 1./ESTI N 27)
A. In how many of the undergraduate courses that you taught during the 1991 Fall Term did you use . . .
(CIRCLE ONE NUMBER FOR EACH ITEM)
None Some All
1 2 3
1 2 3
1 2 3
1 2 3
1 2 3
1 2 3
1 2 3
1 2 3
1 2 3
1 2 3
1 2 3
1 2 3
a. Computer or machine aided instruction?
b. Student-selected topics for course content?
c. Student presentations?
d. Student evaluations of each other's work?
e. Multiple-choice midterm and/or final exam?
f. Essay midterm and/or final exams?
g. Short-answer midterm and/or final exams?
h. Multiple choice and/or short answer quizzes?
i. Weekly essay assignments?
j. Term-research papers?
k. Grading on a curve?
1. Competency-based grading?
27. During the 1991 Fall Term, were you engaged in any professional research, writing, or creative works?
1. Yes 2. No (SKTPT QUESTION
28. How would you describe your primary professional research, writing, or creative work in the 1991-92 academicyear? (CIRCLE ONE NUMBER)
1. Pure or basic
2. Applied
3. Policy-oriented
BEST COPY AVAILABLE
4. Literary or expressive
5. Other (WRITE IN)
13 232
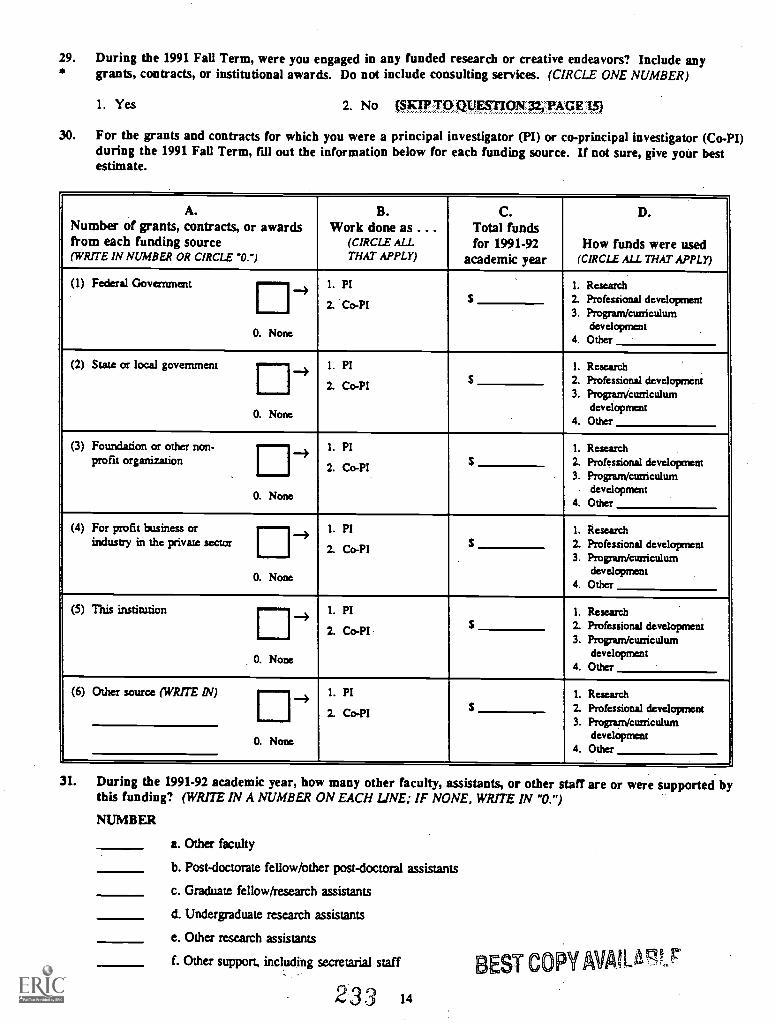
29. During the 1991 Fall Term, were you engaged in any funded research or creative endeavors? Include anygrants, contracts, or institutional awards. Do not include consulting services. (CIRCLE ONE NUMBER)
1. Yes 2. No (SKIP 'TO UESTION 32, PAGE
30. For the grants and contracts for which you were a principal investigator (PI) or co-principal investigator (Co-PI)during the 1991 Fall Term, fill out the information below for each funding source. If not sure, give your bestestimate.
A.Number of grants, contracts, or awardsfrom each funding source(WRITE IN NUMBER OR CIRCLE "0.")
B.Work done as ...
(CIRCLE ALLTHAT APPLY)
C.Total fundsfor 1991-92
academic year
D.
How funds were used(CIRCLE ALL THAT APPLY)
1. PI
2.. Co-PI $1. Research2. Professional development3. Program/curriculum
development4. Other
(1) Federal Government
0. None
(2) State or local government
0.
-4 1. PI
2. Co-PI
1. Research2. Professional development3. Proparnktmiculum
odtheverelopmentNone
(3) Foundation or other non-profit organization
.
0.
-4 1. PI
2. Co-PI $1. Research2. Professional development3. Program /curriculum
development4. OtherNone
(4) For profit business orindustry in the private sector
0.
--4 1. P1
2. Co-PI S1. Research2. Professional development3. Program/curriculum
development4. OtherNone
(5) This institution 1. PI
Co-PIo-PI, S1. Research2. Professional development3. Program/curriculum
development4. Other
-4
0. None
(6) Other source (WRITE DI) 1. PI
2. Co-PI S1. Research2. Professional development3. Program/curriculum
development4. Other
0. None
31. During the 1991.92 academic year, how many other faculty, assistants, or other staffare or were supported bythis funding? (WRITE IN A NUMBER ON EACH LINE; IF NONE, WRITE IN "O.")
NUMBER
a. Other faculty
b. Post-doctorate fellow/other post-doctoral assistants
c. Graduate fellow/research assistants
d. Undergraduate research assistants
e. Other research assistants
f. Other support, including secretarial staff
233 14
BEST COPY AVAILAT,r
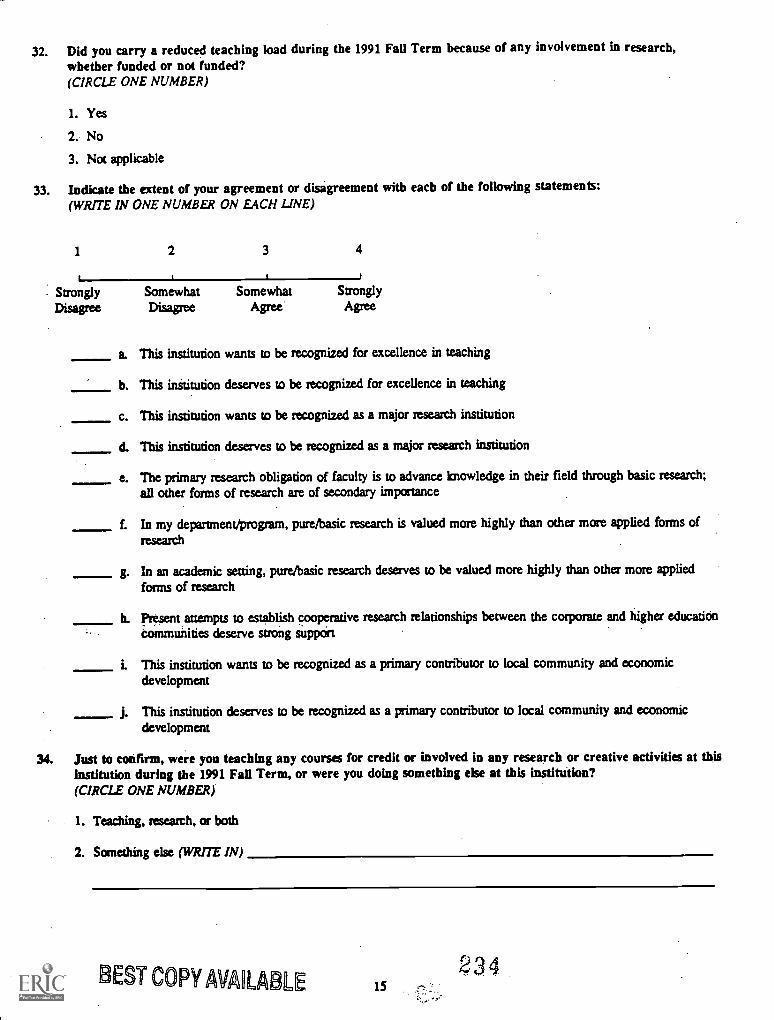
32. Did you carry a reduced teaching load during the 1991 Fall Term because of any involvement in research,whether funded or not funded?(CIRCLE ONE NUMBER)
1. Yes
2. No
3. Not applicable
33. Indicate the extent of your agreement or disagreement with each of the following statements:(WRITE IN ONE NUMBER ON EACH LINE)
1 2 3 4
Strongly Somewhat Somewhat StronglyDisagree Disagree Agree Agree
a. This institution wants to be recognized for excellence in teaching
b. This institution deserves to be recognized for excellence in teaching
c. This institution wants to be recognized as a major research institution
d. This institution deserves to be recognized as a major research institution
e. The primary research obligation of faculty is to advance knowledge in their field through basic research;all other forms of research are of secondary importance
f. In my department/program, pure/basic research is valued more highly than other more applied forms ofresearch
g. In an academic setting, pure/basic research deserves to be valued more highly than other more appliedforms of research
h. present attempts to establish cooperative research relationships between the corporate and higher educationCommunities deserve strong support
1. This institution wants to be recognized as a primary contributor to local community and economicdevelopment
This institution deserves to be recognized as a primary contributor to local community and economicdevelopment
34. Just to confirm, were you teaching any courses for credit or involved in any research or creative activities at thisinstitution during the 1991 Fall Term, or were you doing something else at this institution?(CIRCLE ONE NUMBER)
1. Teaching, research, or both
2. Something else (WRITE IN)
EST COPY MAU LE 15234
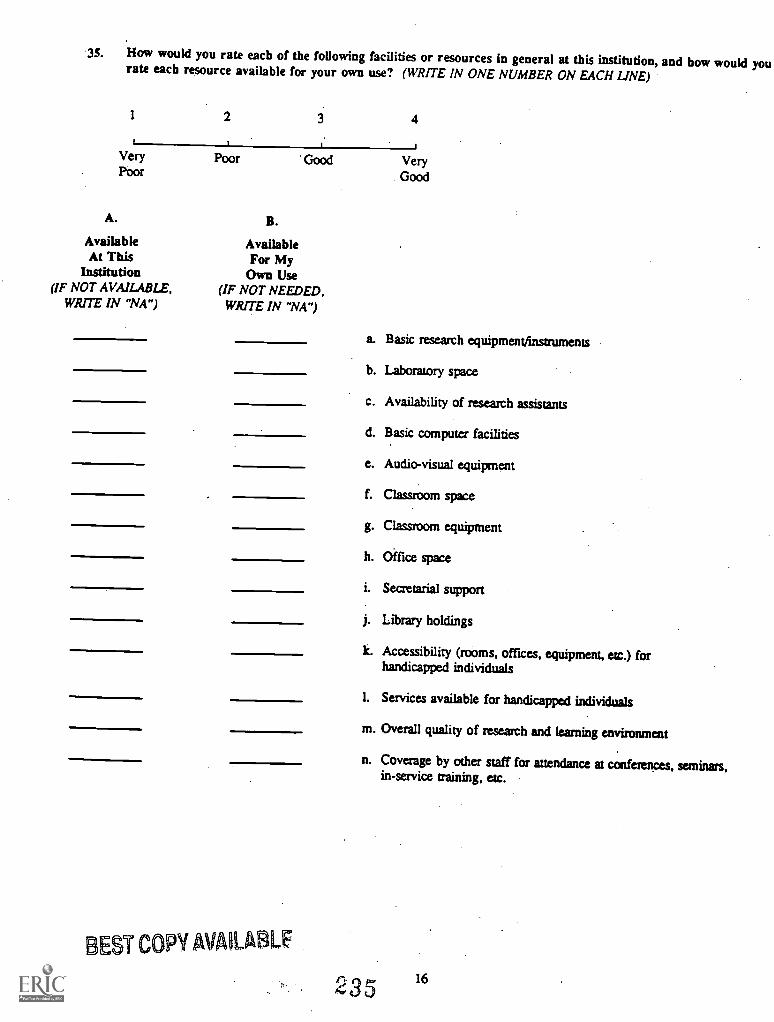
35. How would you rate each of the following facilities or resources in general at this institution, and bow would yourate each resource available for your own use? (WRITE IN ONE NUMBER ON EACH LINE)
1 2 3 4
Very Poor Good VeryPoor Good
A. B.
Available AvailableAt This For My
Institution Own Use(IF NOT AVAILABLE, (IF NOT NEEDED,
WRITE IN "NA") WRITE IN "NA")
BEST COPY AVAILABLIF
a. Basic research equipment/instruments
b. Laboratory space
c. Availability of research assistants
d. Basic computer facilities
e. Audio-visual equipment
1. Classroom space
g. Classroom equipment
h. Office space
i. Secretarial support
j. Library holdings
k. Accessibility (rooms, offices, equipment, etc.) forhandicapped individuals
1. Services available for handicapped individuals
m. Overall quality of research and learning environment
n. Coverage by other staff for attendance at conferences, seminars,in-service raining, etc.
235 16
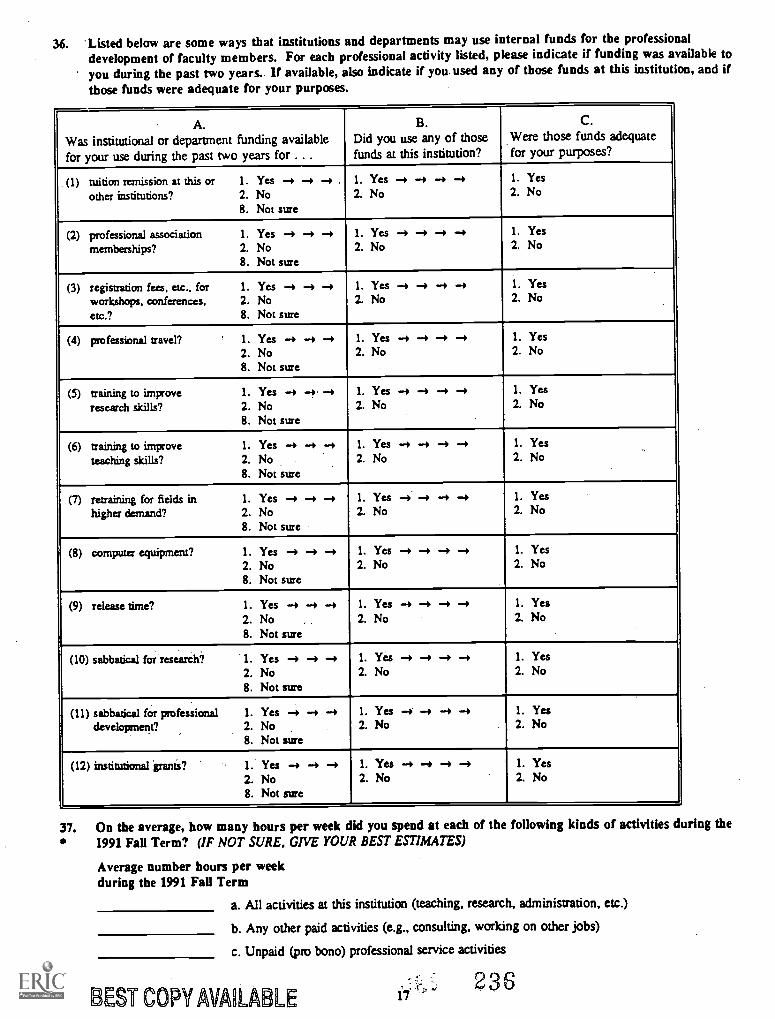
36. 'Listed below are some ways that institutions and departments may use internal funds for the professionaldevelopment of faculty members. For each professional activity listed, please indicate if funding was available toyou during the past two years.. If available, also indicate if you used any of those funds at this institution, and ifthose funds were adequate for your purposes.
A.Was institutional or department funding availablefor your use during the past two years for ...
B.Did you use any of thosefunds at this institution?
C.Were those funds adequatefor your purposes?
(1) tuition remission at this orother institutions?
1. Yes --) -)2. No8. Not sure
--) . I. Yes -4 --02. No
--+ -+ 1. Yes2. No
(2) professional associationmemberships?
I. Yes -4 -/2. No8. Not sure
-4 1. Yes -4 -,2. No
-, -4 1. Yes2. No
(3) registration fees, etc., forworkshops. conferences,etc.?
1. Yes -4 -,2. No8. Not sure
-4 1. Yes -) -42. No
-) -+ 1. Yes2. No
(4) professional travel? 1. Yes -4 -42. No8. Not sure
-.) 1. Yes -4 -42. No
-) -4 1. Yes2. No
(5) training to improveresearch skills?
1. Yes -) -),2. No8. Not sure
-4 1. Yes -, -42. No
-) -4 1. Yes2. No
(6) training to improveteaching skills?
1. Yes -) -)2. No8. Not sure
-4 1. Yes -) -42. No
-) -9 1. Yes2. No
(7) retraining for fields inhigher demand?
1. Yes -, -42. No8. Not sure
. 1. Yes -) -42. No
-, -4 1. Yes2. No
(8) computer equipment? 1. Yes -, -)2. No8. Not sure
-) 1. Yes -4 -+2. No
-) -4 1. Yes2. No
(9) release time? 1. Yes -) .2. No8. Not sure
-, I. Yes .2. No
..4 . 1. Yes2. No
(10) sabbatical for research? 1. Yes -+ -)2. No8. Not sure
--) 1. Yes -4 -42. No
-
-) -4 1. Yes2. No
(11) sabbatical for professionaldevelopment?
1. Yes -) -42. No8. Not sure
-4 1. Yes -) -42. No
-4 -4 1. Yes2. No
(12) institutional 'grants? 1. Yes -4 -,2. No8. Not sure
-, 1. Yes -) -42. No
-, -4 1. Yes2. No
37. On the average, how many hours per week did you spend at each of the following kinds of activities during the1991 Fall Term? (IF NOT SURE, GIVE YOUR BEST ESTIMATES)
Average number hours per weekduring the 1991 Fall Term
a. All activities at this institution (teaching, research, administration, etc.)
b. Any other paid activities (e.g., consulting, working on other jobs)
c. Unpaid (pro bono) professional service activities
BEST COPY MUM 1236
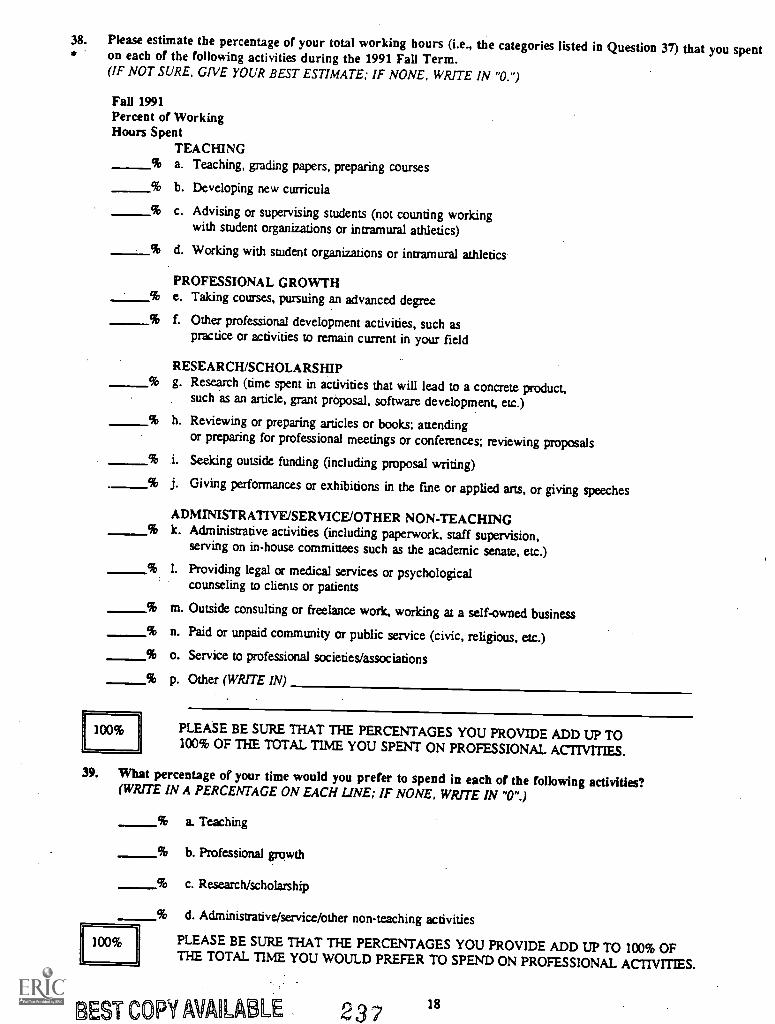
38. Please estimate the percentage of your total working hours (i.e., the categories listed in Question 37) that you spenton each of the following activities during the 1991 Fall Term.(IF NOT SURE, GIVE YOUR BEST ESTIMATE; IF NONE, WRITE IN "0. ")
Fall 1991Percent of WorkingHours Spent
TEACHING% a. Teaching, grading papers, preparing courses
% b. Developing new curricula
% c. Advising or supervising students (not counting workingwith student organizations or intramural athletics)
% d. Working with student organizations or intramural athletics
100%
PROFESSIONAL GROWTH% e. Taking courses, pursuing an advanced degree
% f. Other professional development activities, such aspractice or activities to remain current in your field
RESEARCH/SCHOLARSHIP% g. Research (time spent in activities that will lead to a concrete product,
such as an article, grant proposal, software development, etc.)
% h. Reviewing or preparing articles or books; attendingor preparing for professional meetings or conferences; reviewing proposals
% i. Seeking outside funding (including proposal writing)% j. Giving performances or exhibitions in the fine or applied arts, or giving speeches
ADMINISTRATIVE/SERVICE/OTHER NON-TEACHING% k. Administrative activities (including paperwork, staff supervision,
serving on in-house committees such as the academic senate, etc.)% 1. Providing legal or medical services or psychological
counseling to clients or patients
% m. Outside consulting or freelance work, working at a self-owned business
% n. Paid or unpaid community or public service (civic, religious, etc.)
% o. Service to professional societies/associations
% p. Other (WRITE IN)
PLEASE BE SURE THAT THE PERCENTAGES YOU PROVIDE ADD UP TO100% OF THE TOTAL TIME YOU SPENT ON PROFESSIONAL ACTIVITIES.
39. What percentage of your time would you prefer to spend in each of the following activities?(WRITE IN A PERCENTAGE ON EACH LINE; IF NONE, WRITE IN "0".)
100%
% a. Teaching
% b. Professional growth
% c. Research/scholarship
% d. Administrative/service/other non-teaching activities
PLEASE BE SURE THAT THE PERCENTAGES YOU PROVIDE ADD UP TO 100% OFTHE TOTAL TIME YOU WOULD PREFER TO SPEND ON PROFESSIONAL ACTIVITIES.
BEST COPY AVAILABLE 2 3 718
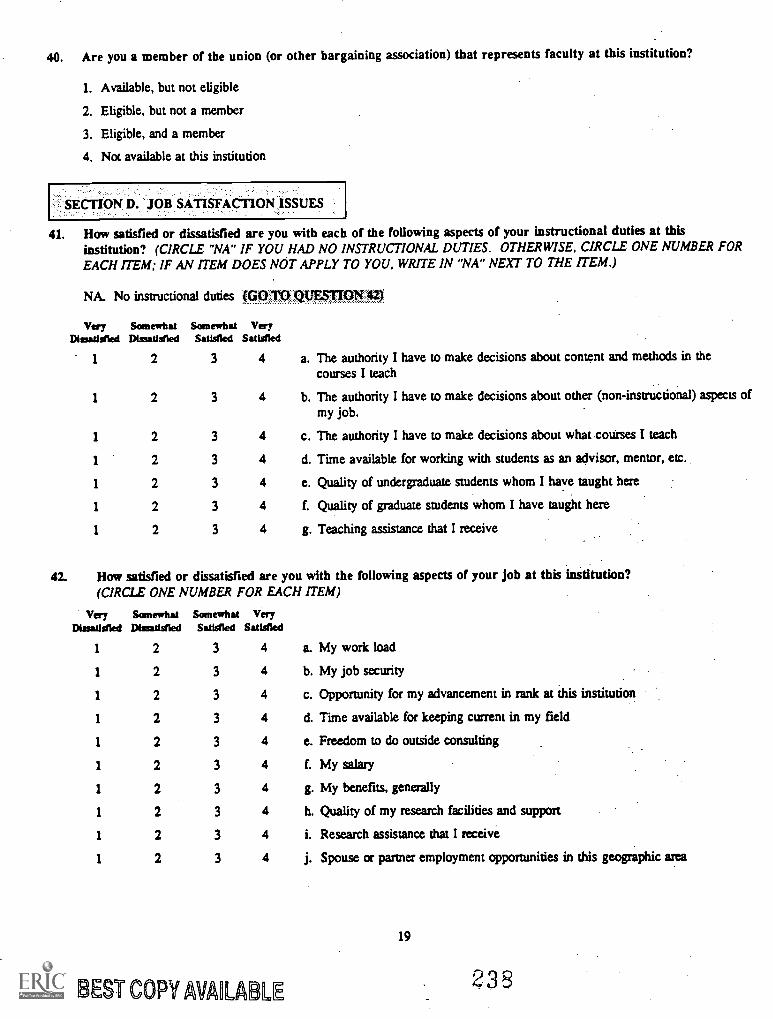
40. Are you a member of the union (or other bargaining association) that represents faculty at this institution?
1. Available, but not eligible
2. Eligible, but not a member
3. Eligible, and a member
4. Not available at this institution
41. How satisfied or dissatisfied are you with each of the following aspects of your instructional duties at thisinstitution? (CIRCLE "NA" IF YOU HAD NO INSTRUCTIONAL DUTIES. OTHERWISE, CIRCLE ONE NUMBER FOREACH ITEM; IF AN ITEM DOES NOT APPLY TO YOU, WRITE IN "NA" NEXT TO THE ITEM.)
NA. No instructional duties QUPTI 42)
Very SomewhatDissatisfied Dissatisfied
Somewhat VerySatisfied Satisfied
1 2 3 4
1 2 3 4
1 2 3 4
1 2 3 4
1 2 3 4
1 2 3 4
1 2 3 4
a. The authority I have to make decisions about content and methods in thecourses I teach
b. The authority I have to make decisions about other (non-instructional) aspects ofmy job.
c. The authority I have to make decisions about what courses I teach
d. Time available for working with students as an advisor, mentor, etc.
e. Quality of undergraduate students whom I have taught here
f. Quality of graduate students whom I have taught here
g. Teaching assistance that I receive
42. How satisfied or dissatisfied are you with the following aspects of your job at this institution?(CIRCLE ONE NUMBER FOR EACH ITEM)
a. My work load
b. My job security
c. Opportunity for my advancement in rank at this institution
d. Time available for keeping current in my field
e. Freedom to do outside consulting
f. My salary
g. My benefits, generally
h. Quality of my research facilities and support
i. Research assistance that I receive
j. Spouse or partner employment opportunities in this geographic area
Very SomewhatDissatisfied Dissatisfied
Somewhat VerySatisfied Satisfied
1 2 3 4
1 2 3 4
1 2 3 4
1 2 3 4
1 2 3 4
1 2 3 4
1 2 3 4
1 2 3 4
1 2 3 4
1 2 3 4
EST COPY AI/ARABLE
19
w35
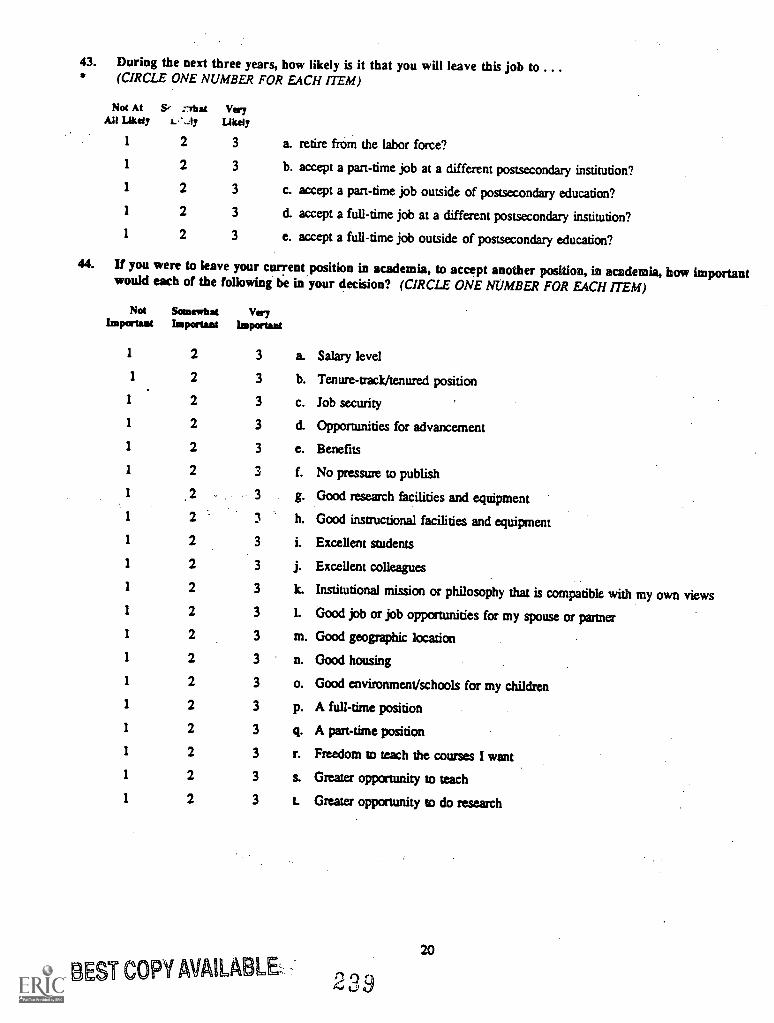
43. During the next three years, how likely is it that you will leave this job to ...(CIRCLE ONE NUMBER FOR EACH ITEM)
Not At Sr rrhat VeryAll Likely L.' .4ty Likely
1 2 3
1 2 3
1 2 3
1 2 3
1 2 3
a. retire from the labor force?
b. accept a part-time job at a different postsecondary institution?
c. accept a part-time job outside of postsecondary education?
d. accept a full-dine job at a different postsecondary institution?
e. accept a full-time job outside of postsecondary education?
44. If you were to leave your current position in academia, to accept another position, in academia, how importantwould each of the following be in your decision? (CIRCLE ONE NUMBER FOR EACH ITEM)
Nothaporteat
SomewhatImportant
VeryLaporte**
1 2 3 a. Salary level
1 2 3 b. Tenure-track/tenured position1 2 3 c. Job security
1 2 3 d. Opportunities for advancement
1 2 3 e. Benefits
1 2 3 f. No pressure to publish
1 2 3 g. Good research facilities and equipment1 2 3 h. Good instructional facilities and equipment1 2 3 i. Excellent students
1 2 3 j. Excellent colleagues
1 2 3 k. Institutional mission or philosophy that is compatible with my own views1 2 3 1. Good job or job opportunities for my spouse or partner1 2 3 m. Good geographic location
1 2 3 n. Good housing1 2 3 o. Good environment/schools for my children1 2 3 p. A full-time position
1 2 3 q. A part-time position
1 2 3 r. Freedom to teach the courses I want1 2 3 s. Greater opportunity to teach
1 2 3 t. Greater opportunity to do research
BEST COPY AVAILABLE. Q44
20
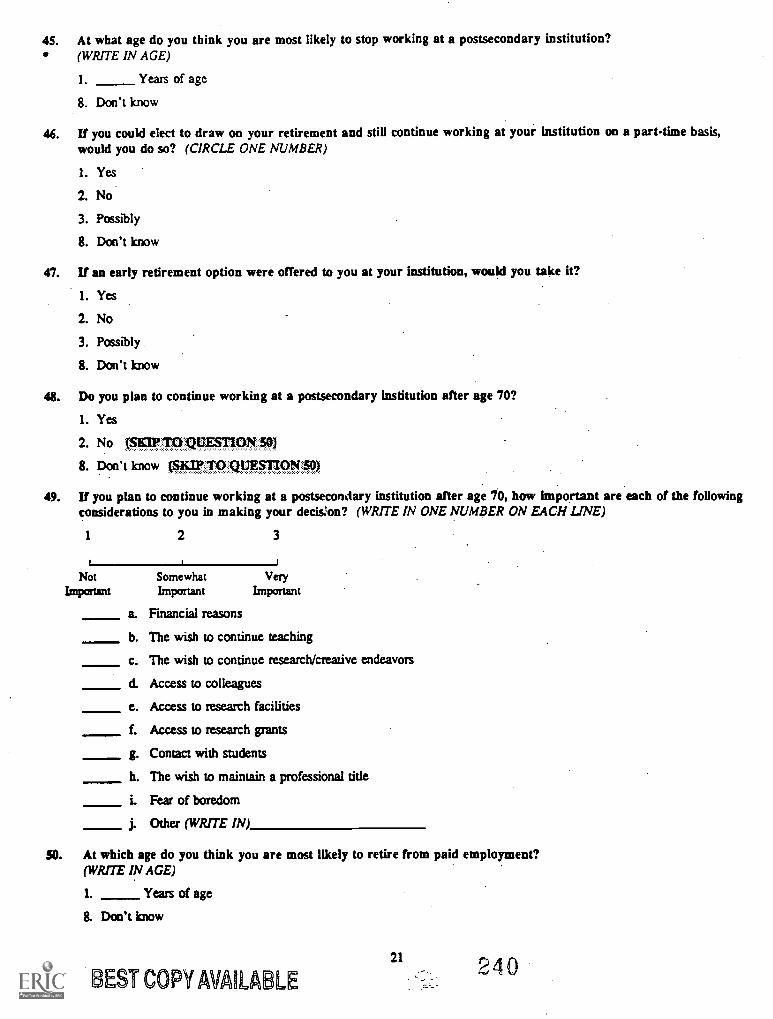
45. At what age do you think you are most likely to stop working at a postsecondary institution?(WRITE IN AGE)
1. Years of age
8. Don't know
46. If you could elect to draw on your retirement and still continue working at your institution on a part-time basis,would you do so? (CIRCLE ONE NUMBER)
1. Yes
2. No
3. Possibly
8. Don't know
47. If an early retirement option were offered to you at your institution, would you take it?
I. Yes
2. No
3. Possibly
8. Don't know
48. Do you plan to continue working at a postsecondary institution after age 70?
I. Yes
2. No (SKIP TQ QUESTION 50)
8. Don't know (8K4' QUE5:179N
49. If you plan to continue working at a postsecondary institution after age 70, how important are each of the followingconsiderations to you in making your decision? (WRITE IN ONE NUMBER ON EACH LINE)
1 2 3
Not Somewhat VeryImportant Important Important
a. Financial reasons
b. The wish to continue teaching
c. The wish to continue research/creative endeavors
d. Access to colleagues
e. Access to research facilities
f. Access to research grants
g. Contact with students
h. The wish to maintain a professional title
i. Fear of boredom
j. Other (WRITE IN)
50. At which age do you think you are most likely to retire from paid employment?(WRITE IN AGE)
1. Years of age
8. Don't know
21
BEST COPY AVAILABLE240

SECTION E. COMPENSATION
Note: Your responses to these items as with all other items in this questionnaire are voluntary and strictly confidential, will beused only in statistical summaries, and will not be disclosed to your institution or to any individual or group. Furthermore, allinformation that would permit identification of individuals or institutions will be removed from the survey files.
51. For the calendar year 1991, estimate your gross earnings before taxes from each of the sources listed below.Please do not record any earnings in more than one category.(IF NOT SURE, GIVE YOUR BEST ESTIMATES; IF NONE, WRITE IN "0. ")
Income from this institution:
a. Basic salary
b. Other teaching at this institution not includedin basic salary (e.g., for summer session)
S c. Supplements not included in basic salary (foradministration, research, coaching sports, etc.)
$ d. Non-monetary compensation, such as food, housing, car(Do not include employee benefits such as medical, dental, or life insurance)
e. Any other income from this institution
Income from other sources:
f. Employment at another academic institution
g. Legal or medical services or psychologizzl counseling
h. Outside consulting, consulting business or freelance work
i. Self-owned business (other than consulting)
j. Professional performances or exhibitions
k. Speaking fees, honoraria
L Royalties or commissions
$ m. Any other employment
$ n. Non-monetary compensation, such as food, housing, car(Do not include employee benefits such as medical, dental, or life insurance)
Other sources of earned Income (WRITE IN BELOW):
$
o.
52. For the calendar year 1991, what was the total combined income of your household?
Total combined household income
53. For the calendar year 1991, how many dependents did you have, not including yourself"? (A dependent is someonereceiving at least half of his or her support from you.)
Number of dependents
BEST COPY AVAILABLE 4 -11
22
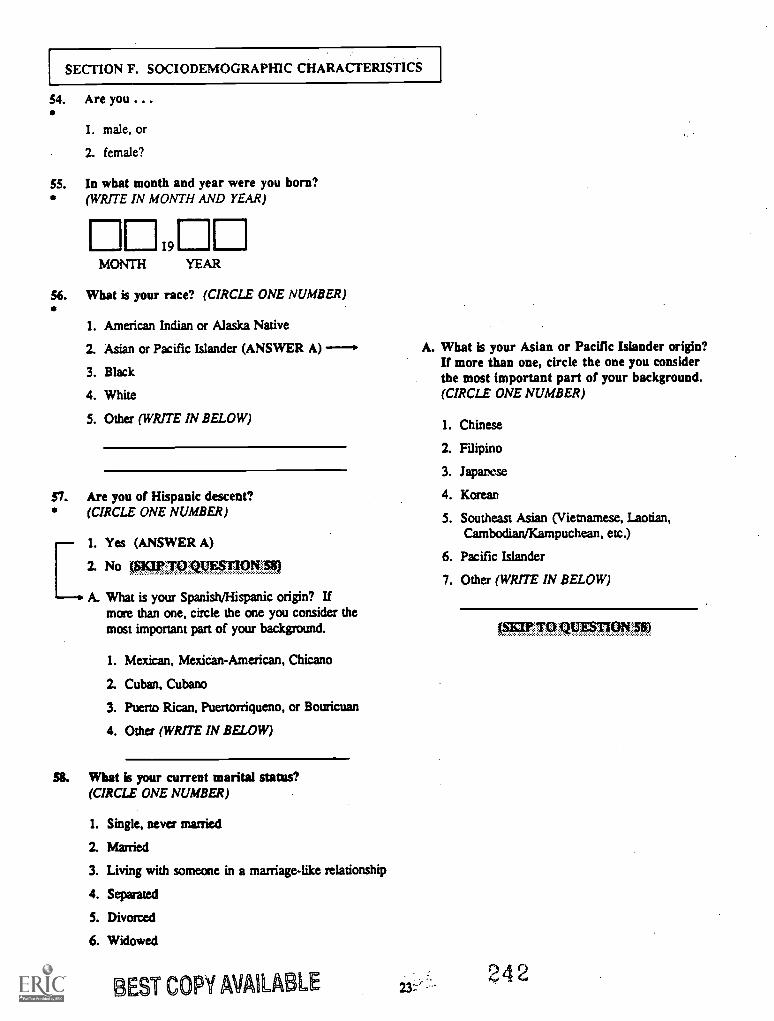
SECTION F. SOCIODEMOGRAPHIC CHARACTERISTICS
54. Are you ...
1. male, or
2. female?
55. In what month and year were you born?(WRITE IN MONTH AND YEAR)
56.
MONTH
19
YEAR
What is your race? (CIRCLE ONE NUMBER)
1. American Indian or Alaska Native
2. Asian or Pacific Islander (ANSWER A)
3. Black
4. White
5. Other (WRITE IN BELOW)
57. Are you of Hispanic descent?(CIRCLE ONE NUMBER)
1. Yes (ANSWER A)
2. No ESKIP , , ,t1M1, ,e L5V
A. What is your Spanish/Hispanic origin? Ifmore than one, circle the one you consider themost important part of your background.
1. Mexican, Mexican-American, Chicano
2. Cuban, Cubano
3. Puerto Rican, Puertorriqueno, or Bouricuan
4. Other (WRITE IN BELOW)
58. What is your current marital status?(CIRCLE ONE NUMBER)
1. Single, never married
2. Married
3. Living with someone in a marriage-like relationship
4. Separated
5. Divorced
6. Widowed
BEST COPY AV ILABLE
A. What is your Asian or Pacific Islander origin?If more than one, circle the one you considerthe most important part of your background.(CIRCLE ONE NUMBER)
1. Chinese
2. Filipino
3. Japanese
4. Korean
5. Southeast Asian (Vietnamese, Laotian,Cambodian/Kampuchean, etc.)
6. Pacific Islander
7. Other (WRITE IN BELOW)
P TQF IJES11O1
242
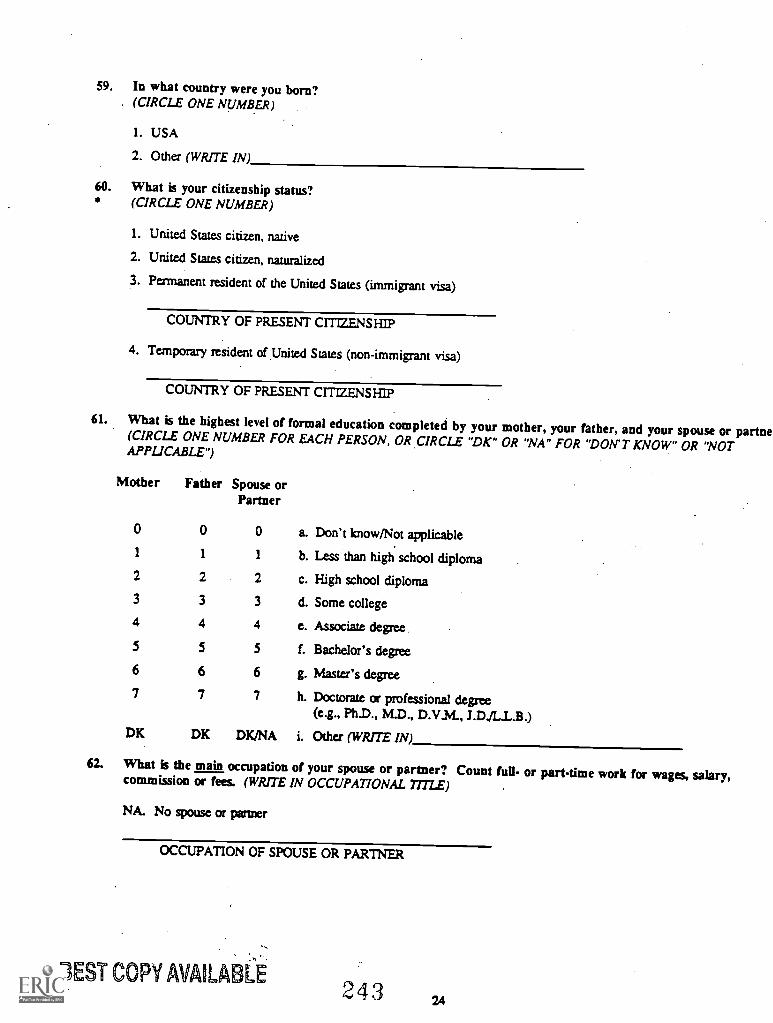
59. In what country were you born?(CIRCLE ONE NUMBER)
1. USA
2. Other (WRITE IN)
60. What is your citizenship status?(CIRCLE ONE NUMBER)
1. United States citizen, native
2. United States citizen, naturalized
3. Permanent resident of the United States (immigrant visa)
COUNTRY OF PRESENT CITIZENSHIP
4. Temporary resident of United States (non-immigrant visa)
COUNTRY OF PRESENT CITIZENSHIP
61. What is the highest level of formal education completed by your mother, your father, and your spouse or partne(CIRCLE ONE NUMBER FOR EACH PERSON, OR CIRCLE "DK" OR "NA" FOR "DON'T KNOW" OR "NOTAPPLICABLE")
Mother Father Spouse orPartner
0 0 0 a. Don't know/Not applicable1 1 1 b. Less than high school diploma2 2 2 c. High school diploma3 3 3 d. Some college4 4 4 e. Associate degree
5 5 5 f. Bachelor's degree
6 6 6 g. Master's degree7 7 7 h. Doctorate or professional degree
(e.g., Ph.D., M.D., D.V.M., J.DJL.L.B.)DK DK DK/NA i. Other (WRITE IN)
62. What is the main occupation of your spouse or partner? Count full- or parttime work for wages, salary,commission or fees. (WRITE IN OCCUPATIONAL TITLE)
NA. No spouse or partner
OCCUPATION OF SPOUSE OR PARTNER
BEST COPY MLA243 24
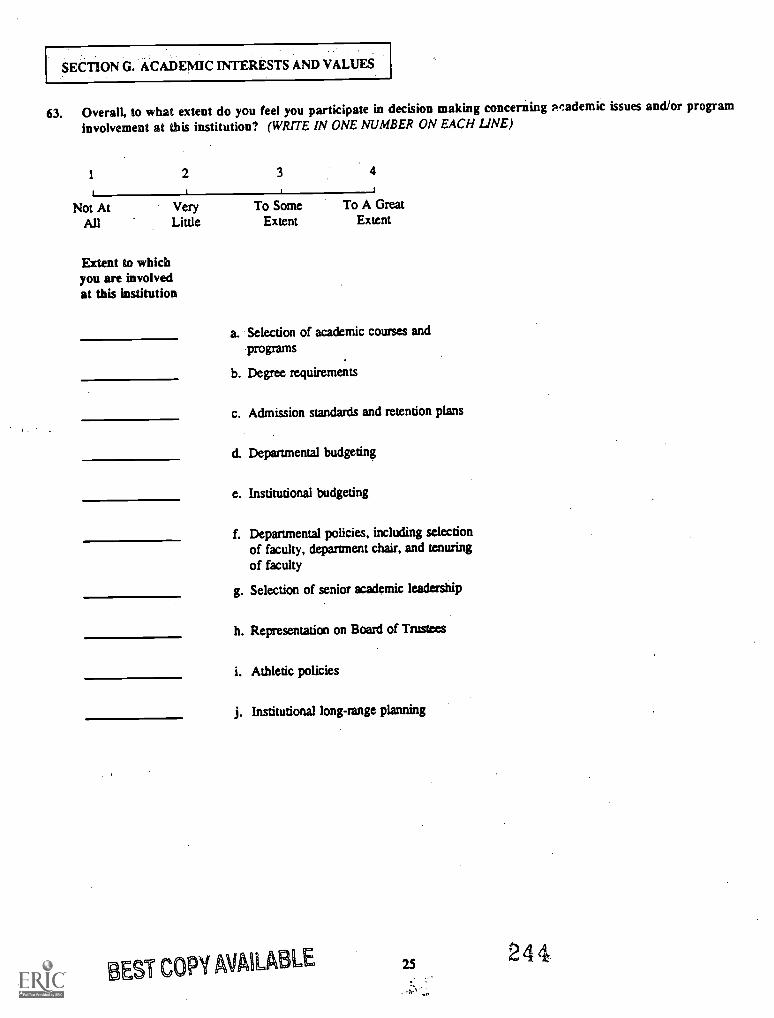
SECTION G. ACADEMIC INTERESTS AND VALUES
63. Overall, to what extent do you feel you participate in decision making concerning Academic issues and/or program
involvement at this institution? (WRITE IN ONE NUMBER ON EACH LINE)
1 2 3 4
1I
Not At Very To Some To A GreatAll Little Extent Extent
Extent to whichyou are involvedat this institution
a. Selection of academic courses andprograms
b. Degree requirements
c. Admission standards and retention plans
d. Departmental budgeting
e. Institutional budgeting
f. Departmental policies, including selectionof faculty, department chair, and tenuringof faculty
g. Selection of senior academic leadership
h. Representation on Board of Trustees
i. Athletic policies
j. Institutional long-range planning
BEST COPY AVAILArio LE 25
24 4
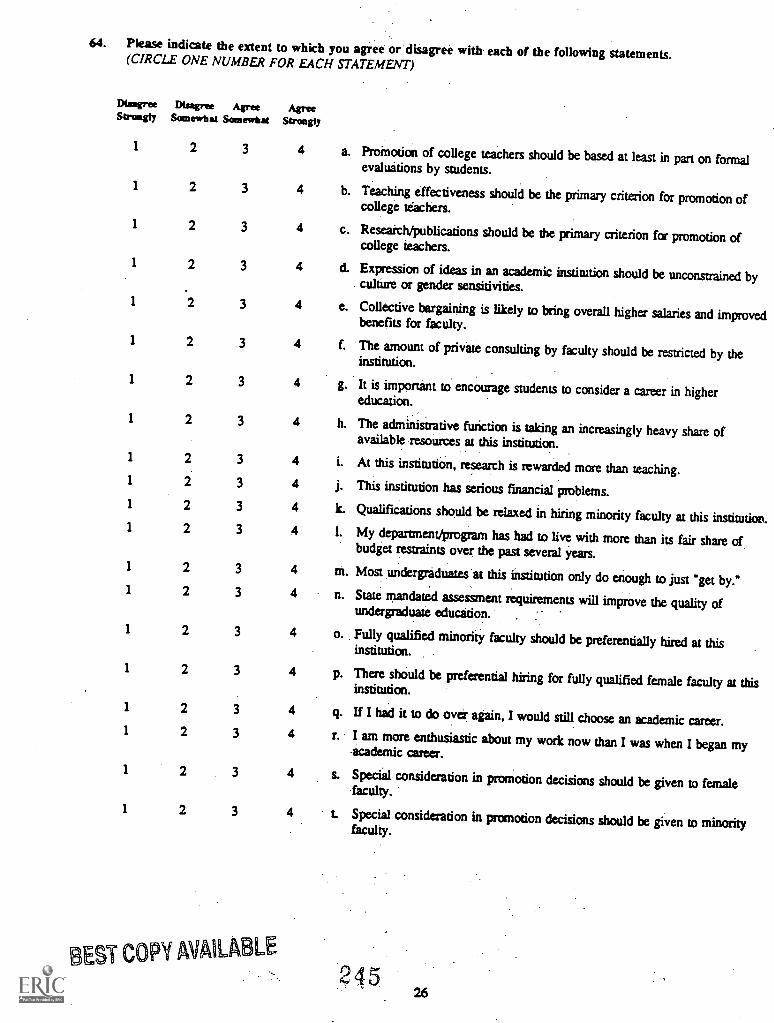
64. Please indicate the extent to which you agree or disagree with each of the following statements.(CIRCLE ONE NUMBER FOR EACH STATEMENT)
DisagreeStrongly
Disagree AgreeSomewhat Somewhat
AgreeStrongly
1 2 3 4
1 2 3 4
1 2 3 4
1 2 3 4
1 2 3 4
1 2 3 4
1 2 3 4
1 2 3 4
1 2 3 4
1 2 3 4
1 2 3 4
1 2 3 4
1 2 3 4
1 2 3 4
1 2 3 4
1 2 3 4
1 2 3 4
1 2 3 4
1 2 3 4
1 2 3 4
BEST COPY MIA,TT: LE
a. Proinotion of college teachers should be based at least in part on formalevaluations by students.
b. Teaching effectiveness should be the primary criterion for promotion ofcollege teachers.
c. Research/publications should be the primary criterion for promotion ofcollege teachers.
d. Expression of ideas in an academic institution should be unconstrained by. culture or gender sensitivities.
e. Collective bargaining is likely to bring overall higher salaries and improvedbenefits for faculty.
f. The amount of private consulting by faculty should be restricted by theinstitution.
g. It is important to encourage students to consider a career in highereducation.
h. The administrative function is taking an increasingly heavy share ofavailable resources at this institution.
i. At this institution, research is rewarded more than teaching.j. This institution has serious financial problems.
L Qualifications should be relaxed in hiring minority faculty at this institution.1. My department/program has had to live with more than its fair share of
budget restraints over the past several years.
tn. Most undergraduates at this institution only do enough to just "get by."n. State mandated assessment requirements will improve the quality of
undergraduate education. . :
o. Fully qualified minority faculty should be preferentially hired at thisinstitution.
p. There should be preferential hiring for fully qualified female faculty at thisinstitution.
q. If I had it to do over again, I would still choose an academic career.r. I am more enthusiastic about my work now than I was when I began my
-academic career.
s. Special consideration in promotion decisions should be given to femalefaculty.
t. Special consideration in promotion decisions should be given to minorityfaculty.
2 4 526
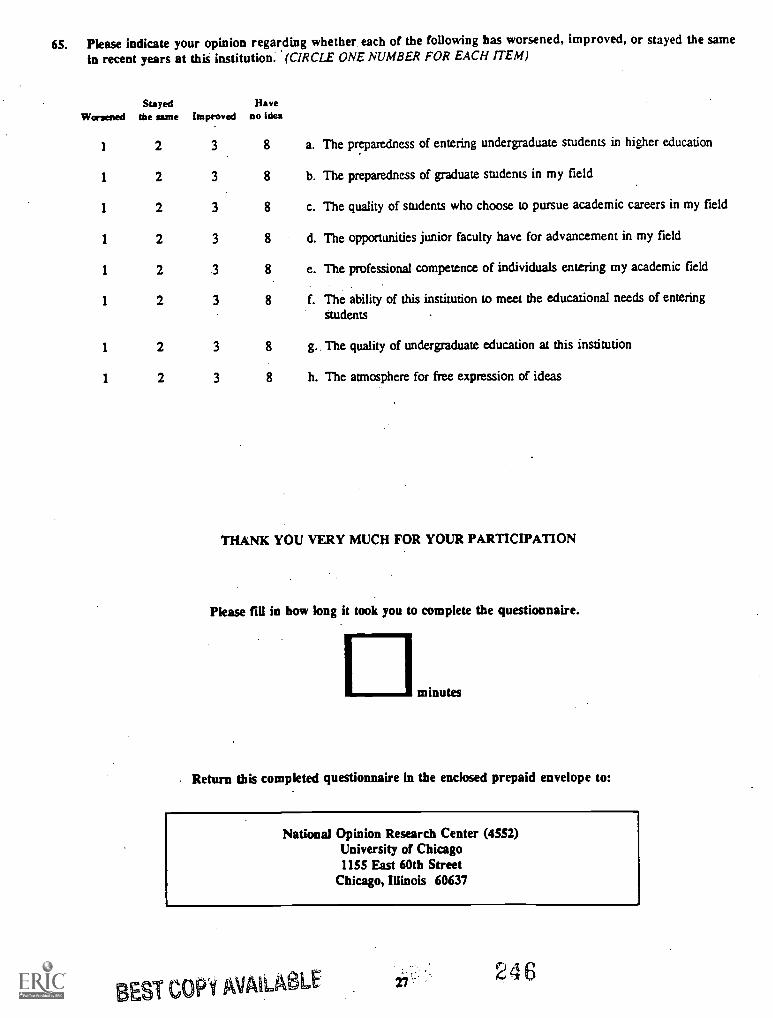
65. Please indicate your opinion regarding whether each of the following has worsened, improved, or stayed the samein recent years at this institution.' (CIRCLE ONE NUMBER FOR EACH ITEM)
WorsenedStayed
the same ImprovedHave
no Idea
1 2 3 8
1 2 3 8
I 2 3 8
1 2 3 8
1 2 3 8
1 2 3 8
1 2 3 8
1 2 3 8
a. The preparedness of entering undergraduate students in higher education
b. The preparedness of graduate students in my field
c. The quality of students who choose to pursue academic careers in my field
d. The opportunities junior faculty have for advancement in my field
e. The professional competence of individuals entering my academic field
f. The ability of this institution to meet the educational needs of enteringstudents
g.. The quality of undergraduate education at this institution
h. The atmosphere for free expression of ideas
THANK YOU VERY MUCH FOR YOUR PARTICIPATION
Please fill in bow long it took you to complete the questionnaire.
minutes
Return this completed questionnaire in the enclosed prepaid envelope to:
National Opinion Research Center (4552)University of Chicago1155 East 60th Street
Chicago, Illinois 60637
BEST COY AVAILABLE 7' 246
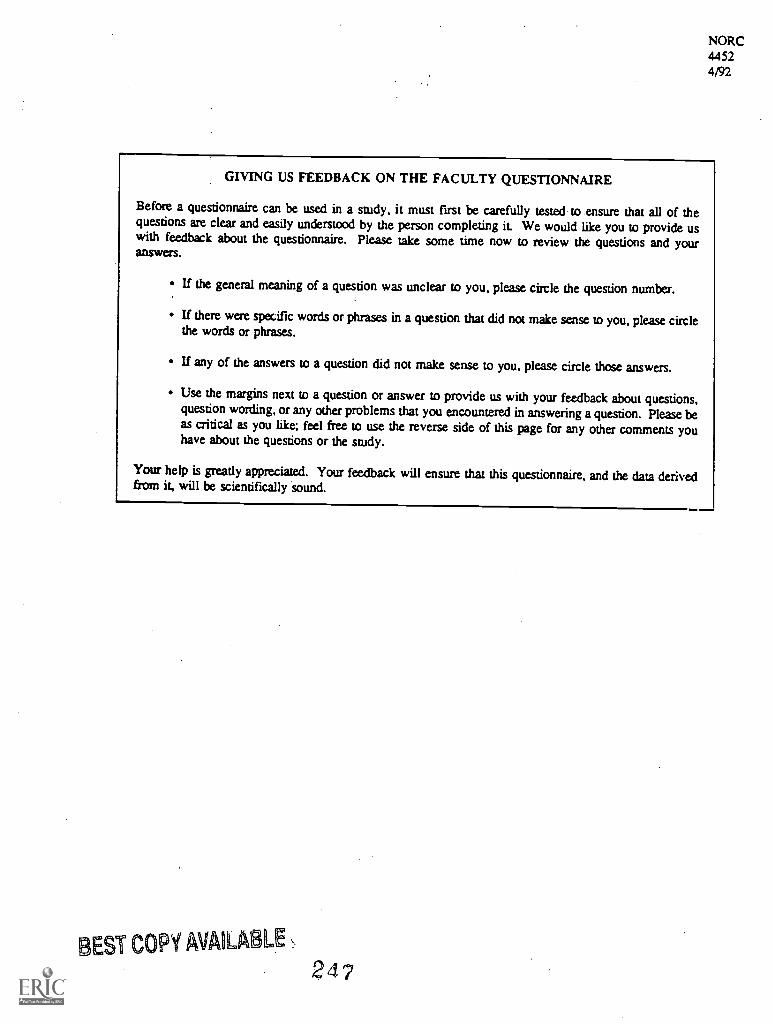
NORC44524/92
GIVING US FEEDBACK ON THE FACULTY QUESTIONNAIRE
Before a questionnaire can be used in a study, it must first be carefully tested to ensure that all of thequestions are clear and easily understood by the person completing it. We would like you to provide uswith feedback about the questionnaire. Please take some time now to review the questions and youranswers.
If the general meaning of a question was unclear to you, please circle the question number.
If there were specific words or phrases in a question that did not make sense to you, please circlethe words or phrases.
If any of the answers to a question did not make sense to you, please circle those answers.
Use the margins next to a question or answer to provide us with your feedback about questions,question wording, or any other problems that you encountered in answering a question. Please beas critical as you like; feel free to use the reverse side of this page for any other comments youhave about the questions or the study.
Your help is greatly appreciated. Your feedback will ensure that this questionnaire, and the data derivedfrom it, will be scientifically sound.
BEST COPY AVAILABLE
24 '7

LABEL
OMB: No. 1SS3-06011Expiration Date: L7/93
U.S. Department of EducationOffice of Educational Research and Improvement
National Center for Education Statistics
1993 NATIONAL STUDY OF POSTSECONDARY FACULTY
Pilot Test
FACULTY REINTERVIEWQUESTIONNAIRE
Co-sponsored by:
Contractor:
All information on this form will be kept confidential and will not bedisclosed or released to your institution or any other group or individual.
National Science FoundationNational Endowment for the Humanities
National Opinion Research Center (NORC)University of Chicago1155 East 60th StreetChicago, Illinois 60637Toll-Free Number: 1-800-733-NORC
249
a T COPY AVAILABLE
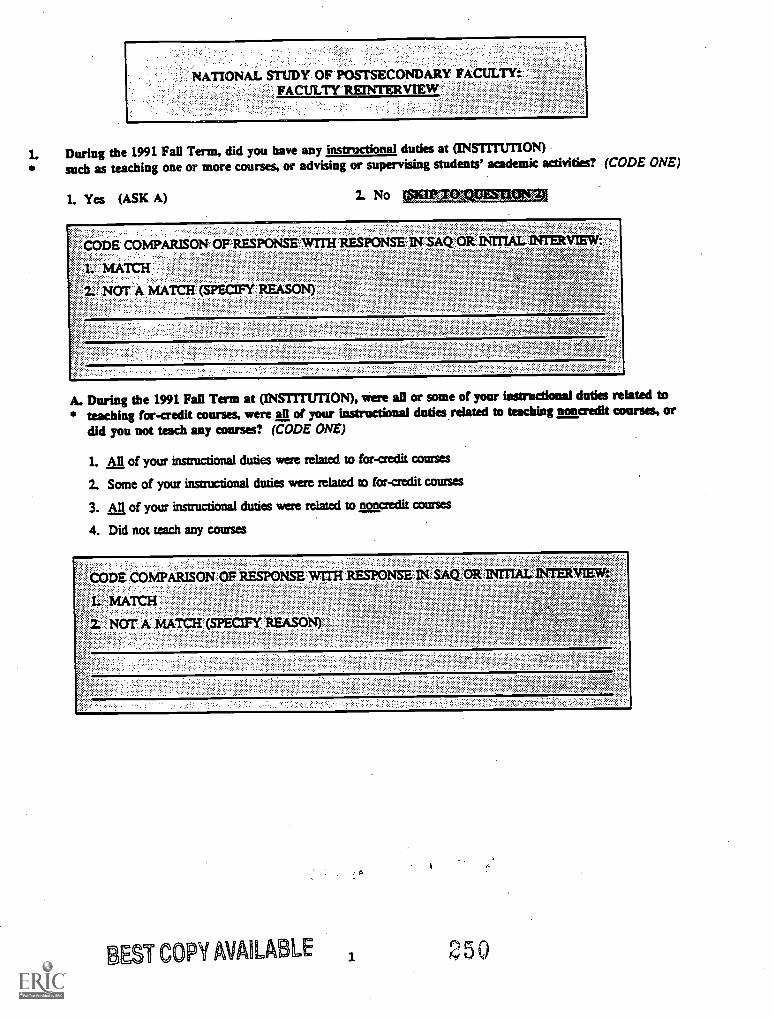
1. During the 1991 Fall Term, did you have any instructional duties at (INSTITUTION)such as teaching one or more courses, or advising or supervising students' academic activities? (CODE ONE)
1. Yes (ASK A) I No Mi...t.Cing}MMI
CODE COMpARISON'OiRESPONSE' WITH RESPONSE INSA
1. MATCH.'`:
2. NOT kMATCH (SPECIFY REASON)
A. During the 1991 Fall Term at (INSTITUTION), were all or some of your instrucdooal duties related toteaching for-credit courses, were all of your instructional duties related to teaching noncredit courses, or
did you not teach any courses? (CODE ONE)
1. All of your instructional duties were related to for-credit courses
2. Some of your instructional duties were related to for-credit courses
3. All of your instructional duties were related to noncredit courses
4. Did not teach any courses
CODE COMPARISON OF RESPONSE WITH RESPONSE IN SAQ ORINITIAL INTERVIEW:
I. MATCH
2. NOT A MATCH (SPECIFY REASON)
T COPY AVAILABLE 2 5 0
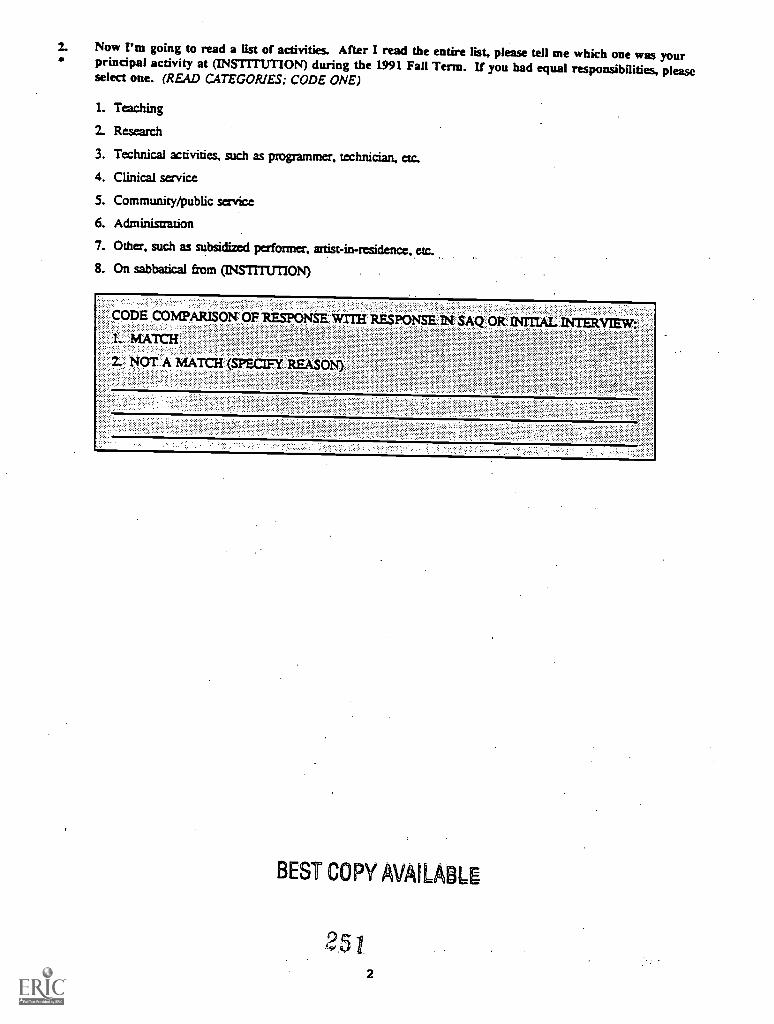
2. Now I'm going to read a list of activities. After I read the entire list, please tell me which one was yourprincipal activity at (INSTITUTION) during the 1991 Fall Term. If you had equal responsibilities, pleaseselect one. (READ CATEGORIES; CODE ONE)
1. Teaching
Research
3. Technical activities, such as programmer, technician, etc.
4. Clinical service
5. Community/public service
6. Administration
7. Other, such as subsidized performer, artist-in-residence, etc.
8. On sabbatical from (INSTITUTION)
CODE COMPARISON OF RESPONSE WTTE RESPONSE IN SAQ OR INITIAL INTERVIEW:I. MATCH.
2. NOT A MATCH (SPECIFY REASON)
BEST COPY AVAILABLE
252
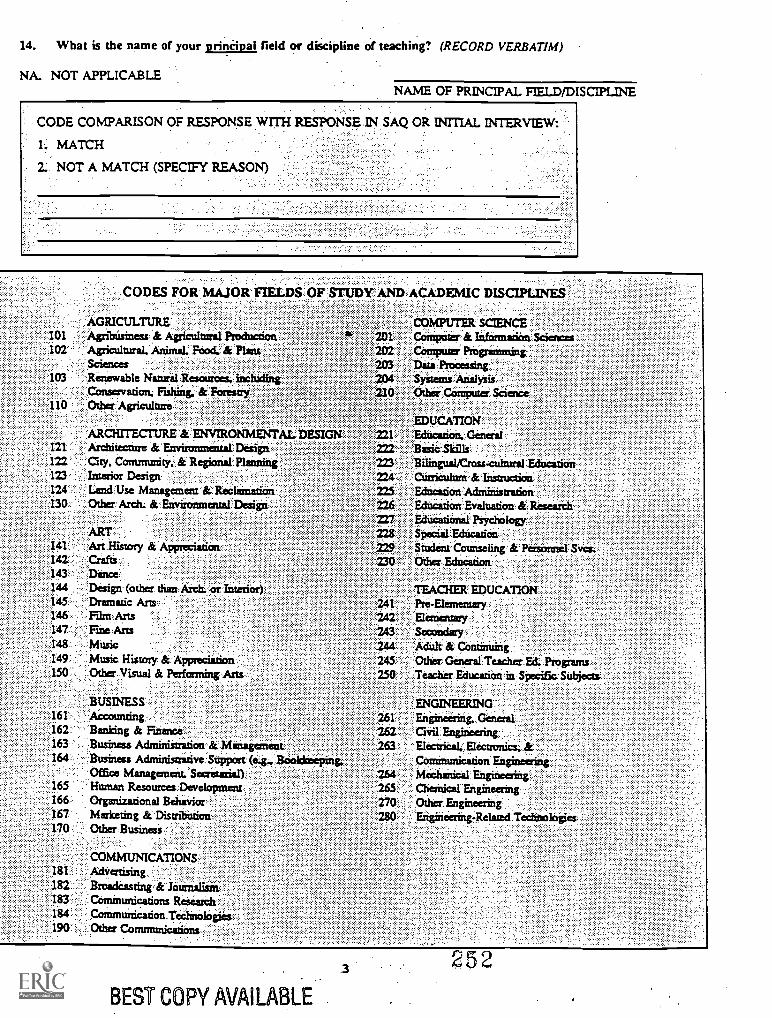
14. What is the name of your principal field or discipline of teaching? (RECORD VERBATIM)
NA. NOT APPLICABLENAME OF PRINCIPAL FIELD/DISCIPUNE
CODE COMPARISON OF RESPONSE WITH RESPONSE. IN SAQ OR INITIAL INTERVIEW:
L MATCH
2. NOT A MATCH (SPECIFY REASON)
CODES FOR MAJOR FIELDS OF STUDY AND ACADEMIC DISCIPLINES
AGRICULTURE101 Agriblisiness & Agriailorral Production102 Agricultural. Animal. Food. & Plant
Sciences103 Renewable Natural Resources, including
Conservation. Fishing. & ForestryI10 Other Agriculture
ARCHITECTURE & ENVIRONMENTAL DESIGN121 Architecntre & Environmental Design122 Oty, Community. & Regional Planning123 . Intedor Design124 Land Use Management & Reeler:mutat130: :;Other. Arch; & Environmental Design
141f. . Art :History & AppreciationCraftir..
143; ::
144 'Design (other than Arch. or Interior)145 : :'.Drarnatic Arts146.. .. :Elia:Arts
I48:. ,Music149 music History & Appreciation150. . Other Visual & Performing Arts
:BUSINESS161. ,
162::163164k.
165166.167.170:
182::
184
Banking & Finance&iciness Administration & ManagementBusiness Adminisaative Support (e.g.. Bookkeeping.Office Management. Secretarial)Human Resources DevelopmentOrganizational BehaviorMarketing & DistributionOther Business
COMMUNICATIONSAdifertisingBrOadCasting & JournalismCannumications ResearchCommunication Technologies:Other Communications
a. 201202203204210
241242243244245250
261262263
264265270280
COMPUTER SCIENCEComputer & Information SciencesComputer ProgammingData ProcessingSystems AnalysisOther Computer Science
EDUCATIONEducation. GeneralBasic SkillsBilingual/Cross.cultmal EducationCurriculum & InstructionEducation AdministrationEducation Evaluation & ResearchEducational PsychologySpecial EducationStudent Counseling & Fersointel Svcs.Other Education
TEACHER EDUCATIONPre-Berne:naryElementarySecondaryAdult & ContinuingOther General Teacher Ed. ProgramsTeacher Education in Specific Subjects
ENGINEERINGEngineering. GeneralCivil EngineeringElectrical. Electronics, &Cenrununication EngineeringMechanical EngineeringChemical EngineeringOther EngineeringEngineering-Related Technologies
BEST COPY MAILABLE
252
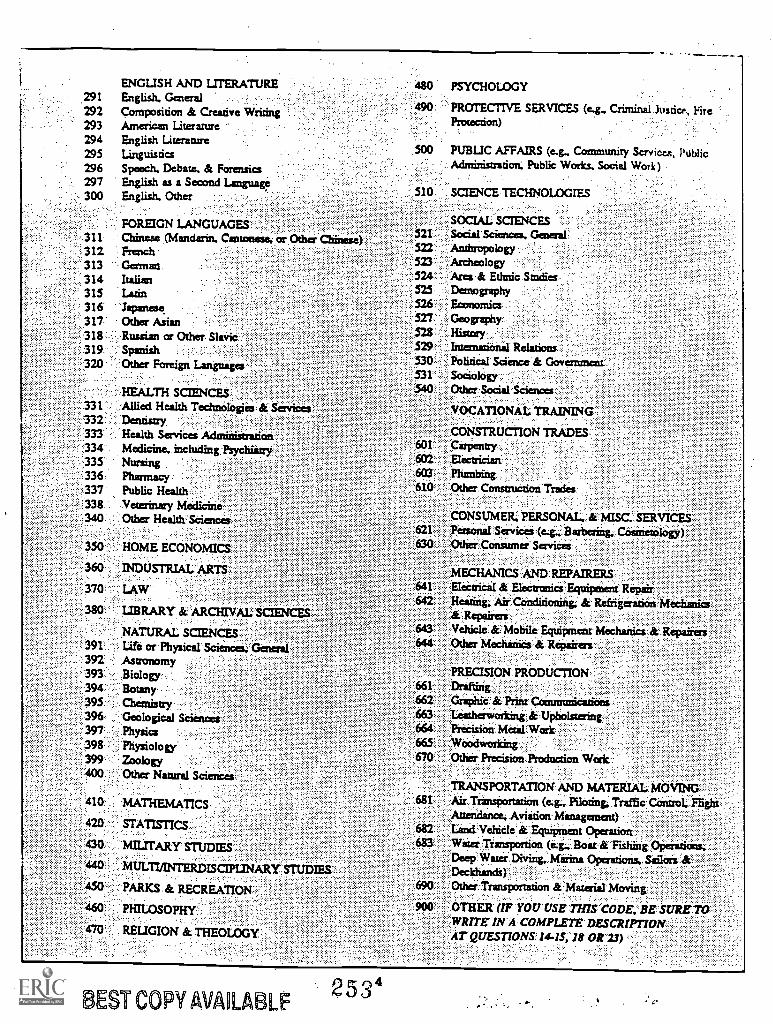
ENGLISH AND LITERATURE291 English. General292 Composition & Creative Writing293 American Literanse294 English Literature295 Linguistics296 Speech. Debate, & Forensics297 English as a Second Language300 English. Other
480 PSYCHOLOGY
PROTECTIVE SERVICES (e.g., Criminal. Justice, tireProtection)
500 PUBLIC AFFAIRS (e.g. Comniimity Savices, PublicAdministration. Public Works. Social Work)
FOREIGN LANGUAGES311 Chinese (Mandarin. Cantonese. or Other Chinese)
FrenchGerman.ItalianLatin
313314315316' Japanese.317 Other Asian318 I.. Russian or Other Slavic319 Spanish320 Other Foreign Languages
HEALTH SaENCES331. Allied Health Technologies & Services332: Dentistry,333' Health Services Administration.334 Medicine., including Psychiatry335 Nursing336. Pharmacy337 Public Health338 Veterinary Medicine340 . Other Health Sciences
350 HOME. ECONOMICS
360'. INDUSTRIAL ARTS
370 . LAW
380, LIBRARY & ARCHIVAL SCIENCES...rtAiutcAt. SCIENCES
391' Life or Physical Sciences, General392 Astronomy393 . Biology394. Botany395 Chemistry396. Geological Sciences397 Physics198 .,, Physiology399 Zoology400 Other Natural Sciences
410 MATHEMATICS
4 STATISTICS
43 :MILITARY STUDIES
ULTI/INTERDISCIPUNARY STUDIES
PARKS .& RECREATION
PHILOSOPHY
RELIGION & THEOLOGY
510 SCIENCE TECHNOLOGIES
SOCIAL SCIENCES521 Social Sciences, General'522 Anthropology523 Archeology524 Area & Ethnic Studies525 Demography526 Economics527 Geography528 History529 Interanional Relations .530 Pollack' Sciaice & Government531 Sociology540 Other Social Saences..:
VOCATIONAL. TRAINING
CONSTRUCTION TRADES601 Carpentry602 Electrician603 Phsnbing610 Other Construction Trades
CONSUMER.: PERSONAL. & MISC. SERVICES621 Personal Sertices.(e.g.Barbering. Cosmetology)630 Other Consurner Services
MECHANICS.AND REPAIRERS641 Electrical & ElearoniciEquipment Repair642 Heating. Air .Carditioning, & Refrigeration Mechanics
& Repairers ..
643 Vehicle & Mobile &wit:neat Mechanics & Repairers644 Other Mectuniies.& Repairers
PRECISION: PRODUCTION661662 Graphic & Print Coinnankrations663 Leatherworkint is:Upholstering664 Precision Metil,Work665 Woodworking670 Other Precision..ProductiOn Work.
TRANSPORTATION AND MATERIAL MOVING681 Air Transportation (e.g.. Piloting; Traffic COnsoL-Frighr...
Attendance, Aviation Management) 1..Land Vehicle' EquiPment OperationWater TransportiOn (e.g.. Boat Se Fishing Operations.Deep Water Diving; Marina OPerations, Sailors JrDecIductids)
Other Transportation 4:Maieriid Moving
OTHER (IF YOU USE 'THIS CODE. BE SURE TOWRITE IN A'COMPLETE DESCRII770NAT QUESTIONS. 1445;18 OR
682683
690
900
25 3BEST COPY AVAILABLE
4
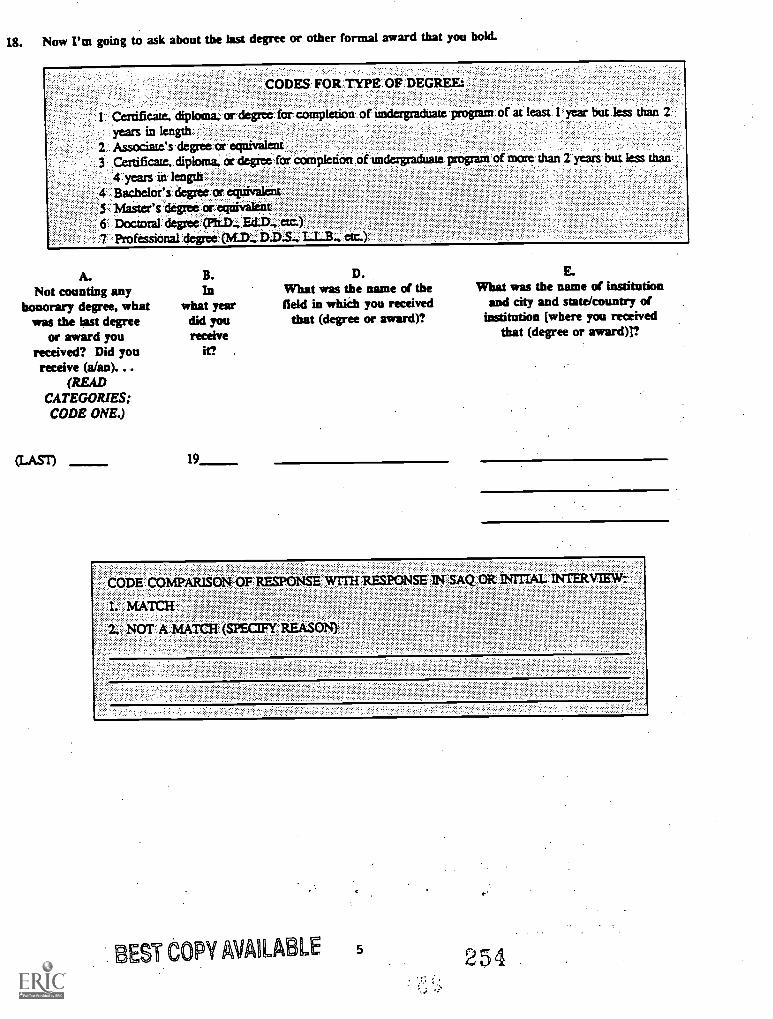
18. Now I'm going to ask about the last degree or other formal award that you hold.
CODES FOR TYPE or DEGREE:
I Certificate. diploma.: or degree. for completion of undergradnate program of at least I year but less than
years in length2. Associates degree. or eciaiVelent...
Certificate, diploma. or degree conipletian of Undergraduate program of more than 2 years but less
4 years in length4'..:Bacheloes:degree or equivalentS ;Master's degn*or equivalent
Doctoral: degree:. (PhD., Ed.D., etc.)1,ProfessiOnardegree (/vf.D., D.D.S...L.L.B., etc.)
A. B. D. E.
Not counting any In What was the name of the What was the name of institution
honorary degree, what what year field in which you received and city and state/country of
was the last degree did you that (degree or award)? institution (where you received
or award youreceived? Did you
receiveit? ,
that (degree or award)r
receive (a/an). ..(READ
CATEGORIES;CODE ONE.)
19
CODE COMPARISON OF RESPONSE WITH RESPONSE IN SAQ OR mud. INTERVIEW:
I. MATCH
2. NOT A MATCH (SPECIFY REASON)
EST COPY AVAILABLE 5 24
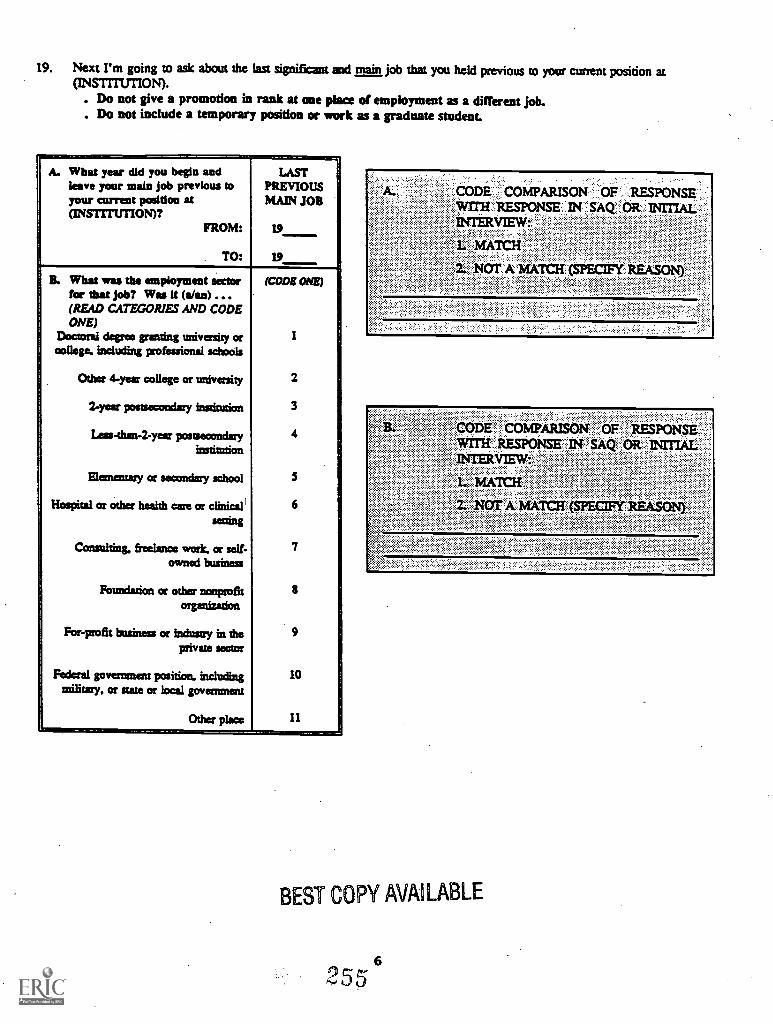
19. Next I'm going to ask about the lag significant and main job that you held previous to your current position at(INSTITUTION).
. Do not give a promotion in rank at one place of employment as a different job.. Do not include a temporary position or work as a graduate student.
A. What year did you begin andleave your main Job previous toyour current position at(INSTITUTION)?
FROM:
TO:
- -LAST
PREVIOUSMAIN JOB
19
19
B. What was the employment sectorfor that Job? Was It (a/an) ...
(CODE ONE)
(READ CATEGORIES AND CODEONE)
Doctoral degree granting rmiversity orcollege. including professional schools
1
Other 4-yea college or university 2
2-year postsecondary Ma ins:ion 3
Les- than- 2-year postsecondaryinsdmticrn
4
Elementary or secondary school 5
Hospital or other health care or clinical Iawing
6
Consulting. freelance work. or self-owned business
7
Formdation or other nonprofitorganization
8
For-profit Laziness or industry in theprivate sector
Federal government position. includingmilitary, or state or local govanmau
10
Other place 11
CODE COMPARISON OF RESPONSEWITH RESPONSE IN SAQ OR INITIALINTERVIEW:
1: MATCH
2. NOT A MATCH (SPECIFY REASON)
CODE COMPARISON OF RESPONSEwrrH RESPONSE IN SAQ OR INITIALINTERVIEW:
Ls MATCH
Z.' NOT A MATCH (SPECIFY REASON)
BEST COPY AVAILABLE
6
5
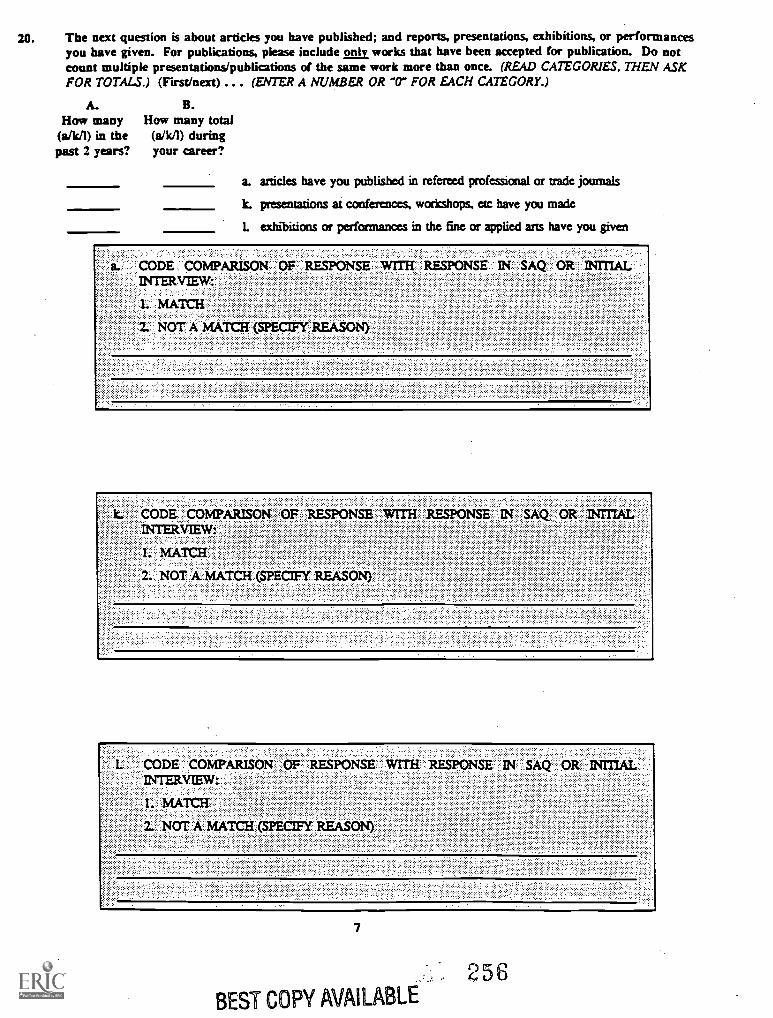
20. The next question is about articles you have published; and reports, presentations, exhibitions, or performancesyou have given. For publications, please include works that have been accepted for publication. Do notcount multiple presentations/publications of the same work more than once. (READ CATEGORIES. THEN ASKFOR TOTALS.) (First/next) ... (ENTER A NUMBER OR ''0" FOR EACH CATEGORY.)
A. B.How many How many total
(a/k/I) in the (a/kip duringpast 2 years? your career?
a. articles have you published in refereed professional or made journals
k. presentations at conferences, workshops, etc have you made
L exhibitions or performances in the fine or applied arts have you given
CODE COMPARISON OF RESPONSE WITH RESPONSE IN SAQ OR INITIALINTERVIEW:
I. MATCH
2. NOT A MATCH (SPECIFY REASON)
k. CODE COMPARISON OF RESPONSE WITH RESPONSE IN SAQ OR INITIALINTERVIEW:
I. MATCH
2. NOT A. MATCH (SPECIFY REASON)
CODE COMPARISON OF RESPONSE WITH RESPONSE IN SAQ OR INITIALINTERVIEW:
I. MATCH
2. NOT A MATCH (SPECIFY REASON)
7
258BEST COPY AVAILABLE
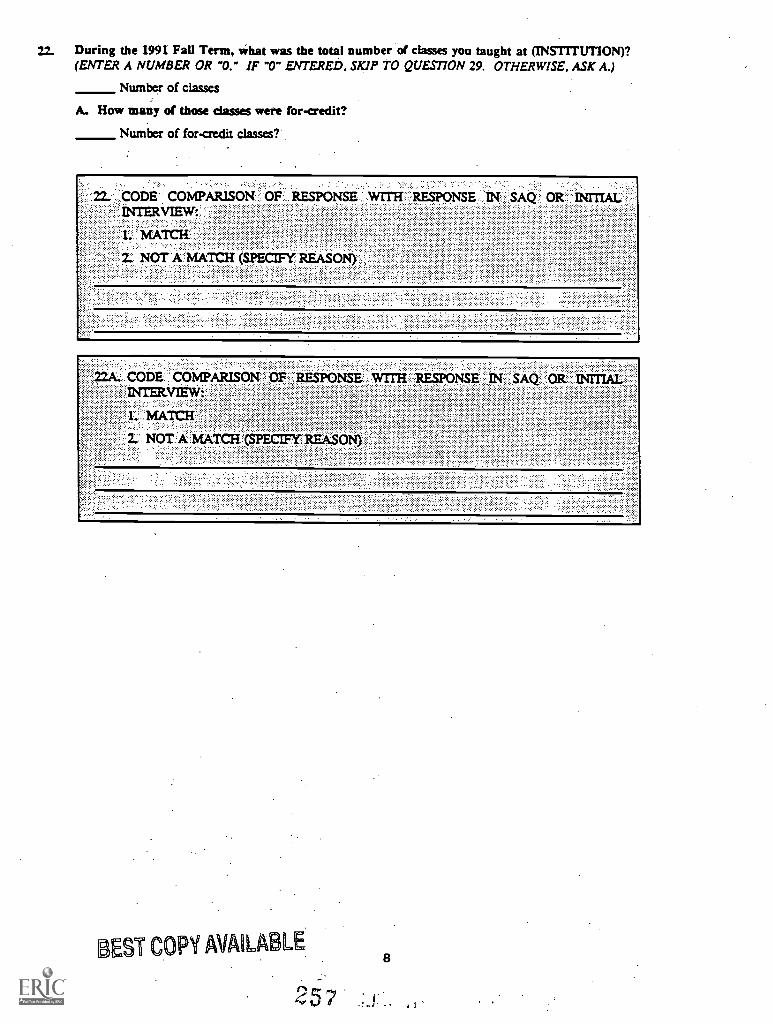
22. During the 1991 Fall Term, what was the total number of classes you taught at (INSTITUTION)?(ENTER A NUMBER OR V." IF V" ENTERED. SKIP TO QUES770N 29. OTHERWISE, ASK A.)
Number of classes
A. How many of those classes were for-credit?
Number of for-credit classes?
22. CODE COMPARISON OF RESPONSE WITH RESPONSE IN SAQ OR INITIALINTERVIEW:
1. MATCH
2. NOT A MATCH (SPECIFY REASON)
22A. CODE COMPARISON OF RESPONSE WITH RESPONSE IN SAQ OR INITIALINTERVIEW:
L MATCH
2. NOT A MATCH (SPECIFY REASON)
BEST COPY AVAILABLE8
25?
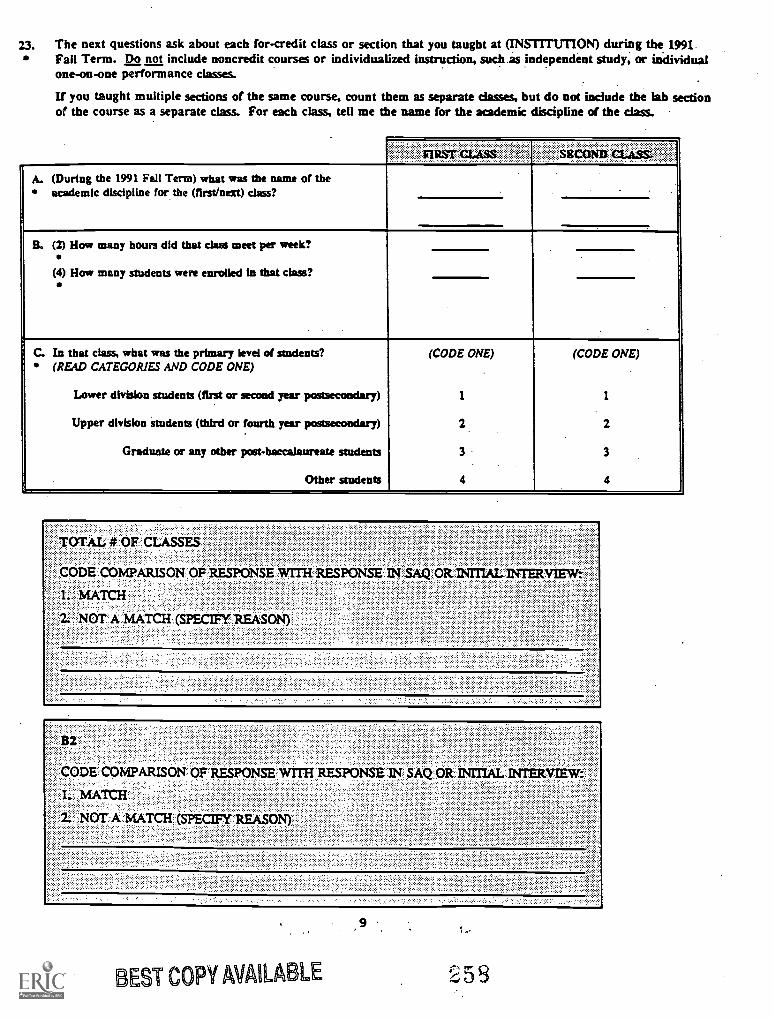
23. The next questions ask about each for-credit class or section that you taught at (INSTITUTION) during the 1991Fall Term. Do not include noncredit courses or individualized instruction, such_ aas independent study, or individualone-on-one performance classes.
If you taught multiple sections of the same course, count them as separate classes, but do not include the lab sectionof the course as a separate class. For each class, tell me the name for the academic discipline of the class.
FIRST CLASS MCCOMB
A. (During the 1991 Fall Term) what was the name of theacademic discipline for the (first/next) class?
B. (2) How many hours did that class meet per week?
(4) How many students were enrolled in that class?
C. In that class, what was the primary level of students?(READ CATEGORIES AND CODE ONE)
Lower division students (first or second year postsecondary)
Upper division students (third or fourth year postsecondary)
Graduate or any other postbaccalaureate students
Other students
(CODE ONE)
1
2
3
4
(CODE ONE)
1
2
3
TOTAL # OF CLASSES
CODE COMPARISON OF RESPONSE WITH RESPONSE IN SAQ ORINMAL INTERVIEW:
1. MATCH
2. NOT A MATCH (SPECIFY REASON)
B2
CODE COMPARISON OF RESPONSE WITH RESPONSE IN SAQ OR INITIAL INTERVIEW:
1. MATCH
2. NOT A MATCH (SPECIFY REASON)
BEST COPY MLA LE
9
w5
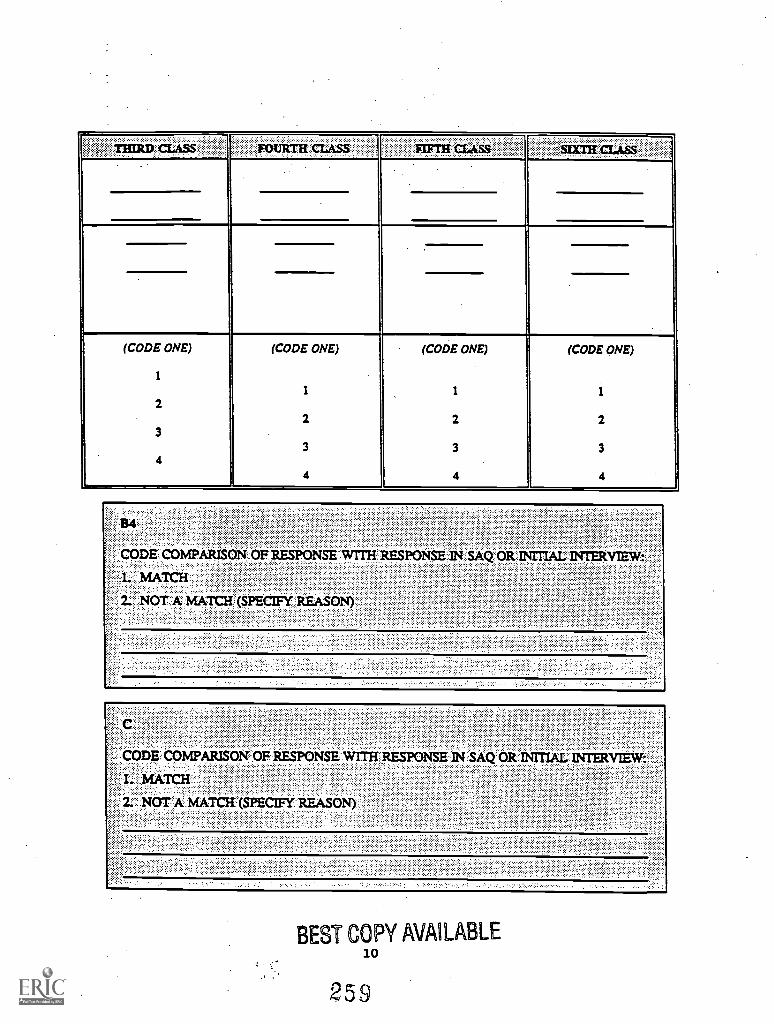
THIRD CLASS FOURTH CLASS FRTH 4c4.44 SIXTH CLASS. . .
.
..
(CODE ONE)
1
2
3
4
(CODE ONE)
1
2
3
4
(CODE ONE)
1
2
3
4
(CODE ONE)
1
2
3
4
B4
CODE COMPARISON OF RESPONSE WITH RESPONSE IN SAQ OR INITIAL INTERVIEW:
1. MATCH
: 2 NOT A MATCH (SPECIFY REASON)
C
CODE COMPARISON OF RESPONSE WITH RESPONSE IN SAQ OR INITIAL INTERVIEW:
I. MATCH
2. NOT A MATCH (SPECIFY REASON)
BEST COPY AVAILABLE10
259
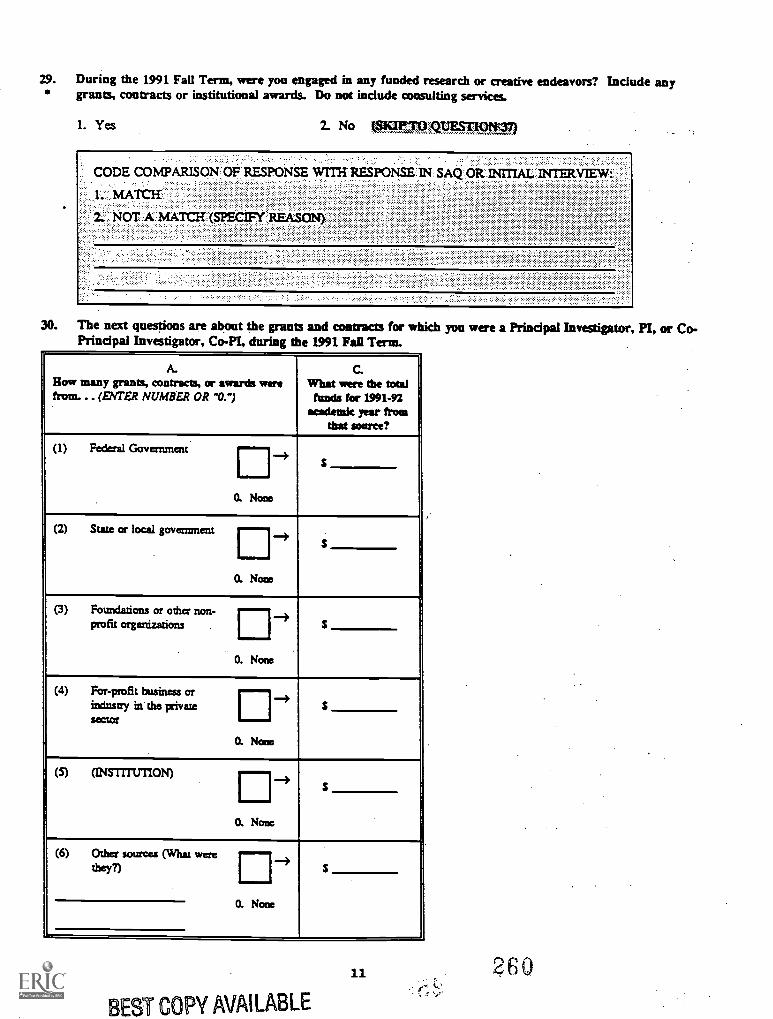
29. During the 1991 Fall Term, were you engaged in any funded research or creative endeavors? Include anygrants, contracts or institutional awards. Do not include consulting services.
1. Yes 2. No PCUPTP.QUFSPROan
CODE COMPARISON OF RESPONSE WITH RESPONSE IN SAQ OR INMAL INTER
I. MATCH
2. NOT ;A MATCH (SPECIFY REASON)
30. The next questions are about the grants and contracts for which you were a Principal Investigator, PI, or Co-Principal Investigator, Co-PI, durinr the 1991 Bad Tom_
A.Row many grants, contracts, or awards werefrom... (EWER NUMBER OR V.")
C.What were the total
funds for 1991-92academic year from
that source?
(1) Federal GovernmentS
O. None
(2) Stare or local govanment-->
0. None
(3) Foundations or other non- -->profit organizations
0. None
S
(4) For-profit businessS
orindustry in the privatesector
0. None
(5) (INSITTUTION) )S
0. None
(6) Other sources (WhatS
werethey?) ÷
O. None
11
BEST COPY AVAILABLE
260
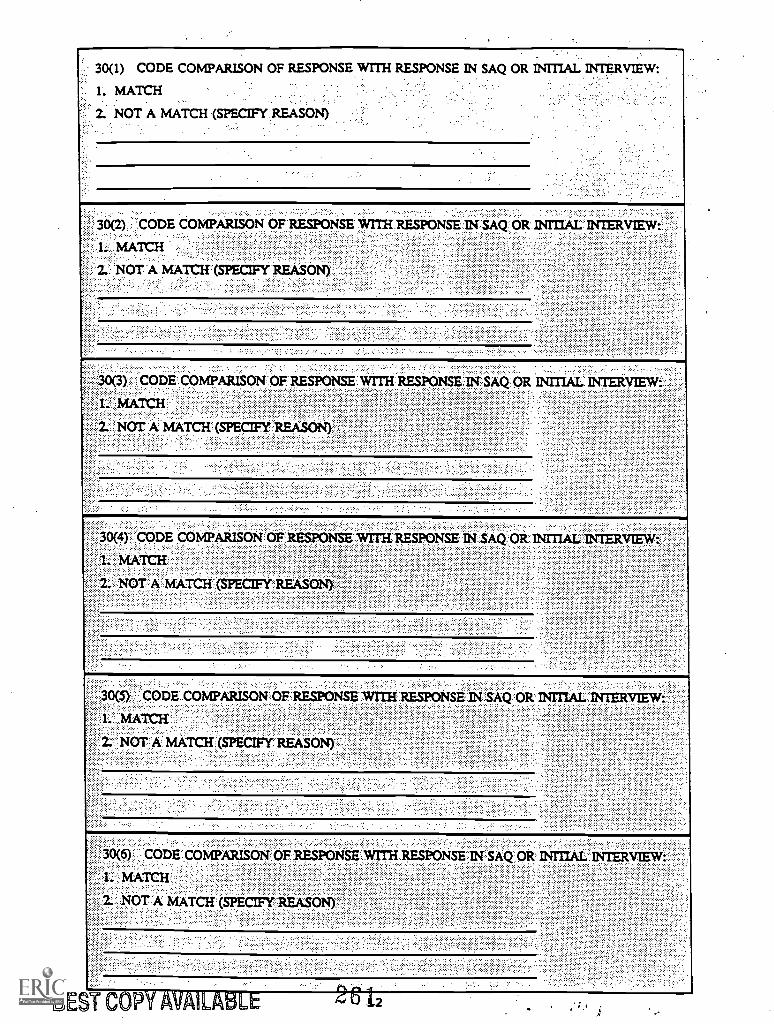
30(1) CODE COMPARISON OF RESPONSE WITH RESPONSE N SAQ OR INITIAL INTERVIEW:
1. MATCH
2. NOT A MATCH (SPECIFY REASON)
30(2) CODE COMPARISON OF RESPONSE WITH RESPONSE IN SAQ OR INITIAL INTERVIEW:
MATCH
NOT A MATCH (SPECIFY REASON)
30(3) CODE COMPARISON OF RESPONSE WITH RESPONSE IN SAQ OR INITIAL INTERVIEW:
MATCH
2. NOT ;A MATCH (SPECIFY REASON)
30(4) CODE COMPARISON OF RESPONSE. WITH RESPONSE IN SAQ OR IMITAL INTERVIEW:
L MATCH
2. NOT A MATCH (SPECIFY REASON)
30(5) CODE CONTARISON OF-RES PONSE RESPONSE:M SAQ' OR. INITIAL INTERVIEW:........ .. . .. .
1. MATCH
2. NOT A MATCH (SPECIFY REASON)
. .
30(6) : CODE. COMPARISON OF RESPONSE: WITH RESPONSE1N SA OR INITIAL' INTERVIEW::
1. MATCH
2. NOT A MATCH (SPECIFY REASON)
BEST COP E 2
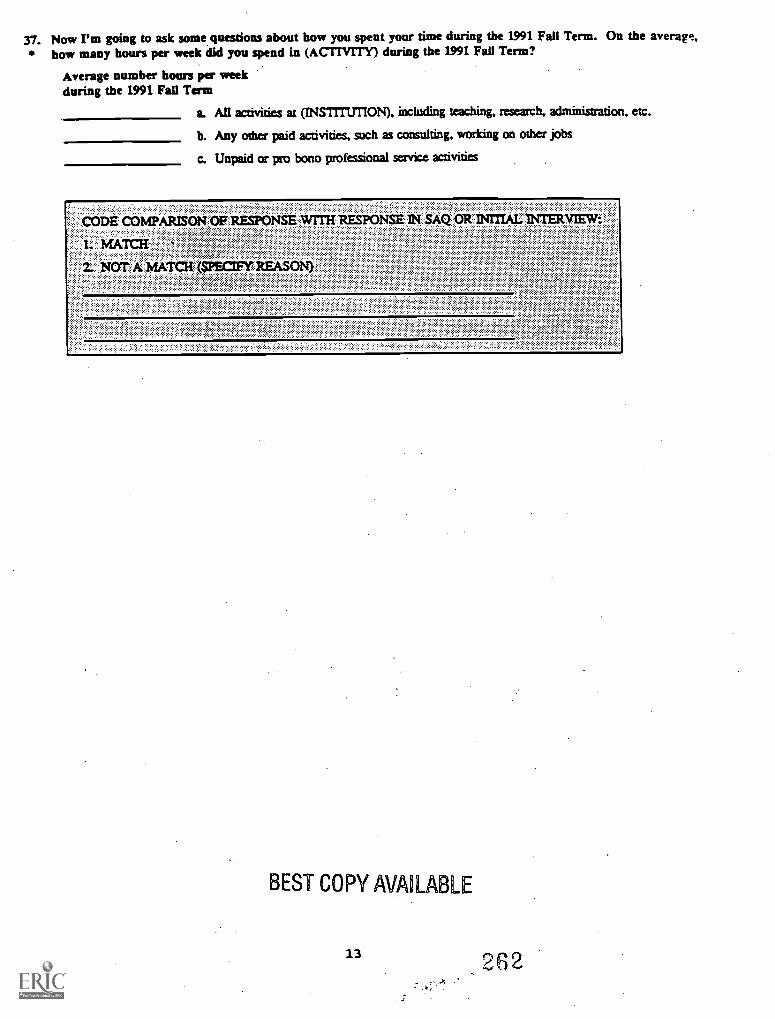
37. Now I'm going to ask some questions about bow you spent your time during thermTe
1991?
Fall Term. On the average,bow many hours per week did you spend in (ACTIVITY) during the 1991 l
Average number hours per weekduring the 1991 Fall Term
a. All activities at (INSITIUTION), including teaching, research, administration. etc.
b. Any other paid activities, such as consulting, working on other jobs
c. Unpaid or pro bono professional service activities
CODE COMPARISON OF RESPONSE WITH RESPONSE IN SAQ OR INITIAL INTERVIEW:
L MATCEI
2. NOT A MATCH (SPECIFY REASON)
BEST COPY AVAILABLE
13 262
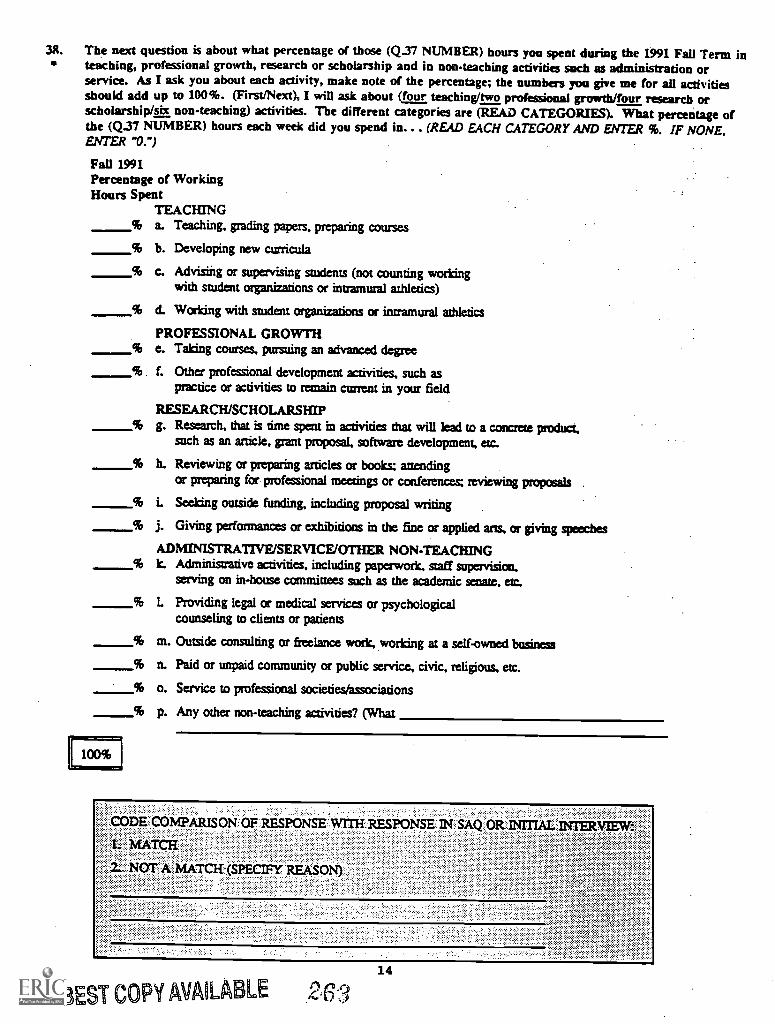
3R. The next question is about what percentage of those (Q.37 NUMBER) hours you spent during the 1991 Fall Term inteaching, professional growth, research or scholarship and in non-teaching activities such as administration orservice. As I ask you about each activity, make note of the percentage; the numbers you give me for all activitiesshould add up to 100%. (First/Next), I will ask about talg teaching/two professional growth/four research orscholarship/sbt non-teaching) activities. The different categories are (READ CATEGORIES). What percentage ofthe (Q37 NUMBER) hours each week did you spend in... (READ EACH CATEGORY AND ENTER %. IF NONE.ENTER "O.")
Fall 1991Percentage of WorkingHours Spent
TEACHING% a. Teaching, grading papers, preparing courses
% b. Developing new curricula
% c. Advising or supervising students (not counting workingwith student organizations or intramural athletics)
% d. Working with student organizations or intramural athletics
PROFESSIONAL GROWTH% e. Taking courses, pursuing an advanced degree
% f. Other professional development activities, such aspractice or activities to remain current in your field
RESEARCH/SCHOLARSHIP% g. Research, that is time spent in activities that will lead toa concrete product,
such as an article, grant proposal, software development, etc.
% h. Reviewing or preparing articles or books; attendingor preparing for professional meetings or conference= reviewing proposals
% i. Seeking outside funding, including proposal writing
% j. Giving performances or exhibitions in the fine or applied arts, or giving speeches
ADMINISTRATIVE/SERVICE/OTHER NON-TEACHING% k. Administrative activities, including paperwork. staff supervision.
serving on in-house committees such as the academic senate, etc.
% L Providing legal or medical services or psychologicalcounseling to clients or patients
% rn. Outside consulting or freelance work, working at a self-owned business
% n. Paid or unpaid community or public service, civic, religious, etc.
% o. Service to professional societies/associations
% p. Any other non-teaching activities? (What
100%
CODE COMPARISON OF RESPONSE WMI RESPONSE IN SAQ OR INITIAL INIERVIEW:
1. MATCH
2.. NOT A MATCH (SPECIFY REASON)
14
BEST COPY AVAILABLE 2 63
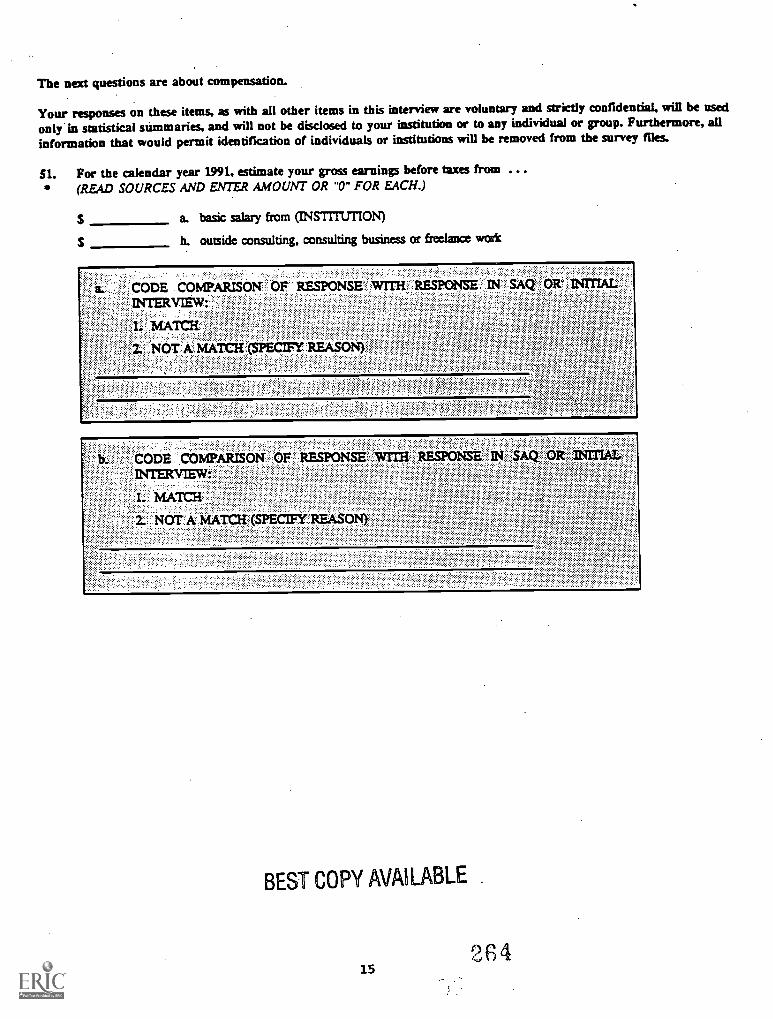
The next questions are about compensation.
Your responses on these items, as with all other items in this interview are voluntary and strictly confidential, will be usedonly in statistical summaries, and will not be disclosed to your institution or to any individual or group. Furthermore, allinformation that would permit identification of individuals or institutions will be removed from the survey files.
51. For the calendar year 1991, estimate your gross earnings before taxes from ...(READ SOURCES AND ENTER AMOUNT OR "0" FOR EACH.)
a. basic salary from (INSTITUTION)
h. outside consulting, consulting business or freelance work
CODE COMPARISON OF RESPONSE' WMI RESPONSE IN SAQ OR INMALINTERVIEW:
1. MATCH
2. NOT A MATCH (SPECIFY REASON)
CODE COMPARISON OF RESPONSE WITH RESPONSE IN SAQ OR INITIALINTERVIEW:
I. MATCH
2. NOT A MATCH (SPECIFY REASON)
BEST COPY AVAILABLE
26415
1993 National Study of Postsecondary FacultyMethodology Report
Appendix E
1993 NSOPF Institution QuestionnairePilot Test
265
U.S. Department of EducationOffice of Educational Research and Improvement
National Center for Education Statistics
1993 NATIONAL STUDY OF POSTSECONDARY FACULTY
Pilot Test
INSTITUTIONQUESTIONNAIRE
Co-sponsored by:
Contractor.
All information on this form will be kept confidential and will not bedisclosed or released to your institution or any other group or individual.
National Science FoundationNational Endowment for the Humanities
National Opinion Research Center (NORC)University of Chicago1155 East 60th StreetChicago, Illinois 60637Toll-Free Number: 1-800-733-NORC
OMB: No. 1850 -0608Expiration Date: 12/93
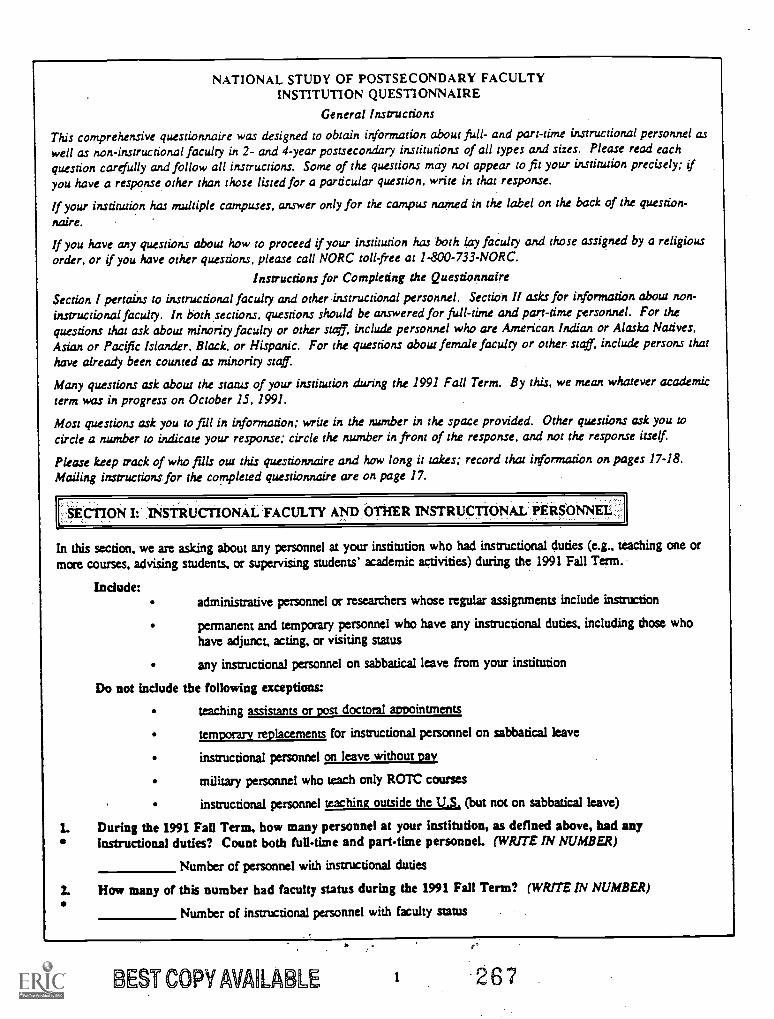
NATIONAL STUDY OF POSTSECONDARY FACULTYINSTITUTION QUESTIONNAIRE
General Instructions
This comprehensive questionnaire was designed to obtain information about full- and part-time instructional personnel aswell as non-instructional faculty in 2- and 4-year postsecondary institutions of all types and sizes. Please read eachquestion carefully and follow all instructions. Some of the questions may not appear to fit your institution precisely; if
you have a response other than those listed for a particular question, write in that response.
If your institution has multiple campuses, answer only for the campus named in the label on the back of the question-
naire.
If you have any questions about how to proceed if your institution has both lay faculty and those assigned by a religiousorder, or if you have other questions, please call NORC toll free at 1-800- 733 -NOR C.
Instructions for Completing the Questionnaire
Section I pertains instructional faculty and other instructional personnel. Section II asks for information about non-instructional faculty. In both sections, questions should be answered for full-time and pan -time personnel. For thequestions that ask about minority faculty or other staff include personnel who are American Indian or Alaska Natives,Asian or Pacific Islander, Black, or Hispanic. For the questions about female faculty or other staff, include persons thathave already been counted as minority staff.
Many questions ask about the status of your institution during the 1991 Fall Term. By this, we mean whatever academic
term was in progress on October 15, 1991.
Most questions ask you to fill in information; write in the number in the space provided. Other questions ask you tocircle a number to indicate your response; circle the number in front of the response, and not the response itself.
Please keep track of who fills out this questionnaire and how long it takes; record that information on pages 17-18.Mailing instructions for the completed questionnaire are on page 17.
SECTION I: INSTRUCTIONAL FACULTY AND OTHER INSTRUCTIONAL PERSONNEL<;.
this section, we are asking about any personnel at your institution who had instructional duties (e.g., teaching one ormore courses, advising students, or supervising students' academic activities) during the 1991 Fall Term.
Include:administrative personnel or researchers whose regular assignments include instruction
permanent and temporary personnel who have any instructional duties, including those whohave adjunct, acting, or visiting status
any instructional personnel on sabbatical leave from your institution
Do not include the following exceptions:
teaching assistants or post doctoral appointments
temporary replacements for instructional personnel on sabbatical leave
instructional personnel on leave without pay
military personnel who teach only ROTC courses
instructional personnel teaching outside the U.S. (but not on sabbatical leave)
I. During the 1991 Fall Term, how many personnel at your institution, as defined above, had anyinstructional duties? Count both full-time and pan-time personnel. (WRITE IN NUMBER)
Number of personnel with instructional duties
2. How many of this number had faculty status during the 1991 Fall Term? (WRITE IN NUMBER)
Number of instructional personnel with faculty status
s, EST COPY AVAILABLE I 267
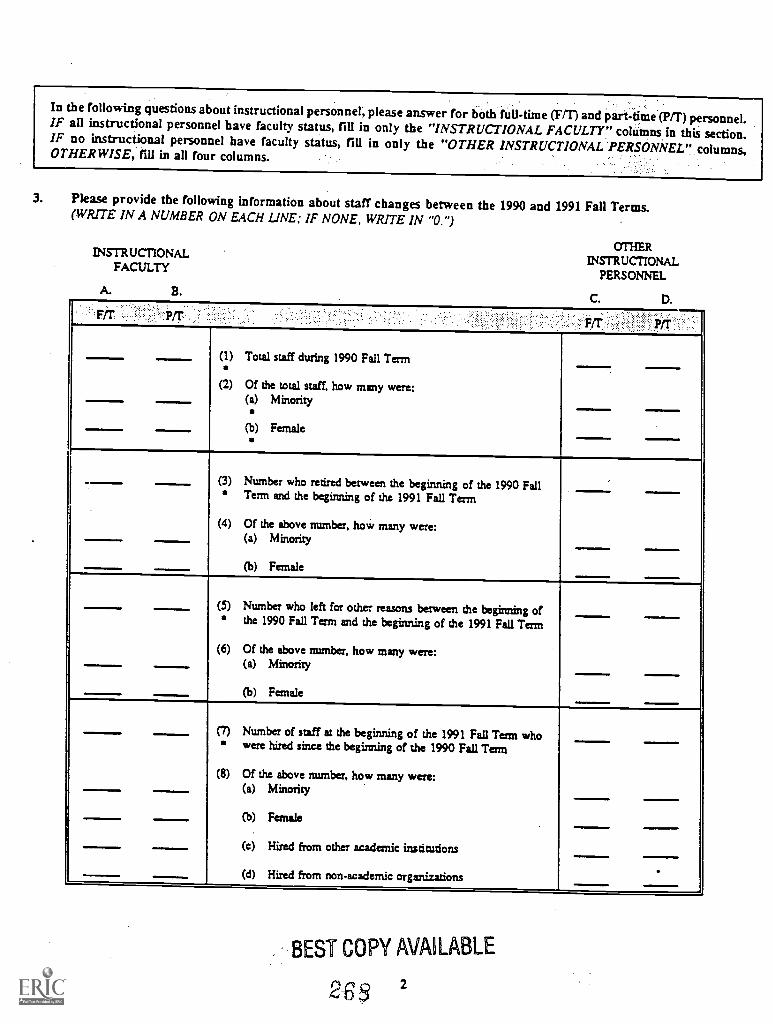
In the following questions about instructional personnel, please answer for both full-time (F/T) and part-time (VT) personnel.IF all instructional personnel have faculty status, fill in only the "INSTRUCTIONAL FACULTY" columns in this section.IF no instructional personnel have faculty status, fill in only the "OTHER INSTRUCTIONAL PERSONNEL" columns,OTHERWISE, fill in all four columns.
3. Please provide the following information about staff changes between the 1990 and 1991 Fall Terms.(WRITE IN A NUMBER ON EACH LINE; IF NONE, WRITE IN "O.")
INSTRUCTIONALFACULTY
A. B.
OTHERINSTRUCTIONAL
PERSONNEL
C. D.F
(1) Total staff during 1990 Fall Term
(2) Of the total staff, how many were:(a) Minority
(b) Female -(3) Number who retired between the beginning of the 1990 Fall
Term and the beginning of the 1991 Fall Term
(4) Of the above number, how many were:(a) Minority
(b) Female
(5) Number who left for other reasons between the beginning ofthe 1990 Fall Term and the beginning of the 1991 Fall Term
(6) Of the above number, how many were:(a) Minority
(b) Female
(7) Number of staff at the beginning of the 1991 Fall Term whowere hired since the beginning of the 1990 Fall Term
(8) Of the above number, how many were:(a) Minority
(b) Female
(c) Hired from other academic institutions
.(d) Hired from non - academic organizations
BEST COPY AVAILABLE
2 6 s
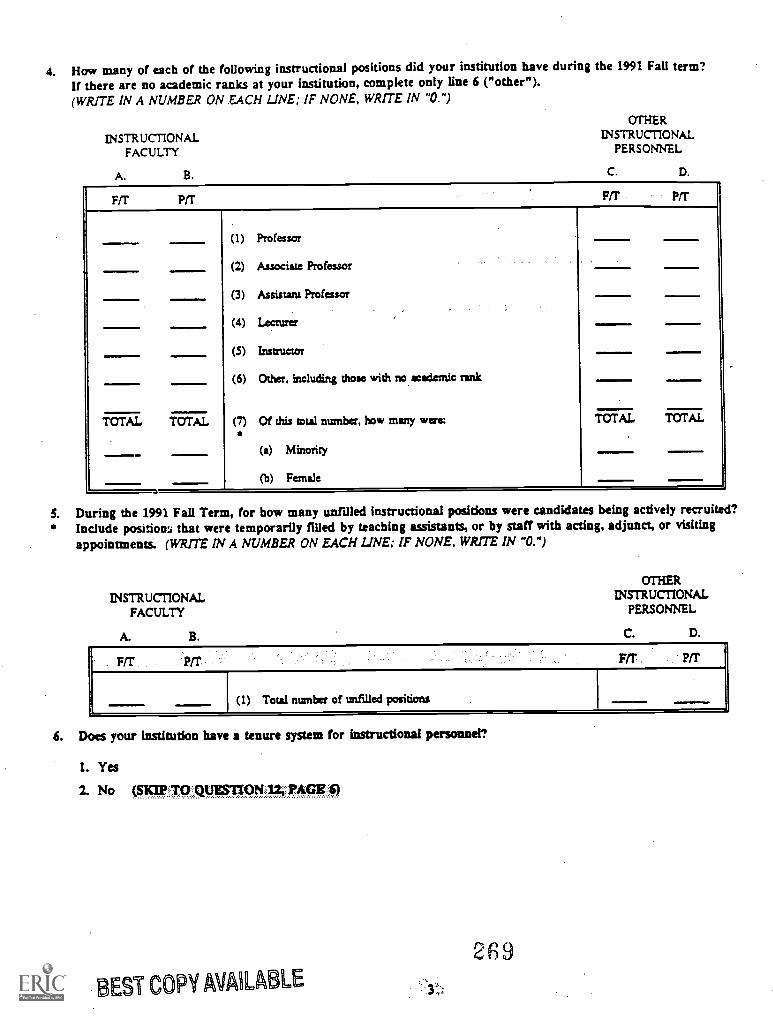
4. How many of each of the following instructional positions did your institution have during the 1991 Fall term?If there are no academic ranks at your institution, complete only line 6 ("other").(WRITE IN A NUMBER ON EACH LINE; IF NONE, WRITE IN "O.")
INSTRUCTIONALFACULTY
A. B.
OTHERINSTRUCTIONAL
PERSONNEL
C. D.
FM PM FIT PIT
(1) Professor
(2)_Associate Professor
(3) Assistant Professor
(4) Lecturer
(5) Instructor
(6) Other, including those with no academic rank
(7) Of this total number. how many were:TOTAL TOTAL TOTAL TOTAL
(a) Minority
(b) Female
S. During the 1991 Fall Term, for how many unfilled instructional positions were candidates being actively recruited?Include position:, that were temporarily filled by teaching assistants, or by staff with acting, adjunct, or visitingappointments. (WRITE IN A NUMBER ON EACH LINE; IF NONE, WRITE IN "O.")
INSTRUCTIONALFACULTY
A. B.
OTHERINSTRUCTIONAL
PERSONNEL
C. D.
F/T PM FM' P/T
(1) Total nurrkba of unfilled positions
6. Does your institution have a tenure system for instructional personnel?
1. Yes
2. No (MOP TO .QUYSTIO
269BEST COPY AVAILABLE
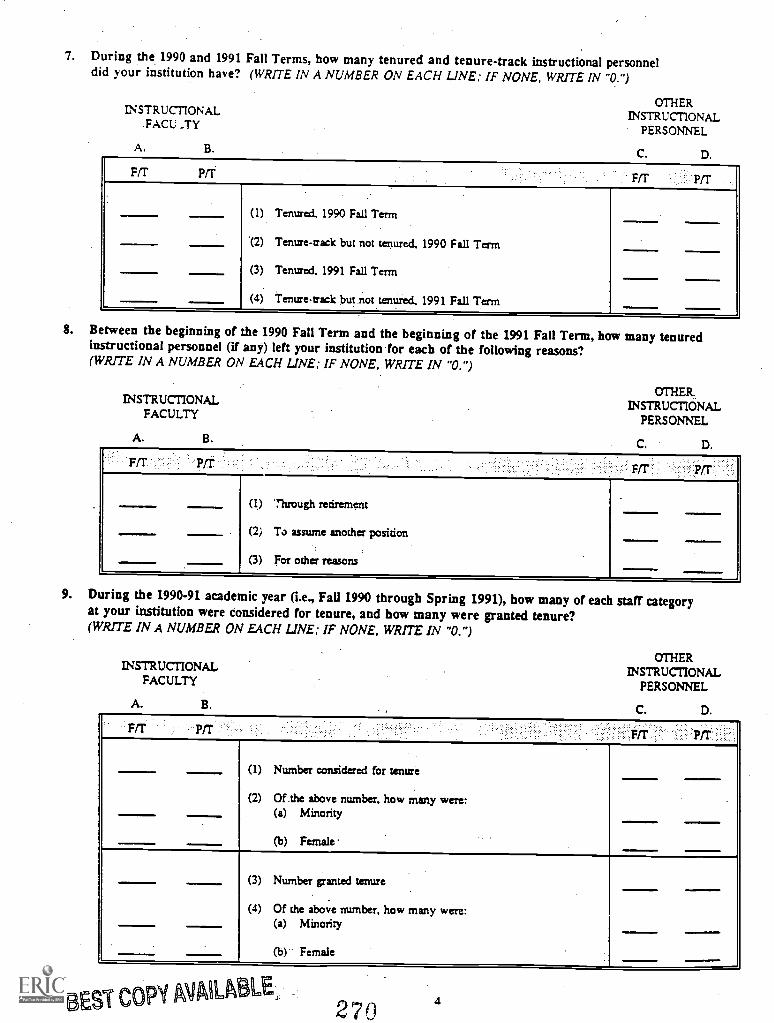
7. During the 1990 and 1991 Fall Terms, how many tenured and tenure-track instructional personneldid your institution have? (WRITE IN A NUMBER ON EACH LINE; IF NONE, WRITE IN "0. ")
LNISTRUCTIONALFACI.:
A. B.
OTHERINSTRUCTIONAL
PERSONNEL
C. D.
FIT Pa FIT, KT
(1) Tenured. 1990 Fall Term
*(2) Tenure-rack but not tenured. 1990 Fall Term
(3) Tenured. 1991 Fall Term
(4) Tenure-rack but not tenured, 1991 Fall Term
8. Between the beginning of the 1990 Fall Term and the beginning of the 1991 Fall Term, how many tenuredinstructional personnel (if any) left your institution for each of the following reasons?(WRITE IN A NUMBER ON EACH LINE; IF NONE, WRITE IN "O.")
INSTRUCTIONALFACULTY
A. B.
OTHER.INSTRUCTIONAL
PERSONNEL
C. D.
Fir . prr Fir 1>(r
(1) Through retirement
(2) To assume another position
(3) For other reasons
9. During the 1990-91 academic year (i.e., Fan 1990 through Spring 1991), how many of each staff categoryat your institution were considered for tenure, and how many were granted tenure?(WRITE IN A NUMBER ON EACH LINE; IF NONE, WRITE IN "0.")
INSTRUCTIONALFACULTY
A. B.
OTHERINSTRUCTIONAL
PERSONNEL
C. D.
Fir prr PIT
(1) Number considered for tenure
(2) Of the above number, how many were:(a) Minority
(b) Female
(3) Number granted tenure
(4) Of the above number, how many were:(a) Minority
(b) Female
BEST COPY MIAILik LE,270 4
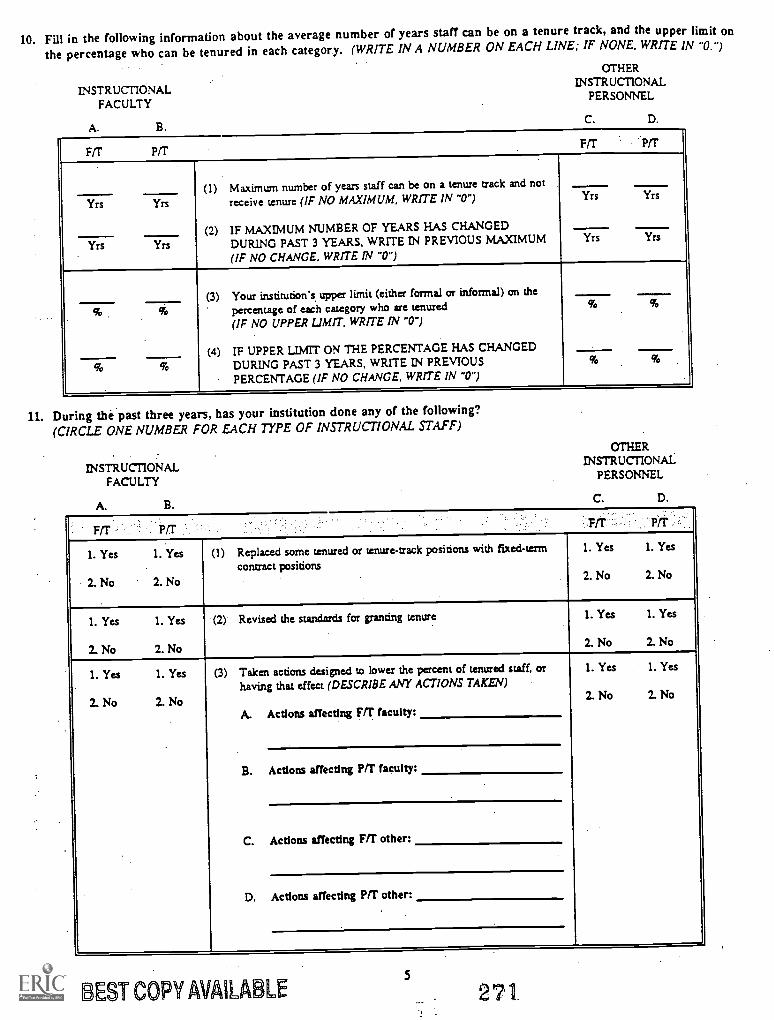
10. Fill in the following information about the average number of years staff can be on a tenure track, and the upper limit on
the percentage who can be tenured in each category. (WRITE IN A NUMBER ON EACH LINE; IF NONE, WRITE IN "O.")
OTHERINSTRUCTIONAL
PERSONNELINSTRUCTIONALFACULTY
A. B.C. D.
F/T Pa F/T prr
(1) Maximum number of years staff can be on a tenure track and not
Yrs Yrs receive tenure (IF NO MAXIMUM, WRITE IN "0") Yrs Yrs
(2) IF MAXIMUM NUMBER OF YEARS HAS CHANGED
Yrs Yrs DURING PAST 3 YEARS, WRITE IN PREVIOUS MAXIMUM Yrs Yrs
(IF NO CHANGE, WRITE IN "0")
(3) Your institution's. upper limit (either formal or informal) on the
percentage of each category who are tenured%To
(IF NO UPPER LIMIT, WRITE IN "0")
(4) IF UPPER LIMIT ON THE PERCENTAGE HAS CHANGED
(iT; % DURING PAST 3 YEARS, WRITE IN PREVIOUS % %
PERCENTAGE (IF NO CHANGE, WRITE IN "0")
11. During the past three years, has your institution done any of the following?(CIRCLE ONE NUMBER FOR EACH TYPE OF INSTRUCTIONAL STAFF)
INSTRUCTIONALFACULTY
A. B.
OTHERINSTRUCTIONAL
PERSONNEL
C. D.
Fir Pa F Prr
1. Yes
2. No
1. Yes
2. No
(1) Replaced some tenured or tenure-track positions with feed -termcontract positions
1. Yes
2. No
1. Yes
2. No
I. Yes
2. No
1. Yes
2. No
(2) Revised the standards for granting tenure 1. Yes
2. No
1. Yes
2. No
1. Yes
2. No
1. Yes
2. No
(3) Taken actions designed to lower the percent of tenured staff, or
having that effect (DESCRIBE ANY ACTIONS TAKEN)
A. Actions affecting F/T faculty:
1. Yes
2. No
1. Yes
2. No
B. Actions affecting PIT faculty:
C. Actions affecting FIT other:
D. Actions affecting PR other:
BEST COPY AVAOLABLE5
271
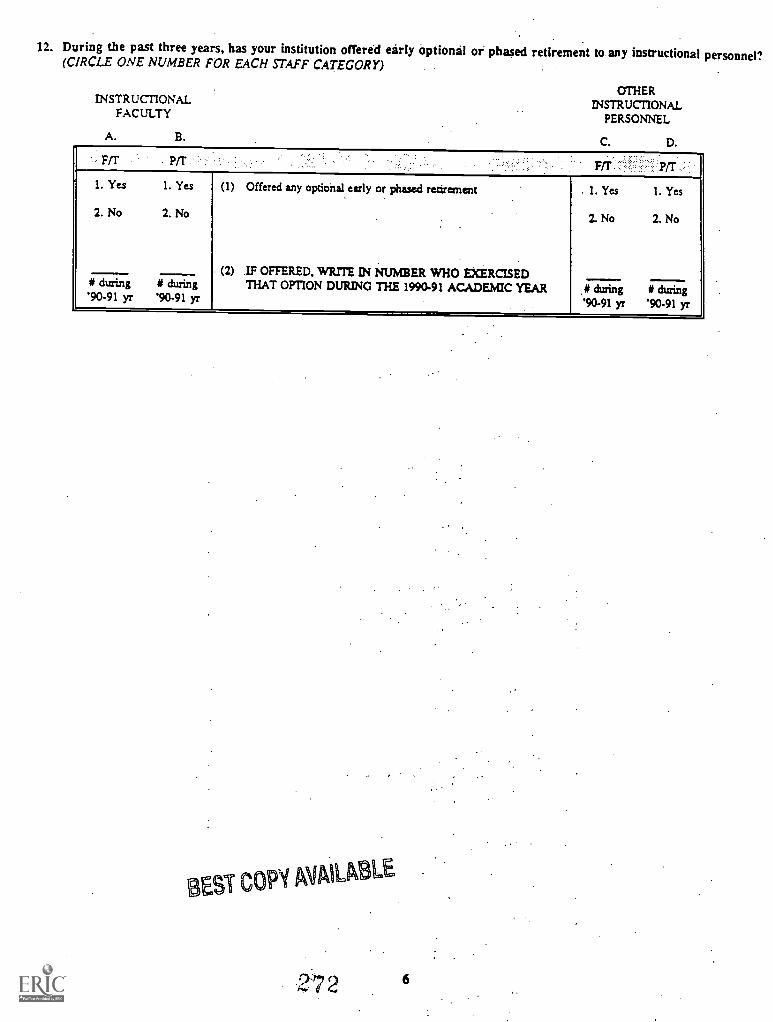
12. During the past three years, has your institution offered early Optional or phased retirement to any instructional personnel?(CIRCLE ONE NUMBER FOR EACH STAFF CATEGORY)
INSTRUCTIONALFACULTY
A. B.
Kr
OTHERINSTRUCTIONAL
PERSONNEL
C. D.
.:.p
Yes Yes1. Yes 1. Yes
2. No 2. No
# during'90-91 yr
# during'90-91 yr
(1) Offered any optional early or phased retirement
(2) IF OFFERED, WRITE N NUMBER WHO EXERCISEDTHAT OPTION DURING THE 1990.91 ACADEMIC YEAR
1. 1.
2. No 2. No
# during # during'90-91 yr '90-91 yr
MT copy MO LE
2'7 2 6
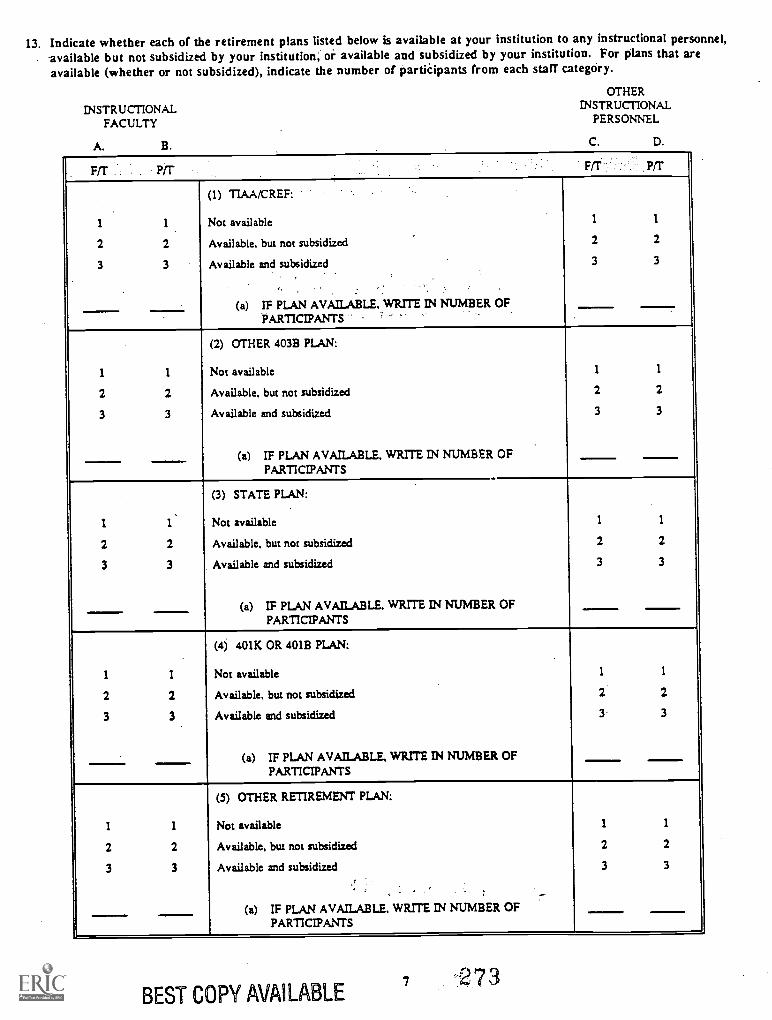
13. Indicate whether each of the retirement plans listed below is available at your institution to any instructional personnel,available but not subsidized by your institution; or available and subsidized by your institution. For plans that areavailable (whether or not subsidized), indicate the number of participants from each staff category.
INSTRUCTIONALFACULTY
A. B.
OTHERINSTRUCTIONAL
PERSONNEL
C. D.
prr prr Pa PiT
(1) TIAA/CREF:
1 1 Not available 1 1
2 2 Available, but not subsidized 2 2
3 3 Available and subsidized 3 3
(a) IF PLAN AVAILABLE. WRITE IN NUMBER OFPARTICIPANTS '
(2) OTHER 403B PLAN:
1 1 Not available 1 1
2 2 Available, but not subsidized 2 2
3 3 Available and subsidized 3 3
(a) IF PLAN AVAILABLE, WRITE IN NUMBER OFPARTICIPANTS
(3) STATE PLAN:
1 1' Not available 1 1
2 2 Available, but not subsidized 2 2
3 3 Available and subsidized 3 3
(a) IF PLAN AVAILABLE, WRITE IN NUMBER OFPARTICIPANTS
(4) 401K OR 401B PLAN:
1 1 Not available 1 1
2 2 Available, but not subsidized 2 2
3 3 Available and subsidized 3 3
(a) IF PLAN AVAILABLE, WRITE IN NUMBER OFPARTICIPANTS
(5) OTHER RETIREMENT PLAN:
1 I Not available 1 1
2 2 Available, but not subsidized 2 2
3 3 Available and subsidized 3 3
(a) IF PLAN AVAILABLE. WRITE IN NUMBER OFPARTICIPANTS
BEST COPY AVAILABLE7 27 3
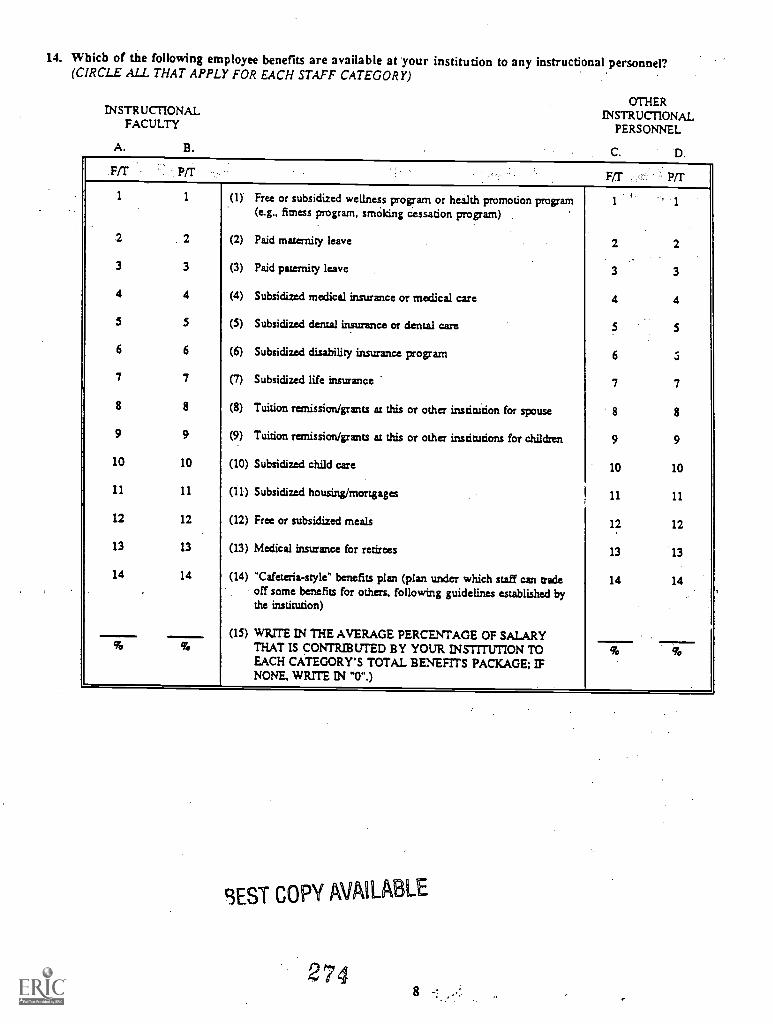
14. Which of the following employee benefits are available at your institution to any instructional personnel?(CIRCLE ALL THAT APPLY FOR EACH STAFF CATEGORY)
INSTRUCTIONALFACULTY
A. B.
OTHERINSTRUCTIONAL
PERSONNEL
C. D.
FIT' PIT F/T PfT
1 1 (1) Free or subsidized wellness program or health promotion program 1 ' 1
(e.g., fitness program. smoking cessation program)
2 2 (2) Paid maternity leave 2 2
3 3 (3) Paid paternity leave 3 3
4 4 (4) Subsidized medical insurance or medical care 4 4
5 5 (5) Subsidized dental insurance or dental care 5 5
6 6 (6) Subsidized disability insurance program 6 5
7 7 (7) Subsidized life insurance 7 7
8 8 (8) Tuition remission/grants at this or other irsstitution for spouse 8 8
9 9 (9) Tuition remission/grants at this or other institutions for children 9 9
10 10 (10) Subsidized child care 10 10
11 11 (11) Subsidized housing/mortgages 11 11
12 12 (12) Free or subsidized meals 12 12
13 13 (13) Medical insurance for retirees 13 13
14 14 (14) "Cafeteria-style" benefits plan (plan under which staff can tradeoff some benefits for others, following guidelines established bythe institution)
14 14
(15) WRITE IN THE AVERAGE PERCENTAGE OF SALARY% fe THAT IS CONTRIBUTED BY YOUR INSTITUTION TO % ile
EACH CATEGORY'S TOTAL BENEFITS PACKAGE; IFNONE. WRITE IN "0".)
BEST COPY AVAILABLE
2 74
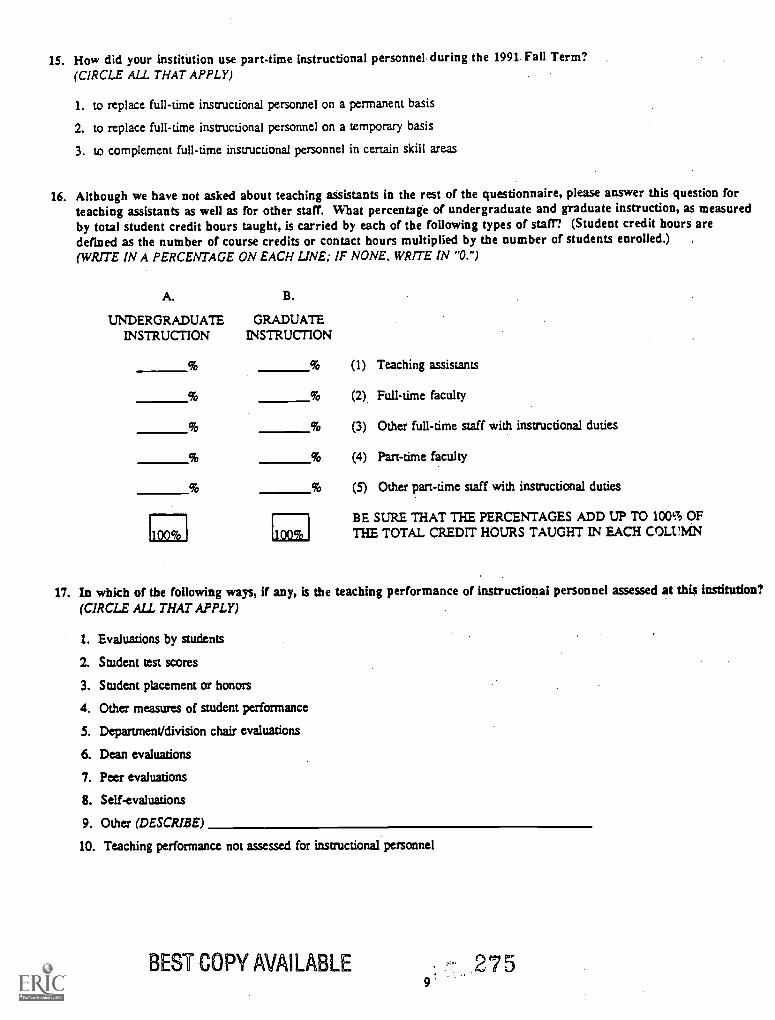
15. How did your institution use part-time instructional personnel during the 1991. Fall Term?(CIRCLE ALL THAT APPLY)
1. to replace full-time instructional personnel on a permanent basis
2. to replace full-time instructional personnel on a temporary basis
3. to complement full-time instructional personnel in certain skill areas
16. Although we have not asked about teaching assistants in the rest of the questionnaire, please answer this question forteaching assistants as well as for other staff. What percentage of undergraduate and graduate instruction, as measuredby total student credit hours taught, is carried by each of the following types of staff? (Student credit hours aredefined as the number of course credits or contact hours multiplied by the number of students enrolled.)(WRITE IN A PERCENTAGE ON EACH LINE; IF NONE. WRITE IN "0. ")
A. B.
UNDERGRADUATE GRADUATEINSTRUCTION INSTRUCTION
11111I
(1) Teaching assistants
(2) Full-time faculty
(3) Other full-time staff with instructional duties
(4) Part-time faculty
(5) Other part-time staff with instructional duties
BE SURE THAT THE PERCENTAGES ADD UP TO 100% OFTHE TOTAL CREDIT HOURS TAUGHT IN EACH COLUMN
17. In which of the following ways, if any, is the teaching performance of instructional personnel assessed at this institution?(CIRCLE ALL THAT APPLY)
1. Evaluations by students
2. Student test scores
3. Student placement or honors
4. Other measures of student performance
5. Department/division chair evaluations
6. Dean evaluations
7. Peer evaluations
8. Self-evaluations
9. Other (DESCRIBE)
10. Teaching performance not assessed for instructional personnel
BEST COPY AVAILABLE 275
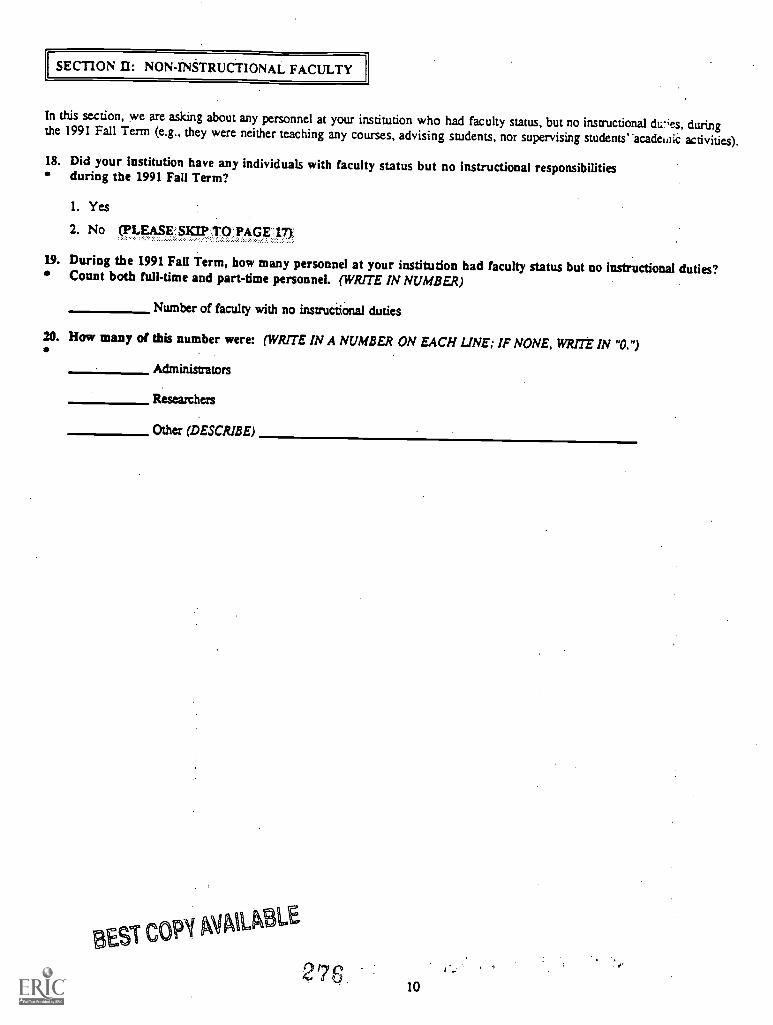
SECTION NON-INSTRUCTIONAL FACULTY
In this section, we are asking about any personnel at your institution who had faculty status, but no instructional dues, duringthe 1991 Fall Term (e.g., they were neither teaching any courses, advising students, nor supervising studentsacadeloic activities).
18. Did your institution have any individuals with faculty status but no instructional responsibilitiesduring the 1991 Fall Term?
I. Yes
2. No (PLEASE SKIP TO PAGE 17)
19. During the 1991 Fall Term, bow many personnel at your institution bad faculty status but no instructional duties?Count both full-time and part-time personnel. (WRITE IN NUMBER)
Number of faculty with no instructional duties
20. How many of this number were: (WRITE IN A NUMBER ON EACH LINE; IF NONE, WRITE IN "O.")
Administrators
Researchers
Other (DESCRIBE)
BEST COP1 AVAILABLE
27g.10
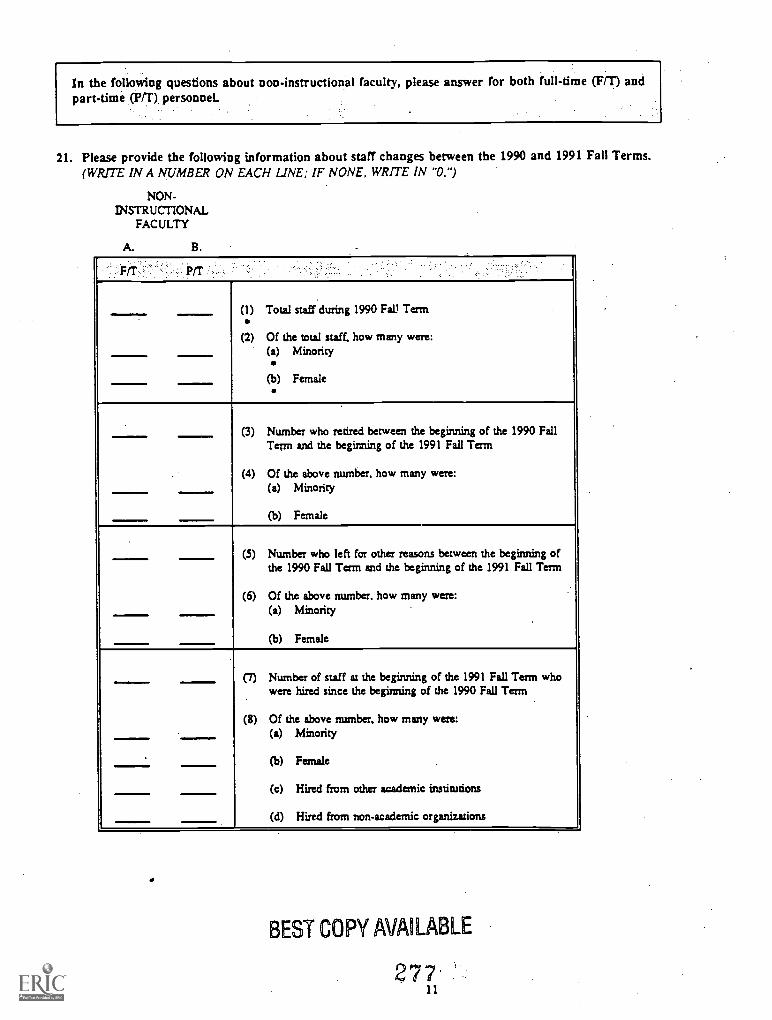
In the following questions about non-instructional faculty, please answer for both full -time (F/T) andpart-time (P/T) personneL
21. Please provide the following information about staff changes between the 1990 and 1991 Fall Terms.(WRITE IN A NUMBER ON EACH LINE; IF NONE, WRITE IN "O.")
NON -INSTRUCTIONAL
FACULTY
A. B.
Pa
(1) Total staff during 1990 Fall Term
(2) Of the total staff. how many were:(a) Minority
(b) Female
(3) Number who retired between the beginning of the 1990 FallTerm and the beginning of the 1991 Fall Term
(4) Of the above number, how many were:(a) Minority
(b) Female
(5) Number who left for other reasons between the beginning ofthe 1990 Fall Term and the beginning of the 1991 Fall Term
(6) Of the above number. how many were:(a) Minority
(b) Female
(7) Number of staff at the beginning of the 1991 Fall Term whowere hired since the beginning of the 1990 Fall Term
(8) Of the above number, how many were:(a) Minority
(b) Female
(c) Hired from other academic institutions
(d) Hired from non-academic organizations
BEST COPY AVAILABLE
277'11
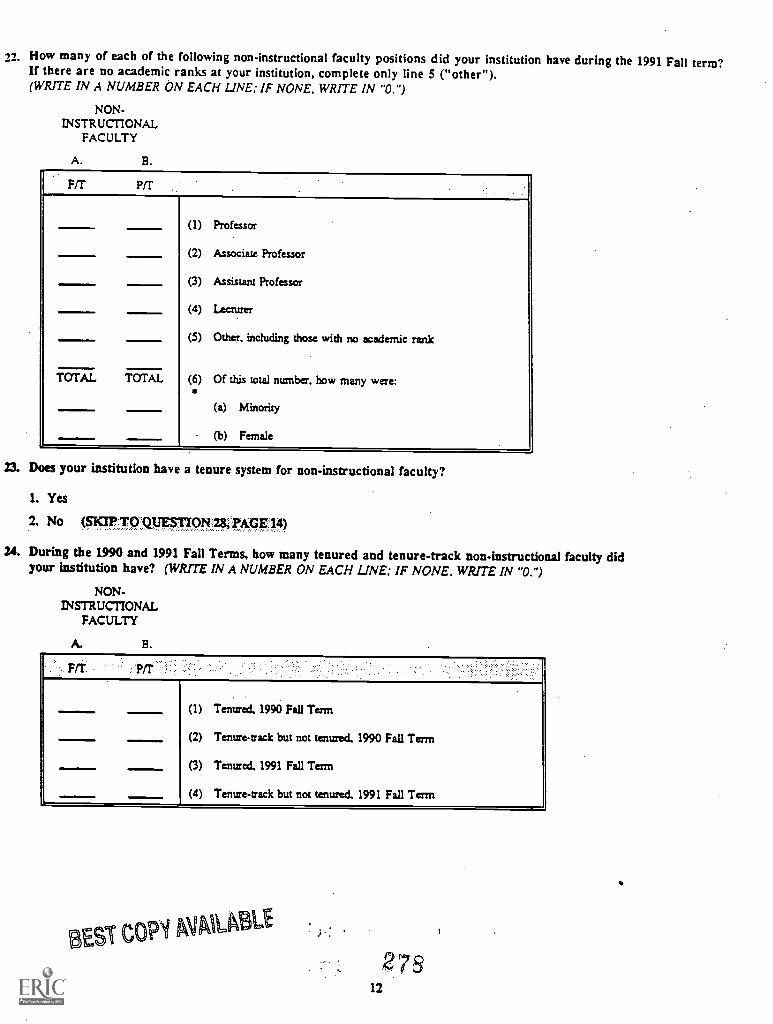
22. How many of each of the following non-instructional faculty positions did your institution have during the 1991 Fall term?If there are no academic ranks at your institution, complete only line 5 ("other").(WRITE IN A NUMBER ON EACH LINE; IF NONE. WRITE IN "O.")
NON-INSTRUCTIONAL
FACULTY
A. B.
FIT PfT
(1) Professor
(2) Associate Professor
(3) Assistant Professor
(4) Lecturer
(5) Other. including those with no academic rank
(6) Of this total number. how many were:TOTAL TOTAL
(a) Minority
(b) Female
23. Does your institution have a tenure system for non-instructional faculty?
1. Yes
2. No (SKIP TO QUESTION PAGE 14)
24. During the 1990 and 1991 Fall Terms, bow many tenured and tenure-track non-instructional faculty didyour institution have? (WRITE IN A NUMBER ON EACH LINE; IF NONE, WRITE IN "0. ")
NON-INSTRUCTIONAL
FACULTY
A. B.
Fir .12/1'
(1) Tenured. 1990 Fall Term
(2) Tenure-track but not tenured, 1990 Fall Term
(3) Tenured, 1991 Fall Term
(4) Ternae-sack but not tenured. 1991 Fall Term
BEST COP/ ANAILial275
12
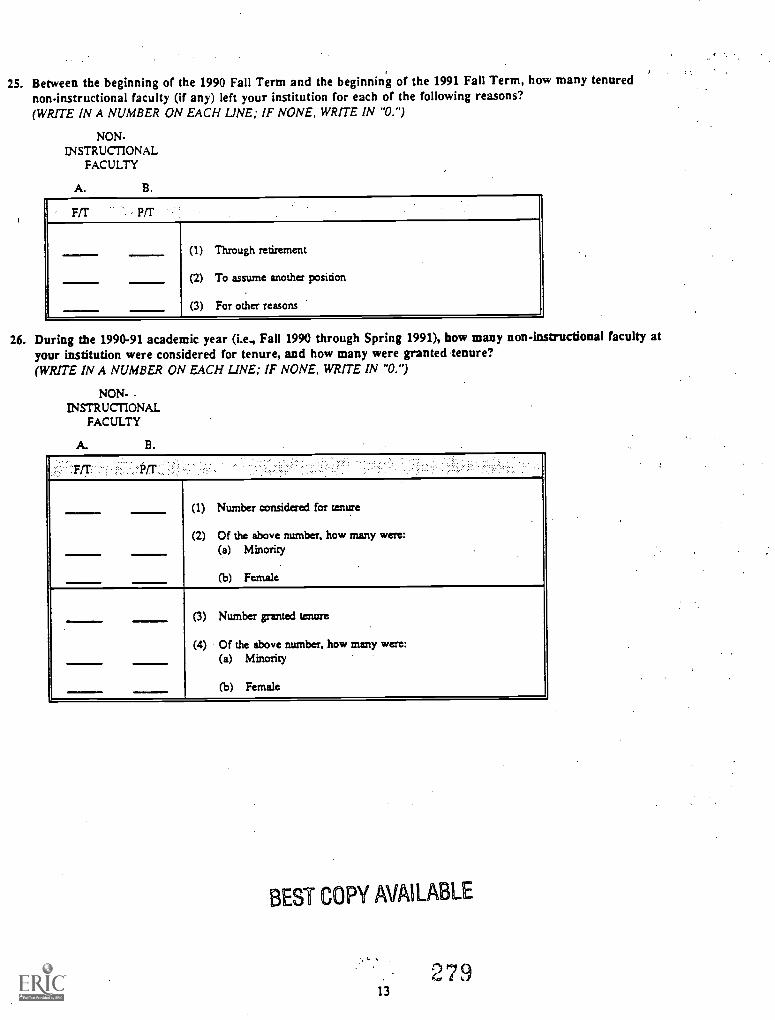
25. Between the beginning of the 1990 Fall Term and the beginning of the 1991 Fall Term, how many tenurednon-instructional faculty (if any) left your institution for each of the following reasons?(WRITE IN A NUMBER ON EACH LINE; IF NONE, WRITE IN "0.")
NON-INSTRUCTIONAL
FACULTY
A. B.
F/T PIT
(1) Through retirement
(2) To assume another position
(3) For other reasons
26. During the 1990-91 academic year (i.e., Fall 1990 through Spring 1991), how many non-instructional faculty atyour institution were considered for tenure, and how many were granted tenure?(WRITE IN A NUMBER ON EACH LINE; IF NONE, WRITE IN "0. ")
NON- -INSTRUCTIONAL
FACULTY
A. B.
Fir P
(1) Number considered for tenure
(2) Of the above number. how many were:(a) Minority
(b) Female
(3) Number granted tenure
(4) Of the above number, how many were:(a) Minority
(b) Female
BEST COPY AVAILABLE
27913
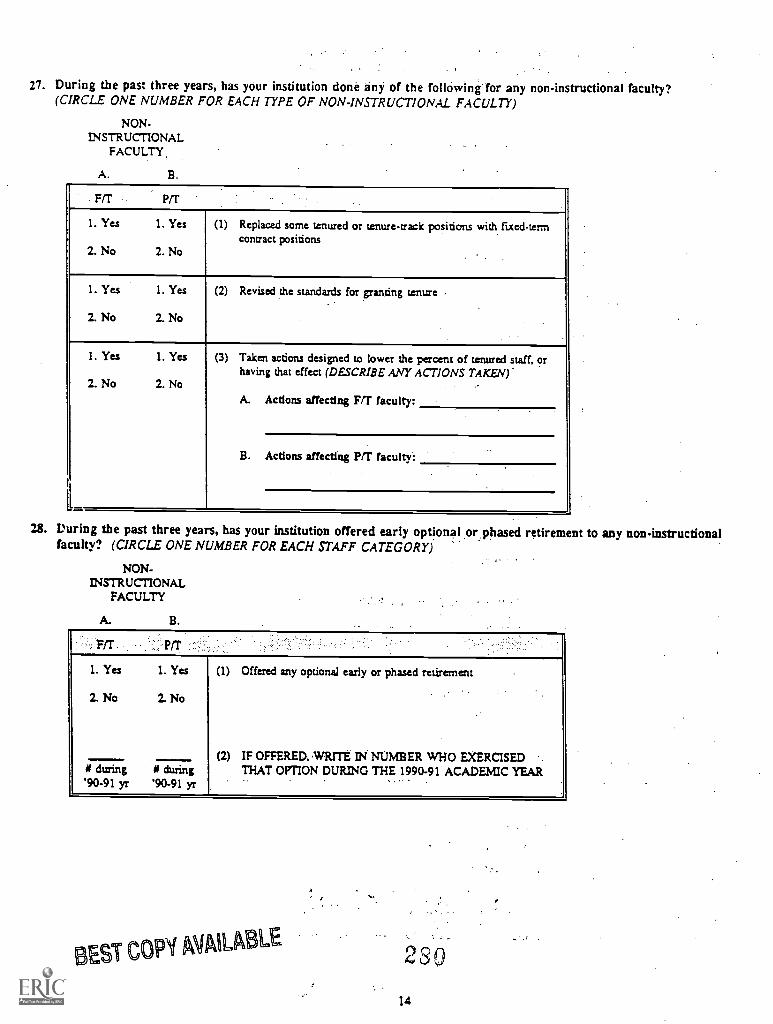
27. During the past three years, has your institution done any of the following for any non-instructional faculty?(CIRCLE ONE NUMBER FOR EACH TYPE OF NON- INSTRUCTIONAL FACULTY)
NON-INSTRUCTIONAL
FACULTY,
A. B.
FIT Pa
1. Yes
2. No
1. Yes
2. No
(1) Replaced some tenured or tenure-track positions with fixed-termcontract positions
1. Yes
2. No
1. Yes
2. No
(2) Revised the standards for granting tenure .
1.
1. Yes
2. No
1. Yes
2. No
(3) Taken actions designed to lower the percent of tenured staff, orhaving that effect (DESCRIBE ANY ACTIONS TAKEN)
A. Actions affecting F/T faculty:
B. Actions affecting P/T faculty:
28. During the past three years, has your institution offered early optional or: phased retirement to any non-instructionalfaculty? (CIRCLE ONE NUMBER FOR EACH STAFF CATEGORY)
NON-INSTRUCTIONAL
FACULTY
A. B.
Fa P
1. Yes
2. No
1. Yes
2. No
(1)
(2)
Offered any optional early or phased retirement
IF OFFERED, WRITE IN NUMBER WHO EXERCISEDTHAT OPTION DURING THE 1990-91 ACADEMIC YEAR# during
'90-91 yr# during'90-91 yr
BEST COPY MIKAr.
280
14
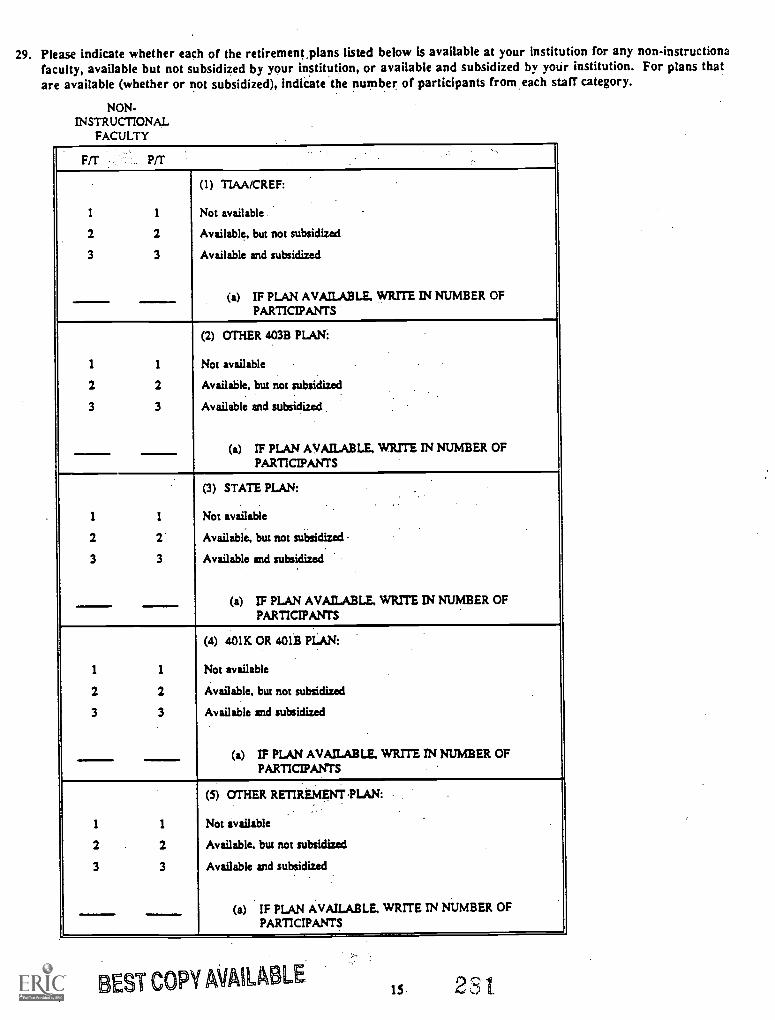
29. Please indicate whether each of the retirement, plans listed below is available at your institution for any non-instructionafaculty, available but not subsidized by your institution, or available and subsidized by your institution. For plans thatare available (whether or not subsidized), indicate the number of participants from. each staff category.
NON-INSTRUCTIONAL
FACULTY
F/T pa(1) TIAA/CREF:
1 1 Not available
2 2 Available, but not subsidized
3 3 Available and subsidized
(a) IF PLAN AVAILABLE, WRITE al NUMBER OFPARTICIPANTS
(2) OTHER 403B PLAN:
1 1 Not available
2 2 Available, but not subsidized
3 3 Available and subsidized
(a) IF PLAN AVAILABLE, WRITE IN NUMBER OFPARTICIPANTS
(3) STATE PLAN:
1 I Not available
2 2 Available, but not subsidized
3 3 Available and subsidized.
(a) IF PLAN AVAILABLE, WRITE N NUMBER OFPARTICIPANTS
(4) 401K OR 401B PLAN:
1 1 Not available
2 2 Available, but not subsidized
3 3 Available and subsidized
(a) IF PLAN AVAILABLE, WRITE IN NUMBER OFPARTICIPANTS
(5) OTHER RETIREMENT -PLAN:
1 1 Not available
2 2 Available, but not subsidized
3 3 Available and subsidized
(a) IF PLAN AVAILABLE. WRITE IN NUMBER OFPARTICIPANTS
;EST COPY AVA1LA LEis 231.
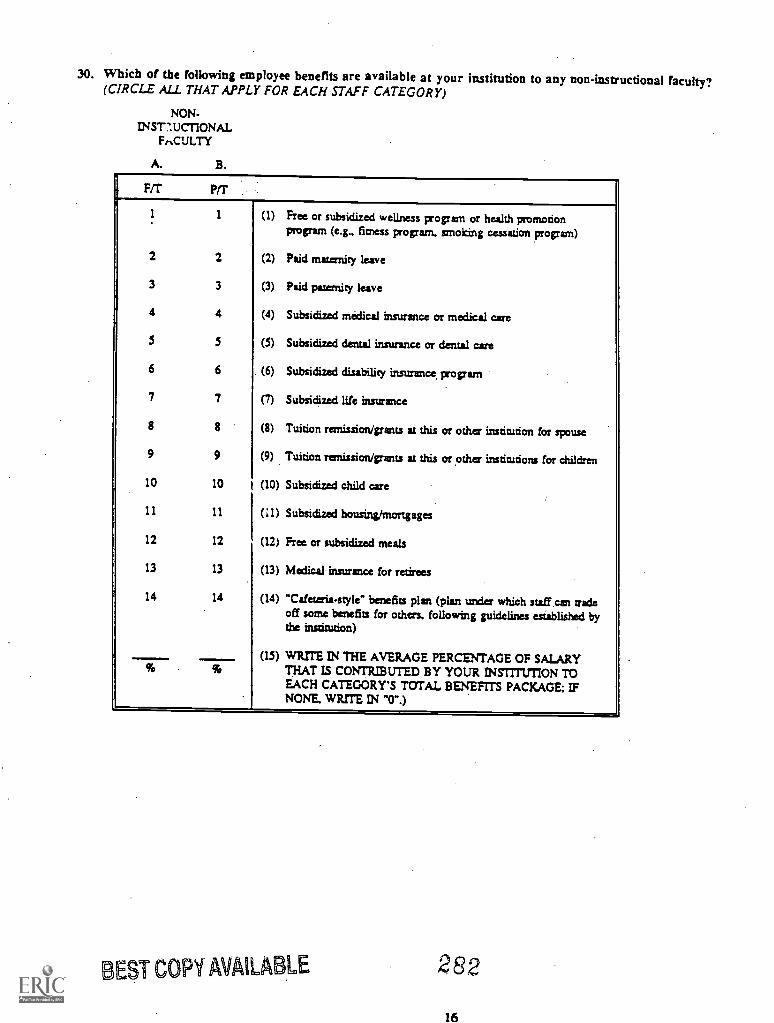
30. Which of the following employee benefits are available at your institution to any non-instructional faculty?(CIRCLE ALL THAT APPLY FOR EACH STAFF CATEGORY)
NON-114Sr:UCTIONAL
FI.CULTY
A. B.I
Fir Prr
1 1 (1) Free or subsidized wellness program or health promotionprogram (e.g.. fitness program. smoking cessation program)
2 2 (2) Paid maternity leave
3 3 (3) Paid paternity leave
4 4 (4) Subsidized medical insurance or medical care
S 5 (5) Subsidized dental insurance or dental care
6 6 (6) Subsidized disability insurance program
7 7 (7) Subsidized life insurance
8 8 (8) Tuition remission/grants at this or other institution for spouse
9 9 (9) Tuition remission/grants at this or other institutions for children
10 10 (10) Subsidized child care
11 11 (U) Subsidized housing/mortgages
12 12 (12) Free or subsidized meals
13 13 (13) Medical insurance for retirees
14 14 (14) "Cafeteria-style" benefits plan (plan under which staff can tradeoff some benefits for others. following guidelines established bythe institution)
(15) WRITE IN THE AVERAGE PERCENTAGE OF SALARY96 % THAT IS CONTRIBUTED BY YOUR INSTITUTION TO
EACH CATEGORY'S TOTAL BENEFITS PACKAGE; IFNONE. WRITE IN ''0".)
BEST COPY MAU LE 282
16
LABEL
PLEASE INDICATE THE TOTAL TIME REQUIREDTO COMPLETE THIS QUESTIONNAIRE:n hours
minutesnTHANK YOU VERY MUCH FOR YOUR PARTICIPATION.
RETURN THIS QUESTIONNAIRE IN THE ENCLOSEDPREPAID ENVELOPE TO:
National Opinion Research Center (4552)University of Chicago1155 East 60th Street
Chicago, Illinois 60637
BEST COPY AVAILABLE 2 8317
NORC44524/92
Please fill in your name and your title at this stitution, as well as the names and titles of any other individuals whohave answered one or more questions in this c, tionnaire, and the question numbers each individual worked on.Include telephone numbers in case we have any questions about any entries.
YOUR NAME: TITLE:
PHONE #: QUESTIONS #s:
OTHER NAME: TITLE:
PHONE #: QUESTIONS #s:
OTHER NAME: TITLE:
PHONE #: QUESTIONS #s:
OTHER NAME: TITLE:
PHONE #: QUESTIONS #s:
OTHER NAME: TITLE:
PHONE #: QUESTIONS #s:
Once the answers have been processed, all identifying information, including names and telephone numbers, will nolonger be associated with this questionnaire.
GIVING US FEEDBACK ON THE INSTITUTION QUESTIONNAIRE
Before a questionnaire can be used in a study, it must first be carefully tested to ensure that all of the questions areclear and easily understood by the person completing it. We would like you to provide us with feedback about thequestionnaire. Please take some time now to review the questions and your answers.
If the general meaning of a question was unclear to you, please circle the question number.
If there were specific words or phrases in a question that did not make sense to you, please circle the wordsor phrases.
If any of the response categories to a question did not make sense to you, please circle those categories.
Use the margins next to a question or answer to provide us with your feedback about questions, questionwording, or any other problems that you encountered in answering a question. Please be as critical as youMe; feel free to use the back cover for any other comments you have about the questions or the study.
Your help is greatly appreciated. Your feedback will ensure that this questionnaire, and the data derived from it, willbe reliable.
BEST COPY AVAILABLE' 18284

LABEL
COMMMNTS:
285
1993 National Study of Postsecondary FacultyMethodology Report
Appendix F
1993 NSOPF Faculty Questionnaire
286
U.S. Department of EducationOffice of Educational Research and Improvement
National Center for Education Statistics
1993 NATIONAL STUDY OF-POSTSECONDARY FACULTY
FACULTYQUESTIONNAIRE
Co-sponsored by:
Contractor:
All information on this form will be kept confidential and will not bedisclosed or released to your institution or any other group or individual.
National Science FoundationNational Endowment for the Humanities
National Opinion Research Center (NORC)University of ChicagoMailing Address:1525 East 55th StreetChicago, Illinois 60615Toll-Free Number: 1-800-733-NORC
2 87
ONG No. 1850-0608Expiratloo Date: 12/93
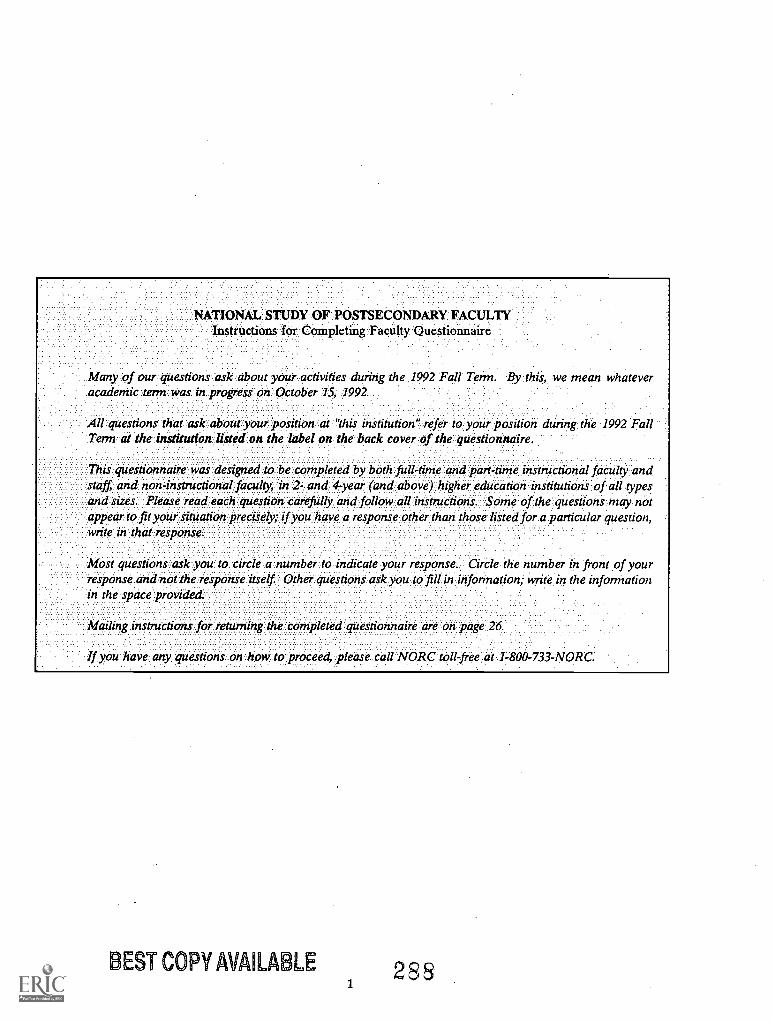
NATIONAL 'STUDY OF POSTSECONDARY FACULTYInstructions for Completing Faculty Questionnaire
Many- of our RitestiOns ask about; duringyour: dung the 1992 Fall Tern:. By:this, we mean whateveractivitiesacadeMiC lerM:WaSin progress on 'October 15 1992.
....
. ... .
All:queitionS...that.:dikabOzti:JOUr.:PoSition:.:dt!'this thiring:the 1992 Fall E:
.7,?enn..diihe:hiStitatiatr14iteitph the..label on:Mi.:back cover thi:guestionhaire.-
is.. ::questionnaire.wai:designed:0:be.completedbybotkfitlkone.dnd pan:lne:instructional faculty'; andStaff:4nctnon4nstructionalfaculty,::in:Z.fand::4;year::(and:qbove):.-1iigherg.edlication institutions: of all:typesand sizes Please read each question:carefully and. follow all instructions Some of questions may notappear to fit your SitUatiOnpreciSely;::Ifyou- have a responSe.:otherthan those: listed for a particular question,write: :in that response.
. .
Most.,questions.,:...askyoa..V..tircle...dhanibetla.inditateyoar reSpOnse....:Circle-:the:number in front of your.. ..... ..... . .
respOnse.-ari4hathe..responie.itself:::.0.ther.qUestibriS.aikyouldfill.i/finforination; write.in the infomiationin the .:
Mailing oistrugiov.lot: returning the.: questionnaire are on page. 26.
. ... . -......:Ifyozi:have::any.:questions:on-how.:toprocee-4.:please .-,call..10RC.folkfree 1-800-733-NORC
BEST COPY AVAILABLE1
2S8
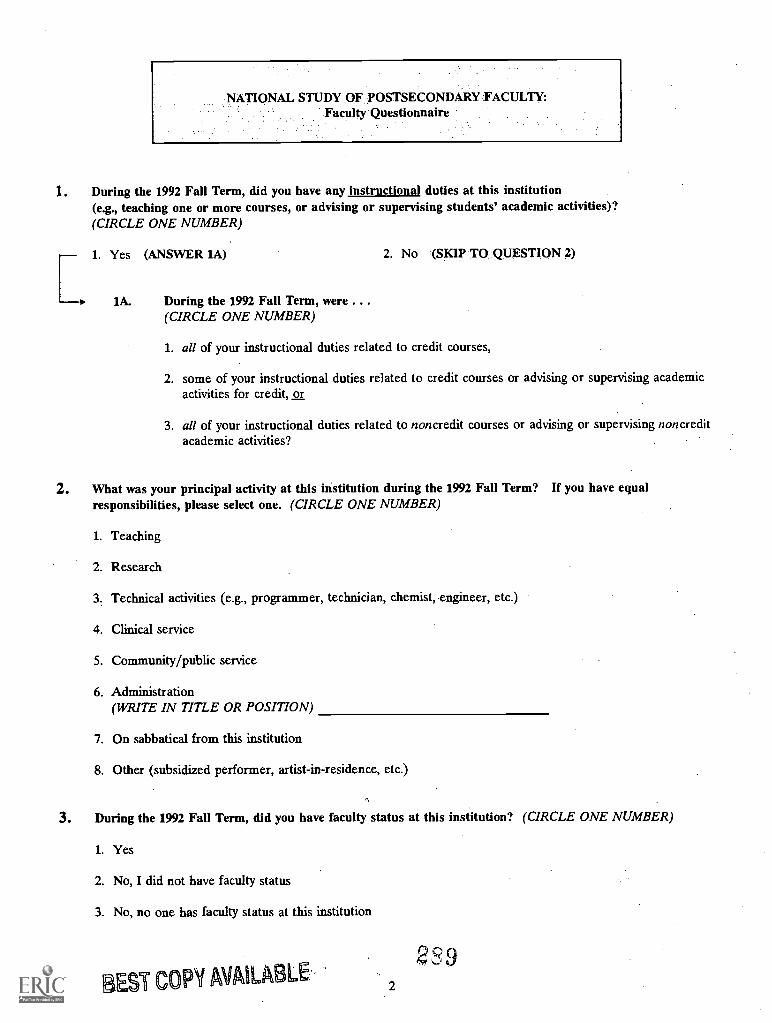
NATIONAL STUDY OF POSTSECONDARY FACULTY:Faculty Questionnaire
1. During the 1992 Fall Term, did you have any instructional duties at this institution(e.g., teaching one or more courses, or advising or supervising students' academic activities)?(CIRCLE ONE NUMBER)
1. Yes (ANSWER 1A) 2. No (SKIP TO QUESTION 2)
1A. During the 1992 Fall Term, were ...(CIRCLE ONE NUMBER)
1. all of your instructional duties related to credit courses,
2. some of your instructional duties related to credit courses or advising or supervising academicactivities for credit, or
3. all of your instructional duties related to noncredit courses or advising or supervising noncreditacademic activities?
2. What was your principal activity at this institution during the 1992 Fall Term? If you have equalresponsibilities, please select one. (CIRCLE ONE NUMBER)
1. Teaching
2. Research
3. Technical activities (e.g., programmer, technician, chemist, engineer, etc.)
4. Clinical service
5. Community/public service
6. Administration(WRITE IN TITLE OR POSITION)
7. On sabbatical from this institution
8. Other (subsidized performer, artist-in-residence, etc.)
3. During the 1992 Fall Term, did you have faculty status at this institution? (CIRCLE ONE NUMBER)
1. Yes
2. No, I did not have faculty status
3. No, no one has faculty status at this institution
BEST COPY AVAILABLE289
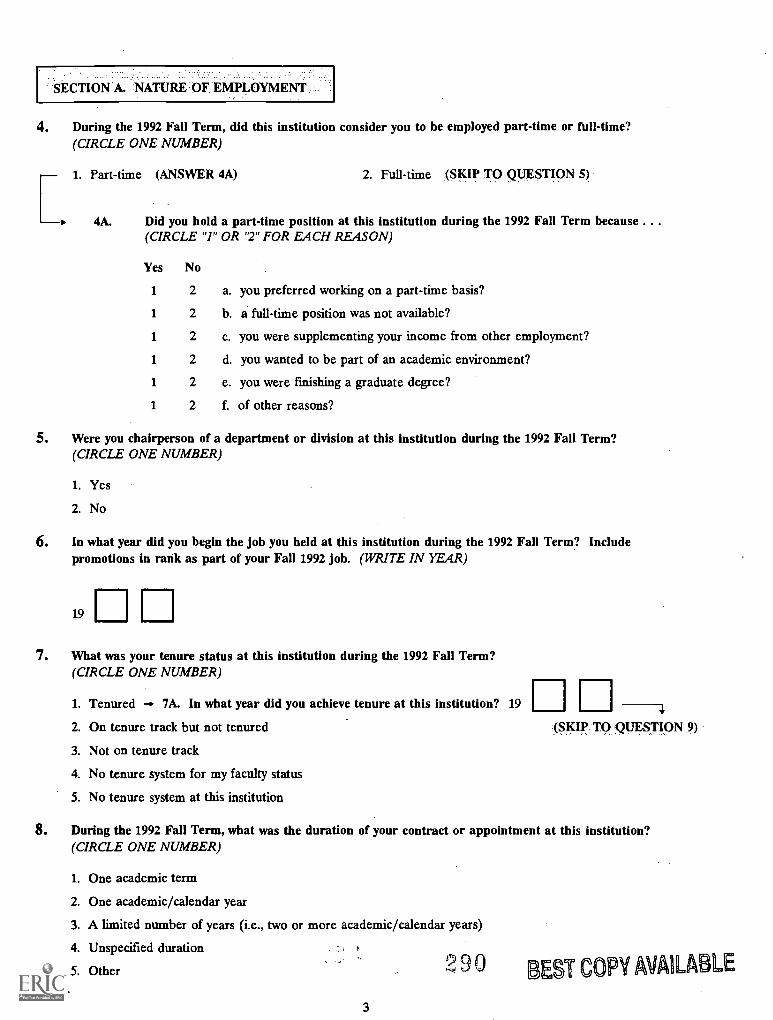
4. During the 1992 Fall Term, did this institution consider you to be employed part-time or full-time?(CIRCLE ONE NUMBER)
1. Part-time (ANSWER 4A) 2. Full-time (SKIP TO QUESTION 5)
4A. Did you hold a part-time position at this institution during the 1992 Fall Term because . . .
(CIRCLE "1" OR "2" FOR EACH REASON)
Yes No
1 2
1 2
1 2
1 2
1 2
1 2
a. you preferred working on a part-time basis?
b. a full-time position was not available?
c. you were supplementing your income from other employment?
d. you wanted to be part of an academic environment?
e. you were finishing a graduate degree?
f. of other reasons?
5. Were you chairperson of a department or division at this institution during the 1992 Fall Term?(CIRCLE ONE NUMBER)
1. Yes
2. No
6. In what year did you begin the job you held at this institution during the 1992 Fall Term? Includepromotions in rank as part of your Fall 1992 job. (WRITE IN YEAR)
19
7. What was your tenure status at this institution during the 1992 Fall Term?(CIRCLE ONE NUMBER)
1. Tenured - 7A. In what year did you achieve tenure at this institution? 19
2. On tenure track but not tenured
3. Not on tenure track
4. No tenure system for my faculty status
5. No tenure system at this institution
(SKIP TO QUESTION 9)
8. During the 1992 Fall Term, what was the duration of your contract or appointment at this institution?(CIRCLE ONE NUMBER)
1. One academic term
2. One academic/calendar year
3. A limited number of years (i.e., two or more academic/calendar years)
4. Unspecified duration n5. Other
3
rP) EST COPY AVAILABLE
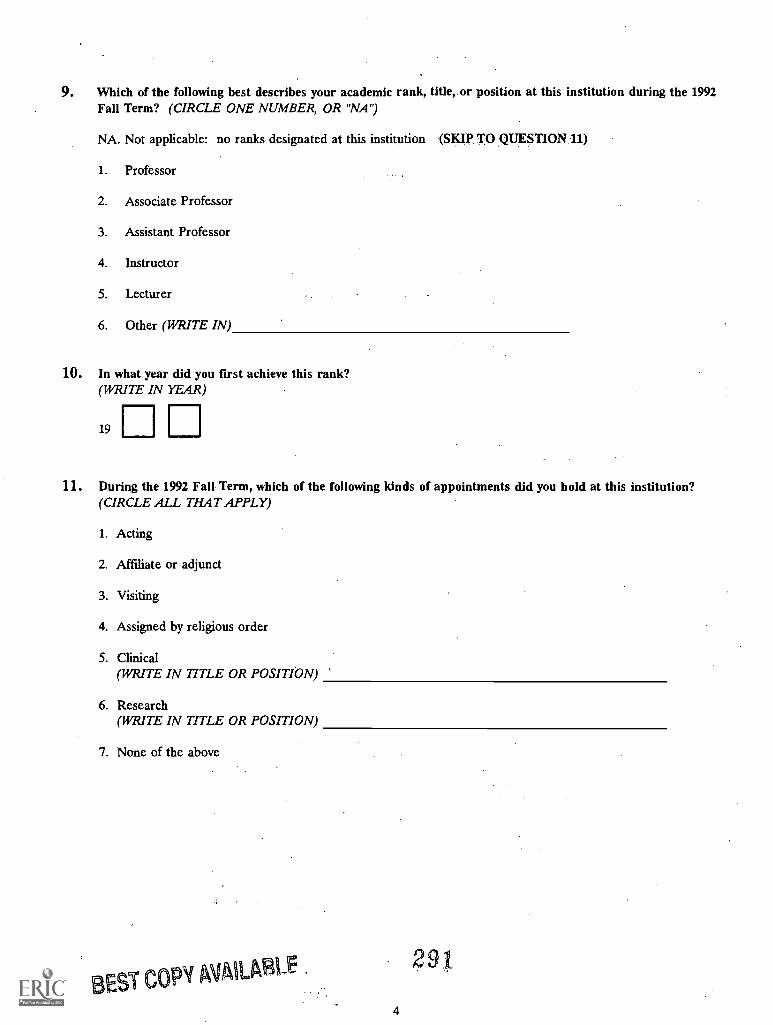
9. Which of the following best describes your academic rank, title, or position at this institution during the 1992Fall Term? (CIRCLE ONE NUMBER, OR "NA")
NA. Not applicable: no ranks designated at this institution (SKIP TO QUESTION 11)
1. Professor
2. Associate Professor
3. Assistant Professor
4. Instructor
5. Lecturer
6. Other (WRITE IN)
10. In what year did you first achieve this rank?(WRITE IN YEAR)
19
11. During the 1992 Fall Term, which of the following kinds of appointments did you hold at this institution?(CIRCLE ALL THAT APPLY)
1. Acting
2. Affiliate or adjunct
3. Visiting
4. Assigned by religious order
5. Clinical(WRITE IN TITLE OR POSITION)
6. Research(WRITE IN TITLE OR POSITION)
7. None of the above
EST COPY AVAILABLE29
4
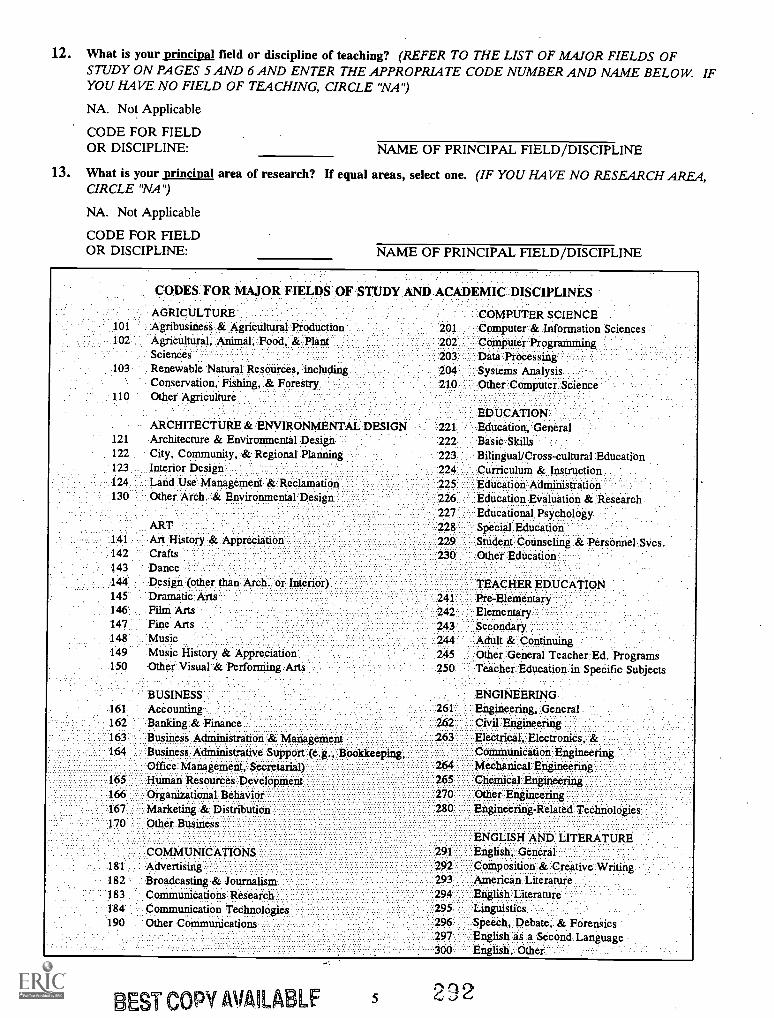
12. What is your principal field or discipline of teaching? (REFER TO THE LIST OF MAJOR FIELDS OFSTUDY ON PAGES 5 AND 6 AND ENTER THE APPROPRIATE CODE NUMBER AND NAME BELOW. IFYOU HAVE NO FIELD OF TEACHING, CIRCLE "NA'9
NA. Not Applicable
CODE FOR FIELDOR DISCIPLINE: NAME OF PRINCIPAL FIELD/DISCIPLINE
13. What is your principal area of research? If equal areas, select one.CIRCLE "NA")
NA. Not Applicable
CODE FOR FIELDOR DISCIPLINE:
(IF YOU HAVE NO RESEARCH AREA,
NAME OF PRINCIPAL FIELD/DISCIPLINE
CODES FOR MAJOR FIELDS OF STUDY AND ACADEMIC :DISCIPLINES
AGRICULTURE101 Agribusiness & Agricultural Production102 Agricultural, Animal. Food. & Plant
ScienceSRenewable Natural Resources, includingConservation, Fishing, & Forestry
110 Other Agriculture
ARCHITECTURE & ENVIRONMENTAL DESIGN121 Architecture & Environmental Design122 City, Community, & Regional Planning123 'Interior Design124 Land Use Management & Reclamation130 Other Arch. & Environmental Design
ART141 Art History & Appreciation142 Crafts143 Dance144 Design(other than Arch. or Interior)145 Dramatic Arts146: Film Arts147 Fine Arts148.149 Music History & Appreciation150 Other Visual & Perforniing Arts
Music
BUSINESS161 Accounting162 Banking & Finance163 Business Administration & Management164 Business Administrative Support (e.g., Bookkeeping.
Office Management, Secretarial)165 Human Resources Development166 Organizational Behavior167 Marketing & Distribution170 Other Business
181
182183184190
COMMUNICATIONSAdvertisingBroadcasting & JournalismCoMmunications ResearchCommunication TechnologiesOther Communications
COMPUTER SCIENCE201 Computer & Information Sciences202 Computer Prograinming203 Data Processing204 Systems Analysis210 Other Computer Science
EDUCATION221 Education, General222 Basic Skills223 Bilingual/Cross-cultural Education224 Curriculum& Instruction225 Education Administration226 Education Evaluation & Research227 Educational Psychology228 Special Education229 Student Counseling & Personnel .Svcs.230 Other Education
TEACHER EDUCATION241 Pre-Elementary242 Elementary243 SeCondary244 Adult & Continuing245 Other General Teacher Ed. Programs250 Teacher Education in Specific Subjects
ENGINEERING261 Engineering,.peneral262 Civil :Engineering263 Electrical, Electronics, &
Communication Engineering264 Mechanical Engineering265 Chemical Fngimering270 Other Engineering280 Engineering-Related Technologies
291292293294295296297300
ENGLISH AND LITERATUREEnglish, GeneralCoMposition & Creative WritingAmerican LiteratureEnglish LiteratureLinguisticsSpeech, Debate, & ForenlicsEnglish as aSecond LanguageEnglish, Other.
BEST COPY AVAILABLF 5 12
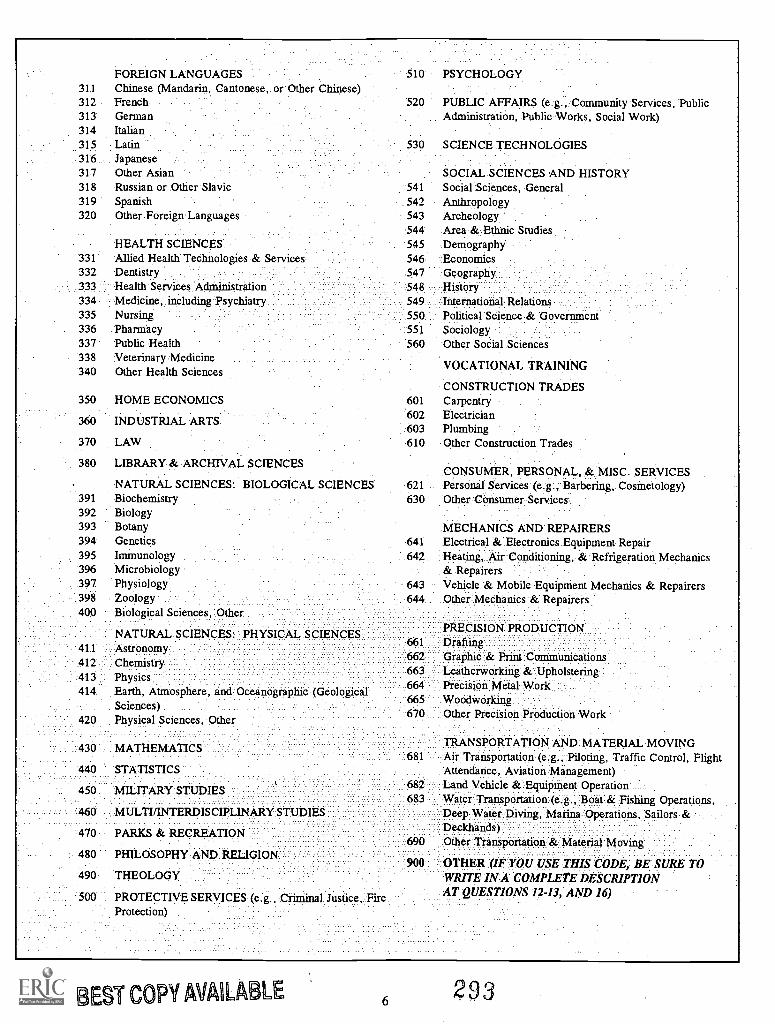
FOREIGN LANGUAGES31.1 Chinese (Mandarin, Cantonese, or Other Chinese)312 French313 German314 Italian315 Latin316 Japanese317 Other Asian318 Russian or Other Slavic319 Spanish320 Other Foreign Languages
510 PSYCHOLOGY
520 PUBLIC AFFAIRS (e.g., Community Services, PublicAdministration, Public Works, Social Work)
530 SCIENCE TECHNOLOGIES
HEALTH SCIENCES331 Allied Health Technologies & Services332 Dentistry333 Health Services- Adininistration334 :Medicine,. including 'psychiatry335 Nursing336 Pharmacy337 Public Health338 Veterinary Medicine340 Other Health Sciences
350
360
370
380
HOME ECONOMICS
INDUSTRIAL ARTS
LAW
LIBRARY & ARCHIVAL SCIENCES
NATURAL SCIENCES: BIOLOGICAL SCIENCES391 Biochemistry392 Biology393 Botany394 Genetics395 Immunology396 Microbiology397 Physiology398 Zoology400 Biological Sciences, .0ther
NATURAL. SCIENCES: .PHYSICAL SCIENCES
541542543544545546
SOCIAL. SCIENCES AND HISTORYSocial Sciences, GeneralAnthropologyArcheologyArea & Ethnic StudiesDemographyEconomics
:547 Geography :548 History5.49 :-:-Internatiohal Relations550 Political Science & Government551 Sociology560 Other Social Sciences
VOCATIONAL TRAINING
CONSTRUCTION TRADES601 Carpentry602 EleCtrician603 Plumbing610 Other Construction Trades
CONSUMER, PERSONAL, & MISC. SERVICES621 Persenal Services (e.g.; Barbering, Cosinetology)630 Other Consumer Seivices.
MECHANICS AND REPAIRERS641 Electrical & Electronics Equipment Repair642 Heating, Air- Conditioning, & Refrigeration Mechanics
& RepairersVehicle & Mobile Equipnient Mechanics & RepairersOtherMechanics & Repairers
41.1:.
412:-: .413...
414.
420
ChemistryPhysics.Earth, AtmoSphere, and Oceanographic :(deolbgiCal-Sciences)Physical Sciences, Other
MATHEMATICS
`STATISTICS
MILITARY STUDIES
661662:
: 663.:664665670
PRECISION PRODUCTIONDraftingGT4phi.-4 Print .CommunicationsLeathenvorking& UpholsteringPrecision Metal Work .
Woodworking.': : ".`Other Precision production.Work
:460 ::MULTI/INTERDISCIPLINARY STUDIES
:470 PARKS & RECREATION
480 PHILOSOPHY AND RELIGION'
490 THEOLOGY
PROTECTIVE SERVICES (e.g., Crintinal justice, -FireProtection)
TRANSPORTATION AND MATERIAL MOVINGAir Transportation (e.g., Piloting, Traffic Control, FlightAttendance, Aviation Management)
682. ::::: Vehicle & EquiPthent Operation683 N.Vater Transportation (e..g ....,.Boat-8c Fishing Operations,
Deep 'Water Diving; Marina Operations, Sailors &Deckhands).,'
690 bitter transixitatioziclviaterial
900; ..0TRER rou. USE CODE, BE SURE TOWRITE IN A COMPLETE DESCRIPTIONAT QUESTIONS 12-13, AND 16)
BEST COPY AVAILABLE 6293
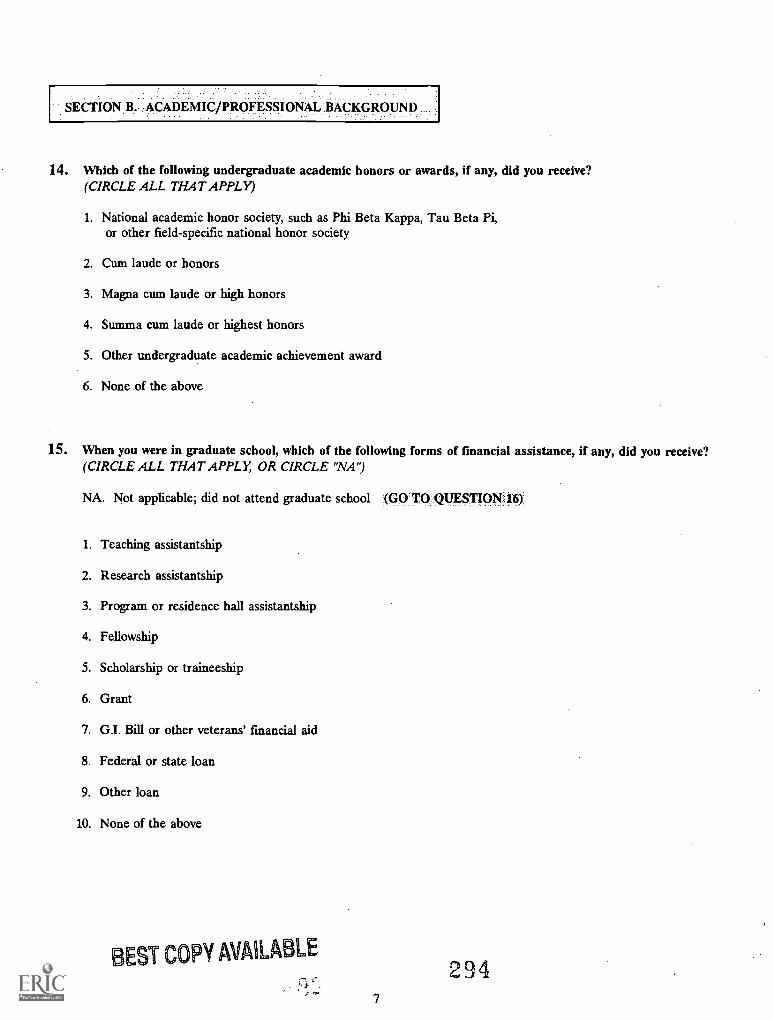
SECTION B. ACADEMIC/PROFESSIONAL-BACKGROUND
14. Which of the following undergraduate academic honors or awards, if any, did you receive?(CIRCLE ALL THAT APPLY)
1. National academic honor society, such as Phi Beta Kappa, Tau Beta Pi,or other field-specific national honor society
2. Cum laude or honors
3. Magna cum laude or high honors
4. Summa cum laude or highest honors
5. Other undergraduate academic achievement award
6. None of the above
15. When you were in graduate school, which of the following forms of financial assistance, if any, did you receive?(CIRCLE ALL THAT APPLY, OR CIRCLE "NA")
NA. Not applicable; did not attend graduate school (GO TO QUESTION 16)
1. Teaching assistantship
2. Research assistantship
3. Program or residence hall assistantship
4. Fellowship
5. Scholarship or traineeship
6. Grant
7. G.I. Bill or other veterans' financial aid
8. Federal or state loan
9. Other loan
10. None of the above
EST COPY AVAILABLE
7
94
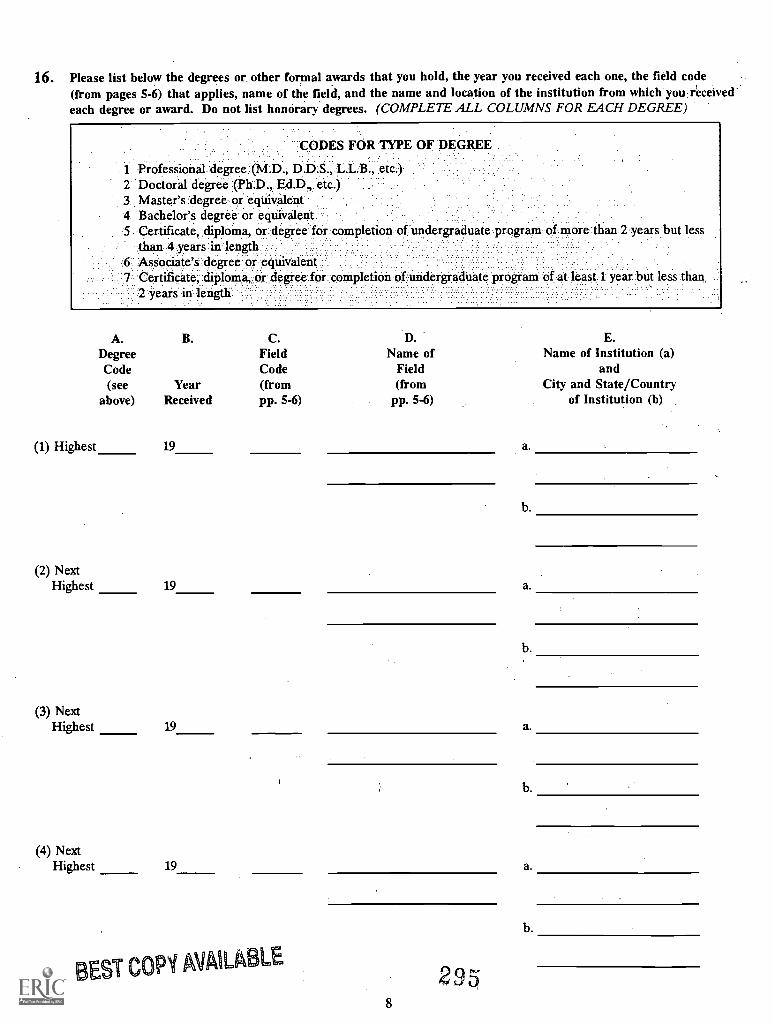
16. Please list below the degrees or other formal awards that you hold, the year you received each one, the field code(from pages 5-6) that applies, name of the field, and the name and location of the institution from which you received'each degree or award. Do not list honorary degrees. (COMPLETE ALL COLUMNS FOR EACH DEGREE)
jCODES FOR TYPE OF DEGREE
1 Professional degree.:(MD.;2 Doctoral degree'y(PhD., Ed.D etc.)3 Master's:degree:or equivalent4 BaChelor's degree:or equivalent.5 Certificate, :diploina, .or:degree.fOr coinpletion of: undergraduate program of more.than 2 years but less
::than,4years:inlength.Associate's degree or equivalent:Certificate; diploma, or 4egt6efOr:cotiipieticin of at least 1 year but less than2 years in length:.
A. B. C. D. E.Degree Field Name of Name of Institution (a)Code Code Field and(see Year (from (from City and State/Country
above) Received PP. 5-6) pp. 5-6) of Institution (b)
(1) Highest 19
(2) NextHighest 19
a.
b.
a.
b.
(3) NextHighest 19 a.
b.
(4) NextHighest 19 a.
BEST COPY AVAILABLE
8
235,
b.
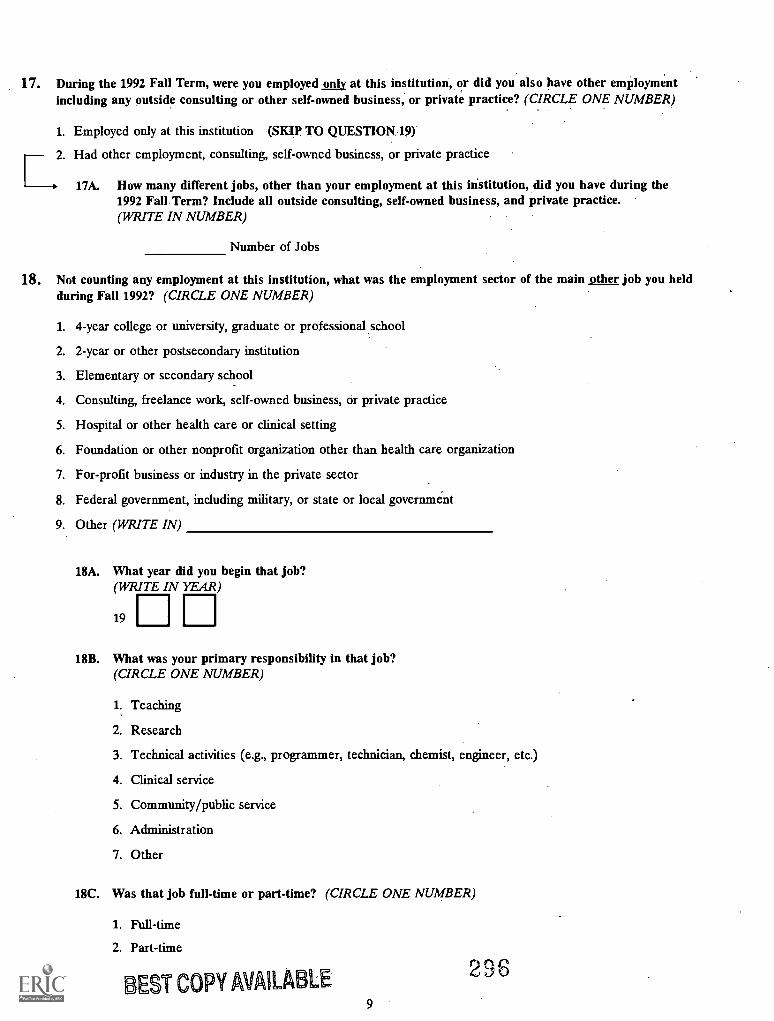
17. During the 1992 Fall Term, were you employed only at this institution, or did you also have other employmentincluding any outside consulting or other self-owned business, or private practice? (CIRCLE ONE NUMBER)
1. Employed only at this institution (SKIP TO QUESTION 19)
L2. Had other employment, consulting, self-owned business, or private practice
17A. How many different jobs, other than your employment at this institution, did you have during the1992 Fall. Term? Include all outside consulting, self-owned business, and private practice.(WRITE IN NUMBER)
Number of Jobs
18. Not counting any employment at this institution, what was the employment sector of the main other job you heldduring Fall 1992? (CIRCLE ONE NUMBER)
1. 4-year college or university, graduate or professional school
2. 2-year or other postsecondary institution
3. Elementary or secondary school
4. Consulting, freelance work, self-owned business, or private practice
5. Hospital or other health care or clinical setting
6. Foundation or other nonprofit organization other than health care organization
7. For-profit business or industry in the private sector
8. Federal government, including military, or state or local government
9. Other (WRITE IN)
18A. What year did you begin that job?(WRITE IN YEAR)
19
18B. What was your primary responsibility in that job?(CIRCLE ONE NUMBER)
1: Teaching
2. Research
3. Technical activities (e.g., programmer, technician, chemist, engineer, etc.)
4. Clinical service
5. Community/public service
6. Administration
7. Other
18C. Was that job full-time or part-time? (CIRCLE ONE NUMBER)
1. Full-time
2. Part-time
BEST COPY AVAILABLE9
296
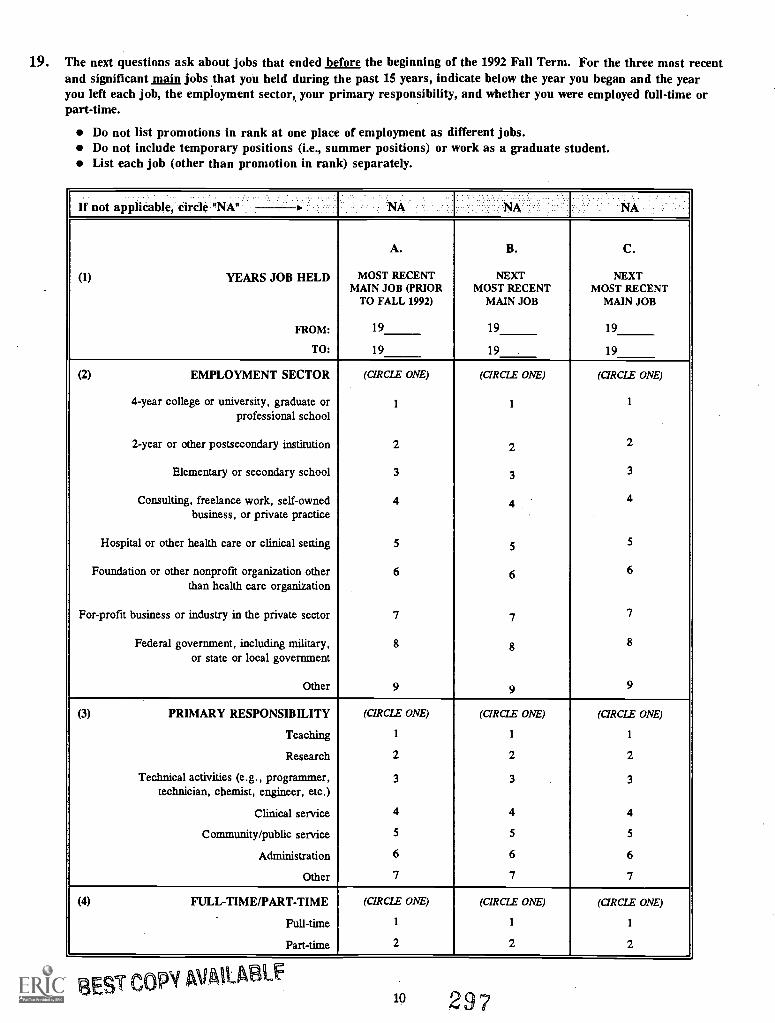
19. The next questions ask about jobs that ended before the beginning of the 1992 Fall Term. For the three most recentand significant main jobs that you held during the past 15 years, indicate below the year you began and the yearyou left each job, the employment sector, your primary responsibility, and whether you were employed full-time orpart-time.
Do not list promotions in rank at one place of employment as different jobs.Do not include temporary positions (i.e., summer positions) or work as a graduate student.List each job (other than promotion in rank) separately.
If "NA" NA NA NAnot applicable, circle
(1) YEARS JOB HELD
FROM:
TO:
A.
MOST RECENTMAIN JOB (PRIOR
TO FALL 1992)
19
B.
NEXTMOST RECENT
MAIN JOB
19
C.
NEXTMOST RECENT
MAIN JOB
19
19 19 19
(2) EMPLOYMENT SECTOR
4-year college or university, graduate orprofessional school
2-year or other postsecondary institution
Elementary or secondary school
Consulting, freelance work, self-ownedbusiness, or private practice
Hospital or other health care or clinical setting
Foundation or other nonprofit organization otherthan health care organization
For-profit business or industry in the private sector
Federal government, including military,or state or local government
Other
(CIRCLE ONE)
1
2
3
4
5
6
7
8
9
(CIRCLE ONE)
1
2
3
4
5
6
7
8
9
(CIRCLE ONE)
1
2
3
4
5
6
7
8
9
(3) PRIMARY RESPONSIBILITY
Teaching
Research
Technical activities (e.g., programmer,technician, chemist, engineer, etc.)
Clinical service
Community/public service
Administration
Other
(CIRCLE ONE)
1
2
3
4
5
6
7
(CIRCLE ONE)
1
2
3
4
5
6
7
(CIRCLE ONE)
1
2
3
4
5
6
7
(4) FULL-TIME/PART-TIME
Full-time
Part-time
(CIRCLE ONE)
1
2
(CIRCLE ONE)
1
2
(CIRCLE ONE)
1
2
BEST COPY AVAILAKF10 297
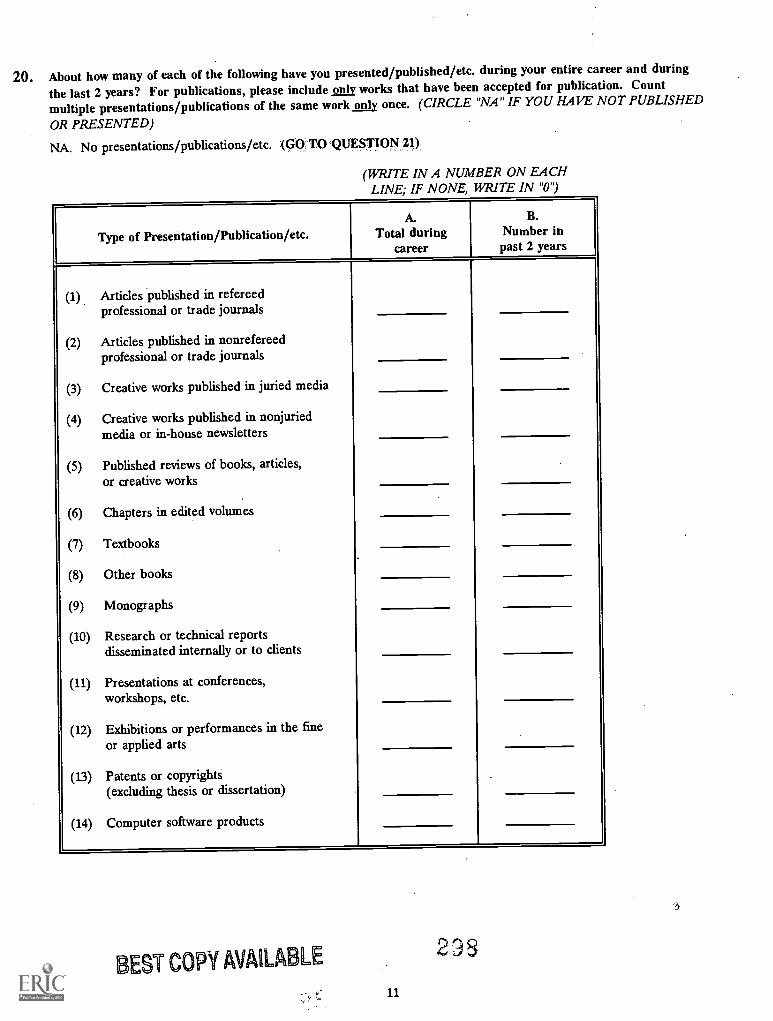
20. About how many of each of the following have you presented/published/etc. during your entire career and during
the last 2 years? For publications, please include only works that have been accepted for publication. Count
multiple presentations/publications of the same work only once. (CIRCLE "NA" IF YOU HAVE NOT PUBLISHED
OR PRESENTED)
NA. No presentations/publications/etc. (GO TO QUESTION 21)
(WRITE IN A NUMBER ON EACHLINE; IF NONE, WRITE IN "0")
Type of Presentation/Publication/etc.A.
Total duringcareer
B.Number in
past 2 years
(1) Articles published in refereedprofessional or trade journals
(2) Articles published in nonrefereedprofessional or trade journals
(3) Creative works published in juried media
(4) Creative works published in nonjuriedmedia or in-house newsletters
(5) Published reviews of books, articles,or creative works
(6) Chapters in edited volumes
(7) Textbooks
(8) Other books
(9) Monographs
(10) Research or technical reportsdisseminated internally or to clients
(11) Presentations at conferences,workshops, etc.
(12) Exhibitions or performances in the fineor applied arts
(13) Patents or copyrights(excluding thesis or dissertation)
(14) Computer software products
BEST COPY AVAILAa LE
11
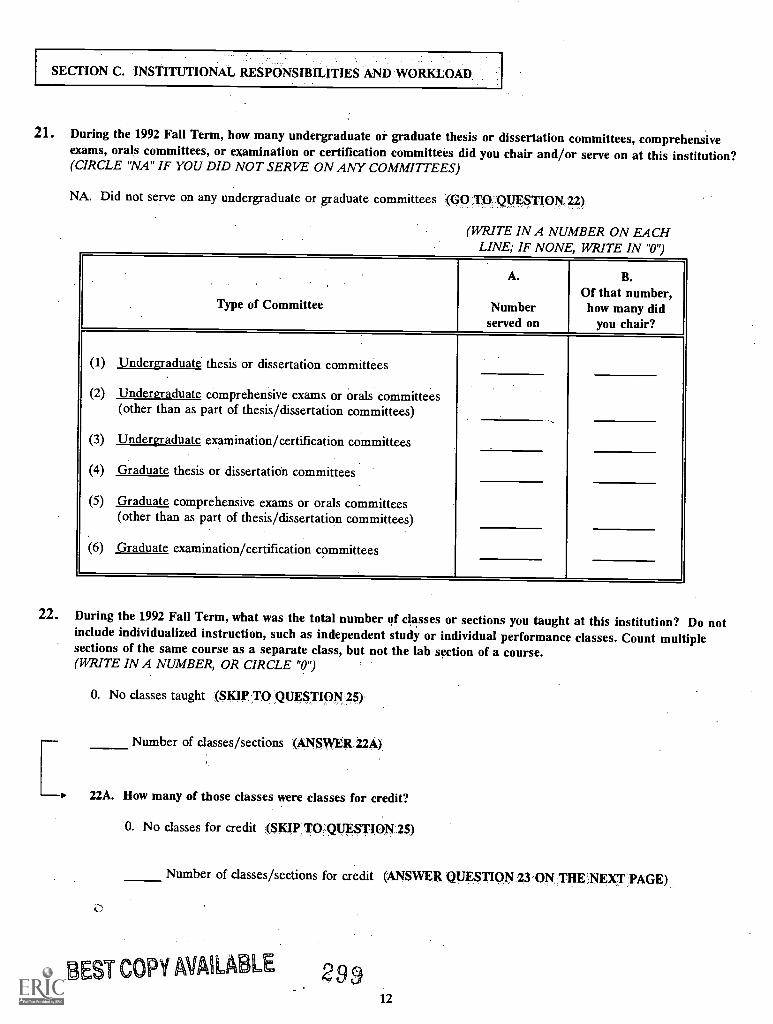
SECTION C. INSTITUTIONAL RESPONSIBILITIES AND WORKLOAD
21. During the 1992 Fall Term, how many undergraduate or graduate thesis or dissertation committees, comprehensiveexams, orals committees, or examination or certification committees did you chair and/or serve on at this institution?(CIRCLE "NA" IF YOU DID NOT SERVE ON ANY COMMITTEES)
NA. Did not serve on any undergraduate or graduate committees (GO TO QUESTION 22)
(WRITE IN A NUMBER ON EACHLINE; IF NONE, WRITE IN "0")
Type of Committee
A.
Numberserved on
B.Of that number,how many did
you chair?
(1) Undergraduate thesis or dissertation committees
(2) Undergraduate comprehensive exams or orals committees(other than as part of thesis/dissertation committees)
(3) Undergraduate examination/certification committees
(4) Graduate thesis or dissertation committees
(5) Graduate comprehensive exams or orals committees(other than as part of thesis/dissertation committees)
(6) Graduate examination/certification committees
22. During the 1992 Fall Term, what was the total number of classes or sections you taught at this institution? Do notinclude individualized instruction, such as independent study or individual performance classes. Count multiplesections of the same course as a separate class, but not the lab section of a course.(WRITE IN A NUMBER, OR CIRCLE "0")
0. No classes taught (S.fcIP:T.0:QtTsTIQN..25):
Number of classes/sectionS ,..(ANww..zzA),:
22A. How many of those classes were classes for credit?
0. No classes for credit (SKIP TO QUESTION 25)
Number of classes/sections for credit (ANSWER QUESTION 23 ON THE NEXT PAGE)
BEST COPY AVAILABLE 2912
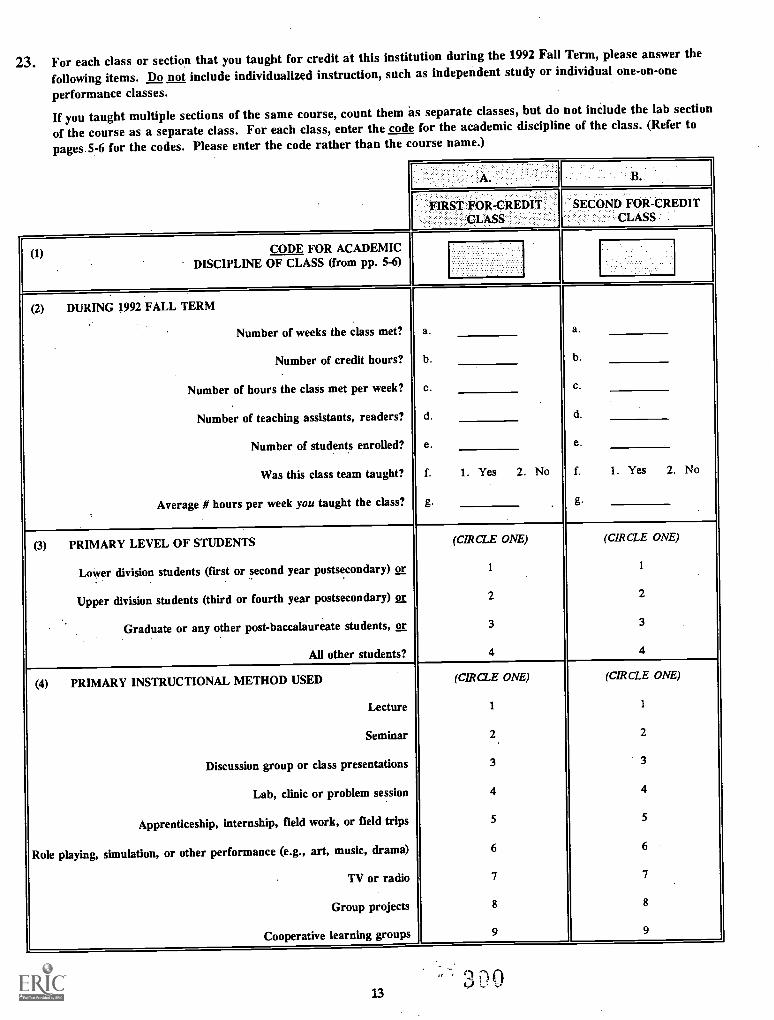
23. For each class or section that you taught for credit at this institution during the 1992 Fall Term, please answer the
following items. Do not include individualized instruction, such as independent study or individual one-on-one
performance classes.
If you taught multiple sections of the same course, count them as separate classes, but do not include the lab section
of the course as a separate class. For each class, enter the code for the academic discipline of the class. (Refer to
pages 5-6 for the codes. Please enter the code rather than the course name.)
A. B.
FIRST FOR-CREDITCLASS
SECOND FOR-CREDITCLASS
(1) CODE FOR ACADEMICDISCIPLINE OF CLASS (from PP. 5-6)
(2) DURING 1992 FALL TERM
Number of weeks the class met?
Number of credit hours?
Number of hours the class met per week?
Number of teaching assistants, readers?
Number of students enrolled?
Was this class team taught?
Average # hours per week you taught the class?
a.
b.
c.
d.
e.
f.
g.
No
a.
b.
c.
d.
e.
f.
g.
No1. Yes 2. 1. Yes 2.
(3) PRIMARY LEVEL OF STUDENTS
Lower division students (first or second year postsecondary) or
Upper division students (third or fourth year postsecondary) or
Graduate or any other post-baccalaureate students, or
All other students?
(CIRCLE ONE)
1
2
3
4
(CIRCLE ONE)
1
2
4
(4) PRIMARY INSTRUCTIONAL METHOD USED
Lecture
Seminar
Discussion group or class presentations
Lab, clinic or problem session
Apprenticeship, internship, field work, or field trips
Role playing, simulation, or other performance (e.g., art, music, drama)
TV or radio
Group projects
Cooperative learning groups
(CIRCLE ONE)
1
2
3
4
5
6
7
8
9
(CIRCLE ONE)
1
2
3
4
5
6
7
8
9
13
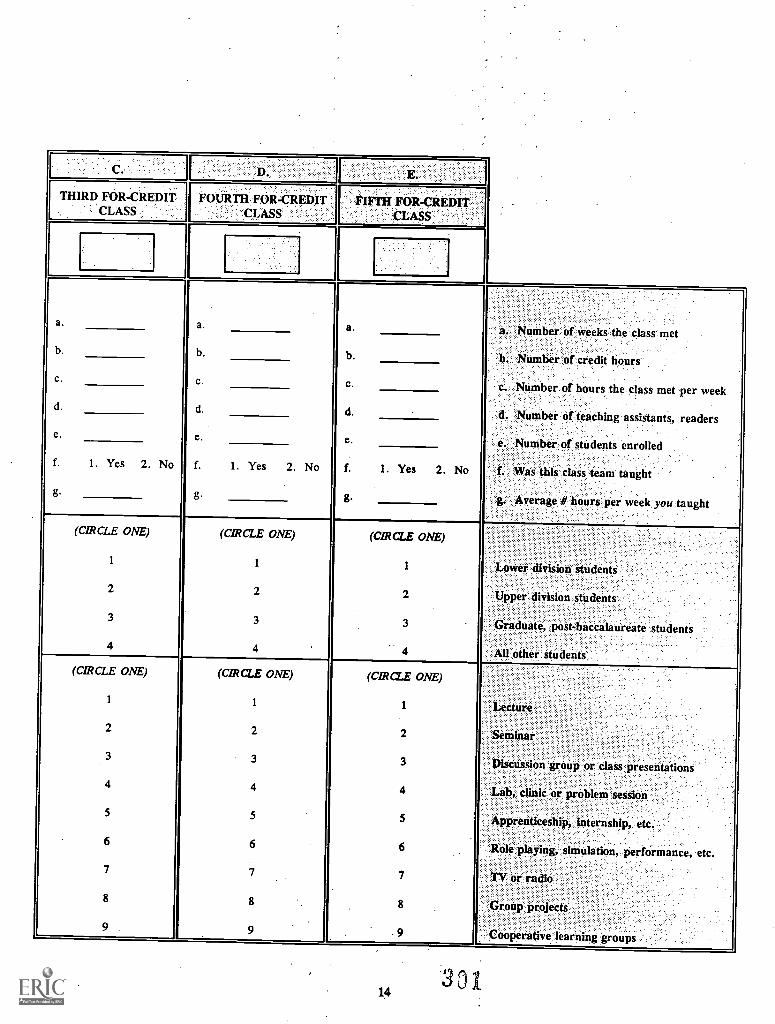
THIRD FOR-CREDITCLASS
FOURTH FOR-CREDITCLASS
a.
b.
c.
d.
e.
f. 1. Yes 2. No
g.
a.
b.
c.
d.
e.
f. 1. Yes 2. No
g.
FIFTH TOR- CREDITCLASS
1. Yes 2. No
a. Number of weeks the class met
b. Number of credit hours
c. Number of hours the class met per week
d. Number of teaching assistants, readers
e Numbr of students enrolled
*as ,this :claSs-team,taught
'Average:ft "Ours:per week you .taught
(CIRCLE ONE)
1
2
3
4
(CIRCLE ONE)
1
2
3
4
(CIRCLE ONE)
1
2
3
Lower division students
Upper division students
Graduate, post-baccalaureate students
All other students(CIRCLE ONE)
1
2
4
5
6
7
8
(CIRCLE ONE)
1
2
3
4
5
8
9
(CIRCLE ONE)
1
2
3
4
5
6
7
8
9
Lecture
Seminar
Discussion.groupor..c/ass::preSentatiOni...
Lab,.:::clinic 'or :problem'seSsiok.
Apprenticeship, internship, etc.
Role playing, simulation, performance, etc.
TV or radio
Group projects
Cooperative:` learning groups
1430
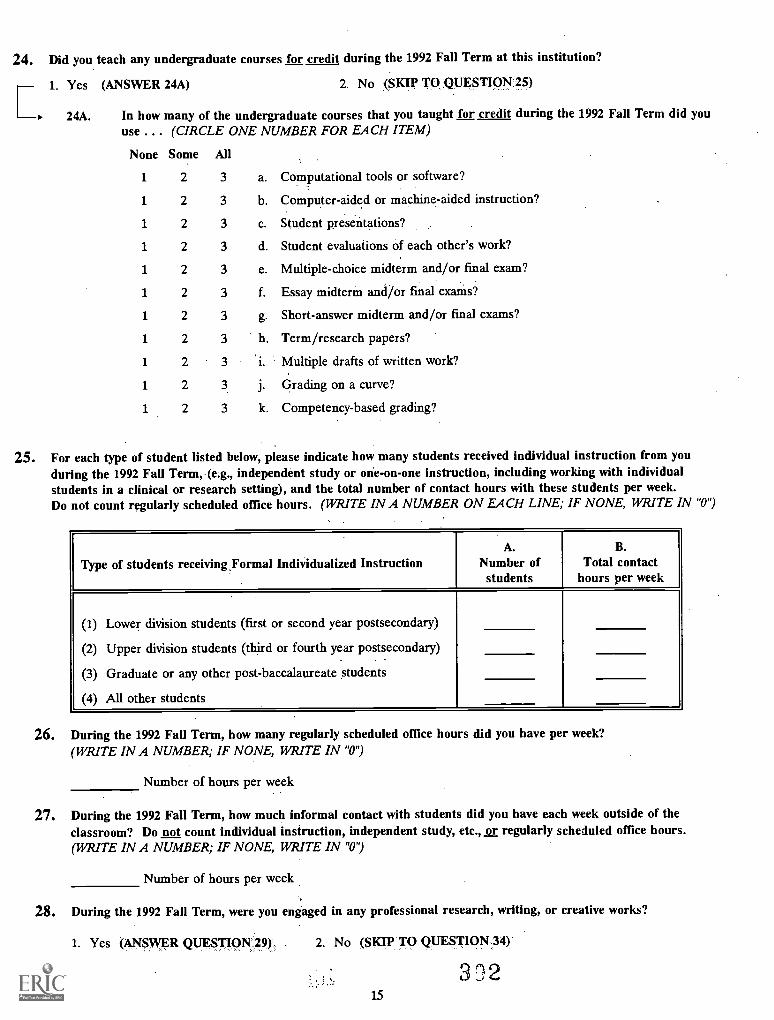
24. Did you teach any undergraduate courses for credit during the 1992 Fall Term at this institution?
C'Yes (ANSWER 24A) 2. No (SKIP TO QUESTION 25)
24A. In how many of the undergraduate courses that you taught for credit during the 1992 Fall Term did youuse ... (CIRCLE ONE NUMBER FOR EACH ITEM)
None Some All
1 2 3 a. Computational tools or software?
1 2 3 b. Computer-aided or machine-aided instruction?
1 2 3 c. Student preseUtations?
1 2 3 d. Student evaluations of each other's work?
1 2 3 e. Multiple-choice midterm and/or final exam?
1 2 3 f. Essay midterm and/or fmal exams?
1 2 3 g. Short-answer midterm and/or final exams?
1 2 3 h. Term/research papers?
1 2 3 i. Multiple drafts of written work?
1 2 3 j. Grading on a curve?
1 2 3 k. Competency-based grading?
25. For each type of student listed below, please indicate how many students received individual instruction from youduring the 1992 Fall Term, (e.g., independent study or one-on-one instruction, including working with individualstudents in a clinical or research setting), and the total number of contact hours with these students per week.Do not count regularly scheduled office hours. (WRITE IN A NUMBER ON EACH LINE; IF NONE, WRITE IN "0")
Type of students receiving, Formal Individualized InstructionA.
Number ofstudents
B.Total contact
hours per week
(1) Lower division students (first or second year postsecondary)
(2) Upper division students (third or fourth year postsecondary)
(3) Graduate or any other post-baccalaureate students
(4) All other students
26. During the 1992 Fall Term, how many regularly scheduled office hours did you have per week?(WRITE IN A NUMBER; IF NONE, WRITE IN "0")
Number of hours per week
27. During the 1992 Fall Term, how much informal contact with students did you have each week outside of theclassroom? Do not count individual instruction, independent study, etc., or regularly scheduled office hours.(WRITE IN A NUMBER; IF NONE, WRITE IN "0")
Number of hours per week
28. During the 1992 Fall Term, were you engaged in any professional research, writing, or creative works?
1. Yes (ANSWER QUESTION 29), - 2. No (SKIP TO QUESTION 34)
32215
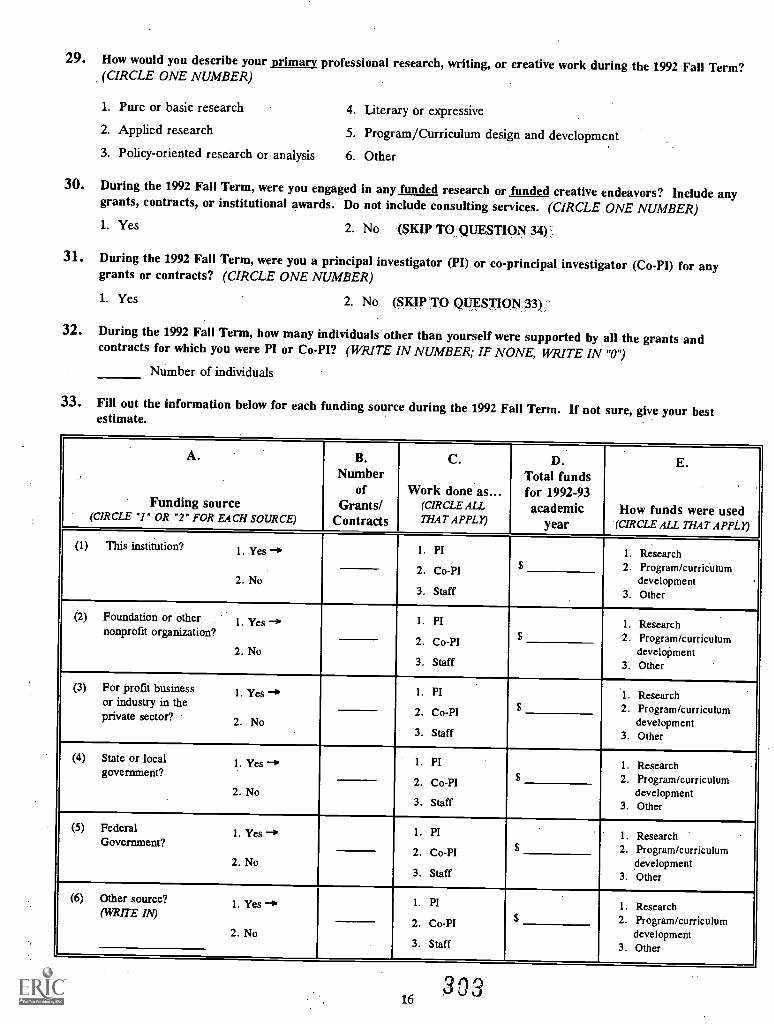
29. How would you describe your primary professional research, writing, or creative work during the 1992 Fall Term?(CIRCLE ONE NUMBER)
1. Pure or basic research
2. Applied research
3. Policy-oriented research or analysis
4. Literary or expressive
5. Program/Curriculum design and development
6. Other
30. During the 1992 Fall Term, were you engaged in any funded research or funded creative endeavors? Include anygrants, contracts, or institutional awards. Do not include consulting services. (CIRCLE ONE NUMBER)1. Yes 2. No (SKIP TO QUESTION 34)
31. During the 1992 Fall Term, were you a principal investigator (PI) or co-principal investigator (Co-PI) for anygrants or contracts? (CIRCLE ONE NUMBER)
1. Yes 2. No (SKIP TO QUESTION 33)
32. During the 1992 Fall Term, how many individuals other than yourself were supported by all the grants andcontracts for which you were PI or Co-PI? (WRITE IN NUMBER; IF NONE, WRITE IN "0")
Number of individuals
33. Fill out the information below for each funding source during the 1992 Fall Term. If not sure, give your bestestimate.
A.
Funding source(CIRCLE "I " OR "2" FOR EACH SOURCE)
B.Number
ofGrants/
Contracts
C.
Work done as...(CIRCLE ALLTHAT APPLY)
D.Total fundsfor 1992-93academic
year
E.
How funds were used(CIRCLE ALL THAT APPLY)
(1) This institution? 1. Yes -> 1. PI 1. Research
2. No2. Co-PI $ 2. Program/curriculum
development3. Staff 3. Other
(2) Foundation or other I. Yes -. 1. PI 1. Researchnonprofit organization?
2. No2. Co -PI $ 2. Program/curriculum
development3. Staff 3. Other
(3) For profit business 1. Yes -> 1. PI 1. Researchor industry in theprivate sector? 2 No
2. Co-PI $ 2. Program/curriculumdevelopment
3. Staff 3. Other
(4) State or local 1. Yes -0 1. PI 1. Researchgovernment?
2. No2. Co-PI $ 2. Program/curriculum
development3. Staff 3. Other
(5) Federal 1. Yes -> 1. PI 1. ResearchGovernment?
2. No2. Co-PI $ 2. Program/curriculum
development3. Staff 3. Other
(6) Other source? 1. Yes -> 1. PI 1. Research(WRITE IN)
2. No2. Co-PI $ 2. Program/curriculum
development3. Staff 3. Other
16303
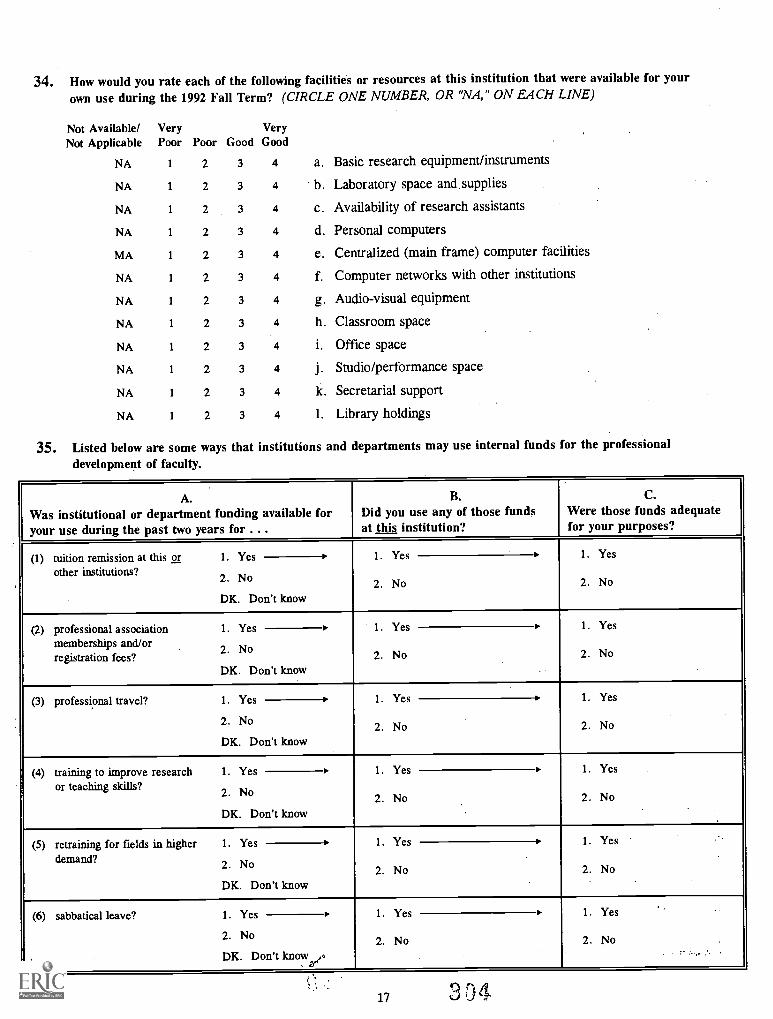
34. How would you rate each of the following facilities or resources at this institution that were available for your
own use during the 1992 Fall Term? (CIRCLE ONE NUMBER, OR "NA," ON EACH LINE)
Not Available/ Very VeryNot Applicable Poor Poor Good Good
NA 1 2 3 4 a. Basic research equipment/instruments
NA 1 2 3 4 b. Laboratory space and supplies
NA 1 2 3 4 c. Availability of research assistants
NA 1 2 3 4 d. Personal computers
MA 1 2 3 4 e. Centralized (main frame) computer facilities
NA 1 2 3 4 f. Computer networks with other institutions
NA 1 2 3 4 g. Audio-visual equipment
NA 1 2 3 4 h. Classroom space
NA 1 2 3 4 i. Office space
NA 1 2 3 4 j. Studio/performance space
NA 1 2 3 4 k. Secretarial support
NA 1 2 3 4 1. Library holdings
35. Listed below are some ways that institutions and departments may use internal funds for the professional
development of faculty.
A.Was institutional or department funding available foryour use during the past two years for ...
B.Did you use any of those fundsat this institution?
C.Were those funds adequatefor your purposes?
(1) tuition remission at this orother institutions?
1.
2.
Yes 1.
2.
Yes
No
1. Yes
2. No
DK. Don't knowNo
(2) professional associationmemberships and/orregistration fees?
1.
2.
1.
2.
Yes
No
1. Yes
2. No
DK. Don't know
Yes
No
(3) professional travel? Yes 1.
2.
Yes 1.
2.
Yes
No
1.
2. No
DK. Don't knowNo
(4) training to improve researchor teaching skills?
1.
2.
Yes 1.
2.
Yes
No
1. Yes
2. No
DK. Don't knowNo
(5) retraining for fields in higherdemand?
1.
2.
Yes 1.
2.
Yes
No
1. Yes
2. No
DK. Don't knowNo
(6) sabbatical leave? 1.
2.
Yes 1.
2.
Yes
No-.... ,
1. Yes
2. No
DK. Don't knowv,No
17 304
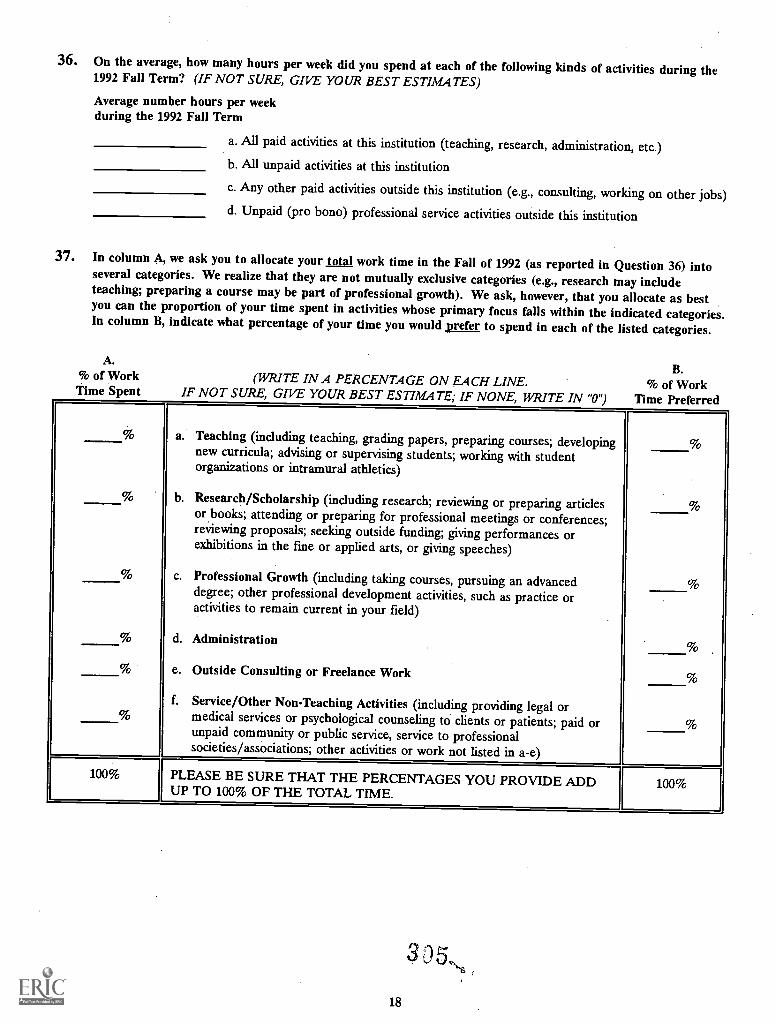
36. On the average, how many hours per week did you spend at each of the following kinds of activities during the1992 Fall Term? (IF NOT SURE, GIVE YOUR BEST ESTIMATES)
Average number hours per weekduring the 1992 Fall Term
a. All paid activities at this institution (teaching, research, administration, etc.)b. All unpaid activities at this institution
c. Any other paid activities outside this institution (e.g., consulting, working on other jobs)d. Unpaid (pro bono) professional service activities outside this institution
37. In column A, we ask you to allocate your total work time in the Fall of 1992 (as reported in Question 36) intoseveral categories. We realize that they are not mutually exclusive categories (e.g., research may includeteaching; preparing a course may be part of professional growth). We ask, however, that you allocate as bestyou can the proportion of your time spent in activities whose primary focus falls within the indicated categories.In column B, indicate what percentage of your time you would prefer to spend in each of the listed categories.
A.% of WorkTime Spent
(WRITE IN A PERCENTAGE ON EACH LINE.IF NOT SURE, GIVE YOUR BEST ESTIMATE; IF NONE, WRITE IN "0")
B.TO of Work
Time Preferred
a. Teaching (including teaching, grading papers, preparing courses; developingnew curricula; advising or supervising students; working with studentorganizations or intramural athletics)
b. Research/Scholarship (including research; reviewing or preparing articlesor books; attending or preparing for professional meetings or conferences;reviewing proposals; seeking outside funding; giving performances orexhibitions in the fine or applied arts, or giving speeches)
%
%%
% c. Professional Growth (including taking courses, pursuing an advanceddegree; other professional development activities, such as practice oractivities to remain current in your field)
%
% d. Administration
% e. Outside Consulting or Freelance Work
f. Service/Other Non-Teaching Activities (including providing legal or
%
% medical services or psychological counseling to clients or patients; paid orunpaid community or public service, service to professionalsocieties/associations; other activities or work not listed in a-e)
%
100% PLEASE BE SURE THAT THE PERCENTAGES YOU PROVIDE ADD 100%UP TO 100% OF THE TOTAL TIME.
18
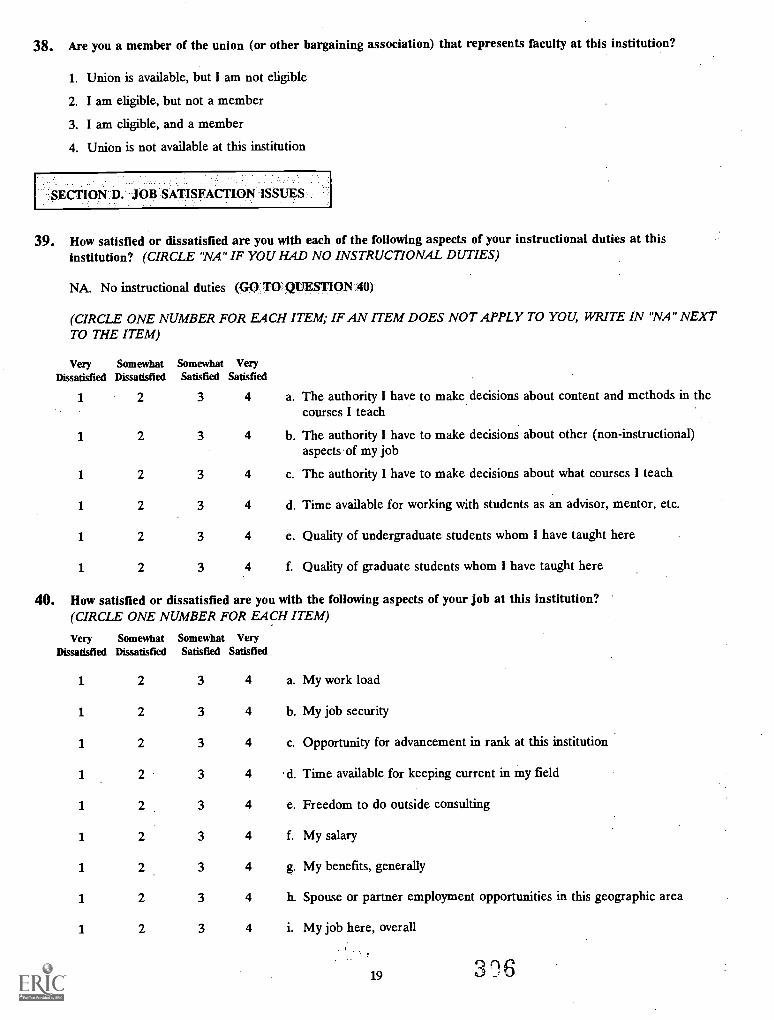
38. Are you a member of the union (or other bargaining association) that represents faculty at this institution?
1. Union is available, but I am not eligible
2. I am eligible, but not a member
3. I am eligible, and a member
4. Union is not available at this institution
SECTION D. JOB SATISFACTION ISSUES
39. How satisfied or dissatisfied are you with each of the following aspects of your instructional duties at thisinstitution? (CIRCLE "NA" IF YOU HAD NO INSTRUCTIONAL DUTIES)
NA. No instructional duties '(GrO.70:1,-2.UESTION:40):
(CIRCLE ONE NUMBER FOR EACH ITEM; IF AN ITEM DOES NOT APPLY TO YOU, WRITE IN "NA" NEXTTO THE ITEM)
Very SomewhatDissatisfied Dissatisfied
Somewhat VerySatisfied Satisfied
1 2 3 4
1 2 3 4
1 2 3 4
1 2 3 4
1 2 3 4
1 2 3 4
a.
b.
c.
d.
e.
The authority I have to makecourses I teach
The authority I have to makeaspects of my job
The authority I have to make
decisions about content and methods in the
decisions about other (non-instructional)
decisions about what courses I teach
Time available for working with students as an advisor, mentor, etc.
Quality of undergraduate students whom I have taught here
f. Quality of graduate students whom I have taught here
40. How satisfied or dissatisfied are you with the following aspects of your job at this institution?(CIRCLE ONE NUMBER FOR EACH ITEM)
Very SomewhatDissatisfied Dissatisfied
Somewhat VerySatisfied Satisfied
1 2 3 4
1 2 3 4
1 2 3 4
1 2 3 4
1 2 3 4
1 2 3 4
1 2 3 4
1 2 3 4
1 2 3 4
a. My work load
b. My job security
c. Opportunity for advancement in rank at this institution
d. Time available for keeping current in my field
e. Freedom to do outside consulting
f. My salary
g. My benefits, generally
h. Spouse or partner employment opportunities in this geographic area
i. My job here, overall
19 306
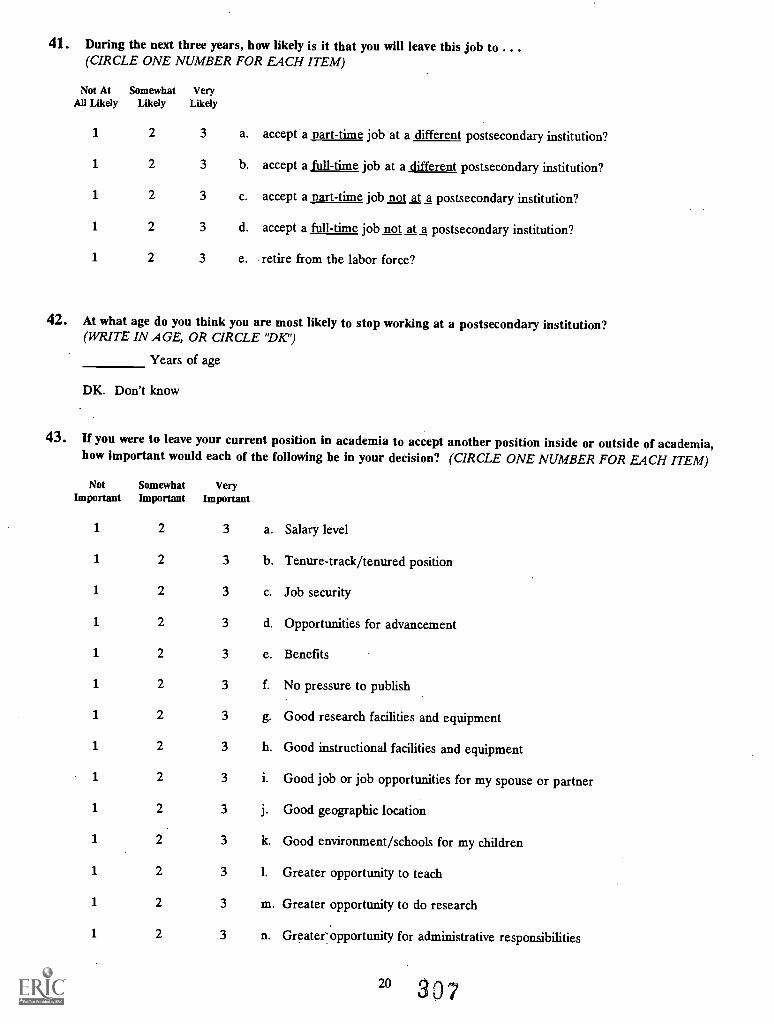
41. During the next three years, how likely is it that you will leave this job to . . .(CIRCLE ONE NUMBER FOR EACH ITEM)
Not AtAll Likely
SomewhatLikely
VeryLikely
1 2 3 a.
1 2 3 b.
1 2 3 c.
1 2 3 d.
1 2 3 e.
accept apart -time job at a different postsecondary institution?
accept a full-time job at a different postsecondary institution?
accept a part-time job not at a postsecondary institution?
accept a full-time job not at a postsecondary institution?
retire from the labor force?
42. At what age do you think you are most likely to stop working at a postsecondary institution?(WRITE IN AGE, OR CIRCLE 'DK")
Years of age
DK. Don't know
43. If you were to leave your current position in academia to accept another position inside or outside of academia,how important would each of the following be in your decision? (CIRCLE ONE NUMBER FOR EACH ITEM)
NotImportant
SomewhatImportant
VeryImportant
1 2 3 a. Salary level
1 2 3 b. Tenure-track/tenured position
1 2 3 c. Job security
1 2 3 d. Opportunities for advancement
1 2 3 e. Benefits
1 2 3 f. No pressure to publish
1 2 3 g. Good research facilities and equipment
1 2 3 h. Good instructional facilities and equipment
1 2 3 i. Good job or job opportunities for my spouse or partner
1 2 3 j. Good geographic location
1 2 3 k. Good environment/schools for my children
1 2 3 1. Greater opportunity to teach
1 2 3 m. Greater opportunity to do research
1 2 3 n. Greater-opportunity for administrative responsibilities
20 80 7
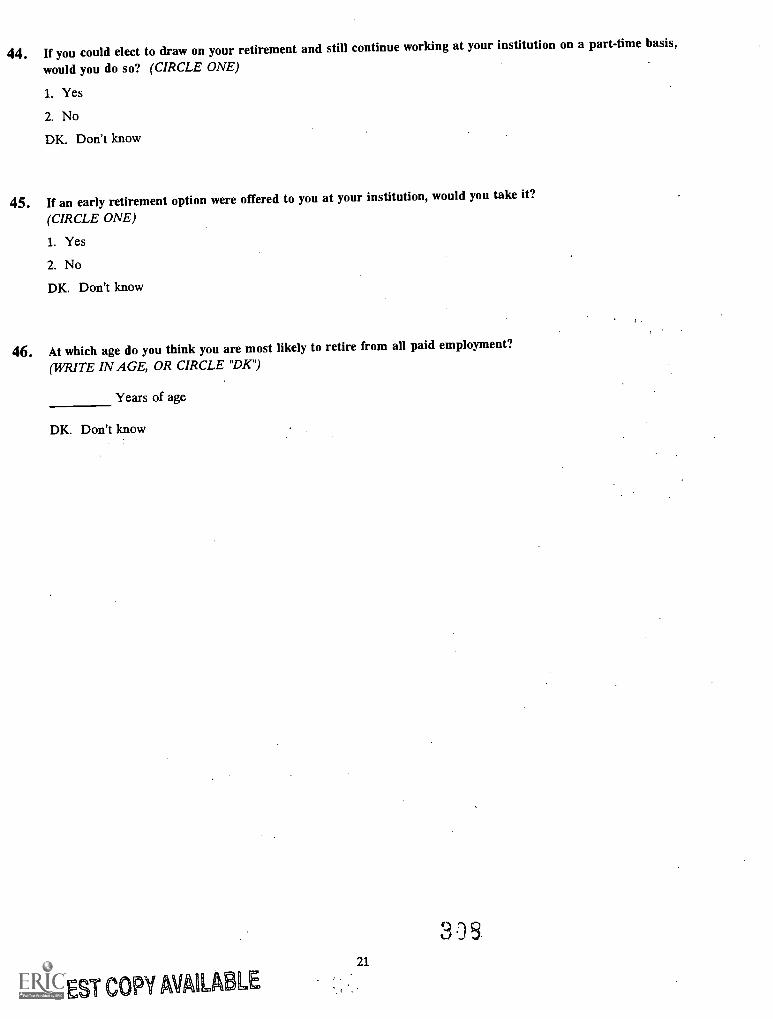
44. If you could elect to draw on your retirement and still continue working at your institution on a part-time basis,
would you do so? (CIRCLE ONE)
1. Yes
2. No
DK. Don't know
45. If an early retirement option were offered to you at your institution, would you take it?
(CIRCLE ONE)
1. Yes
2. No
DK. Don't know
46. At which age do you think you are mostlikely to retire from all paid employment?(WRITE IN AGE, OR CIRCLE "DK ")
Years of age
DK. Don't know
21
BEST COPY AVA1LA LE
3 S
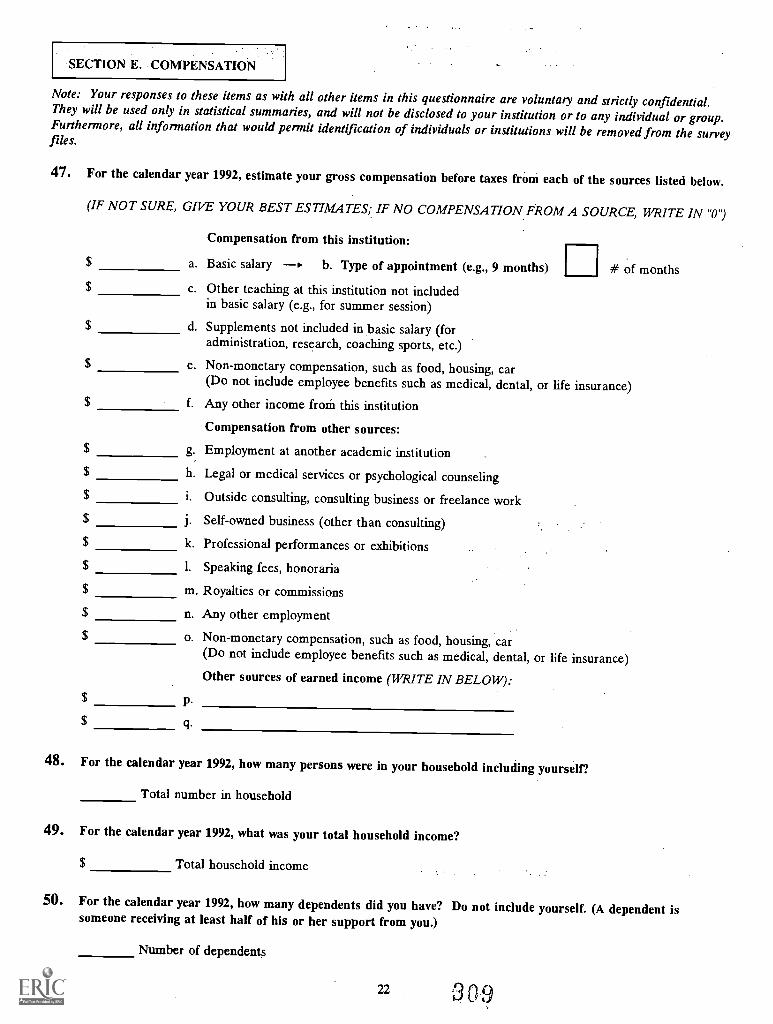
SECTION E. COMPENSATION
Note: Your responses to these items as with all other items in this questionnaire are voluntary and strictly confidential.They will be used only in statistical summaries, and will not be disclosed to your institution or to any individual or group.Furthermore, all information that would permit identification of individuals or institutions will be removed from the surveyfiles.
47. For the calendar year 1992, estimate your gross compensation before taxes from each of the sources listed below.
(IF NOT SURE, GIVE YOUR BEST ESTIMATES,. IFNO COMPENSATION FROM A SOURCE, WRITE IN "0')
Compensation from this institution:
a. Basic salary b. Type of appointment (e.g., 9 months) n # of monthsc. Other teaching at this institution not included
in basic salary (e.g., for summer session)
d. Supplements not included in basic salary (foradministration, research, coaching sports, etc.)
e. Non-monetary compensation, such as food, housing, car(Do not include employee benefits such as medical, dental, or life insurance)
f. Any other income froth this institution
Compensation from other sources:
g. Employment at another academic institution
h. Legal or medical services or psychological counseling
i. Outside consulting, consulting business or freelance workj. Self-owned business (other than consulting)
k. Professional performances or exhibitions
1. Speaking fees, honoraria
m. Royalties or commissions
n. Any other employment
o. Non-monetary compensation, such as food, housing, car(Do not include employee benefits such as medical, dental, or life insurance)
Other sources of earned income (WRITE IN BELOW):
48. For the calendar year 1992, how many persons were in your household including yourself?
Total number in household
49. For the calendar year 1992, what was your total household income?
Total household income
50. For the calendar year 1992, how many dependents did you have? Do not include yourself. (A dependent issomeone receiving at least half of his or her support from you.)
Number of dependents
22 309
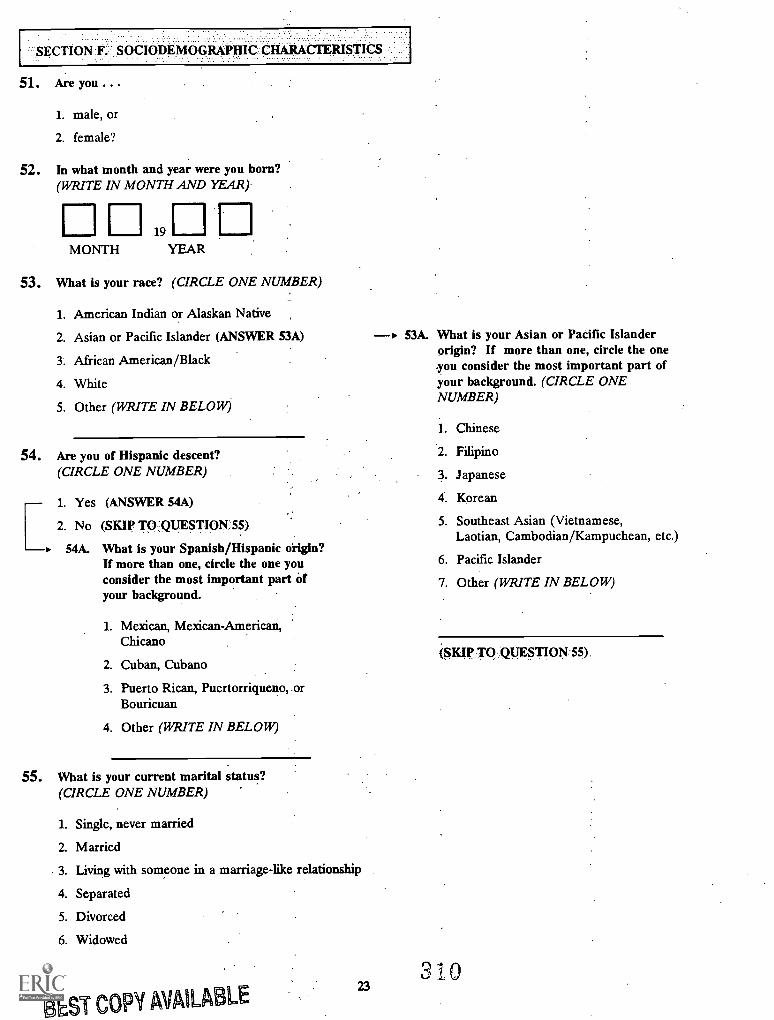
SECTION F. SOCIODEMOGRAPHIC.CHARACTERISTICS
51. Are you ...
1. male, or
2. female?
52. In what month and year were you born?(WRITE IN MONTH AND YEAR)
MONTH19
YEAR
53. What is your race? (CIRCLE ONE NUMBER)
1. American Indian or Alaskan Native
2. Asian or Pacific Islander (ANSWER 53A)
3. African American/Black
4. White
5. Other (WRITE IN BELOW)
54. Are you of Hispanic descent?(CIRCLE ONE NUMBER)
1. Yes (ANSWER 54A)
2. No (SKIP TO QUESTION 55)
54A. What is your Spanish/Hispanic origin?If more than one, circle the one youconsider the most important part ofyour background.
1. Mexican, Mexican-American,Chicano
2. Cuban, Cubano
3. Puerto Rican, Puertorriqueno,.orBouricuan
4. Other (WRITE IN BELOW)
55. What is your current marital status?(CIRCLE ONE NUMBER)
1. Single, never married
2. Married
3. Living with someone in a marriage-like relationship
4. Separated
5. Divorced
6. Widowed
BEST COPY AVAILABLE23
53A. What is your Asian or Pacific Islanderorigin? If more than one, circle the oneyou consider the most important part ofyour background. (CIRCLE ONENUMBER)
1. Chinese
'2. Filipino
3. Japanese
4. Korean
5. Southeast Asian (Vietnamese,Laotian, Cambodian/Kampuchean, etc.)
6. Pacific Islander
7. Other (WRITE IN BELOW)
310
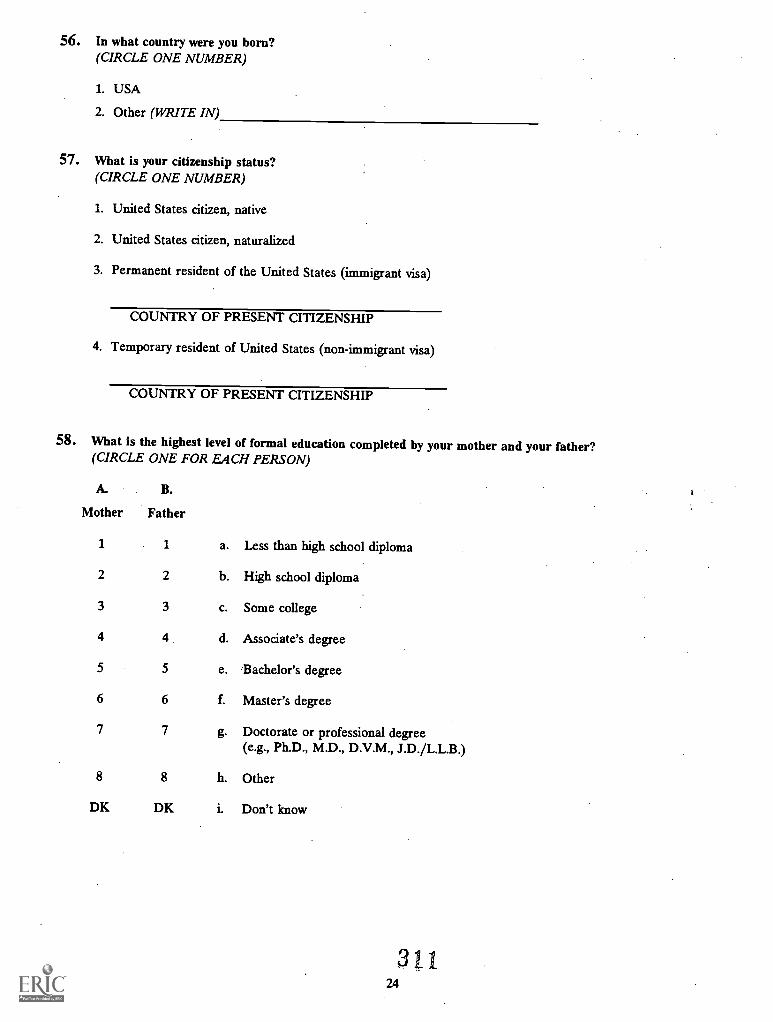
56. In what country were you born?(CIRCLE ONE NUMBER)
1. USA
2. Other (WRITE IN)
57. What is your citizenship status?(CIRCLE ONE NUMBER)
1. United States citizen, native
2. United States citizen, naturalized
3. Permanent resident of the United States (immigrant visa)
COUNTRY OF PRESENT CITIZENSHIP
4. Temporary resident of United States (non-immigrant visa)
COUNTRY OF PRESENT CITIZENSHIP
58. What is the highest level of formal education completed byyour mother and your father?(CIRCLE ONE FOR EACH PERSON)
A. B.
Mother Father
I 1 a. Less than high school diploma
2 2 b. High school diploma
3 3 c. Some college
4 4 d. Associate's degree
5 5 e. Bachelor's degree
6 6 f. Master's degree
7 7 g. Doctorate or professional degree(e.g., Ph.D., M.D., D.V.M., J.D./L.L.B.)
8 8 h. Other
DK DK i. Don't know
1 1.24
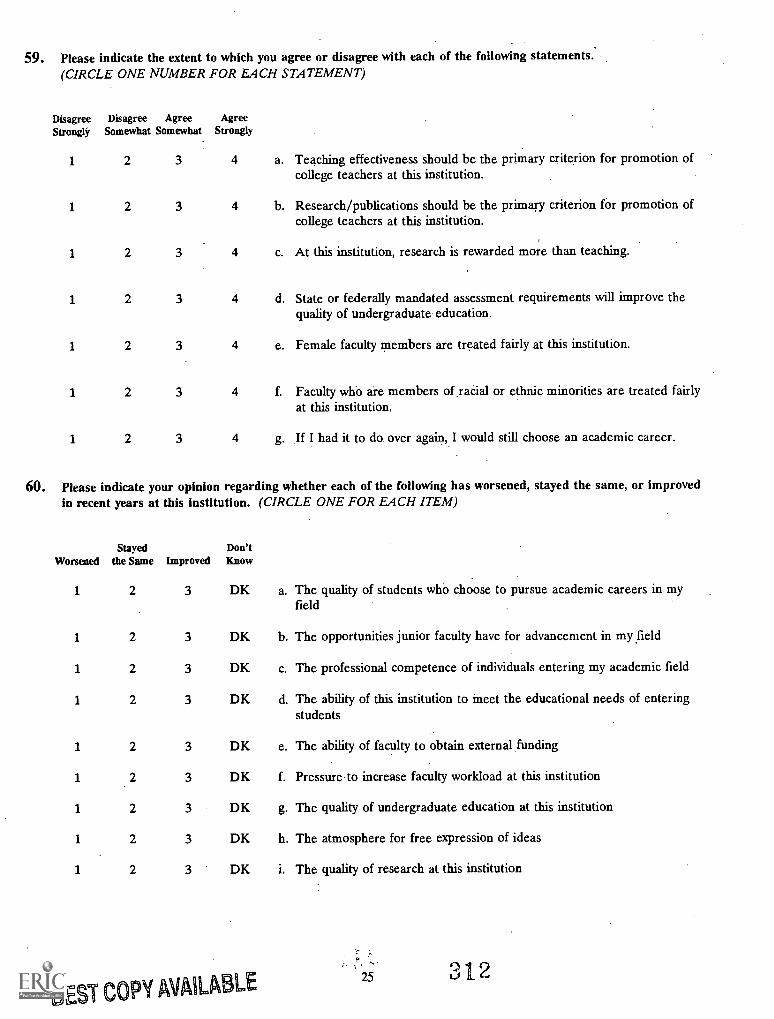
59. Please indicate the extent to which you agree or disagree with each of the following statements.(CIRCLE ONE NUMBER FOR EACH STATEMENT)
DisagreeStronglS,
Disagree AgreeSomewhat Somewhat
AgreeStrongly
1 2 3 4 a. Teaching effectiveness should be the primary criterion for promotion ofcollege teachers at this institution.
2 3 4 b. Research/publications should be the primary criterion for promotion ofcollege teachers at this institution.
1 2 3 4 c. At this institution, research is rewarded more than teaching.
1 2 3 4 d. State or federally mandated assessment requirements will improve thequality of undergraduate education.
1 2 3 4 e. Female faculty members are treated fairly at this institution.
1 2 3 4 f. Faculty who are members of racial or ethnic minorities are treated fairlyat this institution.
1 2 3 4 g. If I had it to do over again, I would still choose an academic career.
60. Please indicate your opinion regarding whether each of the following has worsened, stayed the same, or improvedin recent years at this institution. (CIRCLE ONE FOR EACH ITEM)
WorsenedStayed
the Same ImprovedDon'tKnow
1 2 3 DK
1 2 3 DK
1 2 3 DK
1 2 3 DK
1 2 3 DK
1 2 3 DK
1 2 3 DK
1 2 3 DK
1 2 3 DK
BEST COPY AVAILABLE
a. The quality of students who choose to pursue academic careers in myfield
b. The opportunities junior faculty have for advancement in my field
c. The professional competence of individuals entering my academic field
d. The ability of this institution to meet the educational needs of enteringstudents
e. The ability of faculty to obtain external funding
f. Pressure to increase faculty workload at this institution
g. The quality of undergraduate education at this institution
h. The atmosphere for free expression of ideas
i. The quality of research at this institution
25 0 1 2
THANK YOU VERY MUCH FOR YOUR PARTICIPATION
Return this completed questionnaire in the enclosed prepaid envelope to:
National Opinion Research Center (NORC)University of Chicago1525 East 55th Street
Chicago, Illinois 60615
3 326
EST COO314
Appendix G
1993 National Study of Postsecondary FacultyMethodology Report
1993 NSOPF Institution Questionnaire
31
U.S. Department of EducationOffice of Educational Research and Improvement
National Center for Education Statistics
1993 NATIONAL STUDY OF POSTSECONDARY FACULTY
INSTITUTIONQUESTIONNAIRE
Co-sponsored by:
Contractor:
All Information on this form will be kept confidential and will be usedonly in statistical summaries. All information that would permitIdentification of individuals will be removed from survey ales.
National Science FoundationNational Endowment for the Humanities
National Opinion Research Center (NORC)University of ChicagoMailing Address:1525 East 55th StreetChicago, Illinois 60615Toll-Free Number: 1-800-733-NORC 3 16
01133: No. 1850-0665Expiration Date: 3/94
BEST COPY MIA LE
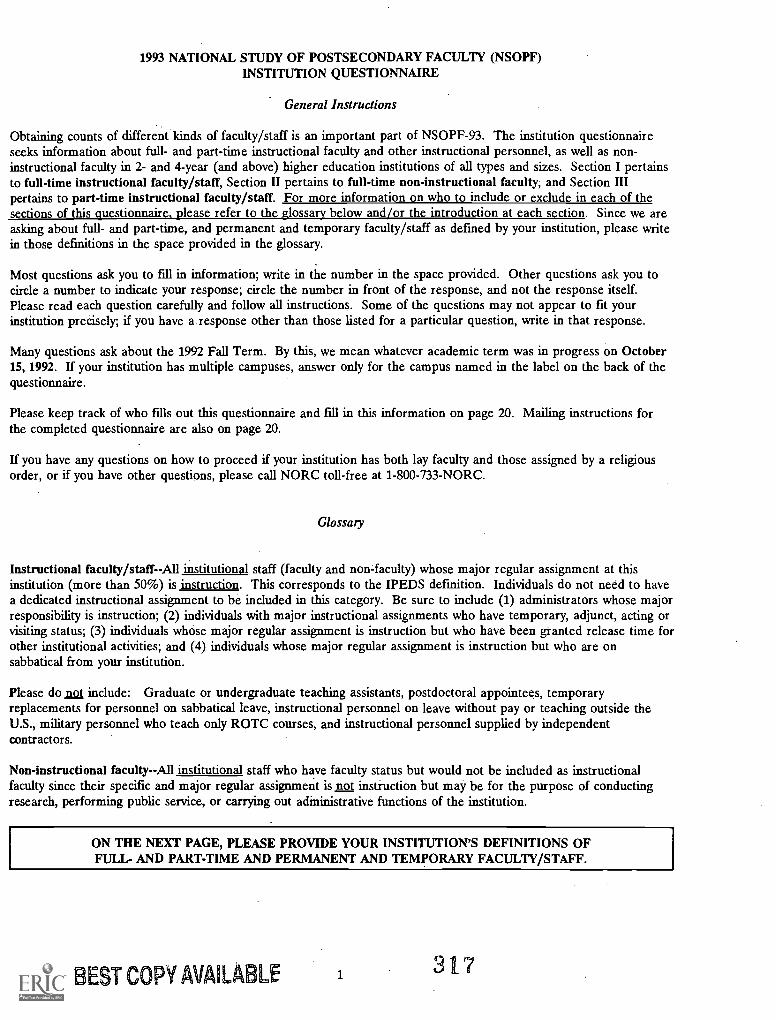
1993 NATIONAL STUDY OF POSTSECONDARY FACULTY (NSOPF)INSTITUTION QUESTIONNAIRE
General Instructions
Obtaining counts of different kinds of faculty/staff is an important part of NSOPF-93. The institution questionnaireseeks information about full- and part-time instructional faculty and other instructional personnel, as well as non-instructional faculty in 2- and 4-year (and above) higher education institutions of all types and sizes. Section I pertainsto full-time instructional faculty/staff, Section II pertains to full-time non-instructional faculty; and Section IIIpertains to part-time instructional faculty/staff. For more information on who to include or exclude in each of thesections of this questionnaire, please refer to the glossary below and/or the introduction at each section. Since we areasking about full- and part-time, and permanent and temporary faculty/staff as defined by your institution, please writein those definitions in the space provided in the glossary.
Most questions ask you to fill in information; write in the number in the space provided. Other questions ask you tocircle a number to indicate your response; circle the number in front of the response, and not the response itself.Please read each question carefully and follow all instructions. Some of the questions may not appear to fit yourinstitution precisely; if you have a response other than those listed for a particular question, write in that response.
Many questions ask about the 1992 Fall Term. By this, we mean whatever academic term was in progress on October15, 1992. If your institution has multiple campuses, answer only for the campus named in the label on the back of thequestionnaire.
Please keep track of who fills out this questionnaire and fill in this information on page 20. Mailing instructions forthe completed questionnaire are also on page 20.
If you have any questions on how to proceed if your institution has both lay faculty and those assigned by a religiousorder, or if you have other questions, please call NORC toll-free at 1-800-733-NORC.
Glossary
Instructional faculty/staff--All institutional staff (faculty and non-faculty) whose major regular assignment at thisinstitution (more than 50%) is instruction. This corresponds to the IPEDS definition. Individuals do not need to havea dedicated instructional assignment to be included in this category. Be sure to include (1) administrators whose majorresponsibility is instruction; (2) individuals with major instructional assignments who have temporary, adjunct, acting orvisiting status; (3) individuals whose major regular assignment is instruction but who have been granted release time forother institutional activities; and (4) individuals whose major regular assignment is instruction but who are onsabbatical from your institution.
Please do not include: Graduate or undergraduate teaching assistants, postdoctoral appointees, temporaryreplacements for personnel on sabbatical leave, instructional personnel on leave without pay or teaching outside theU.S., military personnel who teach only ROTC courses, and instructional personnel supplied by independentcontractors.
Non-instructional faculty--All institutional staff who have faculty status but would not be included as instructionalfaculty since their specific and major regular assignment is not instruction but may be for the purpose of conductingresearch, performing public service, or carrying out administrative functions of the institution.
ON THE NEXT PAGE, PLEASE PROVIDE YOUR INSTITUTION'S DEFINITIONS OFFULL- AND PART-TIME AND PERMANENT AND TEMPORARY FACULTY/STAFF.
EST COPY AVAILABLE 1 317
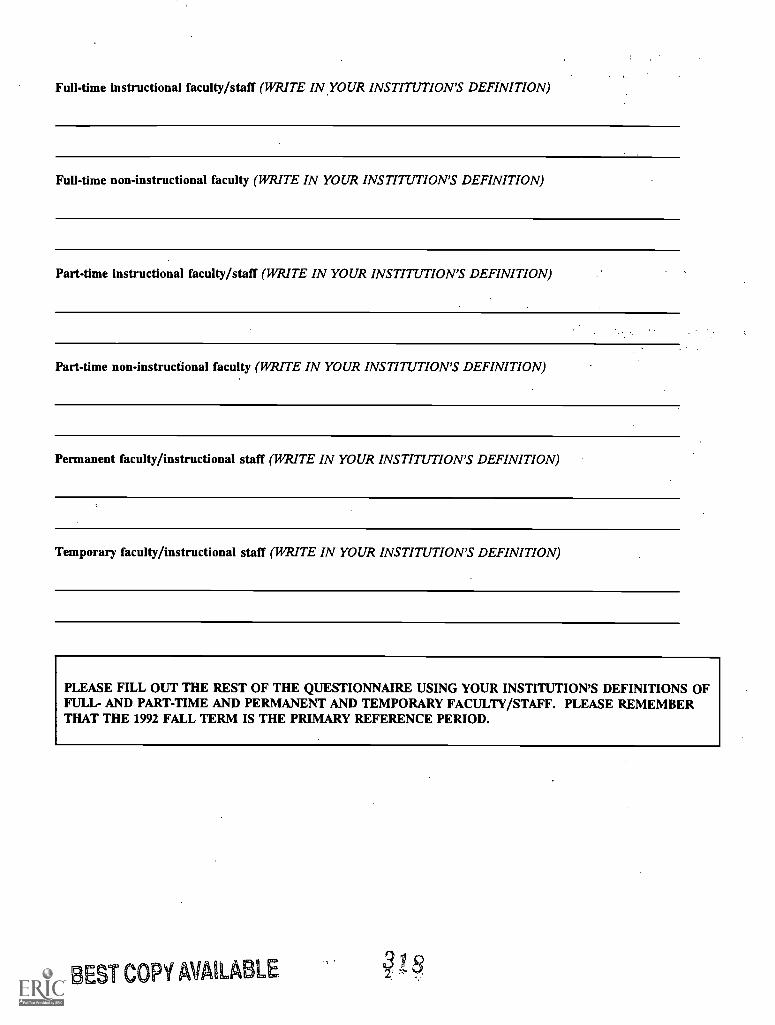
Full-time instructional faculty/staff (WRITE IN YOUR INSTITUTION'S DEFINITION)
Full-time non-instructional faculty (WRITE IN YOUR INSTITUTION'S DEFINITION)
Part-time instructional faculty/staff (WRITE IN YOUR INSTITUTION'S DEFINITION)
Part-time non-instructional faculty (WRITE IN YOUR INSTITUTION'S DEFINITION)
Permanent faculty/instructional staff (WRITE IN YOUR INSTITUTION'S DEFINITION)
Temporary faculty/instructional staff (WRITE IN YOUR INSTITUTION'S DEFINITION)
PLEASE FILL OUT THE REST OF THE QUESTIONNAIRE USING YOUR INSTITUTION'S DEFINITIONS OFFULL- AND PART-TIME AND PERMANENT AND TEMPORARY FACULTY/STAFF. PLEASE REMEMBERTHAT THE 1992 FALL TERM IS THE PRIMARY REFERENCE PERIOD.
BEST COPY AVAILABLE
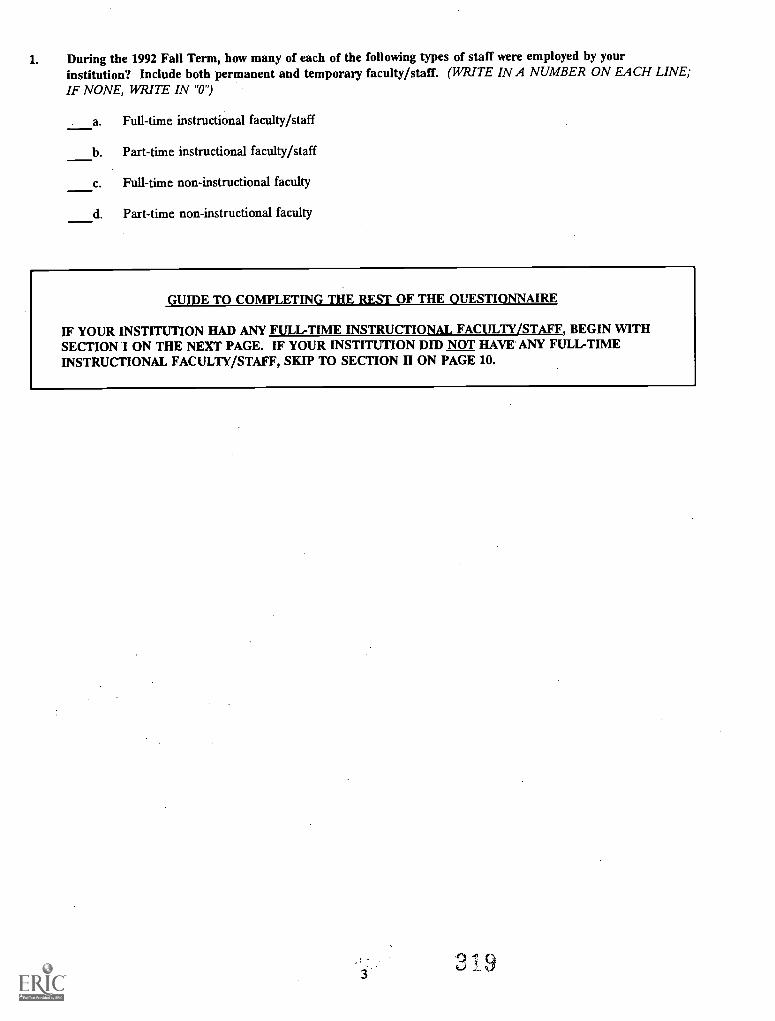
1. During the 1992 Fall Term, how many of each of the following types of staff were employed by yourinstitution? Include both permanent and temporary faculty/staff. (WRITE IN A NUMBER ON EACH LINE;IF NONE, WRITE IN "0")
a. Full-time instructional faculty/staff
b. Part-time instructional faculty/staff
c. Full-time non-instructional faculty
d. Part-time non-instructional faculty
GUIDE TO COMPLETING THE REST OF THE QUESTIONNAIRE
IF YOUR INSTITUTION HAD ANY FULL-TIME INSTRUCTIONAL FACULTY/STAFF, BEGIN WITHSECTION 'I ON THE NEXT PAGE. IF YOUR INSTITUTION DID NOT HAVE ANY FULL-TIMEINSTRUCTIONAL FACULTY/STAFF, SKIP TO SECTION H ON PAGE 10.
3
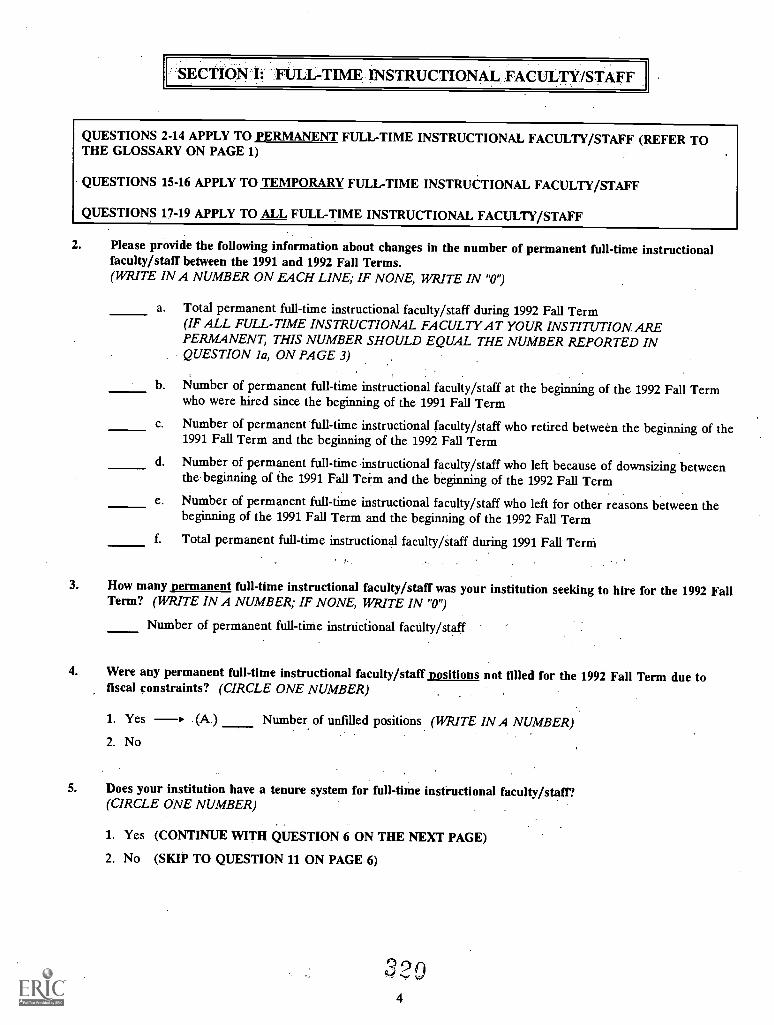
SECTION I : FLAX-TIME INSTRUCTIONAL FACULTY/STAFF
QUESTIONS 2-14 APPLY TO PERMANENT FULL-TIME INSTRUCTIONAL FACULTY/STAFF (REFER TOTHE GLOSSARY ON PAGE 1)
QUESTIONS 15-16 APPLY TO TEMPORARY FULL-TIME INSTRUCTIONAL FACULTY/STAFF
QUESTIONS 17-19 APPLY TO ALL FULL-TIME INSTRUCTIONAL FACULTY/STAFF
2. Please provide the following information about changes in the number of permanent full-time instructionalfaculty/staff between the 1991 and 1992 Fall Terms.(WRITE IN A NUMBER ON EACH LINE; IF NONE, WRITE IN "0")
a. Total permanent full-time instructional faculty/staff during 1992 Fall Term(IF ALL FULL-TIME INSTRUCTIONAL FACULTY AT YOUR INSTITUTION AREPERMANENT, THIS NUMBER SHOULD EQUAL THE NUMBER REPORTED INQUESTION la, ON PAGE 3)
b. Number of permanent full-time instructional faculty/staff at the beginning of the 1992 Fall Termwho were hired since the beginning of the 1991 Fall Term
c. Number of permanent full-time instructional faculty/staff who retired between the beginning of the1991 Fall Term and the beginning of the 1992 Fall Term
d. Number of permanent full-time instructional faculty/staff who left because of downsizing betweenthe beginning of the 1991 Fall Tei-m and the beginning of the 1992 Fall Term
e. Number of permanent full-time instructional faculty/staff who left for other reasons between thebeginning of the 1991 Fall Term and the beginning of the 1992 Fall Term
f. Total permanent full-time instructional faculty/staff during 1991 Fall Term
3. How many permanent full-time instructional faculty/staff was your institution seeking to hire for the 1992 FallTerm? (WRITE IN A NUMBER; IF NONE, WRITE IN "0")
Number of permanent full-time instructional faculty/staff
4. Were any permanent full-time instructional faculty/staff positions not filled for the 1992 Fall Term due tofiscal constraints? (CIRCLE ONE NUMBER)
1. Yes -- (A.)2. No
Number of unfilled positions (WRITE IN A NUMBER)
5. Does your institution have a tenure system for full-time instructional faculty/staff?(CIRCLE ONE NUMBER)
1. Yes (CONTINUE WITH QUESTION 6 ON THE NEXT PAGE)
2. No (SKIP TO QUESTION 11 ON PAGE 6)
4
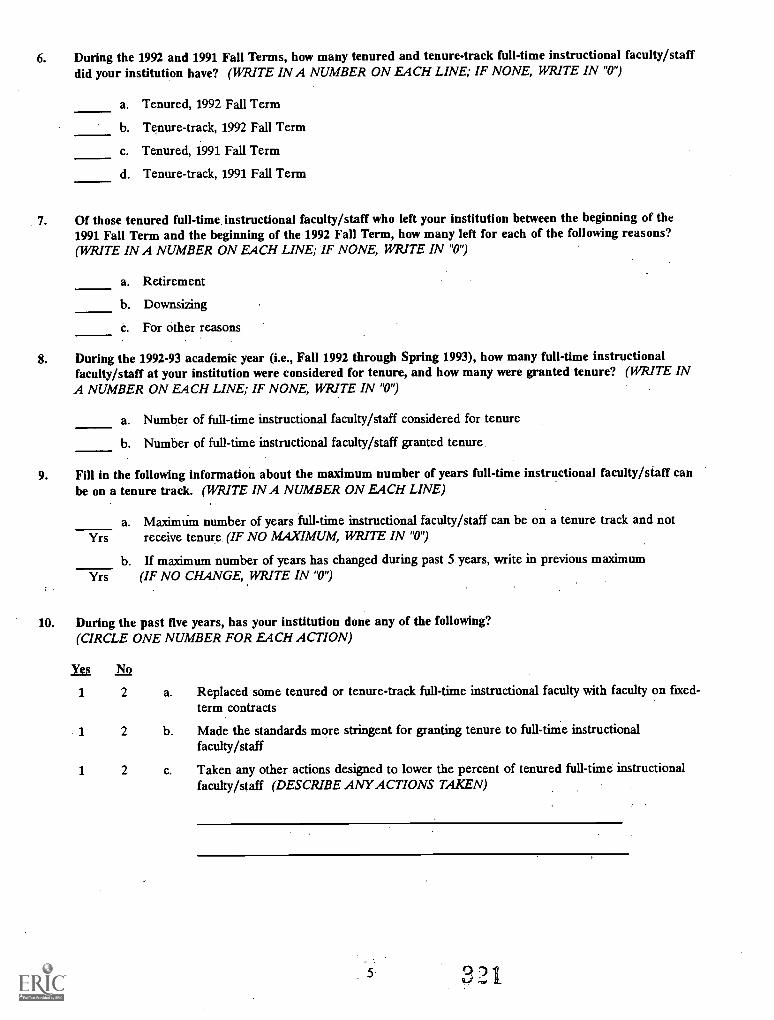
6. During the 1992 and 1991 Fall Terms, how many tenured and tenure-track full-time instructional faculty/staffdid your institution have? (WRITE INA NUMBER ON EACH LINE; IF NONE, WRITE IN "0")
a. Tenured, 1992 Fall Term
b. Tenure-track, 1992 Fall Term
c. Tenured, 1991 Fall Term
d. Tenure-track, 1991 Fall Term
7. Of those tenured full -time, instructional faculty/staff who left your institution between the beginning of the1991 Fall Term and the beginning of the 1992 Fall Term, how many left for each of the following reasons?(WRITE INA NUMBER ON EACH LINE; IF NONE, WRITE IN "0")
a. Retirement
b. Downsizing
c. For other reasons
8. During the 1992-93 academic year (i.e., Fall 1992 through Spring 1993), how many full-time instructionalfaculty/staff at your institution were considered for tenure, and how many were granted tenure? (WRITE IN
A NUMBER ON EACH LINE; IF NONE, WRITE IN "0")
a. Number of full-time instructional faculty/staff considered for tenure
b. Number of full-time instructional faculty/staff granted tenure.
9. Fill in the following information about the maximum number of years full-time instructional faculty/staff canbe on a tenure track. (WRITE INA NUMBER ON EACH LINE)
a. MaximUm number of years full-time instructional faculty/staff can be on a tenure track and notYrs receive tenure (IF NO MAXIMUM, WRITE IN "0")
b. If maximum number of years has changed during past 5 years, write in previous maximumYrs (IF NO CHANGE, WRITE IN "0')
10. During the past five years, has your institution done any of the following?(CIRCLE ONE NUMBER FOR EACH ACTION)
Yes No
1 2 a. Replaced some tenured or tenure-track full-time instructional faculty with faculty on fixed-term contracts
1 2 b. Made the standards more stringent for granting tenure to full-time instructionalfaculty/staff
1 2 c. Taken any other actions designed to lower the percent of tenured full-time instructionalfaculty/staff (DESCRIBE ANY ACTIONS TAKEN)
321
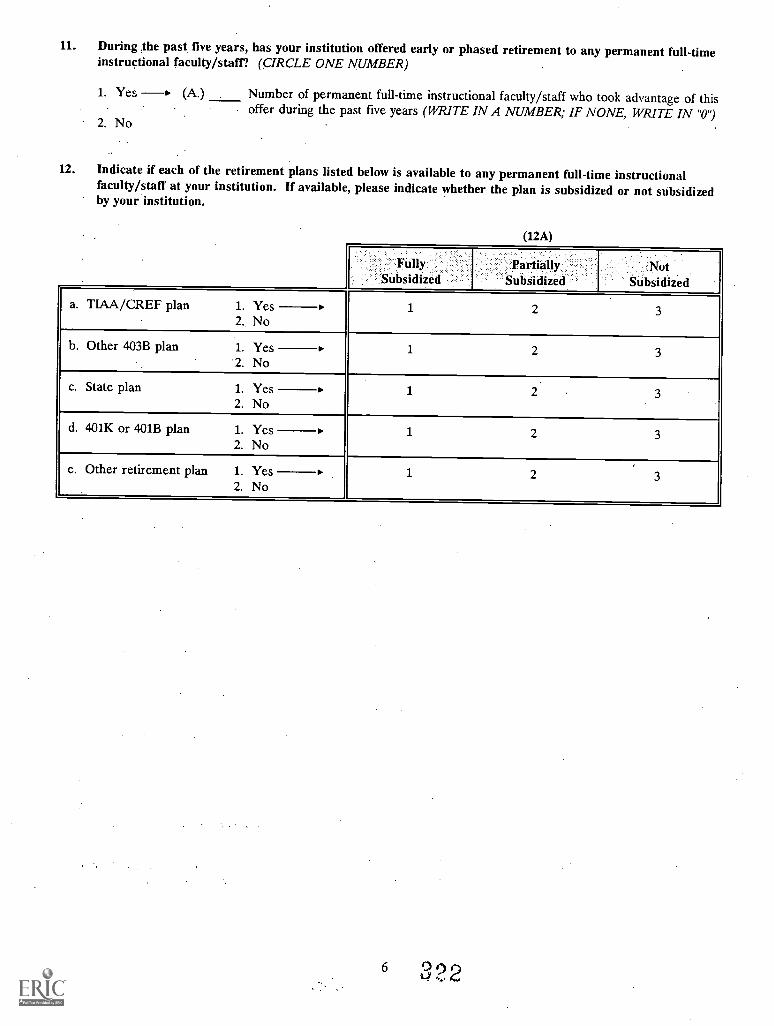
11. During the past five years, has your institution offered early or phased retirement to any permanent full-timeinstructional faculty/staff? (CIRCLE ONE NUMBER)
1. Yes (A.)
2. No
Number of permanent full-time instructional faculty/staff who took advantage of thisoffer during the past five years (WRITE IN A NUMBER; IF NONE, WRITE IN "0")
12. Indicate if each of the retirement plans listed below is available to any permanent full-time instructionalfaculty/staff at your institution. If available, please indicate whether the plan is subsidized or not subsidizedby your institution.
(12A)
FullySubsidized
PartiallySubsidized
NotSubsidized
TIAA/CREF 1. Yes 1 2 3a. plan
2. No
b. Other 403B 1. Yes 1 2 3plan2. No
State 1. Yes 1 2 3c. plan
2. No
d. 401K 401B 1. Yes 1 2 3or plan
2. No
Other 1. Yes 1 2 3e. retirement plan
2. No
6 322
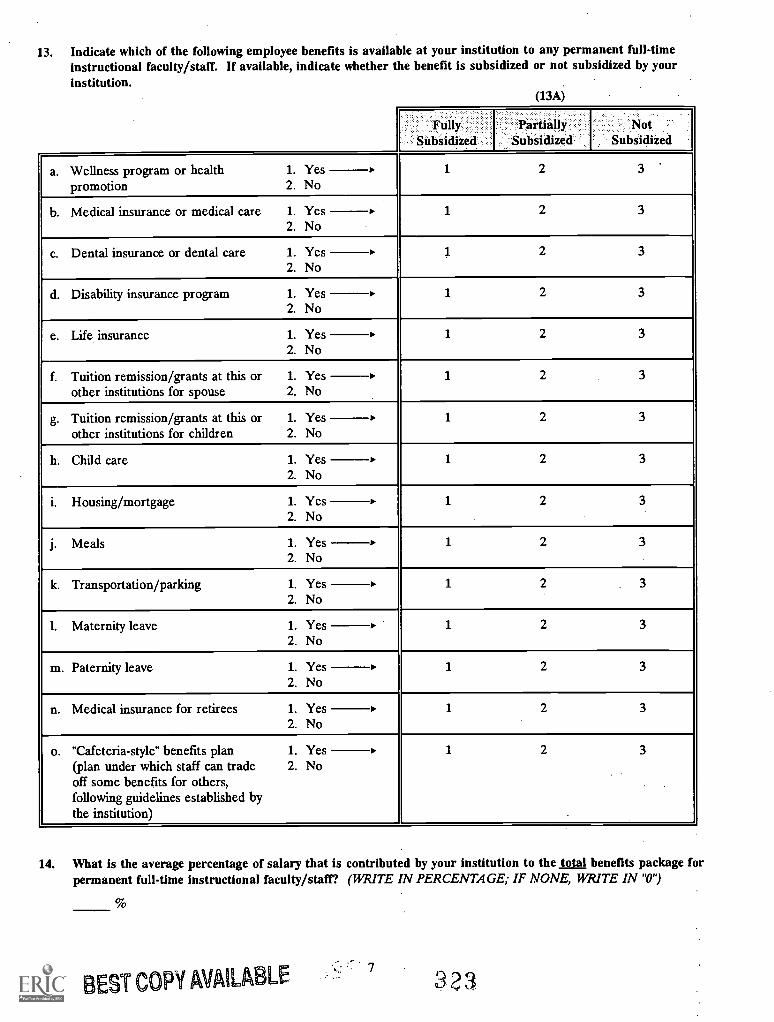
13. Indicate which of the following employee benefits is available at your institution to any permanent full-timeinstructional faculty/staff. If available, indicate whether the benefit is subsidized or not subsidized by yourinstitution.
(13A)
FullySubsidized
PartiallySubsidized
NotSubsidized
a. Wellness program or healthpromotion
1. Yes 1 2 3
2. No
b. Medical insurance or medical care 1. Yes 1 2 3
2. No.
c. Dental insurance or dental care 1. Yes 1 2 32. No
d. Disability insurance program 1. Yes 1 2 32. No
e. Life insurance 1. Yes 1 2 32. No
f. Tuition remission/grants at this orother institutions for spouse
1. Yes 1 2 32. No
g. Tuition remission/grants at this orother institutions for children
1. Yes 1 2 32. No
h. Child care 1. Yes 1 2 32. No
i. Housing/mortgage 1. Yes 1 2 32. No
j. Meals 1. Yes 1 22. No
k. Transportation /parking 1. Yes 1 2 3
2. No
1. Maternity leave 1. Yes 1 2 32. No
m. Paternity leave 1. Yes 1 2 32. No
n. Medical insurance for retirees 1. Yes 1 2 32. No
o. "Cafeteria-style" benefits plan(plan under which staff can tradeoff some benefits for others,following guidelines established bythe institution)
1. Yes 1 2 3
2. No
14. What is the average percentage of salary that is contributed by your institution to the total benefits package forpermanent full-time instructional faculty/staff? (WRITE IN PERCENTAGE; IF NONE, WRITE IN "0")
BEST COPY AVAILABLE 3 2 3,
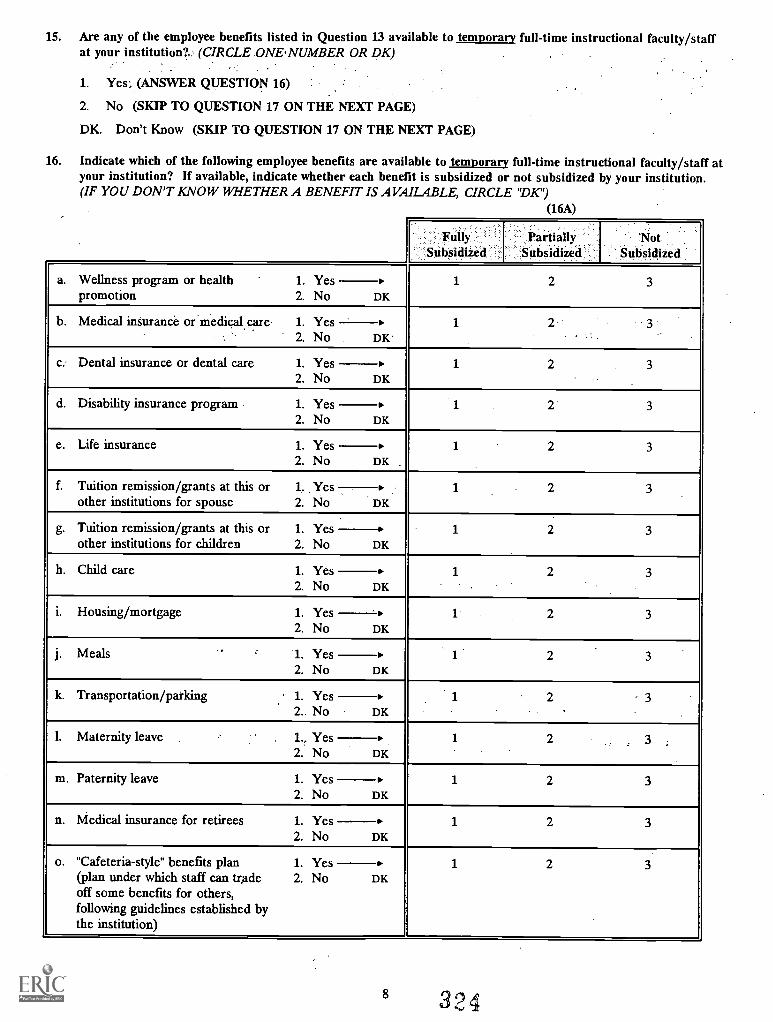
15. Are any of the employee benefits listed in Question 13 available to temporary full-time instructional faculty/staffat your institution? (CIRCLE ONE. NUMBER OR DK)
1. Yes; (ANSWER QUESTION 16)
2. No (SKIP TO QUESTION 17 ON THE NEXT PAGE)
DK. Don't Know (SKIP TO QUESTION 17 ON THE NEXT PAGE)
16. Indicate which of the following employee benefits are available to temporary full-time instructional faculty/staff atyour institution? If available, indicate whether each benefit is subsidized or not subsidized by your institution.(IF YOU DON'T KNOW WHETHER A BENEFIT IS AVAILABLE, CIRCLE "DK")
(16A)
FullySubsidized
PartiallySubsidized
NotSubsidized
a. Wellness program or healthpromotion
1. Yes 1 2 32. No DK
b. Medical insurance or medical care 1. Yes 1
2. No DK
c. Dental insurance or dental care 1. Yes 1 2 32. No DK
d. Disability insurance program 1. Yes 1 2 32. No DK
e. Life insurance 1. Yes 1 2 32. No DK
f. Tuition remission/grants at this orother institutions for spouse
1. Yes 1 2 32. No DK
g. Tuition remission/grants at this orother institutions for children
1. Yes 1 2 32. No DK
h. Child care 1. Yes 1 2 32. No DK
i. Housing/mortgage 1. Yes 1 2 32. No DK
j. Meals '1. Yes 1 2 32. No DK
k. Transportation/parking 1. Yes 1 2 32. No DK
1. Maternity leave 1.. Yes 1 2 32. No DK
m. Paternity leave 1. Yes 1 2 32. No DK
n. Medical insurance for retirees 1. Yes 1 2 32. No DK
o. "Cafeteria-style" benefits plan(plan under which staff can tradeoff some benefits for others,following guidelines established bythe institution)
1. Yes 1 2 32. No DK
8 324
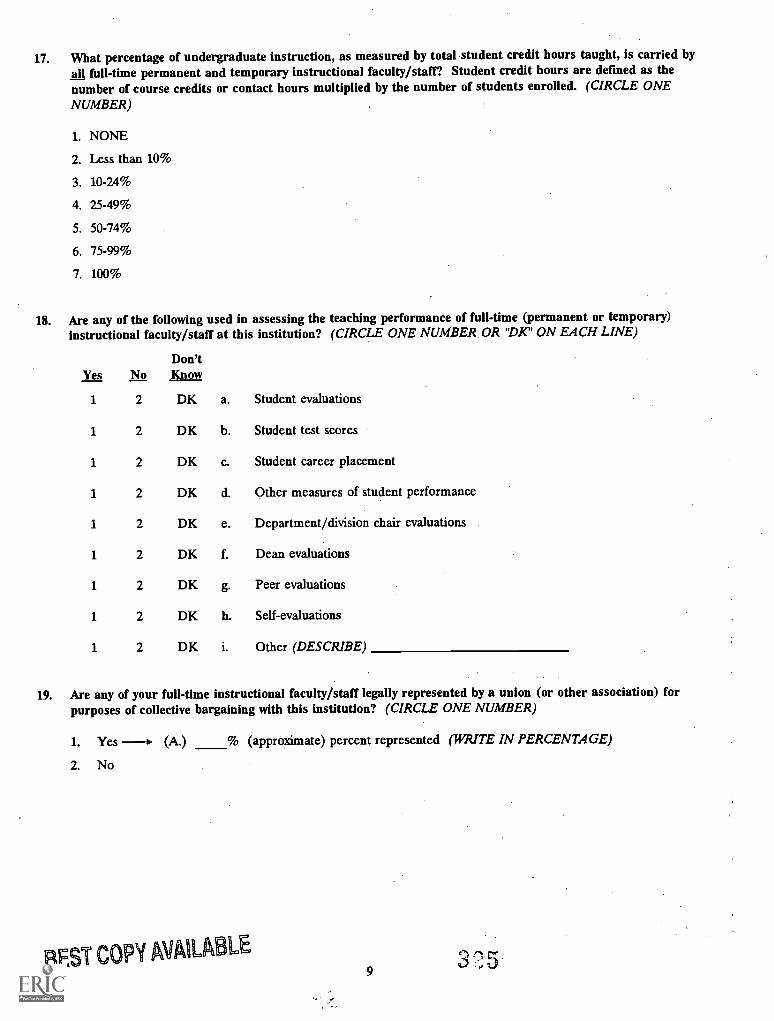
17. What percentage of undergraduate instruction, as measured by total student credit hours taught, is carried byall full-time permanent and temporary instructional faculty/staff? Student credit hours are defined as thenumber of course credits or contact hours multiplied by the number of students enrolled. (CIRCLE ONE
NUMBER)
1. NONE
2. Less than 10%
3. 10-24%
4. 25-49%
5. 50-74%
6. 75-99%
7. 100%
18. Are any of the following used in assessing the teaching performance of full-time (permanent or temporary)instructional faculty/staff at this institution? (CIRCLE ONE NUMBER. OR 'DK' ON EACH LINE)
Yes NoDon'tKnow
1 2 DK a. Student evaluations
1 2 DK b. Student test scores
1 2 DK c. Student career placement
1 2 DK d. Other measures of student performance
1 2 DK e. Department/division chair evaluations
1 2 DK f. Dean evaluations
1 2 DK g. Peer evaluations
1 2 DK h. Self - evaluations
1 2 DK i. Other (DESCRIBE)
19. Are any of your full-time instructional faculty/staff legally represented by a union (or other association) forpurposes of collective bargaining with this institution? (CIRCLE ONE NUMBER)
1. Yes (A.) % (approximate) percent represented (WRITE IN PERCENTAGE)
2. No
BEST COPY AVAILABLE9
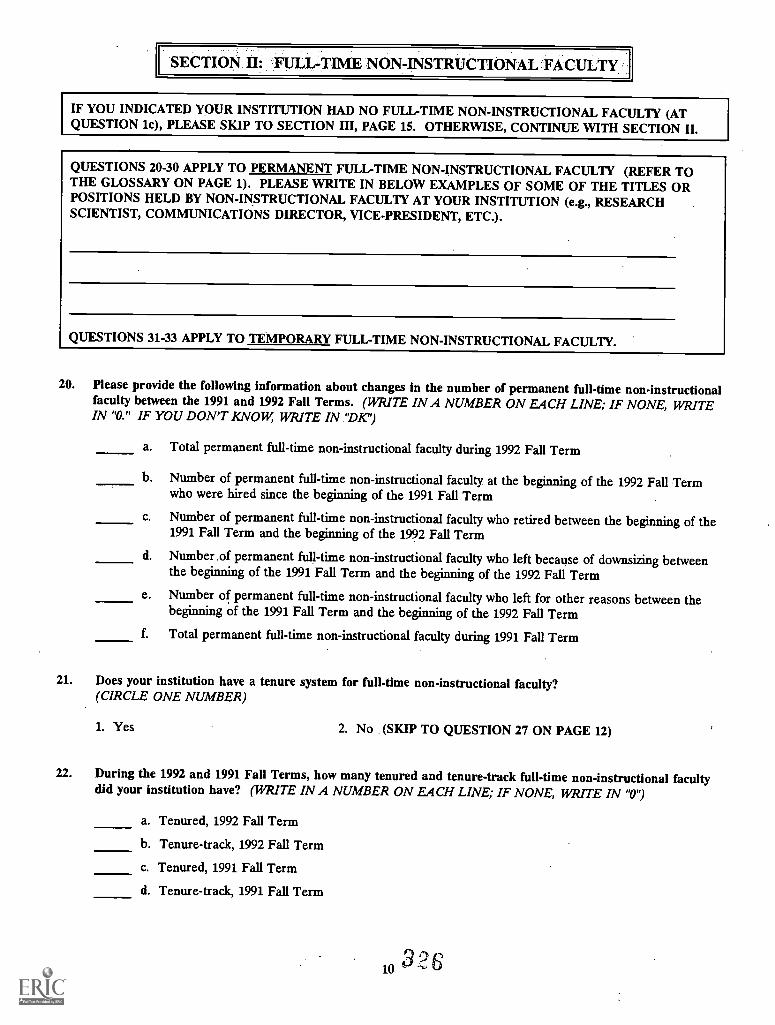
SECTION II: FULL-T1ME NON-INSTRUCTIONAL FACULTY
IF YOU INDICATED YOUR INSTITUTION HAD NO FULL-TIME NON-INSTRUCTIONAL FACULTY (ATQUESTION 1c), PLEASE SKIP TO SECTION HI, PAGE 15. OTHERWISE, CONTINUE WITH SECTION II.
QUESTIONS 20-30 APPLY TO PERMANENT FULL-TIME NON-INSTRUCTIONAL FACULTY (REFER TOTHE GLOSSARY ON PAGE 1). PLEASE WRITE IN BELOW EXAMPLES OF SOME OF THE TITLES ORPOSITIONS HELD BY NON-INSTRUCTIONAL FACULTY AT YOUR INSTITUTION (e.g., RESEARCHSCIENTIST, COMMUNICATIONS DIRECTOR, VICE-PRESIDENT, ETC.).
QUESTIONS 31-33 APPLY TO TEMPORARY FULL-TIME NON-INSTRUCTIONAL FACULTY.
20. Please provide the following information about changes in the number of permanent full-time non-instructionalfaculty between the 1991 and 1992 Fall Terms. (WRITE IN A NUMBER ON EACH LINE; IF NONE, WRITEIN "0." IF YOU DON'T KNOW, WRITE IN 'DK")
a. Total permanent full-time non-instructional faculty during 1992 Fall Term
b. Number of permanent full-time non-instructional faculty at the beginning of the 1992 Fall Termwho were hired since the beginning of the 1991 Fall Term
c. Number of permanent full-time non-instructional faculty who retired between the beginning of the1991 Fall Term and the beginning of the 1992 Fall Term
d. Number, of permanent full-time non-instructional faculty who left because of downsizing betweenthe beginning of the 1991 Fall Term and the beginning of the 1992 Fall Term
e. Number of permanent full-time non-instructional faculty who left for other reasons between thebeginning of the 1991 Fall Term and the beginning of the 1992 Fall Term
f. Total permanent full-time non-instructional faculty during 1991 Fall Term
21. Does your institution have a tenure system for full-time non-instructional faculty?(CIRCLE ONE NUMBER)
1. Yes 2. No (SKIP TO QUESTION 27 ON PAGE 12)
22. During the 1992 and 1991 Fall Terms, how many tenured and tenure-track full-time non-instructional facultydid your institution have? (WRITE IN A NUMBER ON EACH LINE; IF NONE, WRITE IN "0")
a. Tenured, 1992 Fall Term
b. Tenure-track, 1992 Fall Term
c. Tenured, 1991 Fall Term
d. Tenure-track, 1991 Fall Term
610
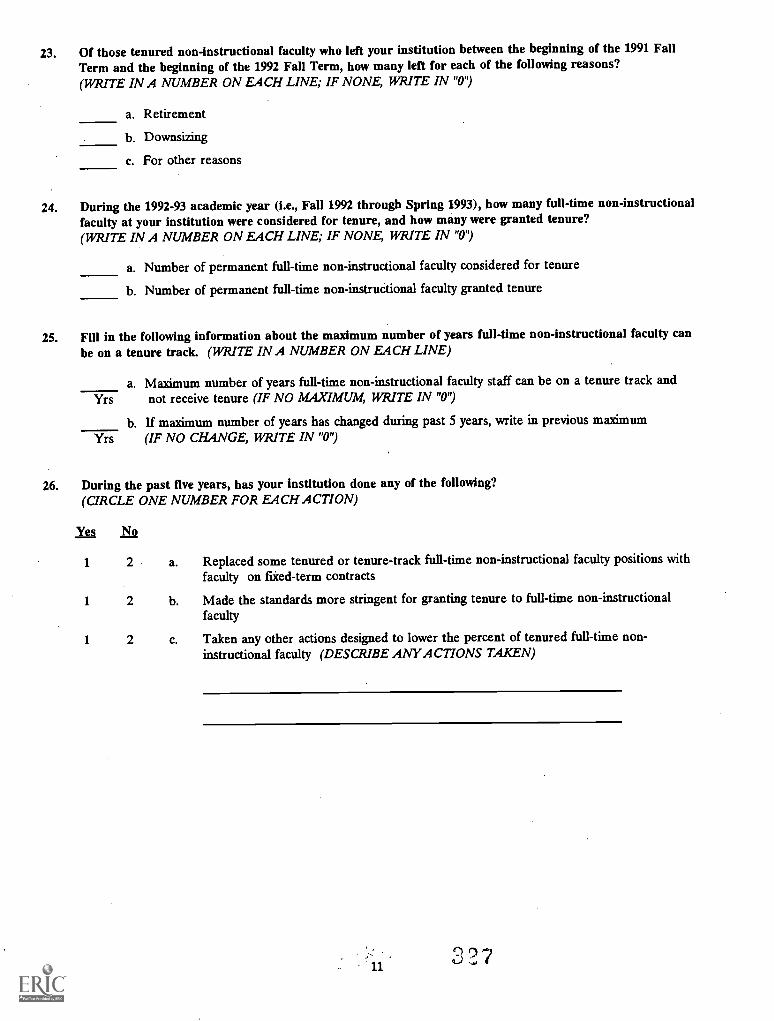
23. Of those tenured non-instructional faculty who left your institution between the beginning of the 1991 FallTerm and the beginning of the 1992 Fall Term, how many left for each of the following reasons?(WRITE IN A NUMBER ON EACH LINE; IF NONE, WRITE IN "0")
a. Retirement
b. Downsizing
c. For other reasons
24. During the 1992-93 academic year (i.e., Fall 1992 through Spring 1993), how many full-time non-instructionalfaculty at your institution were considered for tenure, and how many were granted tenure?(WRITE INA NUMBER ON EACH LINE; IF NONE, WRITE IN "0")
a. Number of permanent full-time non-instructional faculty considered for tenure
b. Number of permanent full-time non-instructional faculty granted tenure
25. Fill in the following information about the maximum number of years full-time non-instructional faculty canbe on a tenure track. (WRITE IN A NUMBER ON EACH LINE)
a. Maximum number of years full-time non-instructional faculty staff can be on a tenure track andYrs not receive tenure (IF NO MAXIMUM, WRITE IN "0")
b. If maximum number of years has changed during past 5 years, write in previous maximumYrs (IF NO CHANGE, WRITEIN "0")
26. During the past five years, has your institution done any of the following?(CIRCLE ONE NUMBER FOR EACH ACTION)
NI No
1 2 a. Replaced some tenured or tenure-track full-time non-instructional faculty positions withfaculty on fixed -term contracts
1 2 b. Made the standards more stringent for granting tenure to full-time non-instructionalfaculty
1 2 c. Taken any other actions designed to lower the percent of tenured full-time non-instructional faculty (DESCRIBE ANY ACTIONS TAKEN)
11
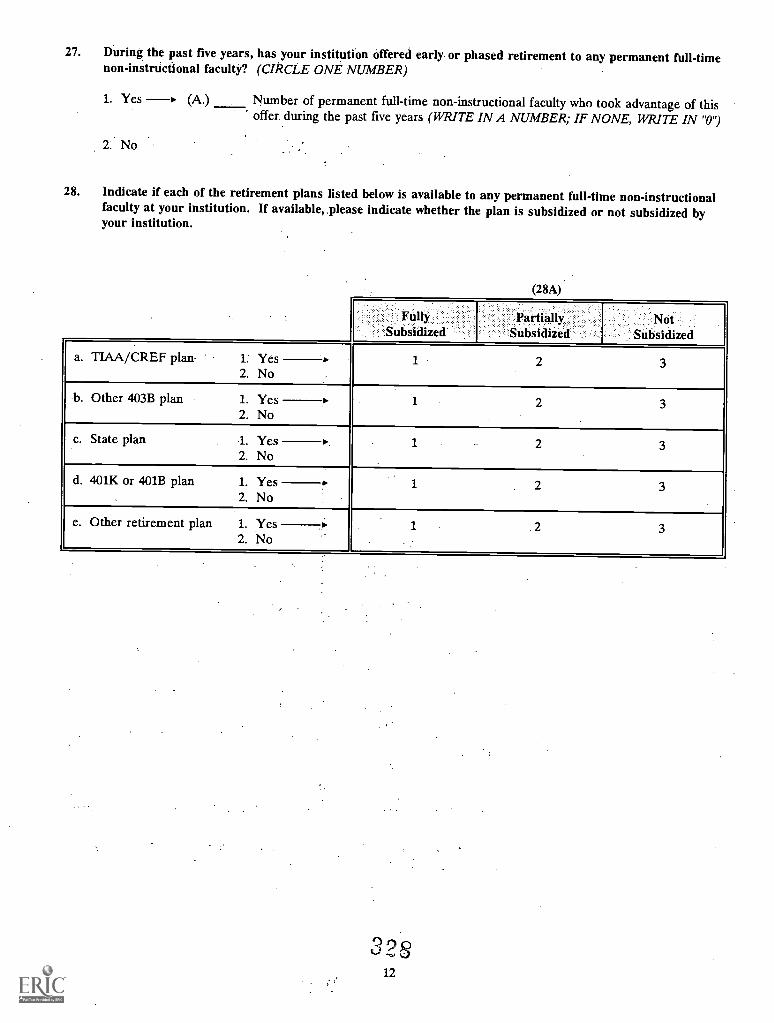
27. During the past five years, has your institution offered early or phased retirement to any permanent full-timenon-instructional faculty? (CIRCLE ONE NUMBER)
1. Yes (A.) Number of permanent full-time non-instructional faculty who took advantage of thisoffer during the past five years (WRITE IN A NUMBER; IF NONE, WRITE IN "0")
2. No
28. Indicate if each of the retirement plans listed below is available to any permanent full-time non-instructionalfaculty at your institution. If available, please indicate whether the plan is subsidized or not subsidized byyour institution.
(28A)
NotSubsidized
a. TIAA/CREF plan. 1. Yes2. No
b. Other 403B plan 1. Yes2. No
c. State plan 1. Yes2. No
d. 401K or 401B plan 1. Yes2. No
e. Other retirement plan 1. Yes2. No
1 2 3
2 3
1 2 3
1 2 3
1 .2 3
3212
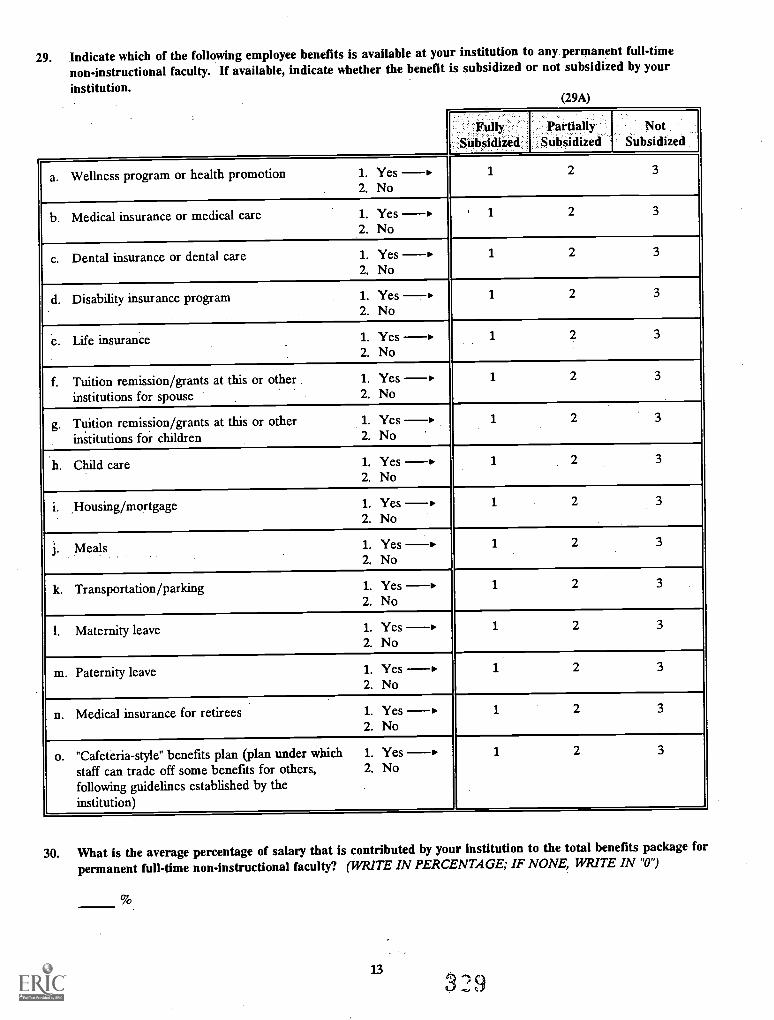
29. Indicate which of the following employee benefits is available at your institution to any permanent full-time
non-instructional faculty. If available, indicate whether the benefit is subsidized or not subsidized by your
institution.(29A)
Fully. .
SubsidiZed
.
PartiallySubsidized
NotSubsidized
a. Wellness program or health promotion 1. Yes 1 2 3--2. No
b. Medical insurance or medical care 1. Yes 1 2 3-2. No
c. Dental insurance or dental care 1. Yes 1 2 3-2. No
.d. Disability insurance program 1. Yes 1 2 3-7-2. No
e. Life insurance 1. Yes 1 2 3-.2. No
f. Tuition remission/grants at this or otherinstitutions for spouse
1. Yes 1 2 3-.2. No
g. Tuition remission/grants at this or otherinstitutions for children
1. Yes -.2. No
2
h. Child care 1. Yes 1 2 3-2. No
i. Housing/mortgage 1. Yes 1 2-2. No
j. Meals 1. Yes 1 2 3-2. No
k. Transportation/parking 1. Yes 1 2 3-2. No
1. Maternity leave 1. Yes 1 2 3-0.2. No
m. Paternity leave 1. Yes 1 2 3-2. No
n. Medical insurance for retirees 1. Yes 1 2 3-2. No
o. "Cafeteria-style" benefits plan (plan under whichstaff can trade off some benefits for others,following guidelines established by theinstitution)
1. Yes 1 2 3---2. No
30. What is the average percentage of salary that is contributed by your institution to the total benefits package for
permanent full-time non-instructional faculty? (WRITE IN PERCENTAGE; IF NONE, WRITE IN "0")
13 3
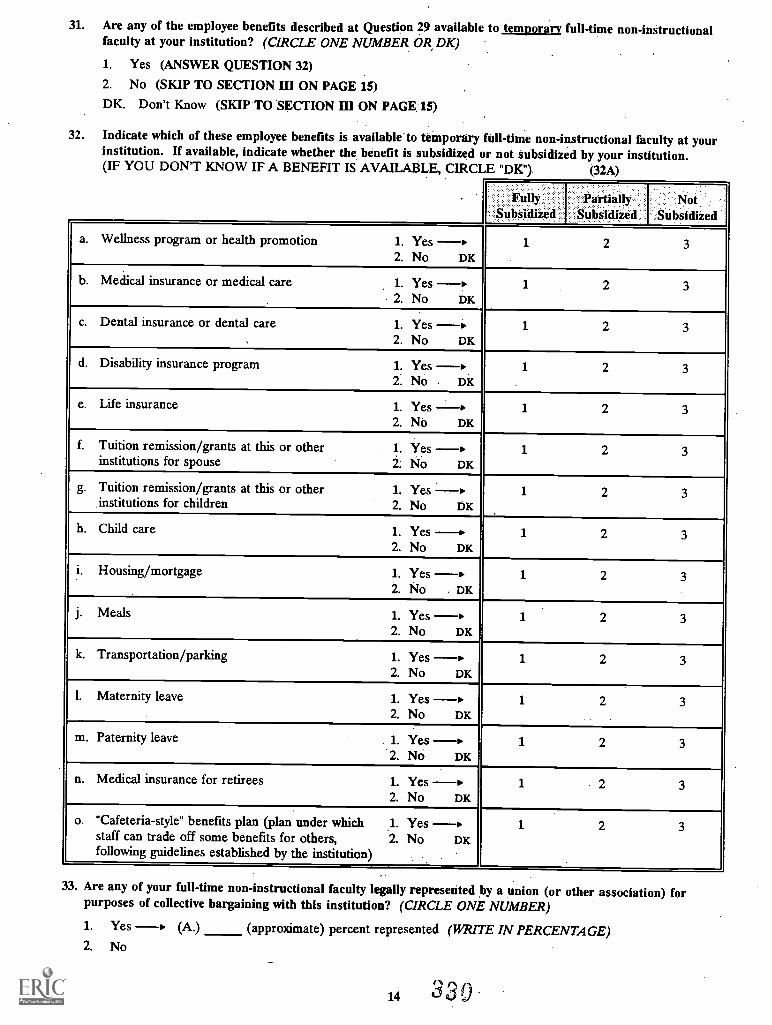
31. Are any of the employee benefits described at Question 29 available to temporary full-time non-instructionalfaculty at your institution? (CIRCLE ONE NUMBER OR DK)
1. Yes (ANSWER QUESTION 32)2. No (SKIP TO SECTION HI ON PAGE 15)DK. Don't Know (SKIP TO 'SECTION III ON PAGE 15)
32. Indicate which of these employee benefits is available'to temporary full-time non-instructional faculty at yourinstitution. If available, indicate whether the benefit is subsidized or not subsidized by your institution.(IF YOU DON'T KNOW IF A BENEFIT IS AVAILABLE, CIRCLE "DK "). (32A)
FullySubsidized .
Partially:.Subsidized ..
NotSubsidized
a. Wellness program or health promotion 1. Yes 1 2 3-.2. No DK
b. Medical insurance or medical care 1. Yes 1 2 3--.2. No DK
c. Dental insurance or dental care 1. Yes 1 2 3-.2. No DK
d. Disability insurance program 1. Yes 1 2 3-.2. No , DK
e. Life insurance 1. Yes 1 2 3-.2. NO DK
f. Tuition remission/grants at this or otherinstitutions for spouse
1. Yes 1 2 32: No DK
g. Tuition remission/grants at this or otherinstitutions for children
1. Yes 1 2 3-.2. No DK
h. Child care 1. Yes 1 2 3-.2. No DK
i. Housing/mortgage 1. Yes 1 2 3--.2. No DK
j. Meals 1. Yes 1 2 3-.2. No DK
k. Transportation/parking 1. Yes 1 2 3---2. No DK
1. Maternity leave 1. Yes 1 2 3-.2. No DK
m. Paternity leave 1. Yes 1 2 3-.2. Na DK
n. Medical insurance for retirees 1. Yes 1 2 3-.2. No DK
o. "Cafeteria-style" benefits plan (plan under whichstaff can trade off some benefits for others,following guidelines established by the institution)
1. Yes 1 2 3-.2. No DK
33. Are any of your full-time non-instructional faculty legally represented by a union (or other association) forpurposes of collective bargaining with this institution? (CIRCLE ONE NUMBER)
1. Yes (A.) (approximate) percent represented (WRITE IN PERCENTAGE)2. No
14 330
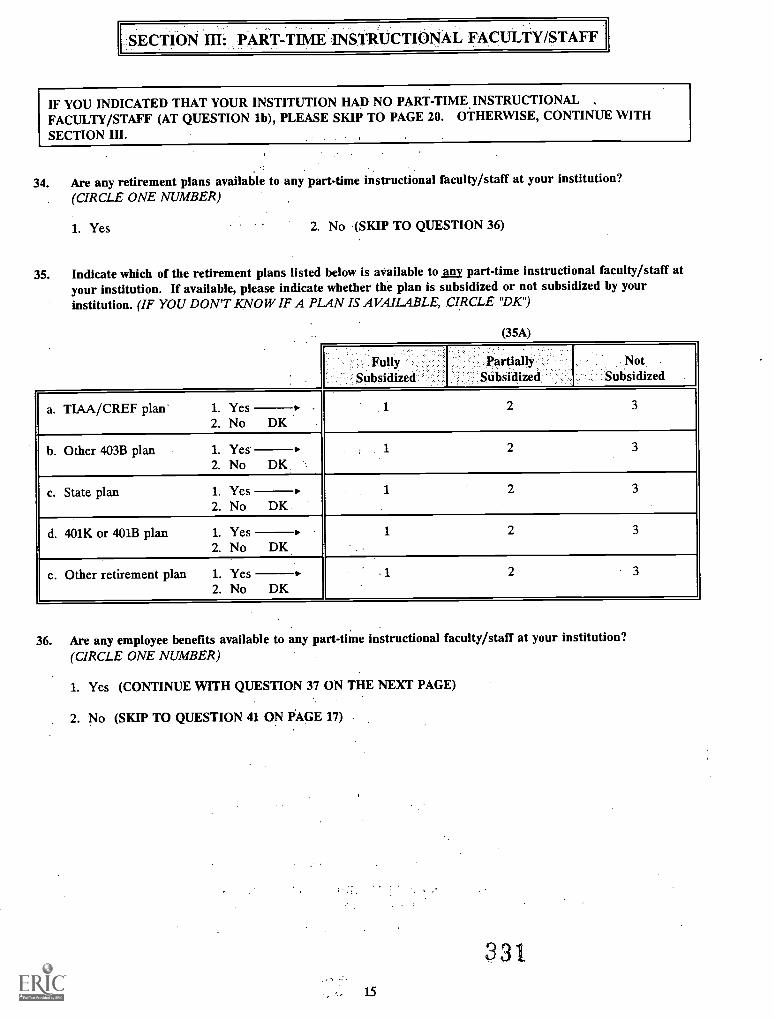
SECTION 111: PARTTIME INSTRUCTIONAL FACULTY/STAFF
IF YOU INDICATED THAT YOUR INSTITUTION HAD NO PART -TIME INSTRUCTIONALFACULTY/STAFF (AT QUESTION lb), PLEASE SKIP TO PAGE 20. OTHERWISE, CONTINUE WITH
SECTION III.
34. Are any retirement plans available to any part-time instructional faculty/staff at your institution?(CIRCLE ONE NUMBER)
1. Yes 2. No (SKIP TO QUESTION 36)
35. Indicate which of the retirement plans listed below is available to any part-time instructional faculty/staff atyour institution. If available, please indicate whether the plan is subsidized or not subsidized by yourinstitution. (IF YOU DON'T KNOW IF A PLAN IS AVAILABLE, CIRCLE 'DK")
(35A)
FullySubsidized
PartiallySubsidized
NotSubsidized
a. TIAA/CREF plan 1. Yes 1 2 3
2. No DK
b. Other 403B plan 1. Yes 1 2 3
2. No DK
c. State plan 1. Yes 1 2 3
2. No DK
d. 401K or 401B plan 1. Yes 1 2 3
2. No DK
e. Other retirement plan 1. Yes 1 2 3
2. No DK
36. Are any employee benefits available to any part-time instructional faculty/staff at your institution?(CIRCLE ONE NUMBER)
1. Yes (CONTINUE WITH QUESTION 37 ON THE NEXT PAGE)
2. No (SKIP TO QUESTION 41 ON PAGE 17)
33115
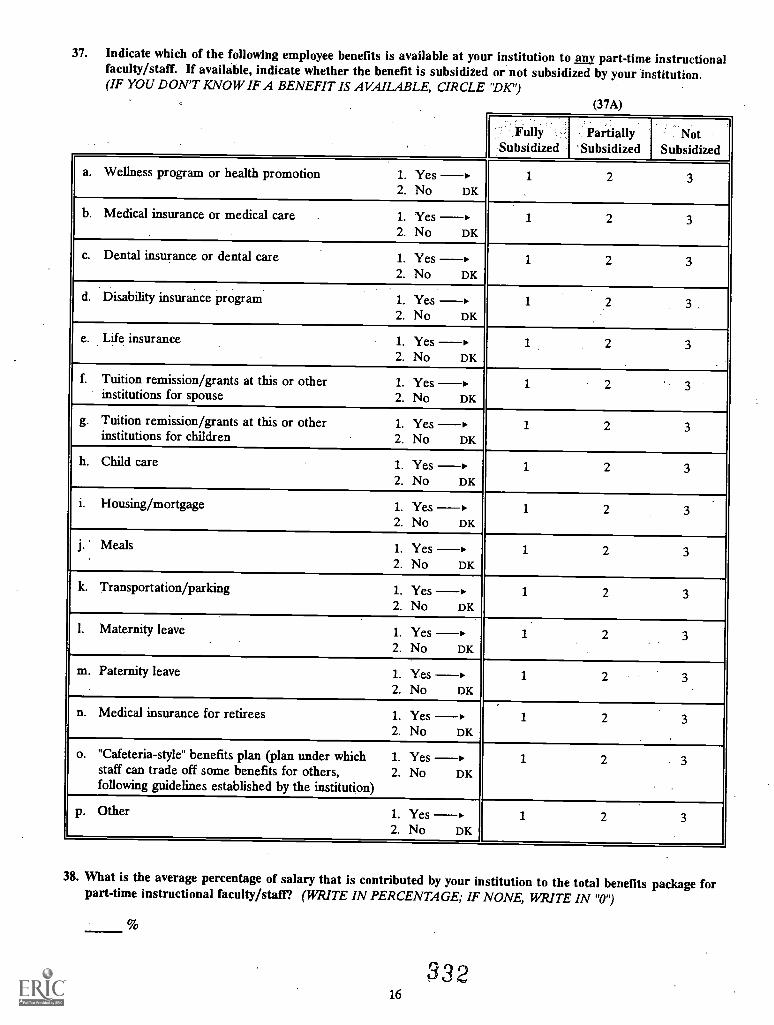
37. Indicate which of the following employee benefits is available at your institution to any part-time instructionalfaculty/staff. If available, indicate whether the benefit is subsidized or not subsidized by your institution.(IF YOU DON'T KNOW IF A BENEFIT IS AVAILABLE, CIRCLE 'DK")
(37A)
a. Wellness program or health promotion 1. Yes -2. No DK
b. Medical insurance or medical care 1. Yes -2. No DK
c. Dental insurance or dental care 1. Yes -2. No DK
d. Disability insurance program 1. Yes -2. No DK
e. Life insurance 1. Yes -2. No DK
f. Tuition remission/grants at this or otherinstitutions for spouse
1. Yes -2. No DK
g. Tuition remission/grants at this or otherinstitutions for children
1. Yes -2. No DK
h. Child care 1. Yes -2. No DK
i. Housing/mortgage 1. Yes -2. No DK
j. Meals 1. Yes -2. No DK
k. Transportation/parking 1. Yes -2. No DK
1. Maternity leave 1. Yes -2. No DK
m. Paternity leave 1. Yes -2. No DK
n. Medical insurance for retirees 1. Yes -2. No DK
o. "Cafeteria-style" benefits plan (plan under which 1. Yesstaff can trade off some benefits for others, 2. No DKfollowing guidelines established by the institution)
p. Other 1. Yes2. No DK
FullySubsidized
Partially'Subsidized
NotSubsidized
1 2 3
1 2 3
1 2 3
1 2 3.
1 2
1 2 3
1 2 3
1 2 3
1 2 3
1 2 3
1 2 3
1 2 3
1 2 3
1 2 3
1 2 3
1 2 3
38. What is the average percentage of salary that is contributed by your institution to the total benefits package forpart-time instructional faculty/staff? (WRITE IN PERCENTAGE; IF NONE, WRITE IN "0'9
16332
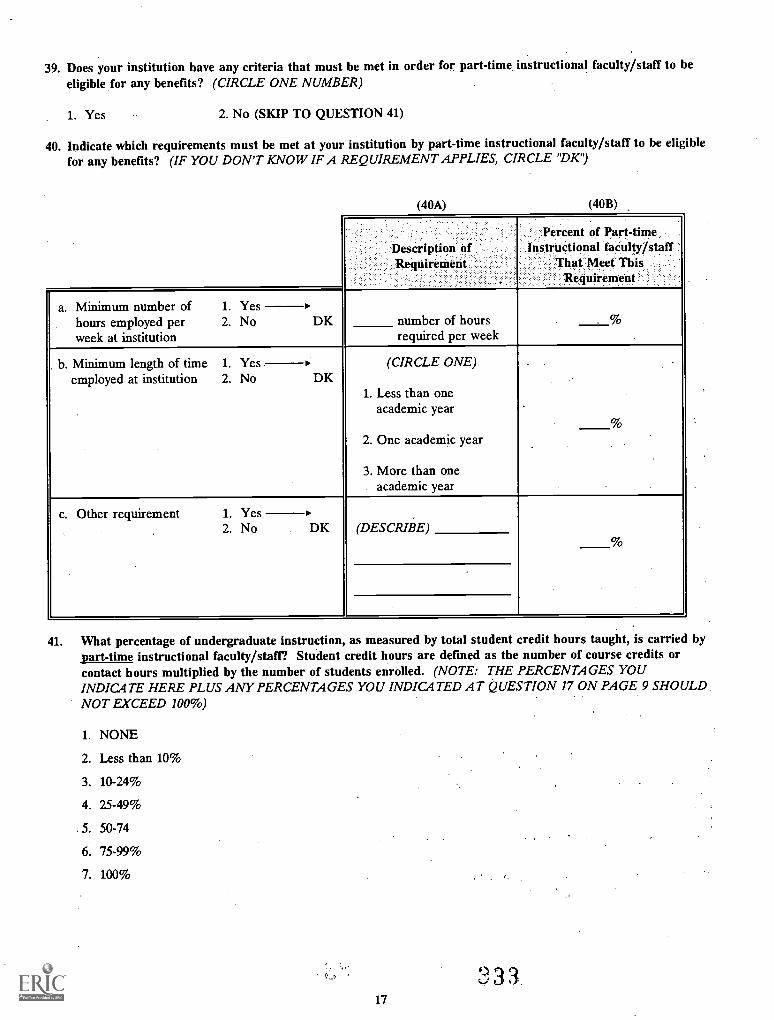
39. Does your institution have any criteria that must be met in order for part-time instructional faculty/staff to beeligible for any benefits? (CIRCLE ONE NUMBER)
1. Yes 2. No (SKIP TO QUESTION 41)
40. Indicate which requirements must be met at your institution by part-time instructional faculty/staff to be eligiblefor any benefits? (IF YOU DON'T KNOW IF A REQUIREMENT APPLIES, CIRCLE 'DK")
(40A) (40B)
Description ofRequirement
Percent of Part-timeInstructional faculty/staff
That Meet ThisRequirenient
a. Minimum number ofhours employed perweek at institution
1. Yesnumber of hours . %2. No DKrequired per week
b. Minimum length of timeemployed at institution
1. Yes (CIRCLE ONE)
1. Less than oneacademic year
2. One academic year
3. More than oneacademic year
.
%
2. No DK
c. Other requirement 1. Yes(DESCRIBE)
%2. No DK
41. What percentage of undergraduate instruction, as measured by total student credit hours taught, is carried bypart -time instructional faculty/staff? Student credit hours are defined as the number of course credits orcontact hours multiplied by the number of students enrolled. (NOTE: THE PERCENTAGES YOUINDICATE HERE PLUS ANY PERCENTAGES YOU INDICATED AT QUESTION 17 ON PAGE 9 SHOULDNOT EXCEED 100%)
1. NONE
2. Less than 10%
3. 10-24%
4. 25-49%
5. 50-74
6. 75-99%
7. 100%
17
3 3
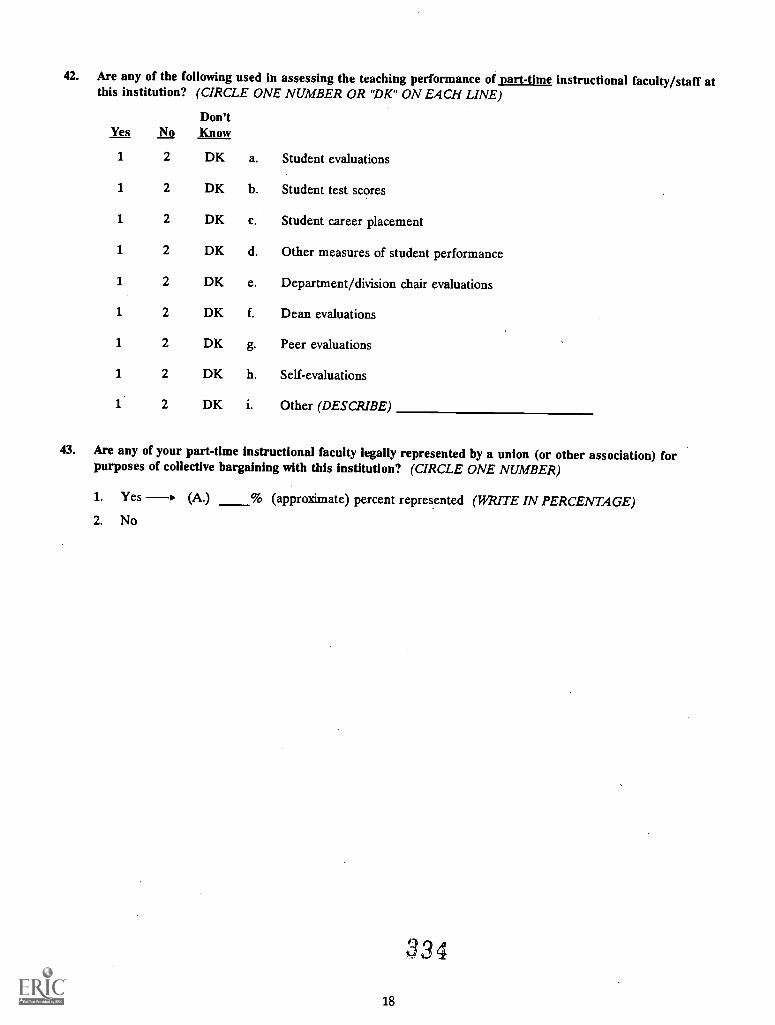
42. Are any of the following used in assessing the teaching performance of part -time instructional faculty/staff atthis institution? (CIRCLE ONE NUMBER OR "DK" ON EACH LINE)
Yes NoDon'tKnow
1 2 DK a. Student evaluations
1 2 DK b. Student test scores
1 2 DK c. Student career placement
1 2 DK d. Other measures of student performance
1 2 DK e. Department/division chair evaluations
1 2 DK f. Dean evaluations
1 2 DK g. Peer evaluations
1 2 DK h. Self-evaluations
1 2 DK i. Other (DESCRIBE)
43. Are any of your part-time instructional faculty legally represented by a union (or other association) forpurposes of collective bargaining with this institution? (CIRCLE ONE NUMBER)
1. Yes I, (A.) % (approximate) percent represented (WRITE IN PERCENTAGE)
2. No
:334
18
Please fill in your name and your title at this institution, as well as the names and titles of any otherindividuals who have answered one or more questions in this questionnaire, and the question numbers eachindividual worked on. Include telephone numbers in case we have any questions about any entries.
Your responses to these items, as with all other items in this questionnaire, are voluntary and strictlyconfidential. The information provided in this questionnaire will be used only in statistical summaries.Furthermore, all information that would permit identification of individuals, including names and telephonenumbers, will be removed from survey files.
YOUR NAME: TITLE:
PHONE #: QUESTIONS #s:
OTHER NAME: TITLE:
PHONE #: QUESTIONS #s:
OTHER NAME: TITLE:
PHONE #: QUESTIONS #s:
OTHER NAME: TITLE:
PHONE #: QUESTIONS #s:
OTHER NAME: TITLE:
PHONE #: QUESTIONS #s:
THANK YOU VERY MUCH FOR YOUR PARTICIPATION. RETURN THIS QUESTIONNAIRE IN THEENCLOSED PREPAID ENVELOPE TO:
National Opinion Research Center (4552)University of Chicago1525 East 55th Street
Chicago, Illinois 60615
335
20
BEST COPY AVAILABLE336
1993 National Study of Postsecondary FacultyMethodology Report
Appendix H
1993 NSOPF Abbreviated Faculty Questionnaire
337
OMB No. 11150-0408Expiration Data: 12193
U.S. Department of EducationOffice of Educational Research and Improvement
National Center for Education Statistics
1993 NATIONAL STUDY OF POSTSECONDARY FACULTY
FACULTYQUESTIONNAIRE
P. 4552 - NSOPF
October 29, 1993
REFUSAL CONVERSION Date:
R Name:
CASE ID:
Institution:
Phone: (
IWER:
Have you updated call not in TNMS"COMPLETE ABBREVIATED QUEX" 7
YES NO
QUEUE STATUS
DATE MOVED:
Co-sponsored by:
Contractor:
All Information on this form will be kept confidential and will not bedisclosed or released to your institution or any other group or individuaL
National Science FoundationNational Endowment for the Humanities
National Opinion Research Center (NORC)University of ChicagoMailing Address: e,
1525 East 55th StreetChicago, Illinois 60615Toll-Free Number: 1-800-733-NORC
EST COPY MAIM
NATIONAL STUDY OF'POSTSECONDARY' FACULTY- Instructirms for Complethig.Faculty Questionnaire
Many. of our questions ask about .your activities during. the 1992 Fall Term:- By this: we rnean.whatevern-acadaniclerm.was.in progress. on October:1S
Altquestions.that.ask about your positionat..lhis.institution7refertoyour position during the.1992.Term at the .institution listed on the label on the back cover of the.:questionnaire.:
77iii..questionnaire- was. designed to be completed byboih full4inte.and part-timeinstructional fcitubranti.staX:iind non-instructional faculty...m.2- and 4-year(cusd.above) higher education institutions:of all:type:7:and sizes:- Please-read each question earefullyandfollowal instructions:.... Sonic of the. questions rttay4otvi:appear:to fa- your situation. precisely; if you .:have a. response.:.other than. those listed. fora particitlitsquestion. write in that response....
Mostquestionr ask..yon. to circle a number indicate: your response:..... Circle the number in frontohourv,response and not the response itseg: Other quesnonsaskyou to fillin information: write in the infortnationinthespace provided..-
Mailing instructions for returning the completed questionnaire are-on page 26.
If you have any. questions on how to proceed. please-call NORC toll-free at 1-800-733-NORC.
EST COPY AVAILABLE 3391
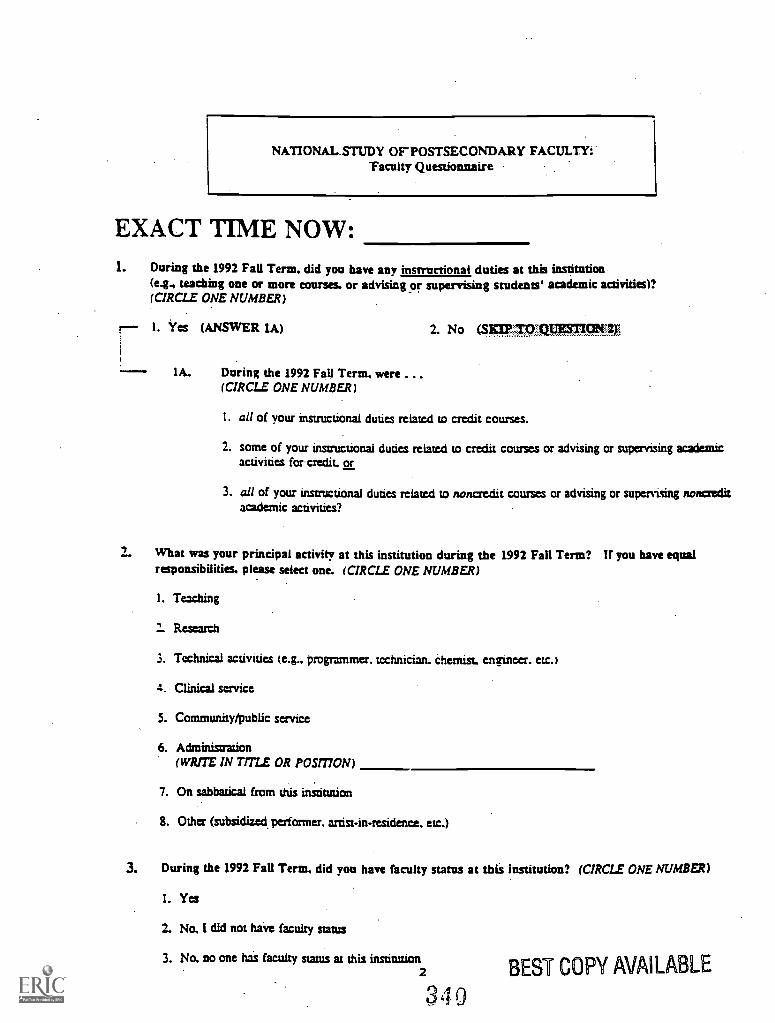
NATIONAL.STUDY OF-POSTSECONDARY FACULTY:'Faculty Questionnaire
EXACT TIME NOW:1. During the 1992 Fall Term. did you have any instructional duties at this institution
(e.g., teaching one or more courses. or advising or supervising students' academic activities)?(CIRCLE ONE NUMBER)
I. Yes (ANSWER 1A)
IA.. During the 1992 Fall Term. were ...(CIRCLE ONE NUMBER)
2. No (S.. 7:t3
I. all of your instructional duties related to credit courses.
IT@FZ)
2. some of your instructional duties related to credit courses or advising or supervising academicactivities for credit. or
3. all of your instructional duties related to noncredit courses or advising or supervising noncreditacademic activities?
What was your principal activity at this institution during the 1992 Fall Term? If you have equalresponsibilities please select one. (CIRCLE ONE NUMBER)
1. Teaching
2. Research
3. Technical activities (e.g., programmer. technician. chemist, entrinetr. etc.)
4. Clinical service
5. Community/public service
6. Administration(WRITE IN TITLE OR POSITION)
7. On sabbatical from this institutiontution
8. Other (subsidized, performer, artist-in-residence, etc.)
3. During the 1992 Fall Term. did you have faculty status at this institution? (CIRCLE ONE NUMBER)
1. Yes
2. No. I did not have faculty status
3. No. no one has faculty status at this institution2 BEST COPY AVAILABLE
3 4 0
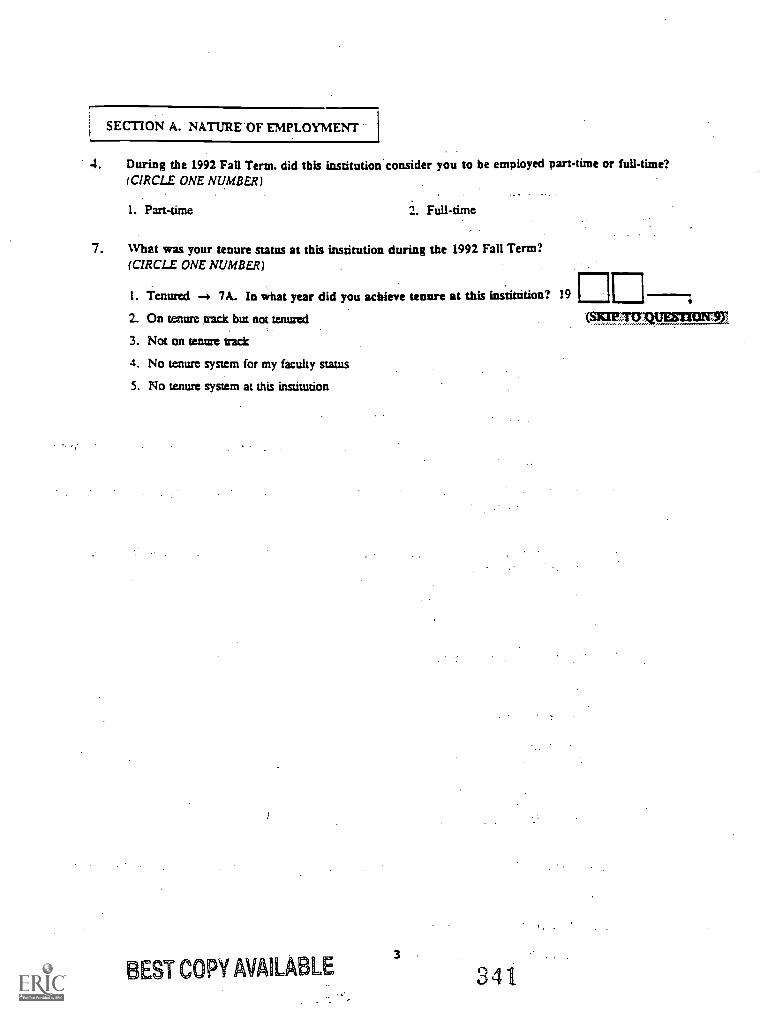
SECTION A. NATURE OF EMPLOYMENT 1
4. During the 1992 Fall Term, did this institution consider you to be employed pan-time or full-time?(CIRCLE ONE NUMBER)
1. Part-time 2.
7. What was your tenure status at this institution during the 1992 Fall Term?(CIRCLE ONE NUMBER)
1. Tenured --o 7A. In what year did you achieve tenure at this institution? 19
2. On tenure track but not tenured
3. Not on tenure track
4. No tenure system for my faculty status
5. No tenure system at this institution
EST COPY AVAILABLE3
341
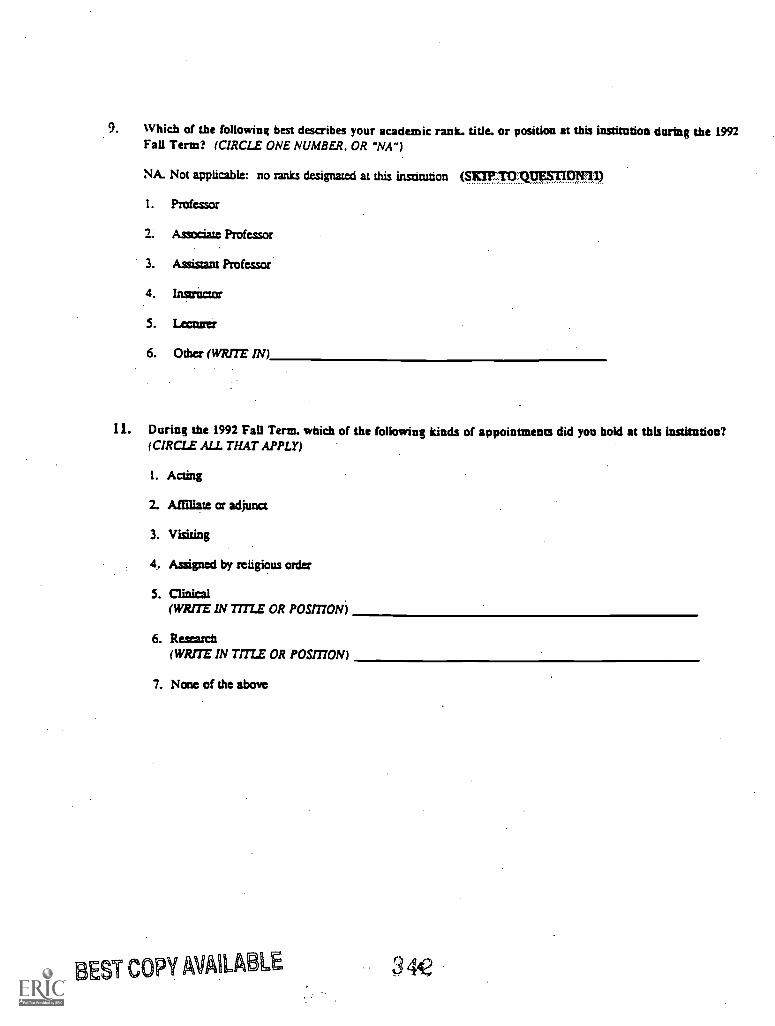
9. Which of the following best describes your academic rank. title. or position at this institution during the 1992Fall Term? (CIRCLE ONE NUMBER. OR 'WA")
NA. Not applicable: no ranks designated at this institution (SKIP ':Q14ESTIOTTII)
1. Professor
2. Associate Professor
3. Assistant Professor
4. Instructor
5. LCCLIVeZ
6. Other (WRITE IN)
11. During the 1992 Fall Term. which of the following kinds of appointments did you hold at this institution?(CIRCLE ALL THAT APPLY)
1. Acting
2. Affiliate or adjunct
3. Visiting
4. Assigned by religious order
5. Clinical(WRITE IN TITLE OR POSITION)
6. Research(WRITE IN TITLE OR POSITION)
7. None of the above
EST COPY AVAILABLE 442
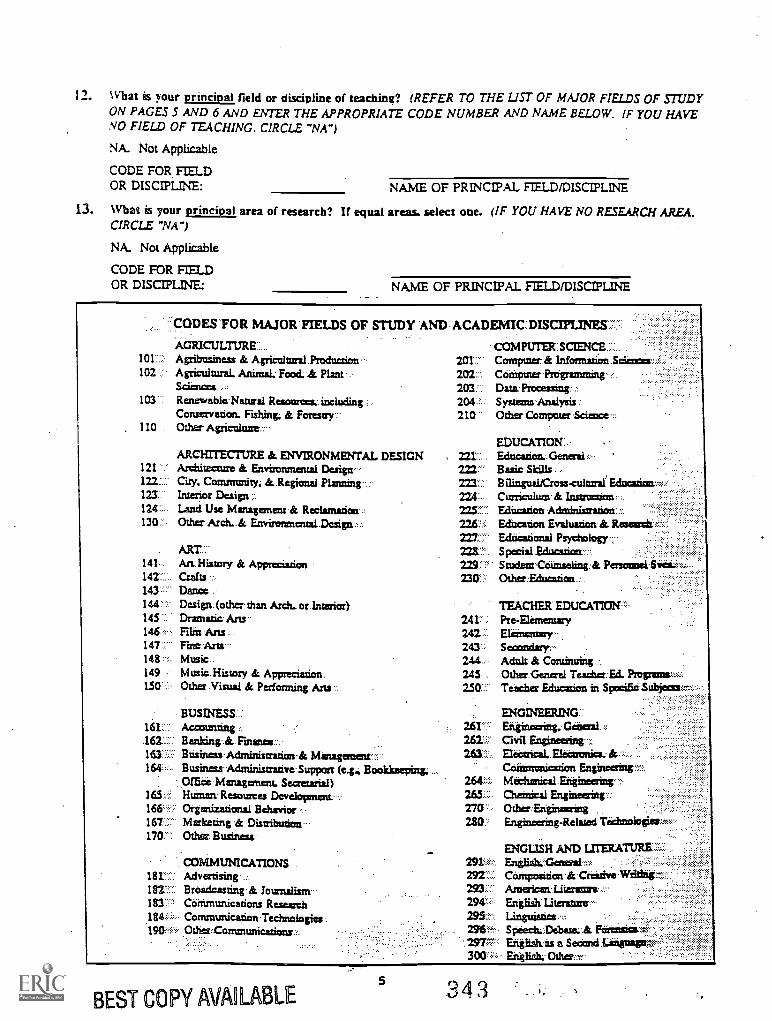
12. What is your principal field or discipline of teaching? (REFER TO THE LIST OF MAJOR FIELDS OF STUDYON PAGES 5 AND 6 AND ENTER THE APPROPRIATE CODE NUMBER AND NAME BELOW. IF YOU HAVENO FIELD OF TEACHING. CIRCLE "NA")
NA. Not Applicable
CODE FOR FIELDOR DISCIPLINE: NAME OF PRINCIPAL FIF_LD/DISCIPLINE
13. What is your principal area of research? If equal areas, select one. (IF YOU HAVE NO RESEARCH AREA.CIRCLE WA")
NA. Not Applicable
CODE FOR FIELDOR DISCIPLINE: NAME OF PRINCIPAL FIELD/DISCIPLINE
CODES FOR MAJOR FIELDS OF STUDY AND:ACADEMIC.DISCIPLINES::::'
AGRICULTURE101 Agribusiness & Agricularal Production102 AgriculturaL Animal. Food. A, Plant
Schemes103 Renewable Natural Resources. including
Consei-vation. Fishing. & Forcsay110 Other Agriculture-
ARCHITECTURE & ENVIRONMENTAL DESIGN121 Architecture & Environmental Design122:..: City. Comrmutity. & Regional Planning123 Interior Design124 Land Use Management & Reclamation130:::. Other Arch. & Envirtrnmental.Design
ART-.141 Art History & Appreciation142 Crafts143 Dance144:145 "146,-147148149150*
Design. (o dies than Arch. or. Interior).Dramatic. ArtsFilin.ArtsFtre:Arts...MusicMusic . History & AppreciationOther Visual & Performing A=
BUSINESS..:161:::
.162::: Banking &163 Bditiness Adminissratimr& Mimagaintett:::
Business- Administrative Support (e.g.; Bookkeeping; ...
Office Management. Sersetarial)165 Hutu= Resources Develop:mu-166.:::: Orgsruzazional Behavior-
Marketing & Distribution...170.-: Other: Business
COMMUNICATIONSAdvertising-Breadcasting.*Corrunimications ResearchCommunication:Technologies..Otlifa:Communications-
COMPUTER:SCIE/4CE201: Computer & Infonnadon Scituate'202::: Cciiirputer Pr:tramming203.'., Data Processing204 Systems Analysis .210 Other Compote: Science ::
221"222:2223: .224:
241:"2422:-241',244.-245...
262.,.
EDUCATION
Basic .Skills .BilinguaLCross-cultural FAnniCurriculum& InstructionEducation .AdministratiOn::::Editcation. Evaluation. &. ResearchEdneational Psychology .
Other:Education. "
TEACHER' EDUCATION':::'PreElernauary :Eletrieruary..
Adnit & Continuing ...Othes.CleneralTeacher Education in SpeeiBeSubjeaa=::.:,...
ENGINEERING':Erigineering...Geberal:::
Conanonication Engineaing:s::Meclutnical Engineering
265 .: Chemical Engineering .:270 Other Engineering280.: Engineering-Related
...
ENGLISH AND L/TERATURBZ.291a: Entlisk:Gaiteral:.........
Care:position* Criative.Wtithtf-
ErigliahLiteranzrec-.295:' Ungzhes"
Spkiesla.:Debastu.:& Fteetisiee*:-.Eiiiliskes a Secend.Langualge0:,..::::::Ehtlish.
BEST COPY AVAILABLE5 343 ,1,
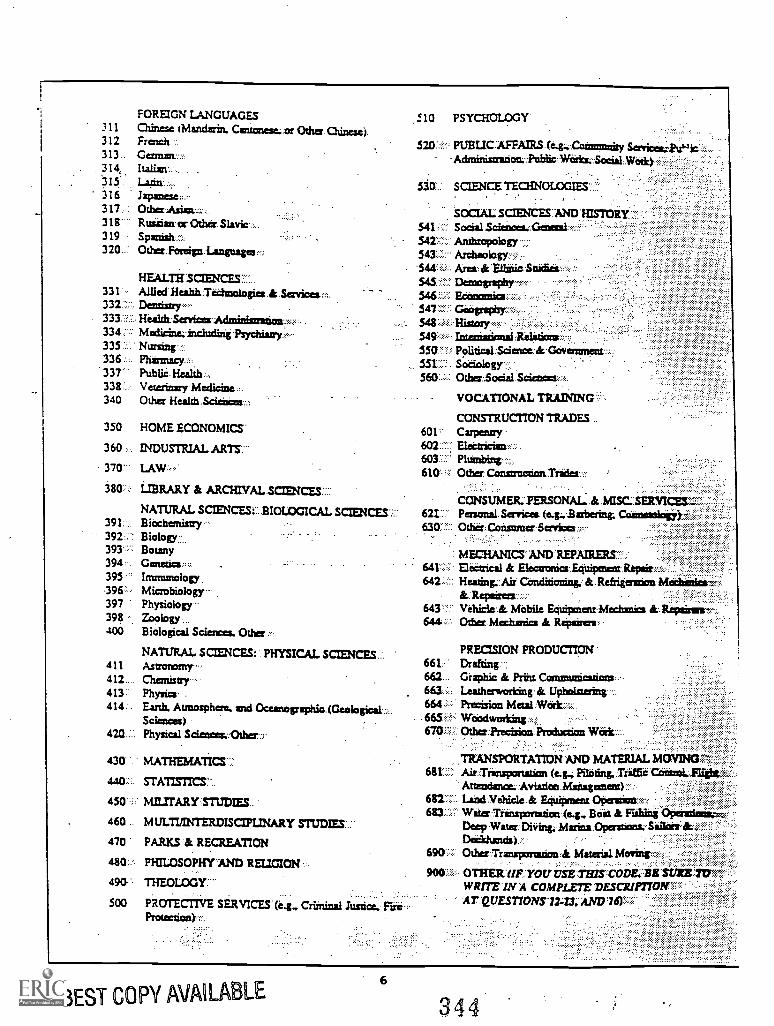
FOREIGN LANGUAGES3 11 Chinese (Mandarin. Cimtonese..or Other. Chinese)312 Fraich313.. Gentiarr..:::314, .
315316 Japacurse::.:.317....:
318": Rusaianor319
Other.foreignlanguagetf......
HEALTH:SCIENCES.'"331 Allied Heahh Tedusologies &. Services ff:.
333 Health:Services:AdministrationPsychiany;:n,.
335"336 Pherntacy..::.:337 Publii. Health338:. Veterinsry340 Other Health.Scieikes......
350 HOME ECONOMICS.
360 .. INDUSTRIAL ARTS'.
370'
380 ..:. LIBRARY & ARCHIVAL.SaENCES::
NATURAL SCIENCES1: BIOLOGICAL SCIENCES:.:::391: Biischanistry392::' Biology393 Botany394: Genetics:::;.395 Irnrrnmology396:' Microbial° gy-397 Physiology398 Zsiolagy400 Biological Sciences. Other
NATURAL SCIENCES: PHYSICAL SCIENCES..411 Astroromy....412.... Chernistry.-413:: Physics .
414 Earth. Atmosphere. and Oceanographic.(OcilogicaL.:SCiences)
420..:. Physical Sciences...-Other....;.
4313 MATHEMATK:S
STATISTX:S:'
MILITARYSTUDIES
MULIVINTERDISCIPLINARY STUDIES
PARKS & RECREATION
PHILOSOPHYAND RELIGION
THEOLOGY:-
PROTECTIVE SERVICES (e.g, Criininal I FireProtection)::::
450
460
470
480 .
490
500
::-.
510 PSYCHOLOGY
520 PUBLIC AFFAIRS (eg,:Cointmnity-Ad:ministration Public:Vied= So Wo& -*
530 SCIENC:ETEc:HNoLociEs..:
tOCIAL SCIENCES:MID TS-TORY--541 Social Science'. Genail
Anthropology.543 Archeology544... Area &
546: .
549550 Political Science & Grivesament551 Sociology
Other Social
VOCATIONAL TRAINING ::
CONSTRUCTION TRADES601' Carpaury602.:... EleCtrician603610. :::: Ot Trades.
COI4SLIMER..PERSONAL, &.MISCSERVICES,621.. Personal.Scrvicea (e.g.:Babe:sin& Cool)
°dicer:Consumer Services..
MECHANI641 Elearical & Elearonies. Equipment: Repair642 Cordoning' & Refri,gaztion
643 . Vehicle & Mobile Equipment Mechanic= & Repairanz,....644;: Other Mechntics & Repairers.
PRECISION PRODUCTION661" Drafting"662... Graphic & Prins. Communicasionr.:663.::: : Leatherworg.&
Precision
: .
:::'
Otha Precision Praha:non Wk
TRANSPORTATION AND MATERIAL MOVINI3-"'681:;: Air.Trinspcatatinnle.g, Piktting.:Triffie ControLfli*t;:.
Antennas= Avian= Managentent):.::Laisd Ve/ticle & Enticement Opentionx:::: . ,
683: WaierTiinsponation (e.g.. Ban & Rating Operasias...Deep Wata Marina Oparis= SiBrinisk.Deekhands)
690::.::: Other Trinspsastion:& Material Moving ^
900.1.2 OTHER (IF'YOUVSE.i-Eirs,Cone;BE suszTar-WRITE 1N A COMPL.E7E DESCRIFITOWAT:QUES77ONS*1243;'AND'145)
BEST COPY AVAILABLE6
44
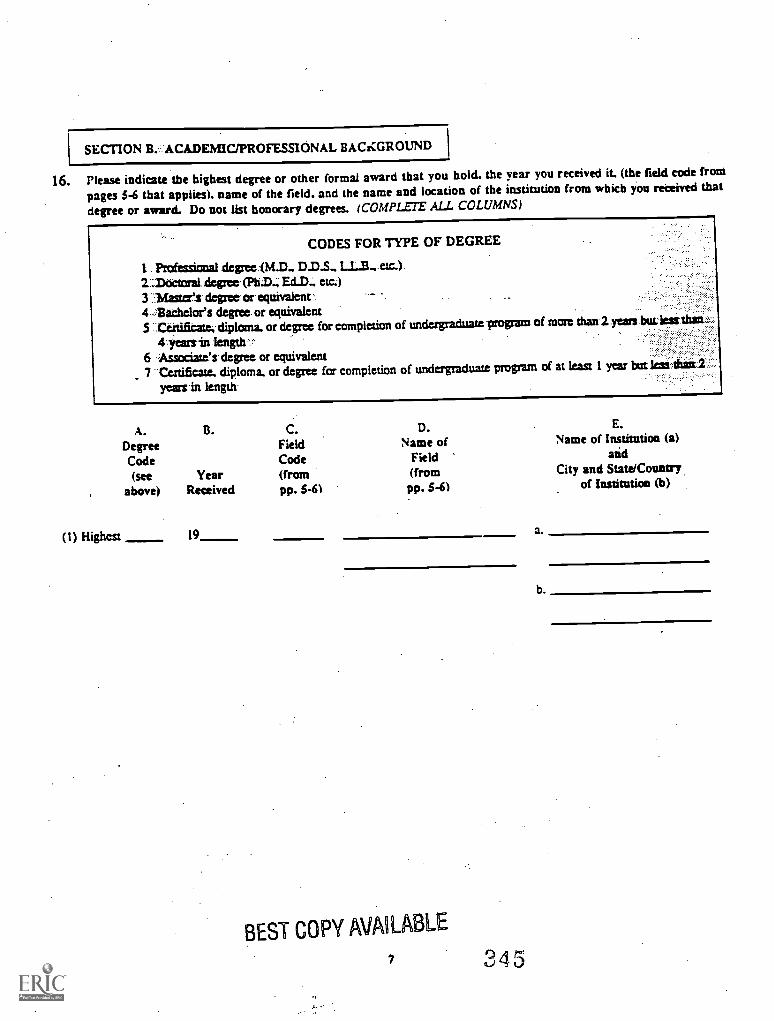
SECTION B. ACADEIVIIC/PROFESSIONAL BACICGROUND
16. Please indicate the highest degree or other formal award that you hold. the year you received it. (the field code from
pages 5-6 that applies). name of the field. and the name and location of the institution from which you received that
degree or award. Do not list honorary degrees. (COMPLETE ALL COLUMNS)
CODES FOR TYPE OF DEGREE
1. Professional degree:(M.D.. D.D.S.. LLB- etc.)2::Thittoral degree.(PILD.; Ed1).; etc:)3 ..:Mastees degree or equivalent4 .13aChelor's degree or equivalent
.
5 ::Cettifii:ate; diploma. or degree for completion of undergraduate program of mom than 2 years:balearthatt.::::::
4.yearsin length6 Associate's degree or equivalent7 Certificate. diploma, or degree for completion of undergraduate program of at least 1 year but Itnithatt2 .
years in length
A. B. C. D. E.
Degree Field Name of Name of Institution (a)
Code Code Field and
(see Year (from (from City and State/Country
above) Received pp. 5-6) pp. 5-6) of Institution (b)
(1) Highest_ 19
BEST COPY AVAILABLE
7 345
a.
b.
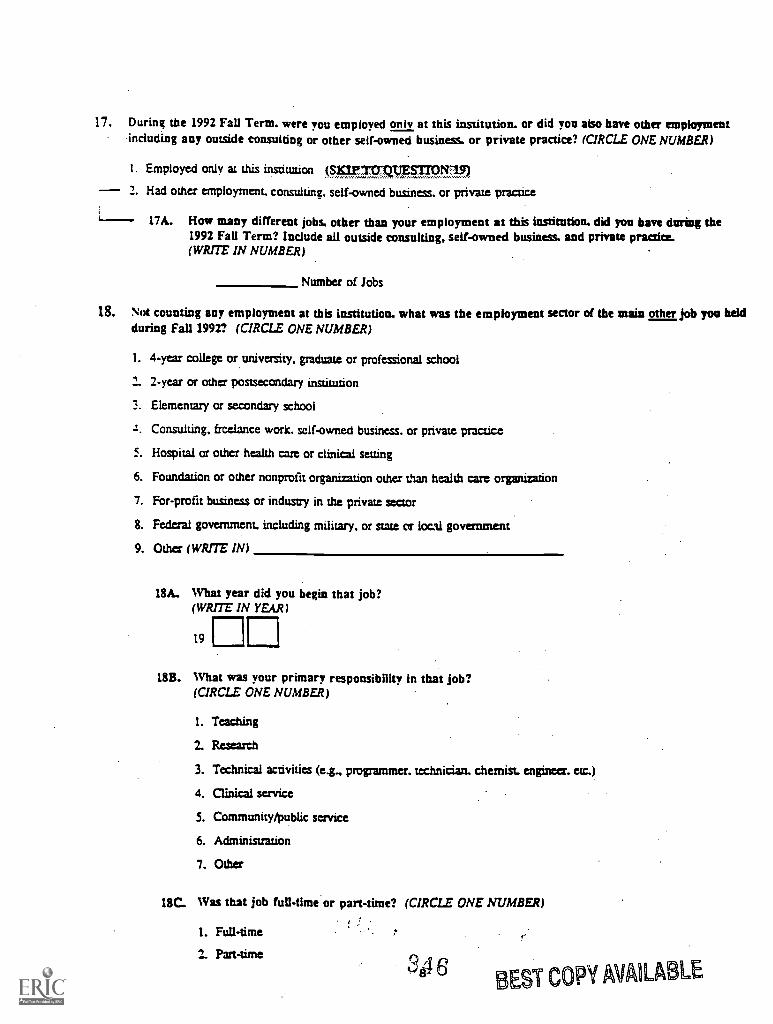
17. During the 1992 Fall Term, were you employed only at this institution. or did you also have other employmentincluding any outside consulting or other self-owned business. or private practice? (CIRCLE ONE NUMBER)
I. Employed only at this institution (sw:romp.E_supym2. Had other employment, consulting, self-owned business, or private practice
17A. How many different jobs. other than your employment at this institution. did you have during the1992 Fall Term? Include all outside consulting, self-owned business. and private practice.(WRITE IN NUMBER)
Number of Jobs
18. Not counting any employment at this institution. what was the employment sector of the main other job you heldduring Fall 1992? (CIRCLE ONE NUMBER)
1. 4-year college or university, graduate or professional school
2. 2-year or other postsecondary institution
3. Elementary or secondary school
.. Consulting. freelance work. self-owned business, or private practice
5. Hospital or other health care or clinical setting
6. Foundation or other nonprofit organization other than health care organization
7. For-profit business or industry in the private sector
8. Federal government, including military, or state or local government
9. Other (WRITE IN)
18A. What year did you begin that job?(WRITE IN YEAR)
19
18B. What was your primary responsibility in that job?(CIRCLE ONE NUMBER)
1. Teaching
2. Research
3. Technical activities (e.g., programmer. technician, chemist. engineer. etc.)
4. Clinical service
5. Community/public service
6. Administration
7. Other
IBC. Was that job full-time or part-time? (CIRCLE ONE NUMBER)
1. Full-time
2. Part-time
416 BEST COPY AVAILABLE
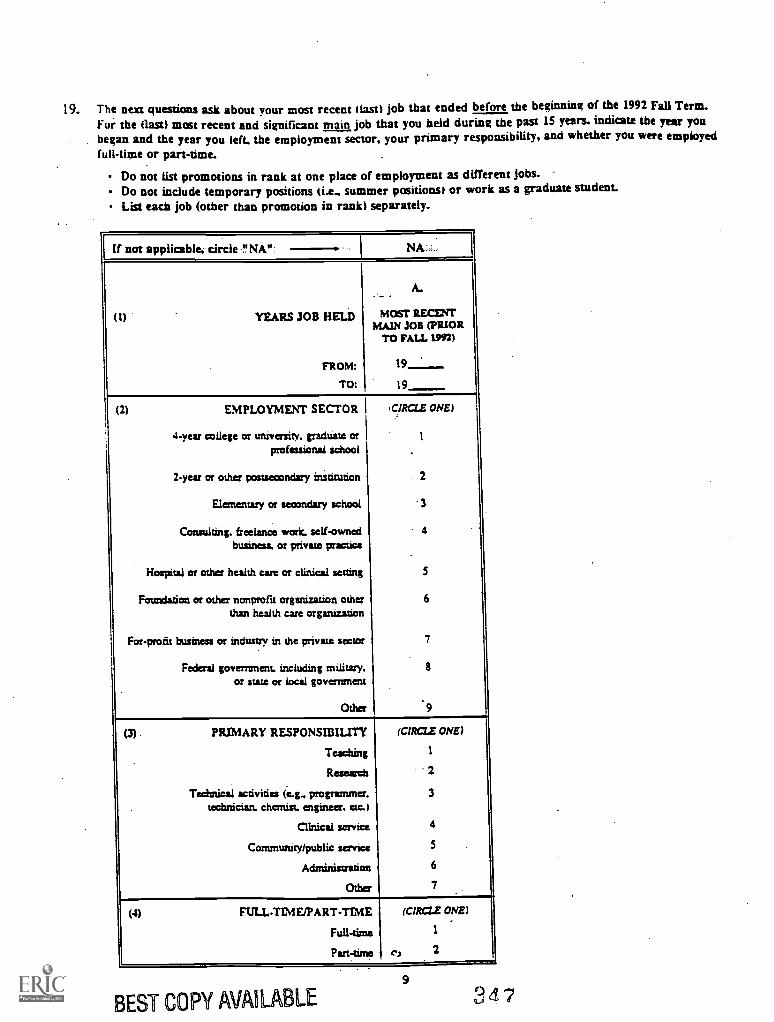
19. The next questions ask about your most recent ilast) job that ended before the beginning of the 1992 Fall Term.
Fur the (last) most recent and significant main job that you held during the past 15 years. indicate the year you
began and the year you left. the employment sector, your primary responsibility, and whether you were employed
full-time or part-time.
Do not list promotions in rank at one place of employment as different jobs.Do not include temporary positions (i.e., summer positions) or work as a graduate student.List each job (other than promotion in rank) separately.
If not applicable, circle "NA ":
(1) YEARS JOB HELD
FROM:
TO:
A.
MOST RECENTMAIN JOB (PRIOR
TO FALL 1992)
19
19
(2) EMPLOYMENT SECTOR
4-year college or university. graduate orprofessional school
2-year or other postsecondary institution
Elanenary or secondary school
Consulting, freelance work. self-ownedbusiness, or private practice
Hospital or other health care or clinical setting
Foundation or other nonprofit organization otherthan health care organization
For-protit business or industry in the private sector
Federal government. including military.or state or local government
Other
CIRCLE ONE)
1
2
.3
4
S
6
7
8
9
(3) PRIMARY RESPONSIBILITY
Teaching
Research
Technical activities (e.g.. Programer-technician. chemist. engineer. etc.)
Clinical service
Community/public service
Administration
Other
(CIRCLE ONE)
1
2
3
4
S
6
7
(4) FULL-TEMEJPART-TLME
Full-time
Part-time
(CIRCLE ONE)
1
e, 2
9
BEST COPY AVAILABLE 3 4 7
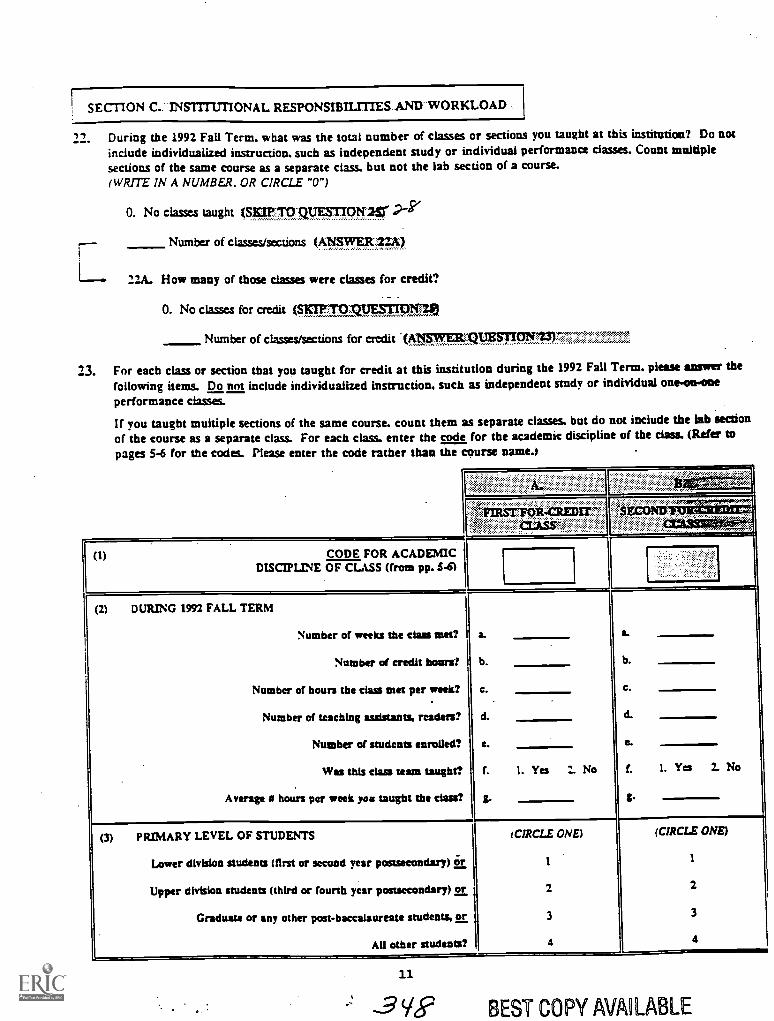
SECTION C. INSTITUTIONAL RESPONSIBILTTIES AND WORKLOAD
'1
L
During the 1992 Fall Term, what was the total number of classes or sections you taught at this institution? Do notinclude individualized instruction, such as independent study or individual performance classes. Count muldplesections of the same course as a separate class, but not the lab section of a course.(WRITE IN A NUMBER. OR CIRCLE "0")
0. No classes taught (nqrro.;Qvgsrrorr2Sr g-r/
Number of classes/sections (ANSWF4t2ZA)
22A. How many of those classes were classes for credit?
0. No classes for credit awrTovvrtsiw- zgia,,
Number of classes/sections for credit (ANSWER:QUESTI
23. For each class or section that you taught for credit at this institution during the 1992 Fall Term. please answer thefollowing items. Do not include individualized instruction, such as independent study or individual one-on-oneperformance classes.
If you taught multiple sections of the same course, count them as separate classes, but do not include the lab seaionof the course as a separate class. For each class, enter the code for the academic discipline of the class. (Refer to
pages 5-6 for the codes. Please enter the code rather than the course name.)
, "17IRSTTORCREDIT "S '''ECOND7611111E
. CLASS",
(1) CODE FOR ACADEMICDISCIPLINE OF CLASS (from pp. 5-61
(2) DURING 1992 FALL TERM
Number of weeks the class met?
Number of credit hours?
Number of hours the class met per week?
Number of teaching assistants, readers?
Number of students enrolled?
Was this class team taught?
Average I hours per week you taught the class?
1. Yes 2. No 1. Yes 2. No
(3) PRIMARY LEVEL OF STUDENTS
Lower division students (first or second year postsecondary) lir
Upper division students (third or fourth year postsecondary) or
Graduate or any other post-baccalaureate students, or
All other students?
(CIRCLE ONE)
2
3
4
(CIRCLE ONE)
1
2
3
4
11
BEST COPY AVAILABLE
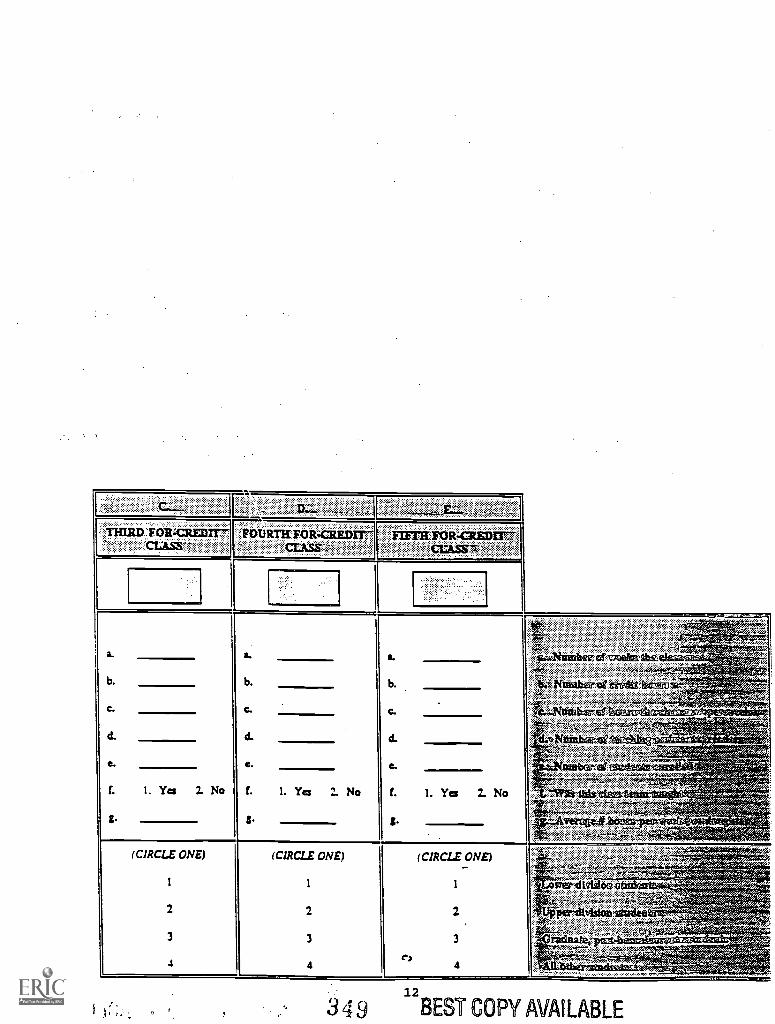
,:e. C...... " , > , ..., OM. ), . .. ,E. D'"".. , , ,
A. , ......0,,,,,A,),r1ILLI...4. .,... o.,....
.
THIRD FOR=CREDIT7CLASS"-
.FOURTILFOR=CREDIT-. CLASS s
)it. if,SXIEVCRED1:17"" CI ;AASVX
" ,.. . ,,,,,,,V.Z.,Y.Y.
' ,/,' Aller.ee
t4li' aifi0; ,
4,4-, , ,,,.., ,, , .:,..",*.(rititt: ''''''''''.1#''''',,,..."":
Ar.iNuattalref twills, .......- 'al', -4,,,:-..,/ rs
Y, , >,$".........,;leve..... .
tillibargif tdatirgio-,...-06* .y:#:.rx....:43;:"..' ..,/
... ..*" ,.. ..7iis" !:r. %L.!. ,a,X *. v..' ";'/'
..." , f., ' ...,...... / .... -',',A, ' "..'5%...?.. :":"..FT,
. b. b.
.
e. C. s ,p.. .., ...O.'. ..r....GeV, tYty. Z..
._ <
E ''''''17-7/)".t. '141"'"*",'''v."c.,D°::,,
4, .......a,-.,.;,:........ -,.., 41 ,
...V.,"41174# '' ..° ''e/ ,,...., .....,,...4........... a -4 , An. r...%,.. ... -..;
... . ... ^ - ........,..,:..f......
1. Yes 2. No
.
t. 1. Yes 2. No 1. Yes 2. No
(CIRCLE ONE)
2
3
4
(CIRCLE ONE)
1
2
3
4
(CIRCLE ONE)-1
2.
3
el
-, wAc,;-,.:',, zfk,,, -- ,= '", 13-1;"..a...
.-% A ,2..,'-c.../..,.<.4.,;.::::;;;;..,4;"..., s'..r,.. ,.. - -if:,werciLdake ? -..-, ,
___ ,,,,,,,,,,./.4....- ,......
.',.(.. -. 4,- x... ,-"-i?-...,..--, ..;.....).0 <4.0,...A,..' Y
.... '4,40
0.
.....x... , , ,,,', 4,,,,a..
aN ss..rarc«,,,g,,,, e4- t.:-....1- ,47, 1,1:4,L,..1re ... I . 444e:
Awb
12
BEST COPY NAB LABLE
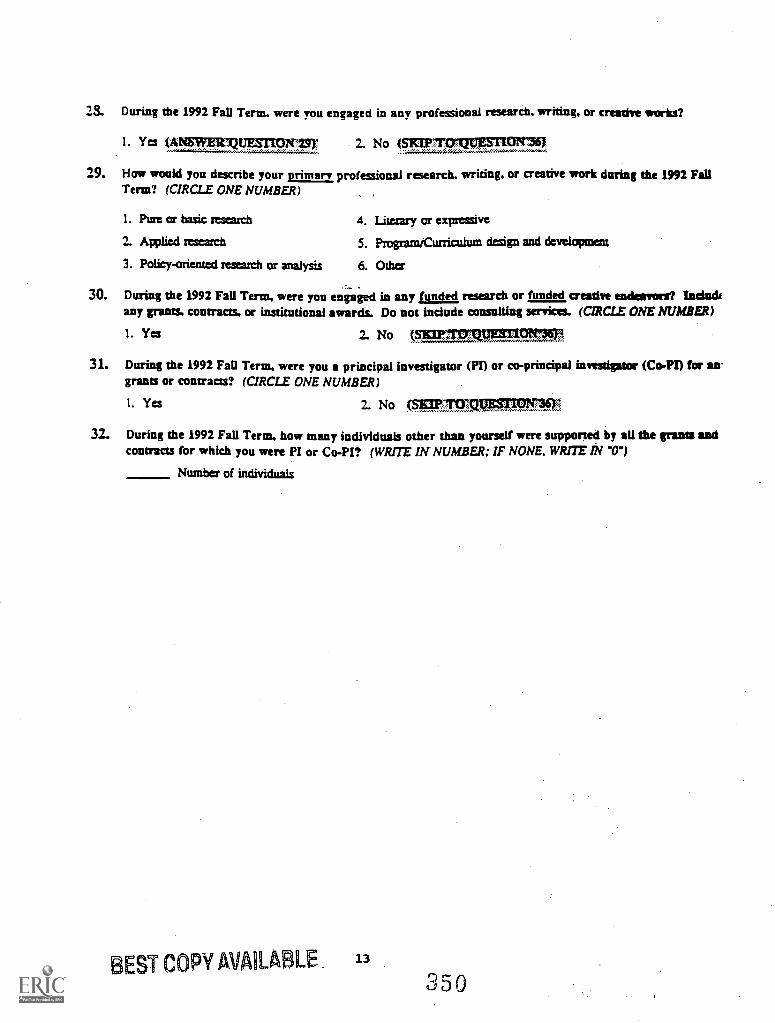
23. During the 1992 Fall Term. were you engaged in any professional research. writing, or creative works?
1. Yes (A NS1711.311.TESTION19) 2. No (SKIPT01713E711.weow .
29. How would you describe your primer., professional research. writing, or creative work during the 1992 FallTerm? (CIRCLE ONE NUMBER)
1. Pure or basic research
2. Applied research
3. Policy-oriented research or analysis
4. Literary or expressive
5. Program/Curriculum design and development
6. Other
30. During the 1992 Fall Term. were you engaged in any funded research or funded creative endeavors? Inctudiany grants, contracts, or institutional awards. Do not include consulting sei-VielS. (CIRCLE ONE NUMBER)
1. Yes 2. No papfrowsnowsw31. During the 1992 Fall Term, were you a principal investigator (PI) or co-principal investigator (Co-PI) for an
grants or contracts? (CIRCLE ONE NUMBER)
1. Yes 2. No ( 7QUESTIOIT36)
32. During the 1992 Fall Term. how many individuals other than yourself were supported by ail the grants andcontracts for which you were PI or Co-PI? (WRITE IN NUMBER: IF NONE. WRITE IV V")
Number of individuals
BEST COPY AVAILABLE. 13
350
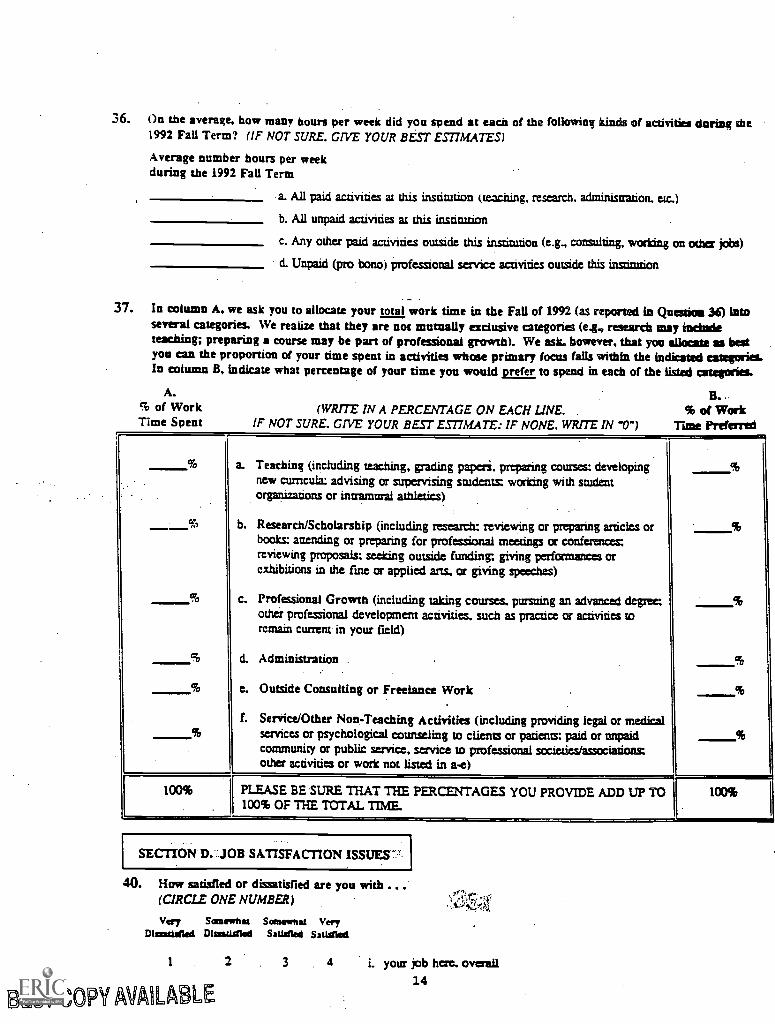
36. On the average, how many hours per week did you spend at each of the following kinds of activities during the1992 Fall Term? (IF NOT SURE. GIVE YOUR BEST ESTIMATES)
Average number hours per weekduring the 1992 Fall Term
-a. All paid act vides at this institution (teaching, research. administration. etc.)
b. All unpaid activities at this institution
c. Any other paid activities outside this institution (e.g., consulting, working on other jobs)
d. Unpaid (pro Bono) professional service activities outside this institution
. _37. In column A. we ask you to allocate your total work time in the Fall of 1992 (as reported in Question 36) Into
several categories. We realize that they are not mutually exclusive categories (e.g., research may includeteaching; preparing a course may be part of professional growth). We ask. however. that you allocate as bestyou can the proportion of your time spent in activities whose primary focus falls within the indicated categories.In column B, indicate what percentage of your time you would prefer to spend in each of the listed categories.
A.% of WorkTime Spent
(WRITE IN A PERCENTAGE ON EACH LINE.IF NOT SURE. GIVE YOUR BEST ESTIMATE: IF NONE. WRITE IN "0")
°o
a. Teaching (including teaching, grading papai. preparing courses: developingnew curricula: advising or supervising students; working with studentorganizations or intramural aihlr-tif-s)
b. Research/Scholarship (including research: reviewing or preparing articles orbooks: attending or preparing for professional meetings or conference=reviewing proposals: seeking outside funding: giving performances orexhibitions in the fine or applied arts, or giving speeches)
c. Professional Growth (including taking courses. pursuing an advanced degree:other professional development activities, such as practice or activities toremain current in your field)
d. Administration
e. Outside Consulting or Freelance Work
f. Service/Other Non-Teaching Activities (including providing legal or medicalservices or psychological counseling to clients or patients: paid or unpaidcommunity or public service, service to professional societies/associationsother activities or work not listed in a-e)
100% PLEASE BE SURE THAT THE PERCENTAGES YOU PROVIDE ADD UP TO100% OF THE TOTAL TIME
SECITON D. JOB SATISFACTION ISSUES::
40. How satisfied or dissatisfied are you with ...(CIRCLE ONE NUMBER)
Very Somewhat Seesawing VeryDimatistled DIssaddled Satisfied Satisfied
I 2 3 4 i. your job here. overall14
BEST COPY MAILABLE
B.% of Work
Time Preferred
100%
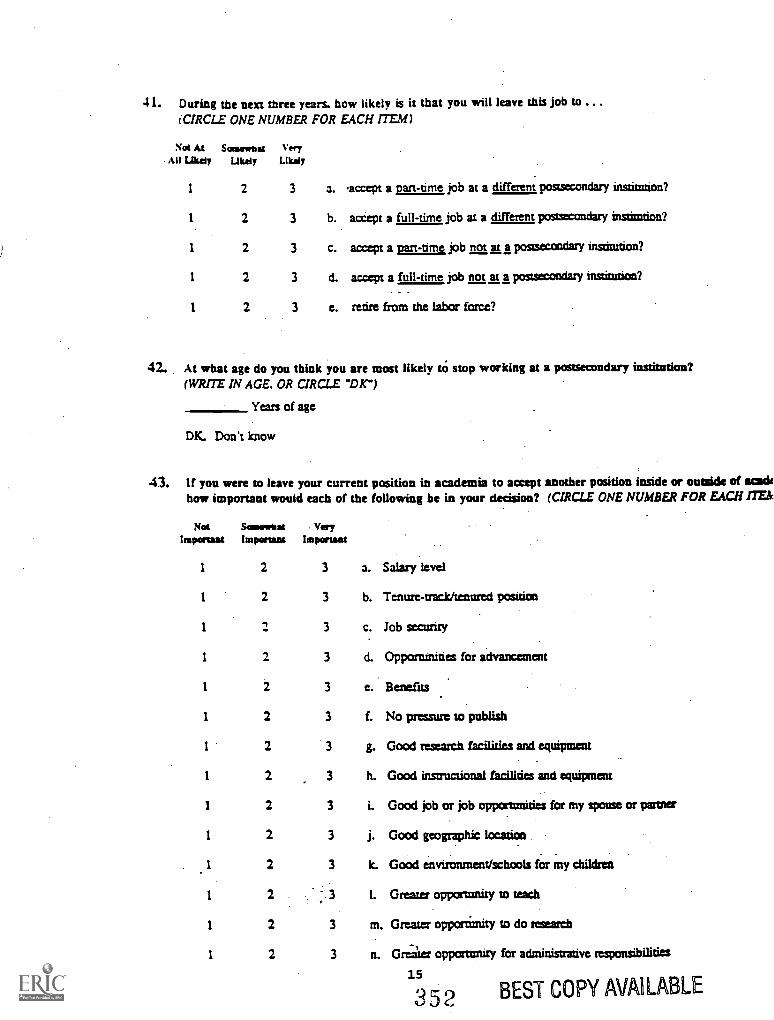
41. During the next three years. how likely is it that you will leave this job to ...(CIRCLE ONE NUMBER FOR EACH ITEM)
Not AtAll Lady
ScesewomUkely
VeryLikely
1 2 3 a.
1 2 3 b.
1 2 3 c.
1 2 3 d.
1 2 3 e.
accept a part-time job at a different postsecondary institution?
accept a full-time job at a different postsecondary instimtion?
accept a part-time job not at a postsecondary institution?
accept a full-time job not at a postsecondary institution?
retire from the labor force?
42.. At what age do you think you are most likely to stop working at a postsecondary institution?(WRITE IN AGE. OR CIRCLE "DK")
Years of age
DK Don't know
43. If you were to leave your current position in academia to accept another position inside or outside of sockhow important would each of the following be in your decision? (CIRCLE ONE NUMBER FOR EACH 17E&
NotImportant
1
1
1
SamewlatImportant
2
2
2 -
2
VeryImportant
3
3
3
3
a. Salary level
b. Tenure-trarJc/tenured position
c. Job security
d. Opportunities for advancement
1 2 3 e. Benefits
1 2 3 1. No pressure to publish
1 2 3 g. Good research facilities and equipment
1 2 3 h. Good instructional facilities and equipment
1 2 3 i. Good job or job opporumities for my spouse or partner
1 2 3 j. Good geographic location
1 2 3 k. Good enviromnern/schoob for my children
1 2 ,' 3 I. Greater opportunity to teach
1 2 3 m. Greater opportunity to do research
1 2 3 T1. Creme' r opportunity for administrative responsibilities
15
3 5 2 BEST COPY AVAILABLE
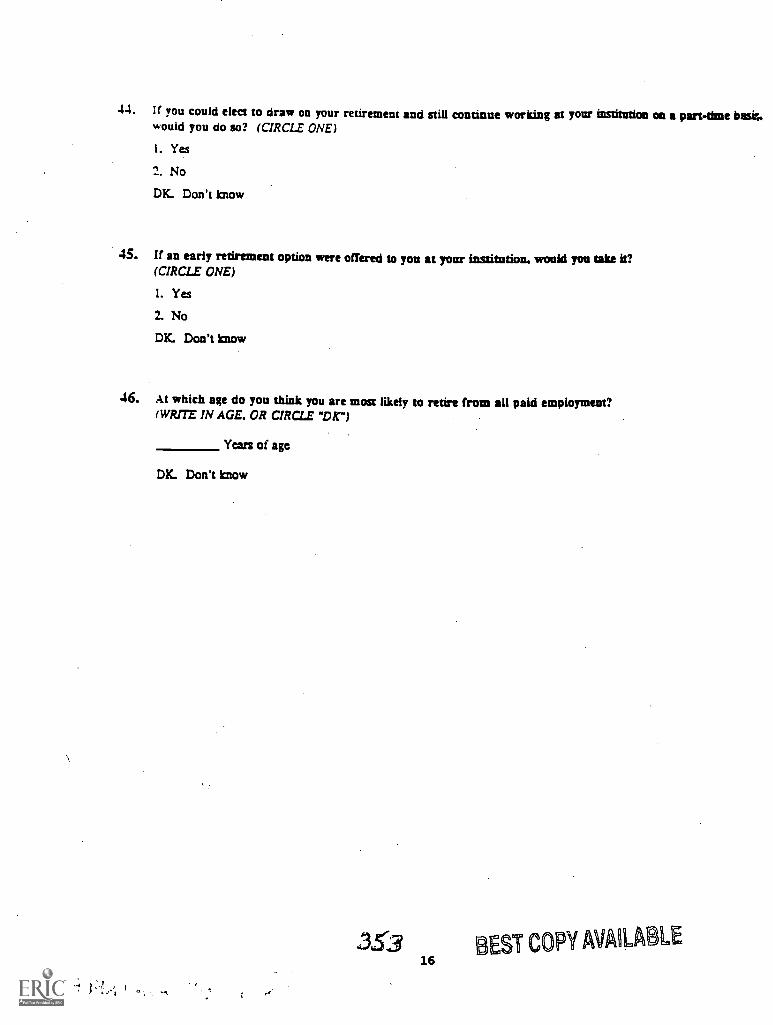
44. 1f you could elect to draw on your retirement and still continue working at your institution on a part-time basn,would you do so? (CIRCLE ONE)
1. Yes
2. No
DK. Don't know
45. If an early retirement option were offered to you at your institution. would Tea take it?(CIRCLE ONE)
1. Yes
2. No
DK. Don't know
46. At which age do you think you are most likely to retire from all paid employment?(WRITE IN AGE. OR CIRCLE "DK")
Years of age
DK. Don't know
353 BEST COPY AVAILABLE16
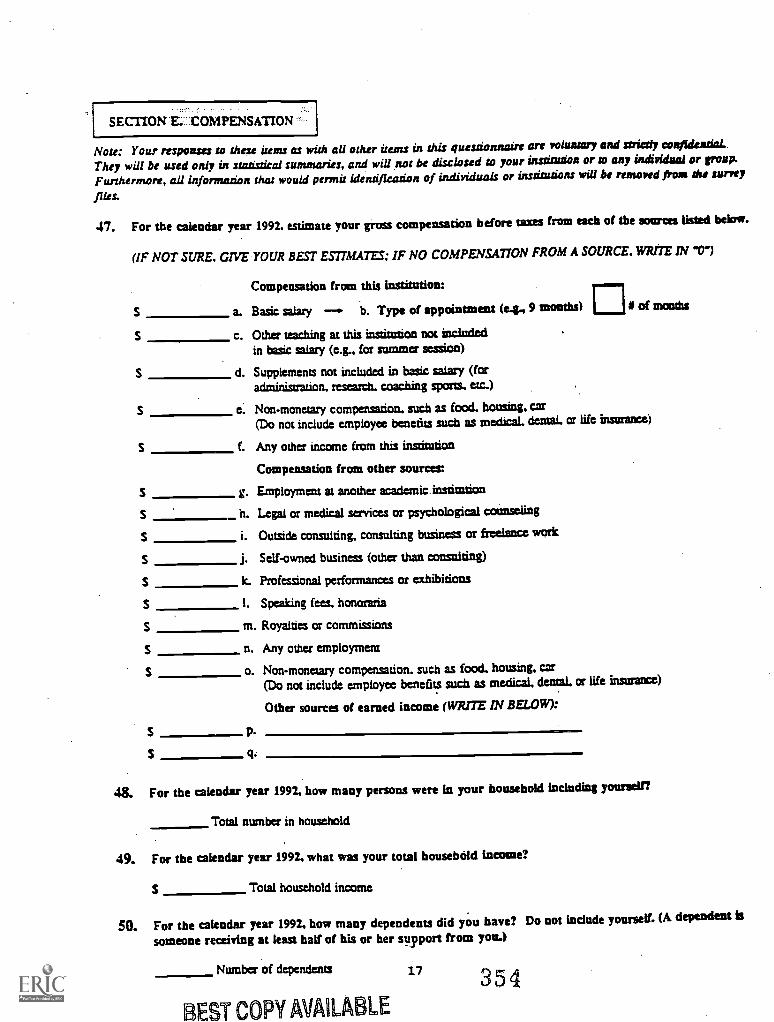
SECTION E: `:COMPENSATION
Nou: Your responses to these items as wuh all other items in this questionnaire are voluntary and strictly confidential.
They will be used only in statistical summaries, and will not be disclosed to your institution or to any individual or group.
Furthermore, all information that would permit identification of individuals or institutions will be removed from the surrey
files.
47. For the calendar year 1992. estimate your gross compensation before taxes from each of the sowers listed below.
(IF NOT SURE. GIVE TOUR BEST ESTIMATES: IF NO COMPENSATION FROM A SOURCE. WRITE IN '01
Compensation from this Institution:
S a. Basic salary b. Type of appointment (e.g, 9 mouths) I of months
S c. Other teaching at this institution not includedin basic salary (e.g., for summer session)
S d. Supplements not included in basic salary (foradministration. research. coaching sports. etc.)
S e: Non-monetary compensation. such as food. housing. car(Do not include employee benefits such as medical. dental. or life insurance)
S f. Any other income from this institution
Compensation from other sources:
S g. Employment at another academic.insdrution
n. Legal or medical services or psychological counseling
S i. Outside consulting, consulting business or freelance work
S j. Self-owned business (other than consulting)
S k. Professional performances or exhibitions
S I. Speaking fees. honoraria
S m. Royalties or commissions
n. Any other employment
5 o. Non-monetary compensation. such as food. housing, car(Do not include employee benefits such as medical. dental. or life insurance)
Other sources of earned income (WRITE IN BELOW):
p.
9.
48. For the calendar year 1992, how many persons were in your household including yourself?
Total number in household
49. For the calendar year 1992, what was your total household income?
S Total household income
50. For the calendar year 1992, how many dependents did you have? Do not include yourself. (A dependent is
someone receiving at least half of his or her support from you.)
Number of dependents
REST COPY MAILABLE
17 354
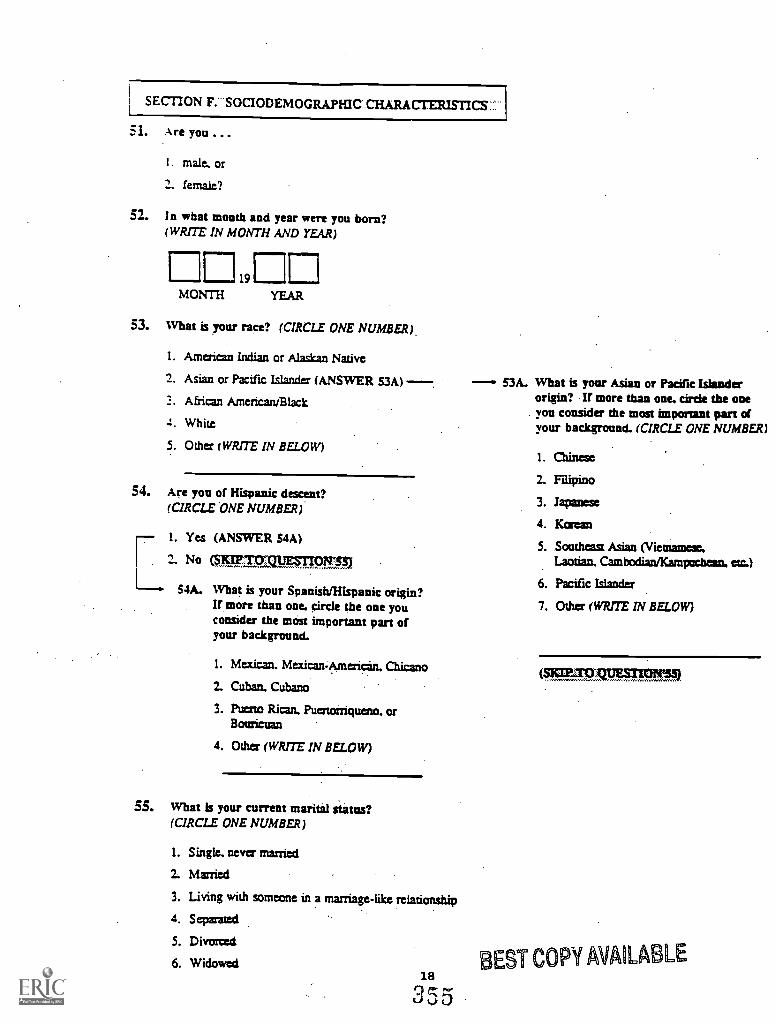
SECTION F. SOCIODEMOGRAPHIC CHARACTERISTICS:"
51. Are you ...
I. male, or
2. female?
52. In what month and year were you born?(WRITE IN MONTH AND YEAR)
MONTH19
YEAR
53. What is your race? (CIRCLE ONE NUMBER).
1. American Indian or Alaskan Native
2. Asian or Pacific Islander (ANSWER 53A)
3. African American/Black
4. White
5. Other (WRITE IN BELOW)
54. Are you of Hispanic descent?(CIRCLE ONE NUMBER)
1. Yes (ANSWER S4A)
I 1 No (SFWTcYCLITs17.P.Wg.)
L_. S4A. What is your Spanish/Hispanic origin?If more than one. circle the one youconsider the most important part ofyour background.
1. Mexican. Mexican-American. Chicano
2. Cuban. Cuban
3. Puerto Rican. Puermariqueno, orBouricuan
4. Other (WRITE IN BELOW)
55. What is your current marital status?(CIRCLE ONE NUMBER)
1. Single, never married
2. Married
3. Living with someone in a marriage-like relationship
4. Separated
5. Divorced
6. Widowed
- 53A. What is your Asian or Pacific Islanderorigin? If more than one. cirde the oneyou consider the most important part ofyour background. (CIRCLE ONE NUMBER)
1. Chinese
2. Filipino
3. Japanese
4. Korean
5. Southeast Asian (Vietnamese.Laotian. Cambodian/Kampuchean. etc.)
6. Pacific Islander
7. Other (WRITE IN BELOW)
BEST COPY AVAILABLE18
355
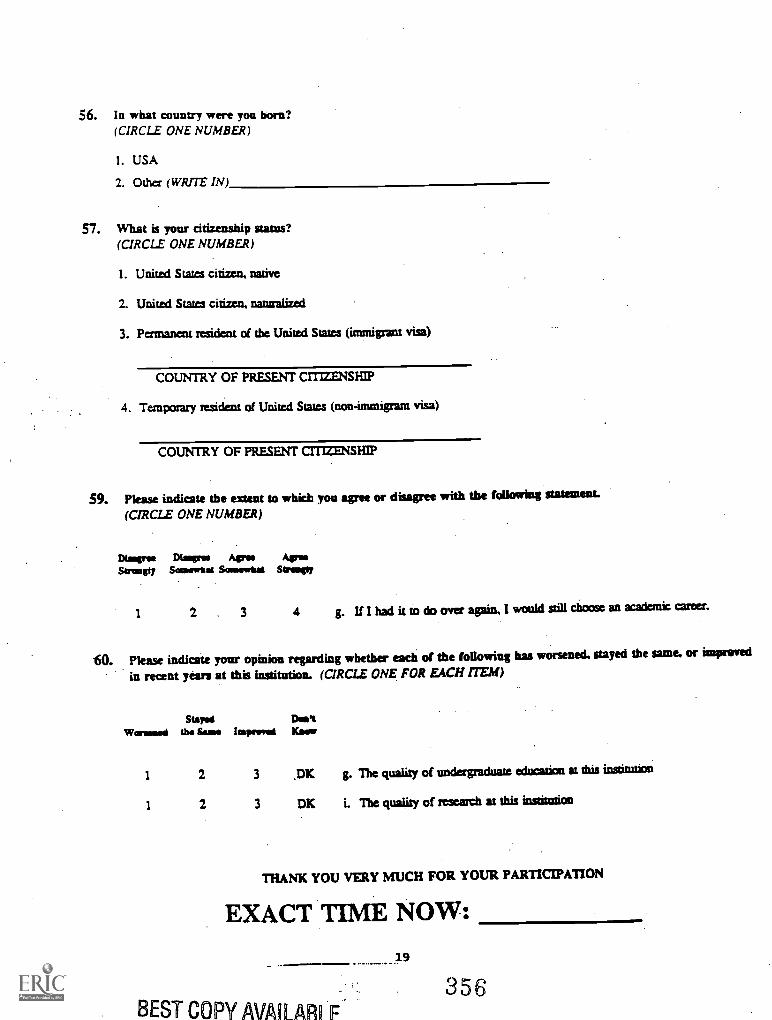
56. In what country were you born?(CIRCLE ONE NUMBER)
1. USA
2. Other (WRITE IN)
57. What is your citizenship status?(CIRCLE ONE NUMBER)
1. United States citizen, native
2. United States citizen, nanualized
3. Permanent resident of the United States (immigrant visa)
COUNTRY OF PRESENT CITIZENSHIP
4. Temporary resident of United States (non-immigrant visa)
COUNTRY OF PRESENT crnzarste
59. Please indicate the extent to which you agree or disagree with the following statement.
(CIRCLE ONE NUMBER)
Disagree Magni Agra Agree
Strangty Somme* Seenewiat Strongly
1 2 3 4 g. If I had it to do over again, I would still choose an academic career.
60. Please indicate your opinion regarding whether each of the following has worsened. stayed the same. or improved
in recent years at this institution. (CIRCLE ONE FOR EACH ITEM)
Stayed Den%
Worsened the Same Imperil" Kam
1 2 3 ,DK g. The quality of undergraduate education at this institution
1 2 3 DK i. The quality of research at this insnmdon
THANK YOU VERY MUCH FOR YOUR PARTICIPATION
EXACT TIME NOW:
19
BEST Copy AVAftAR F356
1993 National Study of Postsecondary FacultyMethodology Report
Appendix I
Critical Items and Nonresponse:1993 NSOPF Faculty Questionnaire
Item Nonresponse Rates: Critical Items
Item Nonresponse Rates: Total RespondentsItem Nonresponse Rates Greater Than 10 Percent
Item Nonresponse Rates for Total Respondents, Sorted by Rate
Item Nonresponse Rates: SAQ RespondentsItem Nonresponse Rates Greater Than 10 Percent (SAQ)
Item Nonresponse Rates for SAQ Respondents, Sorted by Rate
Item Nonresponse Rates: CATI RespondentsItem Nonresponse Rates Greater Than 10 Percent (CATI)
Item Nonresponse Rates for CATI Respondents, Sorted by Rate
357
1993 National Study of Postsecondary FacultyMethodology Report
Item Nonresponse Rates: Critical Items
35.
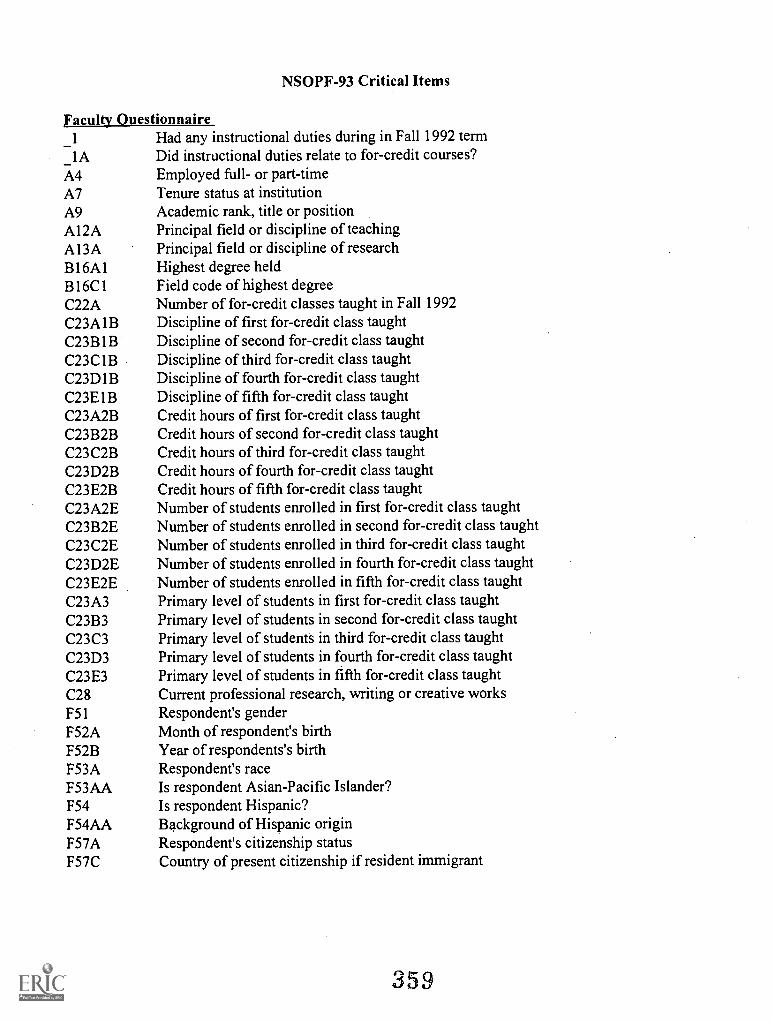
NSOPF-93 Critical Items
Faculty Ouestionnaire1 Had any instructional duties during in Fall 1992 termIA Did instructional duties relate to for-credit courses?
A4 Employed full- or part-timeA7 Tenure status at institutionA9 Academic rank, title or positionAl2A Principal field or discipline of teachingAI3A Principal field or discipline of researchB16A1 Highest degree heldBI6C1 Field code of highest degreeC22A Number of for-credit classes taught in Fall 1992C23AIB Discipline of first for-credit class taughtC23B1B Discipline of second for-credit class taughtC23C1B Discipline of third for-credit class taughtC23D1B Discipline of fourth for-credit class taughtC23E1B Discipline of fifth for-credit class taughtC23A2B Credit hours of first for-credit class taughtC23B2B Credit hours of second for-credit class taughtC23C2B Credit hours of third for-credit class taughtC23D2B Credit hours of fourth for-credit class taughtC23E2B Credit hours of fifth for-credit class taughtC23A2E Number of students enrolled in first for-credit class taughtC23B2E Number of students enrolled in second for-credit class taughtC23C2E Number of students enrolled in third for-credit class taughtC23D2E Number of students enrolled in fourth for-credit class taughtC23E2E Number of students enrolled in fifth for-credit class taughtC23A3 Primary level of students in first for-credit class taughtC23B3 Primary level of students in second for-credit class taughtC23C3 Primary level of students in third for-credit class taughtC23D3 Primary level of students in fourth for-credit class taughtC23E3 Primary level of students in fifth for-credit class taughtC28 Current professional research, writing or creative worksF51 Respondent's genderF52A Month of respondent's birthF52B Year of respondents's birthF53A Respondent's raceF53AA Is respondent Asian-Pacific Islander?F54 Is respondent Hispanic?F54AA Background of Hispanic originF57A Respondent's citizenship statusF57C Country of present citizenship if resident immigrant
359
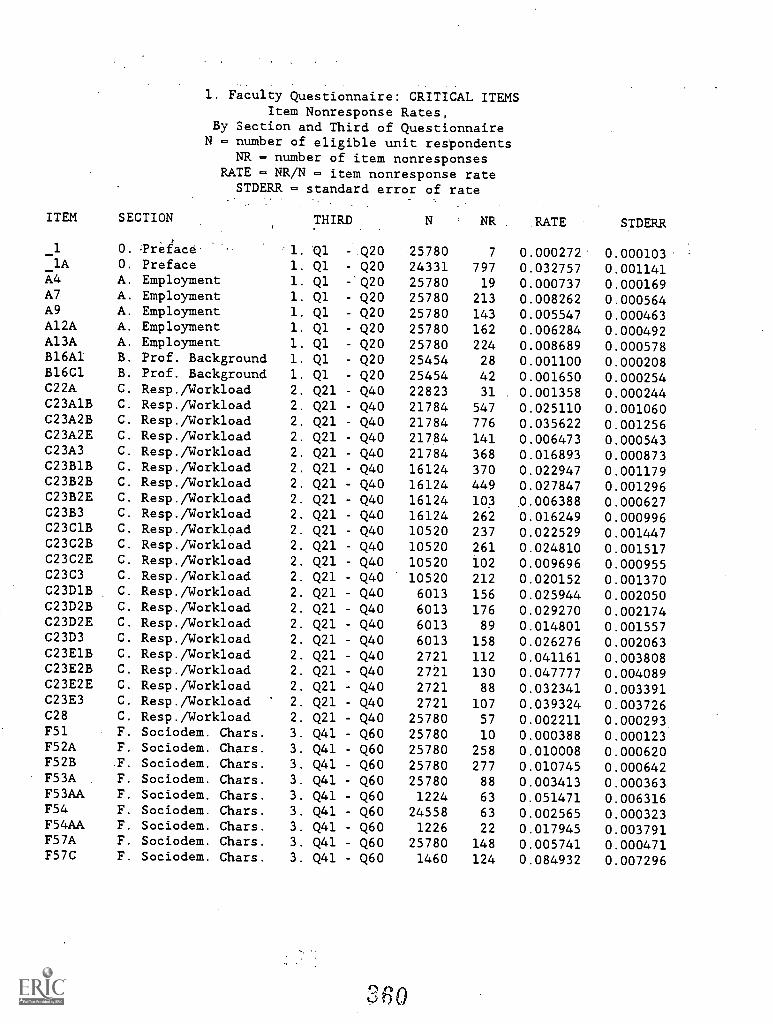
1. Faculty Questionnaire: CRITICAL ITEMSItem Nonresponse Rates,
By Section and Third of QuestionnaireN = number of eligible unit respondents
NR - number of item nonresponsesRATE - NR/N - item nonresponse rate
STDERR - standard error of rate
ITEM SECTION THIRD N NR .RATE STDERR
1 O. Treiace. 1. Q1 - Q20 25780 7 0.000272 0.000103lA O. Preface 1. Ql - Q20 24331 797 0.032757 0.001141
A4 A. Employment 1. Ql -'Q20 25780 19 0.000737 0.000169A7 A. Employment 1. Ql - Q20 25780 213 0.008262 0.000564A9 A. Employment 1. Q1 - Q20 25780 143 0.005547 0.000463Al2A A. Employment 1. Ql - Q20 25780 162 0.006284 0.000492A13A A. Employment 1. Ql - Q20 25780 224 0.008689 0.000578B16A1 B. Prof. Background 1. Ql - Q20 25454 28 0.001100 0.000208B16C1 B. Prof. Background 1. Ql - Q20 25454 42 0.001650 0.000254C22A C. Resp./Workload 2. Q21 - Q40 22823 31 0.001358 0.000244C23A1B C. Resp./Workload 2. Q21 - Q40 21784 547 0.025110 0.001060C23A2B C. Resp./Workload 2. Q21 - Q40 21784 776 0.035622 0.001256C23A2E C. Resp./Workload 2. Q21 - Q40 21784 141 0.006473 0.000543C23A3 C. Resp./Workload 2. Q21 - Q40 21784 368 0.016893 0.000873C23B1B C. Resp./Workload 2. Q21 - Q40 16124 370 0.022947 0.001179C23B2B C. Resp./Workload 2. Q21 - Q40 16124 449 0.027847 0.001296C23B2E C. Resp./Workload 2. Q21 - Q40 16124 103 0.006388 0.000627C23B3 C. Resp./Workload 2. Q21 - Q40 16124 262 0.016249 0.000996C23C1B C. Resp./Workload 2. Q21 - Q40 10520 237 0.022529 0.001447C23C2B C. Resp./Workload 2. Q21 - Q40 10520 261 0.024810 0.001517C23C2E C. Resp./Workload 2. Q21 - Q40 10520 102 0.009696 0.000955C23C3 C. Resp./Workload 2. Q21 - Q40 10520 212 0.020152 0.001370C23D1B C. Resp./Workload 2. Q21 - Q40 6013 156 0.025944 0.002050C23D2B C. Resp./Workload 2. Q21 - Q40 6013 176 0.029270 0.002174C23D2E C. Resp./Workload 2. Q21 - Q40 6013 89 0.014801 0.001557C23D3 C. Resp./Workload 2. Q21 - Q40 6013 158 0.026276 0.002063C23E1B C. Resp./Workload 2. Q21 - Q40 2721 112 0.041161 0.003808C23E2B C. Resp./Workload 2. Q21 - Q40 2721 130 0.047777 0.004089C23E2E C. Resp./Workload 2. Q21 - Q40 2721 88 0.032341 0.003391C23E3 C. Resp./Workload 2. Q21 - Q40 2721 107 0.039324 0.003726C28 C. Resp./Workload 2. Q21 - Q40 25780 57 0.002211 0.000293F51 F. Sociodem. Chars. 3. Q41 - Q60 25780 10 0.000388 0.000123F52A F. Sociodem. Chars. 3. Q41 - Q60 25780 258 0.010008 0.000620F52B F. Sociodem. Chars. 3. Q41 - Q60 25780 277 0.010745 0.000642F53A F. Sociodem. Chars. 3. Q41 - Q60 25780 88 0.003413 0.000363F53AA F. Sociodem. Chars. 3. Q41 - Q60 1224 63 0.051471 0.006316F54 F. Sociodem. Chars. 3. Q41 - Q60 24558 63 0.002565 0.000323F54AA F. Sociodem. Chars. 3. Q41 - Q60 1226 22 0.017945 0.003791F57A F. Sociodem. Chars. 3. Q41 - Q60 25780 148 0.005741 0.000471F57C F. Sociodem. Chars. 3. Q41 - Q60 1460 124 0.084932 0.007296
60
1993 National Study of Postsecondary FacultyMethodology Report
Item Nonresponse Rates: Total RespondentsItem Nonresponse Rates Greater Than 10 Percent
Item Nonresponse Rates for Total Respondents, Sorted by Rate
361
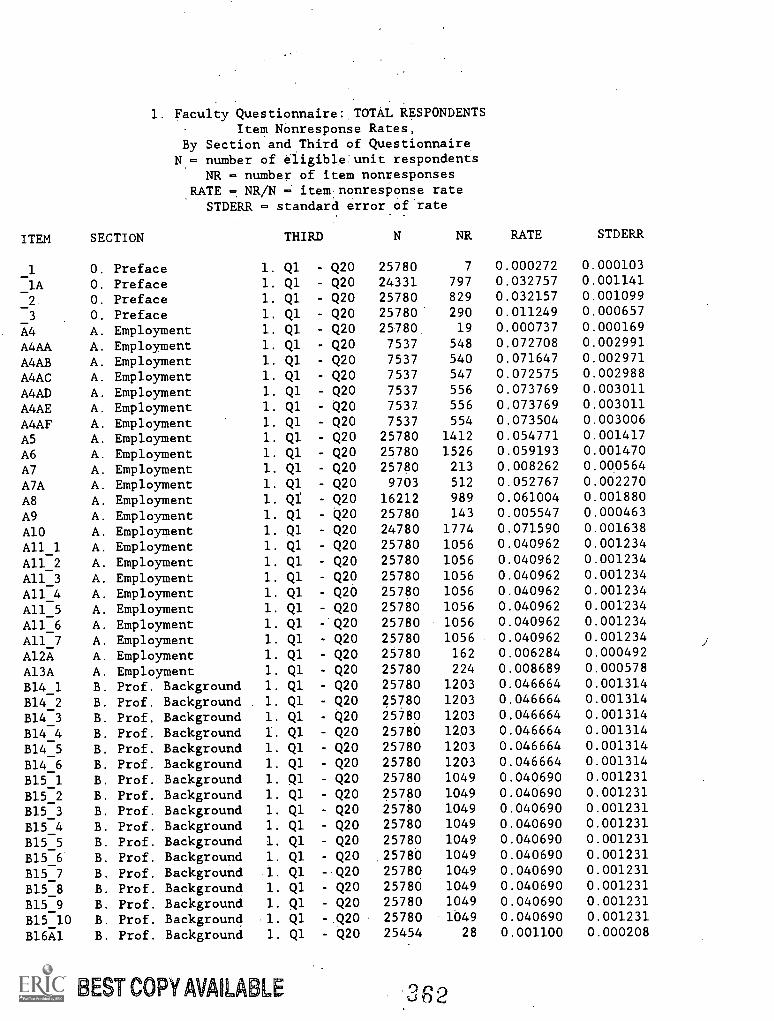
1. Faculty Questionnaire:JOTAL RESPONDENTSItem Nonresponse Rates,
By Section and Third of QuestionnaireN= number of iiigible:unit respondents
NR = number of item nonresponsesRATE NR/N itemnonresPonse rate
STDERR = standard error of rate
ITEM SECTION THIRD N NR RATE STDERR
1 O. Preface 1. Ql - Q20 25780 7 0.000272 0.000103
lA O. Preface 1. Ql - Q20 24331 797 0.032757 0.001141
2 O. Preface 1. Ql - Q20 25780 829 0.032157 0.001099
3 O. Preface 1. Q1 - Q20 25780 290 0.011249 0.000657
A4 A. Employment 1. Q1 - Q20 25780 19 0.000737 0.000169
A4AA A. Employment 1. Ql - Q20 7537 548 0.072708 0.002991
A4AB A. Employment 1. Q1 - Q20 7537 540 0.071647 0.002971
A4AC A. Employment 1. Q1 - Q20 7537 547 0.072575 0.002988
A4AD A. Employment 1. Ql - Q20 7537 556 0.073769 0.003011
A4AE A. Employment 1. Q1 - Q20 7537 556 0.073769 0.003011
A4AF A. Employment 1. Ql - Q20 7537 554 0.073504 0.003006
A5 A. Employment 1. Ql - Q20 25780 1412 0.054771 0.001417
A6 A. Employment 1. Ql - Q20 25780 1526 0.059193 0.001470
A7 A. Employment 1. Ql - Q20 25780 213 0.008262 0.000564
A7A A. Employment 1. Ql - Q20 9703 512 0.052767 0.002270
A8 A. Employment 1. Q1 - Q20 16212 989 0.061004 0.001880
A9 A. Employment 1. Ql - Q20 25780 143 0.005547 0.000463
A10 A. Employment 1. Ql - Q20 24780 1774 0.071590 0.001638
All 1 A. Employment 1. Q1 - Q20 25780 1056 0.040962 0.001234
A11_2 A. Employment 1. Ql - Q20 25780 1056 0.040962 0.001234
A11_3 A. Employment 1. Q1 - Q20 25780 1056 0.040962 0.001234
A11_4 A. Employment 1. Q1 - Q20 25780 1056 0.040962 0.001234
A11_5 A. Employment 1. Q1 - Q20 25780 1056 0.040962 0.001234
A11_6 A. Employment 1. Ql - Q20 25780 1056 0.040962 0.001234
A11_7 A. Employment 1. Ql - Q20 25780 1056 0.040962 0.001234
Al2A A. Employment 1. Q1 - Q20 25780 162 0.006284 0.000492
A13A A. Employment 1. Ql - Q20 25780 224 0.008689 0.000578
B14_1 B. Prof. Background 1. Q1 - Q20 25780 1203 0.046664 0.001314
B142 B. Prof. Background 1. Ql - Q20 25780 1203 0.046664 0.001314
B14:3 B. Prof. Background 1. Q1 - Q20 25780 1203 0.046664 0.001314
B14_4 B. Prof. Background 1. Q1 - Q20 25780 1203 0.046664 0.001314
B145 B. Prof. Background 1. Q1 - Q20 25780 1203 0.046664 0.001314
B14:6 B. Prof. Background 1. Ql - Q20 25780 1203 0.046664 0.001314
B15_1 B. Prof. Background 1. Q1 - Q20 25780 1049 0.040690 0.001231
B15_2 B. Prof. Background 1. Q1 - Q20 25780 1049 0.040690 0.001231
B15_3 B. Prof. Background 1. Ql - Q20 25780 1049 0.040690 0.001231
B15_4 B. Prof. Background 1. Q1 - Q20 25780 1049 0.040690 0.001231
B15_5 B. Prof. Background 1. Q1 - Q20 25780 1049 0.040690 0.001231
B15_6 B. Prof. Background 1. Ql - Q20 25780 1049 0.040690 0.001231
B15:7 B. Prof. Background 1. Ql - Q20 25780 1049 0.040690 0.001231
B15_8 B. Prof. Background 1. Q1 - Q20 25780 1049 0.040690 0.001231
B15_9 B. Prof. Background 1. Ql - Q20 25780 1049 0.040690 0.001231
B15_10 B. Prof. Background 1. Q1 -.Q20 25780 1049 0.040690 0.001231
B16A1 B. Prof. Background 1. Q1 - Q20 25454 28 0.001100 0.000208
BEST COPY AVADLA tit LE 362
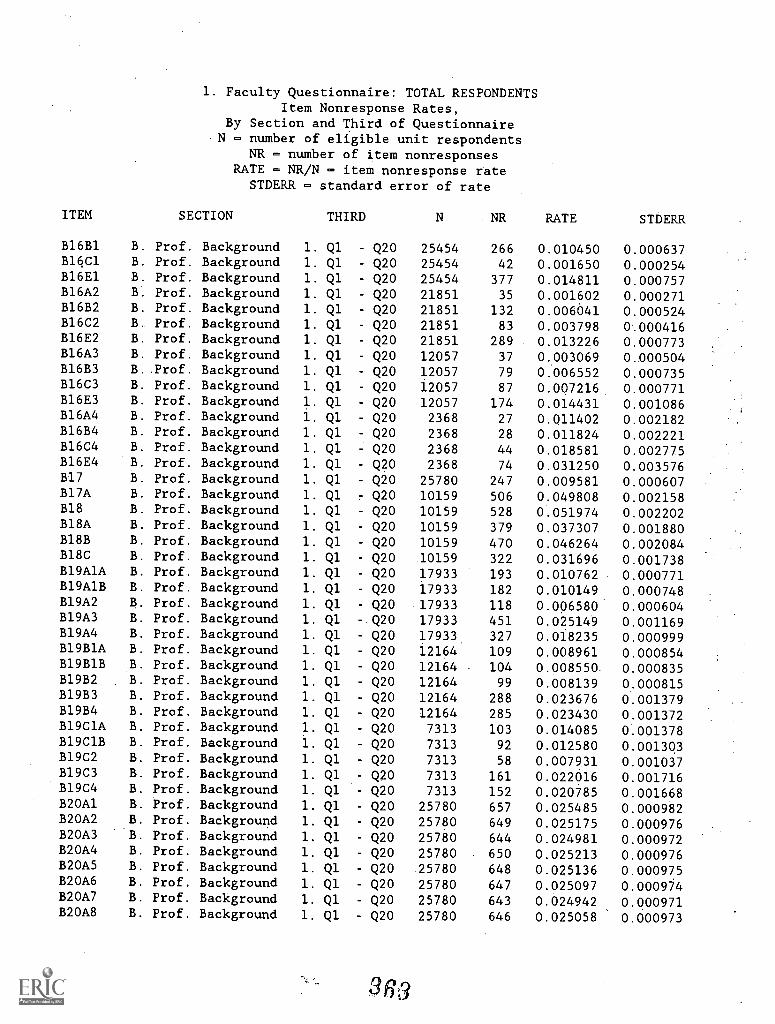
1. Faculty Questionnaire: TOTAL RESPONDENTSItem Nonresponse Rates,
By Section and Third of Questionnaire.N - number of eligible unit respondents
NR = number of item nonresponsesRATE = NR/N - item nonresponse rate
STDERR - standard error of rate
ITEM SECTION THIRD N NR RATE STDERR
B16B1 B. Prof. Background 1. Ql - Q20 25454 266 0.010450 0.000637B16C1 B. Prof. Background 1. Ql - Q20 25454 42 0.001650 0.000254B16E1 B. Prof. Background 1. Ql - Q20 25454 377 0.014811 0.000757B16A2 B. Prof. Background 1. Ql - Q20 21851 35 0.001602 0.000271B16B2 B. Prof. Background 1. Ql - Q20 21851 132 0.006041 0.000524B16C2 B. Prof. Background 1. Ql - Q20 21851 83 0.003798 0.000416B16E2 B. Prof. Background 1. Ql - Q20 21851 289 0.013226 0.000773B16A3 B. Prof. Background 1. Ql - Q20 12057 37 0.003069 0.000504B16B3 B. Prof. Background 1. Q1 - Q20 12057 79 0.006552 0.000735B16C3 B. Prof. Background 1. Ql - Q20 12057 87 0.007216 0.000771B16E3 B. Prof. Background 1. Ql - Q20 12057 174 0.014431 0.001086B16A4 B. Prof. Background 1. Q1 - Q20 2368 27 0.011402 0.002182B16B4 B. Prof. Background 1. Q1 - Q20 2368 28 0.011824 0.002221B16C4 B. Prof. Background 1. Q1 - Q20 2368 44 0.018581 0.002775B16E4 B. Prof. Background 1. Ql - Q20 2368 74 0.031250 0.003576B17 B. Prof. Background 1. Ql - Q20 25780 247 0.009581 0.000607B17A B. Prof. Background 1. Ql - Q20 10159 506 0.049808 0.002158B18 B. Prof. Background 1. Q1 Q20 10159 528 0.051974 0.002202B18A B. Prof. Background 1. Ql - Q20 10159 379 0.037307 0.001880B18B B. Prof. Background 1. Ql - Q20 10159 470 0.046264 0.002084B18C B. Prof. Background 1. Ql - Q20 10159 322 0.031696 0.001738B19A1A B. Prof. Background 1. Ql - Q20 17933 193 0.010762 0.000771B19A1B B. Prof. Background 1. Ql - Q20 17933 182 0.010149 0.000748B19A2 B. Prof. Background 1. Ql - Q20 17933 118 0.006580 0.000604B19A3 B. Prof. Background 1. Ql -.Q20 17933 451 0.025149 0.001169B19A4 B. Prof. Background 1. Ql - Q20 17933 327 0.018235 0.000999B19B1A B. Prof. Background 1. Ql - Q20 12164 109 0.008961 0.000854B19B1B B. Prof. Background 1. Ql - Q20 12164 104 0.008550. 0.000835B19B2 B. Prof. Background 1. Q1 - Q20 12164 99 0.008139 0.000815B19B3 B. Prof. Background 1. Ql - Q20 12164 288 0.023676 0.001379B19B4 B. Prof. Background 1. Ql - Q20 12164 285 0.023430 0.001372B19C1A B. Prof. Background 1. Q1 - Q20 7313 103 0.014085 0.001378B19C1B B. Prof. Background 1. Ql - Q20 7313 92 0.012580 0.001303B19C2 B. Prof. Background 1. Ql - Q20 7313 58 0.007931 0.001037B19C3 B. Prof. Background 1. Ql - Q20 7313 161 0.022016 0.001716B19C4 B. Prof. Background 1. Q1 - Q20 7313 152 0.020785 0.001668B20A1 B. Prof. Background 1. Ql - Q20 25780 657 0.025485 0.000982B20A2 B. Prof. Background 1. Ql - Q20 25780 649 0.025175 0.000976B20A3 B. Prof. Background 1. Q1 - Q20 25780 644 0.024981 0.000972B20A4 B. Prof. Background 1. Ql - Q20 25780 650 0.025213 0.000976B20A5 B. Prof. Background 1. Ql - Q20 25780 648 0.025136 0.000975B20A6 B. Prof. Background 1. Ql - Q20 25780 647 0.025097 0.000974B20A7 B. Prof. Background 1. Q1 - Q20 25780 643 0.024942 0.000971B20A8 B. Prof. Background 1. Ql - Q20 25780 646 0.025058 0.000973
363
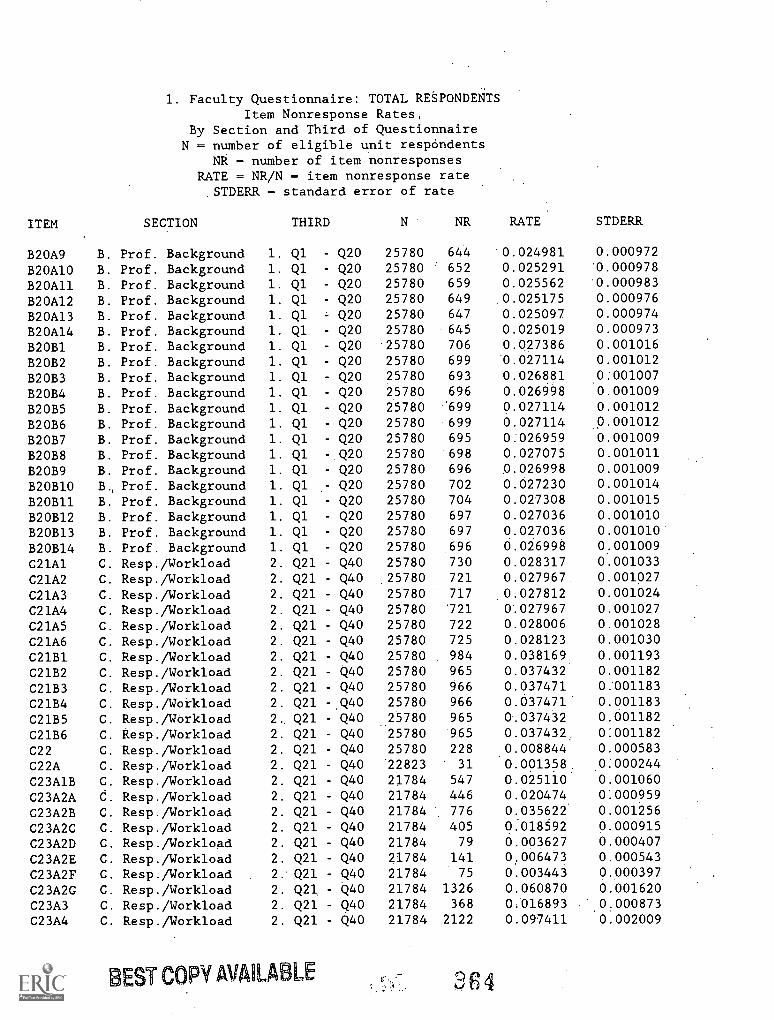
1. Faculty Questionnaire: TOTAL RESPONDENTSItem Nonresponse Rates,
By Section and Third of QuestionnaireN - number of eligible unit respondents
NR - number of item nonresponsesRATE - NR/N = item nonresponse rate
STDERR = standard error of rate
ITEM SECTION THIRD N NR RATE STDERR
B20A9 B. Prof. Background 1. Ql - Q20 25780 644 0.024981 0.000972
B20A10 B. Prof. Background 1. Ql Q20 25780 652 0.025291 0.000978
B20A11 B. Prof. Background 1. Q1 - Q20 25780 659 0.025562 0.000983
B20Al2 B. Prof. Background 1. Ql - Q20 25780 649 0.025175 0.000976
B20A13 B. Prof. Background 1. Ql - Q20 25780 647 0.025097 0.000974
B20A14 B. Prof. Background 1. Ql - Q20 25780 645 0.025019 0.000973
B20B1 B. Prof. Background 1. Ql - Q20 25780 706 0.027386 0.001016
B20B2 B. Prof. Background 1. Ql - Q20 25780 699 0.027114 0.001012
B20B3 B. Prof. Background 1. Ql Q20 25780 693 0.026881 0.001007
B20B4 B. Prof. Background 1. Ql - Q20 25780 696 0.026998 0.001009
B20B5 B. Prof. Background 1. Ql Q20 25780 '699 0.027114 0.001012
B20B6 B. Prof. Background 1. Ql - Q20 25780 699 0.027114 0.001012
B20B7 B. Prof. Background 1. Ql - Q20 25780 695 0.026959 0.001009
B20B8 B. Prof. Background 1. Ql - Q20 25780 698 0.027075 0.001011
B20B9 B. Prof. Background 1. Ql - Q20 25780 696 0.026998 0.001009
B20B10 B., Prof. Background 1. Ql - Q20 25780 702 0.027230 0.001014
B20B11 B. Prof. Background 1. Ql Q20 25780 704 0.027308 0.001015
B20B12 B. Prof. Background 1. Ql - Q20 25780 697 0.027036 0.001010
B20B13 B. Prof. Background 1. Ql - Q20 25780 697 0.027036 0.001010
B20B14 B. Prof. Background 1. Ql - Q20 25780 696 0.026998 0.001009
C21A1 C. Resp./Workload 2. Q21 - Q40 25780 730 0.028317 0.001033
C21A2 C. Resp./Workload 2. Q21 - Q40 25780 721 0.027967 0.001027
C21A3 C. Resp./Workload 2. Q21 - Q40 25780 717 0.027812 0.001024
C21A4 C. Resp./Workload 2. Q21 - Q40 25780 721 0.027967 0.001027
C21A5 C. Resp./Workload 2. Q21 - Q40 25780 722 0.028006 0.001028
C21A6 C. Resp./Workload 2. Q21 - Q40 25780 725 0.028123 0.001030
C21B1 C. Resp./Workload 2. Q21 - Q40 25780 984 0.038169 0.001193
C21B2 C. Resp./Workload 2. Q21 - Q40 25780 965 0.037432 0.001182
C21B3 C. Resp./Workload 2. Q21 - Q40 25780 966 0.037471 0.001183
C21B4 C. Resp./Workload 2. Q21 - Q40 25780 966 0.037471 0.001183
C21B5 C. Resp./Workload 2.. Q21 - Q40 25780 965 0.037432 0.001182
C21B6 C. Resp./Workload 2. Q21 - Q40 25780 965 0.037432. 0:001182
C22 C. Resp./Workload 2. Q21 - Q40 25780 228 0.008844 0.000583
C22A C. Resp./Workload 2. Q21 - Q40 22823 31 0.001358. 0.000244
C23A1B C. Resp./Workload 2. Q21 - Q40 21784 547 0.025110 0.001060
C23A2A C. Resp./Workload 2. Q21 - Q40 21784 446 0.020474 0.000959
C23A2B C. Resp./Workload 2. Q21 - Q40 21784 776 0.035622 0.001256
C23A2C C. Resp./Workload 2. Q21 - Q40 21784 405 0.018592 0.000915
C23A2D C. Resp./Workload 2. Q21 - Q40 21784 79 0.003627 0.000407
C23A2E C. Resp./Workload 2. Q21 - Q40 21784 141 0,006473 0.000543
C23A2F C. Resp./Workload 2. Q21 - Q40 21784 75 0.003443 0.000397
C23A2G C. Resp./Workload 2. Q21 - Q40 21784 1326 0.060870 0.001620
C23A3 C. Resp./Workload 2. Q21 - Q40 21784 368 0.016893 0.000873
C23A4 C. Resp./Workload 2. Q21 - Q40 21784 2122 0.097411 0.002009
BEST COPY AVAILABLE &J 4
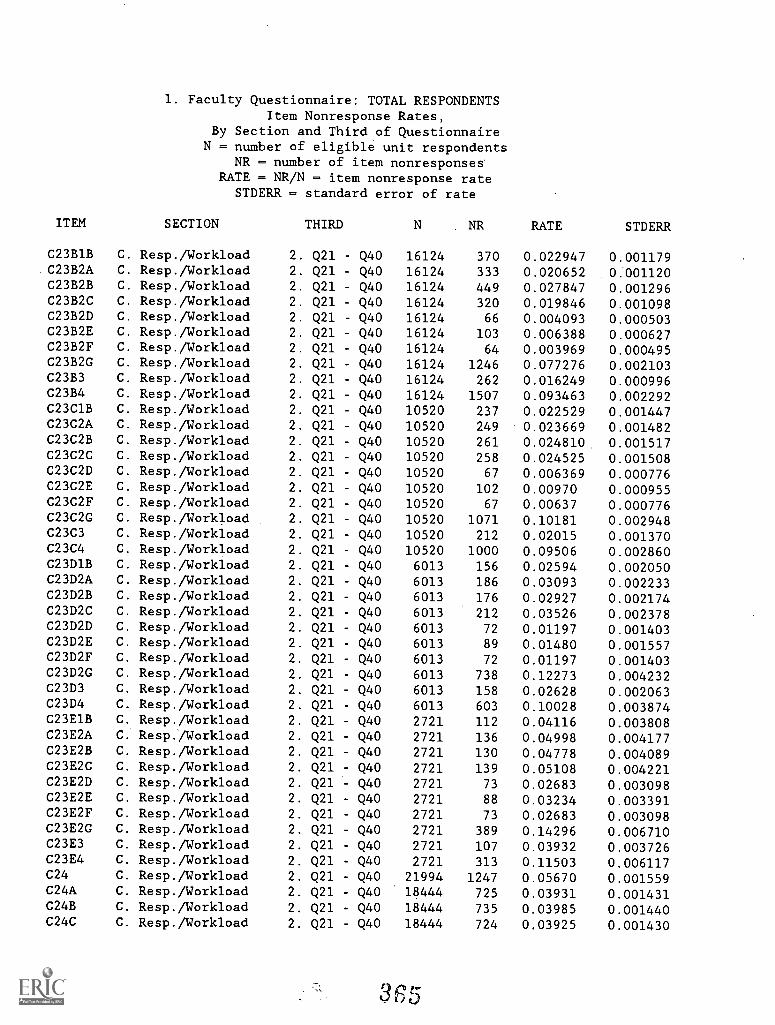
1. Faculty Questionnaire: TOTAL RESPONDENTSItem Nonresponse Rates,
By Section and Third of QuestionnaireN = number of eligible unit respondents
NR = number of item nonresponsesRATE = NR/N = item nonresponse rate
STDERR = standard error of rate
ITEM SECTION THIRD N NR RATE STDERR
C23B1B C. Resp./Workload 2. Q21 - Q40 16124 370 0.022947 0.001179C23B2A C. Resp./Workload 2. Q21 - Q40 16124 333 0.020652 0.001120C23B2B C. Resp./Workload 2. Q21 - Q40 16124 449 0.027847 0.001296C23B2C C. Resp./Workload 2. Q21 Q40 16124 320 0.019846 0.001098C23B2D C. Resp./Workload 2. Q21 Q40 16124 66 0.004093 0.000503C23B2E C. Resp./Workload 2. Q21 - Q40 16124 103 0.006388 0.000627C23B2F C. Resp./Workload 2. Q21 - Q40 16124 64 0.003969 0.000495C23B2G C. Resp./Workload 2. Q21 Q40 16124 1246 0.077276 0.002103C23B3 C. Resp./Workload 2. Q21 - Q40 16124 262 0.016249 0.000996C23B4 C. Resp./Workload 2. Q21 - Q40 16124 1507 0.093463 0.002292C23C1B C. Resp./Workload 2. Q21 Q40 10520 237 0.022529 0.001447C23C2A C. Resp./Workload 2. Q21 Q40 10520 249 0.023669 0.001482C23C2B C. Resp./Workload 2. Q21 - Q40 10520 261 0.024810 0.001517C23C2C C. Resp./Workload 2. Q21 - Q40 10520 258 0.024525 0.001508C23C2D C. Resp./Workload 2. Q21 - Q40 10520 67 0.006369 0.000776C23C2E C. Resp./Workload 2. Q21 - Q40 10520 102 0.00970 0.000955C23C2F C. Resp./Workload 2. Q21 - Q40 10520 67 0.00637 0.000776C23C2G C. Resp./Workload 2. Q21 - Q40 10520 1071 0.10181 0.002948C23C3 C. Resp./Workload 2. Q21 - Q40 10520 212 0.02015 0.001370C23C4 C. Resp./Workload 2. Q21 - Q40 10520 1000 0.09506 0.002860C23D1B C. Resp./Workload 2. Q21 - Q40 6013 156 0.02594 0.002050C23D2A C. Resp./Workload 2. Q21 - Q40 6013 186 0.03093 0.002233C23D2B C. Resp./Workload 2. Q21 - Q40 6013 176 0.02927 0.002174C23D2C C. Resp./Workload 2. Q21 - Q40 6013 212 0.03526 0.002378C23D2D C. Resp./Workload 2. Q21 - Q40 6013 72 0.01197 0.001403C23D2E C. Resp./Workload 2. Q21 - Q40 6013 89 0.01480 0.001557C23D2F C. Resp./Workload 2. Q21 - Q40 6013 72 0.01197 0.001403C23D2G C. Resp./Workload 2. Q21 - Q40 6013 738 0.12273 0.004232C23D3 C. Resp./Workload 2. Q21 - Q40 6013 158 0.02628 0.002063C23D4 C. Resp./Workload 2. Q21 - Q40 6013 603 0.10028 0.003874C23E1B C. Resp./Workload 2. Q21 - Q40 2721 112 0.04116 0.003808C23E2A C. Resp./Workload 2. Q21 - Q40 2721 136 0.04998 0.004177C23E2B C. Resp./Workload 2. Q21 - Q40 2721 130 0.04778 0.004089C23E2C C. Resp./Workload 2. Q21 - Q40 2721 139 0.05108 0.004221C23E2D C. Resp./Workload 2. Q21 - Q40 2721 73 0.02683 0.003098C23E2E C. Resp./Workload 2. Q21 - Q40 2721 88 0.03234 0.003391C23E2F C. Resp./Workload 2. Q21 - Q40 2721 73 0.02683 0.003098C23E2G C. Resp./Workload 2. Q21 - Q40 2721 389 0.14296 0.006710C23E3 C. Resp./Workload 2. Q21 - Q40 2721 107 0.03932 0.003726C23E4 C. Resp./Workload 2. Q21 - Q40 2721 313 0.11503 0.006117C24 C. Resp./Workload 2. Q21 - Q40 21994 1247 0.05670 0.001559C24A C. Resp./Workload 2. Q21 - Q40 18444 725 0.03931 0.001431C24B C. Resp./Workload 2. Q21 - Q40 18444 735 0.03985 0.001440C24C C. Resp./Workload 2. Q21 - Q40 18444 724 0.03925 0.001430
755
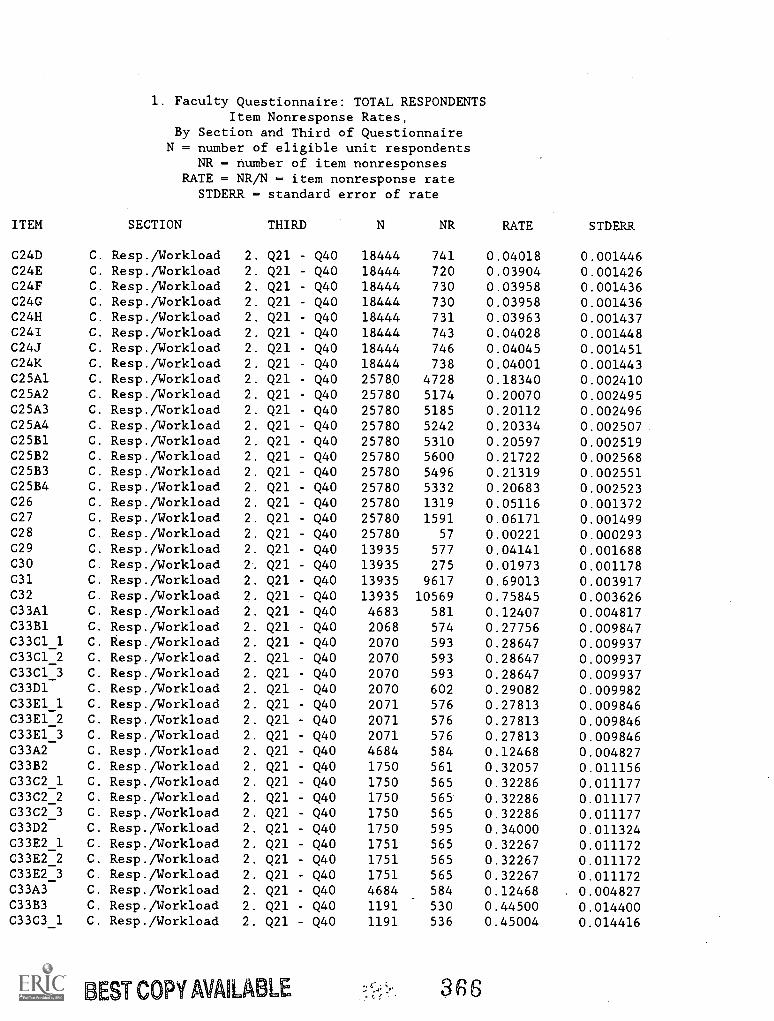
1. Faculty Questionnaire: TOTAL RESPONDENTSItem Nonresponse Rates,
By Section and Third of QuestionnaireN = number of eligible unit respondents
NR = number of item nonresponsesRATE = NR/N = item nonresponse rate
STDERR = standard error of rate
ITEM SECTION THIRD N NR RATE STDERR
C24D C. Resp./Workload 2. Q21 - Q40 18444 741 0.04018 0.001446C24E C. Resp./Workload 2. Q21 - Q40 18444 720 0.03904 0.001426C24F C. Resp./Workload 2. Q21 - Q40 18444 730 0.03958 0.001436C24G C. Resp./Workload 2. Q21 - Q40 18444 730 0.03958 0.001436C24H C. Resp./Workload 2. Q21 - Q40 18444 731 0.03963 0.001437C24I C. Resp./Workload 2. Q21 - Q40 18444 743 0.04028 0.001448C24J C. Resp./Workload 2. Q21 - Q40 18444 746 0.04045 0.001451C24K C. Resp./Workload 2. Q21 - Q40 18444 738 0.04001 0.001443C25A1 C. Resp./Workload 2. Q21 - Q40 25780 4728 0.18340 0.002410C25A2 C. Resp./Workload 2. Q21 - Q40 25780 5174 0.20070 0.002495C25A3 C. Resp./Workload 2. Q21 - Q40 25780 5185 0.20112 0.002496C25A4 C. Resp./Workload 2. Q21 - Q40 25780 5242 0.20334 0.002507C25B1 C. Resp./Workload 2. Q21 - Q40 25780 5310 0.20597 0.002519C25B2 C. Resp./Workload 2. Q21 - Q40 25780 5600 0.21722 0.002568C25B3 C. Resp./Workload 2. Q21 Q40 25780 5496 0.21319 0.002551C25B4 C. Resp./Workload 2. Q21 - Q40 25780 5332 0.20683 0.002523C26 C. Resp./Workload 2. Q21 - Q40 25780 1319 0.05116 0.001372C27 C. Resp./Workload 2. Q21 - Q40 25780 1591 0.06171 0.001499C28 C. Resp./Workload 2. Q21 - Q40 25780 57 0.00221 0.000293C29 C. Resp./Workload 2. Q21 - Q40 13935 577 0.04141 0.001688C30 C. Resp./Workload 2. Q21 - Q40 13935 275 0.01973 0.001178C31 C. Resp./Workload 2. Q21 - Q40 13935 9617 0.69013 0.003917C32 C. Resp./Workload 2. Q21 - Q40 13935 10569 0.75845 0.003626C33A1 C. Resp./Workload 2. Q21 - Q40 4683 581 0.12407 0.004817C33B1 C. Resp./Workload 2. Q21 - Q40 2068 574 0.27756 0.009847C33C1 1 C. Resp./Workload 2. 021 - Q40 2070 593 0.28647 0.009937_C33C1 2 C. Resp./Workload 2. Q21 - Q40 2070 593 0.28647 0.009937C33C1:3 C. Resp./Workload 2. Q21 - Q40 2070 593 0.28647 0.009937C33D1 C. Resp./Workload 2. Q21 Q40 2070 602 0.29082 0.009982C33E1_1 C. Resp./Workload 2. Q21 - Q40 2071 576 0.27813 0.009846C33E1 2 C. Resp./Workload 2. Q21 - Q40 2071 576 0.27813 0.009846_C33E1 3 C. Resp./Workload 2. Q21 - Q40 2071 576 0.27813 0.009846_C33A2 C. Resp./Workload 2. Q21 - Q40 4684 584 0.12468 0.004827C33B2 C. Resp./Workload 2. Q21 - Q40 1750 561 0.32057 0.011156C33C2_1 C. Resp./Workload 2. Q21 - Q40 1750 565 0.32286 0.011177C33C2 2 C. Resp./Workload 2. Q21 - Q40 1750 565 0.32286 0.011177_C33C2 3 C. Resp./Workload 2. Q21 - Q40 1750 565 0.32286 0.011177C33D2 C. Resp./Workload 2. Q21 - Q40 1750 595 0.34000 0.011324C33E2_1 C. Resp./Workload 2. Q21 - Q40 1751 565 0.32267 0.011172C33E2_2 C. Resp./Workload 2. Q21 - Q40 1751 565 0.32267 0.011172C33E2_3 C. Resp./Workload 2. Q21 - Q40 1751 565 0.32267 0.011172C33A3 C. Resp./Workload 2. Q21 - Q40 4684 584 0.12468 , 0.004827C33B3 C. Resp./Workload 2. Q21 - Q40 1191 530 0.44500 0.014400C33C3_1 C. Resp./Workload 2. Q21 - Q40 1191 536 0.45004 0.014416
BEST COPY AVAILABLEC.4' 366
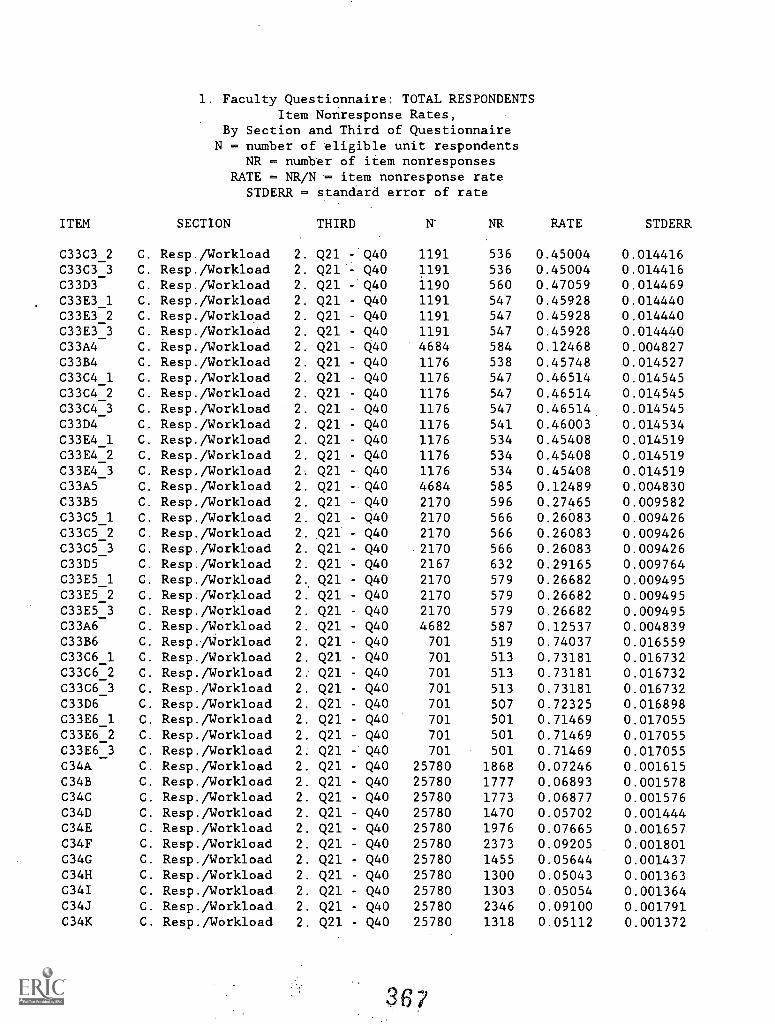
1. Faculty Questionnaire: TOTAL RESPONDENTSItem Nonresponse Rates,
By Section and Third of QuestionnaireN = number of eligible unit respondents
NR - number of item nonresponsesRATE = NR/N = item nonresponse rate
STDERR = standard error of rate
ITEM SECTION THIRD NR RATE STDERR
C33C3_2 C. Resp./Workload 2. Q21 -.Q40 1191 536 0.45004 0.014416C33C3_3 C. Resp./Workload 2. Q21 Q40 1191 536 0.45004 0.014416C33D3 C. Resp./Workload 2. Q21 - Q40 1190 560 0.47059 0.014469C33E3_1 C. Resp./Workload 2. Q21 - Q40 1191 547 0.45928 0.014440C33E3_2 C. Resp./Workload 2. Q21 - Q40 1191 547 0.45928 0.014440C33E3_3 C. Resp./Workload 2. Q21 - Q40 1191 547 0.45928 0.014440C33A4 C. Resp./Workload 2. Q21 - Q40 4684 584 0.12468 0.004827C33B4 C. Resp./Workload 2. Q21 Q40 1176 538 0.45748 0.014527C33C4_1 C. Resp./Workload 2. Q21 - Q40 1176 547 0.46514 0.014545C33C4_2 C. Resp./Workload 2. Q21 Q40 1176 547 0.46514 0.014545C33C4_3 C. Resp./Workload 2. Q21 - Q40 1176 547 0.46514 0.014545C33D4 C. Resp./Workload 2. Q21 - Q40 1176 541 0.46003 0.014534C33E4_1 C. Resp./Workload 2. Q21 Q40 1176 534 0.45408 0.014519C33E4_2 C. Resp./Workload 2. Q21 - Q40 1176 534 0.45408 0.014519C33E4_3 C. Resp./Workload 2. Q21 Q40 1176 534 0.45408 0.014519C33A5 C. Resp./Workload 2. Q21 - Q40 4684 585 0.12489 0.004830C33B5 C. Resp./Workload 2. Q21 - Q40 2170 596 0.27465 0.009582C33C5_1 C. Resp./Workload 2. Q21 - Q40 2170 566 0.26083 0.009426C33C5_2 C. Resp./Workload 2..Q21 - Q40 2170 566 0.26083 0.009426C33C5 3 C. Resp./Workload 2. Q21 - Q40 2170 566 0.26083 0.009426C33D5 C. Resp./Workload 2. Q21 - Q40 2167 632 0.29165 0.009764C33E5_1 C. Resp./Workload 2. Q21 - Q40 2170 579 0.26682 0.009495C33E5_2 C. Resp./Workload 2. Q21 - Q40 2170 579 0.26682 0.009495C33E5_3 C. Resp./Workload 2. Q21 - Q40 2170 579 0.26682 0.009495C33A6 C. Resp./Workload 2. Q21 - Q40 4682 587 0.12537 0.004839C33B6 C. Resp./Workload 2. Q21 - Q40 701 519 0.74037 0.016559C33C6_1 C. Resp./Workload 2. Q21 Q40 701 513 0.73181 0.016732C33C6_2 C. Resp./Workload 2. Q21 - Q40 701 513 0.73181 0.016732C33C6_3 C. Resp./Workload 2. Q21 - Q40 701 513 0.73181 0.016732C33D6 C. Resp./Workload 2. Q21 - Q40 701 507 0.72325 0.016898C33E6_1 C. Resp./Workload 2. Q21 - Q40 701 501 0.71469 0.017055C33E6_2 C. Resp./Workload 2. Q21 - Q40 701 501 0.71469 0.017055C33E6_3 C. Resp./Workload 2. Q21 - Q40 701 501 0.71469 0.017055C34A C. Resp./Workload 2. Q21 - Q40 25780 1868 0.07246 0.001615C34B C. Resp./Workload 2. Q21 - Q40 25780 1777 0.06893 0.001578C34C C. Resp./Workload 2. Q21 - Q40 25780 1773 0.06877 0.001576C34D C. Resp./Workload 2. Q21 - Q40 25780 1470 0.05702 0.001444C34E C. Resp./Workload 2. Q21 - Q40 25780 1976 0.07665 0.001657C34F C. Resp./Workload 2. Q21 - Q40 25780 2373 0.09205 0.001801C34G C. Resp./Workload 2. Q21 - Q40 25780 1455 0.05644 0.001437C34H C. Resp./Workload 2. Q21 - Q40 25780 1300 0.05043 0.001363C34I C. Resp./Workload 2. Q21 - Q40 25780 1303 0.05054 0.001364C34J C. Resp./Workload 2. Q21 - Q40 25780 2346 0.09100 0.001791C34K C. Resp./Workload 2. Q21 - Q40 25780 1318 0.05112 0.001372
3 6 7
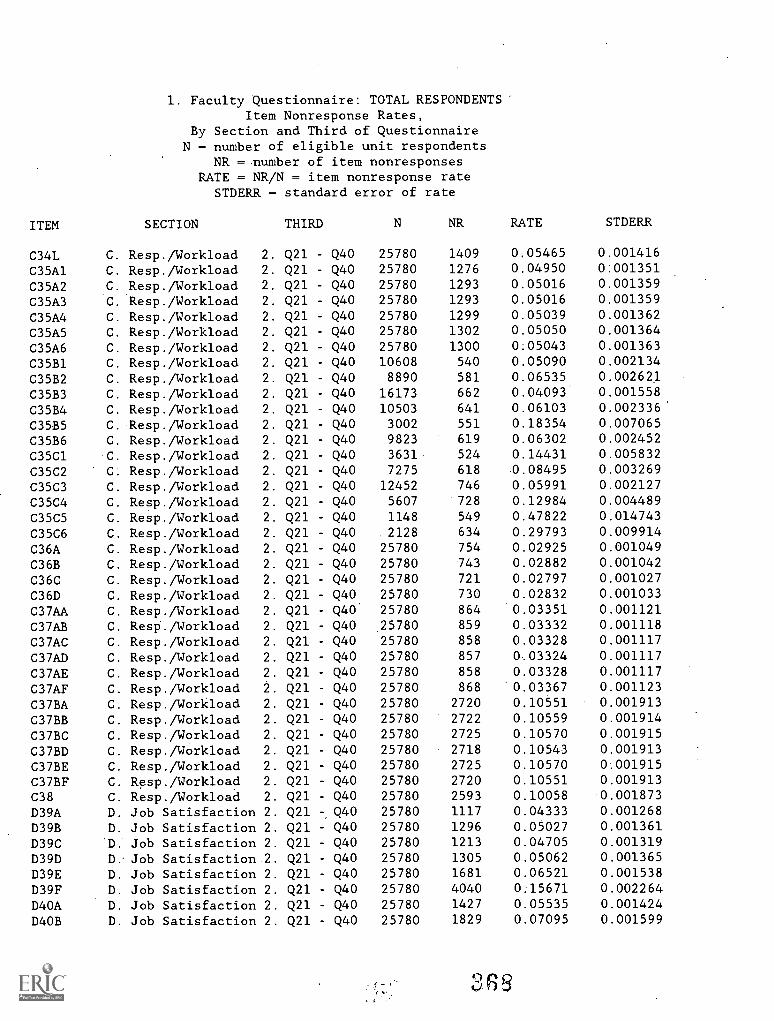
1. Faculty Questionnaire: TOTAL RESPONDENTSItem Nonresponse Rates,
By Section and Third of QuestionnaireN = number of eligible unit respondents
NR = number of item nonresponsesRATE = NR/N - item nonresponse rate
STDERR = standard error of rate
ITEM SECTION THIRD N NR RATE STDERR
C34L C. Resp./Workload 2. Q21 - Q40 25780 1409 0.05465 0.001416
C35A1 C. Resp./Workload 2. Q21 - Q40 25780 1276 0.04950 0:001351
C35A2 C. Resp./Workload 2. Q21 - Q40 25780 1293 0.05016 0.001359
C35A3 C. 'Resp./Workload 2. Q21 - Q40 25780 1293 0.05016 0.001359
C35A4 C. Resp./Workload 2. Q21 - Q40 25780 1299 0.05039 0.001362
C35A5 C. Resp./Workload 2. Q21 - Q40 25780 1302 0.05050 0.001364
C35A6 C. Resp./Workload 2. Q21 - Q40 25780 1300 0:05043 0.001363
C35B1 C. Resp./Workload 2. Q21 Q40 10608 540 0.05090 0.002134
C35B2 C. Resp./Workload 2. Q21 - Q40 8890 581 0.06535 0.002621
C35B3 C. Resp./Workload 2. Q21 Q40 16173 662 0.04093 0.001558
C35B4 C. Resp./Workload 2. Q21 - Q40 10503 641 0.06103 0.002336
C3535 C. Resp./Workload 2. Q21 Q40 3002 551 0.18354 0.007065
C35B6 C. Resp./Workload 2. Q21 Q40 9823 619 0.06302 0.002452
C35C1 C. Resp./Workload 2. Q21 - Q40 3631 524 0.14431 0.005832
C35C2 C. Resp./Workload 2. Q21 - Q40 7275 618 0.08495 0.003269
C35C3 C. Resp./Workload 2. Q21 - Q40 12452 746 0.05991 0.002127
C35C4 C. Resp./Workload 2. Q21 Q40 5607 728 0.12984 0.004489
C35C5 C. Resp./Workload 2. Q21 Q40 1148 549 0.47822 0.014743
C35C6 C. Resp./Workload 2. Q21 - Q40 2128 634 0.29793 0.009914
C36A C. Resp./Workload 2. Q21 Q40 25780 754 0.02925 0.001049
C36B C. Resp./Workload 2. Q21 - Q40 25780 743 0.02882 0.001042
C36C C. Resp./Workload 2. Q21 - Q40 25780 721 0.02797 0.001027
C36D C. Resp./Workload 2. Q21 - Q40 25780 730 0.02832 0.001033
C37AA C. Resp./Workload 2. Q21 - Q40 25780 864 0.03351 0.001121
C37AB C. Resp./Workload 2. Q21 Q40 25780 859 0.03332 0.001118
C37AC C. Resp./Workload 2. Q21 - Q40 25780 858 0.03328 0.001117
C37AD C. Resp./Workload 2. Q21 - Q40 25780 857 0.03324 0.001117
C37AE C. Resp./Workload 2. Q21 Q40 25780 858 0.03328 0.001117
C37AF C. Resp./Workload 2. Q21 - Q40 25780 868 0.03367 0.001123
C37BA C. Resp./Workload 2. Q21 - Q40 25780 2720 0.10551 0.001913
C37BB C. Resp./Workload 2. Q21 - Q40 25780 2722 0.10559 0.001914
C37BC C. Resp./Workload 2. Q21 - Q40 25780 2725 0.10570 0.001915
C37BD C. Resp./Workload 2. Q21 - Q40 25780 2718 0.10543 0.001913
C37BE C. Resp./Workload 2. Q21 - Q40 25780 2725 0.10570 0.001915
C37BF C. Resp./Workload 2. Q21 - Q40 25780 2720 0.10551 0.001913
C38 C. Resp./Workload 2. Q21 - Q40 25780 2593 0.10058 0.001873
D39A D. Job Satisfaction 2. Q21 Q40 25780 1117 0.04333 0.001268
D39B D. Job Satisfaction 2. Q21 - Q40 25780 1296 0.05027 0.001361
D39C 'D.' Job Satisfaction 2. Q21 - Q40 25780 1213 0.04705 0.001319
D39D D. Job Satisfaction 2. Q21 - Q40 25780 1305 0.05062 0.001365
D39E D. Job Satisfaction 2. Q21 - Q40 25780 1681 0.06521 0.001538
D39F D. Job Satisfaction 2. Q21 - Q40 25780 4040 0.15671 0.002264
D40A D. Job Satisfaction 2. Q21 - Q40 25780 1427 0.05535 0.001424
D4OB D. Job Satisfaction 2. Q21 - Q40 25780 1829 0.07095 0.001599
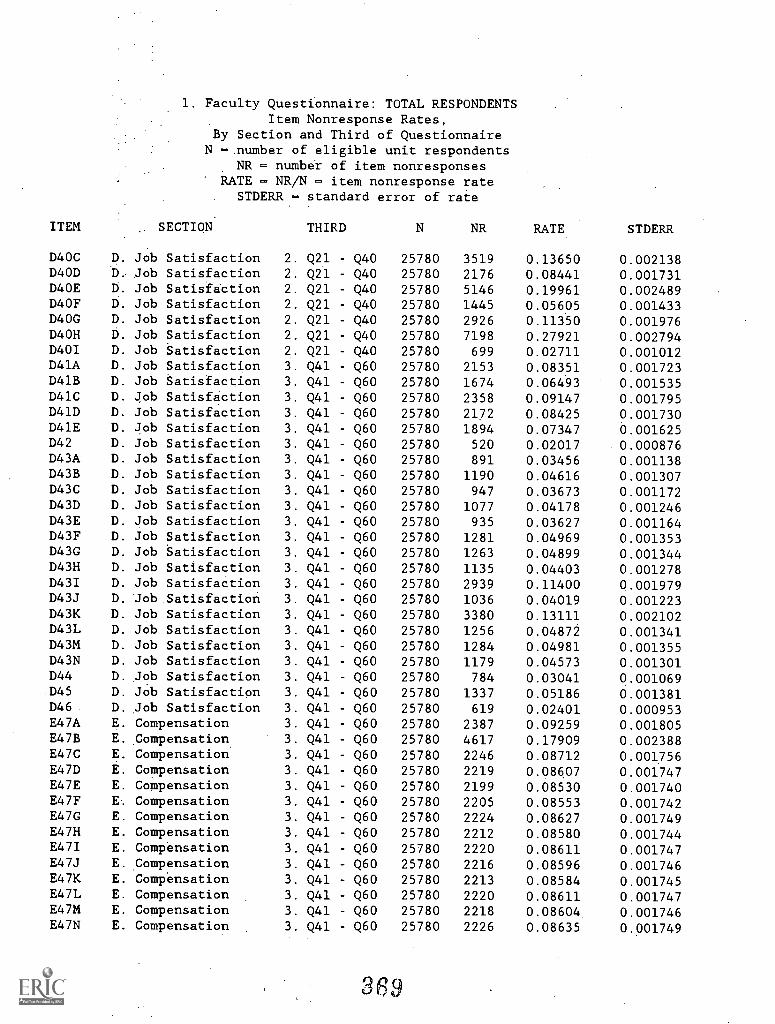
1. Faculty Questionnaire: TOTAL RESPONDENTSItem Nonresponse Rates,
By Section and Third of QuestionnaireN = number of eligible unit respondents
NR = number of item nonresponsesRATE = NR/N - item nonresponse rate
STDERR = standard error of rate
ITEM SECTION THIRD N NR RATE STDERR
D40C D. Job Satisfaction 2. Q21 - Q40 25780 3519 0.13650 0.002138D4OD D. Job Satisfaction 2. Q21 - Q40 25780 2176 0.08441 0.001731D4OE D. Job Satisfaction 2. Q21 - Q40 25780 5146 0.19961 0.002489D4OF D. Job Satisfaction 2. Q21 Q40 25780 1445 0.05605 0.001433D4OG D. Job Satisfaction 2. Q21 - Q40 25780 2926 0.11350 0.001976D4OH D. Job Satisfaction 2. Q21 Q40 25780 7198 0.27921 0.002794D401 D. Job Satisfaction 2. Q21 Q40 25780 699 0.02711 0.001012D41A D. Job Satisfaction 3. Q41 Q60 25780 2153 0.08351 0.001723D41B D. Job Satisfaction 3. Q41 - Q60 25780 1674 0.06493 0.001535D41C D. Job Satisfaction 3. Q41 - Q60 25780 2358 0.09147 0.001795D41D D. Job Satisfaction 3. Q41 - Q60 25780 2172 0.08425 0.001730D41E D. Job Satisfaction 3. Q41 Q60 25780 1894 0.07347 0.001625D42 D. Job Satisfaction 3. Q41 Q60 25780 520 0.02017 0.000876D43A D. Job Satisfaction 3. Q41 - Q60 25780 891 0.03456 0.001138D43B D. Job Satisfaction 3. Q41 - Q60 25780 1190 0.04616 0.001307D43C D. Job Satisfaction 3. Q41 Q60 25780 947 0.03673 0.001172D43D D. Job Satisfaction 3. Q41 - Q60 25780 1077 0.04178 0.001246D43E D. Job Satisfaction 3. Q41 Q60 25780 935 0.03627 0.001164D43F D. Job Satisfaction 3. Q41 - Q60 25780 1281 0.04969 0.001353D43G D. Job Satisfaction 3. Q41 Q60 25780 1263 0.04899 0.001344D43H D. Job Satisfaction 3. Q41 Q60 25780 1135 0.04403 0.001278D43I D. Job Satisfaction 3. Q41 - Q60 25780 2939 0.11400 0.001979D43J D. Job Satisfaction 3. Q41 - Q60 25780 1036 0.04019 0.001223D43K D. Job Satisfaction 3. Q41 - Q60 25780 3380 0.13111 0.002102D43L D. Job Satisfaction 3. Q41 Q60 25780 1256 0.04872 0.001341D43M D. Job Satisfaction 3. Q41 - Q60 25780 1284 0.04981 0.001355D43N D. Job Satisfaction 3. Q41 Q60 25780 1179 0.04573 0.001301D44 D. Job Satisfaction 3. Q41 - Q60 25780 784 0.03041 0.001069D45 D. Job Satisfaction 3. Q41 - Q60 25780 1337 0.05186 0.001381D46 D. Job Satisfaction 3. Q41 - Q60 25780 619 0.02401 0.000953E47A E. Compensation 3. Q41 Q60 25780 2387 0.09259 0.001805E47B E. °Compensation 3. Q41 - Q60 25780 4617 0.17909 0.002388E47C E. Compensation 3. Q41 - Q60 25780 2246 0.08712 0.001756E47D E. Compensation 3. Q41 - Q60 25780 2219 0.08607 0.001747E47E E. Compensation 3. Q41 Q60. 25780 2199 0.08530 0.001740E47F E. Compensation 3. Q41 - Q60 25780 2205 0.08553 0.001742E47G E. Compensation 3. Q41 - Q60 25780 2224 0.08627 0.001749E47H E. Compensation 3. Q41 - Q60 25780 2212 0.08580 0.001744E47I E. Compensation 3. Q41 - Q60 25780 2220 0.08611 0.001747E47J E. Compensation 3. Q41 - Q60 25780 2216 0.08596 0.001746E47K E. Compensation 3. Q41 - Q60 25780 2213 0.08584 0.001745E47L E. Compensation 3. Q41 - Q60 25780 2220 0.08611 0.001747E47M E. Compensation 3. Q41 - Q60 25780 2218 0.08604 0.001746E47N E. Compensation 3. Q41 - Q60 25780 2226 0.08635 0.001749
3f$9
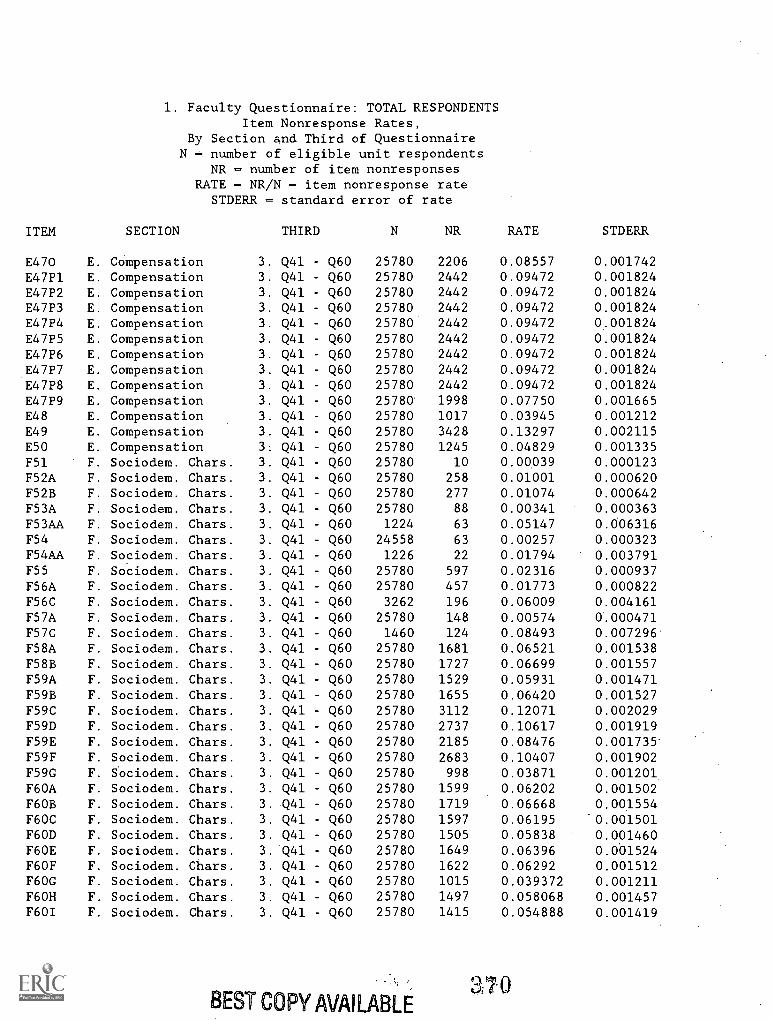
1. Faculty Questionnaire: TOTAL RESPONDENTSItem Nonresponse Rates,
By Section and Third of QuestionnaireN = number of eligible unit respondents
NR = number of item nonresponsesRATE = NR/N = item nonresponse rate
STDERR = standard error of rate
ITEM SECTION THIRD N NR RATE STDERR
E470 E. Compensation 3. Q41 - Q60 25780 2206 0.08557 0.001742E47P1 E. Compensation 3. Q41 - Q60 25780 2442 0.09472 0.001824E47P2 E. Compensation 3. Q41 - Q60 25780 2442 0.09472 0.001824E47P3 E. Compensation 3. Q41 - Q60 25780 2442 0.09472 0.001824E47P4 E. Compensation 3. Q41 Q60 25780 2442 0.09472 0.001824E47P5 E. Compensation 3. Q41 - Q60 25780 2442 0.09472 0.001824E47P6 E. Compensation 3. Q41 Q60 25780 2442 0.09472 0.001824E47P7 E. Compensation 3. Q41 - Q60 25780 2442 0.09472 0.001824E47P8 E. Compensation 3. Q41 Q60 25780 2442 0.09472 0.001824E47P9 E. Compensation 3. Q41 - Q60 25780 1998 0.07750 0.001665E48 E. Compensation 3. Q41 Q60 25780 1017 0.03945 0.001212E49 E. Compensation 3. Q41 - Q60 25780 3428 0.13297 0.002115E50 E. Compensation 31 Q41 Q60 25780 1245 0.04829 0.001335F51 F. Sociodem. Chars. 3. Q41 - Q60 25780 10 0.00039 0.000123F52A F. Sociodem. Chars. 3. Q41 Q60 25780 258 0.01001 0.000620F52B F. Sociodem. Chars. 3. Q41 - Q60 25780 277 0.01074 0.000642F53A F. Sociodem. Chars. 3. Q41 - Q60 25780 88 0.00341 0.000363F53AA F. Sociodem. Chars. 3. Q41 - Q60 1224 63 0.05147 0.006316F54 F. Sociodem. Chars. 3. Q41 - Q60 24558 63 0.00257 0.000323F54AA F. Sociodem. Chars. 3. Q41 - Q60 1226 22 0.01794 0.003791F55 F. Sociodem. Chars. 3. Q41 - Q60 25780 597 0.02316 0.000937F56A F. Sociodem. Chars. 3. Q41 Q60 25780 457 0.01773 0.000822F56C F. Sociodem. Chars. 3. Q41 Q60 3262 196 0.06009 0.004161F57A F. Sociodem. Chars. 3. Q41 - Q60 25780 148 0.00574 0.000471F57C F. Sociodem. Chars. 3. Q41 - Q60 1460 124 0.08493 0.007296F58A F. Sociodem. Chars. 3. Q41 - Q60 25780 1681 0.06521 0.001538F58B F. Sociodem. Chars. 3. Q41 Q60 25780 1727 0.06699 0.001557F59A F. Sociodem. Chars. 3. Q41 Q60 25780 1529 0.05931 0.001471F59B F. Sociodem. Chars. 3. Q41 - Q60 25780 1655 0.06420 0.001527F59C F. Sociodem. Chars. 3. Q41 - Q60 25780 3112 0.12071 0.002029F59D F. Sociodem. Chars. 3. Q41 - Q60 25780 2737 0.10617 0.001919F59E F. Sociodem. Chars. 3. Q41 - Q60 25780 2185 0.08476 0.001735'
F59F F. Sociodem. Chars. 3. Q41 - Q60 25780 2683 0.10407 0.001902F59G F. Sociodem. Chars. 3. Q41 - Q60 25780 998 0.03871 0.001201.F60A F. Sociodem. Chars. 3. Q41 - Q60 25780 1599 0.06202 0.001502F6OB F. Sociodem. Chars. 3. Q41 - Q60 25780 1719 0.06668 0.001554F60C F. Sociodem. Chars. 3. Q41 - Q60 25780 1597 0.06195 0.001501F6OD F. Sociodem. Chars. 3. Q41 Q60 25780 1505 0.05838 0.001460F60E F. Sociodem. Chars. 3. Q41 - Q60 25780 1649 0.06396 0.001524F6OF F. Sociodem. Chars. 3. Q41 Q60 25780 1622 0.06292 0.001512F6OG F. Sociodem. Chars. 3. Q41 - Q60 25780 1015 0.039372 0.001211F6OH F. Sociodem. Chars. 3. Q41 - Q60 25780 1497 0.058068 0.001457F601 F. Sociodem. Chars. 3. Q41 - Q60 25780 1415 0.054888 0.001419
BEST COPY AVAILABLE
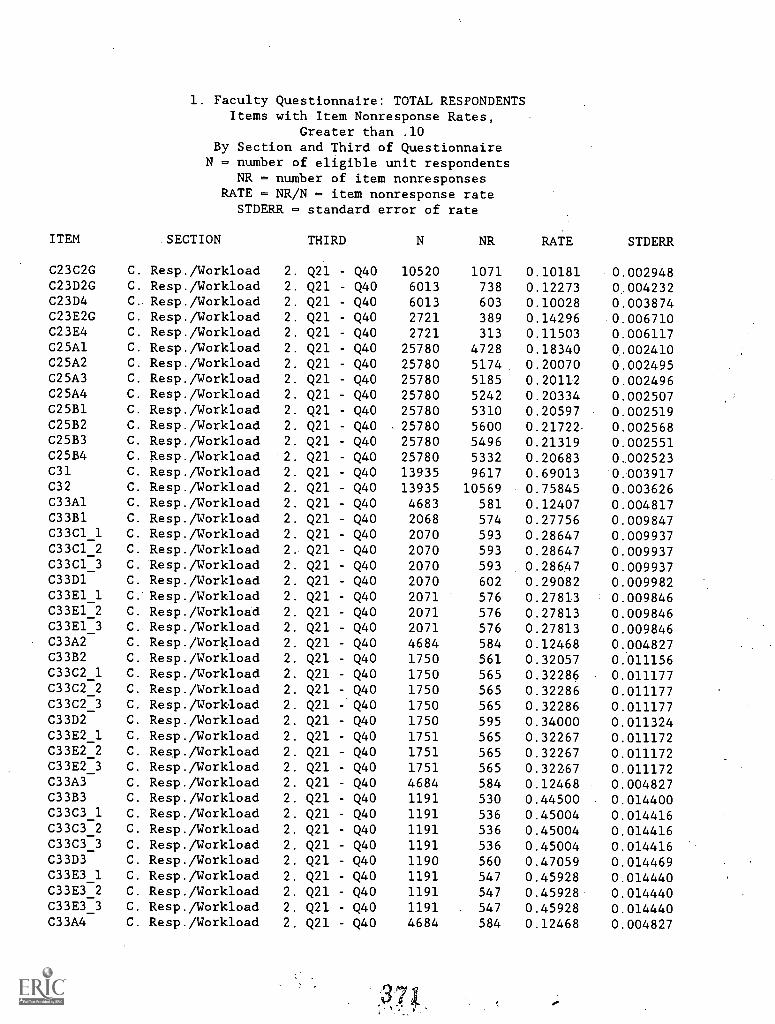
1. Faculty Questionnaire: TOTAL RESPONDENTSItems with Item Nonresponse Rates,
Greater than .10By Section and Third of Questionnaire
N = number of eligible unit respondentsNR = number of item nonresponses
RATE = NR/N - item nonresponse rateSTDERR - standard error of rate
ITEM :SECTION THIRD N NR RATE STDERR
C23C2G C. Resp./Workload 2. Q21 - Q40 10520 1071 0.10181 0.002948C23D2G C. Resp./Workload 2. Q21 - Q40 6013 738 0.12273 0.004232C23D4 C. Resp./Workload 2. Q21 - Q40 6013 603 0.10028 0.003874C23E2G C. Resp./Workload 2. Q21 - Q40 2721 389 0.14296 0.006710C23E4 C. Resp./Workload 2. Q21 - Q40 2721 313 0.11503 0.006117C25A1 C. Resp./Workload 2. Q21 - Q40 25780 4728 0.18340 0.002410C25A2 C. Resp./Workload 2. Q21 - Q40 25780 5174 0.20070 0.002495C25A3 C. Resp./Workload 2. Q21 - Q40 25780 5185 0.20112 0.002496C25A4 C. Resp./Workload 2. Q21 - Q40 25780 5242 0.20334 0.002507C25B1 C. Resp./Workload 2. Q21 - Q40 25780 5310 0.20597 0.002519C25B2 C. Resp./Workload 2. Q21 - Q40 25780 5600 0.21722 0.002568C25B3 C. Resp./Workload 2. Q21 Q40 25780 5496 0.21319 0.002551C25B4 C. Resp./Workload 2. Q21 - Q40 25780 5332 0.20683 0.002523C31 C. Resp./Workload 2. Q21 - Q40 13935 9617 0.69013 0.003917C32 C. Resp./Workload 2. Q21 - Q40 13935 10569 0.75845 0.003626C33A1 C. Resp./Workload 2. Q21 - Q40 4683 581 0.12407 0.004817C33B1 C. Resp./Workload 2. Q21 - Q40 2068 574 0.27756 0.009847C33C1_1 C. Resp./Workload 2. Q21 - Q40 2070 593 0.28647 0.009937C33C1 2 C. Resp./Workload 2. Q21 - Q40 2070 593 0.28647 0.009937C33C1 3 C. Resp./Workload 2. Q21 - Q40 2070 593 0.28647 0.009937C33D1 C. Resp./Workload 2. Q21 - Q40 2070 602 0.29082 0.009982C33E1_1 C. Resp./Workload 2. Q21 - Q40 2071 576 0.27813 0.009846C33E1 2 C. Resp./Workload 2. Q21 - Q40 2071 576 0.27813 0.009846C33E1 3 C. Resp./Workload 2. Q21 - Q40 2071 576 0.27813 0.009846C33A2 C. Resp./Workload 2. Q21 - Q40 4684 584 0.12468 0.004827C33B2 C. Resp./Workload 2. Q21 - Q40 1750 561 0.32057 0.011156C33C2_1 C. Resp./Workload 2. Q21 - Q40 1750 565 0.32286 0.011177C33C2_2 C. Resp./Workload 2. Q21 - Q40 1750 565 0.32286 0.011177C33C2_3 C. Resp./Workload 2. Q21 - Q40 1750 565 0.32286 0.011177C33D2 C. Resp./Workload 2. Q21 - Q40 1750 595 0.34000 0.011324C33E2 1 C. Resp./Workload 2. Q21 - Q40 1751 565 0.32267 0.011172C33E2 2 C. Resp./Workload 2. Q21 - Q40 1751 565 0.32267 0.011172C33E2-3 C. Resp./Workload 2. Q21 - Q40 1751 565 0.32267 0.011172C33A3 C. Resp./Workload 2. Q21 - Q40 4684 584 0.12468 0.004827C33B3 C. Resp./Workload 2. Q21 - Q40 1191 530 0.44500 0.014400C33C3_1 C. Resp./Workload 2. Q21 - Q40 1191 536 0.45004 0.014416C33C3_2 C. Resp./Workload 2. Q21 - Q40 1191 536 0.45004 0.014416C33C3_3 C. Resp./Workload 2. Q21 - Q40 1191 536 0.45004 0.014416C33D3 C. Resp./Workload 2. Q21 - Q40 1190 560 0.47059 0.014469C33E3_1 C. Resp./Workload 2. Q21 - Q40 1191 547 0.45928 0.014440C33E3_2 C. Resp./Workload 2. Q21 - Q40 1191 547 0.45928 0.014440C33E3_3 C. Resp./Workload 2. Q21 - Q40 1191 547 0.45928 0.014440C33A4 C. Resp./Workload 2. Q21 - Q40 4684 584 0.12468 0.004827
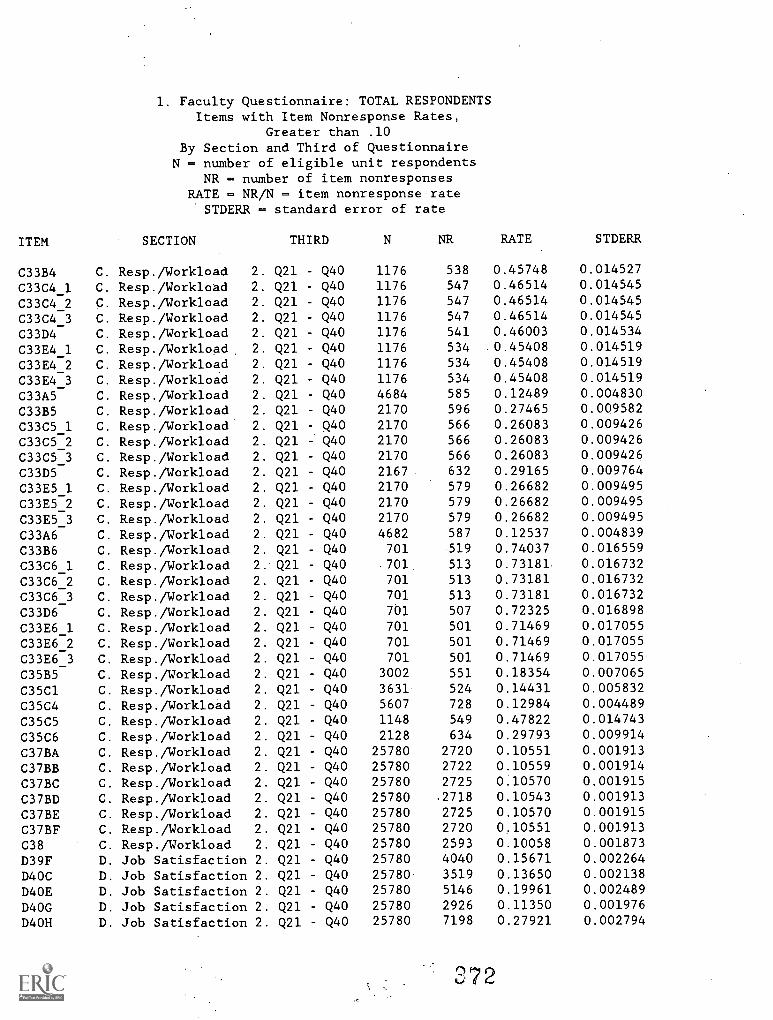
1. Faculty Questionnaire: TOTAL RESPONDENTSItems with Item Nonresponse Rates,
Greater than .10By Section and Third of Questionnaire
N = number of eligible unit respondents
ITEM
NR = number of item nonresponsesRATE = NR/N = item nonresponse rate
STDERR = standard error of rate
SECTION THIRD N NR RATE STDERR
C33B4 C. Resp./Workload 2. Q21 - Q40 1176 538 0.45748 0.014527
C33C4_1 C. Resp./Workload 2. Q21 - Q40 1176 547 0.46514 0.014545
C33C4_2 C. Resp./Workload 2. Q21 - Q40 1176 547 0.46514 0.014545
C33C4_3 C. Resp./Workload 2. Q21 - Q40 1176 547 0.46514 0.014545
C33D4 C. Resp./Workload 2. Q21 - Q40 1176 541 0.46003 0.014534
C33E4_1 C. Resp./Workload 2. Q21 - Q40 1176 534 0.45408 0.014519
C33E4_2 C. Resp./Workload 2. Q21 Q40 1176 534 0.45408 0.014519
C33E4_3 C. Resp./Workload 2. Q21 - Q40 1176 534 0.45408 0.014519
C33A5 C. Resp./Workload 2. Q21 - Q40 4684 585 0.12489 0.004830
C33B5 C. Resp./Workload 2. Q21 Q40 2170 596 0.27465 0.009582
C33C5_1 C. Resp./Workload 2. Q21 - Q40 2170 566 0.26083 0.009426
C33C5_2 C. Resp./Workload 2. Q21 - Q40 2170 566 0.26083 0.009426
C33C5_3 C. Resp./Workload 2. Q21 Q40 2170 566 0.26083 0.009426
C33D5 C. Resp./Workload 2. Q21 - Q40 2167 632 0.29165 0.009764
C33E5_1 C. Resp./Workload 2. Q21 Q40 2170 579 0.26682 0.009495
C33E5_2 C. Resp./Workload 2. Q21 - Q40 2170 579 0.26682 0.009495
C33E5_3 C. Resp./Workload 2. Q21 - Q40 2170 579 0.26682 0.009495
C33A6 C. Resp./Workload 2. Q21 Q40 4682 587 0.12537 0.004839
C33B6 C. Resp./Workload 2. Q21 - Q40 701 519 0.74037 0.016559
C33C6_1 C. Resp./Workload 2. Q21 - Q40 .701. 513 0.73181. 0.016732
C33C6_2 C. Resp./Workload 2. Q21 - Q40 701 513 0.73181 0.016732
C33C6_3 C. Resp./Workload 2. Q21 Q40 701 513 0.73181 0.016732
C33D6 C. Resp./Workload 2. Q21 - Q40 701 507 0.72325 0.016898
C33E6 1 C. Resp./Workload 2. Q21 Q40 701 501 0.71469 0.017055_C33E6 2 C. Resp./Workload 2. Q21 - Q40 701 501 0.71469 0.017055
C33E6=3 C. Resp./Workload 2. Q21 - Q40 701 501 0.71469 0.017055
C35B5 C. Resp./Workload 2. Q21 - Q40 3002 551 0.18354 0.007065
C35C1 C. Resp./Workload 2. Q21 - Q40 3631 524 0.14431 0.005832
C35C4 C. Resp./Workload 2. Q21 - Q40 5607 728 0.12984 0.004489
C35C5 C. Resp./Workload 2. Q21 - Q40 1148 549 0.47822 0.014743
C35C6 C. Resp./Workload 2. Q21 - Q40 2128 634 0.29793 0.009914
C37BA C. Resp./Workload 2. Q21 - Q40 25780 2720 0.10551 0.001913
C37BB C. Resp./Workload 2. Q21 Q40 25780 2722 0.10559 0.001914
C37BC C. Resp./Workload 2. Q21 - Q40 25780 2725 0.10570 0.001915
C37BD C. Resp./Workload 2. Q21 - Q40 25780 .2718 0.10543 0.001913
C37BE C. Resp./Workload 2. Q21 - Q40 25780 2725 0.10570 0.001915
C37BF C. Resp./Workload 2. Q21 - Q40 25780 2720 0.10551 0.001913
C38 C. Resp./Workload 2. Q21 Q40 25780 2593 0.10058 0.001873
D39F D. Job Satisfaction 2. Q21 - Q40 25780 4040 0.15671 0.002264
D40C D. Job Satisfaction 2. Q21 - Q40 25780 3519 0.13650 0.002138
D4OE D. Job Satisfaction 2. Q21 - Q40 25780 5146 0.19961 0.002489
D4OG D. Job Satisfaction 2. Q21 - Q40 25780 2926 0.11350 0.001976
D4OH D. Job Satisfaction 2. Q21 - Q40 25780 7198 0.27921 0.002794
272
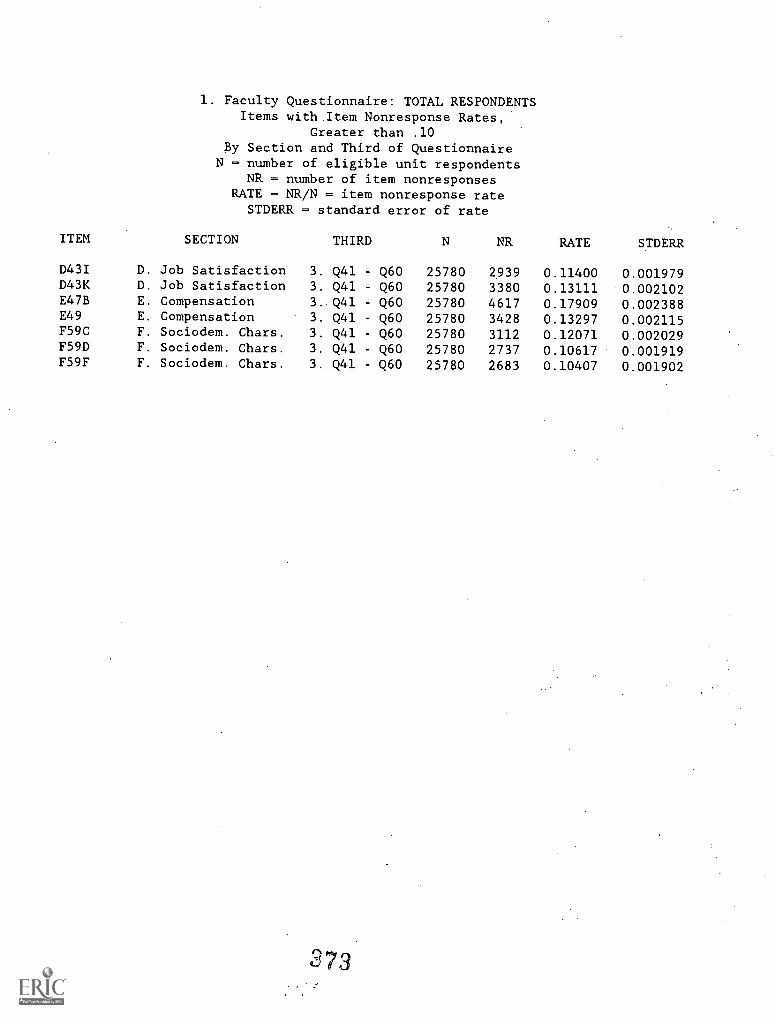
1. Faculty Questionnaire: TOTAL RESPONDENTSItems with Item Nonresponse Rates,
Greater than .10By Section and Third of Questionnaire
N number of eligible unit respondentsNR = number of item nonresponses
RATE = NR/N item nonresponse rateSTDERR = standard error of rate
ITEM SECTION THIRD N NR RATE STDERR
D43I D. Job Satisfaction 3. Q41 - Q60 25780 2939 0.11400 0.001979D43K D. Job Satisfaction 3. Q41 - Q60 25780 3380 0.13111 0.002102E47B E. Compensation 3.,Q41 - Q60 25780 4617 0.17909 0.002388E49 E. Compensation 3. Q41 Q60 25780 3428 0.13297 0.002115F59C F. Sociodem. Chars. 3. Q41 - Q60 25780 3112 0.12071 0.002029F59D F. Sociodem. Chars. 3. Q41 - Q60 25780 2737 0.10617 0.001919F59F F. Sociodem. Chars. 3. Q41 Q60 25780 2683 0.10407 0.001902
373
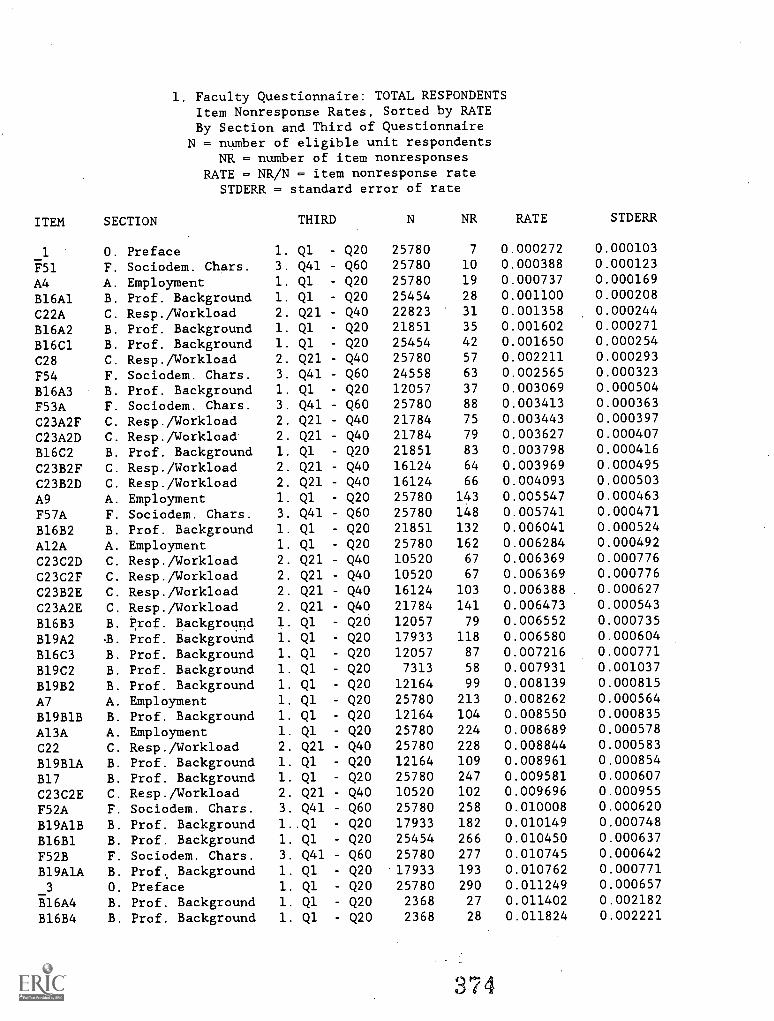
1. Faculty Questionnaire: TOTAL RESPONDENTSItem Nonresponse Rates, Sorted by RATEBy Section and Third of Questionnaire
N = number of eligible unit respondentsNR = number of item nonresponses
RATE = NR/N = item nonresponse rateSTDERR = standard error of rate
ITEM SECTION THIRD N NR RATE STDERR
O. Preface 1. Ql - Q20 25780 7 0.000272 0.000103_1F51 F. Sociodem. Chars. 3. Q41 - Q60 25780 10 0.000388 0.000123
A4 A. Employment 1. Q1 - Q20 25780 19 0.000737 0.000169
B16A1 B. Prof. Background 1. Ql - Q20 25454 28 0.001100 0.000208
C22A C. Resp./Workload 2. Q21 - Q40 22823 31 0.001358 0.000244
B16A2 B. Prof. Background 1. Ql - Q20 21851 35 0.001602 0.000271
B16C1 B. Prof. Background 1. Ql - Q20 25454 42 0.001650 0.000254
C28 C. Resp./Workload 2. Q21 - Q40 25780 57 0.002211 0.000293
F54 F. Sociodem. Chars. 3. Q41 - Q60 24558 63 0.002565 0.000323
B16A3 B. Prof. Background 1. Ql - Q20 12057 37 0.003069 0.000504
F53A F. Sociodem. Chars. 3. Q41 - Q60 25780 88 0.003413 0.000363
C23A2F C. Resp./Workload 2. Q21 - Q40 21784 75 0.003443 0.000397
C23A2D C. Resp./Workload 2. Q21 - Q40 21784 79 0.003627 0.000407
B16C2 B. Prof. Background 1. Ql - Q20 21851 83 0.003798 0.000416
C23B2F C. Resp./Workload 2. Q21 - Q40 16124 64 0.003969 0.000495
C23B2D C. Resp./Workload 2. Q21 - Q40 16124 66 0.004093 0.000503
A9 A. Employment 1. Ql - Q20 25780 143 0.005547 0.000463
F57A F. Sociodem. Chars. 3. Q41 - Q60 25780 148 0.005741 0.000471
B16B2 B. Prof. Background 1. Ql - Q20 21851 132 0.006041 0.000524
Al2A A. Employment 1. Ql - Q20 25780 162 0.006284 0.000492
C23C2D C. Resp./Workload 2. Q21 - Q40 10520 67 0.006369 0.000776
C23C2F C. Resp./Workload 2. Q21 - Q40 10520 67 0.006369 0.000776
C23B2E C. Resp./Workload 2. Q21 - Q40 16124 103 0.006388 0.000627
C23A2E C. Resp./Workload 2. Q21 - Q40 21784 141 0.006473 0.000543
B16B3 B. prof. Background 1. Ql - Q20 12057 79 0.006552 0.000735
B19A2 -B. Prof. Background 1. Ql - Q20 17933 118 0.006580 0.000604
B16C3 B. Prof. Background 1. Ql - Q20 12057 87 0.007216 0.000771
B19C2 B. Prof. Background 1. Ql - Q20 7313 58 0.007931 0.001037
B19B2 B. Prof. Background 1. Ql - Q20 12164 99 0.008139 0.000815
A7 A. Employment 1. Ql - Q20 25780 213 0.008262 0.000564
B19B1B B. Prof. Background 1. Ql - Q20 12164 104 0.008550 0.000835
Al3A A. Employment 1. Ql - Q20 25780 224 0.008689 0.000578
C22 C. Resp./Workload 2. Q21 - Q40 25780 228 0.008844 0.000583
B19B1A B. Prof. Background 1. Ql - Q20 12164 109 0.008961 0.000854
B17 B. Prof. Background 1. Ql - Q20 25780 247 0.009581 0.000607
C23C2E C. Resp./Workload 2. Q21 - Q40 10520 102 0.009696 0.000955
F52A F. Sociodem. Chars. 3. Q41 - Q60 25780 258 0.010008 0.000620
B19A1B B. Prof. Background 1..Q1 - Q20 17933 182 0.010149 0.000748
B16B1 B. Prof. Background 1. Ql - Q20 25454 266 0.010450 0.000637
F52B F. Sociodem. Chars. 3. Q41 - Q60 25780 277 0.010745 0.000642
B19A1A B. Prof, Background 1. Ql - Q20 17933 193 0.010762 0.000771
_3 O. Preface 1. Ql - Q20 25780 290 0.011249 0.000657
B16A4 B. Prof. Background 1. Q1 - Q20 2368 27 0.011402 0.002182
B16B4 B. Prof. Background 1. Ql - Q20 2368 28 0.011824 0.002221
374
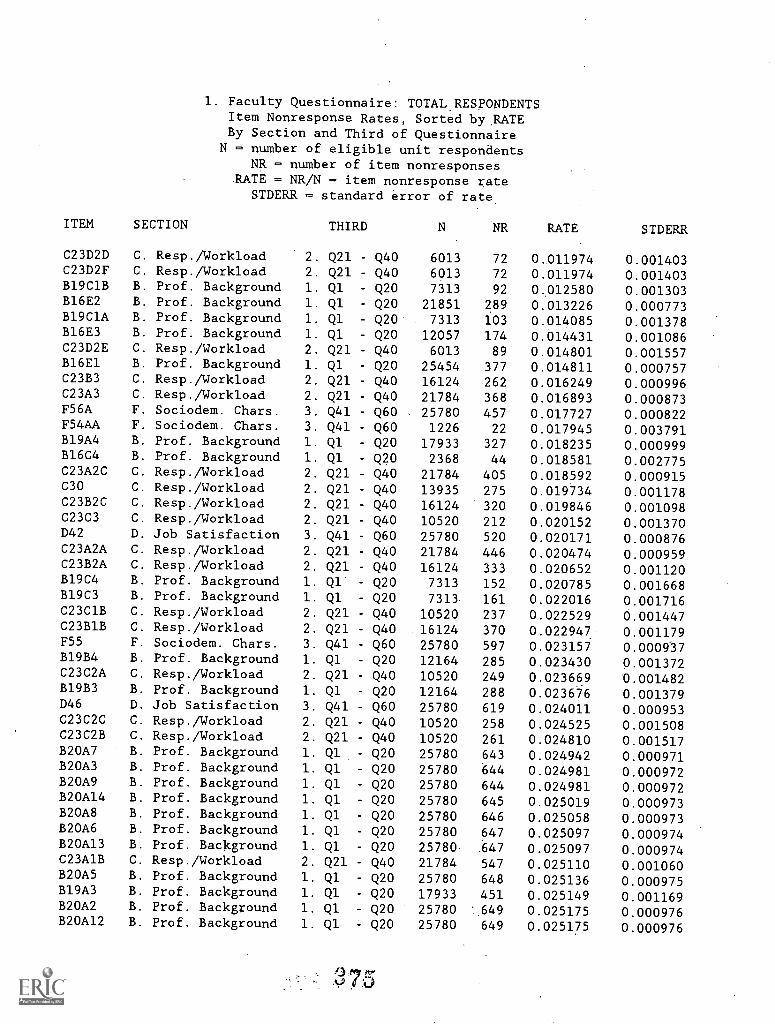
1. Faculty Questionnaire: TOTAL. RESPONDENTSItem Nonresponse Rates, Sorted by.RATEBy Section and Third of Questionnaire
N = number of eligible unit respondentsNR = number of item nonresponses
.RATE = NR/N = item nonresponse rateSTDERR = standard error of rate.
ITEM SECTION THIRD N NR RATE STDERR
C23D2D C. Resp./Workload 2. Q21 Q40 6013 72 0.011974 0.001403C23D2F C. Resp./Workload 2. Q21 Q40 6013 72 0.011974 0.001403B19C1B B. Prof. Background 1. Ql - Q20 7313 92 0.012580 0.001303B16E2 B. Prof. Background 1. Ql Q20 21851 289 0.013226 0.000773B19C1A B. Prof. Background 1. Ql - Q20 7313 103 0.014085 0.001378B16E3 B. Prof. Background 1. Ql - Q20 12057 174 0.014431 0.001086C23D2E C. Resp./Workload 2. Q21 - Q40 6013 89 0.014801 0.001557B16E1 B. Prof. Background 1. Ql Q20 25454 377 0.014811 0.000757C23B3 C. Resp./Workload 2. Q21 - Q40 16124 262 0.016249 0.000996C23A3 C. Resp./Workload 2. Q21 Q40 21784 368 0.016893 0.000873F56A F. Sociodem. Chars. 3. Q41 - Q60 25780 457 0.017727 0.000822F54AA F. Sociodem. Chars. 3. Q41 - Q60 1226 22 0.017945 0.003791B19A4 B. Prof. Background 1. Q1 - Q20 17933 327 0.018235 0.000999B16C4 B. Prof. Background 1. Ql - Q20 2368 44 0.018581 0.002775C23A2C C. Resp./Workload 2. Q21 Q40 21784 405 0.018592 0.000915C30 C. Resp./Workload 2. Q21 - Q40 13935 275 0.019734 0.001178C23B2C C. Resp./Workload 2. Q21 - Q40 16124 320 0.019846 0.001098C23C3 C. Resp./Workload 2. Q21 - Q40 10520 212 0.020152 0.001370D42 D. Job Satisfaction 3. Q41 - Q60 25780 520 0.020171 0.000876C23A2A C. Resp./Workload 2. Q21 - Q40 21784 446 0.020474 0.000959C23B2A C. Resp./Workload 2. Q21 - Q40 16124 333 0.020652 0.001120B19C4 B. Prof. Background 1. Ql - Q20 7313 152 0.020785 0.001668B19C3 B. Prof. Background 1. Q1 - Q20 7313 161 0.022016 0.001716C23C1B C. Resp./Workload 2. Q21 - Q40 10520 237 0.022529 0.001447C23B1B C. Resp./Workload 2. Q21 - Q40 16124 370 0.022947 0.001179F55 F. Sociodem. Chars. 3. Q41 Q60 25780 597 0.023157 0.000937B19B4 B. Prof. Background 1. Q1 - Q20 12164 285 0.023430 0.001372C23C2A C. Resp./Workload 2. Q21 - Q40 10520 249 0.023669 0.001482B19B3 B. Prof. Background 1. Ql - Q20 12164 288 0.023676 0.001379D46 D. Job Satisfaction 3. Q41 - Q60 25780 619 0.024011 0.000953C23C2C C. Resp./Workload 2. Q21 - Q40 10520 258 0.024525 0.001508C23C2B C. Resp./Workload 2. Q21 - Q40 10520 261 0.024810 0.001517B20A7 B. Prof. Background 1. Q1 - Q20 25780 643 0.024942 0.000971B20A3 B. Prof. Background 1. Ql - Q20 25780 644 0.024981 0.000972B20A9 B. Prof. Background 1. Ql - Q20 25780 644 0.024981 0.000972B20A14 B. Prof. Background 1. Q1 - Q20 25780 645 0.025019 0.000973B20A8 B. Prof. Background 1. Q1 - Q20 25780 646 0.025058 0.000973B20A6 B. Prof. Background 1. Ql - Q20 25780 647 0.025097 0.000974820A13 B. Prof. Background 1. Ql - Q20 25780 .647 0.025097 0.000974C23A1B C. Resp./Workload 2. Q21 - Q40 21784 547 0.025110 0.001060B20A5 B. Prof. Background 1. Q1 - Q20 25780 648 0.025136 0.000975B19A3 B. Prof. Background 1. Ql - Q20 17933 451 0.025149 0.001169B20A2 B. Prof. Background 1. Ql - Q20 25780 649 0.025175 0.000976B20Al2 B. Prof. Background 1. Ql - Q20 25780 649 0.025175 0.000976
3 I
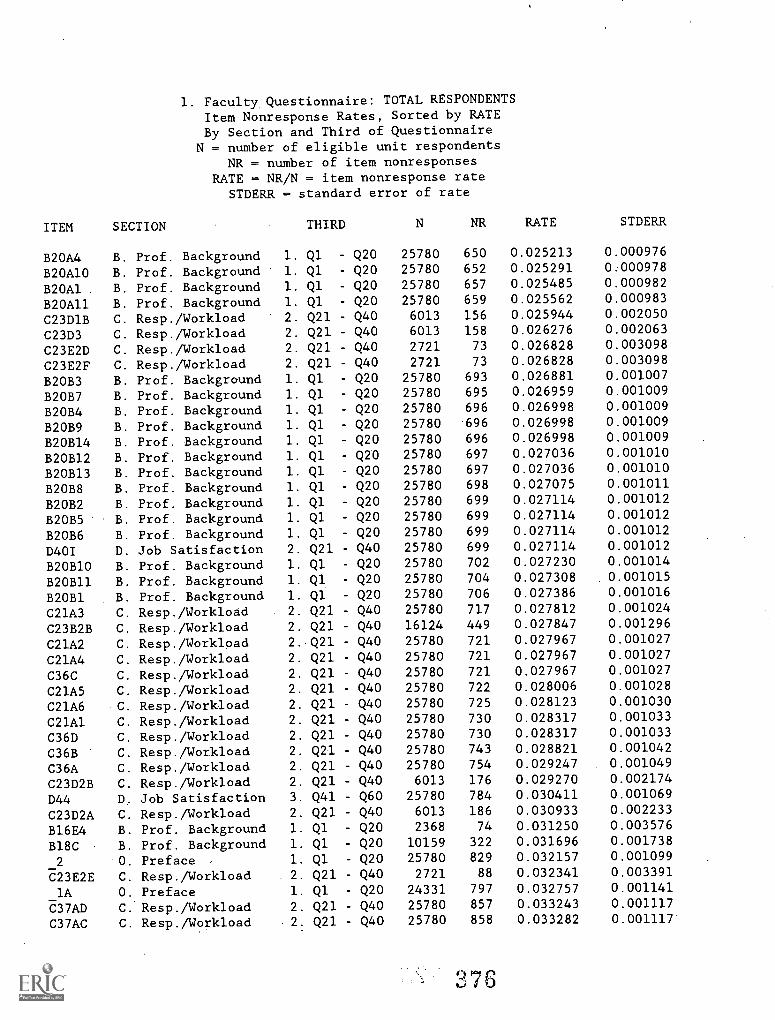
1. Faculty Questionnaire: TOTAL RESPONDENTSItem Nonresponse Rates, Sorted by RATEBy Section and Third of Questionnaire
N = number of eligible unit respondentsNR - number of item nonresponses
RATE = NR/N = item nonresponse rateSTDERR - standard error of rate
ITEM SECTION THIRD N NR RATE STDERR
B20A4 B. Prof. Background 1. Q1 - Q20 25780 650 0.025213 0.000976
B20A10 B. Prof. Background 1. Ql - Q20 25780 652 0.025291 0.000978
B20A1 B. Prof. Background 1. Ql - Q20 25780 657 0.025485 0.000982
B20A11 B. Prof. Background 1. Ql - Q20 25780 659 0.025562 0.000983
C23D1B C. Resp./Workload 2. Q21 - Q40 6013 156 0.025944 0.002050
C23D3 C. Resp./Workload 2. Q21 Q40 6013 158 0.026276 0.002063
C23E2D C. Resp./Workload 2. Q21 - Q40 2721 73 0.026828 0.003098
C23E2F C. Resp./Workload 2. Q21 - Q40 2721 73 0.026828 0.003098
B20B3 B. Prof. Background 1. Q1 - Q20 25780 693 0.026881 0.001007
B2087 B. Prof. Background 1. Ql - Q20 25780 695 0.026959 0.001009
B20B4 B. Prof. Background 1. Ql - Q20 25780 696 0.026998 0.001009
B20B9 B. Prof. Background 1. Ql - Q20 25780 696 0.026998 0.001009
B20B14 B. Prof. Background 1. Ql - Q20 25780 696 0.026998 0.001009
B20B12 B. Prof. Background 1. Q1 - Q20 25780 697 0.027036 0.001010
820B13 B. Prof. Background 1. Q1 - Q20 25780 697 0.027036 0.001010
B20B8 B. Prof. Background 1. Q1 - Q20 25780 698 0.027075 0.001011
B20B2 B. Prof. Background 1. Q1 - Q20 25780 699 0.027114 0.001012
B20B5 B. Prof. Background 1. Q1 - Q20 25780 699 0.027114 0.001012
B20B6 B. Prof. Background 1. Ql - Q20 25780 699 0.027114 0.001012
D401 D. Job Satisfaction 2. Q21 - Q40 25780 699 0.027114 0.001012
B20B10 B. Prof. Background 1. Ql - Q20 25780 702 0.027230 0.001014
B20B11 B. Prof. Background 1. Q1 - Q20 25780 704 0.027308 0.001015
B20B1 B. Prof. Background 1. Ql - Q20 25780 706 0.027386 0.001016
C21A3 C. Resp./Workload 2. Q21 - Q40 25780 717 0.027812 0.001024
C23B2B C. Resp./Workload 2. Q21 - Q40 16124 449 0.027847 0.001296
C21A2 C. Resp./Workload 2. Q21 - Q40 25780 721 0.027967 0.001027
C21A4 C. Resp./Workload 2. Q21 - Q40 25780 721 0.027967 0.001027
C36C C. Resp./Workload 2. Q21 - Q40 25780 721 0.027967 0.001027
C21A5 C. Resp./Workload 2. Q21 - Q40 25780 722 0.028006 0.001028
C21A6 C. Resp./Workload 2. Q21 - Q40 25780 725 0.028123 0.001030
C21A1 C. Resp./Workload 2. Q21 - Q40 25780 730 0.028317 0.001033
C36D C. Resp./Workload 2. Q21 - Q40 25780 730 0.028317 0.001033
C36B C. Resp./Workload 2. Q21 - Q40 25780 743 0.028821 0.001042
C36A C. Resp./Workload 2. Q21 - Q40 25780 754 0.029247 0.001049
C23D2B C. Resp./Workload 2. Q21 - Q40 6013 176 0.029270 0.002174
D44 D. Job Satisfaction 3. Q41 - Q60 25780 784 0.030411 0.001069
C23D2A C. Resp./Workload 2. Q21 - Q40 6013 186 0.030933 0.002233
B16E4 B. Prof. Background 1. Ql - Q20 2368 74 0.031250 0.003576
B18C B. Prof. Background 1. Q1 - Q20 10159 322 0.031696 0.001738
O. Preface , 1. Q1 - Q20 25780 829 0.032157 0.001099_2C23E2E C. Resp./Workload 2. Q21 - Q40 2721 88 0.032341 0.003391
_lA O. Preface 1. Ql - Q20 24331 797 0.032757 0.001141
C37AD C. Resp./Workload 2. Q21 - Q40 25780 857 0.033243 0.001117
C37AC C. Resp./Workload 2: Q21 - Q40 25780 858 0.033282 0.001117'
X76
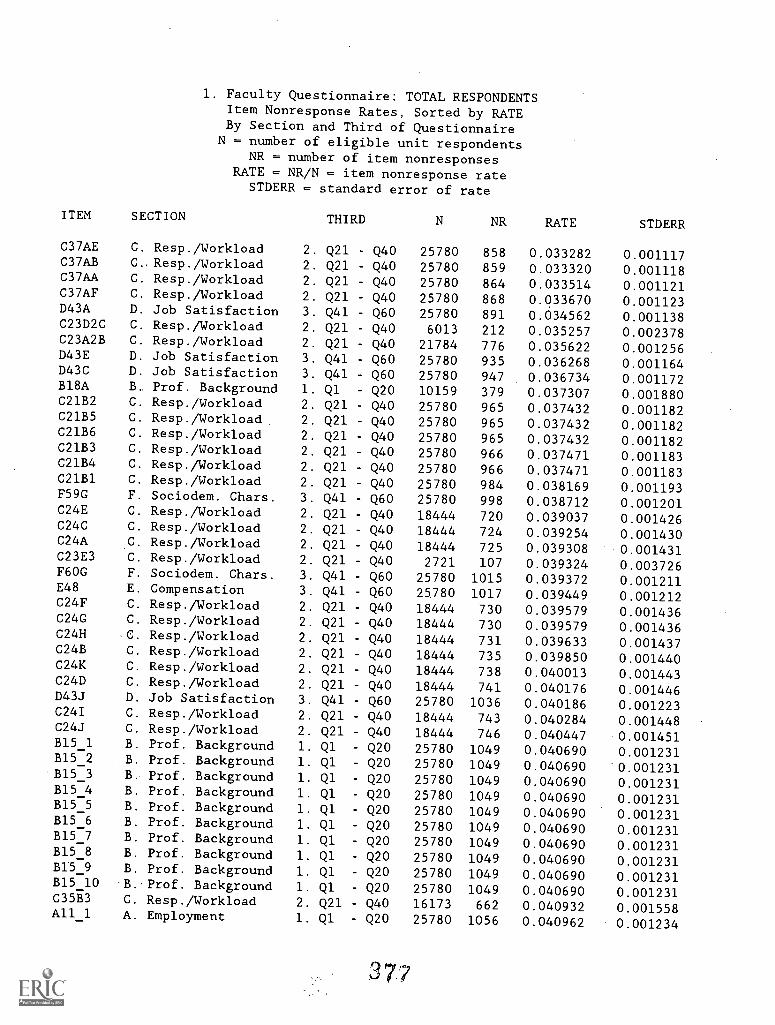
1. Faculty Questionnaire: TOTAL RESPONDENTSItem Nonresponse Rates, Sorted by RATEBy Section and Third of Questionnaire
N = number of eligible unit respondentsNR = number of item nonresponses
RATE = NR/N = item nonresponse rateSTDERR = standard error of rate
ITEM SECTION THIRD N NR RATE STDERR
C37AE C. Resp./Workload 2. Q21 Q40 25780 858 0.033282 0.001117C37AB C.. Resp./Workload 2. Q21 Q40 25780 859 0.033320 0.001118C37AA C. Resp./Workload 2. Q21 - Q40 25780 864 0.033514 0.001121C37AF C. Resp./Workload 2. Q21 - Q40 25780 868 0.033670 0.001123D43A D. Job Satisfaction 3. Q41 - Q60 25780 891 0.034562 0.001138C23D2C C. Resp./Workload 2. Q21 Q40 6013 212 0.035257 0.002378C23A2B C. Resp./Workload 2. Q21 Q40 21784 776 0.035622 0.001256D43E D. Job Satisfaction 3. Q41 - Q60 25780 935 0.036268 0.001164D43C D. Job Satisfaction 3. Q41 - Q60 25780 947 0.036734 0.001172B18A B. Prof. Background 1. Ql Q20 10159 379 0.037307 0.001880C21B2 C. Resp./Workload 2. Q21 - Q40 25780 965 0.037432 0.001182C21B5 C. Resp./Workload 2. Q21 Q40 25780 965 0.037432 0.001182C21B6 C. Resp./Workload 2. Q21 - Q40 25780 965 0.037432 0.001182C21B3 C. Resp./Workload 2. Q21 - Q40 25780 966 0.037471 0.001183C21B4 C. Resp./Workload 2. Q21 - Q40 25780 966 0.037471 0.001183C21B1 C. Resp./Workload 2. Q21 Q40 25780 984 0.038169 0.001193F59G F. Sociodem. Chars. 3. Q41 - Q60 25780 998 0.038712 0.001201C24E C. Resp./Workload 2. Q21 - Q40 18444 720 0.039037 0.001426C24C C. Resp./Workload 2. Q21 - Q40 18444 724 0.039254 0.001430C24A C. Resp./Workload 2. Q21 - Q40 18444 725 0.039308 0.001431C23E3 C. Resp./Workload 2. Q21 Q40 2721 107 0.039324 0.003726F6OG F. Sociodem. Chars. 3. Q41 - Q60 25780 1015 0.039372 0.001211E48 E. Compensation 3. Q41 - Q60 25780 1017 0.039449 0.001212C24F C. Resp./Workload 2. Q21 - Q40 18444 730 0.039579 0.001436C24G C. Resp./Workload 2. Q21 Q40 18444 730 0.039579 0.001436C24H C. Resp./Workload 2. Q21 - Q40 18444 731 0.039633 0.001437C24B C. Resp./Workload 2. Q21 - Q40 18444 735 0.039850 0.001440C24K C. Resp./Workload 2. Q21 - Q40 18444 738 0.040013 0.001443C24D C. Resp./Workload 2. Q21 Q40 18444 741 0.040176 0.001446D43J D. Job Satisfaction 3. Q41 - Q60 25780 1036 0.040186 0.001223C24I C. Resp./Workload 2. Q21 - Q40 18444 743 0.040284 0.001448C24J C. Resp./Workload 2. Q21 - Q40 18444 746 0.040447 0.001451B15_1 B. Prof. Background 1. Ql - Q20 25780 1049 0.040690 0.001231B15_2 B. Prof. Background 1. Q1 - Q20 25780 1049 0.040690 0.001231B15_3 B. Prof. Background 1. Q1 - Q20 25780 1049 0.040690 0.001231B15_4 B. Prof. Background 1. Ql - Q20 25780 1049 0.040690 0.001231B155 B. Prof. Background 1. Ql - Q20 25780 1049 0.040690 0.001231B15:6 B. Prof. Background 1. Ql Q20 25780 1049 0.040690 0.001231B15_7 B. Prof. Background 1. Ql - Q20 25780 1049 0.040690 0.001231B15_8 B. Prof. Background 1. Ql - Q20 25780 1049 0.040690 0.001231B15 9 B. Prof. Background 1. Ql - Q20 25780 1049 0.040690 0.001231B15:10 .B. Prof. Background 1. Ql - Q20 25780 1049 0.040690 0.001231C35B3 C. Resp./Workload 2. Q21 - Q40 16173 662 0.040932 0.001558Al1_1 A. Employment 1. Ql - Q20 25780 1056 0.040962 0.001234
37.7
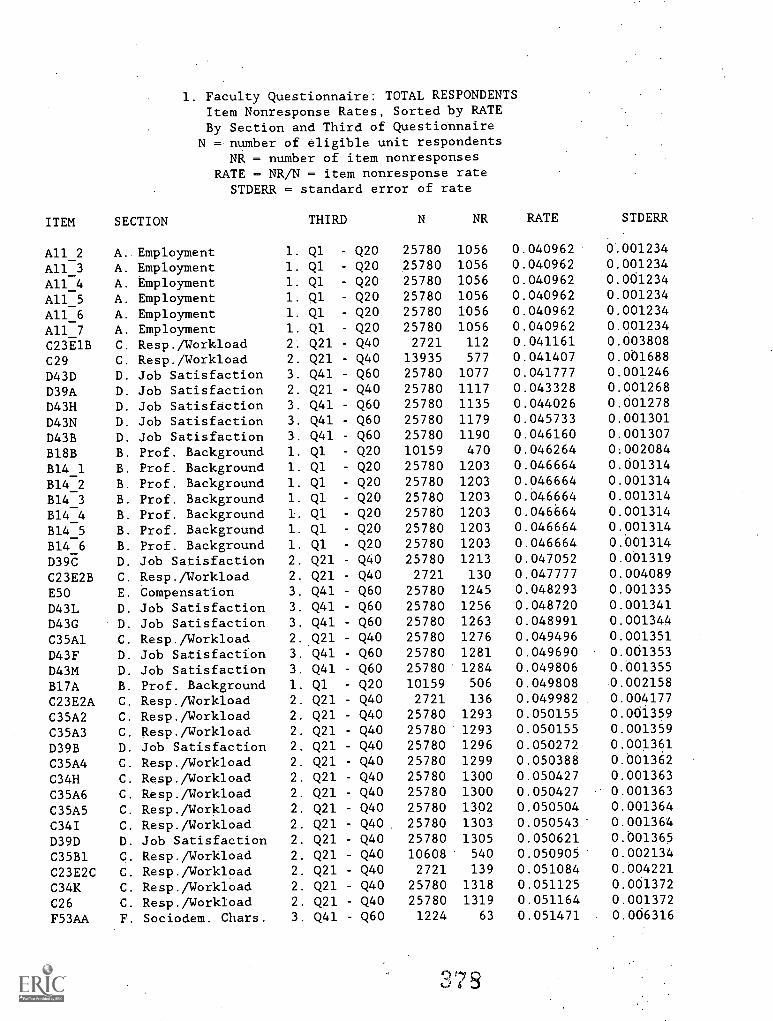
1. Faculty Questionnaire: TOTAL RESPONDENTSItem Nonresponse Rates, Sorted by RATEBy Section and Third of Questionnaire
N = number of eligible unit respondentsNR = number of item nonresponses
RATE = NR/N = item nonresponse rateSTDERR = standard error of rate
ITEM SECTION THIRD N NR RATE STDERR
A11_2 A. Employment 1. Ql - Q20 25780 1056 0.040962 0.001234
A11_3 A. Employment 1. Ql - Q20 25780 1056 0.040962 0.001234
A11_4 A. Employment 1. Ql - Q20 25780 1056 0.040962 0.001234
All A. Employment 1. Ql - Q20 25780 1056 0.040962 0.001234_5A11_6 A. Employment 1. Ql - Q20 25780 1056 0.040962 0.001234
All_7 A. Employment 1. Ql - Q20 25780 1056 0.040962 0.001234
C23E1B C. Resp./Workload 2. Q21 - Q40 2721 112 0.041161 0.003808
C29 C. Resp./Workload 2. Q21 - Q40 13935 577 0.041407 0.001688
D43D D. Job Satisfaction 3. Q41 Q60 25780 1077 0.041777 0.001246
D39A D. Job Satisfaction 2. Q21 - Q40 25780 1117 0.043328 0.001268
D43H D. Job Satisfaction 3. Q41 - Q60 25780 1135 0.044026 0.001278
D43N D. Job Satisfaction 3. Q41 - Q60 25780 1179 0.045733 0.001301
D43B D. Job Satisfaction 3. Q41 - Q60 25780 1190 0.046160 0.001307
B18B B. Prof. Background 1. Ql Q20 10159 470 0.046264 0:002084
B14_1 B. Prof. Background 1. Ql - Q20 25780 1203 0.046664 0.001314
B14_2 B. Prof. Background 1. Ql - Q20 25780 1203 0.046664 0.001314
B14_3 B. Prof. Background 1. Ql Q20 25780 1203 0.046664 0.001314
B14_4 B. Prof. Background 1. Q1 - Q20 25780 1203 0.046664 0.001314
B14_5 B. Prof. Background 1. Ql Q20 25780 1203 0.046664 0.001314
B14_6 B. Prof. Background 1. Ql - Q20 25780 1203 0.046664 0.001314
D39C D. Job Satisfaction 2. Q21 - Q40 25780 1213 0.047052 0.001319
C23E2B C. Resp./Workload 2. Q21 Q40 2721 130 0.047777 0.004089
E50 E. Compensation 3. Q41 Q60 25780 1245 0.048293 0.001335
D43L D. Job Satisfaction 3. Q41 - Q60 25780 1256 0.048720 0.001341
D43G D. Job Satisfaction 3. Q41 - Q60 25780 1263 0.048991 0.001344
C35A1 C. Resp./Workload 2. Q21 - Q40 25780 1276 0.049496 0.001351
D43F D. Job Satisfaction 3. Q41 - Q60 25780 1281 0.049690 0.001353
D43M D. Job Satisfaction 3. Q41 - Q60 25780 1284 0.049806 0.001355
B17A B. Prof. Background 1. Ql - Q20 10159 506 0.049808 0.002158
C23E2A C. Resp./Workload 2. Q21 - Q40 2721 136 0.049982 0.004177
C35A2 C. Resp./Workload 2. Q21 - Q40 25780 1293 0.050155 0.001359
C35A3 C. Resp./Workload 2. Q21 - Q40 25780 1293 0.050155 0.001359
D39B D. Job Satisfaction 2. Q21 - Q40 25780 1296 0.050272 0.001361
C35A4 C. Resp./Workload 2. Q21 - Q40 25780 1299 0.050388 0.001362
C34H C. Resp./Workload 2. Q21 - Q40 25780 1300 0.050427 0.001363
C35A6 C. Resp./Workload 2. Q21 - Q40 25780 1300 0.050427 0.001363
C35A5 C. Resp./Workload 2. Q21 - Q40 25780 1302 0.050504 0.001364
C34I C. Resp./Workload 2. Q21 - Q40 25780 1303 0.050543 0.001364
D39D D. Job Satisfaction 2. Q21 - Q40 25780 1305 0.050621 0.001365
C35B1 C. Resp./Workload 2. Q21 - Q40 10608 540 0.050905 0.002134
C23E2C C. Resp./Workload 2. Q21 - Q40 2721 139 0.051084 0.004221
C34K C. Resp./Workload 2. Q21 - Q40 25780 1318 0.051125 0.001372
C26 C. Resp./Workload 2. Q21 - Q40 25780 1319 0.051164 0.001372
F53AA F. Sociodem. Chars. 3. Q41 - Q60 1224 63 0.051471 0.006316
r,
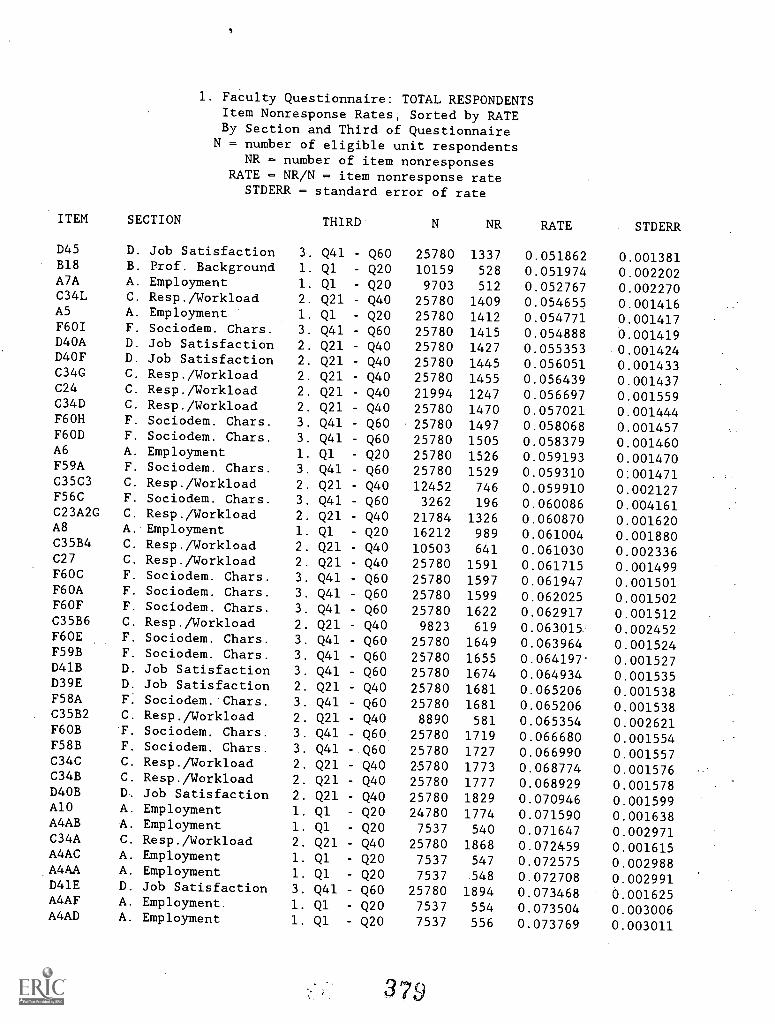
1. Faculty Questionnaire: TOTAL RESPONDENTSItem Nonresponse Rates, Sorted by RATEBy Section and Third of Questionnaire
N = number of eligible unit respondentsNR = number of item nonresponses
RATE = NR/N = item nonresponse rateSTDERR = standard error of rate
ITEM SECTION THIRD N NR RATE STDERR
D45 D. Job Satisfaction 3. Q41 - Q60 25780 1337 0.051862 0.001381B18 B. Prof. Background 1. Ql - Q20 10159 528 0.051974 0.002202A7A A. Employment 1. Ql Q20 9703 512 0.052767 0.002270C34L C. Resp./Workload 2. Q21 - Q40 25780 1409 0.054655 0.001416A5 A. Employment 1. Ql - Q20 25780 1412 0.054771 0.001417F601 F. Sociodem. Chars. 3. Q41 - Q60 25780 1415 0.054888 0.001419D40A D. Job Satisfaction 2. Q21 Q40 25780 1427 0.055353 0.001424D4OF D. Job Satisfaction 2. Q21 - Q40 25780 1445 0.056051 0.001433C34G C. Resp./Workload 2. Q21 - Q40 25780 1455 0.056439 0.001437C24 C. Resp./Workload 2. Q21 Q40 21994 1247 0.056697 0.001559C34D C. Resp./Workload 2. Q21 - Q40 25780 1470 0.057021 0.001444F6OH F. Sociodem. Chars. 3. Q41 Q60 25780 1497 0.058068 0.001457F6OD F. Sociodem. Chars. 3. Q41 - Q60 25780 1505 0.058379 0.001460A6 A. Employment 1. Ql Q20 25780 1526 0.059193 0.001470F59A F. Sociodem. Chars. 3. Q41 Q60 25780 1529 0.059310 0:001471C35C3 C. Resp./Workload 2. Q21 Q40 12452 746 0.059910 0.002127F56C F. Sociodem. Chars. 3. Q41 - Q60 3262 196 0.060086 0.004161C23A2G C. Resp./Workload 2. Q21 - Q40 21784 1326 0.060870 0.001620A8 A. Employment 1. Ql Q20 16212 989 0.061004 0.001880C35B4 C. Resp./Workload 2. Q21 - Q40 10503 641 0.061030 0.002336C27 C. Resp./Workload 2. Q21 - Q40 25780 1591 0.061715 0.001499F60C F. Sociodem. Chars. 3. Q41 - Q60 25780 1597 0.061947 0.001501F60A F. Sociodem. Chars. 3. Q41 - Q60 25780 1599 0.062025 0.001502F6OF F. Sociodem. Chars. 3. Q41 - Q60 25780 1622 0.062917 0.001512C35B6 C. Resp./Workload 2. Q21 - Q40 9823 619 0.063015 0.002452F60E F. Sociodem. Chars. 3. Q41 - Q60 25780 1649 0.063964 0.001524F59B F. Sociodem. Chars. 3. Q41 - Q60 25780 1655 0.064197. 0.001527D41B D. Job Satisfaction 3. Q41 - Q60 25780 1674 0.064934 0.001535D39E D. Job Satisfaction 2. Q21 - Q40 25780 1681 0.065206 0.001538F58A F. Sociodem. Chars. 3. Q41 - Q60 25780 1681 0.065206 0.001538C35B2 C. Resp./Workload 2. Q21 - Q40 8890 581 0.065354 0.002621F6OB F. Sociodem. Chars. 3. Q41 - Q60 25780 1719 0.066680 0.001554F58B F. Sociodem. Chars. 3. Q41 -.Q60 25780 1727 0.066990 0.001557C34C C. Resp./Workload 2. Q21 - Q40 25780 1773 0.068774 0.001576C34B C. Resp./Workload 2. Q21 - Q40 25780 1777 0.068929 0.001578D4OB D. Job Satisfaction 2. Q21 - Q40 25780 1829 0.070946 0.001599A10 A. Employment 1. Q1 - Q20 24780 1774 0.071590 0.001638A4AB A. Employment 1. Q1 - Q20 7537 540 0.071647 0.002971C34A C. Resp./Workload 2. Q21 - Q40 25780 1868 0.072459 0.001615A4AC A. Employment 1. Q1 - Q20 7537 547 0.072575 0.002988A4AA A. Employment 1. Q1 - Q20 7537 548 0.072708 0.002991D41E D. Job Satisfaction 3. Q41 - Q60 25780 1894 0.073468 0.001625A4AF A. Employment. 1. Q1 - Q20 7537 554 0.073504 0.003006A4AD A. Employment 1. Q1 - Q20 7537 556 0.073769 0.003011
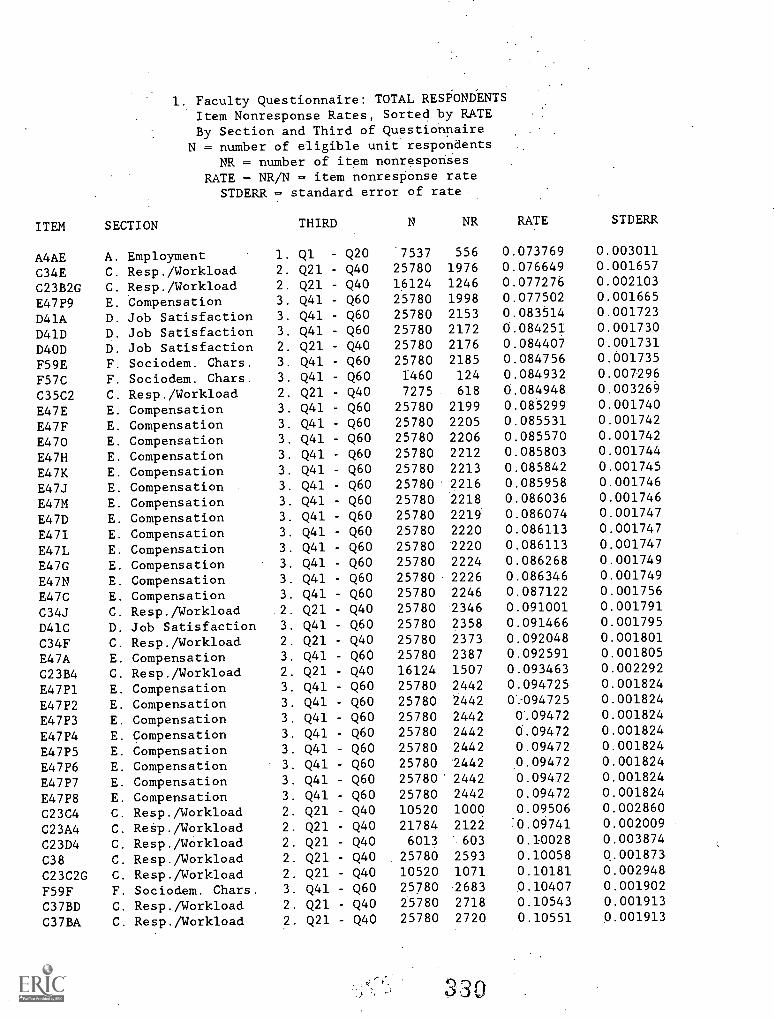
.Faculty Questionnaire: TOTAL RESPONDENTSItem Nonresponse Rates, Sorted by RATEBy Section and Third of Questionnaire
N = number of eligible unit respondentsNR = number of item nonresporises
RATE = NR/N = item nonresponse rateSTDERR = standard error of rate.
ITEM SECTION THIRD N NR RATE STDERR
A4AE A. Employment 1. Ql Q20 7537 556 0.073769 0.003011
C34E C. Resp./Workload 2. Q21 - Q40 25780 1976 0.076649 0.001657
C23B2G C. Resp./Workload 2. Q21 - Q40 16124 1246 0.077276 0.002103
E47P9 E. Compensation 3. Q41 - Q60 25780 1998 0.077502 0.001665
D41A D. Job Satisfaction 3. Q41 - Q60 25780 2153 0.083514 0.001723
D41D D. Job Satisfaction 3. Q41 - Q60 25780 2172 0.084251 0.001730
D4OD D. J'ob Satisfaction 2. Q21 - Q40 25780 2176 0.084407 0.001731
F59E F. Sociodem. Chars. 3. Q41 - Q60 25780 2185 0.084756 0.001735
F57C F. Sociodem. Chars. 3. Q41 Q60 1460 124 0.084932 0.007296
C35C2 C. Resp./Workload 2. Q21 - Q40 7275 618 0.084948 0.003269
E47E E. Compensation 3. Q41 Q60 25780 2199 0.085299 0.001740
E47F E. Compensation 3. Q41 - Q60 25780 2205 0.085531 0.001742
E470 E. Compensation 3. Q41 Q60 25780 2206 0.085570 0.001742
E47H E. Compensation 3. Q41 - Q60 25780 2212 0.085803 0.001744
E47K E. Compensation 3. Q41 - Q60 25780 2213 0.085842 0.001745
E47J E. Compensation 3. Q41 - Q60 25780 2216 0.085958 0.001746
E47M E. Compensation 3. Q41 Q60 25780 2218 0.086036 0.001746
E47D E. Compensation 3. Q41 - Q60 25780 2219 0.086074 0.001747
E47I E. Compensation 3. Q41 - Q60 25780 2220 0.086113 0.001747
E47L E. Compensation 3. Q41 - Q60 25780 2220 0.086113 0.001747
E47G E. Compensation 3. Q41 - Q60 25780 2224 0.086268 0.001749
E47N E. Compensation 3. Q41 - Q60 25780 2226 0.086346 0.001749
E47C E. Compensation 3. Q41 - Q60 25780 2246 0.087122 0.001756
C34J C. Resp./Workload .2. Q21 - Q40 25780 2346 0.091001 0.001791
D41C D. Job Satisfaction 3. Q41 - Q60 25780 2358 0.091466 0.001795
C34F C. Resp./Workload 2. Q21 Q40 25780 2373 0.092048 0.001801
E47A E. Compensation 3. Q41 - Q60 25780 2387 0.092591 0.001805
C23B4 C. Resp./Workload 2. Q21 - Q40 16124 1507 0.093463 0.002292
E47PI E. Compensation 3. Q41 - Q60 25780 2442 0.094725 0.001824
E47P2 E. Compensation 3. Q41 - Q60 25780 2442 0:094725 0.001824
E47P3 E. Compensation 3. Q41 - Q60 25780 2442 0'.09472 0.001824
E47P4 E. Compensation 3. Q41 - Q60 25780 2442 0.09472 0.001824
E47P5 E. Compensation 3. Q41 - Q60 25780 2442 0.09472 0.001824
E47P6 E. Compensation 3. Q41 - Q60 25780 '2442 .0.09472 0.001824
E47P7 E. Compensation 3. Q41 - Q60 25780' 2442 0.09472 0.001824
E47P8 E. Compensation 3. Q41 - Q60 25780 2442 0.09472 0.001824
C23C4 C. Resp./Workload 2. Q21 - Q40 10520 1000 0.09506 0.002860
C23A4 C. Resp./Workload 2. Q21 - Q40 21784 2122 0.09741 0.002009
C23D4 C. Resp./Workload 2. Q21 - Q40 6013 603 0.10028 0.003874
C38 C. Resp./Workload 2. Q21 - Q40 25780 2593 0.10058 0.001873
C23C2G C. Resp./Workload 2. Q21 - Q40 10520 1071 0.10181 0.002948
F59F F. Sociodem. Chars. 3. Q41 - Q60 25780 -2683 0.10407 0.001902
C37BD C. Resp./Workload 2. Q21 - Q40 25780 2718 0.10543 0.001913
C37BA C. Resp./Workload 2. Q21 - Q40 25780 2720 0.10551 0.001913
330
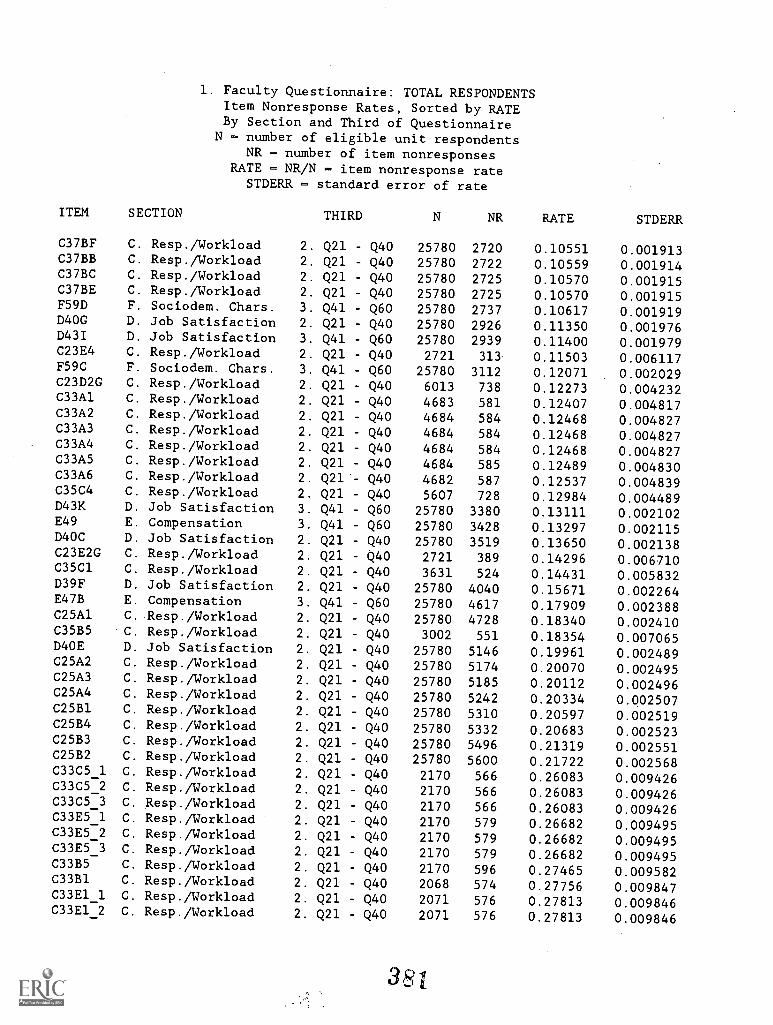
1. Faculty Questionnaire: TOTAL RESPONDENTSItem Nonresponse Rates, Sorted by RATEBy Section and Third of Questionnaire
N = number of eligible unit respondentsNR = number of item nonresponses
RATE = NR/N item nonresponse rateSTDERR = standard error of rate
ITEM SECTION THIRD N NR RATE STDERR
C37BF C. Resp./Workload 2. Q21 - Q40 25780 2720 0.10551 0.001913C37BB C. Resp./Workload 2. Q21 - Q40 25780 2722 0.10559 0.001914C37BC C. Resp./Workload 2. Q21 - Q40 25780 2725 0.10570 0.001915C37BE C. Resp./Workload 2. Q21 - Q40 25780 2725 0.10570 0.001915F59D F. Sociodem. Chars. 3. Q41 - Q60 25780 2737 0.10617 0.001919D4OG D. Job Satisfaction 2. Q21 - Q40 25780 2926 0.11350 0.001976D43I D. Job Satisfaction 3. Q41 - Q60 25780 2939 0.11400 0.001979C23E4 C. Resp./Workload 2. Q21 - Q40 2721 313 0.11503 0.006117F59C F. Sociodem. Chars. 3. Q41 - Q60 25780 3112 0.12071 0.002029C23D2G C. Resp./Workload 2. Q21 - Q40 6013 738 0.12273 0.004232C33A1 C. Resp./Workload 2. Q21 - Q40 4683 581 0.12407 0.004817C33A2 C. Resp./Workload 2. Q21 - Q40 4684 584 0.12468 0.004827C33A3 C. Resp./Workload 2. Q21 - Q40 4684 584 0.12468 0.004827C33A4 C. Resp./Workload 2. Q21 - Q40 4684 584 0.12468 0.004827C33A5 C. Resp./Workload 2. Q21 - Q40 4684 585 0.12489 0.004830C33A6 C. Resp./Workload 2. Q21 - Q40 4682 587 0.12537 0.004839C35C4 C. Resp./Workload 2. Q21 - Q40 5607 728 0.12984 0.004489D43K D. Job Satisfaction 3. Q41 - Q60 25780 3380 0.13111 0.002102E49 E. Compensation 3. Q41 - Q60 25780 3428 0.13297 0.002115D40C D. Job Satisfaction 2. Q21 - Q40 25780 3519 0.13650 0.002138C23E2G C. Resp./Workload 2. Q21 - Q40 2721 389 0.14296 0.006710C35C1 C. Resp./Workload 2. Q21 - Q40 3631 524 0.14431 0.005832D39F D. Job Satisfaction 2. Q21 - Q40 25780 4040 0.15671 0.002264E47B E. Compensation 3. Q41 - Q60 25780 4617 0.17909 0.002388C25A1 C. Resp./Workload 2. Q21 - Q40 25780 4728 0.18340 0.002410C35B5 C. Resp./Workload 2. Q21 Q40 3002 551 0.18354 0.007065D4OE D. Job Satisfaction 2. Q21 Q40 25780 5146 0.19961 0.002489C25A2 C. Resp./Workload 2. Q21 - Q40 25780 5174 0.20070 0.002495C25A3 C. Resp./Workload 2. Q21 Q40 25780 5185 0.20112 0.002496C25A4 C. Resp./Workload 2. Q21 Q40 25780 5242 0.20334 0.002507C25B1 C. Resp./Workload 2. Q21 Q40 25780 5310 0.20597 0.002519C25B4 C. Resp./Workload 2. Q21 Q40 25780 5332 0.20683 0.002523C25B3 C. Resp./Workload 2. Q21 - Q40 25780 5496 0.21319 0.002551C25B2 C. Resp./Workload 2. Q21 - Q40 25780 5600 0.21722 0.002568C33C5_1 C. Resp./Workload 2. Q21 - Q40 2170 566 0.26083 0.009426C33C5_2 C. Resp./Workload 2. Q21 - Q40 2170 566 0.26083 0.009426C33C5_3 C. Resp./Workload 2. Q21 - Q40 2170 566 0.26083 0.009426C33E5_1 C. Resp./Workload 2. Q21 - Q40 2170 579 0.26682 0.009495C33E5_2 C. Resp./Workload 2. Q21 - Q40 2170 579 0.26682 0.009495C33E5 3 C. Resp./Workload 2. Q21 Q40 2170 579 0.26682 0.009495C33B5 C. Resp./Workload 2. Q21 Q40 2170 596 0.27465 0.009582C33B1 C. Resp./Workload 2. Q21 - Q40 2068 574 0.27756 0.009847C33E1_1 C. Resp./Workload 2. Q21 - Q40 2071 576 0.27813 0.009846C33E1 2 C. Resp./Workload 2. Q21 - Q40 2071 576 0.27813 0.009846
381
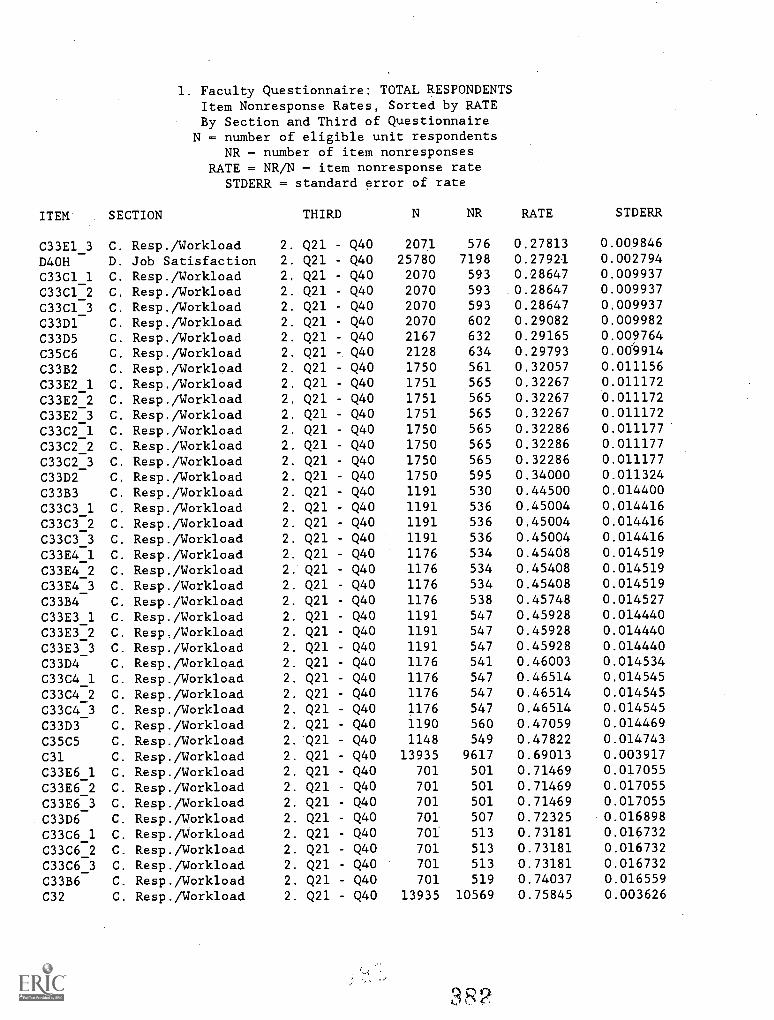
1. Faculty Questionnaire: TOTAL RESPONDENTSItem Nonresponse Rates, Sorted by RATEBy Section and Third of Questionnaire
N = number of eligible unit respondentsNR = number of item nonresponses
RATE = NR/N = item nonresponse rateSTDERR = standard error of rate
ITEM SECTION THIRD N NR RATE STDERR
C33E1_3 C Resp./Workload 2. Q21 - Q40 2071 576 0.27813 0.009846
D4OH D Job Satisfaction 2. Q21 - Q40 25780 7198 0.27921 0.002794
C33C1_1 C. Resp./Workload 2. Q21 - Q40 2070 593 0.28647 0.009937
C33C1_2 C. Resp./Workload 2. Q21 - Q40 2070 593 0.28647 0.009937
C33C1_3 C. Resp./Workload 2. Q21 - Q40 2070 593 0.28647 0.009937
C33D1 C. Resp./Workload 2. Q21 - Q40 2070 602 0.29082 0.009982
C33D5 C. Resp./Workload 2. Q21 - Q40 2167 632 0.29165 0.009764
C35C6 C. Resp./Workload 2. Q21 -. Q40 2128 634 0.29793 0.009914
C33B2 C. Resp./Workload 2. Q21 - Q40 1750 561 0.32057 0.011156
C33E2 1 C. Resp./Workload 2. Q21 - Q40 1751 565 0.32267 0.011172
C33E2 2 C. Resp./Workload 2. Q21 - Q40 1751 565 0.32267 0.011172
C33E2=3 C. Resp./Workload 2. Q21 - Q40 1751 565 0.32267 0.011172
C33C2_1 C. Resp./Workload 2. Q21 - Q40 1750 565 0.32286 0.011177
C33C2_2 C. Resp./Workload 2. Q21 - Q40 1750 565 0.32286 0.011177
C33C2 3 C. Resp./Workload 2. Q21 - Q40 1750 565 0.32286 0.011177
C33D2 C. Resp./Workload 2. Q21 - Q40 1750 595 0.34000 0.011324
C33B3 C. Resp./Workload 2. Q21 - Q40 1191 530 0.44500 0.014400
C33C3_1 C. Resp./Workload 2. Q21 - Q40 1191 536 0.45004 0.014416
C33C3 2 C. Resp./Workload 2. Q21 Q40 1191 536 0.45004 0.014416
C33C3 3 C. Resp./Workload 2. Q21 - Q40 1191 536 0.45004 0.014416
C33E4_1 C. Resp./Workload 2. Q21 - Q40 1176 534 0.45408 0.014519
C33E4_2 C. Resp./Workload 2. Q21 Q40 1176 534 0.45408 0.014519
C33E4 3 C. Resp./Workload 2. Q21 - Q40 1176 534 0.45408 0.014519
C33B4 C. Resp./Workload 2. Q21 - Q40 1176 538 0.45748 0.014527
C33E3_1 C. Resp./Workload 2. Q21 - Q40 1191 547 0.45928 0.014440
C33E3_2 C. Resp./Workload 2. Q21 - Q40 1191 547 0.45928 0.014440
C33E3_3 C. Resp./Workload 2. Q21 - Q40 1191 547 0.45928 0.014440
C33D4 C. Resp./Workload 2. Q21 - Q40 1176 541 0.46003 0.014534
C33C4_1 C. Resp./Workload 2. Q21 - Q40 1176 547 0.46514 0.014545
C33C4_2 C. Resp./Workload 2. Q21 - Q40 1176 547 0.46514 0.014545
C33C4_3 C. Resp./Workload 2. Q21 - Q40 1176 547 0.46514 0.014545
C33D3 C. Resp./Workload 2. Q21 - Q40 1190 560 0.47059 0.014469
C35C5 C. Resp./Workload 2. Q21 - Q40 1148 549 0.47822 0.014743
C31 C. Resp./Workload 2. Q21 - Q40 13935 9617 0.69013 0.003917
C33E6_1 C. Resp./Workload 2. Q21 - Q40 701 501 0.71469 0.017055
C33E6 2 C. Resp./Workload 2. Q21 - Q40 701 501 0.71469 0.017055
C33E6 3 C. Resp./Workload 2. Q21 - Q40 701 501 0.71469 0.017055
C33D6 C. Resp./Workload 2. Q21 - Q40 701 507 0.72325 0.016898
C33C6_1 C. Resp./Workload 2. Q21 - Q40 701 513 0.73181 0.016732
C33C6_2 C. Resp./Workload 2. Q21 - Q40 701 513 0.73181 0.016732
C33C6 3 C. Resp./Workload 2. Q21 - Q40 701 513 0.73181 0.016732
C33B6 C. Resp./Workload 2. Q21 - Q40 701 519 0.74037 0.016559
C32 C. Resp./Workload 2. Q21 - Q40 13935 10569 0.75845 0.003626
382
1993 National Study of Postsecondary FacultyMethodology Report
Item Nonresponse Rates: SAQ RespondentsItem Nonresponse Rates Greater Than 10 Percent (SAQ)
Item Nonresponse Rates for SAQ Respondents, Sorted by Rate
33
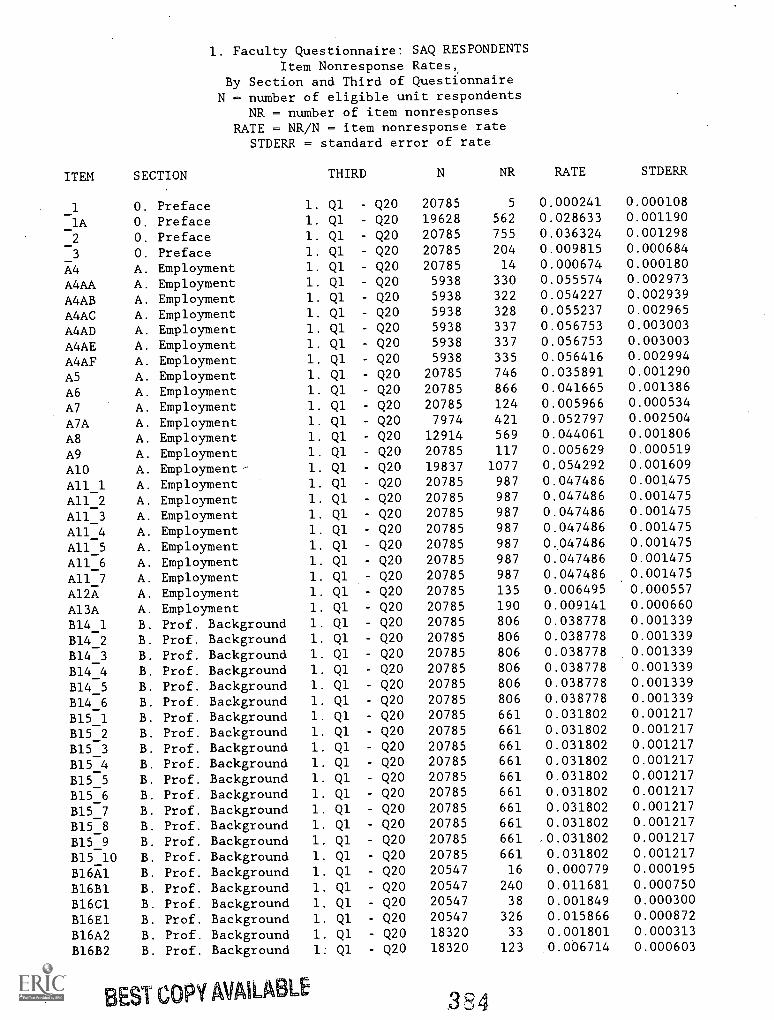
1. Faculty Questionnaire: SAQ RESPONDENTSItem Nonresponse Rates,
By Section and Third of QuestionnaireN - number of eligible unit respondents
NR = number of item nonresponsesRATE = NR/N = item nonresponse rate
STDERR = standard error of rate
ITEM SECTION THIRD N NR RATE STDERR
1 O. Preface 1. Ql Q20 20785 5 0.000241 0.000108
lA O. Preface 1. Ql - Q20 19628 562 0.028633 0.001190
2 O. Preface 1. Ql - Q20 20785 755 0.036324 0.001298
3 O. Preface 1. Ql - Q20 20785 204 0.009815 0.000684
74 A. Employment 1. Ql - Q20 20785 14 0.000674 0.000180
A4AA A. Employment 1. Ql - Q20 5938 330 0.055574 0.002973
A4AB A. Employment 1. Ql - Q20 5938 322 0.054227 0.002939
A4AC A. Employment 1. Ql - Q20 5938 328 0.055237 0.002965
A4AD A. Employment 1. Ql Q20 5938 337 0.056753 0.003003
A4AE A. Employment 1. Ql - Q20 5938 337 0.056753 0.003003
A4AF A. Employment 1. Ql Q20 5938 335 0.056416 0.002994
AS A. Employment 1. Ql - Q20 20785 746 0.035891 0.001290
A6 A. Employment 1. Ql Q20 20785 866 0.041665 0.001386
A7 A. Employment 1. Q1 - Q20 20785 124 0.005966 0.000534
A7A A. Employment 1. Ql Q20 7974 421 0.052797 0.002504
A8 A. Employment 1. Ql Q20 12914 569 0.044061 0.001806
A9 A. Employment 1. Ql Q20 20785 117 0.005629 0.000519
A10 A. Employment 1. Ql - Q20 19837 1077 0.054292 0.001609
A11_1 A. Employment 1. Ql Q20 20785 987 0.047486 0.001475
A11_2 A. Employment 1. Ql Q20 20785 987 0.047486 0.001475
A11_3 A. Employment 1. Ql - Q20 20785 987 0.047486 0.001475
A11_4 A. Employment 1. Ql - Q20 20785 987 0.047486 0.001475
A11_5 A. Employment 1. Ql - Q20 20785 987 0.047486 0.001475
A11_6 A. Employment 1. Ql - Q20 20785 987 0.047486 0.001475
A11_7 A. Employment 1. Ql - Q20 20785 987 0.047486 0.001475
Al2A A. Employment 1. Ql - Q20 20785 135 0.006495 0.000557
A13A A. Employment 1. Ql - Q20 20785 190 0.009141 0.000660
B14_1 B. Prof. Background 1. Q1 - Q20 20785 806 0.038778 0.001339
B14_2 B. Prof. Background 1. Ql - Q20 20785 806 0.038778 0.001339
B14_3 B. Prof. Background 1. Q1 - Q20 20785 806 0.038778 0.001339
B14_4 B. Prof. Background 1. Ql Q20 20785 806 0.038778 0.001339
B14_5 B. Prof. Background 1. Ql - Q20 20785 806 0.038778 0.001339
B14_6 B. Prof. Background 1. Ql - Q20 20785 806 0.038778 0.001339
B151 B. Prof. Background 1. Ql - Q20 20785 661 0.031802 0.001217
B15_2 B. Prof. Background 1. Ql - Q20 20785 661 0.031802 0.001217
B15_3 B. Prof. Background 1. Ql Q20 20785 661 0.031802 0.001217
B15_4 B. Prof. Background 1. Ql - Q20 20785 661 0.031802 0.001217
B15_5 B. Prof. Background 1. Ql - Q20 20785 661 0.031802 0.001217
B15_6 B. Prof. Background 1. Q1 - Q20 20785 661 0.031802 0.001217
B15_7 B. Prof. Background 1. Ql - Q20 20785 661 0.031802 0.001217
B15_8 B. Prof. Background 1. Ql - Q20 20785 661 0.031802 0.001217
B15_9 B. Prof. Background 1. Ql - Q20 20785 661 0.031802 0.001217
815_10 B. Prof. Background 1. Ql - Q20 20785 661 0.031802 0.001217
B16-A-1 B. Prof. Background 1. Ql - Q20 20547 16 0.000779 0.000195
B16B1 B. Prof. Background 1. Ql - Q20 20547 240 0.011681 0.000750
B16C1 B. Prof. Background 1. Q1 - Q20 20547 38 0.001849 0.000300
B16E1 B. Prof. Background 1. Q1 - Q20 20547 326 0.015866 0.000872
B16A2 B. Prof. Background 1. Q1 - Q20 18320 33 0.001801 0.000313
B16B2 B. Prof. Background 1. Q1 - Q20 18320 123 0.006714 0.000603
EST COPY AVAILABLE 394
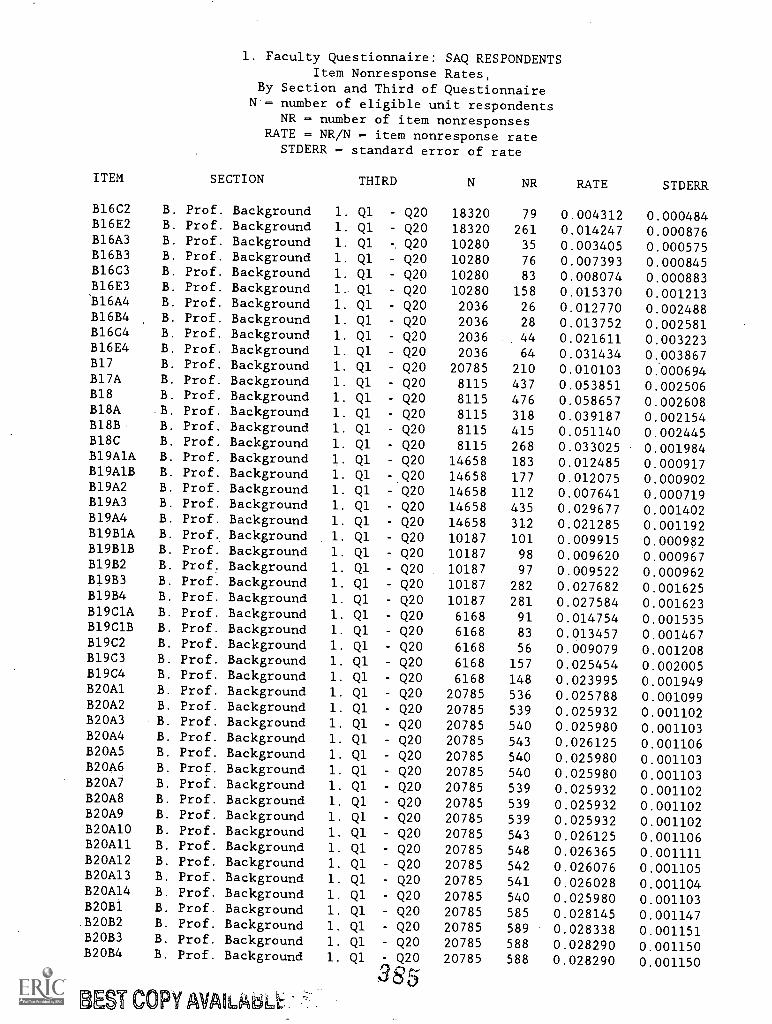
1. Faculty Questionnaire: SAQ RESPONDENTSItem Nonresponse Rates,
By Section and Third of QuestionnaireN = number of eligible unit respondents
NR = number of item nonresponsesRATE = NR/N = item nonresponse rate
STDERR = standard error of rate
ITEM SECTION THIRD
B16C2B16E2B16A3B16B3B16C3B16E3)316A4
B16B4B16C4B16E4B17B17AB18B18AB18BB18CB19A1AB19A1BB19A2B19A3B19A4B19B1AB19B1BB19B2B19B3B19B4B19C1AB19C1BB19C2B19C3B19C4B20A1B20A2B20A3B20A4B20A5B20A6B20A7B20A8B20A9B20A10B20A11B20Al2B20A13B20A14B20B1B20B2B20B3B20B4
B. Prof. Background 1. QlB. Prof. Background 1. Q1B. Prof. Background 1. QlB. Prof. Background 1. QlB. Prof. Background 1. QlB. Prof. Background 1. QlB. Prof. Background 1. Q1B. Prof. Background 1. QlB. Prof. Background I. QlB. Prof. Background 1. Q1B. Prof. Background 1. QlB. Prof. Background 1. QlB. Prof. Background 1. Q1B. Prof. Background 1. QIB. Prof. Background 1. Q1B. Prof. Background 1. Q1B. Prof. Background 1. Q1B. Prof. Background 1. Q1B. Prof. Background 1. Q1B. Prof. Background 1. QlB. Prof. Background 1. QlB. Prof. Background 1. QlB. Prof. Background 1. Q1B. Prof. Background 1. Q1B. Prof. Background 1. QlB. Prof. Background 1. Q1B. Prof. Background 1. QlB. Prof. Background 1. QlB. Prof. Background 1. QlB. Prof. Background 1. QlB. Prof. Background 1. Q1B. Prof. Background 1. QIB. Prof. Background 1. QlB. Prof. Background 1. QlB. Prof. Background 1. QlB. Prof. Background 1. QlB. Prof. Background 1. Q1B. Prof. Background 1. QlB. Prof. Background 1. QlB. Prof. Background 1. QlB. Prof. Background 1. Q1B. Prof. Background 1. QlB. Prof. Background 1. Q1B. Prof. Background 1. QlB. Prof. Background 1. QlB. Prof. Background 1. QlB. Prof. Background 1. QiB. Prof. Background 1. QlB. Prof. Background 1. Q1
BEST COPY AVAILIAba
Q20Q20Q20
- Q20- Q20- Q20- Q20- Q20Q20
- Q20Q20Q20
- Q20- Q20Q20Q20Q20
- Q20- Q20Q20
- Q20Q20
- Q20- Q20- Q20- Q20- Q20- Q20- Q20- Q20- Q20Q20
- Q20- Q20- Q20- Q20- Q20
- Q20- Q20- Q20- Q20
Q20- Q20- Q20- Q20- Q20
Q20- Q20- Q20
385
N NR RATE STDERR
18320 79 0.004312 0.00048418320 261 0.014247 0.00087610280 35 0.003405 0.00057510280 76 0.007393 0.00084510280 83 0.008074 0.00088310280 158 0.015370 0.0012132036 26 0.012770 0.0024882036 28 0.013752 0.0025812036 44 0.021611 0.0032232036 64 0.031434 0.003867
20785 210 0.010103 0.0006948115 437 0.053851 0.0025068115 476 0.058657 0.0026088115 318 0.039187 0.0021548115 415 0.051140 0.0024458115 268 0.033025 0.001984
14658 183 0.012485 0.00091714658 177 0.012075 0.00090214658 112 0.007641 0.00071914658 435 0.029677 0.00140214658 312 0.021285 0.00119210187 101 0.009915 0.00098210187 98 0.009620 0.00096710187 97 0.009522 0.00096210187 282 0.027682 0.00162510187 281 0.027584 0.0016236168 91 0.014754 0.0015356168 83 0.013457 0.0014676168 56 0.009079 0.0012086168 157 0.025454 0.0020056168 148 0.023995 0.001949
20785 536 0.025788 0.00109920785 539 0.025932 0.00110220785 540 0.025980 0.00110320785 543 0.026125 0.00110620785 540 0.025980 0.00110320785 540 0.025980 0.00110320785 539 0.025932 0.00110220785 539 0.025932 0.00110220785 539 0.025932 0.00110220785 543 0.026125 0.00110620785 548 0.026365 0.00111120785 542 0.026076 0.00110520785 541 0.026028 0.00110420785 540 0.025980 0.00110320785 585 0.028145 0.00114720785 589 0.028338 0.00115120785 588 0.028290 0.00115020785 588 0.028290 0.001150
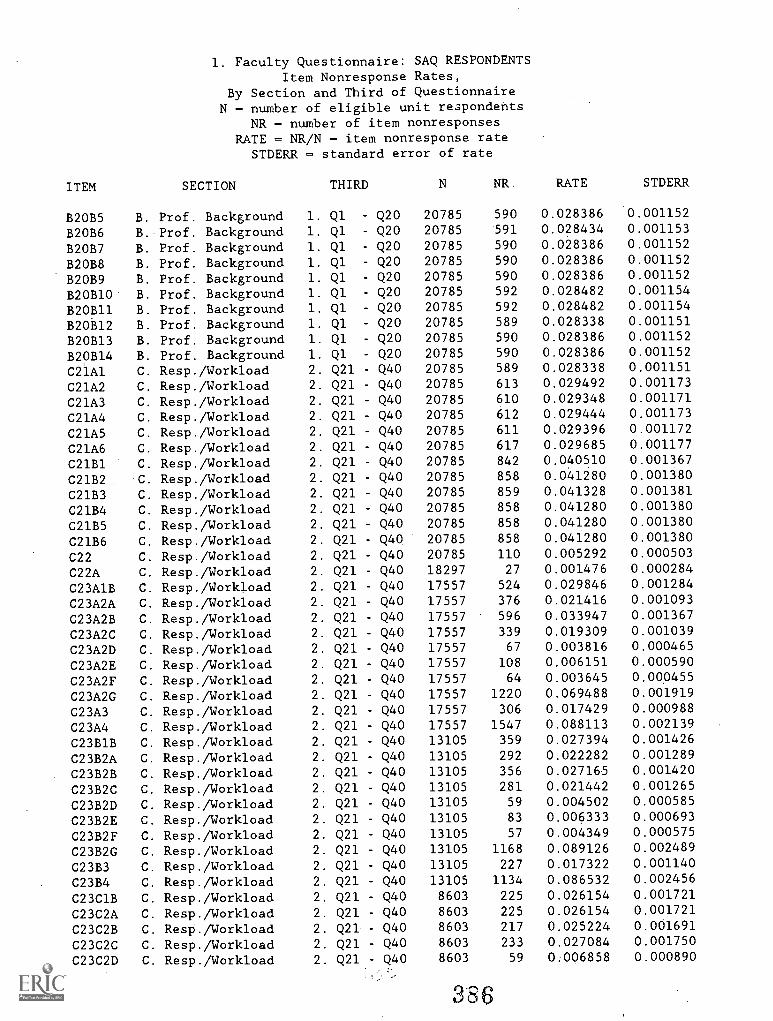
1. Faculty Questionnaire: SAQ RESPONDENTSItem Nonresponse Rates,
By Section and Third of QuestionnaireN = number of eligible unit respondents
NR = number of item nonresponsesRATE = NR/N = item nonresponse rate
STDERR = standard error of rate
ITEM SECTION THIRD N NR. RATE STDERR
B20B5 B. Prof. Background 1. Ql Q20 20785 590 0.028386 0.001152
B20B6 B. Prof. Background 1. Ql Q20 20785 591 0.028434 0.001153
B20B7 B. Prof. Background 1. Ql - Q20 20785 590 0.028386 0.001152
B20B8 B. Prof. Background 1. Q1 - Q20 20785 590 0.028386 0.001152
B20B9 B. Prof. Background 1. Q1 - Q20 20785 590 0.028386 0.001152
B20B10 B. Prof. Background 1. Q1 Q20 20785 592 0.028482 0.001154
B20B11 B. Prof. Background 1. Ql - Q20 20785 592 0.028482 0.001154
B20B12 B. Prof. Background 1. Ql Q20 20785 589 0.028338 0.001151
B20B13 B. Prof. Background 1. Q1 - Q20 20785 590 0.028386 0.001152
B20B14 B. Prof. Background 1. Ql - Q20 20785 590 0.028386 0.001152
C21A1 C. Resp./Workload 2. Q21 - Q40 20785 589 0.028338 0.001151
C21A2 C. Resp./Workload 2. Q21 Q40 20785 613 0.029492 0.001173
C21A3 C. Resp./Workload 2. Q21 Q40 20785 610 0.029348 0.001171
C21A4 C. Resp./Workload 2. Q21 - Q40 20785 612 0.029444 0.001173
C21A5 C. Resp./Workload 2. Q21 Q40 20785 611 0.029396 0.001172
C21A6 C. Resp./Workload 2. Q21 - Q40 20785 617 0.029685 0.001177
C21B1 C. Resp./Workload 2. Q21 - Q40 20785 842 0.040510 0.001367
C21B2 C. Resp./Workload 2. Q21 - Q40 20785 858 0.041280 0.001380
C21B3 C. Resp./Workload 2. Q21 Q40 20785 859 0.041328 0.001381
C21B4 C. Resp./Workload 2. Q21 - Q40 20785 858 0.041280 0.001380
C21B5 C. Resp./Workload 2. Q21 - Q40 20785 858 0.041280 0.001380
C21B6 C. Resp./Workload 2. Q21 Q40 20785 858 0.041280 0.001380
C22 C. Resp./Workload 2. Q21 Q40 20785 110 0.005292 0.000503
C22A C. Resp./Workload 2. Q21 - Q40 18297 27 0.001476 0.000284
C23A1B C. Resp./Workload 2. Q21 - Q40 17557 524 0.029846 0.001284
C23A2A C. Resp./Workload 2. Q21 - Q40 17557 376 0.021416 0.001093
C23A2B C. Resp./Workload 2. Q21 - Q40 17557 596 0.033947 0.001367
C23A2C C. Resp./Workload 2. Q21 - Q40 17557 339 0.019309 0.001039
C23A2D C. Resp./Workload 2. Q21 - Q40 17557 67 0.003816 0.000465
C23A2E C. Resp./Workload 2. Q21 Q40 17557 108 0.006151 0.000590
C23A2F C. Resp./Workload 2. Q21 - Q40 17557 64 0.003645 0.000455
C23A2G C. Resp./Workload 2. Q21 - Q40 17557 1220 0.069488 0.001919
C23A3 C. Resp./Workload 2. Q21 - Q40 17557 306 0.017429 0.000988
C23A4 C. Resp./Workload 2. Q21 Q40 17557 1547 0.088113 0.002139
C23B1B C. Resp./Workload 2. Q21 - Q40 13105 359 0.027394 0.001426
C23B2A C. Resp./Workload 2. Q21 - Q40 13105 292 0.022282 0.001289
C23B2B C. Resp./Workload 2. Q21 - Q40 13105 356 0.027165 0.001420
C23B2C C. Resp./Workload 2. Q21 - Q40 13105 281 0.021442 0.001265
C23B2D C. Resp./Workload 2. Q21 Q40 13105 59 0.004502 0.000585
C23B2E C. Resp./Workload 2. Q21 - Q40 13105 83 0.006333 0.000693
C23B2F C. Resp./Workload 2. Q21 - Q40 13105 57 0.004349 0.000575
C23B2G C. Resp./Workload 2. Q21 Q40 13105 1168 0.089126 0.002489
C23B3 C. Resp./Workload 2. Q21 - Q40 13105 227 0.017322 0.001140
C23B4 C. Resp./Workload 2. Q21 - Q40 13105 1134 0.086532 0.002456
C23C1B C. Resp./Workload 2. Q21 - Q40 8603 225 0.026154 0.001721
C23C2A C. Resp./Workload 2. Q21 - Q40 8603 225 0.026154 0.001721
C23C2B C. Resp./Workload 2. Q21 - Q40 8603 217 0.025224 0.001691
C23C2C C. Resp./Workload 2. Q21 Q40 8603 233 0.027084 0.001750
C23C2D C. Resp./Workload 2. Q21 - Q40 8603 59 0.006858 0.000890
386
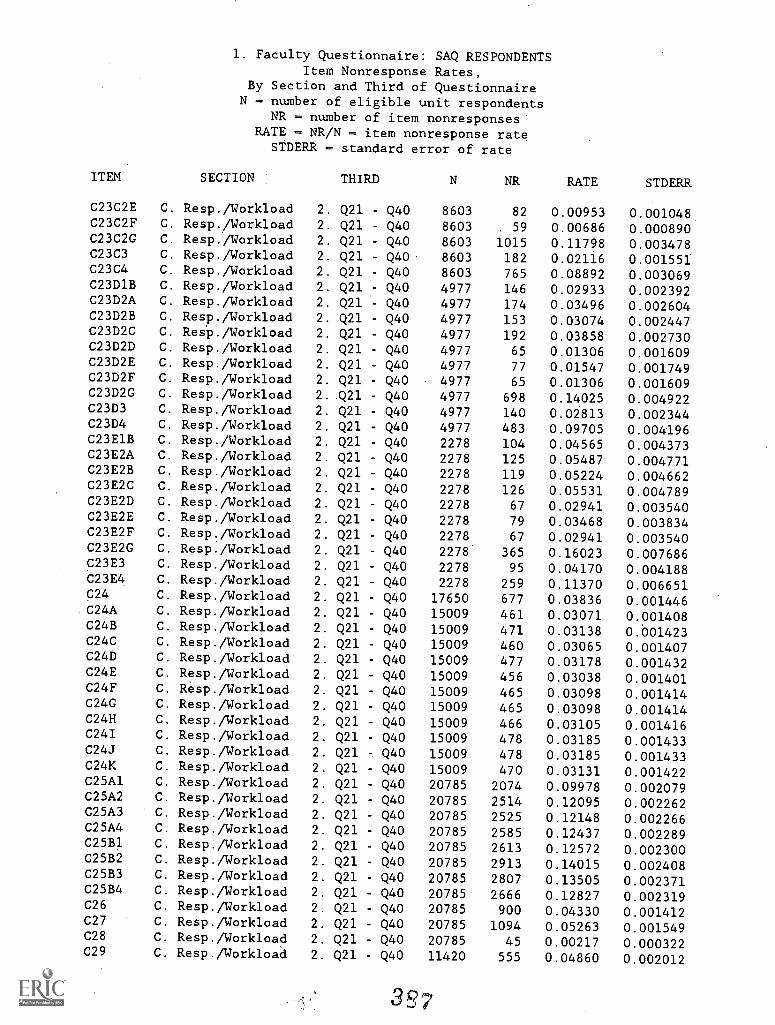
1. Faculty Questionnaire: SAQ RESPONDENTSItem Nonresponse Rates,
By Section and Third of QuestionnaireN - number of eligible unit respondents
NR = number of item nonresponsesRATE = NR/N = item nonresponse rate
STDERR = standard error of rate
ITEM SECTION THIRD N NR RATE STDERR
C23C2E C. Resp./Workload 2. Q21 - Q40 8603 82 0.00953 0.001048C23C2F C. Resp./Workload 2. Q21 - Q40 8603 59 0.00686 0.000890C23C2G C. Resp./Workload 2. Q21 - Q40 8603 1015 0.11798 0.003478C23C3 C. Resp./Workload 2. Q21 - Q40 8603 182 0.02116 0.001551C23C4 C. Resp./Workload 2. Q21 - Q40 8603 765 0.08892 0.003069C23D1B C. Resp./Workload 2. Q21 - Q40 4977 146 0.02933 0.002392C23D2A C. Resp./Workload 2. Q21 - Q40 4977 174 0.03496 0.002604C23D2B C. Resp./Workload 2. Q21 - Q40 4977 153 0.03074 0.002447C23D2C C. Resp./Workload 2. Q21 - Q40 4977 192 0.03858 0.002730C23D2D C. Resp./Workload 2. Q21 - Q40 4977 65 0.01306 0.001609C23D2E C. Resp./Workload 2. Q21 - Q40 4977 77 0.01547 0.001749C23D2F C. Resp./Workload 2. Q21 - Q40 4977 65 0.01306 0.001609C23D2G C. Resp./Workload 2..Q21 - Q40 4977 698 0.14025 0.004922C23D3 C. Resp./Workload 2. Q21 - Q40 4977 140 0.02813 0.002344C23D4 C. Resp./Workload 2. Q21 - Q40 4977 483 0.09705 0.004196C23E1B C. Resp./Workload 2. Q21 - Q40 2278 104 0.04565 0.004373C23E2A C. Resp./Workload 2. Q21 - Q40 2278 125 0.05487 0.004771C23E2B C. Resp./Workload 2. Q21 - Q40 2278 119 0.05224 0.004662C23E2C C. Resp./Workload 2. Q21 - Q40 2278 126 0.05531 0.004789C23E2D C. Resp./Workload 2. Q21 - Q40 2278 67 0.02941 0.003540C23E2E C. Resp./Workload 2. Q21 - Q40 2278 79 0.03468 0.003834C23E2F C. Resp./Workload 2. Q21 - Q40 2278 67 0.02941 0.003540C23E2G C. Resp./Workload 2. Q21 - Q40 2278 365 0.16023 0.007686C23E3 C. Resp./Workload 2. Q21 - Q40 2278 95 0.04170 0.004188C23E4 C. Resp./Workload 2. Q21 - Q40 2278 259 0.11370 0.006651C24 C. Resp./Workload 2. Q21 - Q40 17650 677 0.03836 0.001446C24A C. Resp./Workload 2. Q21 - Q40 15009 461 0.03071 0.001408C24B C. Resp./Workload 2. Q21 Q40 15009 471 0.03138 0.001423C24C C. Resp./Workload 2. Q21 Q40 15009 460 0.03065 0.001407C24D C. Resp./Workload 2. Q21 - Q40 15009 477 0.03178 0.001432C24E C. Resp./Workload 2. Q21 - Q40 15009 456 0.03038 0.001401C24F C. Resp./Workload 2. Q21 - Q40 15009 465 0.03098 0.001414C24G C. Resp./Workload 2. Q21 - Q40 15009 465 0.03098 0.001414C24H C. Resp./Workload 2. Q21 - Q40 15009 466 0.03105 0.001416C24I C. Resp./Workload 2. Q21 - Q40 15009 478 0.03185 0.001433C24J C. Resp./Workload 2. Q21 - Q40 15009 478 0.03185 0.001433C24K C. Resp./Workload 2. Q21 - Q40 15009 470 0.03131 0.001422C25A1 C. Resp./Workload 2. Q21 - Q40 20785 2074 0.09978 0.002079C25A2 C. Resp./Workload 2. Q21 - Q40 20785 2514 0.12095 0.002262C25A3 C. Resp./Workload 2. Q21 - Q40 20785 2525 0.12148 0.002266C25A4 C. Resp./Workload 2. Q21 - Q40 20785 2585 0.12437 0.002289C25B1 C. Resp./Workload 2. Q21 - Q40 20785 2613 0.12572 0.002300C25B2 C. Resp./Workload 2. Q21 - Q40 20785 2913 0.14015 0.002408C25B3 C. Resp./Workload 2. Q21 - Q40 20785 2807 0.13505 0.002371C25B4 C. Resp./Workload 2. Q21 - Q40 20785 2666 0.12827 0.002319C26 C. Resp./Workload 2. Q21 Q40 20785 900 0.04330 0.001412C27 C. Resp./Workload 2. Q21 - Q40 20785 1094 0.05263 0.001549C28 C. Resp./Workload 2. Q21 - Q40 20785 45 0.00217 0.000322C29 C. Resp./Workload 2. Q21 - Q40 11420 555 0.04860 0.002012
357
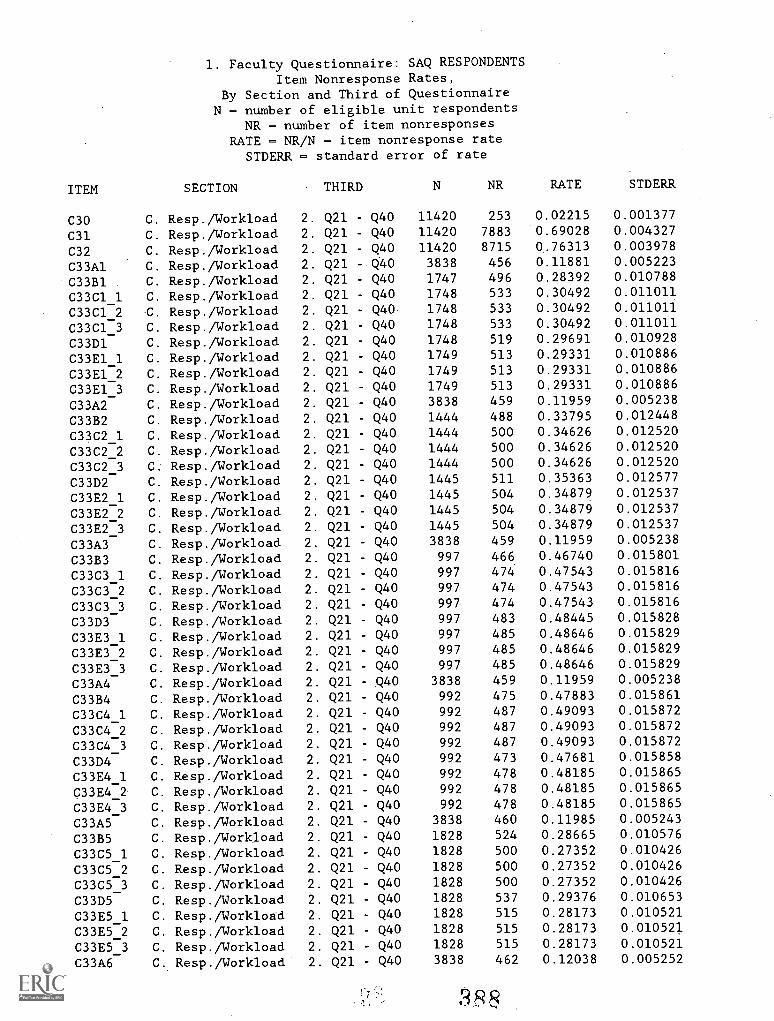
1. Faculty Questionnaire: SAQ RESPONDENTSItem Nonresponse Rates,
By Section and Third of QuestionnaireN = number of eligible unit respondents
NR = number of item nonresponsesRATE = NR/N = item nonresponse rate
STDERR = standard error of rate
ITEM SECTION THIRD N NR RATE STDERR
C30 C. Resp./Workload 2 Q21 - Q40 11420 253 0.02215 0.001377
C31 C. Resp./Workload 2 Q21 - Q40 11420 7883 0.69028 0.004327
C32 C. Resp./Workload 2 Q21 - Q40 11420 8715 0.76313 0.003978
C33A1 C. Resp./Workload 2 Q21 - Q40 3838 456 0.11881 0.005223
C33B1 C. Resp./Workload 2 Q21 - Q40 1747 496 0.28392 0.010788
C33C1 1 C. Resp./Workload 2 Q21 - Q40 1748 533 0.30492 0.011011
C33C1 2 C. Resp./Workload 2 Q21 - Q40 1748 533 0.30492 0.011011
C33C1_3 C. Resp./Workload 2 Q21 - Q40 1748 533 0.30492 0.011011
C33D1 C. Resp./Workload 2 Q21 Q40 1748 519 0.29691 0.010928
C33E1_1 C. Resp./Workload 2 Q21 - Q40 1749 513 0.29331 0.010886
C33E1 2 C. Resp./Workload 2 Q21 - Q40 1749 513 0.29331 0.010886
C33E1 3 C. Resp./Workload 2 Q21 Q40 1749 513 0.29331 0.010886
C33A2 C. Resp./Workload 2 Q21 - Q40 3838 459 0.11959 0.005238
C33B2 C. Resp./Workload 2 Q21 - Q40 1444 488 0.33795 0.012448
C33C2_1 C. Resp./Workload 2 Q21 - Q40 1444 500 0.34626 0.012520
C33C2_2 C. Resp./Workload 2 Q21 Q40 1444 500 0.34626 0.012520
C33C2_3 C. Resp./Workload 2 Q21 - Q40 1444 500 0.34626 0.012520
C33D2 C. Resp./Workload 2 Q21 - Q40 1445 511 0.35363 0.012577
C33E2_1 C. Resp./Workload 2 Q21 - Q40 1445 504 0.34879 0.012537
C33E2 2 C. Resp./Workload 2 Q21 - Q40 1445 504 0.34879 0.012537
C33E2 3 C. Resp./Workload 2 Q21 - Q40 1445 504 0.34879 0.012537
C33A3 C. Resp./Workload 2 Q21 - Q40 3838 459 0.11959 0.005238
C33B3 C. Resp./Workload 2 Q21 - Q40 997 466 0.46740 0.015801
C33C3 1 C. Resp./Workload 2 Q21 - Q40 997 474 0.47543 0.015816
C33C3 2 C. Resp./Workload 2 Q21 - Q40 997 474 0.47543 0.015816
C33C3:3 C. Resp./Workload 2 Q21 - Q40 997 474 0.47543 0.015816
C33D3 C. Resp./Workload 2 Q21 - Q40 997 483 0.48445 0.015828
C33E3_1 C. Resp./Workload 2 Q21 - Q40 997 485 0.48646 0.015829
C33E3 2 C. Resp./Workload 2 Q21 - Q40 997 485 0.48646 0.015829
C33E3 3 C. Resp./Workload 2 Q21 - Q40 997 485 0.48646 0.015829
C33A4 C. Resp./Workload 2 Q21 - .Q40 3838 459 0.11959 0.005238
C33B4 C. Resp./Workload 2 Q21 - Q40 992 475 0.47883 0.015861
C33C4_1 C. Resp./Workload 2 Q21 - Q40 992 487 0.49093 0.015872
C33C4 2 C. Resp./Workload 2 Q21 - Q40 992 487 0.49093 0.015872
C33C4 3 C. Resp./Workload 2 Q21 - Q40 992 487 0.49093 0.015872
C33D4 C. Resp./Workload 2 Q21 - Q40 992 473 0.47681 0.015858
C33E4_1 C. Resp./Workload 2 Q21 - Q40 992 478 0.48185 0.015865
C33E4_2 C. Resp./Workload 2 Q21 - Q40 992 478 0.48185 0.015865
C33E4_3 C. Resp./Workload 2 Q21 - Q40 992 478 0.48185 0.015865
C33A5 C. Resp./Workload 2 Q21 - Q40 3838 460 0.11985 0.005243
C33B5 C. Resp./Workload 2 Q21 - Q40 1828 524 0.28665 0.010576
C33C5_1 C. Resp./Workload 2 Q21 - Q40 1828 500 0.27352 0.010426
C33C5 2 C. Resp./Workload 2 Q21 - Q40 1828 500 0.27352 0.010426
C33C5 3 C. Resp./Workload 2 Q21 - Q40 1828 500 0.27352 0.010426
C33D5 C. Resp./Workload 2 Q21 - Q40 1828 537 0.29376 0.010653
C33E5_1 C. Resp./Workload 2 Q21 - Q40 1828 515 0.28173 0.010521
C33E5 2 C. Resp./Workload 2 Q21 - Q40 1828 515 0.28173 0.010521
C33E5 3 C. Resp./Workload 2 Q21 - Q40 1828 515 0.28173 0.010521
C33A6 C. Resp./Workload 2 Q21 - Q40 3838 462 0.12038 0.005252
3R S
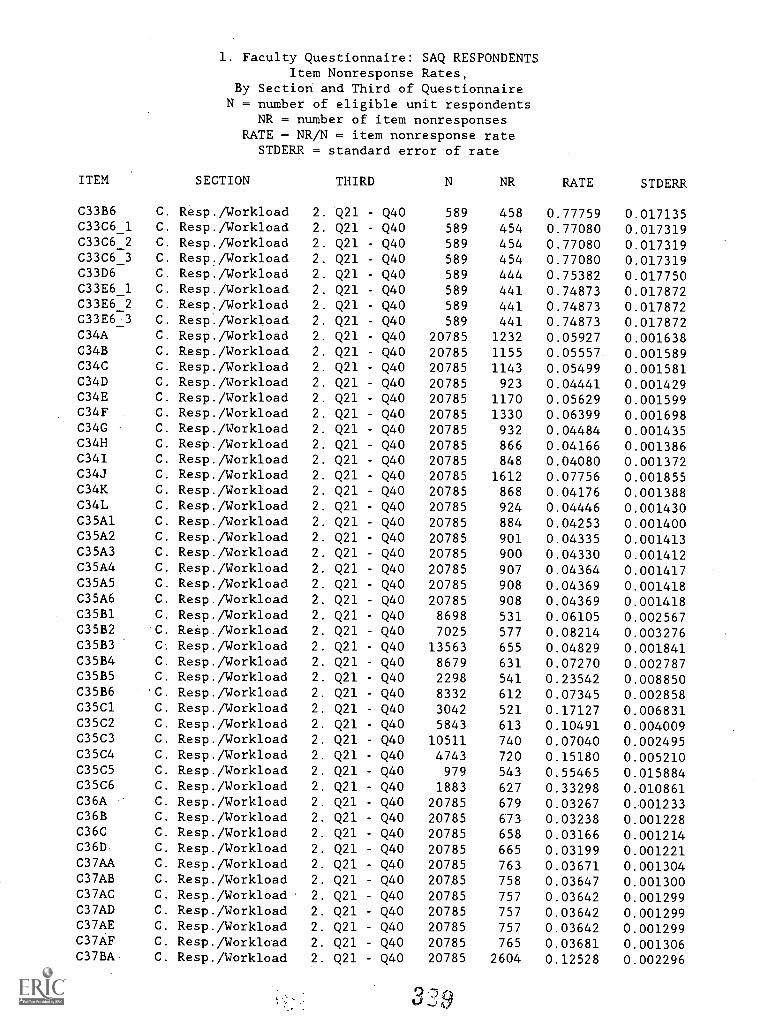
1. Faculty Questionnaire: SAQ RESPONDENTSItem Nonresponse Rates,
By Section and Third of QuestionnaireN = number of eligible unit respondents
ITEM
NR - number of item nonresponsesRATE = NR/N - item nonresponse rate
STDERR = standard error of rate
SECTION THIRD N NR RATE STDERR
C33B6 C. Resp./Workload 2. Q21 - Q40 589 458 0.77759 0.017135C33C6_1 C. Resp./Workload 2. Q21 Q40 589 454 0.77080 0.017319C33C6 2 C. Resp./Workload 2. Q21 - Q40 589 454 0.77080 0.017319C33C6 3 C. Resp./Workload 2. Q21 - Q40 589 454 0.77080 0.017319C33D6 C. Resp./Workload 2. Q21 - Q40 589 444 0.75382 0.017750C33E6_1 C. Resp./Workload 2. Q21 - Q40 589 441 0.74873 0.017872C33E6_2 C. Resp./Workload 2. Q21 - Q40 589 441 0.74873 0.017872C33E6_3 C. Resp./Workload 2. Q21 - Q40 589 441 0.74873 0.017872C34A C. Resp./Workload 2. Q21 - Q40 20785 1232 0.05927 0.001638C34B C. Resp./Workload 2. Q21 - Q40 20785 1155 0.05557 0.001589C34C C. Resp./Workload 2. Q21 Q40 20785 1143 0.05499 0.001581C34D C. Resp./Workload 2. Q21 - Q40 20785 923 0.04441 0.001429C34E C. Resp./Workload 2. Q21 Q40 20785 1170 0.05629 0.001599C34F C. Resp./Workload 2. Q21 - Q40 20785 1330 0.06399 0.001698C34G C. Resp./Workload 2. Q21 Q40 20785 932 0.04484 0.001435C34H C. Resp./Workload 2. Q21 - Q40 20785 866 0.04166 0.001386C34I C. Resp./Workload 2. Q21 - Q40 20785 848 0.04080 0.001372C34J C. Resp./Workload 2. Q21 - Q40 20785 1612 0.07756 0.001855C34K C. Resp./Workload 2. Q21 Q40 20785 868 0.04176 0.001388C34L C. Resp./Workload 2. Q21 Q40 20785 924 0.04446 0.001430C35A1 C. Resp./Workload 2. Q21 - Q40 20785 884 0.04253 0.001400C35A2 C. Resp./Workload 2. Q21 Q40 20785 901 0.04335 0.001413C35A3 C. Resp./Workload 2. Q21 Q40 20785 900 0.04330 0.001412C35A4 C. Resp./Workload 2. Q21 Q40 20785 907 0.04364 0.001417C35A5 C. Resp./Workload 2. Q21 Q40 20785 908 0.04369 0.001418C35A6 C. Resp./Workload 2. Q21 - Q40 20785 908 0.04369 0.001418C35B1 C. Resp./Workload 2. Q21 - Q40 8698 531 0.06105 0.002567C35B2 C. Resp./Workload 2. Q21 Q40 7025 577 0.08214 0.003276C35B3 C. Resp./Workload 2. Q21 - Q40 13563 655 0.04829 0.001841C35B4 C. Resp./Workload 2. Q21 Q40 8679 631 0.07270 0.002787C35B5 C. Resp./Workload 2. Q21 - Q40 2298 541 0.23542 0.008850C35B6 C. Resp./Workload 2. Q21 - Q40 8332 612 0.07345 0.002858C35C1 C. Resp./Workload 2. Q21 - Q40 3042 521 0.17127 0.006831C35C2 C. Resp./Workload 2. Q21 - Q40 5843 613 0.10491 0.004009C35C3 C. Resp./Workload 2. Q21 - Q40 10511 740 0.07040 0.002495C35C4 C. Resp./Workload 2. Q21 - Q40 4743 720 0.15180 0.005210C35C5 C. Resp./Workload 2. Q21 - Q40 979 543 0.55465 0.015884C35C6 C. Resp./Workload 2. Q21 - Q40 1883 627 0.33298 0.010861C36A C. Resp./Workload 2. Q21 - Q40 20785 679 0.03267 0.001233C36B C. Resp./Workload 2. Q21 - Q40 20785 673 0.03238 0.001228C36C C. Resp./Workload 2. Q21 - Q40 20785 658 0.03166 0.001214C36D C. Resp./Workload 2. Q21 - Q40 20785 665 0.03199 0.001221C37AA C. Resp./Workload 2. Q21 - Q40 20785 763 0.03671 0.001304C37AB C. Resp./Workload 2. Q21 - Q40 207,85 758 0.03647 0.001300C37AC C. Resp./Workload 2. Q21 - Q40 20785 757 0.03642 0.001299C37AD C. Resp./Workload 2. Q21 - Q40 20785 757 0.03642 0.001299C37AE C. Resp./Workload 2. Q21 - Q40 20785 757 0.03642 0.001299C37AF C. Resp./Workload 2. Q21 - Q40 20785 765 0.03681 0.001306C37BA C. Resp./Workload 2. Q21 - Q40 20785 2604 0.12528 0.002296
optt.) izy
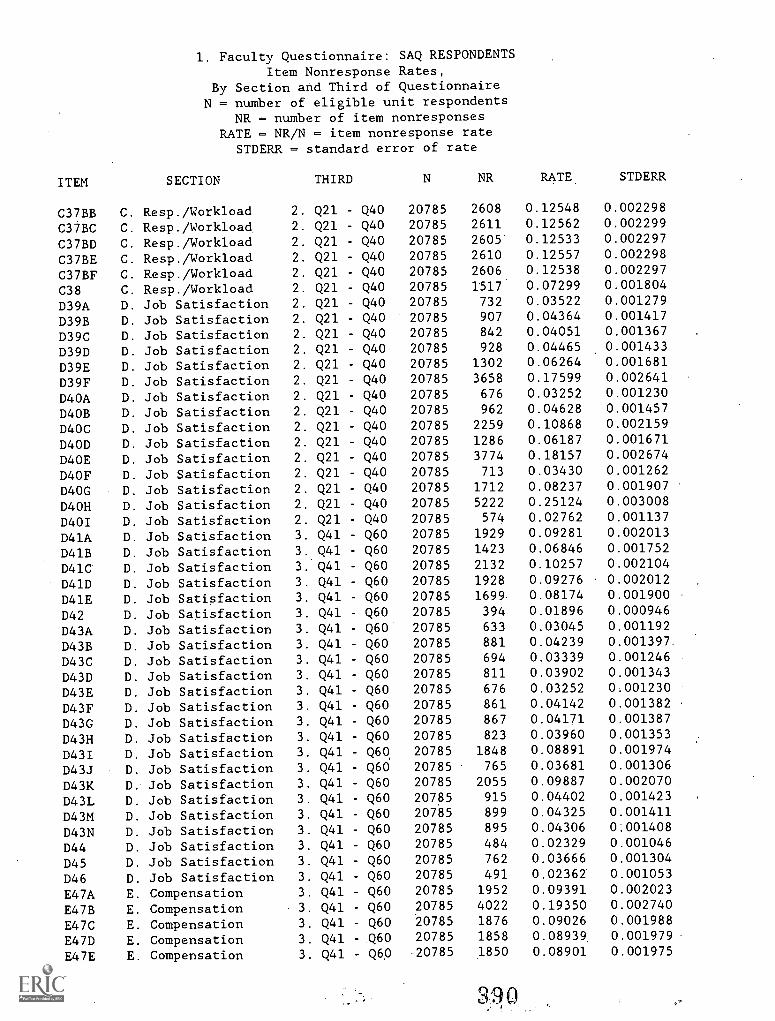
1. Faculty Questionnaire: SAQ RESPONDENTSItem Nonresponse Rates,
By Section and Third of QuestionnaireN = number of eligible unit respondents
NR = number of item nonresponsesRATE = NR/N = item nonresponse rate
STDERR = standard error of rate
ITEM SECTION THIRD N NR RATE STDERR
C37BB C. Resp./Workload 2. Q21 Q40 20785 2608 0.12548 0.002298
C37BC C. Resp./Workload 2. Q21 - Q40 20785 2611 0.12562 0.002299
C37BD C. Resp./Workload 2. Q21 - Q40 20785 2605 0.12533 0.002297
C37BE C. Resp./Workload 2. Q21 - Q40 20785 2610 0.12557 0.002298
C37BF C. Resp./Workload 2. Q21 - Q40 20785 2606 0.12538 0.002297
C38 C. Resp./Workload 2. Q21 - Q40 20785 1517 0.07299 0.001804
D39A D. Job Satisfaction 2. Q21 - Q40 20785 732 0.03522 0.001279
D39B D. Job Satisfaction 2. Q21 - Q40 20785 907 0.04364 0.001417
D39C D. Job Satisfaction 2. Q21 - Q40 20785 842 0.04051 0.001367
D39D D. Job Satisfaction 2. Q21 - Q40 20785 928 0.04465 0.001433
D39E D. Job Satisfaction 2. Q21 - Q40 20785 1302 0.06264 0.001681
D39F D. Job Satisfaction 2. Q21 - Q40 20785 3658 0.17599 0.002641
D40A D. Job Satisfaction 2. Q21 Q40 20785 676 0.03252 0.001230
D4OB D. Job Satisfaction 2. Q21 - Q40 20785 962 0.04628 0.001457
D40C D. Job Satisfaction 2. Q21 Q40 20785 2259 0.10868 0.002159
D4OD D. Job Satisfaction 2. Q21 - Q40 20785 1286 0.06187 0.001671
D4OE D. Job Satisfaction 2. Q21 Q40 20785 3774 0.18157 0.002674
D4OF D. Job Satisfaction 2. Q21 - Q40 20785 713 0.03430 0.001262
D4OG D. Job Satisfaction 2. Q21 - Q40 20785 1712 0.08237 0.001907
D4OH D. Job Satisfaction 2. Q21 Q40 20785 5222 0.25124 0.003008
D401 D. Job Satisfaction 2. Q21 - Q40 20785 574 0.02762 0.001137
D41A D. Job Satisfaction 3. Q41 Q60 20785 1929 0.09281 0.002013
D41B D. Job Satisfaction 3. Q41 - Q60 20785 1423 0.06846 0.001752
D41C D. Job Satisfaction 3. Q41 Q60 20785 2132 0.10257 0.002104
D41D D. Job Satisfaction 3. Q41 - Q60 20785 1928 0.09276 0.002012
D41E D. Job Satisfaction 3. Q41 Q60 20785 1699 0.08174 0.001900
D42 D. Job Satisfaction 3. Q41 - Q60 20785 394 0.01896 0.000946
D43A D. Job Satisfaction 3. Q41 - Q60 20785 633 0.03045 0.001192
D43B D. Job Satisfaction 3. Q41 - Q60 20785 881 0.04239 0.001397.
D43C D. Job Satisfaction 3. Q41 - Q60 20785 694 0.03339 0.001246
D43D D. Job Satisfaction 3. Q41 Q60 20785 811 0.03902 0.001343
D43E D. Job Satisfaction 3. Q41 - Q60 20785 676 0.03252 0.001230
D43F D. Job Satisfaction 3. Q41 Q60 20785 861 0.04142 0.001382
D43G D. Job Satisfaction 3. Q41 - Q60 20785 867 0.04171 0.001387
D43H D. Job Satisfaction 3. Q41 - Q60 20785 823 0.03960 0.001353
D43I D. Job Satisfaction 3. Q41 - Q60 20785 1848 0.08891 0.001974
D43J D. Job Satisfaction 3. Q41 Q60 20785 765 0.03681 0.001306
D43K D. Job Satisfaction 3. Q41 - Q60 20785 2055 0.09887 0.002070
D43L D. Job Satisfaction 3. Q41 Q60 20785 915 0.04402 0.001423
D43M D. Job Satisfaction 3. Q41 - Q60 20785 899 0.04325 0.001411
D43N D. Job Satisfaction 3. Q41 - Q60 20785 895 0.04306 0:001408
D44 D. Job Satisfaction 3. Q41 - Q60 20785 484 0.02329 0.001046
D45 D. Job Satisfaction 3. Q41 - Q60 20785 762 0.03666 0.001304
D46 D. Job Satisfaction 3. Q41 - Q60 20785 491 0.02362 0.001053
E47A E. Compensation 3. Q41 - Q60 20785 1952 0.09391 0.002023
E47B E. Compensation 3. Q41 - Q60 20785 4022 0.19350 0.002740
E47C E. Compensation 3. Q41 - Q60 20785 1876 0.09026 0.001988
E47D E. Compensation 3. Q41 -.Q60 20785 1858 0.08939 0.001979
E47E E. Compensation 3. Q41 - Q60 20785 1850 0.08901 0.001975
3i:10
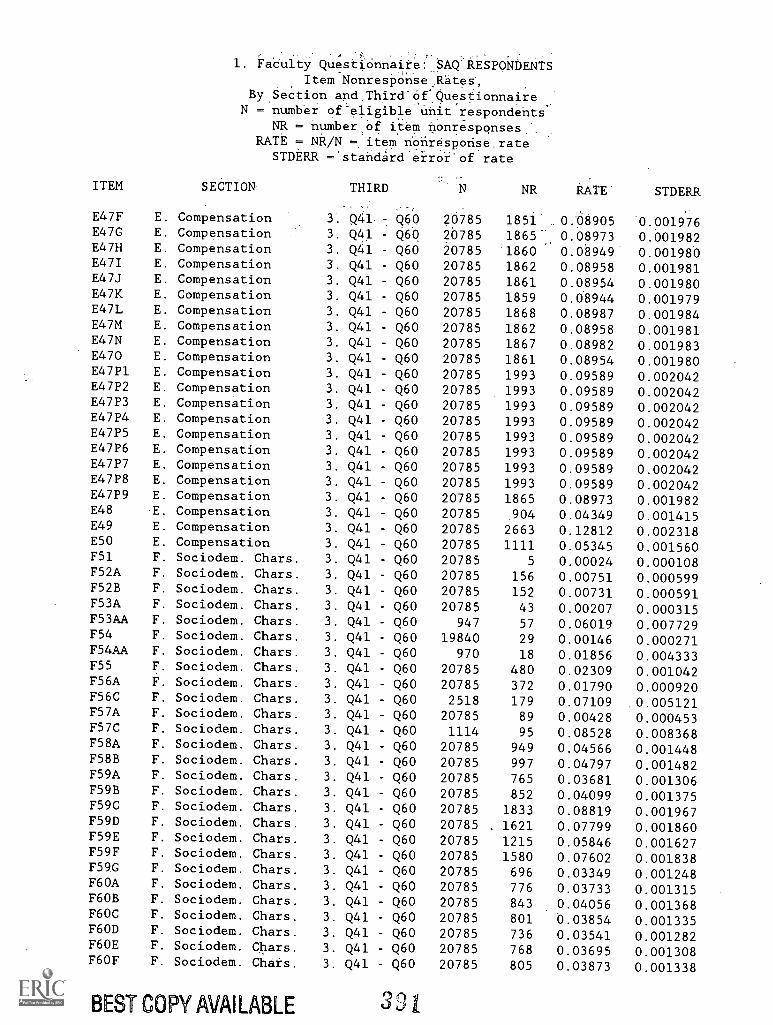
1. FaCultY Questionnaite: SAQ RESPONDENTS-
Item NOnresi:lonse,Kates",
BySection and.Third'OfQuestionnaireN = number of-eligible unit respondents
NR = number`of
item nonresponses..RATE = NR/N 7 item noriresponse.rateSTDERR ='standardeiroi'of rate
ITEM SECTION THIRD N NR RATE STDERR
E47F E. Compensation 3. Q41 Q60 20785 1851 0.08905 0.001976E47G E. Compensation 3. Q41 - Q60 20785 1865 0.08973 0.001982E47H E. Compensation 3. Q41 - Q60 20785 1860 0.08949 0.001980E47I E. Compensation 3. Q41 - Q60 20785 1862 0.08958 0.001981E47J E. Compensation 3. Q41 Q60 20785 1861 0.08954 0.001980E47K E. Compensation 3. Q41 - Q60 20785 1859 0.08944 0.001979E47L E. Compensation 3. Q41 - Q60 20785 1868 0.08987 0.001984E47M E. Compensation 3. Q41 - Q60 20785 1862 0.08958 0.001981E47N E. Compensation 3. Q41 - Q60 20785 1867 0.08982 0.001983E470 E. Compensation 3. Q41 - Q60 20785 1861 0.08954 0.001980E47P1 E. Compensation 3. Q41 - Q60 20785 1993 0.09589 0.002042E47P2 E. Compensation 3. Q41 - Q60 20785 1993 0.09589 0.002042E47P3 E. Compensation 3. Q41 - Q60 20785 1993 0.09589 0.002042E47P4 E. Compensation 3. Q41 - Q60 20785 1993 0.09589 0.002042E47P5 E. Compensation 3. Q41 - Q60 20785 1993 0.09589 0.002042E47P6 E. Compensation 3. Q41 - Q60 20785 1993 0.09589 0.002042E47P7 E. Compensation 3. Q41 - Q60 20785 1993 0.09589 0.002042E47P8 E. Compensation 3. Q41 - Q60 20785 1993 0.09589 0.002042E47P9 E. Compensation 3. Q41 - Q60 20785 1865 0.08973 0.001982E48 E. Compensation 3. Q41 Q60 20785 904 0.04349 0.001415E49 E. Compensation 3. Q41 - Q60 20785 2663 0.12812 0.002318E50 E. Compensation 3. Q41 - Q60 20785 1111 0.05345 0.001560F51 F. Sociodem. Chars. 3. Q41 - Q60 20785 5 0.00024 0.000108F52A F. Sociodem. Chars. 3. Q41 - Q60 20785 156 0.00751 0.000599F52B F. Sociodem. Chars. 3. Q41 - Q60 20785 152 0.00731 0.000591F53A F. Sociodem. Chars. 3. Q41 - Q60 20785 43 0.00207 0.000315F53AA F. Sociodem. Chars. 3. Q41 - Q60 947 57 0.06019 0.007729F54 F. Sociodem. Chars. 3. Q41 - Q60 19840 29 0.00146 0.000271F54AA F. Sociodem. Chars. 3. Q41 - Q60 970 18 0.01856 0.004333F55 F. Sociodem. Chars. 3. Q41 - Q60 20785 480 0.02309 0.001042F56A F. Sociodem. Chars. 3. Q41 Q60 20785 372 0.01790 0.000920F56C F. Sociodem. Chars. 3. Q41 Q60 2518 179 0.07109 .0.005121F57A F. Sociodem. Chars. 3. Q41 Q60 20785 89 0.00428 0.000453F57C F. Sociodem. Chars. 3. Q41 - Q60 1114 95 0.08528 0.008368F58A F. Sociodem. Chars. 3. Q41 - Q60 20785 949 0.04566 0.001448F58B F. Sociodem. Chars. 3. Q41 - Q60 20785 997 0.04797 0.001482F59A F. Sociodem. Chars. 3. Q41 - Q60 20785 765 0.03681 0.001306F59B F. Sociodem. Chars. 3. Q41 - Q60 20785 852 0.04099 0.001375F59C F. Sociodem. Chars. 3. Q41 - Q60 20785 1833 0.08819 0.001967F59D F. Sociodem. Chars. 3. Q41 - Q60 20785 1621 0.07799 0.001860F59E F. Sociodem. Chars. 3. Q41 - Q60 20785 1215 0.05846 0.001627F59F F. Sociodem. Chars. 3. Q41 - Q60 20785 1580 0.07602 0.001838F59G F. Sociodem. Chars. 3. Q41 - Q60 20785 696 0.03349 0.001248F60A F. Sociodem. Chars. 3. Q41 - Q60 20785 776 0.03733 0.001315F6OB F. Sociodem. Chars. 3. Q41 - Q60 20785 843 0.04056 0.001368F60C F. Sociodem. Chars. 3. Q41 - Q60 20785 801 0.03854 0.001335F6OD F. Sociodem. Chars. 3. Q41 - Q60 20785 736 0.03541 0.001282F60E F. Sociodem. Chars. 3. Q41 - Q60 20785 768 0.03695 0.001308F6OF F. Sociodem. Chars. 3. Q41 - Q60 20785 805 0.03873 0.001338
BEST COPY AVAILABLE 3 3 I
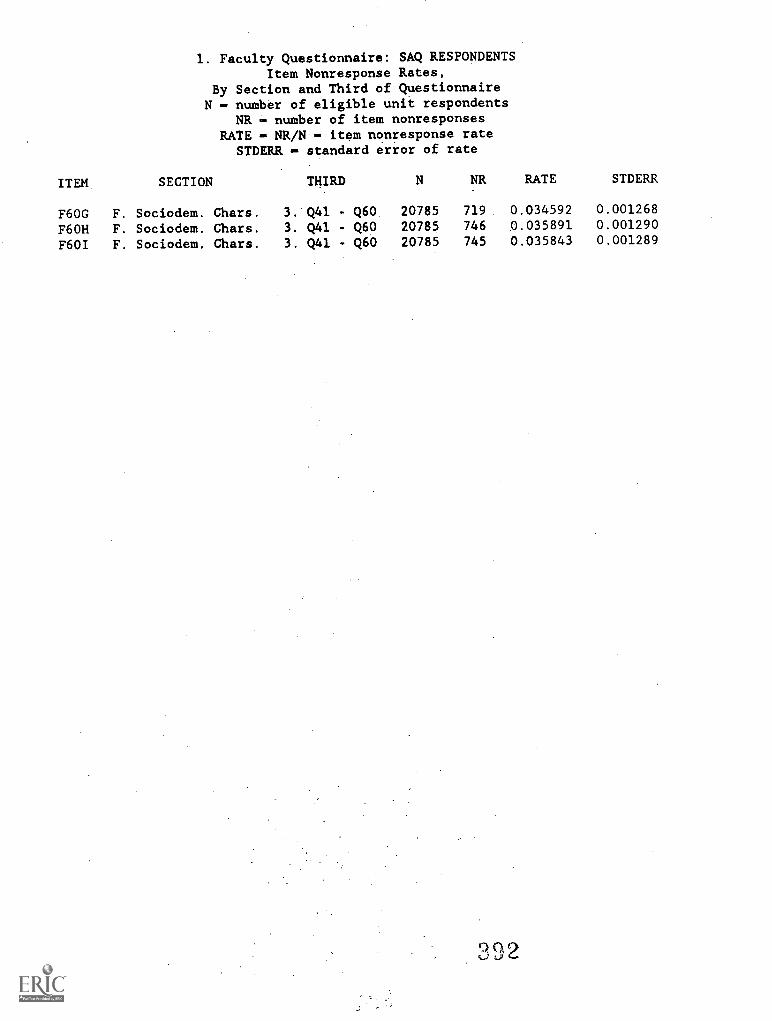
1. Faculty Questionnaire: SAQ RESPONDENTSItem Nonresponse Rates,
By Section and Third of QuestionnaireN number of eligible unit respondents
NR number of item nonresponsesRATE NR/N'.. item nonresponse rate
STDERR standard error of rate
ITEM SECTION THIRD N NR RATE STDERR
F6OG F. Sociodem. Chars. 3. Q41 . Q60 20785 719 0.034592 0.001268
F6OH F. Sociodem. Chars. 3. Q41 - Q60 20785 746 0.035891 0.001290
F601 F. Sociodem. Chars. 3. Q41 - Q60 20785 745 0.035843 0.001289
Q92
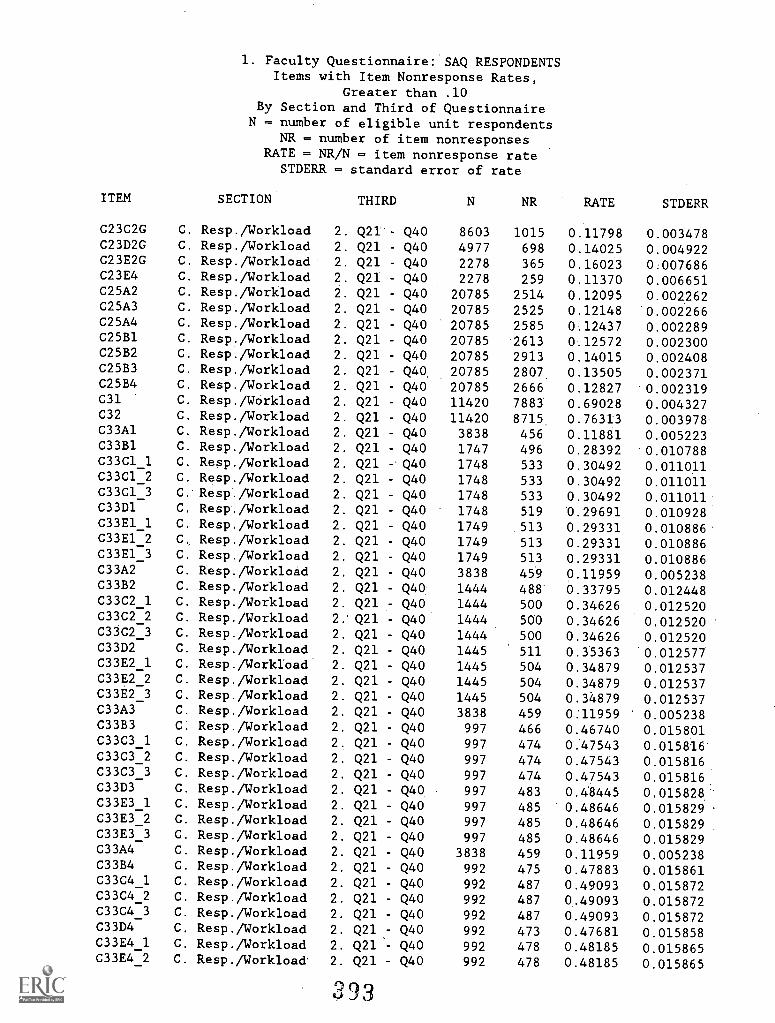
1. Faculty Questionnaire: SAQ RESPONDENTSItems with Item Nonresponse Rates,
Greater than .10By Section and Third of Questionnaire
N = number of eligible unit respondentsNR = number of item nonresponses
RATE = NR/N - item nonresponse rateSTDERR - standard error of rate
ITEM SECTION THIRD N NR RATE STDERR
C23C2G C. Resp./Workload 2. Q21 - Q40 8603 1015 0.11798 0.003478C23D2G C. Resp./Workload 2. Q21 - Q40 4977 698 0.14025 0.004922C23E2G C. Resp./Workload 2. Q21 - Q40 2278 365 0.16023 0.007686C23E4 C. Resp./Workload 2. Q21 - Q40 2278 259 0.11370 0.006651C25A2 C. Resp./Workload 2. Q21 - Q40 20785 2514 0.12095 0.002262C25A3 C. Resp./Workload 2. Q21 - Q40 20785 2525 0.12148 0.002266C25A4 C. Resp./Workload 2. Q21 Q40 20785 2585 0.12437 0.002289C25B1 C. Resp./Workload 2. Q21 - Q40 20785 '2613 0.12572 0.002300C25B2 C. Resp./Workload 2. Q21 - Q40 20785 2913 0.14015 0.002408C25B3 C. Resp./Workload 2. Q21 - Q40 20785 2807 0.13505 0.002371C25B4 C. Resp./Workload 2. Q21 - Q40 20785 2666 0.12827 '0.002319C31 C. Resp./Workload 2. Q21 - Q40 11420 7883' 0.69028 0.004327C32 C. Resp./Workload 2. Q21 - Q40 11420 8715 0.76313 0.003978C33A1 C. Resp./Workload 2. Q21 - Q40 3838 456 0.11881 0.005223C33B1 C. Resp./Workload 2. Q21 - Q40 1747 496 0.28392 0.010788C33C1_1 C. Resp./Workload 2. Q21 -'Q40 1748 533 0.30492 0.011011C33C1_2 C. Resp./Workload 2. Q21 - Q40 1748 533 0.30492 0.011011C33C1_3 C. Resp./Workload 2. Q21 - Q40 1748 533 0.30492 0.011011C33D1 C. Resp./Workload 2. Q21 - Q40 1748 519 0.29691 0.010928C33E1_1 C. Resp./Workload 2. Q21 - Q40 1749 513 0.29331 0.010886C33E1_2 C. Resp./Workload 2. Q21 - Q40 1749 513 0.29331 0.010886C33E1_3 C. Resp./Workload 2. Q21 - Q40 1749 513 0.29331 0.010886C33A2 C. Resp./Workload 2. Q21 - Q40 3838 459 0.11959 0.005238C33B2 C. Resp./Workload 2. Q21 - Q40 1444 488 0.33795 0.012448C33C2_1 C. Resp./Workload 2. Q21 - Q40 1444 500 0.34626 0.012520C33C2_2 C. Resp./Workload 2.' Q21 - Q40 1444 500 0.34626 0.012520C33C2_3 C. Resp./Workload 2. Q21 - Q40 1444 500 0.34626 0.012520C33D2 C. Resp./Workload 2. Q21 - Q40 1445 511 0.35363 0.012577C33E2 1 C. Resp./Workload 2. Q21 - Q40 1445 504 0.34879 0.012537C33E2 2 C. Resp./Workload 2. Q21 - Q40 1445 504 0.34879 0.012537C33E2_3 C. Resp./Workload 2. Q21 - Q40 1445 504 0.34879 0.012537C33A3 C. Resp./Workload 2. Q21 - Q40 3838 459 0:11959 0.005238C33B3 C. Resp./Workload 2. Q21 - Q40 997 466 0.46740 0.015801C33C3_1 C. Resp./Workload 2. Q21 - Q40 997 474 0.47543 0.015816'C33C3_2 C. Resp./Workload 2. Q21 - Q40 997 474 0.47543 0.015816C33C3_3 C. Resp./Workload 2. Q21 - Q40 997 474 0.47543 0.015816C33D3 C. Resp./Workload 2. Q21 - Q40 997 483 0.48445 0.015828,C33E3_1 C. Resp./Workload 2. Q21 - Q40 997 485 0.48646 0.015829C33E3_2 C. Resp./Workload 2. Q21 - Q40 997 485 0.48646 0.015829C33E3_3 C. Resp./Workload 2. Q21 - Q40 997 485 0.48646 0.015829C33A4 C. Resp./Workload 2. Q21 - Q40 3838 459 0.11959 0.005238C33B4 C. Resp./Workload 2. Q21 - Q40 992 475 0.47883 0.015861C33C4_1 C. Resp./Workload 2. Q21 - Q40 992 487 0.49093 0.015872C33C4_2 C. Resp./Workload 2. Q21 - Q40 992 487 0.49093 0.015872C33C4_3 C. Resp./Workload 2. Q21 - Q40 992 487 0.49093 0.015872C33D4 C. Resp./Workload 2. Q21 - Q40 992 473 0.47681 0.015858C33E4_1 C. Resp./Workload 2. Q21 Q40 992 478 0.48185 0.015865C33E4 2 C. Resp./Workload' 2. Q21 - Q40 992 478 0.48185 0.015865
:393
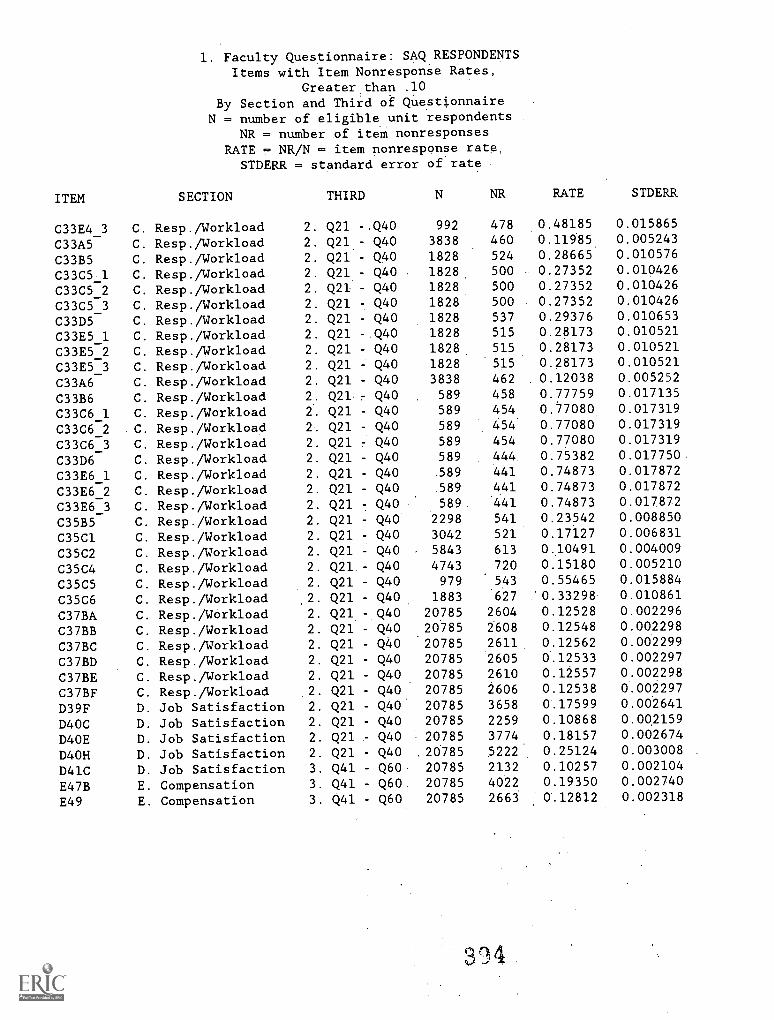
1. Faculty Questionnaire: SAQ RESPONDENTSItems with Item Nonrespone Rates,
Greater than .10By Section and Third of Questionnaire
N = number of eligible unit respondentsNR = number of item nonresponses
RATE = NR/N - item nonresponse rate,STDERR = standard error of rate
ITEM SECTION THIRD N NR RATE STDERR
C33E4 3 C. Resp./Workload 2. Q21 -,Q40 992 478 0.48185 0.015865
C33A5 C. Resp./Workload 2. Q21 Q40 3838 460 0.11985 0.005243
C33B5 C. Resp./Workload 2. Q21 Q40 1828 524 0.28665 0.010576
C33C5.1 C. Resp./Workload 2. Q21 - Q40 1828 500 0.27352 0.010426
C33C5 2 C. Resp./Workload 2. Q2I - Q40 1828 500 0.27352 0.010426
C33C5 3 C. Resp./Workload 2. Q21 Q40 1828 500 0.27352 0.010426
C33D5- C. Resp./Workload 2. Q21 - Q40 1828 537 0.29376 0.010653
C33E5_1 C. Resp./Workload 2. Q21 -.Q40 1828 515 0.28173 0.010521
C33E5_2 C. Resp./Workload 2. Q21 Q40 1828 515 0.28173 0.010521
C33E5 3 C. Resp./Workload 2. Q21 - Q40 1828 515 0.28173 0.010521
C33A6 C. Resp./Workload 2. Q21 Q40 3838 462 0.12038 0.005252
C33B6 C. Resp./Workload 2. Q21. Q40 589 458 0.77759 0.017135
C33C6_1 C. Resp./Workload 2. Q21 Q40 589 454 0.77080 0.017319
C33C6 2 C. Resp./Workload 2. Q21 - Q40 589 454 0.77080 0.017319
C33C6 3 C. Resp./Workload 2. Q21 Q40 589 454 0.77080 0.017319
C33D6- C. Resp./Workload 2. Q21 - Q40 589 444 0.75382 0.017750
C33E6 1 C. Resp./Workload 2. Q21 - Q40 589 441 0.74873 0.017872
C33E6 2 C. Resp./Workload 2. Q21 - Q40 589 441 0.74873 0.017872
C33E6-3 C. Resp./Workload 2. Q21 Q40 589 441 0.74873 0.017872
C35B5 C. Resp./Workload 2. Q21 - Q40 2298 541 0.23542 0.008850
C35C1 C. Resp./Workload 2. Q21 - Q40 3042 521 0.17127 0.006831
C35C2 C. Resp./Workload 2. Q21 - Q40 5843 613 0.10491 0.004009
C35C4 C. Resp./Workload 2. Q21 - Q40 4743 720 0.15180 0.005210
C35C5 C. Resp./Workload 2. Q21 - Q40 979 543 0.55465 0.015884
C35C6 C. Resp./Workload 2. Q21 - Q40 1883 627 0.33298 0.010861
C37BA C. Resp./Workload 2. Q21 - Q40 20785 2604 0.12528 0.002296
C37BB C. Resp./Workload 2. Q21 - Q40 20785 2608 0.12548 0.002298
C37BC C. Resp./Workload 2. Q21 - Q40 20785 2611 0.12562 0.002299
C37BD C. Resp./Workload 2. Q21 Q40 20785 2605 0.12533 0.002297
C37BE C. Resp./Workload 2. Q21 - Q40 20785 2610 0.12557 0.002298
C37BF C. Resp./Workload 2. Q21 Q40 20785 2606 0.12538 0.002297
D39F D. Job Satisfaction 2. Q21 - Q40 20785 3658 0.17599 0.002641
D40C D. Job Satisfaction 2. Q21 - Q40 20785 2259 0.10868 0.00.2159
D4OE D. Job Satisfaction 2. Q21 - Q40 20785 3774 0.18157 0.002674
D4OH D. Job Satisfaction 2. Q21 - Q40 20785 5222 0.25124 0.003008
D41C D. Job Satisfaction 3. Q41 - Q60 20785 2132 0.10257 0.002104
E47B E. Compensation 3. Q41 - Q60 20785 4022 0.19350 0.002740
E49 E. Compensation 3. Q41 - Q60 20785 2663 0.12812 0.002318
094
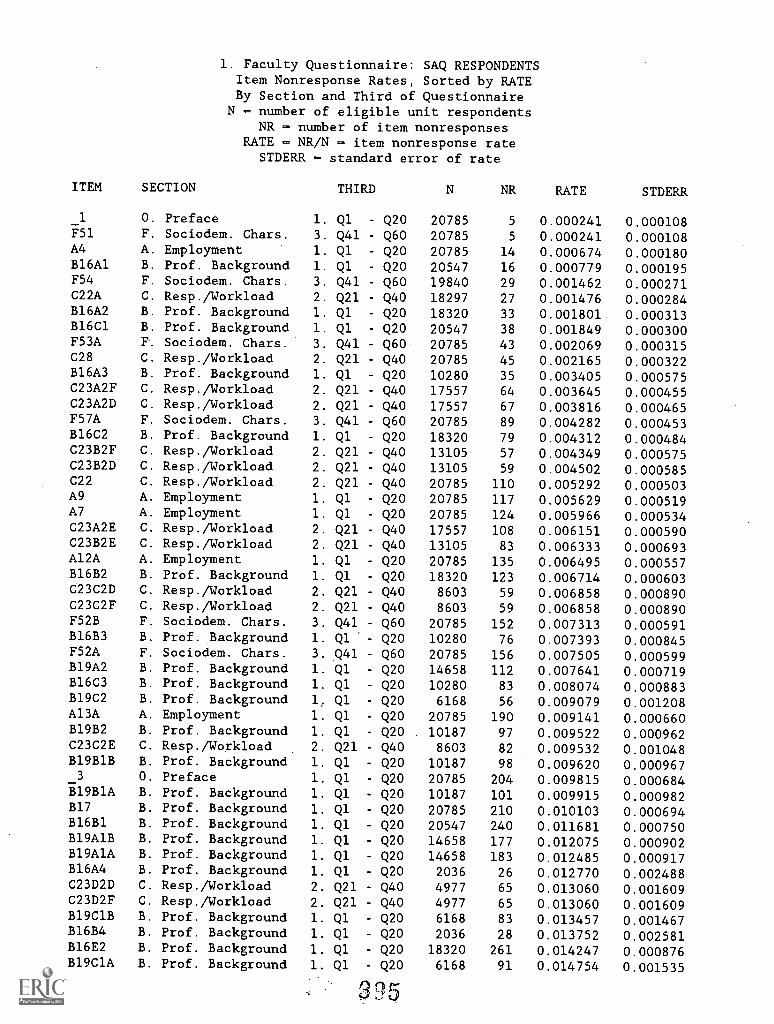
1. Faculty Questionnaire: SAQ RESPONDENTSItem Nonresponse Rates, Sorted by RATEBy Section and Third of Questionnaire
N - number of eligible unit respondentsNR - number of item nonresponses
RATE - NR/N - item nonresponse rateSTDERR - standard error of rate
ITEM SECTION THIRD N NR RATE STDERR
_1 O. Preface 1. Ql - Q20 20785 5 0.000241 0.000108F51 F. Sociodem. Chars. 3. Q41 - Q60 20785 5 0.000241 0.000108A4 A. Employment 1. Q1 - Q20 20785 14 0.000674 0.000180B16A1 B. Prof. Background 1. Q1 - Q20 20547 16 0.000779 0.000195F54 F. Sociodem. Chars. 3. Q41 - Q60 19840 29 0.001462 0.000271C22A C. Resp./Workload 2. Q21 - Q40 18297 27 0.001476 0.000284B16A2 B. Prof. Background 1. Ql - Q20 18320 33 0.001801 0.000313B16C1 B. Prof. Background 1. Q1 - Q20 20547 38 0.001849 0.000300F53A F. Sociodem. Chars. 3. Q41 - Q60 20785 43 0.002069 0.000315C28 C. Resp./Workload 2. Q21 Q40 20785 45 0.002165 0.000322B16A3 B. Prof. Background 1. Q1 - Q20 10280 35 0.003405 0.000575C23A2F C. Resp./Workload 2. Q21 - Q40 17557 64 0.003645 0.000455C23A2D C. Resp./Workload 2. Q21 - Q40 17557 67 0.003816 0.000465F57A F. Sociodem. Chars. 3. Q41 - Q60 20785 89 0.004282 0.000453B16C2 B. Prof. Background 1. Q1 - Q20 18320 79 0.004312 0.000484C23B2F C. Resp./Workload 2. Q21 - Q40 13105 57 0.004349 0.000575C23B2D C. Resp./Workload 2. Q21 Q40 13105 59 0.004502 0.000585C22 C. Resp./Workload 2. Q21 - Q40 20785 110 0.005292 0.000503A9 A. Employment 1. Ql - Q20 20785 117 0.005629 0.000519A7 A. Employment 1. Q1 - Q20 20785 124 0.005966 0.000534C23A2E C. Resp./Workload 2. Q21 - Q40 17557 108 0.006151 0.000590C23B2E C. Resp./Workload 2. Q21 - Q40 13105 83 0.006333 0.000693Al2A A. Employment 1. Q1 - Q20 20785 135 0.006495 0.000557B16B2 B. Prof. Background 1. Q1 - Q20 18320 123 0.006714 0.000603C23C2D C. Resp./Workload 2. Q21 - Q40 8603 59 0.006858 0.000890C23C2F C. Resp./Workload 2. Q21 - Q40 8603 59 0.006858 0.000890F52B F. Sociodem. Chars. 3. Q41 - Q60 20785 152 0.007313 0.000591B16B3 B. Prof. Background 1. Q1 - Q20 10280 76 0.007393 0.000845F52A F. Sociodem. Chars. 3. Q41 - Q60 20785 156 0.007505 0.000599B19A2 B. Prof. Background 1. Q1 - Q20 14658 112 0.007641 0.000719B16C3 B. Prof. Background 1. Ql - Q20 10280 83 0.008074 0.000883B19C2 B. Prof. Background 1, Ql - Q20 6168 56 0.009079 0.001208Al3A A. Employment 1. Q1 - Q20 20785 190 0.009141 0.000660B19B2 B. Prof. Background 1. Q1 - Q20 10187 97 0.009522 0.000962C23C2E C. Resp./Workload 2. Q21 - Q40 8603 82 0.009532 0.001048B19B1B B. Prof. Background 1. Ql - Q20 10187 98 0.009620 0.000967_3 O. Preface 1. Q1 - Q20 20785 204 0.009815 0.000684B19B1A B. Prof. Background 1. Q1 - Q20 10187 101 0.009915 0.000982B17 B. Prof. Background 1. Ql - Q20 20785 210 0.010103 0.000694B16B1 B. Prof. Background 1. Q1 - Q20 20547 240 0.011681 0.000750B19A1B B. Prof. Background 1. Q1 - Q20 14658 177 0.012075 0.000902B19A1A B. Prof. Background 1. Q1 - Q20 14658 183 0.012485 0.000917B16A4 B. Prof. Background 1. Q1 - Q20 2036 26 0.012770 0.002488C23D2D C. Resp./Workload 2. Q21 - Q40 4977 65 0.013060 0.001609C23D2F C. Resp./Workload 2. Q21 - Q40 4977 65 0.013060 0.001609B19C1B B. Prof. Background 1. Q1 - Q20 6168 83 0.013457 0.001467B16B4 B. Prof. Background 1. Q1 - Q20 2036 28 0.013752 0.002581B16E2 B. Prof. Background 1. Q1 - Q20 18320 261 0.014247 0.000876B19C1A B. Prof. Background 1. Ql - Q20 6168 91 0.014754 0.001535
nj'
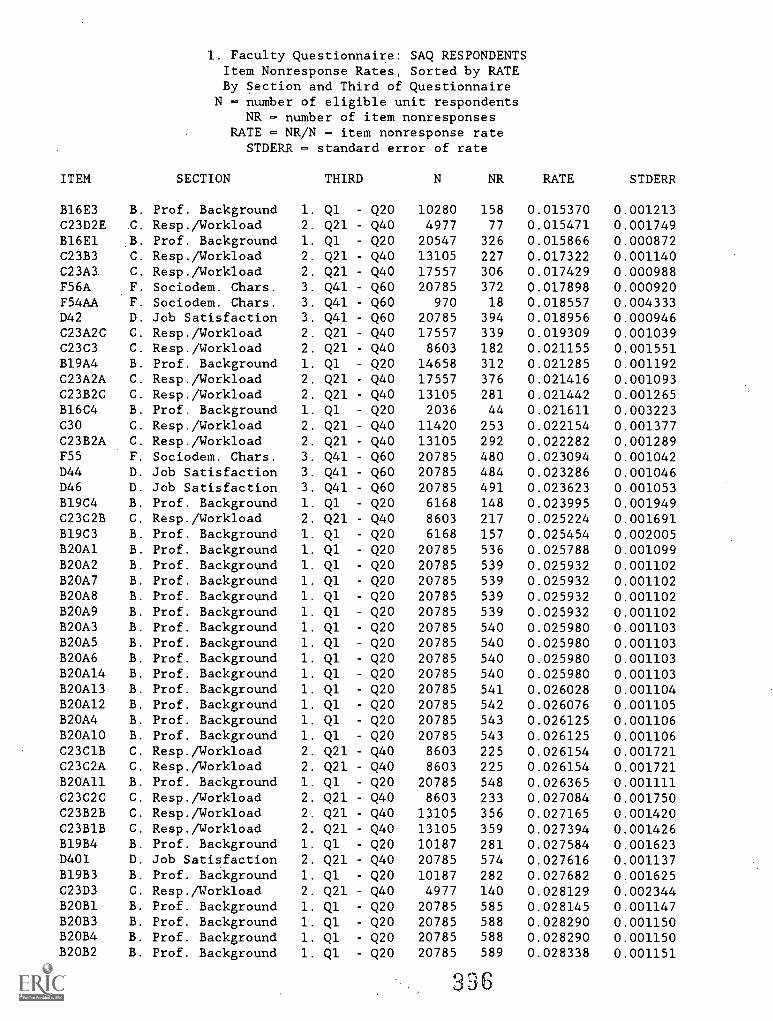
1. Faculty Questionnaire: SAQ RESPONDENTSItem Nonresponse Rates, Sorted by RATEBy Section and Third of Questionnaire
N - number of eligible unit respondentsNR = number of item nonresponses
RATE = NR/N = item nonresponse rateSTDERR = standard error of rate
ITEM SECTION THIRD N NR RATE STDERR
B16E3 B. Prof. Background 1. Ql - Q20 10280 158 0.015370 0.001213C23D2E C. Resp./Workload 2. Q21 - Q40 4977 77 0.015471 0.001749B16E1 B. Prof. Background 1. Ql - Q20 20547 326 0.015866 0.000872C23B3 C. Resp./Workload 2. Q21 - Q40 13105 227 0.017322 0.001140C23A3. C. Resp./Workload 2. Q21 - Q40 17557 306 0.017429 0.000988F56A F. Sociodem. Chars. 3. Q41 - Q60 20785 372 0.017898 0.000920F54AA F. Sociodem. Chars. 3. Q41 - Q60 970 18 0.018557 0.004333D42 D. Job Satisfaction 3. Q41 - Q60 20785 394 0.018956 0.000946C23A2C C. Resp./Workload 2. Q21 - Q40 17557 339 0.019309 0.001039C23C3 C. Resp./Workload 2. Q21 - Q40 8603 182 0.021155 0.001551B19A4 B. Prof. Background 1. Q1 Q20 14658 312 0.021285 0.001192C23A2A C. Resp./Workload 2. Q21 - Q40 17557 376 0.021416 0.001093C23B2C C. Resp./Workload 2. Q21 - Q40 13105 281 0.021442 0.001265B16C4 B. Prof. Background 1. Ql Q20 2036 44 0.021611 0.003223C30 C. Resp./Workload 2. Q21 Q40 11420 253 0.022154 0.001377C23B2A C. Resp./Workload 2. Q21 Q40 13105 292 0.022282 0.001289F55 F. Sociodem. Chars. 3. Q41 - Q60 20785 480 0.023094 0.001042D44 D. Job Satisfaction 3. Q41 Q60 20785 484 0.023286 0.001046D46 D. Job Satisfaction 3. Q41 Q60 20785 491 0.023623 0.001053B19C4 B. Prof. Background 1. Ql - Q20 6168 148 0.023995 0.001949C23C2B C. Resp./Workload 2. Q21 - Q40 8603 217 0.025224 0.001691B19C3 B. Prof. Background 1. Ql Q20 6168 157 0.025454 0.002005B20A1 B. Prof. Background 1. Ql - Q20 20785 536 0.025788 0.001099B20A2 B. Prof. Background 1. Ql - Q20 20785 539 0.025932 0.001102B20A7 B. Prof. Background 1. Ql Q20 20785 539 0.025932 0.001102B20A8 B. Prof. Background 1. Ql - Q20 20785 539 0.025932 0.001102B20A9 B. Prof. Background 1. Ql - Q20 20785 539 0.025932 0.001102B20A3 B. Prof. Background 1. Ql - Q20 20785 540 0.025980 0.001103B20A5 B. Prof. Background 1. Ql - Q20 20785 540 0.025980 0.001103B20A6 B. Prof. Background 1. Ql Q20 20785 540 0.025980 0.001103B20A14 B. Prof. Background 1. Ql - Q20 20785 540 0.025980 0.001103B20A13 B. Prof. Background 1. Ql - Q20 20785 541 0.026028 0.001104B20Al2 B. Prof. Background 1. Ql Q20 20785 542 0.026076 0.001105B20A4 B. Prof. Background 1. Ql - Q20 20785 543 0.026125 0.001106B20A10 B. Prof. Background 1. Ql - Q20 20785 543 0.026125 0.001106C23C1B C. Resp./Workload 2. Q21 - Q40 8603 225 0.026154 0.001721C23C2A C. Resp./Workload 2. Q21 - Q40 8603 225 0.026154 0.001721B20A11 B. Prof. Background 1. Ql - Q20 20785 548 0.026365 0.001111C23C2C C. Resp./Workload 2. Q21 - Q40 8603 233 0.027084 0.001750C23B2B C. Resp./Workload 2. Q21 - Q40 13105 356 0.027165 0.001420C23B1B C. Resp./Workload 2. Q21 - Q40 13105 359 0.027394 0.001426B19B4 B. Prof. Background 1. Ql - Q20 10187 281 0.027584 0.001623D401 D. Job Satisfaction 2. Q21 Q40 20785 574 0.027616 0.001137B19B3 B. Prof. Background 1. Ql - Q20 10187 282 0.027682 0.001625C23D3 C. Resp./Workload 2. Q21 - Q40 4977 140 0.028129 0.002344B20B1 B. Prof. Background 1. Q1 - Q20 20785 585 0.028145 0.001147B20B3 B. Prof. Background 1. Q1 - Q20 20785 588 0.028290 0.001150B20B4 B. Prof. Background 1. Ql - Q20 20785 588 0.028290 0.001150B20B2 B. Prof. Background 1. Ql - Q20 20785 589 0.028338 0.001151
3'36
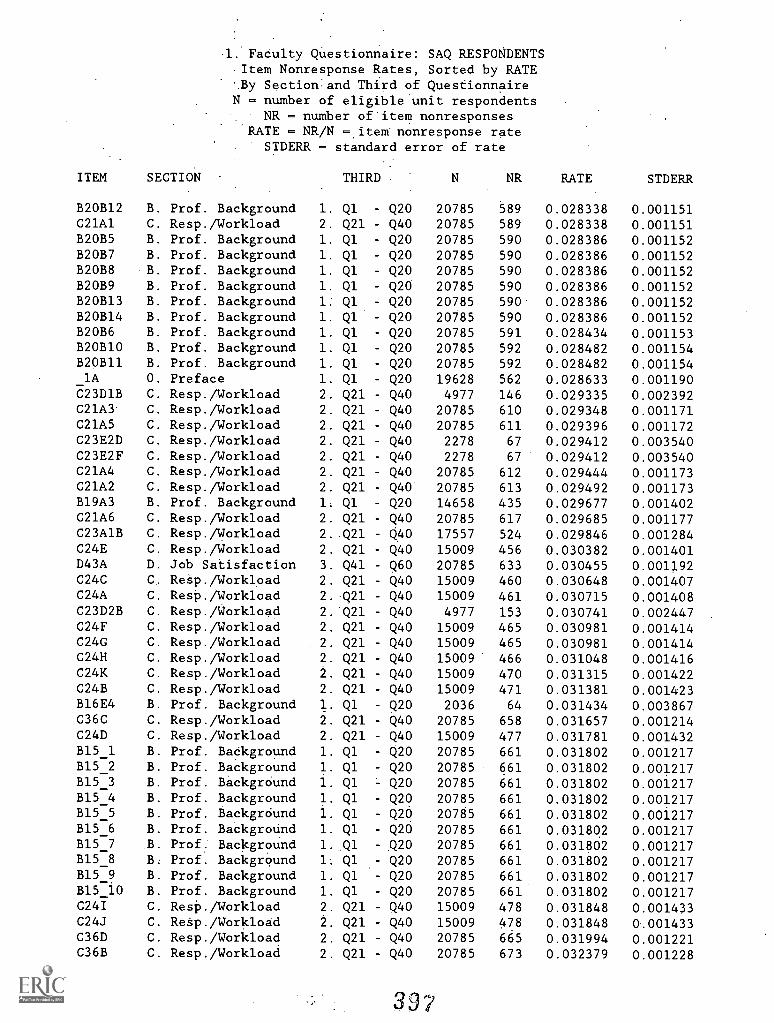
. Fadulty QUestionnaire: SAQ RESPONDENTSItem Nonresponse Rates, Sorted by RATE
-.By Sectionand Third of QuestionnaireN = number of eligible unit respondents
NR = number of'item nonresponsesRATE = NR/N -.item- nonresponse rate
STDERR = standard error of rate
ITEM SECTION THIRD N NR RATE STDERR
B20B12 B. Prof. Background 1. Q1 - Q20 20785 589 0.028338 0.001151C21A1 C. Resp./Workload 2. Q21 - Q40 20785 589 0.028338 0.001151B20B5 B. Prof. Background 1. Q1 - Q20 20785 590 0.028386 0.001152B20B7 B. Prof. Background 1. Q1 - Q20 20785 590 0.028386 0.001152B20B8 B. Prof. Background 1. Q1 - Q20 20785 590 0.028386 0.001152B20B9 B. Prof. Background 1. Q1 - Q20 20785 590 0.028386 0.001152B20B13 B. Prof. Background 1. Q1 - Q20 20785 590 0.028386 0.001152B20B14 B. Prof. Background 1. Q1 - Q20 20785 590 0.028386 0.001152B20B6 B. Prof. Background. 1. Q1 - Q20 20785 591 0.028434 0.001153B20B10 B. Prof. Background 1. Q1 - Q20 20785 592 0.028482 0.001154B20B11 B. Prof. Background 1. Q1 - Q20 20785 592 0.028482 0.001154
O. Preface 1. Q1 - Q20 19628 562 0.028633 0.001190_1AC23D1B C. Resp./Workload 2. Q21 - Q40 4977 146 0.029335 0.002392C21A3 C. Resp./Workload 2. Q21 - Q40 20785 610 0.029348 0.001171C21A5 C. Resp./Workload 2. Q21 Q40 20785 611 0.029396 0.001172C23E2D C. Resp./Workload 2. Q21 - Q40 2278 67 0.029412 0.003540C23E2F C. Resp./Workload 2. Q21 - Q40 2278 67 0.029412 0.003540C21A4 C. Resp./Workload 2. Q21 Q40 20785 612 0.029444 0.001173C21A2 C. Resp./Workload 2. Q21 - Q40 20785 613 0.029492 0.001173B19A3 B. Prof. Background 1. Q1 - Q20 14658 435 0.029677 0.001402C21A6 C. Resp./Workload 2. Q21 - Q40 20785 617 0.029685 0.001177C23A1B C. Resp./Workload 2..Q21 - Q40 17557 524 0.029846 0.001284C24E C. Resp./Workload 2. Q21 - Q40 15009 456 0.030382 0.001401D43A D. Job Satisfaction 3. Q41 - Q60 20785 633 0.030455 0.001192C24C C. Resp./Workload 2. Q21 - Q40 15009 460 0.030648 0.001407C24A C. Resp./Workload 2.Q21 - Q40 15009 461 0.030715 0.001408C23D2B C. Resp./Workload 2. Q21 - Q40 4977 153 0.030741 0.002447C24F C. Resp./Workload 2. Q21 - Q40 15009 465 0.030981 0.001414C24G C. Resp./Workload 2. Q21 Q40 15009 465 0.030981 0.001414C24H C. Resp./Workload 2. Q21 - Q40 1500 9 466 0.031048 0.001416C24K C. Resp./Workload 2. Q21 - Q40 15009 470 0.031315 0.001422C24B C. Resp./Workload 2. Q21 - Q40 15009 471 0.031381 0.001423B16E4 B. Prof. Background 1. Q1 - Q20 2036 64 0.031434 0.003867C36C C. Resp./Workload 2. Q21 - Q40 20785 658 0.031657 0.001214C24D C. Resp./Workload 2. Q21 - Q40 15009 477 0.031781 0.001432B15_1 B. Prof. BaOkground 1. Q1 - Q20 20785 661 0.031802 0.001217B15_2 B. Prof. Background 1. Q1 - Q20 20785 661 0.031802 0.001217B15_3 B. Prof. Background 1. Q1 - Q20 20785 661 0.031802 0.001217B154 B. Prof. Background 1. Q1 - Q20 20785 661 0.031802 0.001217B15:5 B. Prof. Backgr6und 1. Q1 - Q20 20785 661 0.031802 0.001217B15_6 B. Prof. Background 1. Q1 - Q20 20785 661 0.031802 0.001217B15_7 B. Prof. Background 1..Q1 - Q20 20785 661 0.031802 0.001217B15_8 B. Prof. Background 1. Q1 - Q20 20785 661 0.031802 0.001217B15_9 B. Prof. Background 1. Q1 - Q20 20785 661 0.031802 0.001217B15_10 B. Prof. Background 1. Q1 - Q20 20785 661 0.031802 0.001217C24I C. Resp./Workload 2. Q21 - Q40 15009 478 0.031848 0.001433C24J C. Resp./Workload 2. Q21 - Q40 15009 478 0.031848 0.001433C36D C. Resp./Workload 2. Q21 - Q40 20785 665 0.031994 0.001221C36B C. Resp./Workload 2. Q21 - Q40 20785 673 0.032379 0.001228
3 .9
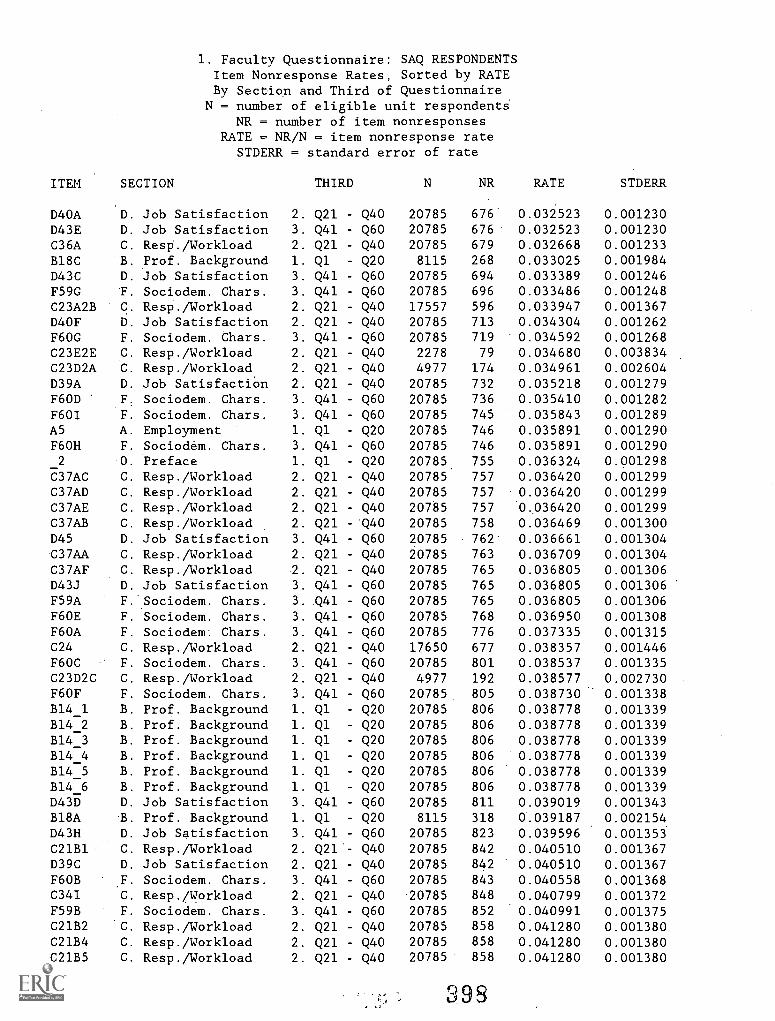
1. Faculty Questionnaire: SAQ RESPONDENTSItem Nonresponse Rates, Sorted by RATEBy Section and Third of Questionnaire
N = number of eligible unit respondentsNR = number of item nonresponses
RATE = NR/N = item nonresponse rateSTDERR = standard error of rate
ITEM SECTION THIRD N NR RATE STDERR
D40A D. Job Satisfaction 2. Q21 - Q40 20785 676 0.032523 0.001230D43E D. Job Satisfaction 3. Q41 Q60 20785 676 0.032523 0.001230C36A C. Resp./Workload 2. Q21 - Q40 20785 679 0.032668 0.001233B18C B. Prof. Background 1. Ql - Q20 8115 268 0.033025 0.001984D43C D. Job Satisfaction 3. Q41 - Q60 20785 694 0.033389 0.001246F59G F. Sociodem. Chars. 3. Q41 - Q60 20785 696 0.033486 0.001248C23A2B C. Resp./Workload 2. Q21 - Q40 17557 596 0.033947 0.001367D4OF D. Job Satisfaction 2. Q21 - Q40 20785 713 0.034304 0.001262F6OG F. Sociodem. Chars. 3. Q41 - Q60 20785 719 0.034592 0.001268C23E2E C. Resp./Workload 2. Q21 Q40 2278 79 0.034680 0.003834C23D2A C. Resp./Workload 2. Q21 Q40 4977 174 0.034961 0.002604D39A D. Job SatisfactiOn 2. Q21 - Q40 20785 732 0.035218 0.001279F6OD F. Sociodem. Chars. 3. Q41 Q60 20785 736 0.035410 0.001282F601 F. Sociodem. Chars. 3. Q41 - Q60 20785 745 0.035843 0.001289AS A. Employment 1. Ql - Q20 20785 746 0.035891 0.001290F6OH F. Sociodem. Chars. 3. Q41 Q60 20785 746 0.035891 0.001290_2 O. Preface 1. Ql - Q20 20785 755 0.036324 0.001298C37AC C. Resp./Workload 2. Q21 Q40 20785 757 0.036420 0.001299C37AD C. Resp./Workload 2. Q21 - Q40 20785 757 0.036420 0.001299C37AE C. Resp./Workload 2. Q21 Q40 20785 757 0..036420 0.001299C37AB C. Resp./Workload 2. Q21 - Q40 20785 758 0.036469 0.001300D45 D. Job Satisfaction 3. Q41 - Q60 20785 762 0.036661 0.001304C37AA C. Resp./Workload 2. Q21 - Q40 20785 763 0.036709 0.001304C37AF C. Resp./Workload 2. Q21 Q40 20785 765 0.036805 0.001306D43J D. Job Satisfaction 3. Q41 - Q60 20785 765 0.036805 0.001306F59A F. Sociodem. Chars. 3..Q41 - Q60 20785 765 0.036805 0.001306F60E F. Sociodem. Chars. 3. Q41 - Q60 20785 768 0.036950 0.001308F60A F. Sociodem. Chars. 3. Q41 - Q60 20785 776 0.037335 0.001315C24 C. Resp./Workload 2. Q21 Q40 17650 677 0.038357 0.001446F60C F. Sociodem. Chars. 3. Q41 - Q60 20785 801 0.038537 0.001335C23D2C C. Resp./Workload 2. Q21 - Q40 4977 192 0.038577 0.002730F6OF F. Sociodem. Chars. 3. Q41 Q60 20785 805 0.038730 0.001338B14_1 B. Prof. Background 1. Ql - Q20 20785 806 0.038778 0.001339B14_2 B. Prof. Background 1. Ql - Q20 20785 806 0.038778 0.001339B14_3 B. Prof. Background 1. Ql - Q20 20785 806 0.038778 0.001339B14_4 B. Prof. Background 1. Q1 - Q20 20785 806 0.038778 0.001339B14:5 B. Prof. Background 1. Ql - Q20 20785 806 0.038778 0.001339B14_6 B. Prof. Background 1. Ql - Q20 20785 806 0.038778 0.001339D43D D. Job Satisfaction 3. Q41 Q60 20785 811 0.039019 0.001343B18A B. Prof. Background 1. Ql - Q20 8115 318 0.039187 0.002154D43H D. Job Satisfaction 3. Q41 - Q60 20785 823 0.039596 0.001353C21B1 C. Resp./Workload 2. Q21'- Q40 20785 842 0.040510 0.001367D39C D. Job Satisfaction 2. Q21 - Q40 20785 842 0.040510 0.001367F6OB F. Sociodem. Chars. 3. Q41 - Q60 20785 843 0.040558 0.001368C34I C. Resp./Workload 2. Q21 - Q40 20785 848 0.040799 0.001372F59B F. Sociodem. Chars. 3. Q41 - Q60 20785 852 0.040991 0.001375C21B2 C. Resp./Workload 2. Q21 - Q40 20785 858 0.041280 0.001380C21B4 C. Resp./Workload 2. Q21 - Q40 20785 858 0.041280 0.001380C21B5 C. Resp./Workload 2. Q21 - Q40 20785 858 0.041280 0.001380
398
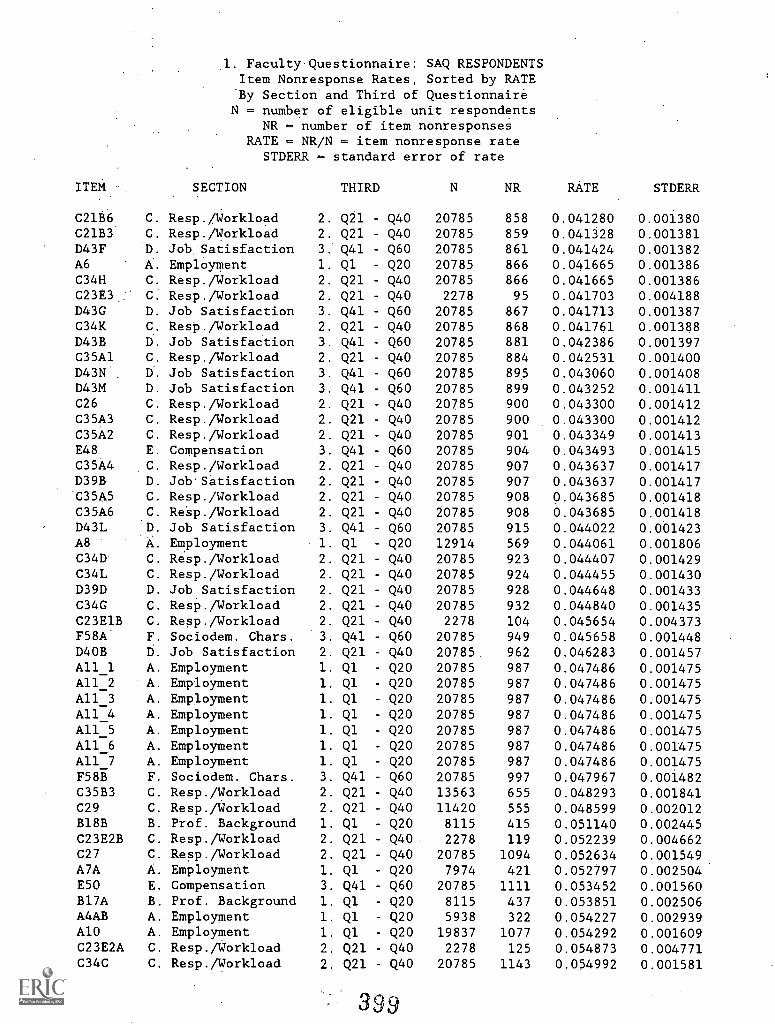
.1. Faculty Questionnaire: SAQ RESPONDENTSItem Nonresponse Rates, Sorted by RATEBy Section and Third of Questionnaire
N = number of eligible unit respondentsNR = number of item nonresponses
RATE = NR/N - item nonresponse rateSTDERR = standard error of rate
ITEM SECTION THIRD N NR RATE STDERR
C21B6 C. Resp./Workload 2. Q21 Q40 20785 858 0.041280 0.001380C21B3 C. Resp./Workload 2. Q21 - Q40 20785 859 0.041328 0.001381D43F D. Job Satisfaction 3. Q41 - Q60 20785 861 0.041424 0.001382A6 A. Employment 1. Ql - Q20 20785 866 0.041665 0.001386C34H C. Resp./Workload 2. Q21 - Q40 20785 866 0.041665 0.001386C23E3 C. Resp./Workload 2. Q21 - Q40 2278 95 0.041703 0.004188D43G D. Job Satisfaction 3. Q41 - Q60 20785 867 0.041713 0.001387C34K G. Resp./Workload 2. Q21 - Q40 20785 868 0.041761 0.001388D43B D. Job Satisfaction 3. Q41 Q60 20785 881 0.042386 0.001397C35A1 C. Resp./Workload 2. Q21 - Q40 20785 884 0.042531 0.001400D43N D. Job Satisfaction 3. Q41 Q60 20785 895 0.043060 0.001408D43M D. Job Satisfaction 3. Q41 - Q60 20785 899 0.043252 0.001411C26 C. Resp./Workload 2. Q21 Q40 20785 900 0.043300 0.001412C35A3 C. Resp./Workload 2. Q21 - Q40 20785 900 0.043300 0.001412C35A2 C. Resp./Workload 2. Q21 Q40 20785 901 0.043349 0.001413E48 E. Compensation 3. Q41 - Q60 20785 904 0.043493 0.001415C35A4 C. Resp./Workload 2. Q21 - Q40 20785 907 0.043637 0.001417D39B D. Job'Satisfaction 2. Q21 Q40 20785 907 0.043637 0.001417C35A5 C. Resp./Workload 2. Q21 - Q40 20785 908 0.043685 0.001418C35A6 C. Reep./Workload 2. Q21 Q40 20785 908 0.043685 0.001418D43L D. Job Satisfaction 3. Q41 - Q60 20785 915 0.044022 0.001423A8 A. Employment 1. Ql Q20 12914 569 0.044061 0.001806C34D C. Resp./Workload 2. Q21 Q40 20785 923 0.044407 0.001429C34L C. Resp./Workload 2. Q21 - Q40 20785 924 0.044455 0.001430D39D D. Job Satisfaction 2. Q21 - Q40 20785 928 0.044648 0.001433C34G C. Resp./Workload 2. Q21 Q40 20785 932 0.044840 0.001435C23E1B C. Resp./Workload 2. Q21 - Q40 2278 104 0.045654 0.004373F58A F. Sociodem. Chars. 3. Q41 - Q60 20785 949 0.045658 0.001448D4OB D. Job Satisfaction 2. Q21 Q40 20785 962 0.046283 0.001457Al1_1 A. Employment 1. Ql - Q20 20785 987 0.047486 0.001475All_2 A. Employment 1. Ql - Q20 20785 987 0.047486 0.001475A11_3 A. Employment 1. Ql Q20 20785 987 0.047486 0.001475All 4 A. Employment 1. Ql - Q20 20785 987 0.047486 0.001475All=5 A. Employment 1. Q1 - Q20 20785 987 0.047486 0.001475A11_6 A. Employment 1. Ql - Q20 20785 987 0.047486 0.001475A11_7 A. Employment 1. Ql - Q20 20785 987 0.047486 0.001475F58B F. Sociodem. Chars. 3. Q41 - Q60 20785 997 0.047967 0.001482C35B3 C. Resp./Workload 2. Q21 - Q40 13563 655 0.048293 0.001841C29 C. Resp./Workload 2. Q21 - Q40 11420 555 0.048599 0.002012B18B B. Prof. Background 1. Ql - Q20 8115 415 0.051140 0.002445C23E2B C. Resp./Workload 2. Q21 - Q40 2278 119 0.052239 0.004662C27 C. Resp./Workload 2. Q21 - Q40 20785 1094 0.052634 0.001549A7A A. Employment 1. Ql - Q20 7974 421 0.052797 0.002504E50 E. Compensation 3. Q41 - Q60 20785 1111 0.053452 0.001560B17A B. Prof. Background 1. Ql - Q20 8115 437 0.053851 0.002506A4AB A. Employment 1. Q1 - Q20 5938 322 0.054227 0.002939A10 A. Employment 1. Ql - Q20 19837 1077 0.054292 0.001609C23E2A C. Resp./Workload 2. Q21 - Q40 2278 125 0.054873 0.004771C34C C. Resp./Workload 2. Q21 - Q40 20785 1143 0.054992 0.001581
399
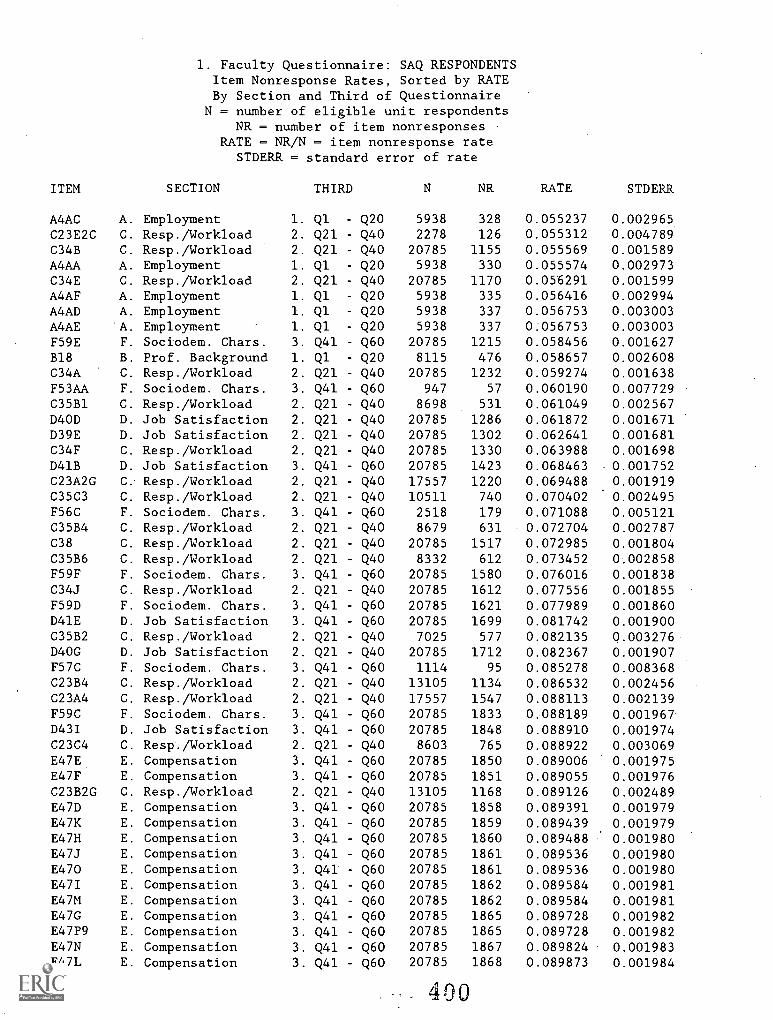
1. Faculty Questionnaire: SAQ RESPONDENTSItem Nonresponse Rates, Sorted by RATEBy Section and Third of Questionnaire
N = number of eligible unit respondentsNR = number of item nonresponses
RATE = NR/N - item nonresponse rateSTDERR = standard error of rate
ITEM SECTION THIRD N NR RATE STDERR
A4AC A. Employment 1. Ql - Q20 5938 328 0.055237 0.002965C23E2C C. Resp./Workload 2. Q21 Q40 2278 126 0.055312 0.004789C34B C. Resp./Workload 2. Q21 - Q40 20785 1155 0.055569 0.001589A4AA A. Employment 1. Ql Q20 5938 330 0.055574 0.002973C34E C. Resp./Workload 2. Q21 - Q40 20785 1170 0.05'6291 0.001599A4AF A. Employment 1. Q1 - Q20 5938 335 0.056416 0.002994A4AD A. Employment 1. Ql - Q20 5938 337 0.056753 0.003003A4AE A. Employment ' 1. Ql - Q20 5938 337 0:056753 0.003003F59E F. Sociodem. Chars. 3. Q41 - Q60 20785 1215 0.058456 0.001627B18 B. Prof. Background 1. Ql - Q20 8115 476 0.058657 0.002608C34A C. Resp./Workload 2. Q21 Q40 20785 1232 0.059274 0.001638F53AA F. Sociodem. Chars. 3. Q41 - Q60 947 57 0.060190 0.007729C35B1 C. Resp./Workload 2. Q21 - Q40 8698 531 0.061049 0.002567D4OD D. Job Satisfaction 2. Q21 Q40 20785 1286 0.061872 0.001671D39E D. Job Satisfaction 2. Q21 - Q40 20785 1302 0.062641 0.001681C34F C. Resp./Workload 2. Q21 Q40 20785 1330 0.063988 0.001698D41B D. Job Satisfaction 3. Q41 Q60 20785 1423 0.068463 0.001752C23A2G C. Resp./Workload 2. Q21 - Q40 17557 1220 0.069488 0.001919C35C3 C. Resp./Workload 2. Q21 Q40 10511 740 0.070402 0.002495F56C F. Sociodem. Chars. 3. Q41 - Q60 2518 179 0.071088 0.005121C35B4 C. Resp./Workload 2. Q21 - Q40 8679 631 0.072704 0.002787C38 C. Resp./Workload 2. Q21 Q40 20785 1517 0.072985 0.001804C35B6 C. Resp./Workload 2. Q21 - Q40 8332 612 0.073452 0.002858F59F F. Sociodem. Chars. 3. Q41 - Q60 20785 1580 0.076016 0.001838C34J C. Resp./Workload 2. Q21 - Q40 20785 1612 0.077556 0.001855F59D F. Sociodem. Chars. 3. Q41 - Q60 20785 1621 0.077989 0.001860D41E D. Job Satisfaction 3. Q41 - Q60 20785 1699 0.081742 0.001900C35B2 C. Resp./Workload 2. Q21 Q40 7025 577 0.082135 0.003276D4OG D. Job Satisfaction 2. Q21 - Q40 20785 1712 0.082367 0.001907F57C F. Sociodem. Chars. 3. Q41 Q60 1114 95 0.085278 0.008368C23B4 C. Resp./Workload 2. Q21 - Q40 13105 1134 0.086532 0.002456C23A4 C. Resp./Workload 2. Q21 Q40 17557 1547 0.088113 0.002139F59C F. Sociodem. Chars. 3. Q41 - Q60 20785 1833 0.088189 0.001967D43I D. Job Satisfaction 3. Q41 - Q60 20785 1848 0.088910 0.001974C23C4 C. Resp./Workload 2. Q21 - Q40 8603 765 0.088922 0.003069E47E E. Compensation 3. Q41 - Q60 20785 1850 0.089006 0.001975E47F E. Compensation 3. Q41 - Q60 20785 1851 0.089055 0.001976C23B2G C. Resp./Workload 2. Q21 - Q40 13105 1168 0.089126 0.002489E47D E. Compensation 3. Q41 - Q60 20785 1858 0.089391 0.001979E47K E. Compensation 3. Q41'- Q60 20785 1859 0.089439 0.001979E47H E. Compensation 3. Q41 - Q60 20785 1860 0.089488 0.001980E47J E. Compensation 3. Q41 - Q60 20785 1861 0.089536 0.001980E470 E. Compensation 3. Q41 - Q60 20785 1861 0.089536 0.001980E47I E. Compensation 3. Q41 - Q60 20785 1862 0.089584 0.001981E47M E. Compensation 3. Q41 - Q60 20785 1862 0.089584 0.001981E47G E. Compensation 3. Q41 - Q60 20785 1865 0.089728 0.001982E47P9 E. Compensation 3. Q41 - Q60 20785 1865 0.089728 0.001982E47N E. Compensation 3. Q41 - Q60 20785 1867 0.089824 0.001983E47L E. Compensation 3. Q41 - Q60 20785 1868 0.089873 0.001984
400
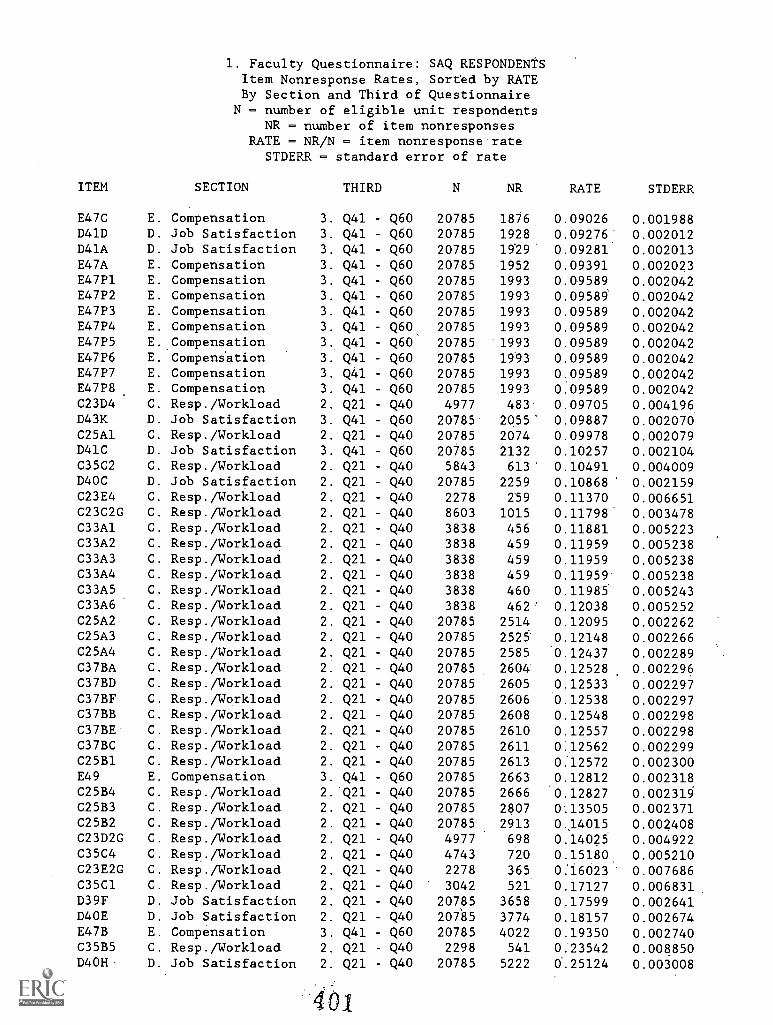
1. Faculty Questionnaire: SAQ RESPONDENTSItem Nonresponse Rates, Sorted by RATEBy Section and Third of Questionnaire
N = number of eligible unit respondents
ITEM
NR - number of item nonresponsesRATE = NR/N = item nonresponse rate
STDERR = standard error of rate
SECTION THIRD N NR RATE STDERR
E47C E. Compensation 3. Q41 - Q60 20785 1876 0.09026 0.001988D41D D. Job Satisfaction 3. Q41 - Q60 20785 1928 0.09276 0.002012D41A D. Job Satisfaction 3. Q41 - Q60 20785 1929 0.09281 0.002013E47A E. Compensation 3. Q41 - Q60 20785 1952 0.09391 0.002023E47P1 E. Compensation 3. Q41 - Q60 20785 1993 0.09589 0.002042E47P2 E. Compensation 3. Q41 - Q60 20785 1993 0.09589 0.002042E47P3 E. Compensation 3. Q41 - Q60 20785 1993 0.09589 0.002042E47P4 E. Compensation 3. Q41 - Q60 20785. 1993 0.09589 0.002042E47P5 E. Compensation 3. Q41 Q60 20785 1993 0.09589 0.002042E47P6 E. Compeniation 3. Q41 - Q60 20785 1993 0.09589 0.002042E47P7 E. Compensation 3. Q41 - Q60 20785 1993 0.09589 0.002042E47P8 E. Compensation 3. Q41 - Q60 20785 1993 0.09589 0.002042C23D4 C. Resp./Workload 2. Q21 - Q40 4977 483 0.09705 0.004196D43K D. Job Satisfaction 3. Q41 - Q60 20785 2055 0.09887 0.002070C25A1 C. Resp./Workload 2. Q21 - Q40 20785 2074 0.09978 0.002079D41C D. Job Satisfaction 3. Q41 - Q60 20785 2132 0.10257 0.002104C35C2 C. Resp./Workload 2. Q21 - Q40 5843 613 0.10491 0.004009D40C D. Job Satisfaction 2. Q21 - Q40 20785 2259 0.10868 0.002159C23E4 C. Resp./Workload 2. Q21 - Q40 2278 259 0.11370 0.006651C23C2G C. Resp./Workload 2. Q21 - Q40 8603 1015 0.11798 0.003478C33A1 C. Resp./Workload 2. Q21 Q40 3838 456 0.11881 0.005223C33A2 C. Resp./Workload 2. Q21 - Q40 3838 459 0.11959 0.005238C33A3 C. Resp./Workload 2. Q21 - Q40 3838 459 0.11959 0.005238C33A4 C. Resp./Workload 2. Q21 - Q40 3838 459 0.11959 0.005238C33A5 C. Resp./Workload 2. Q21 - Q40 3838 460 0.11985 0.005243C33A6 C. Resp./Workload 2. Q21 - Q40 3838 462' 0.12038 0.005252C25A2 C. Resp./Workload 2. Q21 - Q40 20785 2514 0.12095 0.002262C25A3 C. Resp./Workload 2. Q21 - Q40 20785 2525 0.12148 0.002266C25A4 C. Resp./Workload 2. Q21 - Q40 20785 2585 0.12437 0.002289C37BA C. Resp./Workload 2. Q21 - Q40 20785 2604 0.12528 0.002296C37BD C. Resp./Workload 2. Q21 - Q40 20785 2605 0.12533 0.002297C37BF C. Resp./Workload 2. Q21 - Q40 20785 2606 0.12538 0.002297C37BB C. Resp./Workload 2. Q21 - Q40 20785 2608 0.12548 0.002298C37BE C. Resp./Workload 2. Q21 - Q40 20785 2610 0.12557 0.002298C37BC C. Resp./Workload 2. Q21 - Q40 20785 2611 0.12562 0.002299C25B1 C. Resp./Workload 2. Q21 - Q40 20785 2613 0.12572 0.002300E49 E. Compensation 3. Q41 - Q60 20785 2663 0.12812 0.002318C25B4 C. Resp./Workload 2. Q21 - Q40 20785 2666 0.12827 0.002319C25B3 C. Resp./Workload 2. Q21 - Q40 20785 2807 0'.13505 0.002371C25B2 C. Resp./Workload 2. Q21 - Q40 20785 2913 0.14015 0.002408C23D2G C. Resp./Workload 2. Q21 - Q40 4977 698 0.14025 0.004922C35C4 C. Resp./Workload 2. Q21 - Q40 4743 720 0.15180 0.005210C23E2G C. Resp./Workload 2. Q21 - Q40 2278 365 0:16023 0.007686C35C1 C. Resp./Workload 2. Q21 - Q40 3042 521 0.17127 0.006831D39F D. Job Satisfaction 2. Q21 - Q40 20785 3658 0.17599 0.002641D4OE D. Job Satisfaction 2. Q21 - Q40 20785 3774 0.18157 0.002674E47B E. Compensation 3. Q41 - Q60 20785 4022 0.19350 0.002740C35B5 C. Resp./Workload 2. Q21 - Q40 2298 541 0.23542 0.008850D4OH D. Job Satisfaction 2. Q21 - Q40 20785 5222 0.25124 0.003008
401
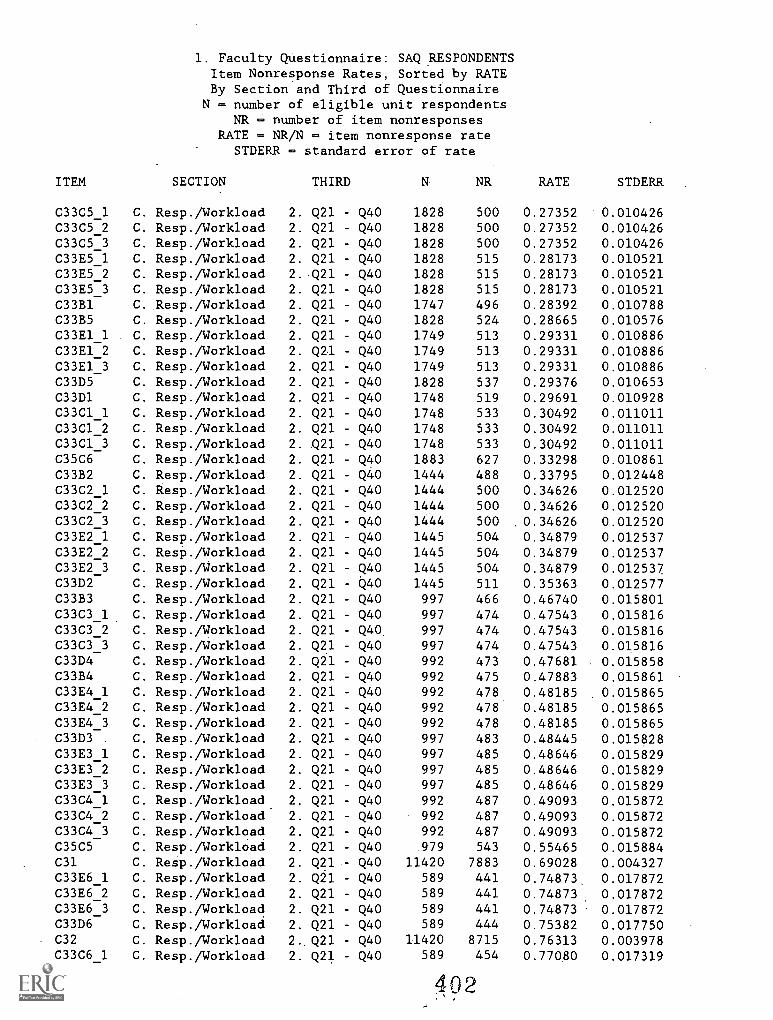
1. Faculty Questionnaire: SAQ RESPONDENTSItem Nonresponse Rates, Sorted by RATEBy Section and Third of Questionnaire
N = number of eligible unit respondentsNR = number of item nonresponses
RATE = NR/N - item nonresponse rateSTDERR = standard error of rate
ITEM SECTION THIRD N NR RATE STDERR
C33C5_1 C. Resp./Workload 2. Q21 - Q40 1828 500 0.27352 0.010426C33C5_2 C. Resp./Workload 2. Q21 - Q40 1828 500 0.27352 0.010426C33C5_3 C. Resp./Workload 2. Q21 - Q40 1828 500 0.27352 0.010426C33E5_1 C. Resp./Workload 2. Q21 Q40 1828 515 0.28173 0.010521C33E5_2 C. Resp./Workload 2. Q21 - Q40 1828 515 0.28173 0.010521C33E5_3 C. Resp./Workload 2. Q21 - Q40 1828 515 0.28173 0.010521C33B1 C. Resp./Workload 2. Q21 - Q40 1747 496 0.28392 0.010788C33B5 C. Resp./Workload 2. Q21 - Q40 1828 524 0.28665 0.010576C33E1_1 C. Resp./Workload 2. Q21 Q40 1749 513 0.29331 0.010886C33E1_2 C. Resp./Workload 2. Q21 - Q40 1749 513 0.29331 0.010886C33E1 3 C. Resp./Workload 2. Q21 Q40 1749 513 0.29331 0.010886C33D5 C. Resp./Workload 2. Q21 - Q40 1828 537 0.29376 0.010653C33D1 C. Resp./Workload 2. Q21 - Q40 1748 519 0.29691 0.010928C33C1_1 C. Resp./Workload 2. Q21 - Q40 1748 533 0.30492 0.011011C33C1_2 C. Resp./Workload 2. Q21 - Q40 1748 533 0.30492 0.011011C33C1_3 C. Resp./Workload 2. .Q21 - Q40 1748 533 0.30492 0.011011C35C6 C. Resp./Workload 2. Q21 Q40 1883 627 0.33298 0.010861C33B2 C. Resp./Workload 2. Q21 - Q40 1444 488 0.33795 0.012448C33C2_1 C. Resp./Workload 2. Q21 - Q40 1444 500 0.34626 0.012520C33C2_2 C. Resp./Workload 2. Q21 - Q40 1444 500 0.34626 0.012520C33C2_3 C. Resp./Workload 2. Q21 Q40 1444 500 0.34626 0.012520C33E2_1 C. Resp./Workload 2. Q21 - Q40 1445 504 0.34879 0.012537C33E2_2 C. Resp./Workload 2. Q21 - Q40 1445 504 0.34879 0.012537C33E2_3 C. Resp./Workload 2. Q21 Q40 1445 504 0.34879 0.012537C33D2 C. Resp./Workload 2. Q21 - Q40 1445 511 0.35363 0.012577C33B3 C. Resp./Workload 2. Q21 - Q40 997 466 0.46740 0.015801C33C3_1 C. Resp./Workload 2. Q21 - Q40 997 474 0.47543 0.015816C33C3_2 C. Resp./Workload 2. Q21 Q40. 997 474 0.47543 0.015816C33C3_3 C. Resp./Workload 2. Q21 - Q40 997 474 0.47543 0.015816C33D4 C. Resp./Workload 2. Q21 - Q40 992 473 0.47681 0.015858C33B4 C. Resp./Workload 2. Q21 Q40 992 475 0.47883 0.015861C33E4 1 C. Resp./Workload 2. Q21 - Q40 992 478 0.48185 0.015865C33E4 2 C. Resp./Workload 2. Q21 - Q40 992 478 0.48185 0.015865C33E4=3 C. Resp./Workload 2. Q21 - Q40 992 478 0.48185 0.015865C33D3 C. Resp./Workload 2. Q21 - Q40 997 483 0.48445 0.015828C33E3_1 C. Resp./Workload 2. Q21 - Q40 997 485 0.48646 0.015829C33E3_2 C. Resp./Workload 2. Q21 - Q40 997 485 0.48646 0.015829C33E3_3 C. Resp./Workload 2. Q21 - Q40 997 485 0.48646 0.015829C33C4_1 C. Resp./Workload 2. Q21 - Q40 992 487 0.49093 0.015872C33C4_2 C. Resp./Workload 2. Q21 - Q40 992 487 0.49093 0.015872C33C4_3 C. Resp./Workload 2. Q21 - Q40 992 487 0.49093 0.015872C35C5 C. Resp./Workload 2. Q21 - Q40 979 543 0.55465 0.015884C31 C. Resp./Workload 2. Q21 - Q40 11420 7883 0.69028 0.004327C33E6_1 C. Resp./Workload 2. Q21 - Q40 589 441 0.74873 0.017872C33E6_2 C. Resp./Workload 2. Q21 - Q40 589 441 0.74873 0.017872C33E6 3 C. Resp./Workload 2. Q21 - Q40 589 441 0.74873 0.017872C33D6 C. Resp./Workload 2. Q21 - Q40 589 444 0.75382 0.017750C32 C. Resp./Workload 2..Q21 - Q40 11420 8715 0.76313 0.003978C33C6 1 C. Resp./Workload 2. Q21 - Q40 589 454 0.77080 0.017319
402
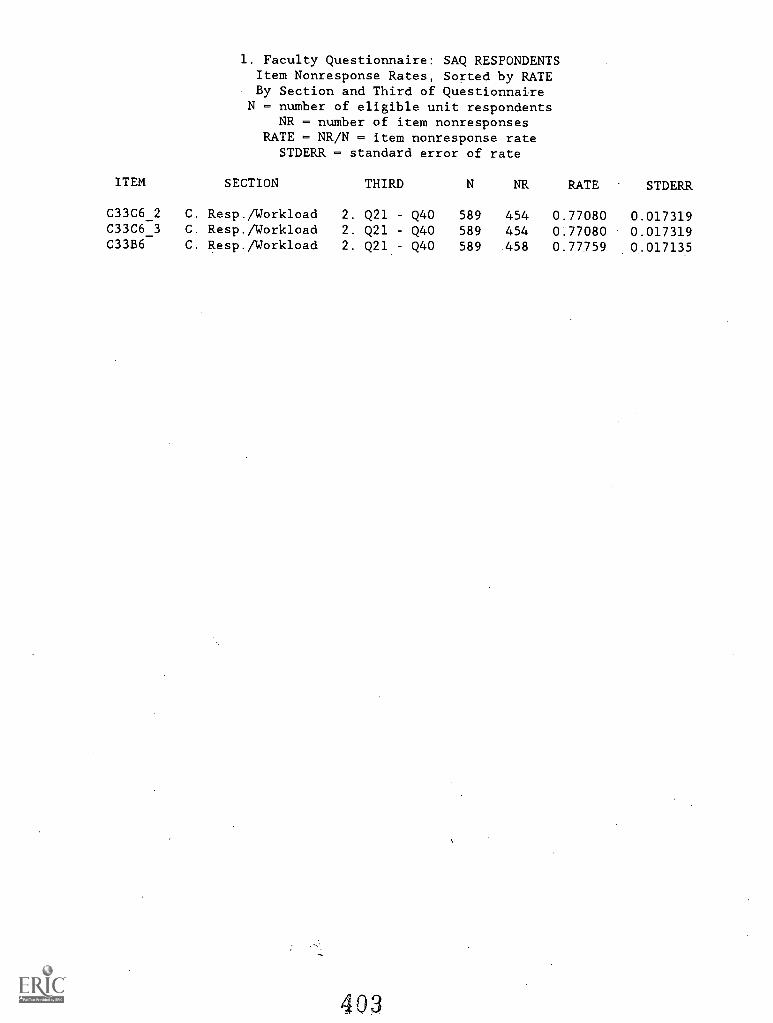
1. Faculty Questionnaire: SAQ RESPONDENTSItem Nonresponse Rates, Sorted by RATEBy Section and Third of Questionnaire
N = number of eligible unit respondentsNR = number of item nonresponses
RATE NR/N = item nonresponse rateSTDERR = standard error of rate
ITEM SECTION THIRD N NR RATE STDERR
C33C6_2 C. Resp./Workload 2. Q21 - Q40 589 454 0.77080 0.017319C33C6_3 C. Resp./Workload 2. Q21 - Q40 589 454 0.77080 0.017319C33B6 C. Resp./Workload 2. Q21 - Q40 589 458 0.77759 0.017135
403
1993 National Study of Postsecondary FacultyMethodology Report
Item Nonresponse Rates: CATI RespondentsItem Nonresponse Rates Greater Than 10 Percent (CATI)
Item Nonresponse Rates for CATI Respondents, Sorted by Rate
404
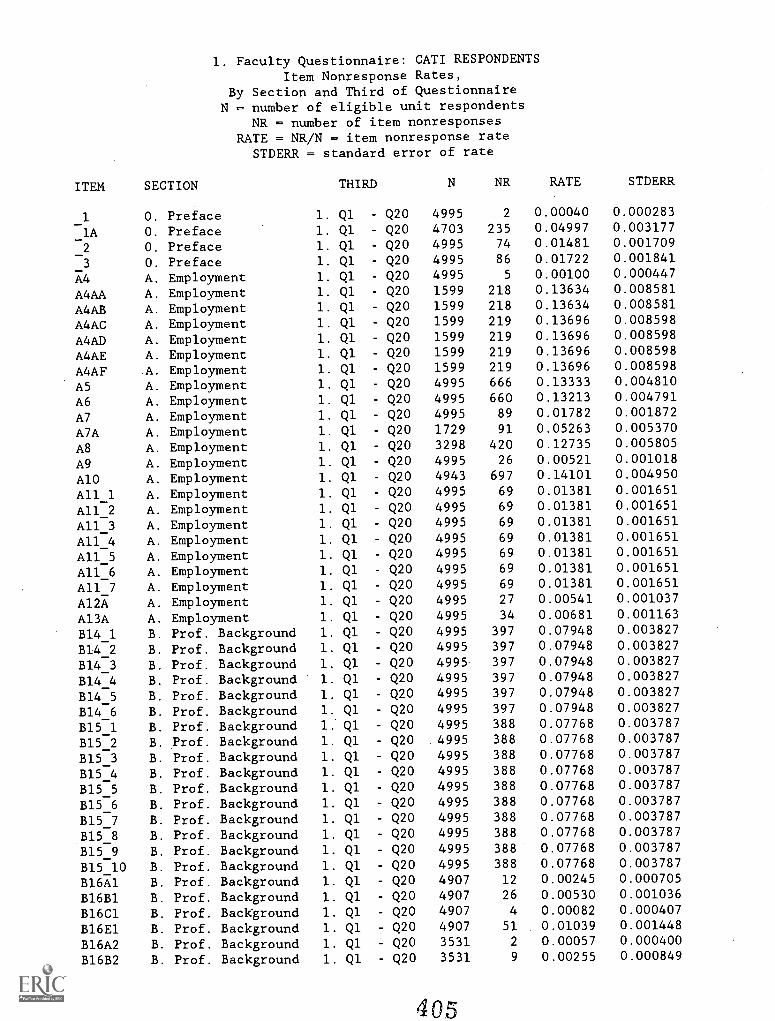
1. Faculty Questionnaire: CATI RESPONDENTSItem Nonresponse Rates,
By Section and Third of QuestionnaireN = number of eligible unit respondents
NR = number of item nonresponsesRATE = NR/N = item nonresponse rate
STDERR = standard error of rate
ITEM SECTION THIRD N NR RATE STDERR
1 O. Preface 1. Ql - Q20 4995 2 0.00040 0.000283
lA O. Preface 1. Ql - Q20 4703 235 0.04997 0.003177
2 O. Preface 1. Ql - Q20 4995 74 0.01481 0.001709
3 O. Preface 1. Q1 - Q20 4995 86 0.01722 0.001841
A4 A. Employment 1. Ql - Q20 4995 5 0.00100 0.000447
A4AA A. Employment 1. Ql - Q20 1599 218 0.13634 0.008581
A4AB A. Employment 1. Ql - Q20 1599 218 0.13634 0.008581
A4AC A. Employment 1. Ql Q20 1599 219 0.13696 0.008598
A4AD A. Employment 1. Ql - Q20 1599 219 0.13696 0.008598
A4AE A. Employment 1. Ql - Q20 1599 219 0.13696 0.008598
A4AF A. Employment 1. Ql - Q20 1599 219 0.13696 0.008598
A5 A. Employment 1. Ql Q20 4995 666 0.13333 0.004810
A6 A. Employment 1. Ql - Q20 4995 660 0.13213 0.004791
A7 A. Employment 1. Ql - Q20 4995 89 0.01782 0.001872
A7A A. Employment 1. Ql - Q20 1729 91 0.05263 0.005370
A8 A. Employment 1. Q1 Q20 3298 420 0.12735 0.005805
A9 A. Employment 1. Ql - Q20 4995 26 0.00521 0.001018
A10 A. Employment 1. Q1 - Q20 4943 697 0.14101 0.004950
Al1_1 A. Employment 1. Ql - Q20 4995 69 0.01381 0.001651
A11_2 A. Employment 1. Ql - Q20 4995 69 0.01381 0.001651
A11_3 A. Employment 1. Ql - Q20 4995 69 0.01381 0.001651
A11_4 A. Employment 1. Q1 - Q20 4995 69 0.01381 0.001651
A11_5 A. Employment 1. Q1 Q20 4995 69 0.01381 0.001651
A11_6 A. Employment 1. Ql - Q20 4995 69 0.01381 0.001651
A11_7 A. Employment 1. Ql - Q20 4995 69 0.01381 0.001651
Al2A A. Employment 1. Ql - Q20 4995 27 0.00541 0.001037
A13A A. Employment 1. Ql - Q20 4995 34 0.00681 0.001163
B14_1 B. Prof. Background 1. Ql - Q20 4995 397 0.07948 0.003827
B14_2 B. Prof. Background 1. Q1 - Q20 4995 397 0.07948 0.003827
B14_3 B. Prof. Background 1. Ql - Q20 4995 397 0.07948 0.003827
B14_4 B. Prof. Background 1. Q1 - Q20 4995 397 0.07948 0.003827
B14_5 B. Prof. Background 1. Q1 - Q20 4995 397 0.07948 0.003827
B14_6 B. Prof. Background 1. Q1 - Q20 4995 397 0.07948 0.003827
B15_1 B. Prof. Background 1. Ql - Q20 4995 388 0.07768 0.003787
B15_2 B. Prof. Background 1. Ql - Q20 4995 388 0.07768 0.003787
B15_3 B. Prof. Background 1. Ql - Q20 4995 388 0.07768 0.003787
B15_4 B. Prof. Background 1. Q1 - Q20 4995 388 0.07768 0.003787
B15_5 B. Prof. Background 1. Ql - Q20 4995 388 0.07768 0.003787
B15_6 B. Prof. Background 1. Ql - Q20 4995 388 0.07768 0.003787
B15_7 B. Prof. Background 1. Ql - Q20 4995 388 0.07768 0.003787
B15_8 B. Prof. Background 1. Ql - Q20 4995 388 0.07768 0.003787
B15_9 B. Prof. Background 1. Ql - Q20 4995 388 0.07768 0.003787
B15_10 B. Prof. Background 1. Q1 - Q20 4995 388 0.07768 0.003787
B16A1 B. Prof. Background 1. Ql - Q20 4907 12 0.00245 0.000705
B16B1 B. Prof. Background 1. Q1 - Q20 4907 26 0.00530 0.001036
B16C1 B. Prof. Background 1. Ql - Q20 4907 4 0.00082 0.000407
B16E1 B. Prof. Background 1. Ql - Q20 4907 51 0.01039 0.001448
B16A2 B. Prof. Background 1. Ql - Q20 3531 2 0.00057 0.000400
B16B2 B. Prof. Background 1. Ql - Q20 3531 9 0.00255 0.000849
405
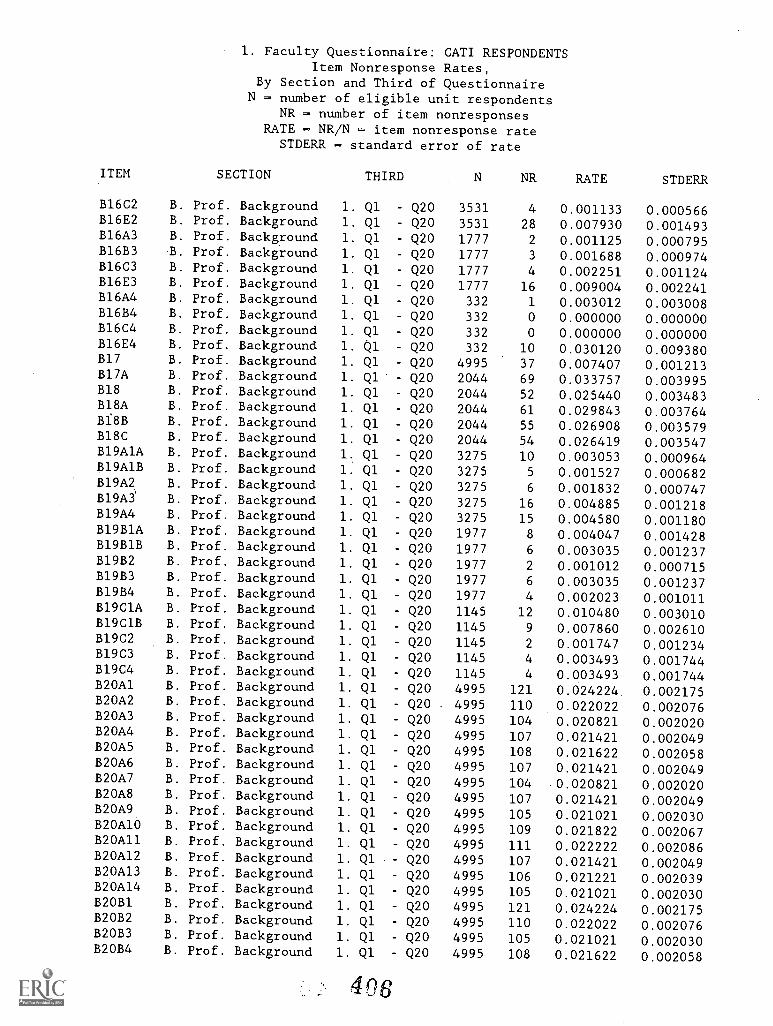
1. Faculty Questionnaire: CATI RESPONDENTSItem Nonresponse Rates,
By Section and Third of QuestionnaireN = number of eligible unit respondents
NR = number of item nonresponsesRATE = NR/N = item nonresponse rate
STDERR = standard error of rate
ITEM SECTION THIRD N NR RATE STDERR
B16C2 B. Prof. Background 1. Ql - Q20 3531 4 0.001133 0.000566B16E2 B. Prof. Background 1. Ql - Q20 3531 28 0.007930 0.001493B16A3 B. Prof. Background 1. Ql - Q20 1777 2 0.001125 0.000795B16B3 B. Prof. Background 1. Ql - Q20 1777 3 0.001688 0.000974B16C3 B. Prof. Background 1. Ql - Q20 1777 4 0.002251 0.001124B16E3 B. Prof. Background 1. Ql - Q20 1777 16 0.009004 0.002241B16A4 B. Prof. Background 1. Q1 - Q20 332 1 0.003012 0.003008B16B4 B. Prof. Background 1. Ql - Q20 332 0 0.000000 0.000000B16C4 B. Prof. Background 1. Ql - Q20 332 0 0.000000 0.000000B16E4 B. Prof. Background 1. 01 Q20 332 10 0.030120 0.009380B17 B. Prof. Background 1. Ql Q20 4995 37 0.007407 0.001213B17A B. Prof. Background 1. Ql Q20 2044 69 0.033757 0.003995B18 B. Prof. Background 1. Ql Q20 2044 52 0.025440 0.003483B18A B. Prof. Background 1. Ql Q20 2044 61 0.029843 0.003764B18B B. Prof. Background 1. Ql - Q20 2044 55 0.026908 0.003579B18C B. Prof. Background 1. Q1 - Q20 2044 54 0.026419 0.003547B19A1A B. Prof. Background 1. Ql Q20 3275 10 0.003053 0.000964B19A1B B. Prof. Background 1. Ql Q20 3275 5 0.001527 0.000682B19A2 B. Prof. Background 1. Ql Q20 3275 6 0.001832 0.000747B19A3 B. Prof. Background 1. Ql Q20 3275 16 0.004885 0.001218B19A4 B. Prof. Background 1. Ql Q20 3275 15 0.004580 0.001180B19B1A B. Prof. Background 1. Ql Q20 1977 8 0.004047 0.001428B19B1B B. Prof. Background 1. Ql - Q20 1977 6 0.003035 0.001237B19B2 B. Prof. Background 1. Ql Q20 1977 2 0.001012 0.000715B19B3 B. Prof. Background 1. Q1 Q20 1977 6 0.003035 0.001237B19B4 B. Prof. Background 1. Q1 - Q20 1977 4 0.002023 0.001011B19C1A B. Prof. Background 1. Q1 - Q20 1145 12 0.010480 0.003010B19C1B B. Prof. Background 1. Q1 - Q20 1145 9 0.007860 0.002610B19C2 B. Prof. Background 1. Q1 Q20 1145 2 0.001747 0.001234B19C3 B. Prof. Background 1. Ql Q20 1145 4 0.003493 0.001744B19C4 B. Prof. Background 1. Ql - Q20 1145 4 0.003493 0.001744B20A1 B. Prof. Background 1. Ql - Q20 4995 121 0.024224 0.002175B20A2 B. Prof. Background 1. Q1 - Q20 4995 110 0.022022 0.002076B20A3 B. Prof. Background 1. Q1 - Q20 4995 104 0.020821 0.002020B20A4 B. Prof. Background 1. Q1 - Q20 4995 107 0.021421 0.002049B20A5 B. Prof. Background 1. Ql - Q20 4995 108 0.021622 0.002058B20A6 B. Prof. Background 1. Q1 - Q20 4995 107 0.021421 0.002049B20A7 B. Prof. Background 1. Ql Q20 4995 104 0.020821 0.002020B20A8 B. Prof. Background 1. Ql - Q20 4995 107 0.021421 0.002049B20A9 B. Prof. Background 1. Q1 - Q20 4995 105 0.021021 0.002030B20A10 B. Prof. Background 1. Ql - Q20 4995 109 0.021822 0.002067B20A11 B. Prof. Background 1. Q1 Q20 4995 111 0.022222 0.002086B20Al2 B. Prof. Background 1. Ql Q20 4995 107 0.021421 0.002049B20A13 B. Prof. Background 1. Q1 - Q20 4995 106 0.021221 0.002039B20A14 B. Prof. Background 1. Q1 - Q20 4995 105 0.021021 0.002030B20B1 B. Prof. Background 1. Q1 Q20 4995 121 0.024224 0.002175B20B2 B. Prof. Background 1. Ql - Q20 4995 110 0.022022 0.002076B20B3 B. Prof. Background 1. Q1 - Q20 4995 105 0.021021 0.002030B20B4 B. Prof. Background 1. Ql - Q20 4995 108 0.021622 0.002058
40$
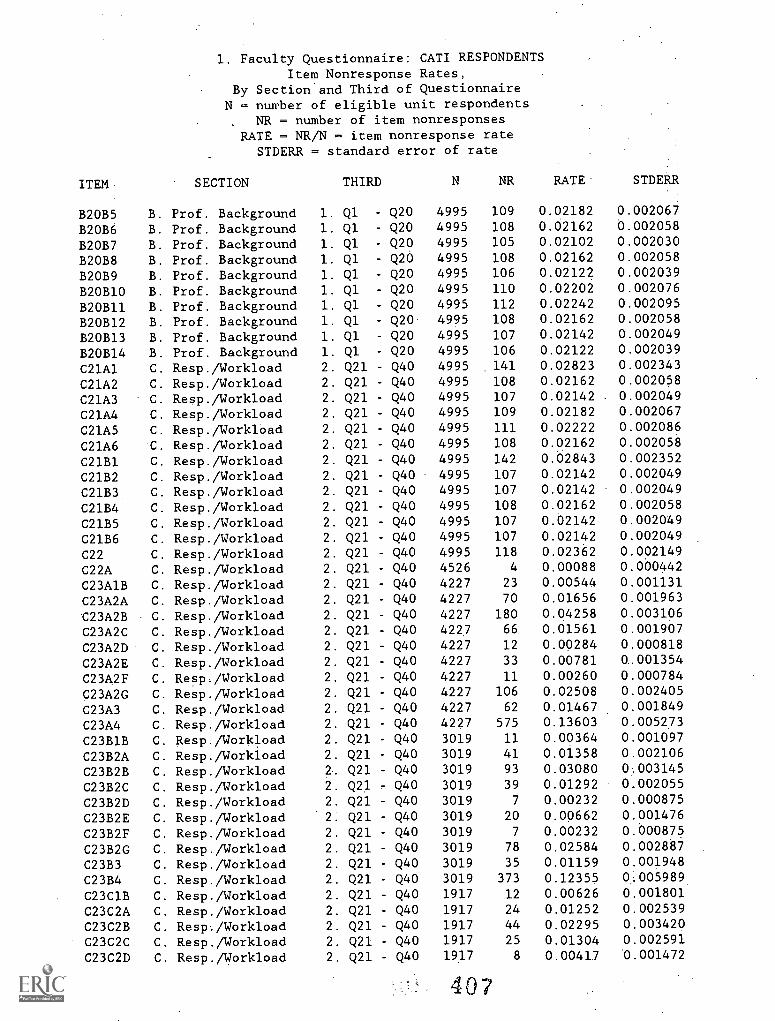
1. Faculty Questionnaire: CATI RESPONDENTSItem Nonresponse Rates,
By Section and Third of QuestionnaireN = number of eligible unit respondents
NR = number of item nonresponsesRATE = NR/N - item nonresponse rate
STDERR = standard error of rate
ITEM - SECTION THIRD N NR RATE STDERR
B20B5 B. Prof. Background 1. Ql Q20 4995 109 0.02182 0.002067
B20B6 B. Prof. Background 1. Ql Q20 4995 108 0.02162 0.002058
B20B7 B. Prof. Background 1. Ql - Q20 4995 105 0.02102 0.002030
B20B8 B. Prof. Background 1. Ql Q20 4995 108 0.02162 0.002058
B20B9 B. Prof. Background 1. Ql - Q20 4995 106 0.02122 0.002039
B20B10 B. Prof. Background 1. Q1 Q20 4995 110 0.02202 0.002076
B20B11 B. Prof. Background 1. Ql - Q20 4995 112 0.02242 0.002095
B20B12 B. Prof. Background 1. Ql - Q20 4995 108 0.02162 0.002058
B20B13 B. Prof. Background 1. Ql Q20 4995 107 0.02142 0.002049
B20B14 B. Prof. Background 1. Ql Q20 4995 106 0.02122 0.002039
C21A1 C. Resp./Workload 2. Q21 - Q40 4995 141 0.02823 0.002343
C21A2 C. Resp./Workload 2. Q21 Q40 4995 108 0.02162 0.002058
C21A3 C. Resp./Workload 2. Q21 - Q40 4995 107 0.02142 0.002049
C21A4 C. Resp./Workload 2. Q21 - Q40 4995 109 0.02182 0.002067
C21A5 C. Resp./Workload 2. Q21 - Q40 4995 111 0.02222 0.002086
C21A6 C. Resp./Workload 2. Q21 Q40 4995 108 0.02162 0.002058
C21B1 C. Resp./Workload 2. Q21 Q40 4995 142 0.02843 0.002352
C21B2 C. Resp./Workload 2. Q21 - Q40 4995 107 0.02142 0.002049
C21B3 C. Resp./Workload 2. Q21 Q40 4995 107 0.02142 0.002049
C21B4 C. Resp./Workload 108 0.02162 0.002058
C21B5 C. Resp./Workload 2. Q21 - Q40 4995 107 0.02142 0.002049
C21B6 C. Resp./Workload 2. Q21 Q40 4995 107 0.02142 0.002049
C22 C. Resp./Workload 2. Q21 - Q40 4995 118 0.02362 0.002149
C22A C. Resp./Workload 2. Q21 - Q40 4526 4 0.00088 0.000442
C23A1B C. Resp./Workload 2. Q21 - Q40 4227 23 0.00544 0.001131
C23A2A C. Resp./Workload 2. Q21 - Q40 4227 70 0.01656 0.001963
C23A2B C. Resp./Workload 2. Q21 - Q40 4227 180 0.04258 0.003106
C23A2C C. Resp./Workload 2. Q21 - Q40 4227 66 0.01561 0.001907
C23A2D C. Resp./Workload 2. Q21 Q40 4227 12 0.00284 0.000818
C23A2E C. Resp./Workload 2. Q21 - Q40 4227 33 0.00781 0.001354
C23A2F C. Resp./Workload 2. Q21 - Q40 4227 11 0.00260 0.000784
C23A2G C. Resp./Workload 2. Q21 Q40 4227 106 0.02508 0.002405
C23A3 C. Resp./Workload 2. Q21 - Q40 4227 62 0.01467 0.001849
C23A4 C. Resp./Workload 2. Q21 - Q40 4227 575 0.13603 0.005273
C23B1B C. Resp./Workload 2. Q21 - Q40 3019 11 0.00364 0.001097
C23B2A C. Resp./Workload 2. Q21 - Q40 3019 41 0.01358 0.002106
C23B2B C. Resp./Workload 2. Q21 - Q40 3019 93 0.03080 0.003145
C23B2C C. Resp./Workload 2. Q21 - Q40 3019 39 0.01292 0.002055
C23B2D C. Resp./Workload 2. Q21 - Q40 3019 7 0.00232 0.000875
C23B2E C. Resp./Workload 2. Q21 - Q40 3019 20 0.00662 0.001476
C23B2F C. Resp./Workload 2. Q21 - Q40 3019 7 0.00232 0.000875
C23B2G C. Resp./Workload 2. Q21 - Q40 3019 78 0.02584 0.002887
C23B3 C. Resp./Workload 2. Q21 - Q40 3019 35 0.01159 0.001948
C23B4 C. Resp./Workload 2. Q21 - Q40 3019 373 0.12355 0..005989
C23C1B C. Resp./Workload 2. Q21 - Q40 1917 12 0.00626 0.001801
C23C2A C. Resp./Workload 2. Q21 - Q40 1917 24 0.01252 0.002539
C23C2B C. Resp./Workload 2. Q21 - Q40 1917 44 0.02295 0.003420
C23C2C C. Resp./Workload 2. Q21 - Q40 1917 25 0.01304 0.002591
C23C2D C. Resp./Workload 2. Q21 - Q40 1917 8 0.00417 0.001472
407
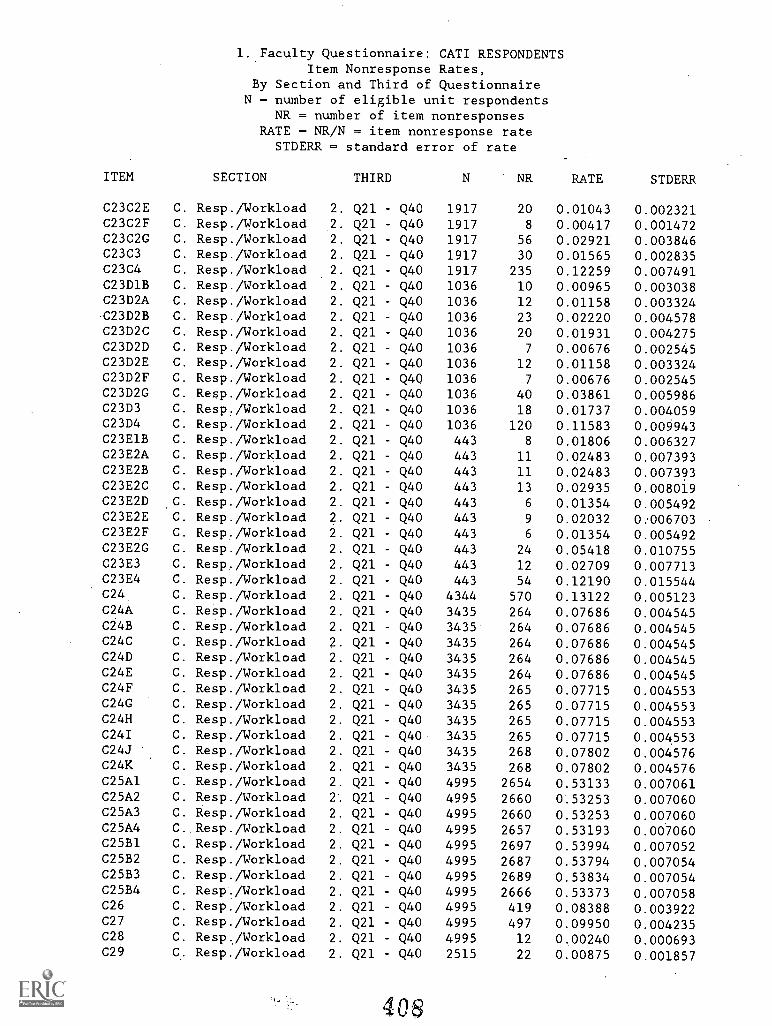
1. Faculty Questionnaire: CATI RESPONDENTSItem Nonresponse Rates,
By Section and Third of QuestionnaireN = number of eligible unit respondents
NR = number of item nonresponsesRATE = NR/N = item nonresponse rate
STDERR = standard error of rate
ITEM SECTION THIRD N NR RATE STDERR
C23C2E C. Resp./Workload 2. Q21 - Q40 1917 20 0.01043 0.002321C23C2F C. Resp./Workload 2. Q21 - Q40 1917 8 0.00417 0.001472C23C2G C. Resp./Workload 2. Q21 - Q40 1917 56 0.02921 0.003846C23C3 C. Resp./Workload 2. Q21 - Q40 1917 30 0.01565 0.002835C23C4 C. Resp./Workload 2. Q21 - Q40 1917 235 0.12259 0.007491C23D1B C. Resp./Workload 2. Q21 - Q40 1036 10 0.00965 0.003038C23D2A C. Resp./Workload 2. Q21 - Q40 1036 12 0.01158 0.003324C23D2B C. Resp./Workload 2. Q21 - Q40 1036 23 0.02220 0.004578C23D2C C. Resp./Workload 2. Q21 - Q40 1036 20 0.01931 0.004275C23D2D C. Resp./Workload 2. Q21 - Q40 1036 7 0.00676 0.002545C23D2E C. Resp./Workload 2. Q21 - Q40 1036 12 0.01158 0.003324C23D2F C. Resp./Workload 2. Q21 - Q40 1036 7 0.00676 0.002545C23D2G C. Resp./Workload 2. Q21 - Q40 1036 40 0.03861 0.005986C23D3 C. Resp./Workload 2. Q21 - Q40 1036 18 0.01737 0.004059C23D4 C. Resp./Workload 2. Q21 - Q40 1036 120 0.11583 0.009943C23E1B C. Resp./Workload 2. Q21 - Q40 443 8 0.01806 0.006327C23E2A C. Resp./Workload 2. Q21 - Q40 443 11 0.02483 0.007393C23E2B C. Resp./Workload 2. Q21 - Q40 443 11 0.02483 0.007393C23E2C C. Resp./Workload 2. Q21 - Q40 443 13 0.02935 0.008019C23E2D C. Resp./Workload 2. Q21 - Q40 443 6 0.01354 0.005492C23E2E C. Resp./Workload 2. Q21 - Q40 443 9 0.02032 0.006703C23E2F C. Resp./Workload 2. Q21 - Q40 443 6 0.01354 0.005492C23E2G C. Resp./Workload 2. Q21 - Q40 443 24 0.05418 0.010755C23E3 C. Resp./Workload 2. Q21 - Q40 443 12 0.02709 0.007713C23E4 C. Resp./Workload 2. Q21 - Q40 443 54 0.12190 0.015544C24 C. Resp./Workload 2. Q21 - Q40 4344 570 0.13122 0.005123C24A C. Resp./Workload 2. Q21 - Q40 3435 264 0.07686 0.004545C24B C. Resp./Workload 2. Q21 - Q40 3435 264 0.07686 0.004545C24C C. Resp./Workload 2. Q21 - Q40 3435 264 0.07686 0.004545C24D C. Resp./Workload 2. Q21 - Q40 3435 264 0.07686 0.004545C24E C. Resp./Workload 2. Q21 - Q40 3435 264 0.07686 0.004545C24F C. Resp./Workload 2. Q21 - Q40 3435 265 0.07715 0.004553C24G C. Resp./Workload 2. Q21 - Q40 3435 265 0.07715 0.004553C24H C. Resp./Workload 2. Q21 - Q40 3435 265 0.07715 0.004553C24I C. Resp./Workload 2. Q21 - Q40 3435 265 0.07715 0.004553C24J C. Resp./Workload 2. Q21 - Q40 3435 268 0.07802 0.004576C24K C. Resp./Workload 2. Q21 - Q40 3435 268 0.07802 0.004576C25A1 C. Resp./Workload 2. Q21 - Q40 4995 2654 0.53133 0.007061C25A2 C. Resp./Workload 2. Q21 - Q40 4995 2660 0.53253 0.007060C25A3 C. Resp./Workload 2. Q21 - Q40 4995 2660 0.53253 0.007060C25A4 C. Resp./Workload 2. Q21 - Q40 4995 2657 0.53193 0.007060C25B1 C. Resp./Workload 2. Q21 - Q40 4995 2697 0.53994 0.007052C25B2 C. Resp./Workload 2. Q21 - Q40 4995 2687 0.53794 0.007054C25B3 C. Resp./Workload 2. Q21 - Q40 4995 2689 0.53834 0.007054C25B4 C. Resp./Workload 2. Q21 - Q40 4995 2666 0.53373 0.007058C26 C. Resp./Workload 2. Q21 - Q40 4995 419 0.08388 0.003922C27 C. Resp./Workload 2. Q21 - Q40 4995 497 0.09950 0.004235C28 C. Resp./Workload 2. Q21 - Q40 4995 12 0.00240 0.000693C29 C. Resp./Workload 2. Q21 - Q40 2515 22 0.00875 0.001857
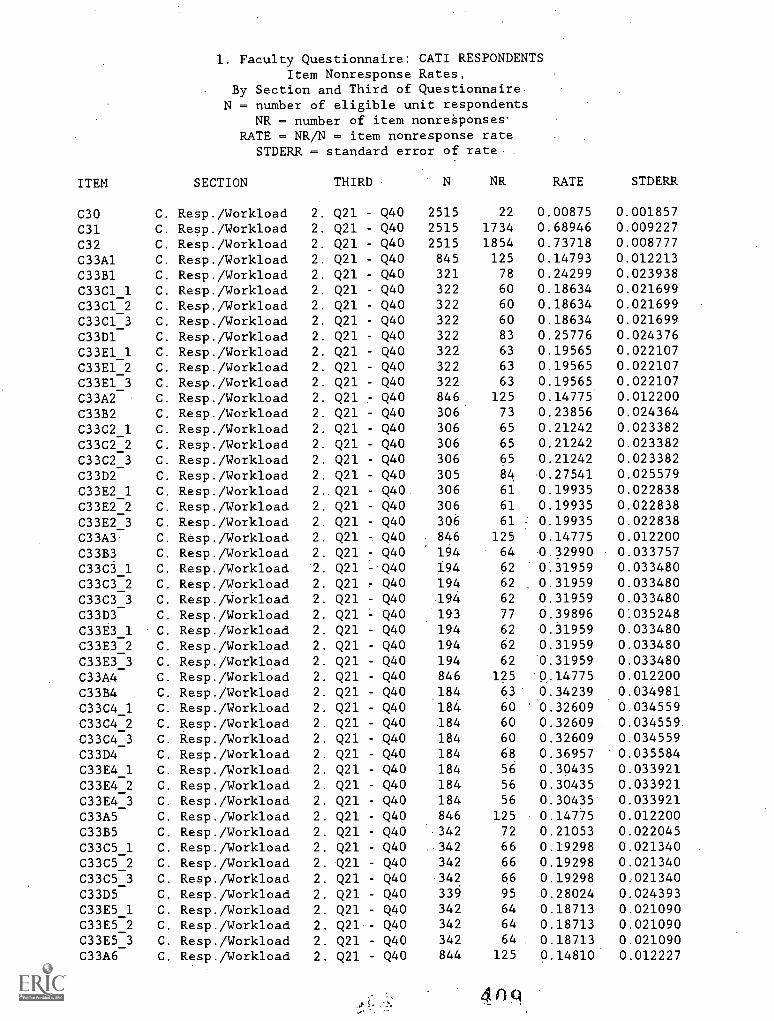
1. Faculty Questionnaire: CATI RESPONDENTSItem Nonresponse Rates,
By Section and Third of Questionnaire.N = number of eligible unit respondents
NR = number of item nonre4onses-RATE = NR/N = item nonresponse rate
STDERR = standard error of rate. .
ITEM SECTION THIRD N NR RATE STDERR
C30 C. Resp./Workload 2. Q21 - Q40 2515 22 0.00875 0.001857
C31 C. Resp./Workload 2. Q21 - Q40 2515 1734 0.68946 0.009227
C32 C. Resp./Workload 2. Q21 - Q40 2515 1854 0.73718 0.008777
C33A1 C. Resp./Workload 2. Q21 - Q40 845 125 0.14793 0.012213
C33B1 C. Resp./Workload 2. Q21 -.Q40 321 78 0.24299 0.023938
C33C1_1 C. Resp./Workload 2. Q21 - Q40 322 60 0.18634 0.021699
C33C1_2 C. Resp./Workload 2. Q21 - Q40 322 60 0.18634 0.021699
C33C1_3 C. Resp./Workload 2. Q21 - Q40 322 60 0.18634 0.021699
C33D1 C. Resp./Workload 2. Q21 - Q40 322 83 0.25776 0.024376
C33E1_1 C. Resp./Workload 2. Q21 Q40 322 63 0.19565 0.022107
C33E1_2 C. Resp./Workload 2. Q21 - Q40 322 63 0.19565 0.022107
C33E1_3 C. Resp./Workload 2. Q21 - Q40 322 63 0.19565 0.022107
C33A2 C. Resp./Workload 2. Q21 Q40 846 125 0.14775 0.012200
C33B2 C. Resp./Workload 2. Q21 - Q40 306 73 0.23856 0.024364
C33C2_1 C. Resp./Workload 2. Q21 - Q40 306 65 0.21242 0.023382
C33C2_2 C. Resp./Workload 2. Q21 - Q40 306 65 0.21242 0.023382
C33C2_3 C. Resp./Workload 2. Q21 Q40 306 65 0.21242 0.023382
C33D2 C. Resp./Workload 2. Q21 - Q40 305 84 0.27541 0.025579
C33E2_1 C. Resp./Workload 2.. Q21 - Q40 306 61 0.19935 0.022838
C33E2_2 C. Resp./Workload 2. Q21 Q40 306 61 0.19935 0.022838
C33E2_3 C. Resp./Workload 2. Q21 - Q40 306 61 = 0.19935 0.022838
C33A3 C. Resp./Workload 2. Q21 Q40 846 125 0.14775 0.012200
C33B3 C. Resp./Workload 2. Q21 - Q40 194 64 0.32990 0.033757
C33C3_1 C. Resp./Workload 2. Q21 Q40 194 62 0.31959 0.033480
C33C3.2 C. Resp./Workload 2. Q21 - Q40 194 62 0.31959 0.033480
C33C3_3 C. Resp./Workload 2. Q21 Q40 194 62 0.31959 0.033480
C33D3 C. Resp./Workload 2. Q21 - Q40 193 77 0.39896 01035248C33E3_1 C. Resp./Workload 2. Q21 Q40 194 62 0.31959 0.033480
C33E3_2 C. Resp./Workload 2. Q21 - Q40 194 62 0.31959 0.033480
C33E3_3 C. Resp./Workload 2. Q21 - Q40 194 62 0.31959 0.033480C33A4 C. Resp./Workload 2. Q21 Q40 846 125 0.14775 0.012200
C33B4 C. Resp./Workload 2. Q21 - Q40 184 63 0.34239 0.034981
C33C4_1 C. Resp./Workload 2. Q21 - Q40 184 60 0.32609 0.034559C33C4_2 C. Resp./Workload 2. Q21 - Q40 184 60 0.32609 0.034559.
C33C4_3 C. Resp./Workload 2. Q21 - Q40 184 60 0.32609 0.034559C33D4 C. Resp./Workload 2. Q21 - Q40 184 68 0.36957 0.035584
C33E4_1 C. Resp./Workload 2. Q21 - Q40 184 56 0.30435 0.033921
C33E4_2 C. Resp./Workload 2. Q21 - Q40 184 56 0.30435 0.033921
C33E4_3 C. Resp./Workload 2. Q21 - Q40 184 56 0.30435 0.033921
C33A5 C. Resp./Workload 2. Q21 - Q40 846 125 0.14775 0.012200
C33B5 C. Resp./Workload 2. Q21 - Q40 342 72 0.21053 0.022045C33C5_1 C. Resp./Workload 2. Q21 - Q40 342 66 0.19298 0.021340C33C5_2 C. Resp./Workload 2. Q21 - Q40 342 66 0.19298 0.021340C33C5_3 C. Resp./Workload 2. Q21 - Q40 342 66 0.19298 0.021340C33D5 C. Resp./Workload 2. Q21 - Q40 339 95 0.28024 0.024393C33E5_1 C. Resp./Workload 2. Q21 - Q40 342 64 0.18713 0.021090C33E5_2 C. Resp./Workload 2. Q21 - Q40 342 64 0.18713 0.021090C33E5_3 C. Resp./Workload 2. Q21 - Q40 342 64 0.18713 0.021090C33A6 C. Resp./Workload 2. Q21 - Q40 844 125 0.14810 0.012227
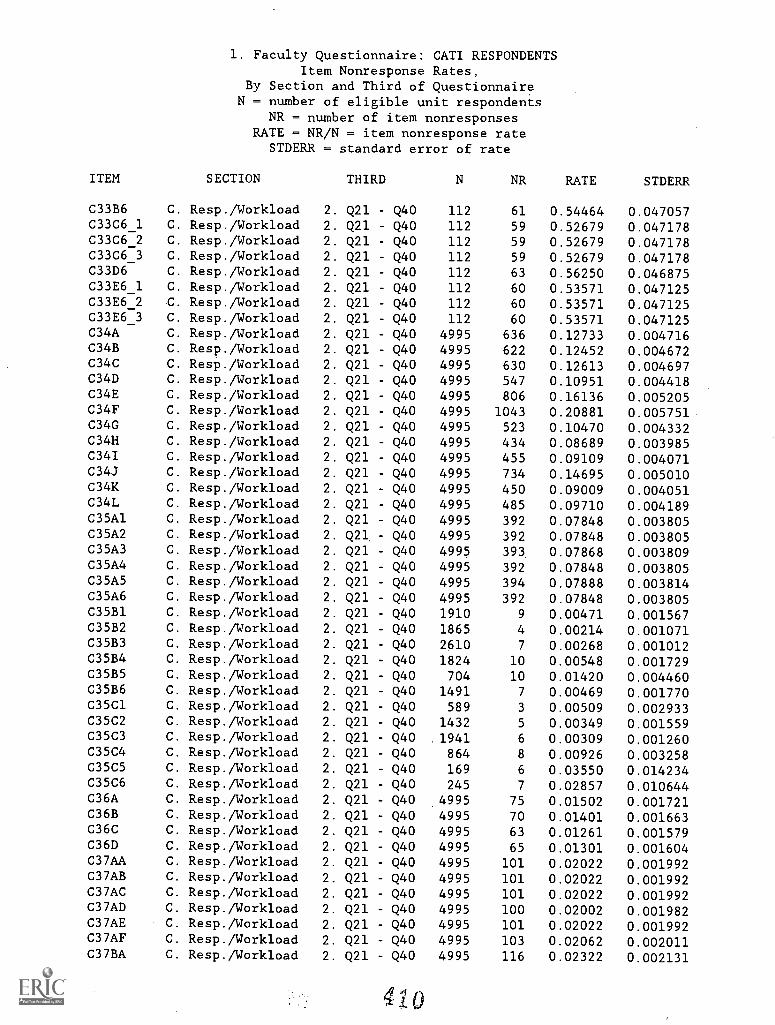
1. Faculty Questionnaire: CATI RESPONDENTSItem Nonresponse Rates,
By Section and Third of QuestionnaireN = number of eligible unit respondents
NR = number of item nonresponsesRATE = NR/N = item nonresponse rate
STDERR = standard error of rate
ITEM SECTION THIRD N NR RATE STDERR
C33B6 C. Resp./Workload 2. Q21 Q40 112 61 0.54464 0.047057C33C6_1 C. Resp./Workload 2. Q21 - Q40 112 59 0.52679 0.047178C33C6_2 C. Resp./Workload 2. Q21 - Q40 112 59 0.52679 0.047178C33C6_3 C. Resp./Workload 2. Q21 - Q40 112 59 0.52679 0.047178C33D6 C. Resp./Workload 2. Q21 - Q40 112 63 0.56250 0.046875C33E6 1 C. Resp./Workload 2. Q21 - Q40 112 60 0.53571 0.047125C33E6 2 C. Resp./Workload 2. Q21 - Q40 112 60 0.53571 0.047125C33E6 3 C. Resp./Workload 2. Q21 - Q40 112 60 0.53571 0.047125C34A C. Resp./Workload 2. Q21 - Q40 4995 636 0.12733 0.004716C34B C. Resp./Workload 2. Q21 - Q40 4995 622 0.12452 0.004672C34C C. Resp./Workload 2. Q21 - Q40 4995 630 0.12613 0.004697C34D C. Resp./Workload 2. Q21 - Q40 4995 547 0.10951 0.004418C34E C. Resp./Workload 2. Q21 - Q40 4995 806 0.16136 0.005205C34F C. Resp./Workload 2. Q21 - Q40 4995 1043 0.20881 0.005751C34G C. Resp./Workload 2. Q21 - Q40 4995 523 0.10470 0.004332C34H C. Resp./Workload 2. Q21 - Q40 4995 434 0.08689 0.003985C34I C. Resp./Workload 2. Q21 - Q40 4995 455 0.09109 0.004071C34J C. Resp./Workload 2. Q21 - Q40 4995 734 0.14695 0.005010C34K C. Resp./Workload 2. Q21 - Q40 4995 450 0.09009 0.004051C34L C. Resp./Workload 2. Q21 - Q40 4995 485 0.09710 0.004189C35A1 C. Resp./Workload 2. Q21 - Q40 4995 392 0.07848 0.003805C35A2 C. Resp./Workload 2. Q21. - Q40 4995 392 0.07848 0.003805C35A3 C. Resp./Workload 2. Q21 - Q40 4995 393 0.07868 0.003809C35A4 C. Resp./Workload 2. Q21 - Q40 4995 392 0.07848 0.003805C35A5 C. Resp./Workload 2. Q21 - Q40 4995 394 0.07888 0.003814C35A6 C. Resp./Workload 2. Q21 - Q40 4995 392 0.07848 0.003805C35B1 C. Resp./Workload 2. Q21 - Q40 1910 9 0.00471 0.001567C35B2 C. Resp./Workload 2. Q21 - Q40 1865 4 0.00214 0.001071C35B3 C. Resp./Workload 2. Q21 Q40 2610 7 0.00268 0.001012C35B4 C. Resp./Workload 2. Q21 - Q40 1824 10 0.00548 0.001729C35B5 C. Resp./Workload 2. Q21 - Q40 704 10 0.01420 0.004460C35B6 C. Resp./Workload 2. Q21 Q40 1491 7 0.00469 0.001770C35C1 C. Resp./Workload 2. Q21 - Q40 589 3 0.00509 0.002933C35C2 C. Resp./Workload 2. Q21 - Q40 1432 5 0.00349 0.001559C35C3 C. Resp./Workload 2. Q21 - Q40 1941 6 0.00309 0.001260C35C4 C. Resp./Workload 2. Q21 - Q40 864 8 0.00926 0.003258C35C5 C. Resp./Workload 2. Q21 - Q40 169 6 0.03550 0.014234C35C6 C. Resp./Workload 2. Q21 - Q40 245 7 0.02857 0.010644C36A C. Resp./Workload 2. Q21 - Q40 .4995 75 0.01502 0.001721C36B C. Resp./Workload 2. Q21 - Q40 4995 70 0.01401 0.001663C36C C. Resp./Workload 2. Q21 - Q40 4995 63 0.01261 0.001579C36D C. Resp./Workload 2. Q21 - Q40 4995 65 0.01301 0.001604C37AA C. Resp./Workload 2. Q21 - Q40 4995 101 0.02022 0.001992C37AB C. Resp./Workload 2. Q21 - Q40 4995 101 0.02022 0.001992C37AC C. Resp./Workload 2. Q21 - Q40 4995 101 0.02022 0.001992C37AD C. Resp./Workload 2. Q21 - Q40 4995 100 0.02002 0.001982C37AE C. Resp./Workload 2. Q21 - Q40 4995 101 0.02022 0.001992C37AF C. Resp./Workload 2. Q21 - Q40 4995 103 0.02062 0.002011C37BA C. Resp./Workload 2. Q21 - Q40 4995 116 0.02322 0.002131
410
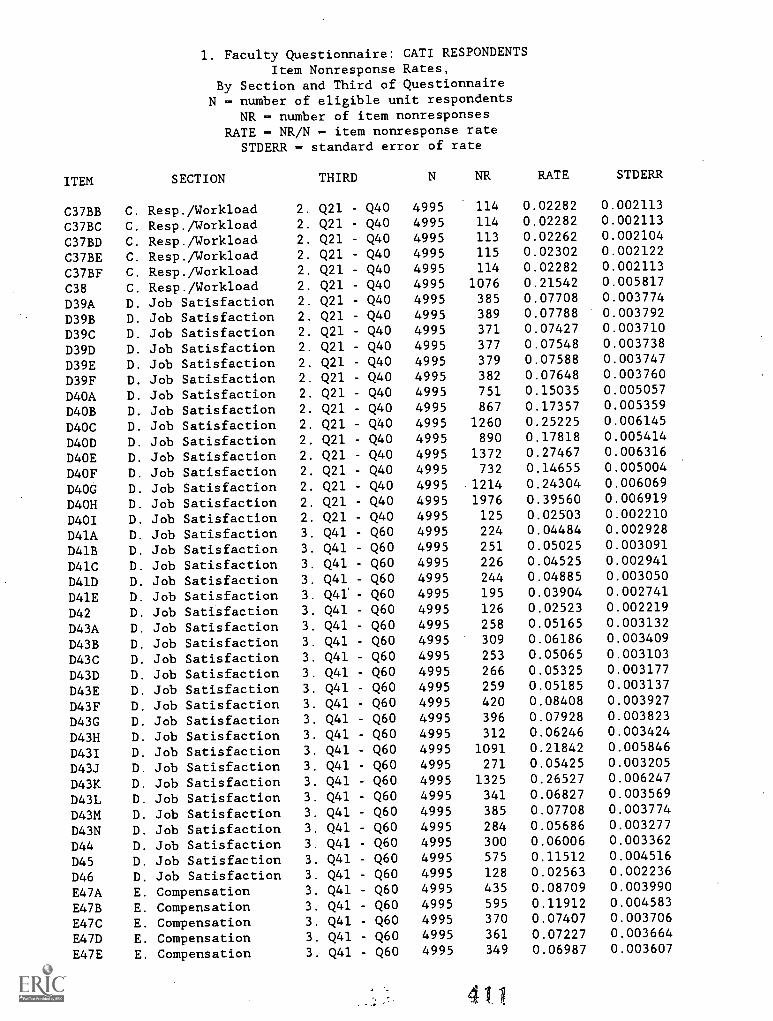
1. Faculty Questionnaire: CATI RESPONDENTSItem Nonresponse Rates,
By Section and Third of QuestionnaireN = number of eligible unit respondents
NR - number of item nonresponsesRATE - NR/N - item nonresponse rate
STDERR - standard error of rate
ITEM SECTION THIRD N NR RATE STDERR
C37BB C. Resp./Workload 2. Q21 Q40 4995 114 0.02282 0.002113
C37BC C. Resp./Workload 2. Q21 Q40 4995 114 0.02282 0.002113
C37BD C. Resp./Workload 2. Q21 - Q40 4995 113 0.02262 0.002104
C37BE C. Resp./Workload 2. Q21 - Q40 4995 115 0.02302 0.002122
C37BF C. Resp./Workload 2. Q21 - Q40 4995 114 0.02282 0.002113
C38 C. Resp./Workload 2. Q21 - Q40 4995 1076 0.21542 0.005817
D39A D. Job Satisfaction 2. Q21 - Q40 4995 385 0.07708 0.003774
D39B D. Job Satisfaction 2. Q21 - Q40 4995 389 0.07788 0.003792
D39C D. Job Satisfaction 2. Q21 - Q40 4995 371 0.07427 0.003710
D39D D. Job Satisfaction 2. Q21 - Q40 4995 377 0.07548 0.003738
D39E D. Job Satisfaction 2. Q21 - Q40 4995 379 0.07588 0.003747
D39F D. Job Satisfaction 2. Q21 - Q40 4995 382 0.07648 0.003760
D40A D. Job Satisfaction 2. Q21 - Q40 4995 751 0.15035 0.005057
D4OB D. Job Satisfaction 2. Q21 - Q40 4995 867 0.17357 0.005359
D40C D. Job Satisfaction 2. Q21 - Q40 4995 1260 0.25225 0.006145
D4OD D. Job Satisfaction 2. Q21 - Q40 4995 890 0.17818 0.005414
D4OE D. Job Satisfaction 2. Q21 - Q40 4995 1372 0.27467 0.006316
D4OF D. Job Satisfaction 2. Q21 - Q40 4995 732 0.14655 0.005004
D4OG D. Job Satisfaction 2. Q21 - Q40 4995 1214 0.24304 0.006069
D4OH D. Job Satisfaction 2. Q21 - Q40 4995 1976 0.39560 0.006919
D401 D. Job Satisfaction 2. Q21 - Q40 4995 125 0.02503 0.002210
D41A D. Job Satisfaction 3. Q41 - Q60 4995 224 0.04484 0.002928
D41B D. Job Satisfaction 3. Q41 - Q60 4995 251 0.05025 0.003091
D41C D. Job Satisfaction 3. Q41 - Q60 4995 226 0.04525 0.002941
D41D D. Job Satisfaction 3. Q41 - Q60 4995 244 0.04885 0.003050
D41E D. Job Satisfaction 3. Q41'- Q60 4995 195 0.03904 0.002741
D42 D. Job Satisfaction 3. Q41 - Q60 4995 126 0.02523 0.002219
D43A D. Job Satisfaction 3. Q41 - Q60 4995 258 0.05165 0.003132
D43B D. Job Satisfaction 3. Q41 - Q60 4995 309 0.06186 0.003409
D43C D. Job Satisfaction 3. Q41 - Q60 4995 253 0.05065 0.003103
D43D D. Job Satisfaction 3. Q41 - Q60 4995 266 0.05325 0.003177
D43E D. Job Satisfaction 3. Q41 - Q60 4995 259 0.05185 0.003137
D43F D. Job Satisfaction 3. Q41 - Q60 4995 420 0.08408 0.003927
D43G D. Job Satisfaction 3. Q41 - Q60 4995 396 0.07928 0.003823
D43H D. Job Satisfaction 3. Q41 - Q60 4995 312 0.06246 0.003424
D43I D. Job Satisfaction 3. Q41 - Q60 4995 1091 0.21842 0.005846
D43J D. Job Satisfaction 3. Q41 - Q60 4995 271 0.05425 0.003205
D43K D. Job Satisfaction 3. Q41 - Q60 4995 1325 0.26527 0.006247
D43L D. Job Satisfaction 3. Q41 - Q60 4995 341 0.06827 0.003569
D43M D. Job Satisfaction 3. Q41 - Q60 4995 385 0.07708 0.003774
D43N D. Job Satisfaction 3. Q41 - Q60 4995 284 0.05686 0.003277
D44 D. Job Satisfaction 3. Q41 - Q60 4995 300 0.06006 0.003362
D45 D. Job Satisfaction 3. Q41 - Q60 4995 575 0.11512 0.004516
D46 D. Job Satisfaction 3. Q41 - Q60 4995 128 0.02563 0.002236
E47A E. Compensation 3. Q41 - Q60 4995 435 0.08709 0.003990
E47B E. Compensation 3. Q41 - Q60 4995 595 0.11912 0.004583
E47C E. Compensation 3. Q41 - Q60 4995 370 0.07407 0.003706
E47D E. Compensation 3. Q41 - Q60 4995 361 0.07227 0.003664
E47E E. Compensation 3. Q41 - Q60 4995 349 0.06987 0.003607
411
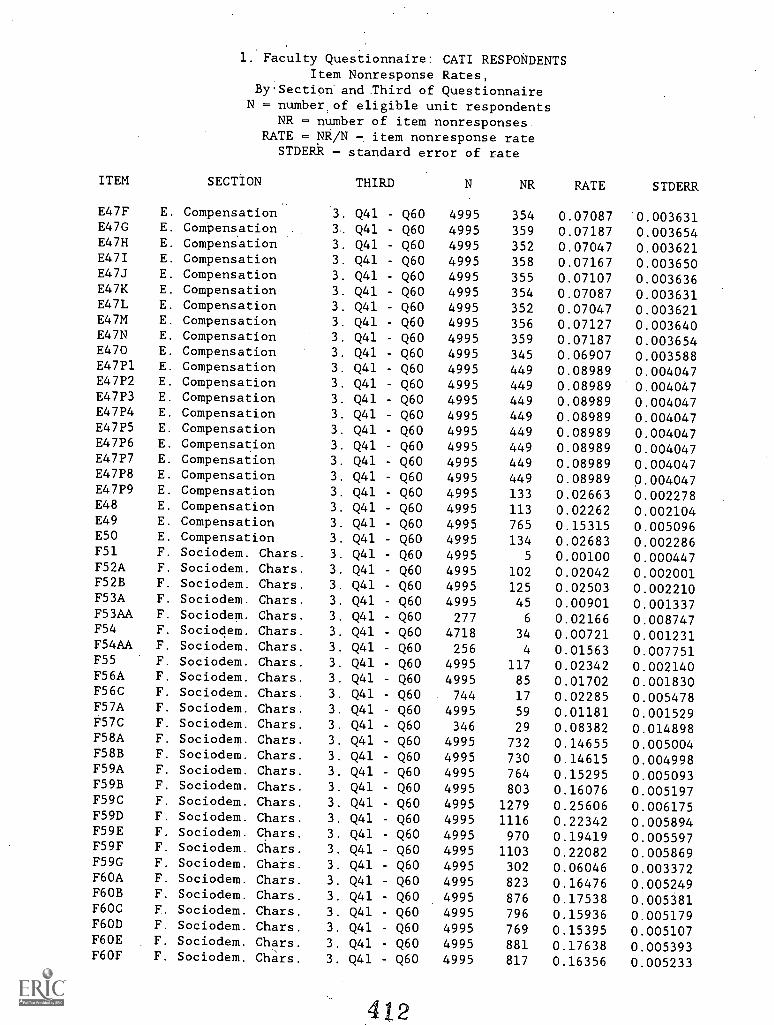
1. Faculty Questionnaire: CATI RESPONDENTSItem Nonresponse Rates,
BySection and Ihird of QuestionnaireN = number,of eligible unit respondents
NR = number of item nonresponsesRATE = NR/N item nonresponse rate
STDERR - standard error of rate
ITEM SECTION THIRD N NR RATE STDERR
E47F E. Compensation 3. Q41 - Q60 4995 354 0.07087 0.003631E47G E. Compensation 3. Q41 - Q60 4995 359 0.07187 0.003654E47H E. Compensation 3. Q41 - Q60 4995 352 0.07047 0.003621E47I E. Compensation 3. Q41 - Q60 4995 358 0.07167 0.003650E47J E. Compensation 3. Q41 - Q60 4995 355 0.07107 0.003636E47K E. Compensation 3. Q41 - Q60 4995 354 0.07087 0.003631E47I, E. Compensation 3. Q41 - Q60 4995 352 0.07047 0.003621E47M E. Compensation 3. Q41 - Q60 4995 356 0.07127 0.003640E47N E. Compensation 3. Q41 - Q60 4995 359 0.07187 0.003654E470 E. Compensation 3. Q41 - Q60 4995 345 0.06907 0.003588E47P1 E. Compensation 3. Q41 - Q60 4995 449 0.08989 0.004047E47P2 E. Compensation 3. Q41 - Q60 4995 449 0.08989 0.004047E47P3 E. Compensation 3. Q41 - Q60 4995 449 0.08989 0.004047E47P4 E. Compensation 3. Q41 - Q60 4995 449 0.08989 0.004047E47P5 E. Compensation 3. Q41 - Q60 4995 449 0.08989 0.004047E47P6 E. Compensation 3. Q41 - Q60 4995 449 0.08989 0.004047E47P7 E. Compensation 3. Q41 - Q60 4995 449 0.08989 0.004047E47P8 E. Compensation 3. Q41 - Q60 4995 449 0.08989 0.004047E47P9 E. Compensation 3. Q41 - Q60 4995 133 0.02663 0.002278E48 E. Compensation 3. Q41 - Q60 4995 113 0.02262 0.002104E49 E. Compensation 3. Q41 - Q60 4995 765 0.15315 0.005096E50 E. Compensation 3. Q41 - Q60 4995 134 0.02683 0.002286F51 F. Sociodem. Chars. 3. Q41 - Q60 4995 5 0.00100 0.000447F52A F. Sociodem. Chars. 3. Q41 - Q60 4995 102 0.02042 0.002001F52B F. Sociodem. Chars. 3. Q41 - Q60 4995 125 0.02503 0.002210F53A F. Sociodem. Chars. 3. Q41 - Q60 4995 45 0.00901 0.001337F53AA F. Sociodem. Chars. 3. Q41 - Q60 277 6 0.02166 0.008747F54 F. Sociodem. Chars. 3. Q41 - Q60 4718 34 0.00721 0.001231F54AA F. Sociodem. Chars. 3. Q41 - Q60 256 4 0.01563 0.007751F55 F. Sociodem. Chars. 3. Q41 - Q60 4995 117 0.02342 0.002140F56A F. Sociodem. Chars. 3. Q41 - Q60 4995 85 0.01702 0.001830F56C F. Sociodem. Chars. 3. Q41 - Q60 744 17 0.02285 0.005478F57A F. Sociodem. Chars. 3. Q41 - Q60 4995 59 0.01181 0.001529F57C F. Sociodem. Chars. 3. Q41 - Q60 346 29 0.08382 0.014898F58A F. Sociodem. Chars. 3. Q41 - Q60 4995 732 0.14655 0.005004F58B F. Sociodem. Chars. 3. Q41 - Q60 4995 730 0.14615 0.004998F59A F. Sociodem. Chars. 3. Q41 - Q60 4995 764 0.15295 0.005093F59B F. Sociodem. Chars. 3. Q41 - Q60 4995 803 0.16076 0.005197F59C F. Sociodem. Chars. 3. Q41 - Q60 4995 1279 0.25606 0.006175F59D F. Sociodem. Chars. 3. Q41 - Q60 4995 1116 0.22342 0.005894F59E F. Sociodem. Chars. 3. Q41 - Q60 4995 970 0.19419 0.005597F59F F. Sociodem. Chars. 3. Q41 - Q60 4995 1103 0.22082 0.005869F59G F. Sociodem. Chai.s. 3. Q41 - Q60 4995 302 0.06046 0.003372F60A F. Sociodem. Chars. 3. Q41 - Q60 4995 823 0.16476 0.005249F6OB F. Sociodem. Chars. 3. Q41 - Q60 4995 876 0.17538 0.005381F60C F. Sociodem. Chars. 3. Q41 - Q60 4995 796 0.15936 0.005179F6OD F. Sociodem. Chars. 3. Q41 - Q60 4995 769 0.15395 0.005107F60E F. Sociodem. Chars. 3. Q41 - Q60 4995 881 0.17638 0.005393F6OF F. Sociodem. Chars. 3. Q41 - Q60 4995 817 0.16356 0.005233
4L2
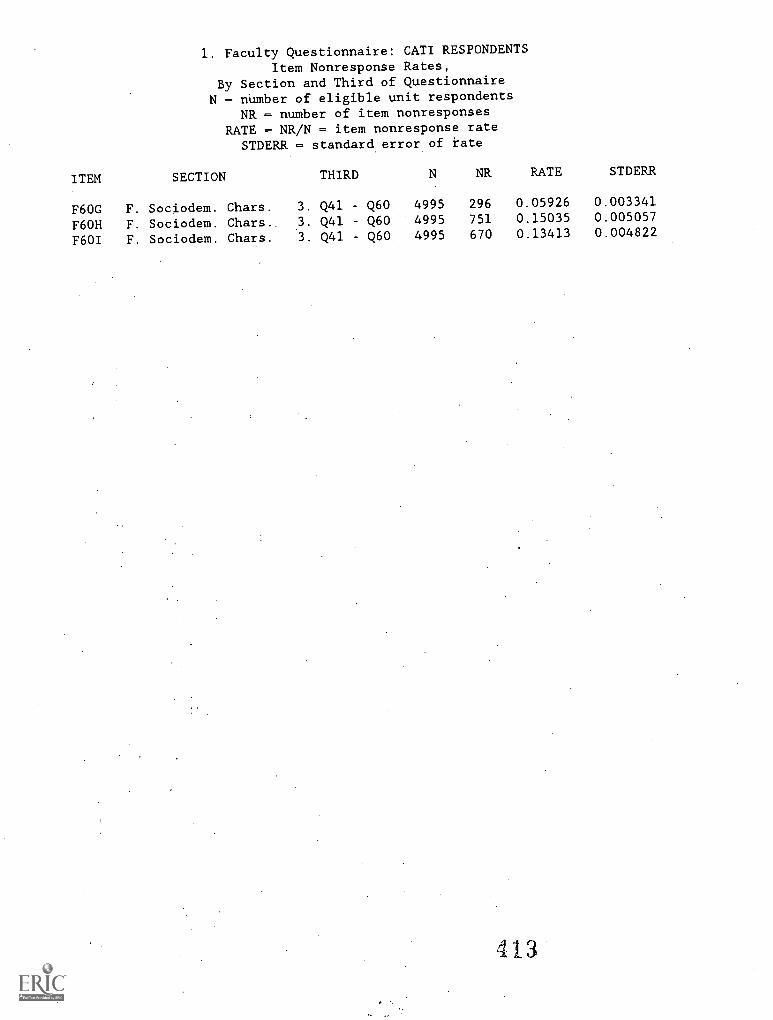
1. Faculty Questionnaire: CATI RESPONDENTS
Item Nonresponse Rates,By Section and Third of QuestionnaireN number of eligible unit respondents
NR = number of item nonresponsesRATE = NR/N = item nonresponse rate
STDERR standard error of rate
ITEM SECTION THIRD N NR RATE STDERR
F6OG F. Sociodem. Chars. 3. Q41 - Q60 4995 296 0.05926 0.003341
F6OH F. Sociodem. Chars.. 3. Q41 - Q60 4995 751 0.15035 0.005057
F601 F. Sociodem. Chars. 3. Q41 - Q60 4995 670 0.13413 0.004822
X13
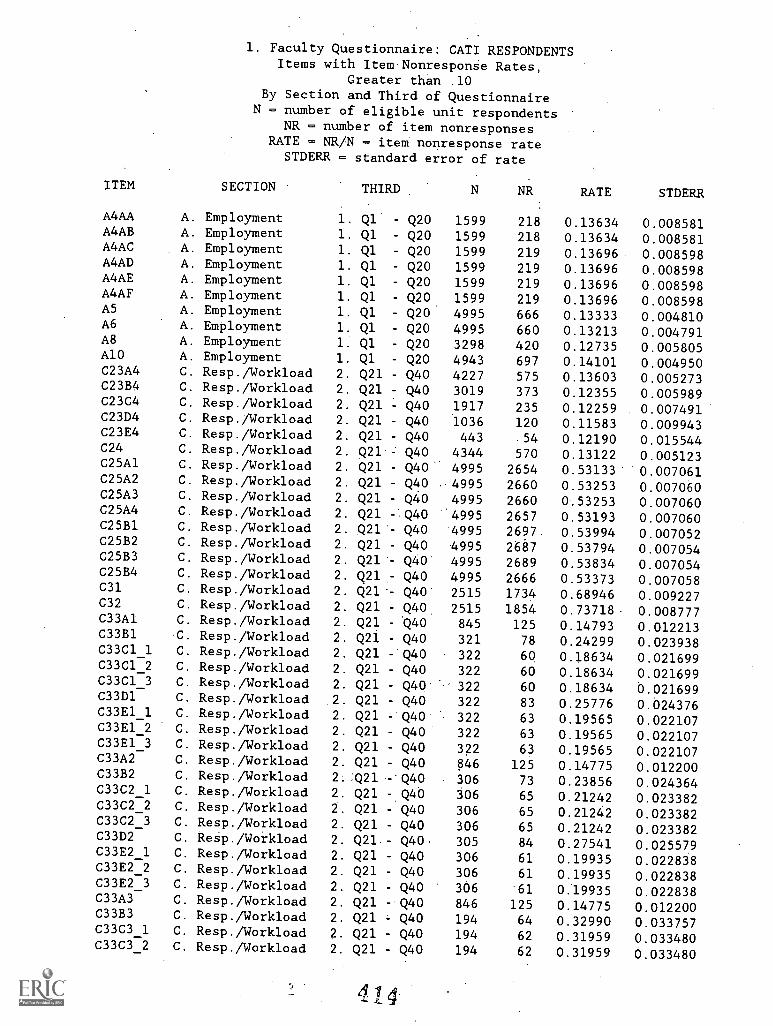
1. Faculty Questionnaire: CATI RESPONDENTSItems with Item NonresponSe Rates,
Greater than .10By Section and Third of Questionnaire
N = number of eligible unit respondents
ITEM
NR - number of item nonresponsesRATE = NR/N - item nonresponse rate
STDERR standard error of rate
SECTION THIRD N NR RATE STDERR
A4AA A. Employment 1. Q1 - Q20 1599 218 0.13634 0.008581A4AB A. Employment 1. Ql - Q20 1599 218 0.13634 0.008581A4AC A. Employment 1. Ql - Q20 1599 219 0.13696 0.008598A4AD A. Employment 1. Ql - Q20 1599 219 0.13696 0.008598A4AE A. Employment 1. Ql - Q20 1599 219 0.13696 0.008598A4AF A. Employment 1. Q1 - Q20 1599 219 0.13696 0.008598A5 A. Employment 1. Ql - Q20 4995 666 0.13333 0.004810A6 A. Employment 1. Ql - Q20 4995 660 0.13213 0.004791A8 A. Employment 1. Ql - Q20 3298 420 0.12735 0.005805A10 A. Employment 1. Q1 - Q20 4943 697 0.14101 0.004950C23A4 C. Resp./Workload 2. Q21 - Q40 4227 575 0.13603 0.005273C23B4 C. Resp./Workload 2. Q21 - Q40 3019 373 0.12355 0.005989C23C4 C. Resp./Workload 2. Q21 - Q40 1917 235 0.12259 0.007491C23D4 C. Resp./Workload 2. Q21 - Q40 1036 120 0.11583 0.009943C23E4 C. Resp./Workload 2. Q21 - Q40 443 54 0.12190 0.015544C24 C. Resp./Workload 2. Q21 - Q40 4344 570 0.13122 0.005123C25A1 C. Resp./Workload 2. Q21 - Q40 4995 2654 0.53133 0.007061C25A2 C. Resp./Workload 2. Q21 - Q40 -4995 2660 0.53253 0.007060C25A3 C. Resp./Workload 2. Q21 - Q40 4995 2660 0.53253 0.007060C25A4 C. Resp./Workload 2. Q21 - Q40 4995 2657 0.53193 0.007060C25B1 C. Resp./Workload 2. Q21'- Q40 4995 2697 0.53994 0.007052C25B2 C. Resp./Workload 2. Q21 - Q40 4995 2687 0.53794 0.007054C25B3 C. Resp./Workload 2. Q21 Q40 4995 2689 0.53834 0.007054C25B4 C. Resp./Workload 2. Q21 - Q40 4995 2666 0.53373 0.007058C31 C. Resp./Workload 2. Q21'- Q40' 2515 1734 0.68946 0.009227C32 C. Resp./Workload 2. Q21 - Q40, 2515 1854 0.73718 0.008777C33A1 C. Resp./Workload 2. Q21 - 'Q40 845 125 0.14793 0.012213C33B1 C. Resp./Workload 2. Q21 - Q40 321 78 0.24299 0.023938C33C1_1 C. Resp./Workload 2. Q21 - Q40 322 60 0.18634 0.021699C33C1_2 C. Resp./Workload 2. Q21 - Q40 322 60 0.18634 0.021699C33C1_3 C. Resp./Workload 2. Q21 - Q40 322 60 0.18634 0.021699C33D1 C. Resp./Workload 2. Q21 - Q40 322 83 0.25776 0.024376C33E1_1 C. Resp./Workload 2. Q21 - Q40 322 63 0.19565 0.022107C33E1_2 C. Resp./Workload 2. Q21 - Q40 322 63 0.19565 0.022107C33E1 3 C. Resp./Workload 2. Q21 - Q40 322 63 0.19565 0.022107C33A2 C. Resp./Workload 2. Q21 - Q40 846 125 0.14775 0.012200C33B2 C. Resp./Workload 2.:Q21 -'Q40 306 73 0.23856 0.024364C33C2_1 C. Resp./Workload 2. Q21 - Q40 306 65 0.21242 0.023382C33C2_2 C. Resp./Workload 2. Q21 - Q40 306 65 0.21242 0.023382C33C2_3 C. Resp./Workload 2. Q21 - Q40 306 65 0.21242 0.023382C33D2 C. Resp./Workload 2. Q21.- Q40 305 84 0.27541 0.025579C33E2_1 C. Resp./Workload 2. Q21 - Q40 306 61 0.19935 0.022838C33E2_2 C. Resp./Workload 2. Q21 - Q40 306 61 0.19935 0.022838C33E2_3 C. Resp./Workload 2. Q21 - Q40 306 61 0.19935 0.022838C33A3 C. Resp./Workload 2. Q21 - Q40 846 125 0.14775 0.012200C33B3 C. Resp./Workload 2. Q21 - Q40 194 64 0.32990 0.033757C33C3_1 C. Resp./Workload 2. Q21 - Q40 194 62 0.31959 0.033480C33C3 2 C. Resp./Workload 2. Q21 - Q40 194 62 0.31959 0.033480
414
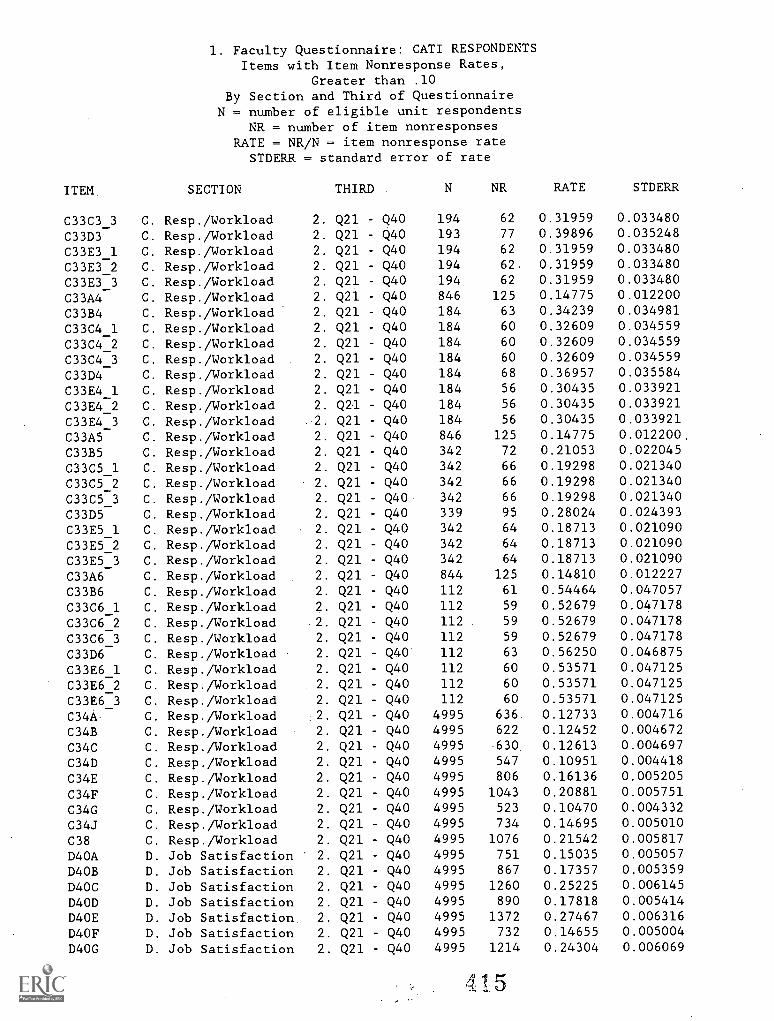
1. Faculty Questionnaire: CATI RESPONDENTSItems with Item Nonresponse Rates,
Greater than .10By Section and Third of Questionnaire
N = number of eligible unit respondentsNR = number of item nonresponses
RATE = NR/N = item nonresponse rateSTDERR = standard error of rate
ITEM. SECTION THIRD . N NR RATE STDERR
C33C3_3 C. Resp./Workload 2. Q21 Q40. 194 62 0.31959 0.033480
C33D3 C. Resp./Workload 2. Q21 Q40 193 77 0.39896 0.035248
C33E3_1 C. Resp./Workload 2. Q21 - Q40 194 62 0.31959 0.033480
C33E3_2 C. Resp./Workload 2. Q21 Q40 194 62 0.31959 0.033480
C33E3_3 C. Resp./Workload 2. Q21 Q40 194 62 0.31959 0.033480
C33A4 C. Resp./Workload 2. Q21 Q40 846 125 0.14775 0.012200
C33B4 C. Resp./Workload 2. Q21 - Q40 184 63 0.34239 0.034981
C33C4_1 C. Resp./Workload 2. Q21 Q40 184 60 0.32609 0.034559
C33C4_2 C. Resp./Workload 2. Q21 - Q40 184 60 0.32609 0.034559
C33C4_3 C. Resp./Workload 2. Q21 Q40 184 60 0.32609 0.034559
C33D4 C. Resp./Workload 2. Q21 - Q40 184 68 0.36957 0.035584
C33E4_1 C. Resp./Workload 2. Q21 Q40 184 56 0.30435 0.033921
C33E4_2 C. Resp./Workload 2. Q21 Q40 184 56 0.30435 0.033921
C33E4_3 C. Resp./Workload . 2. Q21 Q40 184 56 0.30435 0.033921
C33A5 C. Resp./Workload 2. Q21 - Q40 846 125 0.14775 0.012200.
C33B5 C. Resp./Workload 2. Q21 - Q40 342 72 0.21053 0.022045
C33C5_1 C. Resp./Workload 2. Q21 Q40 342 66 0.19298 0.021340
C33C5_2 C. Resp./Workload 2. Q21 Q40 342 66 0.19298 0.021340
C33C5_3 C. Resp./Workload 2. Q21 - Q40 342 66 0.19298 0.021340
C33D5 C. Resp./Workload 2. Q21 Q40 339 95 0.28024 0.024393
C33E5 1 C. Resp./Workload 2. Q21 Q40 342 64 0.18713 0.021090_C33E5 2 C. Resp./Workload 2. Q21 Q40 342 64 0.18713 0.021090
C33E5_3 C. Resp./Workload 2. Q21 Q40 342 64 0.18713 0.021090
C33A6 C. Resp./Workload 2. Q21 Q40 844 125 0.14810 0.012227
C33B6 C. Resp./Workload 2. Q21 Q40 112 61 0.54464 0.047057
C33C6_1 C. Resp./Workload 2. Q21 Q40 112 59 0.52679 0.047178
C33C6_2 C. Resp./Workload 2. Q21 - Q40 112 59 0.52679 0.047178
C33C6_3 C. Resp./Workload 2. Q21 - Q40 112 59 0.52679 0.047178
C33D6 C. Resp./Workload 2. Q21 Q40 112 63 0.56250 0.046875
C33E6_1 C. Resp./Workload 2. Q21 Q40 112 60 0.53571 0.047125
C33E6_2 C. Resp./Workload 2. Q21 Q40 112 60 0.53571 0.047125
C33E6_3 C. Resp./Workload 2. Q21 - Q40 112 60 0.53571 0.047125
C34A C. Resp./Workload .2. Q21 - Q40 4995 636. 0.12733 0.004716
C34B C. Resp./Workload 2. Q21 - Q40 4995 622 0.12452 0.004672
C34C C. Resp./Workload 2. Q21 - Q40 4995 630 0.12613 0.004697
C34D C. Resp./Workload 2. Q21 - Q40 4995 547 0.10951 0.004418
C34E C. Resp./Workload 2. Q21 Q40 4995 806 0.16136 0.005205
C34F C. Resp./Workload 2. Q21 - Q40 4995 1043 0.20881 0.005751
C34G C. Resp./Workload 2. Q21 - Q40 4995 523 0.10470 0.004332
C34J C. Resp./Workload 2. Q21 - Q40 4995 734 0.14695 0.005010
C38 C. Resp./Workload 2. Q21 - Q40 4995 1076 0.21542 0.005817
D40A D. Job Satisfaction 2. Q21 - Q40 4995 751 0.15035 0.005057
D4OB D. Job Satisfaction 2. Q21 - Q40 4995 867 0.17357 0.005359
D40C D. Job Satisfaction 2. Q21 - Q40 4995 1260 0.25225 0.006145
D4OD D. Job Satisfaction 2. Q21 - Q40 4995 890 0.17818 0.005414
D4OE D. Job Satisfaction. 2. Q21 - Q40 4995 1372 0.27467 0.006316
D4OF D. Job Satisfaction 2. Q21 - Q40 4995 732 0.14655 0.005004
D4OG D. Job Satisfaction 2. Q21 - Q40 4995 1214 0.24304 0.006069
4 1 5
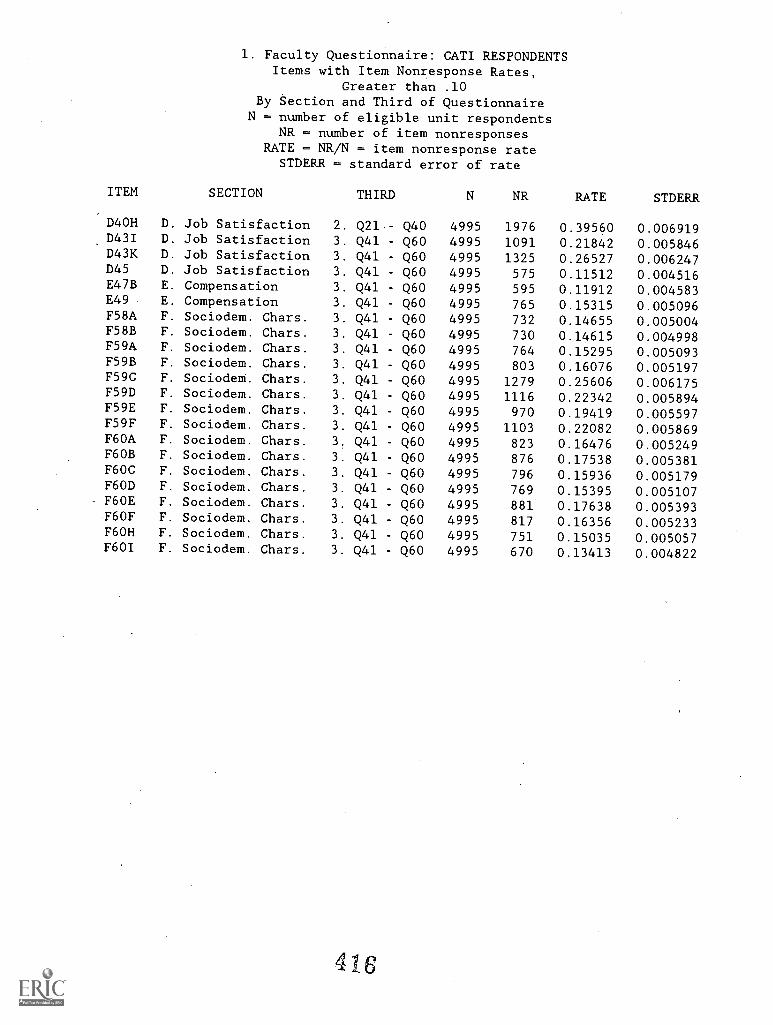
1. Faculty Questionnaire: CATI RESPONDENTSItems with Item Nonresponse Rates,
Greater than .10By Section and Third of Questionnaire
N = number of eligible unit respondentsNR - number of item nonresponses
RATE = NR/N - item nonresponse rateSTDERR = standard error of rate
ITEM SECTION THIRD N NR RATE STDERR
D4OH D. Job Satisfaction 2. Q21 - Q40 4995 1976 0.39560 0.006919D43I D. Job Satisfaction 3. Q41 - Q60 4995 1091 0.21842 0.005846D43K D. Job Satisfaction 3. Q41 Q60 4995 1325 0.26527 0.006247D45 D. Job Satisfaction 3. Q41 - Q60 4995 575 0.11512 0.004516E47B E. Compensation 3. Q41 Q60 4995 595 0.11912 0.004583E49 E. Compensation 3. Q41 - Q60 4995 765 0.15315 0.005096F58A F. Sociodem. Chars. 3. Q41 Q60 4995 732 0.14655 0.005004F58B F. Sociodem. Chars. 3. Q41 Q60 4995 730 0.14615 0.004998F59A F. Sociodem. Chars. 3. Q41 - Q60 4995 764 0.15295 0.005093F59B F. Sociodem. Chars. 3. Q41 - Q60 4995 803 0.16076 0.005197F59C F. Sociodem. Chars. 3. Q41 Q60 4995 1279 0.25606 0.006175F59D F. Sociodem. Chars. 3. Q41 - Q60 4995 1116 0.22342 0.005894F59E F. Sociodem. Chars. 3. Q41 - Q60 4995 970 0.19419 0.005597F59F F. Sociodem. Chars. 3. Q41 Q60 4995 1103 0.22082 0.005869F60A F. Sociodem. Chars. 3. Q41 - Q60 4995 823 0.16476 0.005249F6OB F. Sociodem. Chars. 3. Q41 Q60 4995 876 0.17538 0.005381F60C F. Sociodem. Chars. 3. Q41 Q60 4995 796 0.15936 0.005179F6OD F. Sociodem. Chars. 3. Q41 - Q60 4995 769 0.15395 0.005107F60E F. Sociodem. Chars. 3. Q41 - Q60 4995 881 0.17638 0.005393F6OF F. Sociodem. Chars. 3. Q41 Q60 4995 817 0.16356 0.005233F6OH. F. Sociodem. Chars. 3. Q41 - Q60 4995 751 0.15035 0.005057F601 F. Sociodem. Chars. 3. Q41 Q60 4995 670 0.13413 0.004822
416
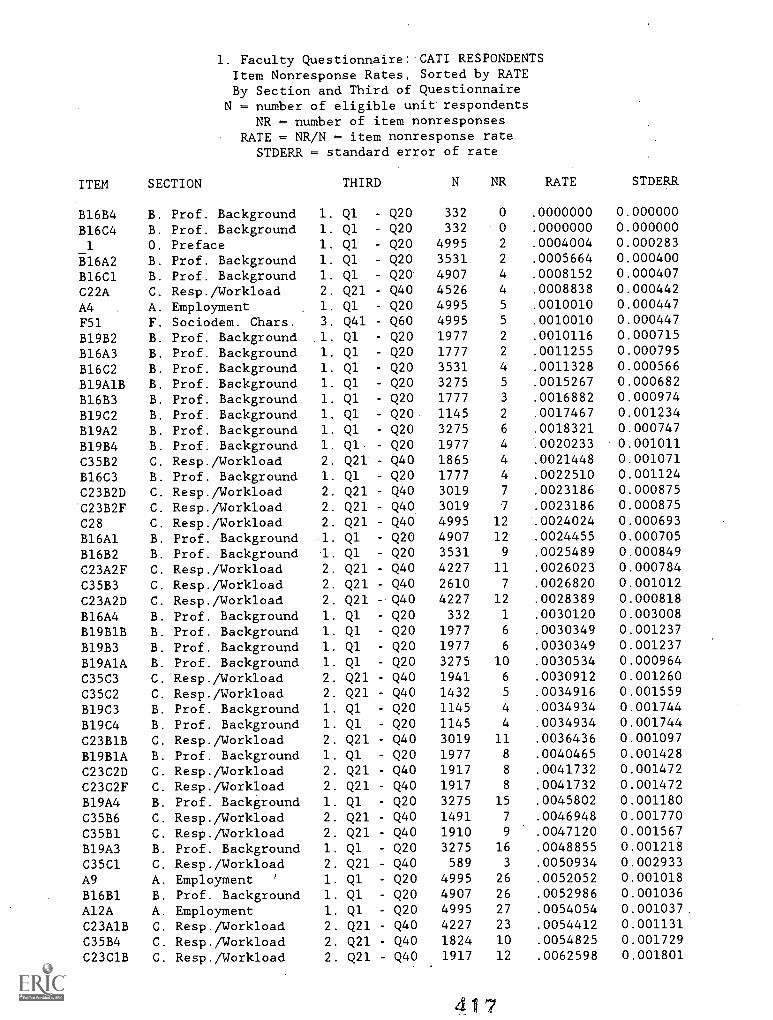
1. Faculty Questionnaire: CATI RESPONDENTSItem Nonresponse Rates, Sorted by RATEBy Section and Third of Questionnaire
N = number of eligible unit respondentsNR = number of item nonresponses
RATE = NR/N = item nonresponse rateSTDERR = standard error of rate
ITEM SECTION THIRD N NR RATE STDERR
B16B4 B. Prof. Background 1. Ql Q20 332 0 .0000000 0.000000
B16C4 B. Prof. Background 1. Ql - Q20 332 0 .0000000 0.000000
O. Preface 1. Ql - Q20 4995 2 .0004004 0.000283_1B16A2 B. Prof. Background 1. Ql Q20 3531 2 .0005664 0.000400
B16C1 B. Prof. Background 1. Ql Q20 4907 4 .0008152 0.000407
C22A C. Resp./Workload 2. Q21 - Q40 4526 4 .0008838 0.000442
A4 A. Employment 1. Ql Q20 4995 5 .0010010 0.000447
F51 F. Sociodem. Chars. 3. Q41 Q60 4995 5 .0010010 0.000447
B19B2 B. Prof. Background .1. Ql - Q20 1977 2 .0010116 0.000715
B16A3 B. Prof. Background 1. Ql - Q20 1777 2 .0011255 0.000795
B16C2 B. Prof. Background 1. Ql - Q20 3531 4 .0011328 0.000566
B19A1B B. Prof. Background 1. Ql - Q20 3275 5 .0015267 0.000682
B16B3 B. Prof. Background 1. Ql Q20 1777 3 .0016882 0.000974
B19C2 B. Prof. Background 1. Ql - Q20 1145 2 .0017467 0.001234
B19A2 B. Prof. Background 1. Ql Q20 3275 6 .0018321 0.000747
B19B4 B. Prof. Background 1. Ql - Q20 1977 4 .0020233 0.001011
C35B2 C. Resp./Workload 2. Q21 Q40 1865 4 .0021448 0.001071
B16C3 B. Prof. Background 1. Ql Q20 1777 4 .0022510 0.001124
C23B2D C. Resp./Workload 2. Q21 Q40 3019 7 .0023186 0.000875
C23B2F C. Resp./Workload 2. Q21 Q40 3019 7 .0023186 0.000875
C28 C. Resp./Workload 2. Q21 Q40 4995 12 .0024024 0.000693
B16A1 B. Prof. Background 1. Ql - Q20 4907 12 .0024455 0.000705
B16B2 B. Prof. Background 1. Ql - Q20 3531 9 .0025489 0.000849
C23A2F C. Resp./Workload 2. Q21 - Q40 4227 11 .0026023 0.000784
C35B3 C. Resp./Workload 2. Q21 - Q40 2610 7 .0026820 0.001012
C23A2D C. Resp./Workload 2. Q21 Q40 4227 12 .0028389 0.000818
B16A4 B. Prof. Background 1. Ql - Q20 332 1 .0030120 0.003008
B19B1B B. Prof. Background 1. Ql - Q20 1977 6 .0030349 0.001237
B19B3 B. Prof. Background 1. Ql - Q20 1977 6 .0030349 0.001237
B19A1A B. Prof. Background 1. Ql - Q20 3275 10 .0030534 0.000964
C35C3 C. Resp./Workload 2. Q21 - Q40 1941 6 .0030912 0.001260
C35C2 C. Resp./Workload 2. Q21 - Q40 1432 5 .0034916 0.001559
B19C3 B. Prof. Background 1. Ql - Q20 1145 4 .0034934 0.001744
B19C4 B. Prof. Background 1. Q1 - Q20 1145 4 .0034934 0.001744
C23B1B C. Resp./Workload 2. Q21 - Q40 3019 11 .0036436 0.001097
B19B1A B. Prof. Background 1. Ql - Q20 1977 8 .0040465 0.001428
C23C2D C. Resp./Workload 2. Q21 - Q40 1917 8 .0041732 0.001472
C23C2F C. Resp./Workload 2. Q21 - Q40 1917 8 .0041732 0.001472
B19A4 B. Prof. Background 1. Ql - Q20 3275 15 .0045802 0.001180
C35B6 C. Resp./Workload 2. Q21 - Q40 1491 7 .0046948 0.001770
C35B1 C. Resp./Workload 2. Q21 Q40 1910 9 .0047120 0.001567
B19A3 B. Prof. Background 1. Q1 - Q20 3275 16 .0048855 0.001218
C35C1 C. Resp./Workload 2. Q21 - Q40 589 3 .0050934 0.002933
A9 A. Employment ' 1. Ql - Q20 4995 26 .0052052 0.001018
B16B1 B. Prof. Background 1. Ql - Q20 4907 26 .0052986 0.001036
Al2A A. Employment 1. Ql - Q20 4995 27 .0054054 0.001037
C23A1B C. Resp./Workload 2. Q21 - Q40 4227 23 .0054412 0.001131
C35B4 C. Resp./Workload 2. Q21 - Q40 1824 10 .0054825 0.001729
C23C1B C. Resp./Workload 2. Q21 - Q40 1917 12 .0062598 0.001801
4 17
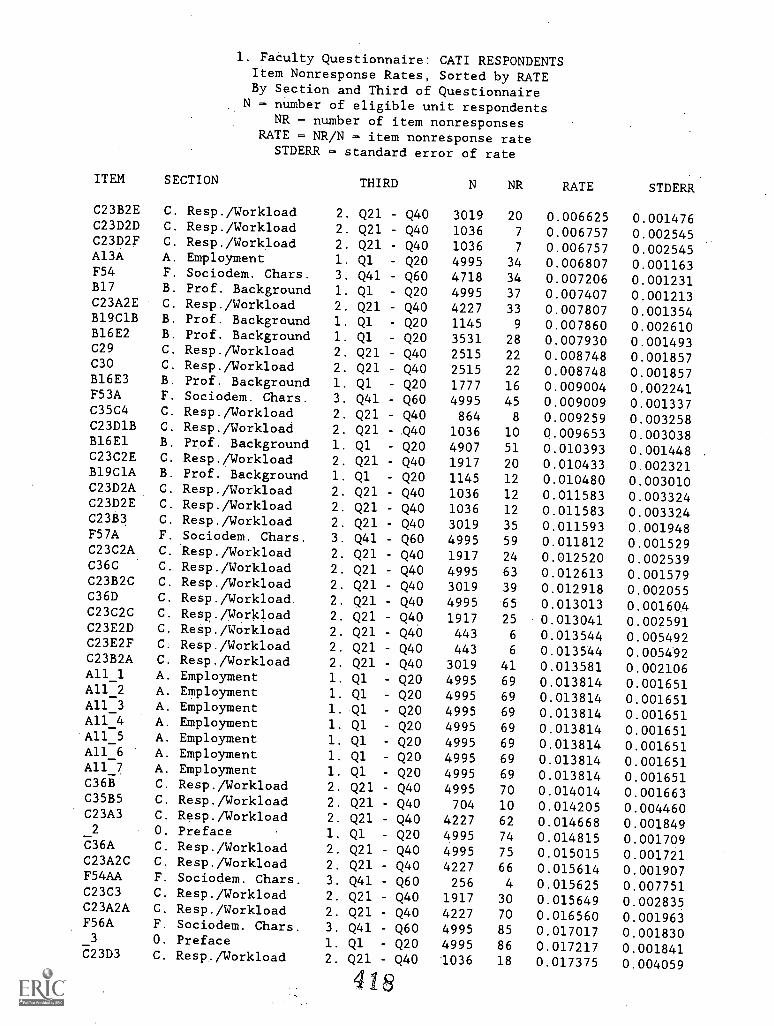
1. Faculty Questionnaire: CATI RESPONDENTSItem Nonresponse Rates, Sorted by RATEBy Section and Third of Questionnaire
N = number of eligible unit respondentsNR = number of item nonresponses
RATE = NR/N = item nonresponse rateSTDERR - standard error of rate
ITEM SECTION THIRD N NR RATE STDERR
C23B2E C. Resp./Workload 2. Q21 Q40 3019 20 0.006625 0.001476C23D2D C. Resp./Workload 2. Q21 Q40 1036 7 0.006757 0.002545C23D2F C. Resp./Workload 2. Q21 - Q40 1036 7 0.006757 0.002545A13A A. Employment 1. Ql Q20 4995 34 0.006807 0.001163F54 F. Sociodem. Chars. 3. Q41 Q60 4718 34 0.007206 0.001231B17 B. Prof. Background 1. Q1 - Q20 4995 37 0.007407 0.001213C23A2E C. Resp./Workload 2. Q21 - Q40 4227 33 0.007807 0.001354B19C1B B. Prof. Background 1. Ql - Q20 1145 9 0.007860 0.002610B16E2 B. Prof. Background 1. Ql - Q20 3531 28 0.007930 0.001493C29 C. Resp./Workload 2. Q21 Q40 2515 22 0.008748 0.001857C30 C. Resp./Workload 2. Q21 - Q40 2515 22 0.008748 0.001857B16E3 B. Prof. Background 1. Ql - Q20 1777 16 0.009004 0.002241F53A F. Sociodem. Chars. 3. Q41 - Q60 4995 45 0.009009 0.001337C35C4 C. Resp./Workload 2. Q21 - Q40 864 8 0.009259 0.003258C23D1B C. Resp./Workload 2. Q21 -.Q40 1036 10 0.009653 0.003038B16E1 B. Prof. Background 1. Ql - Q20 4907 51 0.010393 0.001448 .C23C2E C. Resp./Workload 2. Q21 - Q40 1917 20 0.010433 0.002321B19C1A B. Prof. Background 1. Ql - Q20 1145 12 0.010480 0.003010C23D2A C. Resp./Workload 2. Q21 - Q40 1036 12 0.011583 0.003324C23D2E C. Resp./Workload 2. Q21 - Q40 1036 12 0.011583 0.003324C23B3 C. Resp./Workload 2. Q21 - Q40 3019 35 0.011593 0.001948F57A F. Sociodem. Chars. 3. Q41 - Q60 4995 59 0.011812 0.001529C23C2A C. Resp./Workload 2. Q21 - Q40 1917 24 0.012520 0.002539C36C C. Resp./Workload 2. Q21 Q40 4995 63 0.012613 0.001579C23B2C C. Resp./Workload 2. Q21 - Q40 3019 39 0.012918 0.002055C36D C. Resp./Workload. 2. Q21 - Q40 4995 65 0.013013 0.00160.4C23C2C C. Resp./Workload 2. Q21 - Q40 1917 25 0.013041 0.002591C23E2D C. Resp./Workload 2. Q21 - Q40 443 6 0.013544 0.005492C23E2F C. Resp./Workload 2. Q21 - Q40 443 6 0.013544 0.005492C23B2A C. Resp./Workload 2. Q21 Q40 3019 41 0.013581 0.002106Al1_1 A. Employment 1. Ql - Q20 4995 69 0.013814 0.001651A11_2 A. Employment 1. Ql - Q20 4995 69 0.013814 0.001651A11_3 A. Employment 1. Q1 - Q20 4995 69 0.013814 0.001651A11_4 A. Employment 1. Ql - Q20 4995 69 0.013814 0.001651A11_5 A. Employment 1. Ql - Q20 4995 69 0.013814 0.001651A11_6 A. Employment 1. Ql - Q20 4995 69 0.013814 0.001651A11_7 A. Employment 1. Ql - Q20 4995 69 0.013814 0.001651C36B C. Resp./Workload 2. Q21 Q40 4995 70 0.014014 0.001663C35B5 C. Resp./Workload 2. Q21 - Q40 704 10 0.014205 0.004460C23A3 C. Resp./Workload 2. Q21 - Q40 4227 62 0.014668 0.001849O. Preface 1. Ql - Q20 4995 74 0.014815 0.001709
_2C36A C. Resp./Workload 2. Q21 - Q40 4995 75 0.015015 0.001721C23A2C C. Resp./Workload 2. Q21 - Q40 4227 66 0.015614 0.001907F54AA F. Sociodem. Chars. 3. Q41 - Q60 256 4 0.015625 0.007751C23C3 C. Resp./Workload 2. Q21 - Q40 1917 30 0.015649 0.002835C23A2A C. Resp./Workload 2. Q21 - Q40 4227 70 0.016560 0.001963F56A F. Sociodem. Chars. 3. Q41 - Q60 4995 85 0.017017 0.001830
O. Preface 1. Ql - Q20 4995 86 0.017217 0.001841_3C23D3 C. Resp./Workload 2. Q21 - Q40 1036 18 0.017375 0.004059
4 1 8
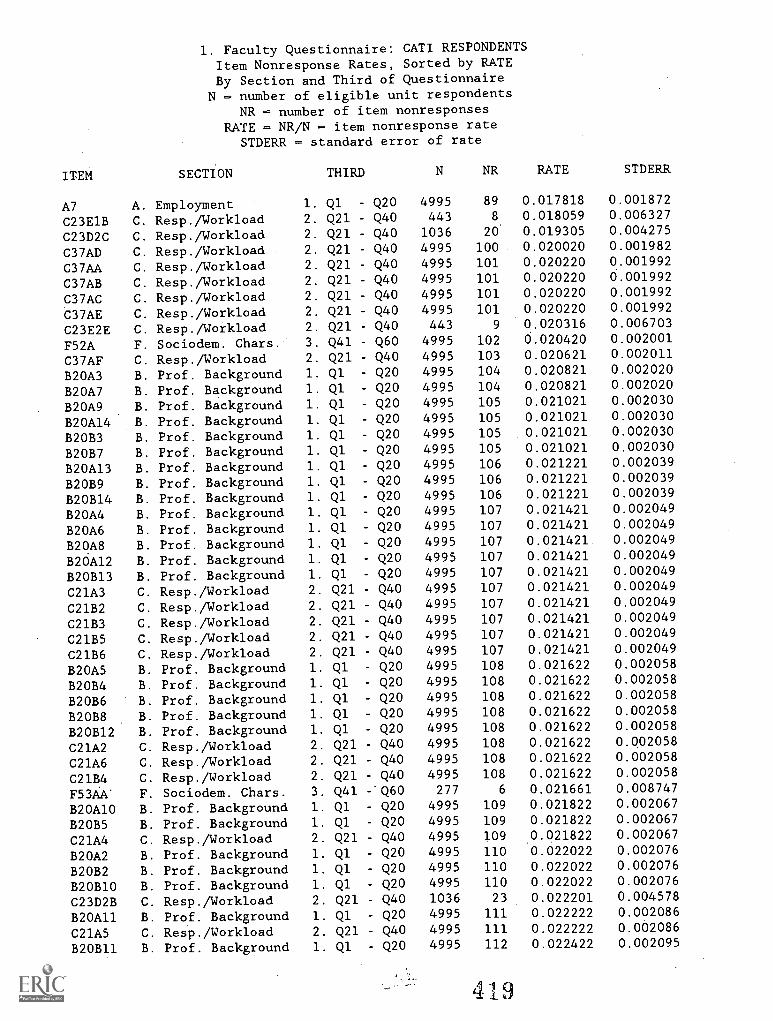
1. Faculty Questionnaire: CATI RESPONDENTSItem Nonresponse Rates, Sorted by RATEBy Section and Third of Questionnaire
N = number of eligible unit respondentsNR = number of item nonresponses
RATE = NR/N - item nonresponse rateSTDERR - standard error of rate
ITEM SECTION THIRD N NR RATE STDERR
A7 A. Employment 1. Ql Q20 4995 89 0.017818 0.001872
C23E1B C. Resp./Workload 2. Q21 - Q40 443 8 0.018059 0.006327
C23D2C C. Resp./Workload 2. Q21 - Q40 1036 20 0.019305 0.004275
C37AD C. Resp./Workload 2. Q21 - Q40 4995 100 0.020020 0.001982
C37AA C. Resp./Workload 2. Q21 - Q40 4995 101 0.020220 0.001992
C37AB C. Resp./Workload 2. Q21 - Q40 4995 101 0.020220 0.001992
C37AC C. Resp./Workload 2. Q21 - Q40 4995 101 0.020220 0.001992
C37AE C. Resp./Workload 2. Q21 - Q40 4995 101 0.020220 0.001992
C23E2E C. Resp./Workload 2. Q21 Q40 443 9 0.020316 0.006703
F52A F. Sociodem. Chars. 3. Q41 - Q60 4995 102 0.020420 0.002001
C37AF C. Resp./Workload 2. Q21 - Q40 4995 103 0.020621 0.002011
B20A3 B. Prof. Background 1. Ql Q20 4995 104 0.020821 0.002020
B20A7 B. Prof. Background 1. Ql Q20 4995 104 0.020821 0.002020
B20A9 B. Prof. Background 1. Ql - Q20 4995 105 0.021021 0.002030
B20A14 B. Prof. Background 1. Ql Q20 4995 105 0.021021 0.002030
B20B3 B. Prof. Background 1. Ql - Q20 4995 105 0.021021 0.002030
B20B7 B. Prof. Background 1. Ql - Q20 4995 105 0.021021 0.002030
B20A13 B. Prof. Background 1. Q1 Q20 4995 106 0.021221 0.002039
B20B9 B. Prof. Background 1. Ql - Q20 4995 106 0.021221 0.002039
B20B14 B. Prof. Background 1. Ql - Q20 4995 106 0.021221 0.002039
B20A4 B. Prof. Background 1. Ql Q20 4995 107 0.021421 0.002049
B20A6 B. Prof. Background 1. Ql - Q20 4995 107 0.021421 0.002049
B20A8 B. Prof. Background 1. Ql Q20 4995 107 0.021421. 0.002049
B20Al2 B. Prof. Background 1. Ql - Q20 4995 107 0.021421 0.002049
B20B13 B. Prof. Background 1. Ql - Q20 4995 107 0.021421 0.002049
C21A3 C. Resp./Workload 2. Q21 - Q40 4995 107 0.021421 0.002049
C21B2 C. Resp./Workload 2. Q21 Q40 4995 107 0.021421 0.002049
C21B3 C. Resp./Workload 2. Q21 - Q40 4995 107 0.021421 0.002049
C21B5 C. Resp./Workload 2. Q21 - Q40 4995 107 0.021421 0.002049
C21B6 C. Resp./Workload 2. Q21 - Q40 4995 107 0.021421 0.002049
B20A5 B. Prof. Background 1. Q1 - Q20 4995 108 0.021622 0.002058
B20B4 B. Prof. Background 1. Ql - Q20 4995 108 0.021622 0.002058
B20B6 B. Prof. Background 1. Ql - Q20 4995 108 0.021622 0.002058
B20B8 B. Prof. Background 1. Ql - Q20 4995 108 0.021622 0.002058
B20B12 B. Prof. Background 1. Ql - Q20 4995 108 0.021622 0.002058
C21A2 C. Resp./Workload 2. Q21 - Q40 4995 108 0.021622 0.002058
C21A6 C. Resp./Workload 2. Q21 - Q40 4995 108 0.021622 0.002058
C21B4 C. Resp./Workload 2. Q21 - Q40 4995 108 0.021622 0.002058
F53AK F. Sociodem. Chars. 3. Q41 -.Q60 277 6 0.021661 0.008747
B20A10 B. Prof. Background 1. Q1 - Q20 4995 109 0.021822 0.002067
B20B5 B. Prof. Background 1. Ql - Q20 4995 109 0.021822 0.002067
C21A4 C. Resp./Workload 2. Q21 - Q40 4995 109 0.021822 0.002067
B20A2 B. Prof. Background 1. Ql - Q20 4995 110 0.022022 0.002076
B20B2 B. Prof. Background 1. Ql - Q20 4995 110 0.022022 0.002076
B20B10 B. Prof. Background 1. Ql - Q20 4995 110 0.022022 0.002076
C23D2B C. Resp./Workload 2. Q21 - Q40 1036 23 0.022201 0.004578
B20A11 B. Prof. Background 1. Ql - Q20 4995 111 0.022222 0.002086
C21A5 C. Resp./Workload 2. Q21 - Q40 4995 111 0.022222 0.002086
B20B11 B. Prof. Background 1. Ql - Q20 4995 112 0.022422 0.002095
4
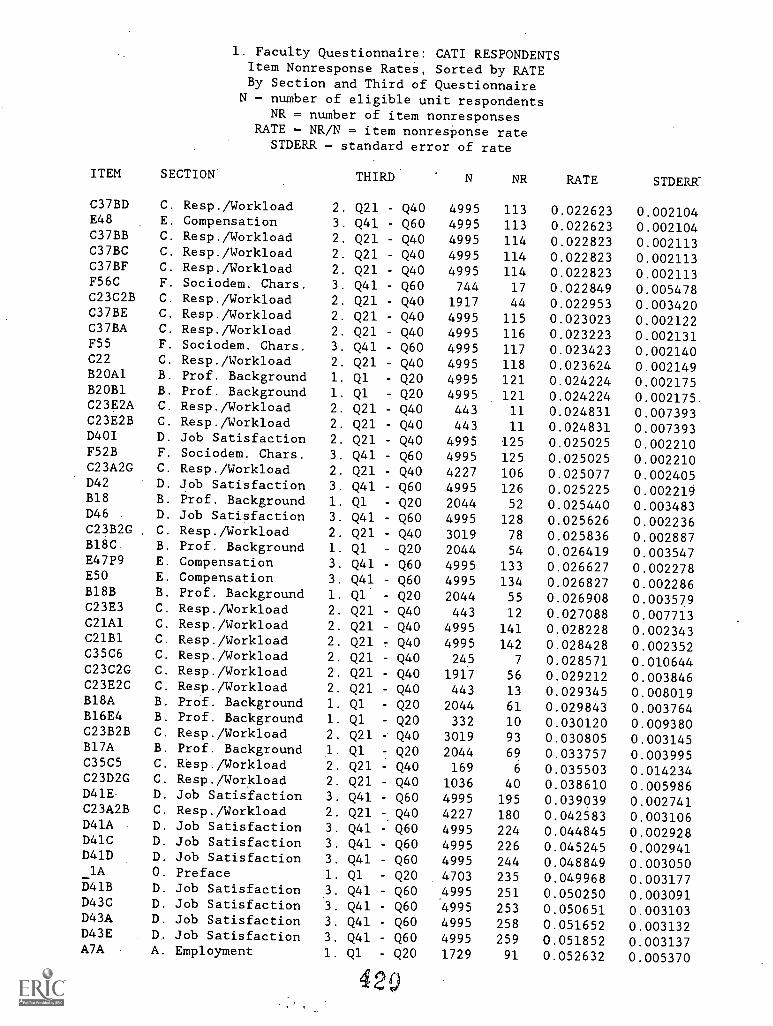
1. Faculty Questionnaire: CATI RESPONDENTSItem Nonresponse Rates, Sorted by RATEBy Section and Third of Questionnaire
N = number of eligible unit respondentsNR = number of item nonresponses
RATE = NR/N = item nonresponse rateSTDERR = standard error of rate
ITEM SECTION THIRD N NR RATE STDERR
C37BD C. Resp./Workload 2. Q21 Q40 4995 113 0.022623 0.002104E48 E. Compensation 3. Q41 - Q60 4995 113 0.022623 0.002104C37BB C. Resp./Workload 2. Q21 Q40 4995 114 0.022823 0.002113C37BC C. Resp./Workload 2. Q21 - Q40 4995 114 0.022823 0.002113C37BF C. Resp./Workload 2. Q21 - Q40 4995 114 0.022823 0.002113F56C F. Sociodem. Chars. 3. Q41 Q60 744 17 0.022849 0.005478C23C2B C. Resp./Workload 2. Q21 - Q40 1917 44 0.022953 0.003420C37BE C. Resp./Workload 2. Q21 - Q40 4995 115 0.023023 0.002122C37BA C. Resp./Workload 2. Q21 - Q40 4995 116 0.023223 0.002131F55 F. Sociodem. Chars. 3. Q41 - Q60 4995 117 0.023423 0.002140C22 C. Resp./Workload 2. Q21 - Q40 4995 118 0.023624 0.002149B20A1 B. Prof. Background 1. Ql - Q20 4995 121 0.024224 0.002175B20B1 B. Prof. Background 1. Ql - Q20 4995 121 0.024224 0.002175.C23E2A C. Resp./Workload 2. Q21 - Q40 443 11 0.024831 0.007393C23E2B C. Resp./Workload 2. Q21 - Q40 443 11 0.024831 0.007393D401 D. Job Satisfaction 2. Q21 - Q40 4995 125 0.025025 0.002210F52B F. Sociodem. Chars. 3. Q41 - Q60 4995 125 0.025025 0.002210C23A2G C. Resp./Workload 2. Q21 - Q40 4227 106 0.025077 0.002405D42 D. Job Satisfaction 3. Q41 - Q60 4995 126 0.025225 0.002219B18 B. Prof. Background 1. Q1 - Q20 2044 52 0.025440 0.003483D46 D. Job Satisfaction 3. Q41 - Q60 4995 128 0.025626 0.002236C23B2G C. Resp./Workload 2. Q21 - Q40 3019 78 0.025836 0.002887B18C B. Prof. Background 1. Q1 - Q20 2044 54 0.026419 0.003547E47P9 E. Compensation 3. Q41 - Q60 4995 133 0.026627 0.002278E50 E. Compensation 3. Q41 - Q60 4995 134 0.026827 0.002286B18B B. Prof. Background 1. Ql - Q20 2044 55 0.026908 0.003579C23E3 C. Resp./Workload 2. Q21 - Q40 443 12 0.027088 0.007713C21A1 C. Resp./Workload 2. Q21 - Q40 4995 141 0.028228 0.002343C21B1 C. Resp./Workload 2. Q21 - Q40 4995 142 0.028428 0.002352C35C6 C. Resp./Workload 2. Q21 - Q40 245 7 0.028571 0.010644C23C2G C. Resp./Workload 2. Q21 - Q40 1917 56 0.029212 0.003846C23E2C C. Resp./Workload 2. Q21 - Q40 443 13 0.029345 0.008019B18A B. Prof. Background 1. Ql - Q20 2044 61 0.029843 0.003764B16E4 B. Prof. Background 1. Q1 - Q20 332 10 0.030120 0.009380C23B2B C. Resp./Workload 2. Q21 - Q40 3019 93 0.030805 0.003145B17A B. Prof. Background 1. Q1 - Q20 2044 69 0.033757 0.003995C35C5 C. Resp./Workload 2. Q21 - Q40 169 6 0.035503 0.014234C23D2G C. Resp./Workload 2. Q21 - Q40 1036 40 0.038610 0.005986D41E- D. Job Satisfaction 3. Q41 - Q60 4995 195 0.039039 0.002741C23A2B C. Resp./Workload 2. Q21 Q40 4227 180 0.042583 0.003106D41A D. Job Satisfaction 3. Q41 - Q60 4995 224 0.044845 0.002928D41C D. Job Satisfaction 3. Q41 - Q60 4995 226 0.045245 0.002941D41D D. Job Satisfaction 3. Q41 - Q60 4995 244 0.048849 0.003050
O. Preface 1. Ql - Q20 4703 235 0.049968 0.003177_lAD41B D. Job Satisfaction 3. Q41 - Q60 4995 251 0.050250 0.003091D43C D. Job Satisfaction 3. Q41 - Q60 4995 253 0.050651 0.003103D43A D. Job Satisfaction 3. Q41 - Q60 4995 258 0.051652 0.003132D43E D. Job Satisfaction 3. Q41 - Q60 4995 259 0.051852 0.003137A7A A. Employment 1. Ql - Q20 1729 91 0.052632 0.005370
42o
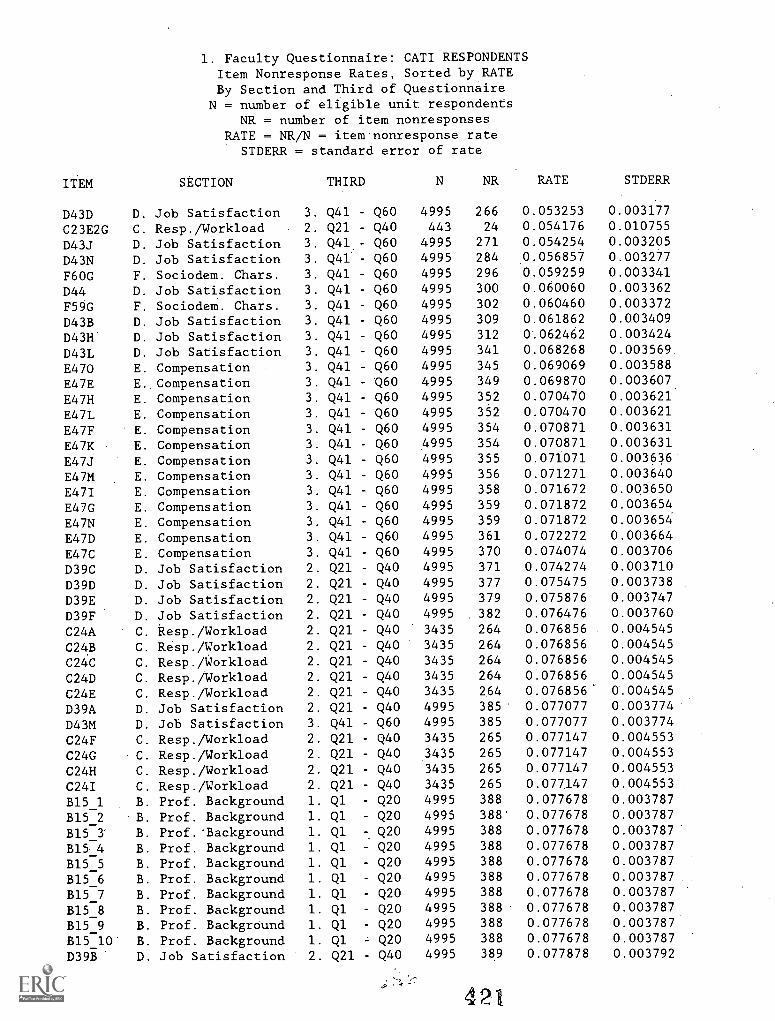
1. Faculty Questionnaire: CATI RESPONDENTSItem Nonresponse Rates, Sorted by RATEBy Section and Third of Questionnaire
N = number of eligible unit respondentsNR = number of item nonresponses
RATE = NR/N = item nonresponse rateSTDERR = standard error of rate
ITEM SECTION THIRD N NR RATE STDERR
D43D D. Job Satisfaction 3. Q41 Q60 4995 266 0.053253 0.003177
C23E2G C. Resp./Workload 2. Q21 Q40 443 24 0.054176 0.010755
D43J D. Job Satisfaction 3. Q41_- Q60 4995 271 0.054254 0.003205
D43N D. Job Satisfaction 3. Q41 Q60 4995 284 0.056857 0.003277
F6OG' F. Sociodem. Chars. 3. Q41 - Q60 4995 296 0.059259 0.003341
D44 D. Job Satisfaction 3. Q41 Q60 4995 300 0.060060 0.003362
F59G F. Sociodem. Chars. 3. Q41 Q60 4995 302 0.060460 0.003372
D43B D. Job Satisfaction 3. Q41 - Q60 4995 309 0.061862 0.003409
D43H D. Job Satisfaction 3. Q41 Q60 4995 312 0.062462 0.003424
D43L D. Job Satisfaction 3. Q41 Q60 4995 341 0.068268 0.003569
E470 E. Compensation 3. Q41 - Q60 4995 345 0.069069 0.003588
E47E E. Compensation 3. Q41 - Q60 4995 349 0.069870 0.003607
E47H E. Compensation 3. Q41 - Q60 4995 352 0.070470 0.003621
E47L E. Compensation 3. Q41 - Q60 4995 352 0.070470 0.003621
E47F E. Compensation 3. Q41 Q60 4995 354 0.070871 0.003631
E47K E. Compensation 3. Q41 - Q60 4995 354 0.070871 0.003631
E47J E. Compensation 3. Q41 Q60 4995 355 0.071071 0.003636
E47M E. Compensation 3. Q41 - Q60 4995 356 0.071271 0.003640
E47I E. Compensation 3. Q41 - Q60 4995 358 0.071672 0.003650
E47G E. Compensation 3. Q41 Q60 4995 359 0.071872 0.003654
E47N E. Compensation 3. Q41 - Q60 4995 359 0.071872 0.003654
E47D E. Compensation 3. Q41 - Q60 4995 361 0.072272 0.003664
E47C E. Compensation 3. Q41 - Q60 4995 370 0.074074 0.003706
D39C D. Job Satisfaction 2. Q21 Q40 4995 371 0.074274 0.003710
D39D D. Job Satisfaction 2. Q21 - Q40 4995 377 0.075475 0.003738
D39E D. Job Satisfaction 2. Q21 - Q40 4995 379 0.075876 0.003747
D39F D. Job Satisfaction 2. Q21 Q40 4995 382 0.076476 0.003760
C24A C. Resp. /Workload 2. Q21 Q40 3435 264 0.076856 0.004545
C24B C. Resp./Workload 2. Q21 - Q40 3435 264 0.076856 0.004545
C24C C. Resp./Workload 2. Q21 - Q40 3435 264 0.076856 0.004545
C24D C. Resp./Workload 2. Q21 - Q40 3435 264 0.076856 0.004545
C24E C. Resp./Workload 2. Q21 - Q40 3435 2,64 0.076856 0.004545
D39A D. Job Satisfaction 2. Q21 - Q40 4995 385 0.077077 0.003774
D43M D. Job Satisfaction 3. Q41 Q60 4995 385 0.077077 0.003774
C24F C. Resp./Workload 2. Q21 - Q40 3435 265 0.077147 0.004553
C24G C. Resp./Workload 2. Q21 - Q40 3435 265 0.077147 0.004553
C24H C. Resp./Workload 2. Q21 - Q40 3435 265 0.077147 0.00455.3
C24I C. Resp./Workload 2. Q21 - Q40 3435 265 0.077.147 0.004553
B15_1 B. Prof. Background 1. Q1 - Q20 4995 388 0.077678 0.003787
B15_2 B. Prof. Background 1. Q1 - Q20 4995 388 0.077678 0.003787
B15_3' B. Prof.' Background 1. Q1 Q20 4995 388 0.077678 0.003787
B15_4 B. Prof. Background 1. Ql Q20 4995 388 0.077678 0.003787
B15_5 B. Prof. Background 1. Q1 - Q20 4995 388 0.077678 0.003787
B15_6 B. Prof. Background 1. Q1 Q20 4995 388 0.077678 0.003787
B15_7 B. Prof. Background 1. Ql - Q20 4995 388 0.077678 0.003787
B158 B. Prof. Background 1. Q1 - Q20 4995 388 0.077678 0.003787
B15:9 B. Prof. Background 1. Ql - Q20 4995 388 0.077678 0.003787
B15_10 B. Prof. Background 1. Q1 - Q20 4995 388 0.077678 0.003787
D39B D. Job Satisfaction 2. Q21 - Q40 4995 389 0.077878 0.003792
421
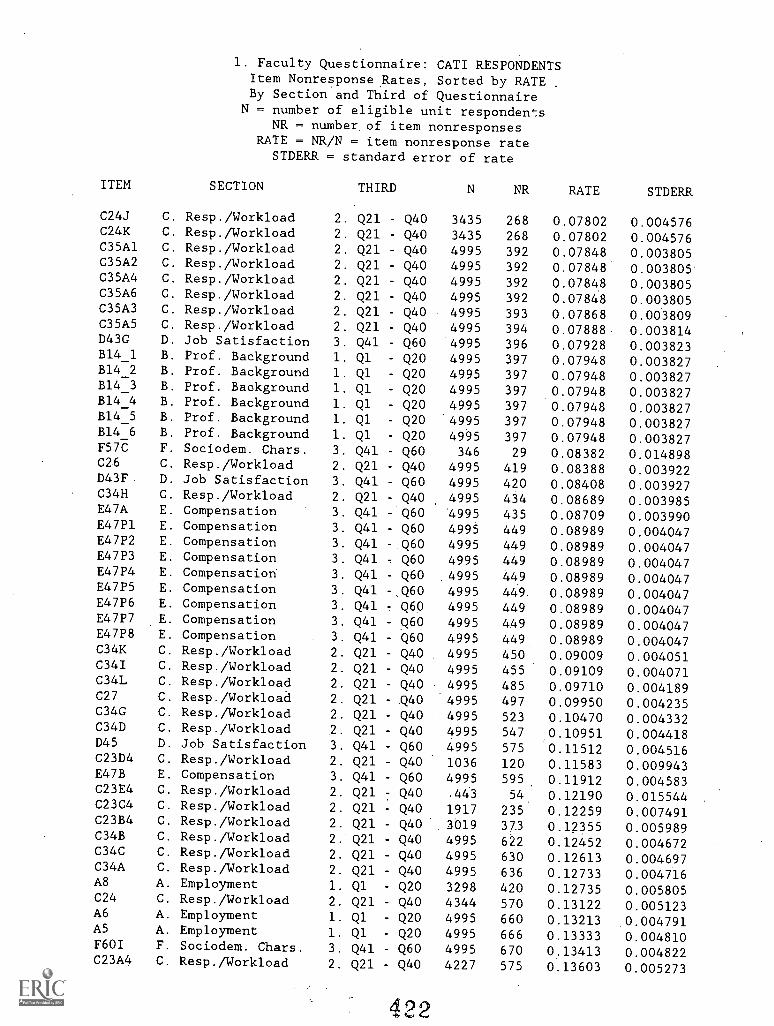
1. Faculty Questionnaire: CATI RESPONDENTSItem Nonresponse Rates, Sorted by RATE
.
By Section and Third of QuestionnaireN = number of eligible unit respondents
NR number, of item nonresponsesRATE = NR/N = item nonresponse rate
STDERR - standard error of rate
ITEM SECTION THIRD N NR RATE STDERR
C24J C. Resp./Workload 2. Q21 Q40 3435 268 0.07802 0.004576C24K C. Resp./Workload 2. Q21 - Q40 3435 268 0.07802 0.004576C35A1 C. Resp./Workload 2. Q21 - Q40 4995 392 0.07848 0.003805C35A2 C. Resp./Workload 2. Q21 - Q40 4995 392 0.07848 0.003805C35A4 C. Resp./Workload 2. Q21 - Q40 4995 392 0.07848 0.003805C35A6 C. Resp./Workload 2. Q21 - Q40 4995 392 0.07848 0.003805C35A3 C. Resp./Workload 2. Q21 - Q40 4995 393 0.07868 0.003809C35A5 C. Resp./Workload 2. Q21 - Q40 4995 394 0.07888 0.003814D43G D. Job Satisfaction 3. Q41 - Q60 4995 396 0.07928 0.003823B14_1 B. Prof. Background 1. Ql Q20 4995 397 0.07948 0.003827B14_2 B. Prof. Background 1. Q1 - Q20 4995 397 0.07948 0.003827B14_3 B. Prof. Background 1. Q1 Q20 4995 397 0.07948 0.003827B14_4 B. Prof. Background 1. Q1 - Q20 4995 397 0.07948 0.003827B14_5 B. Prof. Background 1. Q1 Q20 4995 397 0.07948 0.003827B14_6 B. Prof. Background 1. Ql Q20 4995 397 0.07948 0.003827F57Z F. Sociodem. Chars. 3. Q41 Q60 346 29 0.08382 0.014898C26 C. Resp./Workload 2. Q21 - Q40 4995 419 0.08388 0.003922D43F D. Job Satisfaction 3. Q41 - Q60 4995 420 0.08408 0.003927C34H C. Resp./Workload 2. Q21 Q40 4995 434 0.08689 0.003985E47A E. Compensation 3. Q41 Q60 4995 435 0.08709 0.003990E47P1 E. Compensation 3. Q41 - Q60 4995 449 0.08989 0.004047E47P2 E. Compensation 3. Q41 Q60 4995 449 0.08989 0.004047E47P3 E. Compensation 3. Q41 Q60 4995 449 0.08989 0.004047E47P4 E. Compensation 3. Q41 - Q60 4995 449 0.08989 0.004047E47P5 E. Compensation 3. Q41 -,Q60 4995 449. 0.08989 0.004047E47P6 E. Compensation 3. Q41 - Q60 4995 449 0.08989 0.004047E47P7 E. Compensation 3. Q41 - Q60 4995 449 0.08989 0.004047E47P8 E. Compensation 3. Q41 - Q60 4995 449 0.08989 0.004047C34K C. Resp./Workload 2. Q21 Q40 4995 450 0.09009 0.004051C34I C. Resp./Workload 2. Q21 - Q40 4995 455 0.09109 0.004071C34L C. Resp./Workload 2. Q21 - Q40 4995 485 0.09710 0.004189C27 C. Resp./Workload 2. Q21 Q40 4995 497 0.09950 0.004235C34G C. Resp./Workload 2. Q21 - Q40 4995 523 0.10470 0.004332C34D C. Resp./Workload 2. Q21 - Q40 4995 547 0.10951 0.004418D45 D. Job Satisfaction 3. Q41 - Q60 4995 575 0.11512 0.004516C23D4 C. Resp./Workload 2. Q21 - Q40 1036 120 0.11583 0.009943E47B E. Compensation 3. Q41 Q60 4995 595 0.11912 0.004583.C23E4 C. Resp./Workload 2. Q21 - Q40 .443 54 0.12190 0.015544C23C4 C. Resp./Workload 2. Q21 - Q40 1917 235 0.12259 0.007491C23B4 C. Resp./Workload 2. Q21 - Q40 3019 373 0.12355 0.005989C34B C. Resp./Workload 2. Q21 Q40 4995 622 0.12452 0.004672C34C C. Resp./Workload 2. Q21 Q40 4995 630 0.12613 0.004697C34A C. Resp./Workload 2. Q21 - Q40 4995 636 0.12733 0.004716A8 A. Employment 1. Ql - Q20 3298 420 0.12735 0.005805C24 C. Resp./Workload 2. Q21 - Q40 4344 570 0.13122 0.005123A6 A. Employment 1. Ql - Q20 4995 660 0.13213 0.004791AS A. Employment 1. Ql - Q20 4995 666 0.13333 0.004810F601 F. Sociodem. Chars. 3. Q41 - Q60 4995 670 0.13413 0.004822C23A4 C. Resp./Workload 2. Q21 - Q40 4227 575 0.13603 0.005273
422
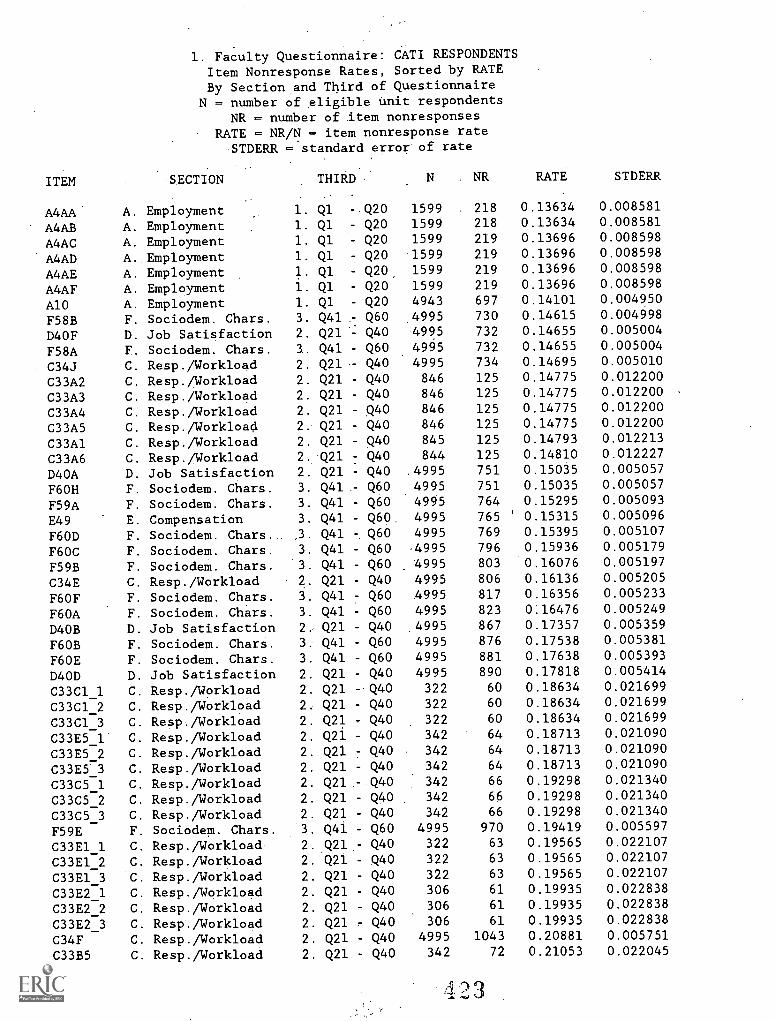
1. Faculty Questionnaire: CATI RESPONDENTSItem Nonresponse Rates, Sorted by RATEBy Section and Third of Questionnaire
N - number of eligible unit respondentsNR 7 number of item nonresponses
RATE 7 NR/N item nonresponse rateSTDERR =standard error of rate
ITEM SECTION THIRD N . NR RATE STDERR
A4AA A. Employment 1. Ql -.Q20 1599 218 0.13634 0.008581
A4AB A. Employment 1. Ql - Q20 1599 218 0.13634 0.008581
A4AC A. Employment 1. Ql - Q20 1599 219 0.13696 0.008598
A4AD A. Employment 1. Ql - Q20 1599 219 0.13696 0.008598
A4AE A. Employment 1. Q1 - Q20 1599 219 0.13696 0.008598
A4AF A. Employment 1. Ql - Q20 1599 219 0.13696 0.008598
A10 A. Employment 1. Ql - Q20 4943 697 0.14101 0.004950
F58B F. Sociodem. Chars. 3. Q41.- Q60 4995 730 0.14615 0.004998
D4OF D. Job Satisfaction 2. Q21 .: Q40 4995 732 0.14655 0.005004
F58A F. Sociodem. Chars. 3.. Q41 - Q60 4995 732 0.14655 0.005004
C34J C. Resp./Workload 2. Q21 - Q40 4995 734 0.14695 0.005010
C33A2 C. Resp./Workload 2. Q21 - Q40 846 125 0.14775 0.012200
C33A3 C. Resp./Workload 2. Q21 - Q40 846 125 0.14775 0.012200 ,
C33A4 C. Resp./Workload 2. Q21 - Q40 846 125 0.14775 0.012200
C33A5 C. Resp./Workload 2. Q21 - Q40 846 125 0.14775 0.012200
C33A1 C. Resp./Workload 2. Q21 - Q40 845 125 0.14793 0.012213
C33A6 C. Resp./Workload 2. Q21 - Q40 844 125 0.14810 0.012227
D40A D. Job Satisfaction 2. Q21 - Q40 4995 751 0.15035 0.005057
F6OH F. Sociodem. Chars. 3. Q41.- Q60 4995 751 0.15035 0.005057
F59A F. Sociodem. Chars. 3. Q41 - Q60 4995 764 0.15295 0.005093
E49 E. Compensation 3. Q41 - Q60 4995 765 ' 0.15315 0.005096
F6OD F. Sociodem. Chars. ,3. Q41 Q60 4995 769 0.15395 0.005107
F60C F. Sociodem. Chars. 3. Q41 Q60 4995 796 0.15936 0.005179
F59B F. Sociodem. Chars. 3. Q41 - Q60 4995 803 0.16076 0.005197
C34E C. Resp./Workload 2. Q21 - Q40 4995 806 0.16136 0.005205
F6OF F. Sociodem. Chars. 3. Q41 - Q60 .4995 817 0.16356 0.005233
F60A F. Sociodem. Chars. 3. Q41 - Q60 4995 823 0:16476 0.005249
D4OB D. Job Satisfaction 2 Q21 - Q40 4995 867 0.17357 0.005359
F6OB F. Sociodem. Chars. 3. Q41 - Q60 4995 876 0.17538 0.005381
F60E F. Sociodem. Chars. 3. Q41 - Q60 4995 881 0.17638 0.005393
D4OD D. Job Satisfaction 2. Q21 - Q40 4995 890 0.17818 0.005414
C33C1_1 C. Resp./Workload 2. Q21 -Q40 322 60 0.18634 0.021699
C33C1_2 C. Resp./Workload 2. Q21 - Q40 322 60 0.18634 0.021699
C33C1 3 C. Resp./Workload 2. Q21 - Q40 322 60 0.18634 0.021699_
C33E5 1 C. Resp./Workload 2. Q21 - Q40 342 64 0.18713 0.021090
C33E5:2 C. Resp./Workload 2. Q21 - Q40 342 64 0.18713 0.021090
C33E5 3 C. Resp./Workload 2. Q21 - Q40 342 64 0.18713 0.021090_
C33C5 1 C. Resp./Workload 2. Q21.- Q40 342 66 0.19298 0.021340
C33C5_2 C. Resp./Workload 2. Q21 - Q40 342 66 0.19298 0.021340
C33C5 3 C. Resp./Workload 2. Q21 - Q40 342 66 0.19298 0.021340_
F59E F. Sociodem. Chars. 3. Q41 - Q60 4995 970 0.19419 0.005597
C33E1_1 C. Resp./Workload 2. Q21 - Q40 322 63 0.19565 0.022107
C33E1 2 C. Resp./Workload 2. Q21 - Q40 322 63 0.19565 0.022107_
C33E1 3 C. Resp./Workload 2. Q21 - Q40 322 63 0.19565 0.022107
C33E2_ -1 C. Resp./Workload 2. Q21 - Q40 306 61 0.19935 0.022838
C33E2 2 C. Resp./Workload 2. Q21 - Q40 306 61 0.19935 0.022838
C33E2:3 C. Resp./Workload 2. Q21 - Q40 306 61 0.19935 0.022838
C34F C. Resp./Workload 2. Q21 - Q40 4995 1043 0.20881 0.005751
C33B5 C. Resp./Workload 2. Q21 - Q40 342 72 0.21053 0.022045
423
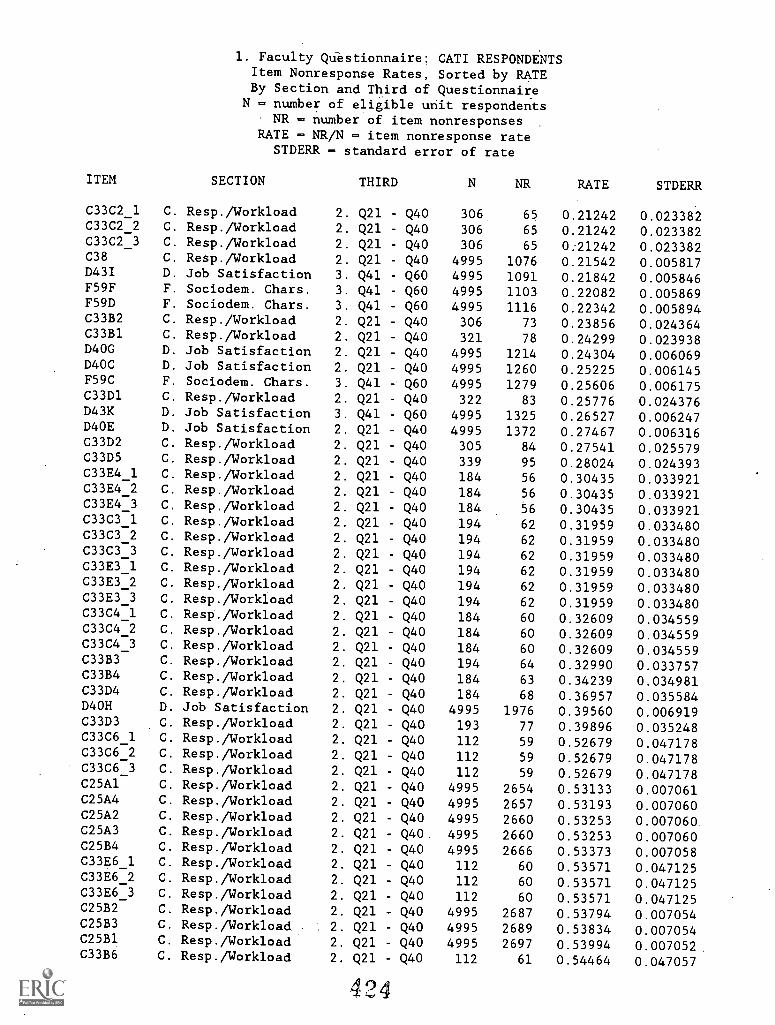
1. Faculty Questionnaire: CATI RESPONDENTSItem Nonresponse Rates, Sorted by RATEBy Section and Third of Questionnaire
N = number of eligible unit respondentsNR - number of item nonresponses
RATE - NR/N - item nonresponse rateSTDERR - standard error of rate
ITEM SECTION THIRD N NR RATE STDERR
C33C2_1 C. Resp./Workload 2. Q21 - Q40 306 65 0.21242 0.023382C33C2_2 C. Resp./Workload 2. Q21 - Q40 306 65 0.21242 0.023382C33C2 3 C. Resp./Workload 2. Q21 - Q40 306 65 0:21242 0.023382_C38 C. Resp./Workload 2. Q21 - Q40 4995 1076 0.21542 0.005817D43I D. Job Satisfaction 3. Q41 - Q60 4995 1091 0.21842 0.005846F59F F. Sociodem. Chars. 3. Q41 - Q60 4995 1103 0.22082 0.005869F59D F. Sociodem. Chars. 3. Q41 - Q60 4995 1116 0.22342 0.005894C33B2 C. Resp./Workload 2. Q21 - Q40 306 73 0.23856 0.024364C33B1 C. Resp./Workload 2. Q21 - Q40 321 78 0.24299 0.023938D4OG D. Job Satisfaction 2. Q21 - Q40 4995 1214 0.24304 0.006069D40C D. Job Satisfaction 2. Q21 - Q40 4995 1260 0.25225 0.006145F59C F. Sociodem. Chars. 3. Q41 - Q60 4995 1279 0.25606 0.006175C33D1 C. Resp./Workload 2. Q21 - Q40 322 83 0.25776 0.024376D43K D. Job Satisfaction 3. Q41 - Q60 4995 1325 0.26527 0.006247D4OE D. Job Satisfaction 2. Q21 - Q40 4995 1372 0.27467 0.006316C33D2 C. Resp./Workload 2. Q21 - Q40 305 84 0.27541 0.025579C33D5 C. Resp./Workload 2. Q21 - Q40 339 95 0.28024 0.024393C33E4 1 C. Resp./Workload 2. Q21 - Q40 184 56 0.30435 0.033921_C33E4 2 C. Resp./Workload 2. Q21 - Q40 184 56 0.30435 0.033921_C33E4 3 C. Resp./Workload 2. Q21 - Q40 184 56 0.30435 0.033921_C33C3 1 C. Resp./Workload 2. Q21 - Q40 194 62 0.31959 0.033480C33C3 -2 C. Resp./Workload 2. Q21 - Q40 194 62 0.31959 0.033480_C33C3 3 C. Resp./Workload 2. Q21 - Q40 194 62 0.31959 0.033480C33E3-1- C. Resp./Workload 2. Q21 - Q40 194 62 0.31959 0.033480C33E3 2 C. Resp./Workload 2. Q21 - Q40 194 62 0.31959 0.033480_C33E3 3 C. Resp./Workload 2. Q21 - Q40 194 62 0.31959 0.033480C33C4 -1 C. Resp./Workload 2. Q21 - Q40 184 60 0.32609 0.034559_C33C4 2 C. Resp./Workload 2. Q21 - Q40 184 60 0.32609 0.034559C33C4:3 C. Resp./Workload 2. Q21 - Q40 184 60 0.32609 0.034559C33B3 C. Resp./Workload 2. Q21 - Q40 194 64 0.32990 0.033757C33B4 C. Resp./Workload 2. Q21 - Q40 184 63 0.34239 0.034981C33D4 C. Resp./Workload 2. Q21 - Q40 184 68 0.36957 0.035584D4OH D. Job Satisfaction 2. Q21 - Q40 4995 1976 0.39560 0.006919C33D3 C. Resp./Workload 2. Q21 - Q40 193 77 0.39896 0.035248C33C6 1 C. Resp./Workload 2. Q21 - Q40 112 59 0.52679 0.047178_C33C6 2 C. Resp./Workload 2. Q21 - Q40 112 59 0.52679 0.047178C33C6 -- 3 C. Resp./Workload 2. Q21 - Q40 112 59 0.52679 0.047178C25A1 C. Resp./Workload 2. Q21 - Q40 4995 2654 0.53133 0.007061C25A4 C. Resp./Workload 2. Q21 - Q40 4995 2657 0.53193 0.007060C25A2 C. Resp./Workload 2. Q21 - Q40 4995 2660 0.53253 0.007060.C25A3 C. Resp./Workload 2. Q21 - Q40. 4995 2660 0.53253 0.007060C25B4 C. Resp./Workload 2. Q21 - Q40 4995 2666 0.53373 0.007058C33E6 1 C. Resp./Workload 2. Q21 - Q40 112 60 0.53571 0.047125_C33E6 2 C. Resp./Workload 2. Q21 - Q40 112 60 0.53571 0.047125C33E6-_ 3 C. Resp./Workload 2. Q21 - Q40 112 60 0.53571 0.047125C25B2 C. Resp./Workload 2. Q21 - Q40 4995 2687 0.53794 0.007054C25B3 C. Resp./Workload 2. Q21 - Q40 4995 2689 0.53834 0.007054C25B1 C. Resp./Workload 2. Q21 - Q40 4995 2697 0.53994 0.007052C33B6 C. Resp./Workload 2. Q21 - Q40 112 61 0.54464 0.047057
424
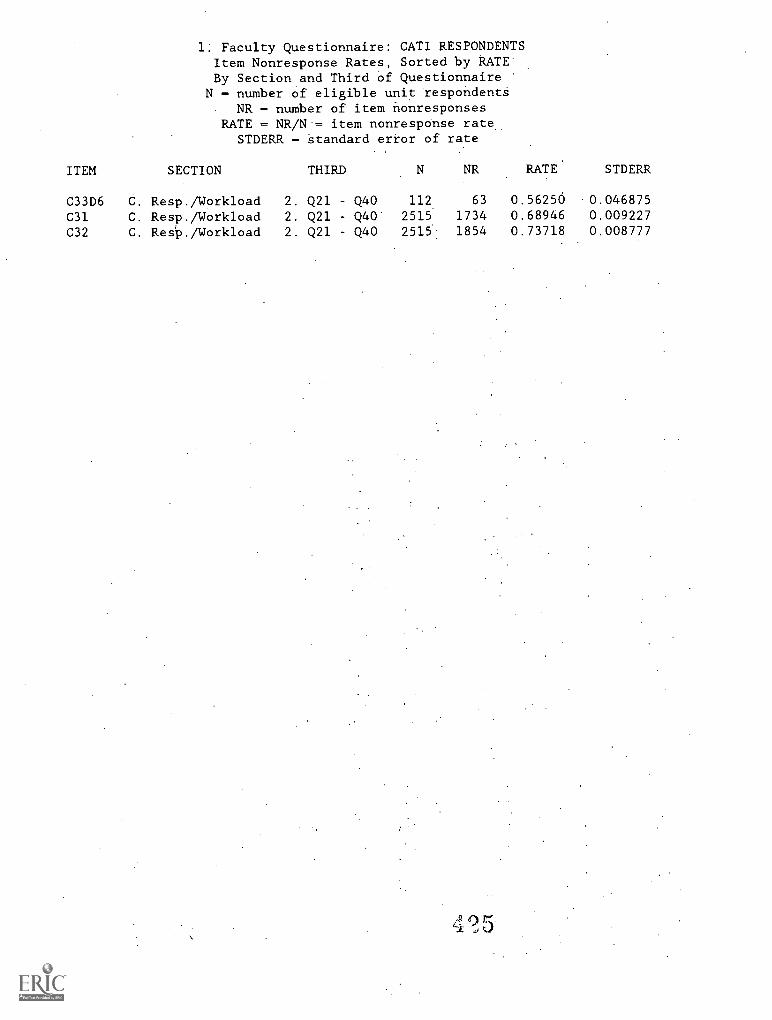
1: Faculty Questionnaire: CATI RESPONDENTSItem Nonresponse Rates, Sorted by RATE'By Section and Third of Questionnaire
N number of eligible unit respondentSNR = number of item nonresponses
RATE = NR/N-- item nonresponse rate.STDERR = standard error of rate
ITEM SECTION THIRD N NR RATE STDERR
C33D6 C. Resp./Workload 2. Q21 Q40 112 63 0.56250 0.046875
C31 C. Resp./Workload 2. Q21 - Q40 2515 1734 0.68946 0.009227
C32 C. Resp. /Workload 2. Q21 Q40 2515 1854 0.73718 0.008777
1993 National Study of Postsecondary FacultyMethodology Report
Appendix J
Critical Items and Nonresponse:1993 NSOPF Institution Questionnaire
Item Nonresponse Rates, Critical Items
Item Nonresponse Rates, Total Respondents
Item Nonresponse Rates, Greater Than 20 Percent
Item Nonresponse Rates, Greater Than 10 Percent
Item Nonresponse Rates, Sorted by Rate
426
1993 National Study of Postsecondary FacultyMethodology Report
Item Nonresponse Rates, Critical Items
427
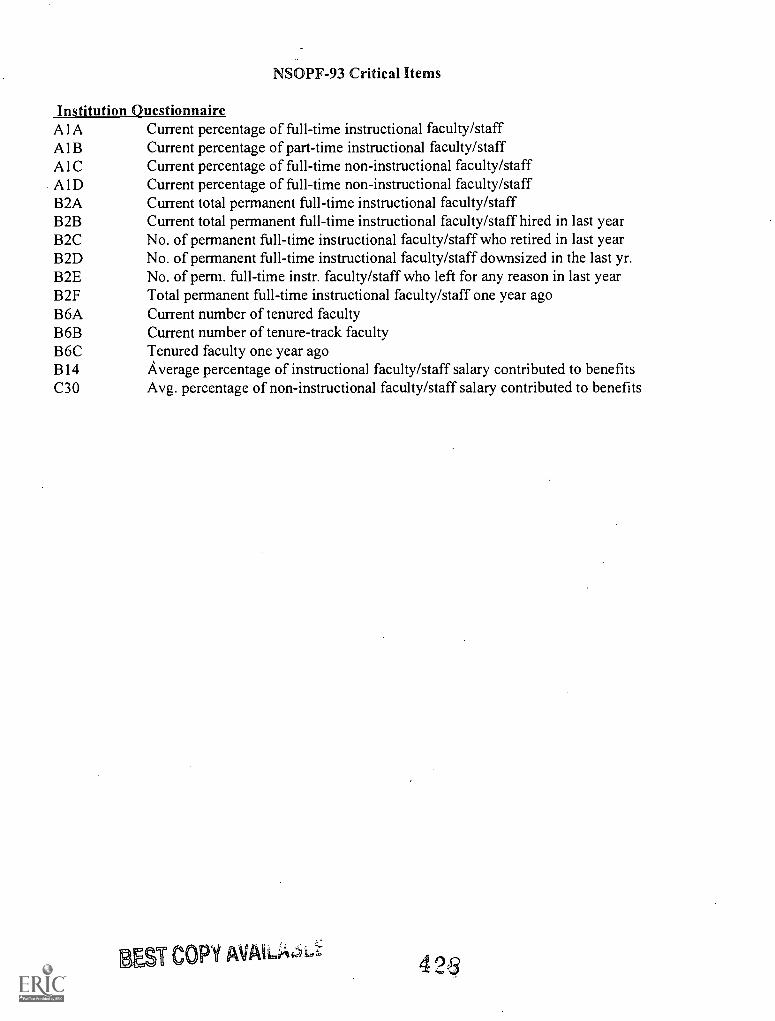
NSOPF-93 Critical Items
Institution QuestionnaireAlA Current percentage of full-time instructional faculty/staffA1B Current percentage of part-time instructional faculty/staffAlC Current percentage of full-time non-instructional faculty/staffA 1 D Current percentage of full-time non-instructional faculty/staffB2A Current total permanent full-time instructional faculty/staffB2B Current total permanent full-time instructional faculty/staff hired in last yearB2C No. of permanent full-time instructional faculty/staff who retired in last yearB2D No. of permanent full-time instructional faculty/staff downsized in the last yr.B2E No. of perm. full-time instr. faculty/staff who left for any reason in last yearB2F Total permanent full-time instructional faculty/staff one year agoB6A Current number of tenured facultyB6B Current number of tenure-track facultyB6C Tenured faculty one year agoB14 Average percentage of instructional faculty/staff salary contributed to benefitsC30 Avg. percentage of non-instructional faculty/staff salary contributed to benefits
COPY AVAILA,A,k 4 2 6
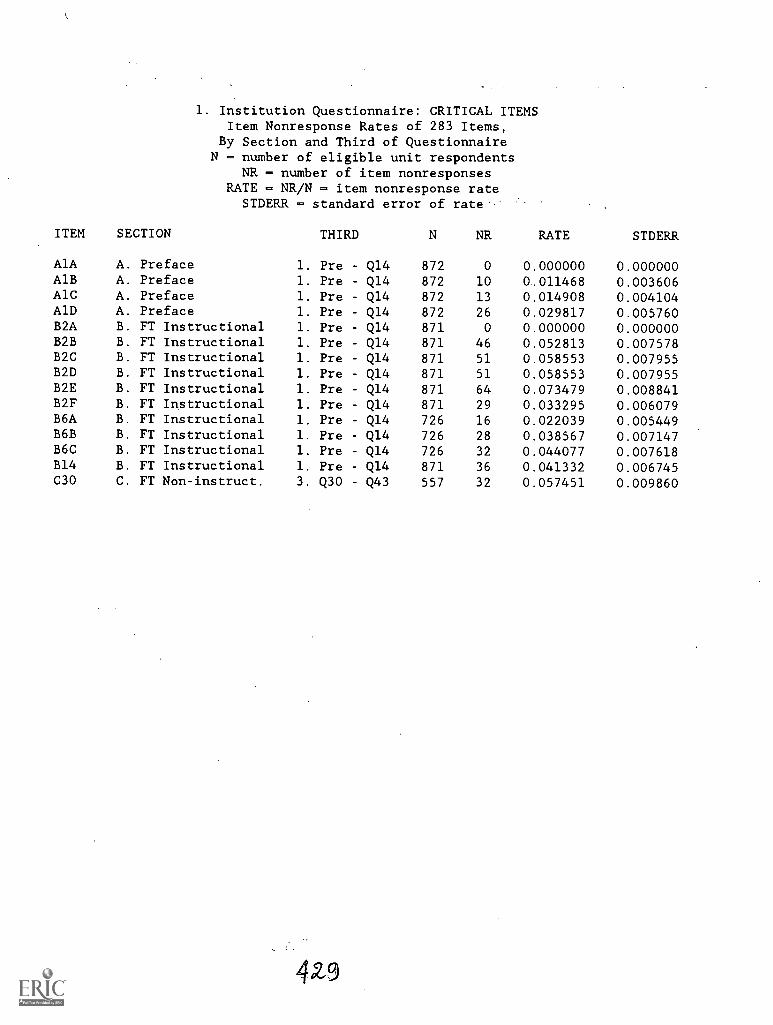
1. Institution Questionnaire: CRITICAL ITEMSItem Nonresponse Rates of 283 Items,
By Section and Third of QuestionnaireN - number of eligible unit respondents
NR = number of item nonresponsesRATE = NR/N - item nonresponse rate
STDERR = standard error of rate'
ITEM SECTION THIRD N NR RATE STDERR
AlA A. Preface 1. Pre - Q14 872 0 0.000000 0.000000A1B A. Preface 1. Pre - Q14 872 10 0.011468 0.003606A1C A. Preface 1. Pre - Q14 872 13 0.014908 0.004104
A. Preface 1. Pre - Q14 872 26 0.029817 0.005760B2A B. FT Instructional 1. Pre - Q14 871 0 0.000000 0.000000B2B B. FT Instructional 1. Pre - Q14 871 46 0.052813 0.007578B2C B. FT Instructional 1. Pre - Q14 871 51 0.058553 0.007955B2D B. FT Instructional 1. Pre - Q14 871 51 0.058553 0.007955B2E B. FT Instructional 1. Pre - Q14 871 64 0.073479 0.008841B2F B. FT Instructional 1. Pre - Q14 871 29 0.033295 0.006079B6A B. FT Instructional 1. Pre - Q14 726 16 0.022039 0.005449B6B B. FT Instructional 1. Pre - Q14 726 28 0.038567 0.007147B6C B. FT Instructional 1. Pre - Q14 726 32 0.044077 0.007618B14 B. FT Instructional 1. Pre - Q14 871 36 0.041332 0.006745C30 C. FT Non-instruct. 3. Q30 - Q43 557 32 0.057451 0.009860
4Z9
1993 National Study of Postsecondary FacultyMethodology Report
Item Nonresponse Rates, Total Respondents
430
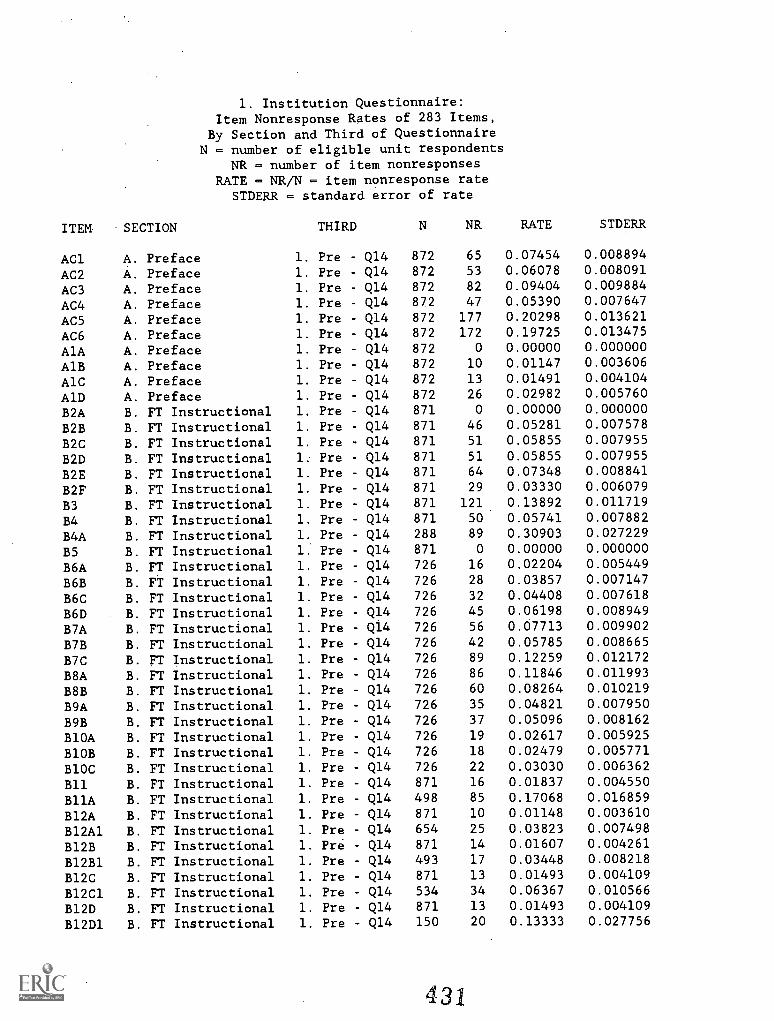
1. Institution Questionnaire:Item Nonresponse Rates of 283 Items,
By Section and Third of QuestionnaireN = number of eligible unit respondents
NR = number of item nonresponsesRATE - NR/N = item nonresponse rate
STDERR = standard error of rate
ITEM SECTION THIRD N NR RATE STDERR
AC1 A. Preface 1. Pre Q14 872 65 0.07454 0.008894
AC2 A. Preface 1. Pre - Q14 872 53 0.06078 0.008091
AC3 A. Preface 1. Pre - Q14 872 82 0.09404 0.009884
AC4 A. Preface 1. Pre - Q14 872 47 0.05390 0.007647
AC5 A. Preface 1. Pre - Q14 872 177 0.20298 0.013621
AC6 A. Preface 1. Pre - Q14 872 172 0.19725 0.013475
AlA A. Preface 1. Pre - Q14 872 0 0.00000 0.000000
A1B A. Preface 1. Pre - Q14 872 10 0.01147 0.003606
A1C A. Preface 1. Pre - Q14 872 13 0.01491 0.004104
A. Preface 1. Pre - Q14 872 26 0.02982 0.005760
B2A B. FT Instructional 1. Pre - Q14 871 0 0.00000 0.000000
B2B B. FT Instructional 1. Pre - Q14 871 46 0.05281 0.007578
B2C B. FT Instructional 1. Pre - Q14 871 51 0.05855 0.007955
B2D B. FT Instructional 1. Pre - Q14 871 51 0.05855 0.007955
B2E B. FT Instructional 1. Pre - Q14 871 64 0.07348 0.008841
B2F B. FT Instructional 1. Pre - Q14 871 29 0.03330 0.006079
B3 B. 1. Pre - Q14 871 121 0.13892 0.011719
B4 B. FT Instructional 1. Pre - Q14 871 50 0.05741 0.007882
B4A B. FT Instructional 1. Pre - Q14 288 89 0.30903 0.027229
B5 B. FT Instructional 1. Pre - Q14 871 0 0.00000 0.000000
B6A B. FT Instructional 1. Pre - Q14 726 16 0.02204 0.005449
B6B B. FT Instructional 1. Pre - Q14 726 28 0.03857 0.007147
B6C B. FT Instructional 1. Pre - Q14 726 32 0.04408 0.007618
B6D B. FT Instructional 1. Pre - Q14 726 45 0.06198 0.008949
B7A B. FT Instructional 1. Pre - Q14 726 56 0.07713 0.009902
B7B B. FT Instructional 1. Pre - Q14 726 42 0.05785 0.008665
B7C B. FT Instructional 1. Pre - Q14 726 89 0.12259 0.012172
B8A B. FT Instructional 1. Pre - Q14 726 86 0.11846 0.011993
B8B B. FT Instructional 1. Pre - Q14 726 60 0.08264 0.010219
B9A B. FT Instructional 1. Pre - Q14 726 35 0.04821 0.007950
B9B B. FT Instructional 1. Pre - Q14 726 37 0.05096 0.008162
810A B. FT Instructional 1. Pre - Q14 726 19 0.02617 0.005925
B108 B. FT Instructional 1. Pre - Q14 726 18 0.02479 0.005771
810C B. FT Instructional 1. Pre - Q14 726 22 0.03030 0.006362
B11 B. FT Instructional 1. Pre - Q14 871 16 0.01837 0.004550
811A B. FT Instructional 1. Pre - Q14 498 85 0.17068 0.016859
812A B. FT Instructional 1. Pre - Q14 871 10 0.01148 0.003610
812A1 B. FT Instructional 1. Pre - Q14 654 25 0.03823 0.007498
B128 B. FT Instructional 1. Pre - Q14 871 14 0.01607 0.004261
B1281 B. FT Instructional 1. Pre - Q14 493 17 0.03448 0.008218
812C B. FT Instructional 1. Pre - Q14 871 13 0.01493 0.004109
812C1 B. FT Instructional 1. Pre - Q14 534 34 0.06367 0.010566
812D B. FT Instructional 1. Pre - Q14 871 13 0.01493 0.004109
812D1 B. FT Instructional 1. Pre - Q14 150 20 0.13333 0.027756
431
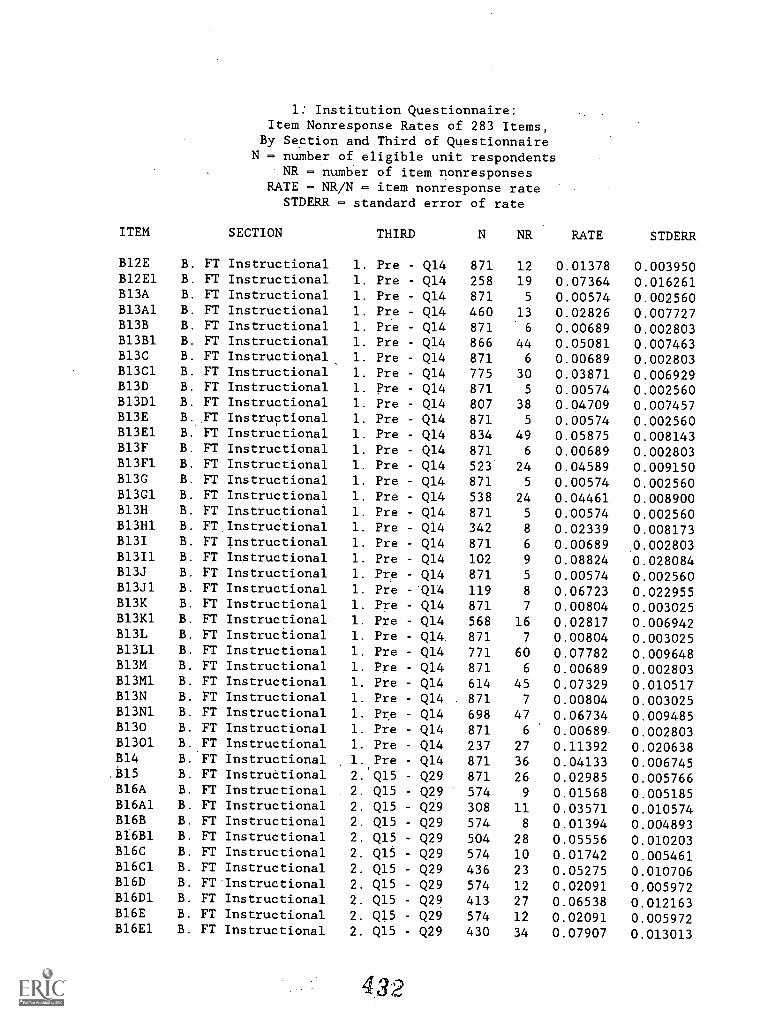
1: Institution Questionnaire:Item Nonresponse Rates of 283 Items,
By Section and Third of QuestionnaireN = number of eligible unit respondents
ITEM
NR = number of item nonresponsesRATE = NR/N - item nonresponse rate
STDERR = standard error of rate
SECTION THIRD N NR RATE STDERR
B12E B. FT Instructional 1. Pre - Q14 871 12 0.01378 0.003950B12E1 B. FT Instructional 1. Pre - Q14 258 19 0.07364 0.016261B13A B. FT Instructional 1. Pre - Q14 871 5 0.00574 0.002560B13A1 B. FT Instructional 1. Pre - Q14 460 13 0.02826 0.007727B13B B. FT Instructional 1. Pre - Q14 871 6 0.00689 0.002803B13B1 B. FT Instructional 1. Pre - Q14 866 44 0.05081 0.007463B13C B. FT Instructional 1. Pre - Q14 871 6 0.00689 0.002803B13C1 B. FT Instructional 1. Pre - Q14 775 30 0.03871 0.006929B13D B. FT Instructional 1. Pre - Q14 871 5 0.00574 0.002560B13D1 B. FT Instructional 1. Pre - Q14 807 38 0.04709 0.007457B13E B. FT Instructional 1. Pre - Q14 871 5 0.00574 0.002560B13E1 B. FT Instructional 1. Pre - Q14 834 49 0.05875 0.008143B13F B. FT Instructional 1. Pre - Q14 871 6 0.00689 0.002803B13F1 B. FT Instructional 1. Pre - Q14 523 24 0.04589 0.009150B13G B. FT Instructional 1. Pre - Q14 871 5 0.00574 0.002560B13G1 B. FT Instructional 1. Pre Q14 538 24 0.04461 0.008900B13H B. FT Instructional 1. Pre - Q14 871 5 0.00574 0.002560813H1 B. FT. Instructional 1. Pre - Q14 342 8 0.02339 0.008173B13I B. FT Instructional 1. Pre - Q14 871 6 0.00689 .0.002803B1311 B. FT Instructional 1. Pre - Q14 102 9 0.08824 0.028084B13J B. FT Instructional 1. Pre Q14 871 5 0.00574 0.002560B13J1 B. FT Instructional 1. Pre -"Q14 119 8 0.06723 0.022955B13K B. FT Instructional 1. Pre - Q14 871 7 0.00804 0.003025B13K1 B. FT Instructional 1. Pre - Q14 568 16 0.02817 0.006942B13L B. FT Instructional 1. Pre - Q14 871 7 0.00804 0.003025B13L1 B. FT Instructional 1. Pre - Q14 771 60 0.07782 0.009648B13M B. FT Instructional 1. Pre - Q14 871 6 0.00689 0.002803B13M1 B. FT Instructional 1. Pre - Q14 614 45 0.07329 0.010517B13N B. FT Instructional 1. Pre - Q14 871 7 0.00804 0.003025B13N1 B. FT Instructional 1. Pre - Q14 698 47 0.06734 0.009485B130 B. FT Instructional 1. Pre - Q14 871 6 0.00689 0.002803B1301 B. FT Instructional 1. Pre - Q14 237 27 0.11392 0.020638B14 B. FT Instructional 1. Pre Q14 871 36 0.04133 0.006745.B15 B. FT Instructional 2.'Q15 - Q29 871 26 0.02985 0.005766B16A B. FT Instructional 2. Q15 Q29 574 9 0.01568 0.005185B16A1 B. FT Instructional 2. Q15 - Q29 308 11 0.03571 0.010574816B B. FT Instructional 2. Q15 - Q29 574 8 0.01394 0.004893B16111 B. FT Instructional 2. Q15 - Q29 504 28 0.05556 0.0102031116C B. FT Instructional 2. Q15 - Q29 574 10 0.01742 0.005461B16C1 B. FT Instructional 2. Q15 - Q29 436 23 0.05275 0.010706B16D B. FT Instructional 2. Q15 - Q29 574 12 0.02091 0.0059721516D1 B. FT Instructional 2. Q15 - Q29 413 27 0.06538 0.012163B16E B. FT Instructional 2. Q15 - Q29 574 12 0.02091 0.005972B16E1 B. FT Instructional 2. Q15 - Q29 430 34 0.07907 0.013013
432
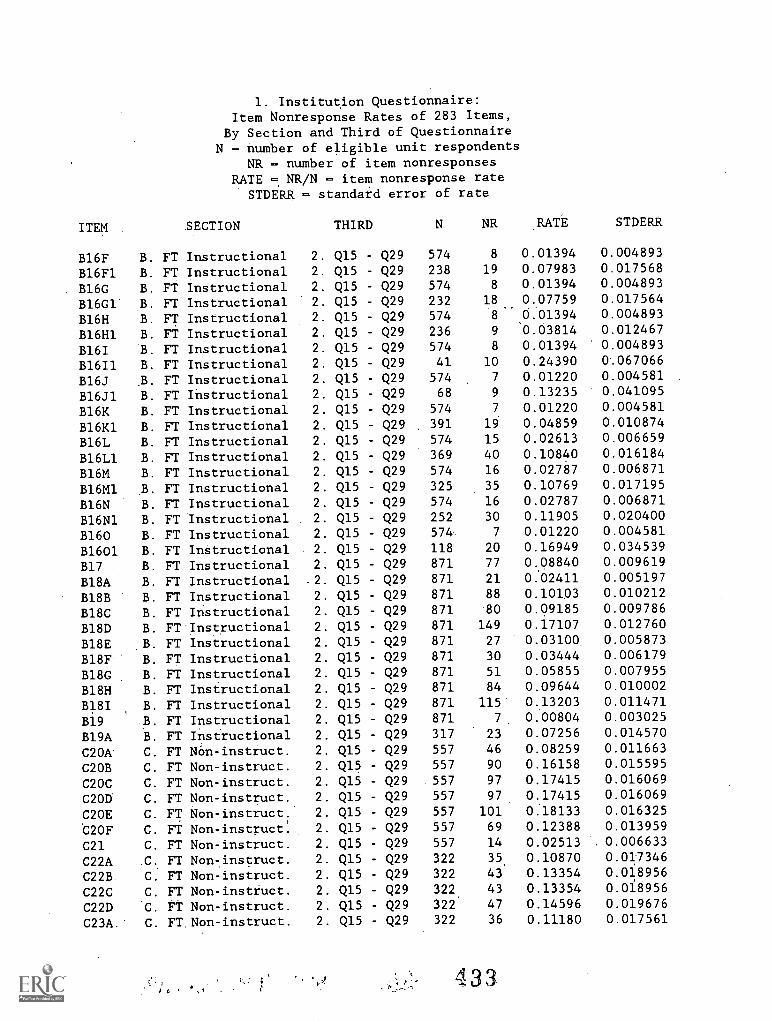
1. Institution Questionnaire:Item Nonresponse Rates of 283 Items,
By Section and Third of QuestionnaireN = number of eligible unit respondents
NR - number of item nonresponsesRATE 7 NR/N = item nonresponse rate
STDERR - standard error of rate
ITEM SECTION THIRD N NR RATE STDERR
B16F B. FT Instructional 2. Q15 - Q29 574 8 0.01394 0.004893
B16F1 B. FT Instructional 2. Q15 - Q29 238 19 0.07983 0.017568
B16G B. FT Instructional 2. Q15 - Q29 574 8 0.01394 0.004893
B16G1 B. FT Instructional 2. Q15 Q29 232 18 0.07759 0.017564
B16H B. FT Instructional 2. Q15 - Q29 574 8 0.01394 0.004893
B16H1 B. FT Instructional 2. Q15 - Q29 236 9 0.03814 0.012467
B16I B. FT Instructional 2. Q15 - Q29 574 8 0.01394 0.004893
B1611 B. FT Instructional 2. Q15 - Q29 41 10 0.24390 0.067066
B16J ,B. FT Instructional 2. Q15 - Q29 574 7 0.01220 0.004581
B16J1 B. FT Instructional 2. Q15 - Q29 68 9 0.13235 0.041095
B16K B. FT Instructional 2. Q15 - Q29 574 7 0.01220 0.004581
B16K1 B. FT Instructional 2. Q15 - Q29 391 19 0.04859 0.010874
B16L B. FT Instructional 2. Q15 - Q29 574 15 0.02613 0.006659
B16L1 B. FT Instructional 2. Q15 - Q29 369 40 0.10840 0.016184
B16M B. FT Instructional 2. Q15 - Q29 574 16 0.02787 0.006871
B16M1 .B. FT Instructional 2. Q15 - Q29 325 35 0.10769 0.017195
B16N B. FT Instructional 2. Q15 - Q29 574 16 0.02787 0.006871
B16N1 B. FT Instructional 2. Q15 - Q29 252 30 0.11905 0.020400
B160 B. FT Instructional 2. Q15 - Q29 574 7 0.01220 0.004581
B1601 B. FT Instructional 2. Q15 - Q29 118 20 0.16949 0.034539
B17 B. FT Instructional 2. Q15 - Q29 871 77 0.08840 0.009619
B18A B. FT Instructional 2. Q15 - Q29 871 21 0.02411 0.005197
B18B B. FT Instructional 2. Q15 - Q29 871 88 0.10103 0.010212
B18C B. FT Instructional 2. Q15 - Q29 871 80 0.09185 0.009786
B18D B. FT Instructional 2. Q15 - Q29 871 149 0.17107 0.012760
B18E B. FT Instructional 2. Q15 - Q29 871 27 0.03100 0.005873
B18F B. FT Instructional 2. Q15 - Q29 871 30 0.03444 0.006179
B18G B. FT Instructional 2. Q15 - Q29 871 51 0.05855 0.007955
B18H B. FT Instructional 2. Q15 - Q29 871 84 0.09644 0.010002
B18I B. FT Instructional 2. Q15 - Q29 871 115 0.13203 0.011471
B19 B. FT Instructional 2. Q15 - Q29 871 7 0.00804 0.003025
B19A B. FT Instructional 2. Q15 - Q29 317 23 0.07256 0.014570
C20A C. FT Non-instruct. 2. Q15 - Q29 557 46 0.08259 0.011663
C2OB C. FT Non-instruct. 2. Q15 - Q29 557 90 0.16158 0.015595
C20C C. FT Non-instruct. 2. Q15 - Q29 557 97 0.17415 0.016069
C2OD C. FT Non-instruct. 2. Q15 - Q29 557 97 0.17415 0.016069
C20E C. FT Non-instruct 2. Q15 - Q29 557 101 0.18133 0.016325
C2OF C. FT Non-instruct. 2. Q15 - Q29 557 69 0.12388 0.013959
C21 C. FT Non-instruct. 2. Q15 - Q29 557 14 0.02513 0.006633
C22A C. FT Non-instruct. 2. Q15 - Q29 322 35 0.10870 0.017346
C22B C. FT Non-instruct. 2. Q15 - Q29 322 43 0.13354 0.018956
C22C C. FT Non-instiuct. 2. Q15 - Q29 322 43 0.13354 0.018956
C22D C. FT Non-instruct. 2. Q15 - Q29 322' 47 0.14596 0.019676
C23A. C. FT Non-instruct. 2. Q15 - Q29 322 36 0.11180 0.017561
433
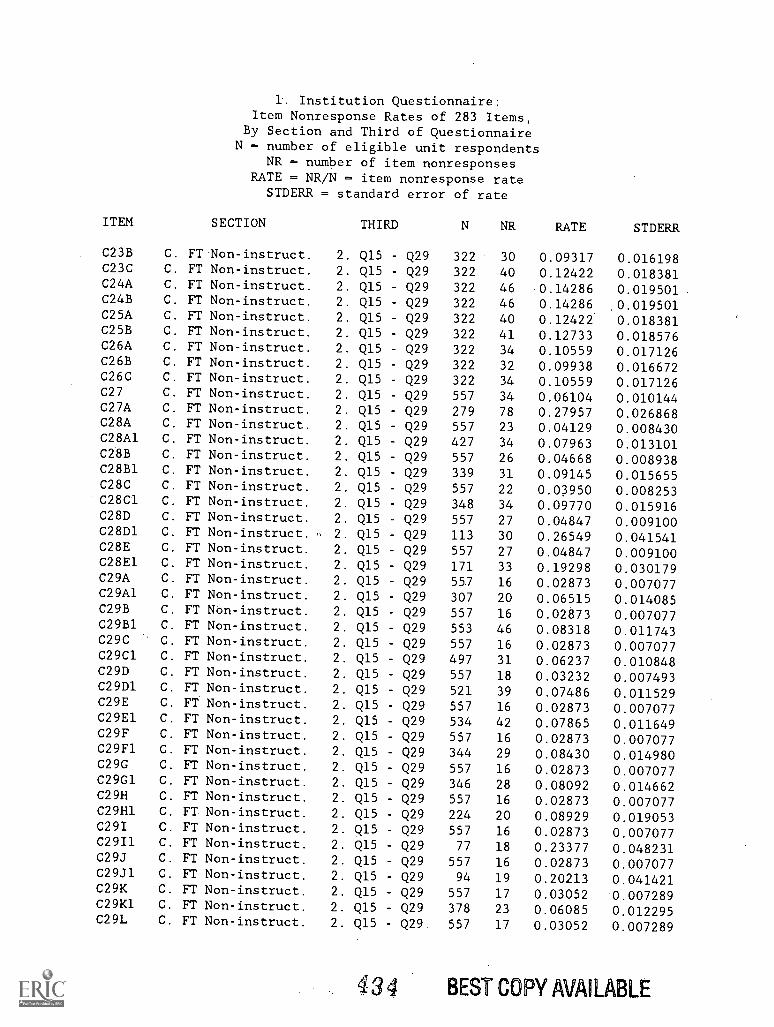
1. Institution Questionnaire:Item Nonresponse Rates of 283 Items,
By Section and Third of QuestionnaireN = number of eligible unit respondents
NR = number of item nonresponsesRATE = NR/N = item nonresponse rate
STDERR = standard error of rate
ITEM SECTION THIRD N NR RATE STDERR
C23B C. FT Non-instruct. 2. Q15 - Q29 322 30 0.09317 0.016198C23C C. FT Non-instruct. 2. Q15 Q29 322 40 0.12422 0.018381C24A C. FT Non-instruct. 2. Q15 - Q29 322 46 0.14286 0.019501C24B C. FT Non-instruct. 2. Q15 - Q29 322 46 0.14286 0.019501C25A C. FT Non-instruct. 2. Q15 Q29 322 40 0.12422 0.018381C25B C. FT Non-instruct. 2. Q15 - Q29 322 41 0.12733 0.018576C26A C. FT Non-instruct. 2. Q15 Q29 322 34 0.10559 0.017126C26B C. FT Non-instruct. 2. Q15 - Q29 322 32 0.09938 0.016672C26C C. FT Non-instruct. 2. Q15 Q29 322 34 0.10559 0.017126C27 C. FT Non-instruct. 2. Q15 Q29 557 34 0.06104 0.010144C27A C. FT Non-instruct. 2. Q15 Q29 279 78 0.27957 0.026868C28A C. FT Non-instruct. 2. Q15 - Q29 557 23 0.04129 0.008430C28A1 C. FT Non-instruct. 2. Q15 Q29 427 34 0.07963 0.013101C28B C. FT Non-instruct. 2. Q15 Q29 557 26 0.04668 0.008938C28131 C. FT Non-instruct. 2. Q15 Q29 339 31 0.09145 0.015655C28C C. FT Non-instruct. 2. Q15 - Q29 557 22 0.03950 0.008253C28C1 C. FT Non-instruct. 2. Q15 Q29 348 34 0.09770 0.015916C28D C. FT Non-instruct. 2. Q15 Q29 557 27 0.04847 0.009100C28D1 C. FT Non-instruct. 2. Q15 - Q29 113 30 0.26549 0.041541C28E C. FT Non-instruct. 2. Q15 Q29 557 27 0.04847 0.009100C28E1 C. FT Non-instruct. 2. Q15 - Q29 171 33 0.19298 0.030179C29A C. FT Non-instruct. 2. Q15 Q29 557 16 0.02873 0.007077C29A1 C. FT Non-instruct. 2. Q15 - Q29 307 20 0.06515 0.014085C29B C. FT Non-instruct. 2. Q15 - Q29 557 16 0.02873 0.007077C2981 C. FT Non-instruct. 2. Q15 - Q29 553 46 0.08318 0.011743C29C C. FT Non-instruct. 2. Q15 - Q29 557 16 0.02873 0.007077C29C1 C. FT Non-instruct. 2. Q15 - Q29 497 31 0.06237 0.010848C29D C. FT Non-instruct. 2. Q15 Q29 557 18 0.03232 0.007493C29D1 C. FT Non-instruct. 2. Q15 Q29 521 39 0.07486 0.011529C29E C. FT Non-instruct, 2. Q15 Q29 557 16 0.02873 0.007077C29E1 C. FT Non-instruct. 2. Q15 - Q29 534 42 0.07865 0.011649C29F C. FT Non-instruct. 2. Q15 - Q29 557 16 0.02873 0.007077C29F1 C. FT Non-instruct. 2. Q15 - Q29 344 29 0.08430 0.014980C29G C. FT Non-instruct. 2. Q15 - Q29 557 16 0.02873 0.007077C29G1 C. FT Non-instruct. 2. Q15 - Q29 346 28 0.08092 0.014662C29H C. FT Non-instruct. 2. Q15 Q29 557 16 0.02873 0.007077C29H1 C. FT Non-instruct. 2. Q15 - Q29 224 20 0.08929 0.019053C29I C. FT Non-instruct. 2. Q15 - Q29 557 16 0.02873 0.007077C29I1 C. FT Non-instruct. 2. Q15 - Q29 77 18 0.23377 0.048231C29J C. FT Non-instruct. 2. Q15 Q29 557 16 0.02873 0.007077C29J1 C. FT Non-instruct. 2. Q15 Q29 94 19 0.20213 0.041421C29K C. FT Non-instruct. 2. Q15 Q29 557 17 0.03052 0.007289C29K1 C. FT Non-instruct. 2. Q15 - Q29 378 23 0.06085 0.012295C29L C. FT Non-instruct. 2. Q15 - Q29 557 17 0.03052 0.007289
434 BEST COPY AVAILABLE
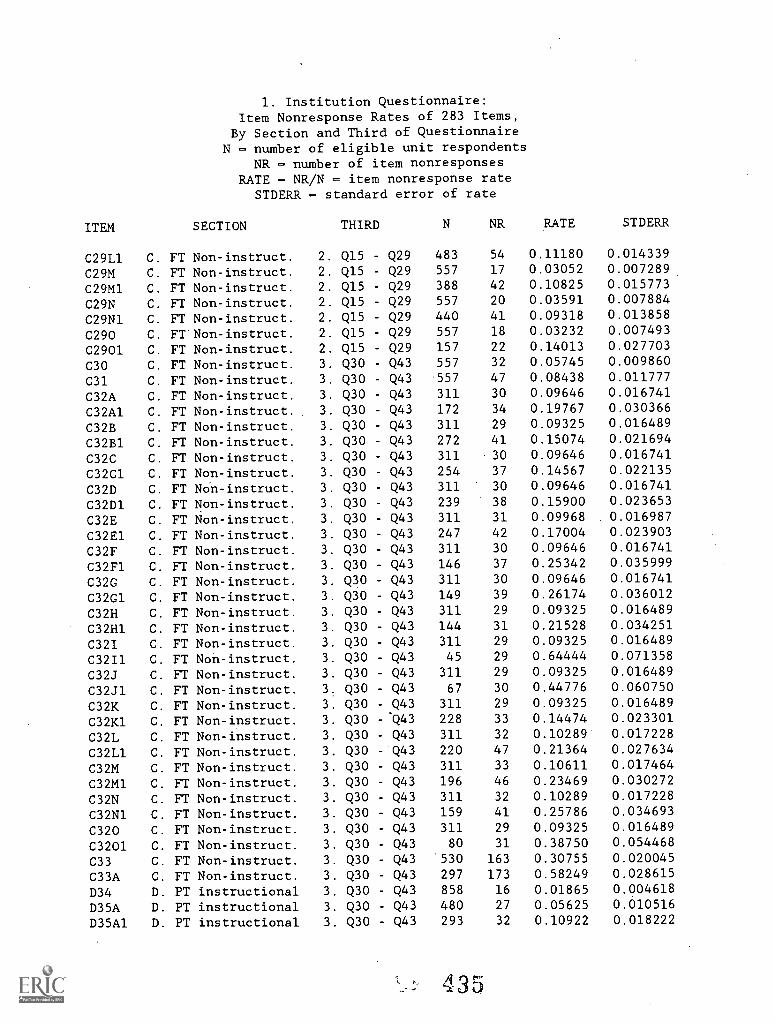
1. Institution Questionnaire:Item Nonresponse Rates of 283 Items,
By Section and Third of QuestionnaireN - number of eligible unit respondents
NR = number of item nonresponsesRATE = NR/N = item nonresponse rate
STDERR = standard error of rate
ITEM SECTION THIRD N NR RATE STDERR
C29L1 C. FT Non-instruct. 2. Q15 Q29 483 54 0.11180 0.014339
C29M C. FT Non-instruct. 2. Q15 Q29 557 17 0.03052 0.007289
C29M1 C. FT Non-instruct. 2. Q15 - Q29 388 42 0.10825 0.015773
C29N C. FT Non-instruct. 2. Q15 - Q29 557 20 0.03591 0.007884
C29N1 C. FT Non-instruct. 2. Q15 Q29 440 41 0.09318 0.013858
C290 C. FT Non-instruct. 2. Q15 - Q29 557 18 0.03232 0.007493
C2901 C. FT Non-instruct. 2. Q15 - Q29 157 22 0.14013 0.027703
C30 C. FT Non-instruct. 3. Q30 - Q43 557 32 0.05745 0.009860
C31 C. FT Non-instruct. 3. Q30 - Q43 557 47 0.08438 0.011777
C32A C. FT Non-instruct. 3. Q30 Q43 311 30 0.09646 0.016741
C32A1 C. FT Non-instruct. 3. Q30 - Q43 172 34 0.19767 0.030366
C32B C. FT Non-instruct. 3. Q30 Q43 311 29 0.09325 0.016489
C32B1 C. FT Non-instruct. 3. Q30 - Q43 272 41 0.15074 0.021694
C32C C. FT Non-instruct. 3. Q30 - Q43 311 30 0.09646 0.016741
C32C1 C. FT Non-instruct. 3. Q30 Q43 254 37 0.14567 0.022135
C32D C. FT Non-instruct. 3. Q30 - Q43 311 30 0.09646 0.016741
C32D1 C. FT Non-instruct. 3. Q30 - Q43 239 38 0.15900 0.023653
C32E C. FT Non-instruct. 3. Q30 - Q43 311 31 0.09968 0.016987
C32E1 C. FT Non-instruct. 3. Q30 - Q43 247 42 0.17004 0.023903
C32F C. FT Non-instruct. 3. Q30 - Q43 311 30 0.09646 0.016741
C32F1 C. FT Non-instruct. 3. Q30 - Q43 146 37 0.25342 0.035999
C32G C. FT Non-instruct. 3. Q30 Q43 311 30 0.09646 0.016741
C32G1 C. FT Non-instruct. 3. Q30 - Q43 149 39 0.26174 0.036012
C32H C. FT Non-instruct. 3. Q30 - Q43 311 29 0.09325 0.016489
C32H1 C. FT Non-instruct. 3. Q30 Q43 144 31 0.21528 0.034251
C32I C. FT Non-instruct. 3. Q30 - Q43 311 29 0.09325 0.016489
C32I1 C. FT Non-instruct. 3. Q30 - Q43 45 29 0.64444 0.071358
C32J C. FT Non-instruct. 3. Q30 Q43 311 29 0.09325 0.016489
C32J1 C. FT Non-instruct. 3. Q30 - Q43 67 30 0.44776 0.060750
C32K C. FT Non-instruct. 3. Q30 - Q43 311 29 0.09325 0.016489
C32K1 C. FT Non-instruct. 3. Q30 -.0143 228 33 0.14474 0.023301
C32L C. FT Non-instruct. 3. Q30 - Q43 311 32 0.10289 0.017228
C32L1 C. FT Non-instruct. 3. Q30 - Q43 220 47 0.21364 0.027634
C32M C. FT Non-instruct. 3. Q30 - Q43 311 33 0.10611 0.017464
C32M1 C. FT Non-instruct. 3. Q30 - Q43 196 46 0.23469 0.030272
C32N C. FT Non-instruct. 3. Q30 - Q43 311 32 0.10289 0.017228
C32N1 C. FT Non-instruct. 3. Q30 - Q43 159 41 0.25786 0.034693
C320 C. FT Non-instruct. 3. Q30 - Q43 311 29 0.09325 0.016489
C3201 C. FT Non-instruct. 3. Q30 - Q43 80 31 0.38750 0.054468
C33 C. FT Non-instruct. 3. Q30 - Q43 530 163 0.30755 0.020045
C33A C. FT Non-instruct. 3. Q30 - Q43 297 173 0.58249 0.028615
D34 D. PT instructional 3. Q30 - Q43 858 16 0.01865 0.004618
D35A D. PT instructional 3. Q30 - Q43 480 27 0.05625 0.010516
D35A1 D. PT instructional 3. Q30 - Q43 293 32 0.10922 0.018222
435
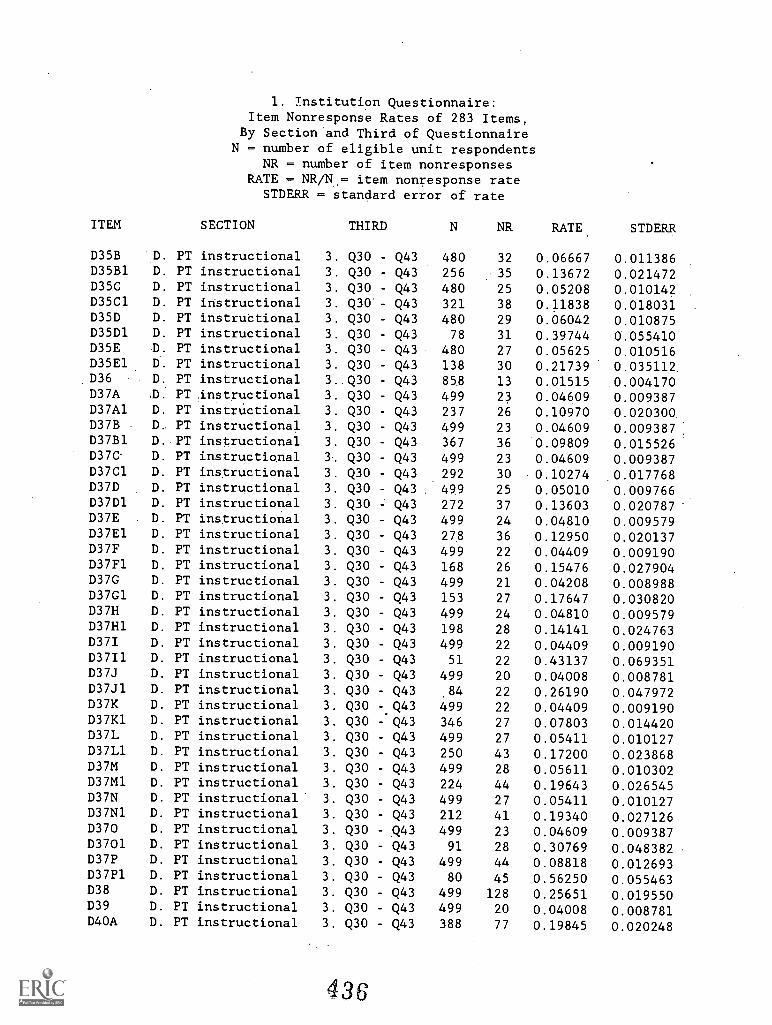
1. Institution Questionnaire:Item Nonresponse Rates of 283 Items,
By Section'and Third of QuestionnaireN = number of eligible unit respondents
NR = number of item nonresponsesRATE = NR/N,- item nonresponse rate
STDERR = standard error of rate
ITEM SECTION THIRD N NR RATE STDERR
D35B D. PT instructional 3. Q30 - Q43 480 32 0.06667 0.011386D35B1 D. PT instructional 3. Q30 - Q43 256 35 0.13672 0.021472D35C D. PT instructional 3. Q30 - Q43 480 25 0.05208 0.010142D35C1 D. PT instructional 3. Q30'- Q43 321 38 0.11838 0.018031D35D D. PT instructional 3. Q30 - Q43 480 29 0.06042 0.010875D35D1 D. PT instructional 3. Q30 - Q43 78 31 0.39744 0.055410D35E D. PT instructional 3. Q30 - Q43 480 27 0.05625 0.010516D35E1 D. PT instructional 3. Q30 - Q43 138 30 0.21739 0.035112D36 D. PT instructional 3..Q30 - Q43 858 13 0.01515 0.004170D37A D. PT ,instructional 3. Q30 - Q43 499 23 0.04609 0.009387D37A1 D. PT instructional 3. Q30 - Q43 237 26 0.10970 0.020300D37B D. PT instructional 3. Q30 - Q43 499 23 0.04609 0.009387D37B1 D. PT instructional 3. Q30 Q43 367 36 0.09809 0.015526D370 D. PT instructional 3. Q30 - Q43 499 23 0.04609 0.009387D37C1 D. PT instructional 3. Q30 - Q43 292 30 0.10274 0.017768D37D D. PT instructional 3. Q30 - Q43 499 25 0.05010 0.009766D37D1 D. PT instructional 3. Q30 - Q43 272 37 0.13603 0.020787D37E D. PT instructional 3. Q30 - Q43 499 24 0.04810 0.009579D37E1 D. PT instructional 3. Q30 Q43 278 36 0.12950 0.020137D37F D. PT instructional 3. Q30 - Q43 499 22 0.04409 0.009190D37F1 D. PT instructional 3. Q30 - Q43 168 26 0.15476 0.027904D37G D. PT instructional 3. Q30 - Q43 499 21 0.04208 0.008988D37G1 D. PT instructional 3. Q30 - Q43 153 27 0.17647 0.030820D37H D. PT instructional 3. Q30 - Q43 499 24 0.04810 0.009579D37H1 D. PT instructional 3. Q30 - Q43 198 28 0.14141 0.024763D37I D. PT instructional 3. Q30 - Q43 499 22 0.04409 0.009190D37I1 D. PT instructional 3. Q30 - Q43 51 22 0.43137 0.069351D37J D. PT instructional 3. Q30 - Q43 499 20 0.04008 0.008781D37J1 D. PT instructional 3. Q30 - Q43 .84 22 0.26190 0.047972D37K D. PT instructional 3. Q30 -.Q43 499 22 0.04409 0.009190D37K1 D. PT instructional 3. Q30 - Q43 346 27 0.07803 0.014420D37L D. PT instructional 3. Q30 - Q43 499 27 0.05411 0.010127D37L1 D. PT instructional 3. Q30 - Q43 250 43 0.17200 0.023868D37M D. PT instructional 3. Q30 - Q43 499 28 0.05611 0.010302D37M1 D. PT instructional 3. Q30 - Q43 224 44 0.19643 0.026545D37N D. PT instructional 3. Q30 - Q43 499 27 0.05411 0.010127D37N1 D. PT instructional 3. Q30 - Q43 212 41 0.19340 0.027126D370 D. PT instructional 3. Q30 - Q43 499 23 0.04609 0.009387D3701 D. PT instructional 3. Q30 - Q43 91 28 0.30769 0.048382D37P D. PT instructional 3. Q30 - Q43 499 44 0.08818 0.012693D37P1 D. PT instructional 3. Q30 - Q43 80 45 0.56250 0.055463D38 D. PT 'instructional 3. Q30 - Q43 499 128 0.25651 0.019550D39 D. PT instructional 3. Q30 - Q43 499 20 0.04008 0.008781D40A D. PT instructional 3. Q30 - Q43 388 77 0.19845 0.020248
436
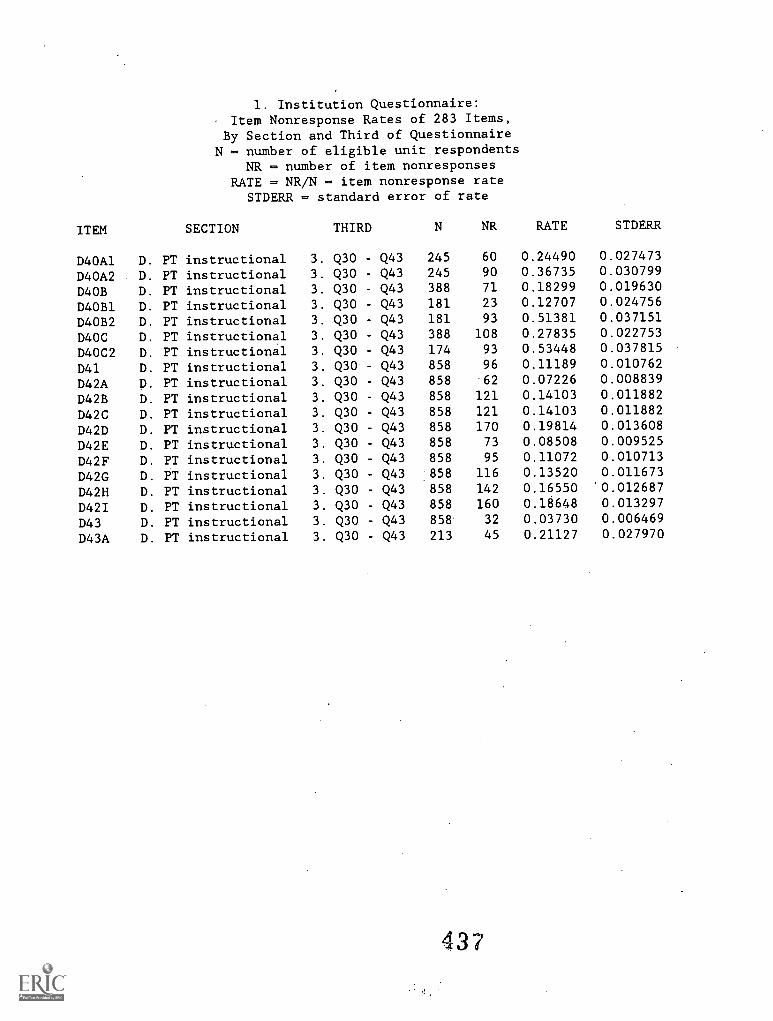
1. Institution Questionnaire:Item Nonresponse Rates of 283 Items,
By Section and Third of QuestionnaireN = number of eligible unit respondents
NR = number of item nonresponsesRATE = NR/N = item nonresponse rate
STDERR - standard error of rate
ITEM SECTION THIRD N NR RATE STDERR
D40A1 D. PT instructional 3. Q30 - Q43 245 60 0.24490 0.027473
D40A2 D. PT instructional 3. Q30 - Q43 245 90 0.36735 0.030799
D4OB D. PT instructional 3. Q30 - Q43 388 71 0.18299 0.019630
D40B1 D. PT instructional 3. Q30 - Q43 181 23 0.12707 0.024756
D40B2 D. PT instructional 3. Q30 - Q43 181 93 0.51381 0.037151
D40C D. PT instructional 3. Q30 - Q43 388 108 0.27835 0.022753
D40C2 D. PT instructional 3. Q30 - Q43 174 93 0.53448 0.037815
D41 D. PT instructional 3. Q30 - Q43 858 96 0.11189 0.010762
D42A D. PT instructional 3. Q30 - Q43 858 62 0.07226 0.008839
D42B D. PT instructional 3. Q30 Q43 858 121 0.14103 0.011882
D42C D. PT instructional 3. Q30 - Q43 858 121 0.14103 0.011882
D42D D. PT instructional 3. Q30 - Q43 858 170 0.19814 0.013608
D42E D. PT instructional 3. Q30 - Q43 858 73 0.08508 0.009525
D42F D. PT instructional 3. Q30 - Q43 858 95 0.11072 0.010713
D42G D. PT instructional 3. Q30 - Q43 858 116 0.13520 0.011673
D42H D. PT instructional 3. Q30 - Q43 858 142 0.16550 0.012687
D42I D. PT instructional 3. Q30 - Q43 858 160 0.18648 0.013297
D43 D. PT instructional 3. Q30 - Q43 858 32 0.03730 0.006469
D43A D. PT instructional 3. Q30 - Q43 213 45 0.21127 0.027970
437
1993 National Study of Postsecondary FacultyMethodology Report
Item Nonresponse Rates, Greater Than 20 Percent
438
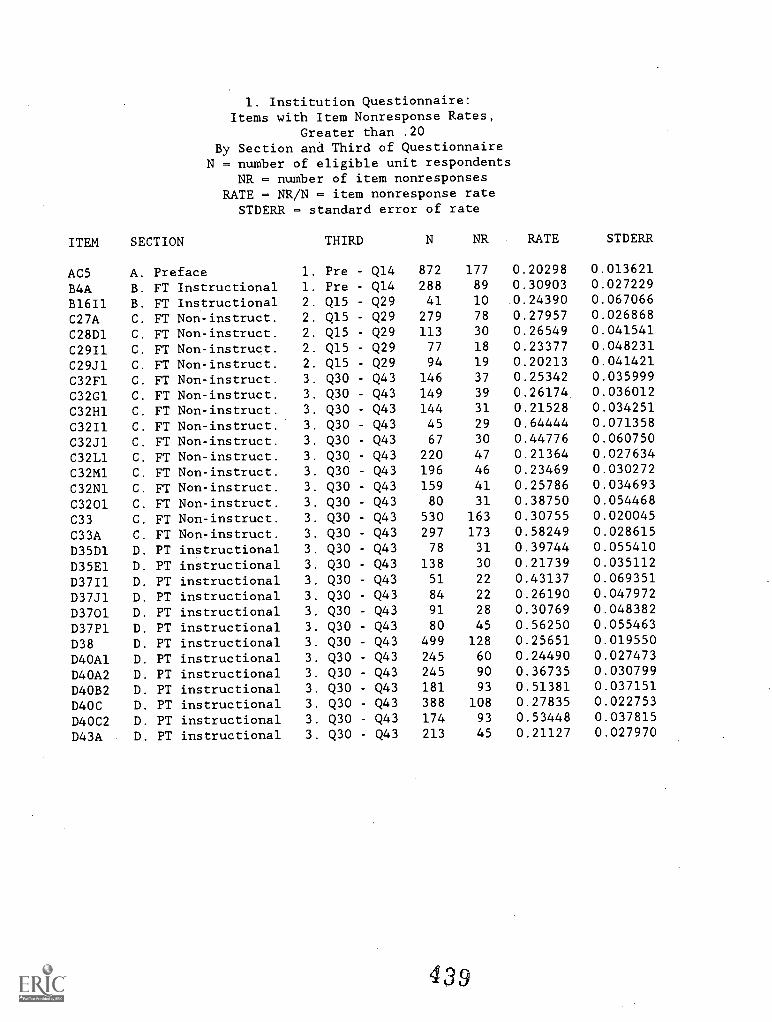
1. Institution Questionnaire:Items with Item Nonresponse Rates,
Greater than .20By Section and Third of Questionnaire
N - number of eligible unit respondentsNR = number of item nonresponses
RATE = NR/N = item nonresponse rateSTDERR - standard error of rate
ITEM SECTION THIRD N NR RATE STDERR
AC5 A. Preface 1. Pre - Q14 872 177 0.20298 0.013621
B4A B. FT Instructional 1. Pre - Q14 288 89 0.30903 0.027229
B1611 B. FT Instructional 2. Q15 - Q29 41 10 0.24390 0.067066
C27A C. FT Non-instruct. 2. Q15 - Q29 279 78 0.27957 0.026868
C28D1 C. FT Non-instruct. 2. Q15 - Q29 113 30 0.26549 0.041541
C29I1 C. FT Non-instruct. 2. Q15 - Q29 77 18 0.23377 0.048231
C29J1 C. FT Non-instruct. 2. Q15 - Q29 94 19 0.20213 0.041421
C32F1 C. FT Non-instruct. 3. Q30 - Q43 146 37 0.25342 0.035999
C32G1 C. FT Non-instruct. 3. Q30 - Q43 149 39 0.26174 0.036012
C32H1 C. FT Non-instruct. 3. Q30 - Q43 144 31 0.21528 0.034251
C32I1 C. FT Non-instruct. 3. Q30 - Q43 45 29 0.64444 0.071358
C32J1 C. FT Non-instruct. 3. Q30 - Q43 67 30 0.44776 0.060750
C32L1 C. FT Non-instruct. 3. Q30 - Q43 220 47 0.21364 0.027634
C32M1 C. FT Non-instruct. 3. Q30 Q43 196 46 0.23469 0.030272
C32N1 C. FT Non-instruct. 3. Q30 - Q43 159 41 0.25786 0.034693
C3201 C. FT Non-instruct. 3. Q30 - Q43 80 31 0.38750 0.054468
C33 C. FT Non-instruct. 3. Q30 - Q43 530 163 0.30755 0.020045
C33A C. FT Non-instruct. 3. Q30 - Q43 297 173 0.58249 0.028615
D35D1 D. PT instructional 3. Q30 - Q43 78 31 0.39744 0.055410
D35E1 D. PT instructional 3. Q30 - Q43 138 30 0.21739 0.035112
D37Il D. PT instructional 3. Q30 - Q43 51 22 0.43137 0.069351
D37J1 D. PT instructional 3. Q30 - Q43 84 22 0.26190 0.047972
D3701 D. PT instructional 3. Q30 - Q43 91 28 0.30769 0.048382
D37P1 D. PT instructional 3. Q30 - Q43 80 45 0.56250 0.055463
D38 D. PT instructional 3. Q30 - Q43 499 128 0.25651 0.019550
D40A1 D. PT instructional 3. Q30 - Q43 245 60 0.24490 0.027473
D40A2 D. PT instructional 3. Q30 - Q43 245 90 0.36735 0.030799
D40B2 D. PT instructional 3. Q30 - Q43 181 93 0.51381 0.037151
D40C D. PT instructional 3. Q30 - Q43 388 108 0.27835 0.022753
D40C2 D. PT instructional 3. Q30 - Q43 174 93 0.53448 0.037815
D43A D. PT instructional 3. Q30 - Q43 213 45 0.21127 0.027970
439
1993 National Study of Postsecondary FacultyMethodology Report
Item Nonresponse Rates, Greater Than 10 Percent
440
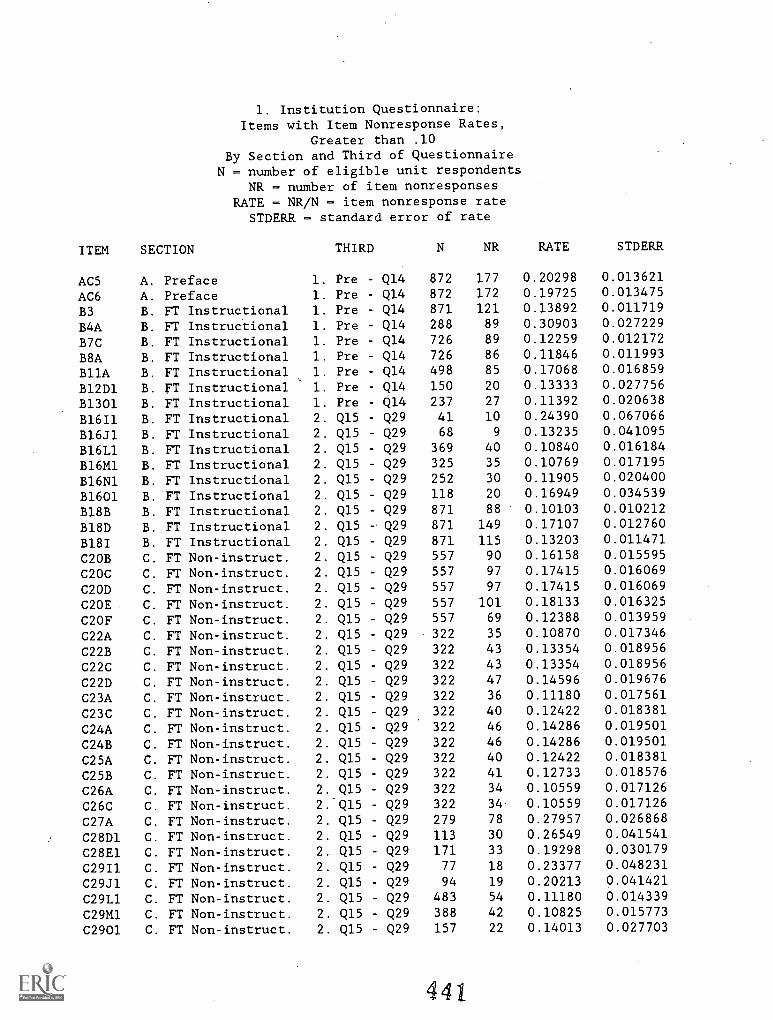
1. Institution Questionnaire:Items with Item Nonresponse Rates,
Greater than .10By Section and Third of Questionnaire
N = number of eligible unit respondentsNR = number of item nonresponses
RATE = NR/N = item nonresponse rateSTDERR = standard error of rate
ITEM SECTION THIRD N NR RATE STDERR
AC5 A. Preface 1. Pre - Q14 872 177 0.20298 0.013621
AC6 A. Preface 1. Pre - Q14 872 172 0.19725 0.013475
B3 B. FT Instructional 1. Pre - Q14 871 121 0.13892 0.011719
B4A B. FT Instructional 1. Pre - Q14 288 89 0.30903 0.027229
B7C B. FT Instructional 1. Pre - Q14 726 89 0.12259 0.012172
B8A B. FT Instructional 1. Pre - Q14 726 86 0.11846 0.011993
B11A B. FT Instructional 1. Pre - Q14 498 85 0.17068 0.016859
B12D1 B. FT Instructional 1. Pre Q14 150 20 0.13333 0.027756
B1301 B. FT Instructional 1. Pre - Q14 237 27 0.11392 0.020638
B1611 B. FT Instructional 2. Q15 - Q29 41 10 0.24390 0.067066
B16J1 B. FT Instructional 2. Q15 Q29 68 9 0.13235 0.041095
B16L1 B. FT Instructional 2. Q15 - Q29 369 40 0.10840 0.016184
B16M1 B. FT Instructional 2. Q15 - Q29 325 35 0.10769 0.017195
B16N1 B. FT Instructional 2. Q15 - Q29 252 30 0.11905 0.020400
B1601 B. FT Instructional 2. Q15 - Q29 118 20 0.16949 0.034539
B18B B. FT Instructional 2. Q15 Q29 871 88 0.10103 0.010212
B18D B. FT Instructional 2. Q15 - Q29 871 149 0.17107 0.012760
B18I B. FT Instructional 2. Q15 - Q29 871 115 0.13203 0.011471
C2OB C. FT Non-instruct. 2. Q15 - Q29 557 90 0.16158 0.015595
C20C C. FT Non-instruct. 2. Q15 - Q29 557 97 0.17415 0.016069
C2OD C. FT Non-instruct. 2. Q15 - Q29 557 97 0.17415 0.016069
C20E C. FT Non-instruct. 2. Q15 - Q29 557 101 0.18133 0.016325
C2OF C. FT Non-instruct. 2. Q15 - Q29 557 69 0.12388 0.013959
C22A C. FT Non-instruct. 2. Q15 - Q29 322 35 0.10870 0.017346
C22B C. FT Non-instruct. 2. Q15 - Q29 322 43 0.13354 0.018956
C22C C. FT Non-instruct. 2. Q15 - Q29 322 43 0.13354 0.018956
C22D C. FT Non-instruct. 2. Q15 - Q29 322 47 0.14596 0.019676
C23A C. FT Non-instruct. 2. Q15 Q29 322 36 0.11180 0.017561
C23C C. FT Non-instruct. 2. Q15 - Q29 322 40 0.12422 0.018381
C24A C. FT Non-instruct. 2. Q15 - Q29 322 46 0.14286 0.019501
C24B C. FT Non-instruct. 2. Q15 - Q29 322 46 0.14286 0.019501
C25A C. FT Non-instruct. 2. Q15 - Q29 322 40 0.12422 0.018381
C25B C. FT Non-instruct. 2. Q15 - Q29 322 41 0.12733 0.018576
C26A C. FT Non-instruct. 2. Q15 - Q29 322 34 0.10559 0.017126
C26C C. FT Non-instruct. 2.Q15 - Q29 322 34 0.10559 0.017126
C27A C. FT Non-instruct. 2. Q15 - Q29 279 78 0.27957 0.026868
C28D1 C. FT Non-instruct. 2. Q15 - Q29 113 30 0.26549 0.041541
C28E1 C. FT Non-instruct. 2. Q15 - Q29 171 33 0.19298 0.030179
C29Il C. FT Non-instruct. 2. Q15 - Q29 77 18 0.23377 0.048231
C29J1 C. FT Non-instruct. 2. Q15 - Q29 94 19 0.20213 0.041421
C29L1 C. FT Non-instruct. 2. Q15 - Q29 483 54 0.11180 0.014339
C29M1 C. FT Non-instruct. 2. Q15 - Q29 388 42 0.10825 0.015773
C2901 C. FT Non-instruct. 2. Q15 - Q29 157 22 0.14013 0.027703
441
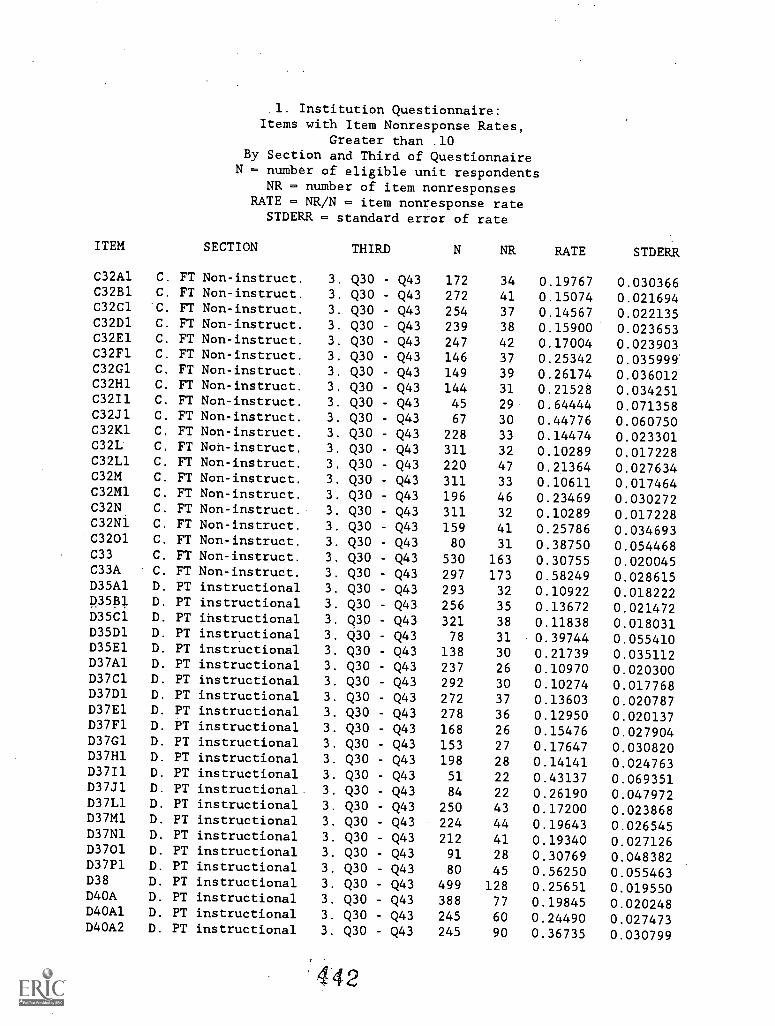
1. Institution Questionnaire:Items with Item Nonresponse Rates,
Greater than .10By Section and Third of Questionnaire
N = number of eligible unit respondentsNR = number of item nonresponses
RATE = NR/N - item nonresponse rateSTDERR = standard error of rate
ITEM SECTION THIRD N NR RATE STDERR
C32A1 C. FT Non-instruct. 3. Q30 - Q43 172 34 0.19767 0.030366C32B1 C. FT Non-instruct. 3. Q30 - Q43 272 41 0.15074 0.021694C32C1 C. FT Non-instruct. 3. Q30 - Q43 254 37 0.14567 0.022135C32D1 C. FT Non-instruct. 3. Q30 - Q43 239 38 0.15900 0.023653C32E1 C. FT Non-instruct. 3. Q30 - Q43 247 42 0.17004 0.023903C32F1 C. FT Non-instruct. 3. Q30 - Q43 146 37 0.25342 0.035999C32G1 C. FT Non-instruct. 3. Q30 - Q43 149 39 0.26174 0.036012C32H1 C. FT Non-instruct. 3. Q30 - Q43 144 31 0.21528 0.034251C32I1 C. FT Non-instruct. 3. Q30 - Q43 45 29 0.64444 0.071358C32J1 C. FT Non-instruct. 3. Q30 - Q43 67 30 0.44776 0.060750C32K1 C. FT Non-instruct. 3. Q30 - Q43 228 33 0.14474 0.023301C32L C. FT Non-instruct. 3. Q30 - Q43 311 32 0.10289 0.017228C32L1 C. FT Non-instruct. 3. Q30 - Q43 220 47 0.21364 0.027634C32M C. FT Non-instruct. 3. Q30 - Q43 311 33 0.10611 0.017464C32M1 C. FT Non-instruct. 3. Q30 - Q43 196 46 0.23469 0.030272C32N C. FT Non-instruct. 3. Q30 - Q43 311 32 0.10289 0.017228C32N1 C. FT Non-instruct. 3. Q30 - Q43 159 41 0.25786 0.034693C3201 C. FT Non-instruct. 3. Q30 - Q43 80 31 0.38750 0.054468C33 C. FT Non-instruct. 3. Q30 - Q43 530 163 0.30755 0.020045C33A C. FT Non-instruct. 3. Q30 - Q43 297 173 0.58249 0.028615D35A1 D. PT instructional 3. Q30 - Q43 293 32 0.10922 0.018222p35!31 D. PT instructional 3. Q30 - Q43 256 35 0.13672 0.021472D35C1 D. PT instructional 3. Q30 Q43 321 38 0.11838 0.018031D35D1 D. PT instructional 3. Q30 - Q43 78 31 0.39744 0.055410D35E1 D. PT instructional 3. Q30 - Q43 138 30 0.21739 0.035112D37A1 D. PT instructional 3. Q30 Q43 237 26 0.10970 0.020300D37C1 D. PT instructional 3. Q30 - Q43 292 30 0.10274 0.017768D37D1 D. PT instructional 3. Q30 - Q43 272 37 0.13603 0.020787D37E1 D. PT instructional 3. Q30 - Q43 278 36 0.12950 0.020137D37F1 D. PT instructional 3. Q30 - Q43 168 26 0.15476 0.027904D37G1 D. PT instructional 3. Q30 - Q43 153 27 0.17647 0.030820D37H1 D. PT instructional 3. Q30 - Q43 198 28 0.14141 0.024763D37Il D. PT instructional 3. Q30 - Q43 51 22 0.43137 0.069351D37J1 D. PT instructional. 3. Q30 - Q43 84 22 0.26190 0.047972D37L1 D. PT instructional 3. Q30 - Q43 250 43 0.17200 0.023868D37M1 D. PT instructional 3. Q30 - Q43 224 44 0.19643 0.026545D37N1 D. PT instructional 3. Q30 - Q43 212 41 0.19340 0.027126D3701 D. PT instructional 3. Q30 - Q43 91 28 0.30769 0.048382D37P1 D. PT instructional 3. Q30 - Q43 80 45 0.56250 0.055463D38 D. PT instructional 3. Q30 - Q43 499 128 0.25651 0.019550D40A D. PT instructional 3. Q30 - Q43 388 77 0.19845 0.020248D40A1 D. PT instructional 3. Q30 - Q43 245 60 0.24490 0.027473D40A2 D. PT instructional 3. Q30 - Q43 245 90 0.36735 0.030799
442
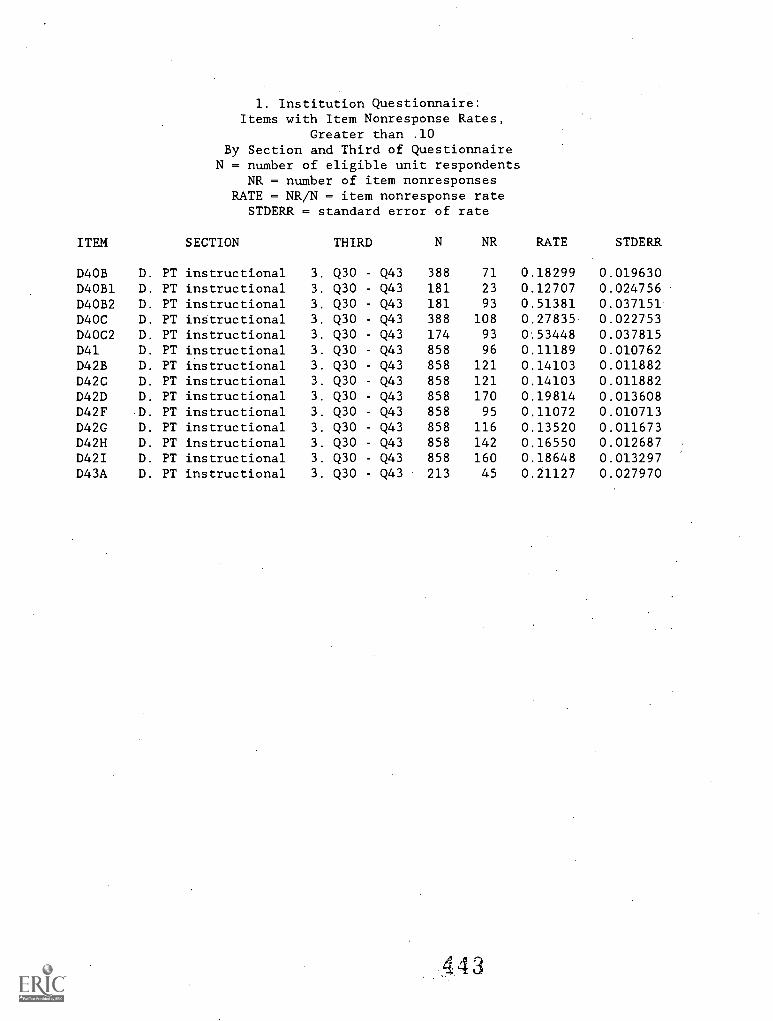
1. Institution Questionnaire:Items with Item Nonresponse Rates,
Greater than .10By Section and Third of Questionnaire
N = number of eligible unit respondentsNR = number of item nonresponses
RATE = NR/N = item nonresponse rateSTDERR - standard error of rate
ITEM SECTION THIRD N NR RATE STDERR
D4OB D. PT instructional 3. Q30 - Q43 388 71 0.18299 0.019630D40B1 D. PT instructional 3. Q30 - Q43 181 23 0.12707 0.024756D40B2 D. PT instructional 3. Q30 - Q43 181 93 0.51381 0.037151D40C D. PT instructional 3. Q30 - Q43 388 108 0.27835 0.022753D40C2 D. PT instructional 3. Q30 - Q43 174 93 0:53448 0.037815D41 D. PT instructional 3. Q30 - Q43 858 96 0.11189 0.010762D42B D. PT instructional 3. Q30 - Q43 858 121 0.14103 0.011882D42C D. PT instructional 3. Q30 Q43 858 121 0.14103 0.011882D42D D. PT instructional 3. Q30 - Q43 858 170 0.19814 0.013608D42F D. PT instructional 3. Q30 - Q43 858 95 0.11072 0.010713D42G D. PT instructional 3. Q30 Q43 858 116 0.13520 0.011673D42H D. PT instructional 3. Q30 - Q43 858 142 0.16550 0.012687D42I D. PT instructional 3. Q30 - Q43 858 160 0.18648 0.013297D43A D. PT instructional 3. Q30 - Q43 213 45 0.21127 0.027970
443
1993 National Study of Postsecondary FacultyMethodology Report
Item Nonresponse Rates, Sorted by Rate
444
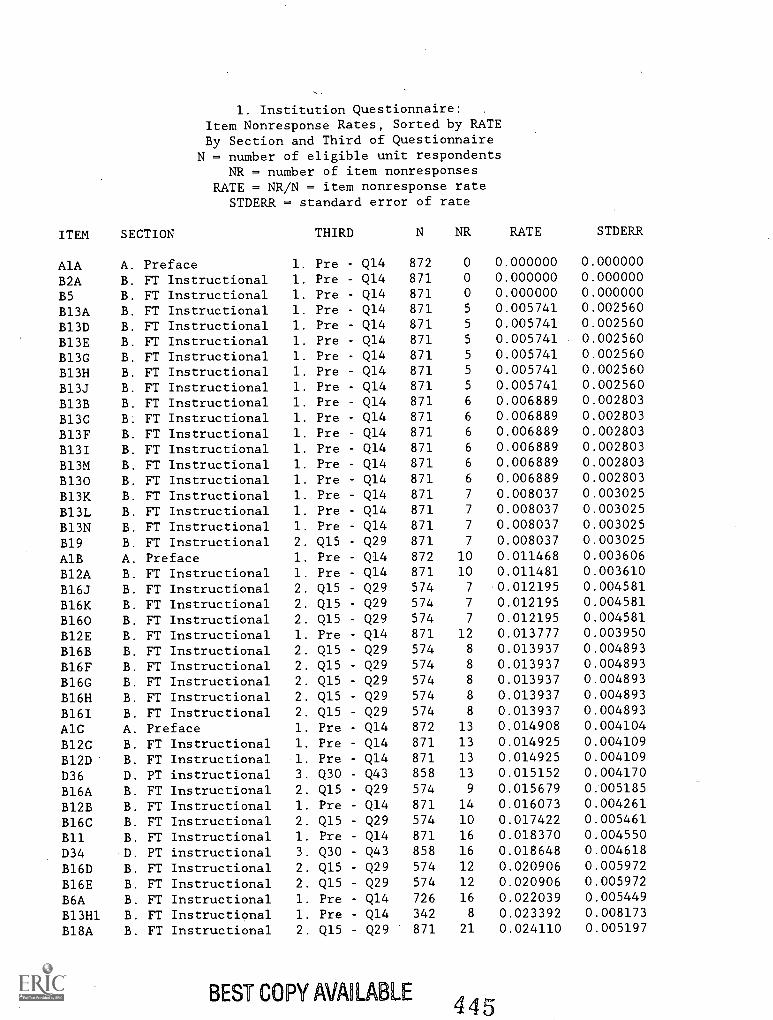
1. Institution Questionnaire: .
Item Nonresponse Rates, Sorted by RATEBy Section and Third of Questionnaire
N = number of eligible unit respondentsNR = number of item nonresponses
RATE = NR/N = item nonresponse rateSTDERR = standard error of rate
ITEM SECTION THIRD N NR RATE STDERR
AlA A. Preface 1. Pre Q14 872 0 0.000000 0.000000
B2A B. FT Instructional 1. Pre - Q14 871 0 0.000000 0.000000
B5 B. FT Instructional 1. Pre - Q14 871 0 0.000000 0.000000
813A B. FT Instructional 1. Pre - Q14 871 5 0.005741 0.002560
813D B. FT Instructional 1. Pre Q14 871 5 0.005741 0.002560
813E B. FT Instructional 1. Pre Q14 871 5 0.005741 0.002560
813G B. FT Instructional 1. Pre Q14 871 5 0.005741 0.002560
813H B. FT Instructional 1. Pre - Q14 871 5 0.005741 0.002560
813J B. FT Instructional 1. Pre - Q14 871 5 0.005741 0.002560
131311 B. FT Instructional 1. Pre - Q14 871 6 0.006889 0.002803
813C B. FT Instructional 1. Pre Q14 871 6 0.006889 0.002803
B13F B. FT Instructional 1. Pre - Q14 871 6 0.006889 0.002803
B13I B. FT Instructional 1. Pre Q14 871 6 0.006889 0.002803
813M B. FT Instructional 1. Pre - Q14 871 6 0.006889 0.002803
8130 B. FT Instructional 1. Pre Q14 871 6 0.006889 0.002803
813K B. FT Instructional 1. Pre - Q14 871 7 0.008037 0.003025
1313L B. FT Instructional 1. Pre - Q14 871 7 0.008037 0.003025
813N B. FT Instructional 1. Pre Q14 871 7 0.008037 0.003025
B19 B. FT Instructional 2. Q15 Q29 871 7 0.008037 0.003025
A1B A. Preface 1. Pre Q14 872 10 0.011468 0.003606
812A B. FT Instructional 1. Pre - Q14 871 10 0.011481 0.003610
816J B. FT Instructional 2. Q15 - Q29 574 7 0.012195 0.004581
816K B. FT Instructional 2. Q15 Q29 574 7 0.012195 0.004581
B160 B. FT Instructional 2. Q15 - Q29 574 7 0.012195 0.004581
812E B. FT Instructional 1. Pre Q14 871 12 0.013777 0.003950
81611 B. FT Instructional 2. Q15 - Q29 574 8 0.013937 0.004893
B16F B. FT Instructional 2. Q15 - Q29 574 8 0.013937 0.004893
B160 B. FT Instructional 2. Q15 Q29 574 8 0.013937 0.004893
B16H B. FT Instructional 2. Q15 Q29 574 8 0.013937 0.004893
B16I B. FT Instructional 2. Q15 - Q29 574 8 0.013937 0.004893
A1C A. Preface 1. Pre - Q14 872 13 0.014908 0.004104
1312C B. FT Instructional 1. Pre - Q14 871 13 0.014925 0.004109
812D B. FT Instructional 1. Pre - Q14 871 13 0.014925 0.004109
D36 D. PT instructional 3. Q30 - Q43 858 13 0.015152 0.004170
816A B. FT Instructional 2. Q15 Q29 574 9 0.015679 0.005185
81213 B. FT Instructional 1. Pre - Q14 871 14 0.016073 0.004261
1316C B. FT Instructional 2. Q15 - Q29 574 10 0.017422 0.005461
B11 B. FT Instructional 1. Pre - Q14 871 16 0.018370 0.004550
D34 D. PT instructional 3. Q30 - Q43 858 16 0.018648 0.004618
816D B. FT Instructional 2. Q15 - Q29 574 12 0.020906 0.005972
816E B. FT Instructional 2. Q15 - Q29 574 12 0.020906 0.005972
B6A B. FT Instructional 1. Pre - Q14 726 16 0.022039 0.005449
1113H1 B. FT Instructional 1. Pre - Q14 342 8 0.023392 0.008173
818A B. FT Instructional 2. Q15 - Q29 871 21 0.024110 0.005197
BEST COPY AVAILABLE4 4
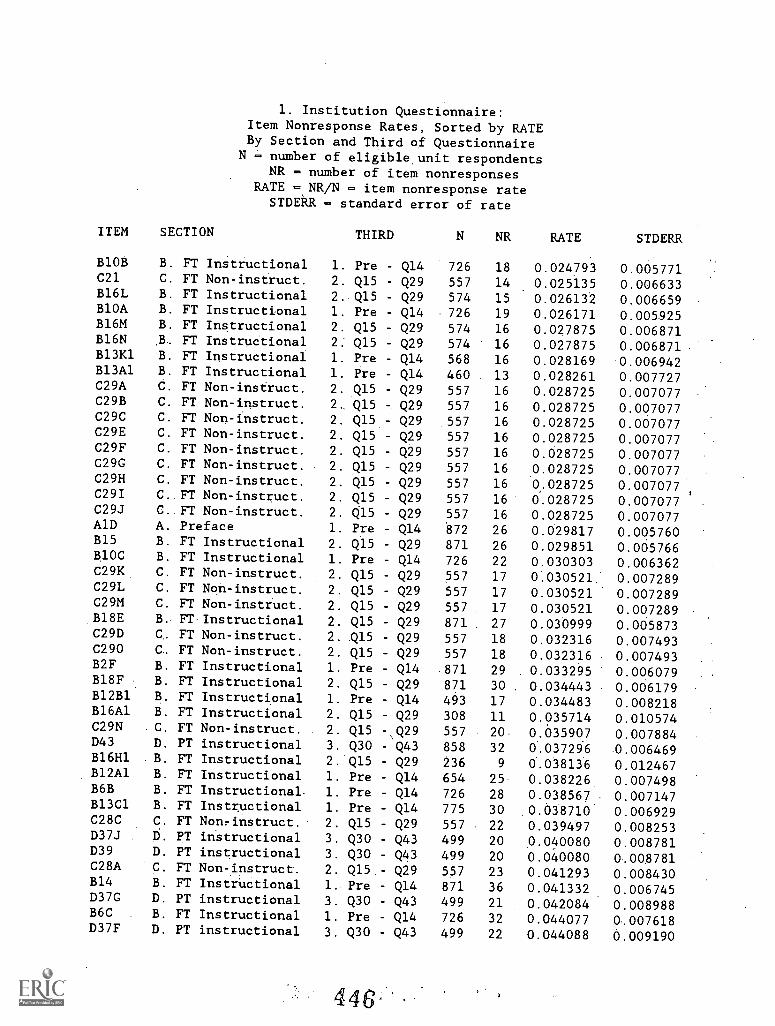
1. Institution Questionnaire:Item Nonresponse Rates, Sorted by RATEBy Section and Third of Questionnaire
N - number of eligible, unit respondentsNR = number of item nonresponses
RATE -,NR/N = item nonresponse rateSTDERR = standard error of rate
ITEM SECTION THIRD N NR RATE STDERR
8108 B. FT Instructional 1. Pre - Q14 726 18 0.024793 0.005771C21 C. FT Non-instruct. 2. Q15 - Q29 557 14 0.025135 0.006633816L B. FT Instructional 2. Q15 - Q29 574 15 0.026132 0.006659810A B. FT Instructional 1. Pre - Q14 726 19 0.026171 0.005925816M B. FT Instructional 2. Q15 - Q29 574 16 0.027875 0.006871816N ,B. FT Instructional 2. Q15 - Q29 574 16 0.027875 0.006871813K1 B. FT Instructional 1. Pre - Q14 568 16 0.028169 0.006942813A1 B. FT Instructional 1. Pre - Q14 460 13 0.028261 0.007727C29A C. FT Non-instruct. 2. Q15 - Q29 557 16 0.028725 0.007077C29B C. FT Non-instruct. 2, Q15 - Q29 557 16 0.028725 0.007077C29C C. FT Non-instruct. 2. Q15 - Q29 557 16 0.028725 0.007077C29E C. FT Non-instruct. 2. Q15 - Q29 557 16 0.028725 0.007077C29F C. FT Non-instruct. 2. Q15 - Q29 557 16 0.028725 0.007077C29G C. FT Non-instruct. 2. Q15 - Q29 557 16 0.028725 0.007077C29H C. FT Non-instruct. 2. Q15 - Q29 557 16 0.028725 0.007077C29I C. FT Non-instruct. 2. Q15 - Q29 557 16 0.028725 0.007077C29J C. FT Non-instruct. 2. Q15 - Q29 557 16 0.028725 0.007077
A. Preface 1. Pre - Q14 872 26 0.029817 0.005760B15 B. FT Instructional 2. Q15 - Q29 871 26 0.029851 0.005766810C B. FT Instructional 1. Pre - Q14 726 22 0.030303 0.006362C29K C. FT Non-instruct. 2. Q15 - Q29 557 17 0.030521 0.007289C29L C. FT Non-instruct. 2. Q15 - Q29 557 17 0.030521 0.007289C29M C. FT Non-instruct. 2. Q15 - Q29 557 17 0.030521 0.007289818E B. FT Instructional 2. Q15 - Q29 871 27 0.030999 0.005873C29D C. FT Non-instruct. 2..Q15 - Q29 557 18 0.032316 0.007493C290 C. FT Non-instruct. 2. Q15 - Q29 557 18 0.032316 0.007493B2F B. FT Instructional 1. Pre - Q14 871 29 0.033295 0.006079B18F B. FT Instructional 2. Q15 - Q29 871 30 0.034443 0.006179B12B1 B. FT Instructional 1. Pre - Q14 493 17 0.034483 0.008218816A1 B. FT Instructional 2. Q15 - Q29 308 11 0.035714 0.010574C29N C. FT Non-instruct. 2. Q15 -\Q29 557 20 0.035907 0.007884D43 D. PT instructional 3. Q30 - Q43 858 32 0.037296 0.006469816H1 B. FT Instructional 2. Q15 - Q29 236 9 0.038136 0.012467812A1 B. FT Instructional 1. Pre - Q14 654 25 0.038226 0.007498B6B B. FT Instructional. 1. Pre - Q14 726 28 0.038567 0.007147813C1 B. FT Instructional 1. Pre - Q14 775 30 0.638710 0.006929C28C C. FT Non - instruct. 2. Q15 - Q29 557 22 0.039497 0.008253D37J D. PT instructional 3. Q30 - Q43 499 20 0.040080 0.008781D39 D. PT instructional 3. Q30 - Q43 499 20 0.040080 0.008781C28A C. FT Non-instruct. 2. Q15.- Q29 557 23 0.041293 0.008430B14 B. FT InstrUctional 1. Pre - Q14 871 36 0.041332 0.006745D37G D. PT instructional 3. Q30 - Q43 499 21 0.042084 0.008988B6C B. FT Instructional 1. Pre - Q14 726 32 0.044077 0-.007618D37F D. PT instructional 3. Q30 - Q43 499 22 0.044088 0.009190
446,
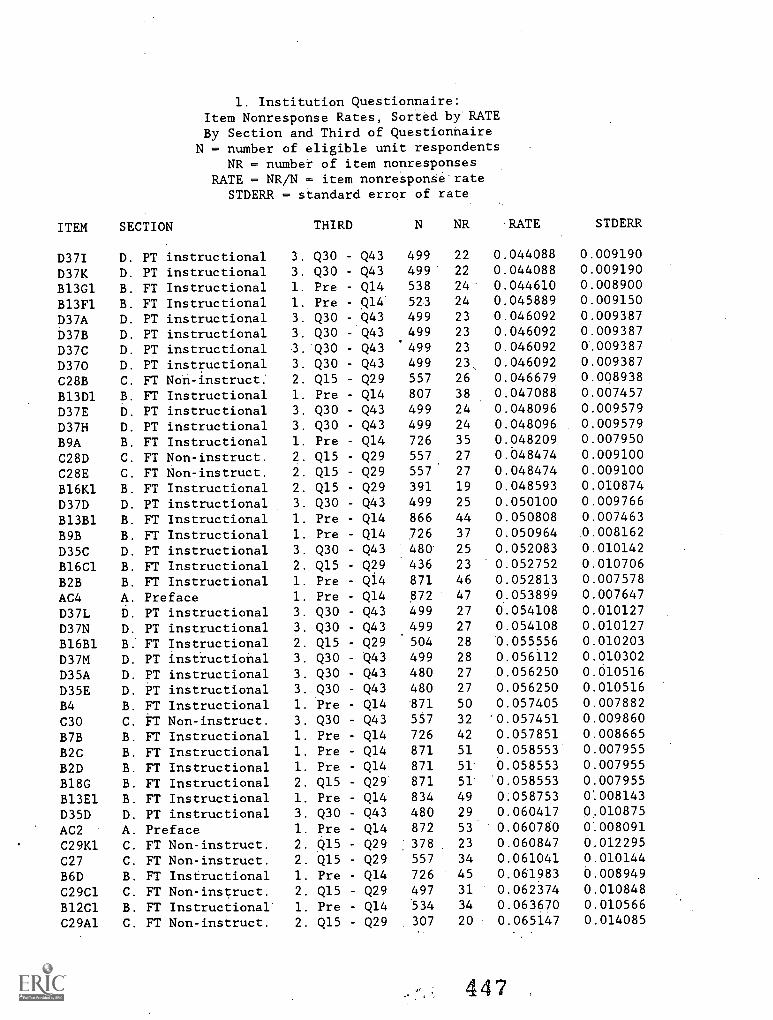
1. Institution Questionnaire:Item Nonresponse Rates, Sorted by RATEBy Section and Third of Questionnaire
N = number of eligible unit respondentsNR = number of item nonresponses
RATE = NR/N = item nonresponse rateSTDERR = standard error of rate
ITEM SECTION THIRD N NR 'RATE STDERR
D37I D. PT instructional 3. Q30 Q43 499 22 0.044088 0.009190
D37K D. PT instructional 3. Q30 - Q43 499 22 0.044088 0.009190
813G1 B. FT Instructional 1. Pre Q14 538 24 0.044610 0.008900
B13F1 B. FT Instructional 1. Pre - Q14' 523 24 0.045889 0.009150
D37A D. PT instructional 3. Q30 - Q43 499 23 0.046092 0.009387
D37B D. PT instructional 3. Q30 - Q43 499 23 0.046092 0.009387
D37C D. PT instructional 3. Q30 - Q43 499 23 0.046092 0.009387
D370 D. PT instructional 3. Q30 - Q43 499 23 0.046092 0.009387
C28B C. FT Non-instruct. 2. Q15 Q29 557 26 0.046679 0.008938
813D1 B. FT Instructional 1. Pre - Q14 807 38 0.047088 0.007457
D37E D. PT instructional 3. Q30 - Q43 499 24 0.048096 0.009579
D37H D. PT instructional 3. Q30 - Q43 499 24 0.048096 0.009579
B9A B. FT Instructional 1. Pre - Q14 726 35 0.048209 0.007950
C28D C. FT Non-instruct. 2. Q15 - Q29 557 27 0.048474 0.009100
C28E C. FT Non-instruct. 2. Q15 - Q29 557 27 0.048474 0.009100
816K1 B. FT Instructional 2. Q15 - Q29 391 19 0.048593 0.010874
D37D D. PT instructional 3. Q30 - Q43 499 25 0.050100 0.009766
81381 B. FT Instructional 1. Pre - Q14 866 44 0.050808 0.007463
B9B B. FT Instructional 1. Pre - Q14 726 37 0.050964 0.008162
D35C D. PT instructional 3. Q30 - Q43 480 25 0.052083 0.010142
816C1 B. FT Instructional 2. Q15 - Q29 436 23 0.052752 0.010706
B2B B. FT Instructional 1. Pre - Q14 871 46 0.052813 0.007578
AC4 A. Preface 1. Pre - Q14 872 47 0.053899 0.007647
D37L D. PT instructional 3. Q30 - Q43 499 27 0.054108 0.010127
D37N D. PT instructional 3. Q30 - Q43 499 27 0.054108 0.010127
81681 B. FT Instructional 2. Q15 - Q29 504 28 '0.055556 0.010203
D37M D. PT instructional 3. Q30 - Q43 499 28 0.056112 0.010302
D35A D. PT instructional 3. Q30 - Q43 480 27 .0.056250 0.010516
D35E D. PT instructional 3. Q30 - Q43 480 27 0.056250 0.010516
B4 B. FT Instructional 1. Pre - Q14 '871 50 0.057405 0.007882
C30 C. FT Non-instruct. 3. Q30 - Q43 557 32 0.057451 0.009860
B7B B. FT Instructional 1. Pre - Q14 726 42 0.057851 0.008665
B2C B. FT Instructional 1. Pre - Q14 871 51 0.058553 0.007955
B2D B. FT Instructional 1. Pre - Q14 871 51 0.058553 0.007955
818G B. FT Instructional 2. Q15 - Q29 871 51 0.058553 0.007955
B13E1 B. FT Instructional 1. Pre - Q14 834 49 0.058753 0..008143
D35D D. PT instructional 3. Q30 - Q43 480 29 0.060417 0.010875
AC2 A. Preface 1. Pre - Q14 872 53 0.060780 0A08091C29K1 C. FT Non-instruct. 2. Q15 - Q29 378 23 0.060847 0.012295
C27 C. FT Non-instruct. 2. Q15 - Q29 557 34 0.061041 0.010144
B6D B. FT Instructional 1. Pre - Q14 726 45 0.061983 0.008949
C29C1 C. FT Non-instruct. 2. Q15 - Q29 497 31 0.062374 0.010848
812C1 B. FT Instructional 1. Pre - Q14 534 34 0.063670 0.010566
C29A1 C. FT Non-instruct. 2. Q15 - Q29 307 20 0.065147 0.014085
447
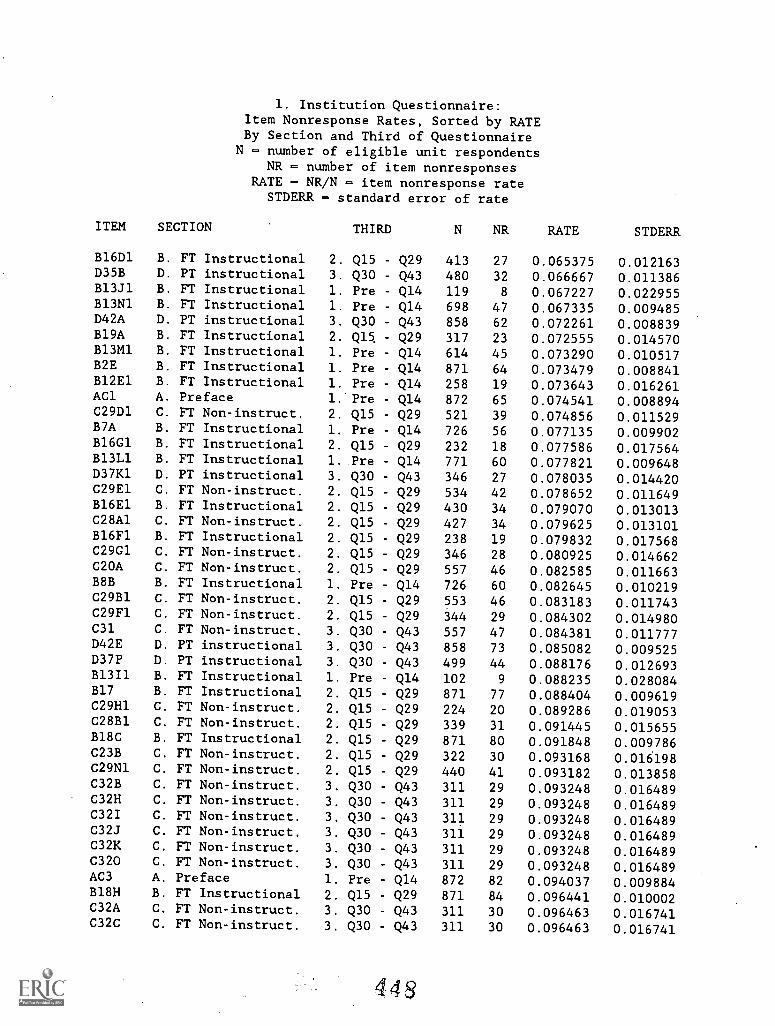
1. Institution Questionnaire:Item Nonresponse Rates, Sorted by RATEBy Section and Third of Questionnaire
N - number of eligible unit respondentsNR = number of item nonresponses
RATE = NR/N - item nonresponse rateSTDERR = standard error of rate
ITEM SECTION THIRD N NR RATE STDERR
B16D1 B. FT Instructional 2. Q15 - Q29 413 27 0.065375 0.012163D35B D. PT instructional 3. Q30 - Q43 480 32 0.066667 0.011386B13J1 B. FT Instructional 1. Pre - Q14 119 8 0.067227 0.022955B13N1 B. FT Instructional 1. Pre - Q14 698 47 0.067335 0.009485D42A D. PT instructional 3. Q30 - Q43 858 62 0.072261 0.008839B19A B. FT Instructional 2. Q15. - Q29 317 23 0.072555 0.014570B13M1 B. FT Instructional 1. Pre Q14 614 45 0.073290 0.010517B2E B. FT Instructional 1. Pre - Q14 871 64 0.073479 0.008841B12E1 B. FT Instructional 1. Pre - Q14 258 19 0.073643 0.016261AC1 A. Preface 1. Pre - Q14 872 65 0.074541 0.008894C29D1 C. FT Non-instruct. 2. Q15 - Q29 521 39 0.074856 0.011529B7A B. FT Instructional 1. Pre - Q14 726 56 0.077135 0.009902B16G1 B. FT Instructional 2. Q15 - Q29 232 18 0.077586 0.017564B13L1 B. FT Instructional 1. Pre - Q14 771 60 0.077821 0.009648D37K1 D. PT instructional 3. Q30 - Q43 346 27 0.078035 0.014420C29E1 C. FT Non-instruct. 2. Q15 - Q29 534 42 0.078652 0.011649B16E1 B. FT Instructional 2. Q15 - Q29 430 34 0.079070 0.013013C28A1 C. FT Non-instruct. 2. Q15 - Q29 427 34 0.079625 0.013101Bl6F1 B. FT Instructional 2. Q15 - Q29 238 19 0.079832 0.017568C29G1 C. FT Non-instruct. 2. Q15 - Q29 346 28 0.080925 0.014662C20A C. FT Non-instruct. 2. Q15 - Q29 557 46 0.082585 0.011663B8B B. FT Instructional 1. Pre - Q14 726 60 0.082645 0.010219C29B1 C. FT Non-instruct. 2. Q15 - Q29 553 46 0.083183 0.011743C29F1 C. FT Non-instruct. 2. Q15 - Q29 344 29 0.084302 0.014980C31 C. FT Non-instruct. 3. Q30 - Q43 557 47 0.084381 0.011777D42E D. PT instructional 3. Q30 - Q43 858 73 0.085082 0.009525D37P D. PT instructional 3. Q30 - Q43 499 44 0.088176 0.012693B1311 B. FT Instructional 1. Pre - Q14 102 9 0.088235 0.028084B17 B. FT Instructional 2. Q15 - Q29 871 77 0.088404 0.009619C29H1 C. FT Non-instruct. 2. Q15 - Q29 224 20 0.089286 0.019053C28B1 C. FT Non-instruct. 2. Q15 - Q29 339 31 0.091445 0.015655B18C B. FT Instructional 2. Q15 - Q29 871 80 0.091848 0.009786C23B C. FT Non-instruct. 2. Q15 - Q29 322 30 0.093168 0.016198C29N1 C. FT Non-instruct. 2. Q15 - Q29 440 41 0.093182 0.013858C32B C. FT Non-instruct. 3. Q30 - Q43 311 29 0.093248 0.016489C32H C. FT Non-instruct. 3. Q30 - Q43 311 29 0.093248 0.016489C32I C. FT Non-instruct. 3. Q30 - Q43 311 29 0.093248 0.016489C32J C. FT Non-instruct. 3. Q30 - Q43 311 29 0.093248 0.016489C32K C. FT Non-instruct. 3. Q30 - Q43 311 29 0.093248 0.016489C320 C. FT Non-instruct. 3. Q30 - Q43 311 29 0.093248 0.016489AC3 A. Preface 1. Pre - Q14 872 82 0.094037 0.009884818H B. FT Instructional 2. Q15 - Q29 871 84 0.096441 0.010002C32A C. FT Non-instruct. 3. Q30 - Q43 311 30 0.096463 0.016741C32C C. FT Non-instruct. 3. Q30 - Q43 311 30 0.096463 0.016741
44
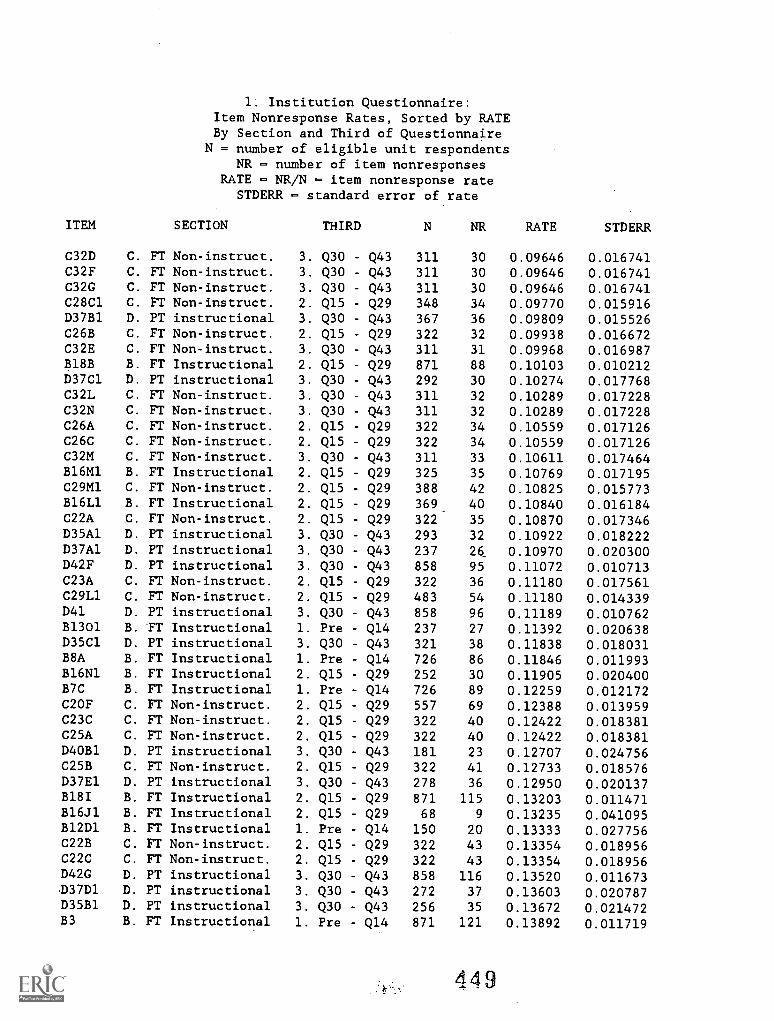
Institution Questionnaire:Item Nonresponse Rates, Sorted by RATEBy Section and Third of Questionnaire
N - number of eligible unit respondentsNR - number of item nonresponses
RATE - NR/N = item nonresponse rateSTDERR - standard error of rate
ITEM SECTION THIRD N NR RATE STDERR
C32D C. FT Non-instruct. 3. Q30 - Q43 311 30 0.09646 0.016741C32F C. FT Non-instruct. 3. Q30 - Q43 311 30 0.09646 0.016741C32G C. FT Non-instruct. 3. Q30 - Q43 311 30 0.09646 0.016741C28C1 C. FT Non-instruct. 2. Q15 - Q29 348 34 0.09770 0.015916D37B1 D. PT instructional 3. Q30 - Q43 367 36 0.09809 0.015526C26B C. FT Non-instruct. 2. Q15 - Q29 322 32 0.09938 0.016672C32E C. FT Non-instruct. 3. Q30 - Q43 311 31 0.09968 0.016987B18B B. FT Instructional 2. Q15 - Q29 871 88 0.10103 0.010212D37C1 D. PT instructional 3. Q30 - Q43 292 30 0.10274 0.017768C32L C. FT Non-instruct. 3. Q30 - Q43 311 32 0.10289 0.017228C32N C. FT Non-instruct. 3. Q30 - Q43 311 32 0.10289 0.017228C26A C. FT Non-instruct. 2. Q15 - Q29 322 34 0.10559 0.017126C26C C. FT Non-instruct. 2. Q15 - Q29 322 34 0.10559 0.017126C32M C. FT Non-instruct. 3. Q30 - Q43 311 33 0.10611 0.017464B16M1 B. FT Instructional 2. Q15 - Q29 325 35 0.10769 0.017195C29M1 C. FT Non-instruct. 2. Q15 - Q29 388 42 0.10825 0.015773B16L1 B. FT Instructional 2. Q15 - Q29 369 40 0.10840 0.016184C22A C. FT Non-instruct. 2. Q15 - Q29 322 35 0.10870 0.017346D35A1 D. PT instructional 3. Q30 - Q43 293 32 0.10922 0.018222D37A1 D. PT instructional 3. Q30 - Q43 237 26 0.10970 0.020300D42F D. PT instructional 3. Q30 - Q43 858 95 0.11072 0.010713C23A C. FT Non-instruct. 2. Q15 - Q29 322 36 0.11180 0.017561C29L1 C. FT Non-instruct. 2. Q15 - Q29 483 54 0.11180 0.014339D41 D. PT instructional 3. Q30 - Q43 858 96 0.11189 0.010762B1301 B. FT Instructional 1. Pre - Q14 237 27 0.11392 0.020638D35C1 D. PT instructional 3. Q30 - Q43 321 38 0.11838 0.018031B8A B. FT Instructional 1. Pre - Q14 726 86 0.11846 0.011993B16N1 B. FT Instructional 2. Q15 - Q29 252 30 0.11905 0.020400B7C B. FT Instructional 1. Pre - Q14 726 89 0.12259 0.012172C2OF C. FT Non-instruct. 2. Q15 - Q29 557 69 0.12388 0.013959C23C C. FT Non-instruct. 2. Q15 - Q29 322 40 0.12422 0.018381C25A C. FT Non-instruct. 2. Q15 - Q29 322 40 0.12422 0.018381D40B1 D. PT instructional 3. Q30 - Q43 181 23 0.12707 0.024756C25B C. FT Non-instruct. 2. Q15 - Q29 322 41 0.12733 0.018576D37E1 D. PT instructional 3. Q30 - Q43 278 36 0.12950 0.020137B18I B. FT Instructional 2. Q15 - Q29 871 115 0.13203 0.011471B16J1 B. FT Instructional 2. Q15 - Q29 68 9 0.13235 0.041095B12D1 B. FT Instructional 1. Pre - Q14 150 20 0.13333 0.027756C22B C. FT Non-instruct. 2. Q15 - Q29 322 43 0.13354 0.018956C22C C. FT Non-instruct. 2. Q15 - Q29 322 43 0.13354 0.018956D42G D. PT instructional 3. Q30 - Q43 858 116 0.13520 0.011673D37D1 D. PT instructional 3. Q30 - Q43 272 37 0.13603 0.020787D35B1 D. PT instructional 3. Q30 - Q43 256 35 0.13672 0.021472B3 B. FT Instructional 1. Pre - Q14 871 121 0.13892 0.011719
449
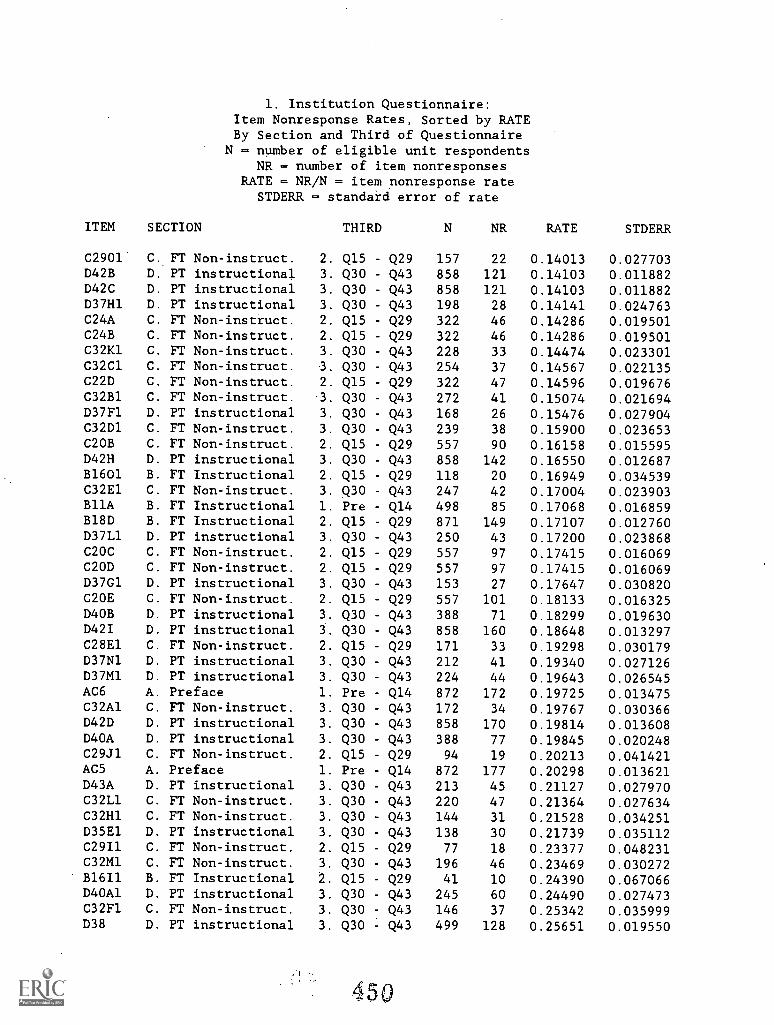
1. Institution Questionnaire:Item Nonresponse Rates, Sorted by RATEBy Section and Third of Questionnaire
N = number of eligible unit respondentsNR = number of item nonresponses
RATE - NR/N = item nonresponse rateSTDERR = standard error of rate
ITEM SECTION THIRD N NR RATE STDERR
C2901 C. FT Non-instruct. 2. Q15 - Q29 157 22 0.14013 0.027703D42B D. PT instructional 3. Q30 - Q43 858 121 0.14103 0.011882D42C D. PT instructional 3. Q30 - Q43 858 121 0.14103 0.011882D37H1 D. PT instructional 3. Q30 - Q43 198 28 0.14141 0.024763C24A C. FT Non-instruct. 2. Q15 - Q29 322 46 0.14286 0.019501C24B C. FT Non-instruct. 2. Q15 - Q29 322 46 0.14286 0.019501C32K1 C. FT Non-instruct. 3. Q30 - Q43 228 33 0.14474 0.023301C32C1 C. FT Non-instruct. 3. Q30 - Q43 254 37 0.14567 0.022135C22D C. FT Non-instruct. 2. Q15 - Q29 322 47 0.14596 0.019676C32B1 C. FT Non-instruct. 3. Q30 - Q43 272 41 0.15074 0.021694D37F1 D. PT instructional 3. Q30 - Q43 168 26 0.15476 0.027904C32D1 C. FT Non-instruct. 3. Q30 - Q43 239 38 0.15900 0.023653C2OB C. FT Non-instruct. 2. Q15 - Q29 557 90 0.16158 0.015595D42H D. PT instructional 3. Q30 - Q43 858 142 0.16550 0.012687B1601 B. FT Instructional 2. Q15 - Q29 118 20 0.16949 0.034539C32E1 C. FT Non-instruct. 3. Q30 - Q43 247 42 0.17004 0.023903B11A B. FT Instructional 1. Pre - Q14 498 85 0.17068 0.016859B18D B. FT Instructional 2. Q15 - Q29 871 149 0.17107 0.012760D37L1 D. PT instructional 3. Q30 - Q43 250 43 0.17200 0.023868C20C C. FT Non-instruct. 2. Q15 - Q29 557 97 0.17415 0.016069C2OD C. FT Non-instruct. 2. Q15 - Q29 557 97 0.17415 0.016069D37G1 D. PT instructional 3. Q30 - Q43 153 27 0.17647 0.030820C20E C. FT Non-instruct. 2. Q15 Q29 557 101 0.18133 0.016325D4OB D. PT instructional 3. Q30 - Q43 388 71 0.18299 0.019630D42I D. PT instructional 3. Q30 - Q43 858 160 0.18648 0.013297C28E1 C. FT Non-instruct. 2. Q15 - Q29 171 33 0.19298 0.030179D37N1 D. PT instructional 3. Q30 - Q43 212 41 0.19340 0.027126D37M1 D. PT instructional 3. Q30 - Q43 224 44 0.19643 0.026545AC6 A. Preface 1. Pre - Q14 872 172 0.19725 0.013475C32A1 C. FT Non-instruct. 3. Q30 - Q43 172 34 0.19767 0.030366D42D D. PT instructional 3. Q30 - Q43 858 170 0.19814 0.013608D40A D. PT instructional 3. Q30 - Q43 388 77 0.19845 0.020248C29J1 C. FT Non-instruct. 2. Q15 - Q29 94 19 0.20213 0.041421AC5 A. Preface 1. Pre - Q14 872 177 0.20298 0.013621D43A D. PT instructional 3. Q30 - Q43 213 45 0.21127 0.027970C32L1 C. FT Non-instruct. 3. Q30 - Q43 220 47 0.21364 0.027634C32H1 C. FT Non-instruct. 3. Q30 - Q43 144 31 0.21528 0.034251D35E1 D. PT instructional 3. Q30 - Q43 138 30 0.21739 0.035112C29I1 C. FT Non-instruct. 2. Q15 - Q29 77 18 0.23377 0.048231C32M1 C. FT Non-instruct. 3. Q30 - Q43 196 46 0.23469 0.030272B1611 B. FT Instructional 2. Q15 - Q29 41 10 0.24390 0.067066D40A1 D. PT instructional 3. Q30 - Q43 245 60 0.24490 0.027473C32F1 C. FT Non-instruct. 3. Q30 - Q43 146 37 0.25342 0.035999D38 D. PT instructional 3. Q30 - Q43 499 128 0.25651 0.019550
450
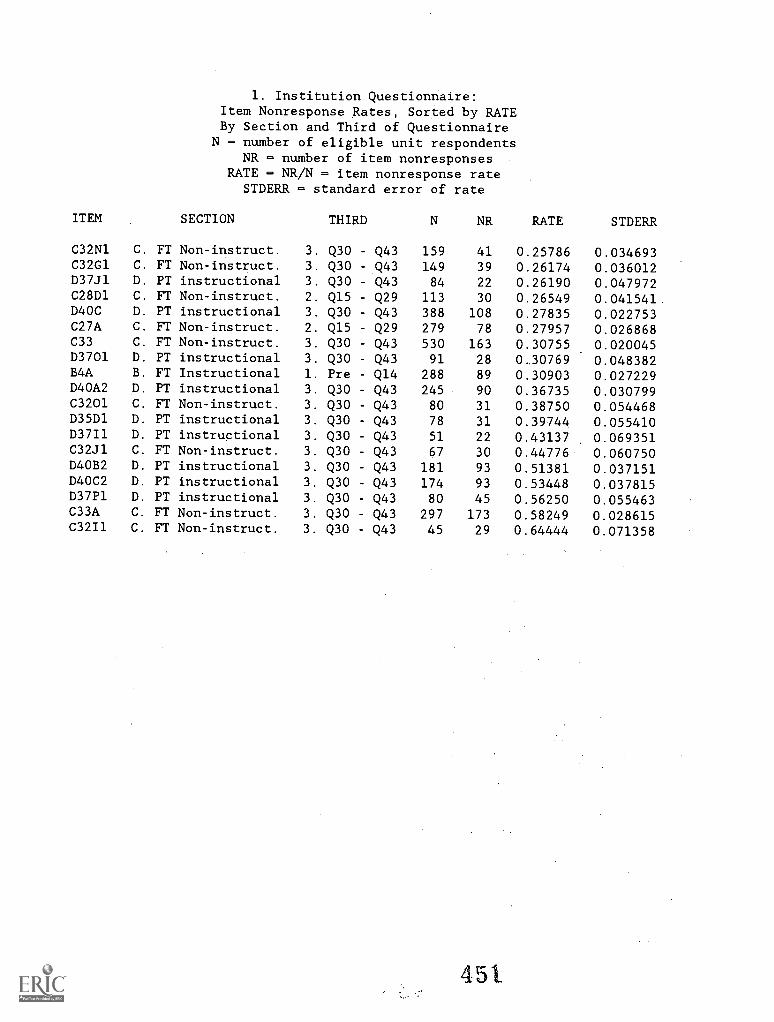
1. Institution Questionnaire:Item Nonresponse Rates, Sorted by RATEBy Section and Third of Questionnaire
N = number of eligible unit respondentsNR = number of item nonresponses
RATE = NR/N = item nonresponse rateSTDERR = standard error of rate
ITEM SECTION THIRD N NR RATE STDERR
C32N1 C. FT Non-instruct. 3. Q30 - Q43 159 41 0.25786 0.034693C32G1 C. FT Non-instruct. 3. Q30 Q43 149 39 0.26174 0.036012D37J1 D. PT instructional 3. Q30 - Q43 84 22 0.26190 0.047972C28D1 C. FT Non-instruct. 2. Q15 - Q29 113 30 0.26549 0.041541.D40C D. PT instructional 3. Q30 - Q43 388 108 0.27835 0.022753C27A C. FT Non-instruct. 2. Q15 - Q29 279 78 0.27957 0.026868C33 C. FT Non-instruct. 3. Q30 - Q43 530 163 0.30755 0.020045D3701 D. PT instructional 3. Q30 - Q43 91 28 0.30769 0.048382B4A B. FT Instructional 1. Pre - Q14 288 89 0.30903 0.027229D40A2 D. PT instructional 3. Q30 - Q43 245 90 0.36735 0.030799C3201 C. FT Non-instruct. 3. Q30 - Q43 80 31 0.38750 0.054468D35D1 D. PT instructional 3. Q30 - Q43 78 31 0.39744 0.055410D37Il D. PT instructional 3. Q30 - Q43 51 22 0.43137 0.069351C32J1 C. FT Non-instruct. 3. Q30 - Q43 67 30 0.44776 0.060750D40B2 D. PT instructional 3. Q30 - Q43 181 93 0.51381 0.037151D40C2 D. PT instructional 3. Q30 - Q43 174 93 0.53448 0.037815D37P1 D. PT instructional 3. Q30 - Q43 80 45 0.56250 0.055463C33A C. FT Non-instruct. 3. Q30 Q43 297 173 0.58249 0.028615C32I1 C. FT Non-instruct. 3. Q30 - Q43 45 29 0.64444 0.071358
451
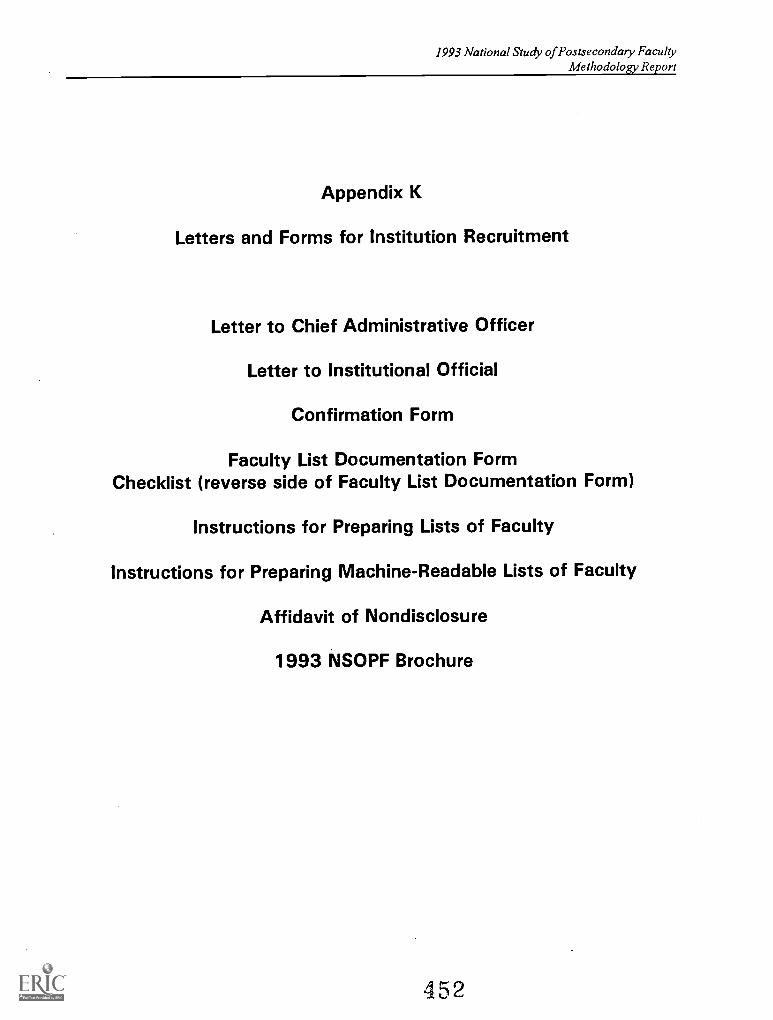
1993 National Study of Postsecondary FacultyMethodology Report
Appendix K
Letters and Forms for Institution Recruitment
Letter to Chief Administrative Officer
Letter to Institutional Official
Confirmation Form
Faculty List Documentation FormChecklist (reverse side of Faculty List Documentation Form)
Instructions for Preparing Lists of Faculty
Instructions for Preparing Machine-Readable Lists of Faculty
Affidavit of Nondisclosure
1993 NSOPF Brochure
452
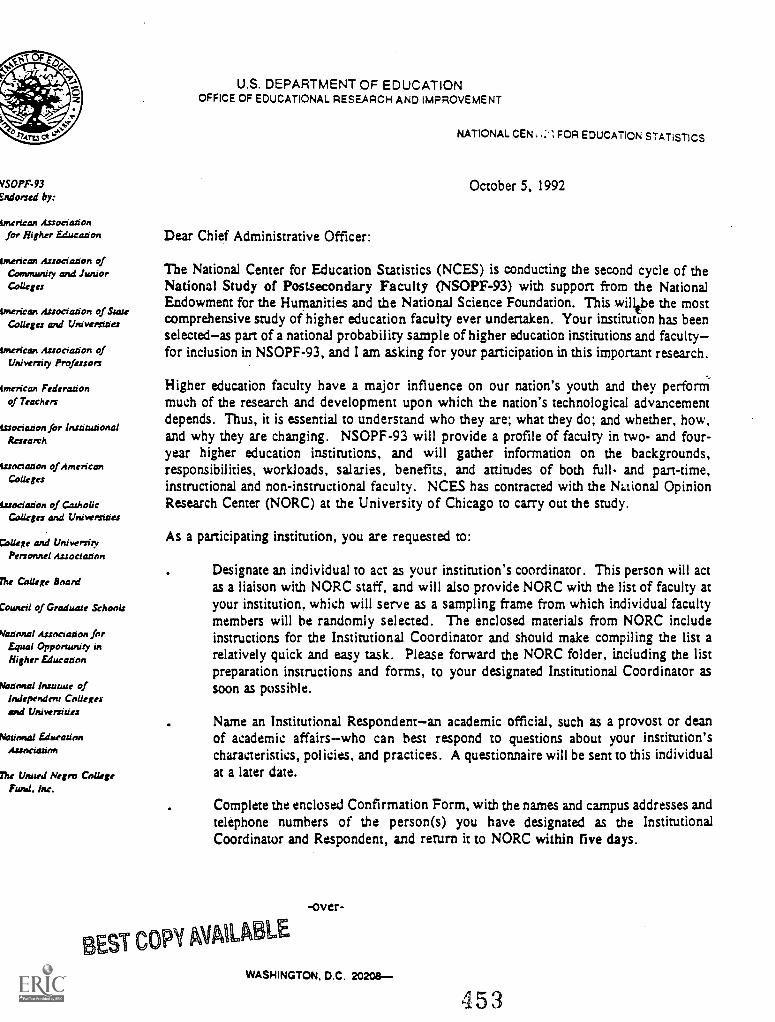
VSOPF-93Endorsed by:
Uneriecin Associationfor Higher Educcuion
Unerican Association ofCommonly and JuniorColleges
Unclean Association of StateColleges and Universities
tmerican Association ofUniversity Professors
tmerican Federationof Teachers
association for InstitutionalResearch
tssociarion of AmericanColleges
Ltsociation of CatholicColleges and Universities
College and UniversityPersonnel Association
The College Board
Council of Graduate Schools
National Association forEqual Opportunity inHigher Education
National huUtute ofIndependent Collegesand Universities
National EducationAssociation
The United Negro CollegeFund. Inc.
U.S. DEPARTMENT OF EDUCATIONOFFICE OF EDUCATIONAL RESEARCH AND IMPROVEMENT
NATIONAL CEN ;FOR EDUCATION STATISTICS
October 5, 1992
Dear Chief Administrative Officer:
The National Center for Education Statistics (NCES) is conducting the second cycle of theNational Study of Postsecondary Faculty (NSOPF-93) with support from the NationalEndowment for the Humanities and the National Science Foundation. This willtbe the mostcomprehensive study of higher education faculty ever undertaken. Your institution has beenselectedas part of a national probability sample of higher education institutions and facultyfor inclusion in NSOPF-93, and I am asking for your participation in this important research.
Higher education faculty have a major influence on our nation's youth and they performmuch of the research and development upon which the nation's technological advancementdepends. Thus, it is essential to understand who they are; what they do; and whether, how,and why they are changing. NSOPF-93 will provide a profile of faculty in two- and four-year higher education institutions, and will gather information on the backgrounds,responsibilities, workloads, salaries, benefits, and attitudes of both full- and part-time,instructional and non-instructional faculty. NCES has contracted with the National OpinionResearch Center (NORC) at the University of Chicago to carry out the study.
As a participating institution, you are requested to:
Designate an individual to act as your institution's coordinator. This person will actas a liaison with NORC staff, and will also provide NORC with the list of faculty atyour institution, which will serve as a sampling frame from which individual facultymembers will be randomly selected. The enclosed materials from NORC includeinstructions for the Institutional Coordinator and should make compiling the list arelatively quick and easy task. Please forward the NORC folder, including the listpreparation instructions and forms, to your designated Institutional Coordinator assoon as possible.
Name an Institutional Respondentan academic official, such as a provost or deanof academic affairswho can best respond to questions about your institution'scharacteristics, policies, and practices. A questionnaire will be sent to this individualat a later date.
Complete the enclosed Confirmation Form, with the names and campus addresses andtelephone numbers of the person(s) you have designated as the InstitutionalCoordinator and Respondent, and return it to NORC within five days.
-over-
EST COPY AVAILA
WASHINGTON, D.C. 20208
4 53
Data provided by your institution and by sampled faculty will be held in strictest confidence. ".idividualresponses, and all information that would permit the identification of individuals or institutions, will be protectedby the Family Educational Rights Privacy Act of 1976, and by Section 406(d) of the General Education ProvisionsAct, as amended by the Hawkins-Stafford Education amendments of 1988, Public Law 100-297. Responses willbe used only in statistical summaries, and individual responses will not be disclosed to any person or group, eitherwithin the sample institution or outside it.
While your participation is voluntary, it is critical if we are to obtain nationally representative samples of highereducation institutions and their faculty. Data collection procedures and questionnaires have been developed tominimize burden on institution staff.
If you have questions or comments concerning the study or this request, please contact the Project Director, Dr.Sameer Abraham of the National Opinion Research Center at the University of Chicago, toll-free at 1-800-733-NORC or the NCES Project Officer, Linda Zimbler, at (202) 219-1834.
I appreciate your interest in this important and useful study, and I thank you for your participation. When theproject is completed, NCES will send you a copy of the final analytic report.
Enclosures
BEST COPY AVAILABLE
454
Sincerely,
Emerson J. ElliottCommissioner
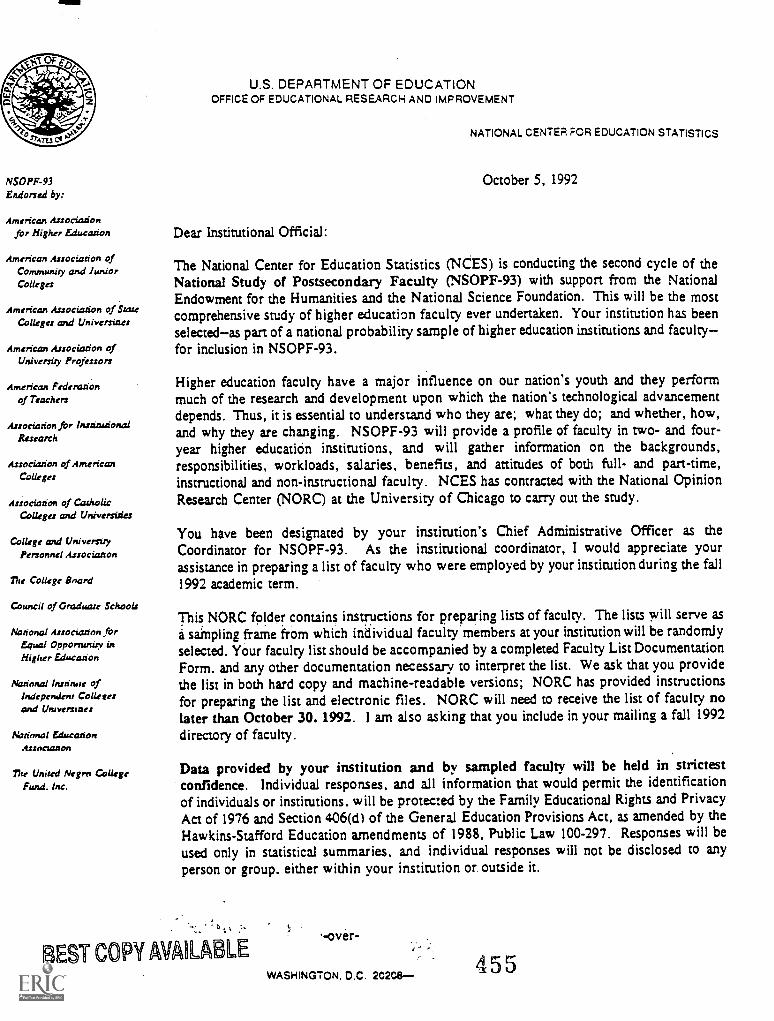
NSOPF-93Endorsed by:
American Associationfor Higher Education
American Association ofCommunity and JuniorColleges
American Association of StateColleges and Universities
American Association ofUniversity Professors
American Federationof Teachers
Association for InstitutionalResearch
Association of AmericanColleges
Association of CatholicColleges and Universities
College and UniversityPersonnel Association
The College Board
Council of Graduate Schools
National Association forEqual Opportunity inHigher Education
National Insanity ofIndependent Collegesand Universanes
Xninnal EducationAssociation
The United Negro CollegeFund. Inc.
rro
U.S. DEPARTMENT OF EDUCATIONOFFICE OF EDUCATIONAL RESEARCH AND IMPROVEMENT
NATIONAL CENTER FOR EDUCATION STATISTICS
October 5, 1992
Dear Institutional Official:
The National Center for Education Statistics (NOES) is conducting the second cycle of theNational Study of Postsecondary Faculty (NSOPF-93) with support from the NationalEndowment for the Humanities and the National Science Foundation. This will be the mostcomprehensive study of higher education faculty ever undertaken. Your institution has beenselectedas part of a national probability sample of higher education institutions and facultyfor inclusion in NSOPF-93.
Higher education faculty have a major influence on our nation's youth and they performmuch of the research and development upon which the nation's technological advancementdepends. Thus, it is essential to understand who they are; what they do; and whether, how,and why they are changing, NSOPF-93 will provide a profile of faculty in two- and four-year higher education institutions, and will gather information on the backgrounds,responsibilities, workloads, salaries, benefits, and attitudes of both full- and part-time,instructional and non-instructional faculty. NCES has contracted with the National OpinionResearch Center (NORC) at the University of Chicago to carry out the study.
You have been designated by your institution's Chief Administrative Officer as theCoordinator for NSOPF-93. As the institutional coordinator, I would appreciate yourassistance in preparing a list of faculty who were employed by your institution during the fall1992 academic term.
This NORC folder contains instructions for preparing lists of faculty. The lists will serve asa sampling frame from which individual faculty members at your institution will be randomlyselected. Your faculty list should be accompanied by a completed Faculty List DocumentationForm. and any other documentation necessary to interpret the list. We ask that you providethe list in both hard copy and machine-readable versions; NORC has provided instructionsfor preparing the list and electronic files. NORC will need to receive the list of faculty nolater than October 30. 1992. 1 am also asking that you include in your mailing a fall 1992directory of faculty.
Data provided by your institution and by sampled faculty will be held in strictestconfidence. Individual responses, and all information that would permit the identificationof individuals or institutions, will be protected by the Family Educational Rights and PrivacyAct of 1976 and Section 406(d) of the General Education Provisions Act, as amended by theHawkins-Stafford Education amendments of 1988, Public Law 100-297. Responses will beused only in statistical summaries, and individual responses will not be disclosed to anyperson or group. either within your institution or outside it.
EST COPY AVAILABLE-over-
WA SH I N GTO N , D . C . 2020S-455
To conform with these confidentiality protections, please sign and notarize the enclosed NCES Affidavit ofNondisclosure. In signing this Affidavit, you are pledging that any information you may obtain regarding facultyin the NSOPF sample will not be released by you to anyone at your institution or elsewhere.
I understand that your institution may have provisions against releasing certain types of information; pleasecontact NORC at the toll-free number below if your institution has such provisions concerning any of theinformation requested. Once NORC has mailed questionnaires to the faculty sample members from yourinstitution, you may be asked for your assistance in prompting these individuals to complete the survey by thescheduled due date.
Public reporting burden for this information is estimated to average one hour per response, including the timefor reviewing instructions, identifying data sources, gathering the data. and completing and reviewing thecollection of information. Send comments regarding this burden estimate or any other aspect of this collectionof information, including suggestions for reducing this burden, to the U.S. Department of Education, InformationManagement and Compliance Division, Washington, D.C. 20202-4651; and to the Office of Management andBudget, Paperwork Reduction Project 1850-0665, Washington, D.C. 20503.
If you have questions or comments concerning the study or about preparing the lists, please contact the ProjectDirector. Dr. Sameer Abraham of the National Opinion Research Center at the University of Chicago, toll-free,at 1 -800- 733 -NORC.
I appreciate your interest in this important and useful study, and I thank you again for your participation.When the project is completed, NCES will send your institution a copy of the final analytic report.
Enclosures
Sincerely,
/Emerson J. ElliottCommissioner
456 BEST COPY AVAILABLE
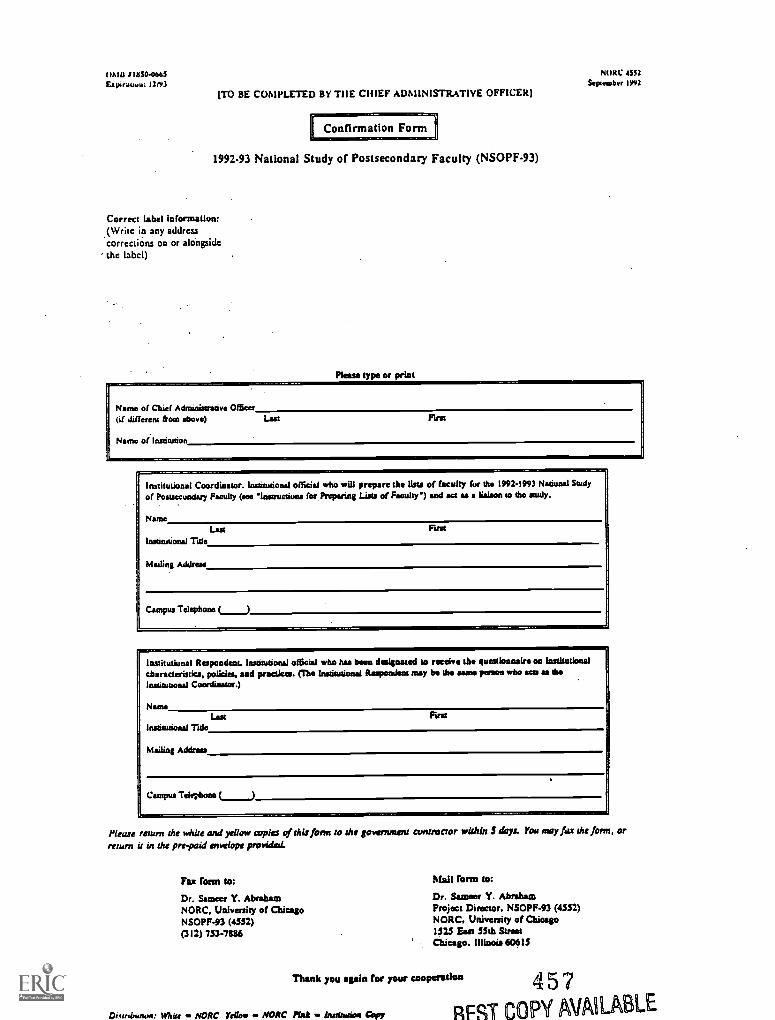
OMB 91930-0605Eapirouvu: 12193
(TO BE COMPLETED BY TIIE CHIEF ADMINISTRATIVE OFFICER)
IConfirmation Form
1992-93 National Study of Postsecondary Faculty (NSOPF-93)
Correct label Information:(Write in any addresscorrections on or alongside
' the label)
Please type or print
NOIle 4352Stpteusber 1992
Name of Chief Administrative OfficerFirst(if different from above) Last
Namo of lestionion
Institutional Coordinator. Innitudetud official who will prepare the lists of faculty fur the 1992-1993 National Studyof Postsecondary Faculty (see loscructiuns for Preparing Lists of Faculty') and act as liaison to the study.
NameLast
Institutional Tile
Fast
Mailing Addicts*
Campus Telephone (___)
Institutional Respondent. In itudonal official who has been designated to receive the questionnaire on institutionalcharacteristics, policies, and practket. (Die Institutional Respondent may be the same person who ace as estiInstitutional Coordinator.)
Instinsionsl Tide
Mailing Address
Last Firs
Campus Teler,bone ( )
Please return the white and yellow copies of this form to the govenuneu contractor within S days. You may fax the form, orreturn it in the pre-paid envelope provided.
Fax form to: Mall form to:
Dr. Sumer Y. AbrahamNORC, University of ChicagoNSOPF-93 (4552)(312) 753-7886
Dr. Sumer Y. AbrahamProject Director, NSOPF-93 (4552)NORC, University of Chicago1525 East 55th StreetChicago, Illinois 60615
Thank you again for your cooperation
Diuninaion: White NORC Yellow NORC Pink w bunnoion Copy SFST C
4 5 7
OPY AVAILABLE
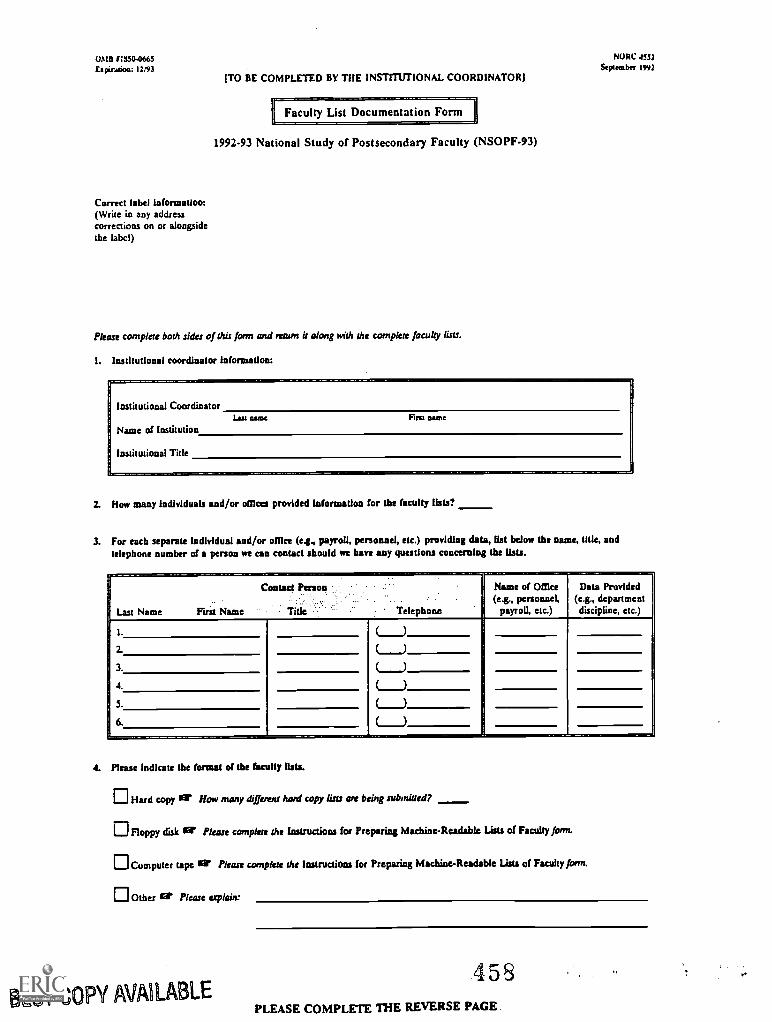
()31/3 /1930-0665EsMr.miom: 12/93
(TO BE COMPLETED BY THE INSTITUTIONAL COORDINATOR)
Faculty List Documentation Form
1992-93 National Study of Postsecondary Faculty (NSOPF-93)
Correct label information:(write in any addresscorrections on or alongsidethe label)
Please complete both sides of this fonts and return it along with the complete faculty lists.
1. Institutional coordinator information:
MAC 4552September 1992
Institutional Coordinator
Name of Institution
Institutional Title
Lag tame First name
2. How many individuals and/or offices provided information for the faculty lists?
.3. For each separate individual and/or *Mee (e.g., payroll, personnel, etc.) providing data, list below the name, title, andtelephone number of a person we can contact should we have any questions concerning the lists.
Contact Person
Last Name First Name Title Telephone
Name of Office(e.g.. personae!,
payroll, etc.)
Data Provided(e.g., departmentdiscipline, etc.)
1. (---)2. (--)3. (---)4. C---)5. (---.)6. (---)
4. Please Indicate the format of the faculty lists.
Hard copy gr How many different had copy lists are being submitted?
0 Floppy disk gar Please complete the Instructions for Preparing Machine-Readable Lists of Faculty joint.
Computer tape Sar Please complete the Instructions for Preparing Machine-Readable Lists of Faculty form.
Other 11:, Please explain:
BEST COPY AVAILABLE458
PLEASE COMPLETE THE REVERSE PAGE
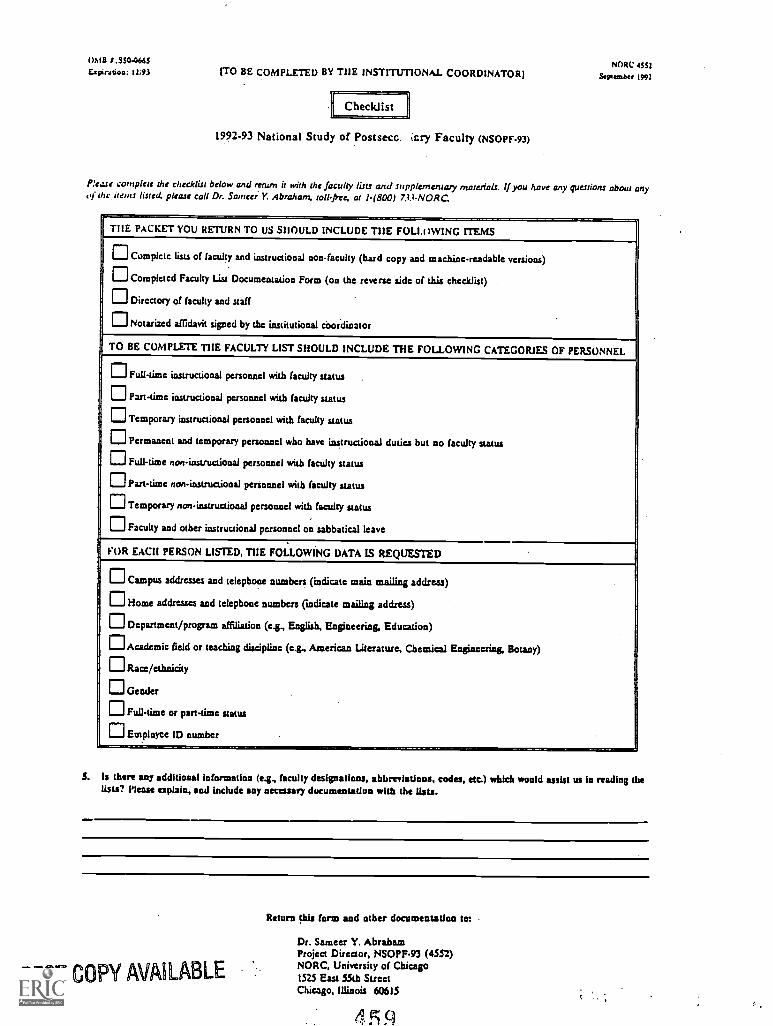
OMB /.330-0643(Apr-Aston: 11;93 (TO BE COMPLETED BY TIIE INSTITUTIONAL. COORDINATOR)
Checklist
1992.93 National Study of Postsecc. ,cry Faculty (NSOPF-93)
NORC 4552
September 1991
P:esse complete the checklist below and return it with the faculty lists and supplemerucoy materials. Ifyou have any questions about anyof the, items listed please call Dr. Sameer Y. Abraham, toll-free, at I-(800) 73.1-NORC
THE PACKET YOU RETURN TO US SHOULD INCLUDE THE FOLLOWING ITEMS
Complete lists of (acuity and instructional non-faculty (hard copy and machine-readable versions)
Completed Faculty List Documentation Form (on the reverse side of this checklist)
Directory of faculty and staff
Notarized affidavit signed by the institutional cbordinator
TO BE COMPLETE THE FACULTY LIST SHOULD INCLUDE THE FOLLOWING CATEGORIES OF PERSONNEL
Full-time instructional personnel with faculty status
Part-time instructional personnel with faculty status
Temporary instructional personnel with faculty status
Permanent and temporary personnel who have instructional duties but no faculty status
Full-time non-instructioaal personnel with faculty status
Part-time non-instructional personnel with faculty status
Temporary non-instructional personnel with faculty status
Faculty and other instructional personnel on sabbatical leave
FOR EACI1 PERSON LISTED, THE FOLLOWING DATA IS REQUESTED
Campus addresses and telephone numbers (indicate main mailing address)
Home addresses and telephone numbers (indicate mailing address)
Department/program affiliation (e.g, English, Engineering, Education)
Academic field or teaching discipline (e.g, American Literature, Chemical Engineering, Botany)
Race/ethnicity
Gender
Full-time or part-time status
Employee ID number
S. Is there any additional information (e.g., faculty designations, abbreviations, codes, etc.) which would assist us in reading thelists? Please explain, and include any necessary documentatiun with the lists.
BEST COPY AVAILABLE
Return this form and other documentation to:
Dr. Sameer Y. AbrahamProject Director, NSOPF-93 (4552)NORC, University of Chicago1525 East 55th StreetChicago, Illinois 60615
459
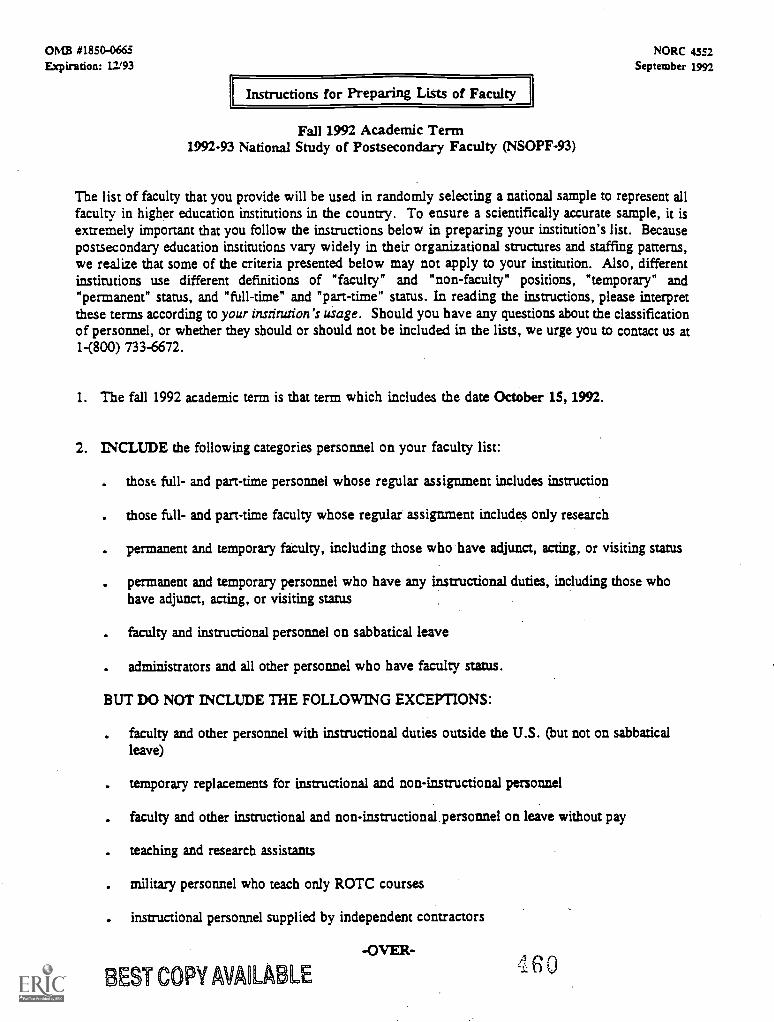
OMB #1850-0665Expiration: 12/93
Instructions for Preparing Lists of Faculty
Fall 1992 Academic Term1992-93 National Study of Postsecondary Faculty (NSOPF-93)
NORC 4552September 1992
The list of faculty that you provide will be used in randomly selecting a national sample to represent allfaculty in higher education institutions in the country. To ensure a scientifically accurate sample, it isextremely important that you follow the instructions below in preparing your institution's list. Becausepostsecondary education institutions vary widely in their organizational structures and staffing patterns,we realize that some of the criteria presented below may not apply to your institution. Also, differentinstitutions use different definitions of "faculty" and "non-faculty" positions, "temporary" and"permanent" status, and "full-time" and "part-time" status. In reading the instructions, please interpretthese terms according to your institution's usage. Should you have any questions about the classificationof personnel, or whether they should or should not be included in the lists, we urge you to contact us at1-(800) 733-6672.
1. The fall 1992 academic term is that term which includes the date October 15, 1992.
2. INCLUDE the following categories personnel on your faculty list:
. those full- and part-time personnel whose regular assignment includes instruction
. those full- and part-time faculty whose regular assignment includes only research
. permanent and temporary faculty, including those who have adjunct, acting, or visiting status
. permanent and temporary personnel who have any instructional duties, including those whohave adjunct, acting, or visiting status
f aculty and instructional personnel on sabbatical leave
administrators and all other personnel who have faculty status.
BUT DO NOT INCLUDE THE FOLLOWING EXCEPTIONS:
f aculty and other personnel with instructional duties outside the U.S. (but not on sabbaticalleave)
temporary replacements for instructional and non-instructional personnel
f aculty and other instructional and non-instructional personnel on leave without pay
teaching and research assistants
military personnel who teach only ROTC courses
instructional personnel supplied by independent contractors
-OVER-
BEST COPY AVAILABLE6 .0
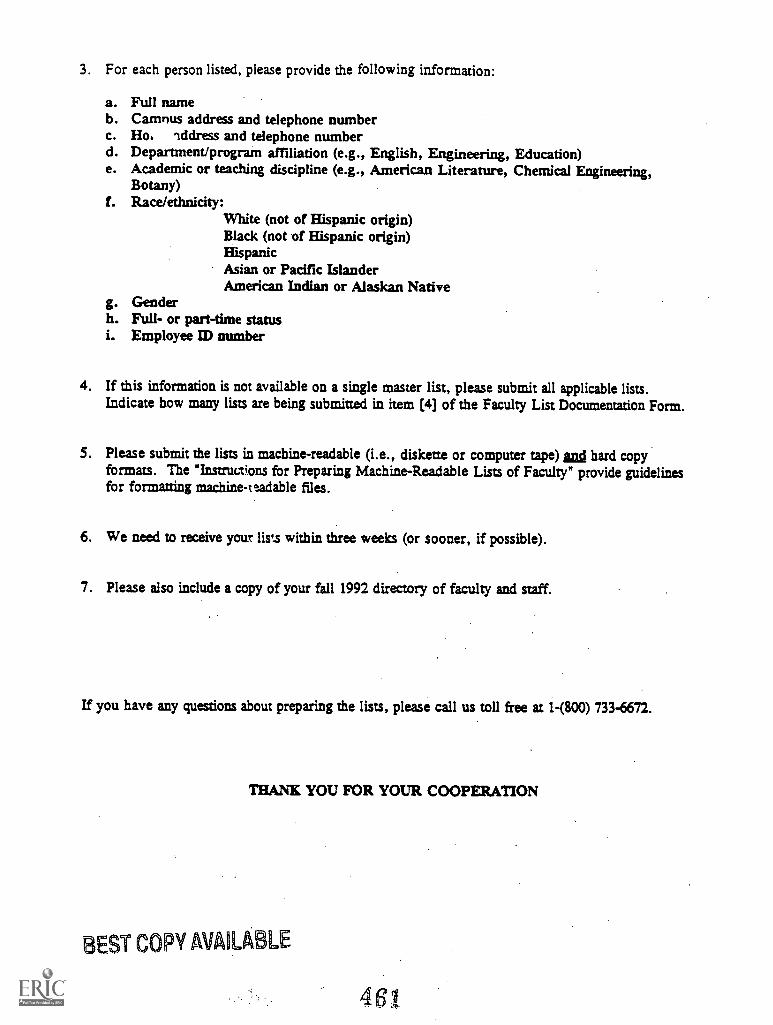
3. For each person listed, please provide the following information:
a. Full nameb. Camnus address and telephone numberc. Ho. address and telephone numberd. Department/program affiliation (e.g., English, Engineering, Education)e. Academic or teaching discipline (e.g., American Literature, Chemical Engineering,
Botany)f. Race/ethnicity:
White (not of Hispanic origin)Black (not of Hispanic origin)HispanicAsian or Pacific IslanderAmerican Indian or Alaskan Native
g. Genderh. Full- or part-time statusi. Employee ID number
4. If this information is not available on a single master list, please submit all applicable lists.Indicate how many lists are being submitted in item [4] of the Faculty List Documentation Form.
5. Please submit the lists in machine-readable (i.e., diskette or computer tape) Bad hard copyformats. The "Instructions for Preparing Machine-Readable Lists of Faculty" provide guidelinesfor formatting machine - tradable files.
6. We need to receive your lists within three weeks (or sooner, if possible).
7. Please also include a copy of your fall 1992 directory of faculty and staff.
If you have any questions about preparing the lists, please call us toll free at 1-(800) 733-6672.
THANK YOU FOR YOUR COOPERATION
BEST COPY AVAILABLE
4 61
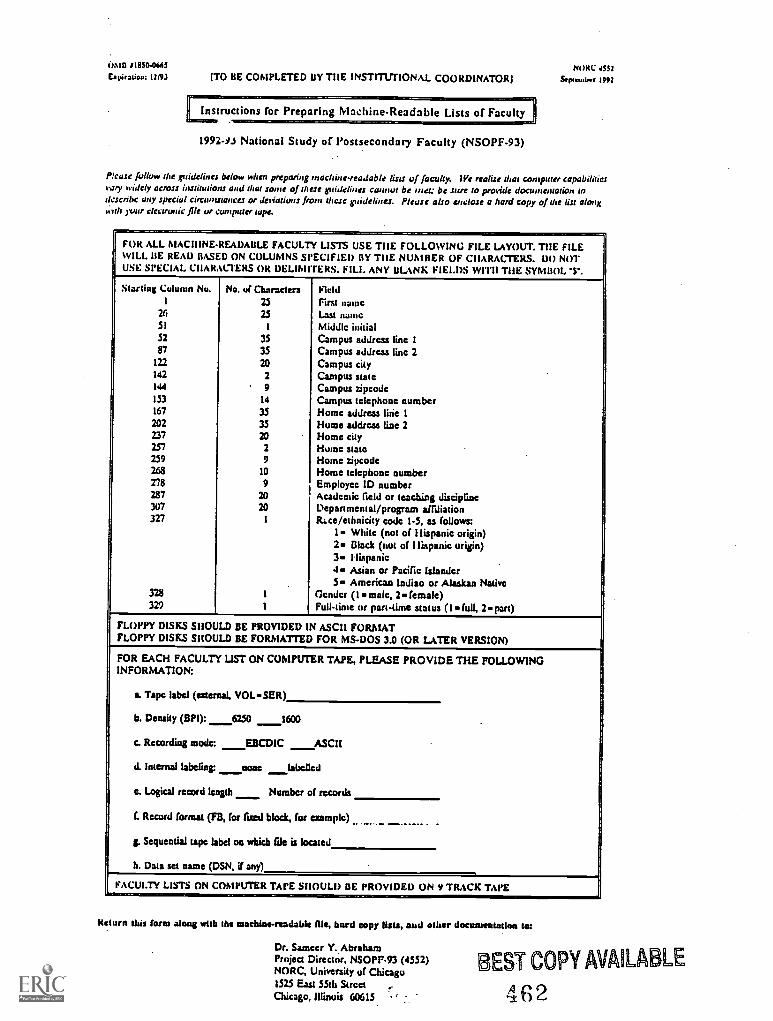
i)N10 11850.0645
Eapitatiou: 11193 (TO BE COMPLETED UY TIIE INSTITUTIONAL COORDINATOR(
Instructions for Preparing Machine-Readable Lists of Faculty
1992-0i National Study of Postsecondary Faculty (NSOPF-93)
19012 4532
Sepatuslrer 1992
Please follow the guidelines below when preparing machine-readable lists of faculty. lye realize that computer capabilitiesvary widely across institutions and that some of these guidelines cannot be met; be sure to provide documentation todeserthe any special circumstances or deviations from these guidelines. Please also enclose a hard copy of the list alongWith your elccoonie file to computer tape.
FOR ALL MACIIINE- READABLE FACULTY LISTS USE TIIE FOLLOWING FILE LAYOUT. THE FILEWILL BE READ BASED ON COLUMNS SPECIFIED BY TIIE NUMBER OF CUARACTEILS. DO NOTUSE SPECIAL CHARACTERS OR DELIMITERS. FILL ANY BLANK FIELDS mill TIIE SYMBOL'S'.
Starting Column Nu.I
26
51
52
87
122
142
144
153
167
202237
257259268
278
287307327
328
329
No. of Characters2525
1
35
35
202
' 914
3535
202
9
10
92020
I
I1
FieldFirst nameLast nameMiddle initialCampus address line ICampus address line 2Campus cityCampus stateCampus zipcodeCampus telephone numberHome address line IHome address line 2Home cityHome stateHome zipcodeHome telephone numberEmployee ID numberAcademic field or teaching disciplineDepartmental /program affiliationRace /ethnicity code 1.5, as follows:
1. White (not of Hispanic origin)2- Black (not of Hispanic origin)3° Hispanic4 Asian or Pacific Islander5w American Indian or Alaskan Native
Gender (I -male, 2-female)Full-time or part-time status (I = full, 2-part)
FLOPPY DISKS SHOULD BE PROVIDED N ASCII FORMATFLOPPY DISKS SHOULD BE FORMATTED FOR MS-DOS 3.0 (OR LATER VERSION)
FOR EACH FACULTYINFORMATION:
a. Tape label (external,
b. Density (BPI):
LIST ON COMPUTER TAPE, PLEASE PROVIDE THE FOLLOWING
VOL -SER)
ASCIIc. Recording mode:
d. Internal labeling:
e. Logical record length
f. Record format (FD,
g. Sequential tape label
B. Data set name (DSN,
_6250 _1600
_EBCDIC
none labelled
of recordsNumber
(or fixed block, for
on which file is located
if any)
example)
FACULTY LISTS ON COMPUTER TAPE SHOULD UE PROVIDED ON 9 TRACK TAPE
Return this form along with the machine-readable Ale, hard copy lists, and oilier documentation to:
Dr. Someer Y. AbrahamProject Director, NSOP12-93 (4552)NORC, University of Chicago1525 East 55th StreetChicago, Illinois 60615
BEST COPY AVAILABLE
462
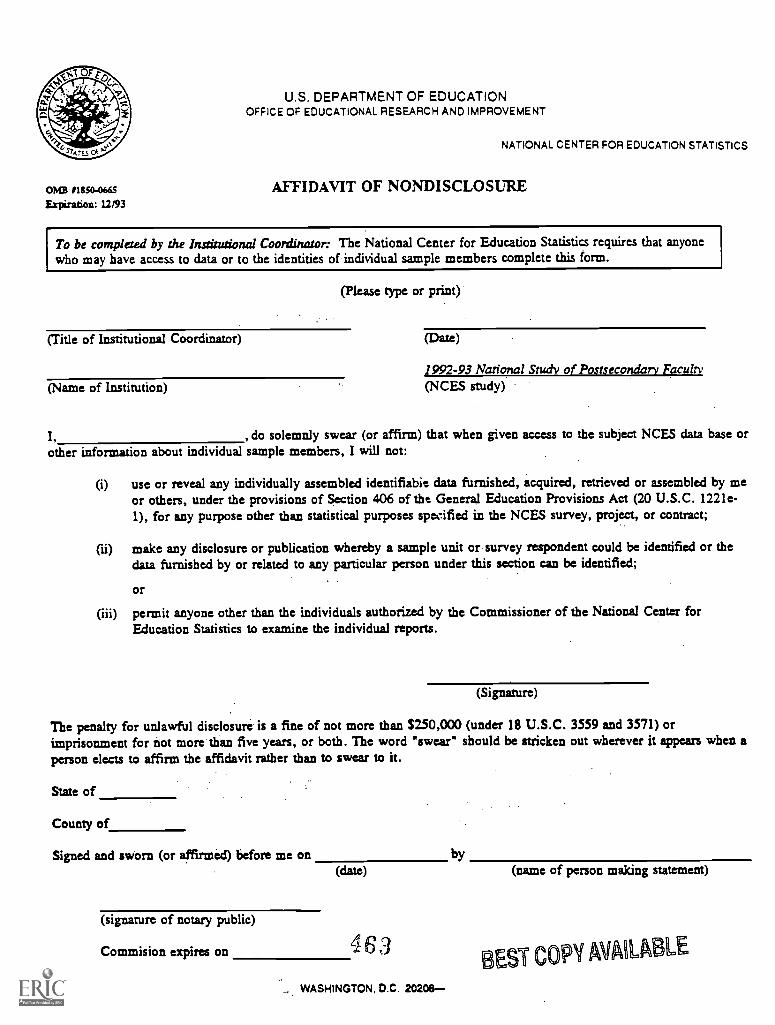
OMB 11850-0665
Expiration: 12/93
U.S. DEPARTMENT OF EDUCATIONOFFICE OF EDUCATIONAL RESEARCH AND IMPROVEMENT
NATIONAL CENTER FOR EDUCATION STATISTICS
AFFIDAVIT OF NONDISCLOSURE
To be completed by the Institutional Coordinator: The National Center for Education Statistics requires that anyonewho may have access to data or to the identities of individual sample members complete this form.
(Please type or print)
(Title of Institutional Coordinator)
(Name of Institution)
(Date)
1992-93 National Study of Postsecondary Faculty,(NCES study)
, do solemnly swear (or affirm) that when given access to the subject NCES data base orother information about individual sample members, I will not:
(i) use or reveal any individually assembled identifiabie data furnished, acquired, retrieved or assembled by meor others, under the provisions of Section 406 of the General Education Provisions Act (20 U.S.C. 1221e-1), for any purpose other than statistical purposes specified in the NCES survey, project, or contract;
make any disclosure or publication whereby a sample unit or survey respondent could be identified or thedata furnished by or related to any particular person under this section can be identified;
or
(iii) permit anyone other than the individuals authorized by the Commissioner of the National Center forEducation Statistics to examine the individual reports.
(Signature)
The penalty for unlawful disclosure is a fine of not more than S250,000 (under 18 U.S.C. 3559 and 3571) orimprisonment for not more than five years, or both. The word "swear" should be stricken out wherever it appears when aperson elects to affirm the affidavit rather than to swear to it.
State of
County of
Signed and sworn (or affirmed) before me on by(date) (name of person making statement)
(signature of notary public)
Commision expires on46
WASHINGTON, D.C. 20208
EST COPY AVAILABLE
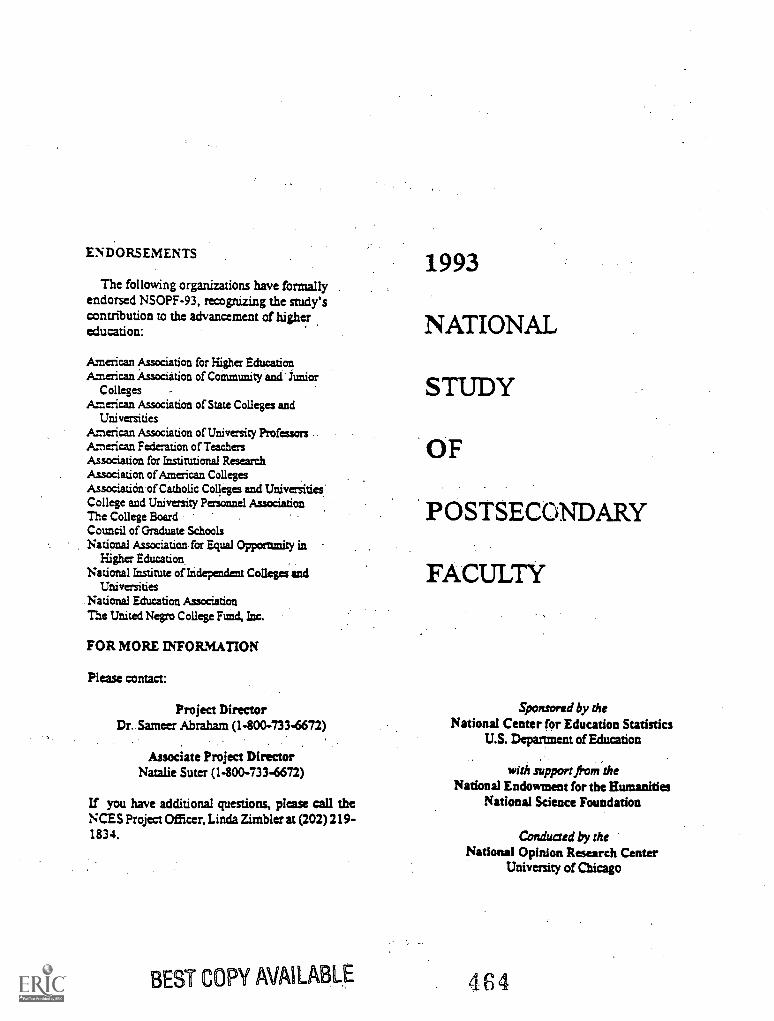
ENDORSEMENTS
The following organizations have formallyendorsed NSOPF-93, recognizing the study'scontribution to the advancement of highereducation:
American Association for Higher EducationAmerican Association of Commimity and Junior
Colleges -
American Association of State Colleges andUniversities
American Association of University ProfessorsAmerican Federation of TeachersAssociation for Institutional ResearchAssociation of American CollegesAssociatiOn of Catholic Colleges and UniversitiesCollege and University Personnel AssociationThe College BoardCouncil of Graduate SchoolsNational Association for Equal Opportunity in
Higher EducationNational Institute of Independent Colleges and
UniversitiesNational Education AssociationThe United Negro College Fund, Inc.
FOR MORE INFORMATION
Please contact:
Project DirectorDr., Sarneer Abraham (1400-733-6672)
Associate Project DirectorNatalie Suter (1400-733-6672)
If you have additional questions, please call theNCES Project Officer, Linda Zimbler at (202) 219-1834.
BEST COPY AVAILABLE
1993
NATIONAL
STUDY
OF
POSTSECONDARY
FACULTY
Sponsored by theNational Center for Education Statistics
U.S. Department of Education
with support from theNational Endowment for the Humanities
National Science Foundation
Conducted by theNational Opinion Research Center
University of Chicago
464
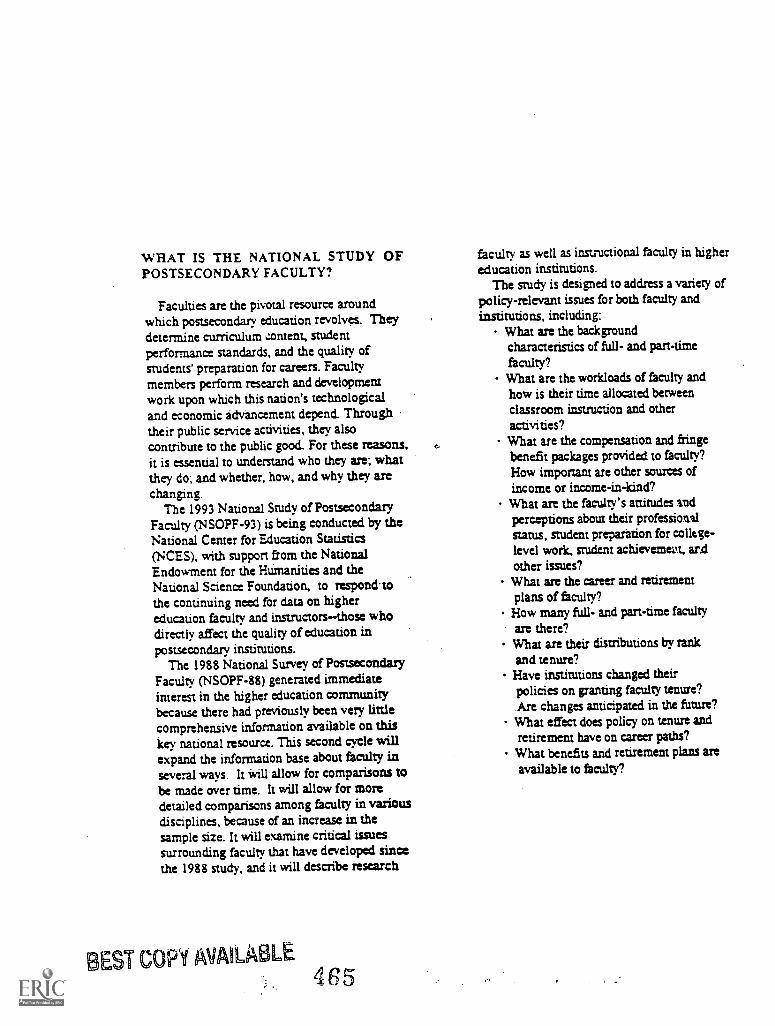
WHAT IS THE NATIONAL STUDY OFPOSTSECONDARY FACULTY?
Faculties are the pivotal resource aroundwhich postsecondary education revolves. Theydetermine curriculum content, studentperformance standards, and the quality ofstudents' preparation for careers. Facultymembers perform research and developmentwork upon which this nation's technologicaland economic advancement depend. Throughtheir public service activities, they alsocontribute to the public good. For these reasons,it is essential to understand who they are; whatthey do; and whether, how, and why they arechanging.
The 1993 National Study of PostsecondaryFaculty (NSOPF-93) is being conducted by theNational Center for Education Statistics(NCES), with support from the NationalEndowment for the Humanities and theNational Science Foundation, to respond.tothe continuing need for data on highereducation faculty and instructorsthose whodirectly affect the quality of education inpostsecondary institutions.
The 1988 National Survey of PostsecondaryFaculty (NSOPF88) generated immediateinterest in the higher education communitybecause there had previously been very littlecomprehensive information available on thiskey national resource. This second cycle willexpand the information base about faculty inseveral ways. It will allow for comparisons tobe made over time. It will allow for moredetailed comparisons among faculty in variousdisciplines, because of an increase in thesample size. It will examine critical issuessurrounding faculty that have developed sincethe 1988 study, and it will describe research
BEST COPY AVAILABLE465
faculty as well as instructional faculty in highereducation institutions.
The study is desired to address a variety ofpolicy-relevant issues for both faculty andinstitutions, including:
What are the backgroundcharacteristics of full- and pan-timefaculty?What are the workloads of faculty andhow is their time allocated betweenclassroom instruction and otheractivities?What are the compensation and fringebenefit packages provided to faculty?How important are other sources ofincome or income-in-kind?What are the faculty's attitudes andperceptions about their professionalstatus, student preparation for college-level work, student achievement, andother issues?What are the career and retirementplans of faculty?
How many full- and part-time facultyare there?What are their distributions by rankand tenure?Have institutions changed theirpolicies on granting faculty tenure?Are changes anticipated in the future?
What effect does policy on tenure andretirement have on career paths?What benefits and retirement plans areavailable to faculty?
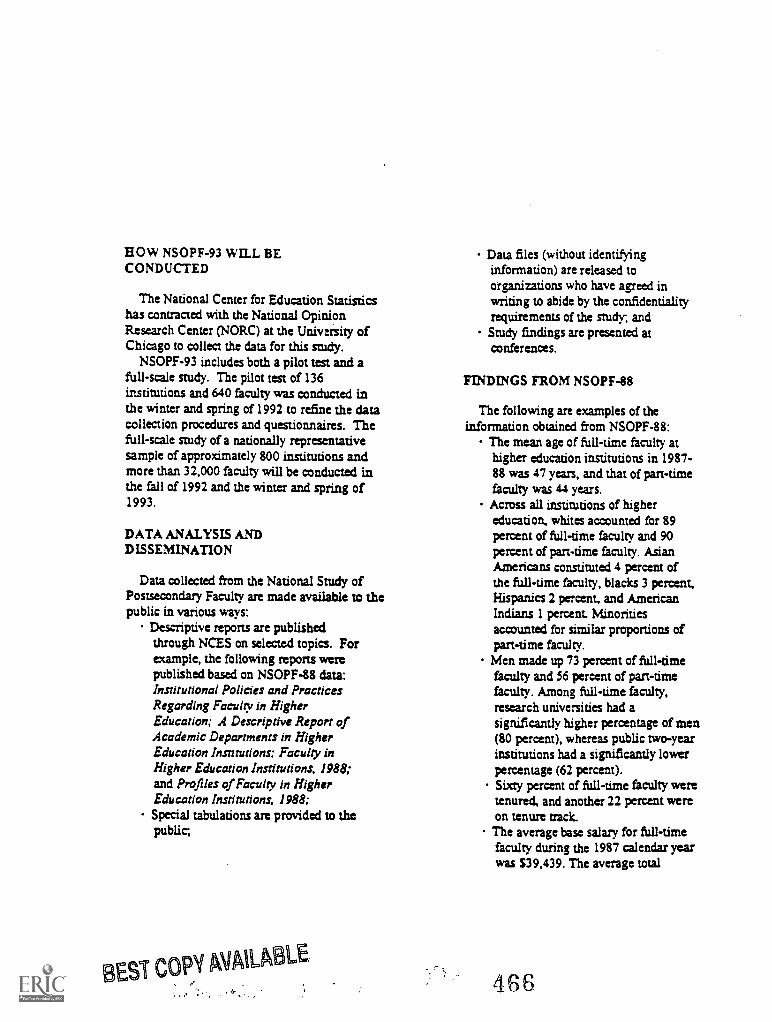
HOW NSOPF-93 WILL BECONDUCTED
The National Center for Education Statisticshas contracted with the National OpinionResearch Center (NORC) at the University ofChicago to collect the data for this study.
NSOPF-93 includes both a pilot test and afull-scale study. The pilot test of 136institutions and 640 faculty was conducted inthe winter and spring of 1992 to refine the datacollection procedures and questionnaires. Thefull-scale study of a nationally representativesample of approximately 800 institutions andmore than 32,000 faculty will be conducted inthe fall of 1992 and the winter and spring of1993.
DATA ANALYSIS ANDDISSEMINATION
Data collected from the National Study ofPostsecondary Faculty are made available to thepublic in various ways:
Descriptive reports are publishedthrough NCES on selected topics. Forexample, the following reports werepublished based on NSOPF-88 data:Institutional Policies and PracticesRegarding Faculty in HigherEducation; A Descriptive Report ofAcademic Departments in HigherEducation Institutions; Faculty inHigher Education Institutions, 1988;and Profiles of Faculty in HigherEducation Institutions, 1988;Special tabulations are provided to thepublic;
BEST COI AVAILkFP' LE
Data files (without identifyinginformation) are released toorganizations who have agreed inwriting to abide by the confidentialityrequirements of the study; andStudy findings are presented atconferences
FINDINGS FROM NSOPF-88
The following are examples of theinformation obtained from NSOPF-88:
The mean age of full-time faculty athigher education institutions in 1987-88 was 47 years, and that of part-timefaculty was 44 years.Across all institutions of highereducation, whites accounted for 89percent of full-time faculty and 90percent of part-time faculty. AsianAmericans constituted 4 percent ofthe full-time faculty, blacks 3 percent.Hispanics 2 percent, and AmericanIndians 1 percent. Minoritiesaccounted for similar proportions ofpart-time faculty.Men made up 73 percent of full-timefaculty and 56 percent of part-timefaculty. Among full-time faculty,research universities had asignificantly higher percentage of men(80 percent), whereas public two-yearinstitutions had a significantly lowerpercentage (62 percent).Sixty percent of full-time faculty weretenured, and another 22 percent wereon tenure track.The average base salary for full-timefaculty during the 1987 calendar yearwas 539,439. The average total
466
incomebase salary, other institutionalincome, consulting, and other outsideincomewas $48,701. For part-time faculty,the average base salary was $6,829, andthe average total income was 533,841,including income from other (perhapsfull-time) employment.
Forty-two percent of the full-time facultyearned some income from consulting, andaveraged $7,886 per year in consultingincome. Twenty- eight percent of the full-time faculty had other, kinds of. incomeaveraging S8,412 from these sources.Among full-time faculty, those in
private research universities had thehighest average total income ($74,732).Faculty in public research universities alsohad higher than average total income($58,309). Those in public comprehensive,public two-year, and liberal arts institutionshad lower than average total incomes,earning $42,965, 538,539, andS32,740, respectively.
CONFIDENTIALITY
The National Study of Postsecondary Faculty isbeing conducted in compliance with the mandatestated in section 406(g) of the General EducationProvisions Act (GEPA), as amended by theHawkins-Stafford Education Amendments of1988 (Public Law 100-297).
The Family Education Rights and Privacy Actof 1974 [20 U.S.C. 1232g] allows the release ofinstitutional record information to the Secretaryof Education or his agent without prior consent ofsurvey members, in connection with theenforcement of Federal legal requirements [20U.S.C. 1232g (b) (3)]. Since NCES is anauthorized representative of the Secretary of
Education, compliance with an NCES officialrequest for information constitutes compliancewith the laws cited above.
Strict confidentiality of all informationobtained from NSOPF is assured by currentfederal laws and regulations. Public Law 100-297 established that all records on individualsmust be kept confidential by NCES and itscontractors under penalty of law. Researchersare subject to fines and imprisonment for misuseor disclosure of individual data
Procedures have been implemented to ensureconfidentiality and privacy of all informationobtained. Specifically:
. All project staff with any access to study datahave signed an affidavit of nondisclosurewhich subjects them to possible fines andimprisonment for any disclosure ofindividual responses.All electronic data are maintained insecure and protected data files, and allpersonally identifying information ismaintained in files separate from filescontaining descriptive information.Any data released to the general public(for example, statistical tables) will betailored so that it is not possible toidentify specific individuals orinstitutions.
4 2BEST COPY AVAILABLE
1993 National Study of Postsecondary FacultyMethodology Report
Appendix L
Letters to Faculty Questionnaire Respondents
Initial Cover Letter to Faculty
Second Faculty Questionnaire Mailing
Third Faculty Questionnaire Mailing
488
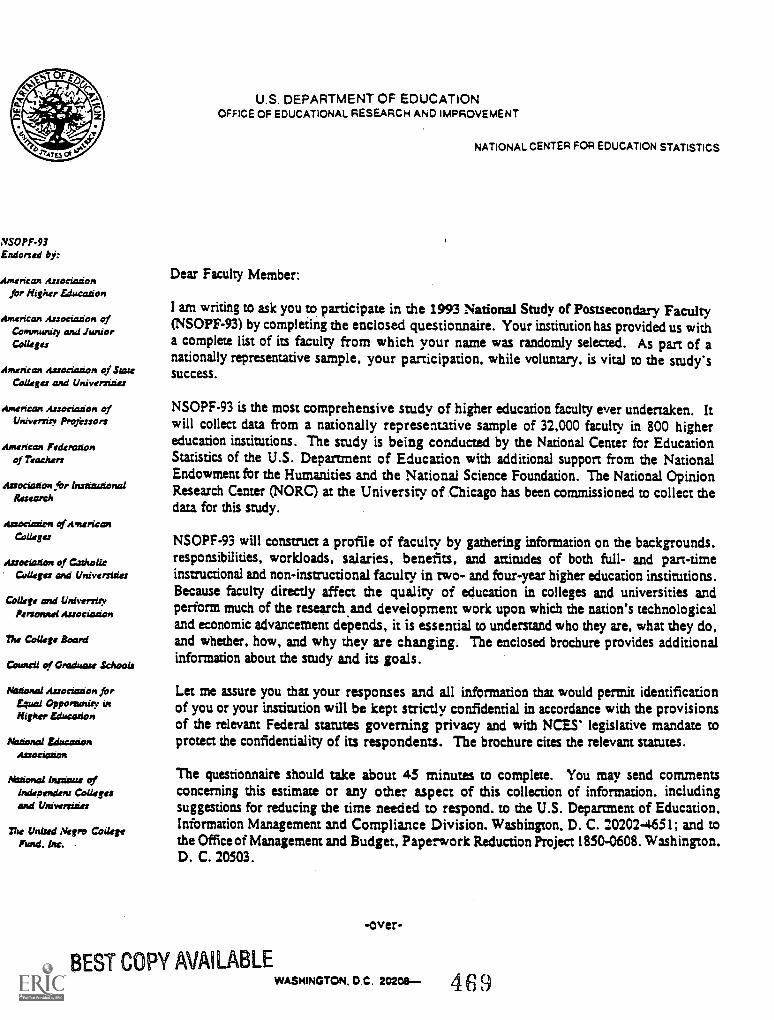
NSOPF-93Endorsed by:
American .4ssociationfor Nigher Education
American Association ofCommunity and JuniorColleges
American Association of StateColleges and Universities
American Association ofUniversity Professors
American Federationof Teachers
Association for bsstitutionalResearch
Associasion of AmericanColleges
Association of CatholicColleges and Universities
College and UniversityPelSOMIti Association
The College Board
Council of Graduate Schools
Nadonal Association fortaunt Oppordinity inNigher Education
National EducationAssociation
National Institute ofIndependent Collegesand Universities
me United Negro CollegeFund. km
U.S. DEPARTMENT OF EDUCATIONOFFICE OF EDUCATIONAL RESEARCH AND IMPROVEMENT
NATIONAL CENTER FOR EDUCATION STATISTICS
Dear Faculty Member:
I am writing to ask you to participate in the 1993 National Study of Postsecondary Faculty(NSOPF-93) by completing the enclosed questionnaire. Your institution has provided us witha complete list of its faculty from which your name was randomly selected. As part of anationally representative sample, your participation, while voluntary, is vital to the study'ssuccess.
NSOPF-93 is the most comprehensive study of higher education faculty ever undertaken. Itwill collect data from a nationally representative sample of 32.000 faculty in 800 highereducation institutions. The study is being conducted by the National Center for EducationStatistics of the U.S. Department of Education with additional support from the NationalEndowment for the Humanities and the National Science Foundation. The National OpinionResearch Center (NORC) at the University of Chicago has been commissioned to collect thedata for this study.
NSOPF-93 will construct a profile of faculty by gathering information on the backgrounds.responsibilities, workloads, salaries, benefits, and attitudes of both full- and part-timeinstructional and non-instructional faculty in two- and four-year higher education institutions.Because faculty directly affect the quality of education in colleges and universities andperform much of the research.and development work upon which the nation's technologicaland economic advancement depends, it is essential to understand who they art, what they do,and whether, how, and why they are changing. The enclosed brochure provides additionalinformation about the study and its goals.
Let me assure you that your responses and all information that would permit identificationof you or your institution will be kept strictly confidential in accordance with the provisionsof the relevant Federal statutes governing privacy and with NCES' legislative mandate toprotect the confidentiality of its respondents. The brochure cites the relevant statutes.
The questionnaire should take about 45 minutes to complete. You may send commentsconcerning this estimate or any other aspect of this collection of information. includingsuggestions for reducing the time needed to respond. to the U.S. Department of Education,Information Management and Compliance Division. Washington. D. C. 20202-4651; and tothe Office of Management and Budget, Paperwork Reduction Project 1850-0608. Washington.D. C. 20503.
BEST COPY AVAILABLE
-over-
WASHINGTON. 0 C. 20206 4 6 9
Please return your completed Faculty Questionnaire in the accompanying NORC business-reply envelope within the nextweek. 1: you have any questions concerning the questionnaire or the study. please contact the Project Director, Dr.Sameer Abraham of NORC, toll-free at l-800-733-NORC.
I thank you for your participation in this important study.
Enclosures
470
Sincerely.
Emerson J. ElliottCommissioner
BESI COM ANINILABLE
(SOPF93:nt forted by:
Snerican Associationfor Higher Education
1merican Association ofCommunity and JuniorColleges
Inierican Association of StateColleges and Universities
Imerican Association ofUniversity Professors
*Mean Federationof Teachers
Luociation for institutionalResearch
Luoviation of lrnericaColleges
Issociadon of CatholicColleges and Universities
College and UniversityPersonnel Association
Me College Board
Council of Graduate School:
Wational Association forEqual Oppornatity inHigher Education
National EducationAssociation
Maternal burtnue ofindependent Collegesand Universities
The United Negro CollegeFund. inc.
LTR2
U.S. DEPARTMENT OF EDUCATIONOFFICE OF EDUCATIONAL RESEARCH AND IMPROVEMENT
NATIONAL CENTER FOR EDUCATION STATISTICS
Dear Colleague,
I am writing to ask you to respond to the 1993 National Study of Postsecondary Faculty(NSOPF-93), in which your institution is participating.
I want to thank you personally if you have already completed and returned your FacultyQuestionnaire. If you did not receive the questionnaire, or have not yet returned it, pleasecomplete and return the enclosed copy within the next five days.
Faculty directly affect the quality of education in postsecondary institutions and perform muchof the research and development work on which this nation's technological and economicadvancement depends. NSOPF-93 is the first comprehensive study to provide a nationalprofile of instructional and non-instructional faculty across a broad range of representativetwo-year, four-year, and doctoral-granting institutions. It is also the first to includeinstructional personnel who do not have faculty status.
As someone who plays a crucial role in higher education, we are certain that you canappreciate our need to obtain a completed questionnaire from each sampled faculty member.You were scientifically selected; no one can substitute for you. Without the participation offaculty like yourself, the results of this study will not adequately represent all faculty in thenation.
Individual responses and all information that would permit identification of individuals orinstitutions will be kept strictly confidential in accordance with the provisions of the FamilyEducational Rights and Privacy Act of 1976 and Section 406(d) of the General EducationProvisions Act, as amended by the Hawkins-Stafford Education Amendments of 1988, PublicLaw 100-297. Responses will be used only in statistical summaries.
I appreciate your contribution to this very important research. Should you have any questions,please call me toll-free at 1-800-733-6672.
BEST COPY AVAILABLE
WASHINGTON. D.C. 20208
Sincerely,
Sameer Y. A am. Ph.D.NSOPF-93 Project Director
471
.VSOPF-93Endorsed by:
American Associationfor Higher Education
American Association ofCommunity and .11111101'
Colleges
American Association of StareColleges and Universities
American Association ofUniversity Professors
American Federationof Teachers
Association for InetizuzionalResearch
Association of AmericanColleges
Association of CatholicColleges and Universities
College and UniversityPersonnel Association
The College Board
Council of Graduate Schools
National Association forEqual Opt:oral:dry inHigher Education
National EducationAstoeicuion
Ilk:tonal Institute ofIndependent College:and Universines
The United Negro CollegeFund. Inc.
LTR3
U.S. DEPARTMENT OF EDUCATIONOFFICE OF EDUCATIONAL RESEARCH AND IMPROVEMENT
NATIONAL CENTER FOR EDUCATION STATISTICS
Dear Colleague,
I am sending this third questionnaire packet to you because we have not heard from you, andthe end date for the 1993 National Study of Postsecondary Faculty is almost upon us.
I want to thank you if you have already mailed in your completed Faculty Questionnaire. Ifyou have not, please complete the enclosed copy and return it within the nett five days. Yourparticipation is absolutely crucial if we are to adequately represent the diversity of thenation's instructional and non-instructional faculty. You were scientifically selected and noone can substitute for you.
NSOPF-93 is the most comprehensive study of faculty ever conducted. This is the first studyto provide a national profile of instructional and non-instructional faculty, both full-time andpart-time, across a variety of two-year, four-year, and doctoral-granting institutions. It is alsothe first to include instructional personnel who do not have faculty status.
Again, let me assure you that your responses and all information that would permitidentification of you or you institution will be kept strictly confidential in accordance withthe provisions of the relevant Federal statutes governing privacy and the U.S. Departmentof Education's mandate to protect the confidentiality of its respondents. Responses will beused only in statistical summaries.
Please take this opportunity to complete the questionnaire now. I appreciate your contributionto this very important research. If you have any questions, call me toll-freeat 1-800-733-6672.
Sincerely,
Sameer Y. Abranarn, Ph.D.NSOPF-93 Project Director
BEST COPY AVAILABLE
WASHINGTON. D.C. 20208...- 472
1993 National Study of Postsecondary FacultyMethodology Report
Appendix M
Letters to Institution Questionnaire Respondents
Initial Cover Letter to Institutions That Provided Faculty Lists
Initial Cover Letter to Institutions That Did Not Provide Faculty Lists
Follow-up Postcard
473
VSOPF-93Endorsed by:
%merits^ Associaionfor Higher Education
4~r:can Assoc:a:ion ofCommunity and JuniorColleges
Vnerictus Association of StateColleges and Universities
4.fterieguy Assoc:axiom ofUniversity Professors
Asurican Federationof Teachers
Association for InexiattionelResearch
Association of Anicric.vtColleges
AssoCation of CatholicColleges and UniversiAier
College era UniversityPersonnel Assoaxision
The College Board
Council of Oreduate Schools
National Association forEqual Opportunity inHigher Education
National EducationAssociation
Nacional loutiatos ofindepostient Collagesand Univorsisies
The United Negro CollegeFund
U.S. DEPARTMENT OF EDUCATIONOr-FicE CF EDUCATIONAL RE S E.-ARC i AN: IMPROVEMENT
NATIONAL CEN7EF FOR EDUCATION STATISTICS
Dear Institutional Representative:
The chief administrative officer of your institution has agreed to participate in the1992-93 National Study of Postsecondary Faculty (NSOPF-93) and has indicated thatyou could provide us with information concerning your institution's characteristics,policies, and practices. We have already received a list of your institution's facultyand have sampled 41, individuals from the list. Sampled faculty have been sent question-naires that ask them to provide information on their backgrounds, responsibilities,workloads, compensation, and attitudes. The enclosed questionnaire asks for informationthat is important to know about the institutions in which faculty work.
NSOPF-93 is the most comprehensive study of faculty in higher educational institu-tions ever undertaken. The National Center for Education Statistics (ACES) of theU.S. Department of Education is conducting the study with additional support from theNational Endowment for the Humanities and the National Science Foundation. TheNational Opinion Research Center (NORC) at the University of Chicago has beencommissioned to collect the data for this study.
Your participation. while voluntary, is critical for us to provide national estimates ofhigher education institutions' charac:eristcs and policies toward their faculty. Suchinstitutions are facing changing academic, fiscal, and political environments. To makerealistic plans for the future of higher education, planners and policy makers at alllevelsinstitutional, government, and legislativewill need reliable and current nationaldata on available.resources, as well as on the constraints and demands on higher educationinstitutions. NSOPF-93 is collecting data from approximately 800 higher educationinstitutions and 33,000 faculty members. The study will provide national profiles offaculty in American institutions of higher learning in 1993, and data on institutionalpolicies and practices affecting faculty. NSOPF-93 is the second in a series that firstcollected data in 1988. The enclosed brochure provides additional information about thestudy and its goals.
The questionnaire should take about 45-60 minutes to complete. You may send commentsregarding this estimate or any other aspect of this collection of information, includingsuggestions for reducing the time needed 'to reapOnd, to the U.S. Department of Education.Information Management and Compliance Division, Washington. D.C. 20202-4651, and tothe Office of Management and Budge; Paperwork Reduction Project 1850-0608,Washington, D.C. 20503.
Individual responses and all information which would permit identification of individualsor institutions will be kept strictly confidential in accordance with the provisions of therelevant Federal statutes governing privacy and with NCES* legislative mandate to protectthe confidentiality of its respondents. The brochure cites the relevant statutes. Responseswill be used only in statistical summaries and will not be disclosed to any individual orgroup.
VVAS)4INGTCN. C 5:2u-
BEST COPY AVAILABLE 4 7 4
Please complete the enclosed Institution Questionnaire and return it in the accompanying business-replyenvelope within the next few weeks. If you have any questions conc- ving the questionnaire or the study,please contact the NORC Project Director, Dr. Sameer Abraham. toll -rrce, at 1-800-733-NORC.
Thank you for your participation in this important study. We will send you a copy of the final analytic report.
Enclosures
BEST COPY AVAILABLE
475
Sincerely,
Emerson J. ElliotCommissioner
NSOPF-93Endorsed by:
American Associationfor Higher Education
American Association ofCommunity and JuniorColleges
American Association of StateColleges and Universities
American Association ofUniversity Professors
American Federationof Teachers
Auociation for InstitutionalResearcn
Auociation of AmericanColleges.
Association of CatholicCollege and Universities
College and UniversityPersonnel Association
The College Board
Council of Graduate Schools
National Association forEqual Opportunity inNigher Education
National EducationAssociation
National Institute ofIndependent Colleges.and Universities
The United Negro CollegeFund, Inc.
U.S. DEPARTMENT OF EDUCATIONOFFICE OF EDUCATIONAL RESEARCH ANC IMPROVEMENT
NATIONAL CENTER FOR EDUCATION STATISTICS
Dear Chief Administrative Officer:
Your institution has been selected into the sample of the 1992-93 National Study ofPostsecondary Faculty (NSOPF-93). I am writing to ask for your institution's coopera-tion in this important study by completing the enclosed Institution Questionnaire. Thequestionnaire should be completed by an academic official, such as a Provost or AcademicDean, who can best respond to questions concerning your institution's characteristics,policies and practices towards its faculty.
NSOPF-93 is the most comprehensive study of faculty in postsecondary educationalinstitutions ever undertaken. The National Center for Education Statistics (NCES) of theU.S. Department of Education is conducting the study with additional support from theNational Endowment for the Humanities and the National Science Foundation. TheNational Opinion Research Center (NORC) at the University of Chicago has beencommissioned to collect the data for this study.
Your institution's participation, while voluntary, is critical for us to provide nationalestimates of higher education institutions' characteristics and policies towad their faculty.Such institutions are facing changing academic, fiscal, and political environments. Tomake realistic plans for the future of higher education, planners and policy makers at alllevelsinstitutional, government, and legislative--will need reliable and current nationaldata on available resources, as well as on the constraints and demands on higher educationinstitutions. NSOPF is collecting data from approximately 800 higher educationinstitutions and 33,000 faculty members. The study will provide national profiles offaculty in American institutions of higher learning in 1993, and data on institutionalpolicies and practices affecting faculty. NSOPF-93 is the second in a series that firstcollected data in 1988. The enclosed brochure provides additional information about thestudy and its goals.
The questionnaire should take about 45-60 minutes to complete. You may send commentsregarding this estimate or any other aspect of this collection of information, includingsuggestions for reducing the time needed to respond, to the U.S. Department of Education,Information Management and Compliance Division, Washington, D.C. 20202-4651, and tothe Office of Management and Budget, Paperwork Reduction Project 1850-0608,Washington, D.C. 20503.
Individual responses and all information which would permit identification of individualsor institutions will be kept strictly confidential in accordance with the provisions of therelevant Federal statutes governing privacy and with NCES' legislative mandate to protectthe confidentiality of its respondents. The brochure cites the relevant statutes. Responseswill be used only in statistical summaries and will not be disclosed to any individual orgroup.
BEST COPY AVAILABLE 4 7 6
WASHINGTON. D C 2.02C11--
The enclosed Institution Questionnaire should be completed and returned in the accompanying business-replyenvelope within the next few weeks. If you have any questions concerning the questionnaire or the study,please contact the NORC Project Director, Dr. Sameer Abraham, toll-free, at 1-800-733-NORC.
Thank you for your participation in this important study. We will send you a copy of the final analytic report.
Enclosures
Sincerely,
Emerson J. ElliottCommissioner
BEST COPY MAU =LE
477
Did you mail back your NSOPFInstitution Questionnaire?
If not, please complete it today. Currentinformation about your institution is important tounderstand constraints and demands on the nation'shigher education system.
Please return the questionnaire in the stamped, pre-addressed envelope. If you have any questions,please call our toll-free number 1-800-733-NORC
If you've already returned back your questionnaire,
Thank you for your participation.
University of ChicagoNational Opinion Research Center (NORC)1155 East 60th StreetChicago, Illinois 60637-2799
We need to hear from you!
National Study of Postsecondary FacultySponsored by the National Center for Education Statistics
478,
1993 National Study of Postsecondary FacultyMethodology Report
Appendix N
Letter to Institution Coordinator for Faculty Follow-up
479
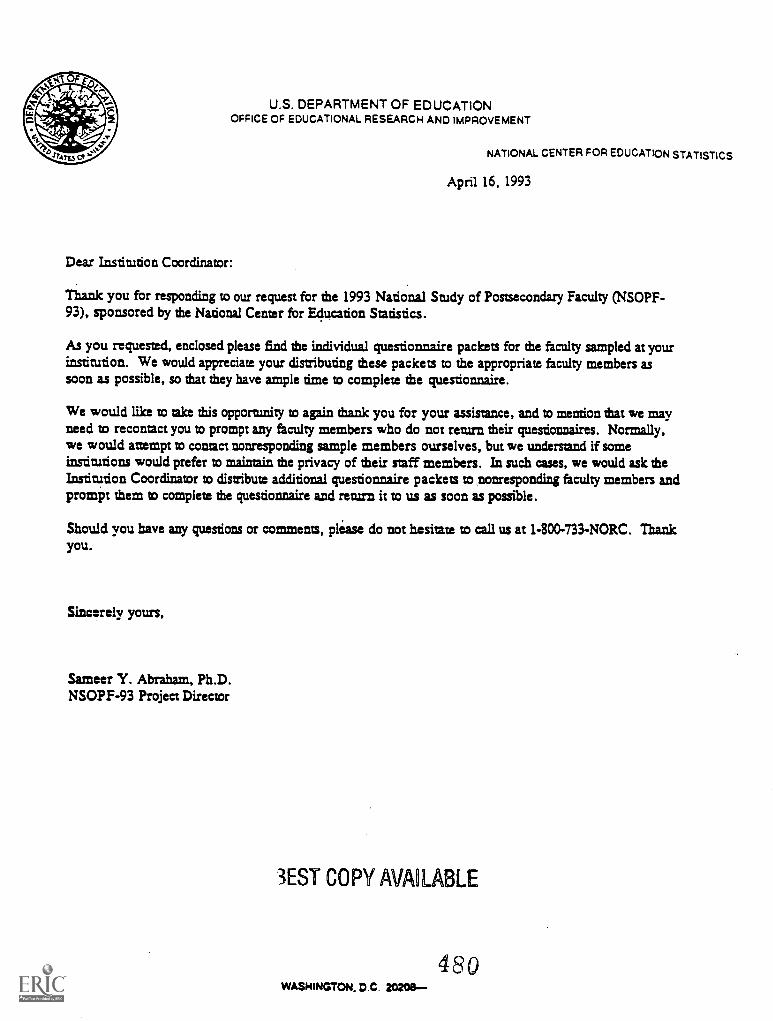
U.S. DEPARTMENT OF EDUCATIONOFFICE OF EDUCATIONAL RESEARCH AND IMPROVEMENT
Dear Institution Coordinator:
NATIONAL CENTER FOR EDUCATION STATISTICS
April 16, 1993
Thank you for responding to our request for the 1993 National Study of Postsecondary Faculty (NSOPF-93), sponsored by the National Center for Education Statistics.
As you requested, enclosed please find the individual questionnaire packets for the faculty sampled at yourinstitution. We would appreciate your distributing these packets to the appropriate faculty members assoon as possible, so that they have ample time to complete the questionnaire.
We would like to take this opportunity to again thank you for your assistance, and to mention that we mayneed to recontact you to prompt any faculty members who do not return their questionnaires Normally,we would anzmpt to contact nonresponding sample members ourselves, but we understand if someinstitutions would prefer to maintain the privacy of their staff members. In such cases, we would ask theInstitution Coordinator to distribute additional questionnaire packets to nonresponding faculty members andprompt them to complete the questionnaire and return it to us as soon as possible.
Should you have any questions or comments, plea' se do not hesitate to call us at I-800-733-NORC. Thankyou.
Sincerely yours,
Sameer Y. Abraham, Ph.D.NSOPF-93 Project Director
3EST COPY AVAOLABLE
WASHINGTON. D.C. 20208-480
1993 National Study of Postsecondary FacultyMethodology Report
Appendix 0
Derived Variables
Exhibit 0-1: Discipline Crosswalk, NSOPF 1988-1993
Exhibit 0-2: Derived Variable Crosswalk to NSOPF-88
48t
1993 National Study of Postsecondary FacultyDocumentation of Derived Variable Creation
This document describes how the derived variables were created that accompany the NSOPF-93 institutionand restricted public use faculty data files. The derived variables appear after the survey variables at the endof each data file, and are listed here in the order in which they appear. A total of 143 derived variables havebeen created. The faculty file includes all 143 derived variables. The institution file contains 36 institution-
level derived variables.
All faculty-level derived variables were created by NORC using data collected from the NSOPF-93 facultyquestionnaire. Most of the institution-level derived variables were created using multiple sources of dataincluding: the 1991-92 IPEDS (Integrated Postsecondary Education Data System), the "Carnegieclassification" system', and NSOPF-93 sampling information. NCES created the derived variables based onIPEDS.
In this document, the SAS variable name of each derived variable appears in UPPER CASE BOLDITALICS on the left-hand side of the page. Each variable name begins with the letter "X". The second andthird elements of the variable name indicate in what order the derived variable was created from the primary
survey variable or other source (e.g., X01, X02, X03, etc.).
Institution-level derived variables. The last element of the SAS variable name for institution-level derivedvariables consists of two characters, an underscore and a zero "_0" (e.g., X01_0, X02 0, X03_0, etc.). Thiscomponent of the variable name signifies both that the variable is an institution-level derived variable andthat an outside data source was used when creating it (derived variables X01_0 through X37 0). Theexample below is a variable derived from IPEDS data; the " 0" indicates that it is an institution-levelvariable. The variable title (created for purposes of this document) appears below the variable name. Belowthat is the CODE which defines the value of the variable. In this example, because it is reported as an open-ended percentage, the value will vary from 0 to 100.
X2 7 0Minority enrollment: Percent American Indian/Alaskan Native
CODE:(PERCENTAGE, open-ended)
Description of the Derived Variable:This derived variable was created by NCES from 1991-92 IPEDS data to provide the percentage of AmericanIndian/Alaskan native enrollment at each NSOPF-93 institution.
American Indian or Alaskan Native. A person having origins in any of the original peoples of North Americaand who maintains cultural identification through tribal affiliation or community recognition.
A Classification of Institutions of Higher Education. The Carnegie Foundation for the Advancement ofTeaching (Princeton, New Jersey: 1987).
1
482
Faculty-level derived variables. The SAS variable names of faculty-level derived variables also begin withthe letter "X'. The second and third digits of the faculty-level derived variable name indicate the order thatthe variable was created from the primary survey variable. The last component of the derived variable namereflects the section and question in the NSOPF-93 Faculty Questionnaire from which the variable originated.
In the example below, "01" in the derived variable name, X01A 7, indicates that this is the first variablederived from survey variable A7, which is in Section A of the Faculty Questionnaire. The CODE identifiesthe values for the derived variable, keying them to the survey variables' original coding scheme (i.e. X01A7'svalue 4 is equivalent to A7's values 4 and/or 5). The description explains how the survey variable (A7) wascollapsed to create the derived variable.
X01A 7Tenure: Tenure status
CODE:1=Tenured (Q7=1)2=On tenure track but not tenured (Q7=2)3=Not on tenure track (Q7=3)4=No tenure system for respondent's faculty status or no tenure system at institution (Q7=4
or 5)
Description of the Derived Variable:This derived variable was created from SAS variable A7 to indicate tenure status of a faculty respondentduring the 1992 Fall Term; codes for "no tenure system for respondent's faculty status" and "no tenuresystem at this institution" have been merged into one category.
Survey variables from questions in the preface of the NSOPF-93 Faculty Questionnaire have a leadingunderscore in place of a section letter (e.g., _1, _1A, etc.). Derived variables based on the questions beginwith the letter "X' and a number indicating order of creation, followed by the name of the survey variable(e.g., X01_1, X02 2, etc).
Exhibit 0-1 contains a list of the academic disciplines and codes used in several NSOPF-93 derived variablesand provides a cross-walk to the NSOPF-88 discipline codes. Exhibit 0-2 contains the derived variable titlesin alphabetical order, and a cross -walk to the NSOPF-88 derived variable titles:
The SAS implementation for each derived variable created by NORC was tested using an iterative process.Special programs were written in order to generate values for each of the derived variables from selectedsubsamples of observations from the faculty data set. The output from these reports was then checked againsta set of values that were manually computed according to the specifications for the derived variable.Whenever discrepancies appeared, both the program implementation and manual computations wererechecked for logical consistency and errors, after which the programs were revised accordingly until theproblems were corrected. This process was repeated for each derived variable to ensure that the variableswere created in accordance with NCES specifications.
2
483
Jnstitutian-Level derived variables
XOLOInstitution strata (matches NSOPF-88 categories)
CODE:1=Public research (I_AFF=1, I_CNG=11 or 12)2=Private research (I_AFF=2, I_CNG=11 or 12)3=Public doctoral, including medical (I_AFF=1, I_CNG=13 or 14 or 52)4=Private doctoral, including medical (I_AFF=2, I_CNG=13 or 14 or 52)5=Public comprehensive (I_AFF=1, I_CNG=21 or 22)6=Private comprehensive (I_AFF=2, I_CNG=21 or 22)7=Liberal arts (I_CNG=31 or 32)8=Public two-year (I_AFF=1, I_CNG=40)9=Other, includes religious and other specialized institutions, except medical; private 2-yearinstitutions not included (I_CNG=51, 53-65)
Description of the Derived Variable:This derived variable was created to indicate the modified 1987 Carnegie classification for the institutionssampled for NSOPF-93. The X0/0 categories match the NSOPF-88 categories used in some NCESpublications. A modified Carnegie system was used to stratify institutions by control (public and private) andtype (research, other Ph.D., comprehensive, liberal arts, medical, two-year, religious, other and unknown.)Specific Carnegie classifications are defined at X05_0. (Note: Private two-year schools are not included inany of the individual categories).
ControlI_AFF=1 PublicI_AFF=2 Private
1:522g
I_CNG=11 or 12 Research.I CNG=13 or 14 Other Ph.D.I CNG=21 or 22 ComprehensiveI CNG=31 or 32 Liberal artsI_CNG=40 Two-year collegeI CNG=51 ReligiousI CNG=52 MedicalI CNG=53 to 65 Other
For NSOPF-93 institutions with unknown Carnegie classifications, the value of X01_0 was individuallyassigned based on information available from IPEDS.
3
484
X02_0Institution strata (modified NSOPF-88 categories)
CODE:1=Public research (1_AFF=1, I CNG=11 or 12)2=Private research (I_AFF=2, CNG=11 or 12)3=Public doctoral, including medical (I_AFF=1, I CNG=13 or 14 or 52)4=Private doctoral, including medical (I_AFF=2, CNG=13 or 14 or 52)5=Public comprehensive (I_AFF=1, I CNG=21 or6=Private comprehensive (1_AFF=2, CNG=21 or 22)7=Private liberal arts (I_AFF=2, I CNG=31 or 32)8=Public two-year (I_AFF=1, I_CTNIG=40)9=Other, including private 2-year institutions, public liberal arts institutions and religious and otherspecialized institutions, except medical (I_AFF=1 and I_CNG=31 or 32, I_AFF=2 and I_CNG=40,I_CNG=51, 53-65)
Description of the Derived Variable.,This variable is a modification of X01_0. The categories for Codes 1-6 and 8 correspond to categories usedin NSOPF-88 (as in X01_0). Code 7; previously labeled "liberal arts", has been modified to include onlyprivate liberal arts institutions. Code 9, "other", now includes public liberal arts, private two-yearinstitutions, and religious and other specialized institutions. (Specific Carnegie classifications are defined atX05_0.) This variable creates the "institution type and control" stratification used in tables in the NCESreports Institutional Policies and Practices Regarding Faculty in Higher Education [NCES 97-080] andInstructional Faculty and Staff in Higher Education Institutions: Fall 1987 and Fall 1992 [NCES 97-470].
For NSOPF-93 institutions with unknown Carnegie classifications, the value of X02_0 was individuallyassigned based on information available from IPEDS.
4
485
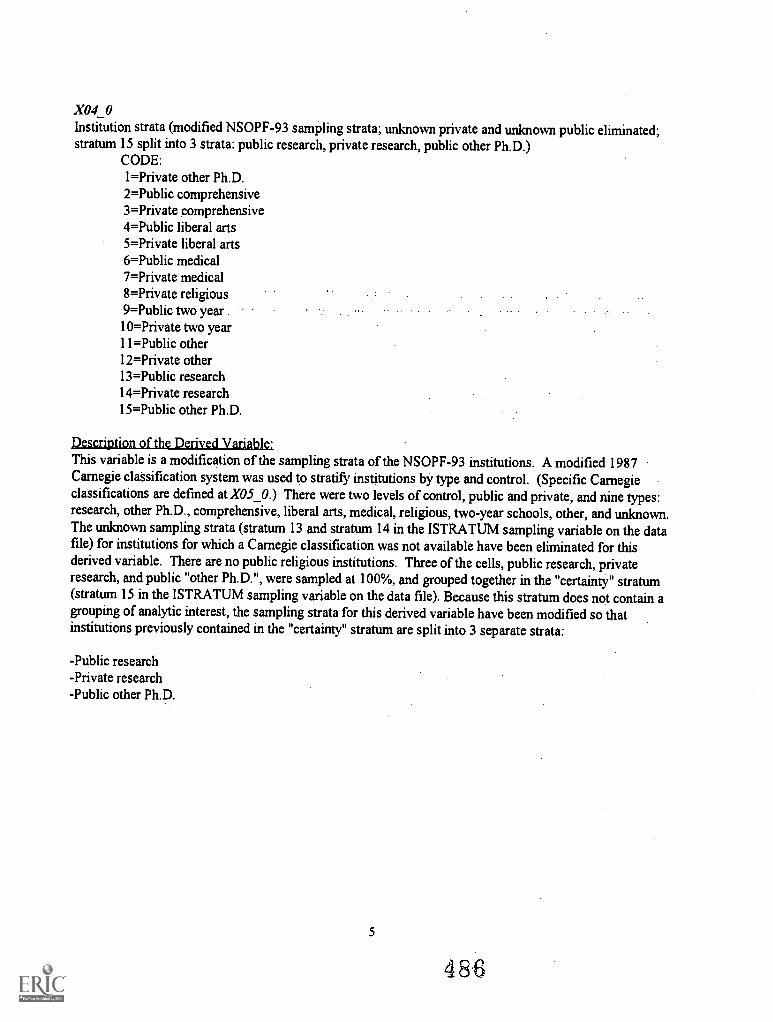
X04_0Institution strata (modified NSOPF-93 sampling strata; unknown private and unknown public eliminated;stratum 15 split into 3 strata: public research, private research, public other Ph.D.)
CODE:1=Private other Ph.D.2=Public comprehensive3=Private comprehensive4=Public liberal arts5=Private liberal arts6=Public medical7=Private medical8=Private religious9=Public two year .
10=Private two year11=Public other12=Private other13=Public research14=Private research15=Public other Ph.D.
Description of the Derived Variable.This variable is a modification of the sampling strata of the NSOPF-93 institutions. A modified 1987Carnegie classification system was used to stratify institutions by type and control. (Specific Carnegieclassifications are defined at X05_0.) There were two levels of control, public and private, and nine types:research, other Ph.D., comprehensive, liberal arts, medical, religious, two-year schools, other, and unknown.The unknown sampling strata (stratum 13 and stratum 14 in the ISTRATUM samplingvariable on the datafile) for institutions for which a Carnegie classification was not available have been eliminated for thisderived variable. There are no public religious institutions. Three of the cells, public research, privateresearch, and public "other Ph.D.", were sampled at 100%, and grouped together in the "certainty" stratum(stratum 15 in the ISTRATUM sampling variable on the data file). Because this stratum does not contain agrouping of analytic interest, the sampling strata for this derived variable have been modified so thatinstitutions previously contained in the "certainty" stratum are split into 3 separate strata:
-Public research-Private research-Public other Ph.D.
5
486
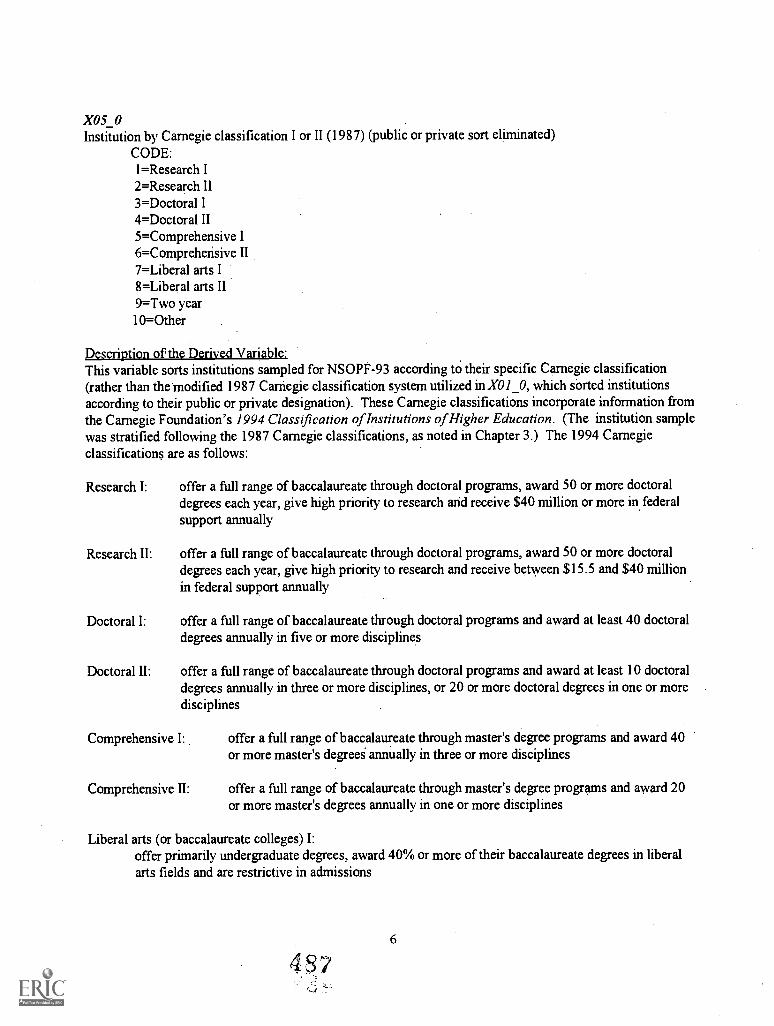
X05_0Institution by Carnegie classification I or II (1987) (public or private sort eliminated)
CODE:1=Research I2=Research II3=Doctoral I4=Doctoral II5=Comprehensive I6=Compreherisive II7=Liberal arts I8=Liberal arts II9=Two year10=Other
Description of the Derived Variable:This variable sorts institutions sampled for NSOPF-93 according to their specific Carnegie classification(rather than the modified 1987 Carnegie classification system utilized in X01_0, which sorted institutionsaccording to their public or private designation). These Carnegie classifications incorporate information fromthe Carnegie Foundation's 1994 Classification of Institutions ofHigher Education. (The institution samplewas stratified following the 1987 Carnegie classifications, as noted in Chapter 3.) The 1994 Carnegieclassifications are as follows:
Research I: offer a full range of baccalaureate through doctoral programs, award 50 or more doctoraldegrees each year, give high priority to research and receive $40 million or more in federalsupport annually
Research H: offer a full range of baccalaureate through doctoral programs, award 50 or more doctoraldegrees each year, give high priority to research and receive between $15.5 and $40 millionin federal support annually
Doctoral I: offer a full range of baccalaureate through doctoral programs and award at least 40 doctoraldegrees annually in five or more disciplines
Doctoral II: offer a full range of baccalaureate through doctoral programs and award at least 10 doctoraldegrees annually in three or more disciplines, or 20 or more doctoral degrees in one or moredisciplines
Comprehensive I: offer a full range of baccalaureate through master's degree programs and award 40or more master's degreei annually in three or more disciplines
Comprehensive II: offer a full range of baccalaureate through master's degree programs and award 20or more master's degrees annually in one or more disciplines
Liberal arts (or baccalaureate colleges) I:offer primarily undergraduate degrees, award 40% or more of their baccalaureate degrees in liberalarts fields and are restrictive in admissions
6
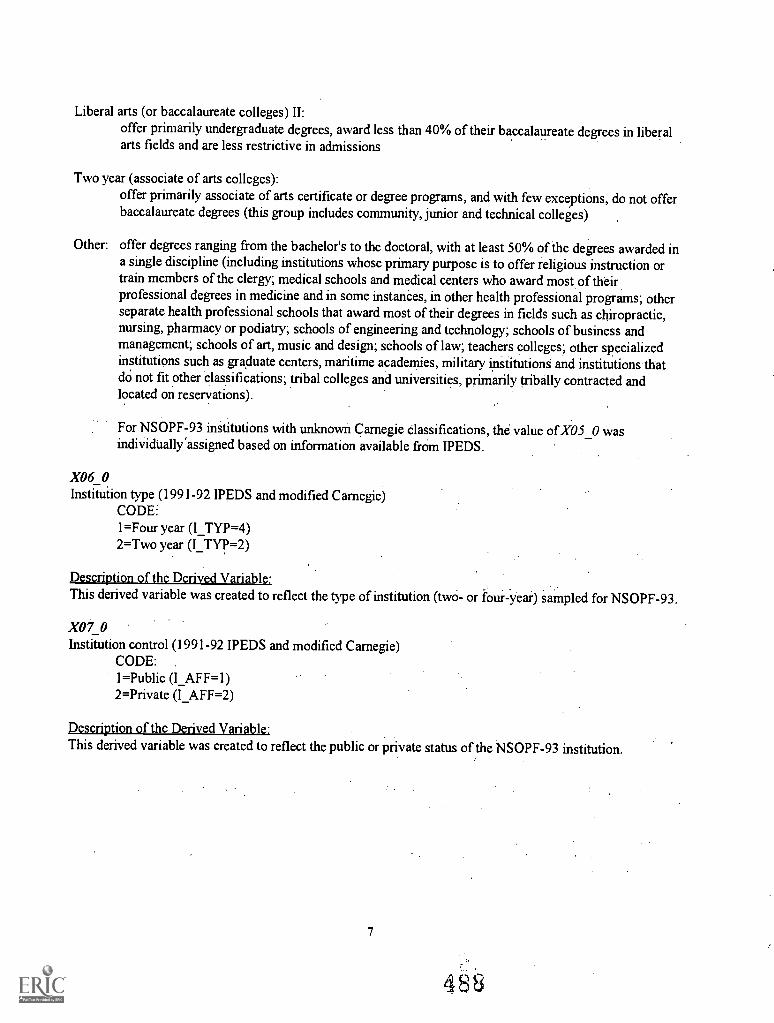
Liberal arts (or baccalaureate colleges) II:offer primarily undergraduate degrees, award less than 40% of their baccalaureate degrees in liberalarts fields and are less restrictive in admissions
Two year (associate of arts colleges):offer primarily associate of arts certificate or degree programs, and with few exceptions, do not offerbaccalaureate degrees (this group includes community, junior and technical colleges)
Other: offer degrees ranging from the bachelor's to the doctoral, with at least 50% of the degrees awarded ina single discipline (including institutions whose primary purpose is to offer religious instruction ortrain members of the clergy; medical schools and medical centers who award most of theirprofessional degrees in medicine and in some instances, in other health professionalprograms; otherseparate health professional schools that award most of their degrees in fields such as chiropractic,nursing, pharmacy or podiatry; schools of engineering and technology; schools of business andmanagement; schools of art, music and design; schools of law; teachers colleges; other specializedinstitutions such as graduate centers, maritime academies, military institutions and institutions thatcici not fit other classifications; tribal colleges and universities, primarily tribally contracted andlocated on reservations).
For NSOPF-93 institutions with unknown Carnegie classifications, the value of X05_0 wasindividually 'assigned based on information available from IPEDS.
X06_0Institution type (1991-92 IPEDS and modified Carnegie)
CODE:1=Four year (I_TYP=4)2=Two year (I_TY13=2)
Description of the Derived Variable:This derived variable was created to reflect the type of institution (two- or tour-year) sampled for NSOPF-93.
X07_0Institution control (1991-92 IPEDS and modified Carnegie)
CODE:1=Public (I_AFF=1)2=Private (I_AFF=2)
Description of the Derived Variable:This derived variable was created to reflect the public or private status of the NSOPF-93 institution.
7
4 88
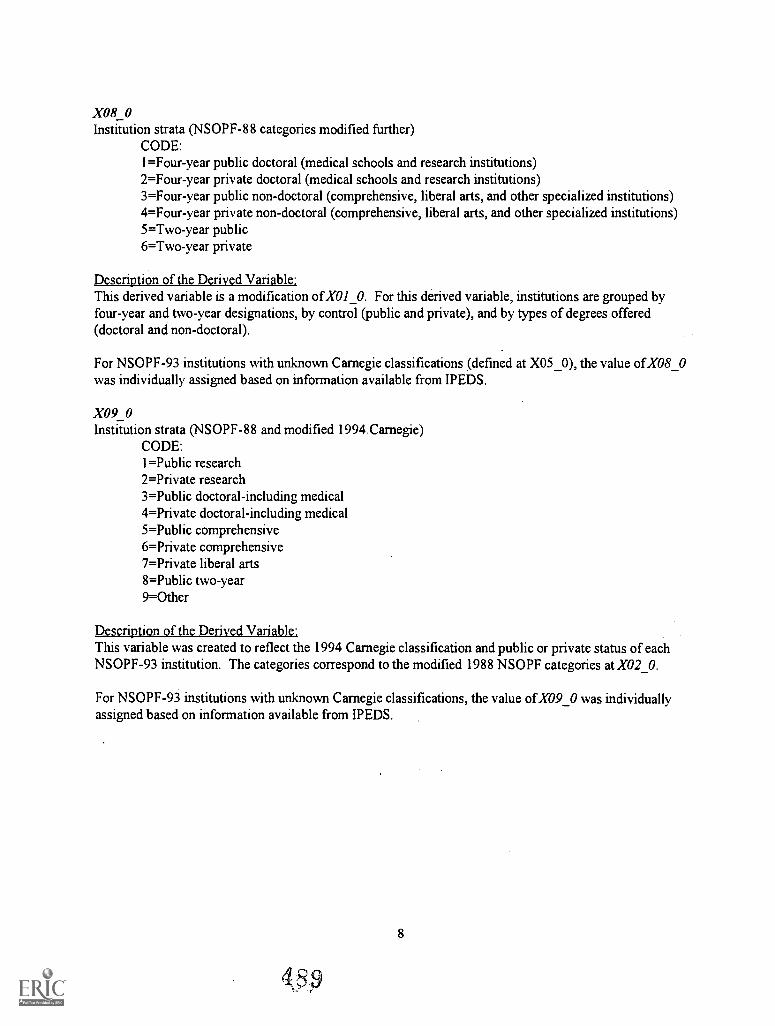
X08_0Institution strata (NSOPF-88 categories modified further)
CODE:1=Four-year public doctoral (medical schools and research institutions)2=Four-year private doctoral (medical schools and research institutions)3=Four-year public non-doctoral (comprehensive, liberal arts, and other specialized institutions)4=Four-year private non-doctoral (comprehensive, liberal arts, and other specialized institutions)5=Two-year public6=Two-year private
Description of the Derived Variable:This derived variable is a modification ofX010. For this derived variable, institutions are grouped byfour-year and two-year designations, by control (public and private), and by types of degrees offered(doctoral and non-doctoral).
For NSOPF-93 institutions with unknown Carnegie classifications (defined at X050), the value of X08_0was individually assigned based on information available from IPEDS.
X09_0Institution strata (NSOPF-88 and modified 1994 Carnegie)
CODE:1=Public research2=Private research3=Public doctoral-including medical4=Private doctoral-including medical5=Public comprehensive6=Private comprehensive7=Private liberal arts8=Public two-year9=Other
Description of the Derived Variable.This variable was created to reflect the 1994 Carnegie classification and public or private status of eachNSOPF-93 institution. The categories correspond to the modified 1988 NSOPF categories at X02_0.
For NSOPF-93 institutions with unknown Carnegie classifications, the value of X09_0 was individuallyassigned based on information available from IPEDS.
8
ti
X10_0Ratio of FTE enrollment/FTE faculty
CODE:(open-ended)
Description of the Derived Variable:This variable was created by NCES from 1991-92 IPEDS data to show the ratio of FTE enrollment to FTEfaculty at NSOPF-93 institutions. These terms are defined as follows:
Full-time equivalent (FTE) enrollment: The sum of the number of full-time students and the full-timeequivalency of part-time students.
Full-time equivalent (FTE) of part-time enrollment: A numeric conversion through which a student attendingpart-time is considered some fraction of a full-time student. The actual fractions used were:
.38 for part-time undergraduates and graduate students
.50 for first-professional students
Full-time equivalent (FTE) faculty: The sum of the number of full-time faculty and the full-time equivalencyof part-time faculty.
Full-time equivalent (FTE) of part-time faculty: A numeric conversion through which a faculty memberemployed part-time is considered some fraction of a faculty member employed full-time. Theactual fraction used was .56.
X/L0Institution size: Number of full- and part-time undergraduate students enrolled
CODE:(open-ended)
Description of the Derived Variable:This derived variable was created by NCES from 1991-92 IPEDS data to show the number of undergraduatestudents enrolled in courses for credit at NSOPF-93 institutions.
Undergraduate: A student enrolled in a four-year or five-year bachelor's degree program, in an associate'sdegree program, or in a vocational or technical program below the baccalaureate, or any other student that isnot seeking a degree but is enrolled in courses for credit.
X12_0Institution size collapsed: Number of full- and part-time under-graduate students enrolled
CODE:(ranges)
Description of the Derived Variable:This derived variable was created by NCES to recode the continuous categories at X/ LO into five ranges.
9
49O
X13_0Institution size: FTE undergraduate enrollment
CODE:(open-ended)
Description of the Derived Variable.,This variable was created by NCES from 1991-92 IPEDS data to show FTE undergraduate enrollment atNSOPF-93 institutions.
FTE: Full-time equivalency of undergraduate students as defined at X10_0.
Undergraduate: A student enrolled in a four-year or five-year bachelor's degree program, in an associate'sdegree program, or in a vocational or technical program below the baccalaureate, or any other student that isnot seeking a degree but is enrolled in courses for credit.
X14_0Institution size collapsed: FTE undergraduate enrollment
CODE:(ranges)
Description of the Derived Variable:This variable was created by NCES to recode the continuous categories at XI 3_0 into five ranges.
X15_0Institution size: Number of first-professional students enrolled
. CODE:(open-ended)
Description of the Derived Variable,This derived variable was created by NCES from 1991-92 IPEDS data to show the number offirst-professional students enrolled at NSOPF-93 institutions.
First-professional student: A student enrolled in any of the following degree programs:
Chiropractic (D.C. or D.C.M.)Dentistry (D.D.S. or D.M.D.)Medicine (M.D.)Optometry (O.D.)Osteopathic Medicine (D.0.)
Pharmacy (D.Phar.)Podiatry (Pod.D. or D.P.)Veterinary Medicine(D.V.M.)Law (L.L.B., J.D.)Theology (M.Div. or M.H.L. or B.D.)
X16_0Institution size collapsed: Number of first-professional students enrolled
CODE:(ranges)
Description of the Derived Variable:This derived variable was created by NCES to recode the continuous categories at X15_0 into five ranges.
10
X17 0Institution size: FTE first-professional enrollment
CODE:(open-ended)
Description of the Derived Variable:This derived variable was created by NCES from 1991-92 IPEDS data to show the number of FTEfirst-professional students enrolled at NSOPF-93 institutions.
FTE: Full-time equivalency of first-professional students as defined at X10_0.
First-professional student: A student enrolled in any of the following degree programs:
Chiropractic (D.C. or D.C.M.)Dentistry' (D.D.S. or D.M.D.)Medicine (M.D.)Optometry (O.D.)Osteopathic Medicine (D.O.)
Pharmacy (D.Phar.)Podiatry (Pod.D. or D.P.)Veterinary Medicine (D.V.M.)Law (L.L.B., J.D.)Theology (M.Div. or M.H.L. or B.D.)
X18_0Institution size collapsed: FTE first-professional enrollment
CODE:(ranges)
Description of the Derived Variable:This derived variable was created by NCES to recode the continuous categories at X17 0 into five ranges.
X19_0Institution size: Number of graduate students enrolled
CODE:(open-ended)
Description of the Derived Variable:This variable was created by NCES from 1991-92 IPEDS data to show the total enrollment of graduatestudents at NSOPF-93 institutions.
Graduate student: A student who holds a bachelor's or, first-professional degree, or equivalent, and is takingcourses for credit at the post-baccalaureate level. These students may or may not be enrolled in a graduatedegree program.
X20_0Institution size collapsed: Number of graduate students enrolled
CODE:(ranges)
Description of the Derived Variable:This derived variable was created by NCES to recode the continuous categories at X190 into five ranges.
11
92
X21_0Institution size: FTE graduate enrollment
CODE:(open-ended)
Description of the Derived Variable-,This derived variable was created by NCES from 1991-92 IPEDS data to show the number of FTE graduate
students at NSOPF-93 institutions.
FTE: Full-time equivalency of graduate students as defined at X10_0.
Graduate student: A student who holds a bachelor's or first-professional degree, or equivalent, and is taking
courses for credit at the post-baccalaureate level. These students may or may not be enrolled in a graduate
degree program.
X22_0Institution size collapsed: FTE graduate enrollment
CODE:(ranges)
Description of the Derived Variable:This derived variable was created by NCES to recode the continuous categories at X21_0 into five ranges.
X23_0Institution size: Total enrollment
CODE:(open-ended)
Description of the Derived Variable..This derived variable was created by NCES from 1991-92 IPEDS data to show the size of the total studentenrollment at NSOPF-93 institutions.
Total enrollment: All students taking courses for credit.
X24_0Institution size collapsed: Total enrollment
CODE:(open-ended)
Description of the Derived Variable;This derived variable was created by NCES to recode the continuous categories at X230 into five ranges.
12
493
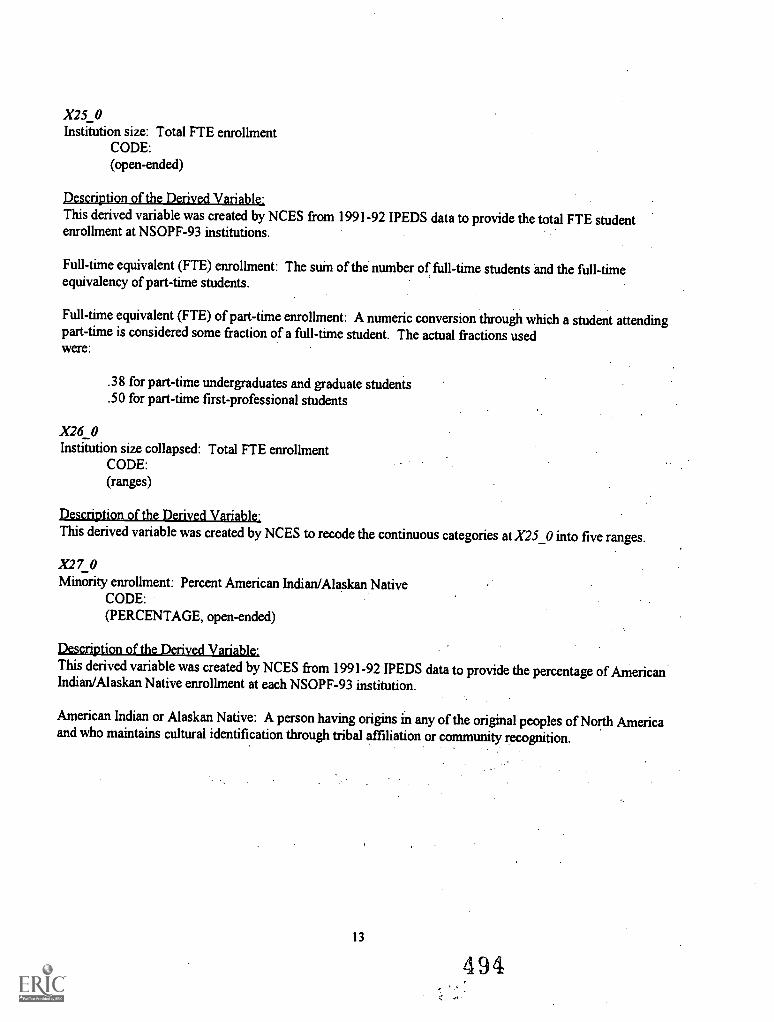
X25_0Institution size: Total FTE enrollment
CODE:(open-ended)
Description of the Derived Variable.,This derived variable was created by NCES from 1991-92 IPEDS data to provide the total FTE studentenrollment at NSOPF-93 institutions.
Full-time equivalent (FTE) enrollment: The sum of the number of full-time students and the full-timeequivalency of part-time students.
Full-time equivalent (FTE) of part-time enrollment: A numeric conversion through which a student attendingpart-time is considered some fraction of a full-time student. The actual fractions usedwere:
.38 for part-time undergraduates and graduate students.50 for part-time first-professional students
X26_0Institution size collapsed: Total FTE enrollment
CODE:(ranges)
Description of the Derived VariableThis derived variable was created by NCES to recode the continuous categories at X25_0 into five ranges.
X27_0Minority enrollment: Percent American Indian/Alaskan Native
CODE:(PERCENTAGE, open-ended)
Description of the Derived Variable.,This derived variable was created by NCES from 1991-92 IPEDS data to provide the percentage of AmericanIndian/Alaskan Native enrollment at each NSOPF-93 institution.
American Indian or Alaskan Native: A person having origins in any of the original peoples of North Americaand who maintains cultural identification through tribal affiliation or community recognition.
13
494
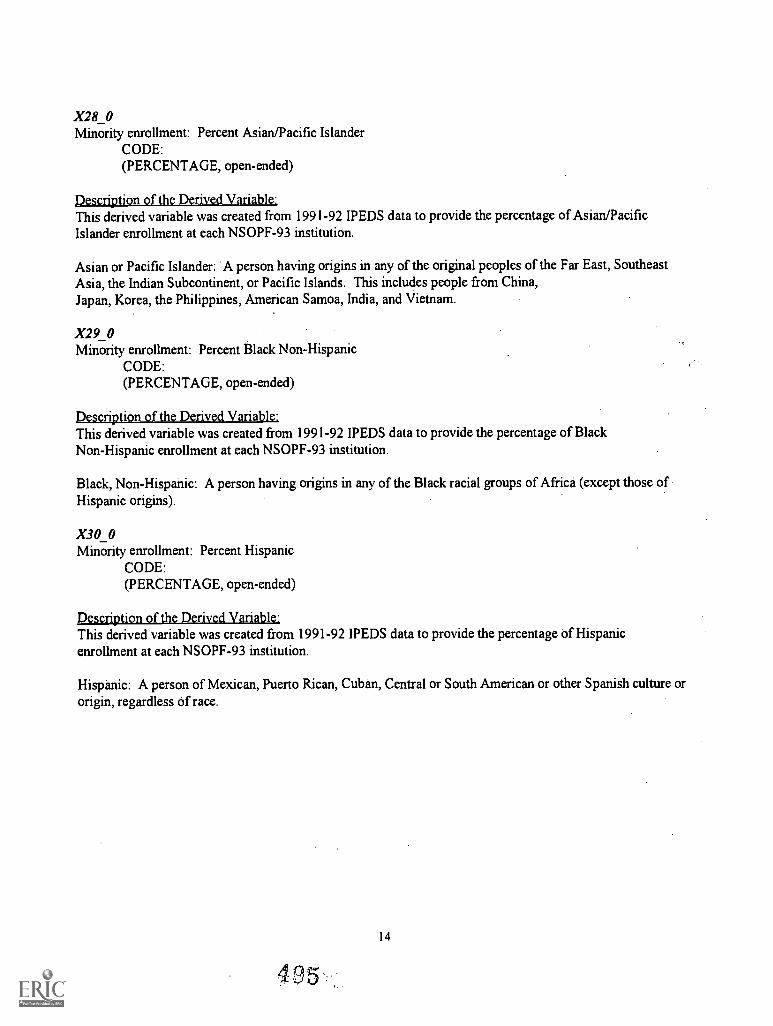
X28_0Minority enrollment: Percent Asian/Pacific Islander
CODE:(PERCENTAGE, open-ended)
Description of the Derived Variable:This derived variable was created from 1991-92 IPEDS data to provide the percentage of Asian/PacificIslander enrollment at each NSOPF-93 institution.
Asian or Pacific Islander: A person having origins in any of the original peoples of the Far East, SoutheastAsia, the Indian Subcontinent, or Pacific Islands. This includes people from China,Japan, Korea, the Philippines, American Samoa, India, and Vietnam.
X29_0Minority enrollment: Percent Black Non-Hispanic
CODE:(PERCENTAGE, open-ended)
Description of the Derived VariableThis derived variable was created from 1991-92 IPEDS data to provide the percentage of BlackNon-Hispanic enrollment at each NSOPF-93 institution.
Black, Non-Hispanic: A person having origins in any of the Black racial groups of Africa (except those ofHispanic origins).
X30_0Minority enrollment: Percent Hispanic
CODE:(PERCENTAGE, open-ended)
Description of the Derived Variable:This derived variable was created from 1991-92 IPEDS data to provide the percentage of Hispanicenrollment at each NSOPF-93 institution.
Hispanic: A person of Mexican, Puerto Rican, Cuban, Central or South American or other Spanish culture ororigin, regardless of race.
14
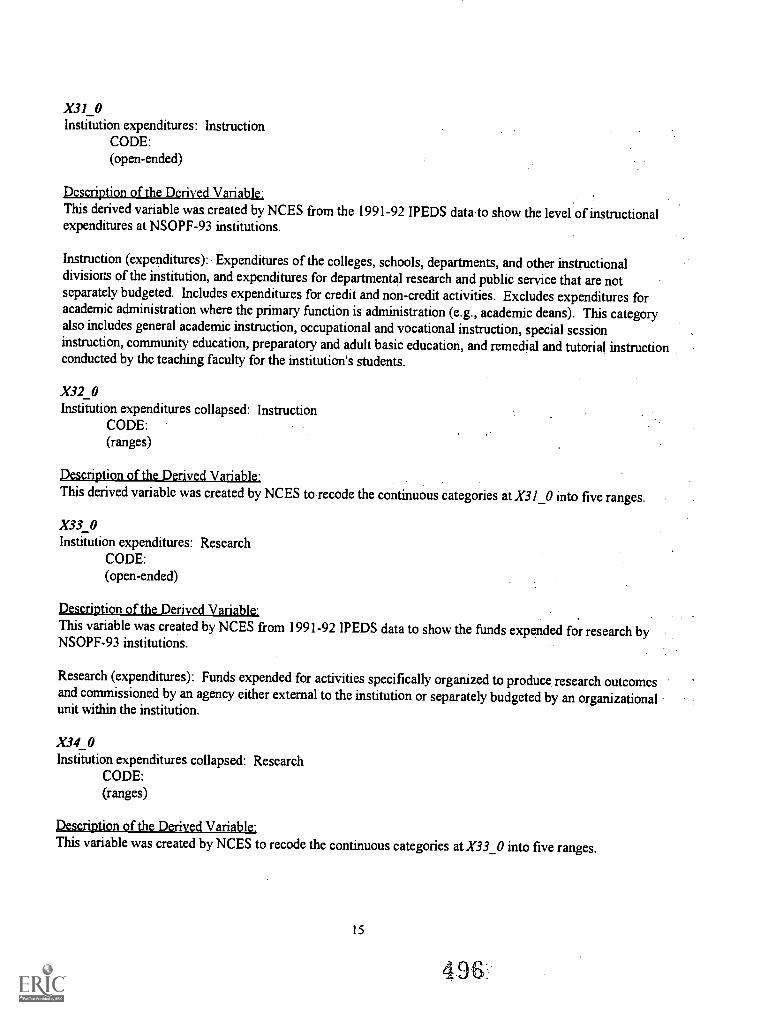
X31_0Institution expenditures: Instruction
CODE:(open-ended)
Description of the Derived Variable:This derived variable was created by NCES from the 1991-92 IPEDS data to show the level of instructionalexpenditures at NSOPF-93 institutions.
Instruction (expenditures): Expenditures of the colleges, schools, departments, and other instructionaldivisions of the institution, and expenditures for departmental research and public service that are notseparately budgeted. Includes expenditures for credit and non-credit activities. Excludes expenditures foracademic administration where the primary function is administration (e.g., academic deans). This categoryalso includes general academic instruction, occupational and vocational instruction, special sessioninstruction, community education, preparatory and adult basic education, and remedial and tutorial instructionconducted by the teaching faculty for the institution's students.
X32_0Institution expenditures collapsed: Instruction
CODE:(ranges)
Description of the Derived Variable.This derived variable was created by NCES to recode the continuous categories at X31 _O into five ranges.
X33_0Institution expenditures: Research
CODE:(open-ended)
Description of the Derived Variable:This variable was created. by NCES from 1991-92 IPEDS data to show the funds expended for research byNSOPF-93 institutions.
Research (expenditures): Funds expended for activities specifically organized to produce research outcomesand commissioned by an agency either external to the institution or separately budgeted by an organizationalunit within the institution.
X34_0Institution expenditures collapsed: Research
CODE:(ranges)
Description of the Derived Variable:This variable was created by NCES to recode the continuous categories at X33 0 into five ranges.
15
496
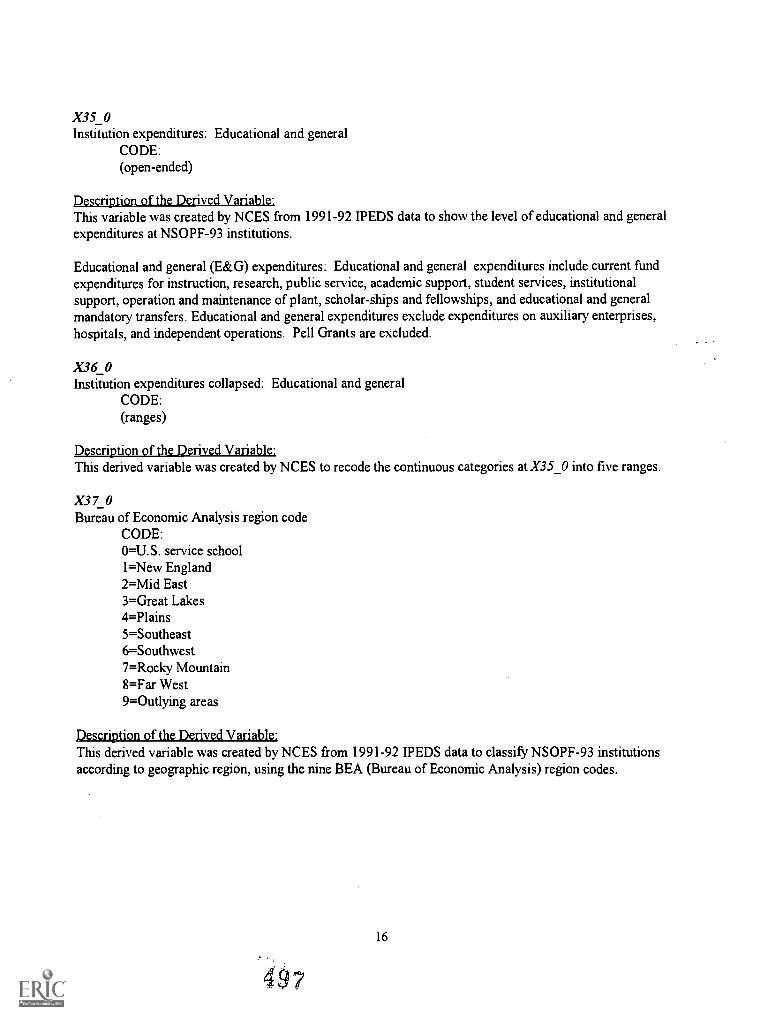
X35_0Institution expenditures: Educational and general
CODE:(open-ended)
Description of the Derived VariableThis variable was created by NCES from 1991-92 IPEDS data to show the level of educational and generalexpenditures at NSOPF-93 institutions.
Educational and general (E&G) expenditures: Educational and general expenditures include current fundexpenditures for instruction, research, public service, academic support, student services, institutionalsupport, operation and maintenance of plant, scholar-ships and fellowships, and educational and generalmandatory transfers. Educational and general expenditures exclude expenditures on auxiliary enterprises,hospitals, and independent operations. Pell Grants are excluded.
X36_0Institution expenditures collapsed: Educational and general
CODE:(ranges)
Description of the Derived Variable:This derived variable was created by NCES to recode the continuous categories at X35_0 into five ranges.
X37_0Bureau of Economic Analysis region code
CODE:0=U.S. service school1=New England2=Mid East3=Great Lakes4=Plains5=Southeast6=Southwest7=Rocky Mountain8=Far West9=Outlying areas
Description of the Derived VariableThis derived variable was created by NCES from 1991-92 IPEDS data to classify NSOPF-93 institutionsaccording to geographic region, using the nine BEA (Bureau of Economic Analysis) region codes.
16
497
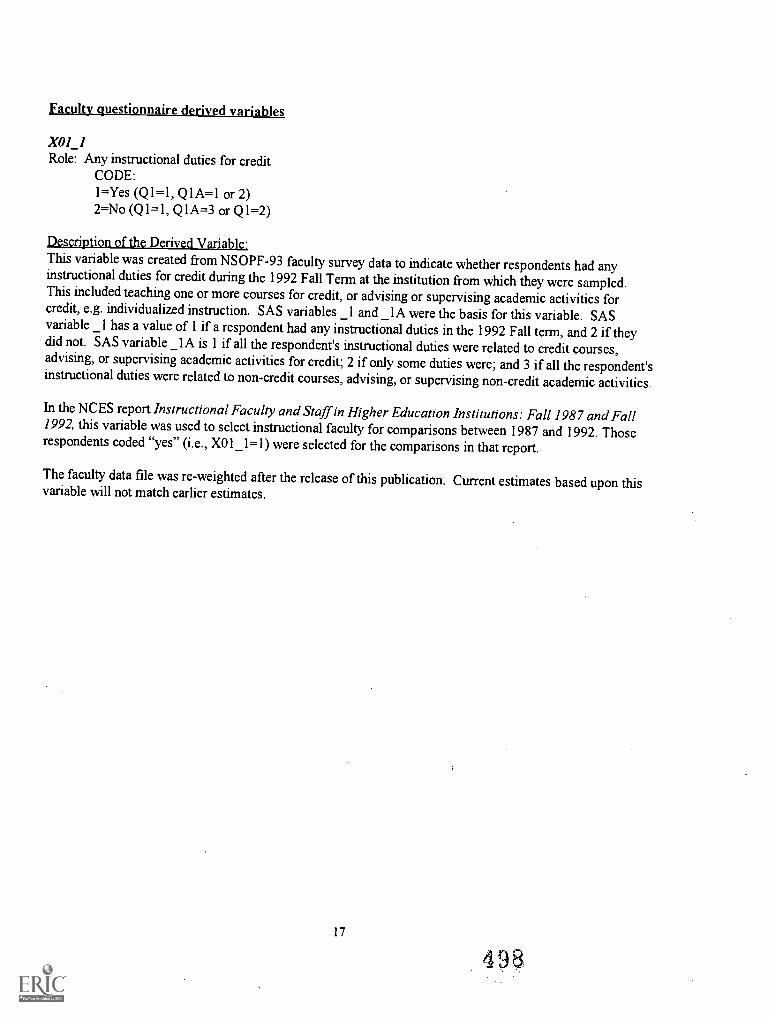
faculty questionnaire derived variables
XOL/Role: Any instructional duties for credit
CODE:1=Yes (Q1=1, Q1A=1 or 2)2=No (Q1=1, Q1A=3 or Q1=2)
Description of the Derived Variable:This variable was created from NSOPF-93 faculty survey data to indicate whether respondents had anyinstructional duties for credit during the 1992 Fall Term at the institution from which they were sampled.This included teaching one or more courses for credit, or advising or supervising academic activities forcredit, e.g. individualized instruction. SAS variables _I and _1A were the basis for this variable. SASvariable _1 has a value of 1 if a respondent had any instructional duties in the 1992 Fall term, and 2 if theydid not. SAS variable _IA is 1 if all the respondent's instructional duties were related to credit courses,advising, or supervising academic activities for credit; 2 if only some duties were; and 3 if all the respondent'sinstructional duties were related to non-credit courses, advising, or supervising non-credit academic activities.
In the NCES report Instructional Faculty and Staffin Higher Education Institutions: Fall 1987 and Fall1992, this variable was used to select instructional faculty for comparisons between 1987 and 1992. Thoserespondents coded "yes" (i.e., X01_1=1) were selected for the comparisons in that report.
The faculty data file was re-weighted after the release of this publication. Current estimates based upon thisvariable will not match earlier estimates.
17
498
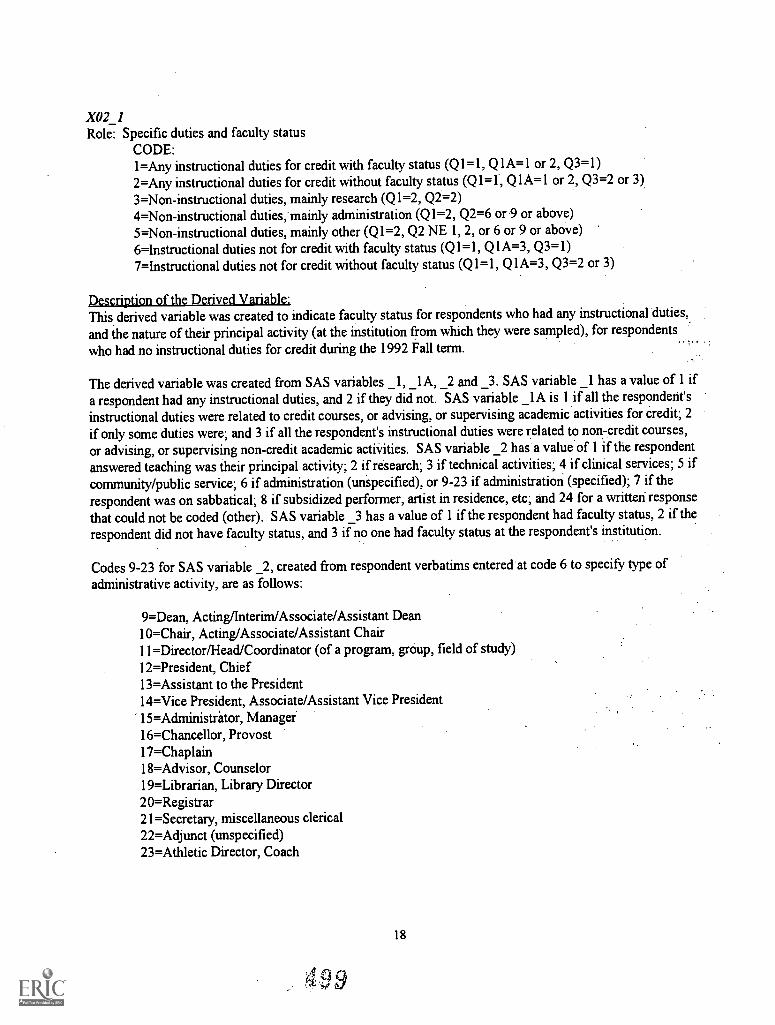
X02 1Role: Specific duties and faculty status
CODE:1=Any instructional duties for credit with faculty status (Q1-1, Q1A=1 or 2, Q3=1)2=Any instructional duties for credit without faculty status (Q1=1., Q1A=1 or 2, Q3=2 or 3)3=Non-instructional duties, mainly research (Q1=2, Q2=2)4=Non-instructional duties, mainly administration (QI=2, Q2=6 or 9 or above)5=Non-instructional duties, mainly other (Q1=2, Q2 NE 1, 2, or 6 or 9 or above)6=Instructional duties not for credit with faculty status (Q1=1, Q1A=3, Q3=1)7=Instructional duties not for credit without faculty status (Q1=1, Q1A=3, Q3=2 or 3)
Description of the Derived Variable.,This derived variable was created to indicate faculty status for respondents who had any instructional duties,
and the nature of their principal activity (at the institution from which they were sampled), for respondentswho had no instructional duties for credit during the 1992 Fall term.
The derived variable was created from SAS variables _1, _IA, _2 and _3. SAS variable _1 has a value of 1 if
a respondent had any instructional duties, and 2 if they did not. SAS variable _lA is 1 if all the respondent'sinstructional duties were related to credit courses, or advising, or supervising academic activities for credit; 2
if only some duties were; and 3 if all the respondent's instructional duties were related to non-credit courses,
or advising, or supervising non-credit academic activities. SAS variable _2 has a value of 1 if the respondentanswered teaching was their principal activity; 2 if research; 3 if technical activities; 4 if clinical services; 5 ifcommunity/public service; 6 if administration (unspecified), or 9-23 if administration (specified); 7 if therespondent was on sabbatical; 8 if subsidized performer, artist in residence, etc; and 24 for a written responsethat could not be coded (other). SAS variable _3 has a value of 1 if the respondent had faculty status, 2 if therespondent did not have faculty status, and 3 if no one had faculty status at the respondent's institution.
Codes 9-23 for SAS variable _2, created from respondent verbatims entered at code 6 to specify type ofadministrative activity, are as follows:
9=Dean, Acting/Interim/Associate/Assistant Dean10=Chair, Acting/Associate/Assistant Chair11=Director/Head/Coordinator (of a program, group, field of study)12=President, Chief13=Assistant to the President14=Vice President, Associate/Assistant Vice President15=Administritor, Manager16=Chancellor, Provost17=Chaplain18=Advisor, Counselor19=Librarian, Library Director20=Registrar21=Secretary, miscellaneous clerical22=Adjunct (unspecified)23=Athletic Director, Coach
18
4 !? 9
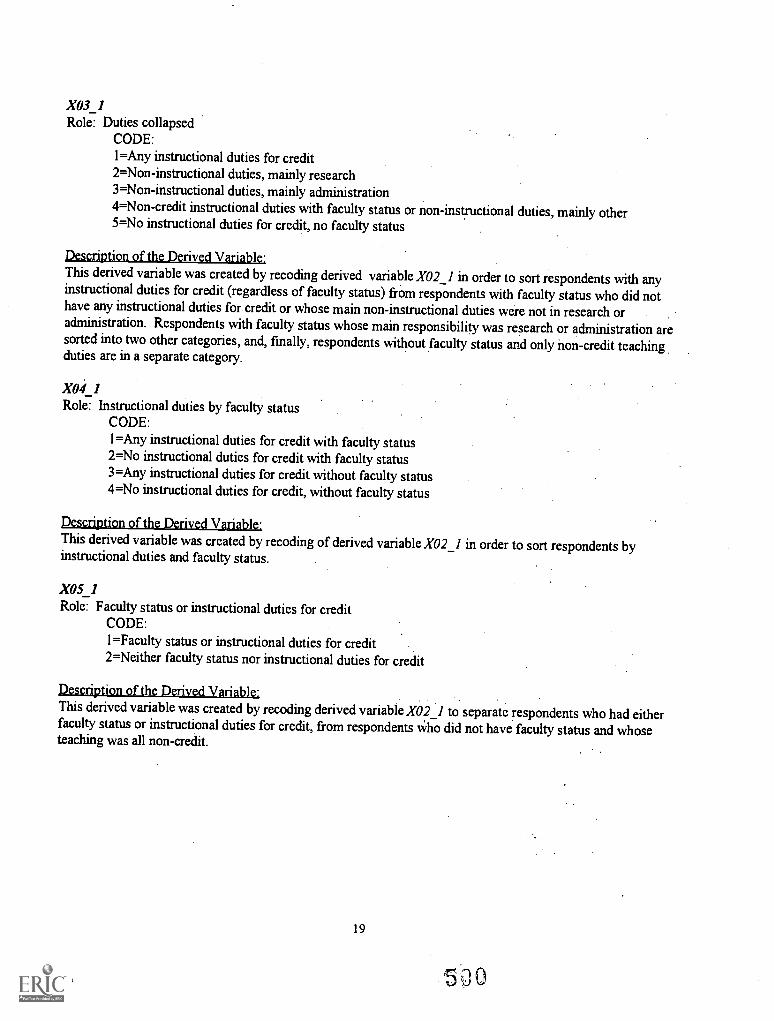
X03_1Role: Duties collapsed
CODE:1=Any instructional duties for credit2=Non-instructional duties, mainly research3=Non-instructional duties, mainly administration4=Non-credit instructional duties with faculty status or non-instructional duties, mainly other5=No instructional duties for credit, no faculty status
Description of the Derived Variable:This derived variable was created by recoding derived variable X02_1 in order to sort respondents with anyinstructional duties for credit (regardless of faculty status) from respondents with faculty status who did nothave any instructional duties for credit or whose main non-instructional duties were not in research oradministration. Respondents with faculty status whose main responsibility was research or administration aresorted into two other categories, and, finally, respondents without faculty status and only non-credit teachingduties are in a separate category.
X04_1Role: Instructional duties by faculty status
CODE:1=Any instructional duties for credit with faculty status2=No instructional duties for credit with faculty status3=Any instructional duties for credit without faculty status4=No instructional duties for credit, without faculty status
Description of the Derived Variable:This derived variable was created by recoding of derived variable X02_1 in order to sort respondents byinstructional duties and faculty status.
X05_1Role: Faculty status or instructional duties for credit
CODE:1=Faculty status or instructional duties for credit2=Neither faculty status nor instructional duties for credit
Description of the Derived Variable.This derived variable was created by recoding derived variable X02 _1 to separate respondents who had eitherfaculty status or instructional duties for credit, from respondents who did not have faculty status and whoseteaching was all non-credit.
19
ir n n0 'Jo w
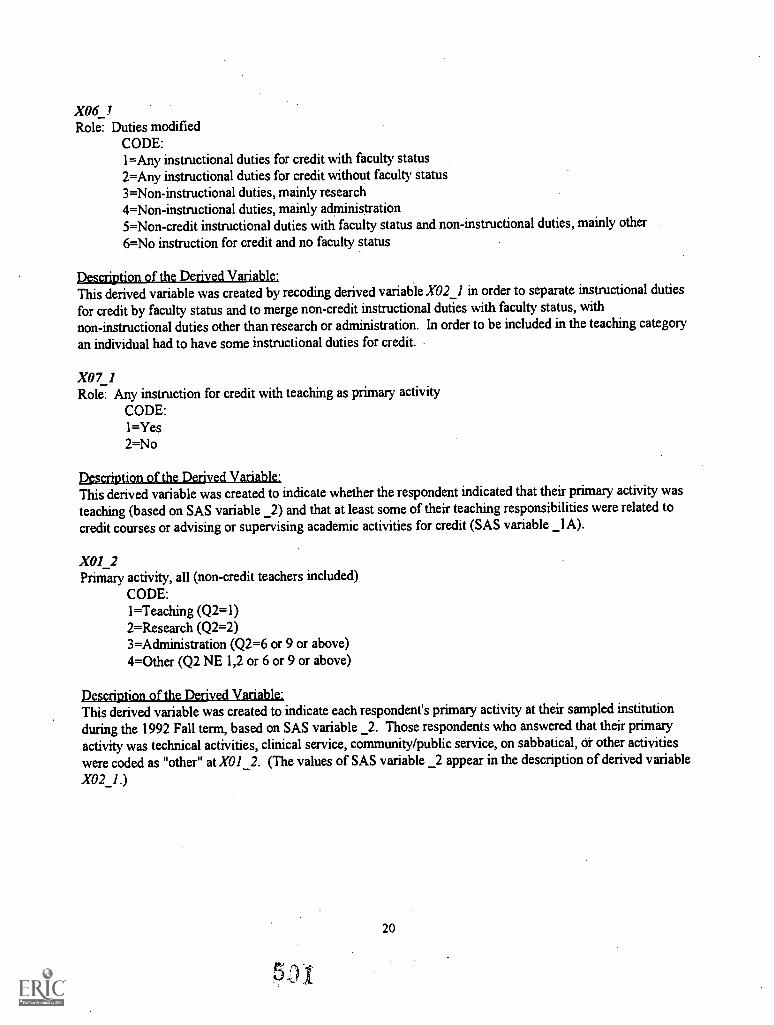
X06Role: Duties modified
CODE:1=Any instructional duties for credit with faculty status2=Any instructional duties for credit without faculty status3=Non-instructional duties, mainly research4=Non-instructional duties, mainly administration5=Non-credit instructional duties with faculty status and non-instructional duties, mainly other
6=No instruction for credit and no faculty status
Description of the Derived Variable.This derived variable was created by recoding derived variable X02_1 in order to separate instructional dutiesfor credit by faculty status and to merge non-credit instructional duties with faculty status, withnon-instructional duties other than research or administration. In order to be included in the teaching category
an individual had to have some instructional duties for credit.
X07_1Role: Any instruction for credit with teaching as primary activity
CODE:1=Yes2=No
Description of the Derived Variable.This derived variable was created to indicate whether the respondent indicated that their primary activity was
teaching (based on SAS variable _2) and that at least some of their teaching responsibilities were related to
credit courses or advising or supervising academic activities for credit (SAS variable _1A).
X01_2Primary activity, all (non-credit teachers included)
CODE:1=Teaching (Q2=1)2=Research (Q2=2)3=Administration (Q2=6 or 9 or above)4=Other (Q2 NE 1,2 or 6 or 9 or above)
Description of the Derived Variable:.This derived variable was created to indicate each respondent's primary activity at their sampled institutionduring the 1992 Fall term, based on SAS variable _2. Those respondents who answered that their primaryactivity was technical activities, clinical service, community/public service, on sabbatical, or other activitieswere coded as "other" at X01_2. (The values of SAS variable _2 appear in the description of derived variable
X02_1.)
20
X02_2Primary activity, modified
CODE:1=Teaching (at least some instructional duties for credit)2=Research3=Administration4=Other duties (including non-credit teaching, with faculty status)
Description of the Derived Variable:This derived variable was created by recoding derived variable X01 _2 to separate non-credit teaching from atleast some teaching for credit. Non-credit teaching with faculty status is merged with other non-instructionalduties. Non-credit teaching without faculty status is not included in this variable.
X01A4Employment: Part-time faculty position only employment
CODE:1=Yes (Q4=1 and Q17=1)2=No (Q4=2, or Q4=1 and Q17=2)
Description of the Derived Variable.,This derived variable was created to identify a respondent whose sole employment during the 1992 Fall Termwas as a part-time faculty member at their sampled institution, based on responses at SAS variable A4(full-time/part-time status) and SAS variable B17 (other employment during the 1992 Fall term).
X01A6Employment: Number of years in current position at institution (1993 minus Q6)
CODE:(NUMBER YEARS, open-ended)
Description of the Derived Variable:.This derived variable was created to indicate the number of years a respondent has been at the position heldduring the 1992 Fall Term at their sampled institution, based on the year began at SAS variable A6.
X01A 7Tenure: Tenure status
CODE:1=Tenured (Q7=1)2=On tenure track but not tenured (Q7=2)3=Not on tenure track (Q7=3)4=No tenure system for respondent's faculty status or no tenure system at institution (Q7=4 or 5)
Description of the Derived Variable-This derived variable was created from SAS variable A7 to indicate tenure status of a respondent during the1992 Fall Term; codes for "no tenure system for respondent's faculty status" and "no tenure system at thisinstitution" have been merged into one category.
21
502
X02A7Tenure: Number of years tenured (1993 minus Q7A)
CODE:(NUMBER YEARS, Open-ended)
Description of the Derived Variable:This derived variable was created from SAS variable A7A to provide a calculation of the number of years arespondent has been tenured.
X01A9Academic rank
CODE:1=Not applicable, no ranks designated at institution (Q9=NA)2=Full Professor (Q9=1)3=Associate Professor (Q9=2)4=Assistant Professor (Q9=3)5=Instructor (Q9=4)6=Lecturer (Q9=5)7=Other ranks (Q9=any "other" category)
Description of the Derived Variable.This derived variable was created from SAS variable A9 to identify a respondent's academic rank, title orposition at their sampled institution or to identify the fact that ranks are not assigned. SAS variable A9 has avalue of 1 if the respondent was a full professor, 2 if an associate professor, 3 if an assistant professor, 4 if aninstructor, 5 if a lecturer, 6 if an unspecified "other rank", and 7 or above if "other rank" was specified. Thereserve code used for NA (not applicable)= -5. Codes 7-25, created from respondent verbatims entered atcode 6 to specify type of rank, are as follows:
7=Visiting Faculty/Teacher/or unspecified8=Professor Emeritus9=Dean10=Chairperson11=Director, Head, Coordinator, Executive12=Administration, Administrator13=Management, Supervisor14=Post-doctoral15=Research Fellow/Scientist/Professor16=President, Chancellor17=Chaplain18=Counselor, Mentor, Advisor19=Librarian, Curator20=Research Associate/Assistant21=Secretary, miscellaneous clerical22=Adjtuict Faculty/Teacher/or unspecified23=Coach24=No title, no rank25=Other
22
X01A10Academic rank: Number of years since rank achieved (1993-Q10)
CODE:(NUMBER YEARS, Open-ended)
Description of the Derived Variable:This derived variable was created to provide a calculation of years since a respondent first achieved theacademic rank held in the 1992 Fall term, based on the year entered at SAS variable A10.
X01AllAppointment type
CODE:1=Regular (Q11 NE 1,2, or 3)2=Temporary (Q11=1,2, or 3)
Description of the Derived VariableThis derived variable was created to determine the type of appointment held by a respondent at their sampledinstitution in the Fall of 1992. SAS variables A11_1 through A117 were used to create this variable. All
1=an acting appointment, Al l_2= affiliate or adjunct, A 1 1_3=visiting, Al l_4= assigned by religious order,Al l_5= clinical, Al l_6= research, and Al l_7=none of the above. Al1_1, A11_2 or A11_3 are consideredtemporary appointments; A11_4 through A11_7 are considered regular appointments.
X02AllAppointment type and employment status
CODE:1=Full-time, regular (Q4=2, Q11 NE 1,2, or 3)2=Full-time, temporary (Q4=2, Q11=1,2, or 3)3=Part-time, regular (Q4=1, Q11 NE 1,2, or 3)4=Part-time, temporary (Q4=1, Q11=1,2, or 3)
Description of the Derived Variable:This derived variable was created to indicate a respondent's type of appointment as well as full- or part-timeemployment status at their sampled institution, based on SAS variable A4 and derived variable X01A11. IfSAS variable A4 is 1, the respondent worked part-time. If it is 2, the respondent worked full-time. X01A1was used to determine the type of appointment. IfX01A1 1=1, the appointment is regular. -IfX01A11=2, theappointment is temporary.
X01Al2Program area: Teaching categories (matches NSOPF-88 categories)
CODE:1=Agriculture and home economics (Q12=100-110, 350; includes agribusiness (101),agricultural sciences (102), renewable resources (103), other agriculture (110), and homeeconomics (350))2=Business (Q12=160-170; includes business (160), accounting (161), banking and fmance(162), business administration and management (163), business administrative support(164), human resources development (165), organizational behavior (166), marketing anddistribution (167) and other business (170))
23
MT COPY AVAILABLE504
3=Education (Q12=220-250; includes general education (221), basic skills (222), bilingualand cross-cultural education (223), curriculum and instruction (224), educationadministration (225), education evaluation and research (226), educational psychology(227) special ed. (228), student counseling and personnel services (229) other education (230),teacher education-unspecified (240), pre-elementary (241), elementary (242), secondary(243), adult and continuing (244), other general teacher ed. programs (245) and teachered. in specific subjects (250))4=Engineering (Q12=260-280; includes general, civil, mechanical, chemical, and otherengineering (261-270), engineering-related technologies (280))5=Fine arts (Q12=140-150, includes art history and appreciation (141), crafts (142), dance(143), design (144), dramatic arts (145), film arts (1.46), fine arts (147), music (148), musichistory and appreciation (149), and other visual or performing arts (150))6=Health sciences (Q12=330-340; includes health sciences-unspecified (330), allied healthtechnologies (331), dentistry (332), health services administration (333), medicine (334), nursing(335), pharmacy (336), public health (337), veterinary medicine (338), and other health sciences(340))7=Humanities (Q12=290-320, 480, 548; includes general English (291), composition (292),American lit. (293), English lit. (294), linguistics (295), speech (296), English as second language(297), other English (300), foreign languages-unspecified (310), Chinese (311), French (312),German (313), Italian (314), Latin (315), Japanese (316), other Asian (317), Russian (318), Spanish(319), other foreign languages (320), philosophy and religion (480), and history (548))8=Natural sciences (Q12=200-210, 390-440; includes computer science-unspecified (200),computer and information sciences (201), computer programming (202), data processing(203),systems analysis (204), other computer science (210), biological sciences-unspecified (390),biochemistry (391), biology (392), botany (393), genetics (394), immunology (395), microbiology(396), physiology (397), zoology (398), other biological sciences (400), physicalsciences-unspecified (410), astronomy (411), chemistry (412), physics (413), geological sciences(414), other physical sciences (420), mathematics (430), and statistics (440))9=Social sciences (Q12=510, 540-547, 549-560; includes psychology (510), socialsciences-unspecified (540), general social sciences (541), anthropology (542), archeology (543), areaand ethnic studies (544), demography (545), economics (546), geography (547) internationalrelations (549), political science (550), sociology (551), and other social sciences (560))10=A11 other fields (Q12=120-130, 180-190, 360, 370, 380, 450, 460, 470, 490, 500, 520, 530,570-900; includes architecture (120-130), communications (180-190), industrial arts (360), law(370), library and archival sciences (380), military studies (450), multi-interdisciplinary studies(460), parks and recreation (470), theology (490), protective services (500), public affairs (520),science technologies (530), vocational training (570), construction trades (600-610), consumerservices (620-630), mechanics and repairers (640-644), precision production (660-670),transportation (680-690), and "other" (900))
Description of the Derived Variable,This derived variable was created from SAS variable A 12A in order to identify the general program area of arespondent's principal field of teaching. The categories match NSOPF-88 program area categories.
-t
24
ti c
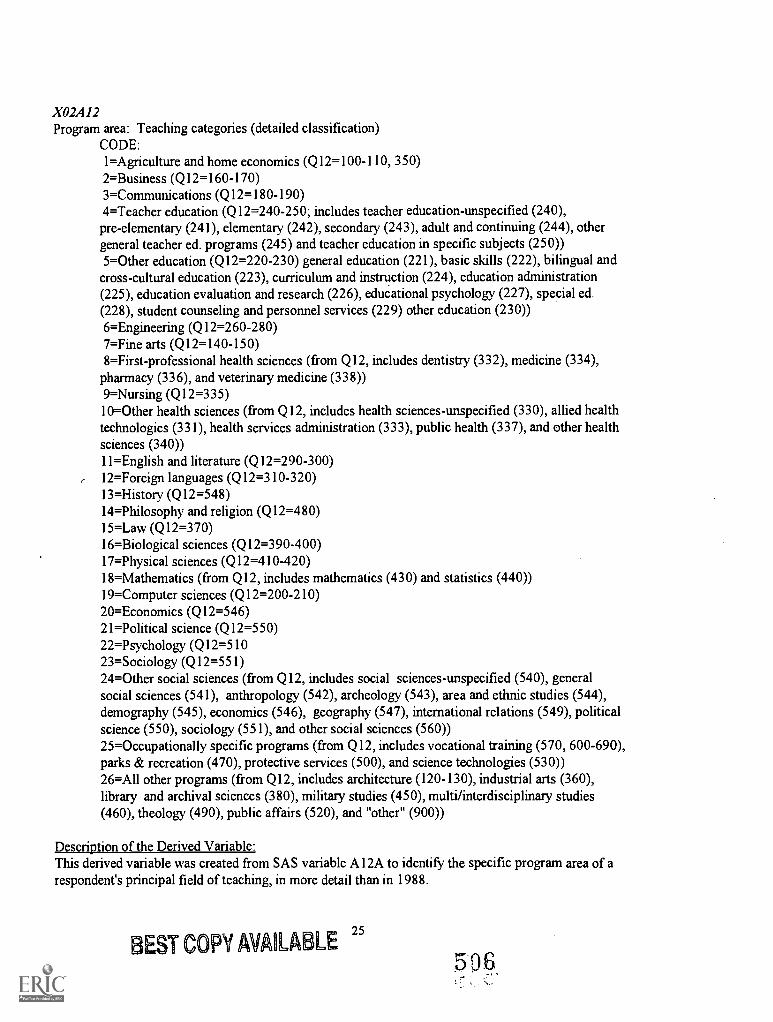
X02Al2Program area: Teaching categories (detailed classification)
CODE:1=Agriculture and home economics (Q12=100-110, 350)2=Business (Q12=160-170)3=Communications (Q12=180-190)4=Teacher education (Q12=240-250; includes teacher education-unspecified (240),
pre-elementary (241), elementary (242), secondary (243), adult and continuing (244), othergeneral teacher ed. programs (245) and teacher education in specific subjects (250))5=Other education (Q12=220-230) general education (221), basic skills (222), bilingual and
cross-cultural education (223), curriculum and instruction (224), education administration(225), education evaluation and research (226), educational psychology (227), special ed.(228), student counseling and personnel services (229) other education (230))6=Engineering (Q12=260-280)7=Fine arts (Q12=140-150)8=First-professional health sciences (from Q12, includes dentistry (332), medicine (334),
pharmacy (336), and veterinary medicine (338))9=Nursing (Q12=335)10=Other health sciences (from Q12, includes health sciences-unspecified (330), allied healthtechnologies (331), health services administration (333), public health (337), and other healthsciences (340))11=English and literature (Q12=290-300)12=Foreign languages (Q12=310-320)13=History (Q12=548)14=Philosophy and religion (Q12=480)15=Law (Q12=370)16=Biological sciences (Q12=390-400)17=Physical sciences (Q12=410-420)18=Mathematics (from Q12, includes mathematics (430) and statistics (440))19=Computer sciences (Q12=200-210)20=Economics (Q12=546)21=Political science (Q12=550)22=Psychology (Q12=51023=Sociology (Q12=551)24=Other social sciences (from Q12, includes social sciences-unspecified (540), generalsocial sciences (541), anthropology (542), archeology (543), area and ethnic studies (544),demography (545), economics (546), geography (547), international relations (549), politicalscience (550), sociology (551), and other social sciences (560))25=Occupationally specific programs (from Q12, includes vocational training (570, 600-690),parks & recreation (470), protective services (500), and science technologies (530))26=All other programs (from Q12, includes architecture (120-130), industrial arts (360),library and archival sciences (380), military studies (450), multi/interdisciplinary studies(460), theology (490), public affairs (520), and "other" (900))
Description of the Derived Variable:This derived variable was created from SAS variable A 12A to identify the specific program area of arespondent's principal field of teaching, in more detail than in 1988.
BEST COPY MAILABLE 25
506
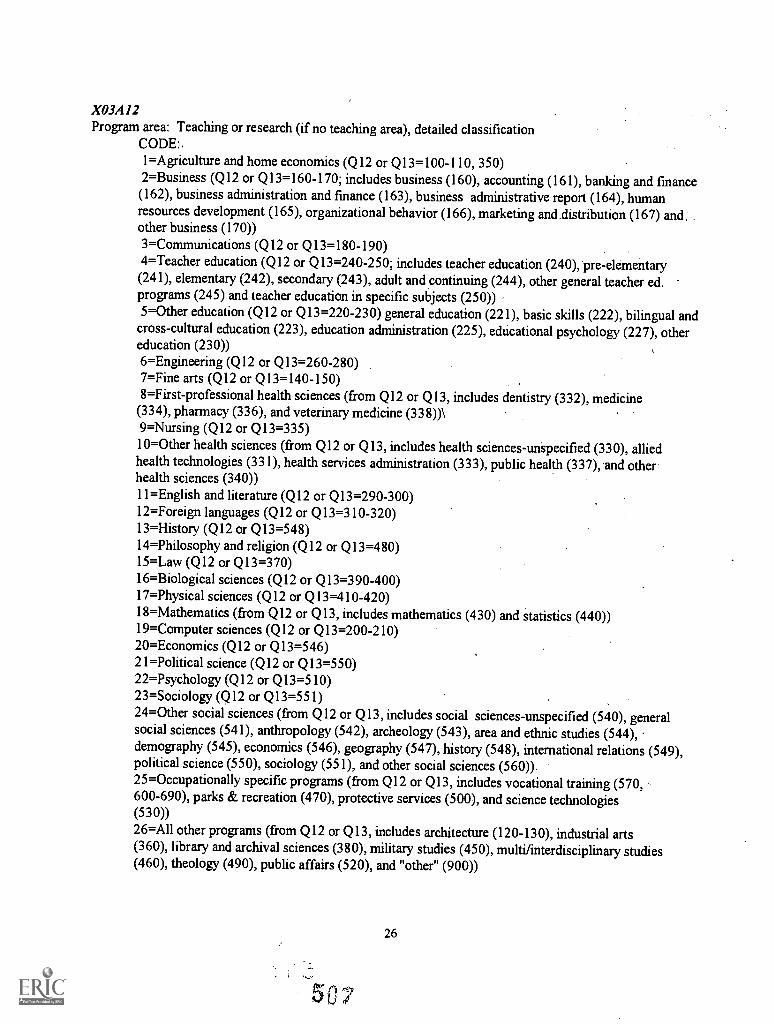
X03A 1 2
Program area: Teaching or research (if no teaching area), detailed classificationCODE:,1=Agriculture and home economics (Q12 or Q13=100-110, 350)2=Business (Q12 or Q13=160-170; includes business (160), accounting (161), banking and fmance
(162), business administration and fmance (163), business administrativereport (164), humanresources development (165), organizational behavior (166), marketing and .distribution (167) and.other business (170))3=Communications (Q12 or Q13=180-190)4=Teacher education (Q12 or Q13=240-250; includes teacher education (240), pre-elementary(241), elementary (242), secondary (243), adult and continuing (244), other general teacher ed.programs (245) and teacher education in specific subjects (250))5=Other education (Q12 or Q13=220-230) general education (221), basic skills (222), bilingual and
cross-cultural education (223), education administration (225), educational psychology (227), othereducation (230))6=Engineering (Q12 or Q13=260-280)7=Fine arts (Q12 or Q13=140-150)8=First-professional health sciences (from Q12 or Q13, includes dentistry (332), medicine
(334), pharmacy (336), and veterinary medicine (338))\9=Nursing (Q12 or Q13=335)10=Other health sciences (from Q12 or Q13, includes health sciences- unspecified (330), alliedhealth technologies (331), health services administration (333), public health (337), and otherhealth sciences (340))11-English and literature (Q12 or Q13=290-300)12=Foreign languages (Q12 or Q13=310-320)13=History (Q12 or Q13=548)14=Philosophy and religion (Q12 or Q13=480)15=Law (Q12 or Q13=370)16=Biological sciences (Q12 or Q13=390-400)17=Physical sciences (Q12 or Q13=410-420)18=Mathematics (from Q12 or Q13, includes mathematics (430) and statistics (440))19=Computer sciences (Q12 or Q13=200-210)20=Economics (Q12 or Q13=546)21=Political science (Q12 or Q13=550)22=Psychology (Q12 or Q13=510)23=Sociology (Q12 or Q13=551)24=Other social sciences (from Q12 or Q13, includes social sciences-unspecified (540), generalsocial sciences (541), anthropology (542), archeology (543), area and ethnic studies (544),demography (545), economics (546), geography (547), history (548), international relations (549),political science (550), sociology (551), and other social sciences (560)).25=Occupationally specific programs (from Q12 or Q13, includes vocational training (570,600-690), parks & recreation (470), protective services (500), and science technologies(530))26=All other programs (from Q12 or Q13, includes architecture (120-130), industrial arts(360), library and archival sciences (380), military studies (450), multi/interdisciplinary studies(460), theology (490), public affairs (520), and "other" (900))
26
5' 0 7
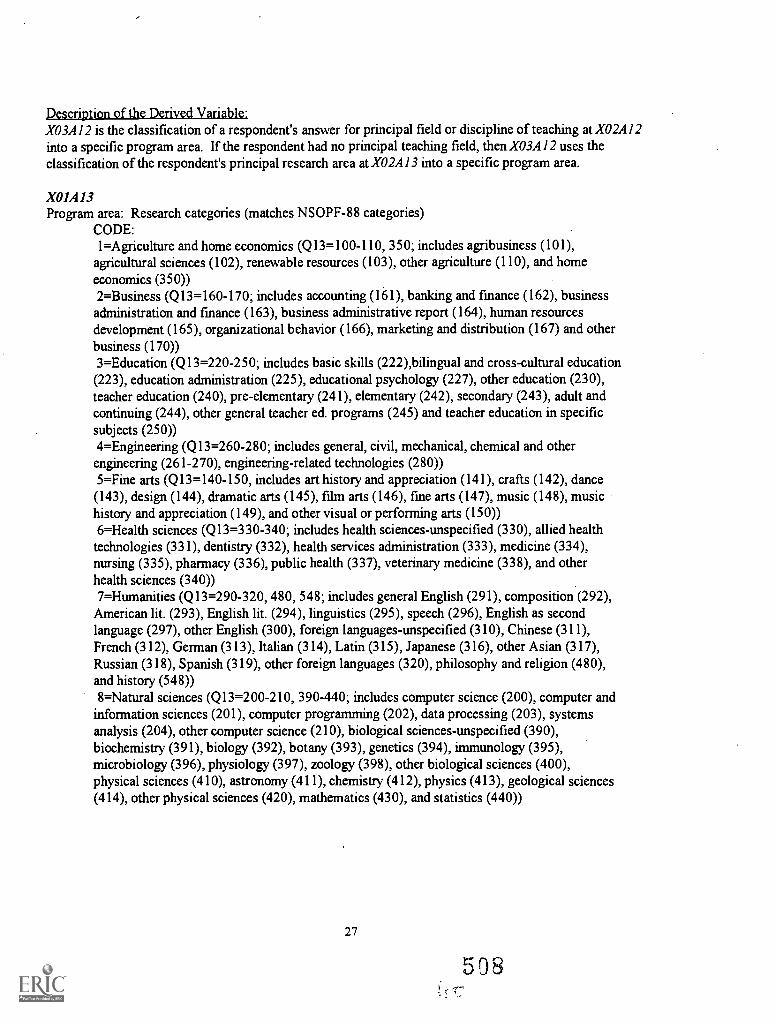
Description of the Derived Variable:X03A 12 is the classification of a respondent's answer for principal field or discipline of teaching at X02A 12into a specific program area. If the respondent had no principal teaching field, then X03A 12 uses theclassification of the respondent's principal research area at X02A 13 into a specific program area.
X01A13Program area: Research categories (matches NSOPF-88 categories)
CODE:1=Agriculture and home economics (Q13=100-110, 350; includes agribusiness (101),
agricultural sciences (102), renewable resources (103), other agriculture (110), and homeeconomics (350))2=Business (Q13=160-170; includes accounting (161), banking and finance (162), businessadministration and finance (163), business administrative report (164), human resourcesdevelopment (165), organizational behavior (166), marketing and distribution (167) and otherbusiness (170))3=Education (Q13=220-250; includes basic skills (222),bilingual and cross-cultural education(223), education administration (225), educational psychology (227), other education (230),teacher education (240), pre-elementary (241), elementary (242), secondary (243), adult andcontinuing (244), other general teacher ed. programs (245) and teacher education in specificsubjects (250))4=Engineering (Q13=260-280; includes general, civil, mechanical, chemical and other
engineering (261-270), engineering-related technologies (280))5=Fine arts (Q13=140-150, includes art history and appreciation (141), crafts (142), dance(143), design (144), dramatic arts (145), film arts (146), fine arts (147), music (148), musichistory and appreciation (149), and other visual or performing arts (150))6=Health sciences (Q13=330-340; includes health sciences-unspecified (330), allied health
technologies (331), dentistry (332), health services administration (333), medicine (334),nursing (335), pharmacy (336), public health (337), veterinary medicine (338), and otherhealth sciences (340))7=Humanities (Q13=290-320, 480, 548; includes general English (291), composition (292),
American lit. (293), English lit. (294), linguistics (295), speech (296), English as secondlanguage (297), other English (300), foreign languages-unspecified (310), Chinese (311),French (312), German (313), Italian (314), Latin (315), Japanese (316), other Asian (317),Russian (318), Spanish (319), other foreign languages (320), philosophy and religion (480),and history (548))8=Natural sciences (Q13=200-210, 390-440; includes computer science (200), computer and
information sciences (201), computer programming (202), data processing (203), systemsanalysis (204), other computer science (210), biological sciences-unspecified (390),biochemistry (391), biology (392), botany (393), genetics (394), immunology (395),microbiology (396), physiology (397), zoology (398), other biological sciences (400),physical sciences (410), astronomy (411), chemistry (412), physics (413), geological sciences(414), other physical sciences (420), mathematics (430), and statistics (440))
27
508
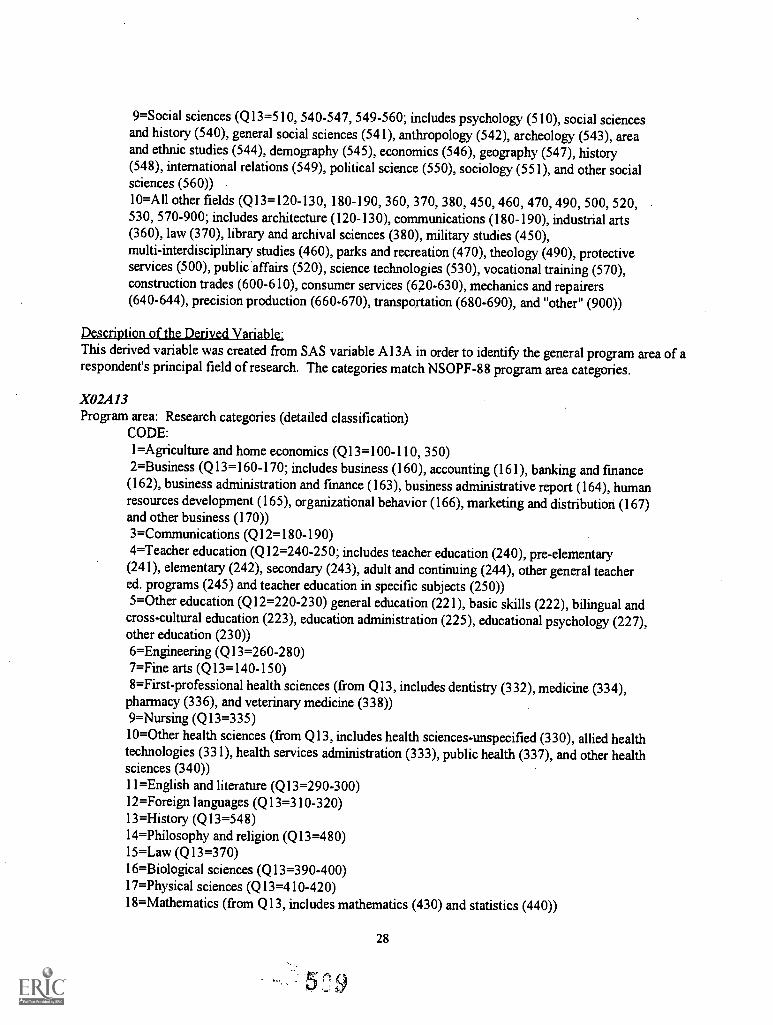
9=Social sciences (Q13=510, 540-547, 549-560; includes psychology (510), social sciencesand history (540), general social sciences (541), anthropology (542), archeology (543), areaand ethnic studies (544), demography (545), economics (546), geography (547), history(548), international relations (549), political science (550), sociology (551), and other socialsciences (560))10=A11 other fields (Q13=120-130, 180-190, 360, 370, 380, 450, 460, 470, 490, 500, 520,530, 570-900; includes architecture (120-130), communications (180-190), industrial arts(360), law (370), library and archival sciences (380), military studies (450),multi-interdisciplinary studies (460), parks and recreation (470), theology (490), protectiveservices (500), public 'affairs (520), science technologies (530), vocational training (570),construction trades (600-610), consumer services (620-630), mechanics and repairers(640-644), precision production (660-670), transportation (680-690), and "other" (900))
Description of the Derived Variable.,This derived variable was created from SAS variable A 13A in order to identify the general program area of arespondent's principal field of research. The categories match NSOPF-88 program area categories.
X02A13Program area: Research categories (detailed classification)
CODE:1=Agriculture and home economics (Q13=100-110, 350)2=Business (Q13=160-170; includes business (160), accounting (161), banking and fmance(162), business administration and fmance (163), business administrative report (164), humanresources development (165), organizational behavior (166), marketing and distribution (167)and other business (170))3=Communications (Q12=180-190)4=Teacher education (Q12=240-250; includes teacher education (240), pre-elementary(241), elementary (242), secondary (243), adult and continuing (244), other general teachered. programs (245) and teacher education in specific subjects (250))5=Other education (Q12=220-230) general education (221), basic skills (222), bilingual and
cross-cultural education (223), education administration (225), educational psychology (227),other education (230))6=Engineering (Q13=260-280)7=Fine arts (Q13=140-150)8=First-professional health sciences (from Q13, includes dentistry (332), medicine (334),
pharmacy (336), and veterinary medicine (338))9=Nursing (Q13=335)10=Other health sciences (from Q13, includes health sciences-unspecified (330), allied healthtechnologies (331), health services administration (333), public health (337), and other healthsciences (340))11=English and literature (Q13=290-300)12=Foreign languages (Q13=310-320)13=History (Q13=548)14=Philosophy and religion (Q13=480)15=Law (Q13=370)16=Biological sciences (Q13=390-400)17=Physical sciences (Q13=410-420)18=Mathematics (from Q13, includes mathematics (430) and statistics (440))
28
19=Computer sciences (Q13=200-210)20=Economics (Q13=546)21=Political sciences (Q13=550)22=Psychology (Q13=510)23=Sociology (Q13=551)24=Other social sciences (from Q12, includes social sciences and history (540), general socialsciences (541), anthropology (542), archeology (543), area and ethnic studies (544),demography (545), economics (546), geography (547), history (548), international relations(549), political science (550), sociology (551), and other social sciences (560))25=Occupationally specific programs (from Q13, includes vocational training (570, 600-690),parks & recreation (470), protective services (500), and science technologies (530))26=All other programs (from Q13, includes architecture (120-130), industrial arts (360),library and archival sciences (380), military studies (450), multi/interdisciplinary studies (460),theology (490), public affairs (520), and "other" (900))
Description of the Derived Variable:This derived variable was created from SAS variable A 13A to identify the specific program area of arespondent's principal field of research, in more detail than in 1988.
X01B14Awards: Undergraduate awards
CODE:1=Yes (Q14=1 or 2 or 3 or 4 or 5)2=No (Q14=6)
Description of the Derived Variable:This derived variable was created to collapse the five categories for academic honors received by arespondent (SAS variables BI4_1 to B14_5) into one category in order to indicate whether therespondent reported receiving any academic honors.
The variables B14_1 to B14_5 are as follows:
B14 1=National academic honor society, such as Phi Beta Kappa, Tau Beta Pi, or other field-specificnational honorB14 2=Cum laude or honorsB14 3=Magna cum laude or high honorsB14_4=Stunma cum laude or highest honorsB14 5=Other undergraduate academic achievement award
29
51.0
X01B16Degree: Highest degree
CODE:1=Ph.D. (Q 16A 1=2)2=First-profession al (Q 1 6A 1 =1)3=Master's (Q 16A 1=3)4Bachelor's (Q16A1=4)S =Less than bachelor's (Q16A1=5 or 6 or 7)
Description of the Derived VariableThis derived variable was created in order to describe the highest degree or award achieved by a respondent.If a respondent reported both a Ph.D. and a first professional degree, X01B16 was coded as "1", (Ph.D.) SASvariable B16A1 (code for type of degree) was used in the creation of this variable.
The values for B16A1 are as follows:
1Professional degree (M.D., D.D.S., L.L.B., etc.)2=Doctoral degree (Ph.D., Ed.D., etc.)3=Master's degree or equivalent4=Bachelor's degree or equivalent5=Certificate, diploma, or degree for completion of undergraduate program of more than two years but
less than four years in length6=Associate's degree or equivalent7=Certificate, diploma, or degree for completion of undergraduate program of at least 1 year but less
than two years in length
X02B16Degree: Highest degree year
CODE:(Open-ended)
Description of the Derived Variable:This derived variable was created to report the year in which a respondent received their highest degree, basedon SAS variable B16B1 (year highest degree received).
30
X03B16Degree: Highest degree program area (matches NSOPF-88 categories)
CODE:1=Agriculture and home economics (B16C1=100-110, 350; includes agribusiness (101),
agricultural sciences (102), renewable resources (103), other agriculture (110), and home economics(350))2=Business (B16C1=160-170; includes accounting (161), banking and fmance (162), businessadministration and fmance (163), business administrative report (164), human resourcesdevelopment (165), organizational behavior (166), marketing and distribution (167) and otherbusiness (170))3=Education (B16C1=220-250; includes basic skills (222), bilingual and cross-culturaleducation (223), education administration (225), educational psychology (227), other education(230), teacher education (240), pre-elementary (241), elementary (242), secondary (243), adult andcontinuing (244), other general teacher ed. programs (245) and teacher education in specific subjects(250))4=Engineering (B16C1=260-280; includes general, civil, mechanical, chemical and otherengineering (261-270), engineering-related technologies (280))5=Fine arts (B16C1=140-150, includes art history and appreciation (141), crafts (142), dance
(143), design (144), dramatic arts (145), film arts (146), fine arts (147), music (148), music historyand appreciation (149), and other visual or performing arts (150))6=Health sciences (816C1=330-340; includes health sciences-unspecified (330), allied health
technologies (331), dentistry (332), health services administration (333), medicine (334), nursing(335), pharmacy (336), public health (337), veterinary medicine (338), and other health sciences(340))7=Humanities (B16C1=290-320, 480, 548; includes general English (291), composition (292),
American lit. (293), English lit. (294), linguistics (295), speech (296), English as second language(297), other English (300), foreign languages (310), Chinese (311), French (312), German (313),Italian (314), Latin (315), Japanese (316), other Asian (317), Russian (318), Spanish (319), otherforeign languages (320), philosophy and religion (480), and history (548))8=Natural sciences (B16C1=200-210, 390-440; includes computer science (200), computer and
information sciences (201), computer programming (202), data processing (203), systems analysis(204), other computer science (210), biological sciences (390), biochemistry (391), biology (392),botany (393), genetics (394), immunology (395), microbiology (396), physiology (397), zoology(398), other biological sciences (400), physical sciences (410), astronomy (411), chemistry (412),physics (413), geological sciences (414), other physical sciences (420), mathematics (430), andstatistics (440))9=Social sciences (B16C1=510, 540-547, 549-560; includes psychology (510), social sciences
and history (540), general social sciences (541), anthropology (542), archeology (543), area andethnic studies (544), demography (545), economics (546), geography (547), history (548),international relations (549), political science (550), sociology (551), and other social sciences (560))10=All other fields (B16C1=120-130, 180-190, 360, 370, 380, 450, 460, 470, 490, 500, 520, 530,570-900; includes architecture (120-130), communications (180-190), industrial arts (360), law(370), library and archival sciences (380), military studies (450), multi-interdisciplinary studies(460), parks and recreation (470), theology (490), protective services (500), public affairs (520),science technologies (530), vocational training (570), construction trades (600-610), consumerservices (620-630), mechanics and repairers (640-644), precision production (660-670),transportation (680-690), and "other" (900))
31
Des,ziption of the Derived Variable:This derived variable was created from SAS variable B16C1 in order to identify the general program area ofa respondent's highest degree field. The categories match NSOPF-88 program area categories.
X07B16Degree: Highest degree program area (more detailed classification)
CODE:1=Agriculture and home economics (B16C1=100-110, 350)2=Business (B16C1=160-170; includes business (160), accounting (161), banking and finance(162), business administration and finance (163), business administrativereport (164), humanresources development (165), organizational behavior (166), marketing and distribution (167) andother business (170))3= Communications (B16C1=180-190)4=Teacher education (B16C1=240-250; includes teacher education (240), pre-elementary(241), elementary (242), secondary (243), adult and continuing (244), other general teacher ed.programs (245) and teacher education in specific subjects (250))5=Other education (Q12=220-230) general education (221), basic skills (222), bilingual and
cross-cultural education (223), education administration (225), educational psychology (227), othereducation (230))6=Engineering (B16C1=260-280)7=Fine arts (B16C1=140-150)8=First-professional health sciences (from B16C1, includes dentistry (332), medicine (334),
pharmacy (336), and veterinary medicine (338))9=Nursing (B16C1=335)10=Other health sciences (from B16C1, includes health sciences-unspecified (330), allied healthtechnologies (331), health services administration (333), public health (337), and other healthsciences (340))11=English and literature (B16C1=291-300)12=Foreign languages (B16C1=310-320)13=History (B16C1=548)14=Philosophy (B16C1=480)15=Law (B16C1=370)16=Biological sciences (B16C1=390-400)17=Physical sciences (B16C1=410-420)18=Mathematics (from B16C1, includes mathematics (430) and statistics (440))19=Computer sciences (B16C1=200-210)20=Economics (B16C1=546)21=Political science (B16C1=550)22=Psychology (B16C1=510)23=Sociology (B16C1=551)24=Other social sciences (from B16C1, includes categories 540, 541, 542, 543, 544, 545, 547, 549,and 560)25=Occupationally specific programs (from B16C1, includes vocational training (570, 600-690),parks & recreation (470), protective services (500), and science technologies (530))
Description of the Derived VariableThis derived variable was created from SAS variable B16C1 in order to identify the specific program area ofa respondent's highest degree field, in more detail than in 1988.
32
513
X06B16Employment: Position at institution Fall 1992 first or only job since highest degree attained
CODE:1=Yes2=No
Description of the Derived Variable:This derived variable was created to report whether a respondent's current position is the only position heldsince attaining the highest degree. This variable was created using SAS variables B16B1 (year highest or onlydegree received), B17A (number of different jobs during Fall 1992), B18A (main other current job), and SASvariables B19A1A and B19A1B (years most recent job was held).
X01B18Employment: Employment sector of main other Fall 1992 job
CODE:1=Postsecondary institution (Q18=1 or 2)2=Hospital, foundation or government (Q18=5, 6 or 8)3=Consulting or self-Employed (Q18=4)4=For profit business (Q18=7)5=Other (Q18=3 or 9)
Description of the Derived Variable:This derived variable was created to indicate the employment sector of the main other job held by arespondent during the 1992 Fall term (SAS variable B18). Postsecondary institutions (two-year or four-year)are collapsed into code 1; hospitals, foundations or government employment are collapsed into Code 2; andelementary or secondary institution is included in Code 5 (Other).
The codes for SAS variable B18 are as follows:
1=Four-year college or university, graduate or professional school2=Two-year or other postsecondary institution3=Elementary or secondary school4=Consulting, freelance work, self-owned business, or private practice5=Hospital or other health care or clinical setting6=Foundation or other nonprofit organization other than health care organization7=For-profit business or industry in the private sector8=Federal government, including military, or state or local government9=Other
33
X02B18Employment: Primary responsibility of main other Fall 1992 job
CODE:1=Teaching (Q18B=1)2=Research (Q18B=2)3=Other (Q18B NE 1 or 2)
Description of the Derived Variable:.Primary responsibilities reported at SAS variable B18B other than teaching or research are collapsed tocreate this derived variable.
Codes 3-7 for SAS variable B18B are as follows:
3=Technical activities4=Clinical service5=Community/public service6= Administration7=Other
X01B19Employment: Employment sector of most recent main job ending before Fall 1992
CODE:1=Postsecondary institution (Q19A2=1 or 2)2=Hospital, foundation or government (Q19A2=5, 6 or 8)3=Consulting or self-employed (Q19A2=4)4=For profit business (Q19A2=7)5=Other (Q19A2=3 or 9)
Description of the Derived Variable.,This derived variable was created to indicate the employment sector of the most recent job held by arespondent prior to Fall 1992 (SAS variable B19A2). Postsecondary institutions (two-year or four-year) arecollapsed into code 1; hospitals, foundations or government employment are collapsed into Code 2; and ,
elementary or secondary institution is included in Code 5 (other).
The codes for SAS variable B19A2 are as follows:
1=Four-year college or university, graduate or professional school2=2-year or other postsecondary institution3=Elementary or secondary school4=Consulting, freelance work, self-owned business, or private practice5=Hospital or other health care or clinical setting6=Foundation or other nonprofit organization other thanhealth care organization7=For-profit business or industry in the private sector8=Federal government, including military, or state or local government9=Other
34
X02B19Employment: Primary responsibility of most recent main job
CODE:1=Teaching (Q 1 9A3=1)2=Research (Q 1 9A3=2)3=Other (Q19A3 NE 1 or 2)
Description of the Derived Variable:This derived variable was created to indicate whether the primary responsibility of a respondent was teaching,
research or another activity using SAS variable B19A3. Codes for technical activities, clinical service,
community /public service, and administration have been collapsed into the "other" code.
Codes 3-7 for SAS variable B19A3 are as follows:
3=Technical activities4=Clinical service5=Community/public service6=Administration7=Other
X01B20Productivity, non-teaching: Career output for refereed articles (Q20A1)
CODE:(Open-ended)
Description of the Derived Variable.This derived variable was created to report on one aspect of a faculty respondent's non-teaching productivity
over the course of their career. This variable is based on SAS variable:
820A1=Total number of articles published in refereed professional or trade journals during career
X02B20Productivity, non-teaching: Career output for books, chapters (Q20A6+A7+A8+A9)
CODE:(Open-ended)
Description of the Derived Variable:This derived variable was created to report on one aspect of a faculty respondent's non-teaching productivity
over the course of their career. This variable is based on totals reported at SAS variables:
B20A6=Total number of chapters in edited volumes during careerB20A7=Total number of textbooks during careerB20A8=Total number of other books during careerB20A9=Total number of monographs during career
35
51.6-
X03B20Productivity, non-teaching: Career output for book reviews (Q20A5)
CODE:(Open-ended)
Description of the Derived Variable.This derived variable was created to report on one aspect of a faculty respondent's non-teaching productivityover the course of their career. This variable is based on SAS variable:
B20A5=Total number of published reviews of books, articles, or creative works during career
X04B20Productivity, non-teaching: Career output for other reports (Q20A2+A10)
CODE:(Open-ended)
Description of the Derived Variable.,This derived variable was created to report on one aspect of a faculty respondent's non-teaching productivityover the course of their career. This variable is based on totals reported at SAS variables:
B20A2=Total number of articles published in non-refereed professional or trade journals duringcareer
B20A10=Total number of research or technical reports disseminated internally or to clients duringcareer
X05B20Productivity, non-teaching: Career output for presentations, exhibitions Q20A1l+Al2)
CODE:(Open-ended)
Description of the Derived Variable:This derived variable was created to report on one aspect of a faculty respondent's non-teaching productivityover the course of their career. This variable is based on totals reported at SAS variables:
B20A11=Total number of presentations at conferences, workshops, etc. during careerB20Al2=Total number of exhibitions or performances in the fine or applied arts during career
36
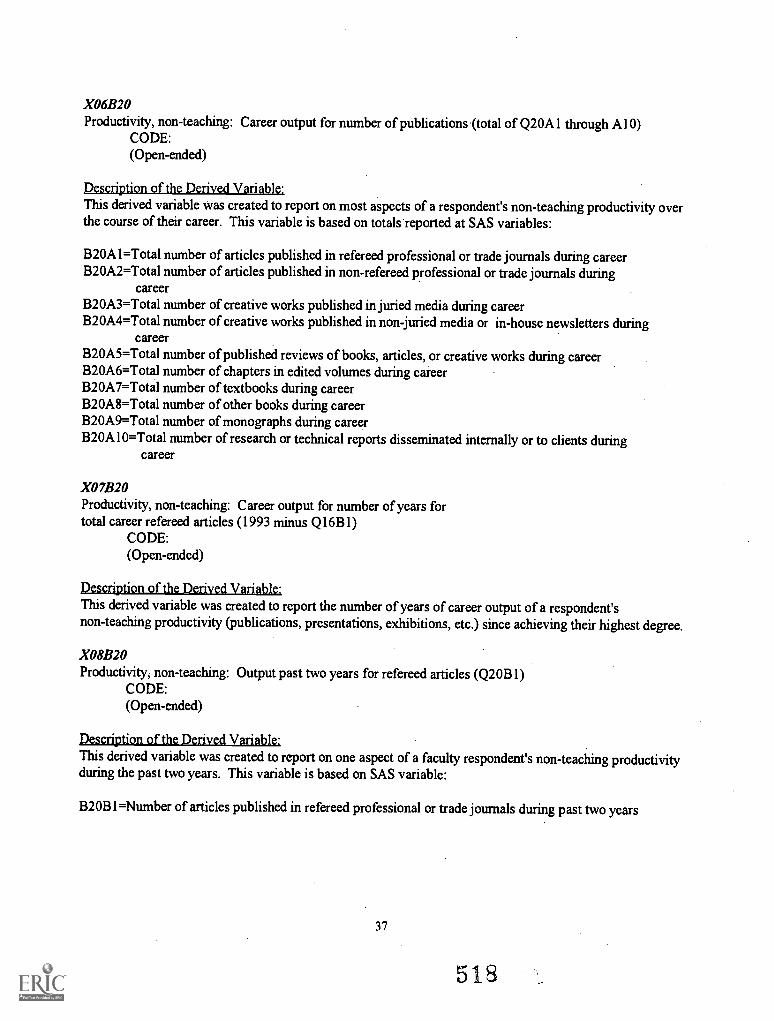
X06B20Productivity, non-teaching: Career output for number of publications '(total of Q20A1 through A10)
CODE:(Open-ended)
Description of the Derived Variable:This derived variable was created to report on most aspects of a respondent's non-teaching productivity overthe course of their career. This variable is based on totals reported at SAS variables:
B20A1=Total number of articles published in refereed professional or trade journals during careerB20A2=Total number of articles published in non-refereed professional or trade journals during
careerB20A3=Total number of creative works published in juried media during careerB20A4=Total number of creative works published in non-juried media or in-house newsletters during
careerB20A5=Total number of published reviews of books, articles, or creative works during careerB20A6=Total number of chapters in edited volumes during careerB20A7=Total number of textbooks during careerB20A8=Total number of other books during careerB20A9=Total number of monographs during careerB20A10=Total number of research or technical reports disseminated internally or to clients during
career
X07B20Productivity, non-teaching: Career output for number of years fortotal career refereed articles (1993 minus Q16B1)
CODE:(Open-ended)
Description of the Derived Variable:This derived variable was created to report the number ofyears of career output of a respondent'snon-teaching productivity (publications, presentations, exhibitions, etc.) since achieving their highest degree.
X08B20Productivity, non-teaching: Output past two years for refereed articles (Q20B1)
CODE:(Open-ended)
Description of the Derived Variable-This derived variable was created to report on one aspect of a faculty respondent's non-teaching productivityduring the past two years. This variable is based on SAS variable:
B20B1=Number of articles published in refereed professional or trade journals during past two years
37
518
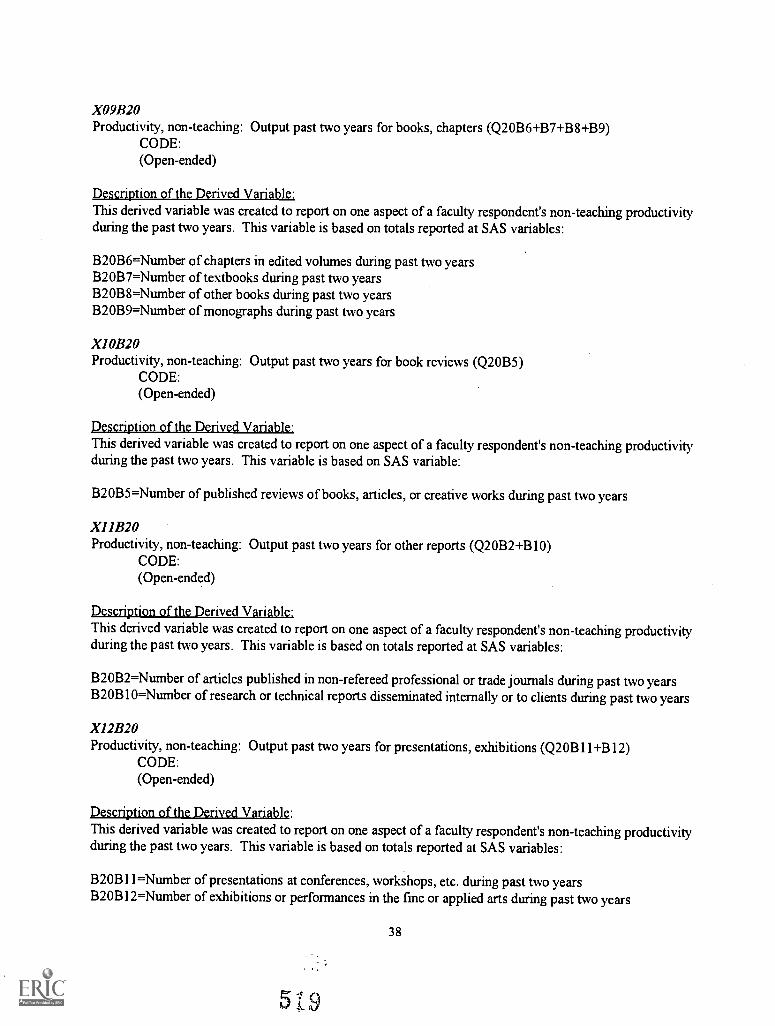
X09B20Productivity, non-teaching: Output past two years for books, chapters (Q20B6+B7+B8+B9)
CODE:(Open-ended)
Description of the Derived Variable:This derived variable was created to report on one aspect of a faculty respondent's non-teaching productivityduring the past two years. This variable is based on totals reported at SAS variables:
B20B6=Number of chapters in edited volumes during past two yearsB20B7=Number of textbooks during past two yearsB20B8=Number of other books during past two yearsB20B9=Number of monographs during past two years
Xl0B20Productivity, non-teaching: Output past two years for book reviews (Q20B5)
CODE:(Open-ended)
Description of the Derived VariableThis derived variable was created to report on one aspect of a faculty respondent's non-teaching productivityduring the past two years. This variable is based on SAS variable:
B20B5=Number of published reviews of books, articles, or creative works during past two years
Xl1B20Productivity, non-teaching: Output past two years for other reports (Q20B2+B10)
CODE:(Open-ended)
Description of the Derived Variable:This derived variable was created to report on one aspect of a faculty respondent's non-teaching productivityduring the past two years. This variable is based on totals reported at SAS variables:
B20B2=Number of articles published in non-refereed professional or trade journals during past two yearsB20B10=Number of research or technical reports disseminated internally or to clients during past two years
X12B20Productivity, non-teaching: Output past two years for presentations, exhibitions (Q20B11+B12)
CODE:(Open-ended)
Description of the Derived Variable:This derived variable was created to report on one aspect of a faculty respondent's non-teaching productivityduring the past two years. This variable is based on totals reported at SAS variables:
B20B11=Number of presentations at conferences, workshops, etc. during past two yearsB20B12=Number of exhibitions or performances in the fine or applied arts during past two years
38
5t9
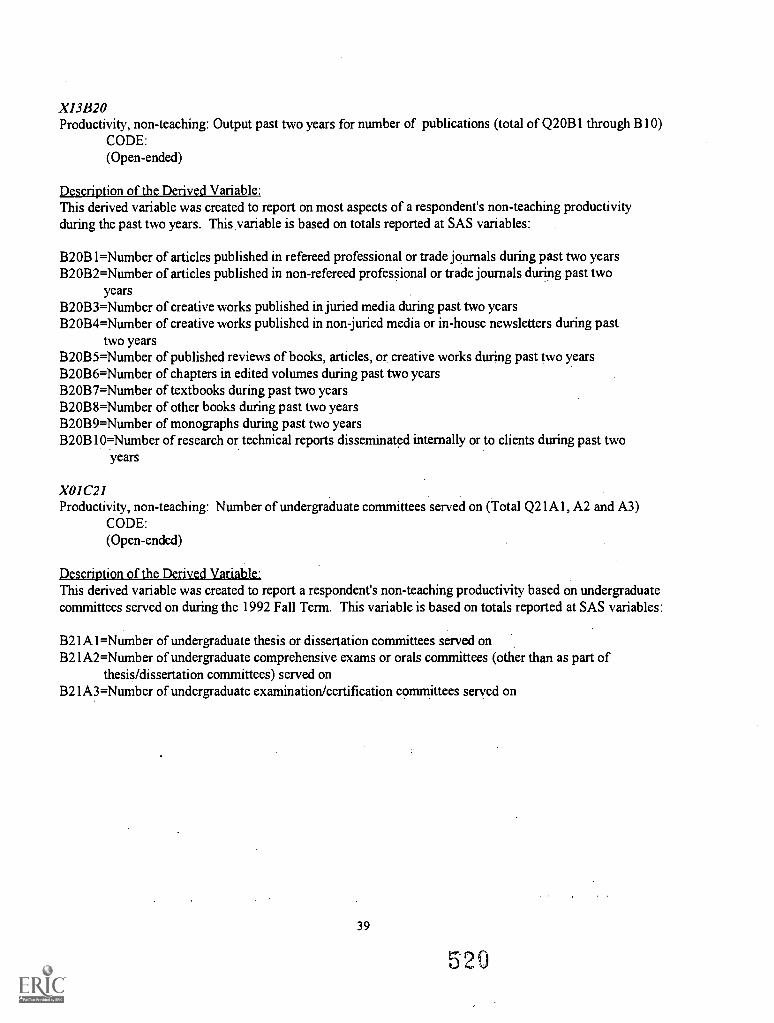
X13B20Productivity, non-teaching: Output past two years for number of publications (total of Q20B1 through B10)
CODE:(Open-ended)
Description of the Derived VariableThis derived variable was created to report on most aspects of a respondent's non-teaching productivityduring the past two years. This variable is based on totals reported at SAS variables:
B20B1=Number of articles published in refereed professional or trade journals during past two yearsB20B2= Number of articles published in non-refereed professional or trade journals during past two
yearsB20B3=Number of creative works published in juried media during past two yearsB20B4=Number of creative works published in non juried media or in-house newsletters during past
two yearsB20B5=Number of published reviews of books, articles, or creative works during past two yearsB20B6=Number of chapters in edited volumes during past two yearsB20B7=Number of textbooks during past two yearsB20B8=Number of other books during past two yearsB20B9=Number of monographs during past two yearsB2OBI0=Number of research or technical reports disseminated internally or to clients during past two
years
X01C21Productivity, non-teaching: Number of undergraduate committees served on (Total Q21A 1, A2 and A3)
CODE:(Open-ended)
Description of the Derived Variable:This derived variable was created to report a respondent's non-teaching productivity based on undergraduatecommittees served on during the 1992 Fall Term. This variable is based on totals reported at SAS variables:
B21A1=Ntunber of undergraduate thesis or dissertation committees served onB21A2=Number of undergraduate comprehensive exams or orals committees (other than as part of
thesis/dissertation committees) served onB21A3=Number of undergraduate examination/certification committees served on
39
520
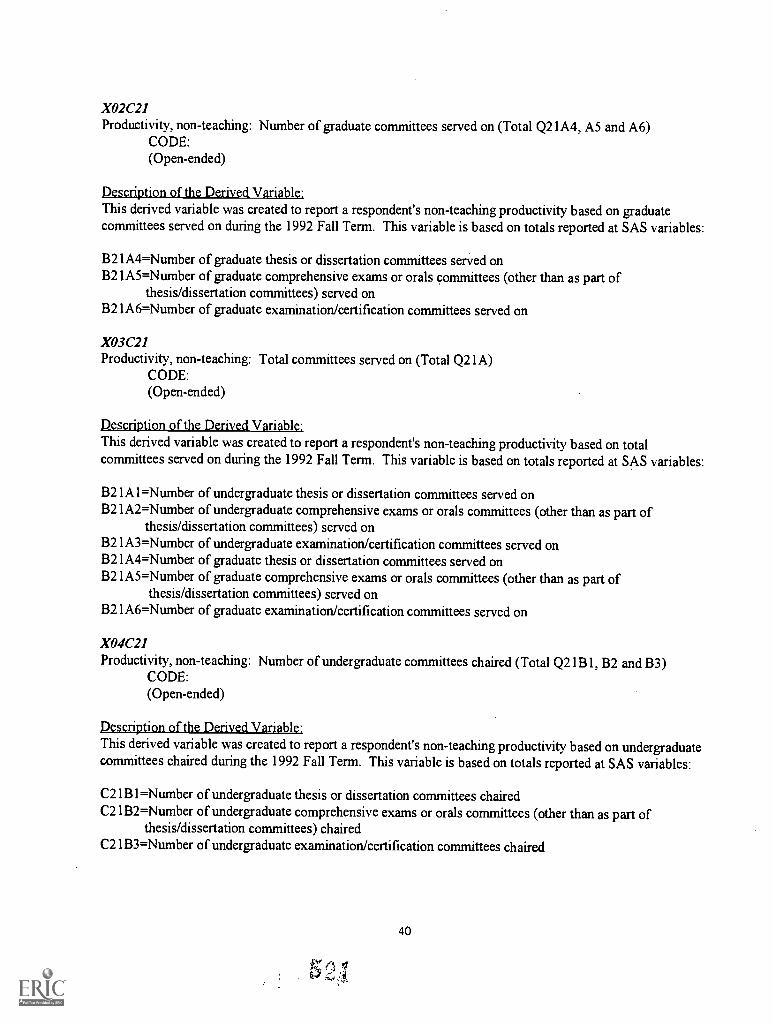
X02C21Productivity, non-teaching: Number of graduate committees served on (Total Q21A4, A5 and A6)
CODE:(Open-ended)
Description of the Derived Variable:.This derived variable was created to report a respondent's non-teaching productivity based on graduatecommittees served on during the 1992 Fall Term. This variable is based on totals reported at SAS variables:
B21A4=Number of graduate thesis or dissertation committees served onB21A5=Number of graduate comprehensive exams or orals committees (other than as part of
thesis/dissertation committees) served onB21A6=Number of graduate examination/certification committees served on
X03C21Productivity, non-teaching: Total committees served on (Total Q21A)
CODE:(Open-ended)
Description of the Derived Variable:.This derived variable was created to report a respondent's non-teaching productivity based on totalcommittees served on during the 1992 Fall Term. This variable is based on totals reported at SAS variables:
B21A1=Number of undergraduate thesis or dissertation committees served onB21A2=Number of undergraduate comprehensive exams or orals committees (other than as part of
thesis/dissertation committees) served onB21A3=Number of undergraduate examination/certification committees served onB21A4=Number of graduate thesis or dissertation committees served onB21A5=Number of graduate comprehensive exams or orals committees (other than as part of
thesis/dissertation committees) served onB21A6=Number of graduate examination/certification committees served on
X04C21
Productivity, non-teaching: Number of undergraduate committees chaired (Total Q21B I, B2 and B3)CODE:(Open-ended)
Description of the Derived Variable:This derived variable was created to report a respondent's non-teaching productivity based on undergraduatecommittees chaired during the 1992 Fall Term. This variable is based on totals reported at SAS variables:
C21B1=Number of undergraduate thesis or dissertation committees chairedC21B2=Number of undergraduate comprehensive exams or orals committees (other than as part of
thesis/dissertation committees) chairedC21B3=Number of undergraduate examination/certification committees chaired
40
XOSC21
Productivity, non-teaching: Number of graduate committees chaired (Total Q21B4, B5 and B6)CODE:(Open-ended)
Description of the Derived Variable:This derived variable was created to report a respondent's non-teaching productivity based on graduatecommittees chaired during the 1992 Fall Term. This variable is based on totals reported at SAS variables:
C21B4=Number of graduate thesis or dissertation committees chairedC21B5=Number of graduate comprehensive exams or orals committees (other than as part of
thesis/dissertation committees) chairedC21B6=Number of graduate examination/certification committees chaired
X06C21Productivity, non-teaching: Total committees chaired (Total Q21B)
CODE:(Open-ended)
Description of the Derived Variable.,This derived variable was created to report a respondent's non-teaching productivity based on totalcommittees chaired during the 1992 Fall Term. This variable is based on totals reported at SAS variables:
C21B1=Number of undergraduate thesis or dissertation committees chairedC21B2=Number of undergraduate comprehensive exams or orals committees (other than as part of
thesis/dissertation committees) chairedC21B3=Number of undergraduate examination/certification committees chairedC21B4=Number of graduate thesis or dissertation committees chairedC21B5=Number of graduate comprehensive exams or orals committees (other than as part of
thesis/dissertation committees) chairedC21B6=Number of graduate examination/certification committees chaired
X01C23Productivity, teaching: Total hours spent teaching per week in 5 or fewer classes for credit (Q23A2G + B2G+ C2G + D2G + E2G, or C, if G was imputed and C was not imputed)
CODE:(TOTAL HOURS, Open-ended)
Description of the Derived Variable:This derived variable was created to provide a calculation of the total number of hours spent teaching perweek at five or fewer classes for credit, by adding together the hours spent teaching for eachreported class at SAS variables C23A2G through C23E2G (unless these values were imputed and C23A2Cthrough C23E2C was not, in which case C23A2C through C23E2C were used). A maximum of five classescould be reported.
41
,522
X02C23Productivity, teaching: Total classroom student contact hours per week in five or fewer classes for credit[total sum of (A2E x A2G or C, if G was imputed and C was not imputed]
CODE:(TOTAL HOURS, Open-ended)
Description of the Derived Variable.This derived variable was created to provide a calculation of the total student contact hours per week withstudents in five or fewer classes for credit. For each class taught, the average number of hours per week therespondent taught the class (SAS variables C23A2G through C23E2G, unless these values were imputed andC23A2C through C23E2C were not, in which case C23A2C through C23E2C were used) is multiplied by thenumber of students enrolled in the class (C23A2E through C23E2E); the results are added together to obtainthe total student contact hours in five or fewer classes for credit.
X03C23Productivity, teaching: Total classroom credit hours in five or fewer classes(Q23A2B + B2B + C2B + D2B + E2B)
CODE:(TOTAL HOURS, Open-ended)
Description of the Derived Variable.This derived variable was created to provide a calculation of the total number of classroom credit hoursreported by adding together the number of credit hours for each class provided in SAS variables C23A2Bthrough C23E2B. A maximum of five classes could be reported.
X04C23Productivity, teaching: Total classroom individual credit hours in five or fewer classes [total sum of (A2B xA2E)]
CODE:(TOTAL HOURS, Open-ended)
Description of the Derived Variable:This derived variable was created to provide a calculation of the total student credit hours taught in theclasses reported. For each class taught, the number of credit hours (SAS variables C23A2B throughC23E2B) is multiplied by the number of students enrolled (SAS variables C23A2E through C23E2E); theresults are added together to obtain the total student credit hours taught in the classes reported. A maximumof five classes could be reported.
42
X05C23Productivity, teaching: Level of classroom instruction
CODE:1=Taught only undergraduate courses (Q23A3 and Q23B3 and Q23C3 and Q23D3 and
Q23E3 NE 3)2=Taught both undergraduate and graduate courses (at least one of Q23A3 or Q23B3 or
Q23C3 or Q23D3 or Q23E3=3 and at least one of them=1, 2, or 4)3=Taught only graduate courses (Q23A3 and Q23B3 and Q23C3 and Q23D3 and Q23E3=3)
Description of the Derived Variable.This derived variable was created to report a respondent's level of classroom credit instruction. SASvariables C23A3 through C23E3 used in the creation of this variable deal with the primary level of students(in up to five courses taught for credit). Lower or upper division students as well as the category "all otherstudents", are considered undergraduates. Graduate or any other post-baccalaureate students are consideredgraduate level students. If a respondent taught classes to primarily undergraduate level students and some tograduate level students then the classroom instruction was categorized as both. The codes used at SASvariables C23A3 through C23E3 are as follows:
1=Lower division students2=Upper division students3=Graduate or other post-baccalaureate students4=All other students.
X08C23Productivity, teaching: Number of undergraduate classes taught for credit (five or fewer) (Q23A3 NE 3 +B3 NE 3 + C3 NE 3 + D3 NE 3 + E3 NE 3)
CODE:(TOTAL CLASSES, Open-ended)
Description of the Derived Variable.This derived variable was created to report the total number of undergraduate classes taught for credit, byexcluding those classes where the primary level of students is graduate or any other post-baccalaureate-level(code 3 at SAS variables C23A3 through C23E3), and adding together those classes where the priMary levelof students is under-graduate level. (Student levels are defined at X05C23.) The codes used to create thisderived variable are as follows (from SAS variables C23A3 through C23E3):
1=Lower division students2=Upper division students4=All other students.A maximum of five classes could be reported.
43
524
X09C23Productivity, teaching: Number of graduate classes taught for credit (5 or fewer)(Q23A3=3 + B3=3 + C3=3 + D3=3 + E3=3)
CODE:(TOTAL CLASSES, Open-ended)
Description of the Derived Variable:,This derived variable was created to provide a calculation of the total number of graduate classes taught forcredit, by adding together those classes where the primary level of students is graduate-level (SAS variableC23A3 through C23E3 = 3). A maximum of five classes could be reported.
X14C23Productivity, teaching: Number of students taught in 5 or fewer classes for credit(Q23A2E+B2E+C2E+D2E+E2E)
CODE:(TOTAL STUDENTS, Open-ended)
Description of the Derived Variable.,This derived variable was created to provide a calculation of the total number of students taught for credit, byadding together the number of students reported for each class. (SAS variables C23A2E through C23E2E).A maximum of five classes could be reported.
X19C23Productivity, teaching: Average number teaching assistants per class in five or fewer classes for credit (totalnumber of teaching assistants divided by total number of classes)
CODE:(AVERAGE NUMBER, Open-ended)
Description of the Derived Variable.This derived variable was created to provide a calculation of the average number of teaching assistants andreaders by adding together the number of teaching assistants and readers reported by a faculty respondent foreach class (SAS Vaiiables C23A2D through C23E2D) and diVidirig by the total number of classes. Amaximum of five classes could be reported.
44
X01C25Productivity, teaching: Level of individualized instruction
CODE:1=Taught only undergraduate students (Q25A3=0 and Q25A1 or Q25A2 or Q25A4 GT 0)2=Taught both undergraduate and graduate students (Q25A3 GT 0 and Q25A1, Q25A2 or
Q25A4 GT 0)3=Taught only graduate students (Q25A3 GT 0 and Q25A1, Q25A2 and Q25A4=0)4=None (Q25A1 through Q25A4=0)
Description of the Derived Variable.This derived variable was created to report a respondent's teaching productivity in terms of their level ofindividualized instruction. (See X05C23 for definitions of student levels.) SAS variables C25A1 throughC25A4, used in the creation of this derived variable, deal with the level of students who received formalindividualized instruction, with codes as follows:
1=Lower division students2=Upper division students3=Graduate or other post-baccalaureate students4=All other students.
X04C25Productivity, teaching: Total number of undergraduate students receiving individualized instruction for credit(Q25A1+A2+A4)
CODE:(TOTAL STUDENTS, Open-ended)
Description of the Derived Variable:This derived variable was created to report the total number of undergraduate students receivingindividualized instruction, based on SAS variables C25A1, A2 and A4 which report only aboutundergraduate students. (Lower or upper division students, as well as those categorized as "all otherstudents," are considered undergraduates.)
X05C25Productivity, teaching: Total number of graduate students receiving individualized instruction for credit(Q25A3)
CODE:(TOTAL STUDENTS, Open-ended)
Description of the Derived Variable:This derived variable was created to report the total number of graduate students receiving individualizedinstruction as reported at SAS variable C25A3.
45 526
X06C25Productivity, teaching: Total students receiving individualized instruction for credit (total Q25A)
CODE:(TOTAL STUDENTS, Open-ended)
Description of the Derived Variable:This derived variable was created from SAS variables C25A1 through C25A4 to report the total number ofstudents (undergraduate, graduate and all other students) receiving individualized instruction for credit.
X07C25Productivity, teaching: Total contact hours per week for undergraduate students receiving individualizedinstruction for credit (Q25B1+B2+B4)
CODE:(TOTAL HOURS, Open-ended)
Description of the Derived Variable:This derived variable was created to report the total number of contact hours spent providing individualizedinstruction to undergraduate students. Lower or upper division students as well as those categorized as "allother students" are considered undergraduates. This variable was created from SAS variables C25B1, C25B2and C25B4.
X08C25Productivity, teaching: Total contact hours per week for graduate students receiving individualizedinstruction for credit (Q25B3)
CODE:(TOTAL HOURS, Open-ended)
Description of the Derived Variable:This derived variable was created from SAS variable C25B3 to report the total number of contact hours spentproviding individualized instruction to graduate students.
X09C25Productivity, teaching: Total contact hours per week of individualized instruction for credit (Q25B)
CODE:(TOTAL HOURS, Open-ended)
Description of the Derived Variable:This derived variable was created from SAS variables C25B1 through C25B4 to report the total number ofcontact hours spent providing individualized instruction to students, regardless of level.
46
Altt 4.1,7
X02C33Productivity, non-teaching: Total funds (Q33D1 + D2 + D3 + D4 + D5 + D6)
CODE:(TOTAL FUNDS, Open-ended)
Description of the Derived Variable:This derived variable is created by totaling SAS variables C33D1 through C33D6, which report the totalresearch or grant funds received for the 1992-93 academic year from each of 6 sources:
C33D1=Sampled institutionC33D2=Foundation or other nonprofit organizationC33D3=For profit business or industry in the private sectorC33D4=State or local governmentC33D5=Federal governmentC33D6=Other source
X03C33Productivity, non-teaching: Average award (total funds divided by total grants/contracts)
CODE:(AVERAGE AWARD, Open-ended)
Description of the Derived Variable:This derived variable was created by dividing the total of SAS variables C33D1 through C33D6 (described atderived variable X02C3 3) by the total number of grants/contracts reported at SAS variables C33B1 throughC33B6.
BEST COPY ''=\MOLE47
5)
X01C34Academic environment: Overall quality of facilities or resources (index)
CODE:1=Veiy poor2=Poor3=Good4=Very good
Description of the Derived Variable:This derived variable was created by averaging the responses by a faculty respondent at SAS variables C34Athrough C34L which are concerned with the quality of various types of facilities and resources. Thecategories are as follows:
C34A=Basic research equipment/instrumentsC34B=Laboratory space and suppliesC34C=Availability of research assistantsC34D=Personal computersC34E=Centralized (main frame) computer facilitiesC34F=Computer networks with other institutionsC34G=Audio-visual equipmentC34H=Classroom spaceC34I=Office spaceC34J=Studio/performance spaceC34K=Secretarial supportC34L=Library holdings
48
X01C35Academic environment: Adequacy of internal funds for professional development (index)
CODE:1=Adequate (all 35C=1)2=Somewhat adequate (more 35C=1 than 35C=2 or, if # of 2's=1# of I's)3=Somewhat inadequate (more 35C=2 than 35C=1)4=Inadequate (all 35C=2)
Description of the Derived Variable-This derived variable was created from SAS variables C35C1 through C35C6; two codes (1=Yes and 2= No)were recoded (based on the total number of 1's and 2's) to indicate whether available funding was adequatefor each of six categories:
C35C1=Tuition remission at this or other institutionsC35C2=Professional association memberships and/or registration feesC35C3=Professional travelC35C4=Training to improve research or teaching skillsC35C5=Retraining for fields in higher demandC35C6=Sabbatical leave
If "yes" (adequate) was coded for all six categories, X01 C35 was coded as "1" (adequate). If equal numbersof categories were coded "yes" and "no," or if more categories were coded "yes" than "no," X01 C35 wascoded as "2" (somewhat adequate). If more categories were coded "no" than "yes," X01 C35 was coded as "3"(somewhat inadequate). There were no cases where all six categories were coded "no".
X01C36Time allocation: Average total hours per week worked (Total Q36)
CODE:(AVERAGE TOTAL HOURS, Open-ended)
Description of the Derived VariableThis derived variable is created by totaling SAS variables C36A through C36D, which are concerned withhours spent at the following activities:
C36A=A11 paid activities at this institutionC36B=All unpaid activities at this institutionC36C=Any other paid activities outside this institution (e.g., consulting, working on other jobs)C36D=Unpaid (pro bono) professional service outside this institution
X01C37Time allocation: Percentage of time spent teaching (Q37AA)
CODE:(PERCENTAGE, open ended)
Description of Derived Variable:This derived variable was created to report the actual percentage of work time respondents spent in teachingduring the Fall of 1992, based on SAS variable C37AA.
49
530
X02C37Time allocation: Percentage of time spent in research (Q37AB)
CODE:(PERCENTAGE, open ended)
Description of Derived Variable;This derived variable was created to report the actual percentage of work time respondents spent in researchduring the Fall of 1992, based on SAS variable C37AAB.
X03C37Time allocation: Percentage of time spent in administration (Q37AD)
CODE:(PERCENTAGE, Open Ended)
Description of Derived Variable:This derived variable was created to report the actual percentage of work time respondents spent inadministration during the Fall of 1992, based on SAS variable C37AD.
X04C37Time allocation: Percentage of time spent in other activities (Q37AC+ C37AE + C37AF)
CODE:(PERCENTAGE, Open Ended)
Description of Derived Variable.,This derived variable was created to report the actual percentage of work time respondents spent in activitiesother than teaching, research or administration during the Fall of 1992, based on these SAS variables:
C37AC=Professional growthC37AE=Outside consulting or free-lance workC37AF=Service/other non-teaching work
X05C37Time allocation: Percentage of time preferred teaching (Q37BA)
CODE:(PERCENTAGE, Open Ended) Description of Derived Variable:
Description of the Derived Variable:This derived variable was created to report the percentage of work time respondents would have preferred tospend in teaching during the Fall of 1992, based on SAS variable C37BA.
X06C37Time allocation: Percentage of time preferred in research (Q37BB)
CODE:(PERCENTAGE, Open Ended)
Description of Derived Variable.This derived variable was created to report the percentage of work time respondents would have preferred tospend in research during the Fall of 1992, based on SAS variable C37BB.
50
X07C37Time allocation: Percentage of time preferred in administration (Q37BD)
CODE:(PERCENTAGE, Open Ended)
Description of Derived Variable:.This derived variable was created to report the percentage of work time respondents would have preferred tospend in administration during the Fall of 1992, based on SAS variable C37BD.
X08C37Time allocation: Percentage of time preferred in other activities (Q37BC+ C37BE + C37BF)
CODE:(PERCENTAGE, Open Ended)
Description of Derived Variable:This derived variable was created to report the percentage of work time respondents would have preferred tospend in activities other than teaching, research or administration, during the Fall of 1992, based on theseSAS variables:
C37BC=Professional growthC37BE=Outside consulting or free-lance workC37BF=Service / other non-teaching work
X01C38Union member
CODE:1=Yes (Q38=3)2=No (Q38-2)3=Not eligible or union not available (Q38=1 or 4)
Description of Derived Variable,This derived variable was created from SAS variable C38 and provides information about union membershipand eligibility. Code 1 (union is available, but respondent is not eligible) and Code 4 (union is not availableat sampled institution) have been collapsed into one category.
X01D41Future: Very likely to retire in the next 3 years
CODE:1=Yes (Q41E=3)2=No
Description of Derived Variable:This derived variable was created from SAS variable D41E, in which respondents indicate how likely they areto retire from the labor force during the next 3 years. Code 3 (very likely) was the response category used forthis derived variable. Respondents who reported they were very likely to retire were coded "1" atX01D41.
BEST COPY MLA LE
51
532
X02D41Future: Very likely to accept part-time job in the next 3 years
CODE:1=Yes (Q41A=3 or c=3)2=No
Description of Derived Variable:.This derived variable was created from SAS variables D4 1A or D41C, in which the respondent indicates howlikely they are to accept a part-time job at a different postsecondary institution or accept a part-time jobelsewhere during the next 3 years. Code 3 (very likely) was the response category used for this derivedvariable. Respondents who reported at D4 IA or D4 1 C they were very likely to accept a part-time job werecoded "1" at X02D41.
X03D41Future: Very likely to accept a full-time job in the next 3 years
CODE:1=Yes (Q41B=3 or d=3)2=No
Description of Derived Variable.This derived variable was created from SAS variables D41B or D41D, in which respondents indicate howlikely they are to accept a full-time job at a different postsecondary institution or accept a full-time jobelsewhere. Code 3 (very likely) was the response category used for this derived variable. Respondents whoreported they were very likely to accept a full-time job were coded "1" at X03D41.
X04D41Future: Very likely to retire or accept a part- or full-time job in the next 3 years
CODE:1=Yes (Q41A=3 or B=3 or C=3 or D=3 or E=3)2=No
Description of Derived Variable:This derived variable was created from SAS variables D4 1A to D41E, in which the respondent indicates howlikely they are to accept a part-or full-time job at a different postsecondary institution or elsewhere, or toretire during the next 3 years. Code 3 (very likely) was the response category used for this derived variable.Respondents who reported they were very likely to accept a full-time or part-time job were coded "1" atX04D41.
52
,f-4,):,!,
X05D41Future: Likely to retire or accept a part- or full-time job in the next 3 years
CODE:1=Yes (Q41A=2 or 3, or B=2 or 3 or C=2 or 3, or D=2 or 3, or E=2 or 3)2=No (Q41A=1 and B=1 and C=1 and D=1 and E=1)
Description of Derived Variable:This derived variable was created from SAS variables D41A to D41E, in which the respondent indicates howlikely they are to accept a part-or full-time job at a different postsecondary institution or elsewhere, or toretire during the next 3 years. Codes 2 (somewhat likely) or 3 (very likely) were the response categories usedfor this derived variable. Respondents who reported they were very likely to accept a different job or retirewere coded "1" at X05D41.
X01D42Future: Age likely to stop working at a postsecondary institution
CODE:-2=Don't know 5=65I =Under. 55 6=66 to 692=55 to 59 7=703=60 8=71 and up4=61 to 64
Description of the Derived Variable:This derived variable was created from SAS variable D42 by recoding the age respondents have indicated asthe "most likely" age when they will stop working at any postsecondary institution.
X01D46Future: Years to retirement (Q46 minus calculated age from Q52)
CODE:-2=Don't know0=This year1=1-52=6-103=11-154=16-255=Over 25
Description of Derived Variable.This derived variable was created to provide a calculation of the years until a respondent's projectedretirement by subtracting the respondent's calculated age (derived from the respondent's year of birth at SASvariable F52B) from the age the respondent has indicated as the "most likely" retirement age (SAS variableD46).
53
534
X02D46Future: Age likely to retire from all paid employment
CODE:-2=Don't know 5=66-691=Under 60 6=702=60 7=71 and up3=61 to 644=65
Description of Derived Variable:This derived variable was created from SAS variable D46 by recoding the age respondents have indicated astheir "most likely" retirement age.
X01E47Compensation: Basic salary from institution (Q47A)
CODE:(ranges)
Description of Derived Variable.This derived variable was created to report the amount of basic salary the respondent had during the 1992calendar year from their sampled institution, based on SAS variable E47A.
X02E47Compensation: Basic salary annualized (Q47A divided by Q47B (the number of months of appointment) x12)
CODE:(ranges)
Description of Derived Variable:This derived variable was created to report the annualized amount of respondent's basic salary at theirsampled institution during the 1992 faculty calendar year, based on SAS variable E47A divided by thenumber of months of appointment (E47B) then multiplied by 12 months.
X03E47Compensation: Other income from institution (Q47C + E47D + E47E + E47F)
CODE:(ranges)
Description of Derived Variable.,This derived variable was created to report a respondent's total income other than basic salary from theirsampled institution during the 1992 calendar year, based on these SAS variables:
E47C=Amount from other teaching at this institution not included in basic salaryE47D=Amount from supplements not included in basic salaryE47E=Amount from non-monetary compensation, such as food, housing, carE47F=Amount from any other income from this institution
54
X04E47Compensation: Outside consulting income (Q47I)
CODE:(ranges)
Description of Derived Variable:This derived variable was created to report the amount of outside consulting income during the 1992 calendaryear, based on SAS variable E47I.
X05E47Compensation: Other outside income (Q47G + Q47H + Q47J + Q47K + Q47L + Q47M +Q47 N + Q470 +Q47P + Q47Q)
CODE:(ranges)
Description of Derived Variable:This derived variable was created to report a respondent's total income from sources (other than outsideconsulting) outside their sampled institution for the 1992 calendar year, based on these SAS variables:
E47G=Amount from employment at another academic institutionE47H=Amount from legal or medical services or psychological counselingE47J=Amount from self-owned business (other than consulting)E47K=Amount from professional performances or exhibitionsE47L=Amount from speaking fees, honorariaE48M=Amount from royalties or commissionsE48N=Amount from any other employmentE480=Amount from non-monetary compensation, such as food, housing, carE47P1=Amount from grants/fellowships (federal, state, city, NSF, Fullbright)E47P2=Amount from retirement, pension, soc. sec., unemploymentE47P3=Amount from military pension/retirement/other militaryE47P4=Amount from alimony, child support, spouse incomeE47P5=Amount from dividends, annuities, insurance, investments, interest, capital gainsE47P6=Amount from government (local/state/federal)E47P7=Amount from loansE47P8=Amount from real estate, rental propertiesE47P9=Amount from other sources(Note: E47P1-E47P9 were recoded from Q47P and Q47Q, which were verbatim responses specifying othersources of earned income.)
55
536
.A'06E47Compensation: Total earned income (Q47A + Q47C + Q47D + Q47 E + Q47F + Q47G + Q47H + Q473 +Q47K + Q47L + Q47M + Q47 N + Q470 + Q47P + Q47Q)
CODE:(ranges)
Description of Derived Variable:This derived variable was created to report the total amount of various sources of compensation therespondent had during the 1992 calendar year, based on these SAS variables:
E47A=Amount from basic salaryE47C=Amount from other teaching at this institution not included in basic salaryE47D=Amount from supplements not included in basic salaryE47E=Amount from non-monetary compensation, such as food, housing, carE47F=Amount from any other income from this institutionE47G=Amount from employment at another academic institutionE47H=Amount from legal or medical services or psychological counselingE47I=Amount from outside consulting, consulting business or freelance workE47J= Amount from self-owned business (other than consulting)E47K=Amount from professional performances or exhibitionsE47L=Amount from speaking fees, honorariaE48M=Amount from royalties or commissionsE48N=Amount from any other employmentE480=Amount from non-monetary compensation, such as food, housing, carE47P1=Amount from grants/fellowships (federal, state, city, NSF, Fulbright)E47P2=Amount from retirement, pension, soc. sec., unemploymentE47P3=Amount from military pension/retirement/other militaryE47P4=Amount from alimony, child support, spouse incomeE47P5=Amount from dividends, annuities, insurance, investments, interest, capital gainsE47P6=Amount from government (local/state/federal)E47P7=Amount from loansE47P8=Amount from real estate, rental propertiesE47P9=Amount from other sources(Note: E47P1-E47P9 were recoded from Q47P and Q47Q, whichwere verbatim responses specifying othersources of earned income.)
X01E49SES: Average income per household member (Q49 divided by Q48)
CODE:(AVERAGE INCOME, open ended)
pescription of the Derived VariableThis derived variable was created to report the average income per household member, by dividing the totalhousehold income (SAS variable E49) by the total number ofpersons in a respondent's household (SASvariable E48).
56
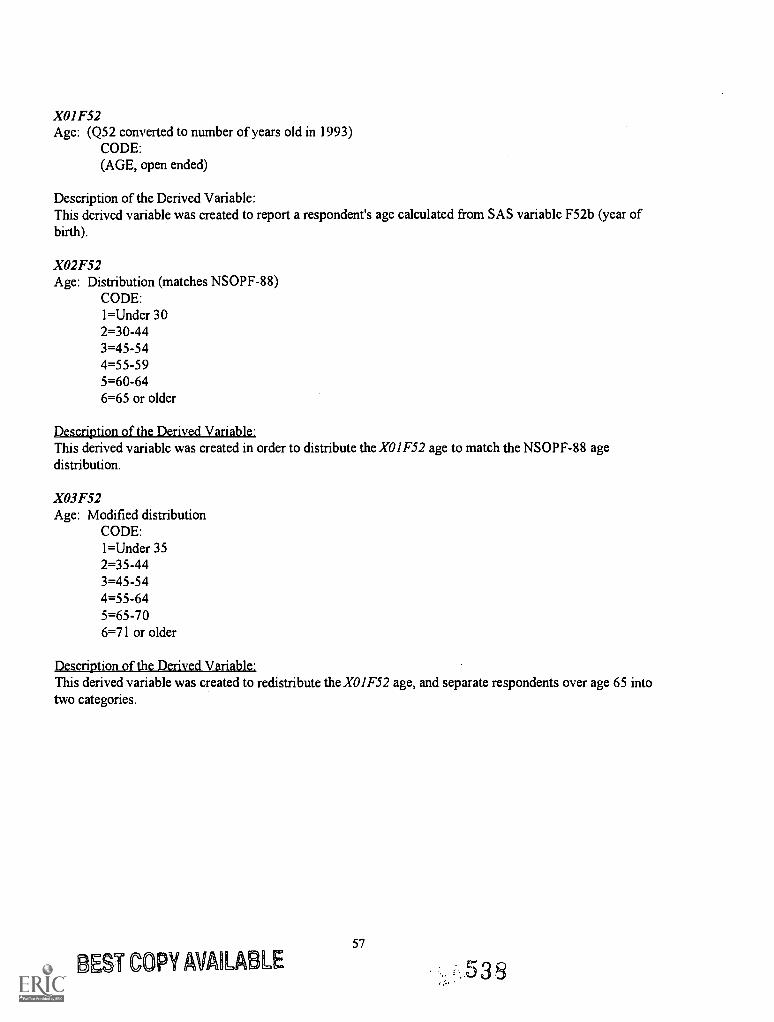
X01 F52Age: (Q52 converted to number of years old in 1993)
CODE:(AGE, open ended)
Description of the Derived Variable:This derived variable was created to report a respondent's age calculated from SAS variable F52b (year ofbirth).
X02 F52Age: Distribution (matches NSOPF-88)
CODE:1=Under 302=30-443=45-544=55-595=60-646=65 or older
Description of the Derived Variable:This derived variable was created in order to distribute the X01F52 age to match the NSOPF-88 agedistribution.
X03 F52Age: Modified distribution
CODE:1=Under 352=35-443=45-544=55-645=65-706=71 or older
Description of the Derived Variable:This derived variable was created to redistribute the X01F52 age, and separate respondents over age 65 intotwo categories.
57
BEST COPY AVAILABLE
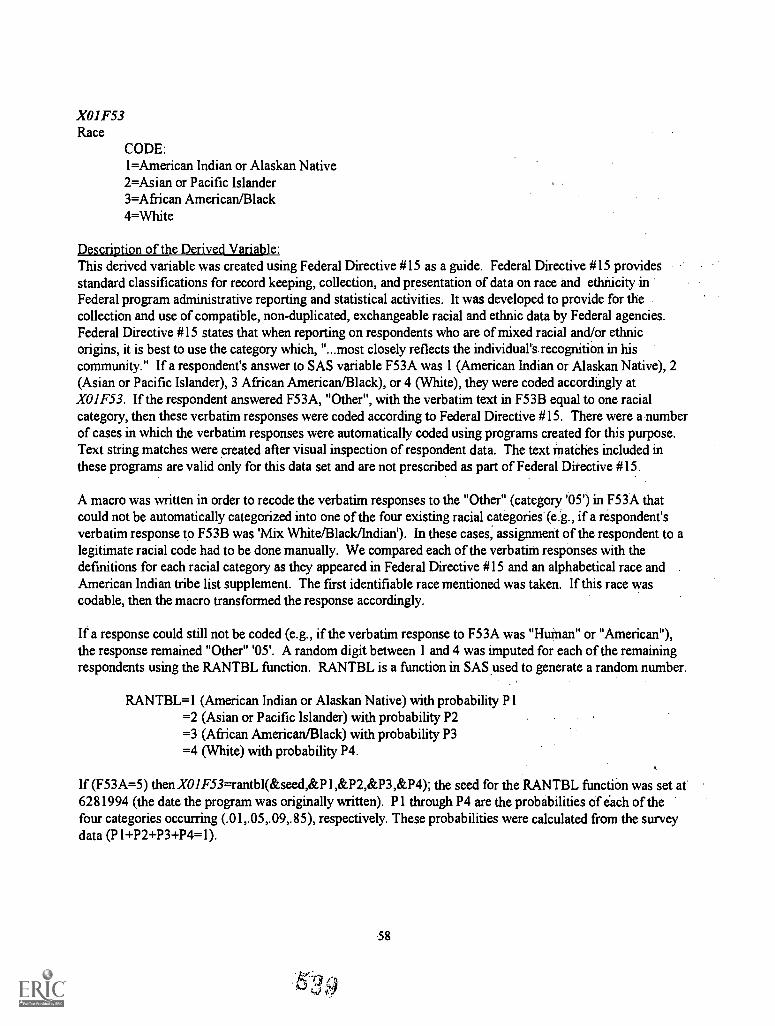
X01F53Race
CODE:1=American Indian or Alaskan Native2=Asian or Pacific Islander3=African American/Black4=White
Description of the Derived Variable.This derived variable was created using Federal Directive #15 as a guide. Federal Directive #15 providesstandard classifications for record keeping, collection, and presentation of data on race and ethnicity inFederal program administrative reporting and statistical activities. It was developed to provide for thecollection and use of compatible, non-duplicated, exchangeable racial and ethnic data by Federal agencies.Federal Directive #15 states that when reporting on respondents who are of mixed racial and/or ethnicorigins, it is best to use the category which, "...most closely reflects the individual's recognition in hiscommunity." If a respondent's answer to SAS variable F53A was 1 (American Indian or Alaskan Native), 2(Asian or Pacific Islander), 3 African American/Black), or 4 (White), they were coded accordingly atX01F53. If the respondent answered F53A, "Other", with the verbatim text in F53B equal to one racialcategory, then these verbatim responses were coded according to Federal Directive #15. There were a numberof cases in which the verbatim responses were automatically coded using programs created for this purpose.Text string matches were created after visual inspection of respondent data. The text mathhes included inthese programs are valid only for this data set and are not prescribed as part of Federal Directive #15.
A macro was written in order to recode the verbatim responses to the "Other" (category '05') in F53A thatcould not be automatically categorized into one of the four existing racial categories.(e.g., if a respondent'sverbatim response to F53B was 'Mix White/Black/Indians). In these cases, assignment of the respondent to alegitimate racial code had to be done manually. We compared each of the verbatim respOnses with thedefinitions for each racial category as they appeared in Federal Directive #15 and an alphabetical race andAmerican Indian tribe list supplement. The first identifiable race mentioned was taken. If this race wascodable, then the macro transformed the response accordingly.
If a response could still not be coded (e.g., if the verbatim response to F53A was "Human" or "American"),the response remained "Other" '05'. A random digit between 1 and 4 was imputed for each of the remainingrespondents using the RANTBL function. RANTBL is a function in SAS used to generate a random number.
RANTBL=1 (American Indian or Alaskan Native) with probability P1=2 (Asian or Pacific Islander) with probability P2=3 (African American/Black) with probability P3=4 (White) with probability P4.
If (F53A=5) then XO/F53=rantb1(&seed,&P1,&P2,&P3,&P4); the seed for the RANTBL function was set at6281994 (the date the program was originally written). P I through P4 are the probabilities of each of thefour categories occurring (.01,.05,.09,.85), respectively. These probabilities were calculated from the surveydata (Pl+P2+P3+P4=1).
58
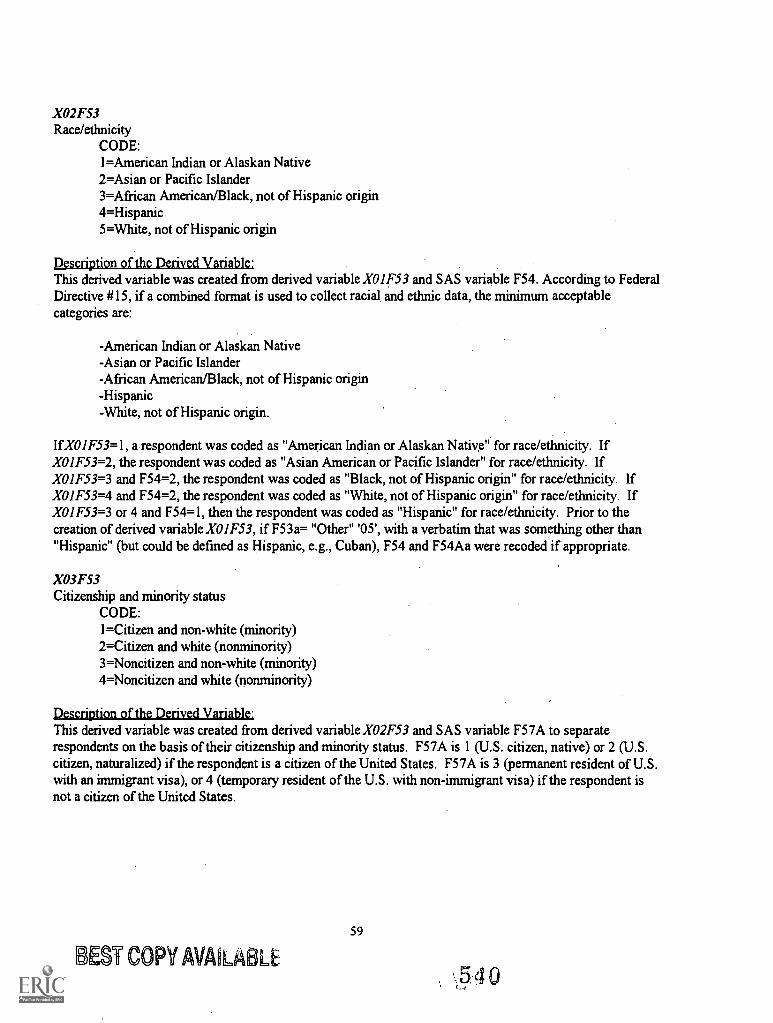
X02F53Race/ethnicity
CODE:1=American Indian or Alaskan Native2=Asian or Pacific Islander3=African American/Black, not of Hispanic origin4=Hispanic5=White, not of Hispanic origin
Description of the Derived Variable:This derived variable was created from derived variable X01F53 and SAS variable F54. According to FederalDirective #15, if a combined format is used to collect racial and ethnic data, the minimum acceptablecategories are:
-American Indian or Alaskan Native-Asian or Pacific Islander-African American/Black, not of Hispanic origin-Hispanic-White, not of Hispanic origin.
If XO 1 F53=1, a respondent was coded as "American Indian or Alaskan Native" for race/ethnicity. IfX01F53=2, the respondent was coded as "Asian American or Pacific Islander" for race/ethnicity. IfX01F53=3 and F54=2, the respondent was coded as "Black, not of Hispanic origin" for race/ethnicity. IfX01F53=4 and F54=2, the respondent was coded as "White, not of Hispanic origin" for race/ethnicity. IfX01F53=3 or 4 and F54=1, then the respondent was coded as "Hispanic" for race/ethnicity. Prior to thecreation of derived variable X01F53, if F53a= "Other" '05', with a verbatim that was something other than"Hispanic" (but could be defined as Hispanic, e.g., Cuban), F54 and F54Aa were recoded if appropriate.
X03F53Citizenship and minority status
CODE:1=Citizen and non-white (minority)2=Citizen and white (nonminority)3=Noncitizen and non-white (minority)4=Noncitizen and white (nonminority)
Description of the Derived Variable.This derived variable was created from derived variable X02F53 and SAS variable F57A to separaterespondents on the basis of their citizenship and minority status. F57A is 1 (U.S. citizen, native) or 2 (U.S.citizen, naturalized) if the respondent is a citizen of the United States. F57A is 3 (permanent resident of U.S.with an immigrant visa), or 4 (temporary resident of the U.S. with non-immigrant visa) if the respondent isnot a citizen of the United States.
L COPY VMLASLE
59
o40-
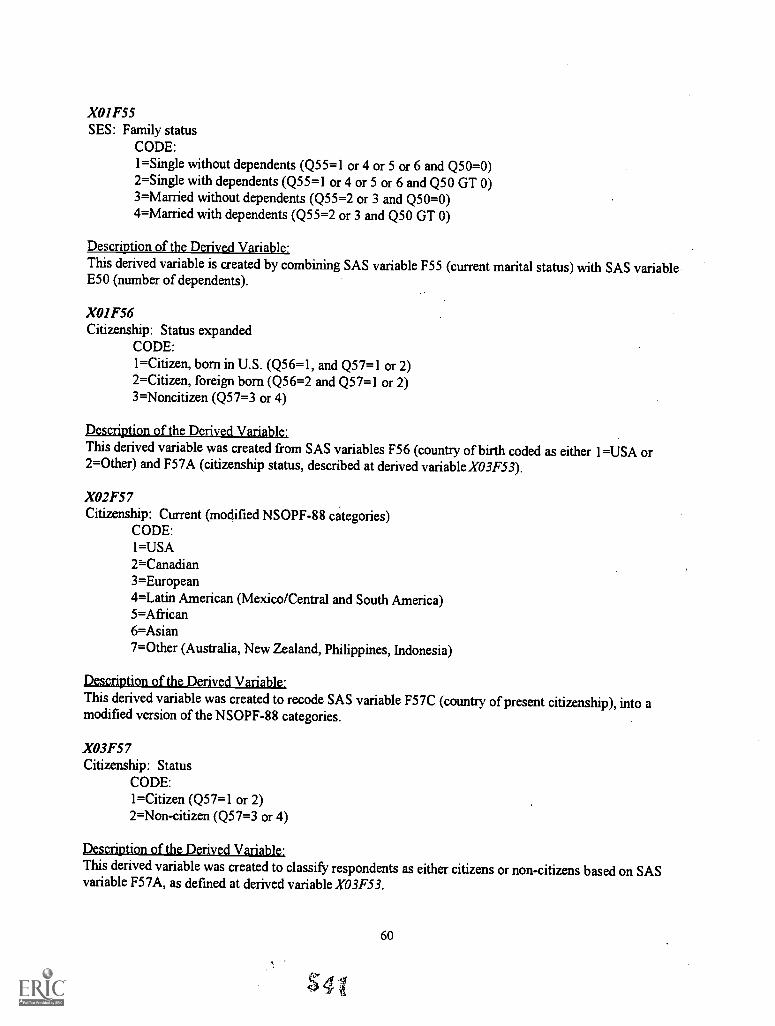
X01 F55SES: Family status
CODE:1=Single without dependents (Q55=1 or 4 or 5 or 6 and Q50=0)2=Single with dependents (Q55=1 or 4 or 5 or 6 and Q50 GT 0)3=Married without dependents (Q55=2 or 3 and Q50=0)4=Married with dependents (Q55=2 or 3 and Q50 GT 0)
Description of the Derived Variable:This derived variable is created by combining SAS variable F55 (current marital status) with SAS variableE50 (number of dependents).
X01 F56Citizenship: Status expanded
CODE:1=Citizen, born in U.S. (Q56=1, and Q57=1 or 2)2=Citizen, foreign born (Q56=2 and Q57=1 or 2)3=Noncitizen (Q57=3 or 4)
Description of the Derived Variable:This derived variable was created from SAS variables F56 (country of birth coded as either 1=USA or2=Other) and F57A (citizenship status, described at derived variable X03F53).
X02F57Citizenship: Current (modified NSOPF-88 categories)
CODE:1=USA2==Canadian3=European4=Latin American (Mexico/Central and South America)5=African6=Asian7=Other (Australia, New Zealand, Philippines, Indonesia)
Description of the Derived Variable:This derived variable was created to recode SAS variable F57C (country of present citizenship), into amodified version of the NSOPF-88 categories.
X03 F57Citizenship: Status
CODE:1=Citizen (Q57=1 or 2)2=Non-citizen (Q57=3 or 4)
Description of the Derived Variable'This derived variable was created to classify respondents as either citizens or non-citizens based on SASvariable F57A, as defined at derived variable X03F53.
60
X01 F58SES: Parents' education (Q58, A+B divided by 2)
CODE:-2=Don't Know1=High (more than 6)2=Medium (6 or less but more than 2)3=Low (2 or less)
Description of the Derived Variable.,This derived variable was created to classify the parents of faculty respondents according to their level offormal education. Values at SAS variable F58A (mother's formal education) and F58B (father's formaleducation) were added together, then divided by 2. A resulting value of 1 or 2 was coded as "low" at X01F58,a value of 3 through 6 was coded as "medium" at X01F58, and a value of 7 or 8 was coded as "high" atX01F58. (If either F58A or F58B was coded "don't know", then the higher coded response is used for thederived variable. If both were "don't know", then the derived variable was coded as "don't know.") Thevalues at F58 are as follows:
-2=Don't know1=Less than high school diploma2=High school diploma3=Some college4=Associate's degree5=Bachelor's degree6=Master's degree7=Doctorate or professional degree (e.g., Ph.D., M.D., D.V.M., J.D./L.L.B)8=Other
61
542
1993 National Study of Postsecondary FacultyMethodology Report
Exhibit 0-1: Discipline Crosswalk, NSOPF 1988-1993
543

EXHIBIT 0-1: DISCIPLINE CROSSWALK, NSOPF 1988-1993CODES FOR MAJOR FIELDS OF STUDY AND ACADEMIC DISCIPLINES
1988 CODES 1993 CODES
100 AGRICULTURE--UNSPECIFIED
001 101 Agribusiness & Agricultural Production
002 102 Agricultural Animal, Food, & Plant Sciences
003 103 Renewable Natural Resources, including Conservation,Fishing, & Forestry
004 110 Other Agriculture
120 ARCHITECTURE & ENVIRONMENTAL DESIGN-UNSPECIFIED
005 121 Architecture & Environmental Design
006 122 City, Community, & Regional Planning
007 123 Interior Design
008 124 Land Use Management & Reclamation Design
009 130 Other Arch. & Environmental Design
140 ART--UNSPECIFIED
010 141 Art History & Appreciation
011 142 Crafts
012 143 Dance
013 144 Design (other than Arch. or Interior)
014 145 Dramatic Arts
015 146 Film Arts
016 147 Fine Arts
017 148 Music
018 149 Music History & Appreciation
019 150 Other Visual & Performing Arts
160 BUSINESS UNSPECIFIED
020 161 Accounting
021 162 Banking & Finance
022 163 Business Administration & Management
1
5 44
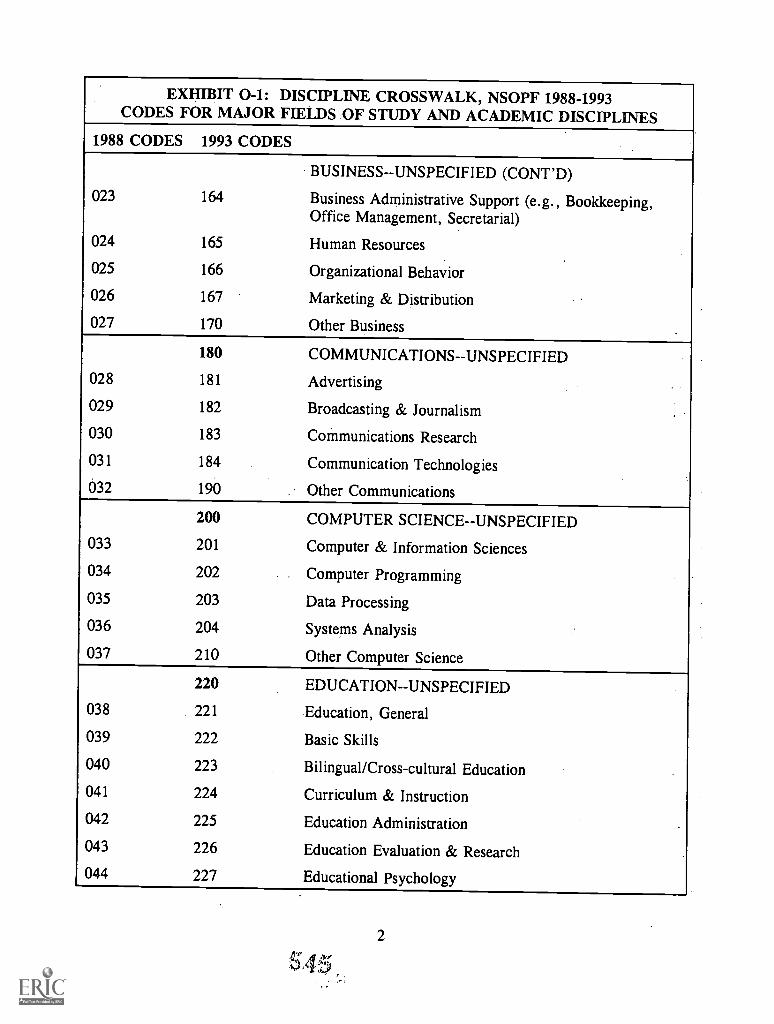
EXHIBIT 0-1: DISCIPLINE CROSSWALK, NSOPF 1988-1993CODES FOR MAJOR FIELDS OF STUDY AND ACADEMIC DISCIPLINES
1988 CODES 1993 CODES
BUSINESS--UNSPECIFIED (CONT'D)023 164 Business Administrative Support (e.g., Bookkeeping,
Office Management, Secretarial)
024 165 Human Resources
025 166 Organizational Behavior
026 167 Marketing & Distribution .
027 170 Other Business
180 COMMUNICATIONS--UNSPECIFIED028 181 Advertising
029 182 Broadcasting & Journalism
030 183 Communications Research
031 184 Communication Technologies
032 190 Other Communications
200 COMPUTER SCIENCE-- UNSPECIFIED
033 201 Computer & Information Sciences
034 202 Computer Programming
035 203 Data Processing
036 204 Systems Analysis
037 210 Other Computer Science
220 EDUCATION-- UNSPECIFIED
038 221 Education, General
039 222 Basic Skills
040 223 Bilingual/Cross-cultural Education
041 224 Curriculum & Instruction
042 225 Education Administration
043 226 Education Evaluation & Research
044 227 Educational Psychology
2
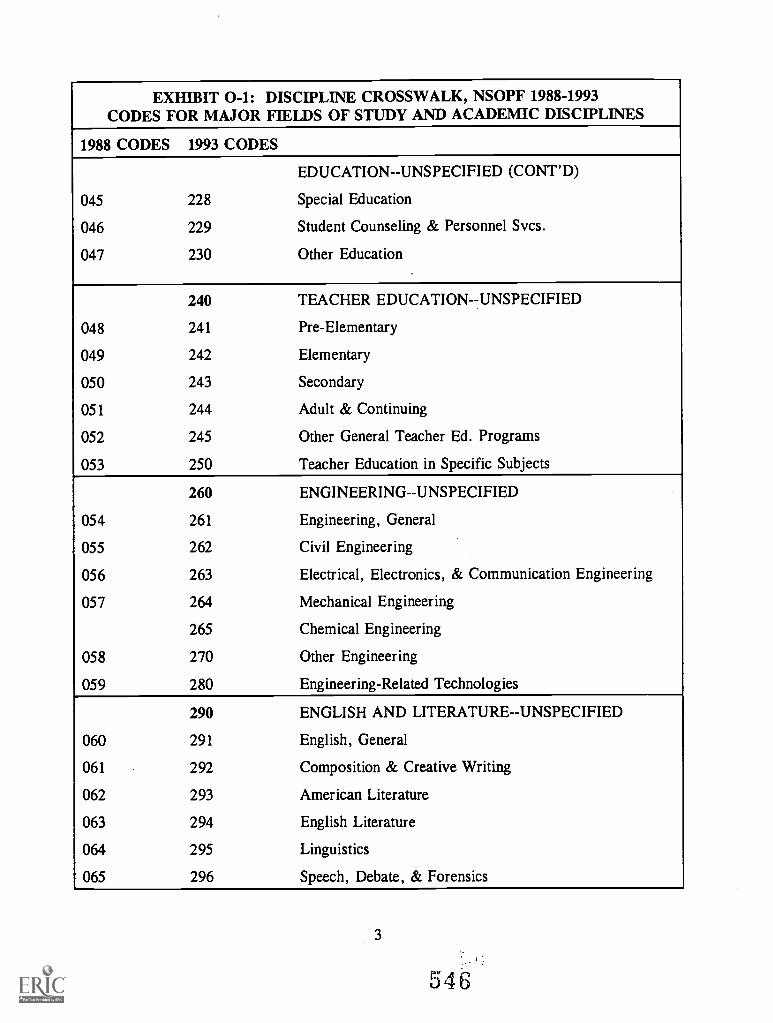
EXHIBIT 0-1: DISCIPLINE CROSSWALK, NSOPF 1988-1993CODES FOR MAJOR FIELDS OF STUDY AND ACADEMIC DISCIPLINES
1988 CODES 1993 CODES
EDUCATION--UNSPECIFIED (CONT'D)
045 228 Special Education
046 229 Student Counseling & Personnel Svcs.
047 230 Other Education
240 TEACHER EDUCATION--UNSPECIFIED
048 241 Pre-Elementary
049 242 Elementary
050 243 Secondary
051 244 Adult & Continuing
052 245 Other General Teacher Ed. Programs
053 250 Teacher Education in Specific Subjects
260 ENGINEERING--UNSPECIFIED
054 261 Engineering, General
055 262 Civil Engineering
056 263 Electrical, Electronics, & Communication Engineering
057 264 Mechanical Engineering
265 Chemical Engineering
058 270 Other Engineering
059 280 Engineering-Related Technologies
290 ENGLISH AND LITERATURE--UNSPECIFIED
060 291 English, General
061 292 Composition & Creative Writing
062 293 American Literature
063 294 English Literature
064 295 Linguistics
065 296 Speech, Debate, & Forensics
546
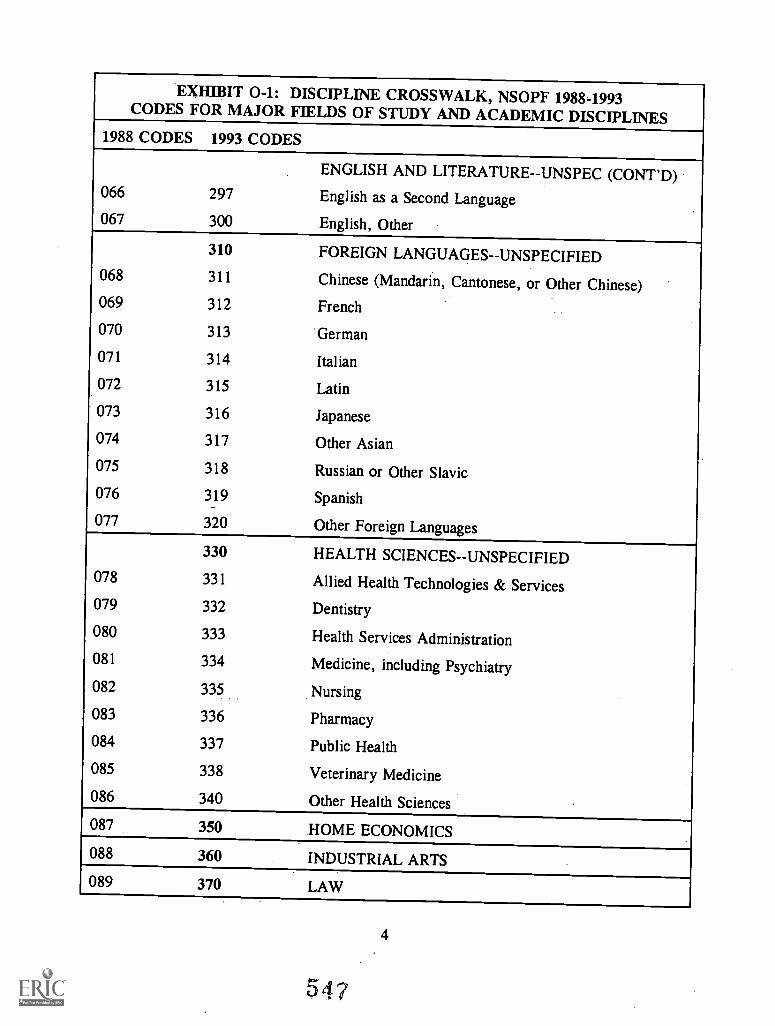
EXHIBIT 0-1: DISCIPLINE CROSSWALK, NSOPF 19884993CODES FOR MAJOR FIELDS OF STUDY AND ACADEMIC DISCIPLINES
1988 CODES 1993 CODES
ENGLISH AND LITERATURE--UNSPEC (CONT'D)066 297 English as a Second Language067 300 English, Other
310 FOREIGN LANGUAGES--UNSPECIFIED068 311 Chinese (Mandarin, Cantonese, or Other Chinese)069 312 French
070 313 German
071 314 Italian
072 315 Latin
073 316 Japanese
074 317 Other Asian075 318 Russian or Other Slavic076 319 Spanish
077 320 Other Foreign Languages
330 HEALTH SCIENCES--UNSPECIFIED078 331 Allied Health Technologies & Services079 332 Dentistry
080 333 Health Services Administration081 334 Medicine, including Psychiatry082 335 Nursing
083 336 Pharmacy084 337 Public Health
085 338 Veterinary Medicine086 340 Other Health Sciences
087 350 HOME ECONOMICS
088 360 INDUSTRIAL ARTS
089 370 LAW
4
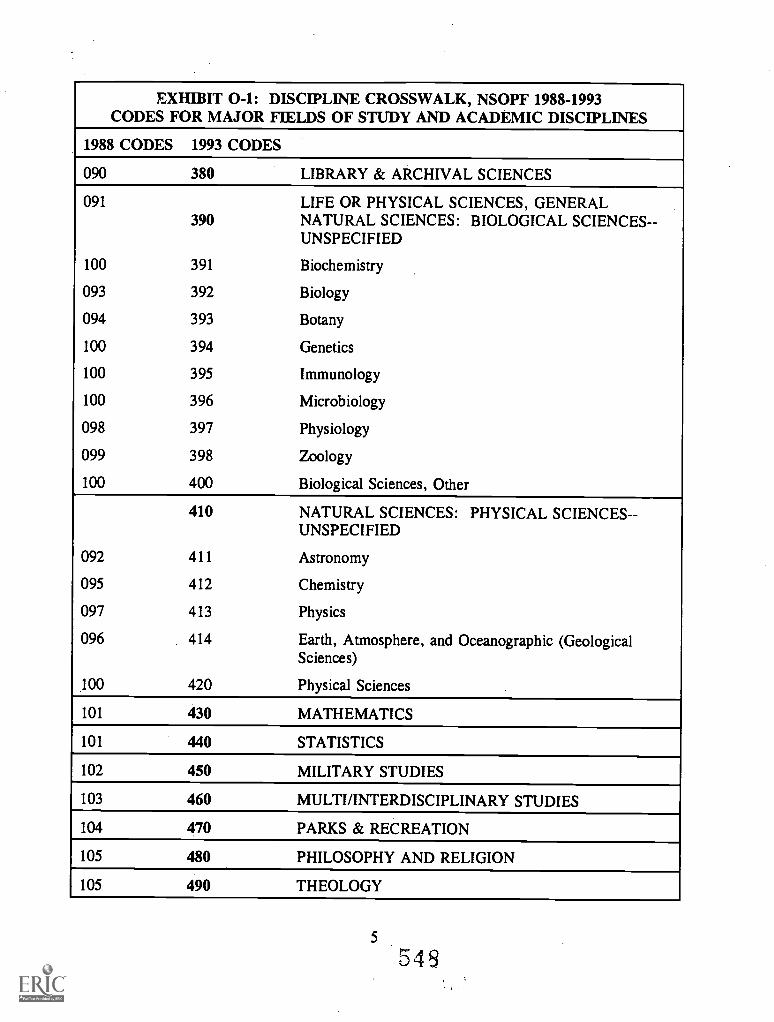
EXHIBIT 0-1: DISCIPLINE CROSSWALK, NSOPF 1988-1993CODES FOR MAJOR FIELDS OF STUDY AND ACADEMIC DISCIPLINES
1988 CODES 1993 CODES
090 380 LIBRARY & ARCHIVAL SCIENCES
091 LIFE OR PHYSICAL SCIENCES, GENERAL390 NATURAL SCIENCES: BIOLOGICAL SCIENCES- -
UNSPECIFIED
100 391 Biochemistry
093 392 Biology
094 393 Botany
100 394 Genetics
100 395 Immunology
100 396 Microbiology
098 397 Physiology
099 398 Zoology
100 400 Biological Sciences, Other
410 NATURAL SCIENCES: PHYSICAL SCIENCES-UNSPECIFIED
092 411 Astronomy
095 412 Chemistry
097 413 Physics
096 414 Earth, Atmosphere, and Oceanographic (GeologicalSciences)
100 420 Physical Sciences
101 430 MATHEMATICS
101 440 STATISTICS
102 450 MILITARY STUDIES
103 460 MULTI/INTERDISCIPLINARY STUDIES
104 470 PARKS & RECREATION
105 480 PHILOSOPHY AND RELIGION
105 490 THEOLOGY
5
545
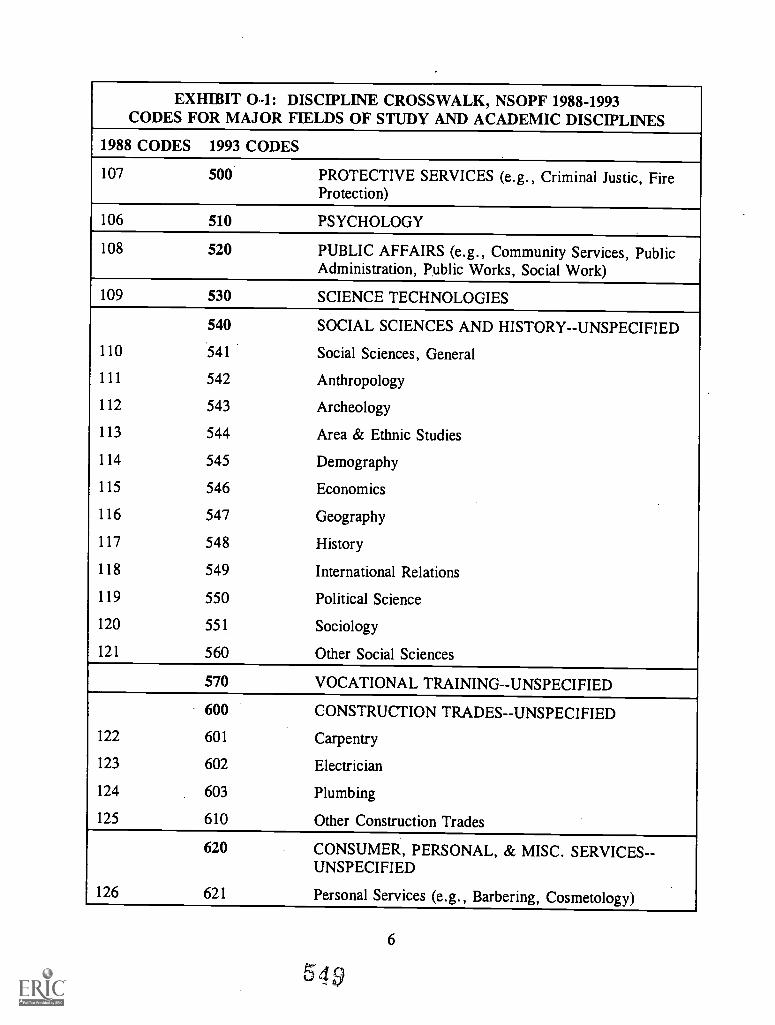
EXHIBIT 0-1: DISCIPLINE CROSSWALK, NSOPF 1988-1993CODES FOR MAJOR FIELDS OF STUDY AND ACADEMIC DISCIPLINES
1988 CODES 1993 CODES
107 500 PROTECTIVE SERVICES (e.g., Criminal Justic, FireProtection)
106 510 PSYCHOLOGY
108 520 PUBLIC AFFAIRS (e.g., Community Services, PublicAdministration, Public Works, Social Work)
109 530 SCIENCE TECHNOLOGIES
540 SOCIAL SCIENCES AND HISTORY--UNSPECIFIED
110 541 Social Sciences, General
111 542 Anthropology
112 543 Archeology
113 544 Area & Ethnic Studies
114 545 Demography
115 546 Economics
116 547 Geography
117 548 History
118 549 International Relations
119 550 Political Science
120 551 Sociology
121 560 Other Social Sciences
570 VOCATIONAL TRAINING--UNSPECIFIED
600 CONSTRUCTION TRADES--UNSPECIFIED
122 601 Carpentry
123 602 Electrician
124 603 Plumbing
125 610 Other Construction Trades
620 CONSUMER, PERSONAL, & MISC. SERVICES- -UNSPECIFIED
126 621 Personal Services (e.g., Barbering, Cosmetology)
6
54
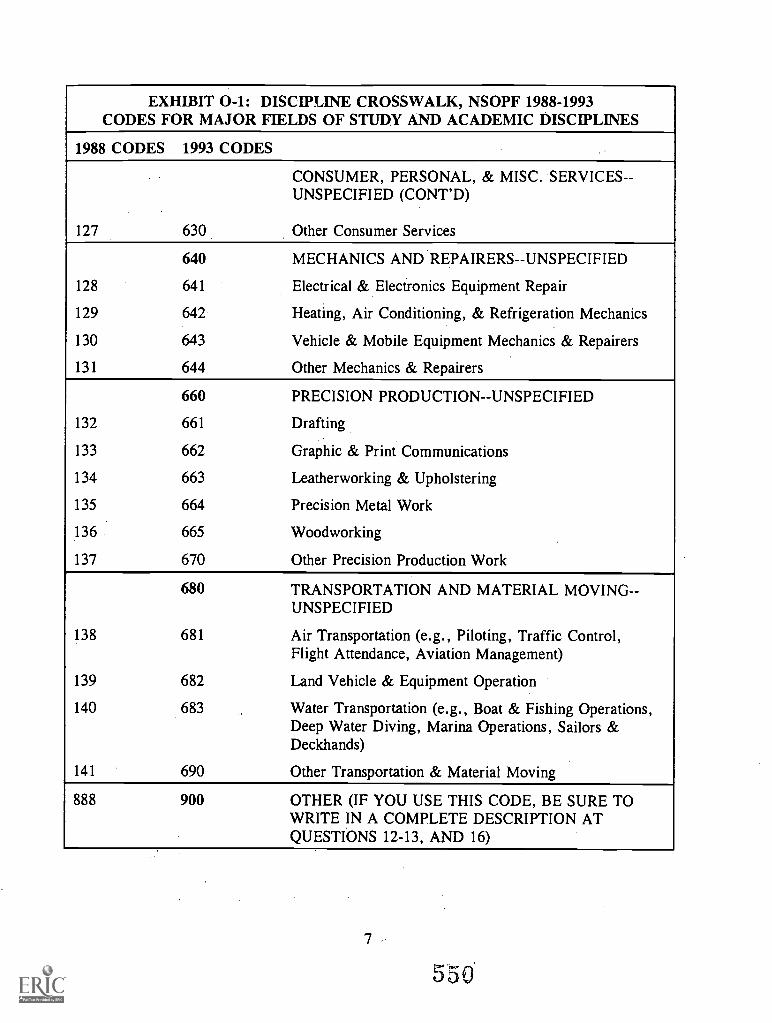
EXHIBIT 0-1: DISCIPLINE CROSSWALK, NSOPF 1988-1993CODES FOR MAJOR FIELDS OF STUDY AND ACADEMIC DISCIPLINES
1988 CODES 1993 CODES
CONSUMER, PERSONAL, & MISC. SERVICES-UNSPECIFIED (CONT'D)
127 630 Other Consumer Services
640 MECHANICS AND REPAIRERS UNSPECIFIED
128 641 Electrical & Electronics Equipment Repair
129 642 Heating, Air Conditioning, & Refrigeration Mechanics
130 643 Vehicle & Mobile Equipment Mechanics & Repairers
131 644 Other Mechanics & Repairers
660 PRECISION PRODUCTION--UNSPECIFIED
132 661 Drafting
133 662 Graphic & Print Communications
134 663 Leatherworking & Upholstering
135 664 Precision Metal Work
136 665 Woodworking
137 670 Other Precision Production Work
680 TRANSPORTATION AND MATERIAL MOVING-UNSPECIFIED
138 681 Air Transportation (e.g., Piloting, Traffic Control,Flight Attendance, Aviation Management)
139 682 Land Vehicle & Equipment Operation
140 683 Water Transportation (e.g., Boat & Fishing Operations,Deep Water Diving, Marina Operations, Sailors &Deckhands)
141 690 Other Transportation & Material Moving
888 900 OTHER (IF YOU USE THIS CODE, BE SURE TOWRITE IN A COMPLETE DESCRIPTION ATQUESTIONS 12-13, AND 16)
7
rJ v
1993 National Study of Postsecondary FacultyMethodology Report
Exhibit 0-2: Derived Variable Crosswalk to NSOPF-88
551
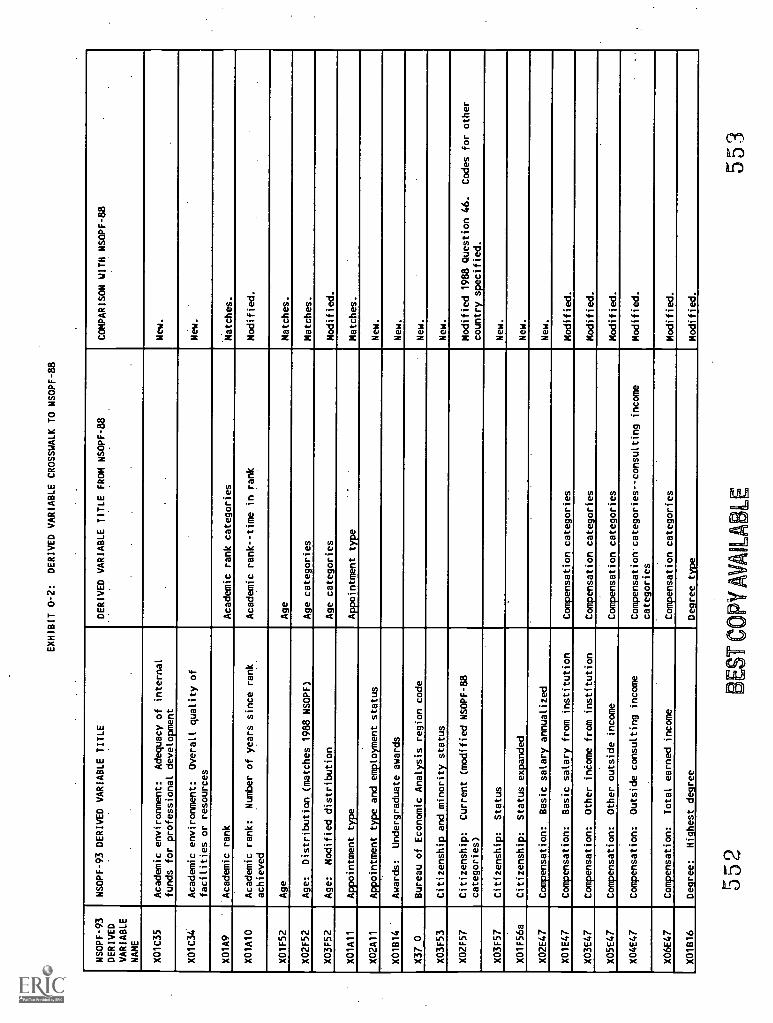
EXHIBIT 0-2:
DERIVED VARIABLE CROSSWALK TO NSOPF-88
NSOPF-93
DERIVED
VARIABLE
NAME
NSOPF-93 DERIVED VARIABLE TITLE
DERIVED VARIABLE TITLE FROM NSOPF-88
COMPARISON WITH NSOPF-88
X01C35
Academic environment:
Adequacy of internal
funds for professional development
.New.
X01C34
Academic environment:
Overall quality of
facilities or resources
New.
X01A9
Academic rank
Academic rank categories
Matches.
X01A10
Academic rank:
Number of years since rank
achieved
Academic rank--time in rank
Modified.
X01F52
Age
Age
Matches.
X02F52
Age:
Distribution (matches 1988 NSOPF)
Age categories
Matches.
X03F52
Age:
Modified distribution
Age categories
Modified.
X01A11
Appointment type
Appointment type
Matches.
X02A11
Appointment type and employment status
New.
X01B14
Awards:
Undergraduate awards
New.
X37 0
Bureau of Economic Analysis region code
New.
X03F53
Citizenship and minority status
New.
X02F57
Citizenship:
Current (modified NSOPF-88
categories)
Modified 1988 Question 46.
Codes for other
country specified.
X03F57
Citizenship:
Status
New.
X01F56a
Citizenship:
Status expanded
New.
X02E47
Compensation:
Basic salary annualized
New.
X01E47
Compensation:
Basic salary from institution
Compensation categories
Modified.
X03E47
Compensation:
Other income from institution
Compensation categories
Modified.
X05E47
Compensation:
Other outside income
Compensation categories
Modified.
X04E47
Compensation:
Outside consulting income
Compensation categories -- consulting income
categories
Modified.
X06E47
Compensation:
Total earned income
.
Compensation categories
Modified.
X01B16
Degree:
Highest degree
Degree type
Modified.
552
EST
CO
PY M
AR
AL
./LE
553
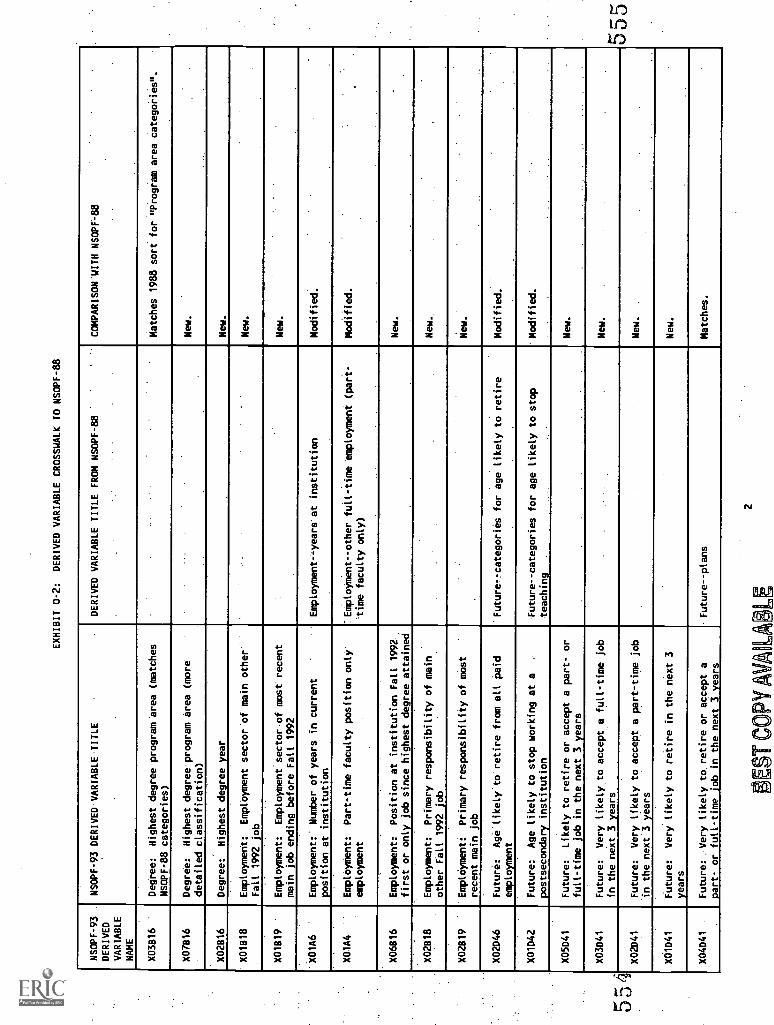
EXHIBIT 0-2:
DERIVED VARIABLE CROSSWALK TO NSOPF-88
NSOPF-93
DERIVED
VARIABLE
NAME
NSOPF-93 DERIVED.VARIABLETITLE
DERIVED VARIABLE TITLE FROM NSOPF-88
COMPARISON-WITH NSOPF-88
..
X03B16
Degree:
HigheSt degree program area (matches
NSOPF-88 categories)
.
Matches 1988 sort for "P'rogiam area categories ".'
X07816
Degree:
Highest degree'program area (more
detailed classification)
New.
.
X02616
Degree:
Highest degree year
New.
X01618
Employment:
EMplOyment sector 'of main other
Fall 1992 job
New.
X01B19
Employment::
EmployMent.tectorof mostrecent
main job ending before Fall 1992
New.
-K01A6
Employment:- Number'of years in current
position at institution
Employment - -years at institution
Modified.
.
X01A4
EmplOyMent:
Part-time faculty position only
employment
TEMPleyment--Other full -time emplOyment (part-
time faculty only)
Modified.
X06616
,Employment:
Position at institution Fall 1992
first or only job since highest degree attained
New.
.
X02B18
Employment:
Primary responsibility of main
other Fall 1992 job
New..
X02819
'Employment:
Primary responsibility'of most
recent main job
New.
X02046
Future:
Agelikely.to'retire from all paid
employment
'Future -- categories for age likely to retire
..
Modified.
.
.
X01042
Future:
Age likely to stop working at a
.-
postsecondary institution
'Future -- categories for age likely to stop
teaching
.
'Modified.
X05041
Future:
Likely to retire or accept a part- or
full-time job in the next 3 years
New.
..
.
X03041
Future:
Very likely to accept a full-time job
in the next 3 years
New..
.
X02041
Future:
Very likely to accept a part-time job
in the next 3 years
New.
.
X01041
Future:
Very likely to retire in the next 3
years
New.
X04041
Future: .Very likely to. retire or accept a
part- or full-time job in the next 3 years
-Future--plans
Matches.
BE
ST C
OPY
AV
AIL
AB
LE
2
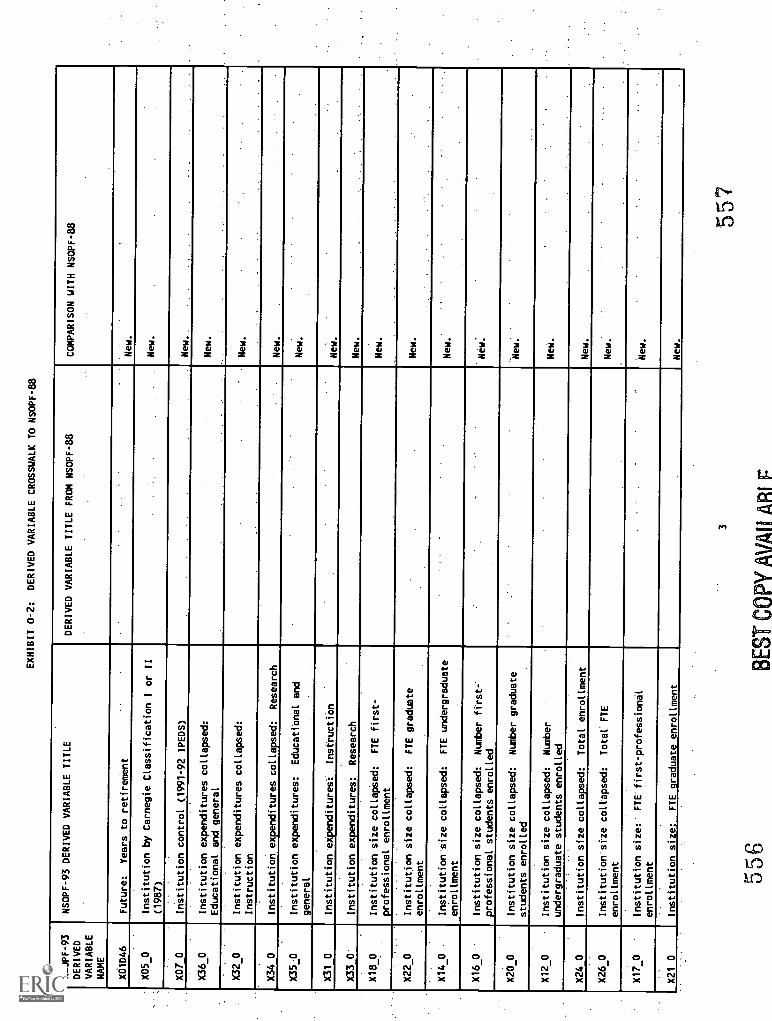
EXHIBIT 0-2:
DERIVED VARIABLE CROSSWALK TO NSOPF-88
NSOPF-93
DERIVED
VARIABLE
NAME
NSOPF-93 DERIVED VARIABLE TITLE
DERIVED VARIABLE TITLE FROM NSOPF-88
COMPARISON WITH NSOPF-88
)(01D46
Future:
Years to retirement
New.
X05_0
Institution by Carnegie Classification I or II
(1987)
New.
X07 0
Institution control (1991-92 IPEDS)
New..
X36_0
Institution expenditures collapsed:
Educational and general
New.
..
.
X32_0
Institution expenditures collapsed:
Instruction
-
New.
.
X34 0
Institution expenditures collapsed:
Research
New.
.
X350
Institution expenditures:
EdUcatiOnal and
general
New.
X31 0
Institution eXpendituresi
InstnuctiOn
New.
.
X33 0'
Institution expenditures:
Research
New.
X18_0
Institution size collapsed:
FTE first-
professional enrollment
New.
..
X22_0
Institution size collapsed:
FTE graduate
enrollment
.New.
..
X14_0
Institution'size collapsed:
FTE undergraduate
enrollment
.S
.
New.
'
X16_0
'
Institution size collapsed:
Number first-
professional students enrolled
-
'New:
X20_0
Institution size collapsed:
Number graduate
students enrolled
.
New.
X12_0
Institution size collapsed:
Number
undergraduate students enrolled
NeW.
X24 0
Institution size collapsed:
Total enrollment
New.
X26_0
Institution size collapsed:
Total FTE
enrollment
New:
.
X170
'
Institution size:' FTE'first-professional
enrollment
'
New.
..
.
X21 0
Institution size:
FTE graduate enrollment
New.
u
3
BE
ST
CO
PY
AV
Ai L
AR
I F
557
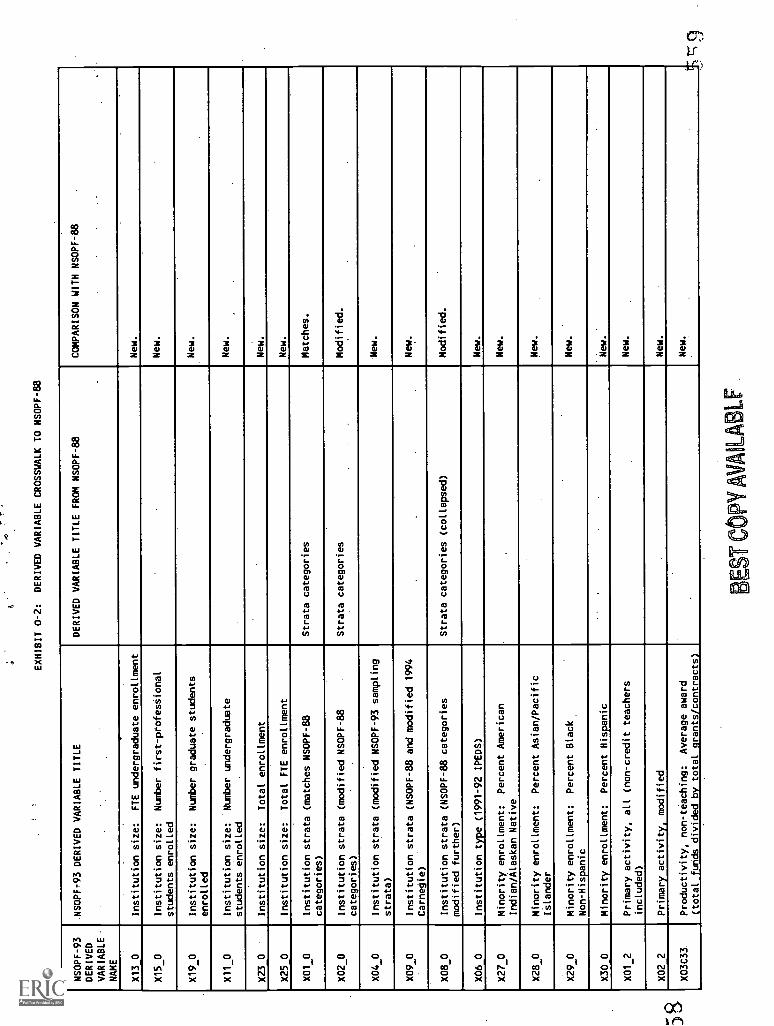
EXHIBIT 0-2:
DERIVED VARIABLE CROSSWALK TO NSOPF-88
NSOPF-93
DERIVED
VARIABLE
NAME
44SOPF,93 DERIVED VARIABLE TITLE
DERIVED VARIABLE TITLE FROM NSOPF-88
COMPARISON WITH NSOPF-88
X13 0
Institution size:
FTE undergraduate enrollment
New.
X15_0
Institution size:
Number first-profesiional
students enrolled
New.
X19 0
Institution size:
Number graduate students
enrolled
New.
X11_0
Institution size:
Number undergraduate
students enrolled
New.
X23 0
d nstitution size:
Total enrollment
New.
X25 0
Institution size:
Total FTE enrollment
New.
X01_0
Institution strata (matches NSOPF-88
categories)
Strata categories
Matches.
X02_0
Institution strata (modified NSOPF-88
categories)
Strata categories
Modified.
X040
Institution strata (modified NSOPF-93 sampling
strata)
New.
X09_0
Institution strata (NSOPF-88 and modified 1994
Carnegie)
New.
X08_0
Institution strata (NSOPF-88 categories
modified further)
Strata categories (collapsed)
Modified.
X06 0
Institution type (1991-92 IPEDS)
New.
X270
Minority enrollment:
Percent American
Indian/Alaskan Native
New.
X28_0
Minority enrollment:
Percent Asian/Pacific
!Slander
New.
.
X29_0
Minority enrollment:
Percent Black
Non-Hispanic
New.
New.
X30 0
Minority enrollment:
Percent Hispanic
X012
Primary activity, all (non-credit teachers
included)
New.
X02 2
Primary activity, modified
New.
X03C33
Productivity, non-teaching:
Average award
(total funds divided by total grants/contracts)
New.
L+
I C
OPY
AV
AIL
AB
LE
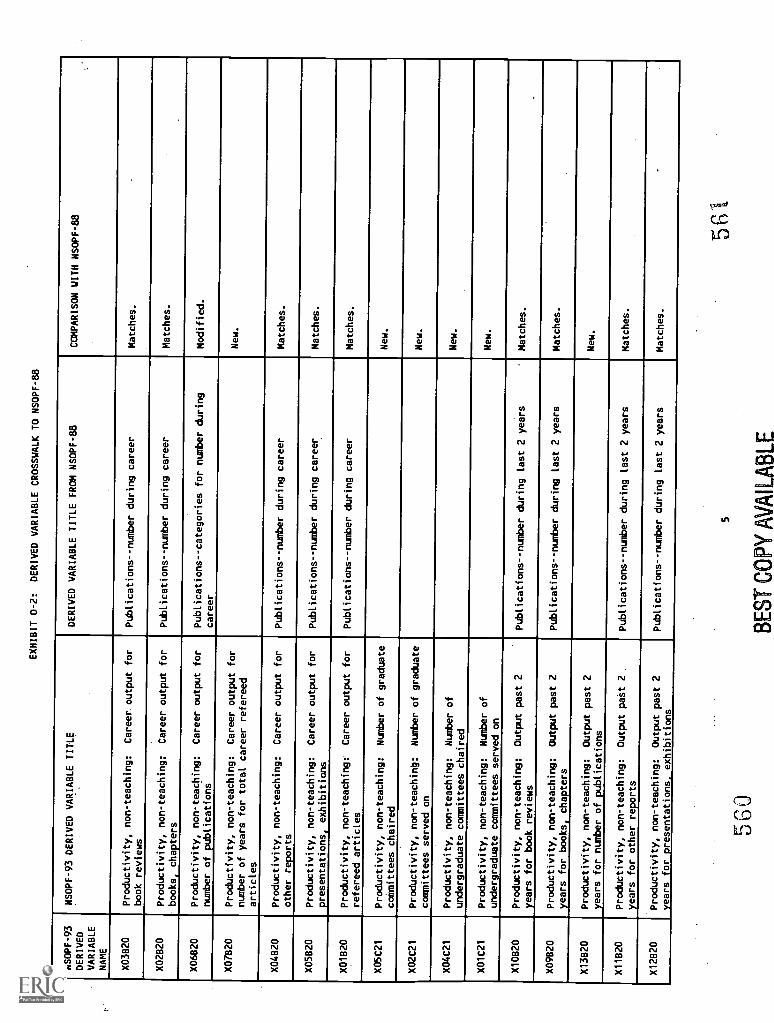
EXHIBIT 0-2:
DERIVED VARIABLE CROSSWALK TO NSOPF-88
NSOPF-93
DERIVED
VARIABLE
NAME
NSOPF-93 DERIVED VARIABLE TITLE
DERIVED VARIABLE TITLE FROM NSOPF-88
COMPARISON WITH NSOPF-88
X03820
Productivity, non-teaching:
Career output for
book reviews
Publications--number during career
Matches.
X02820
Productivity, non-teaching:
Career output for
books, chapters
Publications--number during career
Matches.
X06820
Productivity, non-teaching:
Career output for
number of publications
Publications--categories for number during
career
Modified.
X07820
Productivity, non-teaching:
Career output for
number of years for total career refereed
articles
New.
X04820
Productivity, non-teaching:
Career output for
other reports
Publications--number during career
Matches.
X05820
Productivity, non-teaching:
Career output for
presentations, exhibitions
Publications--number during career
Matches.
X011320
Productivity, non-teaching:
Career output for
refereed articles
Publications--number during career
Matches.
X05C21
Productivity, non-teaching:
Number of graduate
committees chaired
New.
X02C21
Productivity, non-teaching:
Number of graduate
committees served on
New.
X04C21
Productivity, non-teaching:
Number of
undergraduate committees chaired
New.
X01C21
Productivity, non-teaching:
Number of
undergraduate committees served on
New.
X10820
Productivity, non-teaching:
Output past 2
years for book reviews
Publications--number during last 2 years
Matches.
X09820
Productivity, non-teaching:
Output past 2
years for books, chapters
Publications - -number during last 2 years
Matches.
X13820
Productivity, non-teaching:
Output past 2
years for number of publications
New.
X11820
Productivity, non-teaching:
Output paSt 2
years for other reports
Publications--number during last 2 years
Matches.
X12820
Productivity, non-teaching:
Output past 2
years for presentations, exhibitions
Publications--number during last 2 years
Matches.
u 0
5
BE
ST C
OPY
AV
AIL
AB
LE
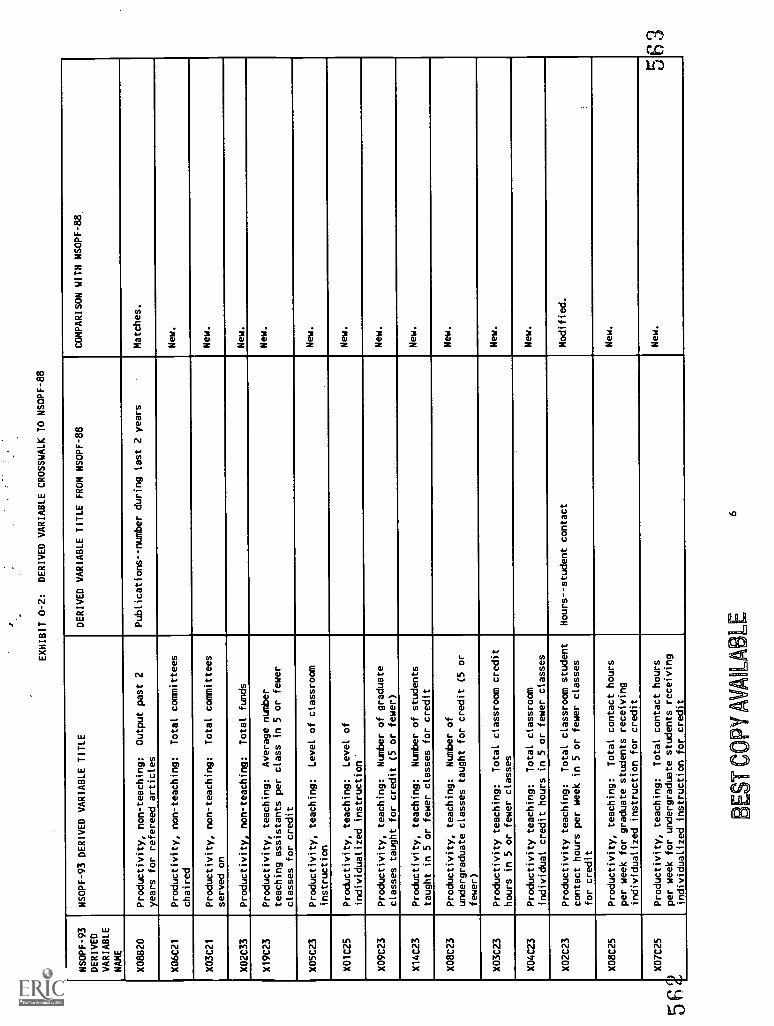
5F
EXHIBIT 0-2:
DERIVED VARIABLE CROSSWALK TO NSOPF-88
NSOPF-93
DERIVED
VARIABLE
NAME
NSOPF-93 DERIVED VARIABLE TITLE
DERIVED VARIABLE TITLE FROM NSOPF-88
COMPARISON WITH NSOPF-88,
X08820
Productivity, non-teaching:
Output past 2
years for refereed articles
Publications--number during last 2 years
Matches.
X06C21
Productivity, non-teaching:
Total committees
chaired
New.
X03C21
Productivity, non-teaching:
Total committees
served on
New.
X02C33
Productivity, non-teaching:
Total funds
New.
X19C23
Productivity, teaching:
Average number
teaching assistants per class in 5 or fewer
classes for credit
New.
X05C23
Productivity, teaching:
Level of classroom
instruction
New.
X01C25
Productivity, teaching:
Level of
individualized instruction"
New.
X09C23
Productivity, teaching:
Number of graduate
classes taught for credit (5 or fewer)
New.
X14C23
Productivity, teaching:
Number of students
taught in 5 or fewer classes for credit
New.
X08C23
Productivity, teaching:
Number of
undergraduate classes taught for credit (5 or
fewer)
New.
X03C23
Productivity teaching:
Total classroom credit
hours in 5 or fewer classes
New.
X04C23
Productivity teaching:
Total classroom
individual credit hours in 5 or fewer classes
New.
X02C23
Productivity teaching:
Total classroom student
contact hours per week in 5 or fewer classes
for credit
Hours--student contact
Modified.
XO8C25
Productivity, teaching:
Total contact hours
per week for graduate students receiving
individualized instruction for credit
New.
X07C25
) ,
Productivity, teaching:
Total contact hours
per week for undergraduate students receiving
individualized instruction for credit
New.
ci
C:
BE
ST C
OPY
AV
AIL
AB
LE
6
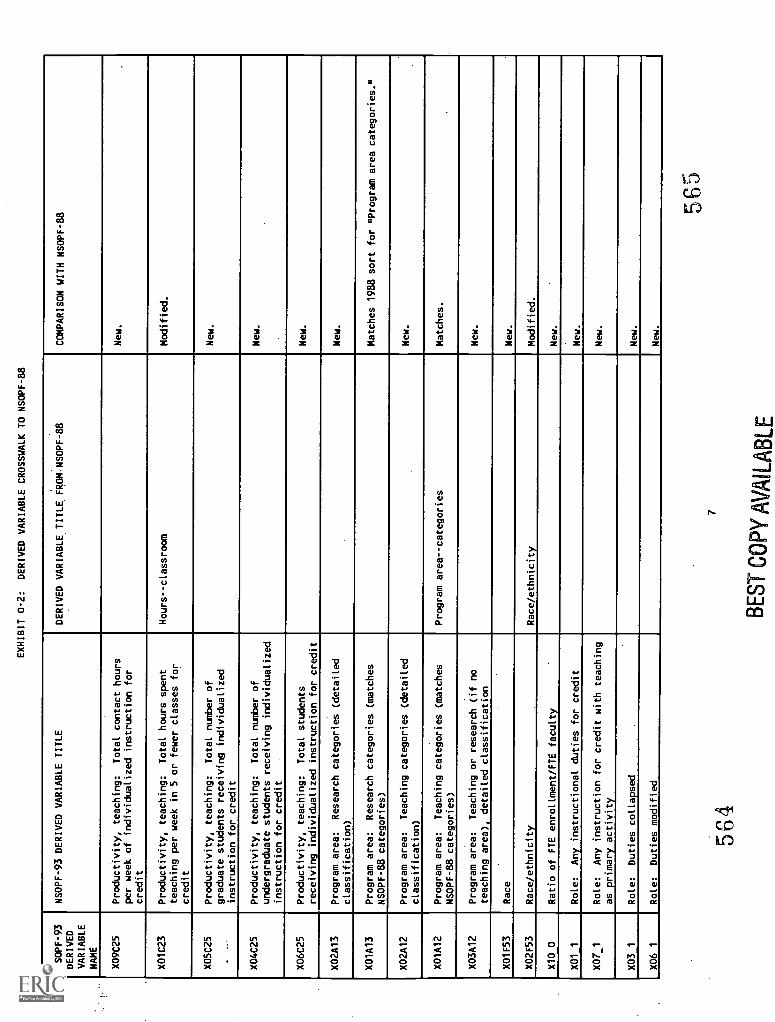
EXHIBIT 0-2:
DERIVED VARIABLE CROSSWALK TO NSOPF-88
NSOPF-93
DERIVED
VARIABLE
NAME
NSOPF-93 DERIVED VARIABLE TITLE
DERIVED VARIABLE TITLE FROWNSOPF-88
COMPARISON WITH NSOPF-88
X09C25
Productivity, teaching:
Total contact hours
per week of individualized instruction for
credit
New.
X01C23
Productivity, teaching:
Total hours spent
teaching per week in 5 or fewer classes for
credit
Hours--classroom
Modified.
X05C25
._.
Productivity, teaching:
Total number of
graduate students receiving individualized
instruction for credit
New.
X04C25
Productivity, teaching:
Total number of
undergraduate students receiving individualized
instruction for credit
New.
.
X06C25
Productivity, teaching:
Total students
receiving individualized instruction for credit
New.
X02A13
Program area:
Research categories (detailed
classification)
New.
X01A13
Program area:
Research categories (matches
NSOPF-88 categories)
Matches 1988 sort for "Program area categories."
X02Al2
Program area:
Teaching categories (detailed
classification)
New.
X01Al2
Program area:
Teaching categories (matches
NSOPF-88 categories)
Program area--categories
Matches.
X03Al2
Program area:
Teaching or research (if no
teaching area), detailed classification
New.
X01F53
Race
New.
X02F53
Race/ethnicity
Race/ethnicity
Modified.
X10 0
Ratio of FTE enrollment/FTE faculty
New.
X01
1Role:
Any instructional duties for credit
New.
X07_1
Role:
Any instruction for credit with teaching
as primary activity
New.
X03 1
Role:
Duties collapsed
New.
X06 1
Role:
Duties modified
New.
564
7
BE
ST
CO
PY
AV
AIL
AB
LE
565
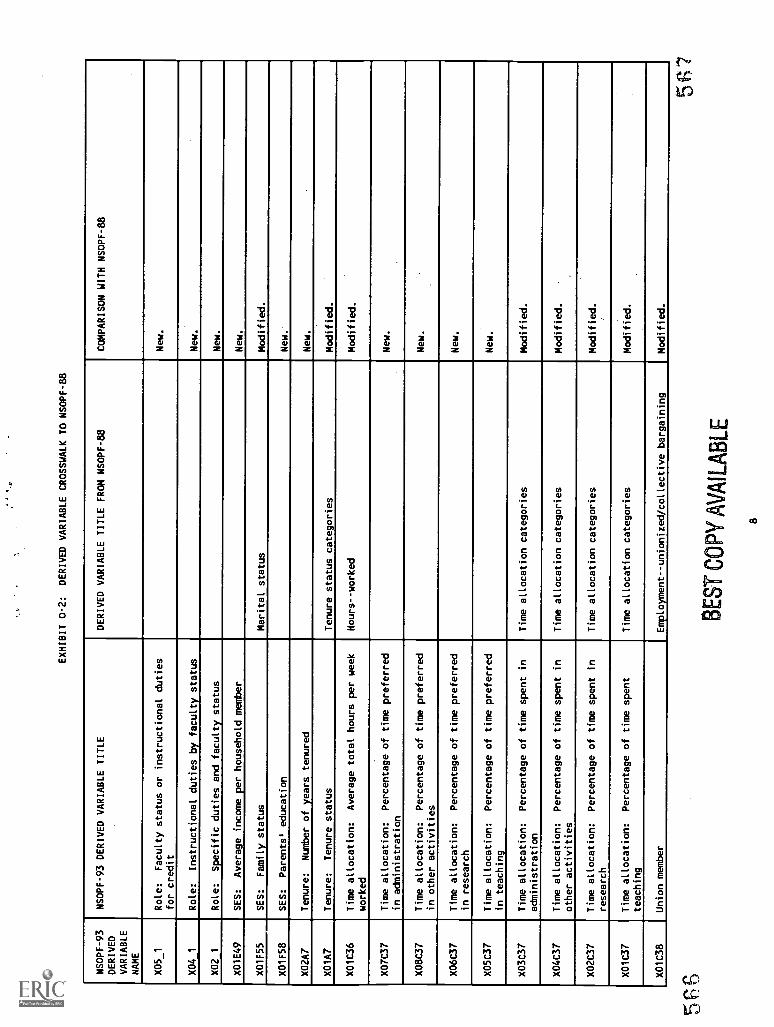
EXHIBIT 0-2:
DERIVED VARIABLE CROSSWALK TO NSOPF-88
NSOPF-93
DERIVED
VARIABLE
NAME
NSOPF-93 DERIVED VARIABLE TITLE
DERIVED VARIABLE TITLE FROM NSOPF-88
COMPARISON WITH NSOPF-88
X05_1
Role:
Faculty status or instructional duties
for credit
New.
X04 1
Role:
Instructional duties by faculty status
New.
X02 1
Role:
Specific duties and faculty status
New.
X01E49
SES:
Average income per household member
New.
X01F55
SES:
Family status
Marital status
Modified.
X01F58
SES:
Parents' education
New..
X02A7
Tenure:
Number of years tenured
New.
XO1A7
Tenure:
Tenure status
Tenure status categories
Modified.
X01C36
Time allocation:
Average total hours per week
worked
Hours--worked
Modified.
X07C37
Time allocation:
Percentage of time preferred
in administration
New.
X08C37
Time allocation:
Percentage of time preferred
in other activities
New.
X06C37
Time allocation:
Percentage of time preferred
in research
New.
X05C37
Time allocation:
Percentage of time preferred
in teaching
New.
X03C37
Time allocation:
Percentage of time spent in
administration
Time allocation categories
Modified.
X04C37
Time allocation:
Percentage of time spent in
other activities
Time allocation categories
Modified.
X02C37
Time allocation:
Percentage of time spent in
research
Time allocation categories
Modified.
X01C37
Time allocation:
Percentage of time spent
teaching
Time allocation categories
Modified.
X01C38
Union member
Employment--unionized/collective bargaining
Modified.
5P6
BE
ST C
OPY
AV
AIL
AB
LE
8
5W?
Appendix P
1993 National Study of Postsecondary FacultyMethodology Report
Imputation Flags for the Institution Data File (Public-use)
Imputation Flags for the Faculty Data File (Restricted-use)
58S
1993 National Study of Postsecondary FacultyMethodology Report
Imputation Flags for the Institution Data File (Public-use)
569
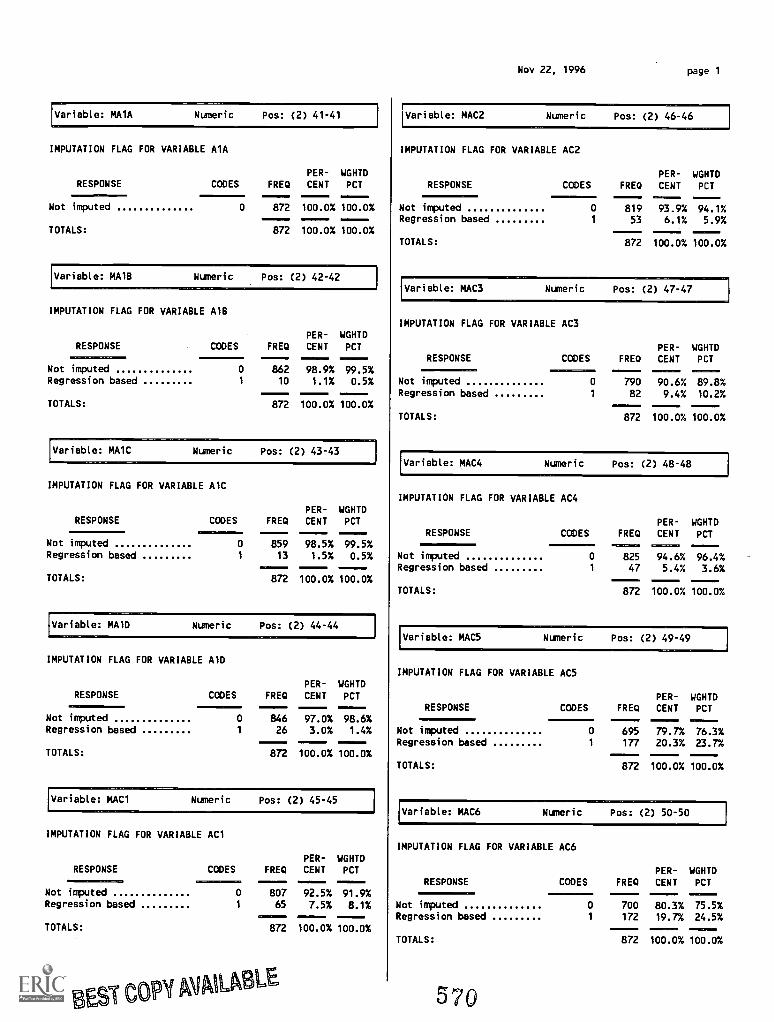
Variable: MA1A Numeric Pos: (2) 41-41
IMPUTATION FLAG FOR VARIABLE A1A
RESPONSEPER- WGHTD
CODES FREQ CENT PCT
-----Not imputed 0 872 100.0% 100.0%
TOTALS: 872 100.0% 100.0%
Variable: MA1B Numeric Pos: (2) 42-42
IMPUTATION FLAG FOR VARIABLE A1B
RESPONSEPER- WGHTD
CODES FREQ CENT PCT
Not imputed 0 862 98.9% 99.5%Regression based 1 10 1.1% 0.5%
TOTALS: 872 100.0% 100.0%
Variable: MA1C Numeric Pos: (2) 43-43
IMPUTATION FLAG FOR VARIABLE A1C
RESPONSEPER- WGHTD
CODES FREQ CENT PCT
Not imputed 0 859 98.5% 99.5%Regression based 1 13 1.5% 0.5%
TOTALS: 872 100.0% 100.0%
Variable: MAID Numeric Pos: (2) 44-44
IMPUTATION FLAG FOR VARIABLE A1D
PER- WGHTDRESPONSE CODES FREQ CENT PCT
Not imputed 0 846 97.0% 98.6%Regression based 1 26 3.0% 1.4%
TOTALS: 872 100.0% 100.0%
Variable: MAC1 Numeric Pos: (2) 45-45
IMPUTATION FLAG FOR VARIABLE AC1
RESPONSE CODESPER- WGHTD
FREQ CENT PCT--------
Not imputed 0 807 92.5% 91.9%Regression based 1 65 7.5% 8.1%
TOTALS: 872 100.0% 100.0%
NV COPY AVAILNBLE
Nov 22, 1996 page 1
rariable: MAC2 Numeric Pos: (2) 46-46
IMPUTATION FLAG FOR VARIABLE AC2
PER- WGHTDRESPONSE CODES FREQ CENT PCT
Not imputed 0 819-----93.9%
-----94.1%
Regression based 1 53 6.1% 5.9%
TOTALS: 872 100.0% 100.0%
Variable: MAC3 Numeric Pos: (2) 47-47
IMPUTATION FLAG FOR VARIABLE AC3
RESPONSEPER- WGHTD
CODES FRED CENT PCT
Not imputed 0 790 90.6% 89.8%Regression based 1 82 9.4% 10.2%
TOTALS: 872 100.0% 100.0%
Variable: MAC4 Numeric Pos: (2) 48-48
IMPUTATION FLAG FOR VARIABLE AC4
RESPONSEPER- WGHTD
CODES FREQ CENT PCT
Not imputed 0 825 94.6% 96.4%Regression based 1 47 5.4% 3.6%
TOTALS: 872 100.0% 100.0%
Variable: MAC5 Numeric Pos: (2) 49-49
IMPUTATION FLAG FOR VARIABLE AC5
RESPONSEPER- WGHTD
CODES FRED CENT PCT-------
Not imputed 0 695 79.7% 76.3%Regression based 1 177 20.3% 23.7%
TOTALS: 872 100.0% 100.0%
Variable: MAC6 Numeric Pos: (2) 50-50
IMPUTATION FLAG FOR VARIABLE AC6
RESPONSE1112111111
PER- WGHTDCODES FREQ CENT PCT
Not imputed 0 700 80.3% 75.5%Regression based 1 172 19.7% 24.5%
TOTALS: 872 100.0% 100.0%
570
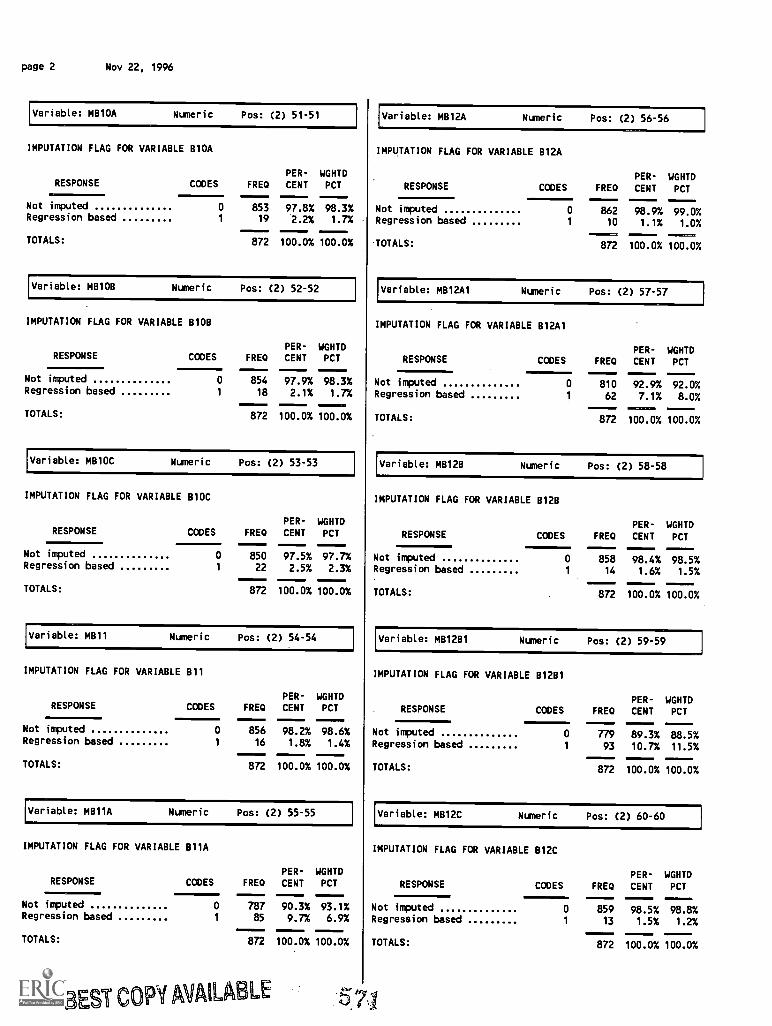
page 2 Nov 22, 1996
Variable: MB10A Numeric Pos: (2) 51-51
IMPUTATION FLAG FOR VARIABLE 810A
PER- WGHTDRESPONSE CODES FRED CENT PCT
Not imputed 0 853 97.8% 98.3%Regression based 1 19 2.2% 1.7%
TOTALS: 872 100.0% 100.0%
Variable: M8108 Numeric Pos: (2) 52-52
IMPUTATION FLAG FOR VARIABLE 8108
RESPONSEPER- WGHTD
CODES FRED CENT PCT
Not imputed 0 854 97.9% 98.3%Regression based 1 18 2.1% 1.7%
TOTALS: 872 100.0% 100.0%
Variable: MB10C Numeric Pos: (2) 53-53
IMPUTATION FLAG FOR VARIABLE 810C
PER- WGHTDRESPONSE CODES FRED CENT PCT
Not imputed 0 850 97.5% 97.7%Regression based 1 22 2.5% 2.3%
TOTALS: 872 100.0% 100.0%
Variable: M811 Numeric Pos: (2) 54-54
IMPUTATION FLAG FOR VARIABLE B11
RESPONSEPER- WGHTD
CODES FRED CENT PCT
Not imputed 0 856 98.2% 98.6%Regression based 1 16 1.8% 1.4%
TOTALS: 872 100.0% 100.0%
Variable: MB11A Numeric Pos: (2) 55-55
IMPUTATION FLAG FOR VARIABLE 811A
PER- WGHTDRESPONSE CODES FRED CENT PCT
Not imputed 0 787 90.3% 93.1%Regression based 1 85 9.7% 6.9%
TOTALS: 872 100.0% 100.0%
EST COPY AVAILABLE
Variable: MB12A Numeric Pos: (2) 56-56
IMPUTATION FLAG FOR VARIABLE 812A
RESPONSEPER- WGHTD
CODES FRED CENT PCT
Not imputed 0 862 98.9% 99.0%Regression based 1 10 1.1% 1.0%
TOTALS: 872 100.0% 100.0%
Variable: M812A1 Numeric Pos: (2) 57-57
IMPUTATION FLAG FOR VARIABLE 812A1
RESPONSEPER- WGHTD
CODES FRED CENT PCT
Not imputed 0 810 92.9% 92.0%Regression based 1 62 7.1% 8.0%
TOTALS:
.11.872
ilee=1.1.
100.0%
IMENCIIMMMO
100.0%
Variable: MB128 Numeric Pos: (2) 58-58
IMPUTATION FLAG FOR VARIABLE B128
RESPONSE1 PER- WGHTDCODES FRED CENT PCT
Not imputed 0 858 98.4% 98.5%Regression based 1 14 1.6% 1.5%
TOTALS: 872 100.0% 100.0%
Variable: M81281 Numeric Pos: (2) 59-59
IMPUTATION FLAG FOR VARIABLE 81281
RESPONSEPER- WGHTD
CODES FRED CENT PCT
Not imputed 0 779 89.3% 88.5%Regression based 1 93 10.7% 11.5%
TOTALS: 872 100.0% 100.0%
Variable: MB12C Numeric Pos: (2) 60-60
IMPUTATION FLAG FOR VARIABLE 812C
RESPONSEPER- WGHTD
CODES FRED CENT PCT
Not imputed 0 859 98.5% 98.8%Regression based 1 13 1.5% 1.2%
TOTALS: 872 100.0% 100.0%
>r4,4'1
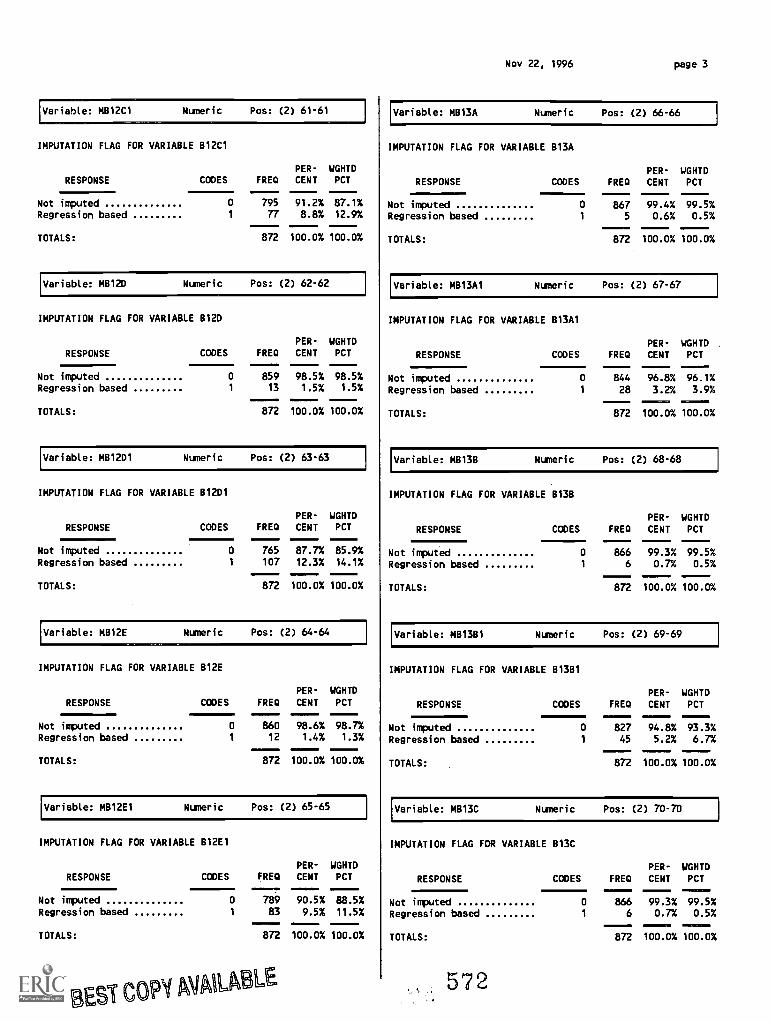
(Variable: MB12C1 Numeric Pos: (2) 61-61
IMPUTATION FLAG FOR VARIABLE 812C1
RESPONSEPER- WGHTD
CODES FREQ CENT PCT
Not imputed 0 795 91.2% 87.1%Regression based 1 77 8.8% 12.9%
TOTALS: 872 100.0% 100.0%
Variable: 16120 Numeric Pos: (2) 62-62
IMPUTATION FLAG FOR VARIABLE 8121)
PER- WGHTD
RESPONSE CODES FRED CENT PCT
Not imputed 0 859 98.5% 98.5%Regression based 1 13 1.5% 1.5%
TOTALS: 872 100.0% 100.0%
Variable: MB12D1 Numeric Pos: (2) 63-63
IMPUTATION FLAG FOR VARIABLE B1201
RESPONSEPER- WGHTD
CODES FREQ CENT PCT
Not imputed 0 765 87.7% 85.9%Regression based 1 107 12.3% 14.1%
TOTALS: 872 100.0% 100.0%
Variable: MB12E Numeric Pos: (2) 64-64
IMPUTATION FLAG FOR VARIABLE 812E
RESPONSE
PER- WGHTD
CODES FREQ CENT PCT
Not imputed 0 860 98.6% 98.7%Regression based 1 12 1.4% 1.3%
TOTALS: 872 100.0% 100.0%
Variable: MB12E1 Numeric Pos: (2) 65-65
IMPUTATION FLAG FOR VARIABLE 812E1
PER- WGHTDRESPONSE CODES FREQ CENT PCT
Not imputed 0 789 90.5% 88.5%Regression based 1 83 9.5% 11.5%
TOTALS: 872 100.0% 100.0%
BEST CON WOKE
Nov 22, 1996 page 3
Variable: MB13A Numeric Pos: (2) 66-66
IMPUTATION FLAG FOR VARIABLE 813A
RESPONSEPER- WGHTD
CODES FREQ CENT PCT
Not imputed 0 867 99.4% 99.5%Regression based 1 5 0.6% 0.5%
TOTALS: 872 100.0% 100.0%
Variable: MB13A1 Numeric Pos: (2) 67-67
IMPUTATION FLAG FOR VARIABLE 813A1
RESPONSEPER- WGHTD
CODES FREQ CENT PCT
Not imputed 0 844 96.8% 96.1%
Regression based 1 28 3.2% 3.9%
TOTALS: 100.0%
81.=1100.0%872
Variable: M8138 Numeric Pos: (2) 68-68
IMPUTATION FLAG FOR VARIABLE B138
RESPONSEPER- WGHTD
CODES FREQ CENT PCT
Not imputed 0 866 99.3% 99.5%Regression based 1 6 0.7% 0.5%
TOTALS: 872 100.0% 100.0%
Variable: MB13B1 Numeric Pos: (2) 69-69
IMPUTATION FLAG FOR VARIABLE 81381
PER- WGHTDRESPONSE CODES FRED CENT PCT
Not imputed 0 827 94.8%-----93.3%
Regression based 1 45 5.2% 6.7%
TOTALS: 872 100.0% 100.0%
Variable: MB13C Numeric Pos: (2) 70-70
IMPUTATION FLAG FOR VARIABLE 813C
RESPONSEPER- WGHTD
CODES FRED CENT PCT
Not imputed 0 866 99.3% 99.5%Regression based 1 6 0.7% 0.5%
TOTALS: 872 100.0% 100.0%
5 72
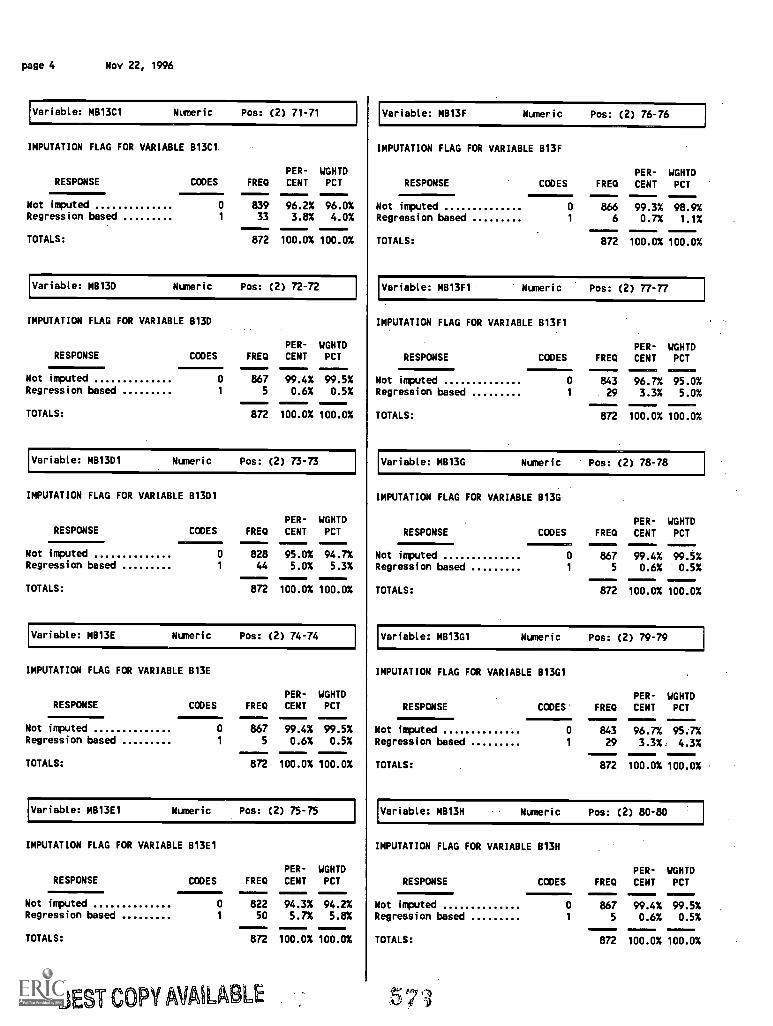
page 4 Nov 22, 1996
Variable: MB13C1 Numeric Pos: (2) 71-71
IMPUTATION FLAG FOR VARIABLE B13C1.
RESPONSE CODESPER- WGHTD
FRED CENT PCT
Not imputed 0 839 96.2%Regression based 1 33 3.8%
TOTALS: 872 100.0%
96.0% I
4.0%
100.0%
Variable: MB13D Numeric Pos: (2) 72-72
IMPUTATION FLAG FOR VARIABLE 813D
RESPONSE111111111MMOMMI
Variable: MB13F Numeric Pos: (2) 76-76
IMPUTATION FLAG FOR VARIABLE 813F
RESPONSEPER- WGHTD
CODES FRED CENT PCT
Not imputed 0 866 99.3% 98.9%Regression based 1 6 0.7% 1.1%
TOTALS: 872 100.0% 100.0%
Variable: MB13F1 Numeric Pos: (2) 77-77
IMPUTATION FLAG FOR VARIABLE 813F1
PER- WGHTDCODES FRED CENT PCT RESPONSE
Not imputed 0 867 99.4% 99.5%Regression based 1 5 0.6% 0.5%
TOTALS: 872 100.0% 100.0%
Variable: MB13D1 Numeric Pos: (2) 73-73
IMPUTATION FLAG FOR VARIABLE 81301
I
PER- WGHTDCODES FRED CENT PCT
Not imputed 0 843 96.7% 95.0%Regression based 1 29 3.3% 5.0%
TOTALS: 872 100.0% 100.0%
Variable: M8136 Numeric Pos: (2) 78-78
IMPUTATION FLAG FOR VARIABLE 813G
PER- WGHTDRESPONSE CODES FRED CENT PCT RESPONSE
Not imputed 0 828 95.0% 94.7%Regression based 1 44 5.0% 5.3%
TOTALS: 872 100.0% 100.0%
Variable: MB13E Numeric Pos: (2) 74-74
IMPUTATION FLAG FOR VARIABLE 813E
RESPONSEPER- WGHTD
CODES FRED CENT PCT
Not imputed 0 867 99.4% 99.5%Regression based 1 5 0.6% 0.5%
TOTALS: 872 100.0% 100.0%
Variable: MB13E1 Numeric Pos: (2) 75-75
IMPUTATION FLAG FOR VARIABLE B13E1
I
PER- WGHTDCODES FRED CENT PCT
1111111121 1171:11. MINN IIMMIMPS
Not imputed 0 867 99.4% 99.5%Regression based 1 5 0.6% 0.5%
TOTALS: 872 100.0% 100.0%
Variable: MB13G1 Numeric Pos: (2) 79-79
IMPUTATION FLAG FOR VARIABLE 813G1
RESPONSE
I Not imputedRegression based
I TOTALS:
PER- WGHTDCODES' FRED CENT PCT
0 843 96.7% 95.7%1 29 3.3%. 4.3%
872 100.0% 100.0%
Variable: MB13H Numeric Pos: (2) 80-80
IMPUTATION FLAG FOR VARIABLE 813H
PER- WGHTDRESPONSE CODES FRED CENT PCT RESPONSE
Not imputed 0 822 94.3% 94.2%Regression based 1 50 5.7% 5.8%
TOTALS: 872 100.0% 100.0%
BEST COPY MARE
I Not imputedRegression based
I TOTALS:
PER- WGHTDCODES FRED CENT PCT
0 867 99.4% 99.5%1 5 0.6% 0.5%
872 100.0% 100.0%
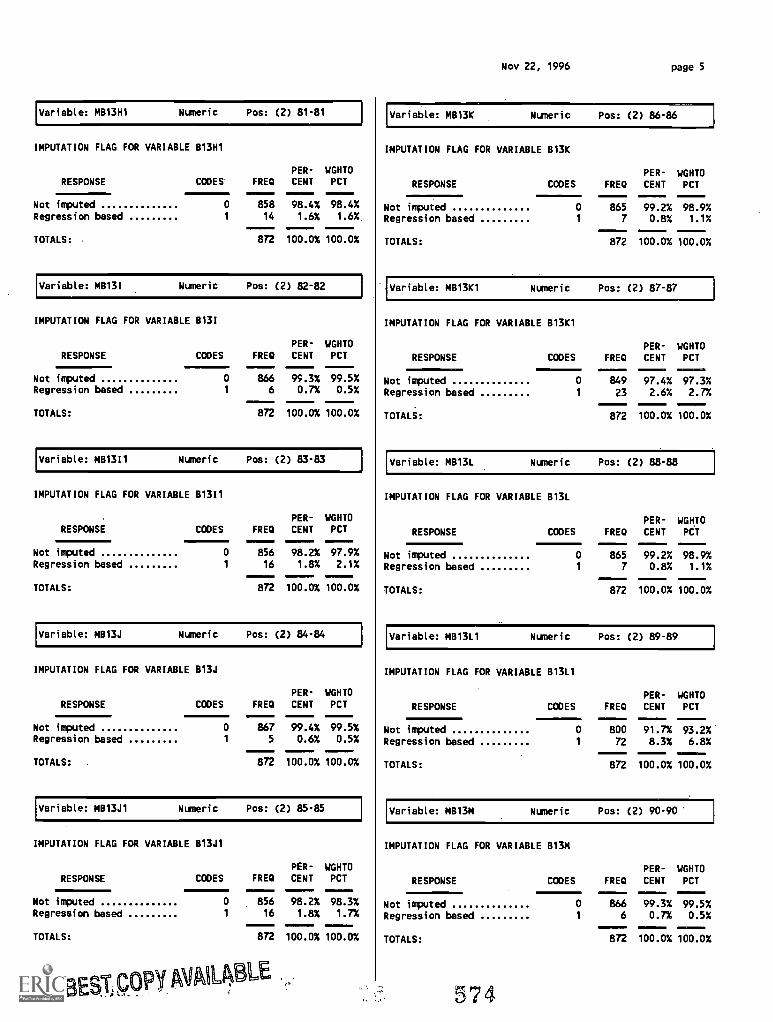
Variable: MB13H1 Numeric Pos: (2) 81-81
IMPUTATION FLAG FOR VARIABLE 813H1
RESPONSEPER- WGHTD
CODES FREQ CENT PCT
Not imputed 0 858 98.4% 98.4%Regression based 1 14 1.6% 1.6%.
TOTALS: 872 100.0% 100.0%
Variable: MB131 Numeric Pos: (2) 82-82
IMPUTATION FLAG FOR VARIABLE B131
RESPONSEPER- WGHTD
CODES FREQ CENT PCT
Not imputed 0 866 99.3% 99.5%Regression based 1 6 0.7% 0.5%
TOTALS:. 872 100.0% 100.0%
Variable: MB1311 Numeric Pos: (2) 83-83
IMPUTATION FLAG FOR VARIABLE 81311
RESPONSEPER- WGHTD
CODES FREQ CENT PCT
Not imputed 0 856 98.2% 97.9%Regression based 1 16 1.8% 2.1%
TOTALS: 872 100.0% 100.0%
Variable: MB13J Numeric Pos: (2) 84-84
IMPUTATION FLAG FOR VARIABLE 813J
RESPONSEPER- WGHTD
CODES FREQ CENT PCT
Not imputed 0 867 99.4% 99.5%Regression based 1 5 0.6% 0.5%
TOTALS: 872 100.0% 100.0%
Variable: MB13J1 Numeric Pos: (2) 85-85
IMPUTATION FLAG FOR VARIABLE 813J1
RESPONSEPER- WGHTD
CODES FREQ CENT PCT
Not imputed 0 856 98.2% 98.3%Regression based 1 16 1.8% 1.7%
TOTALS: 872 100.0% 100.0%
BEST; copy,WOKE
Nov 22, 1996 page 5
Variable: MB13K Numeric Pos: (2) 86-86
IMPUTATION FLAG FOR VARIABLE 813K
PER- WGHTDRESPONSE CODES FRED CENT PCT
Not imputed 0 865-----99.2% 98.9%
Regression based 1 7 0.8% 1.1%
TOTALS: 872 100.0% 100.0%
Variable: MB13K1 Numeric Pos: (2) 87-87
IMPUTATION FLAG FOR VARIABLE 813K1
RESPONSEPER- WGHTD
CODES FREQ CENT PCT
Not imputed 0 849 97.4% 97.3%Regression based 1 23 2.6% 2.7%
TOTALS: 872 100.0% 100.0%
Variable: MB13L Numeric Pos: (2) 88-88
IMPUTATION FLAG FOR VARIABLE 1113L
RESPONSEPER- WGHTD
CODES FREQ CENT PCT
Not imputed 0 865 99.2% 98.9%Regression based 1 7 0.8% 1.1%
TOTALS: 872 100.0% 100.0%
Variable: MB13L1 Numeric Pos: (2) 89-89
IMPUTATION FLAG FOR VARIABLE 813L1
RESPONSEPER- WGHTD
CODES FREQ CENT PCT
Not imputed 0 800 91.7% 93.2%'Regression based 1 72 8.3% 6.8%
TOTALS: 872 100.0% 100.0%
Variable: MB13M Numeric Pos: (2) 90-90
IMPUTATION FLAG FOR VARIABLE 813M
RESPONSEMIN11INIOM
PER- WGHTD
CODES FREQ CENT PCT
Not imputed 0 866 99.3% 99.5%Regression based 1 6 0.7% 0.5%
TOTALS: 872 100.0%-----100.0%
574
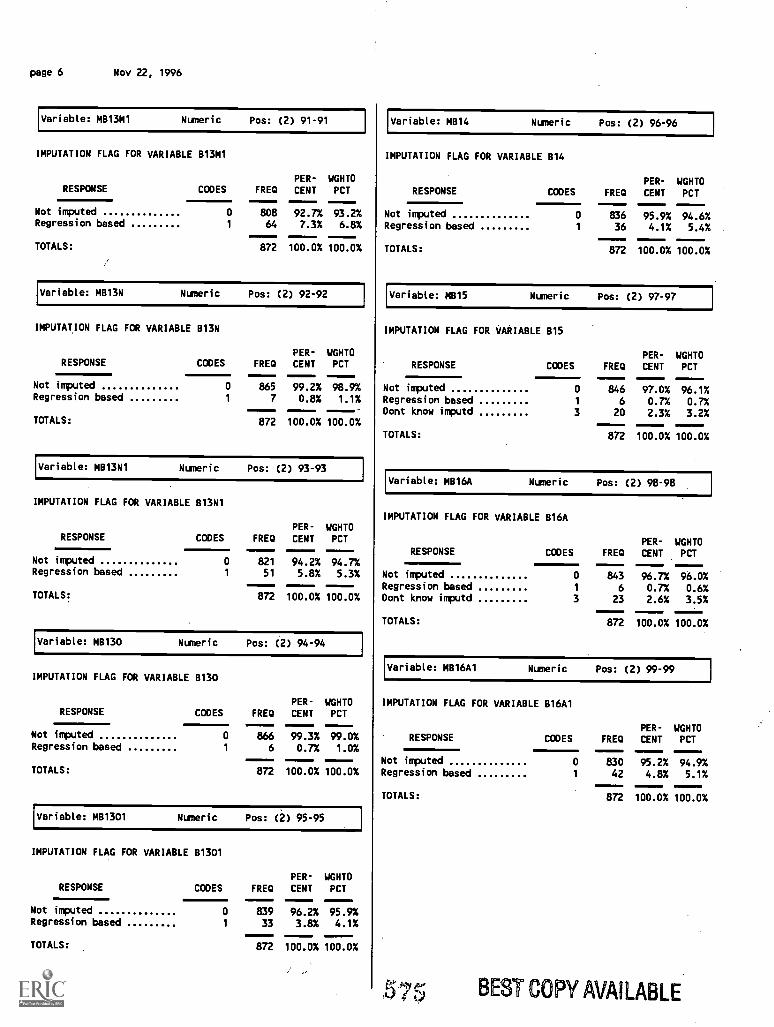
page 6 Nov 22, 1996
Variable: MB13M1 Numeric Pos: (2) 91-91
IMPUTATION FLAG FOR VARIABLE 813M1
RESPONSEPER- WGHTD
CODES FREO CENT PCT
Not imputed 0 808 92.7% 93.2%Regression based 1 64 7.3% 6.8%
TOTALS: 872 100.0% 100.0%
Variable: MB13N Numeric Pos: (2) 92-92
IMPUTATION FLAG FOR VARIABLE B13N
RESPONSEPER- WGHTD
CODES FREO CENT PCT
Not imputed 0 865 99.2% 98.9%Regression based 1 7 0.8% 1.1%
TOTALS: 872 100.0% 100.0%
Variable: MB13N1 Numeric Pos: (2) 93-93
IMPUTATION FLAG FOR VARIABLE 1313N1
RESPONSEPER- WGHTD
CODES FREO CENT PCT
Not imputed 0 821 94.2% 94.7%Regression based 1 51 5.8% 5.3%
TOTALS: 872 100.0% 100.0%
Variable: M8130 Numeric Pos: (2) 94-94
IMPUTATION FLAG FOR VARIABLE 8130
RESPONSEPER- WGHTD
CODES FREO CENT PCT
Not imputed 0 866 99.3% 99.0%Regression based 1 6 0.7% 1.0%
TOTALS: 872 100.0% 100.0%
Variable: MB1301 Numeric Pos: (2) 95-95
IMPUTATION FLAG FOR VARIABLE 81301
RESPONSE
Not imputed 0 839 96.2% 95.9%Regression based 1 33 3.8% 4.1%
TOTALS:
CODESPER- WGHTD
FREO CENT PCT
872 100.0% 100.0%
Variable: M814 Numeric Pos: (2) 96-96
IMPUTATION FLAG FOR VARIABLE B14
RESPONSEPER- WGHTD
CODES FRED CENT PCT
Not imputed 0 836 95.9% 94.6%Regression based 1 36 4.1% 5.4%
TOTALS: 872 100.0% 100.0%
Variable: MB15 Numeric Pos: (2) 97-97
IMPUTATION FLAG FOR VARIABLE B15
RESPONSE CODES FREOPER-
CENTWGHTDPCT
Not imputed 0 846 97.0% 96.1%Regression based 1 6 0.7% 0.7%Dont know imputd 3 20 2.3% 3.2%
TOTALS: 872 100.0% 100.0%
Variable: MB16A Numeric Pos: (2) 98-98
IMPUTATION FLAG FOR VARIABLE 816A
RESPONSE CODES FREOPER-
CENTWGHTDPCT
Not imputed 0 843 96.7% 96.0%Regression based 1 6 0.7% 0.6%Dont know imputd 3 23 2.6% 3.5%
TOTALS: 872 100.0% 100.0%
Variable: MB16A1 Numeric Pos: (2) 99-99
IMPUTATION FLAG FOR VARIABLE 816A1
RESPONSEPER- WGHTD
CODES FREO CENT PCT
Not imputed 0 830 95.2% 94.9%Regression based 1 42 4.8% 5.1%
TOTALS: 872 100.0% 100.0%
BEST COPY AVAILABLE
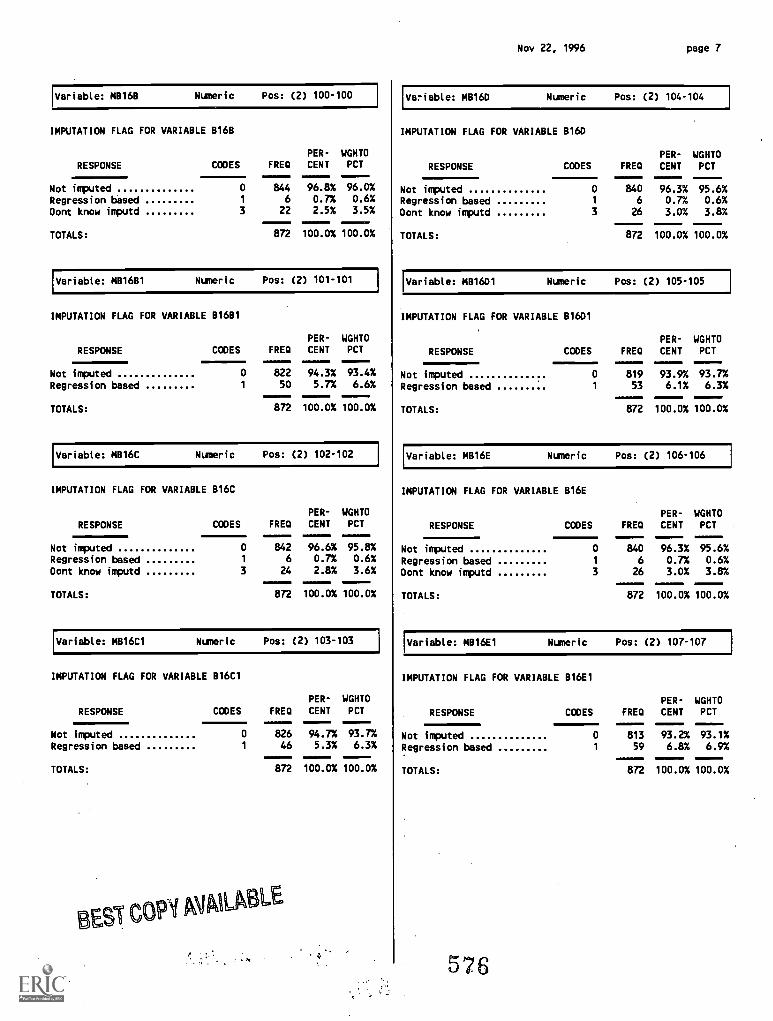
Variable: MB16B Nuneric Pos: (2) 100-100
IMPUTATION FLAG FOR VARIABLE 8168
RESPONSE CODES FREQPER- WGHTDCENT PCT
Not imputed 0 844 96.8% 96.0%Regression based 1 6 0.7% 0.6%
Dont know imputd 3 22 2.5% 3.5%
TOTALS: 872-----
100.0% 100.0%
!Variable: M81681 Nuneric Pos: (2) 101-101
IMPUTATION FLAG FOR VARIABLE 81681
PER- WGHTD
RESPONSE CODES FREQ CENT PCT
Not imputed 0 822 94.3% 93.4%
Regression based 1 50 5.7% 6.6%
TOTALS: 872 100.0% 100.0%
Variable: MB16C Nuneric Pos: (2) 102-102
IMPUTATION FLAG FOR VARIABLE B16C
RESPONSE CODES FREQ
PER-
CENT
WGHTDPCT
Not imputed 0 842 96.6% 95.8%
Regression based 1 6 0.7% 0.6%
Dont know imputd 3 24 2.8% 3.6%
TOTALS: 872 100.0% 100.0%
Variable: MB16C1 Nuneric Pos: (2) 103-103
IMPUTATION FLAG FOR VARIABLE 816C1
PER- WGHTD
RESPONSE CODES FRED CENT PCT
Not imputed 0 826 94.7% 93.7%
Regression based 1 46 5.3% 6.3%
TOTALS: 872 100.0% 100.0%
\BEST CO PI AVAILABLE
Nov 22, 1996 page 7
Variable: MB16D Nuneric Pos: (2) 104-104
IMPUTATION FLAG FOR VARIABLE 8160
RESPONSE CODES FRED
PER-
CENT
WGHTDPCT
Not imputed
--------
0 840 96.3% 95.6%Regression based 1 6 0.7% 0.6%Dont know imputd 3 26 3.0% 3.8%
TOTALS:-----
872 100.0% 100.0%
Variable: M81601 Nuneric Pos: (2) 105-105
IMPUTATION FLAG FOR VARIABLE B1601
RESPONSE
PER- WGHTDCODES FRED CENT PCT
Not imputed 0 819 93.9% 93.7%Regression based 1 53 6.1% 6.3%
TOTALS: 872 100.0% 100.0%
Variable: MB16E Nuneric Pos: (2) 106-106
IMPUTATION FLAG FOR VARIABLE 816E
RESPONSE CODES FRED
PER- WGHTDCENT PCT
Not imputed 0 840 96.3% 95.6%
Regression based 1 6 0.7% 0.6%
Dont know imputd 3 26 3.0% 3.8%
TOTALS: 872 100.0% 100.0%
Variable: MB16E1 Nuneric Pos: (2) 107-107
IMPUTATION FLAG FOR VARIABLE 816E1
RESPONSE
PER- WGHTDCODES FRED CENT PCT
Not imputed 0 813 93.2% 93.1%Regression based 1 59 6.8% 6.9%
TOTALS: 872 100.0% 100.0%
5.6
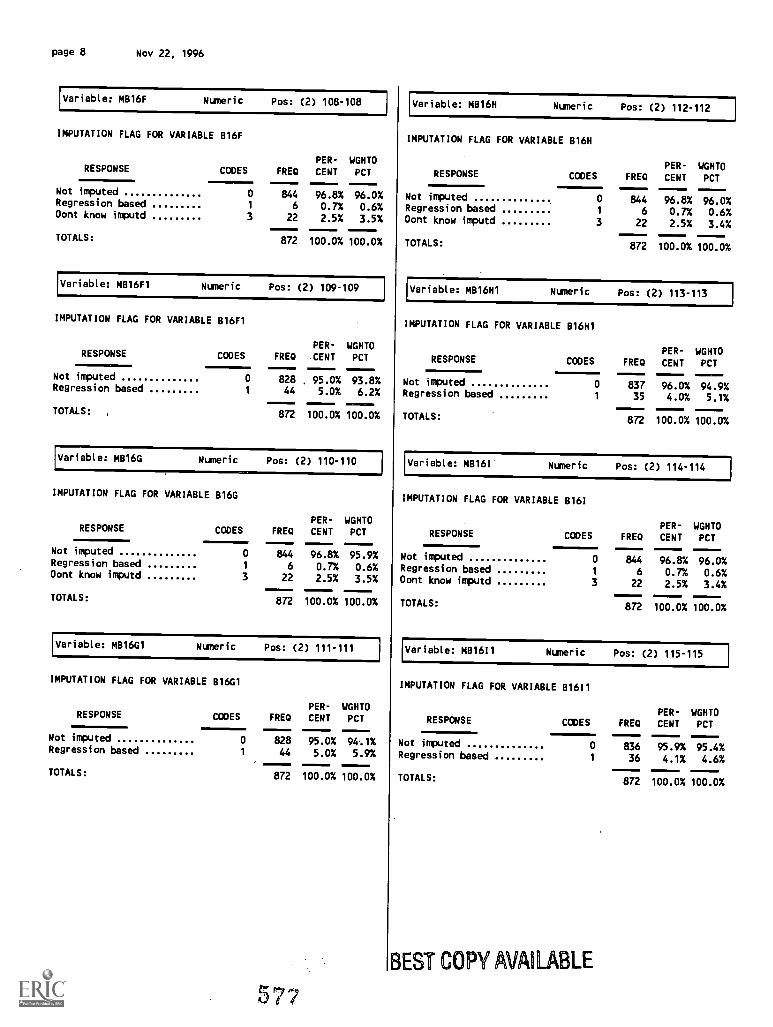
page 8 Nov 22, 1996
Variable: MB16F Numeric Pos: (2) 108-108
IMPUTATION FLAG FOR VARIABLE 816F
RESPONSE CODES FREDPER-
CENTWGHTDPCT
Not imputed 0 844 96.8% 96.0%Regression based 1 6 0.7% 0.6%Dont know imputd 3 22 2.5% 3.5%
TOTALS: 872 100.0% 100.0%
Variable: MB16F1 Numeric Pos: (2) 109-109
IMPUTATION FLAG FOR VARIABLE 11116F1
RESPONSE CODESPER- WGHTD
FRED CENT PCT
Not imputed 0 828 95.0% 93.8%Regression based 1 44 5.0% 6.2%
TOTALS:, 872 100.0% 100.0%
Variable: M8166 Numeric Pos: (2) 110-110
IMPUTATION FLAG FOR VARIABLE 816G
RESPONSE CODES FREDPER-CENT
WGHTDPCT
Not imputed 0 844 96.8% 95.9%Regression based 1 6 0.7% 0.6%Dont know imputd 3 22 2.5% 3.5%
TOTALS: 872 100.0% 100.0%
Variable: MB16G1 Numeric Pos: (2) 111-111
IMPUTATION FLAG FOR VARIABLE 816G1
PER- WGHTDRESPONSE CODES FRED CENT PCT
Not imputed 0 828 95.0% 94.1%Regression based 1 44 5.0% 5.9%
TOTALS: 872 100.0% 100.0%
5
Variable: MB16H Numeric Pos: (2) 112-112
IMPUTATION FLAG FOR VARIABLE 816H
RESPONSE CODES FREDPER-CENT
WGHTDPCT
Not imputed 0 844 96.8% 96.0%Regression based 1 6 0.7% 0.6%Dont know imputd 3 22 2.5% 3.4%
TOTALS: 872 100.0%
IMMI:121
100.0%
Variable: MB16H1 Numeric Pos: (2) 113-113
IMPUTATION FLAG FOR VARIABLE 816H1
RESPONSEPER- WGHTD
CODES FRED CENT PCT
Not imputed 0 837 96.0% 94.9%Regression based 1 35 4.0% 5.1%
TOTALS: 872 100.0% 100.0%
Variable: MB16I Numeric Pos: (2) 114-114
IMPUTATION FLAG FOR VARIABLE 8161
RESPONSE CODES FREDPER-CENT
WGHTDPCT
Not imputed 0 844 96.8% 96.0%Regression based 1 6 0.7% 0.6%Dont know imputd 3 22 2.5% 3.4%
TOTALS: 872 100.0%
1100.0%
Variable: M81611 Numeric Pos: (2) 115-115
IMPUTATION FLAG FOR VARIABLE 81611
RESPONSEPER- WGHTD
CODES FRED CENT PCT
Not imputed 0 836 95.9% 95.4%Regression based 1 36 4.1% 4.6%
TOTALS: 872 100.0% 100.0%
BEST COPY AVAILABLE
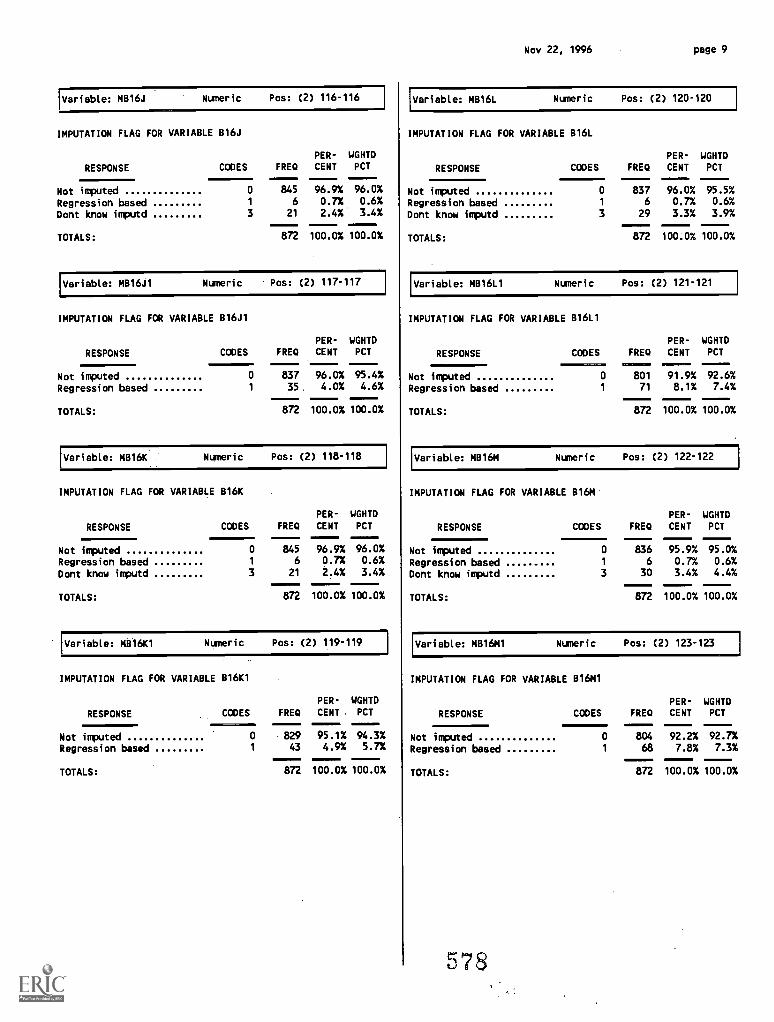
Variable: MB16J Numeric Pos: (2) 116-116
IMPUTATION FLAG FOR VARIABLE B16J
RESPONSE CODES FREQPER-CENT
WGHTDPCT
Not imputed 0 845 96.9% 96.0%
Regression based 1 6 0.7% 0.6%
Dont know imputd 3 21 2.4% 3.4%
TOTALS: 872 100.0% 100.0%
Variable: MB16J1 Numeric Pos: (2) 117-117
IMPUTATION FLAG FOR VARIABLE 816J1
RESPONSE
PER- WGHTD
CODES FREQ CENT PCT
Not imputed 0 837 96.0% 95.4%
Regression based 1 35, 4.0% 4.6%
TOTALS: 872 100.0% 100.0%
Variable: MB16K Numeric Pos: (2) 118-118
IMPUTATION FLAG FOR VARIABLE 1316K
RESPONSE CODES FRED
PER-
CENT
WGHTDPCT
Not imputed 0 845 96.9% 96.0%
Regression based 1 6 0.7% 0.6%
Dont know imputd 3 21 2.4% 3.4%
TOTALS: 872 100.0% 100.0%
Variable: MO6K1 Numeric Pos: (2) 119-119
IMPUTATION FLAG FOR VARIABLE 816K1
RESPONSE
PER- WGHTD
CODES FRED CENT . PCT
Not imputed 0 829 95.1% 94.3%
Regression based 1 43 4.9% 5.7%
TOTALS: 872 100.0% 100.0%
Nov 22, 1996 page 9
Variable: MB16L Numeric Pos: (2) 120-120
IMPUTATION FLAG FOR VARIABLE 816L
RESPONSE CODES FREQPER-
CENT
WGHTDPCT
Not imputed 0 837 96.0% 95.5%
Regression based 1 6 0.7% 0.6%
Dont know imputd 3 29 3.3% 3.9%
TOTALS: 872 100.0% 100.0%
Variable: MB16L1 Numeric Pos: (2) 121-121
IMPUTATION FLAG FOR VARIABLE 8161.1
RESPONSE
PER- WGHTD
CODES FRED CENT PCT2,1:17.1.11111 21:17/ii iliMIIMMINg =ISOM:C.a.
Not imputed 0 801 91.9% 92.6%
Regression based 1 71 8.1% 7.4%
TOTALS: 872 100.0% 100.0%
Variable: MB16M Numeric Pos: (2) 122-122
IMPUTATION FLAG FOR VARIABLE 816M
RESPONSE CODES FREDPER-CENT
WGHTDPCT
1MI11.011Not imputed 0 836 95.9% 95.0%
Regression based 1 6 0.7% 0.6%
Dont know imputd 3 30 3.4% 4.4%
TOTALS: 872 100.0% 100.0%
Variable: MB16M1 Numeric Pos: (2) 123-123
IMPUTATION FLAG FOR VARIABLE 816M1
RESPONSE
PER- WGHTD
CODES FRED CENT PCT
Not imputed 0 804 92.2% 92.7%
Regression based 1 68 7.8% 7.3%
TOTALS: 872 100.0% 100.0%
578
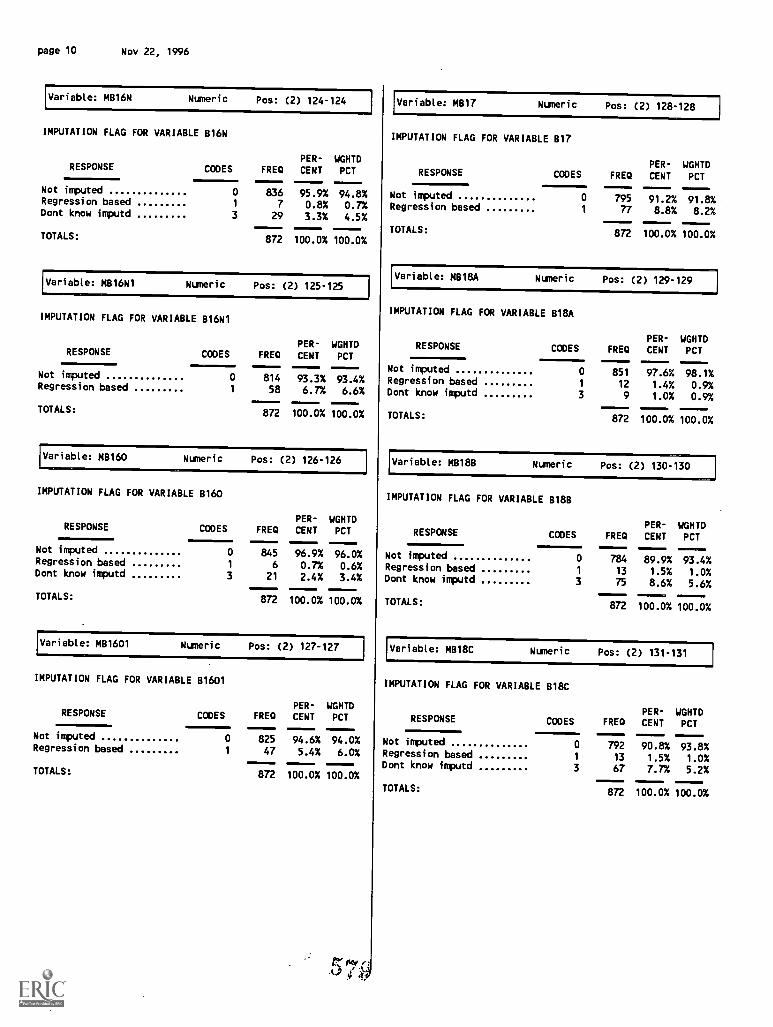
page 10 Nov 22, 1996
Variable: MB16N Numeric Pos: (2) 124-124
IMPUTATION FLAG FOR VARIABLE B16N
RESPONSE CODES FREDPER-
CENTWGHTDPCT
Not imputed 0 836 95.9% 94.8%Regression based 1 7 0.8% 0.7%Dont know imputd 3 29 3.3% 4.5%
TOTALS: 872 100.0% 100.0%
Variable: MB16N1 Numeric Pos: (2) 125-125
IMPUTATION FLAG FOR VARIABLE 816N1
PER- WGHTDRESPONSE CODES FREQ CENT PCT
Not imputed 0 814 93.3% 93.4%Regression based 1 58 6.7% 6.6%
TOTALS: 872 100.0% 100.0%
Variable: MB160 Numeric Pos: (2) 126-126
IMPUTATION FLAG FOR VARIABLE 8160
RESPONSE CODES FREQPER-
CENTWGHTDPCT
Not imputed 0 845 96.9% 96.0%Regression based 1 6 0.7% 0.6%Dont know imputd 3 21 2.4% 3.4%
TOTALS: 872 100.0% 100.0%
Variable: MB1601 Numeric Pos: (2) 127-127
IMPUTATION FLAG FOR VARIABLE 81601
RESPONSEPER- WGHTD
CODES FREQ CENT PCT
Not imputed 0 825 94.6% 94.0%Regression based 1 47 5.4% 6.0%
TOTALS: 872 100.0% 100.0%
Variable: M817 Numeric Pos: (2) 128-128
IMPUTATION FLAG FOR VARIABLE 817
RESPONSEPER- WGHTD
CODES FRED CENT PCT
Not imputed 0 795 91.2% 91.8%Regression based 1 77 8.8% 8.2%
TOTALS: 872 100.0% 100.0%
Variable: M818A Numeric Pos: (2) 129-129
IMPUTATION FLAG FOR VARIABLE 818A
RESPONSE CODES FREQPER-
CENTWGHTDPCT
Not imputed 0 851 97.6% 98.1%Regression based 1 12 1.4% 0.9%Dont know imputd 3 9 1.0% 0.9%
TOTALS: 872 100.0% 100.0%
Variable: M8188 Numeric Pos: (2) 130-130
IMPUTATION FLAG FOR VARIABLE B188
RESPONSE CODES FREQPER-CENT
WGHTDPCT
Not imputed 0 784 89.9% 93.4%Regression based 1 13 1.5% 1.0%Dont know imputd 3 75 8.6% 5.6%
TOTALS: 872
Siff100.0%
111111=11.
100.0%
Variable: MB18C Numeric Pos: (2) 131-131
IMPUTATION FLAG FOR VARIABLE 818C
RESPONSE CODES FREDPER-CENT
WGHTDPCT
Not imputed 0 792 90.8% 93.8%Regression based 1 13 1.5% 1.0%Dont know imputd 3 67 7.7% 5.2%
TOTALS: 872 100.0% 100.0%
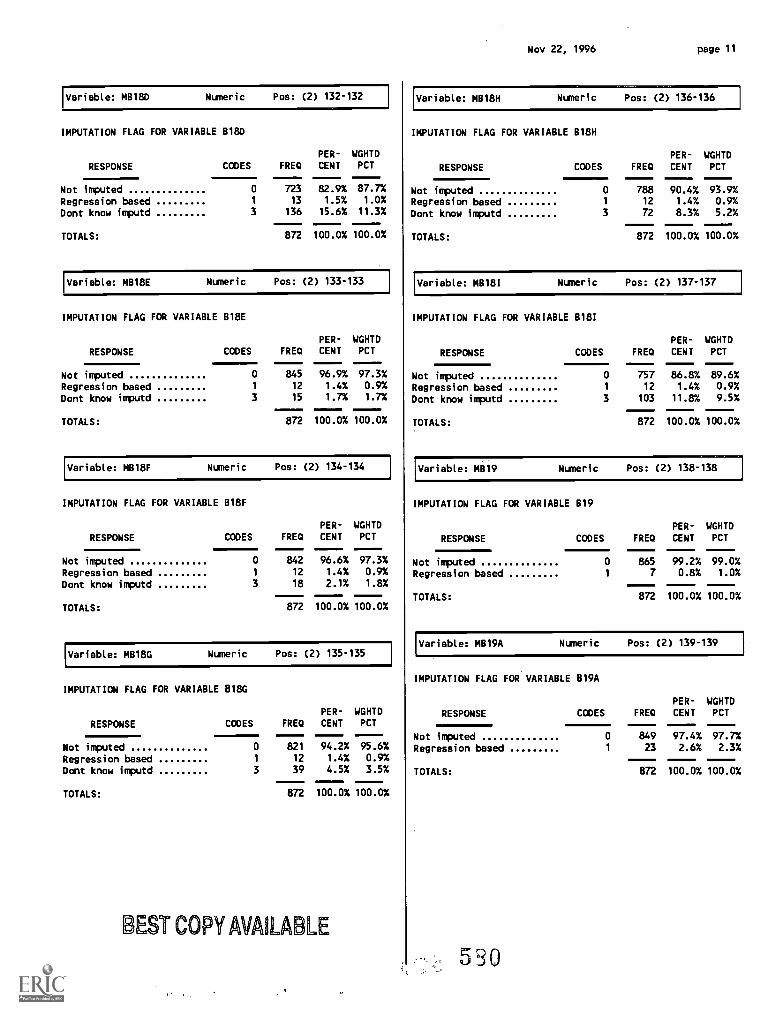
Variable: M8180 Numeric Pos: (2) 132-132
IMPUTATION FLAG FOR VARIABLE B180
RESPONSE CODES FREQPER-CENT
WGHTDPCT
Not imputed 0 723 82.9% 87.7%
Regression based 1 13 1.5% 1.0%
Dont know imputd 3 136 15.6% 11.3%
TOTALS: 872 100.0% 100.0%
Variable: MB18E Numeric Pos: (2) 133-133
IMPUTATION FLAG FOR VARIABLE B18E
RESPONSE CODES FREQPER-CENT
WGHTDPCT
Not imputed 0 845
.m...
96.9% 97.3%
Regression based 1 12 1.4% 0.9%
Dont know imputd 3 15 1.7% 1.7%
TOTALS: 872 100.0% 100.0%
Variable: MB18F Numeric Pos: (2) 134-134
IMPUTATION FLAG FOR VARIABLE 818F
RESPONSE CODES FREQPER-CENT
WGHTDPCT
Not imputed 0 842 96.6% 97.3%
Regression based 1 12 1.4% 0.9%
Dont know inputd 3 18 2.1% 1.8%
TOTALS: 872 100.0% 100.0%
Variable: MB18G Numeric Pos: (2) 135-135
IMPUTATION FLAG FOR VARIABLE 818G
RESPONSE CODES FREQPER-CENT
WGHTDPCT
Not imputed 0 821 94.2% 95.6%
Regression based 1 12 1.4% 0.9%
Dont know inputd 3 39 4.5% 3.5%
TOTALS: 872 100.0% 100.0%
BEST COPY AVAILABLE
Nov 22, 1996 page 11
Variable: MB18H Numeric Pos: (2) 136-136
IMPUTATION FLAG FOR VARIABLE 818H
RESPONSE CODES FREQ
PER-
CENTWGHTDPCT
Not imputed 0 788 90.4% 93.9%Regression based 1 12 1.4% 0.9%
Dont know imputd 3 72 8.3% 5.2%
TOTALS: 872 100.0% 100.0%
Variable: MB18I Numeric Pos: (2) 137-137
IMPUTATION FLAG FOR VARIABLE B18I
RESPONSE CODES FREQ
PER-
CENT
WGHTDPCT
Not imputed 0 757 86.8% 89.6%Regression based 1 12 1.4% 0.9%
Dont know inputd 3 103 11.8% 9.5%=872 100.0% 100.0%TOTALS:
Variable: MB19 Numeric Pos: (2) 138-138
IMPUTATION FLAG FOR VARIABLE 819
RESPONSE
PER- WGHTD
CODES FREQ CENT PCT
Not imputed 0 865 99.2% 99.0%
Regression based 1 7 0.8% 1.0%
TOTALS: 872 100.0% 100.0%
Variable: MB19A Numeric Pos: (2) 139-139
IMPUTATION FLAG FOR VARIABLE 819A
RESPONSE
PER- WGHTDCODES FREQ CENT PCT
Not imputed 0 849 97.4% 97.7%Regression based 1 23 2.6% 2.3%
TOTALS: 872 100.0% 100.0%
5'30
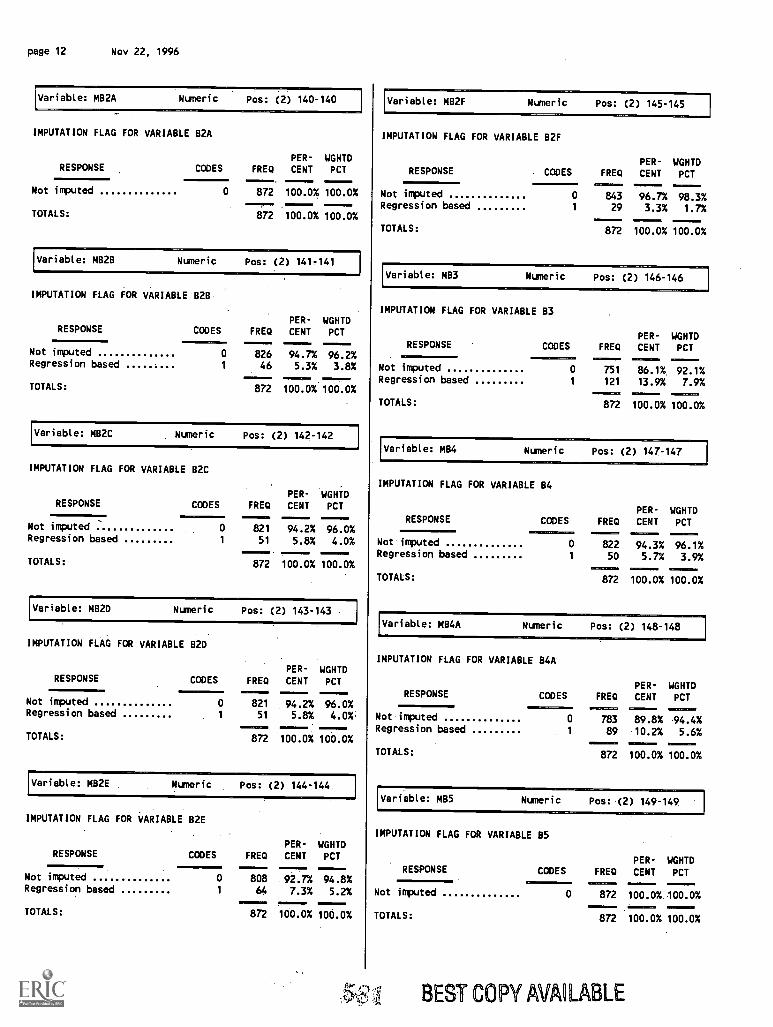
page 12 Nov 22, 1996
Variable: MB2A Numeric Pos: (2) 140-140
IMPUTATION FLAG FOR VARIABLE B2A
RESPONSEPER- WGHTD
CODES FREQ CENT PCT-------
Not imputed 0 872 100.0% 100.0%
TOTALS: 872 100.0% 100.0%
Variable: MB28 Numeric Pos: (2) 141 -141
IMPUTATION FLAG FOR VARIABLE B2B
RESPONSE
Not imputedRegression based
TOTALS:
PER- WGHTDCODES FRS) CENT PCT
1Eli.IMPB .1111MM
0 826 94.7% 96.2%1 46 5.3% 3.8%110
872 100.0% 100.0%
Variable: MB2C Numeric Pos: (2) 142-142
IMPUTATION FLAG FOR VARIABLE B2C
RESPONSEPER- WGHTD
CODES FREQ CENT PCT
Not imputed 0 821 94.2% 96.0%Regression based 1 51 5.8% 4.0%
TOTALS: 872 100.0% 100.0%
Variable: MB2D Numeric Pos: (2) 143-143
IMPUTATION FLAG FOR VARIABLE B2D
RESPONSE=0=1:11=
PER- WGHTDCODES FREQ CENT PCT
Not imputed 0 821 94.2% ,96.0%Regression based 1 51 5.8% 4.0%
TOTALS: 872 100.0% 100.0%
Variable: MB2E Numeric Pos: (2) 144 -144.
IMPUTATION FLAG FOR VARIABLE B2E
RESPONSEPER- WGHTD
CODES FREQ CENT PCT.........
Not imputed 0 808' 92.7% 94.8%Regression based 1 64 7.3% 5.2%
872 100.0% 100.0%TOTALS:
Variable: MB2F Numeric Pos: (2) 145-145
IMPUTATION FLAG FOR VARIABLE B2F
RESPONSEPER- WGHTD
CODES FRED CENT PCT
Not imputed 0 843 96.7% 98.3%Regression based 1 29 3.3% 1.7%
TOTALS: 872
MINE=MV
100.0% 100.0%
Variable: MB3 Numeric Pos: (2) 146-146
IMPUTATION FLAG FOR VARIABLE 83
RESPONSEPER- WGHTD
CODES FRED CENT PCT
Not imputed 0 751 86.1%. 92.1%Regression based 1 121 13.9% 7.9%
TOTALS:131117211
872
C.IMELGCB
100.0% 100.0%
Variable: MB4 Numeric Pos: (2) 147-147
IMPUTATION FLAG FOR VARIABLE B4
RESPONSEPER- WGHTD
CODES FREQ CENT PCT111111111. SI0MICEM 01. 0 0
Not imputed 0 822 94.3% 96.1%Regression based 1 50 5.7% 3.9%
TOTALS: 872 100.0% 100.0%
Variable: MB4A Numeric Pos: (2) 148-148
IMPUTATION FLAG FOR VARIABLE B4A
RESPONSEPER- WGHTD
CODES FRED CENT PCT
Not imputed 0 783 89.8% 94.4%Regression based 1 89 10.2% 5.6%
TOTALS: 872 100.0% 100.0%
Variable: MI15 Numeric Pos: (2) 149-149
IMPUTATION FLAG FOR VARIABLE 85
PER- WGHTDRESPONSE CODES FRED CENT PCT
Not imputed 0 872 100.0 %.100.0%
TOTALS:eseelav mmosmsca sion
872 100.0% 100.0%
ZA,S1 BEST COPY AVAILABLE
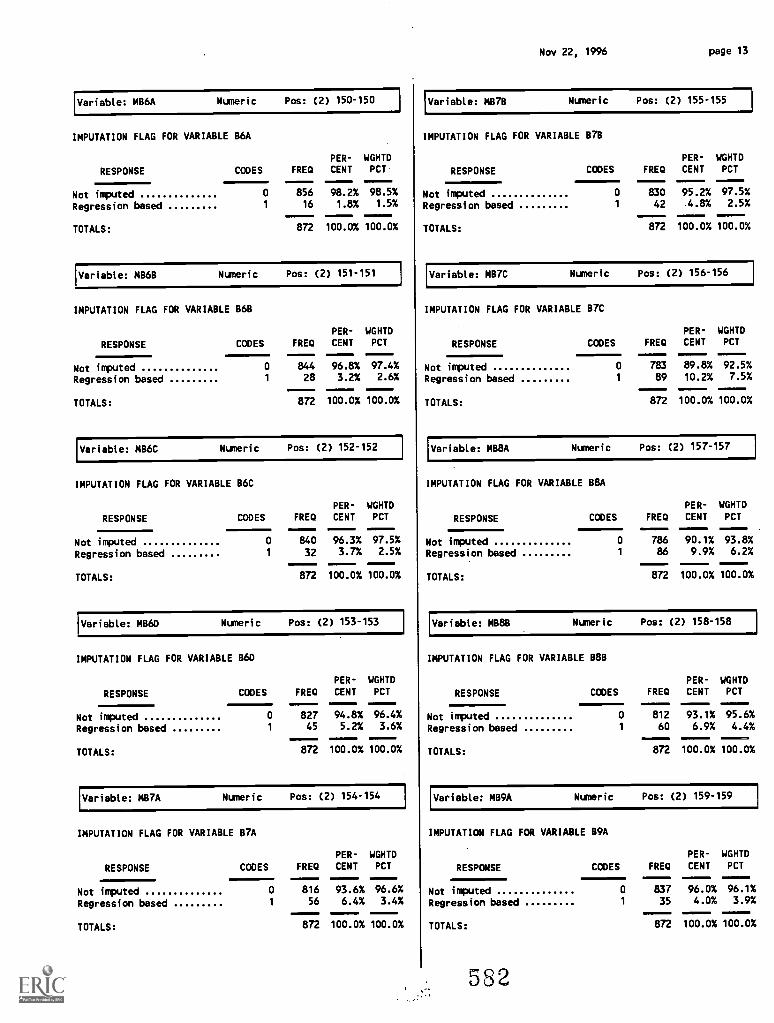
Variable: MB6A Numeric Pos: (2) 150-150
IMPUTATION FLAG FOR VARIABLE B6A
RESPONSE
PER- WGHTD
CODES FREQ CENT PCT
Not imputed 0 856 98.2% 98.5%
Regression based 1 16 1.8% 1.5%
TOTALS: 872 100.0% 100.0%
Variable: MB6B Numeric Pos: (2) 151-151
IMPUTATION FLAG FOR VARIABLE B6B
RESPONSE
PER- WGHTD
CODES FREQ CENT PCT
Not imputed 0 844 96.8% 97.4%
Regression based 1 28 3.2% 2.6%
TOTALS: 872 100.0% 100.0%
Variable: MB6C Numeric Pos: (2) 152-152
IMPUTATION FLAG FOR VARIABLE B6C
RESPONSE
PER- WGHTD
CODES FREQ CENT PCT
Not imputed 0 840 96.3% 97.5%
Regression based 1 32 3.7% 2.5%
TOTALS: 872 100.0% 100.0%
Variable: MB6D Numeric Pos: (2) 153-153
IMPUTATION FLAG FOR VARIABLE B60
RESPONSE
PER- WGHTD
CODES FREQ CENT PCT
Not imputed 0 827 94.8% 96.4%
Regression based 1 45 5.2% 3.6%
TOTALS: 872 100.0% 100.0%
Variable: MB7A Numeric Pos: (2) 154-154
IMPUTATION FLAG FOR VARIABLE B7A
RESPONSE
PER- WGHTD
CODES FRS) CENT PCT
Not imputed 0 816 93.6% 96.6%
Regression based 1 56 6.4% 3.4%
TOTALS: 872 100.0% 100.0%
Nov 22, 1996 page 13
Variable: MB7B Numeric Pos: (2) 155-155
IMPUTATION FLAG FOR VARIABLE 878
RESPONSE
PER- WGHTD
CODES FRED CENT PCT
Not imputed 0 830 95.2% 97.5%
Regression based 1 42 4.8% 2.5%
TOTALS: 872 100.0% 100.0%
Variable: MB7C Numeric Pos: (2) 156-156
IMPUTATION FLAG FOR VARIABLE B7C
RESPONSE
PER- WGHTD
CODES FREQ CENT PCT
Not imputed 0 783 89.8% 92.5%
Regression based 1 89 10.2% 7.5%
TOTALS: 872 100.0% 100.0%
Variable: MB8A Numeric Pos: (2) 157-157
IMPUTATION FLAG FOR VARIABLE B8A
RESPONSE
PER- WGHTD
CODES FREQ CENT PCT
Not imputed 0 786 90.1% 93.8%
Regression based 1 86 9.9% 6.2%
TOTALS: 872 100.0% 100.0%
Variable: MB8B Numeric Pos: (2) 158-158
IMPUTATION FLAG FOR VARIABLE B8B
RESPONSE
PER- WGHTD
CODES FREQ CENT PCT
Not imputed 0 812 93.1% 95.6%
Regression based 1 60 6.9% 4.4%
TOTALS: 872 100.0% 100.0%
Variable: MB9A Numeric Pos: (2) 159-159
IMPUTATION FLAG FOR VARIABLE B9A
RESPONSE
PER- WGHTD
CODES FREQ CENT PCT
Not imputed 0 837 96.0% 96.1%
Regression based 1 35 4.0% 3.9%
TOTALS: 872 100.0% 100.0%
582
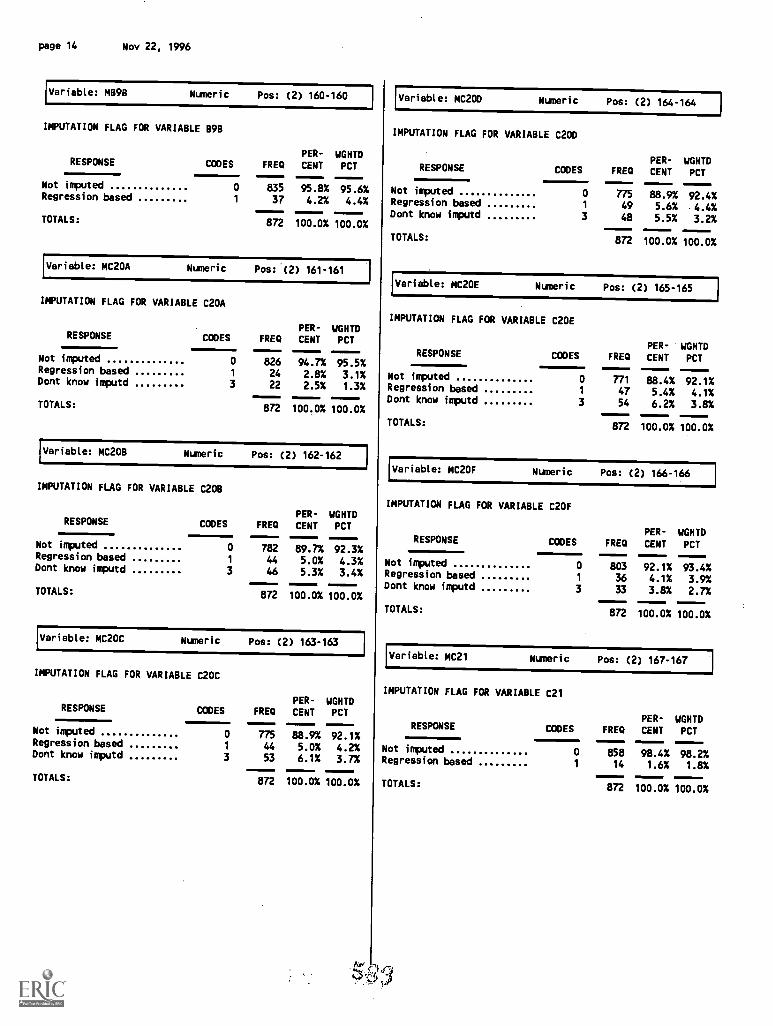
page 14 Nov 22, 1996
Variable: MB9B Numeric Pos: (2) 160-160
IMPUTATION FLAG FOR VARIABLE B9B
PER- WGHTDRESPONSE CODES FREQ CENT PCT
Not imputed 0 835 95.8% 95.6%Regression based 1 37 4.2% 4.4%
TOTALS: 872 100.0% 100.0%
Variable: MC20A Numeric Pos: (2) 161-161
IMPUTATION FLAG FOR VARIABLE C20A
RESPONSE CODES FREQPER-CENT
WGHTDPCT
Not imputed 0 826 94.7% 95.5%Regression based 1 24 2.8% 3.1%Dont know imputd 3 22 2.5% 1.3%
TOTALS: 872 100.0% 100.0%
Variable: MC208 Numeric Pos: (2) 162-162
IMPUTATION FLAG FOR VARIABLE C2OB
RESPONSE CODES FREQPER-CENT
WGHTDPCT
Not imputed 0 782 89.7% 92.3%Regression based 1 44 5.0% 4.3%Dont know imputd 3 46 5.3% 3.4%
TOTALS: 872 100.0% 100.0%
Variable: MC20C Numeric Pos: (2) 163-163
IMPUTATION FLAG FOR VARIABLE C20C
RESPONSE CODES FREQPER-CENT
WGHTDPCT
Not imputed 0 775 88.9% 92.1%Regression based 1 44 5.0% 4.2%Dont know imputd 3 53 6.1% 3.7%
TOTALS: 872 100.0% 100.0%
Variable: MC20D Numeric Pos: (2) 164-164
IMPUTATION FLAG FOR VARIABLE C200
RESPONSE CODES FREQPER-
CENTWGHTDPCT
Not imputed 0 775 88.9% 92.4%Regression based 1 49 5.6% 4.4%Dont know imputd 3 48 5.5% 3.2%
TOTALS: 872 100.0% 100.0%
Variable: MC20E Numeric Pos: (2) 165-165
IMPUTATION FLAG FOR VARIABLE C20E
RESPONSE CODES FREQPER-CENT
WGHTDPCT
Not imputed 0 771 88.4% 92.1%Regression based 1 47 5.4% 4.1%Dont know imputd 3 54 6.2% 3.8%
TOTALS: 872 100.0% 100.0%
Variable: MC2OF Numeric Pos: (2) 166-166
IMPUTATION FLAG FOR VARIABLE C20F
RESPONSE CODES FREQPER-
CENTWGHTDPCT
Not imputed 0 803 92.1% 93.4%Regression based 1 36 4.1% 3.9%Dont know imputd 3 33 3.8% 2.7%
TOTALS: 872 100.0% 100.0%
Variable: MC21 Numeric Pos: (2) 167-167
IMPUTATION FLAG FOR VARIABLE C21
RESPONSEPER- WGHTD
CODES FREQ CENT PCT
Not imputed 0 858 98.4% 98.2%Regression based 1 14 1.6% 1.8%
TOTALS: 872 100.0% 100.0%
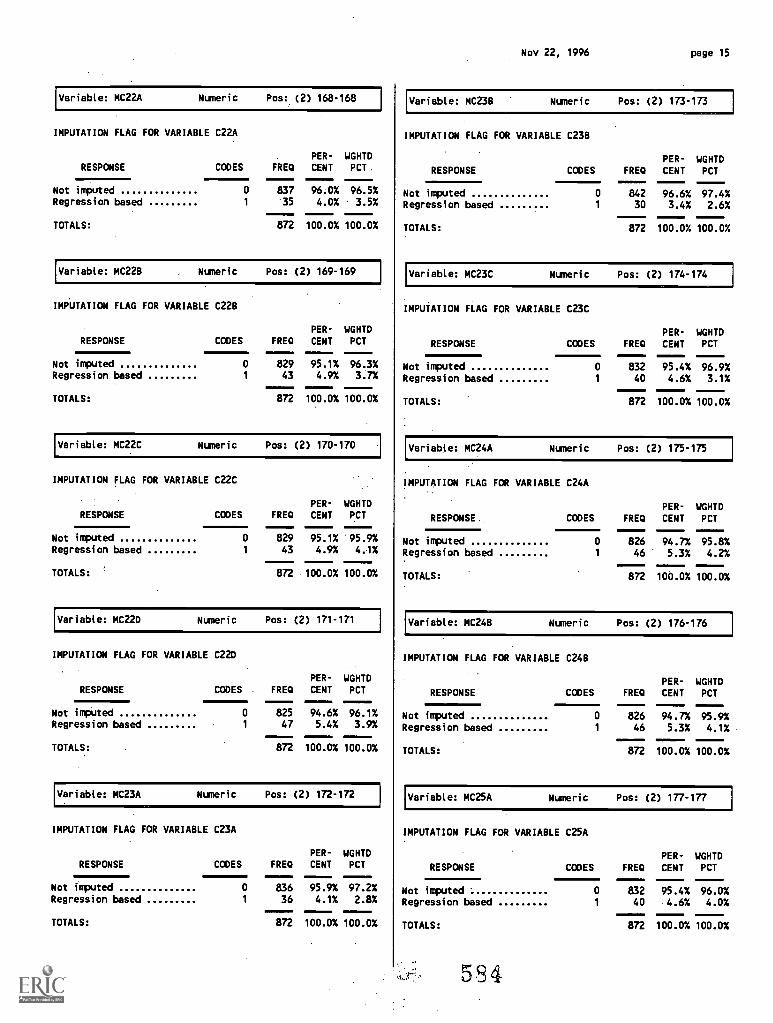
Variable: MC22A Numeric Pos: (2) 168-168
IMPUTATION FLAG FOR VARIABLE C22A
RESPONSE11 PER- WGHTDCODES FREQ CENT PCT.
Not imputed 0 837 96.0% 96.5%Regression based 1 35 4.0% 3.5%
TOTALS: 872 100.0% 100.0%
Variable: MC22B Numeric Pos: (2) 169-169
IMPUTATION FLAG FOR VARIABLE C22B
RESPONSEPER- WGHTD
CODES FRED CENT PCT
Not imputed 0 829 95.1% 96.3%Regression based 1 43 4.9% 3.7%
TOTALS: 872 100.0% 100.0%
Variable: MC22C Numeric Pos: (2) 170-170
IMPUTATION FLAG FOR VARIABLE C22C
RESPONSEPER- WGHTD
CODES FREQ CENT PCT
Not imputed 0 829 95.1% '95.9%Regression based 1 43 4.9% 4.1%
TOTALS: 872 100.0% 100.0%
Variable: MC22D Numeric Pos: (2) 171-171
IMPUTATION FLAG FOR VARIABLE C220
RESPONSEPER- WGHTD
CODES . FRED CENT PCT
Not imputed 0 825 94.6% 96.1%Regression based 1 47 5.4% 3.9%
TOTALS: 872 100.0% 100.0%
Variable: MC23A Numeric Pos: (2) 172-172
IMPUTATION FLAG FOR VARIABLE C23A
RESPONSEPER- WGHTD
CODES FREQ CENT PCT
Not imputed 0 836 95.9% 97.2%Regression based 1 36 4.1% 2.8%
TOTALS: 872 100.0% 100.0%
Nov 22, 1996 page 15
Variable: MC23B Numeric Pos: (2) 173-173
IMPUTATION FLAG FOR VARIABLE C23B
PER- WGHTDRESPONSE CODES FRED CENT PCT
Not imputed 0 842 96.6% 97.4%Regression based 1 30 3.4% 2.6%
TOTALS: 872 100.0% 100.0%
Variable: MC23C Numeric Pos: (2) 174-174
IMPUTATION FLAG FOR VARIABLE C23C
RESPONSEPER- WGHTD
CODES FRED CENT PCT
Not imputed 0 832 95.4% 96.9%Regression based 1 40 4.6% 3.1%
TOTALS: 872 100.0% 100.0%
Variable: MC24A Numeric Pos: (2) 175-175
IMPUTATION FLAG FOR VARIABLE C24A
RESPONSE.PER- WGHTD
CODES FRED CENT PCT
Not imputed 0 826 94.7% 95.8%Regression based 1 46 5.3% 4.2%
TOTALS: 872 100.0% 100.0%
Variable: MC24B Numeric Pos: (2) 176-176
IMPUTATION FLAG FOR VARIABLE C24B
RESPONSEPER- WGHTD
CODES FRED CENT PCT
Not imputed 0 826 94.7% 95.9%Regression based 1 46 5.3% 4.1%
TOTALS: 872 100.0% 100.0%
Variable: MC25A Numeric Pos: (2) 177-177
IMPUTATION FLAG FOR VARIABLE C25A
RESPONSEPER- WGHTD
CODES FRED CENT PCT
Not imputed 0 832 95.4% 96.0%Regression based 1 40 4.6% 4.0%
TOTALS: 872 100.0% 100.0%
584
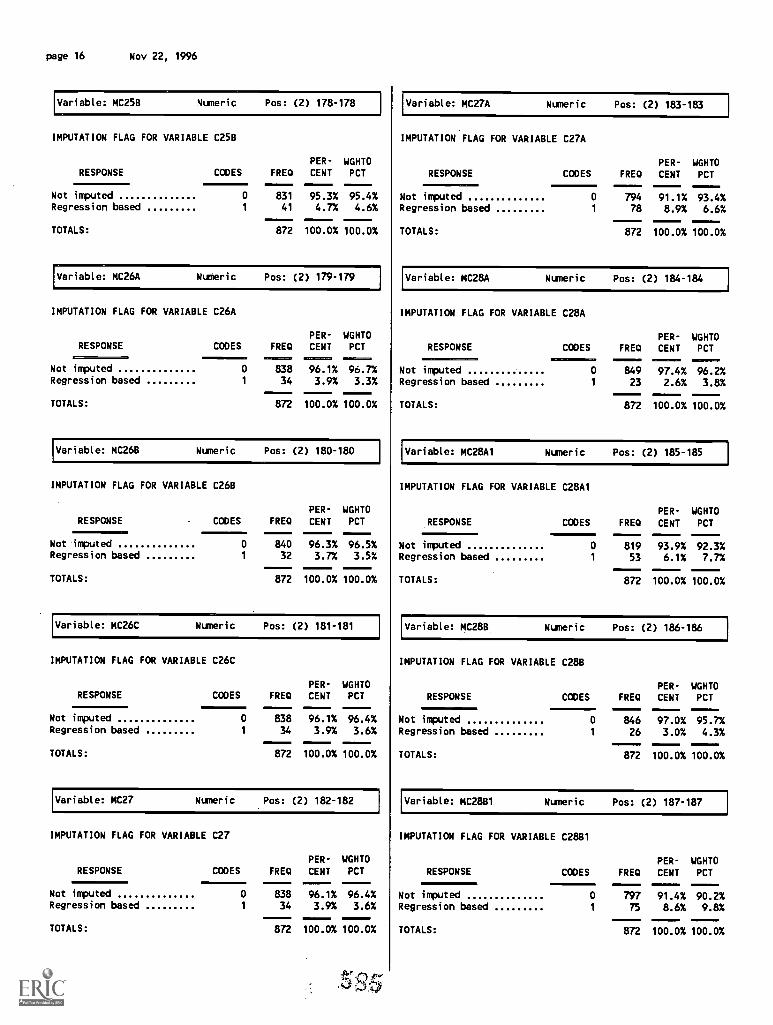
page 16 Nov 22, 1996
Variable: MC258 Numeric Pos: (2) 178-178
IMPUTATION FLAG FOR VARIABLE C25B
PER- WGHTDRESPONSE CODES FRED CENT PCT
Not imputed 0 831 95.3% 95.4%Regression based 1 41 4.7% 4.6%
TOTALS: 872 100.0% 100.0%
Variable: MC26A NuMeric Pos: (2) 179-179
IMPUTATION FLAG FOR VARIABLE C26A
RESPONSEPER- WGHTD
CODES FRED CENT PCT
Not imputed 0 838 96.1% 96.7%Regression based 1 34 3.9% 3.3%
TOTALS: 872 100.0% 100.0%
Variable: MC26B Numeric Pos: (2) 180-180
IMPUTATION FLAG FOR VARIABLE C26B
PER- WGHTDRESPONSE CODES FRED CENT PCT
Not imputed 0 840 96.3% 96.5%Regression based 1 32 3.7% 3.5%
TOTALS: 872 100.0% 100.0%
Variable: MC26C Numeric Pos: (2) 181-181
IMPUTATION FLAG FOR VARIABLE C26C
RESPONSEPER- WGHTD
CODES FRED CENT PCT
Not imputed 0 838 96.1% 96.4%Regression based 1 34 3.9% 3.6%
TOTALS: 872 100.0% 100.0%
Variable: MC27 Numeric Pos: (2) 182-182
IMPUTATION FLAG FOR VARIABLE C27
PER- WGHTDRESPONSE CODES FRED CENT PCT
Not imputed 0 838 96.1% 96.4%Regression based 1 34 3.9% 3.6%
TOTALS: 872 100.0%-----100.0%
Variable: MC27A Numeric Pos: (2) 183-183
IMPUTATION FLAG FOR VARIABLE C27A
RESPONSEPER- WGHTD
CODES FREQ CENT PCT
Not imputed 0 794 91.1% 93.4%Regression based 1 78 8.9% 6.6%
TOTALS: 872 100.0% 100.0%
Variable: MC28A Numeric Pos: (2) 184-184
IMPUTATION FLAG FOR VARIABLE C28A
RESPONSEPER- WGHTD
CODES FREQ CENT PCT=117Of INCENNIC72 MiCW,M =Ed 0
Not imputed 0 849 97.4% 96.2%Regression based 1 23 2.6% 3.8%
TOTALS: 872 100.0% 100.0%
Variable: MC28A1 Numeric Pos: (2) 185-185
IMPUTATION FLAG FOR VARIABLE C28A1
RESPONSE1,...11PER- WGHTD
CODES FREQ CENT PCT
Not imputed 0 819 93.9% 92.3%Regression based 1 53 6.1% 7.7%
TOTALS: 872 100.0% 100.0%
Variable: MC288 Numeric Pos: (2) 186-186
IMPUTATION FLAG FOR VARIABLE C288
RESPONSEPER- WGHTD
CODES FREQ CENT PCT
Not imputed 0 846 97.0% 95.7%Regression based 1 26 3.0% 4.3%
TOTALS: 872 100.0% 100.0%
Variable: MC28B1 Numeric Pos: (2) 187-187
IMPUTATION FLAG FOR VARIABLE C2881
RESPONSEPER- WGHTD
CODES FRED CENT PCT
Not imputed 0 797 91.4% 90.2%Regression based 1 75 8.6% 9.8%
TOTALS: 872 100.0% 100.0%
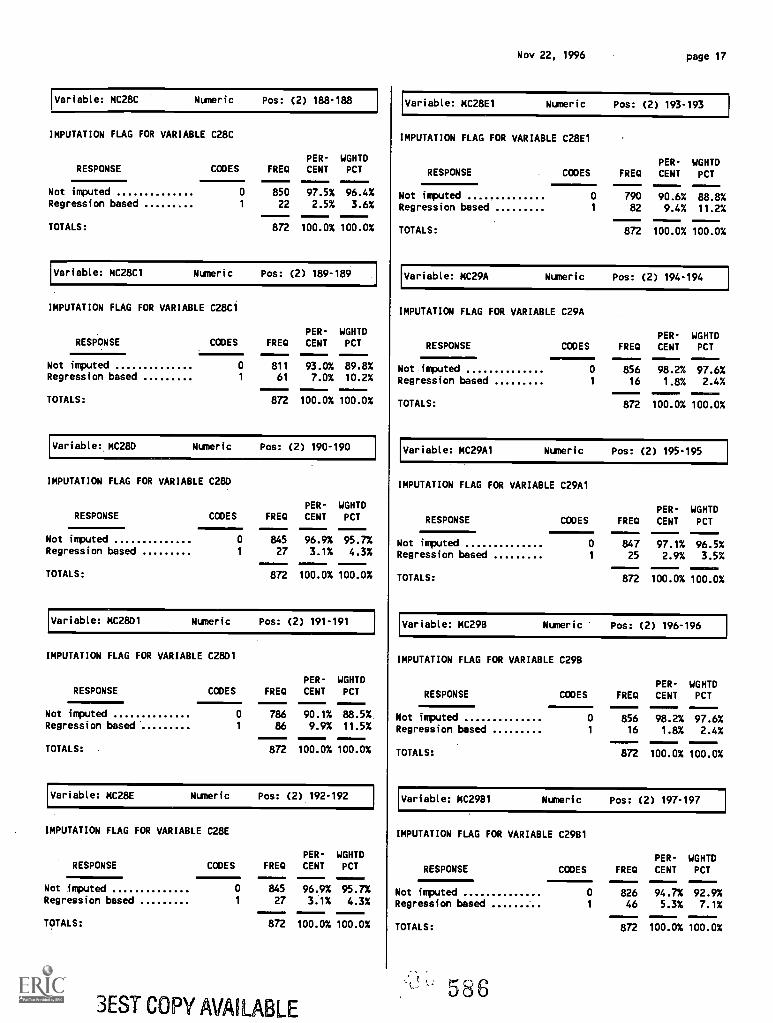
Variable: MC28C Numeric Pos: (2) 188-188
IMPUTATION FLAG FOR VARIABLE C28C
PER- WGHTDRESPONSE CODES FRED CENT PCT
Not imputed 0 850 97.5% 96.4%Regression based 1 22 2.5% 3.6%
TOTALS: 872 100.0% 100.0%
Variable: MC28C1 Numeric Pos: (2) 189 -189
IMPUTATION FLAG FOR VARIABLE C28C1
PER- WGHTDRESPONSE CODES FRED CENT PCT
Not imputed 0 811 93.0% 89.8%Regression based 1 61 7.0% 10.2%
TOTALS: 872 100.0% 100.0%
Variable: MC280 Numeric Pos: (2) 190-190
IMPUTATION FLAG FOR VARIABLE C280
RESPONSEPER- WGHTD
CODES FRED CENT PCT
Not imputed 0 845 96.9% 95.7%Regression based 1 27 3.1% 4.3%
TOTALS: 872 100.0% 100.0%
Variable: MC28D1 Numeric Pos: (2) 191-191
IMPUTATION FLAG FOR VARIABLE C2801
RESPONSEPER- WGHTD
CODES FRED CENT PCT
Not imputed 0 786 90.1% 88.5%Regression based. 1 86 9.9% 11.5%
TOTALS: 872 100.0% 100.0%
Variable: MC28E Numeric Pos: (2) 192-192
IMPUTATION FLAG FOR VARIABLE C28E
RESPONSEPER- WGHTD
CODES FRED CENT PCT
Not imputed 0 845 96.9% 95.7%Regression based 1 27 3.1% 4.3%
TOTALS: 872 100.0% 100.0%
3EST COPY AVAILABLE
Nov 22, 1996 page 17
Variable: MC28E1 Numeric Pos: (2) 193-193
IMPUTATION FLAG FOR VARIABLE C28E1
RESPONSEPER- WGHTD
CODES FRED CENT PCT
Not imputed 0 790 90.6% 88.8%Regression based 1 82 .9.4% 11.2%
TOTALS: 872 100.0% 100.0%
Variable: MC29A Numeric Pos: (2) 194-194
IMPUTATION FLAG FOR VARIABLE C29A
RESPONSEPER- WGHTD
CODES FRED CENT PCT
Not imputed 0 856 98.2% 97.6%Regression based 1 16 1.8% 2.4%
TOTALS: 872 100.0% 100.0%
Variable: MC29A1 Numeric Pos: (2) 195-195
IMPUTATION FLAG FOR VARIABLE C29A1
RESPONSEPER- WGHTD
CODES FRED CENT PCT
Not imputed 0 847 97.1% 96.5%Regression based 1 25 2.9% 3.5%
TOTALS: 872 100.0% 100.0%
Variable: MC29B Numeric Pos: (2) 196-196
IMPUTATION FLAG FOR VARIABLE C29B
RESPONSEPER- WGHTD
CODES FRED CENT PCT
Not imputed 0 856 98.2% 97.6%Regression based 1 16 1.8% 2.4%
TOTALS: 872 100.0% 100.0%
Variable: MC29B1 Numeric Pos: (2) 197-197
IMPUTATION FLAG FOR VARIABLE C2981
RESPONSEPER- WGHTD
CODES FRED CENT PCT
Not imputed 0 826 94.7% 92.9%Regression based 1 46 5.3% 7.1%
TOTALS: 872 100.0% 100.0%
86
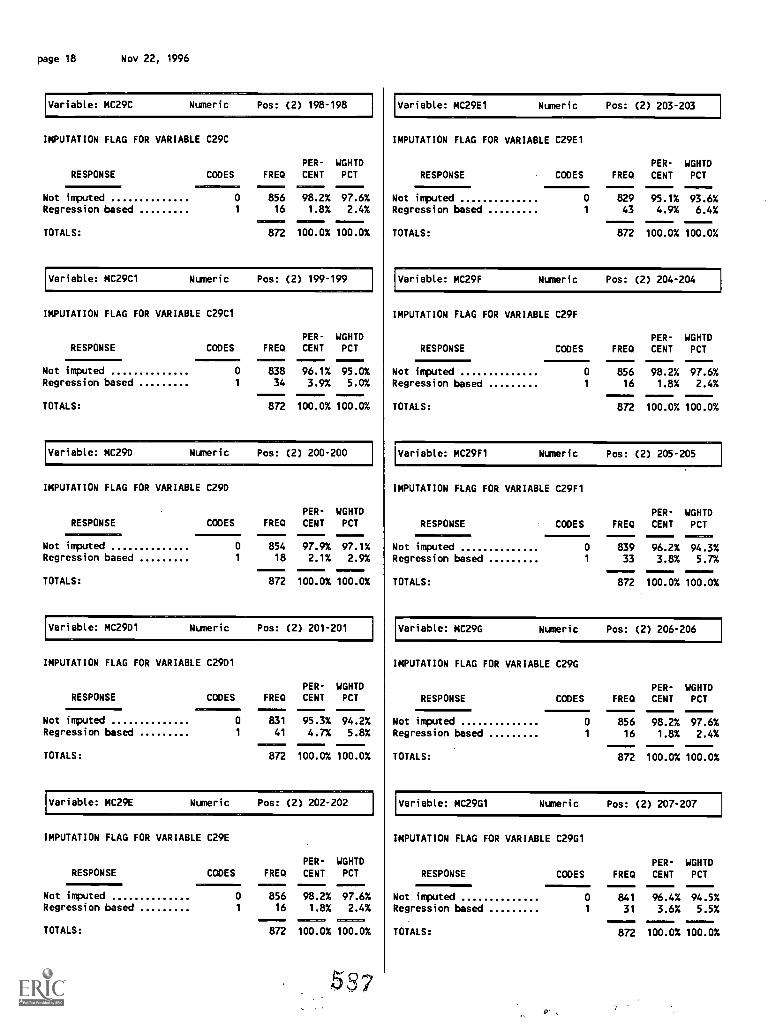
page 18 Nov 22, 1996
Variable: MC29C Numeric Pos: (2) 198-198
IMPUTATION FLAG FOR VARIABLE C29C
PER- WGHTDRESPONSE CODES FREQ CENT PCT
--------Not imputed 0
-----856
-----98.2% 97.6%
Regression based 1 16 1.8% 2.4%
TOTALS: 872-----100.0%
-----100.0%
Variable: MC29C1 Numeric Pos: (2) 199-199
IMPUTATION FLAG FOR VARIABLE C29C1
PER- WGHTDRESPONSE CODES FREQ CENT PCT
--------Not imputed 0 838
-----96.1%
-----95.0%
Regression based 1 34 3.9% 5.0%
TOTALS:
11=1=:1
872
111=MM
100.0% 100.0%
Variable: MC29D Numeric Pos: (2) 200-200
IMPUTATION FLAG FOR VARIABLE C290
PER- WGHTDRESPONSE CODES FREQ CENT PCT
--------
Not imputed 0 854 97.9% 97.1%Regression based 1 18 2.1% 2.9%
TOTALS: 872 100.0% 100.0%
Variable: MC2901 Numeric Pos: (2) 201-201
IMPUTATION FLAG FOR VARIABLE C2901
RESPONSEPER- WGHTD
CODES FREQ CENT PCT--------
Not imputed 0 831 95.3% 94.2%Regression based 1 41 4.7% 5.8%
TOTALS: 872 100.0% 100.0%
Variable: MC29E Numeric Pos: (2) 202-202
IMPUTATION FLAG FOR VARIABLE C29E
PER- WGHTDRESPONSE CODES FREQ CENT PCT
--------Not imputed 0 856
-----98.2%
-----97.6%
Regression based 1 16 1.8% 2.4%
TOTALS: 872 100.0%
-----100.0%
5.3
Variable: MC29E1 Numeric Pos: (2) 203-203
IMPUTATION FLAG FOR VARIABLE C29E1
RESPONSEPER- WGHTD
CODES FREQ CENT PCT
Not imputed 0 829 95.1% 93.6%Regression based 1 43 4.9% 6.4%
TOTALS: 872 100.0% 100.0%
Variable: MC29F Numeric Pos: (2) 204-204
IMPUTATION FLAG FOR VARIABLE C29F
RESPONSEPER- WGHTD
CODES FREQ CENT PCT
Not imputed 0 856 98.2% 97.6%Regression based 1 16 1.8% 2.4%
TOTALS: 872 100.0% 100.0%
Variable: MC29F1 Numeric Pos: (2) 205-205
IMPUTATION FLAG FOR VARIABLE C29F1
RESPONSE111111111i
PER- WGHTDCODES FREQ CENT PCT
Not imputed 0 839 96.2% 94.3%Regression based 1 33 3.8% 5.7%
TOTALS: 872 100.0% 100.0%
Variable: MC29G Numeric Pos: (2) 206-206
IMPUTATION FLAG FOR VARIABLE C29G
RESPONSEPER- WGHTD
CODES FREQ CENT PCT
Not imputed 0 856 98.2% 97.6%Regression based 1 16 1.8% 2.4%
TOTALS: 872 100.0% 100.0%
Variable: MC29G1 Numeric Pos: (2) 207-207
IMPUTATION FLAG FOR VARIABLE C29G1
RESPONSEIIMMAMMI
PER- WGHTDCODES FREQ CENT PCT
Not imputed 0 841 96.4% 94.5%Regression based 1 31 3.6% 5.5%
TOTALS: 872 100.0% 100.0%
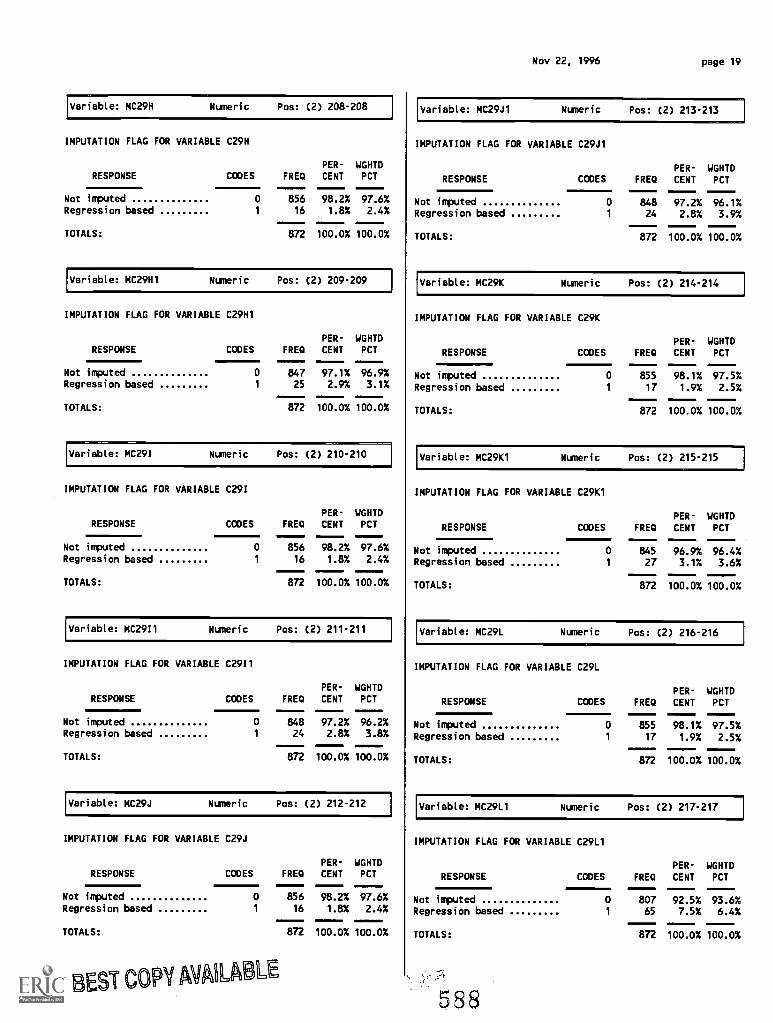
Variable: MC29H Numeric Pos: (2) 208-208
IMPUTATION FLAG FOR VARIABLE C29H
PER- WGHTDRESPONSE CODES FREQ CENT PCT
Not imputed 0 856 98.2% 97.6%Regression based 1 16 1.8% 2.4%
TOTALS: 872 100.0% 100.0%
Variable: MC29H1 Numeric Pos: (2) 209-209
IMPUTATION FLAG FOR VARIABLE C29H1
RESPONSEPER- WGHTD
CODES FREQ CENT PCT
Not imputed 0 847 97.1% 96.9%Regression based 1 25 2.9% 3.1%
TOTALS: 872 100.0% 100.0%
Variable: MC291 Numeric Pos: (2) 210-210
IMPUTATION FLAG FOR VARIABLE C291
RESPONSEPER- WGHTD
CODES FREQ CENT PCT
Not imputed 0 856 98.2% 97.6%Regression based 1 16 1.8% 2.4%
TOTALS: 872 100.0% 100.0%
Variable: MC29I1 Nuneric Pos: (2) 211-211
IMPUTATION FLAG FOR VARIABLE C29I1
RESPONSEPER- WGHTD
CODES FRED CENT PCT
Not imputed 0 848 97.2% 96.2%Regression based 1 24 2.8% 3.8%
TOTALS: 872 100.0% 100.0%
Variable: MC29J Numeric Pos: (2) 212-212
IMPUTATION FLAG FOR VARIABLE C29J
PER- WGHTDRESPONSE CODES FRED CENT PCT
Not imputed 0 856 98.2% 97.6%Regression based 1 16 1.8% 2.4%
TOTALS: 872 100.0% 100.0%
BEST COPY AVAILABLE
Nov 22, 1996 page 19
Variable: MC29J1 Numeric Pos: (2) 213-213
IMPUTATION FLAG FOR VARIABLE C29J1
RESPONSEPER- WGHTD
CODES FREQ CENT PCT
Not imputed 0 848 97.2% 96.1%Regression based 1 24 2.8% 3.9%
TOTALS: 872 100.0% 100.0%
Variable: MC29K Numeric Pos: (2) 214-214
IMPUTATION FLAG FOR VARIABLE C29K
RESPONSEPER- WGHTD
CODES FREQ CENT PCT
Not imputed 0 855 98.1% 97.5%Regression based 1 17 1.9% 2.5%
TOTALS: 872 100.0% 100.0%
Variable: MC29K1 Nuneric Pos: (2) 215-215
IMPUTATION FLAG FOR VARIABLE C29K1
RESPONSEPER- WGHTD
CODES FRED CENT PCT
Not imputed 0 845 96.9% 96.4%Regression based 1 27 3.1% 3.6%
TOTALS: 872 100.0% 100.0%
Variable: MC29L Numeric Pos: (2) 216-216
IMPUTATION FLAG FOR VARIABLE C29L
RESPONSEPER- WGHTD
CODES FREQ CENT PCT
Not imputed 0 855 98.1% 97.5%Regression based 1 17 1.9% 2.5%
TOTALS: 872 100.0% 100.0%
Variable: MC29L1 Nuneric Pos: (2) 217-217
IMPUTATION FLAG FOR VARIABLE C29L1
RESPONSEPER- WGHTD
CODES FREQ CENT PCT
Not imputed 0 807 92.5% 93.6%Regression based 1 65 7.5% 6.4%
TOTALS: 872 100.0% 100.0%
588
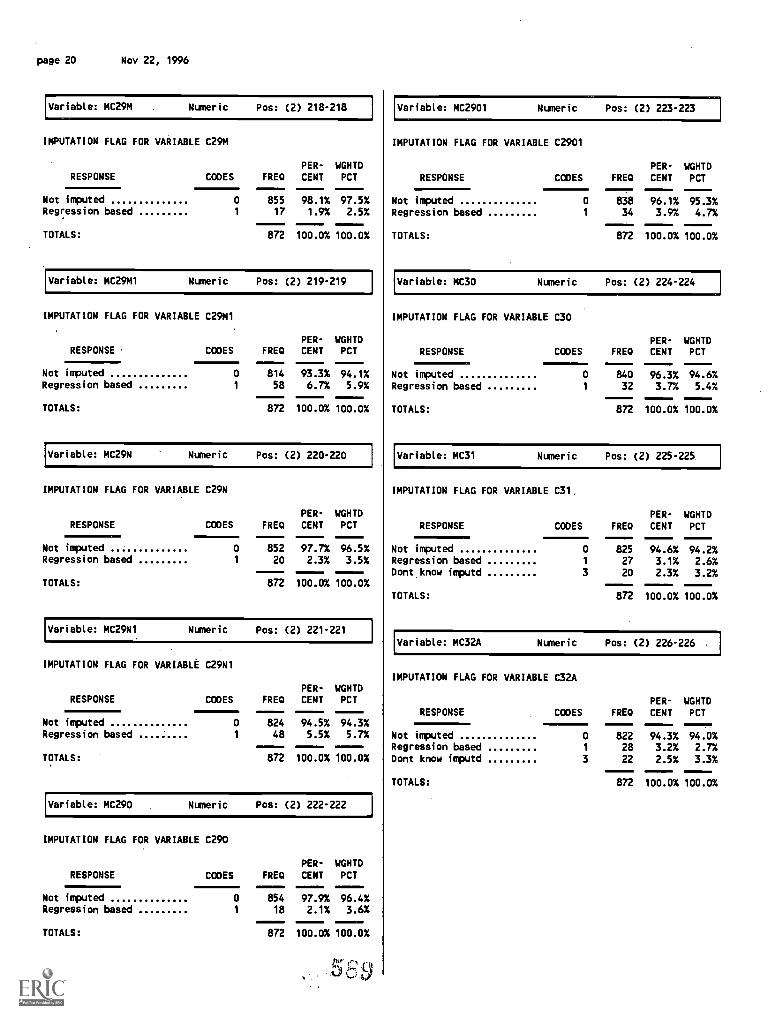
page 20 Nov 22, 1996
Variable: MC29M Nuneric Pos: (2) 218-218
IMPUTATION FLAG FOR VARIABLE C29M
PER- WGHTDRESPONSE CODES FRED CENT PCT
Not imputed 0 855 98.1% 97.5%Regression based 1 17 1.9% 2.5%
TOTALS: 872 100.0% 100.0%
Variable: MC29M1 Nuneric Pos: (2) 219-219
IMPUTATION FLAG FOR VARIABLE C29M1
RESPONSEPER- WGHTD
CODES FRED CENT PCT
Not imputed 0 814 93.3% 94.1%Regression based 1 58 6.7% 5.9%
TOTALS: 872 100.0% 100.0%
Variable: MC29N Nuneric Pos: (2) 220-220
IMPUTATION FLAG FOR VARIABLE C29N
RESPONSE11; PER- WGHTDCODES FREQ CENT PCT
Not imputed 0 852 97.7% 96.5%Regression based 1 20 2.3% 3.5%
TOTALS: 872 100.0% 100.0%
Variable: MC29N1 Nuneric Pos: (2) 221-221
IMPUTATION FLAG FOR VARIABLE C29N1
RESPONSEPER- WGHTD
CODES FREQ CENT PCT
Not imputed 0 824 94.5% 94.3%Regression based 1 48 5.5% 5.7%
TOTALS: 872 100.0% 100.0%
Variable: MC290 Nuneric Pos: (2) 222-222
IMPUTATION FLAG FOR VARIABLE C290
PER- WGHTDRESPONSE CODES FREQ CENT PCT
Not imputed 0 854 97.9% 96.4%Regression based 1 18 2.1% 3.6%
TOTALS: 872 100.0% 100.0%
Variable: MC2901 Nuneric Pos: (2) 223-223
IMPUTATION FLAG FOR VARIABLE C2901
RESPONSEPER- WGHTD
CODES FREQ CENT PCT
Not imputed 0 838 96.1% 95.3%Regression based 1 34 3.9% 4.7%
TOTALS: 872 100.0% 100.0%
Variable: MC30 Nuneric Pos: (2) 224-224
IMPUTATION FLAG FOR VARIABLE C30
PER- WGHTDRESPONSE CODES FRED CENT PCT
Not imputed 0 840 96.3% 94.6%Regression based 1 32 3.7% 5.4%
TOTALS: 872 100.0% 100.0%
Variable: MC31 Nuneric Pos: (2) 225-225
IMPUTATION FLAG FOR VARIABLE C31,
RESPONSE CODES FREQ
PER-
CENT
WGHTD
PCT
Not imputed 0 825 94.6% 94.2%Regression based 1 27 3.1% 2.6%Dont know imputd 3 20 2.3% 3.2%
TOTALS: 872 100.0% 100.0%
Variable: MC32A Numeric Pos: (2) 226-226
IMPUTATION FLAG FOR VARIABLE C32A
RESPONSE CODES FREDPER-
CENTWGHTDPCT
Not imputed 0 822 94.3% 94.0%Regression based 1 28 3.2% 2.7%Dont know imputd 3 22 2.5% 3.3%
TOTALS: 872 100.0% 100.0%
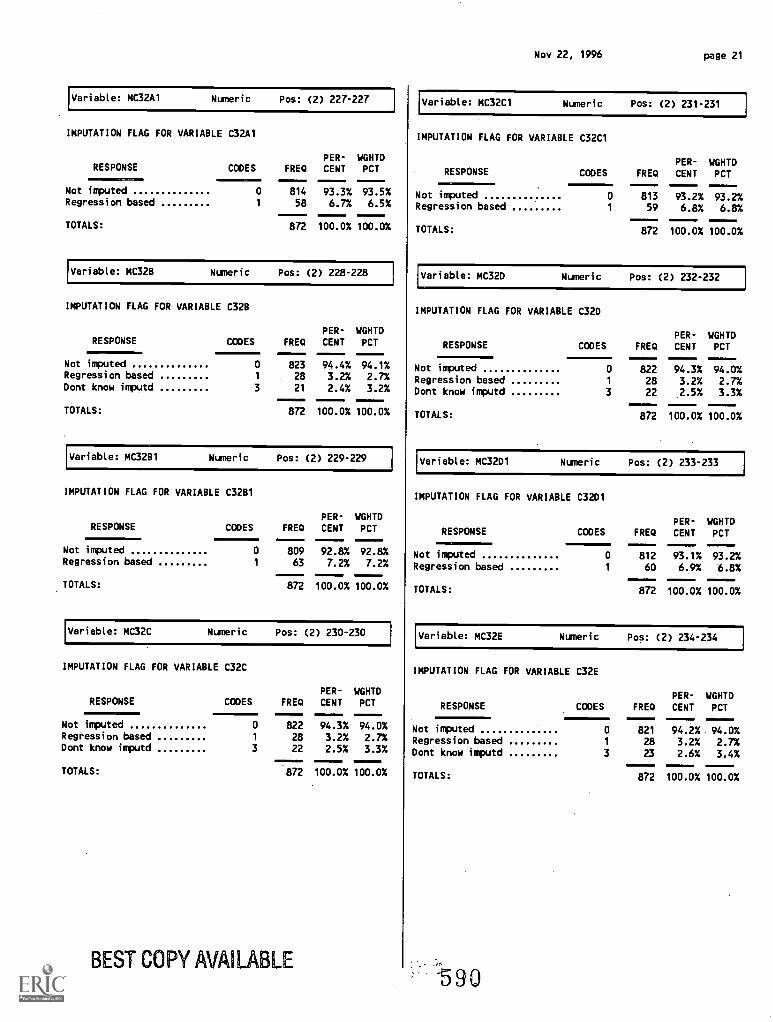
Variable: MC32A1 Numeric Pos: (2) 227-227
IMPUTATION FLAG FOR VARIABLE C32A1
RESPONSE CODESPER- WGHTD
FRED CENT PCT
Not imputed 0 814 93.3% 93.5%Regression based 1 58 6.7% 6.5%
TOTALS: 872 100.0% 100.0%
Variable: MC32B Numeric Pos: (2) 228-228
IMPUTATION FLAG FOR VARIABLE C32B
RESPONSE CODES FREQPER-CENT
WGHTDPCT
Not imputed 0 823 94.4% 94.1%Regression based 1 28 3.2% 2.7%Dont know imputd 3 21 2.4% 3.2%
TOTALS: 872 100.0% 100.0%
Variable: MC32B1 Numeric Pos: (2) 229-229
IMPUTATION FLAG FOR VARIABLE C3281
RESPONSEPER- WGHTD
CODES FRED CENT PCT
Not imputed 0 809 92.8% 92.8%Regression based 1 63 7.2% 7.2%
TOTALS: 872 100.0% 100.0%
Variable: MC32C Numeric Pos: (2) 230-230
IMPUTATION FLAG FOR VARIABLE C32C
RESPONSE CODES FREQPER-CENT
WGHTD
PCTM111111111
Not imputed 0 822 94.3% 94.0%Regression based 1 28 3.2% 2.7%Dont know imputd 3 22 2.5% 3.3%
TOTALS: 872 100.0% 100.0%
BEST COPY AVAILABLE
Nov 22, 1996 page 21
Variable: MC32C1 Numeric Pos: (2) 231-231
IMPUTATION FLAG FOR VARIABLE C32C1
RESPONSEPER- WGHTD
CODES FREQ CENT PCT
Not imputed 0 813 93.2% 93.2%Regression based 1 59 6.8% 6.8%
TOTALS: 872 100.0% 100.0%
Variable: MC32D Numeric Pos: (2) 232-232
IMPUTATION FLAG FOR VARIABLE C32D
RESPONSE CODES FRB)PER-CENT
WGHTDPCT
Not imputed 0 822 94.3% 94.0%Regression based 1 28 3.2% 2.7%Dont know imputd 3 22 2.5% 3.3%
872 100.0%-----100.0%TOTALS:
Variable: MC32D1 Numeric Pos: (2) 233-233
IMPUTATION FLAG FOR VARIABLE C3201
RESPONSEIMINIMIE
PER- WGHTDCODES FREQ CENT PCT
Not imputed 0 812 93.1% 93.2%Regression based 1 60 6.9% 6.8%
TOTALS: 872 100.0% 100.0%
Variable: MC32E Numeric Pos: (2) 234 -234
IMPUTATION FLAG FOR VARIABLE C32E
RESPONSEPER- WGHTD
CODES FREQ CENT PCT
Not imputed 0 821 94.2%. 94.0%Regression based 1 28 3.2% 2.7%Dont know imputd 3 23 2.6% 3.4%
TOTALS: 872 100.0% 100.0%
590
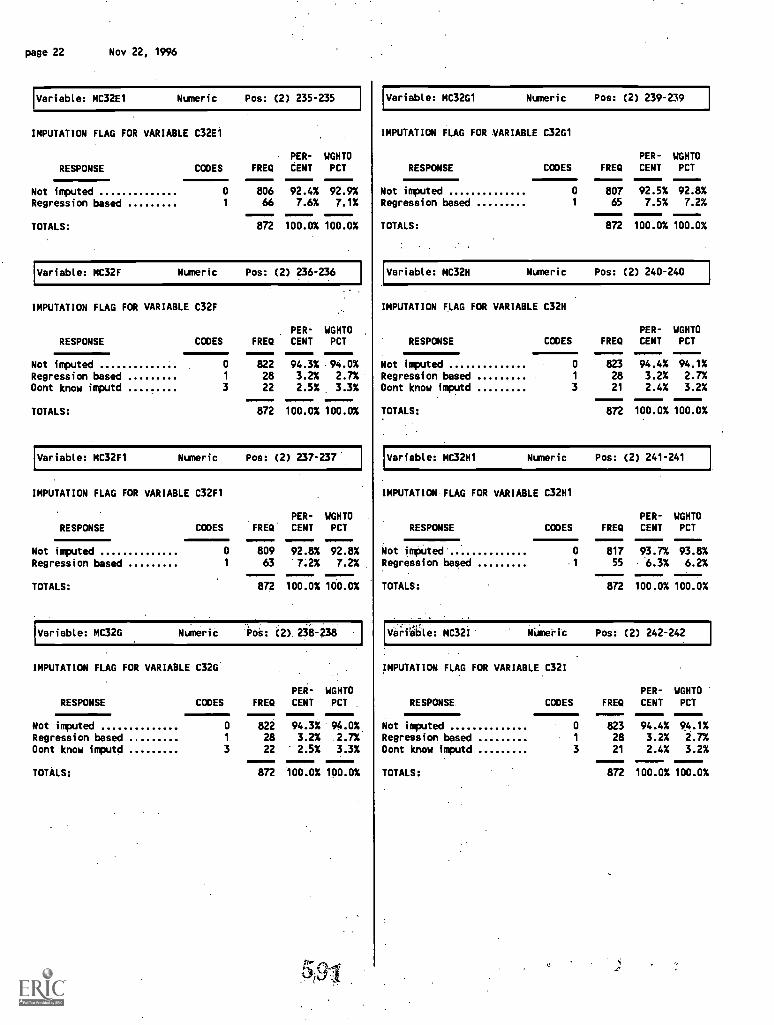
page 22 Nov 22, 1996
Variable: MC32E1 Numeric Pos: (2) 235-235
IMPUTATION FLAG FOR VARIABLE C32E1
PER- WGHTD
RESPONSE CODES FREQ CENT PCT
Not imputed 0 806 92.4% 92.9%Regression based 1 66 7.6% 7.1%
TOTALS: 872 100.0% 100.0%
Variable: MC32F Numeric Pos: (2) 236-236
IMPUTATION FLAG FOR VARIABLE C32F
RESPONSE CODES FREQPER-CENT
WGHTDPCT
Not imputed 0 822 94.3% 94.0%Regression based 1 28 3.2% 2.7%Dont know imputd 3 22 2.5% 3.3%
TOTALS: 872 100.0% 100.0%
Variable: MC32F1 Numeric Pos: (2) 237-237
IMPUTATION FLAG FOR VARIABLE C32F1
RESPONSEPER- WGHTD
CODES FREQ CENT PCT
Not imputed 0 809 92.8% 92.8%Regression based 1 63 '7.2% 7.2%
TOTALS: 872 100.0% 100.0%
Variable: MC32G NumeriC (2).258-238
IMPUTATION FLAG FOR VARIABLE C32G.
RESPONSEPER- WGHTD
CODES FREQ CENT PCT
Not imputed 0 822 94.3% 94:0%Regression based 1 28 3.2% .2.7%.
Dont know imputd 3 22 2.5% 3.3%
TOTALS: 872 100.0% 100.0%
Variable: MC32G1 Numeric Pos: (2) 239-239
IMPUTATION FLAG FOR VARIABLE C32G1
RESPONSEPER- WGHTD
CODES FREQ CENT PCT
Not imputed 0 807 92.5% 92.8%Regression based 1 65 7.5% 7.2%
TOTALS: 872 100.0% 100.0%
Variable: MC32H Numeric Pos: (2) 240-240
IMPUTATION FLAG FOR VARIABLE C32H
RESPONSE CODES FREQPER-CENT
WGHTDPCT
Not imputed 0 823 94.4% 94.1%Regression based 1 28 3.2% 2.7%Dont know imputd 3 21 2.4% 3.2%
TOTALS: 872 100.0% 100.0%
Variable: MC32H1 Numeric Pos: (2) 241-241
IMPUTATION FLAG FOR VARIABLE C32H1
RESPONSEPER- WGHTD
CODES FRED CENT PCT
Not imputed 0 817 93.7% 93.8%Regression based 1 55 6.3% 6.2%
TOTALS: 872 100.0% 100.0%
14;k4116i: MC32i NUmerit Pos: (2) 242-242
IMPUTATION FLAG FOR VARIABLE C321
RESPONSE CODES FRED
PER-
CENTWGHTDPCT
Not imputed 0 823 94.4% 94.1%Regression based 1 28 3.2% 2.7%Dont know imputd 3 21 2.4% 3.2%
TOTALS: 872 100.0% 100.0%
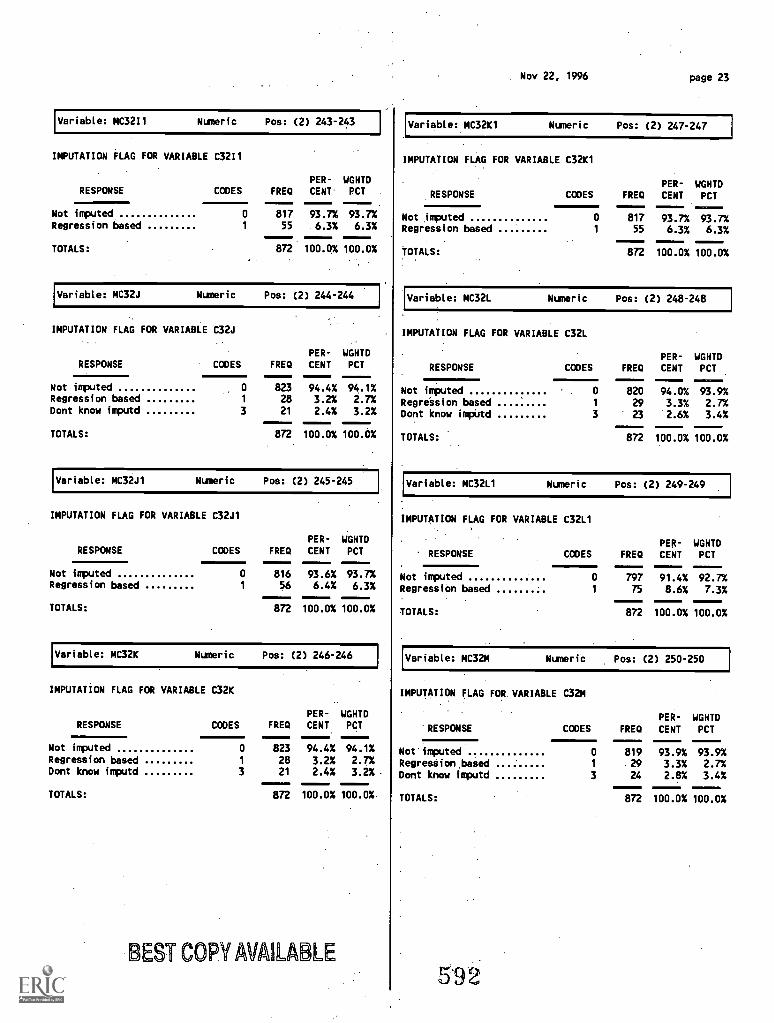
Variable: MC3211 Numeric Pos: (2) 243-243
IMPUTATION FLAG FOR VARIABLE C32I1
RESPONSEPER- WGHTD
CODES FRED CENT PCT .
Not imputed 0 817 93.7% 93.7%Regression based 1 55 6.3% 6.3%
TOTALS: 872 100.0% 100.0%
Variable: MC32J Numeric Pos: (2) 244-244
IMPUTATION FLAG FOR VARIABLE C32J
RESPONSE CODES FRED
PER-
CENTWGHTDPCT
Not imputed 0 823 94.4% 94.1%Regression based 1 28 3.2% 2.7%Dont know imputd 3 21 2.4% 3.2%
TOTALS: 872 100.0% 100.0%
Variable: MC32J1 Numeric Pos: (2) 245-245
IMPUTATION FLAG FOR VARIABLE C32J1
RESPONSEPER- WGHTD
CODES FRED CENT PCT
Not imputed 0 816 93.6% 93.7%Regression based 1 56 6.4% 6.3%
TOTALS: 872 100.0% 100.0%
Variable: MC32K Numeric Pos: (2) 246-246
IMPUTATION FLAG FOR VARIABLE C32K
RESPONSE CODES FREDPERCENT
WGHTDPCT
Not imputed 0 823 94.4% 94.1%Regression based 1 28 3.2% 2.7%Dont know imputd 3 21 2.4% 3.2%
TOTALS: 872 100.0% 100.0%
BEST COPY AMIABLE
Nov 22, 1996 page 23
Variable: MC32K1 Numeric Pos: (2) 247-247
IMPUTATION FLAG FOR VARIABLE C32K1
RESPONSEPER- WGHTD
CODES FRED CENT PCT
Not imputed 0 817 93.7% 93.7%Regression based 1 55 6.3% 6.3%
TOTALS: 872 100.0% 100.0%
Variable: MC32L Numeric Pos: (2) 248-248
IMPUTATION FLAG FOR VARIABLE C32L
RESPONSE CODES FREDPER-CENT
WGHTDPCT
Not imputed 0 820 94.0% 93.9%Regression based 1 29 3.3% 2.7%Dont know imputd 3 23 2.6% 3.4%
TOTALS: 872 100.0% 100.0%
Variable: MC32L1 Numeric Pos: (2) 249-249
IMPUTATION FLAG FOR VARIABLE C32L1
RESPONSEPER- WGHTD
CODES FRED CENT PCT
Not imputed 0 797 91.4% 92.7%Regression based 1 75 8.6% 7.3%
TOTALS: 872 100.0% 100.0%
Variable: MC32M Numeric Pos: (2) 250-250
IMPUTATION FLAG FOR. VARIABLE C32M
RESPONSE CODES FREDPER-
CENTWGHTDPCT
Not imputed 0 819 93.9% 93.9%Regression based 1 29 3.3% 2.7%Dont know imputd 3 24 2.8% 3.4%
TOTALS: 872 100.0% 100.0%
5:9 2
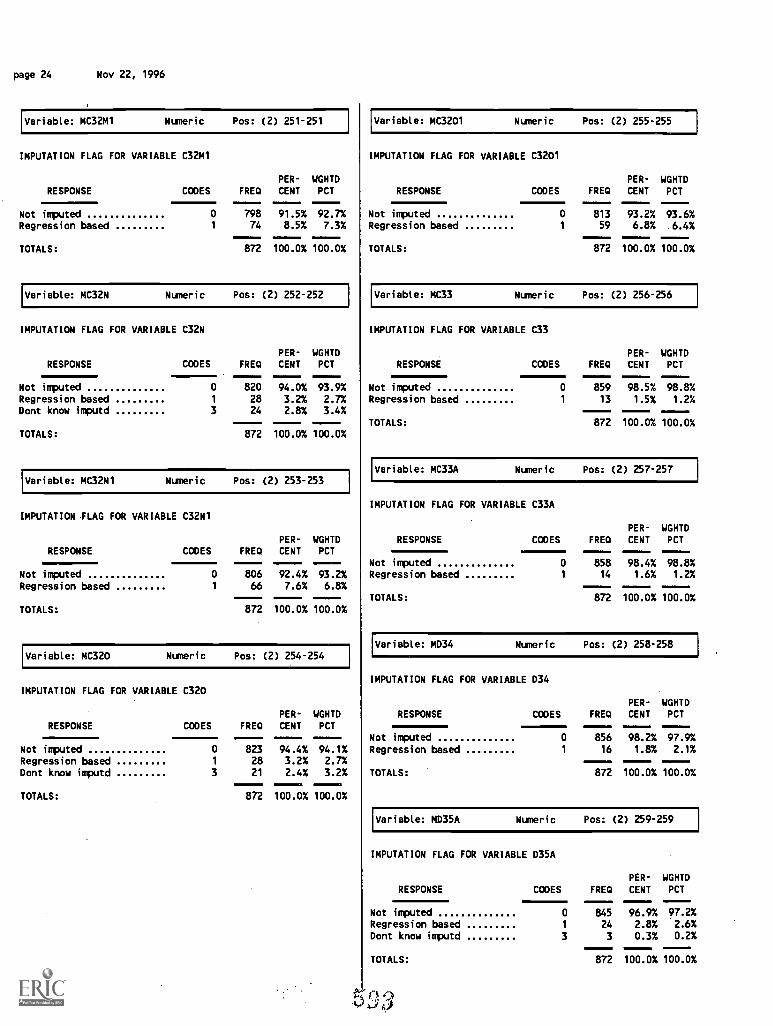
page 24 Nov 22, 1996
Variable: MC32M1 Nuneric Pos: (2) 251-251
IMPUTATION FLAG FOR VARIABLE C32M1
PER- WGHTDRESPONSE CODES FREQ CENT PCT
Not imputed 0 798 91.5%-----92.7%
Regression based 1 74 8.5% 7.3%
TOTALS: 872
111100.0% 100.0%
Variable: MC32N Nuneric Pos: (2) 252-252
IMPUTATION FLAG FOR VARIABLE C32N
RESPONSE CODES FREDPER-
CENTWGHTDPCT
Not imputed 0 820 94.0% 93.9%Regression based 1 28 3.2% 2.7%Dont know imputd 3 24 2.8% 3.4%
TOTALS: 872 100.0% 100.0%
Variable: MC32N1 Nuneric Pos: (2) 253-253
IMPUTATION FLAG FOR VARIABLE C32N1
PER- WGHTDRESPONSE CODES FRED CENT PCT
Not imputed 0 806 92.4% 93.2%Regression based 1 66 7.6% 6.8%
TOTALS: 872 100.0%
11141=
100.0%
Variable: MC320 Nuneric Pos: (2) 254-254
IMPUTATION FLAG FOR VARIABLE C320
RESPONSE CODES FREQPER-
CENT
WGHTDPCT
Not imputed 0 823
11011181111
94.4% 94.1%Regression based 1 28 3.2% 2.7%Dont know imputd 3 21 2.4% 3.2%
TOTALS:
=1872
111=IZB
100.0%
1100.0%
Variable: MC3201 Nuneric Pos: (2) 255-255
IMPUTATION FLAG FOR VARIABLE C3201
PER- WGHTDRESPONSE CODES FREQ CENT PCT
Not imputed 0 813 93.2% 93.6%Regression based 1 59 6.8% 6.4%
TOTALS: 872 100.0% 100.0%
Variable: MC33 Nuneric Pos: (2) 256-256
IMPUTATION FLAG FOR VARIABLE C33
RESPONSEPER- WGHTD
CODES FREQ CENT PCT
Not imputed 0 859 98.5% 98.8%Regression based 1 13 1.5% 1.2%
TOTALS: 872 100.0% 100.0%
Variable: MC33A Nuneric Pos: (2) 257-257
IMPUTATION FLAG FOR VARIABLE C33A
RESPONSEPER- WGHTD
CODES FREQ CENT PCT
Not imputed 0 858 98.4% 98.8%Regression based 1 14 1.6% 1.2%
TOTALS: 872 100.0% 100.0%
Variable: MD34 Numeric Pos: (2) 258-258
IMPUTATION FLAG FOR VARIABLE D34
RESPONSEPER- WGHTD
CODES FRED CENT PCT
Not imputed 0 856 98.2% 97.9%Regression based 1 16 1.8% 2.1%
TOTALS: 872 100.0% 100.0%
Variable: MD35A Nuneric Pos: (2) 259-259
IMPUTATION FLAG FOR VARIABLE D35A
RESPONSE CODES FRED
PER-
CENT
WGHTDPCT
Not imputed 0 845 96.9% 97.2%Regression based 1 24 2.8% 2.6%Dont know imputd 3 3 0.3% 0.2%
TOTALS: 872 100.0% 100.0%
4`:`, 0 4)0.4,Y
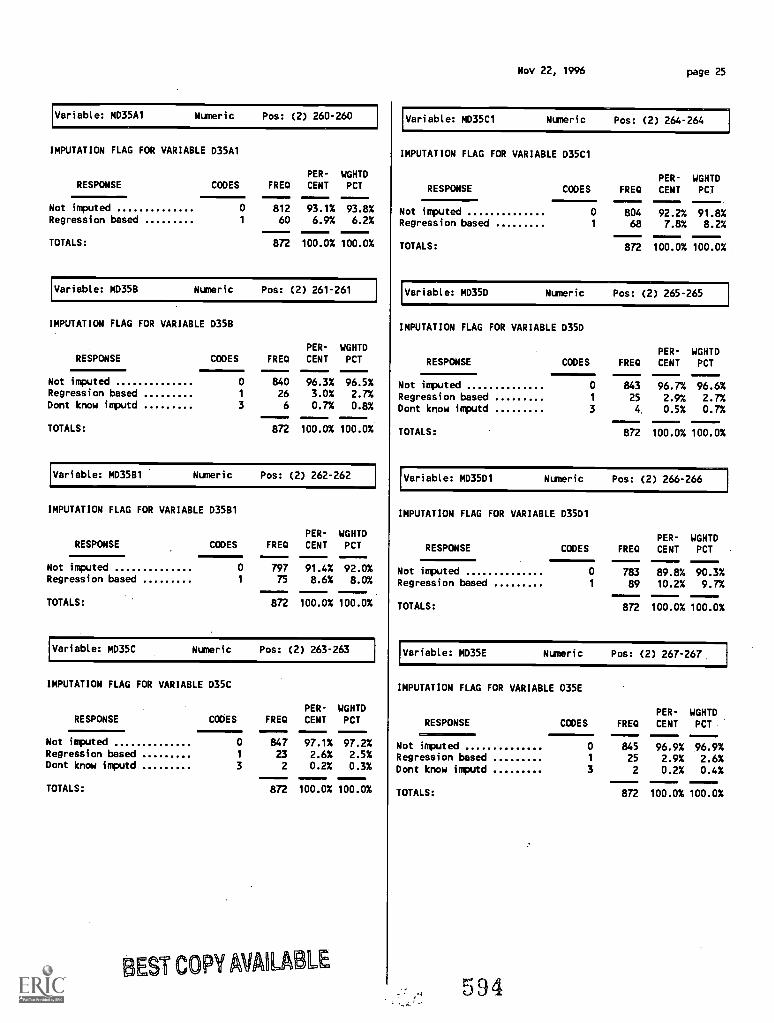
Variable: MD35A1 Numeric Pos: (2) 260-260
IMPUTATION FLAG FOR VARIABLE 035A1
RESPONSEPER- WGHTD
CODES FREQ CENT PCT
Not imputed 0 812 93.1% 93.8%Regression based 1 60 6.9% 6.2%
TOTALS: 872 100.0% 100.0%
Variable: MD35B Numeric Pos: (2) 261-261
IMPUTATION FLAG FOR VARIABLE D35B
RESPONSE CODES FREQPER-
CENT
WGHTDPCT
Not imputed 0 840 96.3% 96.5%Regression based 1 26 3.0% 2.7%Dont know imputd 3 6 0.7% 0.8%
TOTALS: 872 100.0% 100.0%
Variable: MO3581 Numeric Pos: (2) 262-262
IMPUTATION FLAG FOR VARIABLE 03581
RESPONSEPER- WGHTD
CODES FREQ CENT PCT
Not imputed 0 797 91.4% 92.0%Regression based 1 75 8.6% 8.0%
TOTALS: 872 100.0% 100.0%
Variable: MD35C Numeric Pos: (2) 263-263
IMPUTATION FLAG FOR VARIABLE D35C
RESPONSE CODES FREDPER-CENT
WGHTDPCT
Not imputed 0 847 97.1% 97.2%Regression based 1 23 2.6% 2.5%Dont know imputd 3 2 0.2% 0.3%
TOTALS: 872 100.0% 100.0%
BEST COPY MLAr)Li) LE
Nov 22, 1996 page 25
Variable: MD35C1 Numeric Pos: (2) 264-264
IMPUTATION FLAG FOR VARIABLE 035C1
RESPONSEPER- WGHTD
CODES FREQ CENT PCT
Not imputed 0 804 92.2% 91.8%Regression based 1 68 7.8% 8.2%
TOTALS: 872 100.0% 100.0%
Variable: MD35D Numeric Pos: (2) 265-265
IMPUTATION FLAG FOR VARIABLE 0350
RESPONSE CODES FREQPER-CENT
WGHTDPCT11111.
Not imputed 0 843 96.7% 96.6%Regression based 1 25 2.9% 2.7%Dont know imputd 3 4. 0.5% 0.7%
TOTALS: 872 100.0% 100.0%
Variable: MD35D1 Numeric Pos: (2) 266-266
IMPUTATION FLAG FOR VARIABLE 03501
RESPONSEPER- WGHTD
CODES FRED CENT PCT
Not imputed 0 783 89.8% 90.3%Regression based 1 89 10.2% 9.7%
TOTALS: 872 100.0% 100.0%
Variable: MD35E Numeric Pos: (2) 267-267.
IMPUTATION FLAG FOR VARIABLE D35E
RESPONSE CODES FREDPER-
CENTWGHTDPCT
11=11MILIMINIM11
Not imputed 0 845 96.9% 96.9%Regression based 1 25 2.9% 2.6%Dont know imputd 3 2 0.2% 0.4%
TOTALS: 872 100.0% 100.0%
594
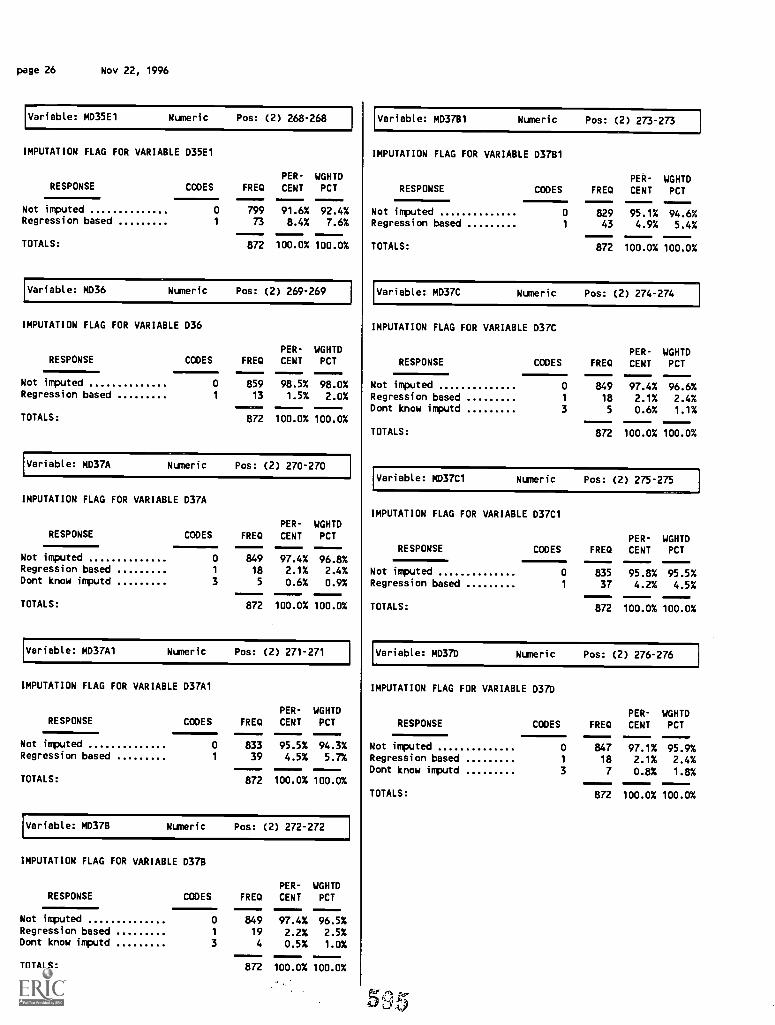
page 26 Nov 22, 1996
Variable: MD35E1 Numeric Pos: (2) 268-268
IMPUTATION FLAG FOR VARIABLE D35E1
PER- WGHTDRESPONSE CODES FREQ CENT PCT
Not imputed 0 799 91.6% 92.4%Regression based 1 73 8.4% 7.6%
TOTALS: 872 100.0% 100.0%
Variable: MD36 Numeric Pos: (2) 269-269
IMPUTATION FLAG FOR VARIABLE D36
RESPONSEPER- WGHTD
CODES FREQ CENT PCT
Not imputed 0 859 98.5% 98.0%Regression based 1 13 1.5% 2.0%
TOTALS: 872 100.0% 100.0%
Variable: MD37A Numeric Pos: (2) 270-270
IMPUTATION FLAG FOR VARIABLE D37A
RESPONSE CODES FREQ
PER-
CENT
WGHTDPCT
Not imputed 0 849 97.4% 96.8%Regression based 1 18 2.1% 2.4%Dont know imputd 3 5 0.6% 0.9%
TOTALS: 872 100.0% 100.0%
Variable: MD37A1 Numeric Pos: (2) 271-271
IMPUTATION FLAG FOR VARIABLE D37A1
RESPONSEPER- WGHTD
CODES FREQ CENT PCT
Not imputed 0 833 95.5% 94.3%Regression based 1 39 4.5% 5.7%
TOTALS: 872 100.0% 100.0%
Variable: MD37B Numeric Pos: (2) 272-272
IMPUTATION FLAG FOR VARIABLE D378
RESPONSE CODES FREQPER-
CENTWGHTDPCT
Not imputed 0 849 97.4% 96.5%Regression based 1 19 2.2% 2.5%Dont know imputd 3 4 0.5% 1.0%
TOTALS: 872 100.0% 100.0%
Variable: MD37B1 Numeric Pos: (2) 273-273
IMPUTATION FLAG FOR VARIABLE D37131
RESPONSEPER- WGHTD
CODES FRED CENT PCT
Not imputed 0 829 95.1% 94.6%Regression based 1 43 4.9% 5.4%
TOTALS: 872 100.0% 100.0%
Variable: MD37C Numeric Pos: (2) 274-274
IMPUTATION FLAG FOR VARIABLE D37C
RESPONSE CODES FRB)PER-
CENT
WGHTDPCT
Not imputed 0 849 97.4% 96.6%Regression based 1 18 2.1% 2.4%Dont know imputd 3 5 0.6% 1.1%
TOTALS: 872 100.0% 100.0%
Variable: MD37C1 Numeric Pos: (2) 275-275
IMPUTATION FLAG FOR VARIABLE D37C1
RESPONSEPER- WGHTD
CODES FREQ CENT PCT
Not imputed 0 835 95.8% 95.5%Regression based 1 37 4.2% 4.5%
TOTALS: 872 100.0% 100.0%
Variable: MD37D Numeric Pos: (2) 276-276
IMPUTATION FLAG FOR VARIABLE D37D
RESPONSE CODES FREDPER-
CENT
WGHTDPCT
Not imputed 0 847 97.1% 95.9%Regression based 1 18 2.1% 2.4%Dont know imputd 3 7 0.8% 1.8%
TOTALS: 872 100.0% 100.0%
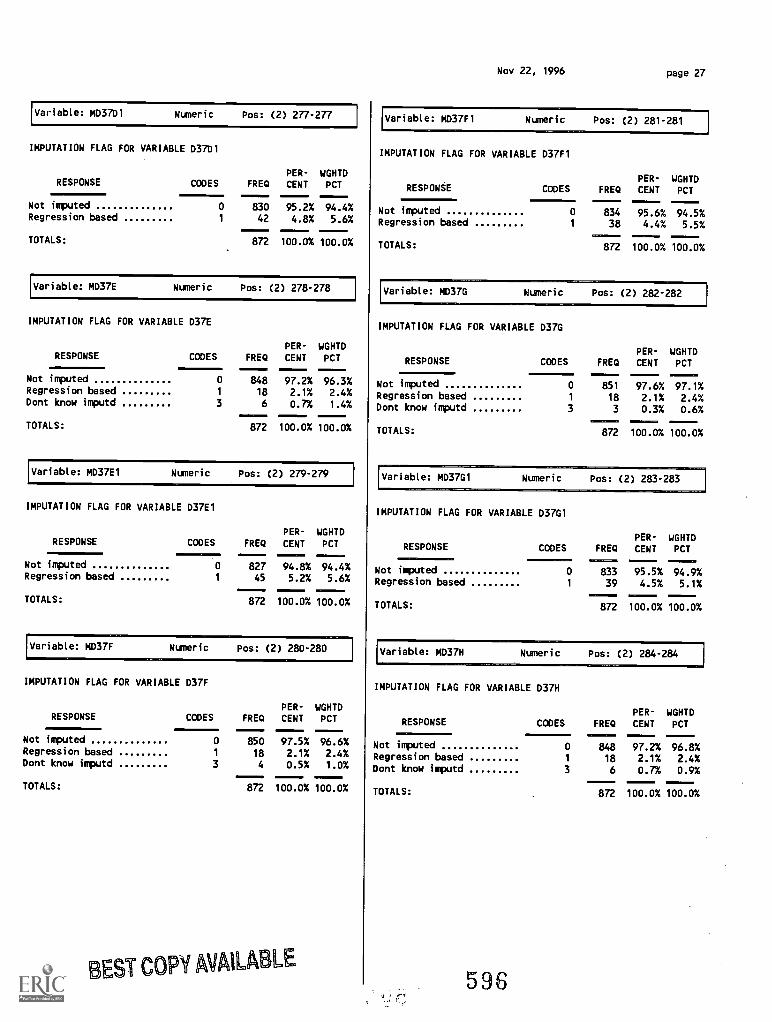
Variable: MD37D1 Numeric Pos: (2) 277-277
IMPUTATION FLAG FOR VARIABLE 03701
RESPONSEPER- WGHTD
CODES FRED CENT PCT
Not imputed 0 830 95.2% 94.4%Regression based 1 42 4.8% 5.6%
TOTALS: 872 100.0% 100.0%
Variable: MD37E Numeric Pos: (2) 278-278
IMPUTATION FLAG FOR VARIABLE D37E
RESPONSE CODES FREDPER-
CENTWGHTDPCT
Not imputed 0 848 97.2% 96.3%Regression based 1 18 2.1% 2.4%Dont know imputd 3 6 0.7% 1.4%
TOTALS:
.11872 100.0% 100.0%
Variable: MD37E1 Numeric Pos: (2) 279-279
IMPUTATION FLAG FOR VARIABLE D37E1
RESPONSEPER- WGHTD
CODES FRED CENT PCT
Not imputed 0 827 94.8% 94.4%Regression based 1 45 5.2% 5.6%
TOTALS: 872 100.0%
==1,100.0%
Variable: MD37F Numeric Pos: (2) 280-280
IMPUTATION FLAG FOR VARIABLE D37F
RESPONSE CODES FREDPER-
CENTWGHTDPCT
Not imputed 0 850 97.5% 96.6%Regression based 1 18 2.1% 2.4%Dont know imputd 3 4 0.5% 1.0%
TOTALS: 872 100.0% 100.0%
BEST COPY ANIMA LE
Nov 22, 1996 page 27
Variable: MD37F1 Numeric Pos: (2) 281-281
IMPUTATION FLAG FOR VARIABLE D37F1
PER- WGHTDRESPONSE CODES FREQ CENT PCT
--------Not imputed 0 834 95.6%
-----94.5%
Regression based 1 38 4.4% 5.5%
TOTALS: 872 100.0% 100.0%
Variable: MD37G Numeric Pos: (2) 282-282
IMPUTATION FLAG FOR VARIABLE D37G
RESPONSE CODES FREQPER-CENT
WGHTDPCT7111
Not imputed 0 851 97.6% 97.1%Regression based 1 18 2.1% 2.4%Dont know imputd 3 3 0.3% 0.6%
TOTALS:11=1710=.
872
11137=11.1
100.0% 100.0%
Variable: MD37G1 Numeric Pos: (2) 283-283
IMPUTATION FLAG. FOR VARIABLE D37G1
RESPONSEPER- WGHTD
CODES FRED CENT PCT
Not imputed 0 833 95.5% 94.9%Regression based 1 39 4.5% 5.1%
TOTALS: 872 100.0% 100.0%
Variable: MD37H Numeric Pos: (2) 284-284
IMPUTATION FLAG FOR VARIABLE D37H
RESPONSE CODES FREDPER-
CENTWGHTDPCT
Not imputed
1151107:1311
0
.MI1MM
848 97.2% 96.8%Regression based 1 18 2.1% 2.4%Dont know imputd 3 6 0.7% 0.9%
TOTALS: 872 100.0% 100.0%
596
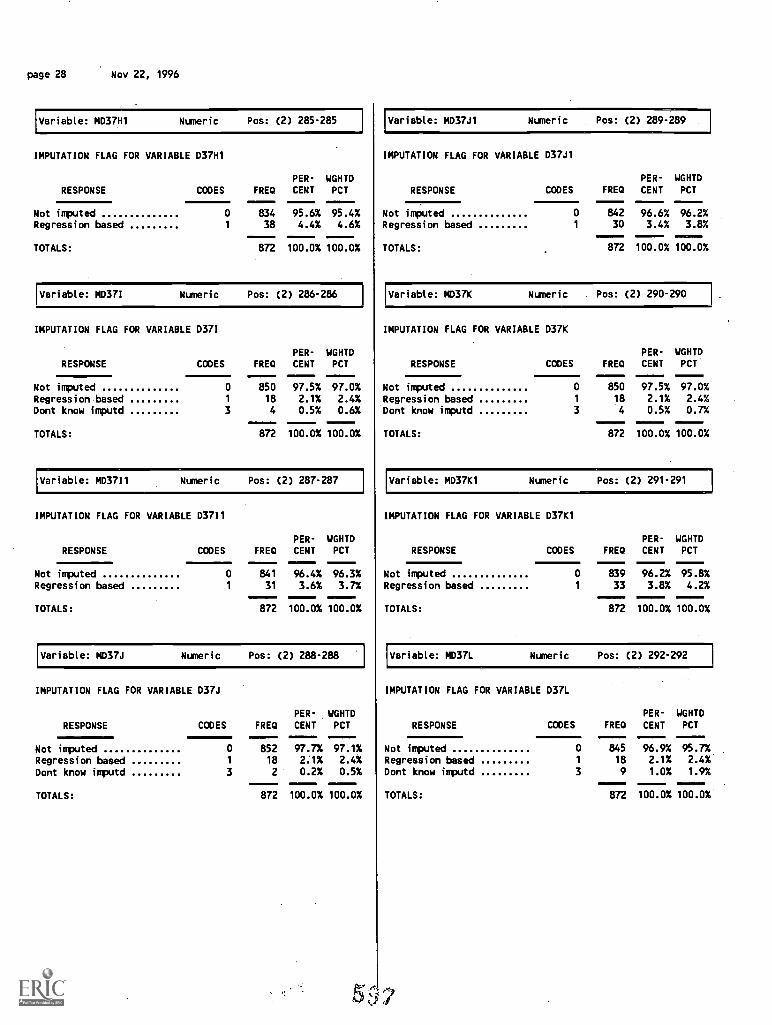
page 28 Nov 22, 1996
Variable: MD37H1 Numeric Pos: (2) 285-285
IMPUTATION FLAG FOR VARIABLE D37H1
Variable: MD37J1 Numeric Pos: (2) 289-289
IMPUTATION FLAG FOR VARIABLE D37J1
PER- WGHTDRESPONSE CODES FRED CENT PCT RESPONSE
Not imputed 0 834 95.6% 95.4%Regression based 1 38 4.4% 4.6%
TOTALS: 872 100.0% 100.0%
Variable: MD37I Numeric Pos: (2) 286-286
IMPUTATION FLAG FOR VARIABLE D37I
RESPONSE CODES FREDPER-
CENTWGHTDPCT
Not imputed 0 850 97.5% 97.0%Regression based 1 18 2.1% 2.4%Dont know imputd 3 4 0.5% 0.6%
TOTALS: 872 100.0% 100.0%
Variable: MD3711 Numeric Pos: (2) 287-287
IMPUTATION FLAG FOR VARIABLE D3711
RESPONSEPER- WGHTD
i
PER- WGHTDCODES FRED CENT PCT
Not imputed 0 842 96.6% 96.2%Regression based 1 30 3.4% 3.8%
TOTALS: 872 100.0%-----100.0%
Variable: MD37K Numeric Pos: (2) 290-290
IMPUTATION FLAG FOR VARIABLE D37K
RESPONSE CODES FRED
PER-
CENTWGHTDPCT
Not imputed 0 850
-----97.5% 97.0%
Regression based 1 18 2.1% 2.4%Dont know imputd 3 4 0.5% 0.7%
TOTALS: 872 100.0% 100.0%
Variable: MD37K1 Numeric Pos: (2) 291-291
IMPUTATION FLAG FOR VARIABLE 037K1
PER WGHTDCODES FRED CENT PCT RESPONSE CODES FRED CENT PCT
Not imputed 0 841 96.4% 96.3%Regression based 1 31 3.6% 3.7%
TOTALS: 872 100.0% 100.0%
Variable: MD37J Numeric Pos: (2) 288-288
IMPUTATION FLAG FOR VARIABLE D37J
RESPONSE CODES FRED
PER-
CENT
WGHTDPCT
Not imputed 0 852 97.7% 97.1%Regression based 1 18 2:1% 2.4%
Dont know imputd 3 2 0.2% 0.5%
TOTALS: 872 100.0% 100.0%
I
I
Not imputed 0
-----839 96.2% 95.8%
Regression based 1 33 3.8% 4.2%
TOTALS: 872 100.0% 100.0%
Variable: MD37L Numeric Pos: (2) 292-292
IMPUTATION FLAG FOR VARIABLE D37L
RESPONSE CODES FRED
PER-
CENT
WGHTDPCT
Not imputed 0 845 96.9% 95.7%Regression based 1 18 2.1% 2.4%
Dont know imputd 3 9 1.0% 1.9%
TOTALS: 872 100.0% 100.0%
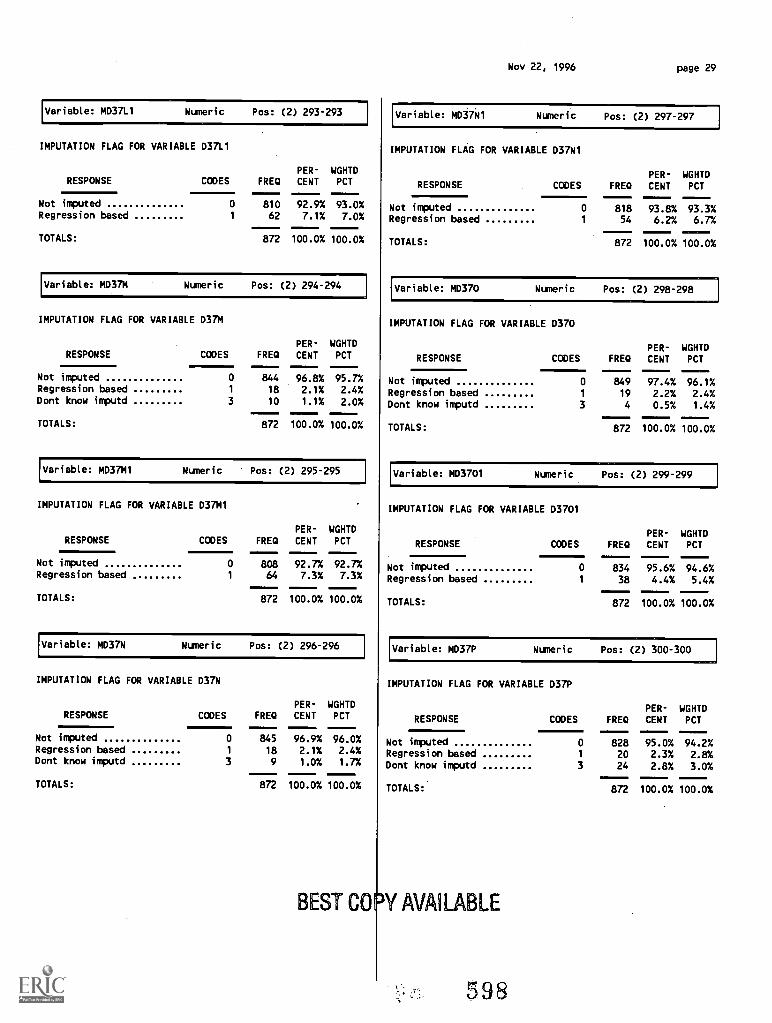
Variable: MD37L1 Numeric Pos: (2) 293-293
IMPUTATION FLAG FOR VARIABLE 037L1
RESPONSEPER- WGHTD
CODES FREQ CENT PCT
Not imputed 0 810 92.9% 93.0%Regression based 1 62 7.1% 7.0%
TOTALS: 872 100.0% 100.0%
Variable: MD37M Numeric Pos: (2) 294-294
IMPUTATION FLAG FOR VARIABLE D37M
RESPONSE CODES FRED
PER-
CENTWGHTDPCT
Not imputed 0 844 96.8% 95.7%Regression based 1 18 2.1% 2.4%Dont know imputd 3 10 1.1% 2.0%
TOTALS: 872 100.0% 100.0%
Variable: MD37M1 Numeric Pos: (2) 295-295
IMPUTATION FLAG FOR VARIABLE D37M1
RESPONSEPER- WGHTD
CODES FREQ CENT PCT
Not imputed 0 808 92.7% 92.7%Regression based 1 64 7.3% 7.3%
TOTALS: 872 100.0% 100.0%
Variable: MD37N Numeric Pos: (2) 296-296
IMPUTATION FLAG FOR VARIABLE D37N
RESPONSE CODES FREQPER-
CENTWGHTDPCT
Not imputed 0 845 96.9% 96.0%Regression based 1 18 2.1% 2.4%Dont know imputd 3 9 1.0% 1.7%
TOTALS: 872 100.0% 100.0%
Nov 22, 1996 page 29
Variable: MD370 Numeric Pos: (2) 297-297
IMPUTATION FLAG FOR VARIABLE D37N1
RESPONSEPER- WGHTD
CODES FRED CENT PCT101=111111
Not imputed 0 818 93.8% 93.3%Regression based 1 54 6.2% 6.7%
TOTALS: 872 100.0% 100.0%
Variable: MD370 Numeric Pos: (2) 298-298
IMPUTATION FLAG FOR VARIABLE D370
RESPONSE CODES FREDPER-
CENTWGHTDPCT
Not imputed 0 849 97.4% 96.1%Regression based 1 19 2.2% 2.4%Dont know imputd 3 4 0.5% 1.4%
TOTALS: 872 100.0% 100.0%
Variable: MD3701 Numeric Pos: (2) 299-299
IMPUTATION FLAG FOR VARIABLE D3701
RESPONSEPER- WGHTD
CODES FREQ CENT PCT
Not imputed 0 834 95.6% 94.6%Regression based 1 38 4.4% 5.4%
TOTALS: 872 100.0% 100.0%
Variable: MD37P Numeric Pos: (2) 300-300
IMPUTATION FLAG FOR VARIABLE D37P
RESPONSE CODES FREDPER-
CENTWGHTDPCT
Not imputed 0 828 95.0%
111111
94.2%Regression based 1 20 2.3% 2.8%Dont know imputd 3 24 2.8% 3.0%
TOTALS: 872 100.0% 100.0%
BEST CO 1V AVAILABLE
598
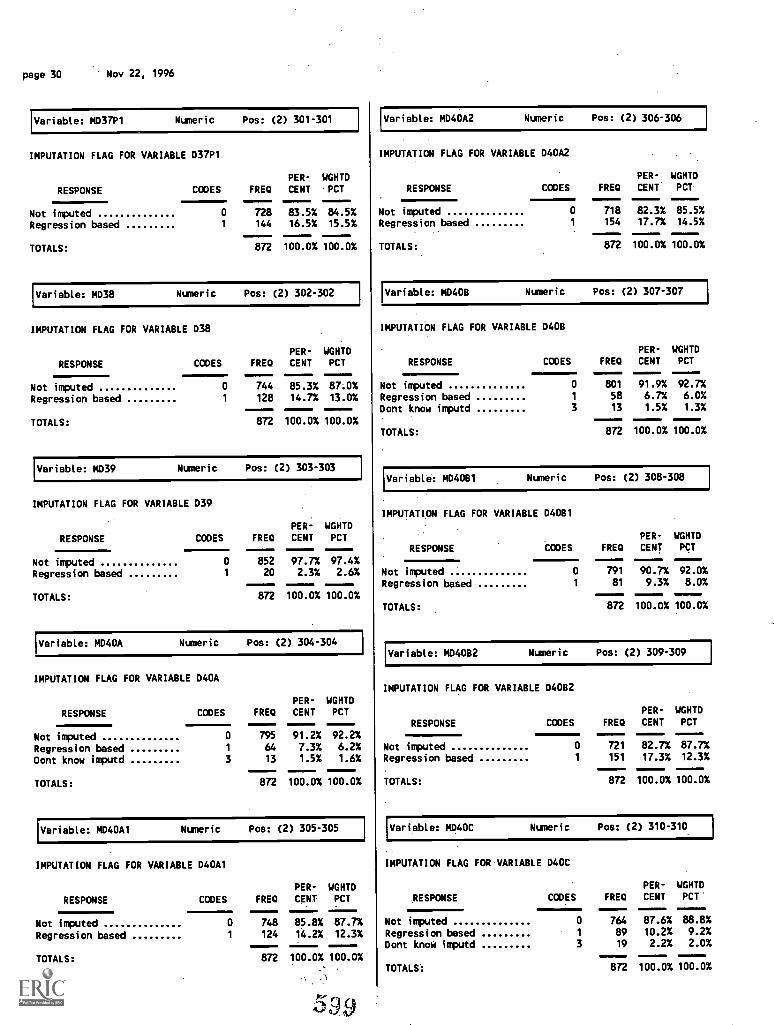
page 30 Nov 22, 1996
Variable: MD37P1 Numeric Pos: (2) 301-301
IMPUTATION FLAG FOR VARIABLE 037P1
PER- WGHTD
RESPONSE CODES FREO CENT PCT
Not imputed 0 728 83.5% 84.5%
Regression based 1 144 16.5% 15.5%
TOTALS: 872 100.0% 100.0%
Variable: MD38 Numeric Pos: (2) 302-302
IMPUTATION FLAG FOR VARIABLE 038
RESPONSE
PER- WGHTDCODES FREO CENT PCT
Not imputed 0 744 85.3% 87.0%
Regression based 1 128 14.7% 13.0%
TOTALS: 872 100.0% 100.0%
Variable: MD39 Numeric Pos: (2) 303-303
IMPUTATION FLAG FOR VARIABLE D39
PER- WGHTD
RESPONSE CODES FREQ CENT PCT
Not imputed 0 852 97.7% 97.4%
Regression based 1 20 2.3% 2.6%
TOTALS: 872 100.0% 100.0%
Variable: 14040A Numeric Pos: (2) 304-304
IMPUTATION FLAG FOR VARIABLE 040A
RESPONSE CODES FREQ
PER-CENT
WGHTDPCT
Not imputed 0 795 91.2% 92.2%
Regression based 1 64 7.3% 6.2%
Dont know imputd 3 13 1.5% 1.6%
TOTALS: 872 100.0% 100.0%
Variable: MD40A1 Numeric Pos: (2) 305-305
IMPUTATION FLAG FOR VARIABLE 040A1
PER- WGHTD
RESPONSE CODES FREQ CENT PCT
Not imputed 0 748 85.8% 87.7%
Regression based 1 124 14.2% 12.3%
TOTALS: 872 100.0% 100.0%
599
Variable: MD40A2 Numeric Pos: (2) 306-306
IMPUTATION FLAG FOR VARIABLE 040A2
RESPONSE
PER- WGHTD
CODES FRED CENT PCT
Not imputed 0 718 82.3% 85.5%
Regression based 1 154 17.7% 14.5%
TOTALS: 872 100.0% 100.0%
Variable: MD4OB Numeric Pos: (2) 307-307
IMPUTATION FLAG FOR VARIABLE 0408
RESPONSE CODES FREDPER-CENT
WGHTDPCT
Not imputed 0 801 91.9% 92.7%
Regression based 1 58 6.7% 6.0%
Dont know imputd 3 13 1.5% 1.3%
TOTALS: 872 100.0% 100.0%
Variable: MD4081 Numeric Pos: (2) 308-308
IMPUTATION FLAG FOR VARIABLE 04081
RESPONSE
PER- WGHTD
CODES FRED CENT PCT
Not imputed 0 791 90.7% 92.0%
Regression based 1 81 9.3% 8.0%
TOTALS: 872 100.0% 100.0%
Variable: i4D4082 Numeric Pos: (2) 309-309
IMPUTATION FLAG FOR VARIABLE 04082
RESPONSE
PER- WGHTD
CODES FRED CENT PCT
Not imputed 0 721 82.7% 87.7%
Regression based 1 151 17.3% 12.3%
TOTALS: 872 100.0% 100.0%
Variable: M040C Numeric Pos: (2) 310-310
IMPUTATION FLAG FOR VARIABLE D40C
,RESPONSE CODES FRED
PER-CENT
WGHTDPCT'
Not imputed 0 764 87.6% 88.8%
Regression based 1 89 10.2% 9.2%
Dont know imputd 3 19 2.2% 2.0%
TOTALS: 872 100.0% 100.0%
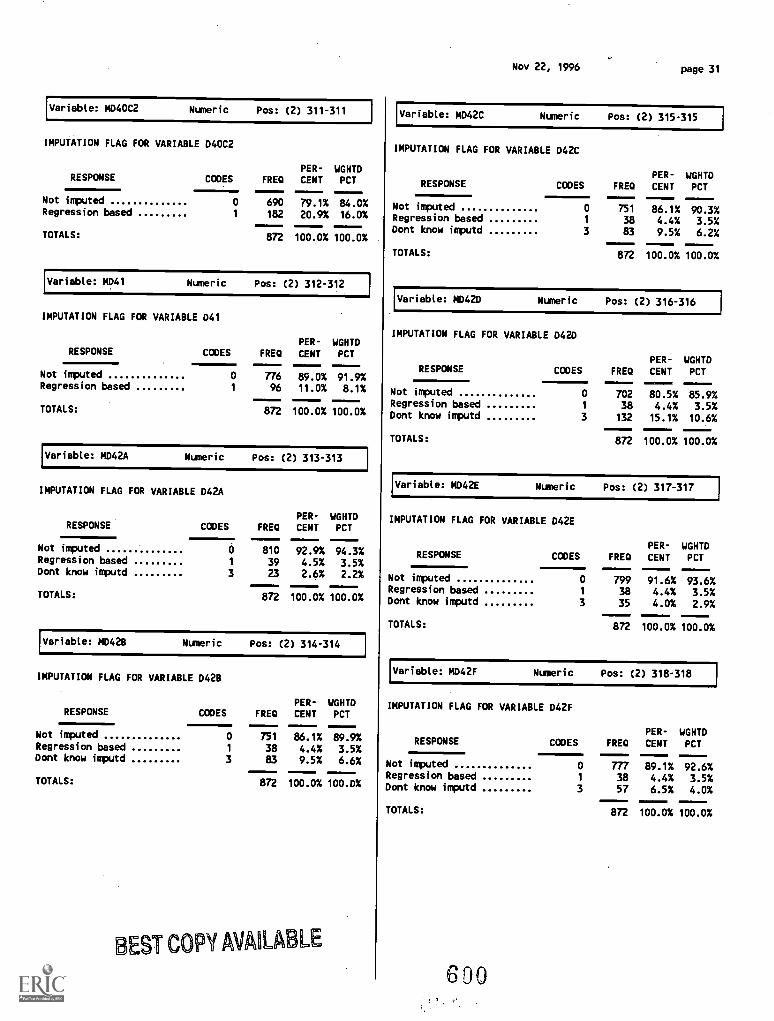
Variable: MD40C2 Numeric Pos: (2) 311-311
IMPUTATION FLAG FOR VARIABLE 040C2
RESPONSEPER- WGHTD
CODES FREQ CENT PCT
Not imputed 0 690 79.1% 84.0%Regression based 1 182 20.9% 16.0%
TOTALS: 872 100.0% 100.0%
Variable: MD41 Numeric Pos: (2) 312-312
IMPUTATION FLAG FOR VARIABLE D41
RESPONSEPER- WGHTD
CODES FREQ CENT PCT
Not imputed 0 776 89.0% 91.9%Regression based 1 96 11.0% 8.1%
TOTALS: 872 100.0% 100.0%
Variable: MD42A Numeric Pos: (2) 313-313
IMPUTATION FLAG FOR VARIABLE D42A
RESPONSE CODES FREQPER-CENT
WGHTDPCT
Not imputed 0 810 92.9% 94.3%Regression based 1 39 4.5% 3.5%Dont know imputd 3 23 2.6% 2.2%
TOTALS: 872 100.0% 100.0%
Variable: MD42B Numeric Pos: (2) 314-314
IMPUTATION FLAG FOR VARIABLE D428
RESPONSE CODES FREQPER-CENT
WGHTDPCT
Not imputed 0 751 86.1% 89.9%Regression based 1 38 4.4% 3.5%Dont know imputd 3 83 9.5% 6.6%
TOTALS: 872 100.0% 100.0%
BEST C PY AVAILI LE
Nov 22, 1996 page 31
Variable: MD42C Numeric Pos: (2) 315-315
IMPUTATION FLAG FOR VARIABLE D42C
RESPONSE CODES FREQPER-CENT
WGHTDPCT
Not imputed 0 751 86.1% 90.3%Regression based 1 38 4.4% 3.5%Dont know imputd 3 83 9.5% 6.2%
TOTALS: 872 100.0% 100.0%
Variable: MD420 Numeric Pos: (2) 316-316
IMPUTATION FLAG FOR VARIABLE D42D
RESPONSE CODES FREDPER-CENT
WGHTDPCT
Not imputed 0 702
11111=
80.5% 85.9%Regression based 1 38 4.4% 3.5%Dont know imputd 3 132 15.1% 10.6%
TOTALS: 872 100.0% 100.0%
Variable: MD42E Numeric Pos: (2) 317-317
IMPUTATION FLAG FOR VARIABLE D42E
RESPONSE CODES FREQPER-
CENTWGHTDPCT
Not imputed 0 799 91.6% 93.6%Regression based 1 38 4.4% 3.5%Dont know imputd 3 35 4.0% 2.9%
TOTALS: 872 100.0% 100.0%
Variable: MD42F Numeric Pos: (2) 318-318
IMPUTATION FLAG FOR VARIABLE D42F
RESPONSE CODES FREDPER-CENT
WGHTDPCT
Not imputed 0 777 89.1% 92.6%Regression based 1 38 4.4% 3.5%Dont know imputd 3 57 6.5% 4.0%
TOTALS: 872 100.0% 100.0%
00
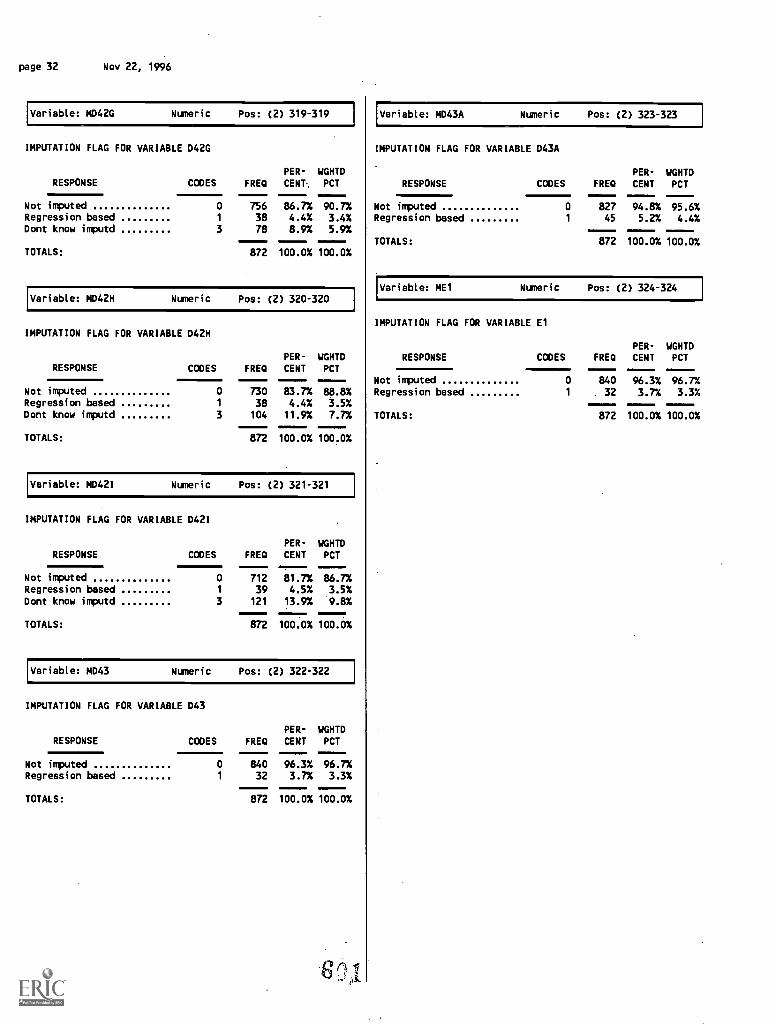
page 32 Nov 22, 1996
Variable: MD42G Numeric Pos: (2) 319-319
IMPUTATION FLAG FOR VARIABLE D42G
RESPONSE CODES FREQPER-
CENT-,
WGHTDPCT
Not imputed 0 756 86.7% 90.7%Regression based 1 38 4.4% 3.4%Dont know imputd 3 78 8.9% 5.9%
TOTALS: 872 100.0% 100.0%
Variable: MD42H Nuneric Pos: (2) 320-320
IMPUTATION FLAG FOR VARIABLE 042H
RESPONSE CODES FREQPER-
CENTWGHTDPCT
Not imputed 0 730 83.7% 88.8%Regression based 1 38 4.4% 3.5%Dont know inputd 3 104 11.9% 7.7%
TOTALS: 872 100.0% 100.0%
Variable: MD421 Nuneric Pos: (2) 321-321
IMPUTATION FLAG FOR VARIABLE D42I
RESPONSE CODES FREDPER-
CENTWGHTDPCT
Not imputed 0 712 81.7% 86.7%Regression based 1 39 4.5% 3.5%Dont know inputd 3 121 13.9% 9.8%
TOTALS: 872 100.0% 100.0%
Variable: MD43 Nuneric Pos: (2) 322-322
IMPUTATION FLAG FOR VARIABLE D43
PER- WGHTDRESPONSE CODES FRED CENT PCT
Not imputed 0 840 96.3% 96.7%Regression based 1 32 3.7% 3.3%
TOTALS: 872 100.0X 100.0%
6(
Variable: MD43A Numeric Pos: (2) 323-323
IMPUTATION FLAG FOR VARIABLE D43A
RESPONSEPER- WGHTD
CODES FREQ CENT PCT
Not imputed 0 827 94.8% 95.6%Regression based 1 45 5.2% 4.4%
TOTALS: 872 100.0% 100.0%
Variable: ME1 Nuneric Pos: (2) 324-324
IMPUTATION FLAG FOR VARIABLE El
RESPONSEPER- WGHTD
CODES FREQ CENT PCT
Not imputed 0 840 96.3% 96.7%Regression based 1 32 3.7% 3.3%
TOTALS: 872 100.0% 100.0%
1993 National Study of Postsecondary FacultyMethodology Report
Imputation Flags for the Faculty Data File (Restricted-use)
602
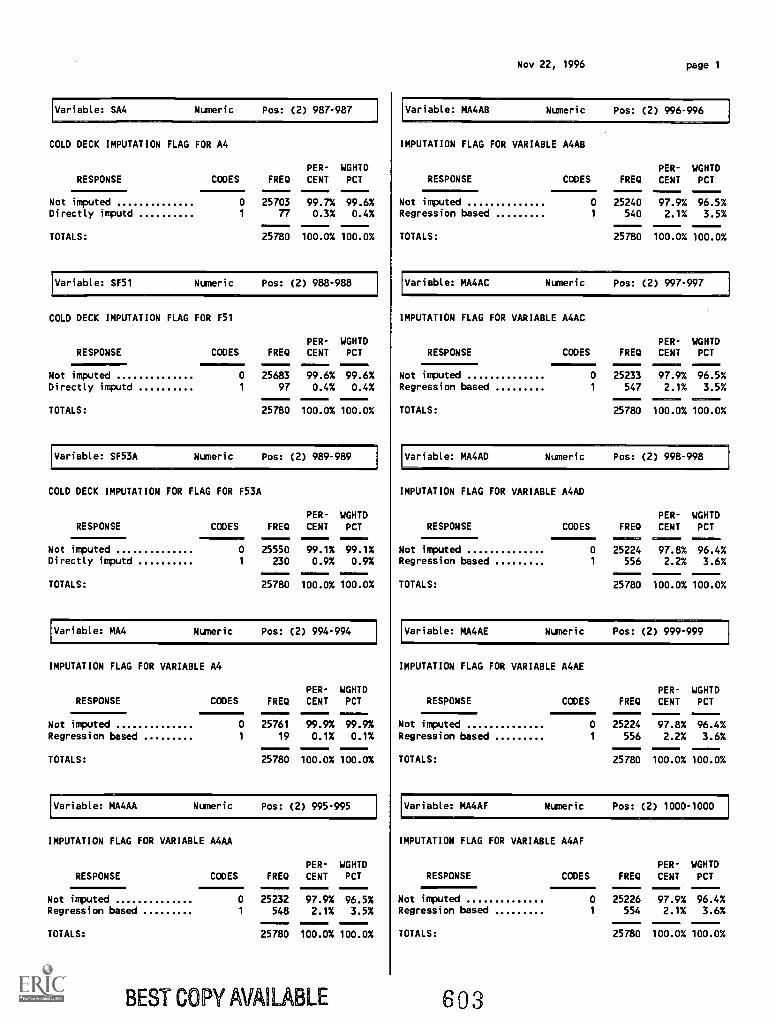
Variable: SA4 Numeric Pos: (2) 987-987
COLD DECK IMPUTATION FLAG FOR A4
PER- WGHTDRESPONSE CODES FRED CENT PCT
Not imputed 0 25703 99.7% 99.6%Directly imputd 1 77 0.3% 0.4%
TOTALS: 25780 100.0% 100.0%
Variable: SF51 Numeric Pos: (2) 988-988
COLD DECK IMPUTATION FLAG FOR F51
RESPONSEPER- WGHTD
CODES FRB! CENT PCT
Not imputed 0 25683 99.6% 99.6%Directly imputd 1 97 0.4% 0.4%
TOTALS: 25780 100.0% 100.0%
Variable: SF53A Numeric Pos: (2) 989-989
COLD DECK IMPUTATION FOR FLAG FOR F53A
PER- WGHTDRESPONSE CODES FREQ CENT PCT
Not imputed 0 25550 99.1% 99.1%Directly imputd 1 230 0.9% 0.9%
TOTALS: 25780 100.0% 100.0%
Variable: MA4 Numeric Pos: (2) 994-994
IMPUTATION FLAG FOR VARIABLE A4
RESPONSEM11=2=111EM
PER- WGHTDCODES FRED CENT PCT
Not imputed 0 25761 99.9% 99.9%Regression based 1 19 0.1% 0.1%
TOTALS: 25780 100.0% 100.0%
Variable: MA4AA Numeric Pos: (2) 995-995
IMPUTATION FLAG FOR VARIABLE A4AA
RESPONSEPER- WGHTD
CODES FREQ CENT PCT
Not imputed 0 25232 97.9% 96.5%Regression based 1 548 2.1% 3.5%
TOTALS: 25780 100.0% 100.0%
Nov 22, 1996 page 1
Variable: MA4AB Numeric Pos: (2) 996-996
IMPUTATION FLAG FOR VARIABLE A4AB
RESPONSEPER- WGHTD
CODES FRED CENT PCT
Not imputed 0 25240 97.9% 96.5%Regression based 1 540 2.1% 3.5%
TOTALS: 25780 100.0% 100.0%
Variable: MA4AC Numeric Pos: (2) 997-997
IMPUTATION FLAG FOR VARIABLE A4AC
RESPONSEPER- WGHTD
CODES FRB] CENT PCT
Not imputed 0 25233
-----97.9% 96.5%
Regression based 1 547 2.1% 3.5%
TOTALS: 25780 100.0% 100.0%
Variable: MA4AD Numeric Pos: (2) 998-998
IMPUTATION FLAG FOR VARIABLE A4AD
RESPONSEPER- WGHTD
CODES FRED CENT PCT
Not imputed 0 25224 97.8% 96.4%Regression based 1 556 2.2% 3.6%
TOTALS: 25780 100.0% 100.0%
Variable: MA4AE Numeric Pos: (2) 999-999
IMPUTATION FLAG FOR VARIABLE A4AE
RESPONSEPER- WGHTD
CODES FRED CENT PCT
Not imputed 0 25224 97.8% 96.4%Regression based 1 556 2.2% 3.6%
TOTALS: 25780 100.0% 100.0%
Variable: MA4AF Numeric Pos: (2) 1000-1000
IMPUTATION FLAG FOR VARIABLE A4AF
RESPONSEPER- WGHTD
CODES FRED CENT PCT
Not imputed 0 25226 97.9% 96.4%Regression based 1 554 2.1% 3.6%
TOTALS: 25780 100.0% 100.0%
BEST COPY AVAI ABLE 6 03
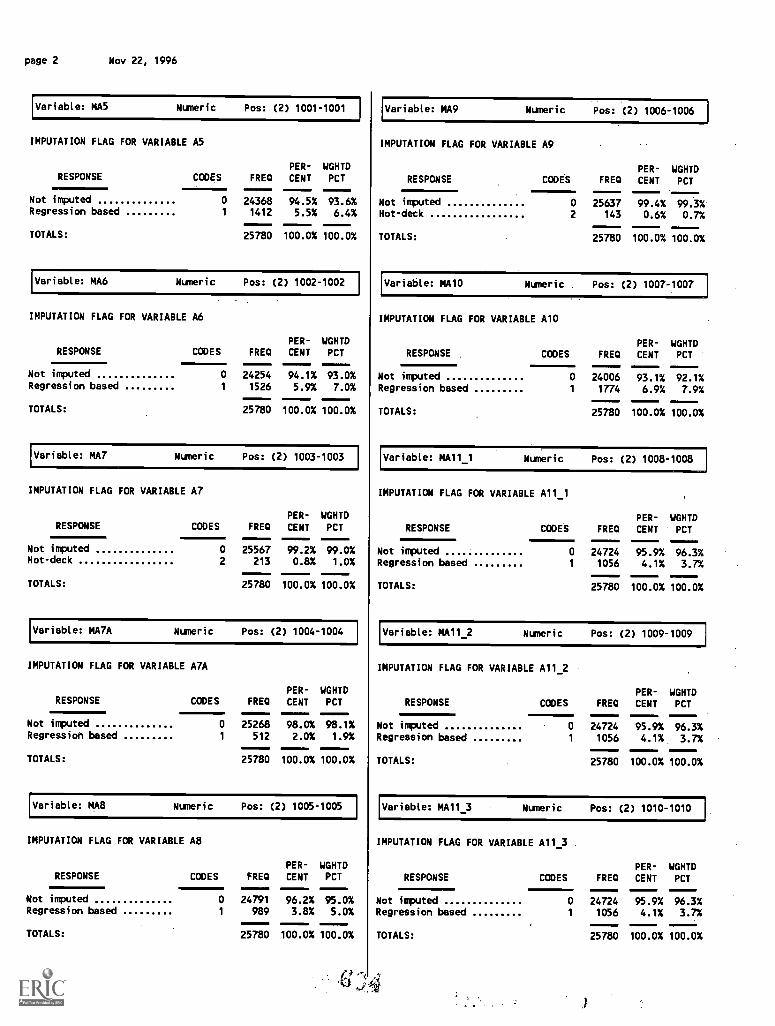
page 2 Nov 22, 1996
Variable: MA5 Numeric Pos: (2) 1001-1001
IMPUTATION FLAG FOR VARIABLE A5
PER- WGHTDRESPONSE CODES FREQ CENT PCT
Not imputed 0 24368 94.5% 93.6%Regression based 1 1412 5.5% 6.4%
TOTALS: 25780 100.0% 100.0%
Variable: MA6 Numeric Pos: (2) 1002-1002
IMPUTATION FLAG FOR VARIABLE A6
PER- WGHTDRESPONSE CODES FREQ CENT PCT
Not imputed 0 24254 94.1% 93.0%Regression based 1 1526 5.9% 7.0%
TOTALS: 25780 100.0% 100.0%
Variable: MA7 Numeric Pos: (2) 1003-1003
IMPUTATION FLAG FOR VARIABLE A7
PER- WGHTDRESPONSE CODES FREQ CENT PCT
Not imputed 0 25567 99.2% 99.0%Hot-deck 2 213 0.8% 1.0%
TOTALS: 25780 100.0% 100.0%
Variable: MA7A Numeric Pos: (2) 1004-1004
IMPUTATION FLAG FOR VARIABLE A7A
PER- WGHTDRESPONSE CODES FREQ CENT PCT
Not imputed 0 25268 98.0% 98.1%Regression based 1 512 2.0% 1.9%
TOTALS: 25780 100.0% 100.0%
Variable: MA8 Numeric Pos: (2) 1005-1005
IMPUTATION FLAG FOR VARIABLE A8
PER- WGHTDRESPONSE CODES FREQ CENT PCT
Not imputed 0 24791 96.2% 95.0%Regression based 1 989 3.8% 5.0%
TOTALS: 25780 100.0% 100.0%
Variable: MA9 Numeric Pos: (2) 1006-1006
IMPUTATION FLAG FOR VARIABLE A9
RESPONSEPER- WGHTD
CODES FREQ CENT PCT
Not imputed 0 25637 99.4% 99.3%Hot-deck 2 143 0.6% 0.7%
TOTALS: 25780 100.0% 100.0%
Variable: MA10 Numeric . Pos: (2) 1007-1007
IMPUTATION FLAG FOR VARIABLE A10
RESPONSEPER- WGHTD
CODES FREQ CENT PCT
Not imputed 0 24006 93.1% 92.1%Regression based 1 1774 6.9% 7.9%
TOTALS: 25780 100.0% 100.0%
Variable: MA11_1 Numeric Pos: (2) 1008-1008
IMPUTATION FLAG FOR VARIABLE A11_1
RESPONSEPER- WGHTD
CODES FREQ CENT PCT
Not imputed 0 24724 95.9% 96.3%Regression based 1 1056 4.1% 3.7%
TOTALS: 25780 100.0% 100.0%
Variable: MA11_2 Numeric Pos: (2) 1009-1009
IMPUTATION FLAG FOR VARIABLE A11_2
RESPONSEPER- WGHTD
CODES FREQ CENT PCT
Not imputed 0 24724 95.9% 96.3%Regression based 1 1056 4.1%. 3.7%
TOTALS: 25780 100.0% 100.0%
Variable: MA11_3 Numeric Pos: (2) 1010-1010
IMPUTATION FLAG FOR VARIABLE A11_3 .
RESPONSEPER- WGHTD
CODES FREQ CENT PCT
Not imputed 0 24724 95.9% 96.3%Regression based 1 1056 4.1% 3.7%
TOTALS: 25780 100.0% 100.0%
.
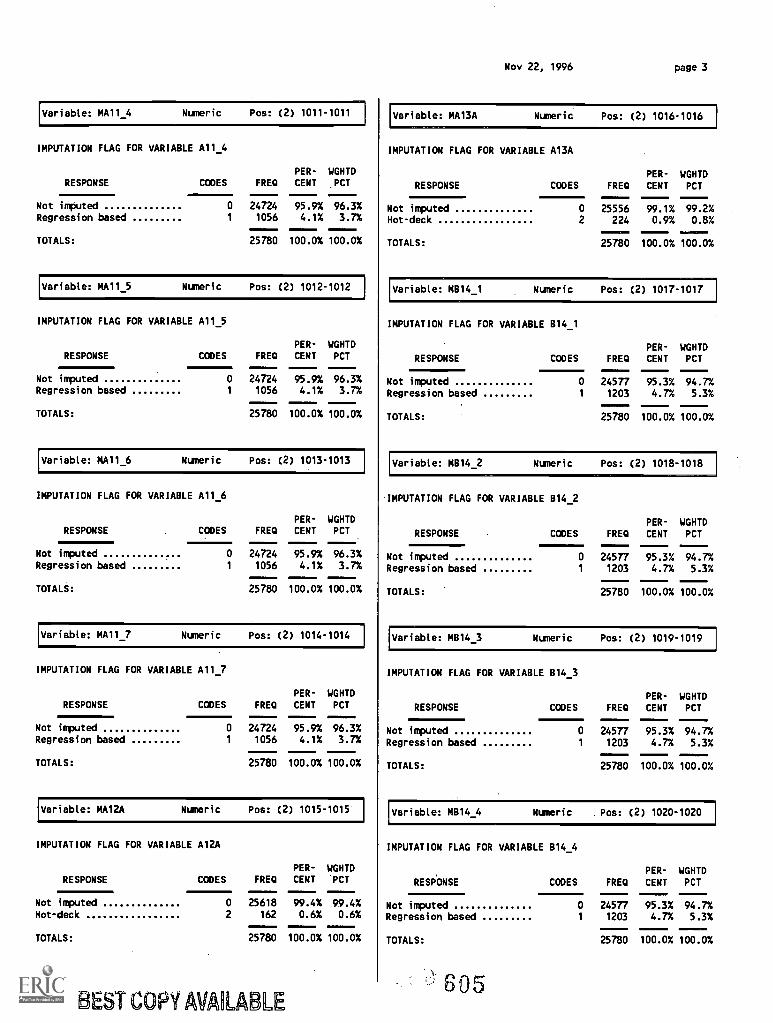
Variable: MA11_4 Numeric Pos: (2) 1011-1011
IMPUTATION FLAG FOR VARIABLE A11_4
PER- WGHTDRESPONSE CODES FRS) CENT _PCT
Not imputed 0 24724 95.9% 96.3%Regression based 1 1056 4.1% 3.7%
TOTALS: 25780 100.0% 100.0%
Variable: MA11_5 Numeric Dos: (2) 1012-1012
IMPUTATION FLAG FOR VARIABLE A115
RESPONSEPER- WGHTD
CODES FRED CENT PCT
Not imputed 0 24724 95.9% 96.3%Regression based 1 1056 4.1% 3.7%
TOTALS: 25780 100.0% 100.0%
Variable: MA11_6 Nuneric Pos: (2) 1013-1013
IMPUTATION FLAG FOR VARIABLE A11_6
RESPONSEPER- WGHTD
CODES FRED CENT PCT
Not imputed 0 24724 95.9% 96.3%Regression based 1 1056 4.1% 3.7%
TOTALS: 25780 100.0% 100.0%
Variable: MA11_7 Numeric Pos: (2) 1014-1014
IMPUTATION FLAG FOR VARIABLE A11_7
RESPONSEPER- WGHTD
CODES FRED CENT PCT
Not imputed 0 24724 95.9% 96.3%Regression based 1 1056 4.1% 3.7%
TOTALS: 25780 100.0% 100.0%
Variable: MA12A Numeric Pos: (2) 1015-1015
IMPUTATION FLAG FOR VARIABLE Al2A
PER- WGHTDRESPONSE CODES FRED CENT PCT
Not imputed 0 25618 99.4% 99.4%Hot -deck 2 162 0.6% 0.6%
TOTALS: 25780 100.0% 100.0%
BEST COPY AVAOLABLE
Nov 22, 1996 page 3
Variable: MA13A Nuneric Pos: (2) 1016-1016
IMPUTATION FLAG FOR VARIABLE A13A
RESPONSEPER- WGHTD
CODES FRED CENT PCT
Not imputed 0 25556 99.1% 99.2%Hot-deck 2 224 0.9% 0.8%
TOTALS: 25780 100.0% 100.0%
Variable: MB14_1 Numeric Pos: (2) 1017-1017
IMPUTATION FLAG FOR VARIABLE 814_1
RESPONSEPER- WGHTD
CODES FRED CENT PCT
Not imputed 0 24577 95.3% 94.7%Regression based 1 1203 4.7% 5.3%
TOTALS: 25780 100.0% 100.0%
Variable: MB14_2 Nuneric Pos: (2) 1018-1018
IMPUTATION FLAG FOR VARIABLE 814_2
RESPONSEPER- WGHTD
CODES FRED CENT PCT
Not imputed 0 24577 95.3% 94.7%Regression based 1 1203 4.7% 5.3%
TOTALS: 25780 100.0% 100.0%
Variable: MB14_3 Numeric Pos: (2) 1019-1019
IMPUTATION FLAG FOR VARIABLE 814_3
RESPONSEPER- WGHTD
CODES FRED CENT PCT
Not imputed 0 24577 95.3% 94.7%Regression based 1 1203 4.7% 5.3%
TOTALS: 25780 100.0% 100.0%
Variable: MB14_4 Numeric Pos: (2) 1020-1020
IMPUTATION FLAG FOR VARIABLE 814_4
RESPONSEPER- WGHTD
CODES FRED CENT PCT
Not imputed 0 24577 95.3% 94.7%Regression based 1 1203 4.7% 5.3%
TOTALS: 25780 100.0% 100.0%
605
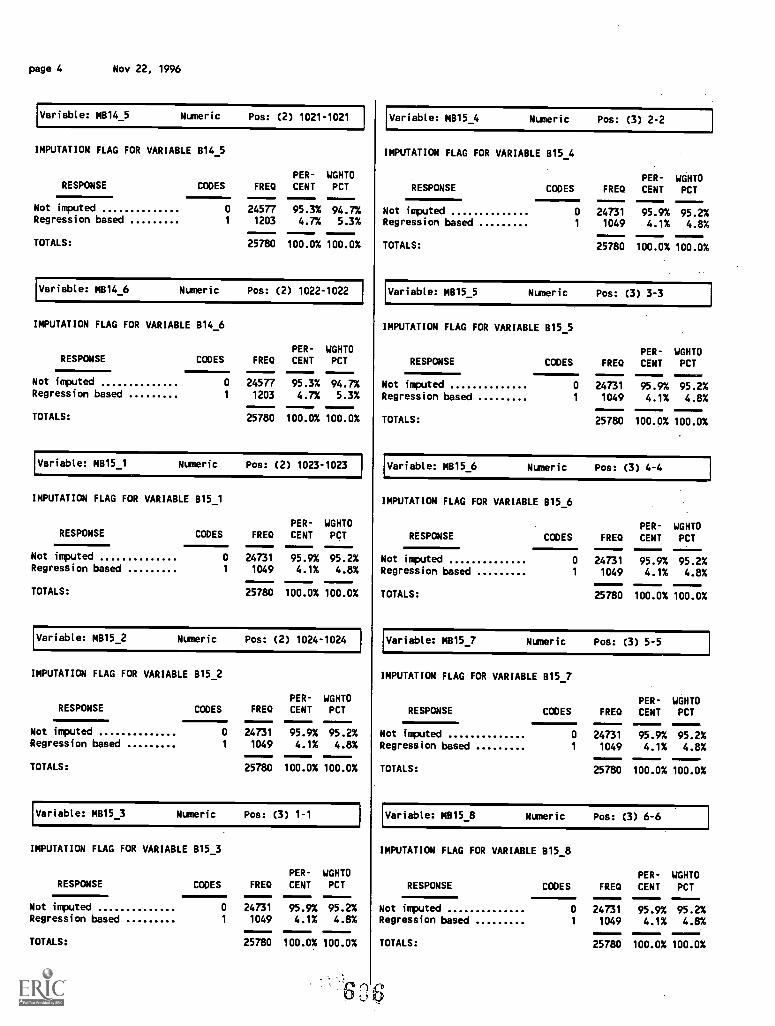
page 4 Nov 22, 1996
Variable: MB14_5 Numeric Pos: (2) 1021-1021
IMPUTATION FLAG FOR VARIABLE 814_5
RESPONSEPER- WGHTD
CODES FREQ CENT PCT
Not imputed 0 24577 95.3% 94.7%Regression based 1 1203 4.7% 5.3%
TOTALS: 25780 100.0% 100.0%
Variable: MB14_6 Numeric Pos: (2) 1022-1022
IMPUTATION FLAG FOR VARIABLE 814_6
RESPONSEPER- WGHTD
CODES FRED CENT PCT
Not imputed 0 24577 95.3% 94.7%Regression based 1 1203 4.7% 5.3%
TOTALS: 25780 100.0% 100.0%
Variable: MB15_1 Numeric Pos: (2) 1023-1023
IMPUTATION FLAG FOR VARIABLE 815_1
PER- WGHTDRESPONSE CODES FREQ CENT PCT
Not imputed 0 24731 95.9% 95.2%Regression based 1 1049 4.1% 4.8%
TOTALS: 25780 100.0% 100.0%
Variable: MB15_2 Numeric Pos: (2) 1024-1024
IMPUTATION FLAG FOR VARIABLE B15_2
RESPONSEPER- WGHTD
CODES FREQ CENT PCT
Not imputed 0 24731 95.9% 95.2%Regression based 1 1049 4.1% 4.8%
TOTALS: 25780 100.0% 100.0%
Variable: MB15 3 Numeric Pos: (3) 1-1
IMPUTATION FLAG FOR VARIABLE 815_3
PER- WGHTDRESPONSE CODES FREQ CENT PCT
Not imputed 0 24731 95.9% 95.2%Regression based 1 1049 4.1% 4.8%
TOTALS: 25780 100.0% 100.0%
Variable: MB154 Numeric Pos: (3) 2-2
IMPUTATION FLAG FOR VARIABLE 815_4
RESPONSEPER- WGHTD
CODES FREQ CENT PCT
Not imputed 0 24731 95.9% 95.2%Regression based 1 1049 4.1% 4.8%
TOTALS: 25780 100.0% 100.0%
Variable: MB15_5 Numeric Pos: (3) 3-3
IMPUTATION FLAG FOR VARIABLE 815_5
RESPONSEPER- WGHTD
CODES FREQ CENT PCT
Not imputed 0 24731 95.9% 95.2%Regression based 1 1049 4.1% 4.8%
TOTALS: 25780 100.0% 100.0%
Variable: MB15_6 Numeric Pos: (3) 4-4
IMPUTATION FLAG FOR VARIABLE 815_6
RESPONSEPER- WGHTD
CODES FRED CENT PCT
Not imputed 0 24731 95.9% 95.2%Regression based 1 1049 4.1% 4.8%
TOTALS: 25780 100.0% 100.0%
Variable: MB15_7 Numeric Pos: (3) 5-5
IMPUTATION FLAG FOR VARIABLE 815_7
RESPONSEPER- WGHTD
CODES FRED CENT PCT
Not imputed 0 24731 95.9% 95.2%Regression based 1 1049 4.1% 4.8%
TOTALS: 25780 100.0% 100.0%
Variable: MB15_8 Numeric Pos: (3) 6-6
IMPUTATION FLAG FOR VARIABLE 815_8
RESPONSEPER- WGHTD
CODES FREQ CENT PCT
Not imputed 0 24731 95.9% 95.2%Regression based 1 1049 4.1% 4.8%
TOTALS: 25780 100.0% 100.0%
63$
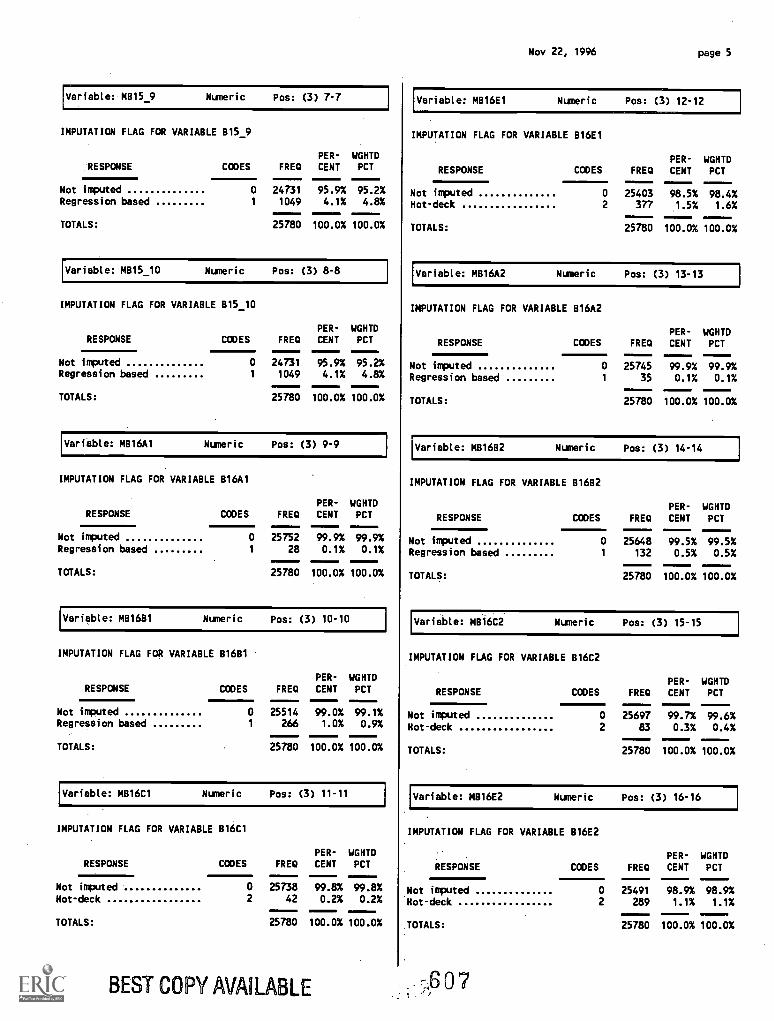
Variable: MB15_9 Numeric Pos: (3) 7-7
IMPUTATION FLAG FOR VARIABLE B15_9
PER- WGHTDRESPONSE CODES FRED CENT PCT
Not imputed 0 24731 95.9% 95.2%Regression based 1 1049 4.1% 4.8%
TOTALS: 25780 100.0% 100.0%
Variable: MB15_10 Numeric Pos: (3) 8-8
IMPUTATION FLAG FOR VARIABLE 815_10
PER- WGHTDRESPONSE CODES FRED CENT PCT
Not imputed 0 24731 95.9% 95.2%Regression based 1 1049 4.1% 4.8%
TOTALS: 25780 100.0% 100.0%
Variable: MB16A1 Numeric Pos: (3) 9-9
IMPUTATION FLAG FOR VARIABLE 816A1
RESPONSEPER- WGHTD
CODES FREQ CENT PCT
Not imputed 0 25752 99.9% 99.9%Regression based 1 28 0.1% 0.1%
TOTALS: 25780 100.0% 100.0%
Variable: M81681 Numeric Pos: (3) 10-10
IMPUTATION FLAG FOR VARIABLE 81681
RESPONSEPER- WGHTD
CODES FRED CENT PCT
Not imputed 0 25514 99.0% 99.1%Regression based 1 266 1.0% 0.9%
TOTALS: 25780 100.0% 100.0%
Variable: MB16C1 Numeric Pos: (3) 11-11
IMPUTATION FLAG FOR VARIABLE 1316C1
PER- WGHTDRESPONSE CODES FRED CENT PCT
Not imputed 0 25738 99.8% 99.8%Hot-deck 2 42 0.2% 0.2%
TOTALS: 25780 100.0% 100.0%
BEST COPY AVAILABLE
Nov 22, 1996 page 5
Variable: MB16E1 Numeric Pos: (3) 12-12
IMPUTATION FLAG FOR VARIABLE 816E1
RESPONSE CODES FREDPER-
CENTWGHTDPCT
Not imputed 0 25403 98.5% 98.4%Hot-deck 2 377 1.5% 1.6%
TOTALS: 25780 100.0% 100.0%
'Variable: MB16A2 Numeric Pos: (3) 13-13
IMPUTATION FLAG FOR VARIABLE 816A2
RESPONSEPER- WGHTD
CODES FRED CENT PCT
Not imputed 0 25745 99.9% 99.9%Regression based 1 35 0.1% 0.1%
TOTALS: 25780 100.0% 100.0%
Variable: MB16B2 Numeric Pos: (3) 14-14
IMPUTATION FLAG FOR VARIABLE 81682
RESPONSEPER- WGHTD
CODES FREQ CENT PCT
Not imputed 0 25648 99.5% 99.5%Regression based 1 132 0.5% 0.5%
TOTALS: 25780 100.0% 100.0%
Variable: MB16C2 Numeric Pos: (3) 15-15
IMPUTATION FLAG FOR VARIABLE 816C2
RESPONSEPER- WGHTD
CODES FRED CENT PCT
Not imputed 0 25697 99.7% 99.6%Hot-deck 2 83 0.3% 0.4%
TOTALS: 25780 100.0% 100.0%
Variable: MB16E2 Numeric Pos: (3) 16-16
IMPUTATION FLAG FOR VARIABLE B16E2
RESPONSEPER- WGHTD
CODES FRED CENT PCT
Not imputed 0 25491 98.9% 98.9%Hot -deck 2 289 1.1% 1.1%
TOTALS: 25780 100.0% 100.0%
0 '7
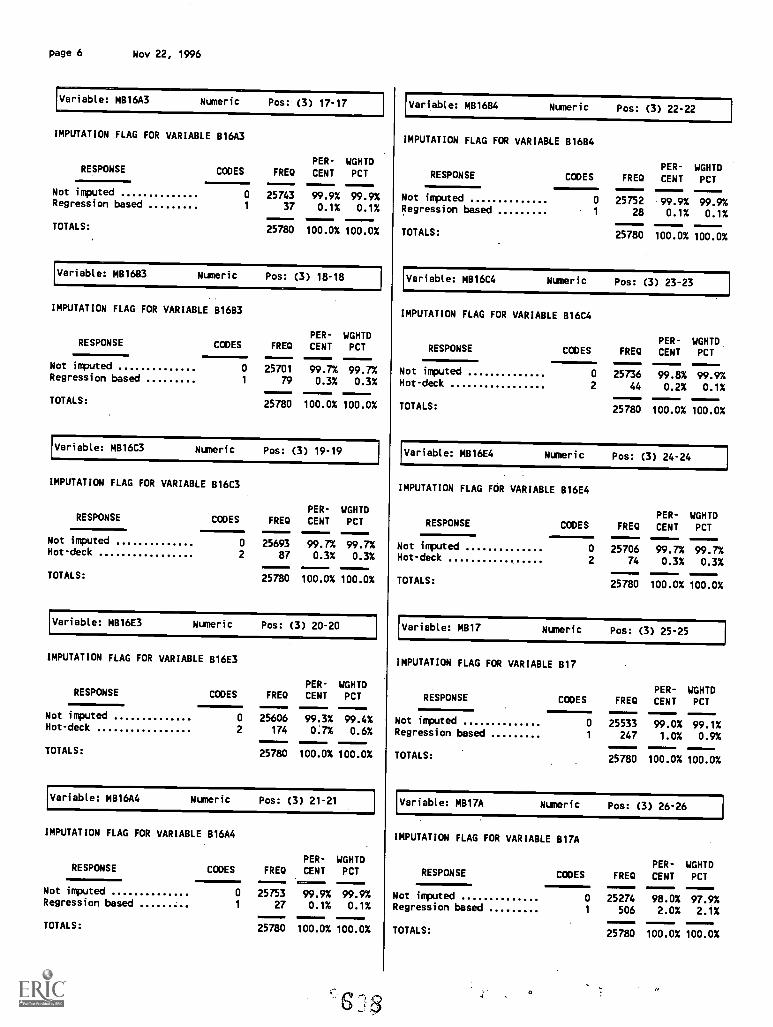
page 6 Nov 22, 1996
Variable: MB16A3 Numeric Pos: (3) 17-17
IMPUTATION FLAG FOR VARIABLE 816A3
RESPONSE CODESPER- WGHTD
FRED CENT PCT
Not imputed 0 25743 99.9% 99.9%Regression based 1 37 0.1% 0.1%
TOTALS: 25780 100.0% 100.0%
Variable: MB16B3 Numeric Pos: (3) 18-18
IMPUTATION FLAG FOR VARIABLE 81683
RESPONSEPER- WGHTD
CODES FREQ CENT PCT
Not imputed 0 25701 99.7% 99.7%Regression based 1 79 0.3% 0.3%
TOTALS: 25780 100.0% 100.0%
Variable: MB16C3 Numeric Pos: (3) 19-19
IMPUTATION FLAG FOR VARIABLE 816C3
PER- WGHTDRESPONSE CODES FRED CENT PCT
Not imputed 0 25693 99.7% 99.7%Hot-deck 2 87 0.3% 0.3%
TOTALS: 25780 100.0% 100.0%
Variable: MB16E3 Numeric Pos: (3) 20.20
IMPUTATION FLAG FOR VARIABLE 816E3
RESPONSEPER- WGHTD
CODES FREQ CENT PCT
Not imputed 0 25606 99.3% 99.4%Hot-deck 2 174 0.7% 0.6%
TOTALS: 25780 100.0% 100.0%
Variable: MB16A4 Numeric Pos: (3) 21-21
IMPUTATION FLAG FOR VARIABLE 816A4
PER- WGHTDRESPONSE CODES FRED CENT PCT
Not imputed 0 25753 99.9% 99.9%Regression based 1 27 0.1% 0.1%
TOTALS: 25780 100.0% 100.0%
Variable: MB1684 Numeric Pos: (3) 22-22
IMPUTATION FLAG FOR VARIABLE 81684
RESPONSEeilmmsm
PER- WGHTDCODES FRED CENT PCT
Not imputed 0 25752 99.9% 99.9%Regression based 1 28 0.1% 0.1%
TOTALS: 25780 100.0% 100.0%
Variable: MB16C4 Numeric Pos: (3) 23-23
IMPUTATION FLAG FOR VARIABLE 816C4
RESPONSEPER- WGHTD
CODES FRED CENT PCT
Not imputed 0 25736 99.8% 99.9%Hot-deck 2 44 0.2% 0.1%
TOTALS: 25780 100.0% 100.0%
Variable: MB16E4 Numeric Pos: (3) 24-24
IMPUTATION FLAG FOR VARIABLE 816E4
RESPONSEPER- WGHTD
CODES FRED CENT PCT
Not imputed 0 25706 99.7% 99.7%Hot-deck 2 74 0.3% 0.3%
TOTALS: 25780 100.0% 100.0%
Variable: M817 Numeric Pos: (3) 25-25
IMPUTATION FLAG FOR VARIABLE 817
RESPONSEPER- WGHTD
CODES FRED CENT PCT
Not imputed 0 25533 99.0% 99.1%Regression based 1 247 1.0% 0.9%
TOTALS: 25780 100.0% 100.0%
Variable: MB17A Numeric Pos: (3) 26-26
IMPUTATION FLAG FOR VARIABLE B17A
RESPONSEPER- WGHTD
CODES FRED CENT PCT
Not imputed 0 25274 98.0% 97.9%Regression based 1 506 2.0% 2.1%
TOTALS: 25780 100.0% 100.0%
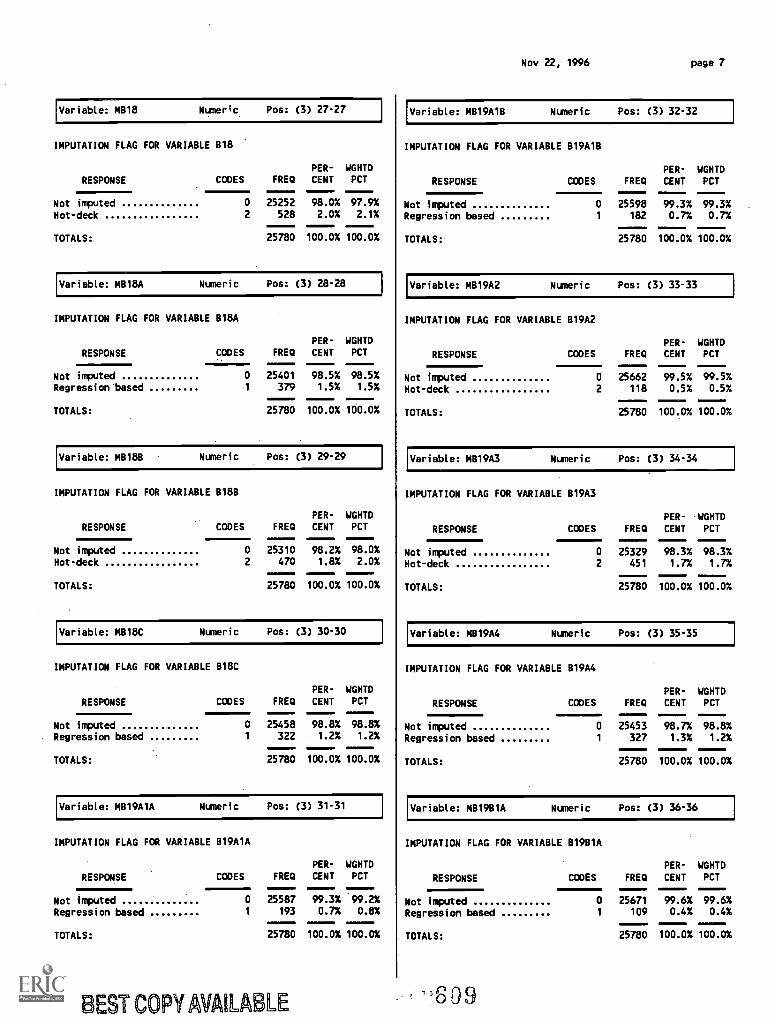
Variable: MB18 Numeric Pos: (3) 27-27
IMPUTATION FLAG FOR VARIABLE B18
PER- WGHTD
RESPONSE CODES FREQ CENT PCT
Not imputed 0 25252 98.0% 97.9%
Hot-deck 2 528 2.0% 2.1%
TOTALS: 25780 100.0% 100.0%
Variable: MB18A Nuneric Pos: (3) 28-28
IMPUTATION FLAG FOR VARIABLE 818A
PER- WGHTD
RESPONSE CODES FREQ CENT PCT
Not imputed 0 25401 98.5% 98.5%Regression'based 1 379 1.5% 1.5%
TOTALS: 25780 100.0% 100.0%
Variable: M8188 Numeric Pos: (3) 29-29
IMPUTATION FLAG FOR VARIABLE 8188
RESPONSE
PER- WGHTDCODES FREQ CENT PCT
Not imputed 0 25310 98.2% 98.0%
Hot-deck 2 470 1.8% 2.0%
TOTALS: 25780 100.0% 100.0%
Variable: MB18C Nuneric Pos: (3) 30-30
IMPUTATION FLAG FOR VARIABLE 818C
RESPONSE
PER- WGHTD
CODES FREQ CENT PCT
Not imputed 0 25458 98.8% 98.8%
Regression based 1 322 1.2% 1.2%
TOTALS: 25780 100.0% 100.0%
Variable: MB19A1A Nuneric Pos: (3) 31-31
IMPUTATION FLAG FOR VARIABLE B19AIA
PER- WGHTD
RESPONSE CODES FREQ CENT PCT
Not imputed 0 25587 99.3% 99.2%
Regression based 1 193 0.7% 0.8%
TOTALS: 25780 100.0% 100.0%
BEST COPY AVAILABLE
Nov 22, 1996 page 7
Variable: MB19A1B Nuneric Pos: (3) 32-32
IMPUTATION FLAG FOR VARIABLE 819A18
RESPONSE
PER- WGHTDCODES FREQ CENT PCT
Not imputed 0 25598 99.3% 99.3%Regression based 1 182 0.7% 0.7%
TOTALS: 25780 100.0% 100.0%
Variable: MB19A2 Nuneric Pos: (3) 33-33
IMPUTATION FLAG FOR VARIABLE 819A2
RESPONSEPER- WGHTD
CODES FREQ CENT PCT
Not imputed 0 25662 99.5% 99.5%
Hot-deck 2 118 0.5% 0.5%
TOTALS: 25780 100.0% 100.0%
Variable: MB19A3 Numeric Pos: (3) 34-34
IMPUTATION FLAG FOR VARIABLE 819A3
RESPONSE
PER- WGHTD
CODES FREO CENT PCT
Not imputed 0 25329 98.3% 98.3%Hot-deck 2 451 1.7% 1.7%
TOTALS: 25780 100.0% 100.0%
Variable: MB19A4 Nuneric Pos: (3) 35-35
IMPUTATION FLAG FOR VARIABLE 819A4
RESPONSEPER- WGHTD
CODES FRB) CENT PCT
Not imputed 0 25453 98.7% 98.8%
Regression based 1 327 1.3% 1.2%
TOTALS: 25780 100.0% 100.0%
Variable: MB19BIA Nuneric Pos: (3) 36-36
IMPUTATION FLAG FOR VARIABLE 81981A
RESPONSE
PER- WGHTD
CODES FREQ CENT PCT
Not imputed 0 25671 99.6% 99.6%
Regression based 1 109 0.4% 0.4%
TOTALS: 25780 100.0% 100.0%
6O9
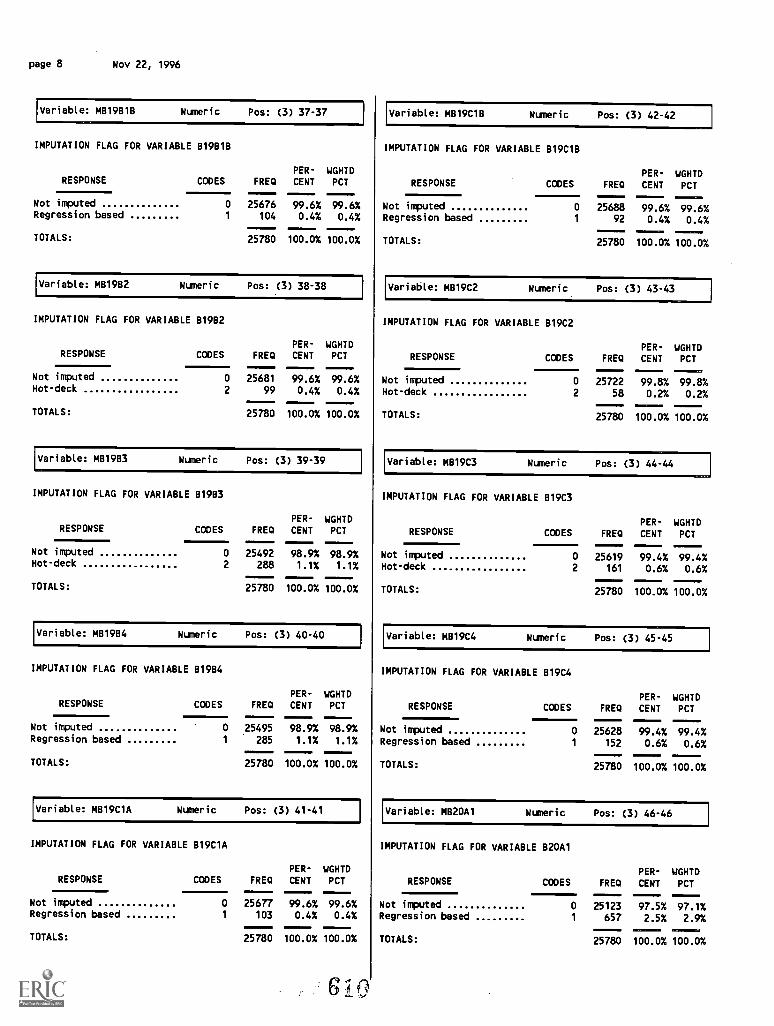
page 8 Nov 22, 1996
Variable: MB19818 Numeric Pos: (3) 37-37
IMPUTATION FLAG FOR VARIABLE B19818
RESPONSEPER- WGHTD
CODES FREQ CENT PCT
Not imputed 0 25676 99.6% 99.6%Regression based 1 104 0.4% 0.4%
TOTALS: 25780 100.0% 100.0%
Variable: M81982 Numeric Pos: (3) 38-38
IMPUTATION FLAG FOR VARIABLE 81982
PER- WGHTDRESPONSE CODES FREQ CENT PCT
Not imputed 0 25681 99.6% 99.6%Hot-deck 2 99 0.4% 0.4%
TOTALS: 25780 100.0% 100.0%
Variable: MB19B3 Numeric Pos: (3) 39-39
IMPUTATION FLAG FOR VARIABLE B1983
RESPONSEPER- WGHTD
CODES FREQ CENT PCT
Not imputed 0 25492 98.9% 98.9%Hot-deck 2 288 1.1% 1.1%
TOTALS: 25780 100.0% 100.0%
Variable: MB19B4 Numeric Pos: (3) 40-40
IMPUTATION FLAG FOR VARIABLE 81984
RESPONSEPER- WGHTD
CODES FREQ CENT PCT
Not imputed 0 25495 98.9% 98.9%Regression based 1 285 1.1% 1.1%
TOTALS: 25780 100.0% 100.0%
Variable: MB19C1A Numeric Pos: (3) 41-41
IMPUTATION FLAG FOR VARIABLE B19C1A
RESPONSEPER- WGHTD
CODES FREQ CENT PCT
Not imputed 0 25677 99.6% 99.6%Regression based 1 103 0.4% 0.4%
TOTALS: 25780 100.0% 100.0%
GI 3
Variable: MB19C1B Numeric Pos: (3) 42-42
IMPUTATION FLAG FOR VARIABLE B19C1B
RESPONSEPER- WGHTD
CODES FRED CENT PCT------..
Not imputed 0 25688 99.6% 99.6%Regression based 1 92 0.4% 0.4%
TOTALS: 25780
111111
100.0%
VIINNSMSNII
100.0%
Variable: MB19C2 Numeric Pos: (3) 43-43
IMPUTATION FLAG FOR VARIABLE El19C2
RESPONSEPER- WGHTD
CODES FRED CENT PCT
Not imputed 0 25722 99.8% 99.8%Hot-deck 2 58 0.2% 0.2%
TOTALS: 25780 100.0% 100.0%
Variable: MB19C3 Numeric Pos: (3) 44-44
IMPUTATION FLAG FOR VARIABLE 1319C3
RESPONSEPER- WGHTD
CODES FRED CENT PCT
Not imputed 0 25619 99.4% 99.4%Hot-deck 2 161 0.6% 0.6%
TOTALS: 25780 100.0% 100.0%
Variable: MB19C4 Numeric Pos: (3) 45-45
IMPUTATION FLAG FOR VARIABLE 819C4
RESPONSEPER- WGHTD
CODES FREQ CENT PCT
Not imputed 0 25628 99.4% 99.4%Regression based 1 152 0.6% 0.6%
TOTALS: 25780 100.0% 100.0%
Variable: MB20A1 Numeric Pos: (3) 46-46
IMPUTATION FLAG FOR VARIABLE B20A1
RESPONSEPER- WGHTD
CODES FRED CENT PCT
Not imputed 0 25123 97.5% 97.1%Regression based 1 657 2.5% 2.9%
TOTALS: 25780 100.0% 100.0%
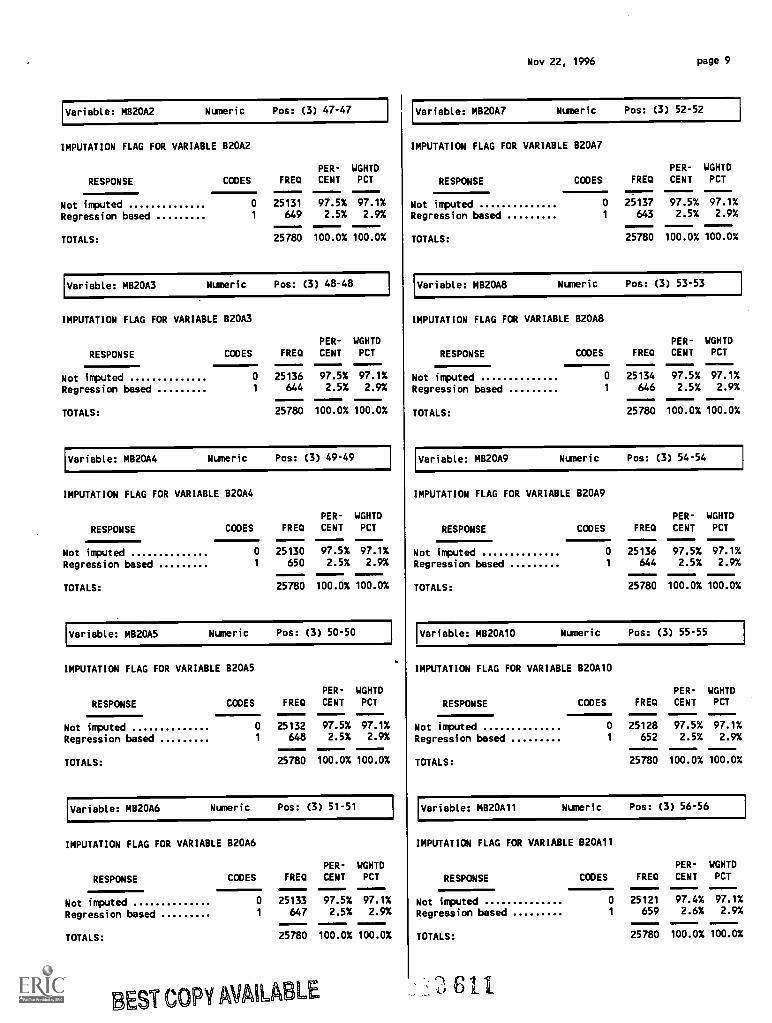
Variable: MB20A2 Numeric Pos: (3) 47-47
IMPUTATION FLAG FOR VARIABLE B20A2
PER- WGHTD
RESPONSE CODES FREQ CENT PCT
Not imputed 0 25131 97.5% 97.1%
Regression based 1 649 2.5% 2.9%
TOTALS: 25780 100.0% 100.0%
Variable: MB20A3 Numeric Pos: (3) 48-48
IMPUTATION FLAG FOR VARIABLE 820A3
PER- WGHTD
RESPONSE CODES FREQ CENT PCT
Not imputed 0 25136 97.5% 97.1%
Regression based 1 644 2.5% 2.9%
TOTALS: 25780 100.0% 100.0%
Variable: MB20A4 Numeric Pos: (3) 49-49
IMPUTATION FLAG FOR VARIABLE B20A4
RESPONSE
PER- WGHTD
CODES FREQ CENT PCT
Not imputed 0 25130 97.5% 97.1%
Regression based 1 650 2.5% 2.9%
TOTALS: 25780 100.0% 100.0%
Variable: M820A5 Numeric Pos: (3) 50-50
IMPUTATION FLAG FOR VARIABLE B20A5
PER- WGHTD
RESPONSE CODES FREQ CENT PCT
Not imputed 0 25132 97.5% 97.1%
Regression based 1 648 2.5% 2.9%
TOTALS: 25780 100.0% 100.0%
Variable: MB20A6 Numeric Pos: (3) 51-51
IMPUTATION FLAG FOR VARIABLE 820A6
RESPONSE
PER- WGHTD
CODES FREQ CENT PCT
Not imputed 0 25133 97.5% 97.1%
Regression based 1 647 2.5% 2.9%
TOTALS: 25780 100.0% 100.0%
BEST COPY MLA LE
Nov 22, 1996 page 9
Variable: MB20A7 Numeric Pos: (3) 52-52
IMPUTATION FLAG FOR VARIABLE 820A7
RESPONSE
PER- WGHTD
CODES FREQ CENT PCT
Not imputed 0 25137 97.5% 97.1%
Regression based 1 643 2.5% 2.9%
TOTALS: 25780 100.0% 100.0%
Variable: MB20A8 Numeric Pos: (3) 53-53
IMPUTATION FLAG FOR VARIABLE 820A8
RESPONSE
PER- WGHTD
CODES FREQ CENT PCT
Not imputed 0 25134 97.5% 97.1%
Regression based 1 646 2.5% 2.9%
TOTALS: 25780 100.0% 100.0%
Variable: MB20A9 Numeric Pos: (3) 54-54
IMPUTATION FLAG FOR VARIABLE 820A9
RESPONSE
PER- WGHTD
CODES FREQ CENT PCT
Not imputed 0 25136 97.5% 97.1%
Regression based 1 644 2.5% 2.9%
TOTALS: 25780 100.0% 100.0%
Variable: MB20A10 Numeric Pos: (3) 55-55
IMPUTATION FLAG FOR VARIABLE 820A10
RESPONSE
PER- WGHTD
CODES FREQ CENT PCT
Not imputed 0 25128 97.5% 97.1%
Regression based 1 652 2.5% 2.9%
TOTALS: 25780 100.0% 100.0%
Variable: M820A11 Numeric Pos: (3) 56-56
IMPUTATION FLAG FOR VARIABLE B20A11
RESPONSE
PER- WGHTD
CODES FREQ CENT PCT
Not imputed 0 25121 97.4% 97.1%
Regression based 1 659 2.6% 2.9%
TOTALS: 25780 100.0% 100.0%
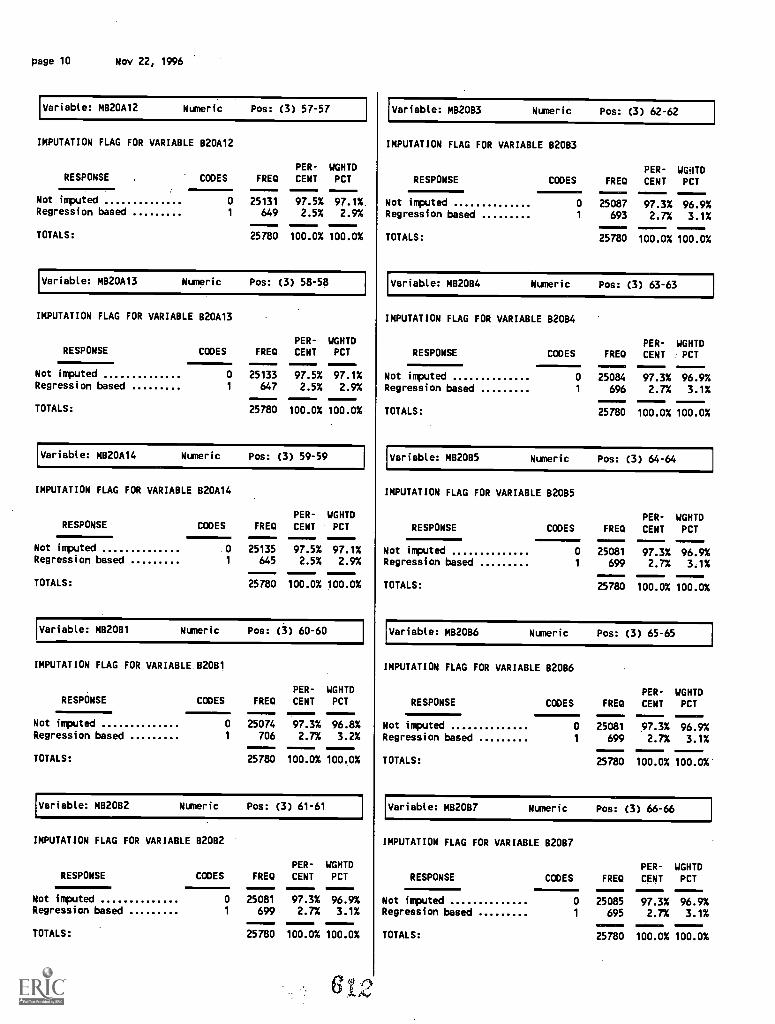
page 10 Nov 22, 1996
Variable: MB20Al2 Numeric Pos: (3) 57-57
IMPUTATION FLAG FOR VARIABLE 820Al2
PER- WGHTDRESPONSE CODES FRED CENT PCT111111
Not imputed 0 25131 97.5% 97.1 %.Regression based 1 649 2.5% 2.9%
TOTALS: 25780 100.0% 100.0%
Variable: MB20A13 Numeric Pos: (3) 58-58
IMPUTATION FLAG FOR VARIABLE B20A13
PER- WGHTDRESPONSE CODES FRED CENT PCT
Not imputed 0 25133 97.5% 97.1%Regression based 1 647 2.5% 2.9%
TOTALS: 25780 100.0% 100.0%
Variable: MB20A14 Numeric Pos: (3) 59-59
IMPUTATION FLAG FOR VARIABLE 820A14
PER- WGHTDRESPONSE CODES FRED CENT PCT
Not imputed 0 25135 97.5% 97.1%Regression based 1 645 2.5% 2.9%
TOTALS: 25780 100.0% 100.0%
Variable: MB2081 Numeric Pos: (3) 60-60
IMPUTATION FLAG FOR VARIABLE B20B1
RESPONSEPER- WGHTD
CODES FRED CENT PCT
Not imputed 0 25074 97.3% 96.8%Regression based 1 706 2.7% 3.2%
TOTALS: 25780 100.0% 100.0%
Variable: MB2082 Numeric Pos: (3) 61-61
IMPUTATION FLAG FOR VARIABLE 820132
PER- WGHTDRESPONSE CODES FRED CENT PCT
Not imputed 0 25081 97.3% 96.9%Regression based 1 699 2.7% 3.1%
TOTALS: 25780 100.0% 100.0%
Variable: MB2083 Numeric Pos: (3) 62-62
IMPUTATION FLAG FOR VARIABLE B2083
RESPONSEPER- WGilTD
CODES FRED CENT PCT
Not imputed 0 25087 97.3% 96.9%Regression based 1 693 2.7% 3.1%
TOTALS: 25780 100.0% 100.0%
Variable: MB20134 Numeric Pos: (3) 63-63
IMPUTATION FLAG FOR VARIABLE B2084
RESPONSEPER- WGHTD
CODES FRED CENT PCT
Not imputed 0 25084 97.3% 96.9%Regression based 1 696 2.7% 3.1%
TOTALS: 25780 100.0% 100.0%
Variable: MB20B5 Numeric Pos: (3) 64-64
IMPUTATION FLAG FOR VARIABLE B2085
RESPONSEPER- WGHTD
CODES FRED CENT PCT
Not imputed 0 25081 97.3% 96.9%Regression based 1 699 2.7% 3.1%
TOTALS: 25780 100.0% 100.0%
Variable: MB20B6 Numeric Pos: (3) 65-65
IMPUTATION FLAG FOR VARIABLE 820116
RESPONSEPER- WGHTD
CODES FRED CENT PCT
Not imputed 0 25081 97.3% 96.9%Regression based 1 699 2.7% 3.1%
TOTALS: 25780 100.0%
MM.100.0%'
Variable: MB2087 Numeric Pos: (3) 66-66
IMPUTATION FLAG FOR VARIABLE 132087
RESPONSEPER- WGHTD
CODES FRED CENT PCT
Not imputed 0 25085 97.3% 96.9%Regression based 1 695 2.7% 3.1%
TOTALS: 25780 100.0% 100.0%
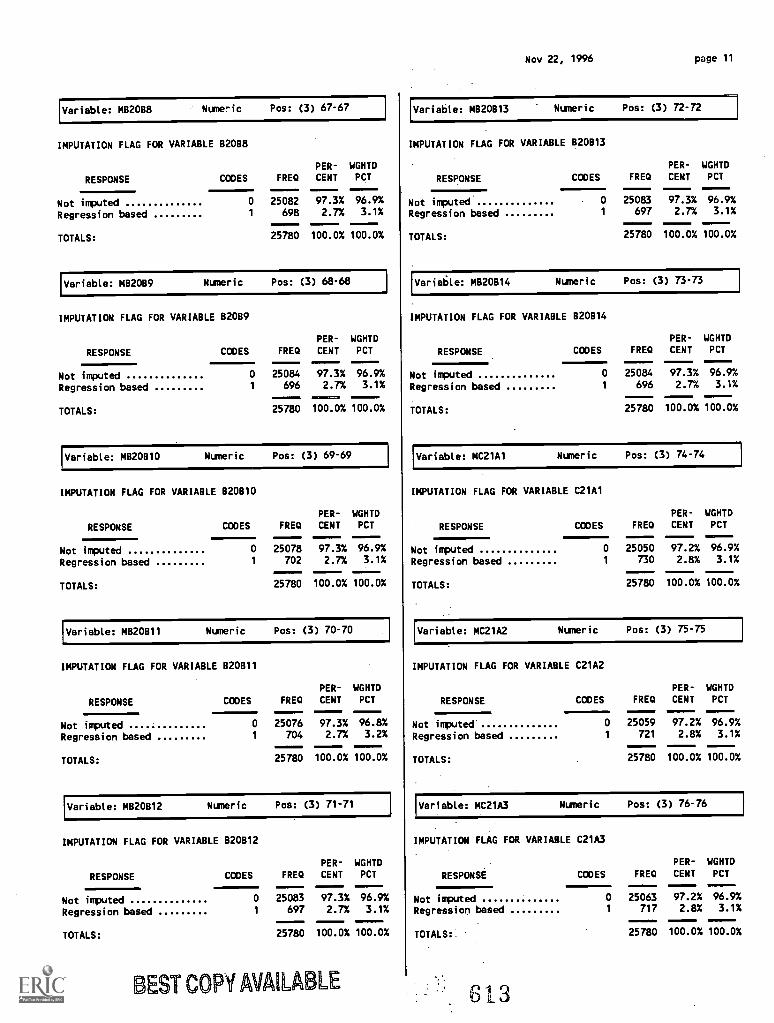
Variable: M82088 ' Numeric Pos: (3) 67-67
IMPUTATION FLAG FOR VARIABLE 82088
PER- WGHTD
RESPONSE CODES FRED CENT PCT
Not imputed 0 25082 97.3% 96.9%
Regression based 1 698 2.7% 3.1%
TOTALS: 25780 100.0% 100.0%
Variable: MUM Nuneric Pos: (3) 68-68
IMPUTATION FLAG FOR VARIABLE 82089
RESPONSE
PER- WGHTD
CODES FRED CENT PCT
Not imputed 0 25084 97.3% 96.9%
Regression based 1 696 2.7% 3.1%
TOTALS: 25780 100.0% 100.0%
Variable: MB20B10 Nuneric Pos: (3) 69-69
IMPUTATION FLAG FOR VARIABLE 820810
PER- WGHTD
RESPONSE CODES FRED CENT PCT
Not imputed 0 25078 97.3% 96.9%
Regression based 1 702 2.7% 3.1%
TOTALS: 25780 100.0% 100.0%
Variable: MB20B11 Nuneric Pos: (3) 70-70
IMPUTATION FLAG FOR VARIABLE 820811
PER- WGHTD
RESPONSE CODES FRED CENT PCT
Not imputed 0 25076 97.3% 96.8%
Regression based 1 704 2.7% 3.2%
TOTALS: 25780 100.0% 100.0%
Variable: MB20B12 Numeric Pos: (3) 71-71
IMPUTATION FLAG FOR VARIABLE 820812
PER- WGHTD
RESPONSE CODES FRED CENT PCT
Not imputed 0 25083 97.3% 96.9%
Regression based 1 697 2.7% 3.1%
TOTALS: 25780 100.0% 100.0%
BEST COPY AVAILABLE
Nov 22, 1996 page 11
Variable: MB20813 Nuneric Pos: (3) 72-72
IMPUTATION FLAG FOR VARIABLE 820813
PER- WGHTD
RESPONSE CODES FRED CENT PCT
Not imputed 0 25083 97.3% 96.9%
Regression based 1 697 2.7% 3.1%
TOTALS: 25780 100.0% 100.0%
Variable: M820814 Nuneric Pos: (3) 73-73
IMPUTATION FLAG FOR VARIABLE 8201314
RESPONSE
PER- WGHTD
CODES FRED CENT PCT
Not imputed 0 25084 97.3% 96.9%
Regression based 1 696 2.7% 3.1%
TOTALS: 25780 100.0% 100.0%
Variable: MC21A1 Nuneric Pos: (3) 74-74
IMPUTATION FLAG FOR VARIABLE C21A1
RESPONSE
PER- WGHTD
CODES FREQ CENT PCT
Not imputed 0 25050 97.2% 96.9%
Regression based 1 730 2.8% 3.1%
TOTALS: 25780 100.0% 100.0%
Variable: MC21A2 Nuneric Pos: (3) 75-75
IMPUTATION FLAG FOR VARIABLE C21A2
RESPONSE
PER- WGHTD
CODES FRED CENT PCT
Not imputed 0 25059 97.2% 96.9%
Regression based 1 721 2.8% 3.1%
TOTALS: 25780 100.0% 100.0%
Variable: MC21A3 Numeric Pos: (3) 76-76
IMPUTATION FLAG FOR VARIABLE C21A3
RESPONSE
PER- WGHTD
CODES FRED CENT PCT
Not imputed 0 25063 97.2% 96.9%
Regression based 1 717 2.8% 3.1%
TOTALS: 25780 100.0% 100.0%
b iL
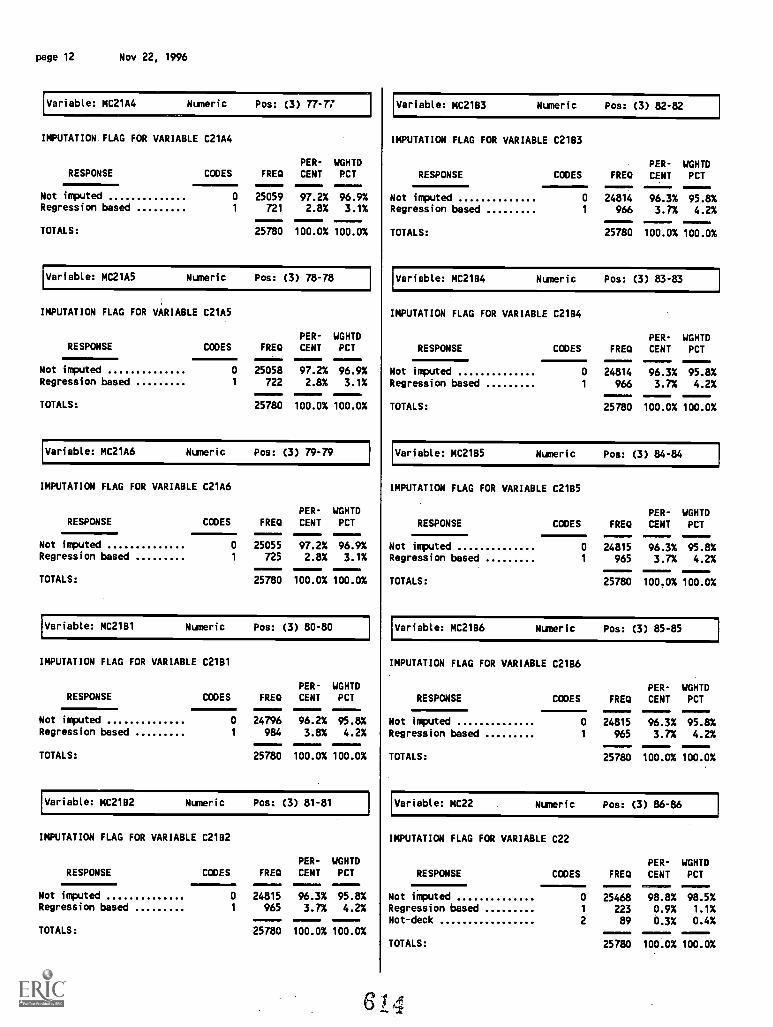
page 12 Nov 22, 1996
Variable: MC21A4 Numeric Pos: (3) 77-77
IMPUTATION. FLAG FOR VARIABLE C21A4
RESPONSEPER- WGHTD
CODES FRED CENT PCT
Not imputed 0 25059 97.2% 96.9%Regression based 1 721 2.8% 3.1%
TOTALS: 25780 100.0% 100.0%
Variable: MC21A5 Numeric Pos: (3) 78-78
IMPUTATION FLAG FOR VARIABLE C21A5
RESPONSEPER- WGHTD
CODES FRED CENT PCT
Not imputed 0 25058 97.2% 96.9%Regression based 1 722 2.8% 3.1%
TOTALS: 25780 100.0% 100.0%
Variable: MC21A6 Numeric Pos: (3) 79-79
IMPUTATION FLAG FOR VARIABLE C21A6
RESPONSEPER- WGHTD
CODES FRED CENT PCT
Not imputed 0 25055 97.2% 96.9%Regression based 1 725 2.8% 3.1%
TOTALS: 25780 100.0% 100.0%
Variable: MC21B1 Numeric Pos: (3) 80-80
IMPUTATION FLAG FOR VARIABLE C2181
PER- WGHTDRESPONSE CODES FRED CENT PCT
Not imputed 0 24796 96.2% 95.8%Regression based 1 984 3.8% 4.2%
TOTALS: 25780 100.0% 100.0%
Variable: MC21B2 Numeric Pos: (3) 81-81
IMPUTATION FLAG FOR VARIABLE C2182
PER- WGHTDRESPONSE CODES FRED CENT PCT
Not imputed 0 24815 96.3% 95.8%Regression based 1 965 3.7% 4.2%
TOTALS: 25780 100.0% 100.0%
Variable: MC21B3 Numeric Pos: (3) 82-82
IMPUTATION FLAG FOR VARIABLE C21B3
RESPONSEPER- WGHTD
CODES FRED CENT PCT
Not imputed 0 24814 96.3% 95.8%Regression based 1 966 3.7% 4.2%
TOTALS: 25780 100.0% 100.0%
Variable: MC21B4 Numeric Pos: (3) 83-83
IMPUTATION FLAG FOR VARIABLE C2184
RESPONSEPER- WGHTD
CODES FRED CENT PCT
Not imputed 0 24814 96.3% 95.8%Regression based 1 966 3.7% 4.2%
TOTALS: 25780 100.0% 100.0%
Variable: MC21B5 Numeric Pos: (3) 84-84
IMPUTATION FLAG FOR VARIABLE C2185
RESPONSEPER- WGHTD
CODES FRED CENT PCT
Not imputed 0 24815 96.3% 95.8%Regression based 1 965 3.7% 4.2%
TOTALS: 25780 100.0% 100.0%
Variable: MC21B6 Numeric Pos: (3) 85-85
IMPUTATION FLAG FOR VARIABLE C2186
RESPONSEPER- WGHTD
CODES FRED CENT PCT
Not imputed 0 24815 96.3% 95.8%Regression based 1 965 3.7% 4.2%
TOTALS: 25780 100.0% 100.0%
Variable: MC22 Numeric Pos: (3) 86-86
IMPUTATION FLAG FOR VARIABLE C22
RESPONSE CODES FRED
PER-
CENT
WGHTDPCT
Not imputed 0 25468 98.8% 98.5%Regression based 1 223 0.9% 1.1%Hot-deck 2 89 0.3% 0.4%
TOTALS: 25780 100.0% 100.0%
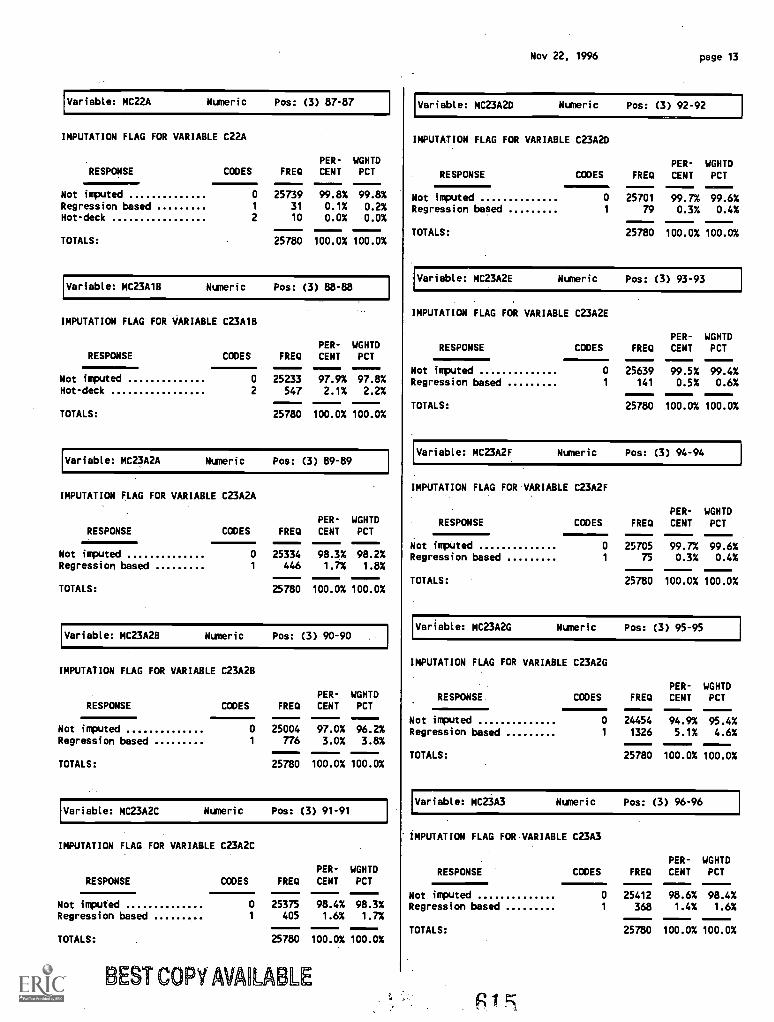
Variable: MC22A Numeric Pos: (3) 87-87
IMPUTATION FLAG FOR VARIABLE C22A
RESPONSE CODES FREQPER-
CENTWGHTDPCT
Not imputed 0 25739 99.8% 99.8%Regression based 1 31 0.1% 0.2%Hot-deck 2 10 0.0% 0.0%
TOTALS: 25780 100.0% 100.0%
Variable: MC23A1B Numeric Pos: (3) 88-88
IMPUTATION FLAG FOR VARIABLE C23A1B
RESPONSEPER- WGHTD
CODES FREQ CENT PCT
Not imputed 0 25233 97.9% 97.8%Hot-deck 2 547 2.1% 2.2%
TOTALS: 25780 100.0% 100.0%
Variable: MC23A2A Numeric Pos: (3) 89-89
IMPUTATION FLAG FOR VARIABLE C23A2A
PER- WGHTDRESPONSE CODES FREQ CENT PCT
Not imputed 0 25334 98.3% 98.2%Regression based 1 446 1.7% 1.8%
TOTALS: 25780 100.0% 100.0%
Variable: MC23A2B Numeric Pos: (3) 90-90
IMPUTATION FLAG FOR VARIABLE C23A2B
PER- WGHTDRESPONSE CODES FREQ CENT PCT
Not imputed 0 25004 97.0% 96.2%Regression based 1 776 3.0% 3.8%
TOTALS: 25780 100.0% 100.0%
Variable: MC23A2C Numeric Pos: (3) 91-91
IMPUTATION FLAG FOR VARIABLE C23A2C
RESPONSEPER- WGHTD
CODES FREQ CENT PCT
Not imputed 0 25375 98.4% 98.3%Regression based 1 405 1.6% 1.7%
TOTALS: 25780 100.0% 100.0%
BEST COPY AV OLABLE
Nov 22, 1996 page 13
Variable: MC23A2D Numeric Pos: (3) 92-92
IMPUTATION FLAG FOR VARIABLE C23A2D
RESPONSEPER- WGHTD
CODES FREQ CENT PCT
Not imputed 0 25701 99.7% 99.6%Regression based 1 79 0.3% 0.4%
TOTALS: 25780 100.0% 100.0%
Variable: MC23A2E Numeric Pos: (3) 93-93
IMPUTATION FLAG FOR VARIABLE C23A2E
RESPONSEPER- WGHTD
CODES FREQ CENT PCT
Not imputed 0 25639 99.5% 99.4%Regression based 1 141 0.5% 0.6%
TOTALS: 25780 100.0% 100.0%
Variable: MC23A2F Numeric Pos: (3) 94-94
IMPUTATION FLAG FOR VARIABLE C23A2F
RESPONSE CODES FREQ
PER-
CENT
WGHTDPCT
Not imputedRegression based
TOTALS:
0
1
2570575
99.7%0.3%
99.6%0.4%
25780 100.0% 100.0%
Variable: MC23A2G Numeric Pos: (3) 95-95
IMPUTATION FLAG FOR VARIABLE C23A2G
RESPONSE.PER- WGHTD
CODES FREQ CENT PCT
Not imputed 0 24454 94.9% 95.4%Regression based 1 1326 5.1% 4.6%
TOTALS: 25780 100.0% 100.0%
Variable: MC23A3 Numeric Pos: (3) 96-96
IMPUTATION FLAG FOR VARIABLE C23A3
RESPONSEPER- WGHTD
CODES FRED CENT PCT
Not imputed 0 25412 98.6% 98.4%Regression based 1 368 1.4% 1.6%
TOTALS: 25780 100.0% 100.0%
1
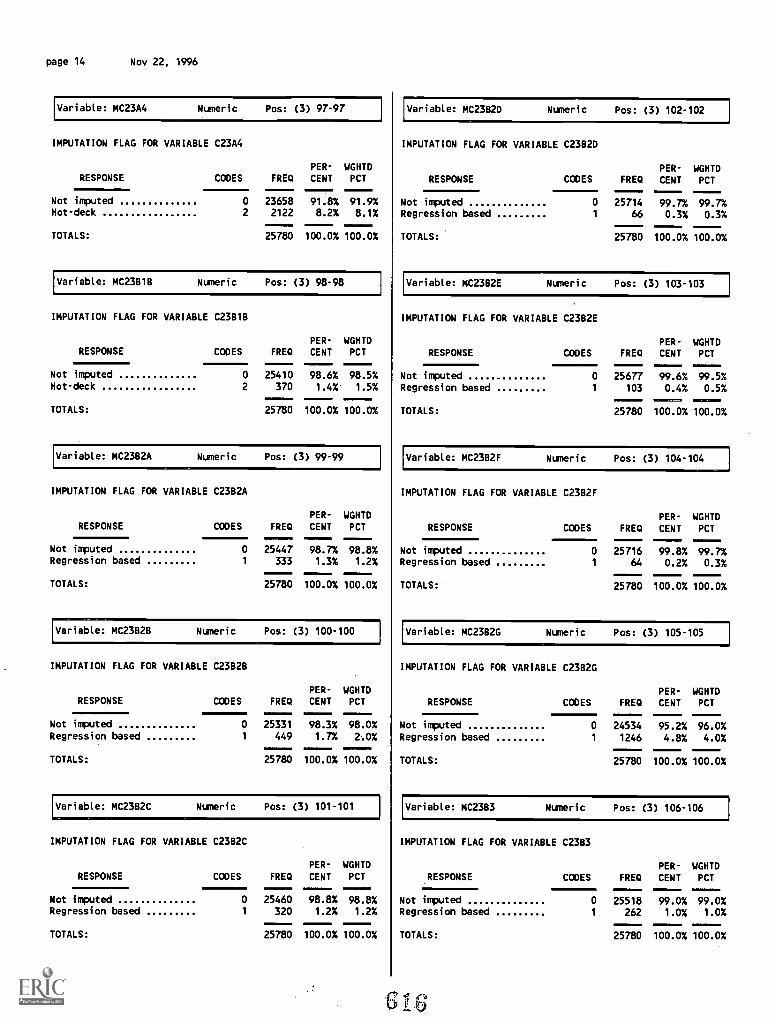
page 14 Nov 22, 1996
Variable: MC23A4 Numeric Pos: (3) 97-97
IMPUTATION FLAG FOR VARIABLE C23A4
RESPONSEPER- WGHTD
CODES FRED CENT PCT
Not imputed 0 23658 91.8% 91.9%Hot-deck 2 2122 8.2% 8.1%
TOTALS: 25780 100.0% 100.0%
Variable: MC23B1B Numeric Pos: (3) 98-98
IMPUTATION FLAG FOR VARIABLE C23B1B
RESPONSE CODES FREOPER-
CENTWGHTDPCT
Not imputed 0 25410 98.6% 98.5%Hot-deck 2 370 1.4% 1.5%
TOTALS:
IMI111
25780
1ii=100.0% 100.0%
Variable: MC23B2A Numeric Pos: (3) 99-99
IMPUTATION FLAG FOR VARIABLE C23B2A
PER- WGHTDRESPONSE CODES FREO CENT PCT
Not imputed 0 25447 98.7% 98.8%Regression based 1 333 1.3% 1.2%
TOTALS: 25780 100.0% 100.0%
Variable: MC23B2B Numeric Pos: (3) 100-100
IMPUTATION FLAG FOR VARIABLE C23B2B
PER- WGHTDRESPONSE CODES FRED CENT PCT.11101
Not imputed 0 25331 98.3% 98.0%Regression based 1 449 1.7% LOX
TOTALS: 25780 100.0% 100.0%
Variable: MC23B2C Numeric Pos: (3) 101-101
IMPUTATION FLAG FOR VARIABLE C23B2C
PER- WGHTDRESPONSE CODES FRED CENT PCT
Not imputed 0 25460 98.8% 98.8%Regression based 1 320 1.2% 1.2%
TOTALS: 25780-----100.0%
-----100.0%
Variable: MC23B2D Numeric Pos: (3) 102-102
IMPUTATION FLAG FOR VARIABLE C23B2D
RESPONSEPER- WGHTD
CODES FRED CENT PCT
Not imputed 0 25714 99.7% 99.7%Regression based 1 66 0.3% 0.3%
TOTALS: 25780 100.0% 100.0%
Variable: MC23B2E Numeric Pos: (3) 103-103
IMPUTATION FLAG FOR VARIABLE C23B2E
RESPONSE CODES FREDPER- WGHTDCENT PCT1
Not imputed 0 25677 99.6% 99.5%Regression based 1 103 0.4% 0.5%
TOTALS:
111.1Mii
25780
=,17=1,
100.0% 100.0%
Variable: MC23B2F Numeric Pos: (3) 104-104
IMPUTATION FLAG FOR VARIABLE C23B2F
RESPONSEPER- WGHTD
CODES FRED CENT. PCT1=1111111
Not imputed 0 25716 99.8% 99.7%Regression based 1 64 0.2% 0.3%
TOTALS: 25780 100.0% 100.0%
Variable: MC23B2G Numeric Pos: (3) 105-105
IMPUTATION FLAG FOR VARIABLE C23B2G
RESPONSEPER- WGHTD
CODES FRED CENT PCT
Not imputed 0 24534 95.2% 96.0%Regression based 1 1246 4.8% 4.0%
TOTALS: 25780 100.0% 100.0%
Variable: MC23B3 Numeric Pos: (3) 106-106
IMPUTATION FLAG FOR VARIABLE C2383
PER- WGHTDRESPONSE CODES FRED CENT PCT
Not imputed 0 25518 99.0% 99.0%Regression based 1 262 1.0% 1.0%
TOTALS: 25780 100.0% 100.0%
6
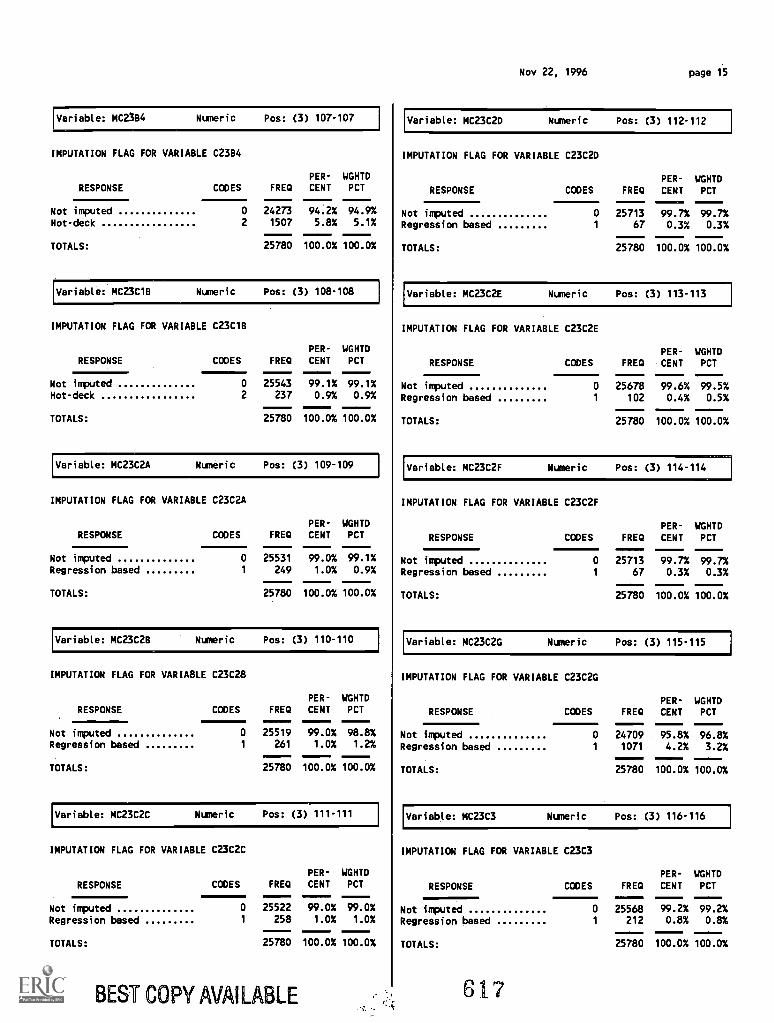
Variable: MC2384 Numeric Pos: (3) 107-107
IMPUTATION FLAG FOR VARIABLE C2364
RESPONSEPER- WGHTD
CODES FREQ CENT PCT
Not imputed 0 24273 94.2% 94.9%Hot-deck 2 1507 5.8% 5.1%
TOTALS: 25780 100.0% 100.0%
Variable: MC23C1B Numeric Pos: (3) 108-108
IMPUTATION FLAG FOR VARIABLE C23C1B
PER- WGHTDRESPONSE CODES FREQ CENT PCT
Not imputed 0 25543 99.1% 99.1%Hot-deck 2 237 0.9% 0.9%
TOTALS: 25780
MI100.0% 100.0%
Variable: MC23C2A Numeric Pos: (3) 109-109
IMPUTATION FLAG FOR VARIABLE C23C2A
PER- WGHTDRESPONSE CODES FREQ CENT PCT
Not imputed 0 25531 99.0% 99.1%Regression based 1 249 1.0% 0.9%
TOTALS: 25780 100.0% 100.0%
Variable: MC23C2B Numeric Pos: (3) 110-110
IMPUTATION FLAG FOR VARIABLE C23C2B
PER- WGHTD
RESPONSE CODES FREQ CENT PCT
Not imputed 0 25519 99.0% 98.8%Regression based 1 261 1.0% 1.2%
TOTALS: 25780 100.0% 100.0%
Variable: MC23C2C Numeric Pos: (3) 111-111
IMPUTATION FLAG FOR VARIABLE C23C2C
PER- WGHTD
RESPONSE CODES FREQ CENT PCT
Not imputed 0 25522 99.0% 99.0%
Regression based 1 258 1.0% 1.0%
TOTALS: 25780 100.0% 100.0%
BEST COPY AVAILABLE
Nov 22, 1996 page 15
Variable: MC23C2D Numeric Pos: (3) 112-112
IMPUTATION FLAG FOR VARIABLE C23C2D
RESPONSEPER- WGHTD
CODES FREQ CENT PCT
Not imputed 0 25713 99.7% 99.7%Regression based 1 67 0.3% 0.3%
TOTALS: 25780 100.0% 100.0%
Variable: MC23C2E Numeric Pos: (3) 113-113
IMPUTATION FLAG FOR VARIABLE C23C2E
RESPONSEPER- WGHTD
CODES FREQ CENT PCT
Not imputed 0 25678 99.6% 99.5%Regression based 1 102 0.4% 0.5%
TOTALS: 25780 100.0% 100.0%
Variable: MC23C2F Numeric Pos: (3) 114-114
IMPUTATION FLAG FOR VARIABLE C23C2F
RESPONSEPER- WGHTD
CODES FREQ CENT PCT
Not imputed 0 25713 99.7% 99.7%Regression based 1 67 0.3% 0.3%
TOTALS: 25780 100.0% 100.0%
Variable: MC23C2G Numeric Pos: (3) 115-115
IMPUTATION FLAG FOR VARIABLE C23C2G
RESPONSEPER- WGHTD
CODES FREQ CENT PCT
Not imputed 0 24709 95.8% 96.8%Regression based 1 1071 4.2% 3.2%
TOTALS: 25780 100.0% 100.0%
Variable: MC23C3 Numeric Pos: (3) 116-116
IMPUTATION FLAG FOR VARIABLE C23C3
RESPONSE
PER- WGHTD
CODES FREQ CENT PCT
Not imputed 0 25568 99.2% 99.2%Regression based 1 212 0.8% 0.8%
TOTALS: 25780 100.0% 100.0%
6.x.7
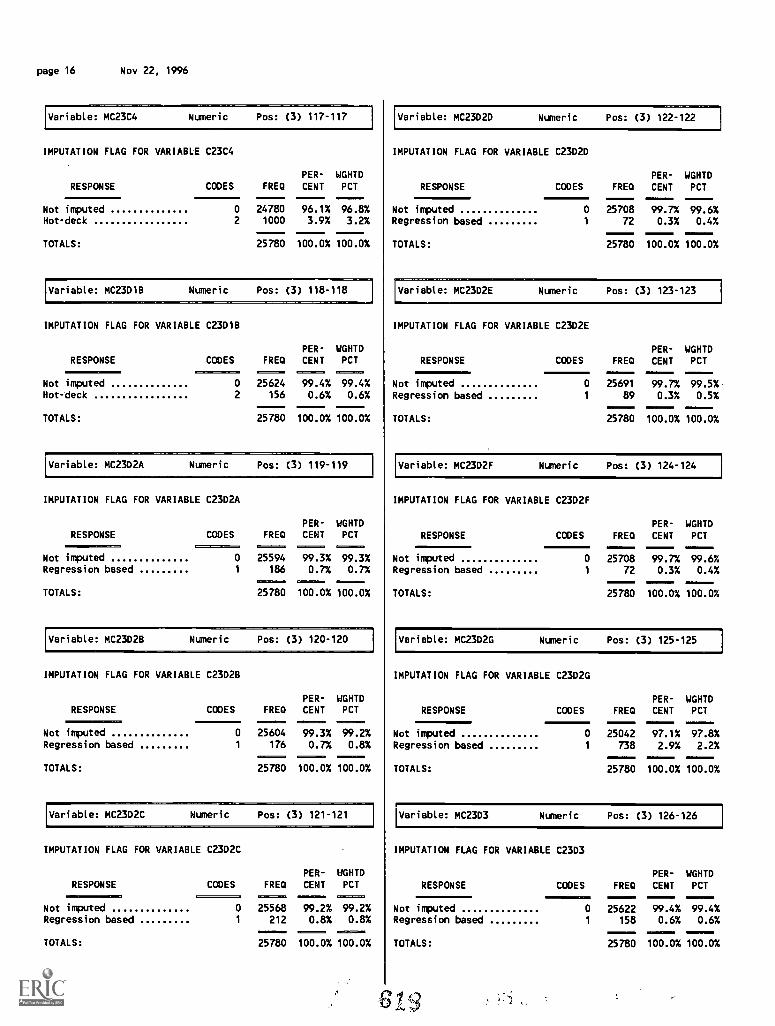
page 16 Nov 22, 1996
[Variable: MC23C4 Numeric Pos: (3) 117-117
IMPUTATION FLAG FOR VARIABLE C23C4
RESPONSEPER- WGHTD
CODES FRED CENT PCT09:01 diMINI1 0 0Not imputed 0 24780 96.1% 96.8%Hot-deck 2 1000 3.9% 3.2%
----- --100.0% 100.0%TOTALS: 25780
Variable: MC23D1B Numeric Pos: (3) 118-118
IMPUTATION FLAG FOR VARIABLE C23018
PER- WGHTDRESPONSE CODES FRED CENT PCT
--------Not imputed 0 25624
-----99.4%
-----99.4%
Hot-deck 2 156 0.6% 0.6%
TOTALS: 25780 100.0% 100.0%
Variable: MC23D2A Numeric Pos: (3) 119-119
IMPUTATION FLAG FOR VARIABLE C23D2A
RESPONSE CODES FRED
PER- WGHTDCENT PCT
Not imputed 0 25594
..==. ==...99.3% 99.3%
Regression based 1 186 0.7% 0.7%
TOTALS:
=I25780
I= 0100.0% 100.0%
Variable: MC23D2B Numeric Pos: (3) 120-120
IMPUTATION FLAG FOR VARIABLE C23028
RESPONSE CODES FREDPER- WGHTDCENT PCT
Not imputed 0 25604 99.3% 99.2%Regression based 1 176 0.7% 0.8%
TOTALS: 25780
====.
100.0% 100.0%
'Variable: MC23D2C Numeric Pos: (3) 121-121
IMPUTATION FLAG FOR VARIABLE C23D2C
PER- WGHTDRESPONSE CODES FRED CENT PCT
Not imputed 0 25568 99.2% 99.2%Regression based 1 212 0.8% 0.8%
TOTALS:
025780
0100.0%
0100.0%
Variable: MC23D2D Numeric Pos: (3) 122-122
IMPUTATION FLAG FOR VARIABLE C23D2D
PER- WGHTDRESPONSE CODES FRED CENT PCT
Not imputed 0 25708 99.7% 99.6%Regression based 1 72 0.3% 0.4%
TOTALS: 25780 100.0% 100.0%
Variable: MC23D2E Numeric Pos: (3) 123-123
IMPUTATION FLAG FOR VARIABLE C23D2E
RESPONSEPER- WGHTD
CODES FRED CENT PCT
Not imputed 0 25691 99.7% 99.5%,Regression based 1 89 0.3% 0.5%
TOTALS: 25780 100.0% 100.0%
Variable: MC23D2F Numeric Pos: (3) 124-124
IMPUTATION FLAG FOR VARIABLE C23D2F
RESPONSEPER- WGHTD
CODES FRED CENT PCT
Not imputed 0 25708 99.7% 99.6%Regression based 1 72 0.3% 0.4%
TOTALS: 25780 100.0% 100.0%
Variable: MC23D2G Numeric Pos: (3) 125-125
IMPUTATION FLAG FOR VARIABLE C23D2G
RESPONSEPER- WGHTD
CODES FRED CENT PCT
Not imputed 0 25042 97.1% 97.8%Regression based 1 738 2.9% 2.2%
TOTALS: 25780 100.0% 100.0%
Variable: MC23D3 Numeric Pos: (3) 126-126
IMPUTATION FLAG FOR VARIABLE C23D3
RESPONSEPER- WGHTD
CODES FRED CENT PCT3211101 010 011
Not imputed 0 25622 99.4% 99.4%Regression based 1 158 0.6% 0.6%
TOTALS: 25780 100.0% 100.0%
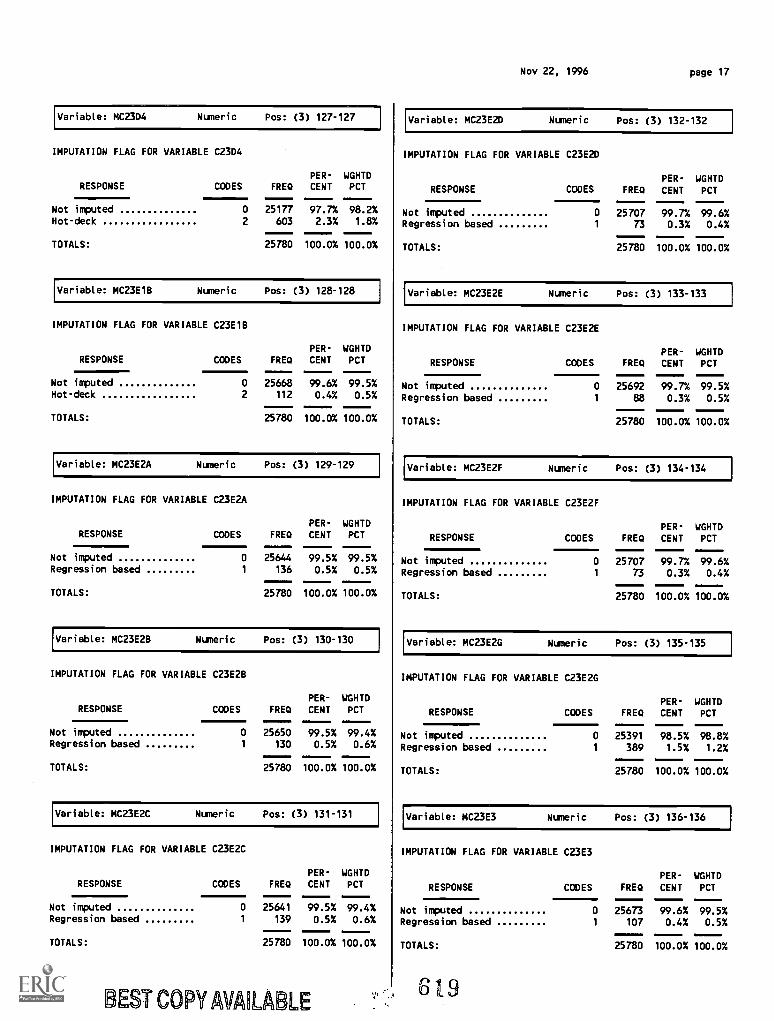
Variable: MC23D4 Numeric Pos: (3) 127-127
IMPUTATION FLAG FOR VARIABLE C23D4
PER- WGHTDRESPONSE CODES FRED CENT PCT
Not imputed 0 25177 97.7% 98.2%Hot-deck 2 603 2.3% 1.8%
TOTALS: 25780 100.0% 100.0%
Variable: MC23E1B Numeric Pos: (3) 128-128
IMPUTATION FLAG FOR VARIABLE C23E1B
PER- WGHTDRESPONSE CODES FRED CENT PCT
Not imputed 0 25668 99.6% 99.5%Hot-deck 2 112 0.4% 0.5%
TOTALS: 25780 100.0% 100.0%
Variable: MC23E2A Numeric Pos: (3) 129-129
IMPUTATION FLAG FOR VARIABLE C23E2A
PER- WGHTDRESPONSE CODES FRED CENT PCT
Not imputed 0 25644 99.5% 99.5%Regression based 1 136 0.5% 0.5%
TOTALS: 25780 100.0% 100.0%
Variable: MC23E2B Numeric Pos: (3) 130-130
IMPUTATION FLAG FOR VARIABLE C23E2B
PER- WGHTDRESPONSE CODES FRED CENT PCT
Not imputed 0 25650 99.5% 99.4%Regression based 1 130 0.5% 0.6%
TOTALS: 25780 100.0% 100.0%
Variable: MC23E2C Numeric Pos: (3) 131-131
IMPUTATION FLAG FOR VARIABLE C23E2C
PER- WGHTDRESPONSE CODES FRED CENT PCT
Not imputed 0 25641 99.5% 99.4%Regression based 1 139 0.5% 0.6%
TOTALS: 25780 100.0% 100.0%
BEST COPY AVAILABLE
Nov 22, 1996 page 17
Variable: MC23E2D Numeric Pos: (3) 132-132
IMPUTATION FLAG FOR VARIABLE C23E2D
RESPONSEPER- WGHTD
CODES FRED CENT PCT
Not imputed 0 25707 99.7% 99.6%Regression based 1 73 0.3% 0.4%
TOTALS: 25780 100.0% 100.0%
Variable: MC23E2E Numeric Pos: (3) 133-133
IMPUTATION FLAG FOR VARIABLE C23E2E
RESPONSEPER- WGHTD
CODES FRED CENT PCT
Not imputed 0 25692 99.7% 99.5%Regression based 1 88 0.3% 0.5%
TOTALS: 25780 100.0% 100.0%
Variable: MC23E2F Numeric Pos: (3) 134-134
IMPUTATION FLAG FOR VARIABLE C23E2F
RESPONSEPER- WGHTD
CODES FRED CENT PCT
Not imputed 0 25707 99.7% 99.6%Regression based 1 73 0.3% 0.4%
TOTALS: 25780 100.0% 100.0%
Variable: MC23E2G Numeric Pos: (3) 135-135
IMPUTATION FLAG FOR VARIABLE C23E2G
PER- WGHTDRESPONSE CODES FRED CENT PCT
Not imputed 0
-----25391 98.5% 98.8%
Regression based 1 389 1.5% 1.2%
TOTALS: 25780 100.0% 100.0%
Variable: MC23E3 Numeric Pos: (3) 136-136
IMPUTATION FLAG FOR VARIABLE C23E3
RESPONSEPER- WGHTD
CODES FRED CENT PCT
Not imputed 0 25673 99.6% 99.5%Regression based 1 107 0.4% 0.5%
TOTALS: 25780 100.0% 100.0%
619
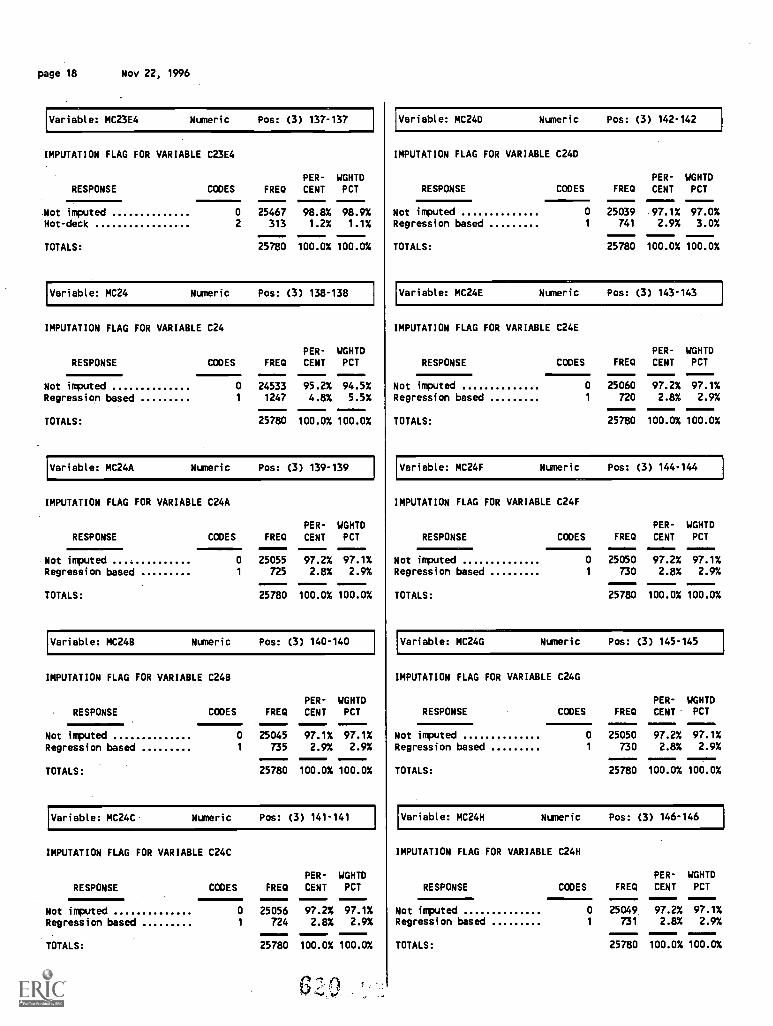
page 18 Nov 22, 1996
Variable: MC23E4 Numeric Pos: (3) 137-137
IMPUTATION FLAG FOR VARIABLE C23E4
PER- WGHTDRESPONSE CODES FRED CENT PCT
Not imputed 0 25467 98.8% 98.9%Hot-deck 2 313 1.2% 1.1%
TOTALS: 25780 100.0% 100.0%
Variable: MC24 Numeric Pos: (3) 138-138
IMPUTATION FLAG FOR VARIABLE C24
PER- WGHTDRESPONSE CODES FRED CENT PCT
Not imputed 0 24533 95.2% 94.5%Regression based 1 1247 4.8% 5.5%
TOTALS: 25780 100.0% 100.0%
Variable: MC24A Numeric Pos: (3) 139-139
IMPUTATION FLAG FOR VARIABLE C24A
RESPONSE1111=111:11011=1=
PER- WGHTDCODES FRED CENT PCT
Not imputed 0 25055 97.2% 97.1%Regression based 1 725 2.8% 2.9%
TOTALS: 25780 100.0% 100.0%
Variable: MC24G Numeric Pos: (3) 140-140
IMPUTATION FLAG FOR VARIABLE C248
PER- WGHTDRESPONSE CODES FREQ CENT PCT
Not imputed 0 25045 97.1% 97.1%
Regression based 1 735 2.9% 2.9%
TOTALS: 25780 100.0% 100.0%
Variable: MC24G Numeric Pos: (3) 141-141
IMPUTATION FLAG FOR VARIABLE C24C
PER- WGHTD
RESPONSE CODES FRED CENT PCT
Not imputed 0 25056 97.2% 97.1%Regression based 1 724 2.8% 2.9%
TOTALS: 25780 100.0% 100.0%
6
Variable: MC24D Numeric Pos: (3) 142-142
IMPUTATION FLAG FOR VARIABLE C24D
RESPONSEPER- WGHTD
CODES FRED CENT PCT
Not imputed 0 25039 .97.1% 97.0%Regression based 1 741 2.9% 3.0%
TOTALS: 25780 100.0% 100.0%
Variable: MC24E Numeric Pos: (3) 143-143
IMPUTATION FLAG FOR VARIABLE C24E
RESPONSEPER- WGHTD
CODES FRED CENT PCT
Not imputed 0 25060 97.2% 97.1%Regression based 1 720 2.8% 2.9%
TOTALS: 25780 100.0% 100.0%
Variable: MC24F Numeric Pos: (3) 144-144
IMPUTATION FLAG FOR VARIABLE C24F
PER- WGHTDRESPONSE CODES FRS) CENT PCT
Not imputed 0 25050 97.2% 97.1%Regression based 1 730 2.8% 2.9%
TOTALS: 25780 100.0% 100.0%
Variable: MC24G Numeric Pos: (3) 145-145
IMPUTATION FLAG FOR VARIABLE C24G
PER- WGHTDRESPONSE CODES FREQ CENT PCT
Not imputed 0 25050 97.2% 97.1%Regression based 1 730 2.8% 2.9%
TOTALS: 25780 100.0% 100.0%
Variable: MC24H Numeric Pos: (3) 146-146
IMPUTATION FLAG FOR VARIABLE C24H
RESPONSEPER- WGHTD
CODES FRED CENT PCT
Not imputed 0 25049 97.2% 97.1%Regression based 1 731 2.8% 2.9%
TOTALS: 25780 100.0% 100.0%
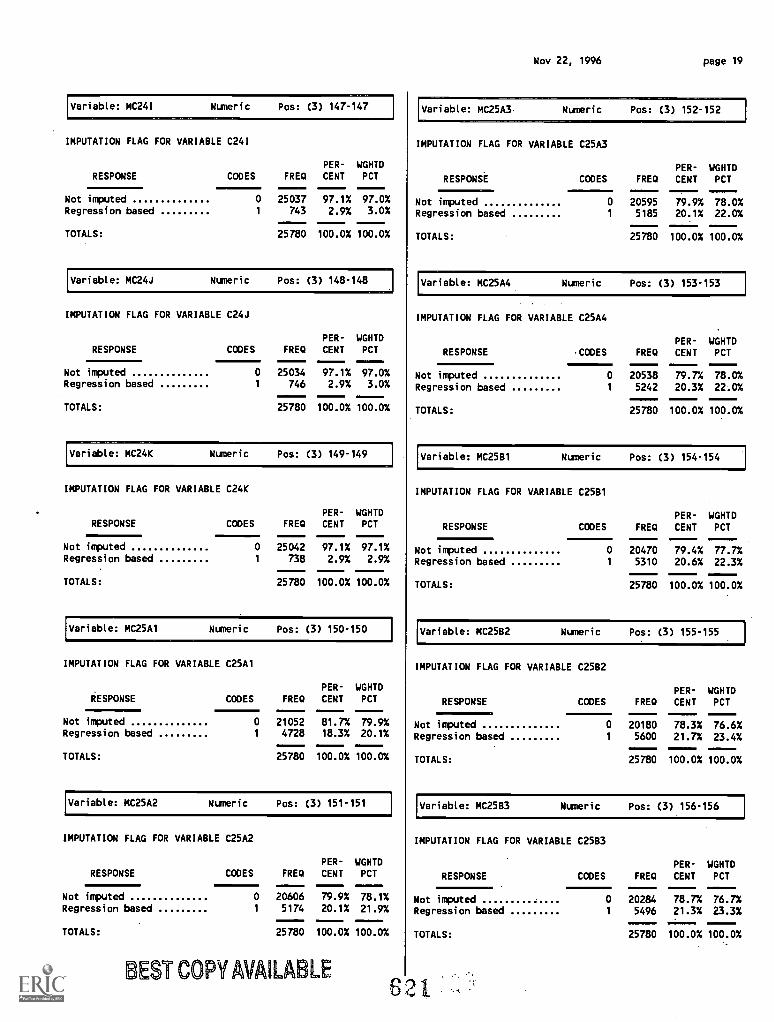
Variable: MC24I Numeric Pos: (3) 147-147
IMPUTATION FLAG FOR VARIABLE C241
PER- WGHTDRESPONSE CODES FREQ CENT PCT
Not imputed 0
-----25037 97.1% 97.0%
Regression based 1 743 2.9% 3.0%
TOTALS: 25780 100.0%-----100.0%
Variable: MC24J Numeric Pos: (3) 148-148
IMPUTATION FLAG FOR VARIABLE C24J
RESPONSEPER- WGHTD
CODES FREQ CENT PCT
Not imputed 0 25034 97.1% 97.0%Regression based 1 746 2.9% 3.0%
TOTALS: 25780 100.0% 100.0%
Variable: MC24K Numeric Pos: (3) 149-149
IMPUTATION FLAG FOR VARIABLE C24K
RESPONSEPER- WGHTD
CODES FREQ CENT PCT
Not imputed 0 25042 97.1% 97.1%Regression based 1 738 2.9% 2.9%
TOTALS: 25780 100.0% 100.0%
Variable: MC25A1 Numeric Pos: (3) 150-150
IMPUTATION FLAG FOR VARIABLE C25A1
RESPONSEPER- WGHTD
CODES FREQ CENT PCT
Not imputed 0 21052 81.7% 79.9%Regression based 1 4728 18.3% 20.1%
TOTALS: 25780 100.0% 100.0%
Variable: MC25A2 Numeric Pos: (3) 151-151
IMPUTATION FLAG FOR VARIABLE C25A2
RESPONSEPER- WGHTD
CODES FREQ CENT PCT
Not imputed 0 20606 79.9% 78.1%Regression based 1 5174 20.1% 21.9%
TOTALS: 25780 100.0%
1ININIMISE
100.0%
BEST COPY AVAILABLE
Nov 22, 1996 page 19
Variable: MC25A3 Numeric Pos: (3) 152-152
IMPUTATION FLAG FOR VARIABLE C25A3
RESPONSE1 PER- WGHTDCODES FREQ CENT PCT
Not imputed 0 20595 79.9% 78.0%Regression based 1 5185 20.1% 22.0%
TOTALS: 25780 100.0% 100.0%
Variable: MC25A4 Numeric Pos: (3) 153-153
IMPUTATION FLAG FOR VARIABLE C25A4
PER- WGHTDRESPONSE CODES FRED CENT PCT
Not imputed 0 20538 79.7% 78.0%Regression based 1 5242 20.3% 22.0%
TOTALS: 25780 100.0% 100.0%
Variable: MC25B1 Numeric Pos: (3) 154-154
IMPUTATION FLAG FOR VARIABLE C2581
RESPONSEPER- WGHTD
CODES FREQ CENT PCT
Not imputed 0 20470 79.4% 77.7%Regression based 1 5310 20.6% 22.3%
TOTALS: 25780 100.0% 100.0%
Variable: MC25B2 Numeric Pos: (3) 155-155
IMPUTATION FLAG FOR VARIABLE C25B2
RESPONSEPER- WGHTD
CODES FRED CENT PCT
Not imputed 0 20180 78.3% 76.6%Regression based 1 5600 21.7% 23.4%
TOTALS: 25780 100.0% 100.0%
Variable: MC2583 Numeric Pos: (3) 156-156
IMPUTATION FLAG FOR VARIABLE C25B3
RESPONSEPER- WGHTD
CODES FRED CENT PCT
Not imputed 0 20284 78.7% 76.7%Regression based 1 5496 21.3% 23.3%
TOTALS: 25780 100.0% 100.0%
621
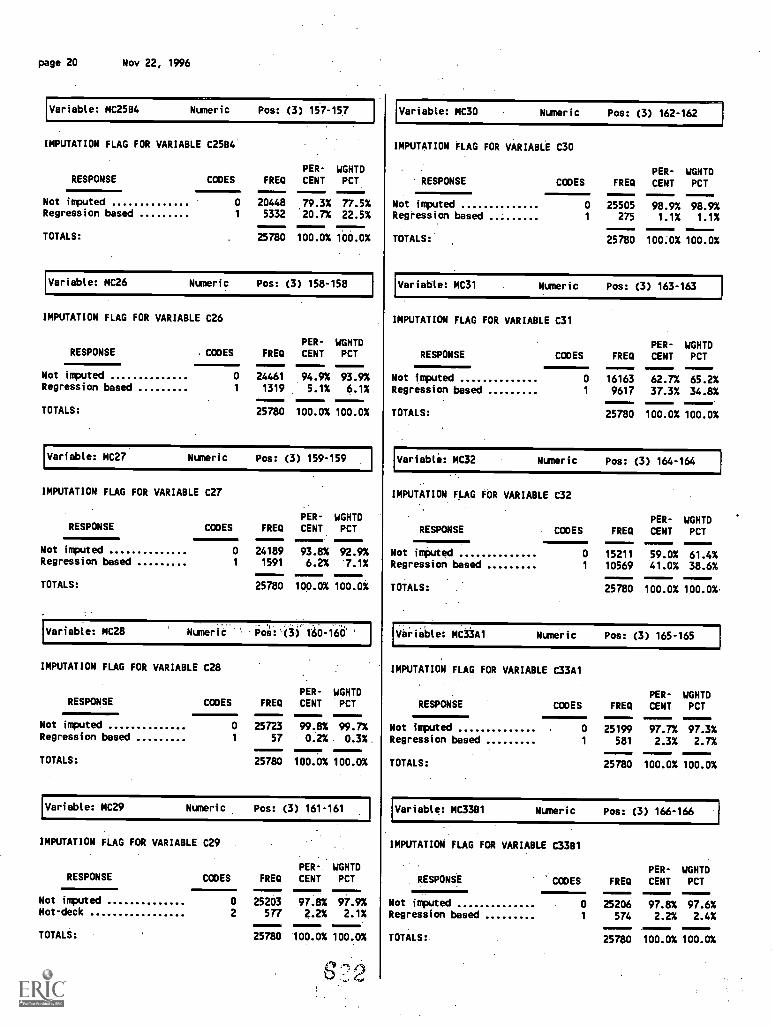
page 20 Nov 22, 1996
Variable: MC25B4 Numeric Pos: (3) 157-157
IMPUTATION FLAG FOR VARIABLE C2584
PER- WGHTDRESPONSE CODES FREQ CENT PCT
Not imputed 0 20448 79.3% 77.5%Regression based 1 5332 20.7% 22.5%
TOTALS: 25780 100.0% 100.0%
Variable: MC26 Numeric Pos: (3) 158-158
IMPUTATION FLAG FOR VARIABLE C26
RESPONSEPER- WGHTD
CODES FUG CENT PCT
Not imputed 0 24461 94.9% 93.9%Regression based 1 1319 5.1% 6.1%
TOTALS: 25780 100.0% 100.0%
Variable: MC27 Numeric Pos: (3) 159-159
IMPUTATION FLAG FOR VARIABLE C27
RESPONSEPER- WGHTD
CODES FREQ CENT PCT
Not imputed 0 24189 93.8% 92.9%Regression based 1 1591 6.2% 7.1%
TOTALS: 25780 100.0% 100.0%
Variable: MC28 NuMeric F;oei'6i404i4'
IMPUTATION FLAG FOR VARIABLE C28
PER- WGHTDRESPONSE CODES FRED CENT PCT
Not imputed 0 25723 99.8% 99.7%Regression based 1 57 0.2% 0.3%.
TOTALS: 25780 100.0% 100.0%
Variable: MC29 Numeric Pos: (3) 161-161
IMPUTATION FLAG FOR VARIABLE C29
PER- WGHTDRESPONSE CODES FRED CENT PCT
Not imputed 0 25203 97.8% 97.9%Hot-deck 2 577 2.2% 2.1%
TOTALS: 25780 100.0% 100.0%
Variable: MC30 Numeric Pos: (3) 162-162
IMPUTATION FLAG FOR VARIABLE C30
RESPONSE
Not imputedRegression based
TOTALS:'
PER- WGHTDCODES FREQ CENT PCT
0 25505 98.9% 98.9%1 275 1.1% 1.1%
25780 100.0% 100.0%
Variable: MC31 Numeric Pos: (3) 163-163
IMPUTATION FLAG FOR VARIABLE C31
RESPONSE
Not imputedRegression based
TOTALS:
PER- WGHTDCODES FRED CENT PCT
0 16163 62.7% 65.2%1 9617 37.3% 34.8%
25780 100.0% 100.0%
Variable: MC32 Numeric Pos: (3) 164-164
IMPUTATION FLAG FOR VARIABLE C32
PER- WGHTDRESPONSE CODES FRED CENT PCT
Not imputedRegression based
TOTALS:
0 15211 59.0% 61.4%1 10569 41.0% 38.6%
25780 100.0% 100.0%
MC33A1 Numeric Pos: (3) 165-165
IMPUTATION FLAG FOR VARIABLE C33A1
RESPONSE
Not imputed
Regression based
TOTALS:
PER- WGHTDCODES FREQ CENT PCT
0 25199 97.7% 97.3%1 581 2.3% 2.7%
25780 100.0% 100.0%
Variable: MC3381 Numeric Pos: (3) 166-166
IMPUTATION FLAG FOR VARIABLE C3381
PER- WGHTDRESPONSE CODES FREQ CENT PCT
Not imputedRegression based
TOTALS:
0 25206 97.8% 97.6%1 574 2.2% 2.4%
25780 100.0% 100.0%
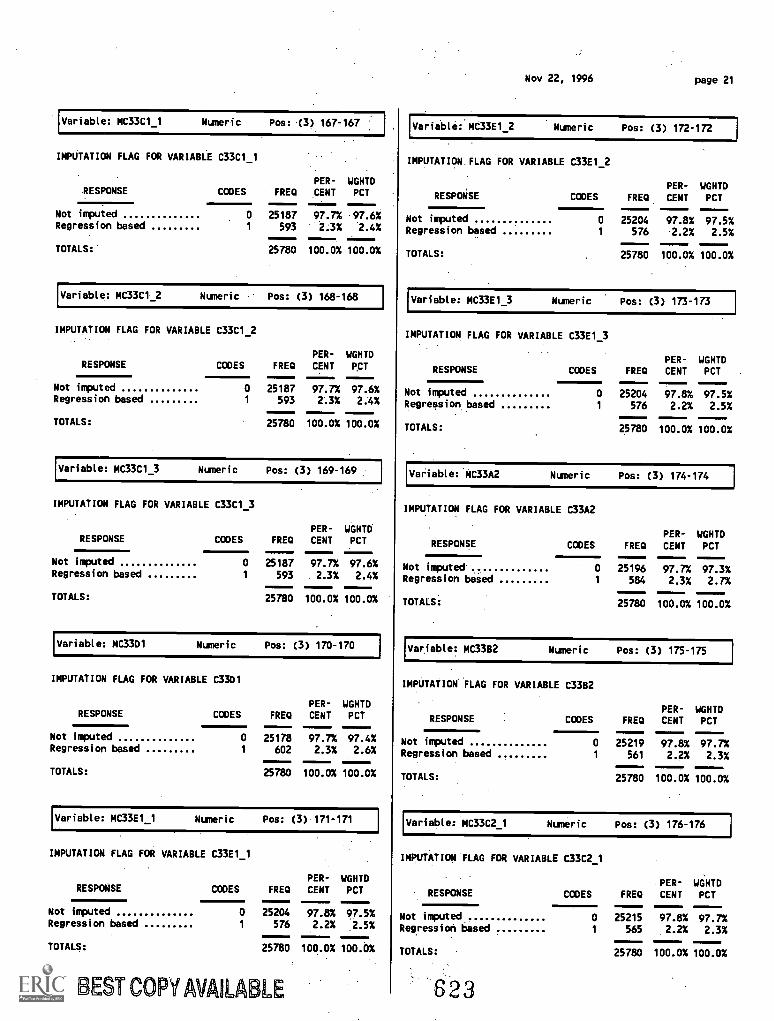
Variable: MC33C1_1 Numeric Pos: (3) 167-167
IMPUTATION FLAG FOR VARIABLE C33C1_1
PER- WGHTDRESPONSE CODES FRED CENT PCT
Not imputed 0 25187 97.7% -97.6%Regrestion based 1 593 -2:3% -2.4%
TOTALS: 25780 100.0% 100.0%
Variable: MC33C1 2 Numeric Pos: (3) 168-168
IMPUTATION FLAG FOR VARIABLE C33C1_2
PER- WGHTDRESPONSE CODES FRED CENT PCT
Not imputed 0 25187 97.7% 97.6%Regression based 1 593 23% 2.4%
TOTALS: 25780 100.0% 100.0%
Variable: MC33C1_3 Numeric Pos: (3) 169-169
IMPUTATION FLAG FOR VARIABLE C33C1_3
PER- WGHTDRESPONSE CODES FREQ CENT PCT
Not imputed 0 25187 97.7% 97.6%Regression based 1 593 2.3% 2.4%
TOTALS: 25780 100.0% 100.0%
Variable: MC3301 Numeric Pos: (3) 170-170
IMPUTATION FLAG FOR VARIABLE C3301
RESPONSEPER- WGHTD
CODES FREQ CENT PCT
Not imputed 0 25178 97.7% 97.4%Regression based 1 602 2.3% 2.6%
TOTALS: 25780 100.0% 100.0%
Variable: MC33E1_1 Numeric Pos: (3) 171-171
IMPUTATION FLAG FOR VARIABLE C33E1_1
RESPONSEPER- WGHTD
CODES FREQ CENT PCT
Not imputed 0 25204 97.8% 97.5%Regression based 1 576 2.2% 2.5%
TOTALS: 25780 100.0% 100.0%
BEST COPY AVAIL LE
Nov 22, 1996 page 21
Variable: MC33E1_2 Numeric Pos: (3) 172-172
IMPUTATION. FLAG FOR VARIABLE C33E1_2
RESPONSEPER- WGHTD
CODES FRED CENT PCT
Not imputed 0 25204 97.8% 97.5%Regression based 1 576 2.2% 2.5%
TOTALS: 25780 100.0% 100.0%
Variable: MC33E1_3 Numeric Pos: (3) 173-173
IMPUTATION FLAG FOR VARIABLE C33E1 3
RESPONSEPER- WGHTD
CODES FRED CENT PCT
Not imputed 0 25204 97.8% 97.5%Regression based 1 576 2.2% 2.5%
TOTALS: 25780 100.0% 100.0%
Variable: MC33A2 Numeric Pos: (3) 174-174
IMPUTATION FLAG FOR VARIABLE C33A2
RESPONSEPER- WGHTD
CODES FRED CENT PCT
Not imputed 0 25196 97.7% 97.3%Regression based 1 584 2.3% 2.7%
TOTALS: 25780 100.0% 100.0%
Variable: MC33B2 Numeric Pos: (3) 175-175
IMPUTATION FLAG FOR VARIABLE C3382
RESPONSEPER- WGHTD
CODES FREQ CENT PCT
Not imputed 0 25219 97.8% 97.7%Regression based 1 561 2.2% 2.3%
TOTALS: 25780 100.0% 100.0%
Variable: MC33C2_1 Numeric Pos: (3) 176-176
IMPUTATION FLAG FOR VARIABLE C33C2_1
RESPONSEPER- WGHTD
CODES FRED CENT PCT
Not imputed 0 25215 97.8% 97.7%Regression based 1 565 2.2% 2.3%
TOTALS: 25780 100.0% 100.0%
623
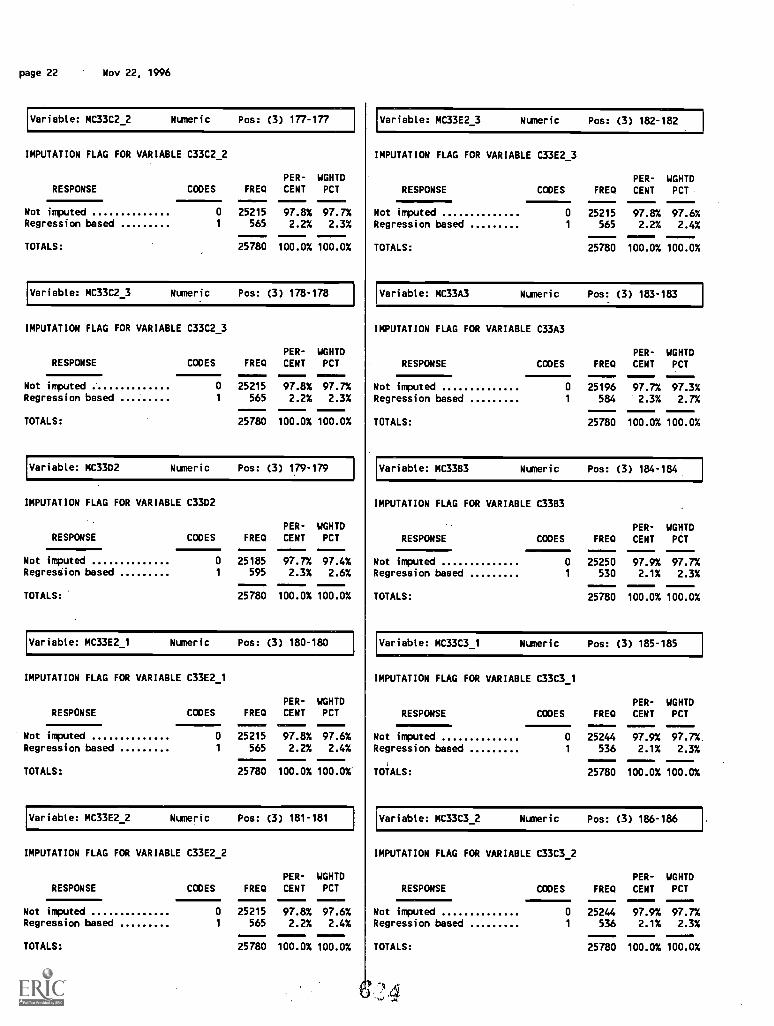
page 22 Nov 22, 1996
Variable: MC33C2_2 Numeric Pos: (3) 177-177
IMPUTATION FLAG FOR VARIABLE C33C2_2
PER- WGHTDRESPONSE CODES FRED CENT PCTle 1 1111011=1
Not imputed 0 25215 97.8% 97.7%Regression based 1 565 2.2% 2.3%
25780 100.0%
.1100.0%TOTALS:
Variable: MC33C23 Numeric Pos: (3) 178-178
IMPUTATION FLAG FOR VARIABLE C33C2_3
PER- WGHTDRESPONSE CODES FREQ CENT PCT RESPONSE CODES FRED CENT PCT
Not imputedRegression based
Variable: MC33E2_3 Numeric Pos: (3) 182-182
IMPUTATION FLAG FOR VARIABLE C33E2_3
RESPONSE
I Not imputedRegression based
TOTALS:
PER- WGHTDCODES FRED CENT PCT
0 25215 97.8% 97.6%1 565 2.2% 2.4%
25780 100.0% 100.0%
Variable: MC33A3 Numeric Pos: (3) 183-183
IMPUTATION FLAG FOR VARIABLE C33A3
PER- WGHTD
Not imputed 0 25215 97.8% 97.7%Regression based 1 565 2.2% 2.3%
TOTALS: 25780 100.0% 100.0%
Variable: MC33D2 Numeric Pos: (3) 179-179
IMPUTATION FLAG FOR VARIABLE C33D2
RESPONSEPER- WGHTD
CODES FREQ CENT PCT
Not imputed 0 25185 97.7% 97.4%Regression based 1 595 2.3% 2.6%
TOTALS: 25780 100.0% 100.0%
Variable: MC33E21 Numeric Pos: (3) 180-180
IMPUTATION FLAG FOR VARIABLE C33E2_1
RESPONSEPER- WGHTD
CODES FREQ CENT PCT
Not imputed 0 25215 97.8% 97.6%Regression based 1 565 2.2% 2.4%
TOTALS: 25780 100.0% 100.0%
Variable: MC33E2_2 Numeric Pos: (3) 181-181
IMPUTATION FLAG FOR VARIABLE C33E2_2
PER WGHTDRESPONSE CODES FRED CENT PCT RESPONSE CODES FRED CENT PCT
I TOTALS:
0 25196 97.7% 97.3%1 584 2.3% 2.7%
25780 100.0% 100.0%
Variable: MC33B3 Numeric Pos: (3) 184-184
IMPUTATION FLAG FOR VARIABLE C3383
RESPONSE
I Not imputedRegression based
I TOTALS:
PER- WGHTDCODES FREQ CENT PCT
0 25250 97.9% 97.7%1 530 2.1% 2.3%
25780 100.0% 100.0%
Variable: MC33C3_1 Numeric Pos: (3) 185-185
IMPUTATION FLAG FOR VARIABLE C33C31
RESPONSEPER- WGHTD
CODES FREQ CENT PCT
Not imputed 0 25244 97.9% 97.7%Regression based 1 536 2.1% 2.3%
TOTALS: 25780 100.0% 100.0%
Variable: MC33C3_2 Numeric Pos: (3) 186-186
IMPUTATION FLAG FOR VARIABLE C33C3_2
PER- WGHTD
Not imputed 0
-----25215
-----97.8%
-----97.6%
Regression based 1 565 2.2% 2.4%
TOTALS: 25780-----100.0%
-----100.0%
-Not imputed 0 25244 97.9% 97.7%Regression based 1 536 2.1% 2.3%
I TOTALS: 25780 100.0% 100.0%
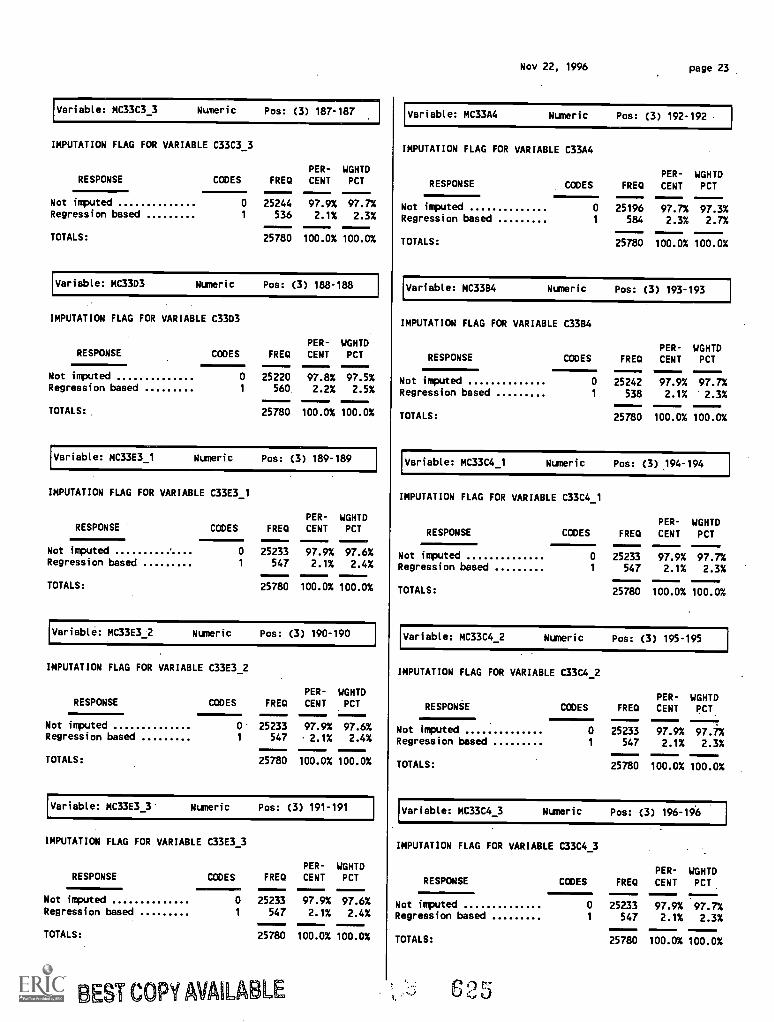
Variable: MC33C3_3 Nuneric Pos: (3) 187-187
IMPUTATION FLAG FOR VARIABLE C33C3_3
RESPONSE CODES FREQ.1 PER-
CENTWGHTDPCT
Not imputedRegression based
TOTALS:
O11110
1
25244536
97.9%2.1%
97.7%2.3%
25780 100.0% 100.0%
Variable: MC33D3 Numeric Pos: (3) 188-188
IMPUTATION FLAG FOR VARIABLE C33D3
RESPONSE11119PER- WGHTD
CODES FREO CENT PCT
Not imputed 0 25220 97.8% 97.5%Regression based 1 560 2.2% 2.5%
TOTALS: 25780 100.0% 100.0%
Variable: MC33E3_1 Numeric Pos: (3) 189-189
IMPUTATION FLAG FOR VARIABLE C33E3_1
RESPONSEPER- WGHTD
CODES FREQ CENT PCT
Not imputed 0 25233 97.9% 97.6%Regression based 1 547 2.1% 2.4%
TOTALS: 25780 100.0% 100.0%
Variable: MC33E32 Numeric Pos: (3) 190-190
IMPUTATION FLAG FOR VARIABLE C33E3_2
RESPONSEPER- WGHTD
CODES FRS/ CENT PCT
Not imputed 0 25233 97.9% 97.6%Regression based 1 547 2.1% 2.4%
TOTALS: 25780 100.0% 100.0%
Variable: MC33E3_3 Nuneric Pos: (3) 191-191
IMPUTATION FLAG FOR VARIABLE C33E3_3
RESPONSEPER- WGHTD
CODES FREQ CENT PCT
Not imputed 0 25233 97.9% 97.6%Regression based 1 547 2.1% 2.4%
TOTALS: 25780 100.0% 100.0%
BEST COPY AVAILABLE
Nov 22, 1996 page 23
Variable: MC33A4 Numeric Pos: (3) 192-192
IMPUTATION FLAG FOR VARIABLE C33A4
RESPONSEPER- WGHTD
CODES FREO CENT PCT
Not imputed 0 25196 97.7% 97.3%Regression based 1 584 2.3% 2.7%
TOTALS: 25780 100.0% 100.0%
Variable: MC33B4 Numeric Pos: (3) 193-193
IMPUTATION FLAG FOR VARIABLE C3384
RESPONSEPER- WGHTD
CODES FRED CENT PCT
Not imputed 0 25242 97.9% 97.7%Regression based 1 538 2.1% 2.3%
TOTALS: 25780 100.0% 100.0%
Variable: MC33C4_1 Numeric Pos: (3) 194-194
IMPUTATION FLAG FOR VARIABLE C33C4_1
PER- WGHTDRESPONSE CODES FREO CENT PCT
Not imputed 0 25233 97.9% 97.7%Regression based 1 547 2.1% 2.3%
TOTALS: 25780 100.0% 100.0%
Variable: MC33C4_2 Numeric Pos: (3) 195-195
IMPUTATION FLAG FOR VARIABLE C33C42
RESPONSEPER- WGHTD
CODES FRED CENT PCT
Not imputed 0 25233 97.9% 97.7%Regression based 1 547 2.1% 2.3%
TOTALS: 25780 100.0% 100.0%
Variable: MC33C4_3 Numeric Pos: (3) 196-196
IMPUTATION FLAG FOR VARIABLE C33C4_3
RESPONSEPER- WGHTD
CODES FRED CENT PCT,
Not imputed 0 25233 97.9% 97.7%Regression based 1 547 2.1% 2.3%
TOTALS: 25780 100.0% 100.0%
6 2 5
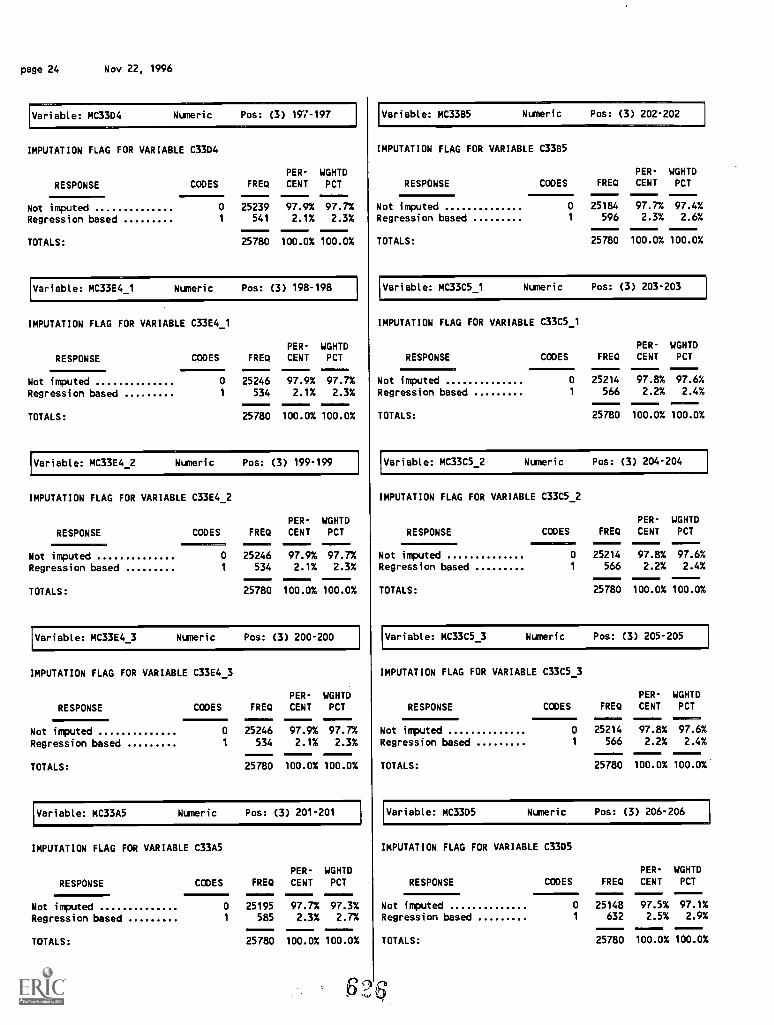
page 24 Nov 22, 1996
Variable: MC33D4 Numeric Pos: (3) 197-197
IMPUTATION FLAG FOR VARIABLE C33D4
RESPONSE
PER- WGHTDCODES FRED CENT PCT
Not imputed 0 25239 97.9% 97.7%Regression based 1 541 2.1% 2.3%
TOTALS: 25780 100.0% 100.0%
Variable: MC33E4_1 Numeric Pos: (3) 198-198
IMPUTATION FLAG FOR VARIABLE C33E4_1
RESPONSE
PER- WGHTDCODES FRED CENT PCT
Not imputed 0 25246 97.9% 97.7%
Regression based 1 534 2.1% 2.3%
TOTALS: 25780 100.0% 100.0%
Variable: MC33E4_2 Numeric Pos: (3) 199-199
IMPUTATION FLAG FOR VARIABLE C33E4_2
RESPONSE CODESPER- WGHTD
FRED CENT PCT
Not imputed 0 25246 97.9% 97.7%Regression based 1 534 2.1% 2.3%
TOTALS: 25780 100.0% 100.0%
Variable: MC33E4_3 Numeric Pos: (3) 200-200
IMPUTATION FLAG FOR VARIABLE C33E4_3
RESPONSE CODESPER- WGHTD
FRED CENT PCT
Not imputed 0 25246 97.9% 97.7%
Regression based 1 534 2.1% 2.3%
TOTALS: 25780 100.0% 100.0%
Variable: MC33A5 Numeric Pos: (3) 201-201
IMPUTATION FLAG FOR VARIABLE C33A5
PER- WGHTD
RESPONSE CODES FRED CENT PCT
Not imputed 0 25195 97.7% 97.3%
Regression based 1 585 2.3% 2.7%
TOTALS: 25780 100.0% 100.0%
Variable: MC33B5 Numeric Pos: (3) 202-202
IMPUTATION FLAG FOR VARIABLE C33B5
RESPONSE
PER- WGHTD
CODES FRED CENT PCT
Not imputed 0 25184 97.7% 97.4%
Regression based 1 596 2.3% 2.6%
TOTALS: 25780 100.0% 100.0%
Variable: MC33C5_1 Numeric Pos: (3) 203-203
IMPUTATION FLAG FOR VARIABLE C33C5_1
RESPONSE11=11111111MIN7
PER- WGHTD
CODES FRED CENT PCT
Not imputed 0 25214 97.8% 97.6%
Regression based 1 566 2.2% 2.4%
TOTALS: 25780 100.0% 100.0%
Variable: MC33C5_2 Numeric Pos: (3) 204-204
IMPUTATION FLAG FOR VARIABLE C33C5_2
PER- WGHTD
RESPONSE CODES FRED CENT PCT
Not imputed 0 25214 97.8%-----97.6%
Regression based 1 566 2.2% 2.4%
TOTALS: 25780 100.0% 100.0%
Variable: MC33C5_3 Numeric Pos: (3) 205-205
IMPUTATION FLAG FOR VARIABLE C33C5_3
RESPONSE
PER- WGHTDCODES FRED CENT PCT
Not imputed 0 25214 97.8% 97.6%
Regression based 1 566 2.2% 2.4%
TOTALS: 25780 100.0% 100.0%
Variable: MC33D5 Numeric Pos: (3) 206-206
IMPUTATION FLAG FOR VARIABLE C33D5
RESPONSE
PER- WGHTD
CODES FRED CENT PCT
Not imputed 0 25148 97.5% 97.1%
Regression based 1 632 2.5% 2.9%
TOTALS: 25780 100.0% 100.0%
26
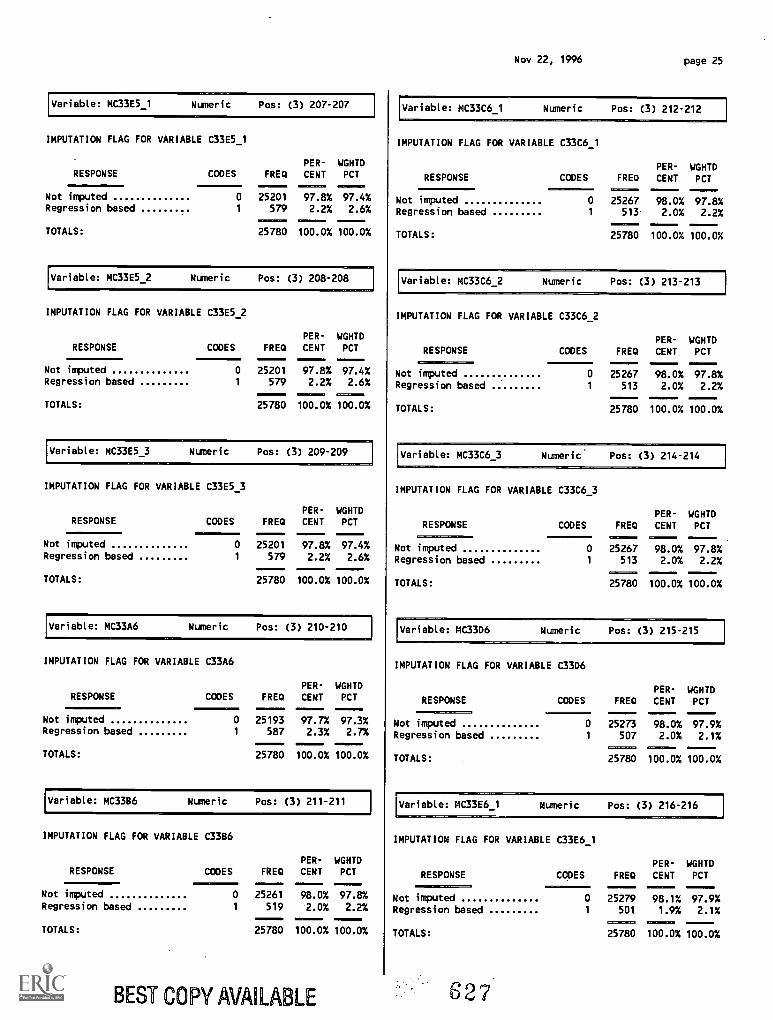
Variable: MC33E5_1 Numeric Pos: (3) 207-207
IMPUTATION FLAG FOR VARIABLE C33E5_1
PER- WGHTDRESPONSE CODES FRED CENT PCT
----- -----Not imputed 0 25201 97.8% 97.4%Regression based 1 579 2.2% 2.6%
TOTALS:
in:V=IMEIM i=ias.211.1
25780 100.0% 100.0%
Variable: MC33E5_2 Numeric Pos: (3) 208-208
IMPUTATION FLAG FOR VARIABLE C33E52
RESPONSE1111M0
PER- WGHTDCODES FREQ CENT PCT
Not imputed 0 25201 97.8% 97.4%Regression based 1 579 2.2% 2.6%
TOTALS: 25780 100.0% 100.0%
Variable: MC33E5_3 Numeric Pos: (3) 209-209
IMPUTATION FLAG FOR VARIABLE C33E5_3
PER- WGHTDRESPONSE CODES FREQ CENT PCT01I
Not imputed 0 25201 97.8% 97.4%Regression based 1 579 2.2% 2.6%
TOTALS: 25780 100.0% 100.0%
Variable: MC33A6 Numeric Pos: (3) 210-210
IMPUTATION FLAG FOR VARIABLE C33A6
RESPONSEPER- WGHTD
CODES FREQ CENT PCTMNIM110 SIMMENIMM
Not imputed 0 25193 97.7% 97.3%Regression based 1 587 2.3% 2.7%
TOTALS: 25780
MMI100.0% 100.0%
Variable: MC33B6 Numeric Pos: (3) 211-211
IMPUTATION FLAG FOR VARIABLE C3386
PER- WGHTDRESPONSE CODES FREQ CENT PCT
Not imputed 0 25261 98.0% 97.8%Regression based 1 519 2.0% 2.2%
TOTALS: 25780 100.0% 100.0%
BEST COPY AVAILABLE
Nov 22, 1996 page 25
Variable: MC33C6_1 Numeric Pos: (3) 212-212
IMPUTATION FLAG FOR VARIABLE C33C6_1
RESPONSEPER- WGHTD
CODES FRED CENT PCT
Not imputed 0 25267 98.0% 97.8%Regression based 1 513. 2.0% 2.2%
TOTALS: 25780 100.0% 100.0%
MC33C6_2 Numeric Pos: (3) 213-213
IMPUTATION FLAG FOR VARIABLE C33C6_2
RESPONSEPER- WGHTD
CODES FREQ CENT PCT
Not imputed 0 25267 98.0% 97.8%Regression based 1 513 2.0% 2.2%
TOTALS: 25780 100.0% 100.0%
Variable: MC33C6_3 Numeric Pos: (3) 214-214
IMPUTATION FLAG FOR VARIABLE C33C6_3
RESPONSEPER- WGHTD
CODES FRED CENT PCT
Not imputed 0 25267 98.0% 97.8%Regression based 1 513 2.0% 2.2%
TOTALS: 25780 100.0% 100.0%
Variable: MC33D6 Numeric Pos: (3) 215-215
IMPUTATION FLAG FOR VARIABLE C33D6
RESPONSE1.177.1==
PER- WGHTDCODES FREQ CENT PCT
Not imputed 0 25273 98.0% 97.9%Regression based 1 507 2.0% 2.1%
TOTALS: 25780 100.0% 100.0%
Variable: MC33E6_1 Numeric Pos: (3) 216-216
IMPUTATION FLAG FOR VARIABLE C33E6_1
RESPONSE CODES FREQPER-
CENTWGHTDPCTali0C71.
Not imputed 0
0125279
4:1=1.111=
98.1% 97.9%Regression based 1 501 1.9% 2.1%
TOTALS:
025780
=Eli= MEE.
100.0%
0100.0%
$27
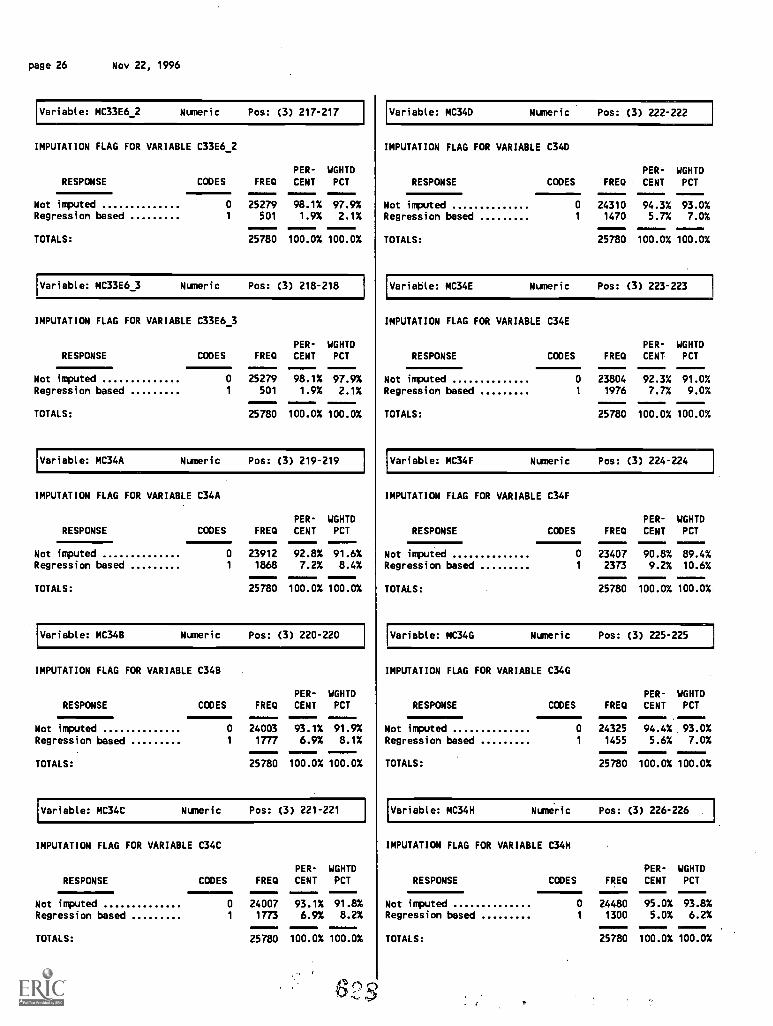
page 26 Nov 22, 1996
Variable: MC33E62 Numeric Pos: (3) 217-217
IMPUTATION FLAG FOR VARIABLE C33E6_2
PER- WGHTDRESPONSE CODES FRED CENT PCT
Not imputed 0 25279 98.1% 97.9%Regression based 1 501 1.9% 2.1%
TOTALS: 25780 100.0% 100.0%
Variable: MC33E63 Numeric Pos: (3) 218-218
IMPUTATION FLAG FOR VARIABLE C33E6_3
PER- WGHTDRESPONSE CODES FREQ CENT PCT
Not imputed 0 25279 98.1% 97.9%Regression based 1 501 1.9% 2.1%
TOTALS: 25780 100.0% 100.0%
Variable: MC34A Numeric Pos: (3) 219-219
IMPUTATION FLAG FOR VARIABLE C34A
RESPONSEPER- WGHTD
CODES FRED CENT PCT
Not imputed 0 23912 92.8% 91.6%Regression based 1 1868 7.2% 8.4%
TOTALS: 25780 100.0% 100.0%
Variable: MC34E Numeric Pos: (3) 220-220
IMPUTATION FLAG FOR VARIABLE C34B
PER- WGHTDRESPONSE CODES FRED CENT PCT
Not imputed 0 24003 93.1% 91.9%Regression based 1 1777 6.9% 8.1%
TOTALS: 25780 100.0% 100.0%
Variable: MC34C Numeric Pos: (3) 221-221
IMPUTATION FLAG FOR VARIABLE C34C
PER- WGHTD
RESPONSE CODES FRED CENT PCT
Not imputed 0 24007 93.1% 91.8%Regression based 1 1773 6.9% 8.2%
TOTALS: 25780 100.0% 100.0%
Variable: MC34D Numeric Pos: (3) 222-222
IMPUTATION FLAG FOR VARIABLE C34D
RESPONSEPER- WGHTD
CODES FRB) CENT PCT
Not imputed 0 24310 94.3% 93.0%Regression based 1 1470 5.7% 7.0%
TOTALS: 25780 100.0% 100.0%
Variable: MC34E Numeric Pos: (3) 223-223
IMPUTATION FLAG FOR VARIABLE C34E
RESPONSEPER- WGHTD
CODES FRED CENT PCT
Not imputed 0 23804 92.3% 91.0%Regression based 1 1976 7.7% 9.0%
TOTALS: 25780 100.0% 100.0%
Variable: MC34F Numeric Pos: (3)224 -224
IMPUTATION FLAG FOR VARIABLE C34F
RESPONSEPER- WGHTD
CODES FRED CENT PCT
Not imputed 0 23407 90.8% 89.4%Regression based 1 2373 9.2% 10.6%
TOTALS: 25780 100.0% 100.0%
Variable: MC34G Numeric Pos: (3) 225-225
IMPUTATION FLAG FOR VARIABLE C34G
RESPONSEPER- WGHTD
CODES FREQ CENT PCT
Not imputed 0 24325 94.4% 93.0%Regression based 1 1455 5.6% 7.0%
TOTALS: 25780 100.0% 100.0%
Variable: MC34H Numeric Pos: (3) 226-226
IMPUTATION FLAG FOR VARIABLE C34H
RESPONSEPER- WGHTD
CODES FRED CENT PCT
Not imputed 0 24480 95.0% 93.8%Regression based 1 1300 5.0% 6.2%
TOTALS: 25780 100.0% 100.0%
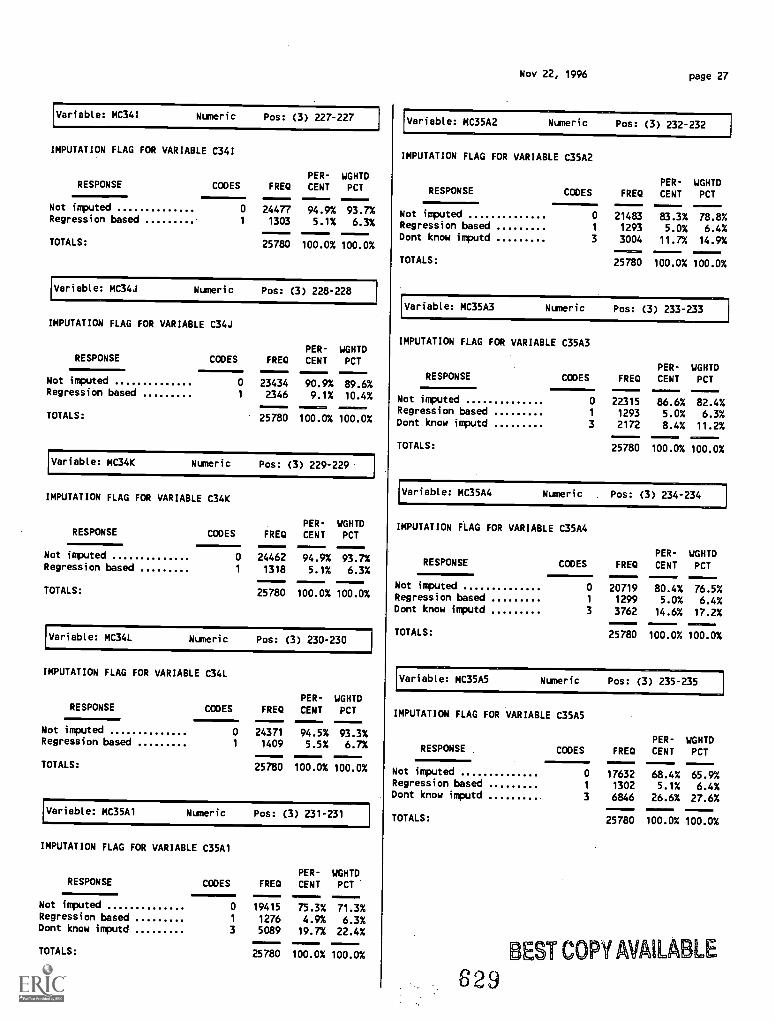
Numeric Pos: (3) 232-232 1Variable: MC34I Numeric Pos: (3) 227-227
IMPUTATION FLAG FOR VARIABLE C34I
RESPONSEPER- WGHTD
CODES FRED CENT PCT
Not imputed 0 24477 94.9% 93.7%Regression based 1 1303 5.1% 6.3%
TOTALS: 25780 100.0% 100.0%
Variable: MC34J Numeric Pos: (3) 228-228
IMPUTATION FLAG FOR VARIABLE C34J
RESPONSEPER- WGHTD
CODES FREQ CENT PCT
Not imputed 0 23434 90.9% 89.6%Regression based 1 2346 9.1% 10.4%
TOTALS: 25780 100.0% 100.0%
Variable: MC34K Numeric Pos: (3) 229-229
IMPUTATION FLAG FOR VARIABLE C34K
RESPONSEPER- WGHTD
CODES FRED CENT PCT
Not imputed 0 24462 94.9% 93.7%Regression based 1 1318 5.1% 6.3%
TOTALS: 25780 100.0% 100.0%
Variable: MC34L Numeric Pos: (3) 230-230
IMPUTATION FLAG FOR VARIABLE C341.
PER- WGHTDRESPONSE CODES FRED CENT PCT01
Not imputed 0 24371 94.5% 93.3%Regression based 1 1409 5.5% 6.7%
TOTALS: 25780 100.0% 100.0%
Variable: MC35A1 Numeric Pos: (3) 231-231
IMPUTATION FLAG FOR VARIABLE C35A1
RESPONSE CODES FREQPER-
CENTWGHTOPCT
Not imputed 0 19415 75.3% 71.3%Regression based 1 1276 4.9% 6.3%Dont know imputd 3 5089 19.7% 22.4%
TOTALS: 25780
0100.0%
00100.0%
Nov 22, 1996 page 27
Variable: MC35A2
IMPUTATION FLAG FOR VARIABLE C35A2
RESPONSE CODES FREDPER-
CENTWGHTDPCT110IMel
Not imputed 0 21483 83.3% 78.8%Regression based 1 1293 5.0% 6.4%Dont know imputd 3 3004 11.7% 14.9%
TOTALS: 25780
INSE100.0% 100.0%
Variable: MC35A3 Numeric Pos: (3) 233-233
IMPUTATION FLAG FOR VARIABLE C35A3
RESPONSE CODES FREDPER-
CENTWGHTDPCT
Not imputed 0 22315 86.6% 82.4%Regression based 1 1293 5.0% 6.3%Dont know imputd 3 2172 8.4% 11.2%
TOTALS: 25780 100.0% 100.0%
Variable: MC35A4 Numeric Pos: (3) 234-234
IMPUTATION FLAG FOR VARIABLE C35A4
RESPONSE CODES FREDPER-
CENTWGHTDPCT
Not imputed11111022
0 20719
MINiziO.
80.4% 76.5%Regression based 1 1299 5.0% 6.4%Dont know imputd 3 3762 14.6% 17.2%
TOTALS: 25780
IM111=1
100.0% 100.0%
Variable: MC35A5 Numeric Pos: (3) 235-235
IMPUTATION FLAG FOR VARIABLE C35A5
RESPONSE CODES FREDPER-
CENTWGHTDPCT
Not imputed 0 17632 68.4% 65.9%Regression based 1 1302 5.1% 6.4%Dont know imputd 3 6846 26.6% 27.6%
TOTALS: 25780 100.0% 100.0%
829EST COPY AVAILABLE
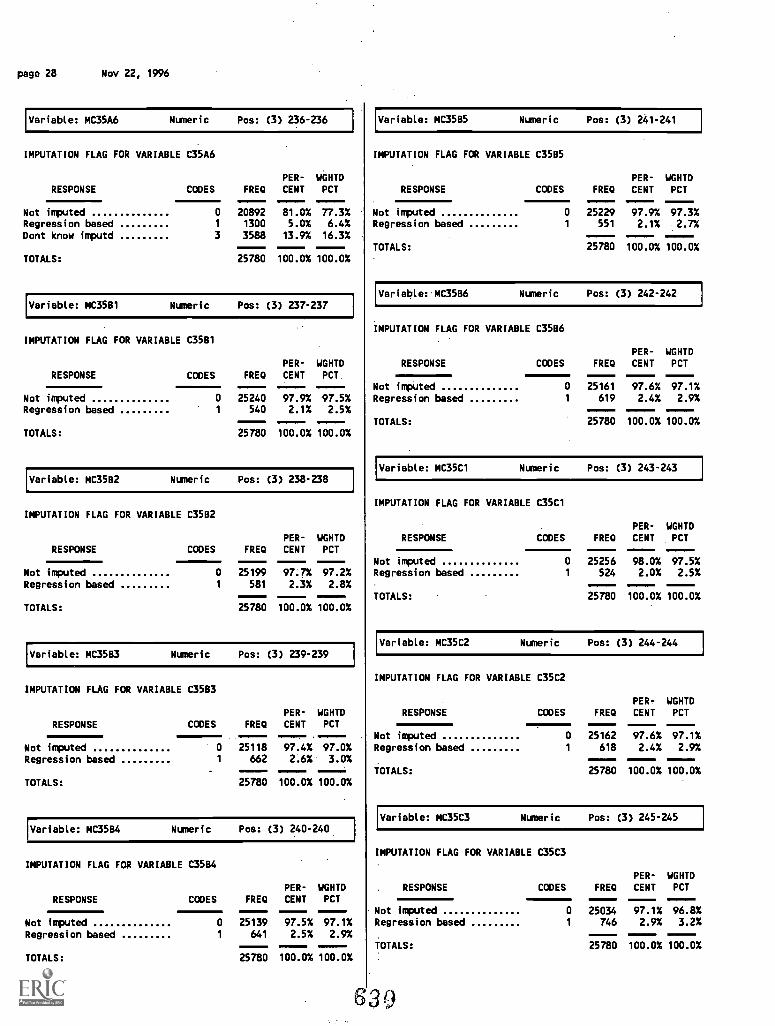
page 28 Nov 22, 1996
Variable: MC35A6 Numeric Pos: (3) 236-236
IMPUTATION FLAG FOR VARIABLE C35A6
RESPONSE CODES FREQ
PER-
CENTWGHTDPCT
Not imputed 0 20892 81.0% 77.3%Regression based 1 1300 5.0% 6.4%Dont know imputd 3 3588 13.9% 16.3%
TOTALS: 25780 100.0% 100.0%
Variable: MC35B1 Numeric Pos: (3) 237-237
IMPUTATION FLAG FOR VARIABLE C3581
PER- WGHTDRESPONSE CODES FRB) CENT PCT.
Not imputed 0 25240 97.9% 97.5%Regression based 1 540 2.1% 2.5%
TOTALS: 25780 100.0% 100.0%
Variable: MC35B2 Numeric Pos: (3) 238-238
IMPUTATION FLAG FOR VARIABLE C3582
RESPONSEPER- WGHTD
CODES FREQ CENT PCT
Not imputed 0 25199 97:7% 97.2%Regression based 1 581 2.3% 2.8%
TOTALS: 25780 100.0% 100.0%
Variable: MC35B3 Numeric Pos: (3) 239-239
IMPUTATION FLAG FOR VARIABLE C3583
RESPONSEPER- WGHTD
CODES FREQ CENT PCT
Not imputed 0 25118 97.4% 97.0%Regression based 1 662 2.6% 3.0%
TOTALS: 25780 100.0% 100.0%
Variable: MC35B4 Numeric Pos: (3) 240-240
IMPUTATION FLAG FOR VARIABLE C3584
PER- WGHTDRESPONSE CODES FREQ CENT PCT
Not imputed 0 25139 97.5% 97.1%
Regression based 1 641 2.5% 2.9%
TOTALS: 25780 100.0% 100.0%
Variable: MC35B5 Numeric Pos: (3) 241-241
IMPUTATION FLAG FOR VARIABLE C3585
RESPONSEPER- WGHTD
CODES FRB) CENT PCT
Not imputed 0 25229 97.9% 97.3%Regression based 1 551 2.1% 2.7%
TOTALS: 25780 100.0% 100.0%
Variable: MC35B6 Numeric Pos: (3) 242-242
IMPUTATION FLAG FOR VARIABLE C35B6
RESPONSEPER- WGHTD
CODES FREQ CENT PCT
Not imputed 0 25161 97.6% 97.1%Regression based 1 619 2.4% 2.9%
TOTALS: 25780 100.0% 100.0%
Variable: MC35C1 Numeric Pos: (3) 243-243
IMPUTATION FLAG FOR VARIABLE C35C1
RESPONSEPER- WGHTD
CODES FREQ CENT PCT
Not imputed 0 25256 98.0% 97.5%Regression based 1 524 2.0% 2.5%
TOTALS: 25780 100.0% 100.0%
Variable: MC35C2 Numeric Pos: (3) 244-244
IMPUTATION FLAG FOR VARIABLE C35C2
RESPONSEPER- WGHTD
CODES FREQ CENT PCT
Not imputed 0 25162 97.6% 97.1%Regression based 1 618 2.4% 2.9%
TOTALS: 25780 100.0% 100.0%
Variable: MC35C3 Numeric Pos: (3) 245-245
IMPUTATION FLAG FOR VARIABLE C35C3
RESPONSEPER- WGHTD
CODES FREQ CENT PCT
Not imputed 0 25034 97.1% 96.8%Regression based 1 746 2.9% 3.2%
TOTALS: 25780 100.0% 100.0%
630
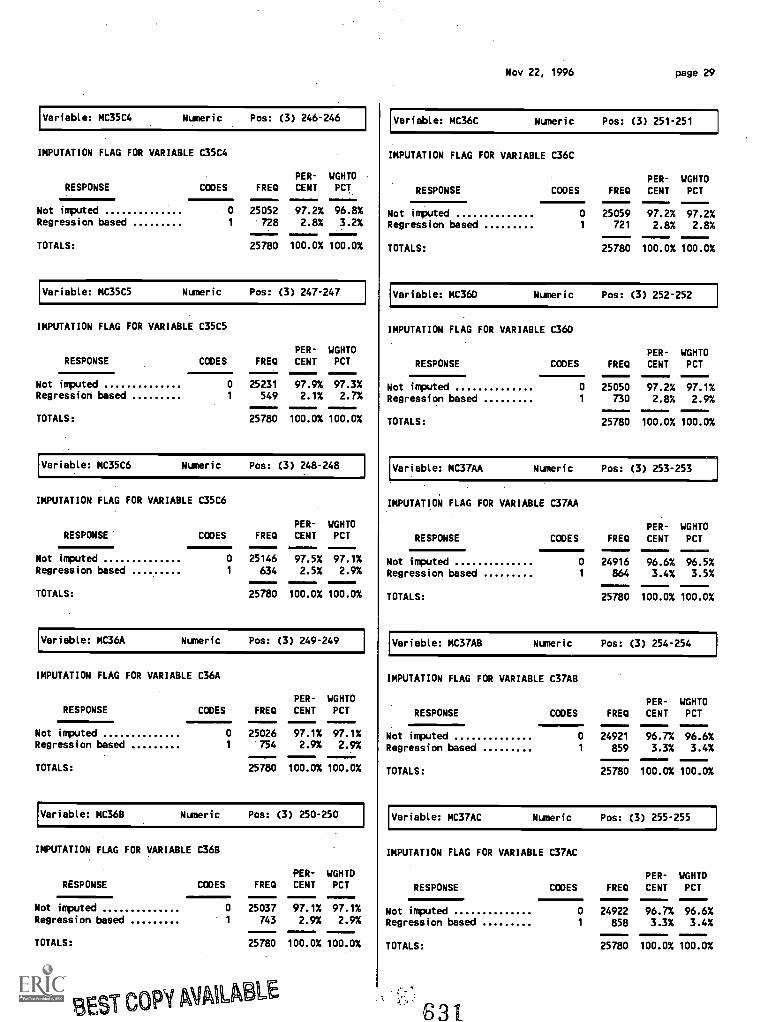
Variable: MC35C4 Numeric Pos: (3) 246-246
IMPUTATION FLAG FOR VARIABLE C35C4
PER- WGHTDRESPONSE CODES FREQ CENT PCT
Not imputed 0 25052 97.2% 96.8%Regression based 1 728 2.8% 3.2%
TOTALS: 25780 100.0% 100.0%
Variable: MC35C5 Numeric Pos: (3) 247-247
IMPUTATION FLAG FOR VARIABLE C35C5
PER- WGHTDRESPONSE CODES FREQ CENT PCT
Not imputed 0 25231 97.9% 97.3%Regression based 1 549 2.1% 2.7%
TOTALS: 25780 100.0% 100.0%
Variable: MC35C6 Numeric Pos: (3) 248-248
IMPUTATION FLAG FOR VARIABLE C35C6
RESPONSEPER- WGHTD
CODES FREQ CENT PCT
Not imputed 0 25146 97.5% 97.1%Regression based 1 634 2.5% 2.9%
TOTALS: 25780 100.0% 100.0%
Variable: MC36A Numeric Pos: (3) 249-249
IMPUTATION FLAG FOR VARIABLE C36A
RESPONSEPER- WGHTD
CODES FREQ CENT PCT
Not imputed 0 25026 97.1% 97.1%Regression based 1 754 2.9% 2.9%
TOTALS: 25780 100.0% 100.0%
Variable: MC36B Numeric Pos: (3) 250-250
IMPUTATION FLAG FOR VARIABLE C36B
RESPONSEPER- WGHTD
CODES FRB) CENT PCT
Not imputed 0 25037 97.1% 97.1%Regression based 1 743 2.9% 2.9%
TOTALS: 25780 100.0% 100.0%
BEST COPY MAUrre
Nov 22, 1996 page 29
Variable: MC36C Numeric Pos: (3) 251-251
IMPUTATION FLAG FOR VARIABLE C36C
RESPONSEPER- WGHTD
CODES FRED CENT PCTMMIIMINIe
Not imputed 0 25059 97.2% 97.2%Regression based 1 721 2.8% 2.8%
TOTALS: 25780 100.0% 100.0%
Variable: MC36D Numeric Pos: (3) 252-252
IMPUTATION FLAG FOR VARIABLE C360
RESPONSEPER- WGHTD
CODES FRED CENT PCT
Not imputed 0 25050 97.2% 97.1%Regression based 1 730 2.8% 2.9%
TOTALS: 25780 100.0% 100.0%
Variable: MC37AA Numeric Pos: (3) 253-253
IMPUTATION FLAG FOR VARIABLE C37AA
RESPONSEPER- WGHTD
CODES FRED CENT PCT
Not imputed 0 24916 96.6% 96.5%Regression based 1 864 3.4% 3.5%
TOTALS: 25780 100.0% 100.0%
Variable: MC37AB Numeric Pos: (3) 254-254
IMPUTATION FLAG FOR VARIABLE C37AB
RESPONSEPER- WGHTD
CODES FREQ CENT PCT
Not imputed 0 24921 96.7% 96.6%Regression based 1 859 3.3% 3.4%
TOTALS: 25780 100.0% 100.0%
Variable: MC37AC Numeric Pos: (3) 255-255
IMPUTATION FLAG FOR VARIABLE C37AC
RESPONSEPER- WGHTD
CODES FRED CENT PCT
Not imputed 0 24922 96.7% 96.6%Regression based 1 858 3.3% 3.4%
TOTALS: 25780 100.0% 100.0%
631
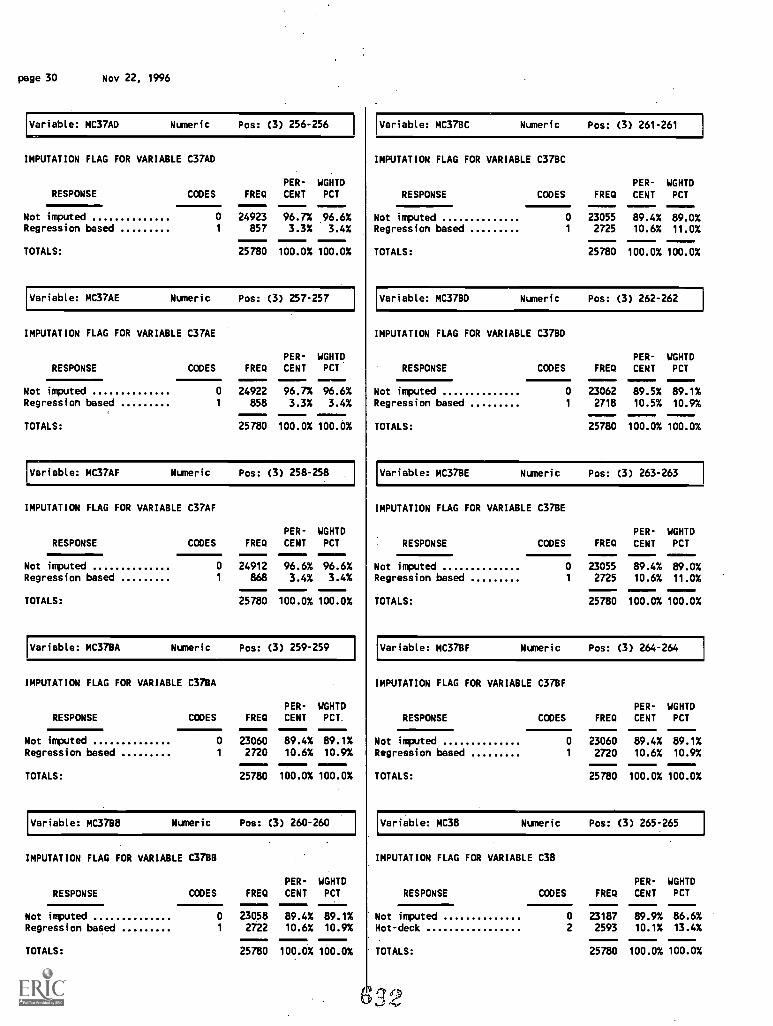
page 30 Nov 22, 1996
Variable: MC37AD Numeric Pos: (3) 256-256
IMPUTATION FLAG FOR VARIABLE C37AD
PER- WGHTDRESPONSE CODES FRED CENT PCT
Not imputed 0 24923 96.7%Regression based 1 857 3.3%
.96.6%
3.4%
TOTALS: 25780 100.0% 100.0%
Variable: MC37AE Numeric Pos: (3) 257-257
IMPUTATION FLAG FOR VARIABLE C37AE
RESPONSEPER- WGHTD
CODES FRED CENT PCT.
Not imputed 0 24922 96.7% 96.6%Regression based 1 858 3.3% 3.4%
TOTALS: 25780 100.0% 100.0%
Variable: MC37AF Numeric Pos: (3) 258-258
IMPUTATION FLAG FOR VARIABLE C37AF
PER- WGHTDRESPONSE CODES FRED CENT PCT
Not imputed 0 24912 96.6% 96.6%Regression based 1 868 3.4% 3.4%
TOTALS: 25780 100.0% 100.0%
Variable: MC37BA Numeric Pos: (3) 259-259
IMPUTATION FLAG FOR VARIABLE C37BA
RESPONSEPER- WGHTD
CODES FRED CENT PCT.
Not imputed 0 23060 89.4% 89.1%Regression based 1 2720 10.6% 10.9%
TOTALS: 25780 100.0% 100.0%
Variable: MC3788 Numeric Pos: (3) 260-260
IMPUTATION FLAG FOR VARIABLE C3788
PER- WGHTDRESPONSE CODES FRED CENT PCT
Not imputed 0 23058 89.4% 89.1%Regression based 1 2722 10.6% 10.9%
TOTALS: 25780 100.0% 100.0%
Variable: MC37BC Numeric Pos: (3) 261-261
IMPUTATION FLAG FOR VARIABLE C37BC
RESPONSEPER- WGHTD
CODES FRED CENT PCT
Not imputed 0 23055 89.4% 89.0%Regression based 1 2725 10.6% 11.0%
TOTALS: 25780 100.0% 100.0%
Variable: MC37BD Numeric Pos: (3) 262-262
IMPUTATION FLAG FOR VARIABLE C3780
RESPONSEPER- WGHTD
CODES FRED CENT PCT
Not imputed 0 23062 89.5% 89.1%Regression based 1 2718 10.5% 10.9%
TOTALS: 25780 100.0% 100.0%
Variable: MC37BE Numeric Pos: (3) 263-263
IMPUTATION FLAG FOR VARIABLE C37BE
RESPONSEPER- WGHTD
CODES FRED CENT PCT
Not imputed 0 23055 89.4% 89.0%Regression based 1 2725 10.6% 11.0%
TOTALS: 25780 100.0% 100.0%
Variable: MC37BF Numeric Pos: (3) 264-264
IMPUTATION FLAG FOR VARIABLE C37BF
RESPONSEPER- WGHTD
CODES FRED CENT PCT
Not imputed 0 23060 89.4% 89.1%Regression based 1 2720 10.6% 10.9%
TOTALS: 25780 100.0% 100.0%
Variable: MC38 Numeric Pos: (3) 265-265
IMPUTATION FLAG FOR VARIABLE C38
RESPONSEPER- WGHTD
CODES FRED CENT PCT
Not imputed 0 23187 89.9% 86.6%Hot-deck 2 2593 10.1% 13.4%
TOTALS: 25780 100.0% 100.0%
612
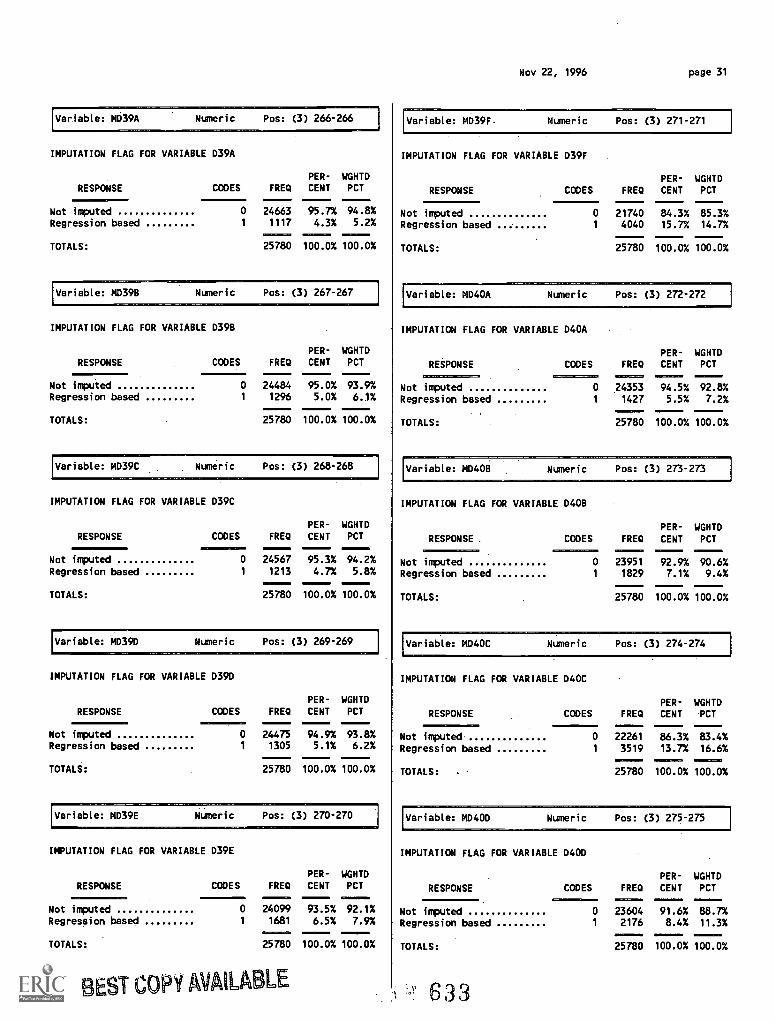
Variable: MD39A Numeric Pos: (3) 266-266
IMPUTATION FLAG FOR VARIABLE D39A
PER- WGHTD
RESPONSE CODES FREO CENT PCT
--------Not imputed 0 24663
-----95.7%
-----94.8%
Regression based 1 1117 4.3% 5.2%
TOTALS:
0125780
0100.0%
0100.0%
Variable: MD39B Numeric Pos: (3) 267-267
IMPUTATION FLAG FOR VARIABLE 039B
PER- WGHTDRESPONSE CODES FREO CENT PCT
--------Not imputed 0
-----24484 95.0% 93.9%
Regression based 1 1296 5.0% 6.1%
TOTALS: 25780 100.0% 100.0%
Variable: MD39C Numeric Pos: (3) 268-268
IMPUTATION FLAG FOR VARIABLE 039C
RESPONSEPER- WGHTD
CODES FREO CENT PCT--------
Not imputed 0 24567 95.3% 94.2%Regression based 1 1213 4.7% 5.8%
TOTALS: 25780 100.0% 100.0%
Variable: MD39D Numeric Pos: (3) 269-269
IMPUTATION FLAG FOR VARIABLE D39D
PER- WGHTDRESPONSE CODES FRED CENT PCT
--------Not imputed 0 24475 94.9% 93.8%Regression based 1 1305 5.1% 6.2%
TOTALS: 25780 100.0% 100.0%
Variable: MD39E Numeric Pos: (3) 270-270
IMPUTATION FLAG FOR VARIABLE D39E
RESPONSEPER- WGHTD
CODES FREO CENT PCT
Not imputed 0 24099 93.5% 92.1%Regression based 1 1681 6.5% 7.9%
TOTALS: 25780 100.0% 100.0%
BEST COPY AVAILABLE
Nov 22, 1996 page 31
Variable: MC139F. Numeric Pos: (3) 271-271
IMPUTATION FLAG FOR VARIABLE D39F
RESPONSEPER- WGHTD
CODES FRED CENT PCT
--------Not imputed 0 21740 84.3% 85.3%Regression based 1 4040 15.7% 14.7%
TOTALS: 25780 100.0% 100.0%
Variable: MD40A Numeric Pos: (3) 272-272
IMPUTATION FLAG FOR VARIABLE 040A
RESPONSEPER- WGHTD
CODES FRED CENT PCT
Not imputed 0 24353 94.5% 92.8%Regression based 1 1427 5.5% 7.2%
TOTALS:
1111=11=101M
25780 100.0% 100.0%
Variable: MD4OB Numeric Pos: (3) 273-273
IMPUTATION FLAG FOR VARIABLE 040B
RESPONSE .
PER- WGHTDCODES FRED CENT PCT
0111711=1 01111111
Not imputed 0 23951 92.9% 90.6%Regression based 1 1829 7.1% 9.4%
TOTALS: 25780 100.0% 100.0%
Variable: MD40C Numeric Pos: (3) 274-274
IMPUTATION FLAG FOR VARIABLE 040C
RESPONSEPER- WGHTD
CODES FRED CENT 'PCT
Not imputed 0 22261 86.3% 83.4%Regression based 1 3519 13.7% 16.6%011
25780
0111100.0%TOTALS: 100.0%
Variable: MD400 Numeric Pos: (3).275-275
IMPUTATION FLAG FOR VARIABLE D400
PER- WGHTD
RESPONSE CODES FREO CENT PCTp==SMIOPMCI1.11.
Not imputed
C911====MIMS
0
1==.1M
23604
0111.MM/a
91.6%
MIMM1IMM
88.7%Regression based 1 2176 8.4% 11.3%
TOTALS: 25780 100.0% 100.0%
633
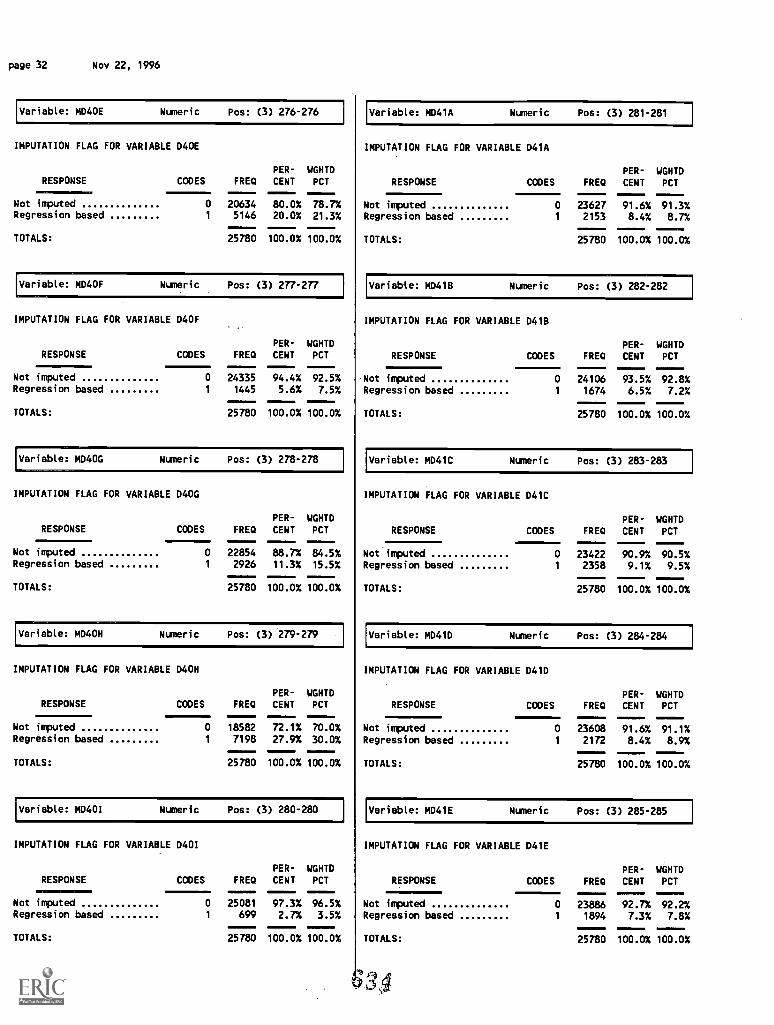
page 32 Nov 22, 1996
Variable: MD4OE Numeric Pos: (3) 276-276
IMPUTATION FLAG FOR VARIABLE D4OE
RESPONSE CODESPER- WGHTD
FRED CENT PCT
Not imputed 0 20634 80.0% 78.7%Regression based 1 5146 20.0% 21.3%
TOTALS: 25780 100.0% 100.0%
Variable: MD4OF Numeric Pos: (3) 277-277
IMPUTATION FLAG FOR VARIABLE D4OF
RESPONSEPER- WGHTD
CODES FRED CENT PCT
Not imputed 0 24335 94.4% 92.5%Regression based 1 1445 5.6% 7.5%
TOTALS: 25780 100.0% 100.0%
Variable: MD4OG Numeric Pos: (3) 278-278
IMPUTATION FLAG FOR VARIABLE D4OG
RESPONSE CODESPER- WGHTD
FRED CENT PCT
Not imputed 0 22854 88.7% 84.5%Regression based 1 2926 11.3% 15.5%
TOTALS: 25780 100.0% 100.0%
Variable: MD4OH Numeric Pos: (3) 279-279
IMPUTATION FLAG FOR VARIABLE D4OH
RESPONSE1:11NIMOIM
PER- WGHTDCODES FRED CENT PCT
Not imputed 0 18582 72.1% 70.0%Regression based 1 7198 27.9% 30.0%
TOTALS: 25780 100.0% 100.0%
Variable: MD401 Numeric Pos: (3) 280-280
IMPUTATION FLAG FOR VARIABLE D401
RESPONSE
Variable: MD41A Numeric Pos: (3) 281-281
IMPUTATION FLAG FOR VARIABLE D41A
RESPONSEPER- WGHTD
CODES FRED CENT PCT
Not imputed 0 23627 91.6% 91.3%Regression based 1 2153 8.4% 8.7%
TOTALS: 25780 100.0%
:EN100.0%
Variable: MD41B Numeric Pos: (3) 282-282
IMPUTATION FLAG FOR VARIABLE D41B
RESPONSEPER- WGHTD
CODES FRED CENT PCT
Not imputed 0 24106 93.5% 92.8%Regression based 1 1674 6.5% 7.2%
TOTALS: 25780 100.0% 100.0%
Variable: MD41C Numeric Pos: (3) 283-283
IMPUTATION FLAG FOR VARIABLE D41C
RESPONSEPER- WGHTD
CODES FRED CENT PCT
Not imputed 0 23422 90.9% 90.5%Regression based 1 2358 9.1% 9.5%
TOTALS: 25780 100.0% 100.0%
Variable: MD41D Numeric Pos: (3) 284-284
IMPUTATION FLAG FOR VARIABLE D410
RESPONSEPER- WGHTD
CODES FRED CENT PCT
Not imputed 0 23608 91.6% 91.1%Regression based 1 2172 8.4% 8.9%
TOTALS: 25780 100.0% 100.0%
Variable: MD41E Numeric Pos: (3) 285-285
IMPUTATION FLAG FOR VARIABLE D41E
PER- WGHTD PER- WGHTDCODES FRED CENT PCT RESPONSE CODES FRED CENT PCT
Not imputed 0 25081 97.3% 96.5%Regression based 1 699 2.7% 3.5%
TOTALS: 25780 100.0% 100.0%
Not imputed 0 23886 92.7% 92.2%Regression based 1 1894 7.3% 7.8%
TOTALS: 25780 100.0% 100.0%
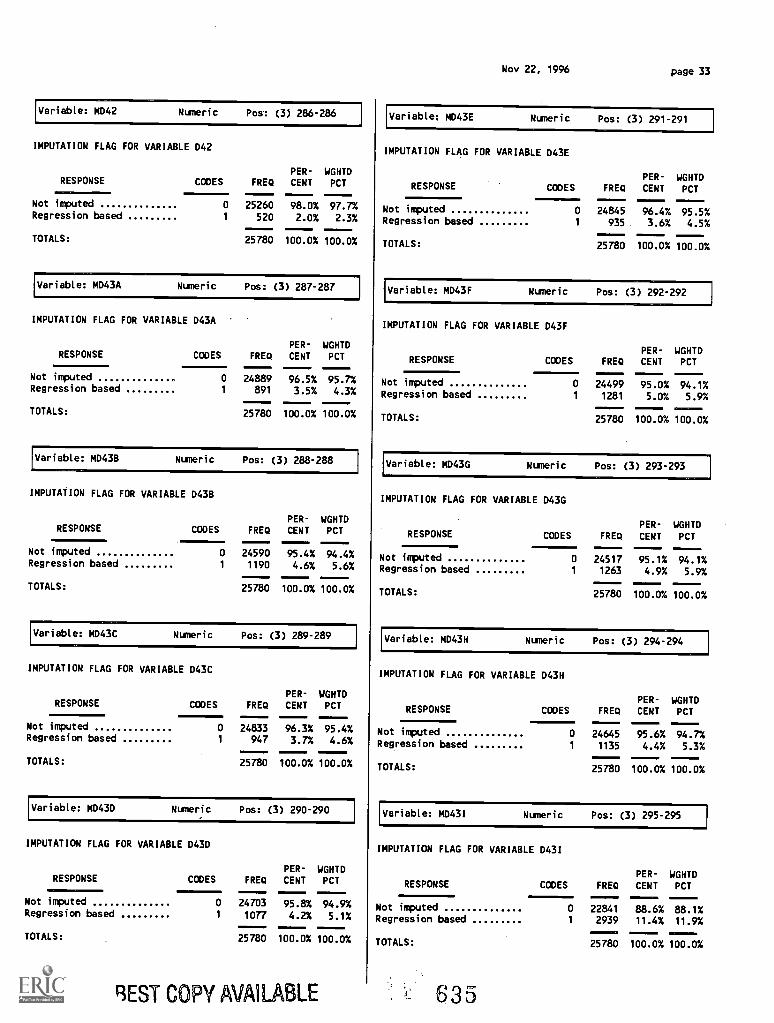
Variable: MD42 Numeric Pos: (3) 286-286
IMPUTATION FLAG FOR VARIABLE D42
RESPONSE111ffilliI!
PER- WGHTDCODES FREQ CENT PCT
Not imputed 0 25260 98.0% 97.7%Regression based 1 520 2.0% 2.3%
TOTALS: 25780 100.0% 100.0%
Variable: MD43A Numeric Pos: (3) 287-287
IMPUTATION FLAG FOR VARIABLE D43A
RESPONSEPER- WGHTD
CODES FRED CENT PCT
Not imputed 0 24889 96.5% 95.7%Regression based 1 891 3.5% 4.3%
TOTALS: 25780 100.0% 100.0%
Variable: MD43E Numeric Pos: (3) 288-288
IMPUTATION FLAG FOR VARIABLE D43B
PER- WGHTDRESPONSE CODES FRED CENT PCT
Not imputed 0 24590 95.4% 94.4%Regression based 1 1190 4.6% 5.6%
TOTALS: 25780 100.0% 100.0%
Variable: MD43C Numeric Pos: (3) 289-289
IMPUTATION FLAG FOR VARIABLE D43C
RESPONSEPER- WGHTD
CODES FREQ CENT PCT
Not imputed 0 24833 96.3% 95.4%Regression based 1 947 3.7% 4.6%
TOTALS: 25780 100.0% 100.0%
Variable: MD43D Numeric Pos: (3) 290-290
IMPUTATION FLAG FOR VARIABLE D43D
PER- WGHTDRESPONSE CODES FRED CENT PCT
Not imputed 0 24703 95.8% 94.9%Regression based 1 1077 4.2% 5.1%
TOTALS: 25780 100.0% 100.0%
Nov 22, 1996 page 33
Variable: MD43E Numeric Pos: (3) 291-291
IMPUTATION FLAG FOR VARIABLE D43E
RESPONSEPER- WGHTD
CODES FREQ CENT PCT
Not imputed 0 24845 96.4% 95.5%Regression based 1 935 3.6% 4.5%
TOTALS: 25780 100.0% 100.0%
Variable: MD43F Numeric Pos: (3) 292-292
IMPUTATION FLAG FOR VARIABLE D43F
RESPONSEPER- WGHTD
CODES FREQ CENT PCT
Not imputed 0 24499 95.0% 94.1%Regression based 1 1281 5.0% 5.9%
25780 100.0%
MMMIO.
100.0%TOTALS:
Variable: MD43G Numeric Pos: (3) 293-293
IMPUTATION FLAG FOR VARIABLE D43G
RESPONSEPER- WGHTD
CODES FREQ CENT PCT
Not imputed 0 24517 95.1% 94.1%Regression based 1 1263 4.9% 5.9%
TOTALS: 25780 100.0% 100.0%
Variable: MD43H Numeric Pos: (3) 294-294
IMPUTATION FLAG FOR VARIABLE D43H
RESPONSEPER- WGHTD
CODES FRB) CENT PCT
Not imputed 0 24645 95.6% 94.7%Regression based 1 1135 4.4% 5.3%
TOTALS: 25780 100.0% 100.0%
Variable: MD431 Numeric Pos: (3) 295-295
IMPUTATION FLAG FOR VARIABLE D43I
RESPONSEPER- WGHTD
CODES FREQ CENT PCT
Not imputed 0 22841 88.6% 88.1%Regression based 1 2939 11.4% 11.9%
TOTALS: 25780 100.0% 100.0%
BEST COPY AVAILABLE 6 3 5
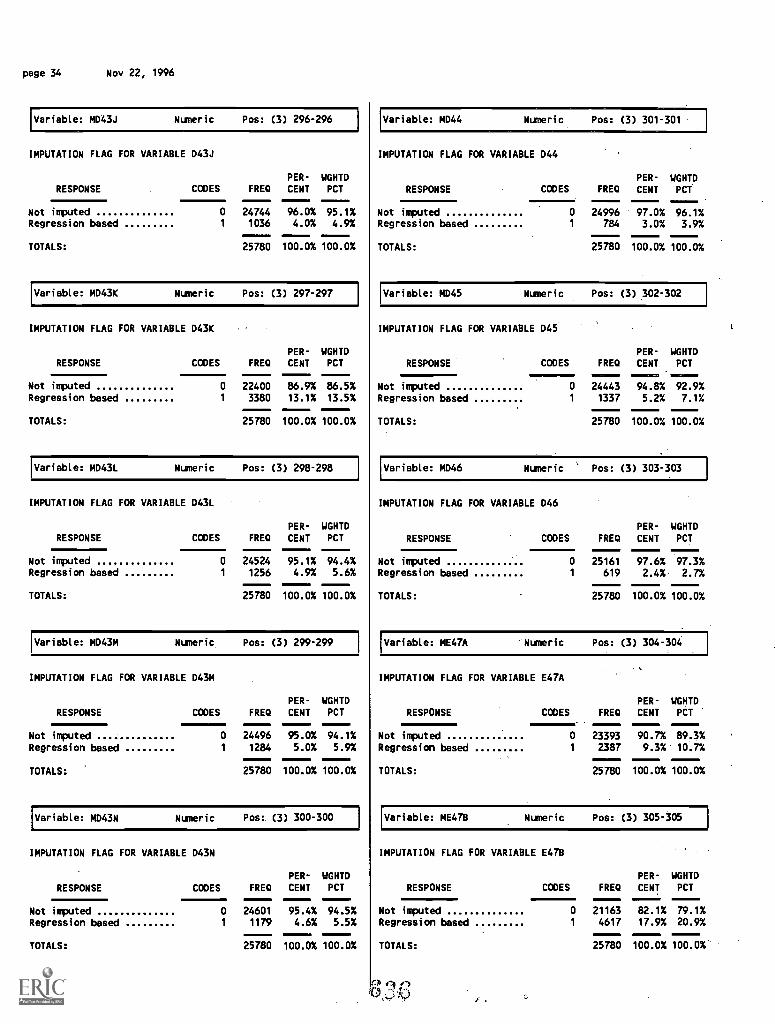
page 34 Nov 22, 1996
Variable: MD43J Numeric Pos: (3) 296-296
IMPUTATION FLAG FOR VARIABLE D43J
RESPONSE CODESPER- WGHTD
FREQ CENT PCT
Not imputed 0 24744 96.0% 95.1%Regression based 1 1036 4.0% 4.9%
TOTALS: 25780 100.0% 100.0%
Variable: MD43K Numeric Pos: (3) 297-297
IMPUTATION FLAG FOR VARIABLE D43K
RESPONSE
I
Variable: MD44 Numeric Pos: (3) 301-301
IMPUTATION FLAG FOR VARIABLE D44
RESPONSEPER- WGHTD
CODES FRED CENT PCT
Not imputed 0 24996 97.0% 96.1%Regression based 1 784 3.0% 3.9%
TOTALS: 25780 100.0% 100.0%
Variable: MD45 Numeric Pos: (3) 302-302
IMPUTATION FLAG FOR VARIABLE D45
PER- WGHTD PER- WGHTDCODES FUG CENT PCT RESPONSE CODES FREQ CENT PCT
Not imputed 0 22400 86.9% 86.5%Regression based 1 3380 13.1% 13.5%
TOTALS: 25780 100.0% 100.0%
Variable: MD43L Numeric Pos: (3) 298-298
IMPUTATION FLAG FOR VARIABLE D43L
Not imputedRegression based
I TOTALS:
0 24443-----94.8%
-----92.9%
1 1337 5.2% 7.1%
25780 100.0% 100.0%
Variable: MD46 Numeric Pos: (3) 303-303
IMPUTATION FLAG FOR VARIABLE D46
PER- WGHTDRESPONSE CODES FREQ CENT PCT RESPONSE
Not imputed 0 24524 95.1% 94.4%Regression based 1 1256 4.9% 5.6%
TOTALS: 25780 100.0% 100.0%
Variable: MD43M Numeric Pos: (3) 299-299
IMPUTATION FLAG FOR VARIABLE D43M
RESPONSEPER- WGHTD
CODES FREQ CENT PCT
Not imputed 0 24496 95.0% 94.1%Regression based 1 1284 5.0% 5.9%
TOTALS: 25780 100.0% 100.0%
Variable: MD43N Numeric Pos: (3) 300-300
IMPUTATION FLAG FOR VARIABLE D43N
Not imputedRegression based
TOTALS:
PER- WGHTDCODES FREQ CENT PCT
0 25161 97.6% 97.3%1 619 2.4% 2.7%
25780 100.0% 100.0%
Variable: ME47A 'Numeric Pos: (3) 304-304
IMPUTATION FLAG FOR VARIABLE E47A
RESPONSE
I Not imputedRegression based
I TOTALS:
PER- WGHTDCODES FREQ CENT PCT
0 23393 90.7% 89.3%1 2387 9.3% 10.7%
25780 100.0% 100.0%
Variable: ME478 Numeric Pos: (3) 305-305
IMPUTATION FLAG FOR VARIABLE E478
PER- WGHTDRESPONSE CODES FRED CENT PCT RESPONSE
Not imputed 0 24601 95.4% 94.5%Regression based 1 1179 4.6% 5.5%
TOTALS: 25780 100.0% 100.0%
Not imputedRegression based
TOTALS:
PER- WGHTDCODES FREQ CENT IPCT
0 21163 82.1% 79.1%1 4617 17.9% 20.9%
25780 100.0% 100.0%
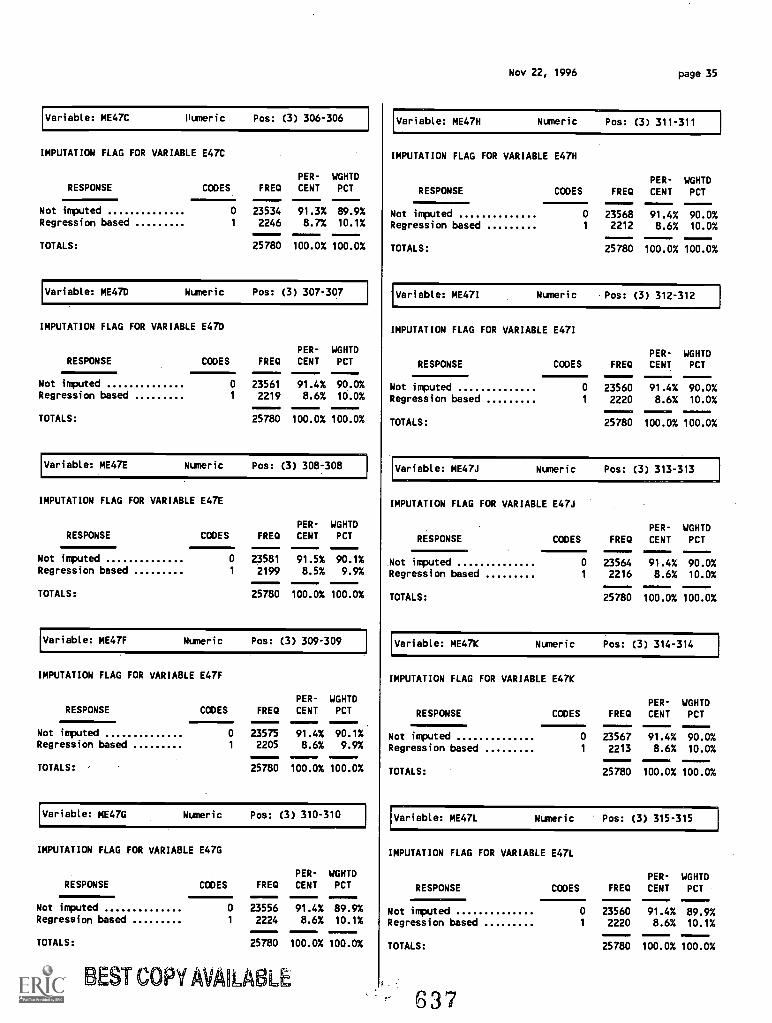
Variable: ME47C Humeric Pos: (3) 306-306
IMPUTATION FLAG FOR VARIABLE E47C
PER- WGHTDRESPONSE CODES FRED CENT PCT
Not imputed 0 23534 91.3% 89.9%Regression based 1 2246 8.7% 10.1%
TOTALS: 25780 100.0% 100.0%
Variable: ME47D Nuneric Pos: (3) 307-307
IMPUTATION FLAG FOR VARIABLE E47D
RESPONSEPER- WGHTD
CODES FRED CENT PCT111111
Not imputed 0 23561 91.4% 90.0%Regression based 1 2219 8.6% 10.0%
TOTALS: 25780 100.0% 100.0%
Variable: ME47E Numeric Pos: (3) 308-308
IMPUTATION FLAG FOR VARIABLE E47E
PER- WGHTDRESPONSE CODES FRED CENT PCT
Not imputed 0 23581 91.5%-----90.1%
Regression based 1 2199 8.5% 9.9%
TOTALS: 25780 100.0% 100.0%
Variable: ME47F Numeric Pos: (3) 309-309
IMPUTATION FLAG FOR VARIABLE E47F
RESPONSEPER- WGHTD
CODES FRED CENT PCT.
Not imputed 0 23575 91.4% 90.1%Regression based 1 2205 8.6% 9.9%
TOTALS: 25780 100.0% 100.0%
Variable: ME47C Numeric Pos: (3) 310-310
IMPUTATION FLAG FOR VARIABLE E47G
PER- WGHTDRESPONSE CODES FRED CENT PCT
Not imputed 0 23556 91.4% 89.9%Regression based 1 2224 8.6% 10.1%
TOTALS: 25780 100.0% 100.0%
BEST COPY AWARE
Nov 22, 1996 page 35
Variable: ME47H Nuneric Pos: (3) 311-311
IMPUTATION FLAG FOR VARIABLE E47H
PER- WGHTDRESPONSE CODES FRED CENT PCT
Not imputed 0 23568 91.4% 90.0%Regression based 1 2212 8.6% 10.0%
TOTALS: 25780 100.0% 100.0%
Variable: ME471 Numeric Pos: (3) 312-312
IMPUTATION FLAG FOR VARIABLE E47I
RESPONSEPER- WGHTD
CODES FRED CENT PCT
Not imputed 0 23560 91.4% 90.0%Regression based 1 2220 8.6% 10.0%
TOTALS:
IIMMINI117 1=1M=1 .117797.1.
25780 100.0% 100.0%
Variable: ME47J Numeric Pos: (3) 313-313
IMPUTATION FLAG FOR VARIABLE E47J
RESPONSEPER- WGHTD
CODES FRED CENT PCT
Not imputed 0 23564 91.4% 90.0%Regression based 1 2216 8.6% 10.0%
TOTALS: 25780
110100.0% 100.0%
Variable: ME47K Numeric Pos: (3) 314-314
IMPUTATION FLAG FOR VARIABLE E47K
RESPONSEPER- WGHTD
CODES FRED CENT PCT
Not imputed 0 23567 91.4% 90.0%Regression based 1 2213 8.6% 10.0%
TOTALS: 25780 100.0% 100.0%
Variable: ME47L Numeric Pos: (3) 315-315
IMPUTATION FLAG FOR VARIABLE E47L
RESPONSEPER- WGHTD
CODES FRED CENT PCTMIIN
Not imputed 0 23560 91.4% 89.9%Regression based 1 2220 8.6% 10.1%
TOTALS: 25780 100.0% 100.0%
637
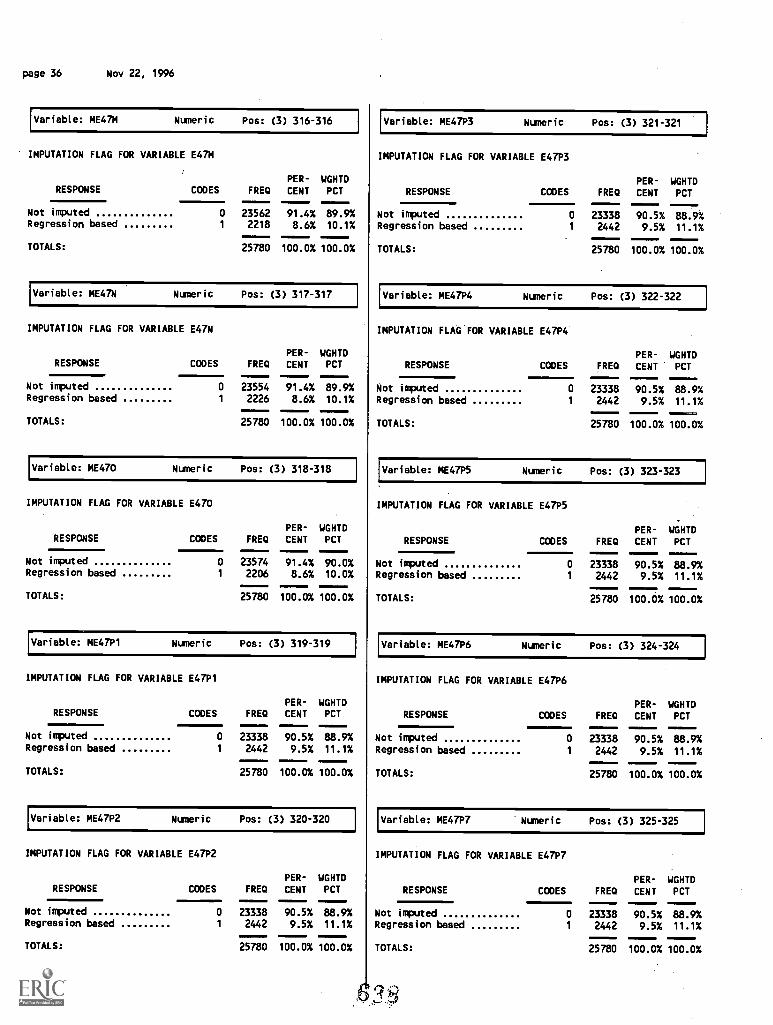
page 36 Nov 22, 1996
Variable: ME47M Numeric Pos: (3) 316-316
IMPUTATION FLAG FOR VARIABLE E47M
RESPONSE CODESPER- WGHTD
FRED CENT PCT
Not imputed 0 23562 91.4% 89.9%Regression based 1 2218 8.6% 10.1%
TOTALS: 25780 100.0% 100.0%
Variable: ME47N Numeric Pos: (3) 317-317
IMPUTATION FLAG FOR VARIABLE E47N
RESPONSEPER- WGHTD
CODES FRED CENT PCT
Not imputed 0 23554 91.4% 89.9%Regression based 1 2226 8.6% 10.1%
TOTALS: 25780 100.0% 100.0%
Variable: ME470 Numeric Pos: (3) 318-318
IMPUTATION FLAG FOR VARIABLE E470
PER- WGHTD
Variable: ME47P3 Numeric Pos: (3) 321-321
IMPUTATION FLAG FOR VARIABLE E47P3
RESPONSEPER- WGHTD
CODES FRED CENT PCT
Not imputed 0 23338 90.5% 88.9%Regression based 1 2442 9.5% 11.1%
TOTALS: 25780 100.0% 100.0%
Variable: ME47P4 Numeric Pos: (3) 322-322
IMPUTATION FLAG FOR VARIABLE E47P4
RESPONSEPER- WGHTD
CODES FRED CENT PCT
Not imputed 0 23338 90.5% 88.9%Regression based 1 2442 9.5% 11.1%
TOTALS: 25780 100.0% 100.0%
Variable: ME47P5 Numeric Pos: (3) 323-323
IMPUTATION FLAG FOR VARIABLE E47P5
PER- WGHTDRESPONSE CODES FRED CENT PCT RESPONSE CODES FRED CENT PCT
Not imputed 0 23574 91.4% 90.0%Regression based 1 2206 8.6% 10.0%
TOTALS: 25780 100.0% 100.0%
Variable: ME47P1 Numeric Pos: (3) 319-319
IMPUTATION FLAG FOR VARIABLE E47P1
RESPONSEPER- WGHTD
CODES FRED CENT PCT
Not imputed 0 23338 90.5% 88.9%Regression based 1 2442 9.5% 11.1%
TOTALS: 25780 100.0% 100.0%
Variable: ME47P2 Numeric Pos: (3) 320-320
IMPUTATION FLAG FOR VARIABLE E47P2
PER- WGHTDRESPONSE CODES FRED CENT PCT RESPONSE
Not imputed 0 23338 90.5% 88.9%Regression based 1 2442 9.5% 11.1%
TOTALS: 25780 100.0% 100.0%
Variable: ME47P6 Numeric Pos: (3) 324-324
IMPUTATION FLAG FOR VARIABLE E47P6
RESPONSEPER- WGHTD
CODES FRED CENT PCT
Not imputed 0 23338 90.5% 88.9%Regression based 1 2442 9.5% 11.1%
TOTALS: 25780 100.0% 100.0%
Variable: ME47P7 Numeric Pos: (3) 325-325
IMPUTATION FLAG FOR VARIABLE E47P7
Not imputed 0 23338 90.5% 88.9%Regression based 1 2442 9.5% 11.1%
TOTALS: 25780 100.0% 100.0%
PER- WGHTDCODES FRED CENT PCT
Not imputed 0 23338 90.5% 88.9%Regression based 1 2442 9.5% 11.1%
TOTALS: 25780 100.0% 100.0%
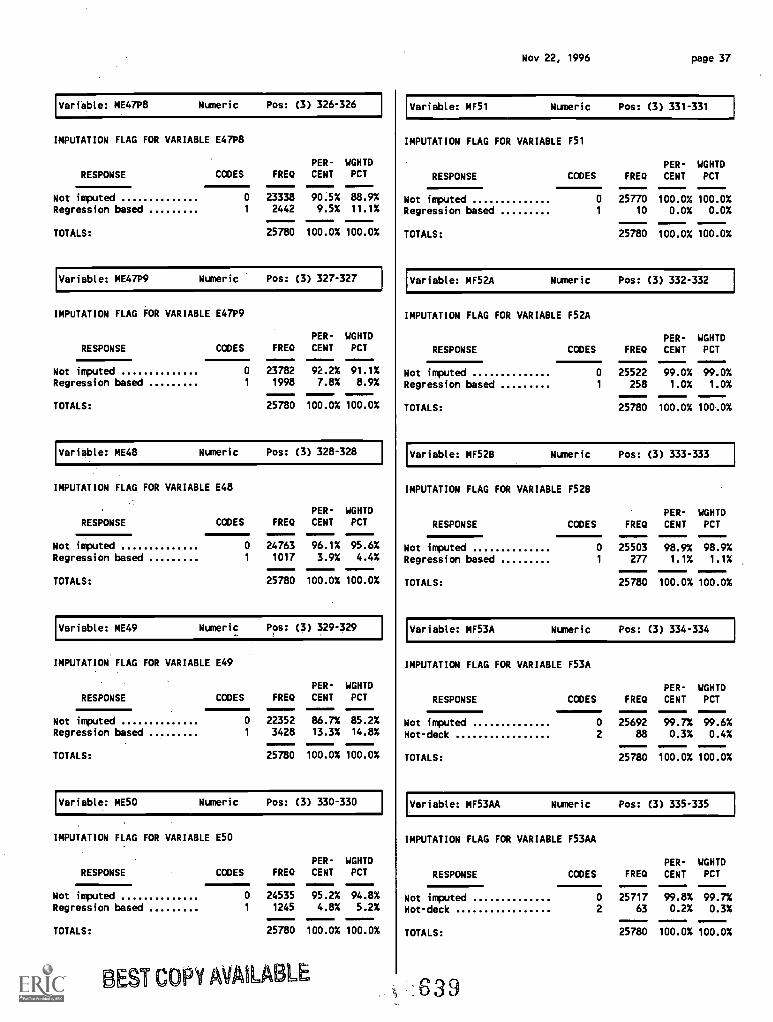
Variable: ME47P8 Numeric Pos: (3) 326-326
IMPUTATION FLAG FOR VARIABLE E47P8
RESPONSE
PER- WGHTDCODES FREQ CENT PCT
Not imputed 0 23338 90.5% 88.9%
Regression based 1 2442 9.5% 11.1%
TOTALS: 25780 100.0% 100.0%
Variable: ME47P9 Numeric Pos: (3) 327-327
IMPUTATION FLAG FOR VARIABLE E47P9
PER- WGHTD
RESPONSE CODES FREQ CENT PCT
Not imputed 0 23782 92.2% 91.1%Regression based 1 1998 7.8% 8.9%
TOTALS: 25780 100.0% 100.0%
Variable: ME48 Numeric Pos: (3) 328-328
IMPUTATION FLAG FOR VARIABLE E48
RESPONSEPER- WGHTD
CODES FREQ CENT PCT
Not imputed 0 24763 96.1% 95.6%
Regression based 1 1017 3.9% 4.4%
TOTALS: 25780 100.0% 100.0%
Variable: ME49 Numeric Pos: (3) 329-329
IMPUTATION FLAG FOR VARIABLE E49
PER- WGHTD
RESPONSE CODES FREQ CENT PCT
Not imputed 0 22352 86.7% 85.2%Regression based 1 3428 13.3% 14.8%
TOTALS: 25780 100.0% 100.0%
Variable: ME50 Numeric Pos: (3) 330-330
IMPUTATION FLAG FOR VARIABLE E50
PER- WGHTDRESPONSE CODES FREQ CENT PCT
Not imputed 0 24535 95.2% 94.8%Regression based 1 1245 4.8% 5.2%
TOTALS: 25780 100.0% 100.0%
BEST COPY AVAILABLE
Nov 22, 1996 page 37
Variable: MF51 Numeric Pos: (3) 331-331
IMPUTATION FLAG FOR VARIABLE F51
RESPONSEPER- WGHTD
CODES FRED CENT PCT
Not imputed 0 25770 100.0% 100.0%Regression based 1 10 0.0% 0.0%
TOTALS: 25780 100.0% 100.0%
Variable: MF52A Numeric Pos: (3) 332-332
IMPUTATION FLAG FOR VARIABLE F52A
RESPONSEPER- WGHTD
CODES FRED CENT PCT
Not imputed 0 25522 99.0% 99.0%Regression based 1 258 1.0% 1.0%
TOTALS: 25780 100.0% 100.0%
Variable: MF52B Numeric Pos: (3) 333-333
IMPUTATION FLAG FOR VARIABLE F52B
RESPONSEPER- WGHTD
CODES FREQ CENT PCT
Not imputed 0 25503 98.9% 98.9%Regression based 1 277 1.1% 1.1%
TOTALS: 25780 100.0% 100.0%
Variable: MF53A Numeric Pos: (3) 334-334
IMPUTATION FLAG FOR VARIABLE F53A
RESPONSEPER- WGHTD
CODES FREQ CENT PCT
Not imputed 0 25692 99.7% 99.6%Hot-deck 2 88 0.3% 0.4%
TOTALS: 25780 100.0% 100.0%
Variable: MF53AA Numeric Pos: (3) 335-335
IMPUTATION FLAG FOR VARIABLE F53AA
RESPONSE
PER- WGHTD
CODES FREQ CENT PCT
Not imputed 0 25717 99.8% 99.7%Hot-deck 2 63 0.2% 0.3%
TOTALS: 25780 100.0% 100.0%
:639
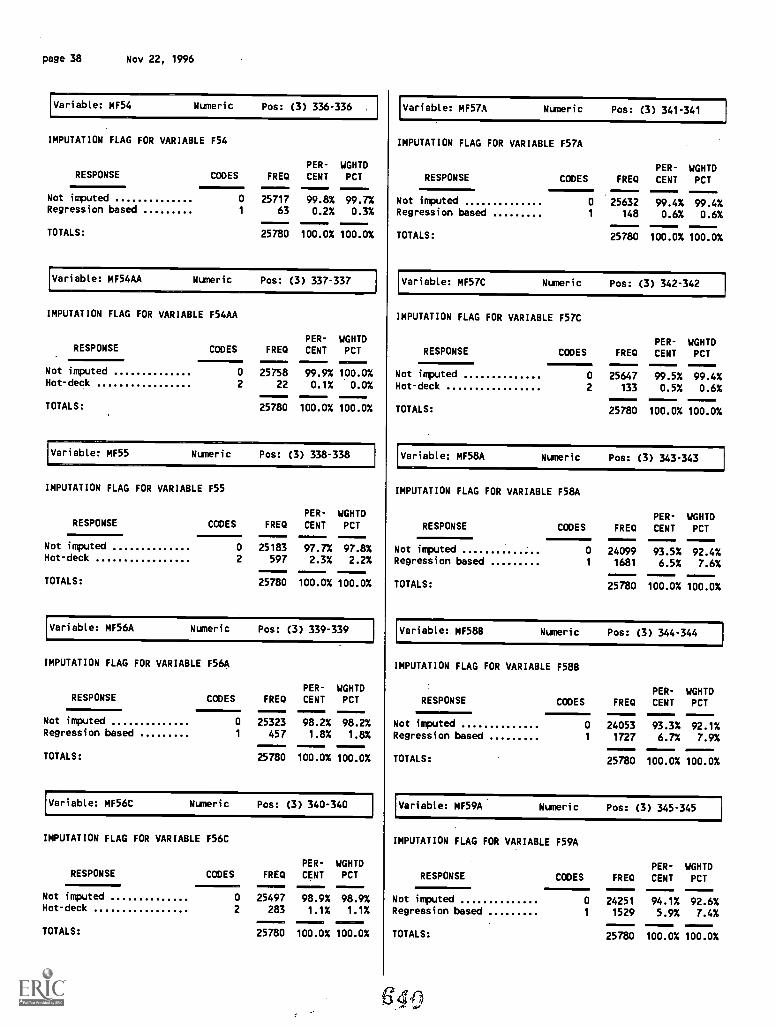
page 38 Nov 22, 1996
Variable: MF54 Numeric Pos: (3) 336-336
IMPUTATION FLAG FOR VARIABLE F54
PER- WGHTDRESPONSE CODES FREQ CENT PCT
Not imputed 0 25717 99.8% 99.7%Regression based 1 63 0.2% 0.3%
TOTALS:-----25780 100.0% 100.0%
Variable: MF54AA Numeric Pos: (3) 337-337
IMPUTATION FLAG FOR VARIABLE F54AA
PER- WGHTDRESPONSE CODES FREQ CENT PCT
Not imputed 0 25758 99.9% 100.0%Hot-deck 2 22 0.1% 0.0%
TOTALS: 25780 100.0% 100.0%
Variable: MF55 Numeric Pos: (3) 338-338
IMPUTATION FLAG FOR VARIABLE F55
RESPONSE11111MMININ
PER- WGHTDCODES FREQ CENT PCT
Not imputed 0 25183 97.7% 97.8%Hot-deck 2 597 2.3% 2.2%
TOTALS: 25780 100.0% 100.0%
Variable: MF56A Numeric Pos: (3) 339-339
IMPUTATION FLAG FOR VARIABLE F56A
RESPONSEPER- WGHTD
CODES FREQ CENT PCT
Not imputed 0 25323 98.2% 98.2%Regression based 1 457 1.8% 1.8%
TOTALS: 25780 100.0% 100.0%
Variable: MF56C Numeric Pos: (3) 340-340
IMPUTATION FLAG FOR VARIABLE F56C
PER- WGHTDRESPONSE CODES FREQ CENT PCT
MIM111=12
Not imputed 0 25497 98.9% 98.9%Hot-deck 2 283 1.1% 1.1%
TOTALS: 25780 100.0% 100.0%
Variable: MF57A Numeric Pos: (3) 341-341
IMPUTATION FLAG FOR VARIABLE F57A
RESPONSEPER- WGHTD
CODES FREQ CENT PCT
Not imputed 0 25632 99.4% 99.4%Regression based 1 148 0.6% 0.6%
TOTALS: 25780 100.0% 100.0%
Variable: MF57C Numeric Pos: (3) 342-342
IMPUTATION FLAG FOR VARIABLE F57C
RESPONSEPER- WGHTD
CODES FREQ CENT PCT
Not imputed 0 25647 99.5% 99.4%Hot-deck 2 133 0.5% 0.6%
TOTALS: 25780 100.0% 100.0%
Variable: Mf58A Numeric Pos: (3) 343-343
IMPUTATION FLAG FOR VARIABLE F58A
RESPONSEPER- WGHTD
CODES FREQ CENT PCT--.......
Not imputed 0 24099 93.5% 92.4%Regression based 1 1681 6.5% 7.6%
TOTALS: 25780 100.0% 100.0%
Variable: MF58B Numeric Pos: (3) 344-344
IMPUTATION FLAG FOR VARIABLE F58B
RESPONSEPER- WGHTD
CODES FREQ CENT PCT
Not imputed 0 24053 93.3% 92.1%Regression based 1 1727 6.7% 7.9%
TOTALS: 25780 100.0% 100.0%
Variable: MF59A Numeric Pos: (3) 345-345
IMPUTATION FLAG FOR VARIABLE F59A
RESPONSEPER- WGHTD
CODES FREQ CENT PCT
Not imputed 0 24251 94.1% 92.6%Regression based 1 1529 5.9% 7.4%
TOTALS: 25780 100.0% 100.0%
640
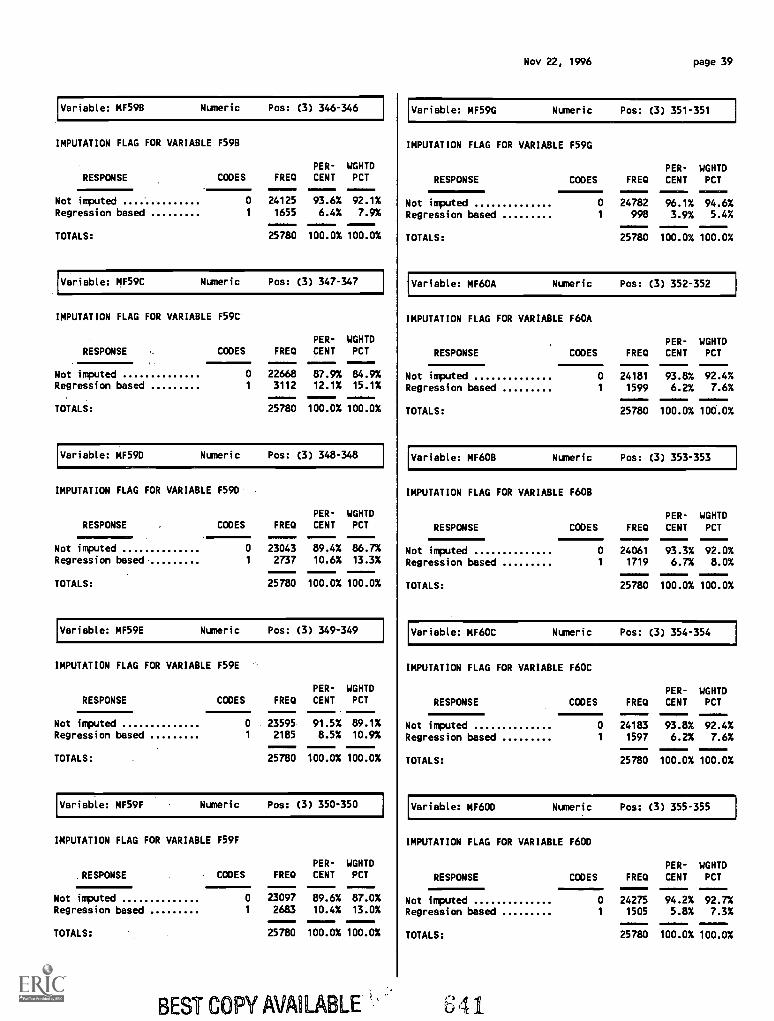
Variable: MF598 Numeric Pos: (3) 346-346
IMPUTATION FLAG FOR VARIABLE F59B
PER- WGHTDRESPONSE CODES FREQ CENT PCT
Not imputed 0 24125 93.6% 92.1%Regression based 1 1655 6.4% 7.9%
TOTALS: 25780 100.0% 100.0%
Variable: MF59C Numeric Pos: (3) 347-347
IMPUTATION FLAG FOR VARIABLE F59C
RESPONSE
PER- WGHTDCODES FRED CENT PCT
Not imputed 0 22668 87.9% 84.9%Regression based 1 3112 12.1% 15.1%
TOTALS: 25780 100.0% 100.0%
Variable: MF590 Numeric Pos: (3) 348-348
IMPUTATION FLAG FOR VARIABLE F59D
RESPONSEPER- WGHTD
CODES FRED CENT PCT
Not imputed 0 23043 89.4% 86.7%Regression based. 1 2737 10.6% 13.3%
TOTALS: 25780 100.0% 100.0%
Variable: MF59E Numeric Pos: (3) 349-349
IMPUTATION FLAG FOR VARIABLE F59E
RESPONSEPER- WGHTD
CODES FREQ CENT PCT
Not imputed 0 23595 91.5% 89.1%Regression based 1 2185 8.5% 10.9%
TOTALS: 25780 100.0% 100.0%
Variable: MF59F Numeric Pos: (3) 350-350
IMPUTATION FLAG FOR VARIABLE F59F
RESPONSEPER- WGHTD
CODES FREQ CENT PCT
Not imputed 0 23097 89.6% 87.0%Regression based 1 2683 10.4% 13.0%
TOTALS: 25780 100.0% 100.0%
BEST COPY AVM BLE
Nov 22, 1996 page 39
Variable: MF59G Numeric Pos: (3) 351-351
IMPUTATION FLAG FOR VARIABLE F59G
RESPONSEPER- WGHTD
CODES FREQ CENT PCT
Not imputed 0 24782 96.1% 94.6%Regression based 1 998 3.9% 5.4%
TOTALS: 25780 100.0% 100.0%
Variable: MF60A Numeric Pos: (3) 352-352
IMPUTATION FLAG FOR VARIABLE F60A
RESPONSEPER- WGHTD
CODES FREQ CENT PCT
Not imputed 0 24181 93.8% 92.4%Regression based 1 1599 6.2% 7.6%
TOTALS: 25780 100.0% 100.0%
Variable: MF608 Numeric Pos: (3) 353-353
IMPUTATION FLAG FOR VARIABLE F608
RESPONSE
PER- WGHTD
CODES FREQ CENT PCT
Not imputed 0 24061 93.3% 92.0%Regression based 1 1719 6.7% 8.0%
TOTALS: 25780 100.0% 100.0%
Variable: MF60C Numeric Pos: (3) 354-354
IMPUTATION FLAG FOR VARIABLE F60C
RESPONSEPER- WGHTD
CODES FREQ CENT PCT
Not imputed 0 24183 93.8% 92.4%Regression based 1 1597 6.2% 7.6%
TOTALS: 25780 100.0% 100.0%
Variable: MF6OD Numeric Pos: (3) 355-355
IMPUTATION FLAG FOR VARIABLE F600
RESPONSE
PER- WGHTD
CODES FRED CENT PCT
Not imputed 0 24275 94.2% 92.7%Regression based 1 1505 5.8% 7.3%
TOTALS: 25780 100.0% 100.0%
X1
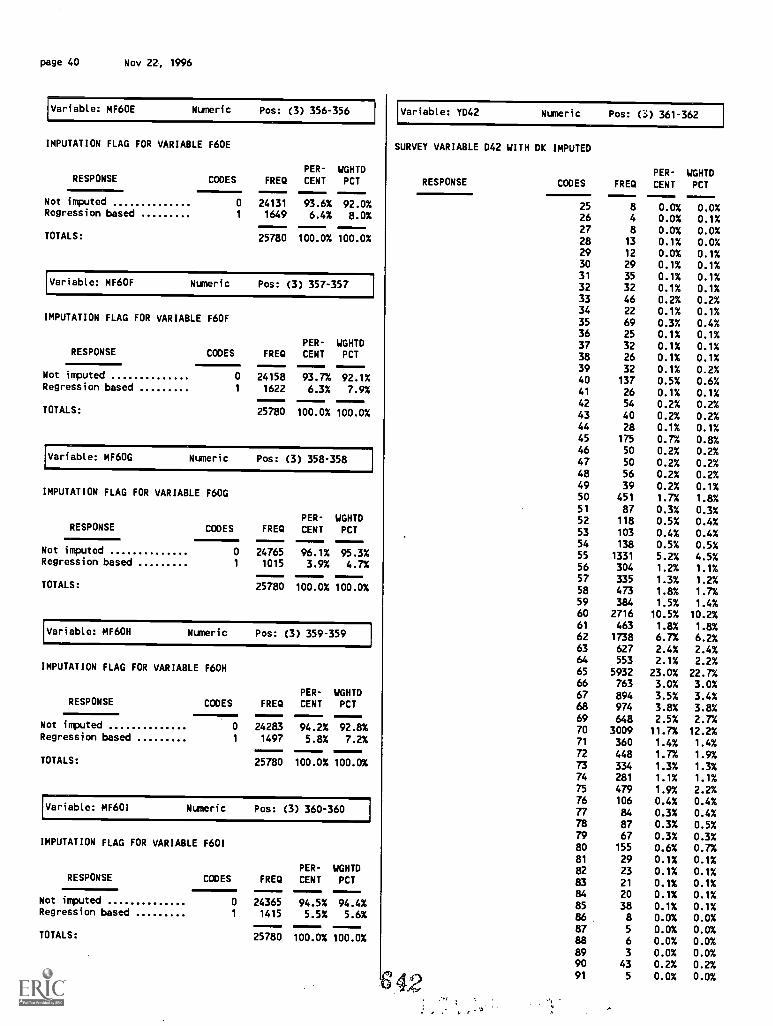
page 40 Nov 224 1996
MF60E Numeric Pos: (3) 356-356
IMPUTATION FLAG FOR VARIABLE F60E
PER- WGHTDRESPONSE CODES FREQ CENT PCT.1
Not imputed 0 24131 93.6% 92.0%Regression based 1 1649 6.4% 8.0%
TOTALS: 25780 100.0% 100.0%
Variable: MF6OF Numeric Pos: (3) 357-357
IMPUTATION FLAG FOR VARIABLE F6OF
RESPONSEPER- WGHTD
CODES FREQ CENT PCT
Not imputed 0 24158 93.7% 92.1%Regression based 1 1622 6.3% 7.9%
TOTALS: 25780 100.0% 100.0%
Variable: MF6OG Numeric Pos: (3) 358-358
IMPUTATION FLAG FOR VARIABLE F6OG
RESPONSE11.1PER- WGHTD
CODES FREQ CENT PCT
Not imputed 0 24765 96.1% 95.3%Regression based 1 1015 3.9% 4.7%
TOTALS: 25780 100.0% 100.0%
Variable: MF6OH Numeric Pos: (3) 359-359
IMPUTATION FLAG FOR VARIABLE F6OH
RESPONSEPER- WGHTD
CODES FREQ CENT PCT
Not imputed 0 24283 94.2% 92.8%Regression based 1 1497 5.8% 7.2%
TOTALS: 25780 100.0% 100.0%
Variable: MF601 Numeric Pos: (3) 360-360
IMPUTATION FLAG FOR VARIABLE F601
PER- WGHTDRESPONSE CODES FREQ CENT PCT
Not imputed 0 24365 94.5% 94.4%Regression based 1 1415 5.5% 5.6%
TOTALS: 25780 100.0% 100.0%
Variable: YD42 Numeric Pos: (3) 361-362
SURVEY VARIABLE D42 WITH DK IMPUTED
RESPONSE
42
CODES FREDPER-CENT
WGHTDPCT
25 8 0.0% 0.0%26 4 0.0% 0.1%27 8 0.0% 0.0%28 13 0.1% 0.0%29 12 0.0% 0.1%30 29 0.1% 0.1%31 35 0.1% 0.1%32 32 0.1% 0.1%33 46 0.2% 0.2%34 22 0.1% 0.1%35 69 0.3% 0.4%36 25 0.1% 0.1%37 32 0.1% 0.1%38 26 0.1% 0.1%39 32 0.1% 0.2%40 137 0.5% 0.6%41 26 0.1% 0.1%42 54 0.2% 0.2%43 40 0.2% 0.2%44 28 0.1% 0.1%45 175 0.7% 0.8%46 50 0.2% 0.2%47 50 0.2% 0.2%48 56 0.2% 0.2%49 39 0.2% 0.1%50 451 1.7% 1.8%51 87 0.3% 0.3%52 118 0.5% 0.4%53 103 0.4% 0.4%54 138 0.5% 0.5%55 1331 5.2% 4.5%56 304 1.2% 1.1%57 335 1.3% 1.2%58 473 1.8% 1.7%59 384 1.5% 1.4%60 2716 10.5% 10.2%61 463 1.8% 1.8%62 1738 6.7% 6.2%63 627 2.4% 2.4%64 553 2.1% 2.2%65 5932 23.0% 22.7%66 763 3.0% 3.0%67 894 3.5% 3.4%68 974 3.8% 3.8%69 648 2.5% 2.7%70 3009 11.7% 12.2%71 360 1.4% 1.4%72 448 1.7% 1.9%73 334 1.3% 1.3%74 281 1.1% 1.1%75 479 1.9% 2.2%76 106 0.4% 0.4%77 84 0.3% 0.4%78 87 0.3% 0.5%79 67 0.3% 0.3%80 155 0.6% 0.7%81 29 0.1% 0.1%82 23 0.1% 0.1%83 21 0.1% 0.1%84 20 0.1% 0.1%85 38 0.1% 0.1%86 8 0.0% 0.0%87 5 0.0% 0.0%88 6 0.0% 0.0%89 3 0.0% 0.0%90 43 0.2% 0.2%91 5 0.0% 0.0%
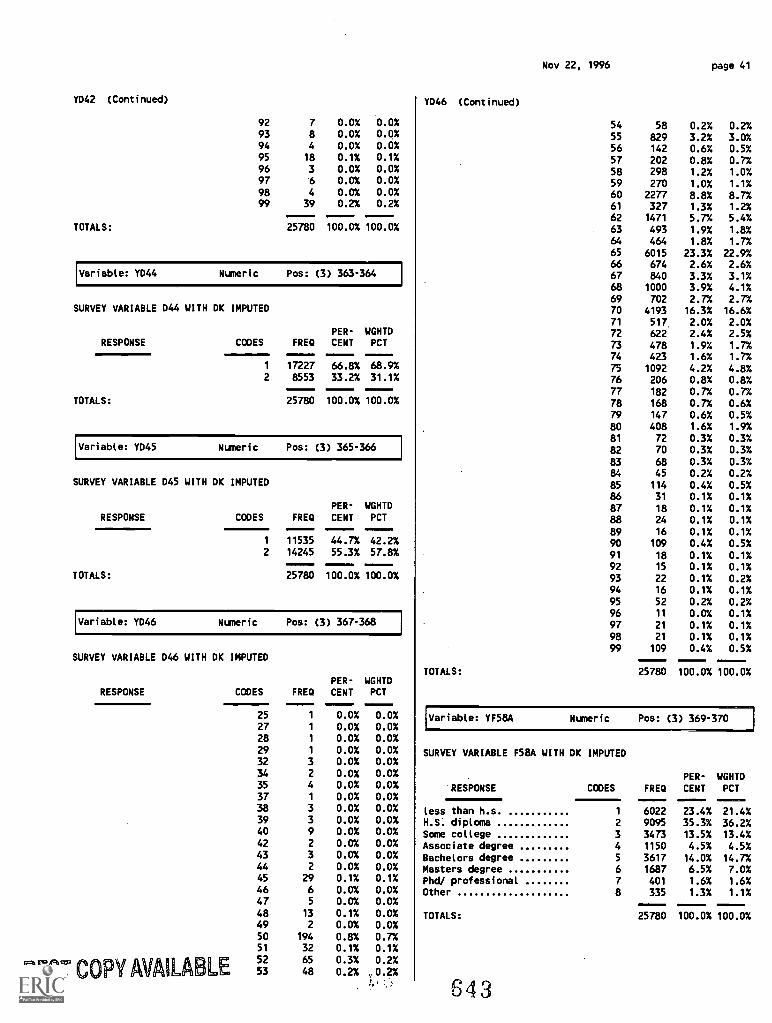
YD42 (Continued)
TOTALS:
92 7 0.0% 0.0%93 8 0.0% 0.0%94 4 0.0% 0.0%95 18 0.1% 0.1%96 3 0.0% 0.0%97 6 0.0% 0.0%98 4 0.0% 0.0%99 39 0.2% 0.2%
25780 100.0% 100.0%
Variable: YD44 Numeric Pos: (3) 363-364
SURVEY VARIABLE 044 WITH DK IMPUTED
RESPONSE
TOTALS:
PER- WGHTDCODES FRED CENT PCT
1 17227 66.8% 68.9%2 8553 33.2% 31.1%
25780 100.0% 100.0%
Variable: YD45 Numeric Pos: (3) 365-366
SURVEY VARIABLE D45 WITH DK IMPUTED
RESPONSE
TOTALS:
PER- WGHTDCODES FRED CENT PCT
1 11535 44.7% 42.2%2 14245 55.3% 57.8%
25780 100.0% 100.0%
Variable: YD46 Numeric Pos: (3) 367-368
SURVEY VARIABLE D46 WITH DK IMPUTED
RESPONSE
BEST COPY MLA
PER- WGHTDCODES FRED CENT PCT
LE
25 1 0.0% 0.0%27 1 0.0% 0.0%28 1 0.0% 0.0%29 1 0.0% 0.0%32 3 0.0% 0.0%34 2 0.0% 0.0%35 4 0.0% 0.0%37 1 0.0% 0.0%38 3 0.0% 0.0%39 3 0.0% 0.0%40 9 0.0% 0.0%42 2 0.0% 0.0%43 3 0.0% 0.0%44 2 0.0% 0.0%45 29 0.1% 0.1%46 6 0.0% 0.0%47 5 0.0% 0.0%48 13 0.1% 0.0%49 2 0.0% 0.0%50 194 0.8% 0.7%51 32 0.1% 0.1%52 65 0.3% 0.2%53 48 0.2% ,0.2%
YD46 (Continued)
TOTALS:
Nov 22, 1996 page 41
54 58 0.2% 0.2%55 829 3.2% 3.0%56 142 0.6% 0.5%57 202 0.8% 0.7%58 298 1.2% 1.0%59 270 1.0% 1.1%60 2277 8.8% 8.7%61 327 1.3% 1.2%62 1471 5.7% 5.4%63 493 1.9% 1.8%64 464 1.8% 1.7%65 6015 23.3% 22.9%66 674 2.6% 2.6%67 840 3.3% 3.1%68 1000 3.9% 4.1%69 702 2.7% 2.7%70 4193 16.3% 16.6%71 517 2.0% 2.0%72 622 2.4% 2.5%73 478 1.9% 1.7%74 423 1.6% 1.7%
75 1092 4.2% 4.8%76 206 0.8% 0.8%77 182 0.7% 0.7%78 168 0.7% 0.6%
79 147 0.6% 0.5%80 408 1.6% 1.9%
81 72 0.3% 0.3%82 70 0.3% 0.3%83 68 0.3% 0.3%84 45 0.2% 0.2%85 114 0.4% 0.5%86 31 0.1% 0.1%87 18 0.1% 0.1%88 24 0.1% 0.1%89 16 0.1% 0.1%90 109 0.4% 0.5%91 18 0.1% 0.1%92 15 0.1% 0.1%93 22 0.1% 0.2%94 16 0.1% 0.1%95 52 0.2% 0.2%96 11 0.0% 0.1%97 21 0.1% 0.1%98 21 0.1% 0.1%99 109 0.4% 0.5%
25780 100.0% 100.0%
Variable: YF58A Numeric Pos: (3) 369-370
SURVEY VARIABLE F58A WITH DK IMPUTED
RESPONSE
less than h.sH.S. diplomaSome collegeAssociate degreeBachelors degreeMasters degreePhd/ professionalOther
TOTALS:
843
CODES FREDPER-
CENTWGHTDPCT
1 6022 23.4% 21.4%2 9095 35.3% 36.2%3 3473 13.5% 13.4%4 1150 4.5% 4.5%5 3617 14.0% 14.7%6 1687 6.5% 7.0%7 401 1.6% 1.6%8 335 1.3% 1.1%
25780 100.0% 100.0%
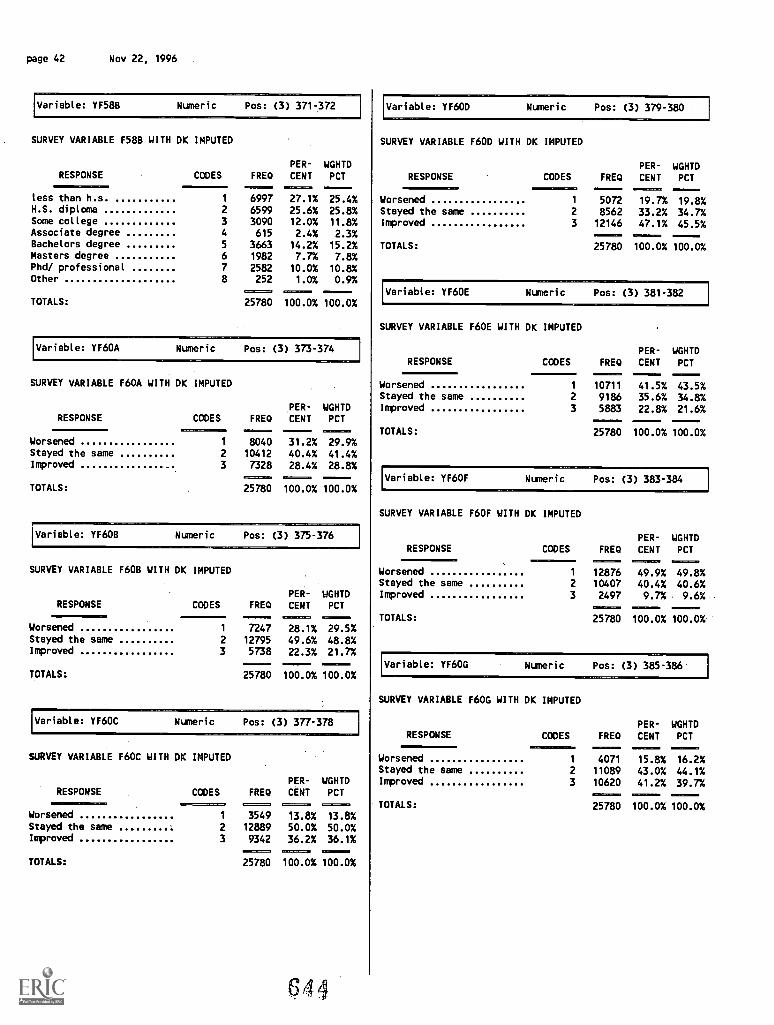
Numeric Pos: (3) 3717372 Variable: YF600 Numeric Pos: (3) 379-380__J
page 42 Nov 22, 1996
Variable: YF58B
SURVEY VARIABLE F588 WITH DK IMPUTED
RESPONSE CODES FRED
PER-
CENTWGHTDPCT
less than h.s 1 6997 27.1% 25.4%H.S. diploma 2 6599 25.6% 25.8%Some college 3 3090 12.0% 11.8%Associate degree 4 615 2.4% 2.3%Bachelors degree 5 3663 14.2% 15.2%Masters degree 6 1982 7.7% 7.8%Phd/ professional 7 2582 10.0% 10.8%Other 8 252 1.0% 0.9%
TOTALS: 25780
117.1.12.Z
100.0% 100.0%
Variable: YF60A Numeric Pos: (3) 373-374
SURVEY VARIABLE F60A WITH DK IMPUTED
RESPONSE CODESICISet0911.1=
FREDPER- WGHTDCENT PCT
1111OBWorsened
CIESISMCM
8040
ISCE. MIM=111:11
31.2% 29.9%1
Stayed the same 2 10412 40.4% 41.4%Improved 3 7328 28.4% 28.8%
TOTALS:
=NM25780
071=1.1=1.1
100.0% 100.0%
Variable: YF608 Numeric Pos: (3) 375-376
SURVEY VARIABLE FOB WITH DK IMPUTED
RESPONSE CODESmaceiseem
FREDPER-
CENT=m.o.=
WGHTDPCT
INIMI1111=Worsened
Mem7247
ona.29.5%1 28.1%
Stayed the same 2 12795 49.6% 48.8%Improved 3 5738 22.3% 21.7%
TOTALS:
=1.Z125780
=CCM:Ca
100.0%
191iMi100.0%
Variable: YF60C Numeric Pos: (3) 377-378
SURVEY VARIABLE F60C WITH DK IMPUTED
RESPONSE CODES FREDPER-
CENTWGHTDPCT
111=111117.M
Worsened 1 3549 13.8% 13.8%Stayed the same 2 12889 50.0% 50.0%Improved 3 9342 36.2% 36.1%
1,11== 191,1,77=== 491:1,Min
TOTALS: 25780 100.0% 100.0%
644
SURVEY VARIABLE F6OD WITH DK IMPUTED
RESPONSE CODES FREDPER-
CENTWGHTDPCT
Worsened
=EN.1 5072 19.7% 19.8%
Stayed the same 2 8562 33.2% 34.7%Improved 3 12146 47.1% 45.5%
TOTALS:-----25780
--100.0% 100.0%
Variable: YF60E Numeric Pos: (3) 381-382
SURVEY VARIABLE F60E WITH DK IMPUTED
RESPONSE CODES FREDPER-
CENTWGHTDPCT1.
Worsened
MIII.C=11.121=131.7
1
MIIIIMM10111=1
10711 41.5% 43.5%Stayed the same 2 9186 35.6% 34.8%Improved 3 5883 22.8% 21.6%
TOTALS: 25780 100.0% 100.0%
Variable: YF6OF Numeric Pos: (3) 383-384
SURVEY VARIABLE F6OF WITH DK IMPUTED
RESPONSE CODES FREDPER- WGHTDCENT PCT
WorsenedNIMMENNIZEMI3231.M.
1 12876
CCC1131. Maleel=1:==
49.9% 49.8%Stayed the same 2 10407 40.4% 40.6%Improved 3 2497 9.7% 9.6%
TOTALS:
CM/16M
25780
IMMCMILIMIN 11=2:1:
100.0% 100.0%
Variable: YF60G Numeric Pos: (3) 385-386
SURVEY VARIABLE F600 WITH DK IMPUTED
RESPONSE CODES FRED
PER-
CENTWGHTDPCT
Worsened
1111.1111MI
1
1=1114071 15.8%
=11116.2%
Stayed the same 2 11089 43.0% 44.1%Improved 3 10620 41.2% 39.7%
0=11111.MMI 1=MICCOB 41MME=11=
TOTALS: 25780 100.0% 100.0%
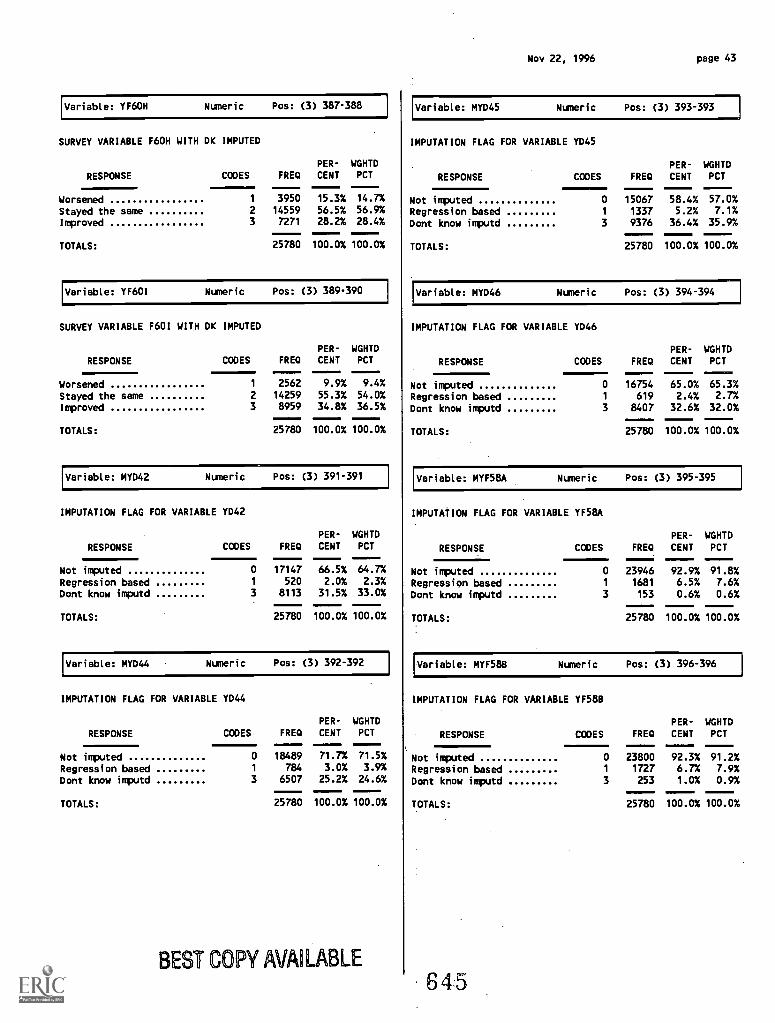
Variable: YF6OH Numeric Pos: (3) 387-388
SURVEY VARIABLE F6OH WITH DK IMPUTED
RESPONSE CODES FREQPER-CENT
WGHTDPCT
Worsened 1 3950 15.3% 14.7%
Stayed the same 2 14559 56.5% 56.9%
Improved 3 7271 28.2% 28.4%
TOTALS: 25780 100.0% 100.0%
Variable: YF601 Numeric Pos: (3) 389-390
SURVEY VARIABLE F601 WITH DK IMPUTED
RESPONSE CODES FREDPER-CENT
WGHTDPCT
Worsened 1 2562 9.9% 9.4%
Stayed the same 2 14259 55.3% 54.0%
Improved 3 8959 34.8% 36.5%
TOTALS: 25780 100.0% 100.0%
Variable: MYD42 Numeric Pos: (3) 391-391
IMPUTATION FLAG FOR VARIABLE YD42
RESPONSE CODES FRED
PER-
CENTWGHTDPCT
Not imputed 0 17147 66.5% 64.7%
Regression baSed 1 520 2.0% 2.3%
Dont know imputd 3 8113 31.5% 33.0%
TOTALS: 25780 100.0% 100.0%
Variable: MYD44 Numeric Pos: (3) 392-392
IMPUTATION FLAG FOR VARIABLE YD44
RESPONSE CODES FRED
PER-CENT
WGHTDPCT
Not imputed 0 18489 71.7% 71.5%
Regression based 1 784 3.0% 3.9%
Dont know imputd 3 6507 25.2% 24.6%
TOTALS: 25780 100.0% 100.0%
BEST COPY AVAILABLE
Nov 22, 1996 page 43
Variable: MYD45 Numeric Pos: (3) 393-393
IMPUTATION FLAG FOR VARIABLE YD45
RESPONSE CODES FREQ
PER-
CENTWGHTDPCT
Not imputed 0 15067 58.4% 57.0%
Regression based 1 1337 5.2% 7.1%
Dont know imputd 3 9376 36.4% 35.9%
TOTALS: 25780 100.0% 100.0%
Variable: MYD46 Numeric Pos: (3) 394-394
IMPUTATION FLAG FOR VARIABLE YD46
RESPONSE CODES FRED
PER-CENT
WGHTDPCT
Not imputed 0 16754 65.0% 65.3%Regression based 1 619 2.4% 2.7%
Dont know imputd 3 8407 32.6% 32.0%
TOTALS: 25780 100.0% 100.0%
Variable: MYF58A Numeric Pos: (3) 395-395
IMPUTATION FLAG FOR VARIABLE YF58A
RESPONSE CODES FREDPER-
CENTWGHTDPCT
Not imputed 0 23946 92.9% 91.8%Regression based 1 1681 6.5% 7.6%
Dont know imputd 3 153 0.6% 0.6%
TOTALS: 25780 100.0% 100.0%
Variable: MYF58B Numeric Pos: (3) 396-396
IMPUTATION FLAG FOR VARIABLE YF58B
RESPONSE CODES FRED
PER-
CENTWGHTDPCT
Not imputed 0 23800 92.3% 91.2%Regression based 1 1727 6.7% 7.9%
Dont know imputd 3 253 1.0% 0.9%
TOTALS: 25780 100.0% 100.0%
645
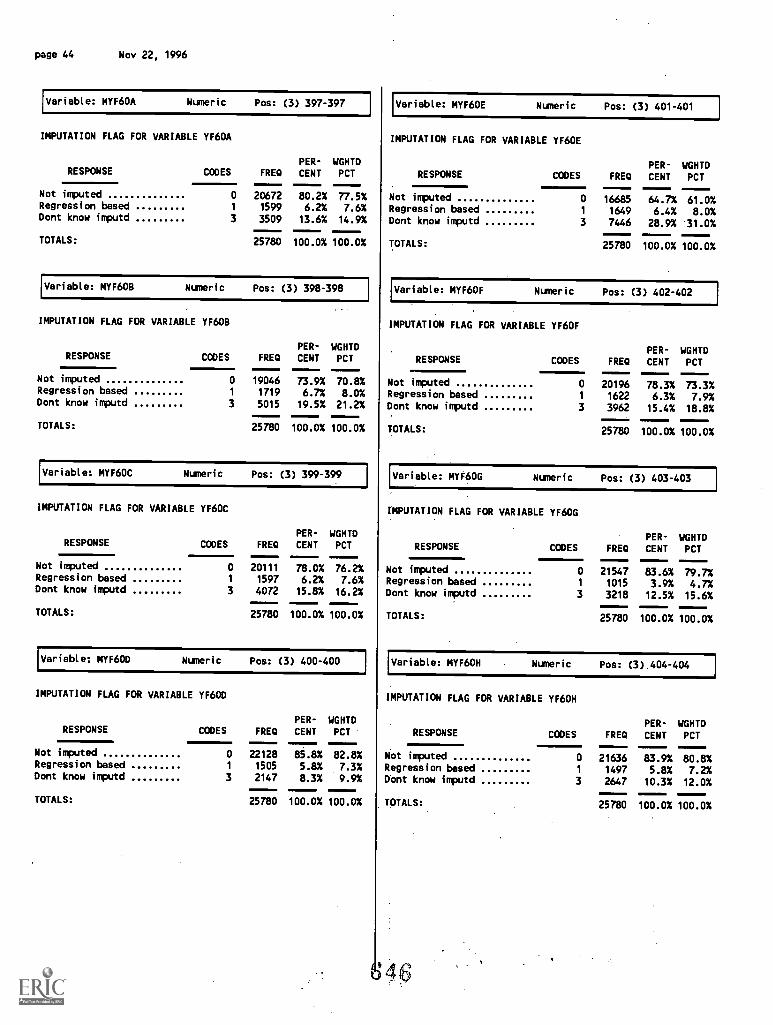
page 44 Nov 22, 1996
Variable: MYF60A Numeric Pos: (3) 397-397
IMPUTATION FLAG FOR VARIABLE YF60A
RESPONSE CODES FREQPER-
CENTWGHTDPCT
Not imputed 0 20672 80.2% 77.5%Regression based 1 1599 6.2% 7.6%Dont know imputd 3 3509 13.6% 14.9%
TOTALS: 25780 100.0% 100.0%
Variable: MYF608 Numeric Pos: (3) 398-398
IMPUTATION FLAG FOR VARIABLE YF608
RESPONSE CODES FREQPER-
CENTWGHTDPCT
Not imputed 0 19046 73.9% 70.8%Regression based 1 1719 6.7% 8.0%Dont know imputd 3 5015 19.5% 21.2%
TOTALS: 25780 100.0% 100.0%
Variable: MYF60C Numeric Pos: (3) 399-399
IMPUTATION FLAG FOR VARIABLE YF60C
RESPONSE CODES FREQ
PER-
CENTWGHTDPCT
Not imputed 0 20111 78.0% 76.2%Regression based 1 1597 6.2% 7.6%Dont know imputd 3 4072 15.8% 16.2%
TOTALS:Mal
25780 100.0% 100.0%
Variable: MYF6OD Numeric Pos: (3) 400-400
IMPUTATION FLAG FOR VARIABLE YF60D
RESPONSE CODES FREQ
PER-
CENTWGHTDPCT
Not imputed 0 22128 85.8% 82.8%Regression based 1 1505 5.8% 7.3%Dont know imputd 3 2147 8.3% 9.9%
TOTALS: 25780 100.0% 100.0%
Variable: MYF60E Numeric Pos: (3) 401-401
IMPUTATION FLAG FOR VARIABLE YF60E
RESPONSE CODES FREQPER-CENT
WGHTDPCT
Not imputed 0 16685 64.7% 61.0%Regression based 1 1649 6.4% 8.0%Dont know imputd 3 7446 28.9% '31.0%
TOTALS: 25780 100.0% 100.0%
Variable: MYF6OF Numeric Pos: (3) 402-402
IMPUTATION FLAG FOR VARIABLE YF6OF
RESPONSEIM PER- WGHTDCODES FREQ CENT PCT
Not imputed 0 20196 78.3% 73.3%Regression based 1 1622 6.3% 7.9%Dont know imputd 3 3962 15.4% 18.8%
TOTALS: 25780 100.0% 100.0%
Variable: MYF6OG Numeric Pos: (3) 403-403
IMPUTATION FLAG FOR VARIABLE YF6OG
RESPONSE CODES FREQPER-
CENTWGHTDPCT
Not imputed 0 21547 83.6% 79.7%Regression based 1 1015 3.9% 4.7%Dont know imputd 3 3218 12.5% 15.6%
TOTALS: 25780 100.0% 100.0%
Variable: MYF6OH Numeric Pos: (3).404-404
IMPUTATION FLAG FOR VARIABLE YF6OH
RESPONSE CODES FREQPER-CENT
WGHTDPCT
Not imputed 0 21636 83.9% 80.8%Regression based 1 1497 5.8% 7.2%Dont know imputd 3 2647 10.3% 12.0%
TOTALS: 25780 100.0% 100.0%
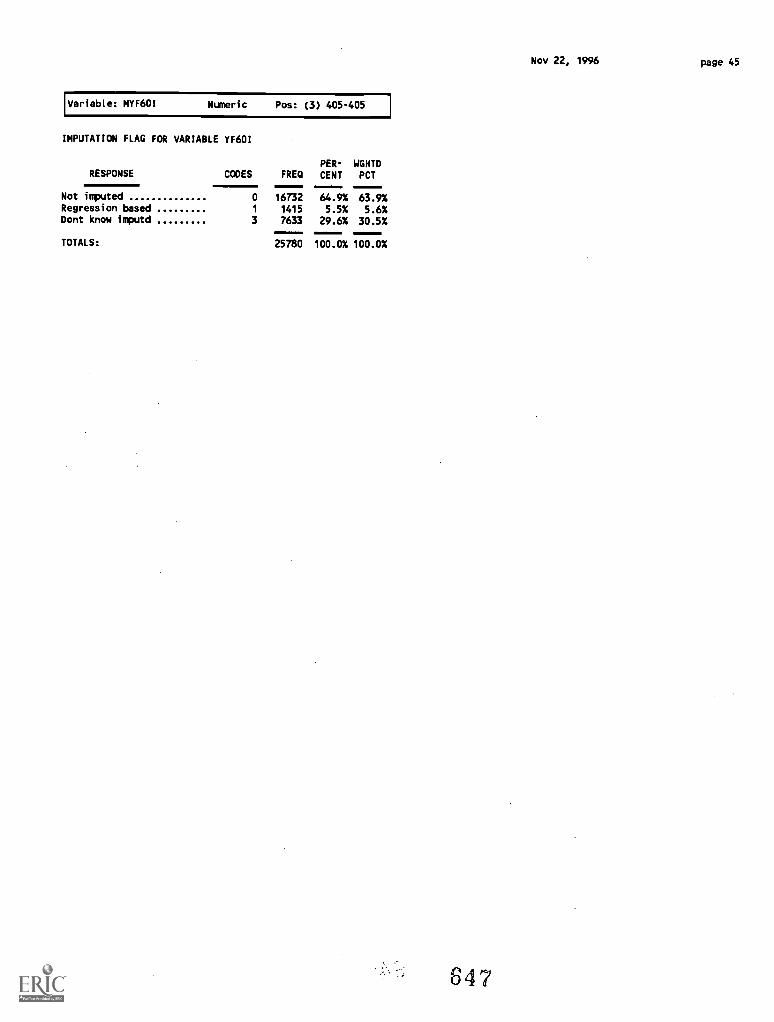
Variable: MYF601 Numeric Pos: (3) 405-405
IMPUTATION FLAG FOR VARIABLE YF601
Nov 22, 1996 page 45
RESPONSE CODES FREDPER-
CENTWGHTDPCT
Not imputed 0 16732 64.9% 63.9%Regression based 1 1415 5.5% 5.6%Dont know imputd 3 7633 29.6% 30.5%
TOTALS: 25780 100.0% 100.0%
647
Appendix Q
1993 National Study of Postsecondary FacultyMethodology Report
NSOPF-1993 National Technical Review Panel (NTRP) Members
$48

NATIONAL STUDY OF POSTSECONDARY FACULTY-1993:NATIONAL TECHNICAL REVIEW PANEL
Nonfederal Members (outside Washington area)
Tommy AnnasAssistant Vice Chancellor for Institutional ResearchState University of New York Central AdministrationState University PlazaAlbany, NY 12246
Roger BaldwinCollege of William and MarySchool of EducationWilliamsburg, VA 23187-8795
Jay L. Chronister, ProfessorCenter for the Study of Higher EducationThe University of VirginiaCharlottesville, VA 22903
Eric L. DeyThe University of Michigan2117d School of Education610 E. UniversityAnn Arbor, MI 48109
Martin Finkelstein, ProfessorHigher Education Administration ProgramN.J.I.C.T.L.Seton Hall UniversitySouth Orange, NJ 07079
Carol S. HollinsCoordinatorInstitutional ResearchJohn Tyler Community CollegeChester, VA 23831
David Leslie, ChairmanDepartment of Educational LeadershipFlorida State UniversityTallahassee, Florida 32306
Michael NettlesUniversity of Michigan2035 School of Education BuildingAnn Arbor, MI 48109-1259
BEST COPY OW LE
Richard C. Richardson, Jr.Professor of Educational Leadership and PolicyStudiesCollege of EducationArizona State UniversityTempe, AZ 85287-1611
Terrence RussellExecutive DirectorAssociation for Institutional ResearchFlorida State UniversityTallahassee, FL 32306-3038
Jack Schuster, ProfessorHigher Education ProgramClaremont Graduate SchoolClaremont, CA 91711-6160
Mary Jean WhitelawDirector of Data ManagementThe Carnegie Foundation for the Advancement ofTeachingPrinceton, NJ 08540
Holly ZanzilleAssistant Vice Chancellor for Academic AffairsOregon State System of Higher EducationSusan Campbell HallUniversity of Oregon CampusEugene, OR 97403-1075
Nonfederal Members (Washington area)
Ernst BenjaminGeneral SecretaryAmerican Association of University ProfessorsWashington, DC 20005
Elaine El-KhawasVice President for Policy Analysis and ResearchAmerican Council on EducationWashington, DC 20036
649
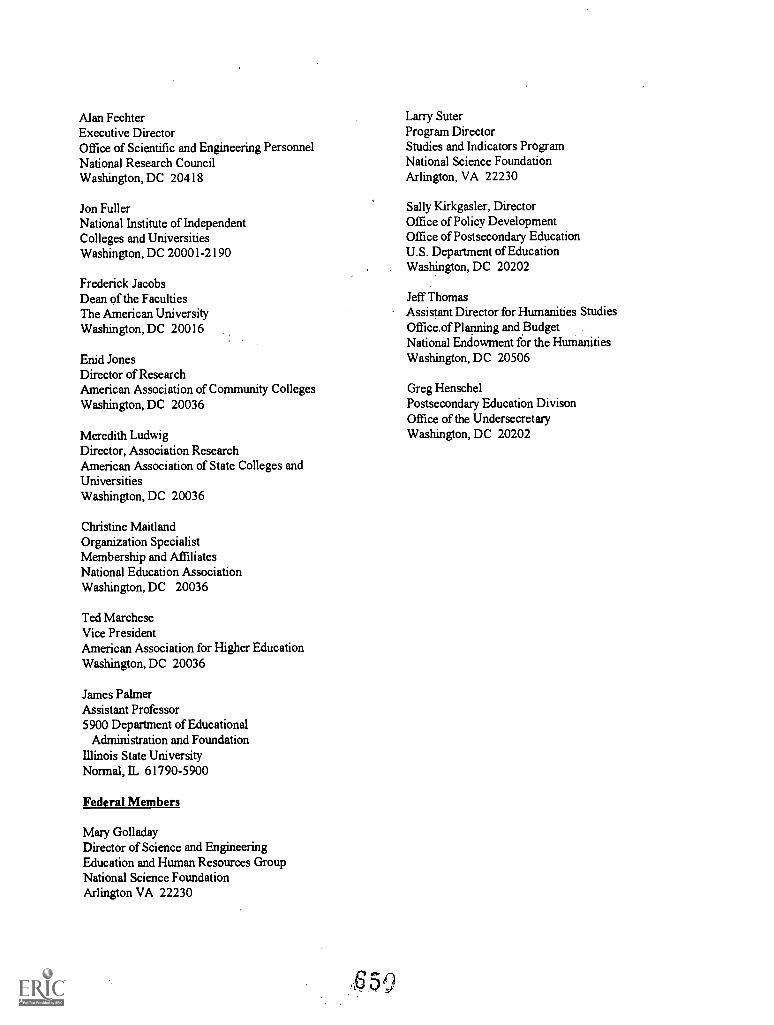
Alan FechterExecutive DirectorOffice of Scientific and Engineering PersonnelNational Research CouncilWashington, DC 20418
Jon FullerNational Institute of IndependentColleges and UniversitiesWashington, DC 20001-2190
Frederick JacobsDean of the FacultiesThe American UniversityWashington, DC 20016
Enid JonesDirector of ResearchAmerican Association of Community CollegesWashington, DC 20036
Meredith LudwigDirector, Association ResearchAmerican Association of State Colleges andUniversitiesWashington, DC 20036
Christine MaitlandOrganization SpecialistMembership and AffiliatesNational Education AssociationWashington, DC 20036
Ted MarcheseVice PresidentAmerican Association for Higher EducationWashington, DC 20036
James PalmerAssistant Professor5900 Department of Educational
Administration and FoundationIllinois State UniversityNormal, IL 61790-5900
Federal Members
Mary GolladayDirector of Science and EngineeringEducation and Human Resources GroupNational Science FoundationArlington VA 22230
65
Larry SuterProgram DirectorStudies and Indicators ProgramNational Science FoundationArlington, VA 22230
Sally Kirkgasler, DirectorOffice of Policy DevelopmentOffice of Postsecondary EducationU.S. Department of EducationWashington, DC 20202
Jeff ThomasAssistant Director for Humanities StudiesOffice,of Planning and BudgetNational Endowment for the HumanitiesWashington, DC 20506
Greg HenschelPostsecondary Education DivisonOffice of the UndersecretaryWashington, DC 20202
1993 National Study of Postsecondary FacultyMethodology Report
Appendix R
Technical Report:
Discrepancies in Faculty Estimates in the1992-93 National Study of Postsecondary Faculty
651
TECHNICAL REPORT:Discrepancies in Faculty Estimates in the
1992-93 National Study of Postsecondary Faculty
Submitted to:National Center for Education Statistics
U.S. Department of Education555 New Jersey Avenue, N.W.
Washington, D.C. 20208
Submitted by:National Opinion Research Center (NORC)
University of Chicago1155 E. 60th Street
Chicago, Illinois 60637
652
1992-93 National Study of Postsecondary FacultyMethodology Report: Appendix R
Table of Contents
Chapter I. Background and Scope of the Problem 1
1.1 Comparing NSOPF-93 with NSOPF-88 Faculty Estimates 51.2 NSOPF-93 Procedures and Discrepancies 8
Chapter II. Discrepancy and Trend Analysis 132.1 Discrepancy Analysis 132.2 Trend Analysis: 1987 and 1992 20
Chapter III. Retrieval, Verification, and Reconciliation 233.1 Identifying Institutions for Retrieval and Reconciliation 233.2 Review of Hard Copy Lists 233.3 Telephone Follow-up for Retrieval and Reconciliation 243.4 Results of the Retrieval and Reconciliation Effort 273.5 Results of Reconciliation at Institutions Employing Health Sciences Faculty 293.6 Reestimating Faculty Population Based on the Reconciliation Effort 32
Chapter IV. Sampling, Weighting, and Imputation in NSOPF-93 434.1 Independent Review of Sampling, Weighting, and Imputation 434.2 Problem Identification 434.3 Part-Time Faculty 43
4.3.1 Response Rates 444.3.2 Survey Implementation and the Part-Time Nonresponse Problem 464.3.3 The Exclusion of Subsampled Faculty 47
4.4 Health Sciences Faculty 494.5 Imputation Procedures 51
Chapter V. Adjustments for NSOPF-93 and Recommendations for Future Cycles 535.1 Adjustments for NSOPF-93 53
5.1.1 Recalculating the Nonresponse Weighting Adjustment 535.1.2 Poststratification Adjustments 535.1.3 Health Sciences Faculty 53
5.2 Recommendations for the Next NSOPF Cycle 545.2.1 Changing Time Frames and Starting List Collection Later 545.2.2 Providing Institutions with an Information Sheet 555.2.3 Coordinating Institution Questionnaire Mailing and List Collection 555.2.4 Changes to Questionnaire Instructions and Questions 56
5.3 Health Sciences Faculty and the Faculty Questionnaire 57
iii
653
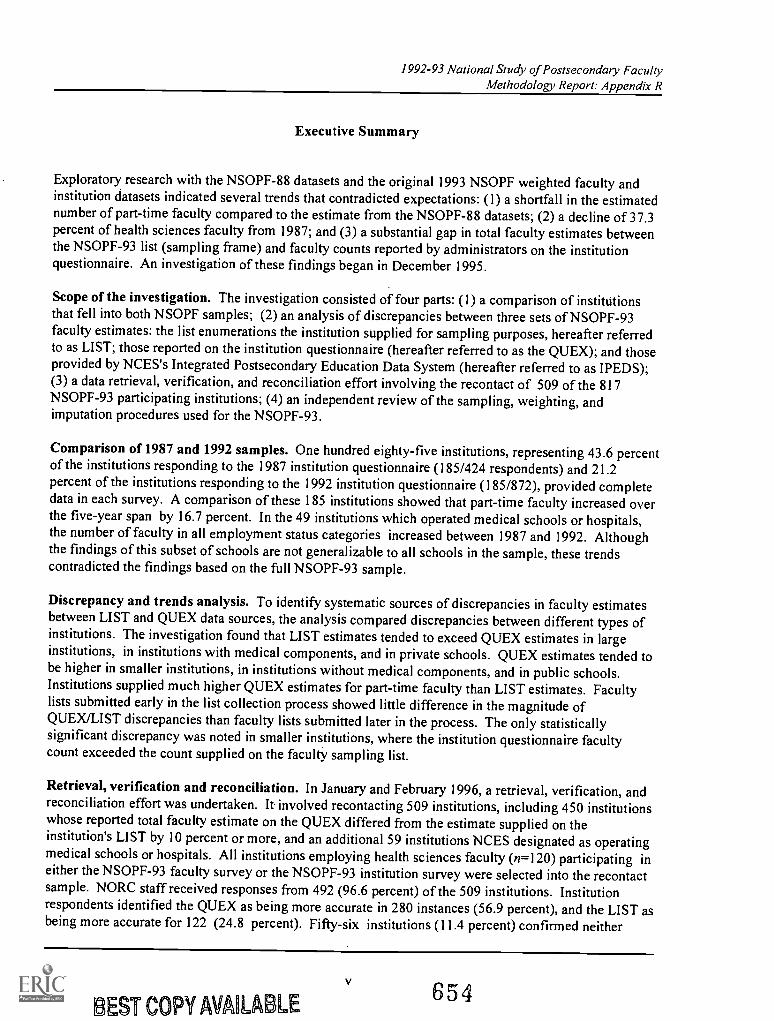
1992-93 National Study of Postsecondary FacultyMethodology Report: Appendix R
Executive Summary
Exploratory research with the NSOPF-88 datasets and the original 1993 NSOPF weighted faculty andinstitution datasets indicated several trends that contradicted expectations: (1) a shortfall in the estimatednumber of part-time faculty compared to the estimate from the NSOPF-88 datasets; (2) a decline of 37.3percent of health sciences faculty from 1987; and (3) a substantial gap in total faculty estimates betweenthe NSOPF-93 list (sampling frame) and faculty counts reported by administrators on the institutionquestionnaire. An investigation of these findings began in December 1995.
Scope of the investigation. The investigation consisted of four parts: (1) a comparison of institutionsthat fell into both NSOPF samples; (2) an analysis of discrepancies between three sets of NSOPF-93faculty estimates: the list enumerations the institution supplied for sampling purposes, hereafter referredto as LIST; those reported on the institution questionnaire (hereafter referred to as the QUEX); and thoseprovided by NCES's Integrated Postsecondary Education Data System (hereafter referred to as IPEDS);(3) a data retrieval, verification, and reconciliation effort involving the recontact of 509 of the 817NSOPF-93 participating institutions; (4) an independent review of the sampling, weighting, andimputation procedures used for the NSOPF-93.
Comparison of 1987 and 1992 samples. One hundred eighty-five institutions, representing 43.6 percentof the institutions responding to the 1987 institution questionnaire (185/424 respondents) and 21.2percent of the institutions responding to the 1992 institution questionnaire (185/872), provided completedata in each survey. A comparison of these 185 institutions showed that part-time faculty increased overthe five-year span by 16.7 percent. In the 49 institutions which operated medical schools or hospitals,the number of faculty in all employment status categories increased between 1987 and 1992. Althoughthe findings of this subset of schools are not generalizable to all schools in the sample, these trendscontradicted the findings based on the full NSOPF-93 sample.
Discrepancy and trends analysis. To identify systematic sources of discrepancies in faculty estimatesbetween LIST and QUEX data sources, the analysis compared discrepancies between different types ofinstitutions. The investigation found that LIST estimates tended to exceed QUEX estimates in largeinstitutions, in institutions with medical components, and in private schools. QUEX estimates tended tobe higher in smaller institutions, in institutions without medical components, and in public schools.Institutions supplied much higher QUEX estimates for part-time faculty than LIST estimates. Facultylists submitted early in the list collection process showed little difference in the magnitude ofQUEX/LIST discrepancies than faculty lists submitted later in the process. The only statisticallysignificant discrepancy was noted in smaller institutions, where the institution questionnaire facultycount exceeded the count supplied on the faculty sampling list.
Retrieval, verification and reconciliation. In January and February 1996, a retrieval, verification, andreconciliation effort was undertaken. It involved recontacting 509 institutions, including 450 institutionswhose reported total faculty estimate on the QUEX differed from the estimate supplied on theinstitution's LIST by 10 percent or more, and an additional 59 institutions NCES designated as operatingmedical schools or hospitals. All institutions employing health sciences faculty (n=120) participating ineither the NSOPF-93 faculty survey or the NSOPF-93 institution survey were selected into the recontactsample. NORC staff received responses from 492 (96.6 percent) of the 509 institutions. Institutionrespondents identified the QUEX as being more accurate in 280 instances (56.9 percent), and the LIST asbeing more accurate for 122 (24.8 percent). Fifty-six institutions (11.4 percent) confirmed neither
BEST COPY AVAILABLE654
1992-93 National Study of Postsecondary FacultyMethodology Report: Appendix R
estimate and provided a new estimate, and 5 (1 percent) of the schools chose IPEDS as the most accurateestimate. An additional 29 institutions (5.9 percent) could not verify any particular estimate andtherefore the original LIST estimate was retained.
Review of sampling, weighting and imputation. An independent review found no errors in thesampling, weighting or imputation procedures used in NSOPF-93 for the original faculty dataset. In fact,faculty employment status (part-time/full-time) and primary area of teaching (i.e., where "healthsciences" is designated) were imputed so rarely that no significant bias could have resulted. However,this review found a major cause for the shortfall in part-time faculty numbers: nonresponse. Thereviewer was unfortunately limited in his examination of the health sciences faculty numbers becauseprimary teaching area was not recorded for nonresponding faculty.
Recommendations. Several statistical adjustments to remedy existing problems in NSOPF-93 estimateswere implemented. The first of these was the recalculation of the nonresponse weighting adjustment tocorrect for the known deficiency in the estimate of part-time faculty. Nonresponse adjustment did not,however, address the gap in faculty estimates between the QUEX and LIST totals. To remedy thisproblem, a poststratification adjustment using the "best estimate" identified during the retrieval,verification, and reconciliation effort was implemented. Several recommendations on survey design areproposed for field-testing in the next round of NSOPF.
1992-93 National Study of Postsecondary FacultyMethodology Report: Appendix R
Chapter I. Background and Scope of the Problem
In exploratory research using the original NSOPF-93 faculty dataset, the NSOPF staff at the NationalOpinion Research Center and its subcontractor, the Pelavin Research Institute, produced facultyestimates that diverged from expectations, in some cases significantly. Gaps appeared between the totalnumber of faculty recorded on the faculty list (or sampling frame) and numbers of faculty institutionadministrators reported on the NSOPF-93 institution questionnaire. Discrepancies were also apparent inthe estimates of faculty in the health sciencesalthough they appeared across other faculty disciplines aswelland in estimates of part-time faculty.
In the health sciences, population estimates of the total number of faculty showed a decline of 48,095 (or37.3 percent) from estimates produced for NSOPF-88. These changes are displayed in Exhibit 1-1,which compares totals for the nine health sciences disciplines. These observations may have indicated apossible problein in the 1987-88 NSOPF dataset. The difficulty of obtaining and rechecking samplingand weighting data files prepared for the 1987 survey prevented further exploration of that dataset. Acheck with the Association of American Medical Colleges and other health sciences professionalorganizations cast doubt on the accuracy of the NSOPF-93 data. Data from these external sourcessuggested that the health sciences faculties had not declined sharply between 1987 and 1992. While theAAMC definitions of faculty do not match NSOPF definitions exactly, the 1994 AAMC Data Bookreported that paid faculty (both full-time and part-time) in pre-clinical and clinical sciences in U.S.medical schools increased from 75,156 in 1987-88 to 94,641 in 1992-93. While the possibility of aproblem in NSOPF-88 cannot be ruled out, the fact that external sources did not verify a substantialdecline in health sciences faculty populations between 1987 and 1992 suggested that it was more prudentto focus the investigation on the original NSOPF-93 dataset.
Exhibit 1-2 compares weighted national faculty population estimates from two NSOPF-93 sources. Itillustrates the weighted faculty estimates provided by institutions that supplied only a faculty samplinglist (n=57), institutions which completed only the institution questionnaire (n=112) and institutionswhich supplied both a faculty sampling list and an institution questionnaire (n=760). Weights in theoriginal faculty dataset summed to 899,765. This compared to a faculty population estimate of1,035,055 derived from the institution questionnaire.
This discrepancy is well illustrated in the comparison between the 760 institutions for which bothfaculty-level data and institution-level data were available. For these institutions, weights in the originalfaculty dataset summed to 820,716. This number fell short of the total number of faculty reported on theinstitution questionnaire by 106,855. Part-time faculty accounted for the bulk of this shortfall (83,408 or78 percent of the total shortfall). Since different sources were involved (i.e. faculty lists and institutionquestionnaires), it was reasonable to assume that the estimates would be different. However,discrepancies of these magnitudes were a reason for concern.
Both of these findings seemed counterintuitive, proceeding in the opposite direction of NCES'sexpectations. Some statistical and anecdotal evidence on higher education for the period in question(1987 to 1992) predicted an increase, rather than a decrease, in part-time faculty.
Tables 1 to 3 in the Attachment to this report illustrate changes in faculty totals between 1987 and 1992reported in three different databases: the NSOPF institution survey, the NSOPF faculty survey and theNational Center for Education Statistics Integrated Postsecondary Data System (IPEDS). Several trendsare apparent in these tables: I) that NSOPF-88 and the original NSOPF-93 survey reported higher totals
1 656
1992-93 National Study of Postsecondary FacultyMethodology Report: Appendix R
for faculty on the institution survey than on the faculty survey, and that faculty population estimatesfrom both NSOPF-93 surveys exceeded those reported in the 1993 IPEDS; 2) that the original facultydataset for NSOPF-93 indicated a full-time/part-time faculty breakdown of instructional faculty of 66.9percent (full-time) to 33.1 percent (part-time), compared with the 57.6 percent (full-time) to 42.4 percent(part-time) breakdown for instructional faculty reported on the NSOPF-93 institutional questionnaire;and 3) that IPEDS and the NSOPF-93 institution survey recorded a growth in the percentage of part-timefaculty between 1987 and 1992, while the NSOPF-93 faculty survey showed virtually no change in thedistribution of full-time and part-time faculty.
C e7.13 Ar
2
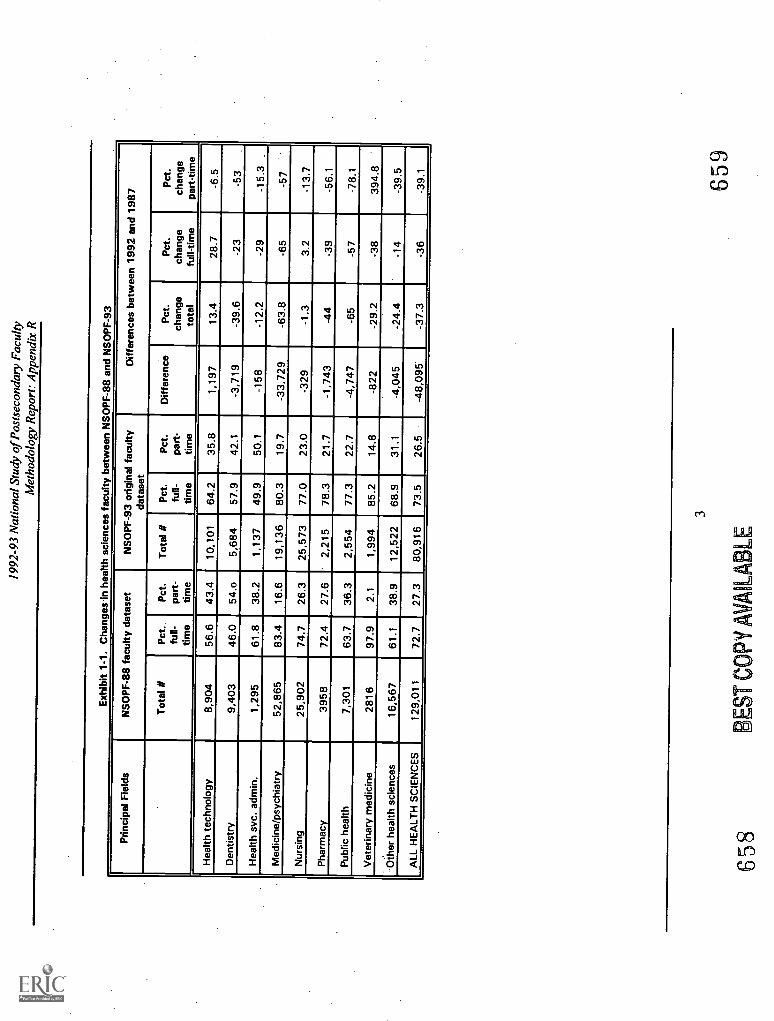
1992
-93
Nat
iona
l Stu
dy o
f Pos
tsec
onda
ry F
acul
tyM
etho
dolo
gy R
epor
t: A
ppen
dix
R
Exh
ibit
1-1.
Cha
nges
In h
ealth
sci
ence
s fa
culty
bet
wee
n N
SO
PF
-88
and
NS
OP
F-9
3
Prin
cipa
l Fie
lds
NS
OP
F-8
8 fa
culty
dat
aset
NS
OP
F-9
3 or
igin
al fa
culty
data
set
Diff
eren
ces
betw
een
1992
and
198
7
Tot
al It
Pct
.fu
ll-tim
e
Pct
.pa
rt-
time
Tot
al #
Pct
.fu
ll-tim
e
Pct
.pa
rt-
time
Diff
eren
ceP
ct.
chan
geto
tal
Pct
.ch
ange
full-
time
Pct
.ch
ange
part
-tim
e
Hea
lth te
chno
logy
8,90
456
.643
.410
,101
64.2
35.8
1,19
713
.428
.7-6
.5
Den
tistr
y9,
403
46.0
54.o
5,68
457
.942
.1-3
,719
-39.
6-2
3-5
3H
ealth
svc
. adm
in.
1,29
561
.838
.21,
137
49.9
50.1
-158
-12.
2-2
9-1
5.3
.
Med
icin
e/ps
ychi
atry
52,8
6583
.416
.619
,136
80.3
19.7
-33,
729
-63.
8-6
5-5
7
Nur
sing
25,9
0274
.726
.325
,573
77.0
23.0
-329
-1.3
3.2
-13.
7P
harm
acy
3958
72A
27.6
2,21
578
.321
.7-1
,743
-44
-39
-56.
1
Pub
lic h
ealth
7,30
163
.736
.32,
554
77.3
22.7
-4,7
47-6
5-5
7-7
8.1
Vet
erin
ary
med
icin
e28
1697
.92.
11,
994
85.2
14.8
-822
-29.
2-3
839
4.8
Oth
er h
ealth
sci
ence
s16
,567
61.1
38.9
12,5
2268
.931
.1-4
,045
-24.
4-1
4-3
9.5
ALL
HE
ALT
H S
CIE
NC
ES
129,
011
72.7
27.3
80,9
1673
.526
.5-4
8,09
5-3
7.3
-36
-39.
1
658
BE
ST C
OPY
AV
AIL
AB
LE
3
659
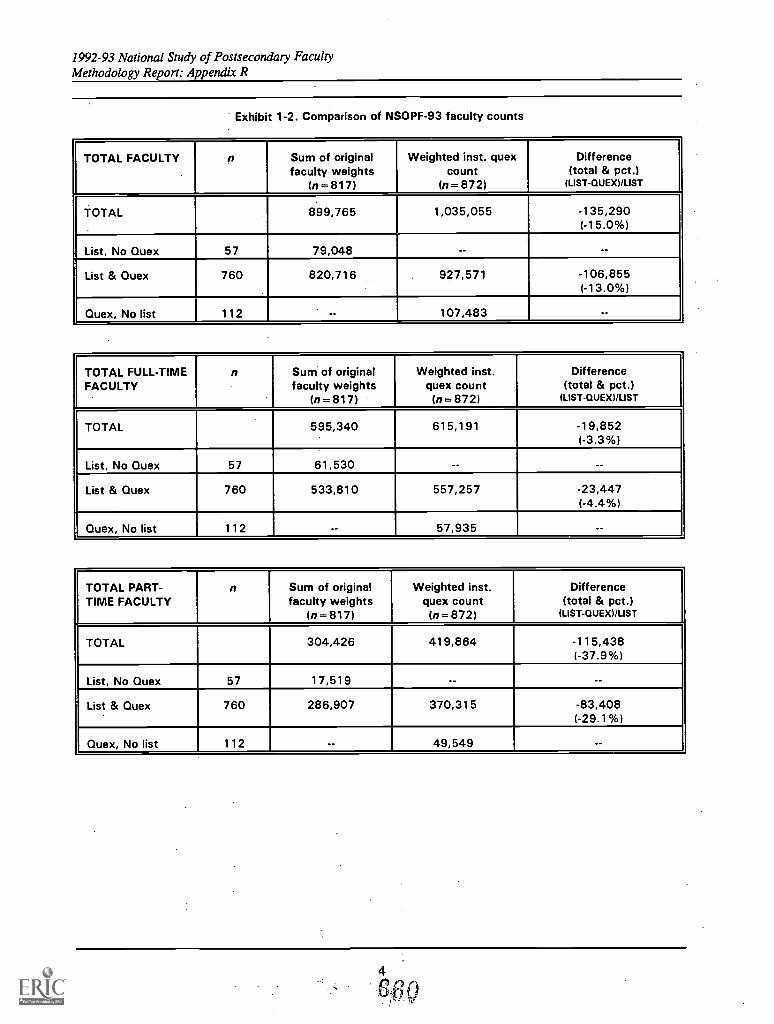
1992-93 National Study of Postsecondary FacultyMethodology Report: Appendix R
Exhibit 1-2. Comparison of NSOPF-93 faculty counts
TOTAL FACULTY n Sum of originalfaculty weights
(n = 817)
Weighted inst. quexcount
(n = 872)
Difference(total & pct.)
(LIST-QUEX /LIST
TOTAL 899,765 1,035,055 -135,290(-15.0%)
List, No Quex 57 79,048 --
List & Quex 760 820,716 927,571 -106,855(-13.0%)
Quex, No list 112 -- 107,483
TOTAL FULL-TIMEFACULTY
n Sum of originalfaculty weights
(n = 817)
Weighted inst.quex count
(n = 872)
Difference(total & pct.)
(LIST-QUEX) /LIST
TOTAL 595,340 615,191 -19,852(-3.3%)
List, No Quex 57 61,530 -- --
List & Quex 760 533,810 557,257 -23,447(-4.4%)
Quex, No list 112 -- 57,935 --
TOTAL PART-TIME FACULTY
n Sum of originalfaculty weights
(n = 817)
Weighted inst.quex count
(n = 872)
Difference(total & pct.)
(LIST-QUEX)/LIST
TOTAL 304,426 419,864 -115,438(-37.9%)
List, No Quex 57 17,519 -- --
List & Quex 760 286,907 370,315 -83,408(-29.1%)
Quex, No list 112 -- 49,549 --
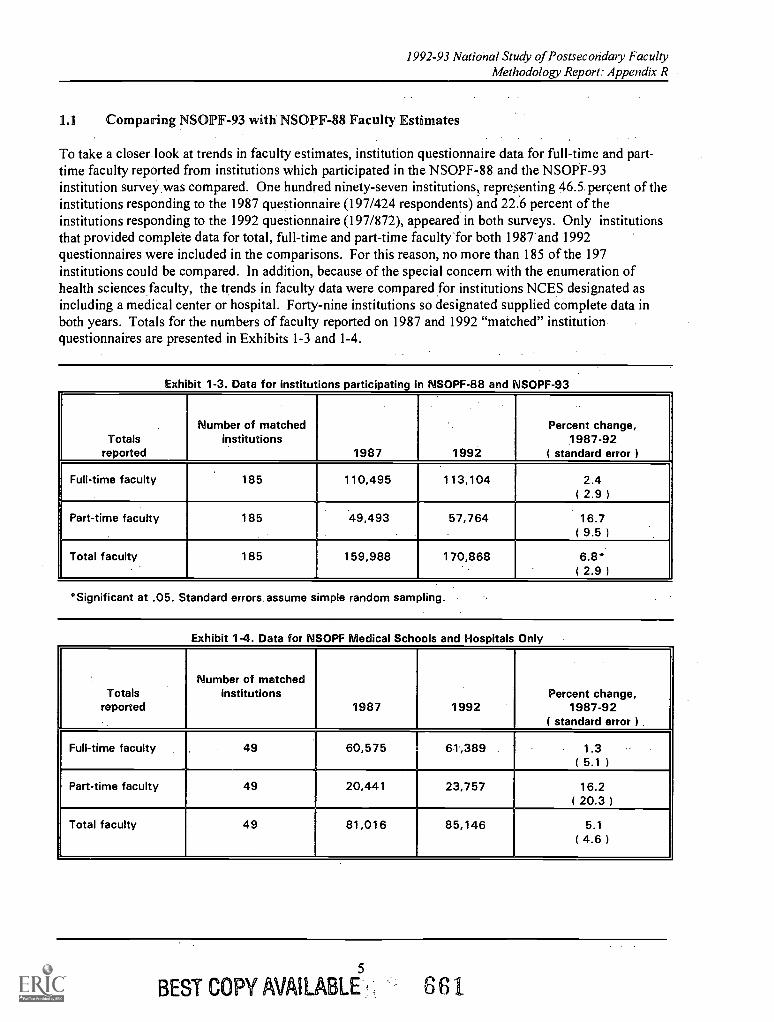
1992-93 National Study of Postsecondary FacultyMethodology Report: Appendix R
1.1 Comparing NSOPF-93 with NSOPF-88 Faculty Estimates
To take a closer look at trends in faculty estimates, institution questionnaire data for full-time and part-time faculty reported from institutions which participated in the NSOPF-88 and the NSOPF-93institution survey was compared. One hundred ninety-seven institutions, representing 46.5 percent of theinstitutions responding to the 1987 questionnaire (197/424 respondents) and 22.6 percent of theinstitutions responding to the 1992 questionnaire (197/872), appeared in both surveys. Only institutionsthat provided complete data for total, full-time and part-time faculty Tor both 1987 and 1992questionnaires were included in the comparisons. For this reason, no more than 185 of the 197institutions could be compared. In addition, because of the special concern with the enumeration ofhealth sciences faculty, the trends in faculty data were compared for institutions NCES designated asincluding a medical center or hospital. Forty-nine institutions so designated supplied complete data inboth years. Totals for the numbers of faculty reported on 1987 and 1992 "matched" institutionquestionnaires are presented in Exhibits 1-3 and 1-4.
Exhibit 1-3. Data for institutions participating in NSOPF-88 and NSOPF-93
Totalsreported
Number of matchedinstitutions
1987 1992
Percent change,1987-92
( standard error )
Full-time faculty 185 110,495 113,104 2.4( 2.9 )
Part-time faculty 185 49,493 57,764 16.7( 9.5 )
Total faculty 185 159,988 170,868 6.8*( 2.9 1
*Significant at .05. Standard errors. assume simple random sampling.
Exhibit 1-4. Data for NSOPF Medical Schools and Hospitals Only
TotalsNumber of matched
institutions Percent change,reported 1987 1992 1987-92
I standard error) .
Full-time faculty 49 60,575 61,389 1.3( 5.1 1
Part-time faculty 49 20,441 23,757 16.2( 20.3 )
Total faculty 49 81,016 85,146 5.1( 4.6 )
5
BEST COPY AVAILABLE 6 61
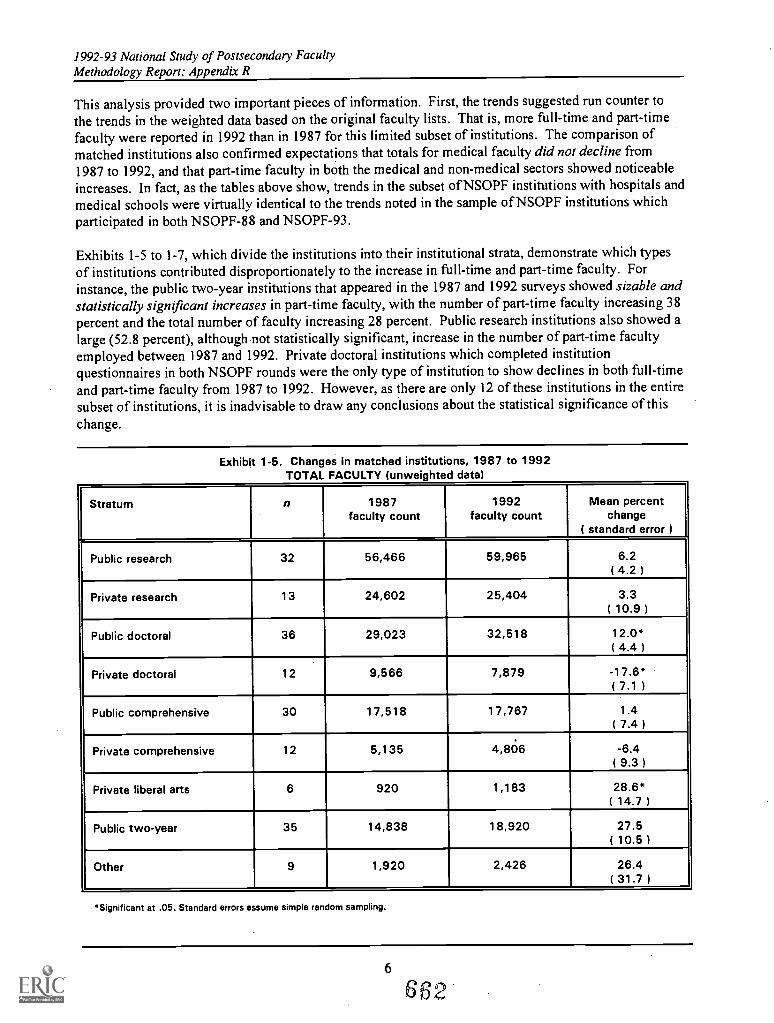
1992-93 National Study of Postsecondary FacultyMethodology Report: Appendix R
This analysis provided two important pieces of information. First, the trends suggested run counter tothe trends in the weighted data based on the original faculty lists. That is, more full-time and part-timefaculty were reported in 1992 than in 1987 for this limited subset of institutions. The comparison ofmatched institutions also confirmed expectations that totals for medical faculty did not decline from1987 to 1992, and that part-time faculty in both the medical and non-medical sectors showed noticeableincreases. In fact, as the tables above show, trends in the subset of NSOPF institutions with hospitals andmedical schools were virtually identical to the trends noted in the sample of NSOPF institutionswhich
participated in both NSOPF-88 and NSOPF-93.
Exhibits 1-5 to 1-7, which divide the institutions into their institutional strata, demonstrate which typesof institutions contributed disproportionately to the increase in full-time and part-time faculty. Forinstance, the public two-year institutions that appeared in the 1987 and 1992 surveys showed sizable andstatistically significant increases in part-time faculty, with the number of part-time faculty increasing 38percent and the total number of faculty increasing 28 percent. Public research institutions also showed alarge (52.8 percent), although not statistically significant, increase in the number of part-time facultyemployed between 1987 and 1992. Private doctoral institutions which completed institutionquestionnaires in both NSOPF rounds were the only type of institution to show declines in both full-timeand part-time faculty from 1987 to 1992. However, as there are only 12 of these institutions in the entiresubset of institutions, it is inadvisable to draw any conclusions about the statistical significance of thischange.
Exhib't 1-5. Changes in matched institutions, 1987 to 1992TOTAL FACULTY (unweighted data)
Stratum n 1987faculty count
1992faculty count
Mean percentchange
( standard error )
Public research 32 56,466 59,965 6.2( 4.2 )
Private research 13 24,602 25,404 3.3( 10.9 )
Public doctoral 36 29,023 32,518 12.0*( 4.4 )
Private doctoral 12 9,566 7,879 -17.6*( 7.1 )
Public comprehensive 30 17,518 17,767 1.4( 7.4 1
Private comprehensive 12 5,135 4,806
.
-6.4(9.3)
Private liberal arts 6 920 1,183 28.6( 14.7 )
-,
Public two-year 35 14,838 18,920 27.5( 10.5)
Other 9 1,920 2,426
..
26.4( 31.7 1
Significant at .05. Standard errors assume simple random sampling.
6
68
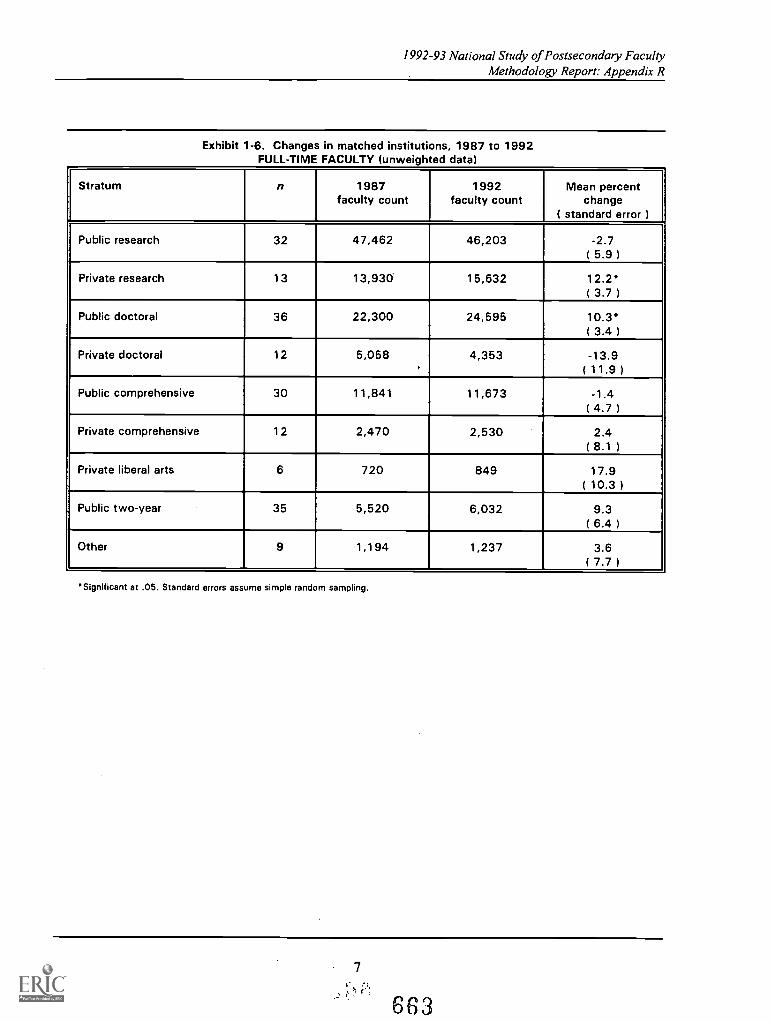
1992-93 National Study of Postsecondary FacultyMethodology Report: Appendix R
Exhibit 1-6. Changes in matched institutions, 1987 to 1992FULL-TIME FACULTY (unweighted data)
Stratum n 1987faculty count
1992faculty count
Mean percentchange
( standard error )
Public research 32 47,462 46,203 -2.7( 5.9 )
Private research 13 13,930' 15,632 12.2*( 3.7 )
Public doctoral 36 22,300 24,595 10.3*( 3.4 )
Private doctoral 12 5,058 4,353 -13.9( 11.91
Public comprehensive 30 11,841 11,673 -1.4(4.7)
Private comprehensive 12 2,470 2,530 2.4( 8.1
Private liberal arts 6 720 849 17.9( 10.3 )
Public two-year 35 5,520 6,032 9.3( 6.4
Other 9 1,194 1,237 3.6( 7.7
Significant at .05. Standard errors assume simple random sampling.
7
663
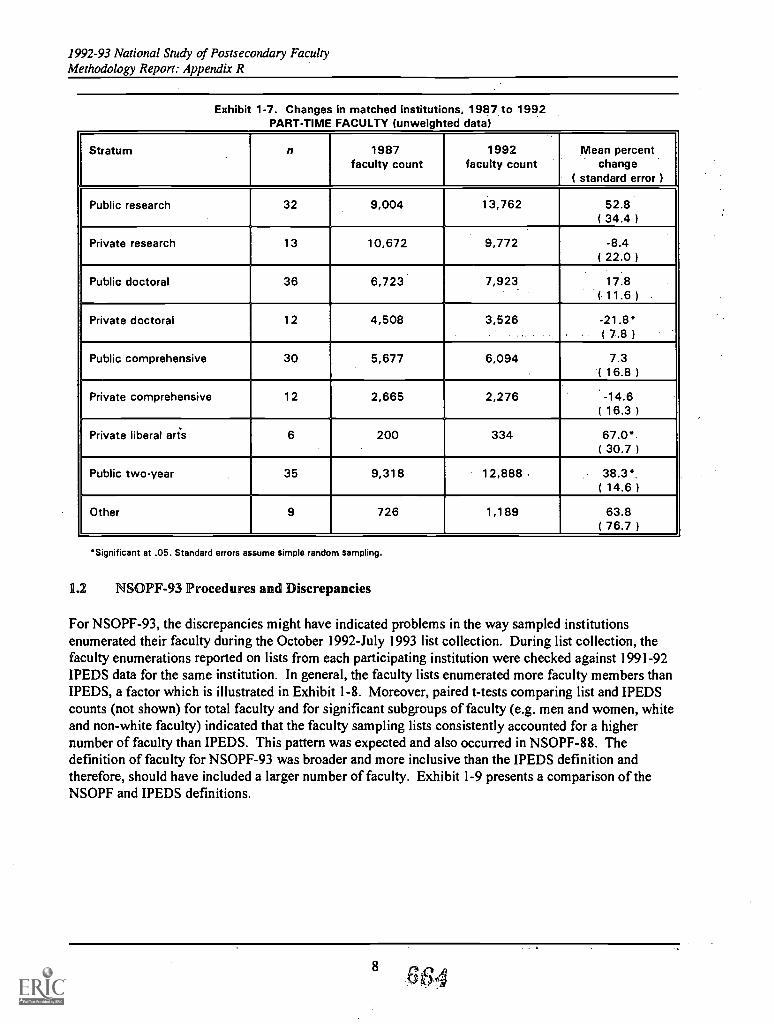
1992-93 National Study of Postsecondary FacultyMethodology Report: Appendix R
Exhibit 1-7. Changes in matched institutions, 1987 to 1992PART-TIME FACULTY (unweighted data)
Stratum n 1987faculty count
1992faculty count
Mean percentchange
( standard error )
Public research 32 9,004 13,762 52.8( 34.4 )
Private research 13 10,672 9,772 -8.4( 22.0 )
Public doctoral 36 6,723 7,923 17.8( 11.6 )
Private doctoral 12 4,508 3,526 -21.8*( 7.8 )
Public comprehensive 30 5,677 6,094 7.3( 16.8 )
Private comprehensive 12 2,665 2,276 -14.6( 16.3 1
Private liberal arts 6 200 334 67.0( 30.7 )
Public two-year 35 9,318 12,888 38.3*.( 14.6 )
Other 9 726 1,189 63.8( 76.7
'Significant at .05. Standard errors assume simple random sampling.
1.2 NSOPF-93 Procedures and Discrepancies
For NSOPF-93, the discrepancies might have indicated problems in the way sampled institutionsenumerated their faculty during the October 1992-July 1993 list collection. During list collection, thefaculty enumerations reported on lists from each participating institution were checked against 1991-92IPEDS data for the same institution. In general, the faculty lists enumerated more faculty members thanIPEDS, a factor which is illustrated in Exhibit 1-8. Moreover, paired t-tests comparing list and IPEDScounts (not shown) for total faculty and for significant subgroups of faculty (e.g. men and women, whiteand non-white faculty) indicated that the faculty sampling lists consistently accounted for a highernumber of faculty than IPEDS. This pattern was expected and also occurred in NSOPF-88. Thedefinition of faculty for NSOPF-93 was broader and more inclusive than the IPEDS definition andtherefore, should have included a larger number of faculty. Exhibit 1-9 presents a comparison of theNSOPF and IPEDS definitions.
8664
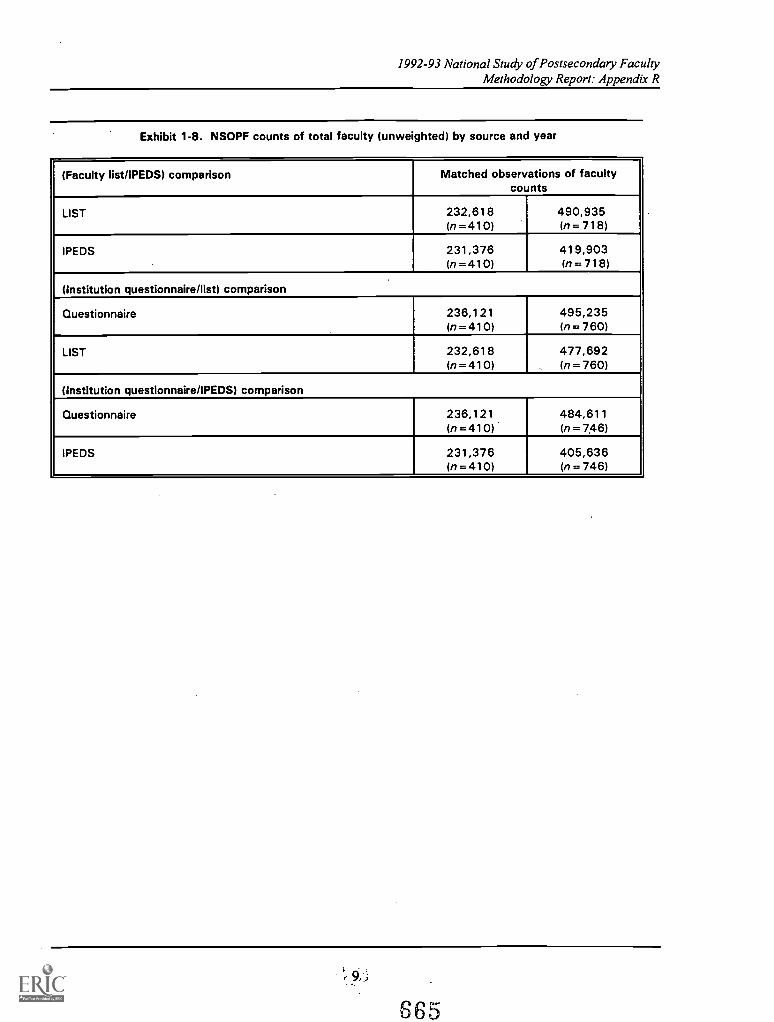
1992-93 National Study of Postsecondary FacultyMethodology Report: Appendix R
Exhibit 1-8. NSOPF counts of total faculty (unweighted) by source and year
(Faculty list/IPEDS) comparison Matched observations of facultycounts
LIST 232,618 490,935(n = 41 0) (n=718)
IPEDS 231,376 419,903(n=410) (n=718)
(Institution questionnaire/list) comparison
Questionnaire 236,121 495,235(n = 41 0) (n = 760)
LIST 232,618 477,692(n =410) In = 7 60)
(Institution questionnaire/IPEDS) comparison
Questionnaire 236,121 484,611(n=410). (n = 746)
IPEDS 231,376 405,636In = 410) In = 746)
665
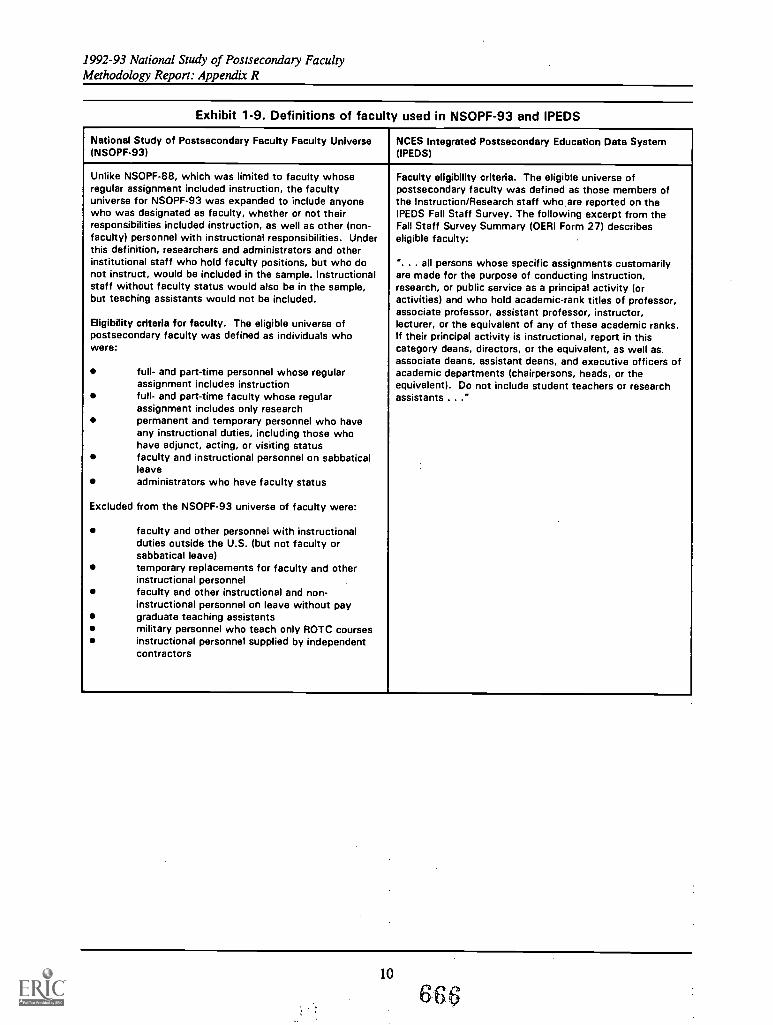
1992-93 National Study of Postsecondary FacultyMethodology Report: Appendix R
Exhibit 1-9. Definitions of faculty used in NSOPF-93 and IPEDS
National Study of Postsecondary Faculty Faculty Universe(NSOPF-93)
NCES Integrated Postsecondary Education Data System(IPEDS)
Unlike NSOPF-88, which was limited to faculty whoseregular assignment included instruction, the facultyuniverse for NSOPF-93 was expanded to include anyonewho was designated as faculty, whether or not theirresponsibilities included instruction, as well as other (non-faculty) personnel with instructional responsibilities. Underthis definition, researchers and administrators and otherinstitutional staff who hold faculty positions, but who donot instruct, would be included in the sample. Instructionalstaff without faculty status would also be in the sample,but teaching assistants would not be included.
Eligibility criteria for faculty. The eligible universe ofpostsecondary faculty was defined as individuals whowere:
full- and part-time personnel whose regularassignment includes instructionfull- and part-time faculty whose regularassignment includes only researchpermanent and temporary personnel who haveany instructional duties, including those whohave adjunct, acting, or visiting statusfaculty and instructional personnel on sabbaticalleaveadministrators who have faculty status
Excluded from the NSOPF-93 universe of faculty were:
faculty and other personnel with instructionalduties outside the U.S. (but not faculty orsabbatical leave)temporary replacements for faculty and otherinstructional personnelfaculty and other instructional and non-instructional personnel on leave without paygraduate teaching assistantsmilitary personnel who teach only ROTC coursesinstructional personnel supplied by independentcontractors
Faculty eligibility criteria. The eligible universe ofpostsecondary faculty was defined as those members ofthe Instruction/Research staff who are reported on theIPEDS Fall Staff Survey. The following excerpt from theFall Staff Survey Summary (OERI Form 27) describeseligible faculty:
.. all persons whose specific assignments customarilyare made for the purpose of conducting instruction,research, or public service as a principal activity (oractivities) and who hold academic-rank titles of professor,associate professor, assistant professor, instructor,lecturer, or the equivalent of any of these academic ranks.If their principal activity is instructional, report in thiscategory deans, directors, or the equivalent, as well as.associate deans, assistant deans, and executive officers ofacademic departments (chairpersons, heads, or theequivalent). Do not include student teachers or researchassistants . . ."
1992-93 National Study of Postsecondary FacultyMethodology Report: Appendix R
The time gap between list collection and questionnaire completion for NSOPF-93 also appeared likely tointroduce additional variability in reporting faculty enumerations. Lists were submitted between October1992 and July 1993, and the institution survey was conducted between September 1993 and May 1994.The NSOPF-93 data collection therefore encompassed a 20-month period. For NSOPF-88, the datacollection period extended from December 1987 to October 1988 (10 months). Though Exhibit 1-8shows that faculty counts were higher on the questionnaire than on the list for both NSOPF years, thedifference was much greater than anticipated for NSOPF-93.
Institutional Coordinatorsindividuals designated by each institution to supply lists of faculty forsampling purposesmay have neglected to include medical school and part-time faculty on theirinstitutions' lists. This seemed a plausible explanation as anecdotal evidence suggested that severalmajor institutions had "spun off" medical centers and hospitals from their main campuses. In addition,the often-tenuous institutional status of part-time faculty members at most institutions suggested agreater likelihood that institution reports of part-time faculty might, for various reasons, be incompleteeven after these estimates were verified against the previous year's IPEDS estimates for NSOPF-93.Those completing the institution questionnairesfewer than one-half (385/872 or 44.2 percent) of whomwere the same individuals who oversaw preparation of their institution's faculty listmay haveinadvertently omitted part-timers and medical or hospital-affiliated faculty in reporting their facultyenumerations on the institution questionnaire.
11
667
1992-93 National Study of Postsecondary FacultyMethodology Report: Appendix R
Chapter II. Discrepancy and Trend Analysis
The investigation of original NSOPF-93 dataset consisted of three parts: (1) an analysis of discrepanciesbetween three sets of estimates: the faculty list enumerations the institution supplied for samplingpurposes (hereafter referred to as LIST); faculty estimates reported on the institution questionnaire(hereafter referred to as QUEX); and NCES's Integrated Postsecondary Education Data System(hereafter referred to as IPEDS); (2) a data retrieval, verification, and reconciliation effort involving therecontact of NSOPF-93 participating institutions with LIST/QUEX discrepancies of 10 percent or moreand all participating institutions with a medical school or hospital; and (3) a review of the sampling,weighting, and imputation procedures used for the 1992-93 NSOPF. This chapter reports on thediscrepancies, Chapter 3 reports on reconciliation and verification effort, and Chapter 4 reports on thereview of sampling, weighting and imputation procedures.
Of a target sample of 974 postsecondary institutions, 962 (99 percent) were eligible for inclusion in theNSOPF-93 sample. Of the 962 eligible institutions, 817 (85 percent) institutions agreed to participate inthe NSOPF-93 full-scale study. "Participation" was defined as providing an enumeration of faculty thatcould be used for sampling purposes. A total of 872 (91 percent) of the 962 eligible institutionsresponded by completing an institution questionnaire. Thus, the 509 institutions recontacted for theretrieval and reconciliation effort represented 62.3 percent of the 817 participating institutions and 58.4percent of 872 institutions that completed an institution questionnaire.
2.1 Discrepancy Analysis
Discrepancies in faculty estimates from the three sources (LIST, QUEX, and IPEDS) were inevitable,owing to the varying definitions used and the different data systems postsecondary institutions maintainto account for faculty. To identify systematic patterns of discrepancies in faculty estimates betweeninstitution questionnaire data and other data sources, a number of institutional characteristics wereconsidered. These were: size (smaller or larger than the median), control (public or private), type (two-year versus four-year), and stratum. Medical and non-medical institutions were also compared.
Institution Size. Institutions were divided into "small" and "large" at the median faculty count forinstitutions in each of the three comparison sets. For the LIST/IPEDS comparison, institutions weredivided at the median IPEDS faculty count of 352. For the QUEX/LIST comparison, institutions weredivided at the median LIST count of 363 faculty members. And for the QUEX/IPEDS comparison,institutions were divided at the median 1PEDS faculty count of 321 faculty members. Paired t-testscomparing mean discrepancies and mean percent discrepancies are reported in Exhibits 2-1 and 2-2.
The significant differences found in five of the six LIST/IPEDS comparisons underscore a point madeearlier: that the NSOPF-93 faculty list, which used a more expansive definition of faculty members thanthe IPEDS dataset, consistently accounted for a greater number of faculty members than IPEDS. In theQUEX/LIST comparison, the only significant difference noted occurred in smaller institutions, where theNSOPF-93 institution questionnaire consistently enumerated an average of 68 faculty members morethan the faculty list. Expressed in percentage terms, institution questionnaire faculty counts tended toreport an average of 39 percent more faculty members than did the sampling lists these institutionssubmitted. For the most part, the QUEX/IPEDS comparison mirrors the LIST/IPEDS comparison. Thisreflects the general pattern of observations: QUEX faculty counts tend to exceed LIST faculty counts,which, in turn, tend to exceed IPEDS faculty counts. The difference in definitions of faculty membersused in both QUEX and LIST and the definition used in IPEDS reinforces this pattern.
13 668
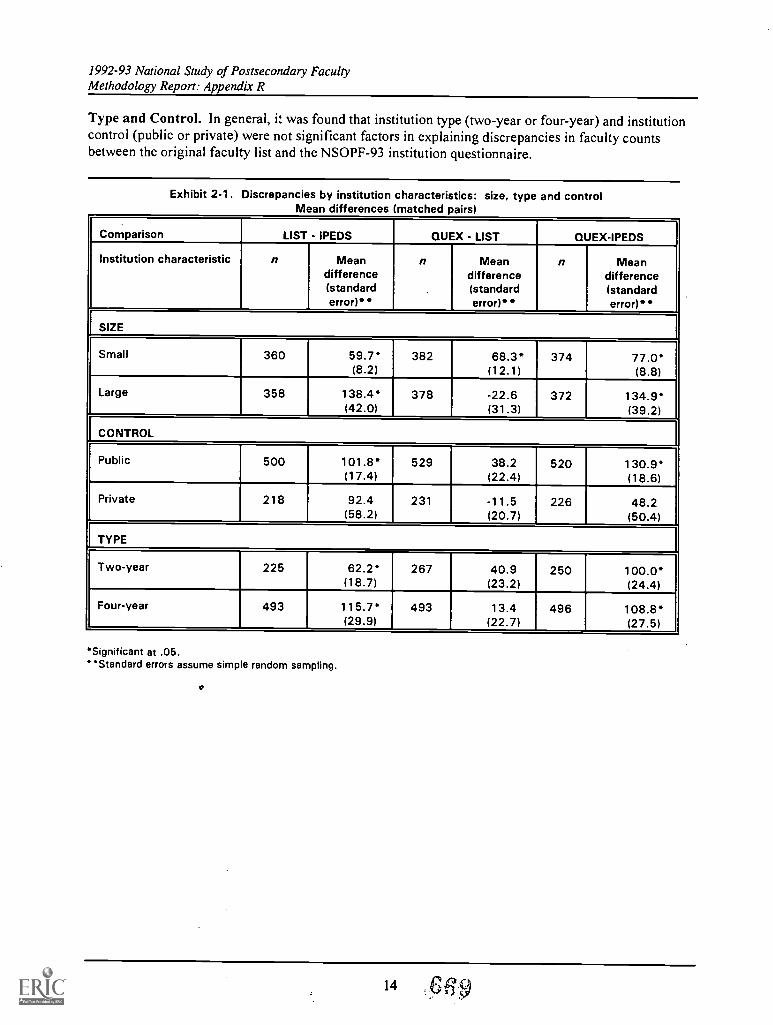
1992-93 National Study of Postsecondary FacultyMethodology Report: Appendix R
Type and Control. In general, it was found that institution type (two-year or four-year) and institutioncontrol (public or private) were not significant factors in explaining discrepancies in faculty countsbetween the original faculty list and the NSOPF-93 institution questionnaire.
Exhibit 2-1. Discrepancies by institution characteristics: size, type and controlMean differences matched pairs)
Comparison LIST - IPEDS QUEX - LIST QUEX -IPEDS
Institution characteristic n Meandifference
n Meandifference
n Meandifference
(standarderror)
(standarderror)**
(standarderror)**
SIZE
Small 360 59.7 382 68.3* 374 77.0(8.2) (12.1) (8.8)
Large 358 138.4* 378 -22.6 372 134.9(42.0) (31.3) (39.2)
CONTROL
Public 500 101.8* 529 38.2 520 130.9*(17.4) (22.4) (18.6)
Private 218 92.4 231 -11.5 226 48.2(58.2) (20.7) (50.4)
TYPE
Two-year 225 62.2 267 40.9 250 100.0(18.7) (23.2) (24.4)
Four-year 493 115.7* 493 13.4 496 108.8(29.9) (22.7) (27.5)
Significant at .05.Standard errors assume simple random sampling.
o
14
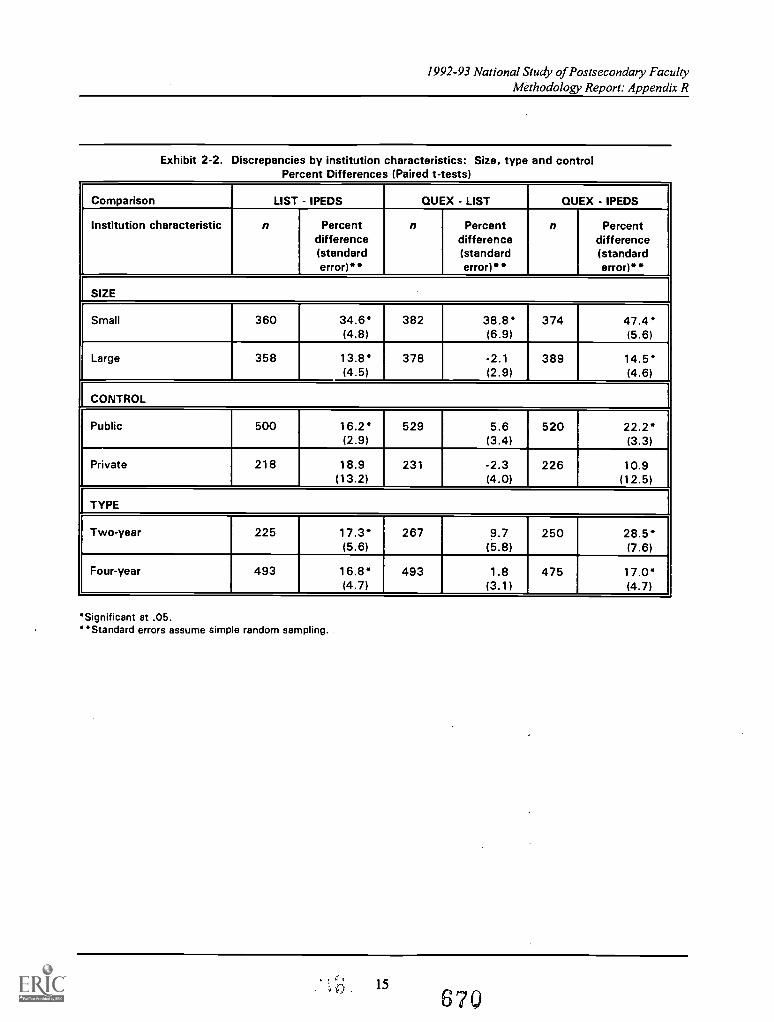
1992-93 National Study of Postsecondary FacultyMethodology Report: Appendix R
Exhibit 2-2. Discrepancies by institution characteristics: Size, type and controlPercent Differences (Paired t-tests)
Comparison LIST - IPEDS QUEX - LIST QUEX - IPEDS
Institution characteristic n Percentdifference
n Percentdifference
n Percentdifference
(standarderror)**
(standarderror)
(standarderror)"
SIZE
Small 360 34.6 382 38.8 374 47.4*(4.8) (6.9) (5.6)
Large 358 13.8* 378 -2.1 389 14.5'(4.5) (2.9) (4.6)
CONTROL
Public 500 16.2' 529 5.6 520 22.2(2.9) (3.4) (3.3)
Private 218 18.9 231 -2.3 226 10.9(13.2) (4.0) (12.5)
TYPE
Two-year 225 17.3' 267 9.7 250 28.5(5.6) (5.8) (7.6)
Four-year 493 16.8' 493 1.8 475 17.0'(4.7) (3.1) (4.7)
Significant at .05.Standard errors assume simple random sampling.
15
670
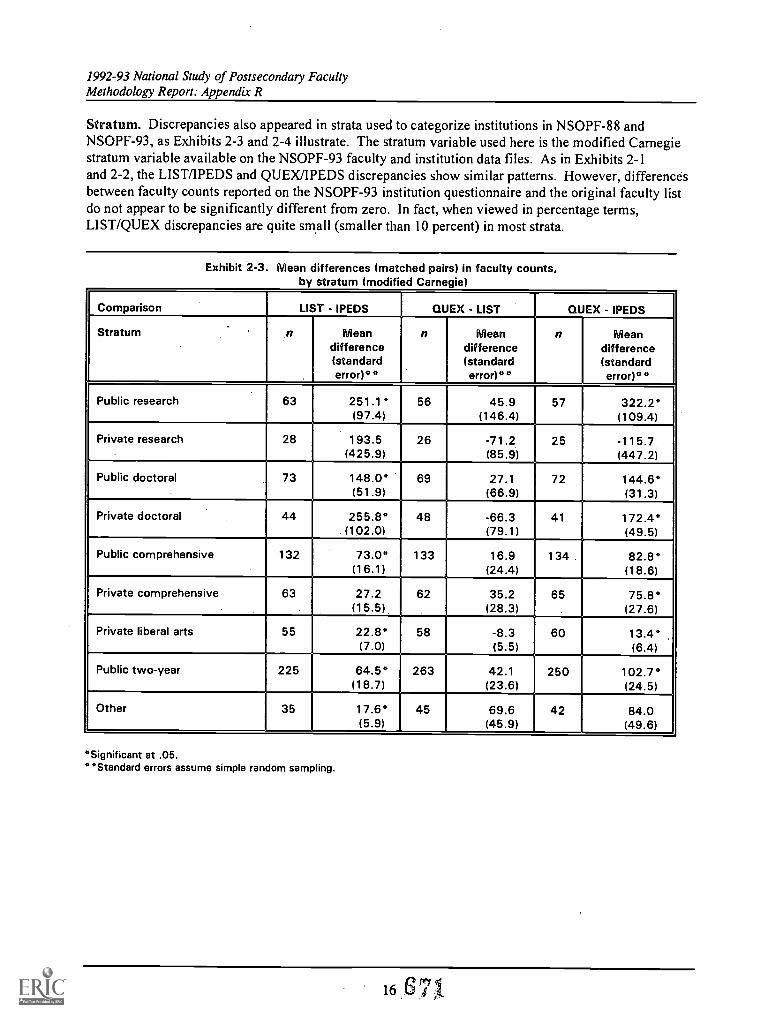
1992-93 National Study of Postsecondary FacultyMethodology Report: Appendix R
Stratum. Discrepancies also appeared in strata used to categorize institutions in NSOPF-88 andNSOPF-93, as Exhibits 2-3 and 2-4 illustrate. The stratum variable used here is the modified Carnegiestratum variable available on the NSOPF-93 faculty and institution data files. As in Exhibits 2-1and 2-2, the LIST/IPEDS and QUEX/IPEDS discrepancies show similar patterns. However, differencesbetween faculty counts reported on the NSOPF-93 institution questionnaire and the original faculty listdo not appear to be significantly different from zero. In fact, when viewed in percentage terms,LIST/QUEX discrepancies are quite small (smaller than 10 percent) in most strata.
Exhibit 2-3. Mean differences (matched pairs) in faculty counts,by stratum (modified Carnegie)
Comparison LIST - IPEDS QUEX - LIST QUEX - IPEDS
Stratum n Mean n Mean n Meandifference difference difference(standard (standard (standarderror)** error) * 0 error) * *
Public research 63 251.1 * 56 45.9 57 322.2*(97.4) (146.4) (109.4)
Private research 28 193.5 26 -71.2 25 -115.7(425.9) (85.9) (447.2)
Public doctoral 73 148.0* 69 27.1 72 144.6*(51.9) (66.9) (31.3)
Private doctoral 44 255.8* 48 -66.3 41 172.4°(102.0) (79.1) (49.5)
Public comprehensive 132 73.0* 133 16.9 134. 82.8*(16.1) (24.4) (18.6)
Private comprehensive 63 27.2 62 35.2 65 75.8*(15.5) (28.3) (27.6)
Private liberal arts 55 22.8* 58 -8.3 60 13.4°(7.0) (5.5) (6.4)
Public two-year 225 64.5* 263 42.1 250 102.7°(18.7) (23.6) (24.5)
Other 35 17.6° 45 69.6 42 84.0(5.9) (45.9) (49.6)
°Significant at .05.**Standard errors assume simple random sampling.
16
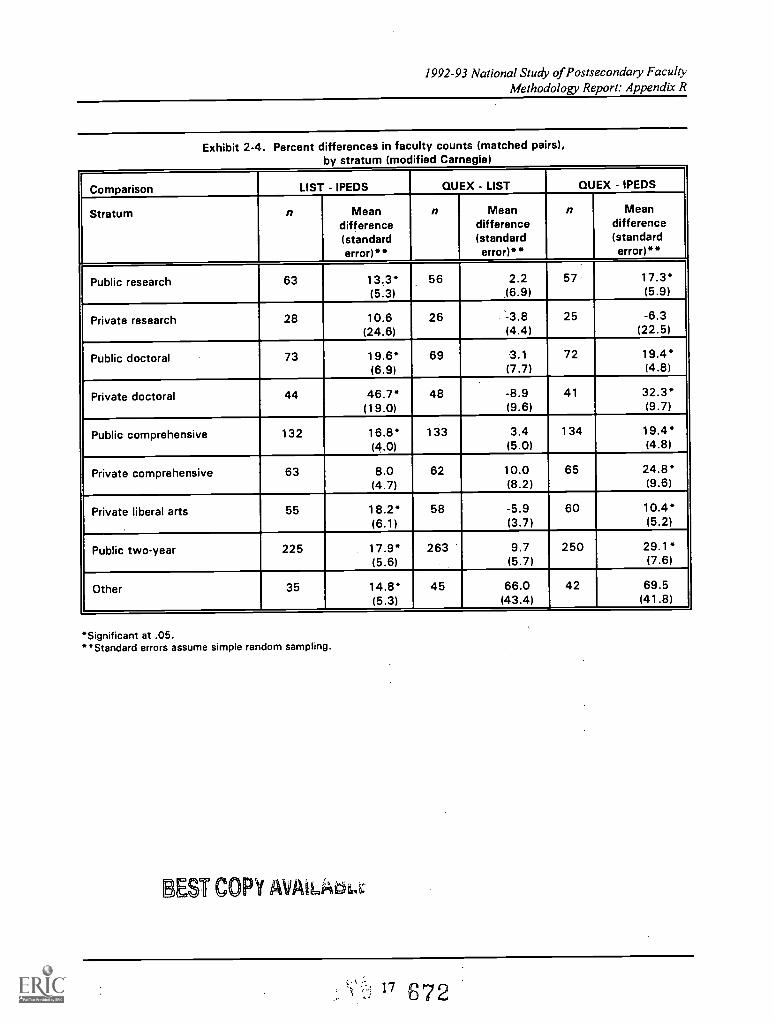
1992-93 National Study of Postsecondary FacultyMethodology Report: Appendix R
Exhibit 2-4. Percent differences in faculty counts (matched pairs),by stratum (modified Carnegie)
Comparison LIST - IPEDS QUEX - LIST QUEX - IPEDS
Stratum n Mean n Mean n Meandifference difference difference(standard (standard (standarderror)" error)" error)"
Public research 63 13.3 56 2.2 57 17.3(5.3) (6.9) (5.9)
Private research 28 10.6 26 13.8 25 -6.3(24.6) (4.4) (22.5)
Public doctoral 73 19.6' 69 3.1 72 19.4(6.9) (7.7) (4.8)
Private doctoral 44 46.7' 48 -8.9 41 32.3'(19.0) (9.6) (9.7)
Public comprehensive 132 16.8' 133 3.4 134 19.4(4.0) (5.0) (4.8)
Private comprehensive 63 8.0 62 10.0 65 24.8'(4.7) (8.2) (9.6)
Private liberal arts 55 18.2' 58 -5.9 60 10.4(6.1) (3.7) (5.2)
Public two-year 225 17.9' 263 9.7 250 29.1(5.6) (5.7) (7.6)
Other 35 14.8* 45 66.0 42 69.5(5.3) (43.4) (41.8)
'Significant at .05.Standard errors assume simple random sampling.
BEST COPY AVAIL a.
17 6 72
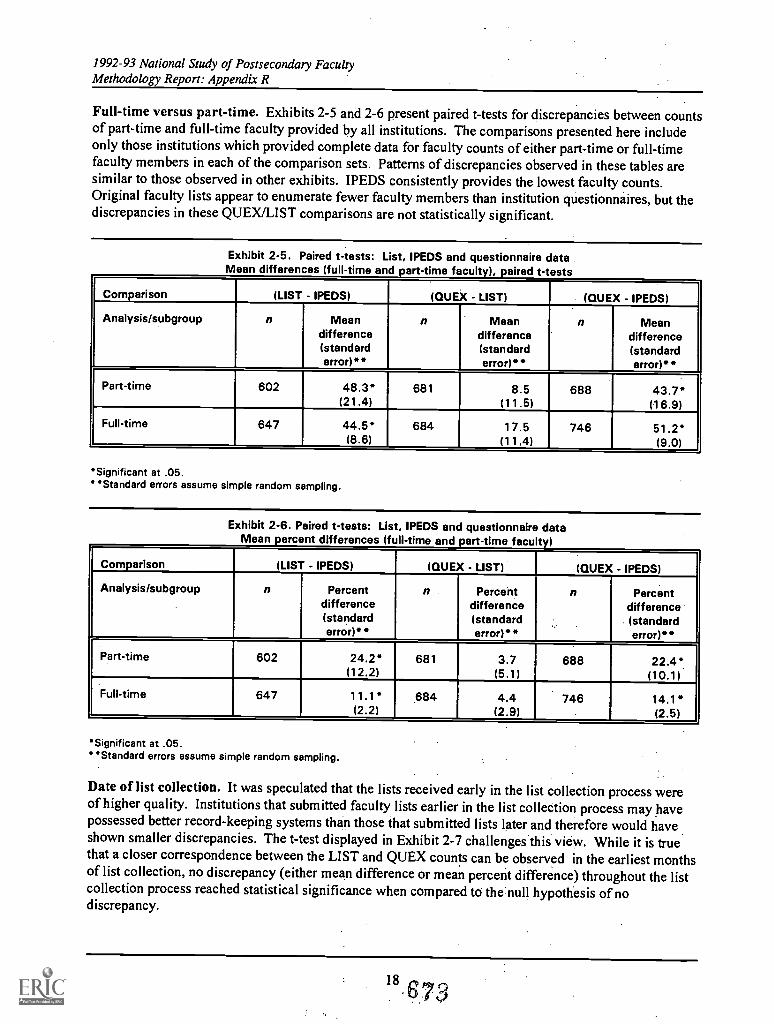
1992-93 National Study of Postsecondary FacultyMethodology Report: Appendix R
Full-time versus part-time. Exhibits 2 -5 and 2 -6 present paired t-tests for discrepancies between countsof part-time and full-time faculty provided by all institutions. The comparisons presented here includeonly those institutions which provided complete data for faculty counts of either part-time or full-timefaculty members in each of the comparison sets. Patterns of discrepancies observed in these tables aresimilar to those observed in other exhibits. IPEDS consistently provides the lowest faculty counts.Original faculty lists appear to enumerate fewer faculty members than institution questionnaires, but thediscrepancies in these QUEX/LIST comparisons are not statistically significant.
Exhibit 2-5. Paired t-tests: List, IPEDS and questionnaire dataMean differences (full-time and part -time faculty), paired t-tests
Comparison (LIST - IPEDS) (QUEX LIST) (QUEX - IPEDS)
Analysis/subgroup n Meandifference
n Meandifference
n Meandifference
(standarderror)"
(standarderror)"
(standarderror)"
Part-time 602 48.3 681 8.5 688 43.7*(21.4) (11.5) (16.9)
Full-time 647 44.5* 684 17.5 746 51.2(8.6) (11.4) (9.0)
Significant at .05."Standard errors assume simple random sampling.
Exhibit 2-6. Paired t-tests: List, IPEDS and questionnaire dataMean percent differences (full-time and part -time faculty)
Comparison (LIST - IPEDS) (QUEX - LIST) (QUEX - IPEDS)
Analysis/subgroup n Percentdifference
n Percentdifference
n Percentdifference'
(standarderror)"
(standarderror)"
(standarderror)"
Part-time 602 24.2 681 3.7 688 22.4(12.2) (5.1) (10.1)
Full-time 647 11.1 684 4.4 746 14.1*(2.2) (2.9) (2.5)
Significant at .05.Standard errors assume simple random sampling.
Date of list collection. It was speculated that the lists received early in the listcollection process wereof higher quality. Institutions that submitted faculty lists earlier in the list collection process may havepossessed better record-keeping systems than those that submitted lists later and therefore would haveshown smaller discrepancies. The t-test displayed in Exhibit 2 -7 challenges this view. While it is truethat a closer correspondence between the LIST and QUEX counts can be observed in the earliest monthsof list collection, no discrepancy (either mean difference or mean percent difference) throughout the listcollection process reached statistical significance when compared to the null hypothesis of nodiscrepancy.
18673
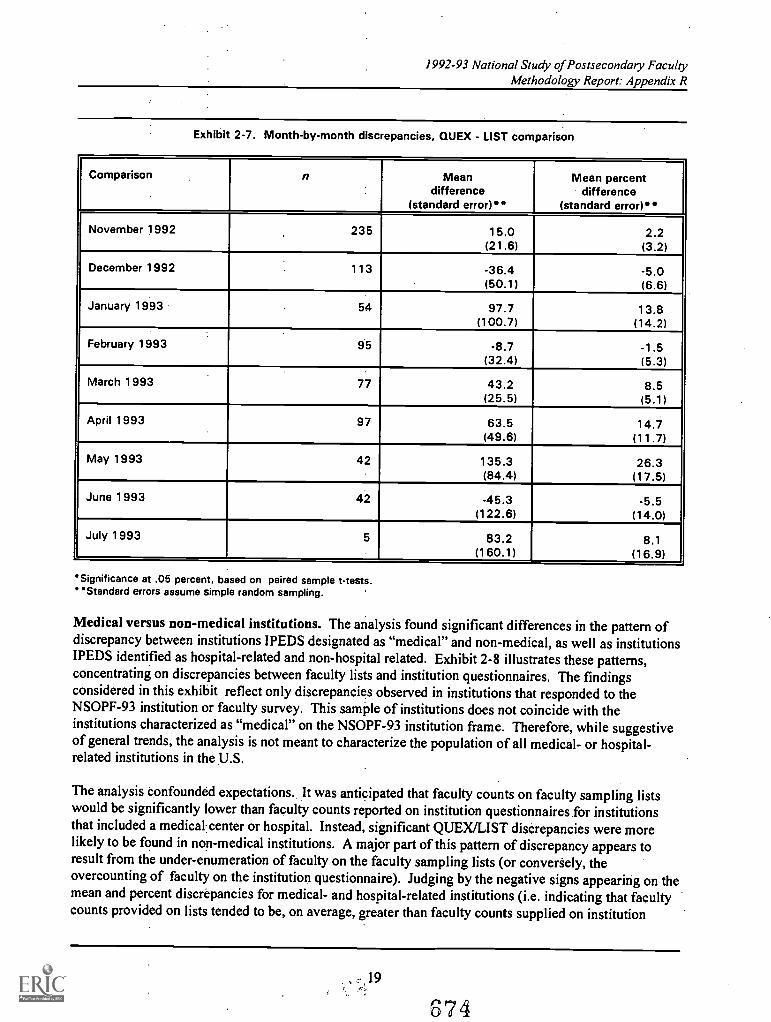
1992-93 National Study of Postsecondary FacultyMethodology Report: Appendix R
Exhibit 2-7. Month-by-month discrepancies, QUEX - LIST comparison
Comparison n Meandifference
(standard error)**
Mean percentdifference
(standard error)**
November 1992 235 15.0 2.2(21.6) (3.2)
December 1992 113 -36.4 -5.0(50.1) (6.6)
January 1993 54 97.7 13.8(100.7) (14.2)
February 1993 95 -8.7 -1.5(32.4) (5.3)
March 1993 77 43.2 8.5(25.5) (5.1)
April 1993 97 63.5 14.7(49.6) (11.7)
May 1993 42 135.3 26.3(84.4) (17.5)
June 1993 42 -45.3 -5.5(122.6) (14.0)
July 1993 5 83.2 8.1(160.1) (16.9)
Significance at .05 percent, based on paired sample t-tests."Standard errors assume simple random sampling.
Medical versus non-medical institutions. The analysis found significant differences in the pattern ofdiscrepancy between institutions IPEDS designated as "medical" and non-medical, as well as institutionsIPEDS identified as hospital-related and non-hospital related. Exhibit 2-8 illustrates these patterns,concentrating on discrepancies between faculty lists and institution questionnaires. The findingsconsidered in this exhibit reflect only discrepancies observed in institutions that responded to theNSOPF-93 institution or faculty survey. This sample of institutions does not coincide with theinstitutions characterized as "medical" on the NSOPF-93 institution frame. Therefore, while suggestiveof general trends, the analysis is not meant to characterize the population of all medical- or hospital-related institutions in the U.S.
The analysis confounded expectations. It was anticipated that faculty counts on faculty sampling listswould be significantly lower than faculty counts reported on institution questionnaires for institutionsthat included a medicalcenter or hospital. Instead, significant QUEX/LIST discrepancies were morelikely to be found in non-medical institutions. A major part of this pattern of discrepancy appears toresult from the under-enumeration of faculty on the faculty sampling lists (or conversely, theovercounting of faculty on the institution questionnaire). Judging by the negative signs appearing on themean and percent discrepancies for medical- and hospital-related institutions (i.e. indicating that facultycounts provided on lists tended to be, on average, greater than faculty counts supplied on institution
;.19
674
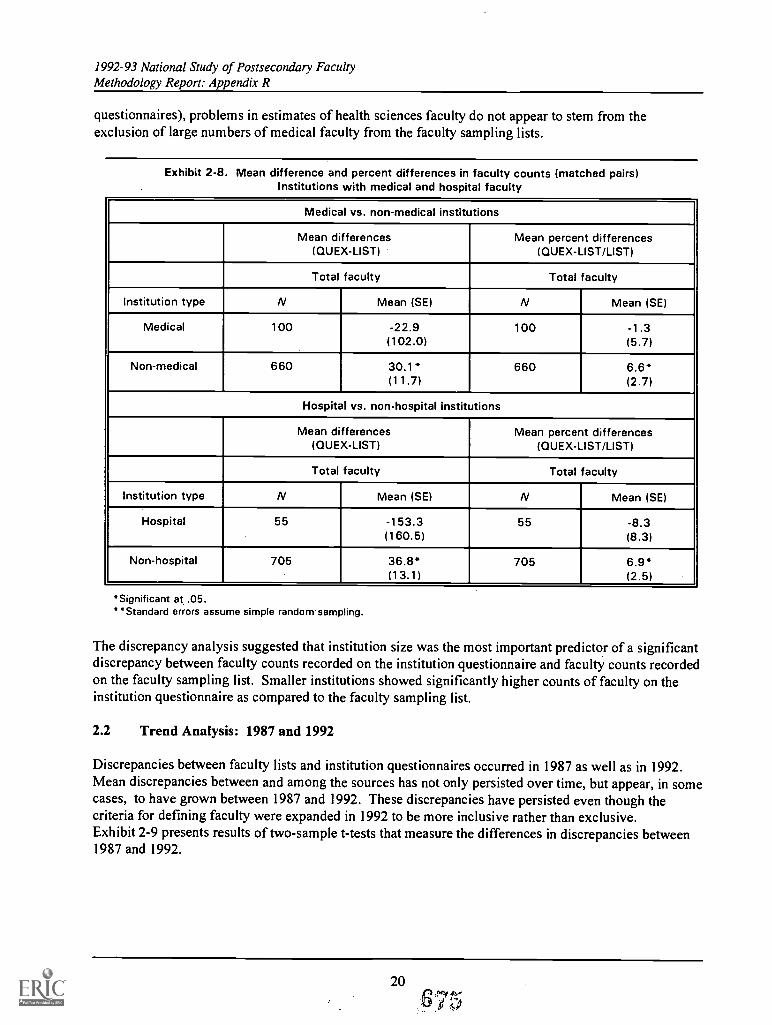
1992-93 National Study of Postsecondary FacultyMethodology Report: Appendix R
questionnaires), problems in estimates of health sciences faculty do not appear to stem from theexclusion of large numbers of medical faculty from the faculty sampling lists.
Exhibit 2-8. Mean difference and percent differences in faculty counts (matched pairs)Institutions with medical and hospital faculty
Medical vs. non-medical institutions
Mean differences(QUEX-LIST)
Mean percent differences(QUEX-LIST/LIST)
Total faculty Total faculty
Institution type N Mean (SE) N Mean (SE)
Medical 100 -22.9(102.0)
100 -1.3(5.7)
Non-medical 660 30.1*(11.7)
660 6.6*(2.7)
Hospital vs. non-hospital institutions
Mean differences(QUEX-LIST)
Mean percent differences(QUEX-LIST/LIST)
Total faculty Total faculty
Institution type N Mean (SE) N Mean (SE)
Hospital 55 -153.3(160.5)
55 -8.3(8.3)
Non-hospital 705 36.8(13.1)
705 6.9*(2.5)
Significant at .05.Standard errors assume simple random sampling.
The discrepancy analysis suggested that institution size was the most important predictor of a significantdiscrepancy between faculty counts recorded on the institution questionnaire and faculty counts recordedon the faculty sampling list. Smaller institutions showed significantly higher counts of faculty on theinstitution questionnaire as compared to the faculty sampling list.
2.2 Trend Analysis: 1987 and 1992
Discrepancies between faculty lists and institution questionnaires occurred in 1987 as well as in 1992.Mean discrepancies between and among the sources has not only persisted over time, butappear, in somecases, to have grown between 1987 and 1992. These discrepancies have persisted even though thecriteria for defining faculty were expanded in 1992 to be more inclusive rather than exclusive.Exhibit 2-9 presents results of two-sample t-tests that measure the differences in discrepancies between1987 and 1992.
20
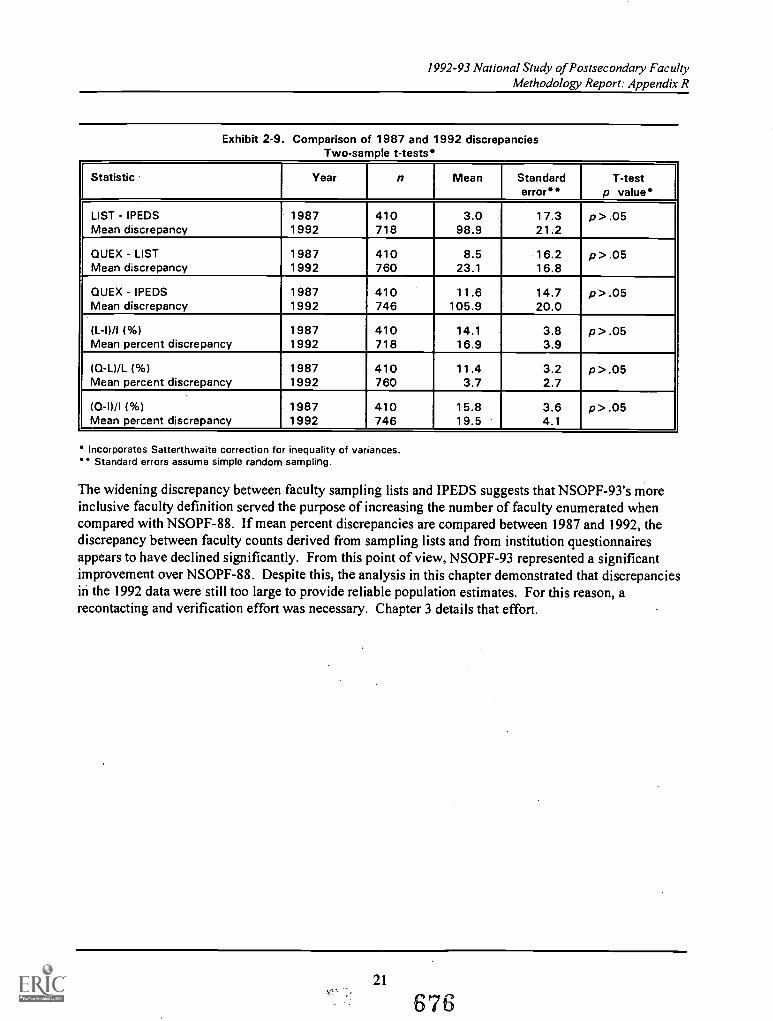
1992-93 National Study of Postsecondary FacultyMethodology Report: Appendix R
Exhibit 2-9. Comparison of 1987 and 1992 discrepanciesTwo-sample t-tests"
Statistic Year n Mean Standarderror**
T-testp value*
LIST - IPEDS 1987 410 3.0 17.3 p>.05Mean discrepancy 1992 718 98.9 21.2
QUEX - LIST 1987 410 8.5 16.2 p >.05Mean discrepancy 1992 760 23.1 16.8
QUEX - IPEDS 1987 410 11.6 14.7 p>.05Mean discrepancy 1992 746 105.9 20.0
(L-1) /I (%) 1987 410 14.1 3.8
_
p >.05Mean percent discrepancy 1992 718 16.9 3.9
(Q -L) /L (%) 1987 410 11.4 3.2 p >.05Mean percent discrepancy 1992 760 3.7 2.7
(Q -I) /I (%) 1987 410 15.8 3.6 p >.05Mean percent discrepancy 1992 746 19.5 4.1
Incorporates Satterthwaite correction for inequality of variances.Standard errors assume simple random sampling.
The widening discrepancy between faculty sampling lists and IPEDS suggests that NSOPF-93's moreinclusive faculty definition served the purpose of increasing the number of faculty enumerated whencompared with NSOPF-88. If mean percent discrepancies are compared between 1987 and 1992, thediscrepancy between faculty counts derived from sampling lists and from institution questionnairesappears to have declined significantly. From this point of view, NSOPF-93 represented a significantimprovement over NSOPF-88. Despite this, the analysis in this chapter demonstrated that discrepanciesin the 1992 data were still too large to provide reliable population estimates. For this reason, arecontacting and verification effort was necessary. Chapter 3 details that effort.
21
676
1992-93 National Study of Postsecondary FacultyMethodology Report: Appendix R
Chapter III. Retrieval, Verification, and Reconciliation
This chapter discusses the effort to recontact NSOPF-93 participating institutions that 1) hadQUEX/LIST discrepancies of 10 percent or more in their faculty estimates; and 2) were designated byNCES as including medical schools or hospitals. The recontact effort's objective was to determinewhich set of faculty estimates was correct (QUEX, LIST or, in some instances, a third set of estimates),and to determine the reasons for the original reporting discrepancies.
3.1 Identifying Institutions for Retrieval and Reconciliation
Discrepancies of 10 percent or more between faculty counts derived from the institution-providedsampling list of faculty (LIST) and the faculty counts provided in the institution questionnaire (QUEX)were identified and sorted according to the magnitude of the discrepancy. Faculty lists furnished countsfor total faculty, full-time faculty, and part-time faculty. The institution questionnaire reported separatecounts of each of four types of faculty in the institution: full-time instructional faculty, full-timenoninstructional faculty, part-time instructional faculty, and part-time noninstructional faculty. For thediscrepancy analysis, institution questionnaire (i.e., QUEX) counts for full-time and part-time facultywere derived by adding together instructional and non-instructional faculty for each type of facultyemployment status (i.e., full-time, part-time). Then total faculty counts were derived by adding togetherQUEX counts for full-time and part-time faculty.
Of the 760 ("matched") institutions which provided both a completed institution questionnaire and a listof faculty, 450 (59 percent) showed a discrepancy of 10 percent or more between the questionnaire andthe list. All 120 institutions (of the 817 participating institutions) designated by NCES as affiliated withhospitals or medical centers were included in the recontacting effort. Of these institutions, 61 wereincluded in the set of institutions with discrepancies of 10 percent or more. Therefore, the sample ofinstitutions selected for recontact totaled 509, which included 59 institutions employing health sciencesfaculty which had less than a 10 percent discrepancy. These 509 represented 62.3 percent of the 817institutions whose faculty members participated in the NSOPF-93 faculty survey.
3.2 Review of Hard Copy Lists
Hard copy lists and other documentation were reviewed to validate new information supplied byinstitutions, to assist institutions in resolving discrepancies, or whenever evidence suggested a data entryor list processing error that could be corrected by a review of the hard copy documents.
Lists of faculty and accompanying documentation supplied by institutions NCES identified as havingmedical centers and hospitals were reviewed to check for the presence of eligible teaching, research, andclinical health sciences faculty in the relevant specialties. If the inclusion of health sciences facultycould not be determined, this issue was reviewed with the institution's staff.
23
677
1992-93 National Study of Postsecondary FacultyMethodology Report: Appendix R
3.3 Telephone Follow-up for Retrieval and Reconciliation
Five telephone interviewers were trained to recontact institutions to retrieve accurate estimates for full-and part-time faculty, and to determine the reason(s) for the discrepancy between the list andquestionnaire data.
Training included both a general project overview and a briefing on the problems encountered in theoriginal data collection effort for the list and institution questionnaire. Because the institutionquestionnaire respondent was the most recent contact with the institution, interviewers were instructed tobegin their follow-up with him or her. If necessary, interviewers also, contacted the InstitutionalCoordinator (the institution-assigned person who oversaw production of the faculty list, if a differentperson from the institution questionnaire respondent), staff in human resources or personnel, the directorof institutional research, or other contacts suggested by informants or listed among documents asassisting in the preparation of the list and/or questionnaire.
A "Discrepancy Analysis Summary" (See Exhibit 3-1) was produced for each institution targeted forfollow-up and reconciliation. This summary provided the following information for each institution:
the name and UNITID of each institution;
the total percentage of the discrepancy; and
totals of full- and part-time faculty for both the list and the questionnaire.
The form also provided a place for interviewers to correct list and/or questionnaire estimates accordingto information provided by each institution and/or to code which set of figures was more accurate, or toinsert a new set of estimates. A set of codes was provided for the most common reasons fordiscrepancies; a space was also provided for further comments or explanations. Three additional codeswere added to the codes listed on the Discrepancy Analysis Summary form during the field period: Code12 ("layoffs/downsizing" between list and questionnaire), Code 35 (non-teaching, non-faculty includedin LIST or QUEX), and Code 62 (full-time equivalents [FTEs] used instead of headcount onquestionnaire). Contacts (by fax and E-mail, as well as telephone) were recorded on a separate Record ofCalls (see Exhibit 3-2).
Additional information useful in assessing the list and questionnaire data (e.g., the dates the list andquestionnaire were completed), as well as hard copy list documentation was provided.
The field period for this reconciliation effort extended from January 3, 1996 through early March, 1996.An earlier start was precluded because most institutions were closed for the Christmas holidays.
24
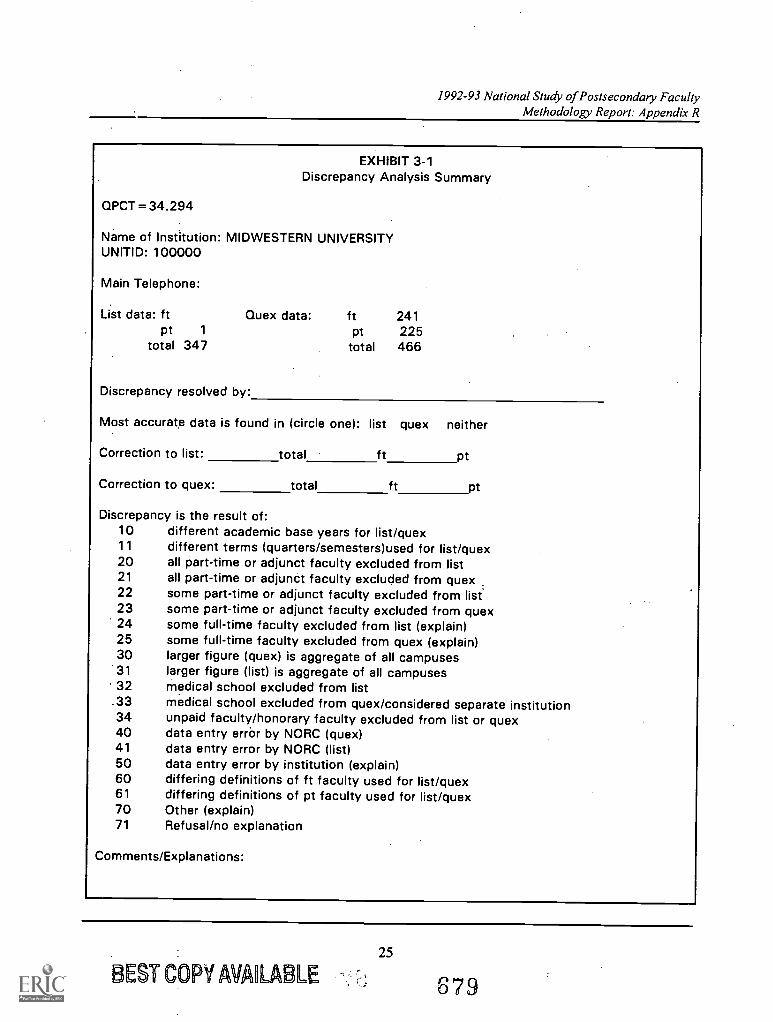
1992-93 National Study of Postsecondary FacultyMethodology Report: Appendix R
EXHIBIT 3-1Discrepancy Analysis Summary
QPCT = 34.294
Name of Institution: MIDWESTERN UNIVERSITYUNITID: 100000
Main Telephone:
List data: ft Quex data: ft 241pt 1 pt 225
total 347 total 466
Discrepancy resolved by:
Most accurate data is found in (circle one): list quex neither
Correction to list: total ft pt
Correction to quex: total ft pt
Discrepancy is the result of:10 different academic base years for list/quex11 different terms (quarters/semesters)used for list/quex20 all part-time or adjunct faculty excluded from list21 all part-time or adjunct faculty excluded from quex22 some part-time or adjunct faculty excluded from list23 some part-time or adjunct faculty excluded from quex24 some full-time faculty excluded from list (explain)25 some full-time faculty excluded from quex (explain)30 larger figure (quex) is aggregate of all campuses31 larger figure (list) is aggregate of all campuses32 medical school excluded from list
.33 medical school excluded from quex/considered separate institution34 unpaid faculty/honorary faculty excluded from list or quex40 data entry error by NORC (quex)41 data entry error by NORC (list)50 data entry error by institution (explain)60 differing definitions of ft faculty used for list/quex61 differing definitions of pt faculty used for list/quex70 Other (explain)71 Refusal/no explanation
Comments/Explanations:
25
BEST COPY AVAILABLE 879
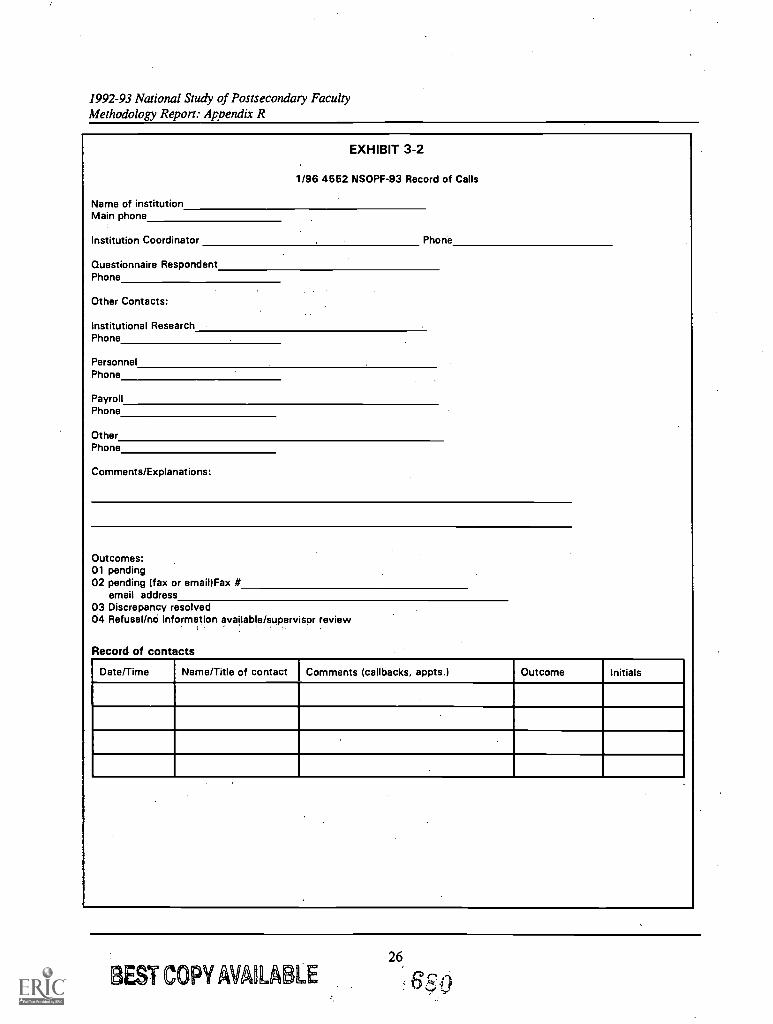
1992-93 National Study of Postsecondary FacultyMethodology Report: Apoendix R
EXHIBIT 3-2
1/96 4552 NSOPF-93 Record of Calls
Name of institutionMain phone
Institution Coordinator Phone
Questionnaire RespondentPhone
Other Contacts:
Institutional ResearchPhone
PersonnelPhone
PayrollPhone
OtherPhone
Comments/Explanations:
Outcomes:01 pending02 pending (fax or email)Fax #
email address03 Discrepancy resolved04 Refusal/no information available/supervisor review
Record of contacts
Date/Time Name/Title of contact Comments (callbacks, appts.) Outcome Initials
REST COPY MIA !!! LE26
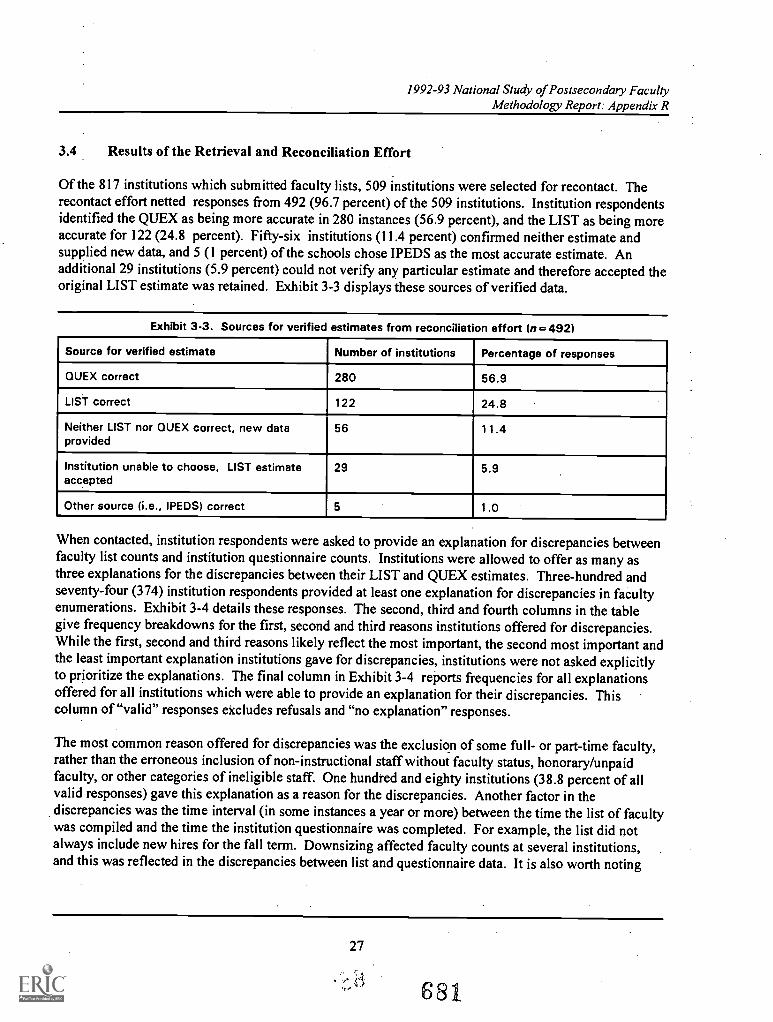
1992-93 National Study of Postsecondary FacultyMethodology Report: Appendix R
3.4 Results of the Retrieval and Reconciliation Effort
Of the 817 institutions which submitted faculty lists, 509 institutions were selected for recontact. Therecontact effort netted responses from 492 (96.7 percent) of the 509 institutions. Institution respondentsidentified the QUEX as being more accurate in 280 instances (56.9 percent), and the LIST as being moreaccurate for 122 (24.8 percent). Fifty-six institutions (11.4 percent) confirmed neither estimate andsupplied new data, and 5 (1 percent) of the schools chose IPEDS as the most accurate estimate. Anadditional 29 institutions (5.9 percent) could not verify any particular estimate and therefore accepted theoriginal LIST estimate was retained. Exhibit 3-3 displays these sources of verified data.
Exhibit 3-3. Sources for verified estimates from reconciliation effort In = 492)
Source for verified estimate Number of institutions Percentage of responses
QUEX correct 280 56.9
LIST correct 122 24.8
Neither LIST nor QUEX correct, new dataprovided
56 11.4
Institution unable to choose, LIST estimateaccepted
29 5.9
Other source (i.e., IPEDS) correct 5 1.0
When contacted, institution respondents were asked to provide an explanation for discrepancies betweenfaculty list counts and institution questionnaire counts. Institutions were allowed to offer as many asthree explanations for the discrepancies between their LIST and QUEX estimates. Three-hundred andseventy-four (374) institution respondents provided at least one explanation for discrepancies in facultyenumerations. Exhibit 3-4 details these responses. The second, third and fourth columns in the tablegive frequency breakdowns for the first, second and third reasons institutions offered for discrepancies.While the first, second and third reasons likely reflect the most important, the second most important andthe least important explanation institutions gave for discrepancies, institutions were not asked explicitlyto prioritize the explanations. The final column in Exhibit 3-4 reports frequencies for all explanationsoffered for all institutions which were able to provide an explanation for their discrepancies. Thiscolumn of "valid" responses excludes refusals and "no explanation" responses.
The most common reason offered for discrepancies was the exclusion ofsome full- or part-time faculty,rather than the erroneous inclusion of non-instructional staff without faculty status, honorary/unpaidfaculty, or other categories of ineligible staff. One hundred and eighty institutions (38.8 percent of allvalid responses) gave this explanation as a reason for the discrepancies. Another factor in thediscrepancies was the time interval (in some instances a year or more) between the time the list of facultywas compiled and the time the institution questionnaire was completed. For example, the list did notalways include new hires for the fall term. Downsizing affected faculty counts at several institutions,and this was reflected in the discrepancies between list and questionnaire data. It is also worth noting
27
681
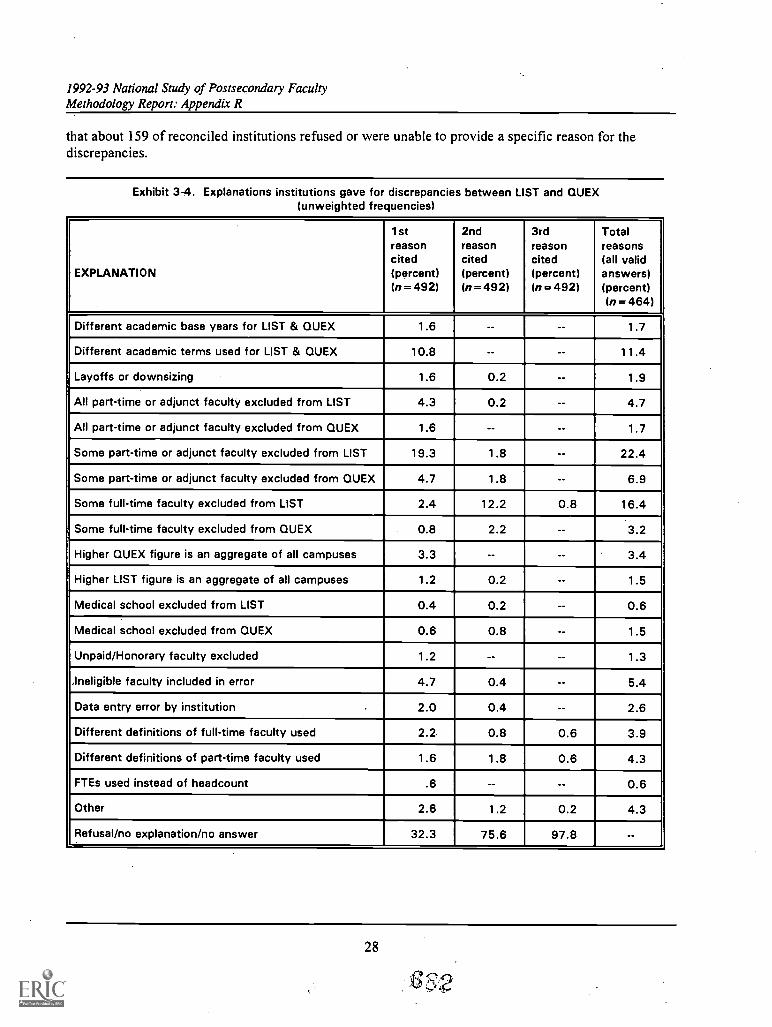
1992-93 National Study of Postsecondary FacultyMethodology Report: Appendix R
that about 159 of reconciled institutions refused or were unable to provide a specific reason for thediscrepancies.
Exhibit 3-4. Explanations institutions gave for discrepancies between LIST and QUEX(unweighted frequencies)
EXPLANATION
1streasoncited(percent)(n = 492)
2ndreasoncited(percent)(n =492)
3rdreasoncited(percent)(n = 492)
Totalreasons(all validanswers)(percent)(n = 464)
Different academic base years for LIST & QUEX 1.6 -- -- 1.7
Different academic terms used for LIST & QUEX 10.8 -- 11.4
Layoffs or downsizing 1.6 0.2 -- 1.9
All part-time or adjunct faculty excluded from LIST 4.3 0.2 -- 4.7
All part-time or adjunct faculty excluded from QUEX 1.6 -- -- 1.7
Some part-time or adjunct faculty excluded from LIST 19.3 1.8 -- 22.4
Some part-time or adjunct faculty excluded from QUEX 4.7 1.8 6.9
Some full-time faculty excluded from LIST 2.4 12.2 0.8 16.4
Some full-time faculty excluded from QUEX 0.8 2.2 3.2
Higher QUEX figure is an aggregate of all campuses 3.3 -- 3.4
Higher LIST figure is an aggregate of all campuses 1.2 0.2 -- 1.5
Medical school excluded from LIST 0.4 0.2 -- 0.6
Medical school excluded from QUEX 0.6 0.8 -- 1.5
Unpaid/Honorary faculty excluded 1.2 -- -- 1.3
ineligible faculty included in error 4.7 0.4 -- 5.4
Data entry error by institution 2.0 0.4 -- 2.6
Different definitions of full-time faculty used 2.2 0.8 0.6 3.9
Different definitions of part-time faculty used 1.6 1.8 0.6 4.3
FTEs used instead of headcount .6 -- -- 0.6
Other 2.6 1.2 0.2 4.3
Refusal/no explanation/no answer 32.3 75.6 97.8 --
28
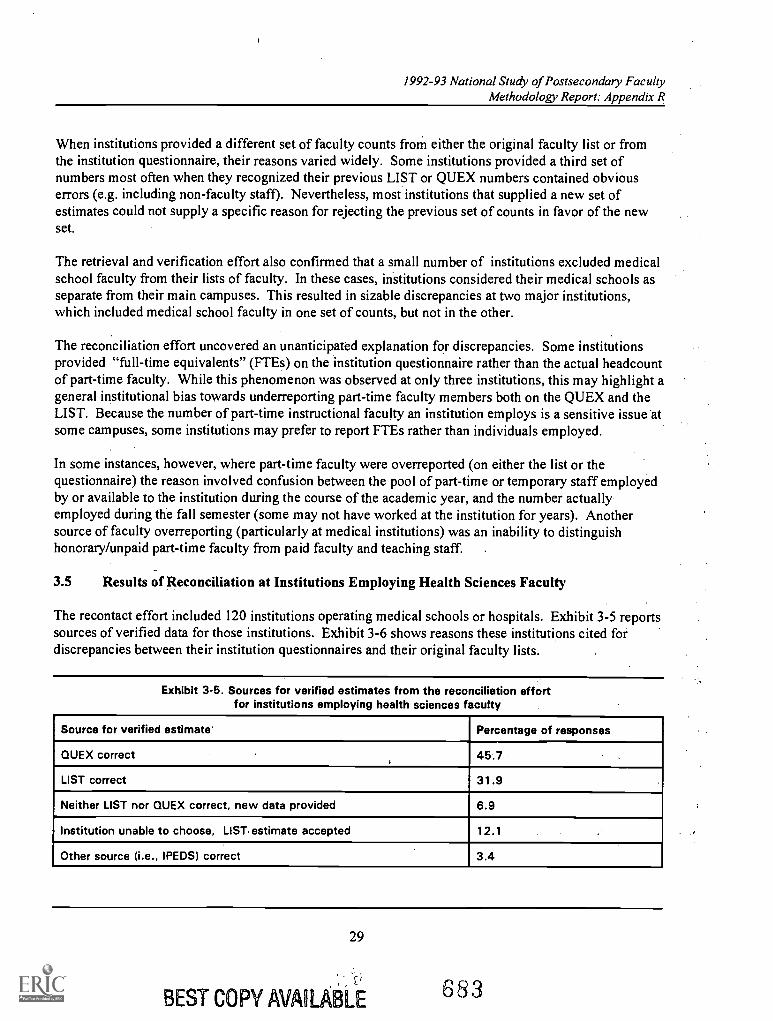
1992-93 National Study of Postsecondary FacultyMethodology Report: Appendix R
When institutions provided a different set of faculty counts from either the original faculty list or fromthe institution questionnaire, their reasons varied widely. Some institutions provided a third set ofnumbers most often when they recognized their previous LIST or QUEX numbers contained obviouserrors (e.g. including non-faculty staff). Nevertheless, most institutions that supplied a new set ofestimates could not supply a specific reason for rejecting the previous set of counts in favor of the newset.
The retrieval and verification effort also confirmed that a small number of institutions excluded medicalschool faculty from their lists of faculty. In these cases, institutions considered their medical schools asseparate from their main campuses. This resulted in sizable discrepancies at two major institutions,which included medical school faculty in one set of counts, but not in the other.
The reconciliation effort uncovered an unanticipated explanation for discrepancies. Some institutionsprovided "full-time equivalents" (FTEs) on the institution questionnaire rather than the actual headcountof part-time faculty. While this phenomenon was observed at only three institutions, this may highlight ageneral institutional bias towards underreporting part-time faculty members both on the QUEX and theLIST. Because the number of part-time instructional faculty an institution employs is a sensitive issue' atsome campuses, some institutions may prefer to report FTEs rather than individuals employed.
In some instances, however, where part-time faculty were overreported (on either the list or thequestionnaire) the reason involved confusion between the pool of part-time or temporary staff employedby or available to the institution during the course of the academic year, and the number actuallyemployed during the fall semester (some may not have worked at the institution for years). Anothersource of faculty overreporting (particularly at medical institutions) was an inability to distinguishhonorary/unpaid part-time faculty from paid faculty and teaching staff. .
3.5 Results of Reconciliation at Institutions Employing Health Sciences Faculty
The recontact effort included 120 institutions operating medical schools or hospitals. Exhibit 3-5 reportssources of verified data for those institutions. Exhibit 3-6 shows reasons these institutions cited fordiscrepancies between their institution questionnaires and their original faculty lists.
Exhibit 3-5. Sources for verified estimates from the reconciliation effortfor institutions employing health sciences faculty
Source for verified estimate' Percentage of responses
QUEX correct 45.7 .
LIST correct 31.9
Neither LIST nor QUEX correct, new data provided 6.9
Institution unable to choose, LIST. estimate accepted 12.1
Other source (i.e., IPEDS) correct 3.4
29
BEST COPY AVAOLABLE 683
1992-93 National Study of Postsecondary FacultyMethodology Report: Appendix R
As shown in Exhibit 3-6, the most common explanation for discrepancies between counts on faculty listsand institution questionnaires for institutions with health sciences faculty was the exclusion of some part-time or full-time faculty from the list. This explanation accounted for nearly 30 percent of all explaineddiscrepancies. Generally, institutions were more likely to exclude eligible faculty than to includeineligible faculty.
Some special problems appeared when data were collected from institutions with health sciences faculty.Medical schools are more likely to have complicated payrolls than other institutions and often do notdefine faculty in traditional terms. As noted earlier, some institutions also find it difficult to distinguishbetween unpaid "honorary" faculty and those receiving a regular paycheck. "Visiting" faculty can bedefined as such for teaching no more than a single lecture (and again may not be paid).
In some cases, institutions may also find it difficult to distinguish "full-time" and "part-time" staff. Forexample, at one hospital-affiliated medical school, any faculty member paid with institutional (ratherthan hospital) funds is considered full-time, though the majority of faculty members spend most of theirtime in private practice and would be considered part-time at most other institutions. For this particularinstitution, all faculty were listed as part-time on their list of faculty, yet were reported as full-time on theinstitution questionnaire.
Ten large institutions considered their medical school a separate entity and therefore did not includemedical faculty in their list and/or questionnaires. Three institutions excluded their medical school fromtheir faculty sampling lists and seven excluded their medical school from their institution questionnaire.In addition, because faculty estimates must sometimes be supplied by individual schools withininstitutions (e.g., Surgery, Dentistry, Osteopathy, etc.), two institutions excluded one or more individualschools that did not supply data in a timely fashion, or which were located at a separate campus.
30
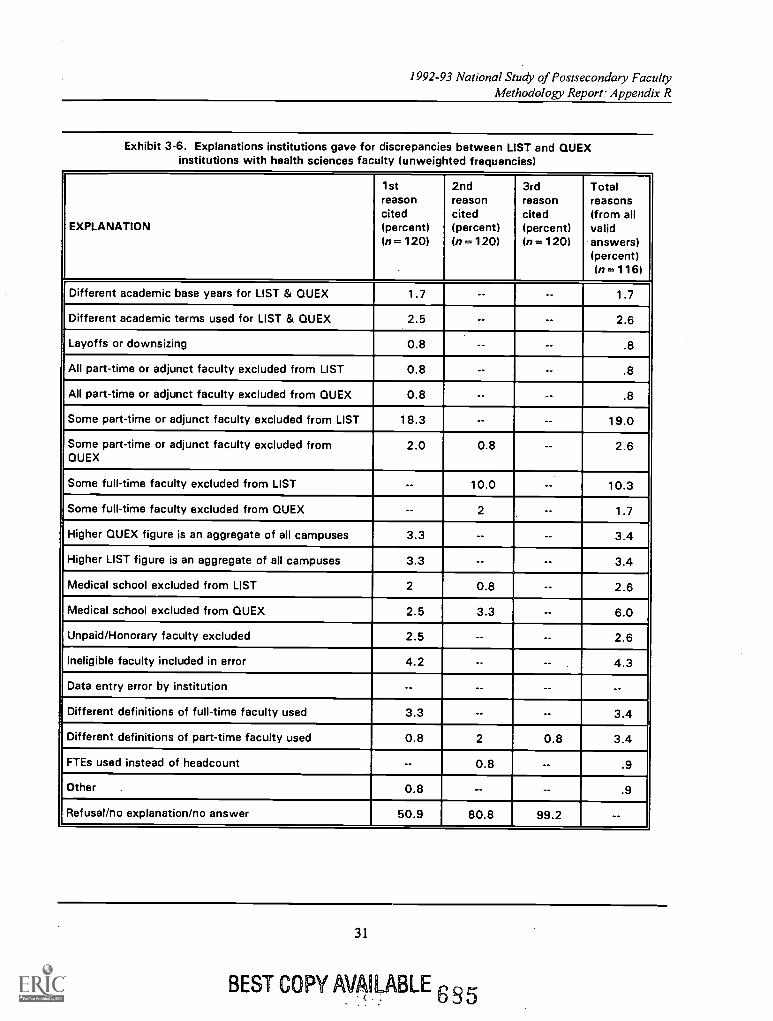
1992-93 National Study of Postsecondary FacultyMethodology Report: Appendix R
Exhibit 3-6. Explanations institutions gave for discrepancies between LIST and QUEXinstitutions with health sciences faculty (unweighted frequencies)
EXPLANATION
1streasoncited(percent)In =120)
2ndreasoncited(percent)(n =120)
3rdreasoncited(percent)(n = 120)
Totalreasons(from allvalidanswers)(percent)(n = 116)
Different academic base years for LIST & QUEX 1.7 1.7
Different academic terms used for LIST & QUEX 2.5 -- 2.6
Layoffs or downsizing 0.8 -- -- .8
All part-time or adjunct faculty excluded from LIST 0.8 -- -- .8
All part-time or adjunct faculty excluded from QUEX 0.8 -- .8
Some part-time or adjunct faculty excluded from LIST 18.3 -- -- 19.0
Some part-time or adjunct faculty excluded fromQUEX
2.0 0.8 -- 2.6
Some full-time faculty excluded from LIST -- 10.0 -- 10.3
Some full-time faculty excluded from QUEX 2 1.7
Higher QUEX figure is an aggregate of all campuses 3.3 -- -- 3.4
Higher LIST figure is an aggregate of all campuses 3.3 -- -- 3.4
Medical school excluded from LIST 2 0.8 2.6
Medical school excluded from QUEX 2.5 3.3 6.0
Unpaid/Honorary faculty excluded 2.5 -- -- 2.6
Ineligible faculty included in error 4.2 -- -- 4.3
Data entry error by institution -- -- -- --
Different definitions of full-time faculty used 3.3 -- 3.4
Different definitions of part-time faculty used 0.8 2 0.8 3.4
FTEs used instead of headcount -- 0.8 -- .9
Other 0.8 -- -- .9
Refusal/no explanation/no answer 50.9 80.8 99.2 --
31
BEST COPY NAMABLE 685
1992-93 National Study of Postsecondary FacultyMethodology Report: Appendix R
A comparison of the data presented in these exhibits with the data presented in Exhibits 3-3 and 3-4elicits the similarities between the subset of institutions affiliated with medical schools or hospitals andthe entire group of recontacted institutions. Both sets of institutions tended to verify institutionquestionnaire faculty counts over other possible sources of faculty counts, including their originalsampling lists. However, institutions affiliated with medical schools or hospitals showed a greatertendency to verify their original sampling lists than did the recontacted institutions as a whole. Nearly32 percent of institutions employing health sciences faculty verified the accuracy of their faculty listscompared to 24.8 percent of all recontacted institutions. This suggests that institutions affiliated withmedical schools or hospitals prepared more complete and inclusive lists than other institutions.
When reasons for discrepancies are compared, it is clear that health sciences institutions did not differgreatly from the entire set of recontacted institutions. The chief reasons for discrepancies for both sets ofinstitutions reported were the same: the exclusion of some part-time or full-time faculty from originalsampling lists. However, institutions employing health sciences faculty were much less likely than allrecontacted institutions to cite "different academic terms used for LIST and QUEX" as a discrepancyexplanation. A total of 11.4 percent of all recontacted institutions reported this reason for theirdiscrepancy. In comparison, only 2.6 percent of institutions affiliated with medical schools or hospitalschose this reason for their discrepancy.
3.6 Reestimating Faculty Population Based on the Reconciliation Effort
Based on revised faculty counts institutions provided during the reconciliation effort, NORC produced"best estimates" of the national faculty population. This process used as its starting database theinstitution-level faculty counts for full-time, part-time, and total faculty that the 817 participatinginstitutions reported on their original faculty lists. Although data for the total number of faculty wereavailable for all of the 817 institutions, in 84 cases, institutions that supplied a total faculty number didnot supply a breakdown of the total into full-time and part-time components. To overcome this problem,a two-step procedure for deriving best estimates was used: first, deriving best estimates for total facultyand, second, deriving best estimates for full-time faculty. Best estimates for part-time faculty weresimply calculated by subtracting the number of full-time faculty from the total number of faculty at eachinstitution. Chapters 3 and 10 of the 1993 National Study of Postsecondary Faculty: MethodologyReport [NCES 97-467] provide technical documentation for the creation of best estimates andpoststratification of final faculty weights.
The recontacting and verification effort increased the total number of faculty enumerated on the facultylist by 15,541. When these best estimates were weighted by the first-stage institution weight, theyproduced an increase in the estimate of total faculty population of 54,298 faculty members nationwide inthe 492 reconciled institutions (representing a weighted estimate of 1,855 institutions). Exhibit 3-7illustrates this increase. It shows the difference between weighted estimates of total faculty calculatedfrom the original faculty list and weighted estimates of total faculty calculated from the "best estimates"based on the verified data for all reconciled institutions. Moreover, differences in weighted estimates arecrossed with the explanations institutions provided for their discrepancies. The figures cited in thecolumn marked "institutions" are the weighted frequencies of figures cited under "1st reason" in Exhibit3-4. Therefore, the table provides an illustration of the relative importance of each explanation to theincrease or decrease in the faculty population for the reconciled institutions.
32
1992-93 National Study of Postsecondary FacultyMethodology Report: Appendix R
By far, the most significant contribution to this increase in total faculty came from those institutions thatreported that they had failed to enumerate some part-time or adjunct faculty on their original faculty lists.As the exhibit illustrates, these institutions accounted for an increase in the national faculty populationestimate of 37,183 faculty members. What is more, the 3.3 percent of institutions that reported that theyhad excluded all part-time faculty from their original lists contributed an additional estimated 14,544faculty members to the total.
The reconciliation effort also called attention to institutions that included ineligible faculty on theiroriginal faculty lists. Almost 6 percent of institutions reported that they included ineligible faculty oneither the list or the questionnaire. As a result, these institutions lowered their "best estimate" of totalfaculty, producing a drop in weighted population estimates for these schools of 6,167 faculty members.Definitional problemsaccounting for different populations of full-time faculty on the list and on theinstitution questionnairemeant that, for 2.4 percent of the institutions, the original list includedineligible faculty. The best estimate correction lowered the national population estimate derived fromthese institutions by 4,475. An almost identical number of faculty (4,514) were dropped from totalpopulation estimates due to institution downsizing.
Even more striking were the institutions that explained their discrepancy by reporting that unpaid orhonorary faculty were excluded from either their institution questionnaire or their faculty list. Althoughthese institutions accounted for fewer than 1 percent of the weighted total number of reconciledinstitutions, they accounted for a subtraction of an estimate of 9,597 faculty members from the originalfaculty list. These schools tended to depend on large numbers of faculty employed by other institutions,such as hospitals or the military. Future cycles of NSOPF-93 will need to take into account specialcases, such as these institutions, when describing faculty eligibility rules for institution list preparers.
As mentioned earlier, 29.7 percent (weighted) of institutions refused or were unable to supply anexplanation for the discrepancy. However, these institutions accounted for a weighted estimate of only3,206 faculty members toward the net increase of 54,298 in faculty population estimated.
33
687
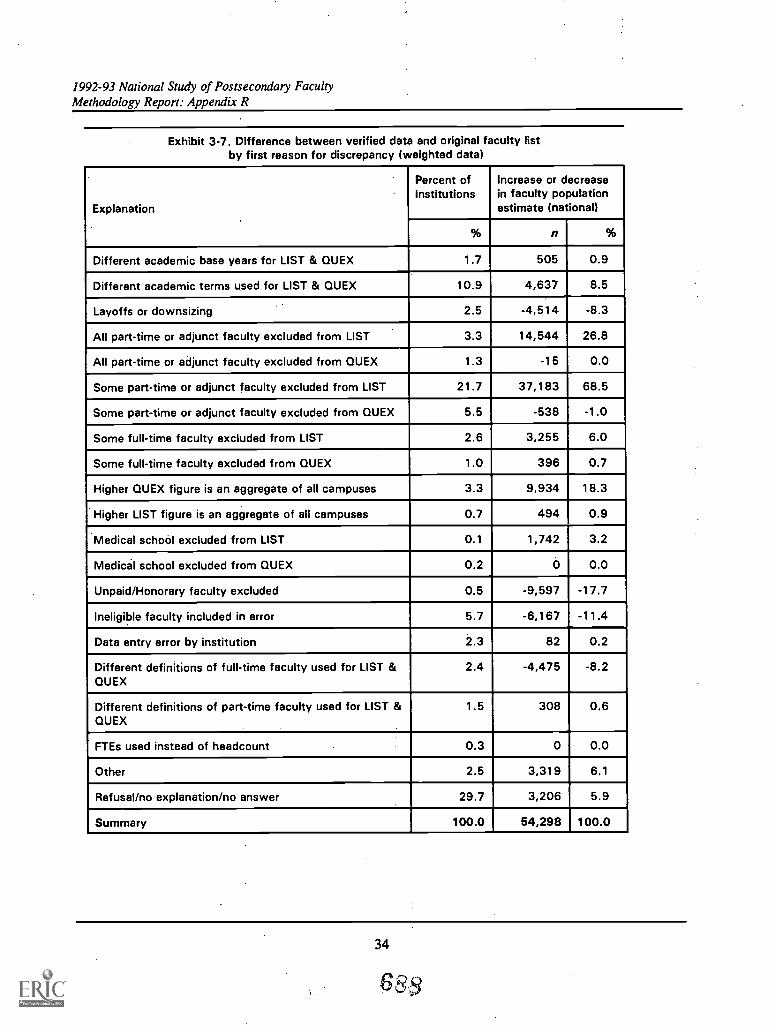
1992-93 National Study of Postsecondary FacultyMethodology Report: Appendix R
Exhibit 3-7. Difference between verified data and original faculty listby first reason for discrepancy (weighted data)
Explanation
Percent ofinstitutions
Increase or decreasein faculty populationestimate (national)
% n %
Different academic base years for LIST & QUEX 1.7 505 0.9
Different academic terms used for LIST & QUEX 10.9 4,637 8.5
Layoffs or downsizing 2.5 -4,514 -8.3
All part-time or adjunct faculty excluded from LIST 3.3 14,544 26.8
All part-time or adjunct faculty excluded from QUEX 1.3 -15 0.0
Some part-time or adjunct faculty excluded from LIST 21.7 37,183 68.5
Some part-time or adjunct faculty excluded from QUEX 5.5 -538 -1.0
Some full-time faculty excluded from LIST 2.6 3,255 6.0
Some full-time faculty excluded from QUEX 1.0 396 0.7
Higher QUEX figure is an aggregate of all campuses 3.3 9,934 18.3
Higher LIST figure is an aggregate of all campuses 0.7 494 0.9
Medical school excluded from LIST 0.1 1,742 3.2
Medical school excluded from QUEX 0.2 0 0.0
Unpaid/Honorary faculty excluded 0.5 -9,597 -17.7
Ineligible faculty included in error 5.7 -6,167 -11.4
Data entry error by institution 2.3 82 0.2
Different definitions of full-time faculty used for LIST &QUEX
2.4 -4,475 -8.2
Different definitions of part-time faculty used for LIST &QUEX
1.5 308 0.6
FTEs used instead of headcount 0.3 0 0.0
Other 2.5 3,319 6.1
Refusal/no explanation/no answer 29.7 3,206 5.9
Summary 100.0 54,298 100.0
34
6 $
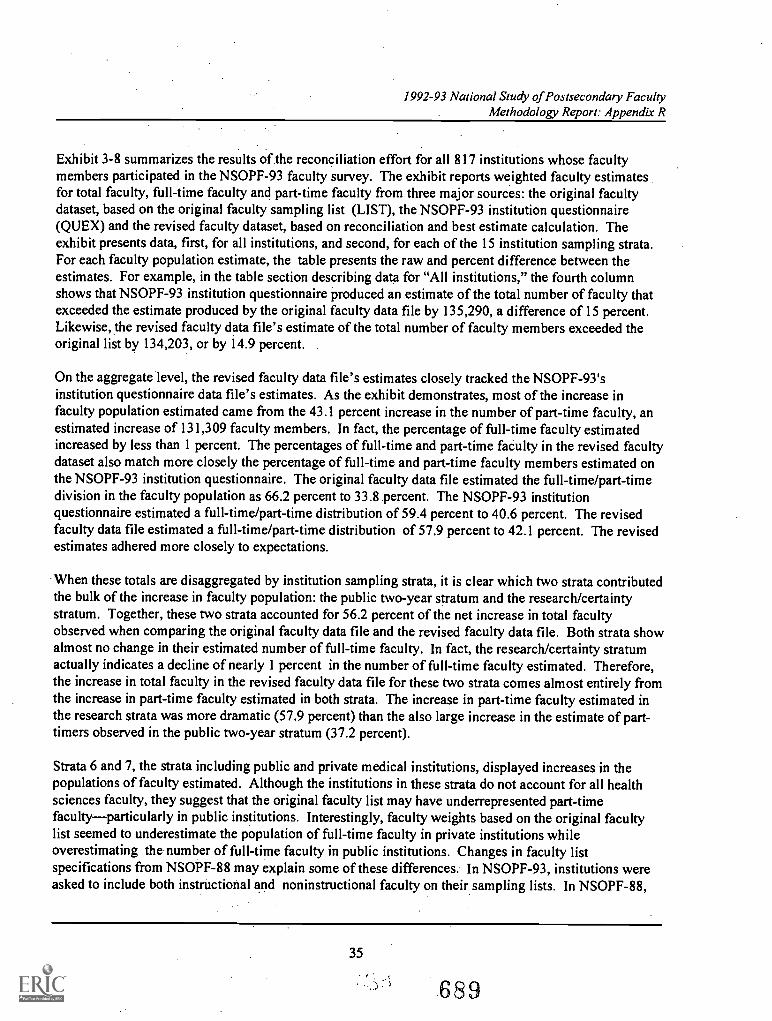
1992-93 National Study of Postsecondary FacultyMethodology Report: Appendix R
Exhibit 3-8 summarizes the results of the reconciliation effort for all 817 institutions whose facultymembers participated in the NSOPF-93 faculty survey. The exhibit reports weighted faculty estimatesfor total faculty, full-time faculty and part-time faculty from three major sources: the original facultydataset, based on the original faculty sampling list (LIST), the NSOPF-93 institution questionnaire(QUEX) and the revised faculty dataset, based on reconciliation and best estimate calculation. Theexhibit presents data, first, for all institutions, and second, for each of the 15 institution sampling strata.For each faculty population estimate, the table presents the raw and percent difference between theestimates. For example, in the table section describing data for "All institutions," the fourth columnshows that NSOPF-93 institution questionnaire produced an estimate of the total number of faculty thatexceeded the estimate produced by the original faculty data file by 135,290, a difference of 15 percent.Likewise, the revised faculty data file's estimate of the total number of faculty members exceeded theoriginal list by 134,203, or by 14.9 percent.
On the aggregate level, the revised faculty data file's estimates closely tracked the NSOPF-93'sinstitution questionnaire data file's estimates. As the exhibit demonstrates, most of the increase infaculty population estimated came from the 43.1 percent increase in the number of part-time faculty, anestimated increase of 131,309 faculty members. In fact, the percentage of full-time faculty estimatedincreased by less than 1 percent. The percentages of full-time and part-time faCulty in the revised facultydataset also match more closely the percentage of full-time and part-time faculty members estimated onthe NSOPF-93 institution questionnaire. The original faculty data file estimated the full-time/part-timedivision in the faculty population as 66.2 percent to 33.8 percent. The NSOPF-93 institutionquestionnaire estimated a full-time/part-time distribution of 59.4 percent to 40.6 percent. The revisedfaculty data file estimated a full-time/part-time distribution of 57.9 percent to 42.1 percent. The revisedestimates adhered more closely to expectations.
When these totals are disaggregated by institution sampling strata, it is clear which two strata contributedthe bulk of the increase in faculty population: the public two-year stratum and the research/certaintystratum. Together, these two strata accounted for 56.2 percent of the net increase in total facultyobserved when comparing the original faculty data file and the revised faculty data file. Both strata showalmost no change in their estimated number of full-time faculty. In fact, the research/certainty stratumactually indicates a decline of nearly 1 percent in the number of full-time faculty estimated. Therefore,the increase in total faculty in the revised faculty data file for these two strata comes almost entirely fromthe increase in part-time faculty estimated in both strata. The increase in part-time faculty estimated inthe research strata was more dramatic (57.9 percent) than the also large increase in the estimate of part-timers observed in the public two-year stratum (37.2 percent).
Strata 6 and 7, the strata including public and private medical institutions, displayed increases in thepopulations of faculty estimated. Although the institutions in these strata do not account for all healthsciences faculty, they suggest that the original faculty list may have underrepresented part-timefacultyparticularly in public institutions. Interestingly, faculty weights based on the original facultylist seemed to underestimate the population of full-time faculty in private institutions whileoverestimating the number of full-time faculty in public institutions. Changes in faculty listspecifications from NSOPF-88 may explain some of these differences. In NSOPF-93, institutions wereasked to include both instructional and noninstructional faculty on their sampling lists. In NSOPF-88,
35
689
1992-93 National Study of Postsecondary FacultyMethodology Report: Appendix R
institutions were asked only to list instructional faculty. NSOPF-93's new requirements may haveintroduced more variability into estimates based on original faculty lists as institutions faced greaterdifficulty accounting for noninstructional faculty. These difficulties may have had disproportionateimpacts on public and private institutions. Further investigation will be needed to discover theunderlying reasons for this difference between public and private medical institutions.
36
6 n
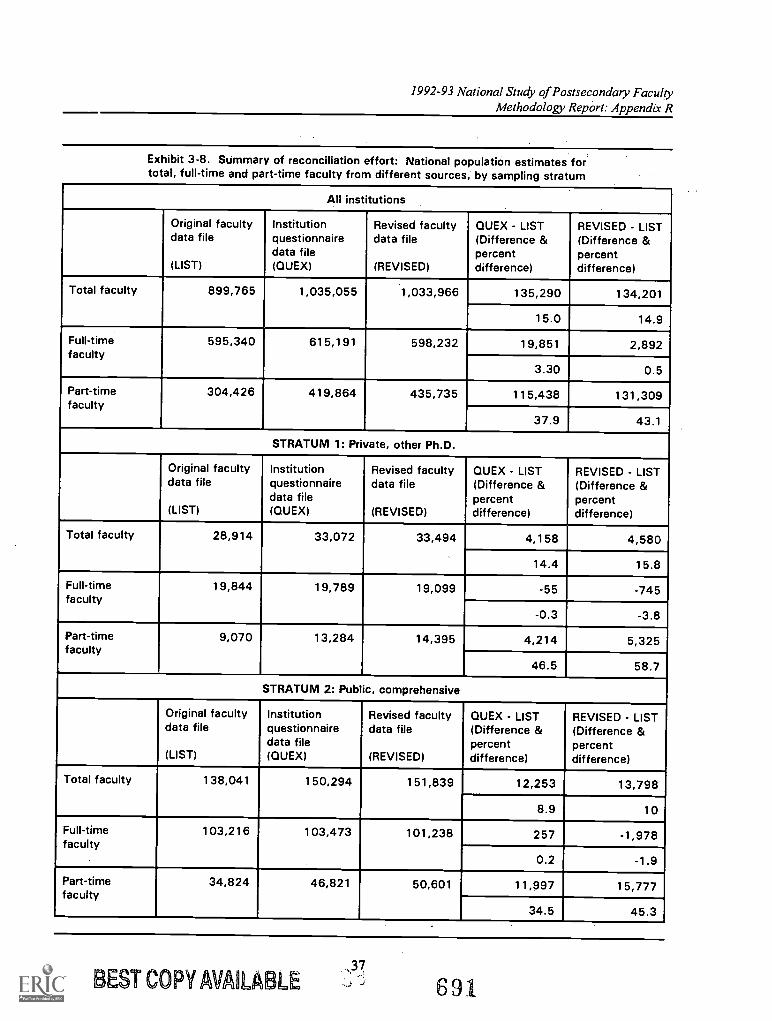
1992-93 National Study of Postsecondary FacultyMethodology Report: Appendix R
Exhibit 3-8. Summary of reconciliation effort: National population estimates fortotal, full-time and part-time faculty from different sources, by sampling stratum
All institutions
Original facultydata file
(LIST)
Institutionquestionnairedata file(QUEX)
Revised facultydata file
(REVISED)
QUEX - LIST(Difference &percentdifference)
REVISED - LIST(Difference &percentdifference)
Total faculty 899,765 1,035,055 1,033,966 135,290 134,201
15.0 14.9
Full-timefaculty
595,340 615,191 598,232 19,851 2,892
3.30 0.5
Part-timefaculty
304,426 419,864 435,735 115,438 131,309
37.9 43.1
STRATUM 1: Private, other Ph.D.
Original facultydata file
(LIST)
Institutionquestionnairedata file(QUEX)
Revised facultydata file
(REVISED)
QUEX - LIST(Difference &percentdifference)
REVISED - LIST(Difference &percentdifference)
Total faculty 28,914 33,072 33,494 4,158 4,580
14.4 15.8
Full-timefaculty
19,844 19,789 19,099 -55 -745
-0.3 -3.8
Part-timefaculty
9,070 13,284 14,395 4,214 5,325
46.5 58.7
STRATUM 2: Public, comprehensive
Original facultydata file
(LIST)
Institutionquestionnairedata file(QUEX)
Revised facultydata file
(REVISED)
QUEX - LIST(Difference &percentdifference)
REVISED - LIST(Difference &percentdifference)
Total faculty 138,041 150,294 151,839 12,253 13,798
8.9 10
Full-timefaculty
103,216 103,473 101,238 257 -1,978
0.2-
-1.9
Part-timefaculty
34,824 46,821 50,601 11,997 15,777
34.5 45.3
37BEST COPY AVAILABLE 691
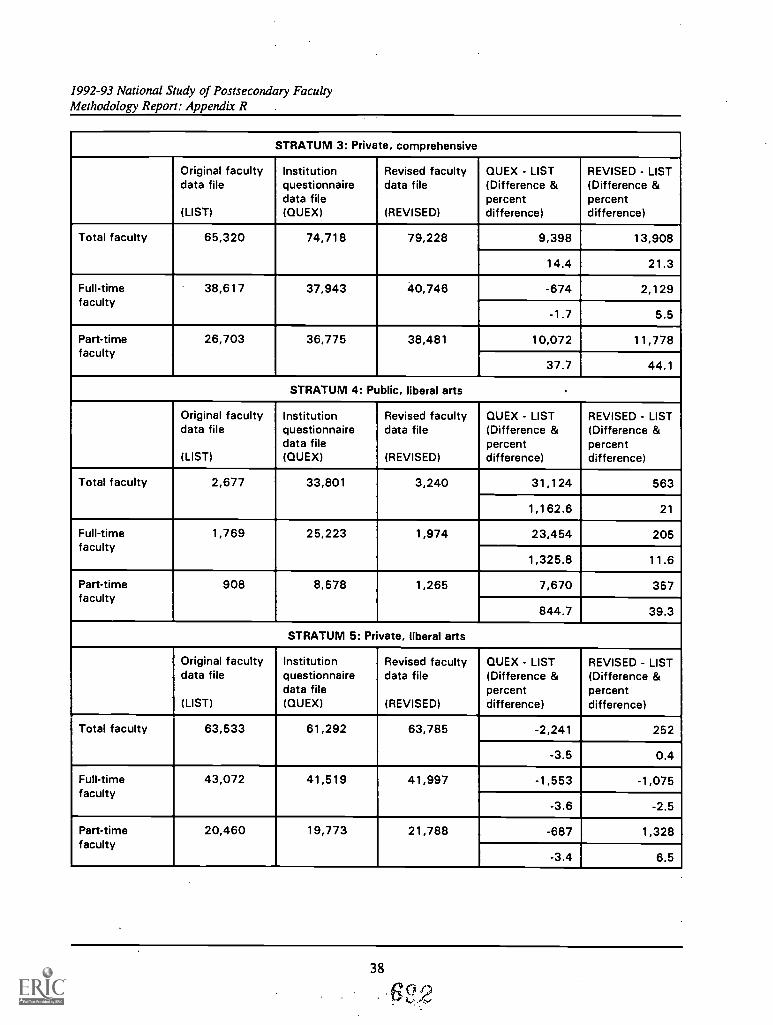
1992-93 National Study of Postsecondary FacultyMethodology Report: Appendix R .
STRATUM 3: Private, comprehensive
Original facultydata file
(LIST)
Institutionquestionnairedata file(QUEX)
Revised facultydata file
(REVISED)
QUEX - LIST(Difference &percentdifference)
REVISED - LIST(Difference &percentdifference)
Total faculty 65,320 74,718 79,228 9,398 13,908
14.4 21.3
Full-timefaculty
38,617 37,943 40,746 -674 2,129
-1.7 5.5
Part-timefaculty
26,703 36,775 38,481 10,072 11,778
37.7 44.1
STRATUM 4: Public, liberal arts .
Original facultydata file
(LIST)
Institutionquestionnairedata file(QUEX)
Revised facultydata file
(REVISED)
QUEX - LIST(Difference &percentdifference)
REVISED - LIST(Difference &percentdifference)
Total faculty 2,677 33,801 3,240 31,124 563
1,162.6 21
Full-timefaculty
1,769 25,223 1,974 23,454 205
1,325.8 11.6
Part-timefaculty
908 8,578 1,265 7,670 357
844.7 39.3
STRATUM 5: Private, liberal arts
Original facultydata file
(LIST)
Institutionquestionnairedata file(QUEX)
Revised facultydata file
(REVISED)
QUEX - LIST(Difference &percentdifference)
REVISED - LIST(Difference &percentdifference)
Total faculty 63,533 61,292 63,785 -2,241 252
-3.5 0.4
Full-timefaculty
43,072 41,519 41,997 -1,553 -1,075
-3.6 -2.5
Part-timefaculty
20,460 19,773 21,788 -687 1,328
-3.4 6.5
38
2
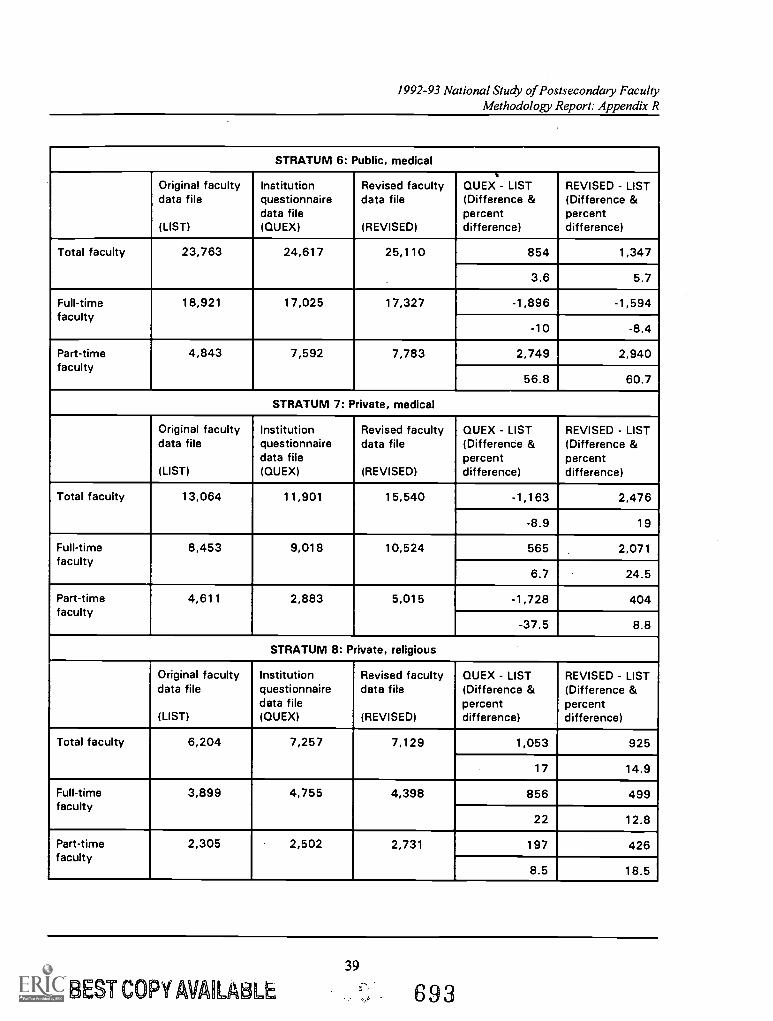
1992-93 National Study of Postsecondary FacultyMethodology Report: Appendix R
STRATUM 6: Public, medical
Original facultydata file
(LIST)
Institutionquestionnairedata file(QUEX)
Revised facultydata file
(REVISED)
QUEX - LIST(Difference &percentdifference)
REVISED - LIST(Difference &percentdifference)
Total faculty 23,763 24,617 25,110 854 1,347
3.6 5.7
Full-timefaculty
18,921 17,025 17,327 -1,896 -1,594
-10 -8.4
Part-timefaculty
4,843 7,592 7,783 2,749 2,940
56.8 60.7
STRATUM 7: Private, medical
Original facultydata file
(LIST)
Institutionquestionnairedata file(QUEX)
Revised facultydata file
(REVISED)
QUEX - LIST(Difference &percentdifference)
REVISED - LIST(Difference &percentdifference)
Total faculty 13,064 11,901 15,540 -1,163 2,476
-8.9 19
Full-timefaculty
8,453 9,018 10,524 565 2,071
6.7 24.5
Part-timefaculty
4,611 2,883 5,015 -1,728 404
-37.5 8.8
STRATUM 8: Private, religious
Original facultydata file
(LIST)
Institutionquestionnairedata file(QUEX)
Revised facultydata file
(REVISED)
QUEX - LIST(Difference &percentdifference)
REVISED - LIST(Difference &percentdifference)
Total faculty 6,204 7,257 7,129 1,053 925
17 14.9
Full-timefaculty
3,899 4,755 4,398 856 499
22 12.8
Part-timefaculty
2,305 2,502 2,731 197 426
8.5 18.5
39
BEST COPY AVAILABLE 6 9 3
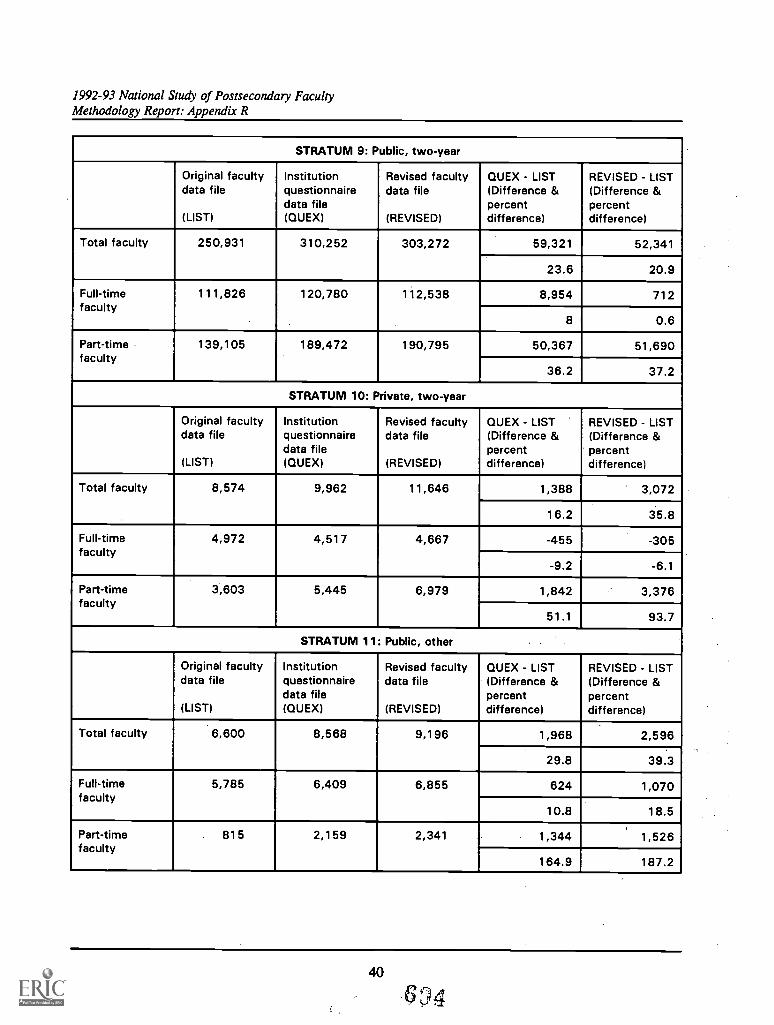
1992-93 National Study of Postsecondary FacultyMethodology Report: Appendix R
STRATUM 9: Public, two-year
Original facultydata file
(LIST)
Institutionquestionnairedata file(QUEX)
Revised facultydata file
(REVISED)
QUEX - LIST(Difference &percentdifference)
REVISED - LIST(Difference &percentdifference)
Total faculty 250,931 310,252 303,272 59,321 52,341
23.6 20.9
Full-timefaculty
111,826
.
120,780 112,538 8,954 712
8 0.6
Part-timefaculty
139,105 189,472 190,795 50,367 51,690
36.2 37.2
STRATUM 10: Private, two-year
Original facultydata file
(LIST)
Institutionquestionnairedata file(QUEX)
Revised facultydata file
(REVISED)
QUEX - LIST(Difference &percentdifference)
REVISED - LIST(Difference &percentdifference)
Total faculty 8,574 9,962 11,646 1,388 3,072
16.2 35.8
Full-timefaculty
4,972 4,517 4,667 -455 -305
-9.2 -6.1
Part-timefaculty
3,603 5,445 6,979 1,842 3,376
51.1 93.7
STRATUM 11: Public, other
Original facultydata file
(LIST)
Institutionquestionnairedata file(QUEX)
Revised facultydata file
(REVISED)
QUEX - LIST(Difference &percentdifference)
REVISED - LIST(Difference &percentdifference)
Total faculty 6,600 8,568 9,196 1,968 2,596
29.8 39.3
Full-timefaculty
5,785 6,409 6,855 624 1,070
10.8 18.5
Part-timefaculty
815 2,159 2,341 1,344 1,526
164.9 187.2
40
4
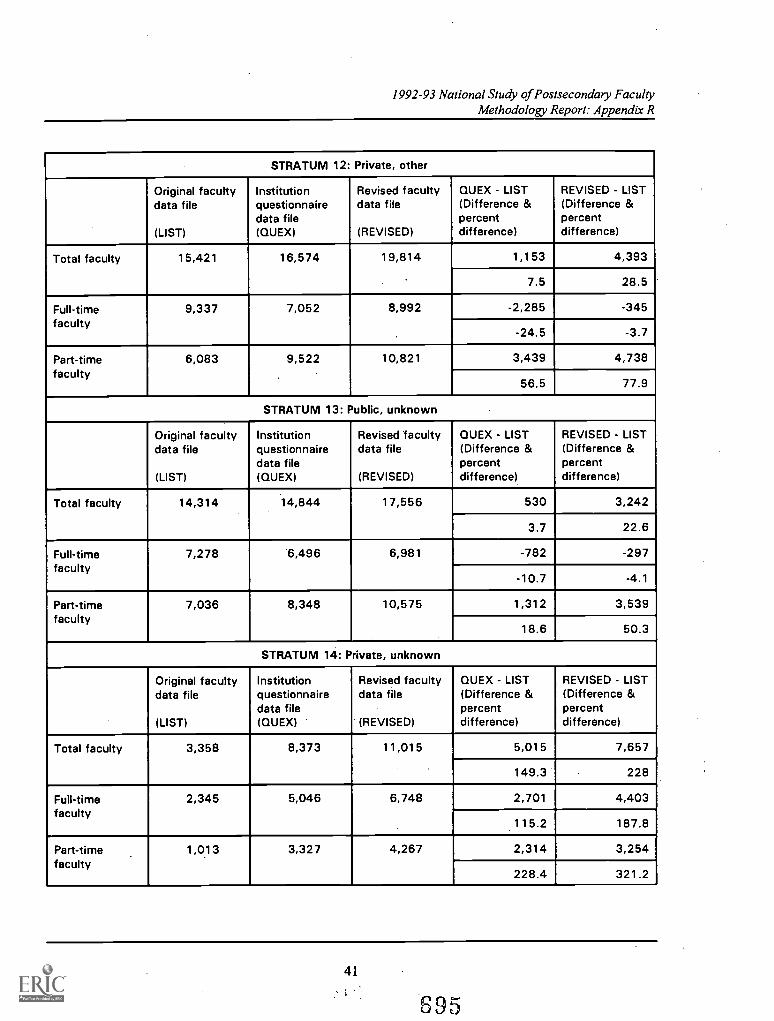
1992-93 National Study of Postsecondary FacultyMethodology Report: Appendix R
STRATUM 12: Private, other
Original facultydata file
(LIST)
Institutionquestionnairedata file(QUEX)
Revised facultydata file
(REVISED)
QUEX LIST(Difference &percentdifference)
REVISED - LIST(Difference &percentdifference)
Total faculty 15,421 16,574 19,814 1,153 4,393
7.5 28.5
Full-timefaculty
9,337 7,052 8,992 -2,285 -345
-24.5 -3.7
Part-timefaculty
6,083 9,522.
10,821 3,439 4,738
56.5 77.9
STRATUM 13: Public, unknown
Original facultydata file
(LIST)
Institutionquestionnairedata file(QUEX)
Revised 'facultydata file
(REVISED)
QUEX - LIST(Difference &percentdifference)
REVISED - LIST(Difference &percentdifference)
Total faculty 14,314 14,844 17,556 530 3,242
3.7 22.6
Full-timefaculty
7,278 '6,496 6,981 -782 -297
-10.7 -4.1
Part-timefaculty
7,036 8,348 10,575 1,312 3,539
18.6 50.3
STRATUM 14: Private, unknown
Original facultydata file
(LIST)
Institutionquestionnairedata file(QUEX)
Revised facultydata file
(REVISED)
QUEX - LIST(Difference &percentdifference)
REVISED - LIST(Difference &percentdifference)
Total faculty 3,358 8,373 11,015 5,015 7,657
149.3 228
Full-timefaculty
2,345 5,046 6,748 2,701 4,403
115.2 187.8
Part-timefaculty
1,013 3,327 4,267 2,314 3,254
228.4 321.2
41
695
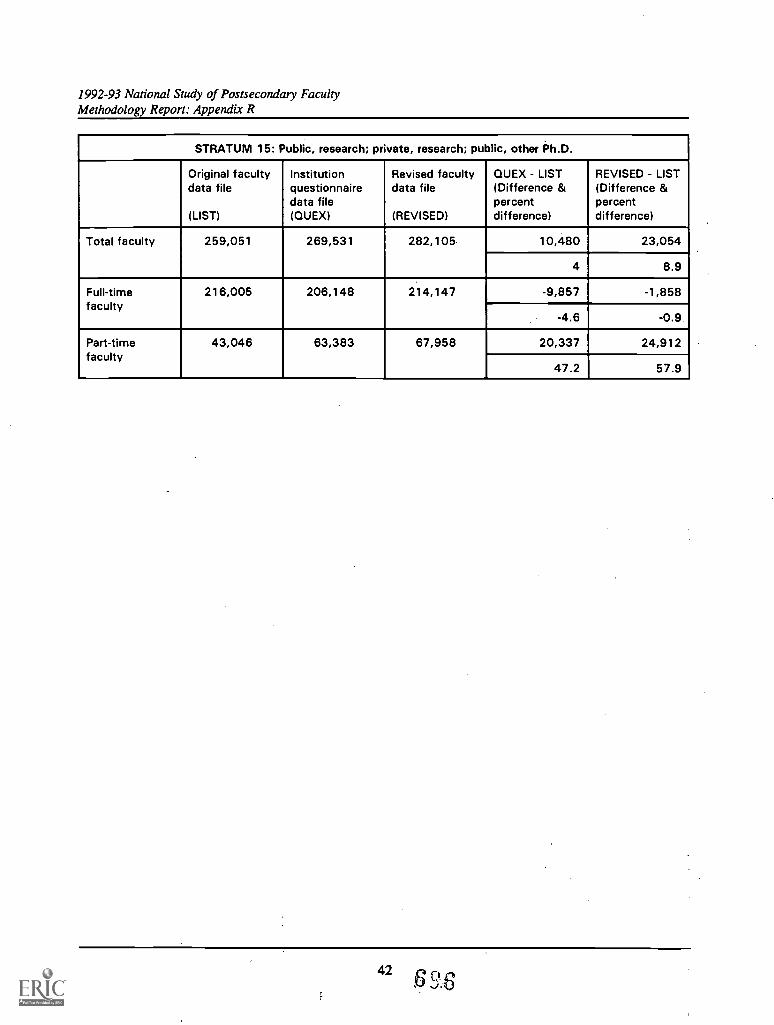
1992-93 National Study of Postsecondary FacultyMethodology Report: Appendix R
STRATUM 15: Public, research; private, research; public, other Ph.D.
Original facultydata file
(LIST)
Institutionquestionnairedata file(QUEX)
Revised facultydata file
(REVISED)
QUEX - LIST(Difference &percentdifference)
REVISED - LIST(Difference &percentdifference)
Total faculty 259,051 269,531 282,105 10,480 23,054
4 8.9
Full-timefaculty
216,005 206,148 214,147 -9,857 -1,858
-4.6 -0.9
Part-timefaculty
43,046 63,383 67,958 20,337 24,912
47.2 57.9
42
1992-93 National Study of Postsecondary FacultyMethodology Repo.-t Appendix R
Chapter IV. Sampling, Weighting, and Imputation in NSOPF-93
4.1 Independent Review of Sampling, Weighting, and Imputation
This chapter consists of an independent review of the sampling, weighting, and imputation performed forthe 1992-93 National Study of Postsecondary Faculty (NSOPF-93) by NORC's Department of Statisticsand Methodology. The review began with a careful examination of the specifications contained in thefollowing documents: the final version of the Sampling Plan for the 1992-93 National Study ofPostsecondary Faculty Full-Scale Study (dated July 1993), the specifications for Weighting forNSOPF-93 (dated May 1994), and the relevant sections of the 1993 National Study of PostsecondaryFaculty Data File User's Manual (draft) that dealt with imputation. Computer code used to performweighting adjustments was also reviewed. Based on the findings reported below, it was determined thatreview of programs used for imputation and for sample selection was unnecessary.
4.2 Problem Identification
As discussed earlier, two major problems manifested themselves in the NSOPF-93 faculty data file: 1) anunexpected decline in the estimates of health sciences faculty from the NSOPF-88 estimates; and, 2) amuch lower estimate of part-time faculty than expected or than noted in the NSOPF-93 institution datafile.
Imputation as a source of bias was dismissed because the two variables of interest, part-time/full-timestatus and primary area of teaching, are imputed too rarely for this to be a possibility. However, a reviewof the specifications for weighting identified nonresponse as a major cause of the shortfall in part-timefaculty estimates. Only a limited investigation of the possible effects of nonresponse on the shortfall inhealth sciences faculty was possible as information on academic area (i.e., discipline/department) wasunavailable for nonresponding faculty. Although discipline/department data were requested for allfaculty at the time of list enumeration, as a cost saving measure this data item was entered into thesampling frame database only for humanities faculty who were oversampled.
Section 4.3 below discusses nonresponse as well as other factors that may have contributed to theshortfall in part-time faculty. Section 4.4 reviews the health sciences decline and explains why theanalysis is necessarily limited. Finally, section 4.5 explains why the imputation procedures play only aminor role in either decline.
4.3 Part-Time Faculty
A major cause of the shortfall in part-time faculty is the difference in response rates between full-timefaculty and part-time faculty: part-time faculty had a lower response rate. Much of this difference can beexplained simply by the increased mobility of part-time faculty, and the associated difficulty in locatingthem. The original nonresponse weight adjustment developed for NSOPF-93 did not adequately correctfor this difference in response rates because full-time/part-time status was not given a role in thisadjustment. In addition, the fielding of the survey in waves had the inadvertent effect of increasing thedifference in response rates.
43
697
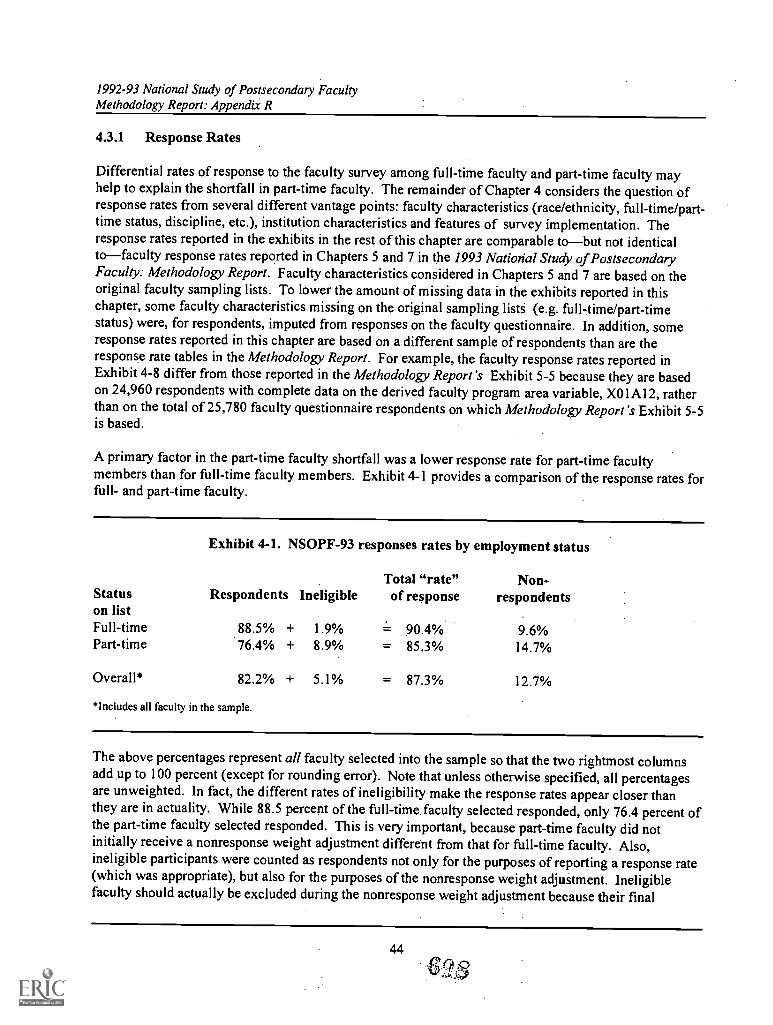
1992-93 National Study of Postsecondary FacultyMethodology Report: Appendix R
4.3.1 Response Rates
Differential rates of response to the faculty survey among full-time faculty and part-time faculty mayhelp to explain the shortfall in part-time faculty. The remainder of Chapter 4 considers the question ofresponse rates from several different vantage points: faculty characteristics (race/ethnicity, full-time/part-time status, discipline, etc.), institution characteristics and features of survey implementation. Theresponse rates reported in the exhibits in the rest of this chapter are comparable tobut not identicaltofaculty response rates reported in Chapters 5 and 7 in the 1993 Natiorial Study ofPostsecondaryFaculty: Methodology Report. Faculty characteristics considered in Chapters 5 and 7 are based on theoriginal faculty sampling lists. To lower the amount of missing data in the exhibits reported in thischapter, some faculty characteristics missing on the original sampling lists (e.g. full-time/part-timestatus) were, for respondents, imputed from responses on the faculty questionnaire. In addition, someresponse rates reported in this chapter are based on a different sample of respondents than are theresponse rate tables in the Methodology Report. For example, the faculty response rates reported inExhibit 4-8 differ from those reported in the Methodology Report's Exhibit 5-5 because they are basedon 24,960 respondents with complete data on the derived faculty program area variable, X01Al2, ratherthan on the total of 25,780 faculty questionnaire respondents on which Methodology Report's Exhibit 5-5is based.
A primary factor in the part-time faculty shortfall was a lower response rate for part-time facultymembers than for full-time faculty members. Exhibit 4-1 provides a comparison of the response rates forfull- and part-time faculty.
Exhibit 4-1. NSOPF-93 responses rates by employment status
Total "rate" Non-Statuson list
Respondents Ineligible of response respondents
Full-time 88.5% + 1.9% = 90.4% 9.6%Part-time 76.4% + 8.9% = 85.3% 14.7%
Overall* 82.2% + 5.1% = 87.3% 12.7%
Includes all faculty in the sample.
The above percentages represent all faculty selected into the sample so that the two rightmost columnsadd up to 100 percent (except for rounding error). Note that unless otherwise specified, all percentagesare unweighted. In fact, the different rates of ineligibility make the response rates appear closer thanthey are in actuality. While 88.5 percent of the full-time faculty selected responded, only 76.4 percent ofthe part-time faculty selected responded. This is very important, because part-time faculty did notinitially receive a nonresponse weight adjustment different from that for full-time faculty. Also,ineligible participants were counted as respondents not only for the purposes of reporting a response rate(which was appropriate), but also for the purposes of the nonresponse weight adjustment. Ineligiblefaculty should actually be excluded during the nonresponse weight adjustment because their final
44
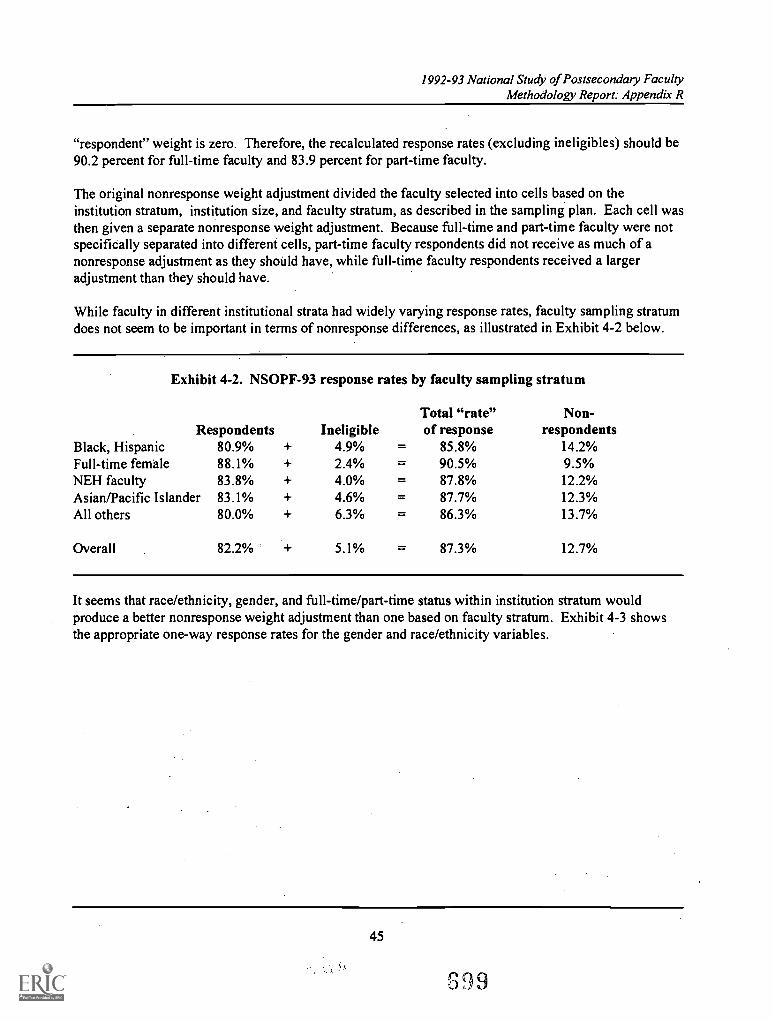
1992-93 National Study of Postsecondary FacultyMethodology Report: Appendix R
"respondent" weight is zero. Therefore, the recalculated response rates (excluding ineligibles) should be90.2 percent for full-time faculty and 83.9 percent for part-time faculty.
The original nonresponse weight adjustment divided the faculty selected into cells based on theinstitution stratum, institution size, and faculty stratum, as described in the sampling plan. Each cell wasthen given a separate nonresponse weight adjustment. Because full-time and part-time faculty were notspecifically separated into different cells, part-time faculty respondents did not receive as much of anonresponse adjustment as they should have, while full-time faculty respondents received a largeradjustment than they should have.
While faculty in different institutional strata had widely varying response rates, faculty sampling stratumdoes not seem to be important in terms of nonresponse differences, as illustrated in Exhibit 4-2 below.
Exhibit 4-2. NSOPF-93 response rates by faculty sampling stratum
Respondents IneligibleTotal "rate"of response
Non-respondents
Black, Hispanic 80.9% + 4.9% 85.8% 14.2%Full-time female 88.1% + 2.4% 90.5% 9.5%NEH faculty 83.8% + 4.0% 87.8% 12.2%Asian/Pacific Islander 83.1% + 4.6% 87.7% 12.3%All others 80.0% + 6.3% 86.3% 13.7%
Overall 82.2% 5.1% 87.3% 12.7%
It seems that race/ethnicity, gender, and full-time/part-time status within institution stratum wouldproduce a better nonresponse weight adjustment than one based on faculty stratum. Exhibit 4-3 showsthe appropriate one-way response rates for the gender and race/ethnicity variables.
45
99
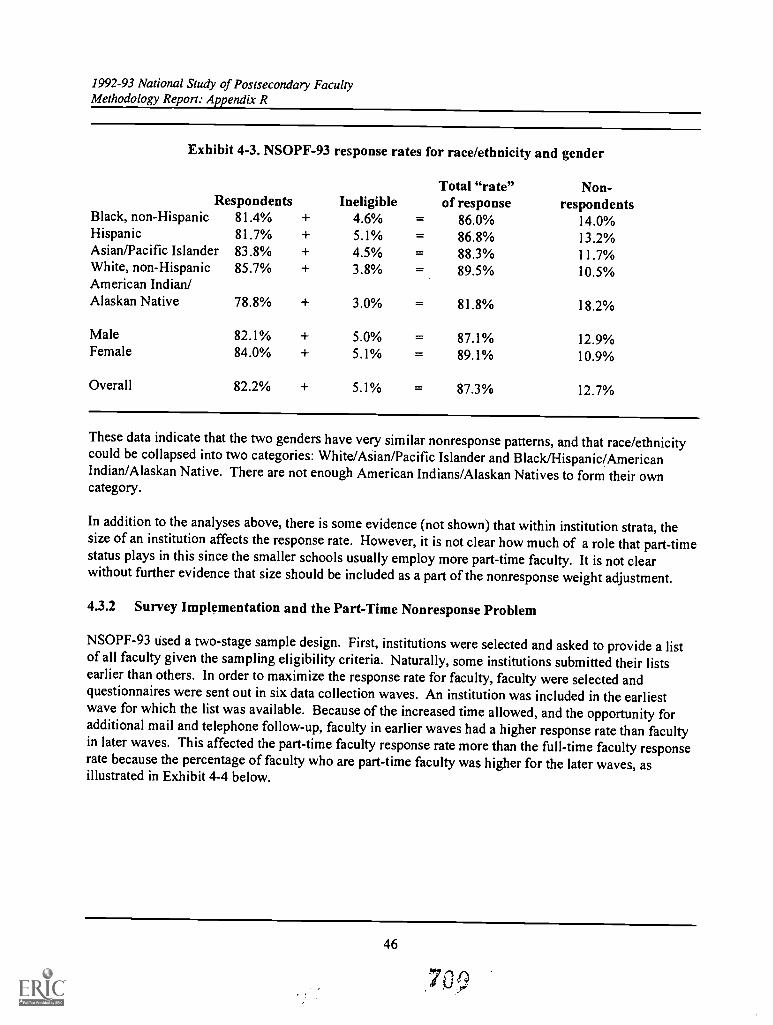
1992-93 National Study of Postsecondary FacultyMethodology Report: Appendix R
Exhibit 4-3. NSOPF-93 response rates for race/ethnicity and gender
Respondents IneligibleTotal "rate"of response
Non-respondents
Black, non-Hispanic 81.4% 4.6% 86.0% 14.0%Hispanic 81.7% 5.1% 86.8% 13.2%Asian/Pacific Islander 83.8% 4.5% 88.3% 11.7%White, non-Hispanic 85.7% 3.8% 89.5% 10.5%American Indian/Alaskan Native 78.8% 3.0% 81.8% 18.2%
Male 82.1% + 5.0% 87.1% 12.9%Female 84.0% + 5.1% 89.1% 10.9%
Overall 82.2% + 5.1% = 87.3% 12.7%
These data indicate that the two genders have very similar nonresponse patterns, and that race/ethnicitycould be collapsed into two categories: White/Asian/Pacific Islander and Black/Hispanic/AmericanIndian/Alaskan Native. There are not enough American Indians/Alaskan Natives to form their owncategory.
In addition to the analyses above, there is some evidence (not shown) that within institution strata, thesize of an institution affects the response rate. However, it is not clear how much of a role that part-timestatus plays in this since the smaller schools usually employ more part-time faculty. It is not clearwithout further evidence that size should be included as a part of the nonresponse weight adjustment.
4.3.2 Survey Implementation and the Part-Time Nonresponse Problem
NSOPF-93 used a two-stage sample design. First, institutions were selected and asked to provide a listof all faculty given the sampling eligibility criteria. Naturally, some institutions submitted their listsearlier than others. In order to maximize the response rate for faculty, faculty were selected andquestionnaires were sent out in six data collection waves. An institution was included in the earliestwave for which the list was available. Because of the increased time allowed, and the opportunity foradditional mail and telephone follow-up, faculty in earlier waves had a higher response rate than facultyin later waves. This affected the part-time faculty response rate more than the full-time faculty responserate because the percentage of faculty who are part-time faculty was higher for the later waves, asillustrated in Exhibit 4-4 below.
46
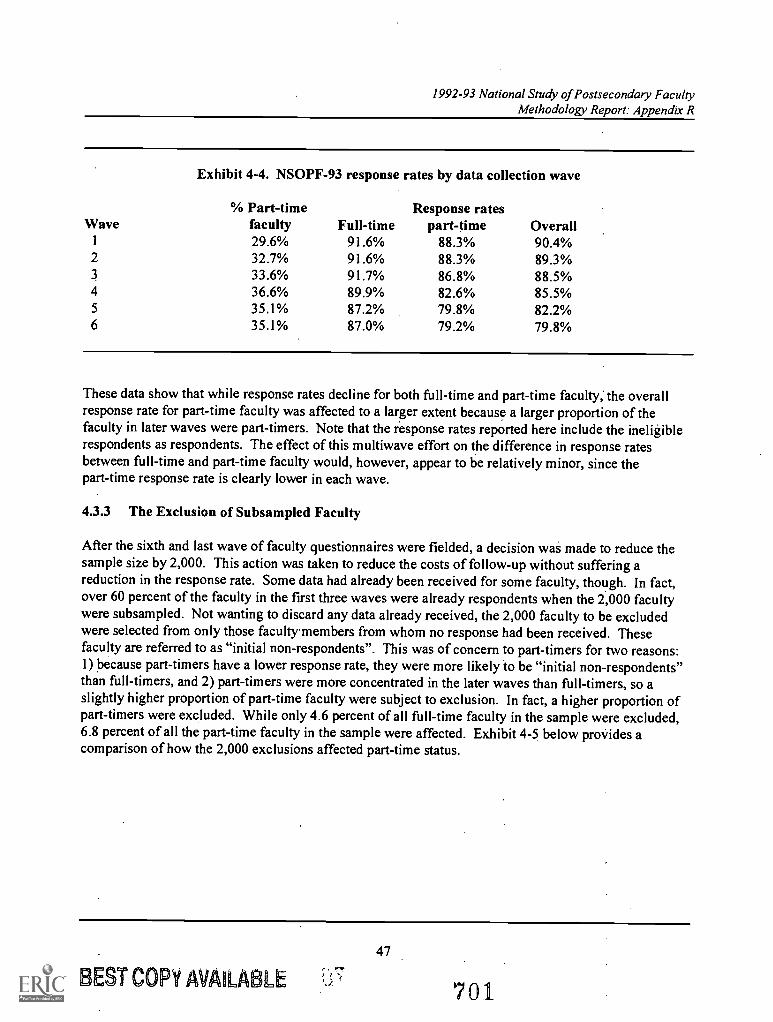
1992-93 National Study of Postsecondary FacultyMethodology Report: Appendix R
Exhibit 4-4. NSOPF-93 response rates by data collection wave
Wave% Part-time
faculty Full-timeResponse rates
part-time Overall29.6% 91.6% 88.3% 90.4%
2 32.7% 91.6% 88.3% 89.3%3 33.6% 91.7% 86.8% 88.5%4 36.6% 89.9% 82.6% 85.5%5 35.1% 87.2% 79.8% 82.2%6 35.1% 87.0% 79.2% 79.8%
These data show that while response rates decline for both full-time and part-time faculty; the overallresponse rate for part-time faculty was affected to a larger extent because a larger proportion of thefaculty in later waves were part-timers. Note that the response rates reported here include the ineligiblerespondents as respondents. The effect of this multiwave effort on the difference in response ratesbetween full-time and part-time faculty would, however, appear to be relatively minor, since thepart-time response rate is clearly lower in each wave.
4.3.3 The Exclusion of Subsampled Faculty
After the sixth and last wave of faculty questionnaires were fielded, a decision was made to reduce thesample size by 2,000. This action was taken to reduce the costs of follow-up without suffering areduction in the response rate. Some data had already been received for some faculty, though. In fact,over 60 percent of the faculty in the first three waves were already respondents when the 2,000 facultywere subsampled. Not wanting to discard any data already received, the 2,000 faculty to be excludedwere selected from only those facultymembers from whom no response had been received. Thesefaculty are referred to as "initial non-respondents". This was of concern to part-timers for two reasons:1) because part-timers have a lower response rate, they were more likely to be "initial non-respondents"than full-timers, and 2) part-timers were more concentrated in the later waves than full-timers, so aslightly higher proportion of part-time faculty were subject to exclusion. In fact, a higher proportion ofpart-timers were excluded. While only 4.6 percent of all full-time faculty in the sample were excluded,6.8 percent of all the part-time faculty in the sample were affected. Exhibit 4-5 below proVides acomparison of how the 2,000 exclusions affected part-time status.
47
BEST COPY AVAILABLE 701
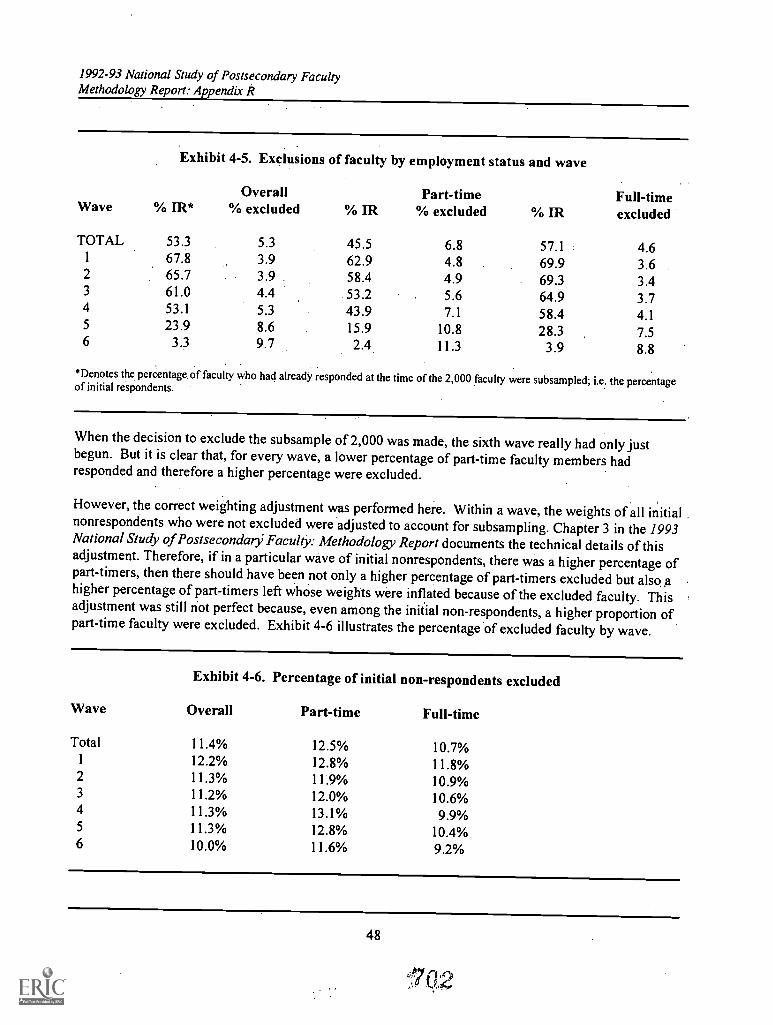
1992-93 National Study of Postsecondary FacultyMethodology Report: Appendix R
Exhibit 4-5. Exclusions of faculty by employment status and wave
Overall Part-time Full-timeWave % IR* % excluded % IR % excluded % IR excluded
TOTAL 53.3 5.3 45.5 6.8 57.1 4.61 67.8 3.9 62.9 4.8 69.9 3.62 65.7 3.9 58.4 4.9 69.3 3.43 61.0 4.4 53.2 5.6 64.9 3.74 53.1 5.3 43.9 7.1 58.4 4.15 23.9 8.6 15.9 10.8 28.3 7.56 3.3 9.7 2.4 11.3 3.9 8.8
*Denotes the percentage of faculty who had already responded at the time of the 2,000 faculty were subsampled; i.e. the percentageof initial respondents.
When the decision to exclude the subsample of 2,000 was made, the sixth wave really had only justbegun. But it is clear that, for every wave, a lower percentage of part-time faculty members hadresponded and therefore a higher percentage were excluded.
However, the correct weighting adjustment was performed here. Within a wave, the weights of all initialnonrespondents who were not excluded were adjusted to account for subsampling. Chapter 3 in the 1993National Study of Postsecondary Faculty: Methodology Report documents the technical details of thisadjustment. Therefore, if in a particular wave of initial nonrespondents, there was a higher percentage ofpart-timers, then there should have been not only a higher percentage of part-timers excluded but also ahigher percentage of part-timers left whose weights were inflated because of the excluded faculty. Thisadjustment was still not perfect because, even among the initial non-respondents, a higher proportion ofpart-time faculty were excluded. Exhibit 4-6 illustrates the percentage of excluded faculty by wave.
Exhibit 4-6. Percentage of initial non-respondents excluded
Wave Overall Part-time Full-time
Total 11.4% 12.5% 10.7%12.2% 12.8% 11.8%
2 11.3% 119% 10.9%3 11.2% 12.0% 10.6%4 11.3% 13.1% 9.9%5 11.3% 12.8% 10.4%6 10.0% 11.6% 9.2%
48
0,2
1992-93 National Study of Postsecondary FacultyMethodology Report: Appendix R
While there clearly seems to be a difference, this is a much smaller bias than is due simply to thedifference in response rates. This bias was addressed within the weighting adjustment, by giving adifferent "exclusion" adjustment to part-time and full-time faculty within a wave.
4.4 Health Sciences Faculty
Unfortunately, the shortfall for health sciences faculty could not be investigated in the same way andwith as much completeness as the shortfall of part-time faculty. As a cost saving measure, thedepartment/discipline of these faculty was not keyed into the sampling frame database. While thisinformation is available for respondents from the faculty questionnaire, it is not available fornonrespondents. It can be retrieved for nonrespondents only by reviewing all of the hard copy andelectronic lists originally submitted by the 817 participating institutions. Not all institutions provideddepartment/discipline information on their lists. Seven hundred seventeen (717) institutions of the 817participating institutions (88.8 percent) provided department/discipline data on their lists. To perform acomplete nonresponse analysis for faculty members in the health science disciplines, these list datawould have had to have been reaccessed, coded, data-entered, verified, and then combined with theinformation from other databases for analysis. Because of the large cost and time involved, this processwas not undertaken for NSOPF-93.
Given this limitation, it was not possible to investigate the rates of response, ineligibility, or exclusionfor health sciences faculty as compared to faculty in other areas. However, the knowledge gained in theanalysis of part-time faculty was used to investigate certain properties of the health sciences faculty.For example, part-time faculty had a lower response rate than full-time faculty. However, healthsciences faculty were less likely to be part-time: 22.6 percent of the total health sciences faculty werefound to be part-time, compared to 30.4 percent in other program areas.
Faculty in the later data collection waves had a lower response rate than those in earlier waves. AsExhibit 4-7 shows, health sciences faculty do not seem to be clustered in the later waves, but appear to befairly evenly distributed across waves.
49
703
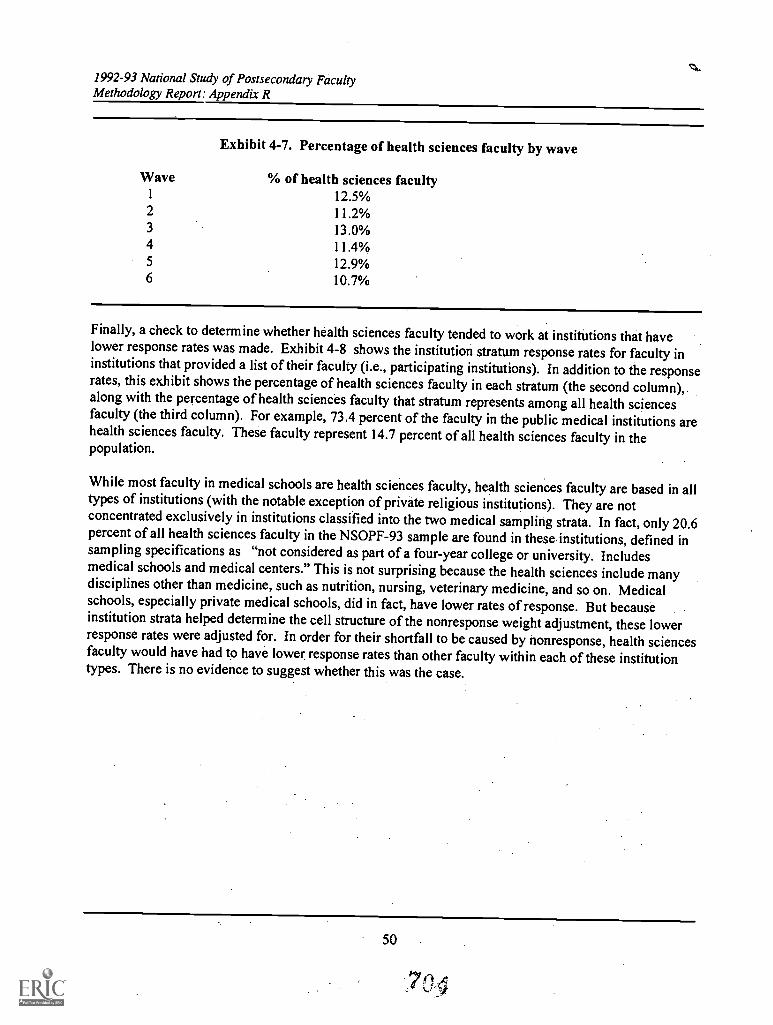
1992-93 National Study of Postsecondary FacultyMethodology Report: Appendix R
Wave
Exhibit 4-7. Percentage of health sciences faculty by wave
% of health sciences faculty1 12.5%2 11.2%3 13.0%4 11.4%5 12.9%6 10.7%
Finally, a check to determine whether health sciences faculty tended to work at institutions that havelower response rates was made. Exhibit 4-8 shows the institution stratum response rates for faculty ininstitutions that provided a list of their faculty (i.e., participating institutions). In addition to the responserates, this exhibit shows the percentage of health sciences faculty in each stratum (the second column),along with the percentage of health sciences faculty that stratum represents among all health sciencesfaculty (the third column). For example, 73.4 percent of the faculty in the public medical institutions arehealth sciences faculty. These faculty represent 14.7 percent of all health sciences faculty in thepopulation.
While most faculty in medical schools are health sciences faculty, health sciences faculty are based in alltypes of institutions (with the notable exception of private religious institutions). They are notconcentrated exclusively in institutions classified into the two medical sampling strata. In fact, only 20.6percent of all health sciences faculty in the NSOPF-93 sample are found in these institutions, defined insampling specifications as "not considered as part of a four-year college or university. Includesmedical schools and medical centers." This is not surprising because the health sciences include manydisciplines other than medicine, such as nutrition, nursing, veterinary medicine, and so on. Medicalschools, especially private medical schools, did in fact, have lower rates of response. But becauseinstitution strata helped determine the cell structure of the nonresponse weight adjustment, these lowerresponse rates were adjusted for. In order for their shortfall to be caused by nonresponse, health sciencesfaculty would have had to have lower response rates than other faculty within each of these institutiontypes. There is no evidence to suggest whether this was the case.
50
-7n
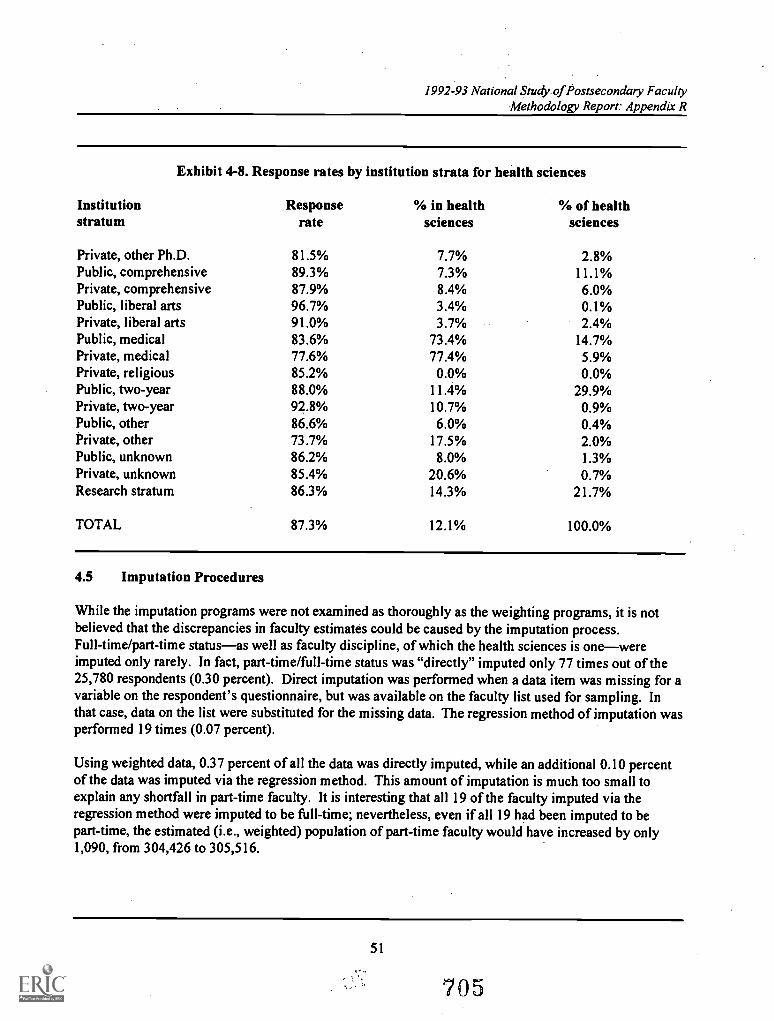
1992-93 National Study. of Postsecondary FacultyMethodology Report: Appendix R
Exhibit 4-8. Response rates by institution strata for health sciences
Institution Response % in health % of healthstratum rate sciences sciences
Private, other Ph.D. 81.5% 7.7% 2.8%Public, comprehensive 89.3% 7.3% 11.1%Private, comprehensive 87.9% 8.4% 6.0%Public, liberal arts 96.7% 3.4% 0.1%Private, liberal arts 91.0% 3.7% 2.4%Public, medical 83.6% 73.4% 14.7%Private, medical 77.6% 77.4% 5.9%Private, religious 85.2% 0.0% 0.0%Public, two-year 88.0% 11.4% 29.9%Private, two-year 92.8% 10.7% 0.9%Public, other 86.6% 6.0% 0.4%Private, other 73.7% 17.5% 2.0%Public, unknown 86.2% 8.0% 1.3%Private, unknown 85.4% 20.6% 0.7%Research stratum 86.3% 14.3% 21.7%
TOTAL 87.3% 12.1% 100.0%
4.5 Imputation Procedures
While the imputation programs were not examined as thoroughly as the weighting programs, it is notbelieved that the discrepancies in faculty estimates could be caused by the imputation process.Full-time/part-time status-as well as faculty discipline, of which the health sciences is one-wereimputed only rarely. In fact, part-time/full-time status was "directly" imputed only 77 times out of the25,780 respondents (0.30 percent). Direct imputation was performed when a data item was missing for avariable on the respondent's questionnaire, but was available on the faculty list used for sampling. Inthat case, data on the list were substituted for the missing data. The regression method of imputation wasperformed 19 times (0.07 percent).
Using weighted data, 0.37 percent of all the data was directly imputed, while an additional 0.10 percentof the data was imputed via the regression method. This amount of imputation is much too small toexplain any shortfall in part-time faculty. It is interesting that all 19 of the faculty imputed via theregression method were imputed to be full-time; nevertheless, even if all 19 had been imputed to bepart-time, the estimated (i.e., weighted) population of part-time faculty would have increased by only1,090, from 304,426 to 305,516.
51
705
1992-93 National Study of Postsecondary FacultyMethodology Report: Appendix R
Similarly, the principal field of teaching, the source variable for the area of teaching variable, had only162 out of 25,780 responses imputed (0.65 percent), via the hot-deck method. When weighted, thispercentage is equal to 0.66 percent. Twenty-five of these 162 imputed faculty were assigned to thehealth sciences, which represents 10.65 percent of cases missing a program area when weighted. This islow when compared to the 14.7 percent (weighted) of the observed faculty members who are in thehealth sciences. However, even if health sciences faculty had been imputed at double the observed rate(29.3 percent), the estimate of health sciences faculty would have increased only by 1,679, from 127,498to 129,177 (a 1.3 percent increase).
52
1992-93 National Study of Postsecondary FacultyMethodology Report: Appendix R
Chapter V. Adjustments for NSOPF-93 and Recommendations for Future Cycles
5.1 Adjustments for NSOPF-93
The discussion in Chapter 4 makes clear that even a large errorwhich did not occurin the imputationmethodology would have caused very little difference in the estimates of part-time and health sciencesfaculty. One general principle is worth keeping in mind, however. Because the imputation methodologyuses the observed data as the model, if the observed data has a shortfall in a group of faculty, mostimputations will extend this shortfall to the imputed data. Fortunately, in this study, there is simply notenough imputation on these two variables for any additional underestimation of part-time or healthsciences faculty to be important. Thus, no adjustments to the imputation procedures were made.
However, based on the data gathered during the reconciliation and verification effort, nonresponse andpoststratification weighting adjustments to the NSOPF-93 faculty dataset were made to remedydiscrepancies in estimates. Full technical documentation is available in Chapters 3 and 10 of the 1993National Study of Postsecondary Faculty: Methodology Report.
5.1.1 Recalculating the Nonresponse Weighting Adjustment
Based on the evidence presented in Chapter 4, it is clear that the response rates for part-time facultydiffer significantly from those of full-time faculty. The original nonresponse weighting adjustment didnot foresee this possibility and, therefore, did not correct for it. To remedy this problem, thenonresponse weighting adjustment was recalculated using the following variables to create the cells foradjustment: institution sampling stratum (15 levels), part-time/full-time status (2 levels), andrace/ethnicity (2 levels, i.e. white, non-Hispanic versus all others).
5.1.2 Poststratification Adjustments
The nonresponse weighting adjustment for part-time/full-time faculty did not remedy the discrepancy intotal faculty estimates between the list and questionnaire. It only shifted weight from full-time facultyto part-time faculty. To address the broader problem, a poststratification adjustment to "best estimates"of faculty was implemented. The adjustment was determined separately for full-time and part-timefaculty within each of the 15 institutional strata. A deeper poststratification defined byinstructional/noninstructional status was considered. But after investigation, it was determined that thesample sizes of noninstructional faculty were too small to support this additional poststratification.
5.1.3 Health Sciences Faculty
For health sciences faculty, analysis of the kind performed in Chapter 4 was limited by the unavailabilityof department-level information for nonrespondents. This prevented an analysis of response rates,exclusion rates, and ineligibility rates for this group of faculty and other departmental areas. Moreover, areliable estimate for the number of health sciences faculty was not identified during the retrieval andreconciliation effort. Therefore, the poststratification plan discussed above could not adjust the specificestimates of health sciences faculty. Nevertheless, the reconciliation process and general
53
707
1992-93 National Study of Postsecondary FacultyMethodology Report: Appendix R
poststratification adjustments made to the NSOPF-93 faculty dataset increased the estimate of healthsciences instructional faculty who taught at least one for-credit course from 80,916 to 93,860.
5.2 Recommendations for the Next NSOPF Cycle
Because it is much more difficult for institutions to compile a complete enumeration of faculty than it isto provide a simple count of them, it is unlikely that discrepancies between the list and institutionquestionnaire can be entirely eliminated. The faculty sampling list institutions prepared required them toprovide the names, gender, race/ethnicity, employment status (part-time/full-time), and discipline (onlythe four NEH disciplines were data-entered) for all eligible staff. In contrast, the institutionquestionnaire asked only for counts of various categories of instructional and noninstructional staff,along with the breakdown for specific subgroups. One of the key goals for the next cycle of NSOPFshould be to minimize the potential discrepancies between list and questionnaire faculty estimates earlyin the study, preferably at the time of list collection. Notwithstanding the burden of these differentrequests on institutions, there are a number of steps that can be taken in future NSOPF cycles tominimize the magnitude and number of discrepancies that occur.
The following recommendations to survey procedures are intended to alleviate in the next NSOPF cyclesome of the problems experienced in NSOPF-93.
5.2.1 Changing Time Frames and Starting List Collection Later
To ensure that part-time staff are not missed in the list enumeration, one member of the NSOPF-93National Technical Review Panel (NTRP) suggested beginning the list collection effort at the end of thefall term rather than at its start as occurred in NSOPF-93. Sampled institutions would be asked tocompile a list of faculty for their fall term (encompassing October 15th to ensure comparability betweenNSOPF cycles). The emphasis should be on the fall term rather than on a specific date.
A later start in the list collection effort has multiple implications. A delay of three to four months wouldmean delaying the faculty survey accordingly. Pushing back the date of the faculty survey, whilemaintaining the fall term as the time frame for the questionnaire, has the potential of creatingmethodological problems for data quality. The NSOPF-93 faculty data collection effort spanned almost11 calendar months (from the end of January to mid-December 1993 with a two month hiatus during thesummer). The data collection schedule is inextricably bound up with the list collection effort, whichitself spanned almost nine calendar months (October, 1992 to June, 1993). These scheduling andpotential methodological problems would have to be considered in changing the start date for listcollection. At a minimum, the reliability of a later faculty data collection should be assessed. Anotherpossibility is to consider transforming the current mixed-mode data collection design (mail, with mailand telephone follow-up supplemented by telephone interviews) into a telephone survey with minimalmail follow-up. This approach presents problems such as additional cost, the unwillingness of faculty toengage in a 45-minute or longer telephone interview, and phone locating problems, particularly for part-time faculty. It is also likely to increase item nonresponse where respondents do not feel comfortableproviding information over the telephone, or where they do not have records needed to answer questionsreadily available. All of this underscores that something as simple as a change in the list collection startdate has numerous implications for other components of the survey design. This recommendation shouldbe field-tested prior to the next cycle of NSOPF.
1992-93 National Study of Postsecondary FacultyMethodology Report: Appendix R
5.2.2 Providing Institutions with an Information Sheet
The verification and retrieval effort demonstrated that when institutions are supplied with facultyestimates, even when they are discrepant, most institutions are capable of determining which set ofestimates is most accurate and can provide the reason(s) for the discrepancy. In view of this finding, it isproposed that institutional staff at the time of list collection be provided with an "Information Sheet,"which would contain the most current IPEDS estimates along with the "best estimate" for facultyreported for NSOPF-93. The information sheet would also include a statement alerting staff that theNSOPF-93 definition of "faculty" is not identical to the IPEDS definition and that, in most instances, theinstitution's estimate of faculty should exceed that of IPEDS. (It may or may not exceed the NSOPF-93totals depending on the actions [e.g., downsizing, increasing staff, etc.] the institution has taken betweenNSOPF cycles.) Institution staff could report the new list estimates on the information sheet and checkthese totals against the IPEDS and/or NSOPF-93 totals. Discrepancies among estimates beyond aspecified threshold (e.g., 10 percent) should be explained in a "Comments" section of the one-page form.A sample "Information Sheet" could be provided to serve as a guide. Once received, the institution'slist enumeration could be entered into a computerized discrepancy module. Faculty estimates from theinstitution questionnaire could also be entered into the discrepancy module. A discrepancy analysiswould be completed for all estimates, and unexplained discrepancies beyond a specified threshold wouldtrigger a retrieval and reconciliation call to the institution coordinator before faculty sample selection.
Experience during the recontacting effort suggests that when institution staff are presented with facultyestimates, they are able to indicate which one is accurate. Most institution staff contacted during thereconciliation effort were also able to offer explanations for the discrepancies. The proposed informationsheet can work in a similar manner. It will provide the institution coordinator with a means to check thework of other staff who are usually responsible for preparing the list. This new procedure will encouragethe coordinator to check the work of the list compiler, who must, under this procedure, supply the listestimates to the coordinator so that s/he can complete the information sheet. In doing so, it will alsoencourage the coordinator to review the estimates and to account for any discrepancies. This will allowthe institutions, in some instances, to correct obvious errors (e.g., exclusion of non-tenure-track facultyor part-time staff) before mailing the list of faculty back to the NSOPF contractor. In other instances,where the institution is simply not equipped to provide a complete or wholly accurate list of faculty, itwould alert the institutionand the NSOPF contractorto any omissions or erroneous inclusions muchearlier in the list collection effort. Even under this changed procedure, the NSOPF contractor wouldcontinue to recontact institutions to retrieve data and to reconcile discrepancies during the list collectionoperation.
5.2.3 Coordinating Institution Questionnaire Mailing and List Collection
Recommendation 5.2.2 requires availability of faculty estimates from the institution questionnaire at thetime of list collection so that potential discrepancies can be checked and reconciled at this early stage ofthe operation. This recommendation offers other advantages as well. Discrepancies resulting frommailing the list and questionnaire requests during different academic terms different academic terms(e.g., Fall 1991; Fall 1992) can also be substantially reduced by mailing the institution questionnaire andthe list request in the same packet, or at least timing it so that both individual requests are received at the
55
709
1992-93 National Study of Postsecondary FacultyMethodology Report: Appendix R
institution at about the same time. By coordinating these requests, the NSOPF contractor can indicateexplicitly in the instructions to both the list and questionnaire that the estimates requested to certainquestions should be identical or very close. Whenever discrepancies are identified, institution staffwould be required to resolve or explain them. By coupling the timing for both of these requests, theNSOPF contractor will be able to enter the list and questionnaire counts (along with the IPEDS counts)into a discrepancy/verification module to immediately check for discrepancies. Of course, no system is"error-proof' and institutions would be recontacted as needed to reconcile discrepancies. An immediatecallback to the institution for verification and reconciliation would be triggered by specifieddiscrepancies, especially those found between the list and the institution questionnaire.
It is possible that the extra respondent burden of cross-checking faculty lists and institutionquestionnaires could result in lower response rates, especially for the institution questionnaire. InNSOPF-93, 85 percent of eligible institutions provided faculty sampling lists, while 91 percent of thosesame institutions responded to the institution questionnaire. Although this procedure may increase theinitial appearance of respondent burden to the institution, it also increases the likelihood that institutionstaff preparing the list and those completing the questionnaire (who are often not the same people) willconsult each other and resolve any discrepancies before submitting the list to the NSOPF contractor. Itis likely that this procedure will reduce respondent burden at many institutions by eliminatingduplication of efforts by separate offices, and by minimizing the number of callback requests from theNSOPF contractor.
5.2.4 Changes to Questionnaire Instructions and Questions
Some of the institution questionnaire instructions and questions may have inadvertently contributed tothe discrepancies in faculty estimates. To avoid confusion between the total pool of part-time andtemporary faculty available to an institution and the total employed (an unintended ambiguity that causedproblems for some institutions because of how part-time and temporary staff are treated), the questionthat asks for counts of part- and full-time instructional faculty and staff and for part- and full-timenoninstructional faculty should be amended. Perhaps a separate question should be added to ask forboth the total number of available staff and for those actually employed during the fall term. This wouldallow institutions to report the status of their temporary and part-time staff more accurately and withoutthe confusion some schools experienced. Even though some institutions may be able to provide one setof these estimates only, it will at least be completely clear which set of figures the institution isproviding.
Another area of ambiguity appeared in the actual faculty counts. Some institutions provided estimates offull-time equivalents (FTEs) rather than the requested headcount of individuals. Instructions to theinstitution questionnaire should make clear that NSOPF is seeking a headcount of faculty, and not acount of FTEs (or positions) unless it is expressly stated in the question.
In NSOPF-93, a number of institutions excluded medical or professional schools or satellite campusesthat should have been included in their faculty enumerations. In future NSOPF cycles, explicitinstructions should be provided in both the questionnaire and the list collection packet to include all suchschools and campuses that do not file separately for IPEDS. If possible, a list of schools and campusesto be included could be printed in the packet given each institution, based on IPEDS information. Theinstitution would be instructed to notify the NSOPF contractor about any changes in the status of the
56
1992-93 National Study of Postsecondary FacultyMethodology Report: Appendix R
listed schools and satellite campuses. If an institution has any questions about which schools andcampuses to include, that institution would be instructed to contact the NSOPF contractor for assistance.
Finally, a small number of institutions erroneously included all staff (including maintenance and clericalstaff). This error may have been avoided had the respondent(s) carefully read the glossary on the frontinside cover of the questionnaire. However, NCES and the NSOPF contractor cannot be assured that therespondent(s) will read the glossary. An additional instruction to the questions soliciting counts offaculty and staff should be added to the institution questionnaire. That instruction would briefly repeatthe instruction to include only instructional and noninstructional faculty and staff. Such an instructioncould include a statement referring respondents to the glossary..
5.3 Health Sciences Faculty and the Faculty Questionnaire
The total number of health sciences faculty estimated in the revised NSOPF-93 faculty dataset is146,615. However, if the criterion ("teaching at least one course for credit") is used to selectinstructional faculty for analysis, the number of health sciences faculty drops to 93,860, a 36 percentdecline. This decline is second only to the decline registered among Agriculture/Home Economicsfaculty (41.7 percent), as Exhibit 5-1 illustrates. In Exhibit 5-1, the derived variable XO 1 Al2 was usedto indicate program area. This derived variable does not record a program area for 820 faculty memberswho were legitimately allowed to skip the question. To account for these cases, an extra category,"Program area skipped" has been added to the exhibit. Health sciences faculty show the largest singledecline in the absolute number of faculty in all the program areas (a decline of 52,755 faculty members)when faculty members who do not teach at least one course for credit are screened out. Under the"teaching at least one course for credit" criterion, health sciences faculty are excluded from analysis at arate almost twice as high as average faculty members are excluded (36.0 percent to 20.5 percent).
57
711
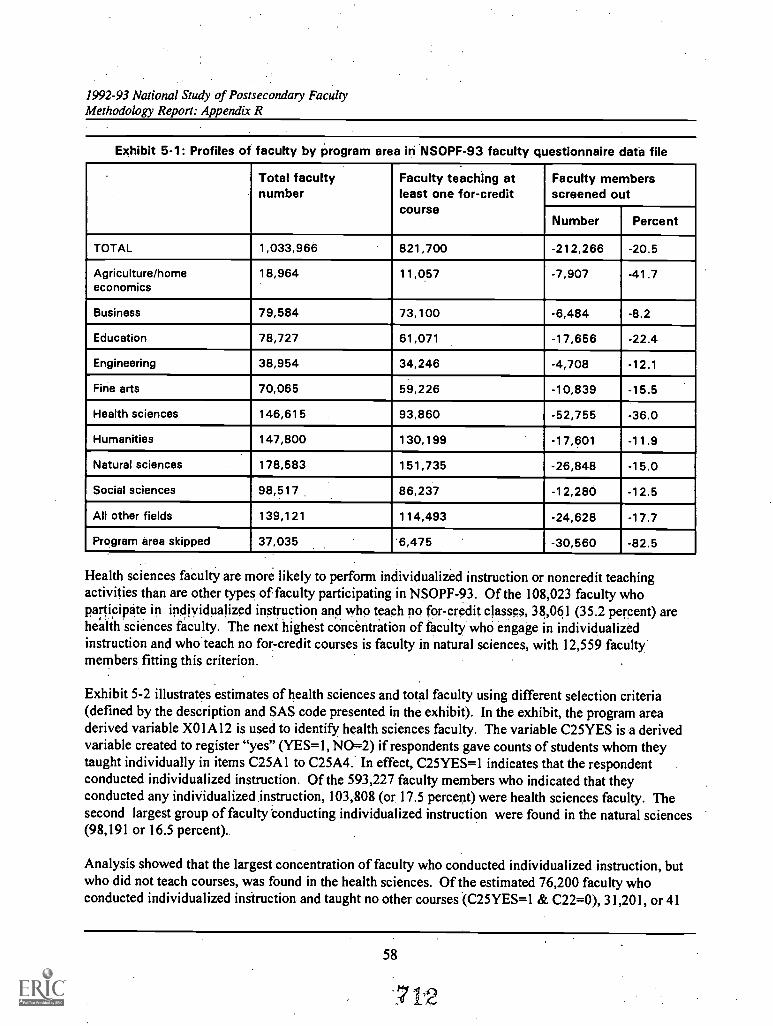
1992-93 National Study of Postsecondary FacultyMethodology Report: Appendix R
Exhibit 5-1: Profiles of faculty by program area in NSOPF-93 faculty questionnaire data file
Total facultynumber
Faculty teaching atleast one for-creditcourse
Faculty membersscreened out
Number Percent
TOTAL 1,033,966 821,700 -212,266 -20.5
Agriculture/homeeconomics
18,964 11,057 -7,907 -41.7
Business 79,584 73,100 -6,484 -8.2
Education 78,727 61,071 -17,656 -22.4
Engineering 38,954 34,246 -4,708 -12.1
Fine arts 70,065 59,226 -10,839 -15.5
Health sciences 146,615 93,860 -52,755 -36.0
Humanities 147,800 130,199 -17,601 -11.9
Natural sciences 178,583 151,735 -26,848 -15.0
Social sciences 98,517 86,237 -12,280 -12.5
All other fields 139,121 114,493 -24,628 -17.7
Program area skipped 37,035 '6,475 -30,560 -82.5
Health sciences faculty are more likely to perform individualized instruction or noncredit teachingactivities than are other types of faculty participating in NSOPF-93. Of the 108,023 faculty whoparticipate in individualized instruction and who teach no for-credit classes, 38,061 (35.2 percent) arehealth sciences faculty. The next highest concentration of faculty whO engage in individualizedinstruction and who teach no for-credit courses is faculty in natural sciences, with 12,559 facultymembers fitting this criterion.
Exhibit 5-2 illustrates estimates of health sciences and total faculty using different selection criteria(defined by the description and SAS code presented in the exhibit). In the exhibit, the program areaderived variable X01Al2 is used to identify health sciences faculty. The variable C25YES is a derivedvariable created to register "yes" (YES=1, NO=2) if respondents gave counts of students whom theytaught individually in items C25A1 to C25A4. In effect, C25YES=1 indicates that the respondentconducted individualized instruction. Of the 593,227 faculty members who indicated that theyconducted any individualized instruction, 103,808 (or 17.5 percent) were health sciences faculty. Thesecond largest group of faculty conducting individualized instruction were found in the natural sciences(98,191 or 16.5 percent)..
Analysis showed that the largest concentration of faculty who conducted individualized instruction, butwho did not teach courses, was found in the health sciences. Of the estimated 76,200 faculty whoconducted individualized instruction and taught no other courses (C25YES=1 & C22=0), 31,201, or 41
58
712
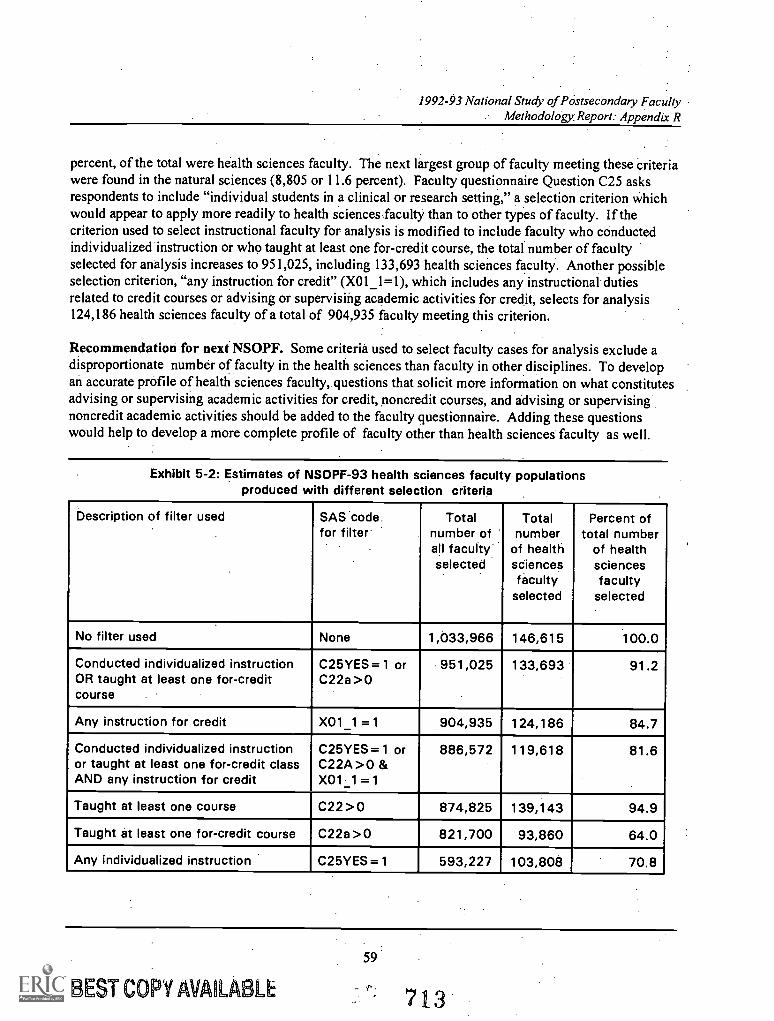
1992-93 National Study of Postsecondary FacUltyMethodology Report: Appendix R
percent, of the total were health sciences faculty. The next largest group of faculty meeting these criteriawere found in the natural sciences (8,805 or 11.6 percent). Faculty questionnaire Question C25 asksrespondents to include "individual students in a clinical or research setting," a selection criterion whichwould appear to apply more readily to health sciences faculty than to other types of faculty. If thecriterion used to select instructional faculty for analysis is modified to include faculty who conductedindividualized instruction or who taught at least one for-credit course, the total number of facultyselected for analysis increases to 951,025, including 133,693 health sciences faculty. Another possibleselection criterion, "any instruction for credit" (X01_1=1), which includes any instructional dutiesrelated to credit courses or advising or supervising academic activities for credit, selects for analysis124,186 health sciences faculty of a total of 904,935 faculty meeting this criterion.
Recommendation for next NSOPF. Some criteria used to select faculty cases for analysis exclude adisproportionate number of faculty in the health sciences than faculty in other disciplines. To developan accurate profile of health sciences faculty, questions that solicit more information on what constitutesadvising or supervising academic activities for credit, noncredit courses, and advising or supervisingnoncredit academic activities should be added to the faculty questionnaire. Adding these questionswould help to develop a more complete profile of faculty other than health sciences faculty as well.
Exhibit 5-2: Estimates of NSOPF-93 health sciences faculty populationsproduced with different selection criteria
Description of filter used SAS code.for filter
Totalnumber ofall facultyselected
Totalnumber
of healthsciencesfaculty
selected
Percent oftotal number
of healthsciencesfaculty
selected
No filter used None 1,033,966 146,615 100.0
Conducted individualized instructionOR taught at least one for-creditcourse
C25YES =1 orC22a >0
951,025 133,693 91.2
Any instruction for credit X01_1 =1_ 904,935 124,186 84.7
Conducted individualized instructionor taught at least one for-credit classAND any instruction for credit
C25YES = 1 orC22A >0 &X01 1 =1_
886,572 119,618 81.6
Taught at least one course C22 >0 874,825 139,143 94.9
Taught at least one for-credit course C22a >0 821,700 93,860 64.0
Any individualized instruction C25YES =1 593,227 103,808 70.8
59
BEST COPY AVAILABLE 713
1992-93 National Study of Postsecondary FacultyMethodology Report: Appendix R
Attachment
Tables Comparing Faculty TotalsReported on NSOPF and IPEDS
1987-1993
61
714
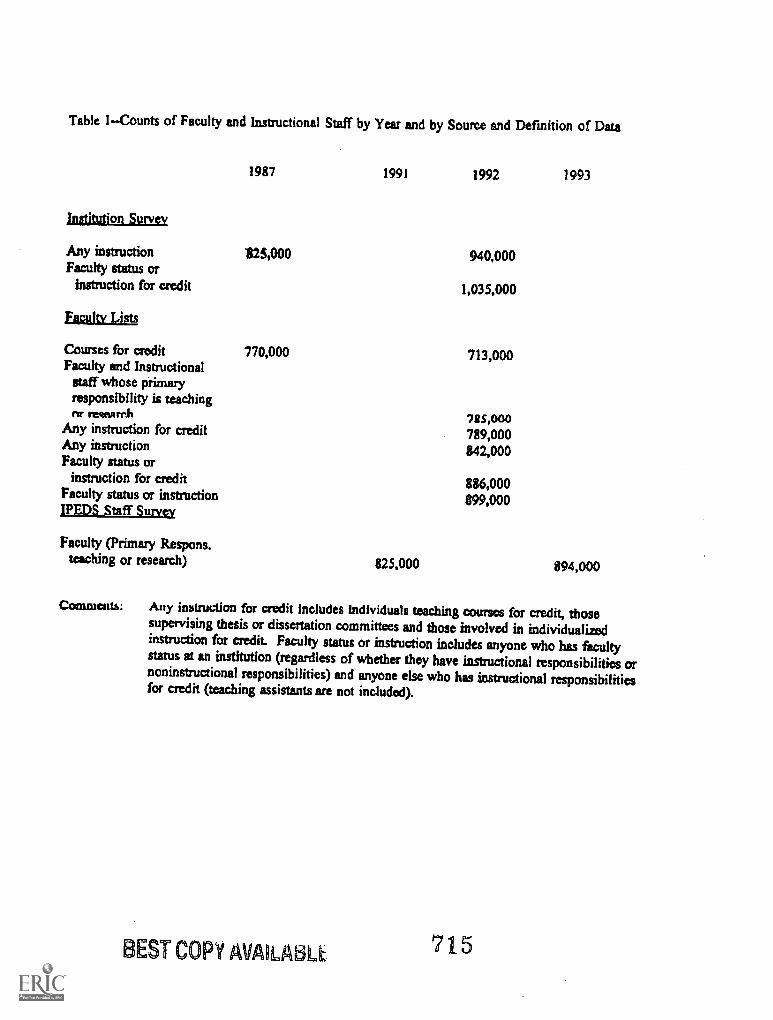
Table 1Counts of Faculty and Instructional Staff by Year and by Source and Definition of Data
1987 1991 1992 1993
Institution Survey
Any instruction 825,000 940,000Faculty status or
instruction for credit 1,035,000
Faculty Lists
Courses for credit 770,000 713,000Faculty and Instructional
staff whose primaryresponsibility is teachingnr rearm rnh 755,000
Any instruction for credit 789,000Any instruction 842,000Faculty status or
instruction for credit 886,000Faculty status or instruction 899,000JPEDS Staff Survey
Faculty (Primary Respons.teaching or research) 825,000 894,000
Commenta: Any instruction for credit includes individuals teaching courses for credit, thosesupervising thesis or dissertation committees and those involved in individualizedinstruction for credit. Faculty status or instruction includes anyone who has facultystatus at an institution (regardless of whether they have instructional responsibilities ornoninstructional responsibilities) and anyone else who has instructional responsibilitiesfor credit (teaching assistants are not included).
BEST COPY AVAitAaL 715
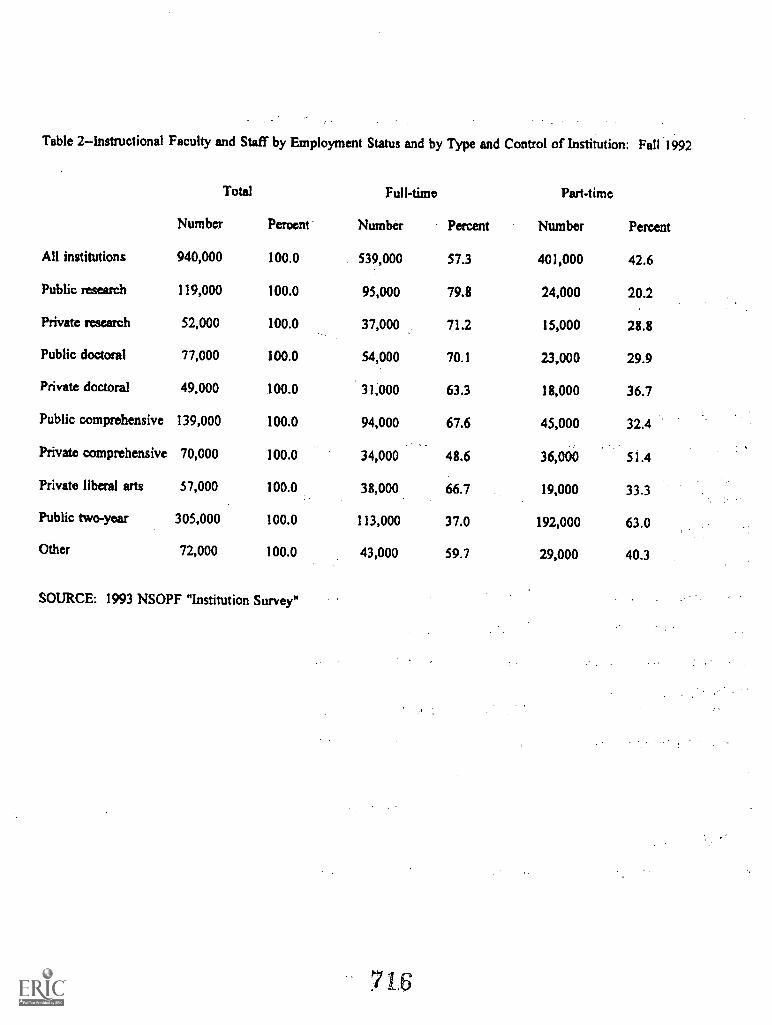
Table 2--Instructional Faculty and Staff by Employment Status and by Type and Control of Institution: Fall 1992
Total
Number Percent'
Full-time
Number Percent
Part-time
Number Percent
All institutions 940,000 100.0 539,000 57.3 401,000 42.6
Public research 119,000 100.0 95,000 79.8 24,000 20.2
Private research 52,000 100.0 37,000 71.2 15,000 28.8
Public doctoral 77,000 100.0 54,000 70.1 23,000 29.9
Private doctoral 49,000 100.0 31,000 63.3 18,000 36.7
Public comprehensive 139,000 100.0 94,000 67.6 45,000 32.4
Private comprehensive 70,000 100.0 34,000 48.6 36,000 51.4
Private liberal arts 57,000 100.0 38,000 66.7 19,000 33.3
Public two-year 305,000 100.0 113,000 37.0 192,000 63.0
Other 72,000 100.0 43,000 59.7 29,000 40.3
SOURCE: 1993 NSOPF "Institution Survey"
716
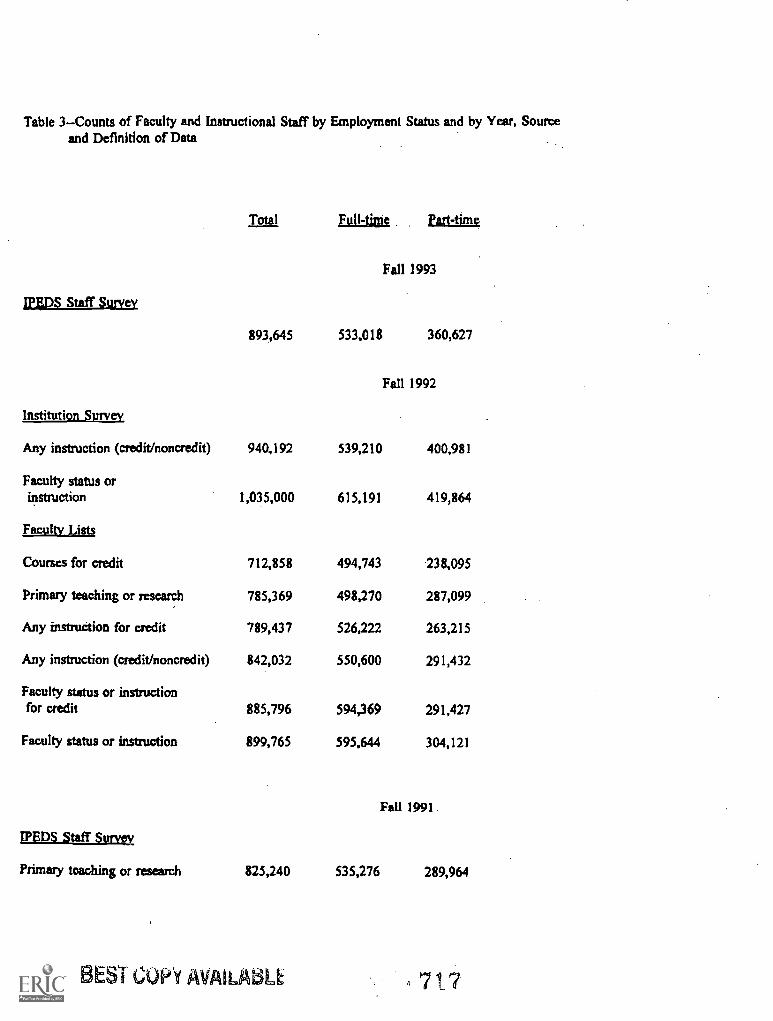
Table 3Counts of Faculty and Instructional Staff by Employment Status and by Year, Sourceand Definition of Data
Total Full-time Part-time
Fall 1993
ups Staff Swvey
893,645 533,018 360,627
Fall 1992
Institution_Survey
Any instruction (credit/noncredit) 940,192 539,210 400,981
Faculty status orinstruction 1,035,000 615,191 419,864
Faculty Lists
Courses for credit 712,858 494,743 238,095
Primary teaching or research 785,369 498,270 287,099
Any instruction for credit 789,437 526,222 263,215
Any instruction (credit/noncredit) 842,032 550,600 291,432
Faculty status or instructionfor credit 885,796 594,369 291,427
Faculty status or instruction 899,765 595,644 304,121
Fall 1991.
REDS Staff Survey
Primary teaching or research 825,240 535,276 289,964
BEST COP 'Y AVAILAS11 7 7
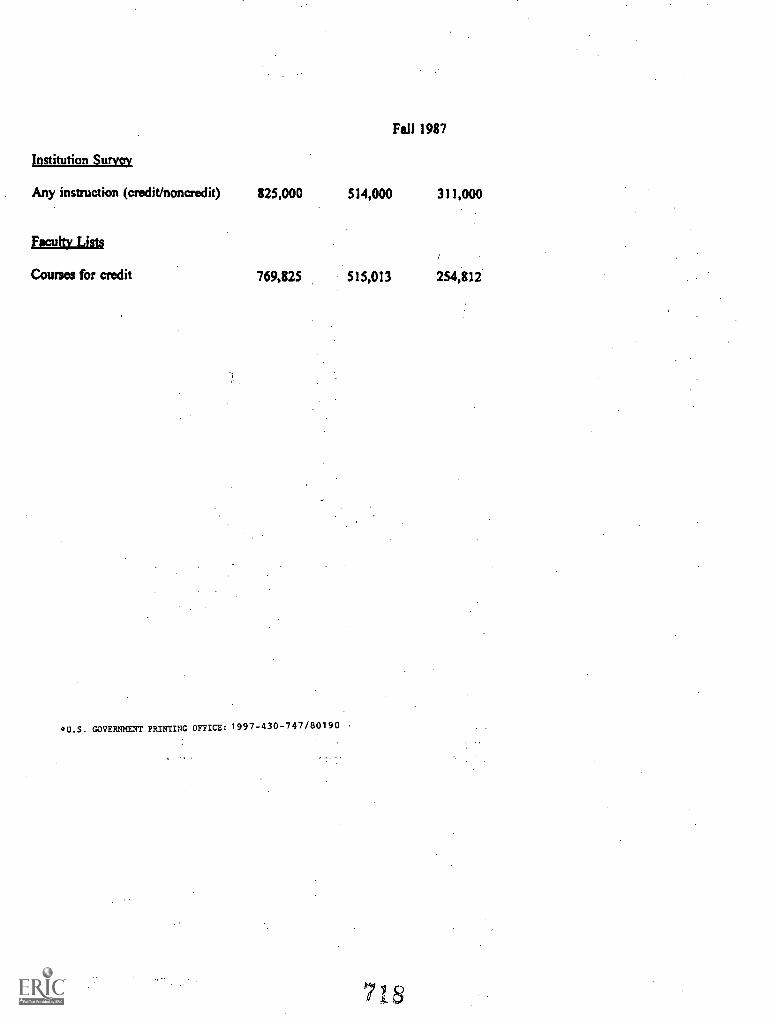
Fall 1987
Institution Survey
Any instruction (credit/noncredit) 825,000 514,000 311,000
faculty Lista
Courses for credit 769,825 515,013 254,812
U.S. GOVERNMENT PRINTING OFFICE: 1 9 9 7 - 4 3 0 - 7 4 7 / 8 0 1 9 0
7 I
t
United StatesDepartment of Education
Washington, DC 20208-5652
Official BusinessPenalty for Private Use, $300 Standard Mail (B)
Postage and Fees PaidU.S. Department of Education
Permit No. G-17
BEST COPY AVAILABLE
E ICIU.S. DEPARTMENT OF EDUCATION
Office of Educational Research and improvement (OERI)Educational Resources Information Center (ERIC)
NOTICE
REPRODUCTION BASIS
49
This document is covered by a signed "Reproduction Release(Blanket)" form (on file within the ERIC system), encompassing allor classes of documents from its source organization and, therefore,does not require a "Specific Document" Release form.
This document is Federally-funded, or carries its own permission toreproduce, or is otherwise in the public domain and, therefore, maybe reproduced by ERIC without a signed Reproduction Releaseform (either "Specific Document" or "Blanket").