Embed Size (px)
Citation preview

EMBARGOED 1400 GMT October 122005 Not for newswire transmission posting on websites or any other media use until 1400 GMT Wednesday October 12 2005 (900 AM EDT Washington DC Wednesday October 12)
Pub
lic D
iscl
osur
e A
utho
rized
Pub
lic D
iscl
osur
e A
utho
rized
Pub
lic D
iscl
osur
e A
utho
rized
Pub
lic D
iscl
osur
e A
utho
rized
This report is part of a series undertaken by the Europe and Central Asia Region of the World Bank The series covers the following countries
Albania Armenia Azerbaijan Belarus Bosnia and Herzegovina Bulgaria Croatia Czech Republic Estonia FYR Macedonia Georgia Hungary Kazakhstan Kyrgyz Republic
Latvia L~huania
Moldova Poland Romania Russian Federation Serbia and Montenegro Slovak Republic Slovenia Tajikistan Turkey Turkmenistan Ukraine Uzbekistan
I
OVERVIEW
GROWTH POVERTY
AND INEQUALITY
Eastern Europe and the Former Soviet Union
Asad Alam Mamta Murthi Ruslan Yemtsov Edmundo Murrugarra Nora Dudwick
Ellen Hamilton and Erwin TIongson
Europe and Central Asia Region
THE WORLD BANK III
copy2005 The International Bank for Reconstruction and Development The World Bank 1818 H Street NW Washington DC 20433 Telephone 202-473-1000 Internet wwwworldbankorg E-mail feedbackworldbankorg
All rights reserved
I 2 3 408 07 06 05
This overview is part of a larger publication Growth Poverty and Inequality Eastern Europe and the Former Soviet Union to be published later this year This overview is a product of the staff of the International Bank for Reconstruction and Development The World Bank The findings interpretashytions and conclusions expressed in this paper do not necessarily reflect the views of the Executive Directors of The World Bank or the governments they represent
The World Bank does not guarantee the accuracy of the data included in this work The boundaries colors denominations and other information shown on any map in this work do not imply any judgment on the part of The World Bank concerning the legal status of any territory or the endorsement or acceptance of such boundaries
Rights and Permissions The material in this publication is copyrighted Copying andor transmitting portions or all of this work without permission may be a violation of applicable law The International Bank for Reconstruction and Development The World Bank encourages dissemination of its work and will normally grant permission to reproduce portions of the work promptly
For permission to photocopy or reprint any part of this work please send a request with complete information to the Copyright Clearance Center Inc 222 Rosewood Drive Danvers MA 01923 USA telephone 978-750-8400 fax 978-750-4470 Internet wwwcopyrightcom
All other queries on rights and licenses including subsidiary rights should be addressed to the Of[jce of the Publisher The World Bank 1818 H Street NW Washington DC 20433 USA fax 202-522-2422 e-mail pubrightsworldbankorg
Cover photo by Anatoliy Rakhimbayev
Cover design by Naylor Design Inc
I
Contents
Overview
Nature and Evolution of Poverty 1998-2003
How Has Poverty Responded to Growth
The Role of Labor Markets and Safety Nets
Affordable Access to Quality Services
Prospects for Poverty Reduction
Bibliography
Appendixes
A Data and Methodology
B Key Poverty Indicators
Overview
This study examines the impact of growth on poverty and inequalshyity in Eastern Europe and the Former Soviet Union during 1998-2003 It updates the World Banks previous study on poverty entitled Making Transition Work for Everyone which appeared in 2000 It asks three questions What are the recent trends in poverty and inequality Why do we see different outcomes across counshytries And how can public policy help maximize the impact of growth on poverty reduction
To measure poverty an absolute poverty line of $2 a dayl is used
comparing it with household consumption per capita This tine is a closer approximation to basic material needs in the Region than the well-known global standard of $1 a day because of the additional expenditures on heating and warm clothing that are required by the
cold climate Using an absolute-as opposed to a relative-poverty
line allows us to focus on those who are deprived of the most basic needs rather than those who may be deprived relative to their bettershy
off fellow citizens It also allows us to determine trends over time and
make comparisons across countries both of which would be difficult if we were using a relative notion of poverty In addition to the $2-a-day poverty line a $4-a-day line is used to capture the notion of ecoshy
nomic vulnerability that is to measure the proportion of the populashy
2 Growth Poverty and Inequality Eastern Europe and the Former Soviet Union
tion that is not absolutely poor but could become poor in the event of
an economic downturn In terms of poverty levels the Region is best thought of in four disshy
tinct subgroups of countries The eight new member states of the European Union (EU-8) have low poverty (less than 5 percent) conshy
fined to specific subgroups of the population2 Countries in Southeastshyern Europe (SEE) have generally moderate levels of poverty (around
5-20 percent) 3 The same is true of the middle-income countries in the Commonwealth of Independent States (CIS)4 The low-income counshytries in the CIS however have extremely high levels of poverty (more than 40 percent)5 In addition to countries in these four subgroups
The Europe and Central Asia Region of the World Bank (ECA) also includes Turkey Wherever possible we treat Turkey as a benchmark against which to evaluate the performance of postsocialist countries in the Region Turkey has moderate poverty We also include two counshy
tries from outside the Region as benchmarks Colombia (a middleshyincome country) and Vietnam (a low-income country)
Summary
The resurgence of growth in the eastern half of the Region particularly in the CIS resulted in a significant decline in poverty in the Region durshying 1998-2003 (figure I )6 more than 40 million people have moved
out of poverty during this period Where roughly 20 percent of the population (or one in five people) was living in poverty today poverty affects only 12 percent (or one in eight people) While much of this poverty reduction has occurred in the populous middle-income counshytries in the Region (Kazakhstan the Russian Federation and Ukraine) poverty has fallen almost everywhere During 1998-2003 poverty fell in most countries of the Region except for Poland and Lithuania in the EU-8 and Georgia in the low income CIS group7 However in the conshy
text of the EU-8 the low overall levels of poverty need to be borne in
mind Income (consumption) inequality showed no clear trend in the
EU-8 and SEE however inequality declined in the CIS with the
notable exceptions of Georgia and Tajikistan
At the same time that 40 million people have moved out of poverty
in ECA as a whole more than 60 million people remain poor and
more than 150 million people are economically vulnerable 8 Progress on the nonincome dimensions of poverty-such as access to educashytion health care safe water and heating-is very mixed with
improvements in some cases and deterioration in others In educashy
tion although access has improved no subregion is free from counshy
tries experiencing declining standards In health no subregion is free
I
3 Overview
from the growing epidemic of human immunodeficiency virus (HIV) and acquired immune deficiency syndrome (AIDS) Quite apart from HIV AIDS and other communicable diseases attaining the health Millennium Development Goals (MDGs) will prove difficult for many
countries in the CIS and SEE because of the failure of health services
to deliver adequate and timely services Access to key infrastructure services-in particular lighting and heating-is actually deteriorating
in some countries of the low income CIS group
The single most important factor behind the significant decline in
poverty in the period in question is high growth in the CIS where the
bulk of the poor reside Combined with moderate levels of inequality
economic growth has delivered significant poverty reduction To some
extent this rebound in growth rates in the CIS is unsurprising
although at the height of the financial crisis in Russia and neighboring
contagion-which came at the end of a decade of difficult transitionshyit was hard to see the prospects for resumption in growth A further
factor influencing poverty reduction since 1999 is the reduction in
consumption inequality in some countries of the CIS which too can
be viewed as a rebound from the levels observed in the 1990s
Because the substantial reduction in poverty is the result of a unique constellation of factors-rapid catch-up growth in the CIS
accompanied by reductions in inequality in some countries-prospects
for poverty reduction going forward are less propitious Very few counshy
tries even those that have made the most progress in reducing poverty have been successful in creating jobs to fully replace those
that have been destroyed To some extent reduction in overall
employment was only to be expected given the socialist legacy of high employment-to-population ratios However the failure to generate a
sufficient number of jobs means that employment-to-population ratios have been falling except in a few of the rapidly growing counshy
tries of the CIS In the EU-8 and SEE the employment ratio is well below what is found in Organisation for Economic Co-operation and
Development (OECD) countries If it persists this failure to expand employment will fundamentally limit the poverty reduction impact of
growth and act as a brake on further reduction of absolute poverty
This is an issue even in countries where poverty is relatively low (for
example Poland where rising poverty is related to the growing divide
between those with and without employment)
In addition to concerns on the jobs front there is a marked regional
and spatial dimension to both the income and nonincome dimenshy
sions of poverty in the Region The most rapid declines in poverty
have been observed in capital cities as opposed to secondary cities
and rural areas In parts of the CIS poverty rates are just as high in
FIGURE 1 More than 40 Million People Moved out of Poverty during 1998-2003 Distribution of Population by Poverty Status
100
90
80
70
=60CI ~
-= 50 CI 040
30
20
10
1998--9 2002-3
_ Nonpoor above $430 a day
c=J Vulnerable above $215 and below $430 a day
_ Poor
below $215 a day
Source World Bank staff estimates using ECA Household Surveys Archive
Note In million persons and in permiddot cent to populationPoverty lines conmiddot verted to local currencies using 2000 PPP Data refer to ECA Region as deshyfined by the World Bank and Turkey is inclUded in the aggregate figures
4 Growth Poverty and Inequality Eastern Europe and the Former Soviet Union
secondary cities as in rural areas Throughout the Region the quality of public services is also poorer outside of capital cities and trends are mixed with some differences between capital and noncapital areas getting smaller and others larger
Overall there is a substantial agenda of reforms if countries wish to reduce poverty in all its dimensions over the coming years While specific actions will vary from country to country all countries need to focus on poliCies that will accelerate rates of growth and ensure that benefits are widely shared among the population In addition efficiency and equity concerns warrant strengthening delivery of edushycation health and public utilities services and enhancing social proshy
tection It is also essential to monitor progress on poverty reduction Poverty and poverty reduction have a special significance in the
Region that is different from that in other parts of the world First as mentioned previously the cold climate means that the notion of
basic needs has to be expanded to take into account the need for warmth Only a small fraction of the population in the developing world would require a similar expansion of the basic needs set Secshyond many countries in the Region completed the demographic and epidemiological transition a few decades ago This graying of the popshyulation poses significant challenges for public policy particularly where there are trade-offs involved in relation to the working (or the young) versus the elderly There is also a greater burden of noncomshymunicable diseases with implications for costs and access to health care Again there are few countries at equivalent levels of income that face a similar challenge Finally the legacy of the former socialist systems of production means that huge inefficiencies exist in the way production is organized how infrastructure is deployed and where people are located Breaking with the past represents not only an opportunity but also a challenge
Trends in Poverty in the Region 1998-2003
Since 1998 absolute poverty at $2 a day (or more accurately $215
a day) has declined in most countries in the Region (figure 2) Two
countries Georgia and Poland bucked the trend of declining poverty
and in another one Lithuania poverty was largely unchanged These trends which are based on comparable consumption aggreshy
gates specially constructed for the purposes of this report reflect the
use of the latest purchasing power parity (PPP) exchange rates (2000
PPP) available for the countries of the Region The use of different PPP revisions affects the ranking of a few countries in the Region
5 Overview
especially those that experienced hyperinflation or continue to pracshytice administrative price setting but leaves the overall extent of poverty and trends unchanged (see overview box l)
As it did five years ago absolute deprivation varies enormously
across the Region At one end of the spectrum are countries in the
low income ClS group such as Tajikistan where the proportion of the population living on less than $2 l5 per day is more than 70 percent
while at the other end are countries in the EU-8 such as Hungary
where absolute poverty by this definition is virtually absent Counshy
tries fall into three broad groups those with high poverty (all low
income CIS countries) those with low poverty (typically EU-8) and those in between with moderate poverty (typically SEE and middle
income CIS countries) These groupings are not hard and fast with
some countries in SEE (for example Bulgaria) and the middle income
CIS group (for example Belarus) having low levels of poverty
Even where incomes have grown and absolute material deprivashytion at $2l5 per day is low the standard of living is not high and
FIGURE 2 At the Country Level Absolute Poverty Has Declined Almost Everywhere Poverty Rates by Country
100
90
80
70
60 c 2 laquoi 50 -=co e co 40 0 of 30
20
10
0 I OOIN 0018 OOIN ~IM _1 M ID 0 m mom 0 0 0 ID 0 mom 0 moo 0 ~ N ~ N - N - N N N
Hungary Lithuania Poland Romania Bulgaria
EU-8 SEE
~IN ~IN -tMoolN _1 M m g ~ g 3 8 ~ g g co- g m 8g- N _ N N N _ N ~ N
Belarus Russian Kazakhmiddot Georgia Uzbeki -Fed stan stan
Middle income CIS Low income CIS
Below $215 aday bull Above $215 but below $430
~IM ~I 01 ~I~ g g 3 - N ~ N N N - N
Moldova Armenia Kyrgyz trajikistan Rep
bull
Source World Bank staff estimates using EGA Household Surveys Archive
Note2000 PPP
6 Growth Poverty and Inequality Eastern Europe and the Former Soviet Union
OVERVIEW BOX 1
Using Purchasing Power Parity to Measure Poverty
An absolute poverty line as the name implies attempts to establish the value of consumption
that a person needs to stay out of poverty regardless of time and place The first widely acshy
cepted global poverty estimates produced by the World Banks World Development Report in
1990 chose a poverty line measured in 1985 PPP Chen and Ravallion (2001) have since updatshy
ed these numbers using 1993 PPP exchange rates for consumption The PPPs were again upshy
dated for the Region in 1996 and this updated set was used by Making Transition Work for
Everyone (World Bank 2000a)
This report uses the most recent PPP numbers from 2000 (OECD 2003) More recent data on
PPP are more relevant for the transition economies of the Region because they reflect contemshy
porary (in many cases liberalized) prices as opposed to the administered prices of the past For
Turkey a country without the legacy of an administratively directed economy all PPP revisions
produce approximately the same poverty counts (see figure) The economies of all formerly soshy
cialist countries exhibit significant changes with more recent numbers being more plausible
For example it is highly implausible that poverty in Uzbekistan is negligible (which is the imshy
pression that one gets using 1993 and 1996 PPPs and could be traced to widespread price conshy
trols in that country practiced during the 19905) Errors can also go the other way (that is overshy
state poverty) as appears to be the case when the 1993 PPP is used for Georgia In addition to
issues with relative prices Georgia experienced hyperinflations around 1993 which would have
made measurement of prices problematic It would be incorrect to say that the 2000 PPP revishy
sion solves all comparability problems Where interferences in market mechanisms continue
price surveys that form the basis for PPPs will deliver incorrect results (a factor that can be partshy
ly responsible for the low poverty headcount for Belarus)
large shares of the population are found to consume between $2 15 and $430 per capita per day This group while not absolutely deprived is likely to have relatively low savings and is vulnerable to
poverty in the event of shocks that affect earning potential Of course an absolute poverty line of $215 a day (or some mulshy
tiple) is one of many potential lines that could be drawn Often what is relevant from the perspective of the poor is the level of
resources that may be needed in the country context to be free from h unger cold and other forms of deprivation In this report the authors have chosen to use an absolute concept of deprivation not only to focus more on those who are deprived in some fundamenshytal sense but also to facilitate comparisons across countries and over time The basic needs without which individuals would be
7 Overview
Poverty Rates at $215 a Day with Different PPPs Countries Sorted by Poverty Based on 2000 PPPs
-- 1993 PPP -- 1996 PPP -- 2000 PPP
Soumis Staff estimates DECO 2003
The total poverty headcount for the Region does not change much whether one uses the 1993
PPP or the 2000 PPp although individual country assessments are affected However the 1996
PPP (with few exceptions Bulgaria Estonia and Lithuania) produces a lower poverty count than
the 2000 PPP does It is important to note that only the ongoing global International Comparison
Program (wwwworldbankorgldataicpl expected to produce results by 2007 will address fundashy
mental problems of all existing sets of PPP in their application to poverty comparisons Internashy
tionally comparable poverty data produced for this study need to be interpreted with due caution
Sounes World Bank staff World Bank 2000a Chen and Ravallion 2001 Kakwani and Sajaia 2004 DECO 2003
absolutely deprived are typically reflected in national poverty lines9
As might be expected standards of income required to ensure against material deprivation in richer countries are higher so
national poverty lines are positively related to income levels
National poverty lines in the Region suggest that a poverty line
around $2 per capita per day might indeed be a relevant absolute
floor (figure 3) When compared with national poverty lines from a
random selection of non-Region countries the Regions poverty
lines are found to be higher on average perhaps reflecting the
higher cost of basic needs due to the extremely cold climate in cershy
tain countries However high though they may seem even the
highest national poverty lines in the Region are substantially lower
than poverty lines of two of the poorest EU-15 countries 10 Greece
8 Growth Poverty and lnequality Eastern Europe and the Former Soviet Union
FIGURE 3
The Lowest National Poverty Line in the Region Is around Two Dollars a Day
9$
bull Greece 8$
c bull PortugalCgt
~ 7$
~
~ 6$
Cgt
~ 5$
~ ~ 4$ ~ Cgt Cgt 3$
ii c Cgt ~ 2$ z
1$ - --- --- - -~- ---- - --- -------- --- - --- --------- shy
Hungary
bullBulgariabull
Nigeria Burkina Faso
O$L---------------~~---------------
1$ 10$ 100$
Level of consumption per capita per dayperson log
bull NonmiddotEGA countries bull EGA countries
Sources Region World Bank staff estimates nonmiddotRegion Kakwani and Sajaia 2004 and DEGD 2003 EUDennis and Guio 2004
Note latest years of available data used all values expressed in 2000 PPP $
and Portugal Using measures of absolute deprivation that are more consistent with national poverty lines but still modest (such as $430 per capita per day) it is evident tbat absolute deprivation continues to exist even in relatively well-off countries such as EU-membershystate Hungary (figure 2)
How has poverty risk evolved in the past five years Looking below the national averages on population subgroups four characteristics
stand out for raising poverty risk (that is poverty incidence) above
average being young living in a rural area or (in some cases) a secshyondary city being unemployed and having low levels of education I I
Although not equally important in all subregions these were the
same groups identified as having a higher-than-average poverty incishy
dence five years ago (World Bank 2000a)
Outside the low income CIS countries children face a substantially
higher risk of poverty than other population groups do Relative
poverty risk for children has actually increased in the past five years
because poverty incidence has fallen less rapidly among families with
children than for other groups (figure 4a)
9 Overview
Residents of rural areas face a higher risk of poverty than those in
cities do (figure 4b) Among the rural dwellers children usually face
the highest poverty risk often multiple times the national average
But in some countries of the CIS poverty risks are as high in secondshy
ary cities as in rural areas Indeed lumping capital cities together with
other urban areas can be misleading because of the contrast between
their positions Over the past five years with few exceptions poverty
has declined far more rapidly in capital cities than elsewhere As a
result residents of rural areas and secondary cities face a far greater
risk of poverty relative to capital city dwellers than previously
Outside the low income CIS countries the unemployed face sigshy
nificantly higher risks of poverty than the employed do (figure 4c)
With the resumption of sustained growth in the CIS and an improveshy
ment in the position of the employed the relative risk of poverty
faced by the unemployed has increased significantly
The risk of poverty falls with educational attainment As shown in
the report over time the risk of poverty of those with basic education
FIGURE 4a Children Face a Greater Risk of Poverty than Other Population Groups in Most Cases This Risk Has Increased over Time
25
-II () c-O c
~
2 I
~
15 ~ ~ middotu E K -6 ~ E ~ A-A t a ~ gt 1 - - shy ~ t2t e4 Q - ~ ~
~ - ~ =
()
c
05 +---+ ~ ~
Hungary Poland Romania Bulgaria Russian Kazakh - Moldova Georgia Armenia Kyrgyz Rep Tajiki-Fed stan stan
EU-8 SEE Middle income CIS Low Income CIS
--- lt6years -e- 7- 14 years -6- 15-17 years - between 18 and 65 years -+- ~ 66 years
SourceWorld Bank staff estimates using ECA Household Surveys Archive
Note 2000 PPP Poverty line for the EU-8 and Bulgaria is $430 per day Risk of 1 indicates that an age group is no more or less likely than the average to fall into poverty
10 Growth Poverty and Inequality Eastern Europe and the Former Soviet Union
FIGURE 4b Poverty Reduction in Secondary Cities and Rural Areas Has Lagged behind Capital Cities
Poland
Hungary
Lithuania
Romania (I)
Macedonia FYR
(I) Russian Fed c
g~ - QlEu
Kazakhstan
Moldova
Georgia
(I)
c Kyrgyz Rep E Q
U
Armenia ~
Tajikistan
Uzbekistan
- 0 + 100
Change in poverty
bull 2003 capital cities bull 2003 secondary cities bull 2003 rural areas
o Change in poverty D Change in poverty bull Change in poverty capitalcities secondary cities rural areas
SourceWorld Bank staff estimates using ECA Household Surveys Archive
Note2002 data used instead of 2003 in Russia Poland and HungaryThe benchmark year to measure change is 1998 exshycept in Kazakhstan where it is 2001 Kyrgyz Republic and Uzbekistan 120001 and Tajikistan 11999) Poverty line for the EUshy8and FYR Macedonia is $430 per day everywhere else it is $215 per day in 2000 PPP
50
Percent of population defined as poor
11 Overview
or less rdative to other groups has increased reflecting their handishycap in benefiting from new economic opportunities
Ethnicity is also associated with higher-than-average poverty incishydence in some cases Data on ethnicity are sometimes not covered in surveys and even where they are sample size may preclude any
robust conclusions While the data do not allow trends to be inferred relatively strong evidence exists that in more than one country groups such as the Roma of Central and Eastern Europe (CEE) face a substantially higher incidence of poverty than the general population does (World Bank 200lc World Bank 2002g and World Bank 2005e) Available evidence on other minorities is mixed with some faring worse than average such as the Turkish minority in Bulgaria or the Russian minority in Latvia while others do better such as the Russian minority in the Kyrgyz Republic or the Hungarian minority in Romania (World Bank 2003i World Bank 2003k World Bank 2004g) The relative position of minorities is a function of human
capital and other endowments relative to the population as a whole and of their position in relations of power which may vary from
group to group Within countries poverty incidence shows marked variation and
there is evidence that regional differences are growing over time in some countries (figure 4d) This is because poverty rates have typishycally declined more sharply in capital cities and other prosperous areas of trade and tourism than in rural areas or secondary towns In a related vein many countries outside the low income CIS group (where information is more limited) show high and highly persistent differences in unemployment rates across regions
Composition ofthe poor Most of the poor in the Region comprise workshying adults and children who between them account for 60-75 pershycent of the poor (figure 5) In most instances poor children are children of working parents This structure of poverty with the preshydominance of working families (that is households with working adults) is no different from that of the past although the share of working families has declined The next largest group comprises those
out of the labor force followed by the unemployed and the elderly
With regard to location urban and rural residents are evenly split
each constituting around 50 percent of the poor in the Region as a
whole This split is influenced by an interaction of higher-than-avershy
age poverty risk for rural residents and their relatively low share in
the population In relation to subregions rural residents form the
bulk of the poor in the low income CIS group (70 percent of the poor) SEE (62 percent) and the EU-8 (5l percent) The only subregion that
12 Growth Poverty and Inequality Eastern Europe and the Former Soviet Union
FIGURE 4c The Unemployed Face Higher Risks of Poverty than the Employed This Risk Has Grown over Time in the CIS
350
300 gt)(0 Q ~ 250
e -
shy~ ~ 200
~~ Q 150 e gt amp I 100
050 Poland Romania
EU-8 SEE
Belarus Russian Kazakh-Fed stan
Middle income CIS
Moldova Georgia Tajikistan
Low income CIS
bull 1998 poverty of unemployedpoverty of employed
2002 poverty of unemployedpoverty of employed
SourceWorld Bank staff estimates using ECA Household Surveys Archive
Note For Kazakhstan 2001 is used instead of 1998 and 2003 instead of 2002 for Tajikistan 1999 instead of 1998 and 2003 instead of 2002 For Romania and Moldova 2003 is used instead of 2002 For the EU-8 and Belarus the poverty line is $430 everywhere else it is $215 aday in 2000 PPP
FIGURE 4d There Are Marked and in Some Cases Increasing Differences in Poverty across Regions
30 bull
25
o 20
~ 15gt o 0
fti2 10 ftj Z bull
5 bull
Source World Bank staff estimates using ECA Household Surveys Archive
Note The box depicts the spread in regional poverty rates Iboxes plot upper and lower boundaries called interquartile range of the interval where most of the regional poverty rates would fall and the whiskers the extremes) Dots represent outlying regions in a statistical sense
- - - -
13 Overview
is dominated by urban poor is the middle income CIS group (only 41
percent rural poor)
Trends in poverty depth At the end of the 1990s the general undershy
standing was that poverty in the Region while widespread was relashy
tively shallow The pattern five years later appears more varied with
the Regions countries now spanning a wide range (figure 6) Using
Turkey Vietnam and Colombia as the benchmarks shows that poverty in the low income CIS group is fairly deep but in the middle income
CIS countries and SEE it is fairly shallow In the EU-8 the picture (relshy
ative to a $430 poverty line) is mixed with examples of both shallow
and deep poverty
Trends in inequality While there is no clear trend in the EU-8 and SEE
consumption inequality in the CIS declined (with few exceptions)
between 1998 and 2003 (figure 7)12 By 2003 consumption inequalshy
ity in the Region as a whole looked broadly comparable to that in
OECD countries and East Asia While inequality in consumption does
not appear egregiously high subjective data suggest that people in
the Region continue to find inequality to be excessive This may be
FIGURE 5 Working Adults and Children Continue to Form the Bulk of the Poor in the Region
100 r- r- r- r- r- r-
c 752 = E co 50 ~ co c ltf 25
1998 2002 1999 2003 1999 2002 1999 2003 1999 2003
Poland Romania
EU-8 SEE
Russian Fed
Middle income CIS
Moldova Tajikistan
Low income CIS
aChildrenllt16 years) 8Working (employed+self-employed) 8 Unemployed ~Inactive cElderly (66 years)
SourceWorld Bank staff estimates using ECA Household Surveys Archive
Noll For the EU-8 and Bulgaria the poverty line is $430
14 Growth Poverty and Inequality Eastern Europe and the Former Soviet Union
FIGURE 6 In Some Countries Poverty Is Shallow in Others Deep Deficit in Consumption of an Average Poor Person as Percentage of Poverty Line
Hungary
PolandI I w Lithuania
Estonia
Serbia amp Montenegro w w CI) Albania
Romania Russian Fed
2~~ E5 ~ Kazakhstan
Armenia
CI) Moldova
~ UzbekistanE
CI ltgt 5 Kyrgyz Rep ~ CI Georgia
Tajikistan
IIgt Vietnam E
c Colombia ltgt c III Turkey
-5 -15 -25 -35 -45
Depth in to poverty line
SOUfce World Bank staff estimates using ECA Household Surveys Archive
Note For the EU-B the poverty line is $430 everywhere else it is $215 per day per capita in 2000 PPPlatest year of availshyable data used
related in part to the fact that despite recent faIls in the CIS inequalshyity remains significantly higher than at the outset of the transition
The decline in inequality in most of the CIS (with the notable
exceptions of Georgia and Tajikistan) also runs counter to widely held
perceptions that the bounce-back in growth has gone hand in hand with widening income differentials There are at least three reasons
why subjective and objective measures may suggest different trends
First changing relative positions of different population subgroups
may leave overall inequality unchanged but may lead to the impresshy
sion of growing inequality For example the rise in the position of
capital city dwellers relative to residents of secondary cities may leave overall inequality unchanged (as for example would be the case if
the two groups simply switched positions in the income distribution) but may contribute to the perception of a growing divide
15 Overview
FIGURE 7 While Changes in Distribution Have Gone Either Way in the EU-8 and SEE They Have Moved in Favor of the Poor in the CIS (Georgia and Tajikistan Excepted)
Estonia
exgt Hungary
Lithuania
Poland
Albania
Bulgaria en Romania
Serbia amp Montenegro
en Belarus C3 E Kazakhstan 0 Ru ssian Fed i Ukraine
Armenia en C3 Georgia E 0 Kyrgyz Rep ~ 0 Moldova
Tajikistan
Colombia ~
E c Turkey c
CICI Vietnam
0100 0200 0300 OAOO 0500
Gini Index
1998 2003
Source World Bank staff estimates using ECA Household Surveys Archive
Note Gini index for per capita consumption
Second measures of inequality typically employed in the literashyture (including in this report) are measures of relative inequality however subjective perceptions often relate to absolute differences in income not relative ones For example if everyones income increases by 10 percent measures of inequality (such as the Gini
16 Growth Poverty and Inequality Eastern Europe and the Former Soviet Union
coefficient employed in this report) would show no change in the distribution of income 13 However the absolute difference in the incomes of the rich and the poor would have increased (for example 10 percent growth means a larger absolute increase in income for
the rich than for the poor) contributing to a perception of growing inequality14
Third sampling and nonsampling errors mean that survey data may do a poor job of measuring income growth at the top of the disshytribution and thus may end up underestimating upward drift in inequality This is a worldwide problem however if there is confishydence in the quality of the data at the lower end of the distribution
one can be reasonably confident of trends in poverty and inequality in the vicinity of the poverty line In the Region because of data
improvements in all but a handful of countries the measured trends in poverty and inequality are robust
Factors Contributing to Poverty Reduction 1998-2003
Growth in output and wages Since 1999 the growth of the gross domesshytic product (GDP) in the Region has been impressive (higher than the world average) with the CIS the most rapidly growing subregion For the CIS the recovery of growth in Russia has been an important facshy
tor The devaluation that accompanied the financial crisis in Russia was important for restoring the exchange rate to a more competitive level and spurring the recovery of exports and growth Combined with high prices for oil and other natural resources this gave a huge boost to the Russian economy which has in turn become a regional locomotive for many neighboring countries Structural reforms that had been undertaken by many of the CIS countries enabled an improved supply response when the opportunity presented itself For
the EU-8 the prospect of accession provided a strong impetus for
both reforms and growth while the restoration of peace and stability
in SEE was an important factor in sustaining recovery (figure 8)
Mirroring the growth in output there has been a sharp upswing in
average wages in all economies in the Region For example in the
low income CIS group real wages have almost doubled since 1997 Data on wages by profession or by position in the income distribution
suggest that this upswing has been shared alike by unskilled and
skilled poor and nonpoor In most cases wage increases have been
larger than increases in productivity reflecting in part the bounceshy
back of wages from the very low levels observed in the late 1990s in
the CIS and parts of SEE
17 Overview
While growth has resulted in the creation of new and more proshyductive jobs only the fast-growing economies of the CIS have been able to create jobs at a sufficient pace to replace ones that were lost Employment-to-population ratios have therefore stayed steady or declined almost everywhere outside the CIS (figure 9)15 Because of the failure to engender sufficient job creation the EU-8 and SEE are
well below the Lisbon targets of 70 percent of the labor force in employment 16 The position is somewhat different in the CIS where
employment levels tend to be higher and in many cases are trending upward (with some notable exceptions such as Georgia and Tajikshy
istan) While some fast-growing countries have succeeded in increasshying wage employment (for example Russia) in many low-income countries the main source of employment growth has been through the expansion in self-employment (for example Moldova)
Even where employment ratios are stable there has been a continshyuing reallocation of labor across sectors In most of the EU-8 agriculshyture employment fell and its relative share of employment is now close to the EU benchmark In contrast agriculture employment increased in
most SEE and low income CIS countries Expansion of employment in services was observed in almost all countries in the Region
FIGURE 8 Since 1999 Growth Rates in the Region Have Been High with the CIS the Most Rapidly Growing Subregion
15
10
I
~ Or----~--~~~~--~r-~~~~--~--~~--~~ l
- 10
-15
-20
-25
EUmiddot8 - SEE - Middle income CiS - Low income CIS
SourceWorld Development Indicators (World Bank 2005i)
20 Growth Poverty and Inequality Eastern Europe and the Former Soviet Union
in distribution in poverty reduction for selected growth periods since 1998 The growth share measures how much poverty reduction can be attributed to growth in mean incomes on its own (that is assuming no changes in the distribution) while the distribution share measures how much can be attributed to changes in the distrishybution of incomes alone assuming no change in mean income Figshyure 11 highlights the overwhelming importance of growth to poverty
reduction over the period in question Relative to growth the contrishybution of changes in distribution to poverty reduction has been relashytively small But as small on average as they appear changes in distribution have clearly been quite important in some countries For example in Poland in 1998-99 40 percent of the increase in poverty is attributable to the increase in inequality while 60 percent is attribshyutable to the decline in income In a number of countries in the CIS the share of changes in distribution to poverty reduction in the period since the end of the financial crisis is more than 20 percent
Role of public transfers In addition to wages public transfers are an important component of household income and play an important role in poverty reduction In most countries social protection benefits
FIGURE 11 The Share of Growth in Poverty Reduction Is Dominant across All Regional Subgroups
20
~ 10 0 CI
ltfl
~ Q CI - 10 5 -20 ~ ()
I -g ro ~(U c cc -0 ro ro ro ro-0 ci ~~ gtmiddotc middotc middotc ~sect ~ ~ 0 0
~ 0 iii ro ~ a ~ -0-0 0c c0 EQi~ ~ (5 ro~ ro0shy ltC0 0 co J or ~ ~ ~~ ~a a gtshy1 ~
ro
gtshya a 2001- 22000-1 2001-2 2000-1 2000-1 2001 - 2 2002-3 1998-9 1999shy 2002- 3 2000-2 1998-9 2000-1 1998-9 1999shy 1999shy1998-9 1998-9
EU-8 SEE
Overall change in poverty
Due to growth bull Due to inequality
2002 Middle income CIS
20032002 Low income CIS
Sourcemiddot World Bank staff estimates using ECA Household Surveys Archive
21 Overview shy
have increased in the past five years in real per capita terms along with the growth of fiscal revenues Where data are available they suggest that benefits have also improved in both coverage and adeshyquacy The reduction in arrears particularly in pensions but also in other benefits has no doubt contributed to these improvements As a result social protection transfers have come to play an important role in reducing poverty Indeed poverty would have been significantly higher in a hypothetical no-transfers situation (overview table 1)
While somewhat Simplistic particularly in assuming no behavioral response in the no-transfer scenario (except in a few instances) the
data are nonetheless illustrative of the importance of public transfers to poverty reduction especially outside the low income CIS group
Private transfers In the low income CIS countries and parts of SEE remittances and other private transfers by far exceed publicly proshyvided resources In some cases remittances accounted for more than 10 percent of GDP and boosted consumption levels including among the poor helping to reduce poverty however the size of the impact is difficult to estimate because of various data limitations (Chernetsky Forthcoming)
OVERVIEW TABLE 1 Transfer Payments for Social Protection Have Had an Important Role to Play in Reducing Poverty outside of the Low Income CIS Countries
Incmeln PlMltYwiIhout Veer an socIallr1 I
EUmiddot8 Poland 2001 141
SEE Bosnia ampHerzegovina 2001 68 Bulgaria 2001 156 Romania 2002 49 Serbia Montenegro
Middle income CIS Belarus Kazakhstan
Russian Fed Low income CIS
Armenia Kyrgyz Rep
Benchmark Countries
Vietnam
2003 2002
2002 2002 2002
2001 2001
1998
41 34
143 100
68
12 10
5
Sources For ECA World Bank various poverty assessments for Vietnam Van De Walle 12002)
Note Simulations use national poverty lines Some behavioral response is assumed in Romania 150 percent oj transfer inshycome is replaced) and Serbia 172 percent of transfer income is replaced in rural areas 87 percent in urban areas)
22 Growth Poverty and Inequality Eastern Europe and the Former Soviet Union
The impact of public and private transfers on inequality is mixed Parts of the public transfer system such as well-targeted social assisshytance programs can be fairly progressive Others may be regressive
The largest program in most countries however is the public pension program which tends to be distributionally either neutral or regresshysive The overall impact thus varies from country to country with examples of both fairly progressive and fairly regressive systems in
the Region Unfortunately there has been little systematic study of the contribution of public and private transfers to changes in inequalshyity over this period
Nonincome Dimensions of Well-Being 1998-2003
What are the trends in the nonincome dimensions of well-being Although there has been a reduction in poverty trends in the noninshycome dimensions of well-being such as access to education health care safe water and heating are markedly variable Inequalities in access whether to good schooling or health care or reliable water and electricity persist and in some cases have increased particularly in the CIS In these countries many people have thus come to have more income in their pockets but in access to services and quality of services they may be no better off
Education The most acute form of education deprivation is illiteracy Average literacy among the transition countries of the Region is high (more than 98 percent) and in the transition country with the lowshyest level of literacy (Tajikistan) 96 percent of adults are literate In a benchmark country Turkey literacy was much lower to start with and despite increases stood at just 875 percent in 2002 Thus the extreme form of education deprivation does not appear to be a major issue in the Region
Since 1998 many countries in the Region have maintained or
improved their high levels of school enrollment Most countries
entered the 1990s with a widespread network of education services
that enabled them to achieve almost universal coverage in compulsory
education However some of these achievements were eroded during
the 1990s particularly among the low income CIS group and some countries in SEE although even with the decline in coverage enrollshy
ment in the compulsory cycle was typically higher than in comparator
countries Since 1998 enrollment in the compulsory cycle has been maintained or improved except for some poor countries such as Georshy
gia the Kyrgyz Republic and Tajikistan which have still not managed
23 Overview
to arrest the decline (figure 12) While there is evidence of some income gradient in enrollment with children from better-off households havshying better coverage the gradient is not large Continuing high coverage in most countries of the Region suggests that the prospects for meeting the MDG of universal primary enrollment are fairly good (World Bank 200Sc) Gender inequality in compulsory education has not been an issue except in Tajikistan where it continues to warrant attention
Compared with the primary level enrollments at the secondary level have increased throughout the Region This increase has genershyally been accompanied by a reduction in enrollment gaps across
income groups except in a few low income CIS countries Urbanshyrural gaps have also been reduced in virtually all countries Interestshyingly gender inequalities at this stage of education favor girls The exceptions to this are Bulgaria and Tajikistan Although the ratio of female to male enrollments in Tajikistan has increased over the past five years it continues to be low by the standards of the Region
Returns to education which were highly variable during the 1990s particularly in the CIS have now stabilized at levels similar to those of market economies This underlines the value of investment in educashytion not only for its own sake but also as a means for ensuring adeshyquate standards of living particularly for the poor However returns are a function not simply of access but also of quality of education Compared with enrollments trends in quality of education are less
sanguine Despite increases in spending on a real per capita basis almost everywhere in the Region the failure to invest sufficiently in the quality of infrastructure or staff means that quality is not being maintained For example Trends in International Mathematics and Science Study (TIMSS) data suggest that although performance of eighth graders continues to remain good relative to those in other countries including those in OECD countries at higher levels of income scores are declining in all but a handful of countries in the EUshy8 Where the analysis is available it suggests that the declines are in large part due to a sharp increase in the share of students who are serishyously underperforming Often these students tend to be in schools
where the quality of service provision is marginal such as rural
schools Reading scores of 1S-year-olds from the Programme for Intershy
national Student Assessment (PISA) present no different a picture Apart from a small handful of countries in the EU-8 scores are declinshy
ing or low
Health care Trends in health status and health care utilization are
mixed Declines in male life expectancy (particularly in the successors of the Former Soviet Union) which had become one of the most
24 Growth Poverty and Inequality Eastern Europe and the Former Soviet Union
FIGURE 12 Access to Secondary Education Has Gone Up Virtually throughout the Region but Some Countries Continue to Struggle to Arrest the Decline in Primary Enrollment Rates Enrollment in Primary Education (7-14 years)
100
98 bull I Ci
c 96
S bulltI I I94 e amp
bullc 92 amp
shy I90
88 +-------------------------------------------------------- Poland Hungary Bulgaria Romania Russian Kazakh- Kyrgyz Georgia Moldova Armenia Tajikistan Colombia Turkey Vietnam
Fed stan Rep
BenchmarksEU-8 SEE Low income CISMiddle income CIS
bull 1998 amp 2002--)3
Enrollment in Secondary Education (15-17 years)
100
1 bull
95
90
1 I ICi 85c 80 S
65
ItI 75 bull e 70 c amp
- ~ 60 bull 55
50 Hungary Poland Bulgaria Romania
EU-8 SEE
bull 1998-99 amp 2002--)3
Ru ssian Kazakh-Fed stan
Middle income CIS
Armenia
amp
Georgia Kyrgyz Moldova Tajikistan Colombia Turkey Vietnam Rep
Low income CIS Benchmarks
SourceWorld Bank staff estimates using ECA Household Surveys Archive
25 Overview
widely documented negative health outcomes of the transition have
generally been arrested However many of the proximate causes of high male mortality notably the high incidence of cardiovascular and
circulatory disease and death from accidents and acts of violence
remain As with male life expectancy child and maternal mortality
are also trending in the right direction However the very slow
progress in achieving reductions in mortality and concerns about the
delivery and quality of critical medical services imply that many counshy
tries in the CIS appear unlikely to meet the child and maternal morshy
tality-related Millennium Development Goals (MDGs) (World Bank 2005c)19
There is a growing threat to the health of the Regions population
from HIVAIDS and tuberculosis (TB) particularly in the CIS but also
to some extent in SEE and the EU-8 (the Baltic countries) The Region
as a whole currently has one of the most rapidly growing infection
rates of HIV I AIDS in the world due to problems related to the increase in injecting drugs and commercial sex work a concurrent
increase in the incidence of sexually transmitted infections (STIs)
high migration rates limited capacity of governments and civil socishy
ety to implement effective preventive responses and low levels of
awareness of HIV and STIs Drug transit through the CIS and growth
of local consumer markets for drugs are also contributing to the probshy
lem At current rates of infection and treatment the HIV I AIDS MDG
is unlikely to be attained by a broad swath of countries in the Region (World Bank 2005c)
Countries in the Region have a large network of public health
providers that distributed generous services and that suffered major fiscal restrictions during the 19905 Between 1994 and 1999 counshytries in the Region spent on average 4 percent of GDP on health rangshy
ing from 1 percent in Georgia (low income CIS group) to 9 percent in
Croatia (SEE) After 1999 some countries in the low income CIS
group continued to experience reductions in public spending on health Other poor countries were able to stem the decline in spendshy
ing but only at very low levels of spending (for example Armenia)
Even where funding may be on the upswing outside the EU-8 it is
not close to levels experienced at the outset of the transition
While funding levels may have stabilized or even increased this is
not reflected in improving quality particularly for the poor because of
three factors First the very large network of providers has largely been
retained resulting in an underfunded and hence ineffective network
in many countries Second the lack of resources for basic interventions
like public health activities has resulted in a repeated failure to stem
communicable diseases Third the changing demographic composition
26 Growth Poverty and Inequality Eastern Europe and the Former Soviet Union
of the population (which is becoming older) has altered the morbidity profile and increased the costs of health provision Vulnerable populashy
tion groups (such as rural or small-town dwellers or the poor) are expected to have borne the brunt of not only the misallocation but also the failure of resources to keep pace with needs
The lack of public resources increased the use of fee-for-services in a mostly unregulated setting reducing the demand for health care
Official statistics show the decline in utilization of health care during the 1990s but after 1999 this remained stable or even recovered (figshyure 13) Inpa tient care in the low income CIS group declined more than 20 percent between the mid-l 990s and 2000 only to stop after
2001 Countries in the middle income CIS group continue to have very high hospital utilization rates higher than the EU average Surshyvey data on utilization which control for need suggest a similar picshyture but point in many cases to persistent differentials across rural
and urban areas particularly in the CIS
Infrastructure Turning to infrastructure here too the picture is very
mixed Data problems make this a particularly difficult area to analyze However what is clear is that countries of the Region began transition
reasonably well covered with basic utility services but the economic shocks of the early reform years left providers strapped for funds
which meant that utilities deteriorated Regionwide for much of the 1990s Since then the decline in utility performance (as measured by access and quality) has been reversed or slowed Electricity has shown
FIGURE 13 Hospital Utilization Rates Have Recovered but Remain at Low Levels in Parts of the Low Income CIS Group
1994-8 1999 2000 2001 2002
-lithuania (EU-8) - Romania (SEE)
- Belarus (middle income CIS) - Georgia (low income CIS)
Source WHO based on official statistics of hospital admissions
27 Overview
the greatest improvement providers have maintained near universal coverage while improving reliability in subregions where it was particshyularly poor such as in the low income CIS countries Other recent gains include the expansion of gas supply networks to many houseshy
holds affected by the collapse in district heating and the improvement of water reliability in some countries Despite these improvements many households including many urban households in the CIS and in some parts of SEE continue to use dirty fuels such as coal wood and oil for heating because they lack access to gas and cannot afford or are not reliably provided with electricity Available survey evidence suggests that the reliance on solid fuels for heating affects the poor more than the rich (figure 14) This could have a long-term impact on the health of the poor due to the negative impact of increased indoor
pollution Over the past five years access to clean heat has become less
FIGURE 14 The Poor Make Greater Use of So-Called Dirty Fuels for Heating Percentage of Population Using Clean Sources of Heating in the Poorest and the Richest Quintiles (Latest Available Year)
6 Hungary w
Bulgaria w w (I)
Romania
-e
8 ~ Kazakhstan i 5
Armenia (I)
u E CI Moldova 5 ~ CI
J Tajikistan
jl Turkeyc -
eaI
o 10 20 30 40 50 60 70 80 90 100
of population
Poorest quintile bull Ri chest quintile
SourceWorld Bank staff estimates using ECA Household Surveys Archive
Note Clean fuels are all sources of heating for ahousehold except solid fuels such as wood and coal which are classified as dirty
28 Growth Poverty and Inequality Eastern Europe and the Former Soviet Union
equal in some countries of the low income CIS group (for example Armenia) although in others (such as Tajikistan) the revival of district
heating has improved equity Although time-series data tracking water availability are available
for only a few countries the evidence from the low income CIS counshytries shows the influence of years of little maintenance and no investshy
ment in water provision (figure 15) Although households officially still have water connections little water flows through the pipes On average Tajik households receive water for less than six hours each day and although not depicted here households in smaller cities and
rural areas have the least water
Are key public services affordable Both catastrophic health spending and the additional cost of utilities pose the challenge of affordability for
the poor Household expenditure shares for utilities have continued to increase from the late 1990s to the present (figure 16) They are typically higher for poor households than for rich ones On average however expenditure shares are highest in the EU-B followed by
SEE the middle income CIS countries and the low income CIS group as shown in the figure The increase in utility expenditure shares is largely driven by the increasing cost of electricity and in the EU-B
the price of water
FIGURE 15 In the Low Income CIS Countries the Reliability of Water Supply Is Low and Shows Little Improvement Access to Uninterrupted Water Supply
24
20gtshy =- 15gtshyQ J =shyE 10 t J ~ c
5
0
Bulgaria Georgia Tajikistan
SEE Low income CIS
III Poorest quintile bull Richest quintile
SourceWorld Bank staff estimates using ECA Household Surveys Archive
29 Overview l
FIGURE 16 Household Expenditures on Utilities Have Increased Expenditure Shares on Electricity Heating Water and Sewerage
24
22
20
en 18 E
16 3 c = 14GO CL )( GO 12
~ 10S S 1
4
1 bull I 1
bull I Ibull Ii bull
I1
bull f I Ii
bull
i e ~
] 3 r
EU-8
j cJ
0 c
amp ~ lti
~
-s agt
a it -
e 0
~
SEE
ee 0gt
~ ~ E0
a 0
oil
0 0
~ co ~=gt
~ ~ no ~
0 c
~agt ~ ~
a
Middle income CIS
c ci coe 0 15 2 0 a ~
E s ~ ~ 0
0 (J rot gtshy fshy
Low income CIS
c
tl
a
~ E0 E a0 fshy0 gtU
Benchmark
bull 1998 or earliest bull 2003 or latest
SourceWorld Bank staff estimates using ECA Household Surveys Archive
Note For Albania Latvia Ukraine Serbia and Montenegro Azerbaijan Turkey and Colombia data before 2002 are not available For Estonia Armenia Kyrgyz Reshypublic and Uzbekistan 2000 is used instead of 1998 for Tajikistan 1999 and for Kazakhstan 2001
Catastrophic health expenditures run the danger of impoverishing households in parts of the Region such as the low income CIS counshytries where the health system relies heavily on household contribushytions and households are relatively poor Outside the EU-8 where the impact is more limited because of higher incomes simulations undertaken for the purposes of this report suggest that catastrophic health spending can increase the fraction of the poor population by
3-9 percent
Prospects for Poverty Reduction
Given what has been achieved what are the prospects for poverty reduction In drawing lessons it is worth reminding ourselves of the
main concerns five years ago when Making Transition Work for Everyshyone (World Bank 2000a) was published Then although growth had
I
1
30 Growth Poverty and Inequality Eastern Europe and the Former Soviet Union
recovered in the EU-8 and parts of SEE recovery was slow at best in
the CIS where most countries suffered an additional blow because of
the financial crisis in Russia The collapse in output particularly in the CIS combined with the increase in inequality meant a sharp increase in poverty Prospects for poverty reduction were felt to be
unclear even in the event of the resumption of growth because a core group of the very poor-the long-term unemployed and socially excluded-were likely to be bypassed by growth Despite notable
achievement in the pretransition period education and health sectors were under strain and working to the detriment of poor families and
the economic mobility of their children And to top it aiL data issues clouded researchers understanding of poverty
The picture looks different five years later and ones understanding
of the challenge of poverty needs to be suitably nuanced Economic
growth has firmly returned to the Region and all countries are expeshyriencing positive growth In addition changes in inequality have been modest over this period Moreover in the CIS which had previously
seen the sharpest increases inequality has (with the few exceptions
noted previously) abated The rise in output and the moderation in inequality have together meant a substantial reduction in poverty20
The long-term unemployed and the SOcially excluded remain a conshycern particularly because very few countries outside of the rapidly
growing economies of the CIS have succeeded in raising the share of the population that is employed However the failure to raise overall employment levels has not acted as a brake on poverty reduction to date (except perhaps in a few countries such as Poland) because in
most countries the bulk of the poor retain some attachment to the labor market and have benefited from the bounce-back in real wages The health and education sectors in most countries have benefited from increased levels of funding but because of remaining inefficienshycies in delivery this has not translated into uniform improvements in
quality Access is possibly less of a concern with poor quality and high
cost (or reduced affordability) becoming key dimensions of deprivashy
tion The quality of data has improved encouraging more confidence
about observed trends At the same time shortcomings remain espeshy
cially with regard to data on the quality dimension of public services
However while the picture looks somewhat different and notwithshystanding the impressive reduction in poverty in the Region over the
past five years it is clear that there is a long road ahead not just for the
low income CIS countries but also for many middle-income countries
in the Region (where poverty rates are lower but where most of the poor live) This is for a number of reasons First despite the recovery
poverty rates remain Significant for many countries it will be some
31 Overview
time before absolute poverty is eradicated (on this see further below) Second the recovery is still recent for many if not most countries and large numbers remain vulnerable to poverty in the event of an ecoshynomic downturn Third despite recent improvements morale (as revealed in self-reported assessments of well-being) remains low comshypared with that of countdes at similar levels of income This may be related to uncertain prospects for the future Low morale may also be related to greater inequality and erosion in access and quality of public services compared with the past
Projecting poverty rates over the medium term using available economic growth forecasts from the World Banks Global Economic
Prospects 2005 indicates that poverty will not disappear altogether
and together with economic vulnerability will affect 30 percent of the population by 2007 This is not to say that there will be little poverty reduction In fact poverty will fall by 7 percent a year or 21 million fewer people will be in poverty in the five years covered by
the forecast period (figure 17) Impressive though this reduction may
FIGURE 17 Growth Will Move an Additional 21 Million People out of Poverty by 2007 but 40 Million Will Remain Absolutely Poor and More Than 100 Million Vulnerable to Poverty
100
90
80
70
c 0 60~
E 500 li 40
30
20
10
1998-9 2002-3 By 2007
_ Nonpoor above $430 aday
Vulnerable above $215 and below $430 a day
_ Poor below $215 a day
Source World Bank staff estimates using EGA Household Surveys Archive
Note Growth rates for 2002-2007 are from the World Banks Global Economic Prospects bull = simulations
32 Growth Poverty and Inequality Eastern Europe and the Former Soviet Union
OVERVIEW BOX 2
Nonlncome Dimensions of Poverty and Millennium Development Goals In the Region
Of the Regions subregions the EU-8 is perhaps the least challenged by the nonIncome
dimensions of poverty Most countries have met or are likely to meet all of the non income
MDGs However for the Baltics current trends suggest that the spread of HIVAIDS may not be
effectively combated
The nonincome dimensions of poverty are likely to challenge some countries in SEE It is
not clear that countries such as Bulgaria and Romania w ill be able to combat the spread of
HIVAIDS Romania may also struggle to meet the water access MDG because only 16 percent
of the sizable rural population is assessed to have access to an improved water source
The nonincome dimensions of poverty particularly related to health are likely to chalshylenge the middle income CIS countries None of these countries is assessed as likely to be
able to combat the spread of HIVAIDS The targets for reductions in child mortality and matershy
nal mortality may also not be achieved in some countries It should be pointed out however that
because of the age and epidemiological profile of these countries proportionately higher gains
in life expectancy would accrue from reducing adult mortality through the control of noncomshy
municable diseases than from achieving targets related to the MDGs
The low income CIS countries are most severely challenged on nonIncome dimensions of
poverty Most MDGs are unlikely to be met in the low income CIS group Indeed only the MDG
regarding attaining gender equity in schOOling is on track
In benchmark Turkey the nonincome dimensions also represent a challenge In particular
even though the gender gap has been closing girls are significantly underrepresented in primary
and secondary schools The MDG for maternal mortality also appears unlikely to be achieved
with maternal mortality rates unusually high for a middle-income country
SourceWorld Bank 2OO5c
be some 40 million people are projected to remain absolutely poor in the Region by 2007 Naturally faster growth could lead to faster reduction of poverty rates Sustained economic growth is hence a crucial component of any poverty alleviation strategy These projecshytions do not incorporate any worsening of the income distribution which would undermine the impact of growth Given that inequality levels in the Region are broadly speaking at the low end by world standards some worsening of inequality over the medium term would not be surprising These projections should therefore be undershystood as a best-case scenario
33
I
Overview
Looking behind the regional aggregates and using subgroups speshy
cific targets indicate that all country subgroups face challenges in poverty reduction over the longer term A forward-looking agenda
could for example aim to meet the MDG on poverty-halving
absolute poverty by 2015 compared with 1990 levels-which is most
relevant for the low income CIS countries For the middle income CIS
group and SEE which have moderate poverty the MDG is not suffishy
ciently ambitious Eliminating economic vulnerability which this
report takes as having income (consumption) levels that are above
twice the poverty line is an appropriate modified MDG for this
group For the EU-8 who have minimal absolute poverty but are sigshy
nificantly poorer than the 15 EU member states they have joined a
modified MDG could be to reduce poverty by half assuming the
poverty line to be the lowest among the EU-15 21 Overview table 2
shows that despite recent progress all subgroups face a real chalshy
lenge in poverty reduction The required growth rates are signifishy
cantly higher than the rates at which these countries are expected to
grow Moreover as was the case in figure 17 no change in income
distribution is assumed With worsening inequality either the goals
would not be achieved or the required growth rates would be even
higher
As with income countries in the Region will continue to face
challenges on nonincome dimensions of well-being This is most
simply characterized through the prospects of attaining the MDGs on
education health and the environment which in many ways repshy
resent a subset of aspirations on the nonincome side The World
Bank (2005) projects the likelihood that countries will attain the MDGs based on recent trends in the indicators It concludes that the
OVERVIEW TABLE 2 Achieving Subgroup-Appropriate Poverty Reduction Targets over the Long Term (2015) Will Require Significantly Higher GOP Growth Rates
I IGroupings
Long-tllm growllt ratu requilld to
meet taIgIII grawIb forIellt
2OO2-71
Specific tIrgtt
Baseline
Low income CIS Middle income CIS SEE EUmiddot8
56 97
108 66
39 68 54 43
Reduce poverty by half relative to 1990 (at $215 aday) Eliminate economic vulnerability (at $430 aday) Eliminate economic vulnerability (at $430 aday) Reduce poverty by half taking as poverty line the lowest line in EU-15 today
I
523 396 553
366
Source World Bank staff estimates growth rates are from GEP
Note bull Subregional country averages weighted by GDP bullbull GEP Global Economic Prospects IWorid Bank 2005b) bullbullbull Population weighted
I
--
36 Growth Poverty and Inequality Eastern Europe and the Former Soviet Union
need to be improved to faciJitate land restructuring (for example in SEE) significant income gains can be attained from accelerated
reforms In all countries future gains in reducing poverty in rural areas would hinge on eliminating key market imperfections in input and output markets essential for enabling self-employed farmers to lift themselves out of poverty In particular the integration of rural
areas into national credit markets is critical for further investments and productivity growth in agriculture More broadly improving the investment climate in rural areas is very important Increasing evishydence shows that investments in food processing agribusiness trade and retail companies playa crucial role in helping small farmers overshy
come input and output market imperfections in helping them upgrade the quality of their products and in accessing markets (World Bank 2005a) Beyond measures related to agriculture inteshygration of the rural poor into national labor markets-either through rural off-farm employment or by improving access to urban labor
markets-and adequate social safety nets will be crucial for sustained income growth and poverty reduction particularly in the middle
income CIS and SEE countries EmphasiS on rural service delivery and infrastructure is also criticaL especially in the low income CIS
not only for its instrumental role in raising rural incomes but also as an aspect of poverty that warrants attention in its own right
PromotinH opportunities in laHHinH reHions Countries in the Region face substantial differences in poverty rates between urban and rural areas and between capital cities and smaller towns that if severe risk pershypetuating intergenerational poverty and inequality traps and act as a drag on economic growth Most countries seek to address regional inequalities through the maintenance of a stable macroeconomic envishyronment the creation of a level playing field for businesses and fiscal transfers for targeted programs in lagging regions But more can be done First countries need to enhance labor mobility When people
move to economic nodes that promise a higher expected income it
helps to reduce spatial income disparities Adoption of appropriate polishy
cies to encourage movement supported by the development of urban
housing markets and policies credit markets and entitlement reform
can provide a strong stimulus to inter- and intra regional mobility and
help improve income levels in relatively poorer areas while also boostshy
ing competition productivity and growth in destination areas Second
in countries with decentralized fiscal systems there is a strong role for
equalizing resource transfers to address regional inequalities In particshy
ular social and economic reforms in the lagging regions can be encourshy
aged through market-based incentives including the use of competitive
37 Overview
allocation mechanisms for fiscal transfers Third education and health service delivery should be strengthened in lagging regions to ensure adequate human capital formation as a route out of poverty In particshyular existing inequalities in access to public services and quality of sershyvices provided need to be addressed as a priority
Strengthening Public Service Delivery
Ensuring access and improving quality of education and health care require strengthened accountability arrangements Although low levshyels of spending are an issue more so in education than in health care only a few countries spend less than is warranted given levels of
income Thus going forward most countries will need to operate within the available resource envelope Reforms will therefore have to focus on improving the quality and efficiency of public spending
Enhancing quality and equity of education services In education the low income CIS group needs to stem the decline in primary enrollments and quality of education in particular by ending the situation in which
staff are underpaid and complementary expenditures (on textbooks heating and repairs) are underfinanced while at the same time employment and in some cases facilities remain well above standards common in much richer countries In addition some countries may need to ensure greater equity in education spending across subnashytiona I regions (for example the Kyrgyz Republic) Ensuring access to
primary education is much less of an issue outside the low income CIS countries Here the main issue is secondary education where quality and relevance to market demand are often in question Governance reforms that both strengthen government accountability for outcomes as well as increase participation and voice will be essential to improvshying outcomes Lessons from the experience of the EU-8 in raising qualshyity certainly point in this direction In particular decentralization of services to allow for a greater role for both school administrators and parents has an important role to play in stemming declines in quality
Strengthening access to and quality of health care In health care lowshyincome countries suffer from having to provide for a range of sershy
vices when budget resources are limited but even the available
allocations are not spent wisely This is reflected in the large share of
household contributions in total health spending Improving utilizashy
tion among the poor is closely linked to financing and quality issues
Tough decisions are required on the size of the basic package and a
major reallocation of expenditure-and greater accountability for its
38 Growth Poverty and Inequality Eastern Europe and the Former Soviet Union
use-implemented to improve access to and quality of care (World
Bank 2005d) To improve matters accountability relationships between politicians and citizens need to become more effective (through such means as more organized voice power of citizens citshyizens report cards and informed voting) and the accountability
relationships between politicians and providers need to be strengthshyened (through such means as clarifying responsibility aligning incentives between policy maker as principal and provider as agent and better enforcement of contracts between organizational and front-line providers) Countries such as Armenia have shown that even with limited resources and high poverty rates improvements in key dimensions such as affordability can be made albeit on a modshyerate scale At the other end of the spectrum the EU-8 is struggling to maintain the easy access to a wide range of health services in a
context of rising costs Clearly further efficiency-enhancing mechashynisms as well as private financing wiU need to be found to control expenditures
Managing reform of utilities Service quality in many of the infrastrucshyture services is extremely poor in the low income CIS countries and even in richer countries there are large disparities between service quality for the poor and the nonpoor The infrastructure needs of the
poor are unlikely to be met without reform of the utilities sector to bring it to a financially self-sustaining basis which would encourage much-needed upkeep and maintenance of viable infrastructure and improvements in service quality Improving financial performance will involve raising tariffs which--except for power where there has been some movement toward cost recovery and possibly water in the EU-8-are well below cost recovery levels Further movement toward full cost recovery in power is expected to have a limited impact on poverty except in the poorest countries However acrossshy
the-board increases in the full range of utilities is expected to have a
more serious impact on poverty (World Bank 2005 Forthcoming b)
The social impact of tariff increases will need to be factored into the
sequencing and pace of reforms in the event of across-the-board
reforms in a range of utilities Where the social safety net is adequate
it can be expected to mitigate the impact on the poor However where
social safety nets are relatively thin as for example in the low income
CIS group other options are worthy of consideration For utilities
that can be metered lifeline tariffs can serve as a useful temporary
cushion however where lifelines are not practical (as for example
in sectors where consumption cannot be measured) reforms would
need to be calibrated to affordability
39 Overview
Enhancing Social Protection
Strengthening the social safety net Given their importance for poverty reduction and the broad improvements over time it should be clear that countries need to maintain ongoing social insurance and social assistance reforms which are largely designed to improve sustainabilshy
ity and to enhance coverage and targeting of the poor within the available resource envelope In the low income CIS group the main constraint will continue to be the fiscal means to cover the population adequately In the middle income CIS group and SEE although there is more fiscal space for social protection there is also greater resistshyance to reforms as suggested (for example) by the difficulties with the monetization of privileges in Russia While the objective of the reforms is not in question the difficulties in implementation serve as a useful reminder of the importance of sequencing with other social and economic reforms the need to protect the most vulnerable
groups and an appropriate communications strategy to explain the benefits of reforms Where systems are more generous as for examshyple in parts of SEE and the EU-8 a balance will need to be struck between the need for social protection and labor market incentives
Strengthening taqeted interventions for marginalized groups and minorities This may be in the form of assistance in cash or in-kind (such as edushycation health or housing) depending on the nature of the group For the long-term unemployed or nonparticipants active labor marshy
ket programs can be particularly relevant But evidence from successshyful training programs suggests that these should be targeted offered on a selective basis with clear links to potential employers and in collaboration with the private sector It is important to bear in mind that there is limited evidence of successful retraining programs from the low income CIS group In some cases interventions may need to be integrated across many fronts For example for the Roma minorshyity of the EU-8 and SEE governments are taking a holistic approach to ending persistent exclusion by setting goals in four areas-educashy
tion employment health and housing Other mjnorities may require
a different approach The elderly especially those who are very old or
living alone may also require special interventions such as suppleshy
mentary cash benefits or provision of assisted living services For most
marginalized groups however additional assistance whether in cash
or kind need not be provided by the public sector alone Civil society
organizations community-based groups and other organizations
could also be encouraged to come into the sector under the overall
direction of the government
40 Growth Poverty and Inequality Eastern Europe and the Former Soviet Union
Ensuring adequate minimum wages Minimum wages are an important policy instrument for enhancing the income security of the poor These can help provide a floor to income but need to be kept at a reashy
sonable level In this context the large real increases in the CIS in recent years have brought minimum wages closer to subsistence levshyels However future increases in minimum wages need to be considshyered carefully so as not to become so high that they have negative effects on growth and employment with adverse impacts on poverty
Where variations in regional income and labor market profiles are large governments may need to consider setting region-specific minshyimum wages which may help improve the employability of certain
groups of workers (such as younger workers and those in lagging regions) This is an issue particularly in the EU-8 and SEE where minimum wages represent a relatively high proportion of the average
wage and the adverse impact of common minimum wages is particushylarly noticeable For example the relatively high minimum wage is found to constrain employment opportunities for the low-skilled in countries such as Lithuania and Poland
Monitoring Progress on Poverty Reduction
Huge progress has been made in recent years in improving the qualshy
ity and accessibility of poverty data Countries need good survey data to monitor changes in poverty and to evaluate the impact of specific policy actions on the poor This report documents significant progress in collecting up-to-date high-quality data across the Region The preshyvious report on poverty (World Bank 2000a) relied on a single survey for many countries and could produce an estimate of poverty over
time for only three countries With full data sets closed to users outshyside statistical offices the report also had to rely on partial data Since then many countries have started implementing regular surveys that
periodically collect representative data on income and nonincome
dimensions of living standards In addition data are provided openly
to researchers for the purposes of study and policy evaluation These
improvements are not only confined to EU-8 countries (for example
Hungary) but also cover SEE (for example Romania) middle income
CIS countries (for example Kazakhstan) and low income CIS counshy
tries (for example Georgia and Moldova)
But many challenges remain First improvements to data quality
and availability are very recent and for many countries in the Region
reliable data on poverty changes can be obtained for only a few recent
years The efforts in collecting data need to be maintained Second
survey coverage and response rates have fallen over time in all counshy
41
I
Overview
tries and there is a need to strengthen the technical capacity of stashytistical offices to curb this trend and deal with it appropriately Third wide gaps exist in data collection on the nonincome dimensions of poverty there are practically no attempts to gauge trends in the qualshyity of health care and infrastructure services and even indicators of access are not consistently collected Given the changing nature of poverty with the increasing role of nonincome components this gap
is the most worrying Fourth not all countries have opened their data sets to researchers undermining the effective use of public funds spent on data collection and monitoring These areas-keeping up with periodic surveys to provide comparable data collecting informashytion on nonincome dimensions and opening up access to survey data-are priorities for action to ensure adequate information supshy
port for poverty reduction efforts (See overview box 3 for a discusshysion of the data used for this report)
Conclusions
The countries in the Region have made significant progress in redUCing poverty More than 40 million people moved out of poverty during 1998-2003 Much of this poverty reduction derives from the growth rebound in the CIS countries But poverty and vulnerability still remain a significant problem more than 60 million are poor and more than 150 million are vulnerable Most of the poor are the working poor Many others face deprivations in access and quality of public services
Regional inequalities both between and within countries are large The highest levels of absolute poverty are found in poor countries of Censhytral Asia and the South Caucasus but most of the Regions poor and vulnerable are in middle-income countries
Notwithstanding the tremendous heterogeneity among countries in the Region reducing poverty and vulnerability requires an accelshyeration of shared growth strengthening of public service delivery better targeting of social protection and regular monitoring of
progress in poverty reduction across the Region In promoting accelshy
erated shared growth the report emphasizes (a) further reform of
the enterprise sector to encourage the release of resources from the
old less productive sectors to the new more productive sectors (b)
further reforms to promote agriculture and rural growth by integratshy
ing rural areas into the rest of the economy with regard to labor and capital markets access to credit trade and services and (c) policies to
promote greater opportunity in lagging regions Public service delivshy
ery needs to be improved through increasing the accountability of
42 Growth Poverty and Inequality Eastern Europe and the Former Soviet Union
OVERVIEW BOX 3
Data for This Report The World Banks ECA Household Survey Archive
To arrive at the internationally comparable assessment of poverty this report uses primary unit
record data from recent household surveys to construct a comparable indicator of living stanshy
dards across all countries in the Region Income data an alternative to consumption for measshy
uring living standards remain particularly difficult to collect in transition countries In contrast
practice has shown that consumption data can be gathered with a great degree of precision
Survey consumption modules have become more detailed over time and better capture various
dimensions of consumption
In relying on consumption of goods and services by a household as the measure of living
standards a number of conceptual and practical issues needed to be addressed First unlike
food consumer durables and housing are consumed over a long time It is customary thereshy
fore to include the imputed value of the consumption flow associated with the possession
of consumer durables (including housing) but exclude the expenditure on the purchase of
these goods However for the Region data availability limits the application of this approach
to all countries This report does not therefore include estimates of flow of services of
durables nor have researchers added in durable purchases or rents Second when conshy
sumption is used as a measure of well-being higher consumption should indicate a higher
level of well-being For most consumption items this correspondence is reasonable howshy
ever for some categories such as health expenditures this correspondence is questionable
As a result health expenditures were not included as a part of consumption (Deaton and Zaishy
di 2002) Third given the significance of spatial differences the authors adjusted for spatial
price differences using the same set of information in all countries In the cases where data
government and the voice and participation of citizens This is essenshytial to improving access and quality of social services which are not
only important in their own right but also of instrumental value in helping the poor move out of poverty The report emphasizes the need to further strengthen the social safety net to meet the chalshylenges of restructuring economies Finally monitoring progress on
poverty reduction on a regular basis needs good-quality household survey data sets that are publicly available for research and analysis
Endnotes
l All monetary amounts are in us dollars ($) unless otherwise indicated 2 The new member states of the European Union are the Czech Republic
43 Owrview
were collected over a long time it was also necessary to adjust for changes in prices over
time Fourth households in the Region cope with poverty by relying on an array of nonmarshy
ket strategies including producing their own food and engaging in reciprocal exchange with
other households and institutions A consistent approach was used in assigning a monetary
value to these components of consumption Fifth to adjust for differences in household
composition researchers took the simplest approach and used the per capita scale Sixth
the procedure which conforms to methods used in other international household survey
data depositories (such as the Luxembourg Income Study see Gottschalk and Smeeding
[1997) and wwwlisprojectorg) was used to clean the data of outliers across all data sets
Following a consistent approach across all data sets gives reasonable confidence that differshy
ences across countries in the final consumption measure are due to differences in the primary
data and are not due to the method of aggregation This is the first time (to the authors knowlshy
edge) that comparable consumption aggregates have been constructed for countries in the Reshy
gion (Full details are provided in appendix A Data and Methodology)
The constructed estimate of real per capita consumption has several shortcomings that reflect
some persistent data problems in the Region First it ignores the differential impact of price inshy
creases on the poor and nonpoor No price indices for low-income groups that would allow this
issue to be addressed are routinely available in the Region Second over time there has been
considerable deterioration in response rates in many countries Countries deal with this problem
in different ways which may have (as yet unknown) implications for survey-based poverty and
inequality measures Notwithstanding these limitations consumption indicators constructed for
this report produce a reasonably reliable anchor to assess changes in poverty and distribution
during 1998-2003
Soutrss Deaton and Zaidi 2002 Gottschalk and Smeeding 1997 and wwwlisprojectorg
-- -shy
Estonia Hungary Latvia Lithuania Poland the Slovak Republic and Slovenia
3 Countries in SEE consist of Albania Bosnia and Herzegovina Bulgaria Croatia the former Yugoslav Republic (FYR) of Macedonia Romania and Serbia and Montenegro the subregion also includes a territory of Kosovo now UNMIK
4 Middle-income countries in the CIS are Belarus Kazakhstan Russia and Ukraine
5 Low-income countries in the CIS are Armenia Azerbaijan Georgia the Kyrgyz Republic Moldova Tajikistan Turkmenistan and Uzbekistan
6 The Commonwealth of Independent States includes all countries that were part of the Former Soviet Union except for the three Baltic republics Estonia Latvia and Lithuania which acceded to the European Union in May 2004
7 The analysis of poverty trends uses data from 15 countries in the Region for which comparable representative surveys are available over the entire
I
44 Growth Poverty and Inequality Eastern Europe and the Former Soviet Union
1998-2003 period or its significant part Armenia Belarus Bosnia and Herzegovina Bulgaria Estonia Georgia Kazakhstan the Kyrgyz Repubshylic Lithuania Moldova Poland Romania Russia Tajikistan and Uzbekshyistan The appendix to the study discusses country coverage in detail
8 Aggregate poverty figures include Turkey in addition to the Regions poverty headcount and thus refer to the ECA Region as defined by the World Bank
9 Many of these poverty lines have been drawn in-country from houseshyhold survey data and represent a level of consumption that would allow a typical household to meet international minimum caloric requireshyments with an additional allowance for nonfood basic needs They are a far cry from the outdated and questionable poverty lines used in many countries in the early years of the transition
10 The first 15 member states of the European Union are Austria Belgium Denmark Finland France Germany Greece Ireland Italy Luxembourg the Netherlands Portugal Spain Sweden and the United Kingdom
II For the purposes of ctiscussing poverty risks in the EU-8 countries and selected countries in SEE and the middle income CIS group we use a higher poverty line of $430 The $215 line catches a fairly small proshyportion of the population in these countries and thus may not provide robust results
12 For the reasons explained in the appendix we use consumption as an inctishycator of welfare at the household level The other often applied measure-income-tends to show much higher levels of inequality but it suffers from severe problems of underreporting in many transition economies it is unclear whether high levels of income inequality are driven by the noisy data To deal with this problem while comparing levshyels of inequality in the Region with other countries we consistently rely on consumption-based indices
13 The Gini coefficient is a standard measure of inequality it takes values between 0 (complete equality) to I (extreme inequality when all income is appropriated by the richest person) (see details in the appendix)
14 The point here is not whether relative or absolute notions of inequality are right but simply that peoples perceptions of inequality are differshyent from how economists have chosen to measure it
15 Employment rates among women do not compare unfavorably with those of men except in a few countries such as Bosnia and Herzegovina and Tajikistan
16 Targets agreed to at the Lisbon Summit in March 2000 where heads of state and governments of the European Union decided that the EU should adopt the strategic goals for the next decade of becoming the most competitive and dynamic knowledge-based economy [with) greater social cohesion The 70 percent employment rate for the workshying-age population is one of such targets
17 Georgia (not depicted here) is another country where the incomes of the poor have declined in real terms
18 Thus trends in wage inequality are mixed with inequality falling in some countries and rising in others
19 The MDGs represent an international effort to promote poverty reducshytion and human development by establishing measurable yardsticks for
45 Overview
eight goals to be achieved by 2015 To achieve the child and maternal mortality MDGs countries would have to reduce child mortality by twoshythirds and maternal mortality by three-quarters by 2015 The 1990 benchmark against which progress is assessed is often not suitable for the Regions countries because many social indicators reached their nadir in the mid-1990s or later The projections made by the World Bank are
I
based on recent trends in the indicators (see World Bank 2005c for furshyther details)
II 20 In technical terms the elasticity of poverty reduction to growth has Ii proved to be high for the most part
21 Portugal has the lowest poverty line around PPP $750 per capita per day
Bibliography
Chen Shaohua and Martin Ravallion 2001 How Did the Worlds Poorest Fare in the 1990s Review of Income and Wealth 47 (3 September) 283-300
I Chernetsky Taras Forthcoming Magnitudes and Distribution of Remitshytances in Eastern Europe Evidence from Household Surveys Data and Balance of Payment Statistics Photocopy World Bank Washington DC
Deaton A and S Zaidi 2002 Guidelines for Constructing Consumption Aggregates for Welfare Analysis LSMS Working Paper 135 World Bank Washington DC
Dennis Ian and Anne-Catherine Guio 2004 Poverty and Social Exclusion in the EU Statistics In Focus Population and Social Conditions 162004 Luxembourg European Commission Office for Official Publications of the European Communities
Gottschalk Peter and Timothy M Smeeding 1997 Cross-National Comshyparisons of Earnings and Income Inequality Journal of Economic Literature 35 (June) 633-87
Kakwani N and Z Sajaia 2004 Internationally Comparable Poverty Lines for CIS Countries Photocopy Poverty Reduction and Economic Management Unit ECA Region World Bank Washington DC and DFlD United Kingdom
Lehmann Hartmut and Jonathan Wadsworth 2001 Wage Arrears and the Distribution of Earnings in Russia William Davidson Institute Working Paper 421 University of Michigan Stephen M Ross Business School Ann Arbor
OECD 2003 Summary Results of ECP 2000 A Note by the OECD Secreshytariat Working Paper 6 Statistical Commission and Economic Commisshysion for Europe Conference of European Statisticians Joint Consultation on the European Comparison Programme Geneva March 31-April 2 2003
van de Walle Dominique 2002 The Static and Dynamic Incidence of Vietshynams Public Safety Net Policy Research Working Paper 2791 World Bank Washington DC
46 Growth Poverty and Inequality Eastern Europe and the Former Soviet Union
World Bank 1990 World Development Report 1990 New York Oxford Univershysity Press
- -- 2000a Making Transition Work for Everyone Poverty and Inequality in Europe and Central Asia Washington DC World Bank
--- 2000b Republic of Latvia The Poverty Assessment 2 vols Washington DC World Bank
--- 2001 a Hungary Long-Term Poverty Social Protection and the Labor Marshyket 2 vols Washington DC World Bank
--- 2001b Poland Labor Market Study The Challenge of Job Creation Washshyington DC World Bank
--- 2001e Slovak Republic Living Standards Employment and Labor Market Study Washington DC World Bank
--- 2001d World Development Report 200012001 Attacking Poverty Washshyington DC World Bank
--- 2002a Armenia Poverty Update Washington DC World Bank
--- 2002b Bulgaria Poverty Assessment Washington DC World Bank
~ 2002e Georgia Poverty Update Washington DC World Bank
--- 2002d Labor Market in Postwar Bosnia and Herzegovina How to Encourshyage Businesses to Create Jobs and Increase Worker Mobility Washington DC World Bank
--- 2002e Republic of Tajikistan Poverty Assessment Washington DC World Bank
--- 2002f Russian Labor Market Moving from Crisis to Recovery Europe and Central Asia Region Human Development Sector Unit Washington DC World Bank
--- 2002g Slovak Republic Poverty and Welfare ofRoma in the Slovak Repubshylic Bratislava The World Bank Foundation SPACE Ineko and The Open Society Institute
---- 2002h Transition The First Ten Years Analysis and Lessons for Eastern Europe and the Former Soviet Union Washington DC World Bank
--- 2002i Turkmenistan A Profile of Living Standards in Turkmenistan Washington DC World Bank
--- 2003a Albania Poverty Assessment Washington DC World Bank
--- 2003b Armenia Poverty Assessment Washington DC World Bank
--- 2003e Azerbaijan Republic Poverty Assessment 2 vols Washington DC World Bank
--- 2003d Bosnia and Herzegovina Poverty Assessment 2 vols Washington DC World Bank
--- 2003e FYR Macedonia Country Economic Memorandum Tackling Unemshyployment Washington DC World Bank
--- 2003f Guatemala Poverty in Guatemala Washington DC World Bank
--- 2003g Inequality in Latin America and the Caribbean Breaking with the Past Washington DC World Bank
)
47
I
Overview
--- 2003h Kosovo Labor Market Study Policy Challenges ofFormal and Inforshymal Employment Washington DC World Bank
--- 2003i Kyrgyz Republic Enhancing Pro-Poor Growth Washington DC World Bank
---- 2003j hReview of Parent-Community Participation in Schools in ECAH Background Paper for Social Development in Europe and Central Asia Region Issues and Directions ECA Socially and Sustainable Development Department Washington DC World Bank
--- 2003k Romania Poverty Assessment 2 vols Washington DC World Bank
--- 2003l Serbia and Montenegro Poverty Assessment 2 vols Washington I
DC World Bank
--- 2003m Tracking Nonincome Dimensions ofPoverty in ECA Poverty Reducshytion and Economic Management Unit and Human Development Sector Unit Europe and Central Asia Region Washington DC World Bank
--- 2003n Uzbekistan Living Standards Assessment Washington DC World Bank
--- 2004a Azerbaijan Municipal Services Study Photocopy ECSIE World Bank Washington DC
- -- 2004b Belarus Poverty Assessment 2 vols Decision Draft Washington DC World Bank
--- 2004c Bosnia and Herzegovina Country Economic Memorandum Washshyington DC World Bank
--- 2004d The Governance ofService Delivery in ECA A Regional Study ECA Vice Presidency Washington DC World Bank
--- 2004e Kazakhstan Living Standards Assessment in Kazakhstan 2 vols Washington DC World Bank
--- 2004f Latvia Poverty Assessment Decision Draft Washington DC World Bank
--- 2004g Latvia The Quest for Jobs and Growth A World Bank Country Ecoshynomic Memorandum Washington DC World Bank
--- 2004h Poland Growth Employment and Living Standards in Pre-Accesshysion Poland Washington DC World Bank
--- 2004i Recession Recovery and Poverty in Moldova Report 2B024-MD World Bank Washington DC
--- 2004j World Development Report 2005 Washington DC World Bank
--- 2005a Dynamics of Vertical Coordination in Agri-Food Supply Chains in ECA Washington DC World Bank
--- 2005b Global Economic Prospects 2005 Trade Regionalism and Developshyment Washington DC World Bank
--- 2005c MDGs in Europe and Central Asia Performance and Prospects Washington DC World Bank
- -- 2005d Operationalizing MDGs How Effective Is the Long Route A Case Study ofGeorgia Washington DC World Bank
48 Growth Poverty and Inequality Eastern Europe and the Former Soviet Union
--- 2005e Poverty and Social Exclusion of the Roma in Serbia and Montenegro Photocopy World Bank Washington DC
--- 2005f Pro-Poor Growth in the 1990s Lessons and Insights from 14 Countries Washington DC World Bank
--- 2005g Russian Federation Reducing Poverty through Growth and Social Policy Reform Washington DC World Bank
~ 2005h Serbia The Social Safety Net and the Poor Photocopy World Bank Washington DC
--- 2005i World Development Indicators Washington DC World Bank
--- 2005j World Development Report 2006 Equity and Development Washshyington DC World Bank
~--- Forthcoming-a Enhancing Job Opportunities in Transition Countries Eastern Europe and the Former Soviet Union Washington DC World Bank
--- Forthcoming-b Foundations for Sustainable Infrastructure in Europe and Central Asia Tariffs Safety Nets RegUlation Commercialization Washington DC World Bank
-~~- Forthcoming-c From Disintegration to Reintegration Eastern Europe and the Former Soviet Union in International Trade Washington DC World Bank
--- Forthcoming-d Doing Business 2006 Washington DC World Bank
Growth Poverty and Inequality Eastern Europe and the Former Soviet Union
While the countries of Eastern Europe and the Former Soviet Union have made significant progress in reducing poverty in the past five years poverty and vulnerability remain significant problems This book examines these important issues and provides recommendations for policy makers
D16193 US$28
016195 US$28
016197 US$28
Infrastructure n Eastern Europe and the Former Sovet Unon Tadffs Safety Nets Regulaton and CommerciaUzaton
0-8213-6191-0 016191
bull Geoiraphic discounts applymiddot up to 75 in some countries Please see enclosed information or visit http- publications worldbankorg discounts
middotmiddotShipping and Handling charges within the US are USSBOO per arder If a purchase order is used actual shipping will be charged Outside of the US customers have the option to choose between nonmiddot tradable airmail delivery (USS700 per order plus USS600 per item) and trackable couriered airmail delivery (USS1650 per order plus USSB per item)
PAYMENT METHOD
US$28
Shipping
Subtotal
Total usS
Orders from individuals must be accompanied by payment or credit card information Credit cards accepted only for orders addressed to the World Bank Check wih your local distributor about acceptable credit cards Please do not send cash
(Please print)
Name ____________________ ----______________ Charge my DAmerican Express D Mastercard D Visa
nVe ________________- ___________ Card no __~_____________________________
Organization _ _ _________________ Expiration date __- 1__ Name ____________________________________ __Address ____________________________
(as it appears on the card)
Signature-~-o___c__---__-___-----------shyCity ________~_______ (required for all credit card charges)
State _____ ZipPostal Code _______ o Check no in the amount of $___ is enclosed When ordering direcVy from the World Country _______________________________ Bank make check payable in US funds only drawn
Phone ______________ _____ on a US bank to The World Bank Please send your check with your order
Fax ______________________________________ __ Institutional customers in the US only
E-mail ______________________ _ _ D Bill me Please include purchase order
bullbullbullmlsectb World Bank Publications
wwwworldbankorgpublications By mail PO Box 960 Herndon VA 20172-0960 USA
By phone +1-703-661-1580 or 800-645-7247middot By fax +1-703-661-1501 SOURCE CODE Questions E-mail us at booksworldbankorg OECA05
WORLD BANK I Publications The refelence of chOIce 011 development
I
This report is part of a series undertaken by the Europe and Central Asia Region of
the World Bank The series draws on original data the World Banks operational
experience and the extensive literature on the Region Poverty jobs trade migration
and infrastructure will be among the topics covered

I
OVERVIEW
GROWTH POVERTY
AND INEQUALITY
Eastern Europe and the Former Soviet Union
Asad Alam Mamta Murthi Ruslan Yemtsov Edmundo Murrugarra Nora Dudwick
Ellen Hamilton and Erwin TIongson
Europe and Central Asia Region
THE WORLD BANK III
copy2005 The International Bank for Reconstruction and Development The World Bank 1818 H Street NW Washington DC 20433 Telephone 202-473-1000 Internet wwwworldbankorg E-mail feedbackworldbankorg
All rights reserved
I 2 3 408 07 06 05
This overview is part of a larger publication Growth Poverty and Inequality Eastern Europe and the Former Soviet Union to be published later this year This overview is a product of the staff of the International Bank for Reconstruction and Development The World Bank The findings interpretashytions and conclusions expressed in this paper do not necessarily reflect the views of the Executive Directors of The World Bank or the governments they represent
The World Bank does not guarantee the accuracy of the data included in this work The boundaries colors denominations and other information shown on any map in this work do not imply any judgment on the part of The World Bank concerning the legal status of any territory or the endorsement or acceptance of such boundaries
Rights and Permissions The material in this publication is copyrighted Copying andor transmitting portions or all of this work without permission may be a violation of applicable law The International Bank for Reconstruction and Development The World Bank encourages dissemination of its work and will normally grant permission to reproduce portions of the work promptly
For permission to photocopy or reprint any part of this work please send a request with complete information to the Copyright Clearance Center Inc 222 Rosewood Drive Danvers MA 01923 USA telephone 978-750-8400 fax 978-750-4470 Internet wwwcopyrightcom
All other queries on rights and licenses including subsidiary rights should be addressed to the Of[jce of the Publisher The World Bank 1818 H Street NW Washington DC 20433 USA fax 202-522-2422 e-mail pubrightsworldbankorg
Cover photo by Anatoliy Rakhimbayev
Cover design by Naylor Design Inc
I
Contents
Overview
Nature and Evolution of Poverty 1998-2003
How Has Poverty Responded to Growth
The Role of Labor Markets and Safety Nets
Affordable Access to Quality Services
Prospects for Poverty Reduction
Bibliography
Appendixes
A Data and Methodology
B Key Poverty Indicators
Overview
This study examines the impact of growth on poverty and inequalshyity in Eastern Europe and the Former Soviet Union during 1998-2003 It updates the World Banks previous study on poverty entitled Making Transition Work for Everyone which appeared in 2000 It asks three questions What are the recent trends in poverty and inequality Why do we see different outcomes across counshytries And how can public policy help maximize the impact of growth on poverty reduction
To measure poverty an absolute poverty line of $2 a dayl is used
comparing it with household consumption per capita This tine is a closer approximation to basic material needs in the Region than the well-known global standard of $1 a day because of the additional expenditures on heating and warm clothing that are required by the
cold climate Using an absolute-as opposed to a relative-poverty
line allows us to focus on those who are deprived of the most basic needs rather than those who may be deprived relative to their bettershy
off fellow citizens It also allows us to determine trends over time and
make comparisons across countries both of which would be difficult if we were using a relative notion of poverty In addition to the $2-a-day poverty line a $4-a-day line is used to capture the notion of ecoshy
nomic vulnerability that is to measure the proportion of the populashy
2 Growth Poverty and Inequality Eastern Europe and the Former Soviet Union
tion that is not absolutely poor but could become poor in the event of
an economic downturn In terms of poverty levels the Region is best thought of in four disshy
tinct subgroups of countries The eight new member states of the European Union (EU-8) have low poverty (less than 5 percent) conshy
fined to specific subgroups of the population2 Countries in Southeastshyern Europe (SEE) have generally moderate levels of poverty (around
5-20 percent) 3 The same is true of the middle-income countries in the Commonwealth of Independent States (CIS)4 The low-income counshytries in the CIS however have extremely high levels of poverty (more than 40 percent)5 In addition to countries in these four subgroups
The Europe and Central Asia Region of the World Bank (ECA) also includes Turkey Wherever possible we treat Turkey as a benchmark against which to evaluate the performance of postsocialist countries in the Region Turkey has moderate poverty We also include two counshy
tries from outside the Region as benchmarks Colombia (a middleshyincome country) and Vietnam (a low-income country)
Summary
The resurgence of growth in the eastern half of the Region particularly in the CIS resulted in a significant decline in poverty in the Region durshying 1998-2003 (figure I )6 more than 40 million people have moved
out of poverty during this period Where roughly 20 percent of the population (or one in five people) was living in poverty today poverty affects only 12 percent (or one in eight people) While much of this poverty reduction has occurred in the populous middle-income counshytries in the Region (Kazakhstan the Russian Federation and Ukraine) poverty has fallen almost everywhere During 1998-2003 poverty fell in most countries of the Region except for Poland and Lithuania in the EU-8 and Georgia in the low income CIS group7 However in the conshy
text of the EU-8 the low overall levels of poverty need to be borne in
mind Income (consumption) inequality showed no clear trend in the
EU-8 and SEE however inequality declined in the CIS with the
notable exceptions of Georgia and Tajikistan
At the same time that 40 million people have moved out of poverty
in ECA as a whole more than 60 million people remain poor and
more than 150 million people are economically vulnerable 8 Progress on the nonincome dimensions of poverty-such as access to educashytion health care safe water and heating-is very mixed with
improvements in some cases and deterioration in others In educashy
tion although access has improved no subregion is free from counshy
tries experiencing declining standards In health no subregion is free
I
3 Overview
from the growing epidemic of human immunodeficiency virus (HIV) and acquired immune deficiency syndrome (AIDS) Quite apart from HIV AIDS and other communicable diseases attaining the health Millennium Development Goals (MDGs) will prove difficult for many
countries in the CIS and SEE because of the failure of health services
to deliver adequate and timely services Access to key infrastructure services-in particular lighting and heating-is actually deteriorating
in some countries of the low income CIS group
The single most important factor behind the significant decline in
poverty in the period in question is high growth in the CIS where the
bulk of the poor reside Combined with moderate levels of inequality
economic growth has delivered significant poverty reduction To some
extent this rebound in growth rates in the CIS is unsurprising
although at the height of the financial crisis in Russia and neighboring
contagion-which came at the end of a decade of difficult transitionshyit was hard to see the prospects for resumption in growth A further
factor influencing poverty reduction since 1999 is the reduction in
consumption inequality in some countries of the CIS which too can
be viewed as a rebound from the levels observed in the 1990s
Because the substantial reduction in poverty is the result of a unique constellation of factors-rapid catch-up growth in the CIS
accompanied by reductions in inequality in some countries-prospects
for poverty reduction going forward are less propitious Very few counshy
tries even those that have made the most progress in reducing poverty have been successful in creating jobs to fully replace those
that have been destroyed To some extent reduction in overall
employment was only to be expected given the socialist legacy of high employment-to-population ratios However the failure to generate a
sufficient number of jobs means that employment-to-population ratios have been falling except in a few of the rapidly growing counshy
tries of the CIS In the EU-8 and SEE the employment ratio is well below what is found in Organisation for Economic Co-operation and
Development (OECD) countries If it persists this failure to expand employment will fundamentally limit the poverty reduction impact of
growth and act as a brake on further reduction of absolute poverty
This is an issue even in countries where poverty is relatively low (for
example Poland where rising poverty is related to the growing divide
between those with and without employment)
In addition to concerns on the jobs front there is a marked regional
and spatial dimension to both the income and nonincome dimenshy
sions of poverty in the Region The most rapid declines in poverty
have been observed in capital cities as opposed to secondary cities
and rural areas In parts of the CIS poverty rates are just as high in
FIGURE 1 More than 40 Million People Moved out of Poverty during 1998-2003 Distribution of Population by Poverty Status
100
90
80
70
=60CI ~
-= 50 CI 040
30
20
10
1998--9 2002-3
_ Nonpoor above $430 a day
c=J Vulnerable above $215 and below $430 a day
_ Poor
below $215 a day
Source World Bank staff estimates using ECA Household Surveys Archive
Note In million persons and in permiddot cent to populationPoverty lines conmiddot verted to local currencies using 2000 PPP Data refer to ECA Region as deshyfined by the World Bank and Turkey is inclUded in the aggregate figures
4 Growth Poverty and Inequality Eastern Europe and the Former Soviet Union
secondary cities as in rural areas Throughout the Region the quality of public services is also poorer outside of capital cities and trends are mixed with some differences between capital and noncapital areas getting smaller and others larger
Overall there is a substantial agenda of reforms if countries wish to reduce poverty in all its dimensions over the coming years While specific actions will vary from country to country all countries need to focus on poliCies that will accelerate rates of growth and ensure that benefits are widely shared among the population In addition efficiency and equity concerns warrant strengthening delivery of edushycation health and public utilities services and enhancing social proshy
tection It is also essential to monitor progress on poverty reduction Poverty and poverty reduction have a special significance in the
Region that is different from that in other parts of the world First as mentioned previously the cold climate means that the notion of
basic needs has to be expanded to take into account the need for warmth Only a small fraction of the population in the developing world would require a similar expansion of the basic needs set Secshyond many countries in the Region completed the demographic and epidemiological transition a few decades ago This graying of the popshyulation poses significant challenges for public policy particularly where there are trade-offs involved in relation to the working (or the young) versus the elderly There is also a greater burden of noncomshymunicable diseases with implications for costs and access to health care Again there are few countries at equivalent levels of income that face a similar challenge Finally the legacy of the former socialist systems of production means that huge inefficiencies exist in the way production is organized how infrastructure is deployed and where people are located Breaking with the past represents not only an opportunity but also a challenge
Trends in Poverty in the Region 1998-2003
Since 1998 absolute poverty at $2 a day (or more accurately $215
a day) has declined in most countries in the Region (figure 2) Two
countries Georgia and Poland bucked the trend of declining poverty
and in another one Lithuania poverty was largely unchanged These trends which are based on comparable consumption aggreshy
gates specially constructed for the purposes of this report reflect the
use of the latest purchasing power parity (PPP) exchange rates (2000
PPP) available for the countries of the Region The use of different PPP revisions affects the ranking of a few countries in the Region
5 Overview
especially those that experienced hyperinflation or continue to pracshytice administrative price setting but leaves the overall extent of poverty and trends unchanged (see overview box l)
As it did five years ago absolute deprivation varies enormously
across the Region At one end of the spectrum are countries in the
low income ClS group such as Tajikistan where the proportion of the population living on less than $2 l5 per day is more than 70 percent
while at the other end are countries in the EU-8 such as Hungary
where absolute poverty by this definition is virtually absent Counshy
tries fall into three broad groups those with high poverty (all low
income CIS countries) those with low poverty (typically EU-8) and those in between with moderate poverty (typically SEE and middle
income CIS countries) These groupings are not hard and fast with
some countries in SEE (for example Bulgaria) and the middle income
CIS group (for example Belarus) having low levels of poverty
Even where incomes have grown and absolute material deprivashytion at $2l5 per day is low the standard of living is not high and
FIGURE 2 At the Country Level Absolute Poverty Has Declined Almost Everywhere Poverty Rates by Country
100
90
80
70
60 c 2 laquoi 50 -=co e co 40 0 of 30
20
10
0 I OOIN 0018 OOIN ~IM _1 M ID 0 m mom 0 0 0 ID 0 mom 0 moo 0 ~ N ~ N - N - N N N
Hungary Lithuania Poland Romania Bulgaria
EU-8 SEE
~IN ~IN -tMoolN _1 M m g ~ g 3 8 ~ g g co- g m 8g- N _ N N N _ N ~ N
Belarus Russian Kazakhmiddot Georgia Uzbeki -Fed stan stan
Middle income CIS Low income CIS
Below $215 aday bull Above $215 but below $430
~IM ~I 01 ~I~ g g 3 - N ~ N N N - N
Moldova Armenia Kyrgyz trajikistan Rep
bull
Source World Bank staff estimates using EGA Household Surveys Archive
Note2000 PPP
6 Growth Poverty and Inequality Eastern Europe and the Former Soviet Union
OVERVIEW BOX 1
Using Purchasing Power Parity to Measure Poverty
An absolute poverty line as the name implies attempts to establish the value of consumption
that a person needs to stay out of poverty regardless of time and place The first widely acshy
cepted global poverty estimates produced by the World Banks World Development Report in
1990 chose a poverty line measured in 1985 PPP Chen and Ravallion (2001) have since updatshy
ed these numbers using 1993 PPP exchange rates for consumption The PPPs were again upshy
dated for the Region in 1996 and this updated set was used by Making Transition Work for
Everyone (World Bank 2000a)
This report uses the most recent PPP numbers from 2000 (OECD 2003) More recent data on
PPP are more relevant for the transition economies of the Region because they reflect contemshy
porary (in many cases liberalized) prices as opposed to the administered prices of the past For
Turkey a country without the legacy of an administratively directed economy all PPP revisions
produce approximately the same poverty counts (see figure) The economies of all formerly soshy
cialist countries exhibit significant changes with more recent numbers being more plausible
For example it is highly implausible that poverty in Uzbekistan is negligible (which is the imshy
pression that one gets using 1993 and 1996 PPPs and could be traced to widespread price conshy
trols in that country practiced during the 19905) Errors can also go the other way (that is overshy
state poverty) as appears to be the case when the 1993 PPP is used for Georgia In addition to
issues with relative prices Georgia experienced hyperinflations around 1993 which would have
made measurement of prices problematic It would be incorrect to say that the 2000 PPP revishy
sion solves all comparability problems Where interferences in market mechanisms continue
price surveys that form the basis for PPPs will deliver incorrect results (a factor that can be partshy
ly responsible for the low poverty headcount for Belarus)
large shares of the population are found to consume between $2 15 and $430 per capita per day This group while not absolutely deprived is likely to have relatively low savings and is vulnerable to
poverty in the event of shocks that affect earning potential Of course an absolute poverty line of $215 a day (or some mulshy
tiple) is one of many potential lines that could be drawn Often what is relevant from the perspective of the poor is the level of
resources that may be needed in the country context to be free from h unger cold and other forms of deprivation In this report the authors have chosen to use an absolute concept of deprivation not only to focus more on those who are deprived in some fundamenshytal sense but also to facilitate comparisons across countries and over time The basic needs without which individuals would be
7 Overview
Poverty Rates at $215 a Day with Different PPPs Countries Sorted by Poverty Based on 2000 PPPs
-- 1993 PPP -- 1996 PPP -- 2000 PPP
Soumis Staff estimates DECO 2003
The total poverty headcount for the Region does not change much whether one uses the 1993
PPP or the 2000 PPp although individual country assessments are affected However the 1996
PPP (with few exceptions Bulgaria Estonia and Lithuania) produces a lower poverty count than
the 2000 PPP does It is important to note that only the ongoing global International Comparison
Program (wwwworldbankorgldataicpl expected to produce results by 2007 will address fundashy
mental problems of all existing sets of PPP in their application to poverty comparisons Internashy
tionally comparable poverty data produced for this study need to be interpreted with due caution
Sounes World Bank staff World Bank 2000a Chen and Ravallion 2001 Kakwani and Sajaia 2004 DECO 2003
absolutely deprived are typically reflected in national poverty lines9
As might be expected standards of income required to ensure against material deprivation in richer countries are higher so
national poverty lines are positively related to income levels
National poverty lines in the Region suggest that a poverty line
around $2 per capita per day might indeed be a relevant absolute
floor (figure 3) When compared with national poverty lines from a
random selection of non-Region countries the Regions poverty
lines are found to be higher on average perhaps reflecting the
higher cost of basic needs due to the extremely cold climate in cershy
tain countries However high though they may seem even the
highest national poverty lines in the Region are substantially lower
than poverty lines of two of the poorest EU-15 countries 10 Greece
8 Growth Poverty and lnequality Eastern Europe and the Former Soviet Union
FIGURE 3
The Lowest National Poverty Line in the Region Is around Two Dollars a Day
9$
bull Greece 8$
c bull PortugalCgt
~ 7$
~
~ 6$
Cgt
~ 5$
~ ~ 4$ ~ Cgt Cgt 3$
ii c Cgt ~ 2$ z
1$ - --- --- - -~- ---- - --- -------- --- - --- --------- shy
Hungary
bullBulgariabull
Nigeria Burkina Faso
O$L---------------~~---------------
1$ 10$ 100$
Level of consumption per capita per dayperson log
bull NonmiddotEGA countries bull EGA countries
Sources Region World Bank staff estimates nonmiddotRegion Kakwani and Sajaia 2004 and DEGD 2003 EUDennis and Guio 2004
Note latest years of available data used all values expressed in 2000 PPP $
and Portugal Using measures of absolute deprivation that are more consistent with national poverty lines but still modest (such as $430 per capita per day) it is evident tbat absolute deprivation continues to exist even in relatively well-off countries such as EU-membershystate Hungary (figure 2)
How has poverty risk evolved in the past five years Looking below the national averages on population subgroups four characteristics
stand out for raising poverty risk (that is poverty incidence) above
average being young living in a rural area or (in some cases) a secshyondary city being unemployed and having low levels of education I I
Although not equally important in all subregions these were the
same groups identified as having a higher-than-average poverty incishy
dence five years ago (World Bank 2000a)
Outside the low income CIS countries children face a substantially
higher risk of poverty than other population groups do Relative
poverty risk for children has actually increased in the past five years
because poverty incidence has fallen less rapidly among families with
children than for other groups (figure 4a)
9 Overview
Residents of rural areas face a higher risk of poverty than those in
cities do (figure 4b) Among the rural dwellers children usually face
the highest poverty risk often multiple times the national average
But in some countries of the CIS poverty risks are as high in secondshy
ary cities as in rural areas Indeed lumping capital cities together with
other urban areas can be misleading because of the contrast between
their positions Over the past five years with few exceptions poverty
has declined far more rapidly in capital cities than elsewhere As a
result residents of rural areas and secondary cities face a far greater
risk of poverty relative to capital city dwellers than previously
Outside the low income CIS countries the unemployed face sigshy
nificantly higher risks of poverty than the employed do (figure 4c)
With the resumption of sustained growth in the CIS and an improveshy
ment in the position of the employed the relative risk of poverty
faced by the unemployed has increased significantly
The risk of poverty falls with educational attainment As shown in
the report over time the risk of poverty of those with basic education
FIGURE 4a Children Face a Greater Risk of Poverty than Other Population Groups in Most Cases This Risk Has Increased over Time
25
-II () c-O c
~
2 I
~
15 ~ ~ middotu E K -6 ~ E ~ A-A t a ~ gt 1 - - shy ~ t2t e4 Q - ~ ~
~ - ~ =
()
c
05 +---+ ~ ~
Hungary Poland Romania Bulgaria Russian Kazakh - Moldova Georgia Armenia Kyrgyz Rep Tajiki-Fed stan stan
EU-8 SEE Middle income CIS Low Income CIS
--- lt6years -e- 7- 14 years -6- 15-17 years - between 18 and 65 years -+- ~ 66 years
SourceWorld Bank staff estimates using ECA Household Surveys Archive
Note 2000 PPP Poverty line for the EU-8 and Bulgaria is $430 per day Risk of 1 indicates that an age group is no more or less likely than the average to fall into poverty
10 Growth Poverty and Inequality Eastern Europe and the Former Soviet Union
FIGURE 4b Poverty Reduction in Secondary Cities and Rural Areas Has Lagged behind Capital Cities
Poland
Hungary
Lithuania
Romania (I)
Macedonia FYR
(I) Russian Fed c
g~ - QlEu
Kazakhstan
Moldova
Georgia
(I)
c Kyrgyz Rep E Q
U
Armenia ~
Tajikistan
Uzbekistan
- 0 + 100
Change in poverty
bull 2003 capital cities bull 2003 secondary cities bull 2003 rural areas
o Change in poverty D Change in poverty bull Change in poverty capitalcities secondary cities rural areas
SourceWorld Bank staff estimates using ECA Household Surveys Archive
Note2002 data used instead of 2003 in Russia Poland and HungaryThe benchmark year to measure change is 1998 exshycept in Kazakhstan where it is 2001 Kyrgyz Republic and Uzbekistan 120001 and Tajikistan 11999) Poverty line for the EUshy8and FYR Macedonia is $430 per day everywhere else it is $215 per day in 2000 PPP
50
Percent of population defined as poor
11 Overview
or less rdative to other groups has increased reflecting their handishycap in benefiting from new economic opportunities
Ethnicity is also associated with higher-than-average poverty incishydence in some cases Data on ethnicity are sometimes not covered in surveys and even where they are sample size may preclude any
robust conclusions While the data do not allow trends to be inferred relatively strong evidence exists that in more than one country groups such as the Roma of Central and Eastern Europe (CEE) face a substantially higher incidence of poverty than the general population does (World Bank 200lc World Bank 2002g and World Bank 2005e) Available evidence on other minorities is mixed with some faring worse than average such as the Turkish minority in Bulgaria or the Russian minority in Latvia while others do better such as the Russian minority in the Kyrgyz Republic or the Hungarian minority in Romania (World Bank 2003i World Bank 2003k World Bank 2004g) The relative position of minorities is a function of human
capital and other endowments relative to the population as a whole and of their position in relations of power which may vary from
group to group Within countries poverty incidence shows marked variation and
there is evidence that regional differences are growing over time in some countries (figure 4d) This is because poverty rates have typishycally declined more sharply in capital cities and other prosperous areas of trade and tourism than in rural areas or secondary towns In a related vein many countries outside the low income CIS group (where information is more limited) show high and highly persistent differences in unemployment rates across regions
Composition ofthe poor Most of the poor in the Region comprise workshying adults and children who between them account for 60-75 pershycent of the poor (figure 5) In most instances poor children are children of working parents This structure of poverty with the preshydominance of working families (that is households with working adults) is no different from that of the past although the share of working families has declined The next largest group comprises those
out of the labor force followed by the unemployed and the elderly
With regard to location urban and rural residents are evenly split
each constituting around 50 percent of the poor in the Region as a
whole This split is influenced by an interaction of higher-than-avershy
age poverty risk for rural residents and their relatively low share in
the population In relation to subregions rural residents form the
bulk of the poor in the low income CIS group (70 percent of the poor) SEE (62 percent) and the EU-8 (5l percent) The only subregion that
12 Growth Poverty and Inequality Eastern Europe and the Former Soviet Union
FIGURE 4c The Unemployed Face Higher Risks of Poverty than the Employed This Risk Has Grown over Time in the CIS
350
300 gt)(0 Q ~ 250
e -
shy~ ~ 200
~~ Q 150 e gt amp I 100
050 Poland Romania
EU-8 SEE
Belarus Russian Kazakh-Fed stan
Middle income CIS
Moldova Georgia Tajikistan
Low income CIS
bull 1998 poverty of unemployedpoverty of employed
2002 poverty of unemployedpoverty of employed
SourceWorld Bank staff estimates using ECA Household Surveys Archive
Note For Kazakhstan 2001 is used instead of 1998 and 2003 instead of 2002 for Tajikistan 1999 instead of 1998 and 2003 instead of 2002 For Romania and Moldova 2003 is used instead of 2002 For the EU-8 and Belarus the poverty line is $430 everywhere else it is $215 aday in 2000 PPP
FIGURE 4d There Are Marked and in Some Cases Increasing Differences in Poverty across Regions
30 bull
25
o 20
~ 15gt o 0
fti2 10 ftj Z bull
5 bull
Source World Bank staff estimates using ECA Household Surveys Archive
Note The box depicts the spread in regional poverty rates Iboxes plot upper and lower boundaries called interquartile range of the interval where most of the regional poverty rates would fall and the whiskers the extremes) Dots represent outlying regions in a statistical sense
- - - -
13 Overview
is dominated by urban poor is the middle income CIS group (only 41
percent rural poor)
Trends in poverty depth At the end of the 1990s the general undershy
standing was that poverty in the Region while widespread was relashy
tively shallow The pattern five years later appears more varied with
the Regions countries now spanning a wide range (figure 6) Using
Turkey Vietnam and Colombia as the benchmarks shows that poverty in the low income CIS group is fairly deep but in the middle income
CIS countries and SEE it is fairly shallow In the EU-8 the picture (relshy
ative to a $430 poverty line) is mixed with examples of both shallow
and deep poverty
Trends in inequality While there is no clear trend in the EU-8 and SEE
consumption inequality in the CIS declined (with few exceptions)
between 1998 and 2003 (figure 7)12 By 2003 consumption inequalshy
ity in the Region as a whole looked broadly comparable to that in
OECD countries and East Asia While inequality in consumption does
not appear egregiously high subjective data suggest that people in
the Region continue to find inequality to be excessive This may be
FIGURE 5 Working Adults and Children Continue to Form the Bulk of the Poor in the Region
100 r- r- r- r- r- r-
c 752 = E co 50 ~ co c ltf 25
1998 2002 1999 2003 1999 2002 1999 2003 1999 2003
Poland Romania
EU-8 SEE
Russian Fed
Middle income CIS
Moldova Tajikistan
Low income CIS
aChildrenllt16 years) 8Working (employed+self-employed) 8 Unemployed ~Inactive cElderly (66 years)
SourceWorld Bank staff estimates using ECA Household Surveys Archive
Noll For the EU-8 and Bulgaria the poverty line is $430
14 Growth Poverty and Inequality Eastern Europe and the Former Soviet Union
FIGURE 6 In Some Countries Poverty Is Shallow in Others Deep Deficit in Consumption of an Average Poor Person as Percentage of Poverty Line
Hungary
PolandI I w Lithuania
Estonia
Serbia amp Montenegro w w CI) Albania
Romania Russian Fed
2~~ E5 ~ Kazakhstan
Armenia
CI) Moldova
~ UzbekistanE
CI ltgt 5 Kyrgyz Rep ~ CI Georgia
Tajikistan
IIgt Vietnam E
c Colombia ltgt c III Turkey
-5 -15 -25 -35 -45
Depth in to poverty line
SOUfce World Bank staff estimates using ECA Household Surveys Archive
Note For the EU-B the poverty line is $430 everywhere else it is $215 per day per capita in 2000 PPPlatest year of availshyable data used
related in part to the fact that despite recent faIls in the CIS inequalshyity remains significantly higher than at the outset of the transition
The decline in inequality in most of the CIS (with the notable
exceptions of Georgia and Tajikistan) also runs counter to widely held
perceptions that the bounce-back in growth has gone hand in hand with widening income differentials There are at least three reasons
why subjective and objective measures may suggest different trends
First changing relative positions of different population subgroups
may leave overall inequality unchanged but may lead to the impresshy
sion of growing inequality For example the rise in the position of
capital city dwellers relative to residents of secondary cities may leave overall inequality unchanged (as for example would be the case if
the two groups simply switched positions in the income distribution) but may contribute to the perception of a growing divide
15 Overview
FIGURE 7 While Changes in Distribution Have Gone Either Way in the EU-8 and SEE They Have Moved in Favor of the Poor in the CIS (Georgia and Tajikistan Excepted)
Estonia
exgt Hungary
Lithuania
Poland
Albania
Bulgaria en Romania
Serbia amp Montenegro
en Belarus C3 E Kazakhstan 0 Ru ssian Fed i Ukraine
Armenia en C3 Georgia E 0 Kyrgyz Rep ~ 0 Moldova
Tajikistan
Colombia ~
E c Turkey c
CICI Vietnam
0100 0200 0300 OAOO 0500
Gini Index
1998 2003
Source World Bank staff estimates using ECA Household Surveys Archive
Note Gini index for per capita consumption
Second measures of inequality typically employed in the literashyture (including in this report) are measures of relative inequality however subjective perceptions often relate to absolute differences in income not relative ones For example if everyones income increases by 10 percent measures of inequality (such as the Gini
16 Growth Poverty and Inequality Eastern Europe and the Former Soviet Union
coefficient employed in this report) would show no change in the distribution of income 13 However the absolute difference in the incomes of the rich and the poor would have increased (for example 10 percent growth means a larger absolute increase in income for
the rich than for the poor) contributing to a perception of growing inequality14
Third sampling and nonsampling errors mean that survey data may do a poor job of measuring income growth at the top of the disshytribution and thus may end up underestimating upward drift in inequality This is a worldwide problem however if there is confishydence in the quality of the data at the lower end of the distribution
one can be reasonably confident of trends in poverty and inequality in the vicinity of the poverty line In the Region because of data
improvements in all but a handful of countries the measured trends in poverty and inequality are robust
Factors Contributing to Poverty Reduction 1998-2003
Growth in output and wages Since 1999 the growth of the gross domesshytic product (GDP) in the Region has been impressive (higher than the world average) with the CIS the most rapidly growing subregion For the CIS the recovery of growth in Russia has been an important facshy
tor The devaluation that accompanied the financial crisis in Russia was important for restoring the exchange rate to a more competitive level and spurring the recovery of exports and growth Combined with high prices for oil and other natural resources this gave a huge boost to the Russian economy which has in turn become a regional locomotive for many neighboring countries Structural reforms that had been undertaken by many of the CIS countries enabled an improved supply response when the opportunity presented itself For
the EU-8 the prospect of accession provided a strong impetus for
both reforms and growth while the restoration of peace and stability
in SEE was an important factor in sustaining recovery (figure 8)
Mirroring the growth in output there has been a sharp upswing in
average wages in all economies in the Region For example in the
low income CIS group real wages have almost doubled since 1997 Data on wages by profession or by position in the income distribution
suggest that this upswing has been shared alike by unskilled and
skilled poor and nonpoor In most cases wage increases have been
larger than increases in productivity reflecting in part the bounceshy
back of wages from the very low levels observed in the late 1990s in
the CIS and parts of SEE
17 Overview
While growth has resulted in the creation of new and more proshyductive jobs only the fast-growing economies of the CIS have been able to create jobs at a sufficient pace to replace ones that were lost Employment-to-population ratios have therefore stayed steady or declined almost everywhere outside the CIS (figure 9)15 Because of the failure to engender sufficient job creation the EU-8 and SEE are
well below the Lisbon targets of 70 percent of the labor force in employment 16 The position is somewhat different in the CIS where
employment levels tend to be higher and in many cases are trending upward (with some notable exceptions such as Georgia and Tajikshy
istan) While some fast-growing countries have succeeded in increasshying wage employment (for example Russia) in many low-income countries the main source of employment growth has been through the expansion in self-employment (for example Moldova)
Even where employment ratios are stable there has been a continshyuing reallocation of labor across sectors In most of the EU-8 agriculshyture employment fell and its relative share of employment is now close to the EU benchmark In contrast agriculture employment increased in
most SEE and low income CIS countries Expansion of employment in services was observed in almost all countries in the Region
FIGURE 8 Since 1999 Growth Rates in the Region Have Been High with the CIS the Most Rapidly Growing Subregion
15
10
I
~ Or----~--~~~~--~r-~~~~--~--~~--~~ l
- 10
-15
-20
-25
EUmiddot8 - SEE - Middle income CiS - Low income CIS
SourceWorld Development Indicators (World Bank 2005i)
20 Growth Poverty and Inequality Eastern Europe and the Former Soviet Union
in distribution in poverty reduction for selected growth periods since 1998 The growth share measures how much poverty reduction can be attributed to growth in mean incomes on its own (that is assuming no changes in the distribution) while the distribution share measures how much can be attributed to changes in the distrishybution of incomes alone assuming no change in mean income Figshyure 11 highlights the overwhelming importance of growth to poverty
reduction over the period in question Relative to growth the contrishybution of changes in distribution to poverty reduction has been relashytively small But as small on average as they appear changes in distribution have clearly been quite important in some countries For example in Poland in 1998-99 40 percent of the increase in poverty is attributable to the increase in inequality while 60 percent is attribshyutable to the decline in income In a number of countries in the CIS the share of changes in distribution to poverty reduction in the period since the end of the financial crisis is more than 20 percent
Role of public transfers In addition to wages public transfers are an important component of household income and play an important role in poverty reduction In most countries social protection benefits
FIGURE 11 The Share of Growth in Poverty Reduction Is Dominant across All Regional Subgroups
20
~ 10 0 CI
ltfl
~ Q CI - 10 5 -20 ~ ()
I -g ro ~(U c cc -0 ro ro ro ro-0 ci ~~ gtmiddotc middotc middotc ~sect ~ ~ 0 0
~ 0 iii ro ~ a ~ -0-0 0c c0 EQi~ ~ (5 ro~ ro0shy ltC0 0 co J or ~ ~ ~~ ~a a gtshy1 ~
ro
gtshya a 2001- 22000-1 2001-2 2000-1 2000-1 2001 - 2 2002-3 1998-9 1999shy 2002- 3 2000-2 1998-9 2000-1 1998-9 1999shy 1999shy1998-9 1998-9
EU-8 SEE
Overall change in poverty
Due to growth bull Due to inequality
2002 Middle income CIS
20032002 Low income CIS
Sourcemiddot World Bank staff estimates using ECA Household Surveys Archive
21 Overview shy
have increased in the past five years in real per capita terms along with the growth of fiscal revenues Where data are available they suggest that benefits have also improved in both coverage and adeshyquacy The reduction in arrears particularly in pensions but also in other benefits has no doubt contributed to these improvements As a result social protection transfers have come to play an important role in reducing poverty Indeed poverty would have been significantly higher in a hypothetical no-transfers situation (overview table 1)
While somewhat Simplistic particularly in assuming no behavioral response in the no-transfer scenario (except in a few instances) the
data are nonetheless illustrative of the importance of public transfers to poverty reduction especially outside the low income CIS group
Private transfers In the low income CIS countries and parts of SEE remittances and other private transfers by far exceed publicly proshyvided resources In some cases remittances accounted for more than 10 percent of GDP and boosted consumption levels including among the poor helping to reduce poverty however the size of the impact is difficult to estimate because of various data limitations (Chernetsky Forthcoming)
OVERVIEW TABLE 1 Transfer Payments for Social Protection Have Had an Important Role to Play in Reducing Poverty outside of the Low Income CIS Countries
Incmeln PlMltYwiIhout Veer an socIallr1 I
EUmiddot8 Poland 2001 141
SEE Bosnia ampHerzegovina 2001 68 Bulgaria 2001 156 Romania 2002 49 Serbia Montenegro
Middle income CIS Belarus Kazakhstan
Russian Fed Low income CIS
Armenia Kyrgyz Rep
Benchmark Countries
Vietnam
2003 2002
2002 2002 2002
2001 2001
1998
41 34
143 100
68
12 10
5
Sources For ECA World Bank various poverty assessments for Vietnam Van De Walle 12002)
Note Simulations use national poverty lines Some behavioral response is assumed in Romania 150 percent oj transfer inshycome is replaced) and Serbia 172 percent of transfer income is replaced in rural areas 87 percent in urban areas)
22 Growth Poverty and Inequality Eastern Europe and the Former Soviet Union
The impact of public and private transfers on inequality is mixed Parts of the public transfer system such as well-targeted social assisshytance programs can be fairly progressive Others may be regressive
The largest program in most countries however is the public pension program which tends to be distributionally either neutral or regresshysive The overall impact thus varies from country to country with examples of both fairly progressive and fairly regressive systems in
the Region Unfortunately there has been little systematic study of the contribution of public and private transfers to changes in inequalshyity over this period
Nonincome Dimensions of Well-Being 1998-2003
What are the trends in the nonincome dimensions of well-being Although there has been a reduction in poverty trends in the noninshycome dimensions of well-being such as access to education health care safe water and heating are markedly variable Inequalities in access whether to good schooling or health care or reliable water and electricity persist and in some cases have increased particularly in the CIS In these countries many people have thus come to have more income in their pockets but in access to services and quality of services they may be no better off
Education The most acute form of education deprivation is illiteracy Average literacy among the transition countries of the Region is high (more than 98 percent) and in the transition country with the lowshyest level of literacy (Tajikistan) 96 percent of adults are literate In a benchmark country Turkey literacy was much lower to start with and despite increases stood at just 875 percent in 2002 Thus the extreme form of education deprivation does not appear to be a major issue in the Region
Since 1998 many countries in the Region have maintained or
improved their high levels of school enrollment Most countries
entered the 1990s with a widespread network of education services
that enabled them to achieve almost universal coverage in compulsory
education However some of these achievements were eroded during
the 1990s particularly among the low income CIS group and some countries in SEE although even with the decline in coverage enrollshy
ment in the compulsory cycle was typically higher than in comparator
countries Since 1998 enrollment in the compulsory cycle has been maintained or improved except for some poor countries such as Georshy
gia the Kyrgyz Republic and Tajikistan which have still not managed
23 Overview
to arrest the decline (figure 12) While there is evidence of some income gradient in enrollment with children from better-off households havshying better coverage the gradient is not large Continuing high coverage in most countries of the Region suggests that the prospects for meeting the MDG of universal primary enrollment are fairly good (World Bank 200Sc) Gender inequality in compulsory education has not been an issue except in Tajikistan where it continues to warrant attention
Compared with the primary level enrollments at the secondary level have increased throughout the Region This increase has genershyally been accompanied by a reduction in enrollment gaps across
income groups except in a few low income CIS countries Urbanshyrural gaps have also been reduced in virtually all countries Interestshyingly gender inequalities at this stage of education favor girls The exceptions to this are Bulgaria and Tajikistan Although the ratio of female to male enrollments in Tajikistan has increased over the past five years it continues to be low by the standards of the Region
Returns to education which were highly variable during the 1990s particularly in the CIS have now stabilized at levels similar to those of market economies This underlines the value of investment in educashytion not only for its own sake but also as a means for ensuring adeshyquate standards of living particularly for the poor However returns are a function not simply of access but also of quality of education Compared with enrollments trends in quality of education are less
sanguine Despite increases in spending on a real per capita basis almost everywhere in the Region the failure to invest sufficiently in the quality of infrastructure or staff means that quality is not being maintained For example Trends in International Mathematics and Science Study (TIMSS) data suggest that although performance of eighth graders continues to remain good relative to those in other countries including those in OECD countries at higher levels of income scores are declining in all but a handful of countries in the EUshy8 Where the analysis is available it suggests that the declines are in large part due to a sharp increase in the share of students who are serishyously underperforming Often these students tend to be in schools
where the quality of service provision is marginal such as rural
schools Reading scores of 1S-year-olds from the Programme for Intershy
national Student Assessment (PISA) present no different a picture Apart from a small handful of countries in the EU-8 scores are declinshy
ing or low
Health care Trends in health status and health care utilization are
mixed Declines in male life expectancy (particularly in the successors of the Former Soviet Union) which had become one of the most
24 Growth Poverty and Inequality Eastern Europe and the Former Soviet Union
FIGURE 12 Access to Secondary Education Has Gone Up Virtually throughout the Region but Some Countries Continue to Struggle to Arrest the Decline in Primary Enrollment Rates Enrollment in Primary Education (7-14 years)
100
98 bull I Ci
c 96
S bulltI I I94 e amp
bullc 92 amp
shy I90
88 +-------------------------------------------------------- Poland Hungary Bulgaria Romania Russian Kazakh- Kyrgyz Georgia Moldova Armenia Tajikistan Colombia Turkey Vietnam
Fed stan Rep
BenchmarksEU-8 SEE Low income CISMiddle income CIS
bull 1998 amp 2002--)3
Enrollment in Secondary Education (15-17 years)
100
1 bull
95
90
1 I ICi 85c 80 S
65
ItI 75 bull e 70 c amp
- ~ 60 bull 55
50 Hungary Poland Bulgaria Romania
EU-8 SEE
bull 1998-99 amp 2002--)3
Ru ssian Kazakh-Fed stan
Middle income CIS
Armenia
amp
Georgia Kyrgyz Moldova Tajikistan Colombia Turkey Vietnam Rep
Low income CIS Benchmarks
SourceWorld Bank staff estimates using ECA Household Surveys Archive
25 Overview
widely documented negative health outcomes of the transition have
generally been arrested However many of the proximate causes of high male mortality notably the high incidence of cardiovascular and
circulatory disease and death from accidents and acts of violence
remain As with male life expectancy child and maternal mortality
are also trending in the right direction However the very slow
progress in achieving reductions in mortality and concerns about the
delivery and quality of critical medical services imply that many counshy
tries in the CIS appear unlikely to meet the child and maternal morshy
tality-related Millennium Development Goals (MDGs) (World Bank 2005c)19
There is a growing threat to the health of the Regions population
from HIVAIDS and tuberculosis (TB) particularly in the CIS but also
to some extent in SEE and the EU-8 (the Baltic countries) The Region
as a whole currently has one of the most rapidly growing infection
rates of HIV I AIDS in the world due to problems related to the increase in injecting drugs and commercial sex work a concurrent
increase in the incidence of sexually transmitted infections (STIs)
high migration rates limited capacity of governments and civil socishy
ety to implement effective preventive responses and low levels of
awareness of HIV and STIs Drug transit through the CIS and growth
of local consumer markets for drugs are also contributing to the probshy
lem At current rates of infection and treatment the HIV I AIDS MDG
is unlikely to be attained by a broad swath of countries in the Region (World Bank 2005c)
Countries in the Region have a large network of public health
providers that distributed generous services and that suffered major fiscal restrictions during the 19905 Between 1994 and 1999 counshytries in the Region spent on average 4 percent of GDP on health rangshy
ing from 1 percent in Georgia (low income CIS group) to 9 percent in
Croatia (SEE) After 1999 some countries in the low income CIS
group continued to experience reductions in public spending on health Other poor countries were able to stem the decline in spendshy
ing but only at very low levels of spending (for example Armenia)
Even where funding may be on the upswing outside the EU-8 it is
not close to levels experienced at the outset of the transition
While funding levels may have stabilized or even increased this is
not reflected in improving quality particularly for the poor because of
three factors First the very large network of providers has largely been
retained resulting in an underfunded and hence ineffective network
in many countries Second the lack of resources for basic interventions
like public health activities has resulted in a repeated failure to stem
communicable diseases Third the changing demographic composition
26 Growth Poverty and Inequality Eastern Europe and the Former Soviet Union
of the population (which is becoming older) has altered the morbidity profile and increased the costs of health provision Vulnerable populashy
tion groups (such as rural or small-town dwellers or the poor) are expected to have borne the brunt of not only the misallocation but also the failure of resources to keep pace with needs
The lack of public resources increased the use of fee-for-services in a mostly unregulated setting reducing the demand for health care
Official statistics show the decline in utilization of health care during the 1990s but after 1999 this remained stable or even recovered (figshyure 13) Inpa tient care in the low income CIS group declined more than 20 percent between the mid-l 990s and 2000 only to stop after
2001 Countries in the middle income CIS group continue to have very high hospital utilization rates higher than the EU average Surshyvey data on utilization which control for need suggest a similar picshyture but point in many cases to persistent differentials across rural
and urban areas particularly in the CIS
Infrastructure Turning to infrastructure here too the picture is very
mixed Data problems make this a particularly difficult area to analyze However what is clear is that countries of the Region began transition
reasonably well covered with basic utility services but the economic shocks of the early reform years left providers strapped for funds
which meant that utilities deteriorated Regionwide for much of the 1990s Since then the decline in utility performance (as measured by access and quality) has been reversed or slowed Electricity has shown
FIGURE 13 Hospital Utilization Rates Have Recovered but Remain at Low Levels in Parts of the Low Income CIS Group
1994-8 1999 2000 2001 2002
-lithuania (EU-8) - Romania (SEE)
- Belarus (middle income CIS) - Georgia (low income CIS)
Source WHO based on official statistics of hospital admissions
27 Overview
the greatest improvement providers have maintained near universal coverage while improving reliability in subregions where it was particshyularly poor such as in the low income CIS countries Other recent gains include the expansion of gas supply networks to many houseshy
holds affected by the collapse in district heating and the improvement of water reliability in some countries Despite these improvements many households including many urban households in the CIS and in some parts of SEE continue to use dirty fuels such as coal wood and oil for heating because they lack access to gas and cannot afford or are not reliably provided with electricity Available survey evidence suggests that the reliance on solid fuels for heating affects the poor more than the rich (figure 14) This could have a long-term impact on the health of the poor due to the negative impact of increased indoor
pollution Over the past five years access to clean heat has become less
FIGURE 14 The Poor Make Greater Use of So-Called Dirty Fuels for Heating Percentage of Population Using Clean Sources of Heating in the Poorest and the Richest Quintiles (Latest Available Year)
6 Hungary w
Bulgaria w w (I)
Romania
-e
8 ~ Kazakhstan i 5
Armenia (I)
u E CI Moldova 5 ~ CI
J Tajikistan
jl Turkeyc -
eaI
o 10 20 30 40 50 60 70 80 90 100
of population
Poorest quintile bull Ri chest quintile
SourceWorld Bank staff estimates using ECA Household Surveys Archive
Note Clean fuels are all sources of heating for ahousehold except solid fuels such as wood and coal which are classified as dirty
28 Growth Poverty and Inequality Eastern Europe and the Former Soviet Union
equal in some countries of the low income CIS group (for example Armenia) although in others (such as Tajikistan) the revival of district
heating has improved equity Although time-series data tracking water availability are available
for only a few countries the evidence from the low income CIS counshytries shows the influence of years of little maintenance and no investshy
ment in water provision (figure 15) Although households officially still have water connections little water flows through the pipes On average Tajik households receive water for less than six hours each day and although not depicted here households in smaller cities and
rural areas have the least water
Are key public services affordable Both catastrophic health spending and the additional cost of utilities pose the challenge of affordability for
the poor Household expenditure shares for utilities have continued to increase from the late 1990s to the present (figure 16) They are typically higher for poor households than for rich ones On average however expenditure shares are highest in the EU-B followed by
SEE the middle income CIS countries and the low income CIS group as shown in the figure The increase in utility expenditure shares is largely driven by the increasing cost of electricity and in the EU-B
the price of water
FIGURE 15 In the Low Income CIS Countries the Reliability of Water Supply Is Low and Shows Little Improvement Access to Uninterrupted Water Supply
24
20gtshy =- 15gtshyQ J =shyE 10 t J ~ c
5
0
Bulgaria Georgia Tajikistan
SEE Low income CIS
III Poorest quintile bull Richest quintile
SourceWorld Bank staff estimates using ECA Household Surveys Archive
29 Overview l
FIGURE 16 Household Expenditures on Utilities Have Increased Expenditure Shares on Electricity Heating Water and Sewerage
24
22
20
en 18 E
16 3 c = 14GO CL )( GO 12
~ 10S S 1
4
1 bull I 1
bull I Ibull Ii bull
I1
bull f I Ii
bull
i e ~
] 3 r
EU-8
j cJ
0 c
amp ~ lti
~
-s agt
a it -
e 0
~
SEE
ee 0gt
~ ~ E0
a 0
oil
0 0
~ co ~=gt
~ ~ no ~
0 c
~agt ~ ~
a
Middle income CIS
c ci coe 0 15 2 0 a ~
E s ~ ~ 0
0 (J rot gtshy fshy
Low income CIS
c
tl
a
~ E0 E a0 fshy0 gtU
Benchmark
bull 1998 or earliest bull 2003 or latest
SourceWorld Bank staff estimates using ECA Household Surveys Archive
Note For Albania Latvia Ukraine Serbia and Montenegro Azerbaijan Turkey and Colombia data before 2002 are not available For Estonia Armenia Kyrgyz Reshypublic and Uzbekistan 2000 is used instead of 1998 for Tajikistan 1999 and for Kazakhstan 2001
Catastrophic health expenditures run the danger of impoverishing households in parts of the Region such as the low income CIS counshytries where the health system relies heavily on household contribushytions and households are relatively poor Outside the EU-8 where the impact is more limited because of higher incomes simulations undertaken for the purposes of this report suggest that catastrophic health spending can increase the fraction of the poor population by
3-9 percent
Prospects for Poverty Reduction
Given what has been achieved what are the prospects for poverty reduction In drawing lessons it is worth reminding ourselves of the
main concerns five years ago when Making Transition Work for Everyshyone (World Bank 2000a) was published Then although growth had
I
1
30 Growth Poverty and Inequality Eastern Europe and the Former Soviet Union
recovered in the EU-8 and parts of SEE recovery was slow at best in
the CIS where most countries suffered an additional blow because of
the financial crisis in Russia The collapse in output particularly in the CIS combined with the increase in inequality meant a sharp increase in poverty Prospects for poverty reduction were felt to be
unclear even in the event of the resumption of growth because a core group of the very poor-the long-term unemployed and socially excluded-were likely to be bypassed by growth Despite notable
achievement in the pretransition period education and health sectors were under strain and working to the detriment of poor families and
the economic mobility of their children And to top it aiL data issues clouded researchers understanding of poverty
The picture looks different five years later and ones understanding
of the challenge of poverty needs to be suitably nuanced Economic
growth has firmly returned to the Region and all countries are expeshyriencing positive growth In addition changes in inequality have been modest over this period Moreover in the CIS which had previously
seen the sharpest increases inequality has (with the few exceptions
noted previously) abated The rise in output and the moderation in inequality have together meant a substantial reduction in poverty20
The long-term unemployed and the SOcially excluded remain a conshycern particularly because very few countries outside of the rapidly
growing economies of the CIS have succeeded in raising the share of the population that is employed However the failure to raise overall employment levels has not acted as a brake on poverty reduction to date (except perhaps in a few countries such as Poland) because in
most countries the bulk of the poor retain some attachment to the labor market and have benefited from the bounce-back in real wages The health and education sectors in most countries have benefited from increased levels of funding but because of remaining inefficienshycies in delivery this has not translated into uniform improvements in
quality Access is possibly less of a concern with poor quality and high
cost (or reduced affordability) becoming key dimensions of deprivashy
tion The quality of data has improved encouraging more confidence
about observed trends At the same time shortcomings remain espeshy
cially with regard to data on the quality dimension of public services
However while the picture looks somewhat different and notwithshystanding the impressive reduction in poverty in the Region over the
past five years it is clear that there is a long road ahead not just for the
low income CIS countries but also for many middle-income countries
in the Region (where poverty rates are lower but where most of the poor live) This is for a number of reasons First despite the recovery
poverty rates remain Significant for many countries it will be some
31 Overview
time before absolute poverty is eradicated (on this see further below) Second the recovery is still recent for many if not most countries and large numbers remain vulnerable to poverty in the event of an ecoshynomic downturn Third despite recent improvements morale (as revealed in self-reported assessments of well-being) remains low comshypared with that of countdes at similar levels of income This may be related to uncertain prospects for the future Low morale may also be related to greater inequality and erosion in access and quality of public services compared with the past
Projecting poverty rates over the medium term using available economic growth forecasts from the World Banks Global Economic
Prospects 2005 indicates that poverty will not disappear altogether
and together with economic vulnerability will affect 30 percent of the population by 2007 This is not to say that there will be little poverty reduction In fact poverty will fall by 7 percent a year or 21 million fewer people will be in poverty in the five years covered by
the forecast period (figure 17) Impressive though this reduction may
FIGURE 17 Growth Will Move an Additional 21 Million People out of Poverty by 2007 but 40 Million Will Remain Absolutely Poor and More Than 100 Million Vulnerable to Poverty
100
90
80
70
c 0 60~
E 500 li 40
30
20
10
1998-9 2002-3 By 2007
_ Nonpoor above $430 aday
Vulnerable above $215 and below $430 a day
_ Poor below $215 a day
Source World Bank staff estimates using EGA Household Surveys Archive
Note Growth rates for 2002-2007 are from the World Banks Global Economic Prospects bull = simulations
32 Growth Poverty and Inequality Eastern Europe and the Former Soviet Union
OVERVIEW BOX 2
Nonlncome Dimensions of Poverty and Millennium Development Goals In the Region
Of the Regions subregions the EU-8 is perhaps the least challenged by the nonIncome
dimensions of poverty Most countries have met or are likely to meet all of the non income
MDGs However for the Baltics current trends suggest that the spread of HIVAIDS may not be
effectively combated
The nonincome dimensions of poverty are likely to challenge some countries in SEE It is
not clear that countries such as Bulgaria and Romania w ill be able to combat the spread of
HIVAIDS Romania may also struggle to meet the water access MDG because only 16 percent
of the sizable rural population is assessed to have access to an improved water source
The nonincome dimensions of poverty particularly related to health are likely to chalshylenge the middle income CIS countries None of these countries is assessed as likely to be
able to combat the spread of HIVAIDS The targets for reductions in child mortality and matershy
nal mortality may also not be achieved in some countries It should be pointed out however that
because of the age and epidemiological profile of these countries proportionately higher gains
in life expectancy would accrue from reducing adult mortality through the control of noncomshy
municable diseases than from achieving targets related to the MDGs
The low income CIS countries are most severely challenged on nonIncome dimensions of
poverty Most MDGs are unlikely to be met in the low income CIS group Indeed only the MDG
regarding attaining gender equity in schOOling is on track
In benchmark Turkey the nonincome dimensions also represent a challenge In particular
even though the gender gap has been closing girls are significantly underrepresented in primary
and secondary schools The MDG for maternal mortality also appears unlikely to be achieved
with maternal mortality rates unusually high for a middle-income country
SourceWorld Bank 2OO5c
be some 40 million people are projected to remain absolutely poor in the Region by 2007 Naturally faster growth could lead to faster reduction of poverty rates Sustained economic growth is hence a crucial component of any poverty alleviation strategy These projecshytions do not incorporate any worsening of the income distribution which would undermine the impact of growth Given that inequality levels in the Region are broadly speaking at the low end by world standards some worsening of inequality over the medium term would not be surprising These projections should therefore be undershystood as a best-case scenario
33
I
Overview
Looking behind the regional aggregates and using subgroups speshy
cific targets indicate that all country subgroups face challenges in poverty reduction over the longer term A forward-looking agenda
could for example aim to meet the MDG on poverty-halving
absolute poverty by 2015 compared with 1990 levels-which is most
relevant for the low income CIS countries For the middle income CIS
group and SEE which have moderate poverty the MDG is not suffishy
ciently ambitious Eliminating economic vulnerability which this
report takes as having income (consumption) levels that are above
twice the poverty line is an appropriate modified MDG for this
group For the EU-8 who have minimal absolute poverty but are sigshy
nificantly poorer than the 15 EU member states they have joined a
modified MDG could be to reduce poverty by half assuming the
poverty line to be the lowest among the EU-15 21 Overview table 2
shows that despite recent progress all subgroups face a real chalshy
lenge in poverty reduction The required growth rates are signifishy
cantly higher than the rates at which these countries are expected to
grow Moreover as was the case in figure 17 no change in income
distribution is assumed With worsening inequality either the goals
would not be achieved or the required growth rates would be even
higher
As with income countries in the Region will continue to face
challenges on nonincome dimensions of well-being This is most
simply characterized through the prospects of attaining the MDGs on
education health and the environment which in many ways repshy
resent a subset of aspirations on the nonincome side The World
Bank (2005) projects the likelihood that countries will attain the MDGs based on recent trends in the indicators It concludes that the
OVERVIEW TABLE 2 Achieving Subgroup-Appropriate Poverty Reduction Targets over the Long Term (2015) Will Require Significantly Higher GOP Growth Rates
I IGroupings
Long-tllm growllt ratu requilld to
meet taIgIII grawIb forIellt
2OO2-71
Specific tIrgtt
Baseline
Low income CIS Middle income CIS SEE EUmiddot8
56 97
108 66
39 68 54 43
Reduce poverty by half relative to 1990 (at $215 aday) Eliminate economic vulnerability (at $430 aday) Eliminate economic vulnerability (at $430 aday) Reduce poverty by half taking as poverty line the lowest line in EU-15 today
I
523 396 553
366
Source World Bank staff estimates growth rates are from GEP
Note bull Subregional country averages weighted by GDP bullbull GEP Global Economic Prospects IWorid Bank 2005b) bullbullbull Population weighted
I
--
36 Growth Poverty and Inequality Eastern Europe and the Former Soviet Union
need to be improved to faciJitate land restructuring (for example in SEE) significant income gains can be attained from accelerated
reforms In all countries future gains in reducing poverty in rural areas would hinge on eliminating key market imperfections in input and output markets essential for enabling self-employed farmers to lift themselves out of poverty In particular the integration of rural
areas into national credit markets is critical for further investments and productivity growth in agriculture More broadly improving the investment climate in rural areas is very important Increasing evishydence shows that investments in food processing agribusiness trade and retail companies playa crucial role in helping small farmers overshy
come input and output market imperfections in helping them upgrade the quality of their products and in accessing markets (World Bank 2005a) Beyond measures related to agriculture inteshygration of the rural poor into national labor markets-either through rural off-farm employment or by improving access to urban labor
markets-and adequate social safety nets will be crucial for sustained income growth and poverty reduction particularly in the middle
income CIS and SEE countries EmphasiS on rural service delivery and infrastructure is also criticaL especially in the low income CIS
not only for its instrumental role in raising rural incomes but also as an aspect of poverty that warrants attention in its own right
PromotinH opportunities in laHHinH reHions Countries in the Region face substantial differences in poverty rates between urban and rural areas and between capital cities and smaller towns that if severe risk pershypetuating intergenerational poverty and inequality traps and act as a drag on economic growth Most countries seek to address regional inequalities through the maintenance of a stable macroeconomic envishyronment the creation of a level playing field for businesses and fiscal transfers for targeted programs in lagging regions But more can be done First countries need to enhance labor mobility When people
move to economic nodes that promise a higher expected income it
helps to reduce spatial income disparities Adoption of appropriate polishy
cies to encourage movement supported by the development of urban
housing markets and policies credit markets and entitlement reform
can provide a strong stimulus to inter- and intra regional mobility and
help improve income levels in relatively poorer areas while also boostshy
ing competition productivity and growth in destination areas Second
in countries with decentralized fiscal systems there is a strong role for
equalizing resource transfers to address regional inequalities In particshy
ular social and economic reforms in the lagging regions can be encourshy
aged through market-based incentives including the use of competitive
37 Overview
allocation mechanisms for fiscal transfers Third education and health service delivery should be strengthened in lagging regions to ensure adequate human capital formation as a route out of poverty In particshyular existing inequalities in access to public services and quality of sershyvices provided need to be addressed as a priority
Strengthening Public Service Delivery
Ensuring access and improving quality of education and health care require strengthened accountability arrangements Although low levshyels of spending are an issue more so in education than in health care only a few countries spend less than is warranted given levels of
income Thus going forward most countries will need to operate within the available resource envelope Reforms will therefore have to focus on improving the quality and efficiency of public spending
Enhancing quality and equity of education services In education the low income CIS group needs to stem the decline in primary enrollments and quality of education in particular by ending the situation in which
staff are underpaid and complementary expenditures (on textbooks heating and repairs) are underfinanced while at the same time employment and in some cases facilities remain well above standards common in much richer countries In addition some countries may need to ensure greater equity in education spending across subnashytiona I regions (for example the Kyrgyz Republic) Ensuring access to
primary education is much less of an issue outside the low income CIS countries Here the main issue is secondary education where quality and relevance to market demand are often in question Governance reforms that both strengthen government accountability for outcomes as well as increase participation and voice will be essential to improvshying outcomes Lessons from the experience of the EU-8 in raising qualshyity certainly point in this direction In particular decentralization of services to allow for a greater role for both school administrators and parents has an important role to play in stemming declines in quality
Strengthening access to and quality of health care In health care lowshyincome countries suffer from having to provide for a range of sershy
vices when budget resources are limited but even the available
allocations are not spent wisely This is reflected in the large share of
household contributions in total health spending Improving utilizashy
tion among the poor is closely linked to financing and quality issues
Tough decisions are required on the size of the basic package and a
major reallocation of expenditure-and greater accountability for its
38 Growth Poverty and Inequality Eastern Europe and the Former Soviet Union
use-implemented to improve access to and quality of care (World
Bank 2005d) To improve matters accountability relationships between politicians and citizens need to become more effective (through such means as more organized voice power of citizens citshyizens report cards and informed voting) and the accountability
relationships between politicians and providers need to be strengthshyened (through such means as clarifying responsibility aligning incentives between policy maker as principal and provider as agent and better enforcement of contracts between organizational and front-line providers) Countries such as Armenia have shown that even with limited resources and high poverty rates improvements in key dimensions such as affordability can be made albeit on a modshyerate scale At the other end of the spectrum the EU-8 is struggling to maintain the easy access to a wide range of health services in a
context of rising costs Clearly further efficiency-enhancing mechashynisms as well as private financing wiU need to be found to control expenditures
Managing reform of utilities Service quality in many of the infrastrucshyture services is extremely poor in the low income CIS countries and even in richer countries there are large disparities between service quality for the poor and the nonpoor The infrastructure needs of the
poor are unlikely to be met without reform of the utilities sector to bring it to a financially self-sustaining basis which would encourage much-needed upkeep and maintenance of viable infrastructure and improvements in service quality Improving financial performance will involve raising tariffs which--except for power where there has been some movement toward cost recovery and possibly water in the EU-8-are well below cost recovery levels Further movement toward full cost recovery in power is expected to have a limited impact on poverty except in the poorest countries However acrossshy
the-board increases in the full range of utilities is expected to have a
more serious impact on poverty (World Bank 2005 Forthcoming b)
The social impact of tariff increases will need to be factored into the
sequencing and pace of reforms in the event of across-the-board
reforms in a range of utilities Where the social safety net is adequate
it can be expected to mitigate the impact on the poor However where
social safety nets are relatively thin as for example in the low income
CIS group other options are worthy of consideration For utilities
that can be metered lifeline tariffs can serve as a useful temporary
cushion however where lifelines are not practical (as for example
in sectors where consumption cannot be measured) reforms would
need to be calibrated to affordability
39 Overview
Enhancing Social Protection
Strengthening the social safety net Given their importance for poverty reduction and the broad improvements over time it should be clear that countries need to maintain ongoing social insurance and social assistance reforms which are largely designed to improve sustainabilshy
ity and to enhance coverage and targeting of the poor within the available resource envelope In the low income CIS group the main constraint will continue to be the fiscal means to cover the population adequately In the middle income CIS group and SEE although there is more fiscal space for social protection there is also greater resistshyance to reforms as suggested (for example) by the difficulties with the monetization of privileges in Russia While the objective of the reforms is not in question the difficulties in implementation serve as a useful reminder of the importance of sequencing with other social and economic reforms the need to protect the most vulnerable
groups and an appropriate communications strategy to explain the benefits of reforms Where systems are more generous as for examshyple in parts of SEE and the EU-8 a balance will need to be struck between the need for social protection and labor market incentives
Strengthening taqeted interventions for marginalized groups and minorities This may be in the form of assistance in cash or in-kind (such as edushycation health or housing) depending on the nature of the group For the long-term unemployed or nonparticipants active labor marshy
ket programs can be particularly relevant But evidence from successshyful training programs suggests that these should be targeted offered on a selective basis with clear links to potential employers and in collaboration with the private sector It is important to bear in mind that there is limited evidence of successful retraining programs from the low income CIS group In some cases interventions may need to be integrated across many fronts For example for the Roma minorshyity of the EU-8 and SEE governments are taking a holistic approach to ending persistent exclusion by setting goals in four areas-educashy
tion employment health and housing Other mjnorities may require
a different approach The elderly especially those who are very old or
living alone may also require special interventions such as suppleshy
mentary cash benefits or provision of assisted living services For most
marginalized groups however additional assistance whether in cash
or kind need not be provided by the public sector alone Civil society
organizations community-based groups and other organizations
could also be encouraged to come into the sector under the overall
direction of the government
40 Growth Poverty and Inequality Eastern Europe and the Former Soviet Union
Ensuring adequate minimum wages Minimum wages are an important policy instrument for enhancing the income security of the poor These can help provide a floor to income but need to be kept at a reashy
sonable level In this context the large real increases in the CIS in recent years have brought minimum wages closer to subsistence levshyels However future increases in minimum wages need to be considshyered carefully so as not to become so high that they have negative effects on growth and employment with adverse impacts on poverty
Where variations in regional income and labor market profiles are large governments may need to consider setting region-specific minshyimum wages which may help improve the employability of certain
groups of workers (such as younger workers and those in lagging regions) This is an issue particularly in the EU-8 and SEE where minimum wages represent a relatively high proportion of the average
wage and the adverse impact of common minimum wages is particushylarly noticeable For example the relatively high minimum wage is found to constrain employment opportunities for the low-skilled in countries such as Lithuania and Poland
Monitoring Progress on Poverty Reduction
Huge progress has been made in recent years in improving the qualshy
ity and accessibility of poverty data Countries need good survey data to monitor changes in poverty and to evaluate the impact of specific policy actions on the poor This report documents significant progress in collecting up-to-date high-quality data across the Region The preshyvious report on poverty (World Bank 2000a) relied on a single survey for many countries and could produce an estimate of poverty over
time for only three countries With full data sets closed to users outshyside statistical offices the report also had to rely on partial data Since then many countries have started implementing regular surveys that
periodically collect representative data on income and nonincome
dimensions of living standards In addition data are provided openly
to researchers for the purposes of study and policy evaluation These
improvements are not only confined to EU-8 countries (for example
Hungary) but also cover SEE (for example Romania) middle income
CIS countries (for example Kazakhstan) and low income CIS counshy
tries (for example Georgia and Moldova)
But many challenges remain First improvements to data quality
and availability are very recent and for many countries in the Region
reliable data on poverty changes can be obtained for only a few recent
years The efforts in collecting data need to be maintained Second
survey coverage and response rates have fallen over time in all counshy
41
I
Overview
tries and there is a need to strengthen the technical capacity of stashytistical offices to curb this trend and deal with it appropriately Third wide gaps exist in data collection on the nonincome dimensions of poverty there are practically no attempts to gauge trends in the qualshyity of health care and infrastructure services and even indicators of access are not consistently collected Given the changing nature of poverty with the increasing role of nonincome components this gap
is the most worrying Fourth not all countries have opened their data sets to researchers undermining the effective use of public funds spent on data collection and monitoring These areas-keeping up with periodic surveys to provide comparable data collecting informashytion on nonincome dimensions and opening up access to survey data-are priorities for action to ensure adequate information supshy
port for poverty reduction efforts (See overview box 3 for a discusshysion of the data used for this report)
Conclusions
The countries in the Region have made significant progress in redUCing poverty More than 40 million people moved out of poverty during 1998-2003 Much of this poverty reduction derives from the growth rebound in the CIS countries But poverty and vulnerability still remain a significant problem more than 60 million are poor and more than 150 million are vulnerable Most of the poor are the working poor Many others face deprivations in access and quality of public services
Regional inequalities both between and within countries are large The highest levels of absolute poverty are found in poor countries of Censhytral Asia and the South Caucasus but most of the Regions poor and vulnerable are in middle-income countries
Notwithstanding the tremendous heterogeneity among countries in the Region reducing poverty and vulnerability requires an accelshyeration of shared growth strengthening of public service delivery better targeting of social protection and regular monitoring of
progress in poverty reduction across the Region In promoting accelshy
erated shared growth the report emphasizes (a) further reform of
the enterprise sector to encourage the release of resources from the
old less productive sectors to the new more productive sectors (b)
further reforms to promote agriculture and rural growth by integratshy
ing rural areas into the rest of the economy with regard to labor and capital markets access to credit trade and services and (c) policies to
promote greater opportunity in lagging regions Public service delivshy
ery needs to be improved through increasing the accountability of
42 Growth Poverty and Inequality Eastern Europe and the Former Soviet Union
OVERVIEW BOX 3
Data for This Report The World Banks ECA Household Survey Archive
To arrive at the internationally comparable assessment of poverty this report uses primary unit
record data from recent household surveys to construct a comparable indicator of living stanshy
dards across all countries in the Region Income data an alternative to consumption for measshy
uring living standards remain particularly difficult to collect in transition countries In contrast
practice has shown that consumption data can be gathered with a great degree of precision
Survey consumption modules have become more detailed over time and better capture various
dimensions of consumption
In relying on consumption of goods and services by a household as the measure of living
standards a number of conceptual and practical issues needed to be addressed First unlike
food consumer durables and housing are consumed over a long time It is customary thereshy
fore to include the imputed value of the consumption flow associated with the possession
of consumer durables (including housing) but exclude the expenditure on the purchase of
these goods However for the Region data availability limits the application of this approach
to all countries This report does not therefore include estimates of flow of services of
durables nor have researchers added in durable purchases or rents Second when conshy
sumption is used as a measure of well-being higher consumption should indicate a higher
level of well-being For most consumption items this correspondence is reasonable howshy
ever for some categories such as health expenditures this correspondence is questionable
As a result health expenditures were not included as a part of consumption (Deaton and Zaishy
di 2002) Third given the significance of spatial differences the authors adjusted for spatial
price differences using the same set of information in all countries In the cases where data
government and the voice and participation of citizens This is essenshytial to improving access and quality of social services which are not
only important in their own right but also of instrumental value in helping the poor move out of poverty The report emphasizes the need to further strengthen the social safety net to meet the chalshylenges of restructuring economies Finally monitoring progress on
poverty reduction on a regular basis needs good-quality household survey data sets that are publicly available for research and analysis
Endnotes
l All monetary amounts are in us dollars ($) unless otherwise indicated 2 The new member states of the European Union are the Czech Republic
43 Owrview
were collected over a long time it was also necessary to adjust for changes in prices over
time Fourth households in the Region cope with poverty by relying on an array of nonmarshy
ket strategies including producing their own food and engaging in reciprocal exchange with
other households and institutions A consistent approach was used in assigning a monetary
value to these components of consumption Fifth to adjust for differences in household
composition researchers took the simplest approach and used the per capita scale Sixth
the procedure which conforms to methods used in other international household survey
data depositories (such as the Luxembourg Income Study see Gottschalk and Smeeding
[1997) and wwwlisprojectorg) was used to clean the data of outliers across all data sets
Following a consistent approach across all data sets gives reasonable confidence that differshy
ences across countries in the final consumption measure are due to differences in the primary
data and are not due to the method of aggregation This is the first time (to the authors knowlshy
edge) that comparable consumption aggregates have been constructed for countries in the Reshy
gion (Full details are provided in appendix A Data and Methodology)
The constructed estimate of real per capita consumption has several shortcomings that reflect
some persistent data problems in the Region First it ignores the differential impact of price inshy
creases on the poor and nonpoor No price indices for low-income groups that would allow this
issue to be addressed are routinely available in the Region Second over time there has been
considerable deterioration in response rates in many countries Countries deal with this problem
in different ways which may have (as yet unknown) implications for survey-based poverty and
inequality measures Notwithstanding these limitations consumption indicators constructed for
this report produce a reasonably reliable anchor to assess changes in poverty and distribution
during 1998-2003
Soutrss Deaton and Zaidi 2002 Gottschalk and Smeeding 1997 and wwwlisprojectorg
-- -shy
Estonia Hungary Latvia Lithuania Poland the Slovak Republic and Slovenia
3 Countries in SEE consist of Albania Bosnia and Herzegovina Bulgaria Croatia the former Yugoslav Republic (FYR) of Macedonia Romania and Serbia and Montenegro the subregion also includes a territory of Kosovo now UNMIK
4 Middle-income countries in the CIS are Belarus Kazakhstan Russia and Ukraine
5 Low-income countries in the CIS are Armenia Azerbaijan Georgia the Kyrgyz Republic Moldova Tajikistan Turkmenistan and Uzbekistan
6 The Commonwealth of Independent States includes all countries that were part of the Former Soviet Union except for the three Baltic republics Estonia Latvia and Lithuania which acceded to the European Union in May 2004
7 The analysis of poverty trends uses data from 15 countries in the Region for which comparable representative surveys are available over the entire
I
44 Growth Poverty and Inequality Eastern Europe and the Former Soviet Union
1998-2003 period or its significant part Armenia Belarus Bosnia and Herzegovina Bulgaria Estonia Georgia Kazakhstan the Kyrgyz Repubshylic Lithuania Moldova Poland Romania Russia Tajikistan and Uzbekshyistan The appendix to the study discusses country coverage in detail
8 Aggregate poverty figures include Turkey in addition to the Regions poverty headcount and thus refer to the ECA Region as defined by the World Bank
9 Many of these poverty lines have been drawn in-country from houseshyhold survey data and represent a level of consumption that would allow a typical household to meet international minimum caloric requireshyments with an additional allowance for nonfood basic needs They are a far cry from the outdated and questionable poverty lines used in many countries in the early years of the transition
10 The first 15 member states of the European Union are Austria Belgium Denmark Finland France Germany Greece Ireland Italy Luxembourg the Netherlands Portugal Spain Sweden and the United Kingdom
II For the purposes of ctiscussing poverty risks in the EU-8 countries and selected countries in SEE and the middle income CIS group we use a higher poverty line of $430 The $215 line catches a fairly small proshyportion of the population in these countries and thus may not provide robust results
12 For the reasons explained in the appendix we use consumption as an inctishycator of welfare at the household level The other often applied measure-income-tends to show much higher levels of inequality but it suffers from severe problems of underreporting in many transition economies it is unclear whether high levels of income inequality are driven by the noisy data To deal with this problem while comparing levshyels of inequality in the Region with other countries we consistently rely on consumption-based indices
13 The Gini coefficient is a standard measure of inequality it takes values between 0 (complete equality) to I (extreme inequality when all income is appropriated by the richest person) (see details in the appendix)
14 The point here is not whether relative or absolute notions of inequality are right but simply that peoples perceptions of inequality are differshyent from how economists have chosen to measure it
15 Employment rates among women do not compare unfavorably with those of men except in a few countries such as Bosnia and Herzegovina and Tajikistan
16 Targets agreed to at the Lisbon Summit in March 2000 where heads of state and governments of the European Union decided that the EU should adopt the strategic goals for the next decade of becoming the most competitive and dynamic knowledge-based economy [with) greater social cohesion The 70 percent employment rate for the workshying-age population is one of such targets
17 Georgia (not depicted here) is another country where the incomes of the poor have declined in real terms
18 Thus trends in wage inequality are mixed with inequality falling in some countries and rising in others
19 The MDGs represent an international effort to promote poverty reducshytion and human development by establishing measurable yardsticks for
45 Overview
eight goals to be achieved by 2015 To achieve the child and maternal mortality MDGs countries would have to reduce child mortality by twoshythirds and maternal mortality by three-quarters by 2015 The 1990 benchmark against which progress is assessed is often not suitable for the Regions countries because many social indicators reached their nadir in the mid-1990s or later The projections made by the World Bank are
I
based on recent trends in the indicators (see World Bank 2005c for furshyther details)
II 20 In technical terms the elasticity of poverty reduction to growth has Ii proved to be high for the most part
21 Portugal has the lowest poverty line around PPP $750 per capita per day
Bibliography
Chen Shaohua and Martin Ravallion 2001 How Did the Worlds Poorest Fare in the 1990s Review of Income and Wealth 47 (3 September) 283-300
I Chernetsky Taras Forthcoming Magnitudes and Distribution of Remitshytances in Eastern Europe Evidence from Household Surveys Data and Balance of Payment Statistics Photocopy World Bank Washington DC
Deaton A and S Zaidi 2002 Guidelines for Constructing Consumption Aggregates for Welfare Analysis LSMS Working Paper 135 World Bank Washington DC
Dennis Ian and Anne-Catherine Guio 2004 Poverty and Social Exclusion in the EU Statistics In Focus Population and Social Conditions 162004 Luxembourg European Commission Office for Official Publications of the European Communities
Gottschalk Peter and Timothy M Smeeding 1997 Cross-National Comshyparisons of Earnings and Income Inequality Journal of Economic Literature 35 (June) 633-87
Kakwani N and Z Sajaia 2004 Internationally Comparable Poverty Lines for CIS Countries Photocopy Poverty Reduction and Economic Management Unit ECA Region World Bank Washington DC and DFlD United Kingdom
Lehmann Hartmut and Jonathan Wadsworth 2001 Wage Arrears and the Distribution of Earnings in Russia William Davidson Institute Working Paper 421 University of Michigan Stephen M Ross Business School Ann Arbor
OECD 2003 Summary Results of ECP 2000 A Note by the OECD Secreshytariat Working Paper 6 Statistical Commission and Economic Commisshysion for Europe Conference of European Statisticians Joint Consultation on the European Comparison Programme Geneva March 31-April 2 2003
van de Walle Dominique 2002 The Static and Dynamic Incidence of Vietshynams Public Safety Net Policy Research Working Paper 2791 World Bank Washington DC
46 Growth Poverty and Inequality Eastern Europe and the Former Soviet Union
World Bank 1990 World Development Report 1990 New York Oxford Univershysity Press
- -- 2000a Making Transition Work for Everyone Poverty and Inequality in Europe and Central Asia Washington DC World Bank
--- 2000b Republic of Latvia The Poverty Assessment 2 vols Washington DC World Bank
--- 2001 a Hungary Long-Term Poverty Social Protection and the Labor Marshyket 2 vols Washington DC World Bank
--- 2001b Poland Labor Market Study The Challenge of Job Creation Washshyington DC World Bank
--- 2001e Slovak Republic Living Standards Employment and Labor Market Study Washington DC World Bank
--- 2001d World Development Report 200012001 Attacking Poverty Washshyington DC World Bank
--- 2002a Armenia Poverty Update Washington DC World Bank
--- 2002b Bulgaria Poverty Assessment Washington DC World Bank
~ 2002e Georgia Poverty Update Washington DC World Bank
--- 2002d Labor Market in Postwar Bosnia and Herzegovina How to Encourshyage Businesses to Create Jobs and Increase Worker Mobility Washington DC World Bank
--- 2002e Republic of Tajikistan Poverty Assessment Washington DC World Bank
--- 2002f Russian Labor Market Moving from Crisis to Recovery Europe and Central Asia Region Human Development Sector Unit Washington DC World Bank
--- 2002g Slovak Republic Poverty and Welfare ofRoma in the Slovak Repubshylic Bratislava The World Bank Foundation SPACE Ineko and The Open Society Institute
---- 2002h Transition The First Ten Years Analysis and Lessons for Eastern Europe and the Former Soviet Union Washington DC World Bank
--- 2002i Turkmenistan A Profile of Living Standards in Turkmenistan Washington DC World Bank
--- 2003a Albania Poverty Assessment Washington DC World Bank
--- 2003b Armenia Poverty Assessment Washington DC World Bank
--- 2003e Azerbaijan Republic Poverty Assessment 2 vols Washington DC World Bank
--- 2003d Bosnia and Herzegovina Poverty Assessment 2 vols Washington DC World Bank
--- 2003e FYR Macedonia Country Economic Memorandum Tackling Unemshyployment Washington DC World Bank
--- 2003f Guatemala Poverty in Guatemala Washington DC World Bank
--- 2003g Inequality in Latin America and the Caribbean Breaking with the Past Washington DC World Bank
)
47
I
Overview
--- 2003h Kosovo Labor Market Study Policy Challenges ofFormal and Inforshymal Employment Washington DC World Bank
--- 2003i Kyrgyz Republic Enhancing Pro-Poor Growth Washington DC World Bank
---- 2003j hReview of Parent-Community Participation in Schools in ECAH Background Paper for Social Development in Europe and Central Asia Region Issues and Directions ECA Socially and Sustainable Development Department Washington DC World Bank
--- 2003k Romania Poverty Assessment 2 vols Washington DC World Bank
--- 2003l Serbia and Montenegro Poverty Assessment 2 vols Washington I
DC World Bank
--- 2003m Tracking Nonincome Dimensions ofPoverty in ECA Poverty Reducshytion and Economic Management Unit and Human Development Sector Unit Europe and Central Asia Region Washington DC World Bank
--- 2003n Uzbekistan Living Standards Assessment Washington DC World Bank
--- 2004a Azerbaijan Municipal Services Study Photocopy ECSIE World Bank Washington DC
- -- 2004b Belarus Poverty Assessment 2 vols Decision Draft Washington DC World Bank
--- 2004c Bosnia and Herzegovina Country Economic Memorandum Washshyington DC World Bank
--- 2004d The Governance ofService Delivery in ECA A Regional Study ECA Vice Presidency Washington DC World Bank
--- 2004e Kazakhstan Living Standards Assessment in Kazakhstan 2 vols Washington DC World Bank
--- 2004f Latvia Poverty Assessment Decision Draft Washington DC World Bank
--- 2004g Latvia The Quest for Jobs and Growth A World Bank Country Ecoshynomic Memorandum Washington DC World Bank
--- 2004h Poland Growth Employment and Living Standards in Pre-Accesshysion Poland Washington DC World Bank
--- 2004i Recession Recovery and Poverty in Moldova Report 2B024-MD World Bank Washington DC
--- 2004j World Development Report 2005 Washington DC World Bank
--- 2005a Dynamics of Vertical Coordination in Agri-Food Supply Chains in ECA Washington DC World Bank
--- 2005b Global Economic Prospects 2005 Trade Regionalism and Developshyment Washington DC World Bank
--- 2005c MDGs in Europe and Central Asia Performance and Prospects Washington DC World Bank
- -- 2005d Operationalizing MDGs How Effective Is the Long Route A Case Study ofGeorgia Washington DC World Bank
48 Growth Poverty and Inequality Eastern Europe and the Former Soviet Union
--- 2005e Poverty and Social Exclusion of the Roma in Serbia and Montenegro Photocopy World Bank Washington DC
--- 2005f Pro-Poor Growth in the 1990s Lessons and Insights from 14 Countries Washington DC World Bank
--- 2005g Russian Federation Reducing Poverty through Growth and Social Policy Reform Washington DC World Bank
~ 2005h Serbia The Social Safety Net and the Poor Photocopy World Bank Washington DC
--- 2005i World Development Indicators Washington DC World Bank
--- 2005j World Development Report 2006 Equity and Development Washshyington DC World Bank
~--- Forthcoming-a Enhancing Job Opportunities in Transition Countries Eastern Europe and the Former Soviet Union Washington DC World Bank
--- Forthcoming-b Foundations for Sustainable Infrastructure in Europe and Central Asia Tariffs Safety Nets RegUlation Commercialization Washington DC World Bank
-~~- Forthcoming-c From Disintegration to Reintegration Eastern Europe and the Former Soviet Union in International Trade Washington DC World Bank
--- Forthcoming-d Doing Business 2006 Washington DC World Bank
Growth Poverty and Inequality Eastern Europe and the Former Soviet Union
While the countries of Eastern Europe and the Former Soviet Union have made significant progress in reducing poverty in the past five years poverty and vulnerability remain significant problems This book examines these important issues and provides recommendations for policy makers
D16193 US$28
016195 US$28
016197 US$28
Infrastructure n Eastern Europe and the Former Sovet Unon Tadffs Safety Nets Regulaton and CommerciaUzaton
0-8213-6191-0 016191
bull Geoiraphic discounts applymiddot up to 75 in some countries Please see enclosed information or visit http- publications worldbankorg discounts
middotmiddotShipping and Handling charges within the US are USSBOO per arder If a purchase order is used actual shipping will be charged Outside of the US customers have the option to choose between nonmiddot tradable airmail delivery (USS700 per order plus USS600 per item) and trackable couriered airmail delivery (USS1650 per order plus USSB per item)
PAYMENT METHOD
US$28
Shipping
Subtotal
Total usS
Orders from individuals must be accompanied by payment or credit card information Credit cards accepted only for orders addressed to the World Bank Check wih your local distributor about acceptable credit cards Please do not send cash
(Please print)
Name ____________________ ----______________ Charge my DAmerican Express D Mastercard D Visa
nVe ________________- ___________ Card no __~_____________________________
Organization _ _ _________________ Expiration date __- 1__ Name ____________________________________ __Address ____________________________
(as it appears on the card)
Signature-~-o___c__---__-___-----------shyCity ________~_______ (required for all credit card charges)
State _____ ZipPostal Code _______ o Check no in the amount of $___ is enclosed When ordering direcVy from the World Country _______________________________ Bank make check payable in US funds only drawn
Phone ______________ _____ on a US bank to The World Bank Please send your check with your order
Fax ______________________________________ __ Institutional customers in the US only
E-mail ______________________ _ _ D Bill me Please include purchase order
bullbullbullmlsectb World Bank Publications
wwwworldbankorgpublications By mail PO Box 960 Herndon VA 20172-0960 USA
By phone +1-703-661-1580 or 800-645-7247middot By fax +1-703-661-1501 SOURCE CODE Questions E-mail us at booksworldbankorg OECA05
WORLD BANK I Publications The refelence of chOIce 011 development
I
This report is part of a series undertaken by the Europe and Central Asia Region of
the World Bank The series draws on original data the World Banks operational
experience and the extensive literature on the Region Poverty jobs trade migration
and infrastructure will be among the topics covered
Overview
This study examines the impact of growth on poverty and inequalshyity in Eastern Europe and the Former Soviet Union during 1998-2003 It updates the World Banks previous study on poverty entitled Making Transition Work for Everyone which appeared in 2000 It asks three questions What are the recent trends in poverty and inequality Why do we see different outcomes across counshytries And how can public policy help maximize the impact of growth on poverty reduction
To measure poverty an absolute poverty line of $2 a dayl is used
comparing it with household consumption per capita This tine is a closer approximation to basic material needs in the Region than the well-known global standard of $1 a day because of the additional expenditures on heating and warm clothing that are required by the
cold climate Using an absolute-as opposed to a relative-poverty
line allows us to focus on those who are deprived of the most basic needs rather than those who may be deprived relative to their bettershy
off fellow citizens It also allows us to determine trends over time and
make comparisons across countries both of which would be difficult if we were using a relative notion of poverty In addition to the $2-a-day poverty line a $4-a-day line is used to capture the notion of ecoshy
nomic vulnerability that is to measure the proportion of the populashy
2 Growth Poverty and Inequality Eastern Europe and the Former Soviet Union
tion that is not absolutely poor but could become poor in the event of
an economic downturn In terms of poverty levels the Region is best thought of in four disshy
tinct subgroups of countries The eight new member states of the European Union (EU-8) have low poverty (less than 5 percent) conshy
fined to specific subgroups of the population2 Countries in Southeastshyern Europe (SEE) have generally moderate levels of poverty (around
5-20 percent) 3 The same is true of the middle-income countries in the Commonwealth of Independent States (CIS)4 The low-income counshytries in the CIS however have extremely high levels of poverty (more than 40 percent)5 In addition to countries in these four subgroups
The Europe and Central Asia Region of the World Bank (ECA) also includes Turkey Wherever possible we treat Turkey as a benchmark against which to evaluate the performance of postsocialist countries in the Region Turkey has moderate poverty We also include two counshy
tries from outside the Region as benchmarks Colombia (a middleshyincome country) and Vietnam (a low-income country)
Summary
The resurgence of growth in the eastern half of the Region particularly in the CIS resulted in a significant decline in poverty in the Region durshying 1998-2003 (figure I )6 more than 40 million people have moved
out of poverty during this period Where roughly 20 percent of the population (or one in five people) was living in poverty today poverty affects only 12 percent (or one in eight people) While much of this poverty reduction has occurred in the populous middle-income counshytries in the Region (Kazakhstan the Russian Federation and Ukraine) poverty has fallen almost everywhere During 1998-2003 poverty fell in most countries of the Region except for Poland and Lithuania in the EU-8 and Georgia in the low income CIS group7 However in the conshy
text of the EU-8 the low overall levels of poverty need to be borne in
mind Income (consumption) inequality showed no clear trend in the
EU-8 and SEE however inequality declined in the CIS with the
notable exceptions of Georgia and Tajikistan
At the same time that 40 million people have moved out of poverty
in ECA as a whole more than 60 million people remain poor and
more than 150 million people are economically vulnerable 8 Progress on the nonincome dimensions of poverty-such as access to educashytion health care safe water and heating-is very mixed with
improvements in some cases and deterioration in others In educashy
tion although access has improved no subregion is free from counshy
tries experiencing declining standards In health no subregion is free
I
3 Overview
from the growing epidemic of human immunodeficiency virus (HIV) and acquired immune deficiency syndrome (AIDS) Quite apart from HIV AIDS and other communicable diseases attaining the health Millennium Development Goals (MDGs) will prove difficult for many
countries in the CIS and SEE because of the failure of health services
to deliver adequate and timely services Access to key infrastructure services-in particular lighting and heating-is actually deteriorating
in some countries of the low income CIS group
The single most important factor behind the significant decline in
poverty in the period in question is high growth in the CIS where the
bulk of the poor reside Combined with moderate levels of inequality
economic growth has delivered significant poverty reduction To some
extent this rebound in growth rates in the CIS is unsurprising
although at the height of the financial crisis in Russia and neighboring
contagion-which came at the end of a decade of difficult transitionshyit was hard to see the prospects for resumption in growth A further
factor influencing poverty reduction since 1999 is the reduction in
consumption inequality in some countries of the CIS which too can
be viewed as a rebound from the levels observed in the 1990s
Because the substantial reduction in poverty is the result of a unique constellation of factors-rapid catch-up growth in the CIS
accompanied by reductions in inequality in some countries-prospects
for poverty reduction going forward are less propitious Very few counshy
tries even those that have made the most progress in reducing poverty have been successful in creating jobs to fully replace those
that have been destroyed To some extent reduction in overall
employment was only to be expected given the socialist legacy of high employment-to-population ratios However the failure to generate a
sufficient number of jobs means that employment-to-population ratios have been falling except in a few of the rapidly growing counshy
tries of the CIS In the EU-8 and SEE the employment ratio is well below what is found in Organisation for Economic Co-operation and
Development (OECD) countries If it persists this failure to expand employment will fundamentally limit the poverty reduction impact of
growth and act as a brake on further reduction of absolute poverty
This is an issue even in countries where poverty is relatively low (for
example Poland where rising poverty is related to the growing divide
between those with and without employment)
In addition to concerns on the jobs front there is a marked regional
and spatial dimension to both the income and nonincome dimenshy
sions of poverty in the Region The most rapid declines in poverty
have been observed in capital cities as opposed to secondary cities
and rural areas In parts of the CIS poverty rates are just as high in
FIGURE 1 More than 40 Million People Moved out of Poverty during 1998-2003 Distribution of Population by Poverty Status
100
90
80
70
=60CI ~
-= 50 CI 040
30
20
10
1998--9 2002-3
_ Nonpoor above $430 a day
c=J Vulnerable above $215 and below $430 a day
_ Poor
below $215 a day
Source World Bank staff estimates using ECA Household Surveys Archive
Note In million persons and in permiddot cent to populationPoverty lines conmiddot verted to local currencies using 2000 PPP Data refer to ECA Region as deshyfined by the World Bank and Turkey is inclUded in the aggregate figures
4 Growth Poverty and Inequality Eastern Europe and the Former Soviet Union
secondary cities as in rural areas Throughout the Region the quality of public services is also poorer outside of capital cities and trends are mixed with some differences between capital and noncapital areas getting smaller and others larger
Overall there is a substantial agenda of reforms if countries wish to reduce poverty in all its dimensions over the coming years While specific actions will vary from country to country all countries need to focus on poliCies that will accelerate rates of growth and ensure that benefits are widely shared among the population In addition efficiency and equity concerns warrant strengthening delivery of edushycation health and public utilities services and enhancing social proshy
tection It is also essential to monitor progress on poverty reduction Poverty and poverty reduction have a special significance in the
Region that is different from that in other parts of the world First as mentioned previously the cold climate means that the notion of
basic needs has to be expanded to take into account the need for warmth Only a small fraction of the population in the developing world would require a similar expansion of the basic needs set Secshyond many countries in the Region completed the demographic and epidemiological transition a few decades ago This graying of the popshyulation poses significant challenges for public policy particularly where there are trade-offs involved in relation to the working (or the young) versus the elderly There is also a greater burden of noncomshymunicable diseases with implications for costs and access to health care Again there are few countries at equivalent levels of income that face a similar challenge Finally the legacy of the former socialist systems of production means that huge inefficiencies exist in the way production is organized how infrastructure is deployed and where people are located Breaking with the past represents not only an opportunity but also a challenge
Trends in Poverty in the Region 1998-2003
Since 1998 absolute poverty at $2 a day (or more accurately $215
a day) has declined in most countries in the Region (figure 2) Two
countries Georgia and Poland bucked the trend of declining poverty
and in another one Lithuania poverty was largely unchanged These trends which are based on comparable consumption aggreshy
gates specially constructed for the purposes of this report reflect the
use of the latest purchasing power parity (PPP) exchange rates (2000
PPP) available for the countries of the Region The use of different PPP revisions affects the ranking of a few countries in the Region
5 Overview
especially those that experienced hyperinflation or continue to pracshytice administrative price setting but leaves the overall extent of poverty and trends unchanged (see overview box l)
As it did five years ago absolute deprivation varies enormously
across the Region At one end of the spectrum are countries in the
low income ClS group such as Tajikistan where the proportion of the population living on less than $2 l5 per day is more than 70 percent
while at the other end are countries in the EU-8 such as Hungary
where absolute poverty by this definition is virtually absent Counshy
tries fall into three broad groups those with high poverty (all low
income CIS countries) those with low poverty (typically EU-8) and those in between with moderate poverty (typically SEE and middle
income CIS countries) These groupings are not hard and fast with
some countries in SEE (for example Bulgaria) and the middle income
CIS group (for example Belarus) having low levels of poverty
Even where incomes have grown and absolute material deprivashytion at $2l5 per day is low the standard of living is not high and
FIGURE 2 At the Country Level Absolute Poverty Has Declined Almost Everywhere Poverty Rates by Country
100
90
80
70
60 c 2 laquoi 50 -=co e co 40 0 of 30
20
10
0 I OOIN 0018 OOIN ~IM _1 M ID 0 m mom 0 0 0 ID 0 mom 0 moo 0 ~ N ~ N - N - N N N
Hungary Lithuania Poland Romania Bulgaria
EU-8 SEE
~IN ~IN -tMoolN _1 M m g ~ g 3 8 ~ g g co- g m 8g- N _ N N N _ N ~ N
Belarus Russian Kazakhmiddot Georgia Uzbeki -Fed stan stan
Middle income CIS Low income CIS
Below $215 aday bull Above $215 but below $430
~IM ~I 01 ~I~ g g 3 - N ~ N N N - N
Moldova Armenia Kyrgyz trajikistan Rep
bull
Source World Bank staff estimates using EGA Household Surveys Archive
Note2000 PPP
6 Growth Poverty and Inequality Eastern Europe and the Former Soviet Union
OVERVIEW BOX 1
Using Purchasing Power Parity to Measure Poverty
An absolute poverty line as the name implies attempts to establish the value of consumption
that a person needs to stay out of poverty regardless of time and place The first widely acshy
cepted global poverty estimates produced by the World Banks World Development Report in
1990 chose a poverty line measured in 1985 PPP Chen and Ravallion (2001) have since updatshy
ed these numbers using 1993 PPP exchange rates for consumption The PPPs were again upshy
dated for the Region in 1996 and this updated set was used by Making Transition Work for
Everyone (World Bank 2000a)
This report uses the most recent PPP numbers from 2000 (OECD 2003) More recent data on
PPP are more relevant for the transition economies of the Region because they reflect contemshy
porary (in many cases liberalized) prices as opposed to the administered prices of the past For
Turkey a country without the legacy of an administratively directed economy all PPP revisions
produce approximately the same poverty counts (see figure) The economies of all formerly soshy
cialist countries exhibit significant changes with more recent numbers being more plausible
For example it is highly implausible that poverty in Uzbekistan is negligible (which is the imshy
pression that one gets using 1993 and 1996 PPPs and could be traced to widespread price conshy
trols in that country practiced during the 19905) Errors can also go the other way (that is overshy
state poverty) as appears to be the case when the 1993 PPP is used for Georgia In addition to
issues with relative prices Georgia experienced hyperinflations around 1993 which would have
made measurement of prices problematic It would be incorrect to say that the 2000 PPP revishy
sion solves all comparability problems Where interferences in market mechanisms continue
price surveys that form the basis for PPPs will deliver incorrect results (a factor that can be partshy
ly responsible for the low poverty headcount for Belarus)
large shares of the population are found to consume between $2 15 and $430 per capita per day This group while not absolutely deprived is likely to have relatively low savings and is vulnerable to
poverty in the event of shocks that affect earning potential Of course an absolute poverty line of $215 a day (or some mulshy
tiple) is one of many potential lines that could be drawn Often what is relevant from the perspective of the poor is the level of
resources that may be needed in the country context to be free from h unger cold and other forms of deprivation In this report the authors have chosen to use an absolute concept of deprivation not only to focus more on those who are deprived in some fundamenshytal sense but also to facilitate comparisons across countries and over time The basic needs without which individuals would be
7 Overview
Poverty Rates at $215 a Day with Different PPPs Countries Sorted by Poverty Based on 2000 PPPs
-- 1993 PPP -- 1996 PPP -- 2000 PPP
Soumis Staff estimates DECO 2003
The total poverty headcount for the Region does not change much whether one uses the 1993
PPP or the 2000 PPp although individual country assessments are affected However the 1996
PPP (with few exceptions Bulgaria Estonia and Lithuania) produces a lower poverty count than
the 2000 PPP does It is important to note that only the ongoing global International Comparison
Program (wwwworldbankorgldataicpl expected to produce results by 2007 will address fundashy
mental problems of all existing sets of PPP in their application to poverty comparisons Internashy
tionally comparable poverty data produced for this study need to be interpreted with due caution
Sounes World Bank staff World Bank 2000a Chen and Ravallion 2001 Kakwani and Sajaia 2004 DECO 2003
absolutely deprived are typically reflected in national poverty lines9
As might be expected standards of income required to ensure against material deprivation in richer countries are higher so
national poverty lines are positively related to income levels
National poverty lines in the Region suggest that a poverty line
around $2 per capita per day might indeed be a relevant absolute
floor (figure 3) When compared with national poverty lines from a
random selection of non-Region countries the Regions poverty
lines are found to be higher on average perhaps reflecting the
higher cost of basic needs due to the extremely cold climate in cershy
tain countries However high though they may seem even the
highest national poverty lines in the Region are substantially lower
than poverty lines of two of the poorest EU-15 countries 10 Greece
8 Growth Poverty and lnequality Eastern Europe and the Former Soviet Union
FIGURE 3
The Lowest National Poverty Line in the Region Is around Two Dollars a Day
9$
bull Greece 8$
c bull PortugalCgt
~ 7$
~
~ 6$
Cgt
~ 5$
~ ~ 4$ ~ Cgt Cgt 3$
ii c Cgt ~ 2$ z
1$ - --- --- - -~- ---- - --- -------- --- - --- --------- shy
Hungary
bullBulgariabull
Nigeria Burkina Faso
O$L---------------~~---------------
1$ 10$ 100$
Level of consumption per capita per dayperson log
bull NonmiddotEGA countries bull EGA countries
Sources Region World Bank staff estimates nonmiddotRegion Kakwani and Sajaia 2004 and DEGD 2003 EUDennis and Guio 2004
Note latest years of available data used all values expressed in 2000 PPP $
and Portugal Using measures of absolute deprivation that are more consistent with national poverty lines but still modest (such as $430 per capita per day) it is evident tbat absolute deprivation continues to exist even in relatively well-off countries such as EU-membershystate Hungary (figure 2)
How has poverty risk evolved in the past five years Looking below the national averages on population subgroups four characteristics
stand out for raising poverty risk (that is poverty incidence) above
average being young living in a rural area or (in some cases) a secshyondary city being unemployed and having low levels of education I I
Although not equally important in all subregions these were the
same groups identified as having a higher-than-average poverty incishy
dence five years ago (World Bank 2000a)
Outside the low income CIS countries children face a substantially
higher risk of poverty than other population groups do Relative
poverty risk for children has actually increased in the past five years
because poverty incidence has fallen less rapidly among families with
children than for other groups (figure 4a)
9 Overview
Residents of rural areas face a higher risk of poverty than those in
cities do (figure 4b) Among the rural dwellers children usually face
the highest poverty risk often multiple times the national average
But in some countries of the CIS poverty risks are as high in secondshy
ary cities as in rural areas Indeed lumping capital cities together with
other urban areas can be misleading because of the contrast between
their positions Over the past five years with few exceptions poverty
has declined far more rapidly in capital cities than elsewhere As a
result residents of rural areas and secondary cities face a far greater
risk of poverty relative to capital city dwellers than previously
Outside the low income CIS countries the unemployed face sigshy
nificantly higher risks of poverty than the employed do (figure 4c)
With the resumption of sustained growth in the CIS and an improveshy
ment in the position of the employed the relative risk of poverty
faced by the unemployed has increased significantly
The risk of poverty falls with educational attainment As shown in
the report over time the risk of poverty of those with basic education
FIGURE 4a Children Face a Greater Risk of Poverty than Other Population Groups in Most Cases This Risk Has Increased over Time
25
-II () c-O c
~
2 I
~
15 ~ ~ middotu E K -6 ~ E ~ A-A t a ~ gt 1 - - shy ~ t2t e4 Q - ~ ~
~ - ~ =
()
c
05 +---+ ~ ~
Hungary Poland Romania Bulgaria Russian Kazakh - Moldova Georgia Armenia Kyrgyz Rep Tajiki-Fed stan stan
EU-8 SEE Middle income CIS Low Income CIS
--- lt6years -e- 7- 14 years -6- 15-17 years - between 18 and 65 years -+- ~ 66 years
SourceWorld Bank staff estimates using ECA Household Surveys Archive
Note 2000 PPP Poverty line for the EU-8 and Bulgaria is $430 per day Risk of 1 indicates that an age group is no more or less likely than the average to fall into poverty
10 Growth Poverty and Inequality Eastern Europe and the Former Soviet Union
FIGURE 4b Poverty Reduction in Secondary Cities and Rural Areas Has Lagged behind Capital Cities
Poland
Hungary
Lithuania
Romania (I)
Macedonia FYR
(I) Russian Fed c
g~ - QlEu
Kazakhstan
Moldova
Georgia
(I)
c Kyrgyz Rep E Q
U
Armenia ~
Tajikistan
Uzbekistan
- 0 + 100
Change in poverty
bull 2003 capital cities bull 2003 secondary cities bull 2003 rural areas
o Change in poverty D Change in poverty bull Change in poverty capitalcities secondary cities rural areas
SourceWorld Bank staff estimates using ECA Household Surveys Archive
Note2002 data used instead of 2003 in Russia Poland and HungaryThe benchmark year to measure change is 1998 exshycept in Kazakhstan where it is 2001 Kyrgyz Republic and Uzbekistan 120001 and Tajikistan 11999) Poverty line for the EUshy8and FYR Macedonia is $430 per day everywhere else it is $215 per day in 2000 PPP
50
Percent of population defined as poor
11 Overview
or less rdative to other groups has increased reflecting their handishycap in benefiting from new economic opportunities
Ethnicity is also associated with higher-than-average poverty incishydence in some cases Data on ethnicity are sometimes not covered in surveys and even where they are sample size may preclude any
robust conclusions While the data do not allow trends to be inferred relatively strong evidence exists that in more than one country groups such as the Roma of Central and Eastern Europe (CEE) face a substantially higher incidence of poverty than the general population does (World Bank 200lc World Bank 2002g and World Bank 2005e) Available evidence on other minorities is mixed with some faring worse than average such as the Turkish minority in Bulgaria or the Russian minority in Latvia while others do better such as the Russian minority in the Kyrgyz Republic or the Hungarian minority in Romania (World Bank 2003i World Bank 2003k World Bank 2004g) The relative position of minorities is a function of human
capital and other endowments relative to the population as a whole and of their position in relations of power which may vary from
group to group Within countries poverty incidence shows marked variation and
there is evidence that regional differences are growing over time in some countries (figure 4d) This is because poverty rates have typishycally declined more sharply in capital cities and other prosperous areas of trade and tourism than in rural areas or secondary towns In a related vein many countries outside the low income CIS group (where information is more limited) show high and highly persistent differences in unemployment rates across regions
Composition ofthe poor Most of the poor in the Region comprise workshying adults and children who between them account for 60-75 pershycent of the poor (figure 5) In most instances poor children are children of working parents This structure of poverty with the preshydominance of working families (that is households with working adults) is no different from that of the past although the share of working families has declined The next largest group comprises those
out of the labor force followed by the unemployed and the elderly
With regard to location urban and rural residents are evenly split
each constituting around 50 percent of the poor in the Region as a
whole This split is influenced by an interaction of higher-than-avershy
age poverty risk for rural residents and their relatively low share in
the population In relation to subregions rural residents form the
bulk of the poor in the low income CIS group (70 percent of the poor) SEE (62 percent) and the EU-8 (5l percent) The only subregion that
12 Growth Poverty and Inequality Eastern Europe and the Former Soviet Union
FIGURE 4c The Unemployed Face Higher Risks of Poverty than the Employed This Risk Has Grown over Time in the CIS
350
300 gt)(0 Q ~ 250
e -
shy~ ~ 200
~~ Q 150 e gt amp I 100
050 Poland Romania
EU-8 SEE
Belarus Russian Kazakh-Fed stan
Middle income CIS
Moldova Georgia Tajikistan
Low income CIS
bull 1998 poverty of unemployedpoverty of employed
2002 poverty of unemployedpoverty of employed
SourceWorld Bank staff estimates using ECA Household Surveys Archive
Note For Kazakhstan 2001 is used instead of 1998 and 2003 instead of 2002 for Tajikistan 1999 instead of 1998 and 2003 instead of 2002 For Romania and Moldova 2003 is used instead of 2002 For the EU-8 and Belarus the poverty line is $430 everywhere else it is $215 aday in 2000 PPP
FIGURE 4d There Are Marked and in Some Cases Increasing Differences in Poverty across Regions
30 bull
25
o 20
~ 15gt o 0
fti2 10 ftj Z bull
5 bull
Source World Bank staff estimates using ECA Household Surveys Archive
Note The box depicts the spread in regional poverty rates Iboxes plot upper and lower boundaries called interquartile range of the interval where most of the regional poverty rates would fall and the whiskers the extremes) Dots represent outlying regions in a statistical sense
- - - -
13 Overview
is dominated by urban poor is the middle income CIS group (only 41
percent rural poor)
Trends in poverty depth At the end of the 1990s the general undershy
standing was that poverty in the Region while widespread was relashy
tively shallow The pattern five years later appears more varied with
the Regions countries now spanning a wide range (figure 6) Using
Turkey Vietnam and Colombia as the benchmarks shows that poverty in the low income CIS group is fairly deep but in the middle income
CIS countries and SEE it is fairly shallow In the EU-8 the picture (relshy
ative to a $430 poverty line) is mixed with examples of both shallow
and deep poverty
Trends in inequality While there is no clear trend in the EU-8 and SEE
consumption inequality in the CIS declined (with few exceptions)
between 1998 and 2003 (figure 7)12 By 2003 consumption inequalshy
ity in the Region as a whole looked broadly comparable to that in
OECD countries and East Asia While inequality in consumption does
not appear egregiously high subjective data suggest that people in
the Region continue to find inequality to be excessive This may be
FIGURE 5 Working Adults and Children Continue to Form the Bulk of the Poor in the Region
100 r- r- r- r- r- r-
c 752 = E co 50 ~ co c ltf 25
1998 2002 1999 2003 1999 2002 1999 2003 1999 2003
Poland Romania
EU-8 SEE
Russian Fed
Middle income CIS
Moldova Tajikistan
Low income CIS
aChildrenllt16 years) 8Working (employed+self-employed) 8 Unemployed ~Inactive cElderly (66 years)
SourceWorld Bank staff estimates using ECA Household Surveys Archive
Noll For the EU-8 and Bulgaria the poverty line is $430
14 Growth Poverty and Inequality Eastern Europe and the Former Soviet Union
FIGURE 6 In Some Countries Poverty Is Shallow in Others Deep Deficit in Consumption of an Average Poor Person as Percentage of Poverty Line
Hungary
PolandI I w Lithuania
Estonia
Serbia amp Montenegro w w CI) Albania
Romania Russian Fed
2~~ E5 ~ Kazakhstan
Armenia
CI) Moldova
~ UzbekistanE
CI ltgt 5 Kyrgyz Rep ~ CI Georgia
Tajikistan
IIgt Vietnam E
c Colombia ltgt c III Turkey
-5 -15 -25 -35 -45
Depth in to poverty line
SOUfce World Bank staff estimates using ECA Household Surveys Archive
Note For the EU-B the poverty line is $430 everywhere else it is $215 per day per capita in 2000 PPPlatest year of availshyable data used
related in part to the fact that despite recent faIls in the CIS inequalshyity remains significantly higher than at the outset of the transition
The decline in inequality in most of the CIS (with the notable
exceptions of Georgia and Tajikistan) also runs counter to widely held
perceptions that the bounce-back in growth has gone hand in hand with widening income differentials There are at least three reasons
why subjective and objective measures may suggest different trends
First changing relative positions of different population subgroups
may leave overall inequality unchanged but may lead to the impresshy
sion of growing inequality For example the rise in the position of
capital city dwellers relative to residents of secondary cities may leave overall inequality unchanged (as for example would be the case if
the two groups simply switched positions in the income distribution) but may contribute to the perception of a growing divide
15 Overview
FIGURE 7 While Changes in Distribution Have Gone Either Way in the EU-8 and SEE They Have Moved in Favor of the Poor in the CIS (Georgia and Tajikistan Excepted)
Estonia
exgt Hungary
Lithuania
Poland
Albania
Bulgaria en Romania
Serbia amp Montenegro
en Belarus C3 E Kazakhstan 0 Ru ssian Fed i Ukraine
Armenia en C3 Georgia E 0 Kyrgyz Rep ~ 0 Moldova
Tajikistan
Colombia ~
E c Turkey c
CICI Vietnam
0100 0200 0300 OAOO 0500
Gini Index
1998 2003
Source World Bank staff estimates using ECA Household Surveys Archive
Note Gini index for per capita consumption
Second measures of inequality typically employed in the literashyture (including in this report) are measures of relative inequality however subjective perceptions often relate to absolute differences in income not relative ones For example if everyones income increases by 10 percent measures of inequality (such as the Gini
16 Growth Poverty and Inequality Eastern Europe and the Former Soviet Union
coefficient employed in this report) would show no change in the distribution of income 13 However the absolute difference in the incomes of the rich and the poor would have increased (for example 10 percent growth means a larger absolute increase in income for
the rich than for the poor) contributing to a perception of growing inequality14
Third sampling and nonsampling errors mean that survey data may do a poor job of measuring income growth at the top of the disshytribution and thus may end up underestimating upward drift in inequality This is a worldwide problem however if there is confishydence in the quality of the data at the lower end of the distribution
one can be reasonably confident of trends in poverty and inequality in the vicinity of the poverty line In the Region because of data
improvements in all but a handful of countries the measured trends in poverty and inequality are robust
Factors Contributing to Poverty Reduction 1998-2003
Growth in output and wages Since 1999 the growth of the gross domesshytic product (GDP) in the Region has been impressive (higher than the world average) with the CIS the most rapidly growing subregion For the CIS the recovery of growth in Russia has been an important facshy
tor The devaluation that accompanied the financial crisis in Russia was important for restoring the exchange rate to a more competitive level and spurring the recovery of exports and growth Combined with high prices for oil and other natural resources this gave a huge boost to the Russian economy which has in turn become a regional locomotive for many neighboring countries Structural reforms that had been undertaken by many of the CIS countries enabled an improved supply response when the opportunity presented itself For
the EU-8 the prospect of accession provided a strong impetus for
both reforms and growth while the restoration of peace and stability
in SEE was an important factor in sustaining recovery (figure 8)
Mirroring the growth in output there has been a sharp upswing in
average wages in all economies in the Region For example in the
low income CIS group real wages have almost doubled since 1997 Data on wages by profession or by position in the income distribution
suggest that this upswing has been shared alike by unskilled and
skilled poor and nonpoor In most cases wage increases have been
larger than increases in productivity reflecting in part the bounceshy
back of wages from the very low levels observed in the late 1990s in
the CIS and parts of SEE
17 Overview
While growth has resulted in the creation of new and more proshyductive jobs only the fast-growing economies of the CIS have been able to create jobs at a sufficient pace to replace ones that were lost Employment-to-population ratios have therefore stayed steady or declined almost everywhere outside the CIS (figure 9)15 Because of the failure to engender sufficient job creation the EU-8 and SEE are
well below the Lisbon targets of 70 percent of the labor force in employment 16 The position is somewhat different in the CIS where
employment levels tend to be higher and in many cases are trending upward (with some notable exceptions such as Georgia and Tajikshy
istan) While some fast-growing countries have succeeded in increasshying wage employment (for example Russia) in many low-income countries the main source of employment growth has been through the expansion in self-employment (for example Moldova)
Even where employment ratios are stable there has been a continshyuing reallocation of labor across sectors In most of the EU-8 agriculshyture employment fell and its relative share of employment is now close to the EU benchmark In contrast agriculture employment increased in
most SEE and low income CIS countries Expansion of employment in services was observed in almost all countries in the Region
FIGURE 8 Since 1999 Growth Rates in the Region Have Been High with the CIS the Most Rapidly Growing Subregion
15
10
I
~ Or----~--~~~~--~r-~~~~--~--~~--~~ l
- 10
-15
-20
-25
EUmiddot8 - SEE - Middle income CiS - Low income CIS
SourceWorld Development Indicators (World Bank 2005i)
20 Growth Poverty and Inequality Eastern Europe and the Former Soviet Union
in distribution in poverty reduction for selected growth periods since 1998 The growth share measures how much poverty reduction can be attributed to growth in mean incomes on its own (that is assuming no changes in the distribution) while the distribution share measures how much can be attributed to changes in the distrishybution of incomes alone assuming no change in mean income Figshyure 11 highlights the overwhelming importance of growth to poverty
reduction over the period in question Relative to growth the contrishybution of changes in distribution to poverty reduction has been relashytively small But as small on average as they appear changes in distribution have clearly been quite important in some countries For example in Poland in 1998-99 40 percent of the increase in poverty is attributable to the increase in inequality while 60 percent is attribshyutable to the decline in income In a number of countries in the CIS the share of changes in distribution to poverty reduction in the period since the end of the financial crisis is more than 20 percent
Role of public transfers In addition to wages public transfers are an important component of household income and play an important role in poverty reduction In most countries social protection benefits
FIGURE 11 The Share of Growth in Poverty Reduction Is Dominant across All Regional Subgroups
20
~ 10 0 CI
ltfl
~ Q CI - 10 5 -20 ~ ()
I -g ro ~(U c cc -0 ro ro ro ro-0 ci ~~ gtmiddotc middotc middotc ~sect ~ ~ 0 0
~ 0 iii ro ~ a ~ -0-0 0c c0 EQi~ ~ (5 ro~ ro0shy ltC0 0 co J or ~ ~ ~~ ~a a gtshy1 ~
ro
gtshya a 2001- 22000-1 2001-2 2000-1 2000-1 2001 - 2 2002-3 1998-9 1999shy 2002- 3 2000-2 1998-9 2000-1 1998-9 1999shy 1999shy1998-9 1998-9
EU-8 SEE
Overall change in poverty
Due to growth bull Due to inequality
2002 Middle income CIS
20032002 Low income CIS
Sourcemiddot World Bank staff estimates using ECA Household Surveys Archive
21 Overview shy
have increased in the past five years in real per capita terms along with the growth of fiscal revenues Where data are available they suggest that benefits have also improved in both coverage and adeshyquacy The reduction in arrears particularly in pensions but also in other benefits has no doubt contributed to these improvements As a result social protection transfers have come to play an important role in reducing poverty Indeed poverty would have been significantly higher in a hypothetical no-transfers situation (overview table 1)
While somewhat Simplistic particularly in assuming no behavioral response in the no-transfer scenario (except in a few instances) the
data are nonetheless illustrative of the importance of public transfers to poverty reduction especially outside the low income CIS group
Private transfers In the low income CIS countries and parts of SEE remittances and other private transfers by far exceed publicly proshyvided resources In some cases remittances accounted for more than 10 percent of GDP and boosted consumption levels including among the poor helping to reduce poverty however the size of the impact is difficult to estimate because of various data limitations (Chernetsky Forthcoming)
OVERVIEW TABLE 1 Transfer Payments for Social Protection Have Had an Important Role to Play in Reducing Poverty outside of the Low Income CIS Countries
Incmeln PlMltYwiIhout Veer an socIallr1 I
EUmiddot8 Poland 2001 141
SEE Bosnia ampHerzegovina 2001 68 Bulgaria 2001 156 Romania 2002 49 Serbia Montenegro
Middle income CIS Belarus Kazakhstan
Russian Fed Low income CIS
Armenia Kyrgyz Rep
Benchmark Countries
Vietnam
2003 2002
2002 2002 2002
2001 2001
1998
41 34
143 100
68
12 10
5
Sources For ECA World Bank various poverty assessments for Vietnam Van De Walle 12002)
Note Simulations use national poverty lines Some behavioral response is assumed in Romania 150 percent oj transfer inshycome is replaced) and Serbia 172 percent of transfer income is replaced in rural areas 87 percent in urban areas)
22 Growth Poverty and Inequality Eastern Europe and the Former Soviet Union
The impact of public and private transfers on inequality is mixed Parts of the public transfer system such as well-targeted social assisshytance programs can be fairly progressive Others may be regressive
The largest program in most countries however is the public pension program which tends to be distributionally either neutral or regresshysive The overall impact thus varies from country to country with examples of both fairly progressive and fairly regressive systems in
the Region Unfortunately there has been little systematic study of the contribution of public and private transfers to changes in inequalshyity over this period
Nonincome Dimensions of Well-Being 1998-2003
What are the trends in the nonincome dimensions of well-being Although there has been a reduction in poverty trends in the noninshycome dimensions of well-being such as access to education health care safe water and heating are markedly variable Inequalities in access whether to good schooling or health care or reliable water and electricity persist and in some cases have increased particularly in the CIS In these countries many people have thus come to have more income in their pockets but in access to services and quality of services they may be no better off
Education The most acute form of education deprivation is illiteracy Average literacy among the transition countries of the Region is high (more than 98 percent) and in the transition country with the lowshyest level of literacy (Tajikistan) 96 percent of adults are literate In a benchmark country Turkey literacy was much lower to start with and despite increases stood at just 875 percent in 2002 Thus the extreme form of education deprivation does not appear to be a major issue in the Region
Since 1998 many countries in the Region have maintained or
improved their high levels of school enrollment Most countries
entered the 1990s with a widespread network of education services
that enabled them to achieve almost universal coverage in compulsory
education However some of these achievements were eroded during
the 1990s particularly among the low income CIS group and some countries in SEE although even with the decline in coverage enrollshy
ment in the compulsory cycle was typically higher than in comparator
countries Since 1998 enrollment in the compulsory cycle has been maintained or improved except for some poor countries such as Georshy
gia the Kyrgyz Republic and Tajikistan which have still not managed
23 Overview
to arrest the decline (figure 12) While there is evidence of some income gradient in enrollment with children from better-off households havshying better coverage the gradient is not large Continuing high coverage in most countries of the Region suggests that the prospects for meeting the MDG of universal primary enrollment are fairly good (World Bank 200Sc) Gender inequality in compulsory education has not been an issue except in Tajikistan where it continues to warrant attention
Compared with the primary level enrollments at the secondary level have increased throughout the Region This increase has genershyally been accompanied by a reduction in enrollment gaps across
income groups except in a few low income CIS countries Urbanshyrural gaps have also been reduced in virtually all countries Interestshyingly gender inequalities at this stage of education favor girls The exceptions to this are Bulgaria and Tajikistan Although the ratio of female to male enrollments in Tajikistan has increased over the past five years it continues to be low by the standards of the Region
Returns to education which were highly variable during the 1990s particularly in the CIS have now stabilized at levels similar to those of market economies This underlines the value of investment in educashytion not only for its own sake but also as a means for ensuring adeshyquate standards of living particularly for the poor However returns are a function not simply of access but also of quality of education Compared with enrollments trends in quality of education are less
sanguine Despite increases in spending on a real per capita basis almost everywhere in the Region the failure to invest sufficiently in the quality of infrastructure or staff means that quality is not being maintained For example Trends in International Mathematics and Science Study (TIMSS) data suggest that although performance of eighth graders continues to remain good relative to those in other countries including those in OECD countries at higher levels of income scores are declining in all but a handful of countries in the EUshy8 Where the analysis is available it suggests that the declines are in large part due to a sharp increase in the share of students who are serishyously underperforming Often these students tend to be in schools
where the quality of service provision is marginal such as rural
schools Reading scores of 1S-year-olds from the Programme for Intershy
national Student Assessment (PISA) present no different a picture Apart from a small handful of countries in the EU-8 scores are declinshy
ing or low
Health care Trends in health status and health care utilization are
mixed Declines in male life expectancy (particularly in the successors of the Former Soviet Union) which had become one of the most
24 Growth Poverty and Inequality Eastern Europe and the Former Soviet Union
FIGURE 12 Access to Secondary Education Has Gone Up Virtually throughout the Region but Some Countries Continue to Struggle to Arrest the Decline in Primary Enrollment Rates Enrollment in Primary Education (7-14 years)
100
98 bull I Ci
c 96
S bulltI I I94 e amp
bullc 92 amp
shy I90
88 +-------------------------------------------------------- Poland Hungary Bulgaria Romania Russian Kazakh- Kyrgyz Georgia Moldova Armenia Tajikistan Colombia Turkey Vietnam
Fed stan Rep
BenchmarksEU-8 SEE Low income CISMiddle income CIS
bull 1998 amp 2002--)3
Enrollment in Secondary Education (15-17 years)
100
1 bull
95
90
1 I ICi 85c 80 S
65
ItI 75 bull e 70 c amp
- ~ 60 bull 55
50 Hungary Poland Bulgaria Romania
EU-8 SEE
bull 1998-99 amp 2002--)3
Ru ssian Kazakh-Fed stan
Middle income CIS
Armenia
amp
Georgia Kyrgyz Moldova Tajikistan Colombia Turkey Vietnam Rep
Low income CIS Benchmarks
SourceWorld Bank staff estimates using ECA Household Surveys Archive
25 Overview
widely documented negative health outcomes of the transition have
generally been arrested However many of the proximate causes of high male mortality notably the high incidence of cardiovascular and
circulatory disease and death from accidents and acts of violence
remain As with male life expectancy child and maternal mortality
are also trending in the right direction However the very slow
progress in achieving reductions in mortality and concerns about the
delivery and quality of critical medical services imply that many counshy
tries in the CIS appear unlikely to meet the child and maternal morshy
tality-related Millennium Development Goals (MDGs) (World Bank 2005c)19
There is a growing threat to the health of the Regions population
from HIVAIDS and tuberculosis (TB) particularly in the CIS but also
to some extent in SEE and the EU-8 (the Baltic countries) The Region
as a whole currently has one of the most rapidly growing infection
rates of HIV I AIDS in the world due to problems related to the increase in injecting drugs and commercial sex work a concurrent
increase in the incidence of sexually transmitted infections (STIs)
high migration rates limited capacity of governments and civil socishy
ety to implement effective preventive responses and low levels of
awareness of HIV and STIs Drug transit through the CIS and growth
of local consumer markets for drugs are also contributing to the probshy
lem At current rates of infection and treatment the HIV I AIDS MDG
is unlikely to be attained by a broad swath of countries in the Region (World Bank 2005c)
Countries in the Region have a large network of public health
providers that distributed generous services and that suffered major fiscal restrictions during the 19905 Between 1994 and 1999 counshytries in the Region spent on average 4 percent of GDP on health rangshy
ing from 1 percent in Georgia (low income CIS group) to 9 percent in
Croatia (SEE) After 1999 some countries in the low income CIS
group continued to experience reductions in public spending on health Other poor countries were able to stem the decline in spendshy
ing but only at very low levels of spending (for example Armenia)
Even where funding may be on the upswing outside the EU-8 it is
not close to levels experienced at the outset of the transition
While funding levels may have stabilized or even increased this is
not reflected in improving quality particularly for the poor because of
three factors First the very large network of providers has largely been
retained resulting in an underfunded and hence ineffective network
in many countries Second the lack of resources for basic interventions
like public health activities has resulted in a repeated failure to stem
communicable diseases Third the changing demographic composition
26 Growth Poverty and Inequality Eastern Europe and the Former Soviet Union
of the population (which is becoming older) has altered the morbidity profile and increased the costs of health provision Vulnerable populashy
tion groups (such as rural or small-town dwellers or the poor) are expected to have borne the brunt of not only the misallocation but also the failure of resources to keep pace with needs
The lack of public resources increased the use of fee-for-services in a mostly unregulated setting reducing the demand for health care
Official statistics show the decline in utilization of health care during the 1990s but after 1999 this remained stable or even recovered (figshyure 13) Inpa tient care in the low income CIS group declined more than 20 percent between the mid-l 990s and 2000 only to stop after
2001 Countries in the middle income CIS group continue to have very high hospital utilization rates higher than the EU average Surshyvey data on utilization which control for need suggest a similar picshyture but point in many cases to persistent differentials across rural
and urban areas particularly in the CIS
Infrastructure Turning to infrastructure here too the picture is very
mixed Data problems make this a particularly difficult area to analyze However what is clear is that countries of the Region began transition
reasonably well covered with basic utility services but the economic shocks of the early reform years left providers strapped for funds
which meant that utilities deteriorated Regionwide for much of the 1990s Since then the decline in utility performance (as measured by access and quality) has been reversed or slowed Electricity has shown
FIGURE 13 Hospital Utilization Rates Have Recovered but Remain at Low Levels in Parts of the Low Income CIS Group
1994-8 1999 2000 2001 2002
-lithuania (EU-8) - Romania (SEE)
- Belarus (middle income CIS) - Georgia (low income CIS)
Source WHO based on official statistics of hospital admissions
27 Overview
the greatest improvement providers have maintained near universal coverage while improving reliability in subregions where it was particshyularly poor such as in the low income CIS countries Other recent gains include the expansion of gas supply networks to many houseshy
holds affected by the collapse in district heating and the improvement of water reliability in some countries Despite these improvements many households including many urban households in the CIS and in some parts of SEE continue to use dirty fuels such as coal wood and oil for heating because they lack access to gas and cannot afford or are not reliably provided with electricity Available survey evidence suggests that the reliance on solid fuels for heating affects the poor more than the rich (figure 14) This could have a long-term impact on the health of the poor due to the negative impact of increased indoor
pollution Over the past five years access to clean heat has become less
FIGURE 14 The Poor Make Greater Use of So-Called Dirty Fuels for Heating Percentage of Population Using Clean Sources of Heating in the Poorest and the Richest Quintiles (Latest Available Year)
6 Hungary w
Bulgaria w w (I)
Romania
-e
8 ~ Kazakhstan i 5
Armenia (I)
u E CI Moldova 5 ~ CI
J Tajikistan
jl Turkeyc -
eaI
o 10 20 30 40 50 60 70 80 90 100
of population
Poorest quintile bull Ri chest quintile
SourceWorld Bank staff estimates using ECA Household Surveys Archive
Note Clean fuels are all sources of heating for ahousehold except solid fuels such as wood and coal which are classified as dirty
28 Growth Poverty and Inequality Eastern Europe and the Former Soviet Union
equal in some countries of the low income CIS group (for example Armenia) although in others (such as Tajikistan) the revival of district
heating has improved equity Although time-series data tracking water availability are available
for only a few countries the evidence from the low income CIS counshytries shows the influence of years of little maintenance and no investshy
ment in water provision (figure 15) Although households officially still have water connections little water flows through the pipes On average Tajik households receive water for less than six hours each day and although not depicted here households in smaller cities and
rural areas have the least water
Are key public services affordable Both catastrophic health spending and the additional cost of utilities pose the challenge of affordability for
the poor Household expenditure shares for utilities have continued to increase from the late 1990s to the present (figure 16) They are typically higher for poor households than for rich ones On average however expenditure shares are highest in the EU-B followed by
SEE the middle income CIS countries and the low income CIS group as shown in the figure The increase in utility expenditure shares is largely driven by the increasing cost of electricity and in the EU-B
the price of water
FIGURE 15 In the Low Income CIS Countries the Reliability of Water Supply Is Low and Shows Little Improvement Access to Uninterrupted Water Supply
24
20gtshy =- 15gtshyQ J =shyE 10 t J ~ c
5
0
Bulgaria Georgia Tajikistan
SEE Low income CIS
III Poorest quintile bull Richest quintile
SourceWorld Bank staff estimates using ECA Household Surveys Archive
29 Overview l
FIGURE 16 Household Expenditures on Utilities Have Increased Expenditure Shares on Electricity Heating Water and Sewerage
24
22
20
en 18 E
16 3 c = 14GO CL )( GO 12
~ 10S S 1
4
1 bull I 1
bull I Ibull Ii bull
I1
bull f I Ii
bull
i e ~
] 3 r
EU-8
j cJ
0 c
amp ~ lti
~
-s agt
a it -
e 0
~
SEE
ee 0gt
~ ~ E0
a 0
oil
0 0
~ co ~=gt
~ ~ no ~
0 c
~agt ~ ~
a
Middle income CIS
c ci coe 0 15 2 0 a ~
E s ~ ~ 0
0 (J rot gtshy fshy
Low income CIS
c
tl
a
~ E0 E a0 fshy0 gtU
Benchmark
bull 1998 or earliest bull 2003 or latest
SourceWorld Bank staff estimates using ECA Household Surveys Archive
Note For Albania Latvia Ukraine Serbia and Montenegro Azerbaijan Turkey and Colombia data before 2002 are not available For Estonia Armenia Kyrgyz Reshypublic and Uzbekistan 2000 is used instead of 1998 for Tajikistan 1999 and for Kazakhstan 2001
Catastrophic health expenditures run the danger of impoverishing households in parts of the Region such as the low income CIS counshytries where the health system relies heavily on household contribushytions and households are relatively poor Outside the EU-8 where the impact is more limited because of higher incomes simulations undertaken for the purposes of this report suggest that catastrophic health spending can increase the fraction of the poor population by
3-9 percent
Prospects for Poverty Reduction
Given what has been achieved what are the prospects for poverty reduction In drawing lessons it is worth reminding ourselves of the
main concerns five years ago when Making Transition Work for Everyshyone (World Bank 2000a) was published Then although growth had
I
1
30 Growth Poverty and Inequality Eastern Europe and the Former Soviet Union
recovered in the EU-8 and parts of SEE recovery was slow at best in
the CIS where most countries suffered an additional blow because of
the financial crisis in Russia The collapse in output particularly in the CIS combined with the increase in inequality meant a sharp increase in poverty Prospects for poverty reduction were felt to be
unclear even in the event of the resumption of growth because a core group of the very poor-the long-term unemployed and socially excluded-were likely to be bypassed by growth Despite notable
achievement in the pretransition period education and health sectors were under strain and working to the detriment of poor families and
the economic mobility of their children And to top it aiL data issues clouded researchers understanding of poverty
The picture looks different five years later and ones understanding
of the challenge of poverty needs to be suitably nuanced Economic
growth has firmly returned to the Region and all countries are expeshyriencing positive growth In addition changes in inequality have been modest over this period Moreover in the CIS which had previously
seen the sharpest increases inequality has (with the few exceptions
noted previously) abated The rise in output and the moderation in inequality have together meant a substantial reduction in poverty20
The long-term unemployed and the SOcially excluded remain a conshycern particularly because very few countries outside of the rapidly
growing economies of the CIS have succeeded in raising the share of the population that is employed However the failure to raise overall employment levels has not acted as a brake on poverty reduction to date (except perhaps in a few countries such as Poland) because in
most countries the bulk of the poor retain some attachment to the labor market and have benefited from the bounce-back in real wages The health and education sectors in most countries have benefited from increased levels of funding but because of remaining inefficienshycies in delivery this has not translated into uniform improvements in
quality Access is possibly less of a concern with poor quality and high
cost (or reduced affordability) becoming key dimensions of deprivashy
tion The quality of data has improved encouraging more confidence
about observed trends At the same time shortcomings remain espeshy
cially with regard to data on the quality dimension of public services
However while the picture looks somewhat different and notwithshystanding the impressive reduction in poverty in the Region over the
past five years it is clear that there is a long road ahead not just for the
low income CIS countries but also for many middle-income countries
in the Region (where poverty rates are lower but where most of the poor live) This is for a number of reasons First despite the recovery
poverty rates remain Significant for many countries it will be some
31 Overview
time before absolute poverty is eradicated (on this see further below) Second the recovery is still recent for many if not most countries and large numbers remain vulnerable to poverty in the event of an ecoshynomic downturn Third despite recent improvements morale (as revealed in self-reported assessments of well-being) remains low comshypared with that of countdes at similar levels of income This may be related to uncertain prospects for the future Low morale may also be related to greater inequality and erosion in access and quality of public services compared with the past
Projecting poverty rates over the medium term using available economic growth forecasts from the World Banks Global Economic
Prospects 2005 indicates that poverty will not disappear altogether
and together with economic vulnerability will affect 30 percent of the population by 2007 This is not to say that there will be little poverty reduction In fact poverty will fall by 7 percent a year or 21 million fewer people will be in poverty in the five years covered by
the forecast period (figure 17) Impressive though this reduction may
FIGURE 17 Growth Will Move an Additional 21 Million People out of Poverty by 2007 but 40 Million Will Remain Absolutely Poor and More Than 100 Million Vulnerable to Poverty
100
90
80
70
c 0 60~
E 500 li 40
30
20
10
1998-9 2002-3 By 2007
_ Nonpoor above $430 aday
Vulnerable above $215 and below $430 a day
_ Poor below $215 a day
Source World Bank staff estimates using EGA Household Surveys Archive
Note Growth rates for 2002-2007 are from the World Banks Global Economic Prospects bull = simulations
32 Growth Poverty and Inequality Eastern Europe and the Former Soviet Union
OVERVIEW BOX 2
Nonlncome Dimensions of Poverty and Millennium Development Goals In the Region
Of the Regions subregions the EU-8 is perhaps the least challenged by the nonIncome
dimensions of poverty Most countries have met or are likely to meet all of the non income
MDGs However for the Baltics current trends suggest that the spread of HIVAIDS may not be
effectively combated
The nonincome dimensions of poverty are likely to challenge some countries in SEE It is
not clear that countries such as Bulgaria and Romania w ill be able to combat the spread of
HIVAIDS Romania may also struggle to meet the water access MDG because only 16 percent
of the sizable rural population is assessed to have access to an improved water source
The nonincome dimensions of poverty particularly related to health are likely to chalshylenge the middle income CIS countries None of these countries is assessed as likely to be
able to combat the spread of HIVAIDS The targets for reductions in child mortality and matershy
nal mortality may also not be achieved in some countries It should be pointed out however that
because of the age and epidemiological profile of these countries proportionately higher gains
in life expectancy would accrue from reducing adult mortality through the control of noncomshy
municable diseases than from achieving targets related to the MDGs
The low income CIS countries are most severely challenged on nonIncome dimensions of
poverty Most MDGs are unlikely to be met in the low income CIS group Indeed only the MDG
regarding attaining gender equity in schOOling is on track
In benchmark Turkey the nonincome dimensions also represent a challenge In particular
even though the gender gap has been closing girls are significantly underrepresented in primary
and secondary schools The MDG for maternal mortality also appears unlikely to be achieved
with maternal mortality rates unusually high for a middle-income country
SourceWorld Bank 2OO5c
be some 40 million people are projected to remain absolutely poor in the Region by 2007 Naturally faster growth could lead to faster reduction of poverty rates Sustained economic growth is hence a crucial component of any poverty alleviation strategy These projecshytions do not incorporate any worsening of the income distribution which would undermine the impact of growth Given that inequality levels in the Region are broadly speaking at the low end by world standards some worsening of inequality over the medium term would not be surprising These projections should therefore be undershystood as a best-case scenario
33
I
Overview
Looking behind the regional aggregates and using subgroups speshy
cific targets indicate that all country subgroups face challenges in poverty reduction over the longer term A forward-looking agenda
could for example aim to meet the MDG on poverty-halving
absolute poverty by 2015 compared with 1990 levels-which is most
relevant for the low income CIS countries For the middle income CIS
group and SEE which have moderate poverty the MDG is not suffishy
ciently ambitious Eliminating economic vulnerability which this
report takes as having income (consumption) levels that are above
twice the poverty line is an appropriate modified MDG for this
group For the EU-8 who have minimal absolute poverty but are sigshy
nificantly poorer than the 15 EU member states they have joined a
modified MDG could be to reduce poverty by half assuming the
poverty line to be the lowest among the EU-15 21 Overview table 2
shows that despite recent progress all subgroups face a real chalshy
lenge in poverty reduction The required growth rates are signifishy
cantly higher than the rates at which these countries are expected to
grow Moreover as was the case in figure 17 no change in income
distribution is assumed With worsening inequality either the goals
would not be achieved or the required growth rates would be even
higher
As with income countries in the Region will continue to face
challenges on nonincome dimensions of well-being This is most
simply characterized through the prospects of attaining the MDGs on
education health and the environment which in many ways repshy
resent a subset of aspirations on the nonincome side The World
Bank (2005) projects the likelihood that countries will attain the MDGs based on recent trends in the indicators It concludes that the
OVERVIEW TABLE 2 Achieving Subgroup-Appropriate Poverty Reduction Targets over the Long Term (2015) Will Require Significantly Higher GOP Growth Rates
I IGroupings
Long-tllm growllt ratu requilld to
meet taIgIII grawIb forIellt
2OO2-71
Specific tIrgtt
Baseline
Low income CIS Middle income CIS SEE EUmiddot8
56 97
108 66
39 68 54 43
Reduce poverty by half relative to 1990 (at $215 aday) Eliminate economic vulnerability (at $430 aday) Eliminate economic vulnerability (at $430 aday) Reduce poverty by half taking as poverty line the lowest line in EU-15 today
I
523 396 553
366
Source World Bank staff estimates growth rates are from GEP
Note bull Subregional country averages weighted by GDP bullbull GEP Global Economic Prospects IWorid Bank 2005b) bullbullbull Population weighted
I
--
36 Growth Poverty and Inequality Eastern Europe and the Former Soviet Union
need to be improved to faciJitate land restructuring (for example in SEE) significant income gains can be attained from accelerated
reforms In all countries future gains in reducing poverty in rural areas would hinge on eliminating key market imperfections in input and output markets essential for enabling self-employed farmers to lift themselves out of poverty In particular the integration of rural
areas into national credit markets is critical for further investments and productivity growth in agriculture More broadly improving the investment climate in rural areas is very important Increasing evishydence shows that investments in food processing agribusiness trade and retail companies playa crucial role in helping small farmers overshy
come input and output market imperfections in helping them upgrade the quality of their products and in accessing markets (World Bank 2005a) Beyond measures related to agriculture inteshygration of the rural poor into national labor markets-either through rural off-farm employment or by improving access to urban labor
markets-and adequate social safety nets will be crucial for sustained income growth and poverty reduction particularly in the middle
income CIS and SEE countries EmphasiS on rural service delivery and infrastructure is also criticaL especially in the low income CIS
not only for its instrumental role in raising rural incomes but also as an aspect of poverty that warrants attention in its own right
PromotinH opportunities in laHHinH reHions Countries in the Region face substantial differences in poverty rates between urban and rural areas and between capital cities and smaller towns that if severe risk pershypetuating intergenerational poverty and inequality traps and act as a drag on economic growth Most countries seek to address regional inequalities through the maintenance of a stable macroeconomic envishyronment the creation of a level playing field for businesses and fiscal transfers for targeted programs in lagging regions But more can be done First countries need to enhance labor mobility When people
move to economic nodes that promise a higher expected income it
helps to reduce spatial income disparities Adoption of appropriate polishy
cies to encourage movement supported by the development of urban
housing markets and policies credit markets and entitlement reform
can provide a strong stimulus to inter- and intra regional mobility and
help improve income levels in relatively poorer areas while also boostshy
ing competition productivity and growth in destination areas Second
in countries with decentralized fiscal systems there is a strong role for
equalizing resource transfers to address regional inequalities In particshy
ular social and economic reforms in the lagging regions can be encourshy
aged through market-based incentives including the use of competitive
37 Overview
allocation mechanisms for fiscal transfers Third education and health service delivery should be strengthened in lagging regions to ensure adequate human capital formation as a route out of poverty In particshyular existing inequalities in access to public services and quality of sershyvices provided need to be addressed as a priority
Strengthening Public Service Delivery
Ensuring access and improving quality of education and health care require strengthened accountability arrangements Although low levshyels of spending are an issue more so in education than in health care only a few countries spend less than is warranted given levels of
income Thus going forward most countries will need to operate within the available resource envelope Reforms will therefore have to focus on improving the quality and efficiency of public spending
Enhancing quality and equity of education services In education the low income CIS group needs to stem the decline in primary enrollments and quality of education in particular by ending the situation in which
staff are underpaid and complementary expenditures (on textbooks heating and repairs) are underfinanced while at the same time employment and in some cases facilities remain well above standards common in much richer countries In addition some countries may need to ensure greater equity in education spending across subnashytiona I regions (for example the Kyrgyz Republic) Ensuring access to
primary education is much less of an issue outside the low income CIS countries Here the main issue is secondary education where quality and relevance to market demand are often in question Governance reforms that both strengthen government accountability for outcomes as well as increase participation and voice will be essential to improvshying outcomes Lessons from the experience of the EU-8 in raising qualshyity certainly point in this direction In particular decentralization of services to allow for a greater role for both school administrators and parents has an important role to play in stemming declines in quality
Strengthening access to and quality of health care In health care lowshyincome countries suffer from having to provide for a range of sershy
vices when budget resources are limited but even the available
allocations are not spent wisely This is reflected in the large share of
household contributions in total health spending Improving utilizashy
tion among the poor is closely linked to financing and quality issues
Tough decisions are required on the size of the basic package and a
major reallocation of expenditure-and greater accountability for its
38 Growth Poverty and Inequality Eastern Europe and the Former Soviet Union
use-implemented to improve access to and quality of care (World
Bank 2005d) To improve matters accountability relationships between politicians and citizens need to become more effective (through such means as more organized voice power of citizens citshyizens report cards and informed voting) and the accountability
relationships between politicians and providers need to be strengthshyened (through such means as clarifying responsibility aligning incentives between policy maker as principal and provider as agent and better enforcement of contracts between organizational and front-line providers) Countries such as Armenia have shown that even with limited resources and high poverty rates improvements in key dimensions such as affordability can be made albeit on a modshyerate scale At the other end of the spectrum the EU-8 is struggling to maintain the easy access to a wide range of health services in a
context of rising costs Clearly further efficiency-enhancing mechashynisms as well as private financing wiU need to be found to control expenditures
Managing reform of utilities Service quality in many of the infrastrucshyture services is extremely poor in the low income CIS countries and even in richer countries there are large disparities between service quality for the poor and the nonpoor The infrastructure needs of the
poor are unlikely to be met without reform of the utilities sector to bring it to a financially self-sustaining basis which would encourage much-needed upkeep and maintenance of viable infrastructure and improvements in service quality Improving financial performance will involve raising tariffs which--except for power where there has been some movement toward cost recovery and possibly water in the EU-8-are well below cost recovery levels Further movement toward full cost recovery in power is expected to have a limited impact on poverty except in the poorest countries However acrossshy
the-board increases in the full range of utilities is expected to have a
more serious impact on poverty (World Bank 2005 Forthcoming b)
The social impact of tariff increases will need to be factored into the
sequencing and pace of reforms in the event of across-the-board
reforms in a range of utilities Where the social safety net is adequate
it can be expected to mitigate the impact on the poor However where
social safety nets are relatively thin as for example in the low income
CIS group other options are worthy of consideration For utilities
that can be metered lifeline tariffs can serve as a useful temporary
cushion however where lifelines are not practical (as for example
in sectors where consumption cannot be measured) reforms would
need to be calibrated to affordability
39 Overview
Enhancing Social Protection
Strengthening the social safety net Given their importance for poverty reduction and the broad improvements over time it should be clear that countries need to maintain ongoing social insurance and social assistance reforms which are largely designed to improve sustainabilshy
ity and to enhance coverage and targeting of the poor within the available resource envelope In the low income CIS group the main constraint will continue to be the fiscal means to cover the population adequately In the middle income CIS group and SEE although there is more fiscal space for social protection there is also greater resistshyance to reforms as suggested (for example) by the difficulties with the monetization of privileges in Russia While the objective of the reforms is not in question the difficulties in implementation serve as a useful reminder of the importance of sequencing with other social and economic reforms the need to protect the most vulnerable
groups and an appropriate communications strategy to explain the benefits of reforms Where systems are more generous as for examshyple in parts of SEE and the EU-8 a balance will need to be struck between the need for social protection and labor market incentives
Strengthening taqeted interventions for marginalized groups and minorities This may be in the form of assistance in cash or in-kind (such as edushycation health or housing) depending on the nature of the group For the long-term unemployed or nonparticipants active labor marshy
ket programs can be particularly relevant But evidence from successshyful training programs suggests that these should be targeted offered on a selective basis with clear links to potential employers and in collaboration with the private sector It is important to bear in mind that there is limited evidence of successful retraining programs from the low income CIS group In some cases interventions may need to be integrated across many fronts For example for the Roma minorshyity of the EU-8 and SEE governments are taking a holistic approach to ending persistent exclusion by setting goals in four areas-educashy
tion employment health and housing Other mjnorities may require
a different approach The elderly especially those who are very old or
living alone may also require special interventions such as suppleshy
mentary cash benefits or provision of assisted living services For most
marginalized groups however additional assistance whether in cash
or kind need not be provided by the public sector alone Civil society
organizations community-based groups and other organizations
could also be encouraged to come into the sector under the overall
direction of the government
40 Growth Poverty and Inequality Eastern Europe and the Former Soviet Union
Ensuring adequate minimum wages Minimum wages are an important policy instrument for enhancing the income security of the poor These can help provide a floor to income but need to be kept at a reashy
sonable level In this context the large real increases in the CIS in recent years have brought minimum wages closer to subsistence levshyels However future increases in minimum wages need to be considshyered carefully so as not to become so high that they have negative effects on growth and employment with adverse impacts on poverty
Where variations in regional income and labor market profiles are large governments may need to consider setting region-specific minshyimum wages which may help improve the employability of certain
groups of workers (such as younger workers and those in lagging regions) This is an issue particularly in the EU-8 and SEE where minimum wages represent a relatively high proportion of the average
wage and the adverse impact of common minimum wages is particushylarly noticeable For example the relatively high minimum wage is found to constrain employment opportunities for the low-skilled in countries such as Lithuania and Poland
Monitoring Progress on Poverty Reduction
Huge progress has been made in recent years in improving the qualshy
ity and accessibility of poverty data Countries need good survey data to monitor changes in poverty and to evaluate the impact of specific policy actions on the poor This report documents significant progress in collecting up-to-date high-quality data across the Region The preshyvious report on poverty (World Bank 2000a) relied on a single survey for many countries and could produce an estimate of poverty over
time for only three countries With full data sets closed to users outshyside statistical offices the report also had to rely on partial data Since then many countries have started implementing regular surveys that
periodically collect representative data on income and nonincome
dimensions of living standards In addition data are provided openly
to researchers for the purposes of study and policy evaluation These
improvements are not only confined to EU-8 countries (for example
Hungary) but also cover SEE (for example Romania) middle income
CIS countries (for example Kazakhstan) and low income CIS counshy
tries (for example Georgia and Moldova)
But many challenges remain First improvements to data quality
and availability are very recent and for many countries in the Region
reliable data on poverty changes can be obtained for only a few recent
years The efforts in collecting data need to be maintained Second
survey coverage and response rates have fallen over time in all counshy
41
I
Overview
tries and there is a need to strengthen the technical capacity of stashytistical offices to curb this trend and deal with it appropriately Third wide gaps exist in data collection on the nonincome dimensions of poverty there are practically no attempts to gauge trends in the qualshyity of health care and infrastructure services and even indicators of access are not consistently collected Given the changing nature of poverty with the increasing role of nonincome components this gap
is the most worrying Fourth not all countries have opened their data sets to researchers undermining the effective use of public funds spent on data collection and monitoring These areas-keeping up with periodic surveys to provide comparable data collecting informashytion on nonincome dimensions and opening up access to survey data-are priorities for action to ensure adequate information supshy
port for poverty reduction efforts (See overview box 3 for a discusshysion of the data used for this report)
Conclusions
The countries in the Region have made significant progress in redUCing poverty More than 40 million people moved out of poverty during 1998-2003 Much of this poverty reduction derives from the growth rebound in the CIS countries But poverty and vulnerability still remain a significant problem more than 60 million are poor and more than 150 million are vulnerable Most of the poor are the working poor Many others face deprivations in access and quality of public services
Regional inequalities both between and within countries are large The highest levels of absolute poverty are found in poor countries of Censhytral Asia and the South Caucasus but most of the Regions poor and vulnerable are in middle-income countries
Notwithstanding the tremendous heterogeneity among countries in the Region reducing poverty and vulnerability requires an accelshyeration of shared growth strengthening of public service delivery better targeting of social protection and regular monitoring of
progress in poverty reduction across the Region In promoting accelshy
erated shared growth the report emphasizes (a) further reform of
the enterprise sector to encourage the release of resources from the
old less productive sectors to the new more productive sectors (b)
further reforms to promote agriculture and rural growth by integratshy
ing rural areas into the rest of the economy with regard to labor and capital markets access to credit trade and services and (c) policies to
promote greater opportunity in lagging regions Public service delivshy
ery needs to be improved through increasing the accountability of
42 Growth Poverty and Inequality Eastern Europe and the Former Soviet Union
OVERVIEW BOX 3
Data for This Report The World Banks ECA Household Survey Archive
To arrive at the internationally comparable assessment of poverty this report uses primary unit
record data from recent household surveys to construct a comparable indicator of living stanshy
dards across all countries in the Region Income data an alternative to consumption for measshy
uring living standards remain particularly difficult to collect in transition countries In contrast
practice has shown that consumption data can be gathered with a great degree of precision
Survey consumption modules have become more detailed over time and better capture various
dimensions of consumption
In relying on consumption of goods and services by a household as the measure of living
standards a number of conceptual and practical issues needed to be addressed First unlike
food consumer durables and housing are consumed over a long time It is customary thereshy
fore to include the imputed value of the consumption flow associated with the possession
of consumer durables (including housing) but exclude the expenditure on the purchase of
these goods However for the Region data availability limits the application of this approach
to all countries This report does not therefore include estimates of flow of services of
durables nor have researchers added in durable purchases or rents Second when conshy
sumption is used as a measure of well-being higher consumption should indicate a higher
level of well-being For most consumption items this correspondence is reasonable howshy
ever for some categories such as health expenditures this correspondence is questionable
As a result health expenditures were not included as a part of consumption (Deaton and Zaishy
di 2002) Third given the significance of spatial differences the authors adjusted for spatial
price differences using the same set of information in all countries In the cases where data
government and the voice and participation of citizens This is essenshytial to improving access and quality of social services which are not
only important in their own right but also of instrumental value in helping the poor move out of poverty The report emphasizes the need to further strengthen the social safety net to meet the chalshylenges of restructuring economies Finally monitoring progress on
poverty reduction on a regular basis needs good-quality household survey data sets that are publicly available for research and analysis
Endnotes
l All monetary amounts are in us dollars ($) unless otherwise indicated 2 The new member states of the European Union are the Czech Republic
43 Owrview
were collected over a long time it was also necessary to adjust for changes in prices over
time Fourth households in the Region cope with poverty by relying on an array of nonmarshy
ket strategies including producing their own food and engaging in reciprocal exchange with
other households and institutions A consistent approach was used in assigning a monetary
value to these components of consumption Fifth to adjust for differences in household
composition researchers took the simplest approach and used the per capita scale Sixth
the procedure which conforms to methods used in other international household survey
data depositories (such as the Luxembourg Income Study see Gottschalk and Smeeding
[1997) and wwwlisprojectorg) was used to clean the data of outliers across all data sets
Following a consistent approach across all data sets gives reasonable confidence that differshy
ences across countries in the final consumption measure are due to differences in the primary
data and are not due to the method of aggregation This is the first time (to the authors knowlshy
edge) that comparable consumption aggregates have been constructed for countries in the Reshy
gion (Full details are provided in appendix A Data and Methodology)
The constructed estimate of real per capita consumption has several shortcomings that reflect
some persistent data problems in the Region First it ignores the differential impact of price inshy
creases on the poor and nonpoor No price indices for low-income groups that would allow this
issue to be addressed are routinely available in the Region Second over time there has been
considerable deterioration in response rates in many countries Countries deal with this problem
in different ways which may have (as yet unknown) implications for survey-based poverty and
inequality measures Notwithstanding these limitations consumption indicators constructed for
this report produce a reasonably reliable anchor to assess changes in poverty and distribution
during 1998-2003
Soutrss Deaton and Zaidi 2002 Gottschalk and Smeeding 1997 and wwwlisprojectorg
-- -shy
Estonia Hungary Latvia Lithuania Poland the Slovak Republic and Slovenia
3 Countries in SEE consist of Albania Bosnia and Herzegovina Bulgaria Croatia the former Yugoslav Republic (FYR) of Macedonia Romania and Serbia and Montenegro the subregion also includes a territory of Kosovo now UNMIK
4 Middle-income countries in the CIS are Belarus Kazakhstan Russia and Ukraine
5 Low-income countries in the CIS are Armenia Azerbaijan Georgia the Kyrgyz Republic Moldova Tajikistan Turkmenistan and Uzbekistan
6 The Commonwealth of Independent States includes all countries that were part of the Former Soviet Union except for the three Baltic republics Estonia Latvia and Lithuania which acceded to the European Union in May 2004
7 The analysis of poverty trends uses data from 15 countries in the Region for which comparable representative surveys are available over the entire
I
44 Growth Poverty and Inequality Eastern Europe and the Former Soviet Union
1998-2003 period or its significant part Armenia Belarus Bosnia and Herzegovina Bulgaria Estonia Georgia Kazakhstan the Kyrgyz Repubshylic Lithuania Moldova Poland Romania Russia Tajikistan and Uzbekshyistan The appendix to the study discusses country coverage in detail
8 Aggregate poverty figures include Turkey in addition to the Regions poverty headcount and thus refer to the ECA Region as defined by the World Bank
9 Many of these poverty lines have been drawn in-country from houseshyhold survey data and represent a level of consumption that would allow a typical household to meet international minimum caloric requireshyments with an additional allowance for nonfood basic needs They are a far cry from the outdated and questionable poverty lines used in many countries in the early years of the transition
10 The first 15 member states of the European Union are Austria Belgium Denmark Finland France Germany Greece Ireland Italy Luxembourg the Netherlands Portugal Spain Sweden and the United Kingdom
II For the purposes of ctiscussing poverty risks in the EU-8 countries and selected countries in SEE and the middle income CIS group we use a higher poverty line of $430 The $215 line catches a fairly small proshyportion of the population in these countries and thus may not provide robust results
12 For the reasons explained in the appendix we use consumption as an inctishycator of welfare at the household level The other often applied measure-income-tends to show much higher levels of inequality but it suffers from severe problems of underreporting in many transition economies it is unclear whether high levels of income inequality are driven by the noisy data To deal with this problem while comparing levshyels of inequality in the Region with other countries we consistently rely on consumption-based indices
13 The Gini coefficient is a standard measure of inequality it takes values between 0 (complete equality) to I (extreme inequality when all income is appropriated by the richest person) (see details in the appendix)
14 The point here is not whether relative or absolute notions of inequality are right but simply that peoples perceptions of inequality are differshyent from how economists have chosen to measure it
15 Employment rates among women do not compare unfavorably with those of men except in a few countries such as Bosnia and Herzegovina and Tajikistan
16 Targets agreed to at the Lisbon Summit in March 2000 where heads of state and governments of the European Union decided that the EU should adopt the strategic goals for the next decade of becoming the most competitive and dynamic knowledge-based economy [with) greater social cohesion The 70 percent employment rate for the workshying-age population is one of such targets
17 Georgia (not depicted here) is another country where the incomes of the poor have declined in real terms
18 Thus trends in wage inequality are mixed with inequality falling in some countries and rising in others
19 The MDGs represent an international effort to promote poverty reducshytion and human development by establishing measurable yardsticks for
45 Overview
eight goals to be achieved by 2015 To achieve the child and maternal mortality MDGs countries would have to reduce child mortality by twoshythirds and maternal mortality by three-quarters by 2015 The 1990 benchmark against which progress is assessed is often not suitable for the Regions countries because many social indicators reached their nadir in the mid-1990s or later The projections made by the World Bank are
I
based on recent trends in the indicators (see World Bank 2005c for furshyther details)
II 20 In technical terms the elasticity of poverty reduction to growth has Ii proved to be high for the most part
21 Portugal has the lowest poverty line around PPP $750 per capita per day
Bibliography
Chen Shaohua and Martin Ravallion 2001 How Did the Worlds Poorest Fare in the 1990s Review of Income and Wealth 47 (3 September) 283-300
I Chernetsky Taras Forthcoming Magnitudes and Distribution of Remitshytances in Eastern Europe Evidence from Household Surveys Data and Balance of Payment Statistics Photocopy World Bank Washington DC
Deaton A and S Zaidi 2002 Guidelines for Constructing Consumption Aggregates for Welfare Analysis LSMS Working Paper 135 World Bank Washington DC
Dennis Ian and Anne-Catherine Guio 2004 Poverty and Social Exclusion in the EU Statistics In Focus Population and Social Conditions 162004 Luxembourg European Commission Office for Official Publications of the European Communities
Gottschalk Peter and Timothy M Smeeding 1997 Cross-National Comshyparisons of Earnings and Income Inequality Journal of Economic Literature 35 (June) 633-87
Kakwani N and Z Sajaia 2004 Internationally Comparable Poverty Lines for CIS Countries Photocopy Poverty Reduction and Economic Management Unit ECA Region World Bank Washington DC and DFlD United Kingdom
Lehmann Hartmut and Jonathan Wadsworth 2001 Wage Arrears and the Distribution of Earnings in Russia William Davidson Institute Working Paper 421 University of Michigan Stephen M Ross Business School Ann Arbor
OECD 2003 Summary Results of ECP 2000 A Note by the OECD Secreshytariat Working Paper 6 Statistical Commission and Economic Commisshysion for Europe Conference of European Statisticians Joint Consultation on the European Comparison Programme Geneva March 31-April 2 2003
van de Walle Dominique 2002 The Static and Dynamic Incidence of Vietshynams Public Safety Net Policy Research Working Paper 2791 World Bank Washington DC
46 Growth Poverty and Inequality Eastern Europe and the Former Soviet Union
World Bank 1990 World Development Report 1990 New York Oxford Univershysity Press
- -- 2000a Making Transition Work for Everyone Poverty and Inequality in Europe and Central Asia Washington DC World Bank
--- 2000b Republic of Latvia The Poverty Assessment 2 vols Washington DC World Bank
--- 2001 a Hungary Long-Term Poverty Social Protection and the Labor Marshyket 2 vols Washington DC World Bank
--- 2001b Poland Labor Market Study The Challenge of Job Creation Washshyington DC World Bank
--- 2001e Slovak Republic Living Standards Employment and Labor Market Study Washington DC World Bank
--- 2001d World Development Report 200012001 Attacking Poverty Washshyington DC World Bank
--- 2002a Armenia Poverty Update Washington DC World Bank
--- 2002b Bulgaria Poverty Assessment Washington DC World Bank
~ 2002e Georgia Poverty Update Washington DC World Bank
--- 2002d Labor Market in Postwar Bosnia and Herzegovina How to Encourshyage Businesses to Create Jobs and Increase Worker Mobility Washington DC World Bank
--- 2002e Republic of Tajikistan Poverty Assessment Washington DC World Bank
--- 2002f Russian Labor Market Moving from Crisis to Recovery Europe and Central Asia Region Human Development Sector Unit Washington DC World Bank
--- 2002g Slovak Republic Poverty and Welfare ofRoma in the Slovak Repubshylic Bratislava The World Bank Foundation SPACE Ineko and The Open Society Institute
---- 2002h Transition The First Ten Years Analysis and Lessons for Eastern Europe and the Former Soviet Union Washington DC World Bank
--- 2002i Turkmenistan A Profile of Living Standards in Turkmenistan Washington DC World Bank
--- 2003a Albania Poverty Assessment Washington DC World Bank
--- 2003b Armenia Poverty Assessment Washington DC World Bank
--- 2003e Azerbaijan Republic Poverty Assessment 2 vols Washington DC World Bank
--- 2003d Bosnia and Herzegovina Poverty Assessment 2 vols Washington DC World Bank
--- 2003e FYR Macedonia Country Economic Memorandum Tackling Unemshyployment Washington DC World Bank
--- 2003f Guatemala Poverty in Guatemala Washington DC World Bank
--- 2003g Inequality in Latin America and the Caribbean Breaking with the Past Washington DC World Bank
)
47
I
Overview
--- 2003h Kosovo Labor Market Study Policy Challenges ofFormal and Inforshymal Employment Washington DC World Bank
--- 2003i Kyrgyz Republic Enhancing Pro-Poor Growth Washington DC World Bank
---- 2003j hReview of Parent-Community Participation in Schools in ECAH Background Paper for Social Development in Europe and Central Asia Region Issues and Directions ECA Socially and Sustainable Development Department Washington DC World Bank
--- 2003k Romania Poverty Assessment 2 vols Washington DC World Bank
--- 2003l Serbia and Montenegro Poverty Assessment 2 vols Washington I
DC World Bank
--- 2003m Tracking Nonincome Dimensions ofPoverty in ECA Poverty Reducshytion and Economic Management Unit and Human Development Sector Unit Europe and Central Asia Region Washington DC World Bank
--- 2003n Uzbekistan Living Standards Assessment Washington DC World Bank
--- 2004a Azerbaijan Municipal Services Study Photocopy ECSIE World Bank Washington DC
- -- 2004b Belarus Poverty Assessment 2 vols Decision Draft Washington DC World Bank
--- 2004c Bosnia and Herzegovina Country Economic Memorandum Washshyington DC World Bank
--- 2004d The Governance ofService Delivery in ECA A Regional Study ECA Vice Presidency Washington DC World Bank
--- 2004e Kazakhstan Living Standards Assessment in Kazakhstan 2 vols Washington DC World Bank
--- 2004f Latvia Poverty Assessment Decision Draft Washington DC World Bank
--- 2004g Latvia The Quest for Jobs and Growth A World Bank Country Ecoshynomic Memorandum Washington DC World Bank
--- 2004h Poland Growth Employment and Living Standards in Pre-Accesshysion Poland Washington DC World Bank
--- 2004i Recession Recovery and Poverty in Moldova Report 2B024-MD World Bank Washington DC
--- 2004j World Development Report 2005 Washington DC World Bank
--- 2005a Dynamics of Vertical Coordination in Agri-Food Supply Chains in ECA Washington DC World Bank
--- 2005b Global Economic Prospects 2005 Trade Regionalism and Developshyment Washington DC World Bank
--- 2005c MDGs in Europe and Central Asia Performance and Prospects Washington DC World Bank
- -- 2005d Operationalizing MDGs How Effective Is the Long Route A Case Study ofGeorgia Washington DC World Bank
48 Growth Poverty and Inequality Eastern Europe and the Former Soviet Union
--- 2005e Poverty and Social Exclusion of the Roma in Serbia and Montenegro Photocopy World Bank Washington DC
--- 2005f Pro-Poor Growth in the 1990s Lessons and Insights from 14 Countries Washington DC World Bank
--- 2005g Russian Federation Reducing Poverty through Growth and Social Policy Reform Washington DC World Bank
~ 2005h Serbia The Social Safety Net and the Poor Photocopy World Bank Washington DC
--- 2005i World Development Indicators Washington DC World Bank
--- 2005j World Development Report 2006 Equity and Development Washshyington DC World Bank
~--- Forthcoming-a Enhancing Job Opportunities in Transition Countries Eastern Europe and the Former Soviet Union Washington DC World Bank
--- Forthcoming-b Foundations for Sustainable Infrastructure in Europe and Central Asia Tariffs Safety Nets RegUlation Commercialization Washington DC World Bank
-~~- Forthcoming-c From Disintegration to Reintegration Eastern Europe and the Former Soviet Union in International Trade Washington DC World Bank
--- Forthcoming-d Doing Business 2006 Washington DC World Bank
Growth Poverty and Inequality Eastern Europe and the Former Soviet Union
While the countries of Eastern Europe and the Former Soviet Union have made significant progress in reducing poverty in the past five years poverty and vulnerability remain significant problems This book examines these important issues and provides recommendations for policy makers
D16193 US$28
016195 US$28
016197 US$28
Infrastructure n Eastern Europe and the Former Sovet Unon Tadffs Safety Nets Regulaton and CommerciaUzaton
0-8213-6191-0 016191
bull Geoiraphic discounts applymiddot up to 75 in some countries Please see enclosed information or visit http- publications worldbankorg discounts
middotmiddotShipping and Handling charges within the US are USSBOO per arder If a purchase order is used actual shipping will be charged Outside of the US customers have the option to choose between nonmiddot tradable airmail delivery (USS700 per order plus USS600 per item) and trackable couriered airmail delivery (USS1650 per order plus USSB per item)
PAYMENT METHOD
US$28
Shipping
Subtotal
Total usS
Orders from individuals must be accompanied by payment or credit card information Credit cards accepted only for orders addressed to the World Bank Check wih your local distributor about acceptable credit cards Please do not send cash
(Please print)
Name ____________________ ----______________ Charge my DAmerican Express D Mastercard D Visa
nVe ________________- ___________ Card no __~_____________________________
Organization _ _ _________________ Expiration date __- 1__ Name ____________________________________ __Address ____________________________
(as it appears on the card)
Signature-~-o___c__---__-___-----------shyCity ________~_______ (required for all credit card charges)
State _____ ZipPostal Code _______ o Check no in the amount of $___ is enclosed When ordering direcVy from the World Country _______________________________ Bank make check payable in US funds only drawn
Phone ______________ _____ on a US bank to The World Bank Please send your check with your order
Fax ______________________________________ __ Institutional customers in the US only
E-mail ______________________ _ _ D Bill me Please include purchase order
bullbullbullmlsectb World Bank Publications
wwwworldbankorgpublications By mail PO Box 960 Herndon VA 20172-0960 USA
By phone +1-703-661-1580 or 800-645-7247middot By fax +1-703-661-1501 SOURCE CODE Questions E-mail us at booksworldbankorg OECA05
WORLD BANK I Publications The refelence of chOIce 011 development
I
This report is part of a series undertaken by the Europe and Central Asia Region of
the World Bank The series draws on original data the World Banks operational
experience and the extensive literature on the Region Poverty jobs trade migration
and infrastructure will be among the topics covered
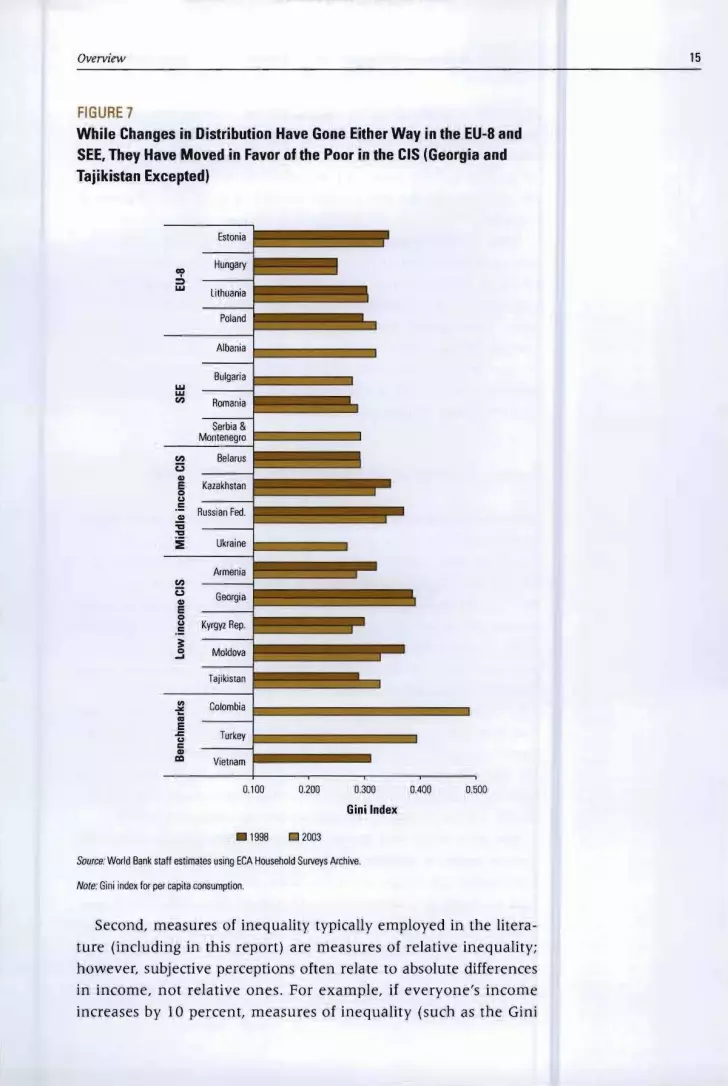
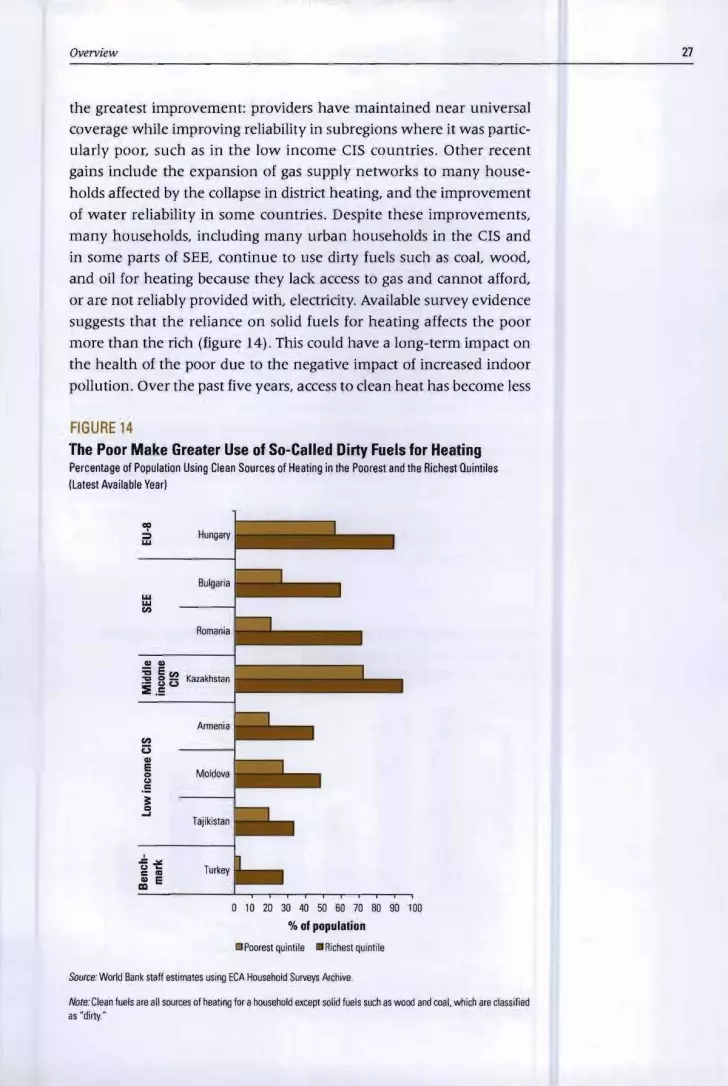
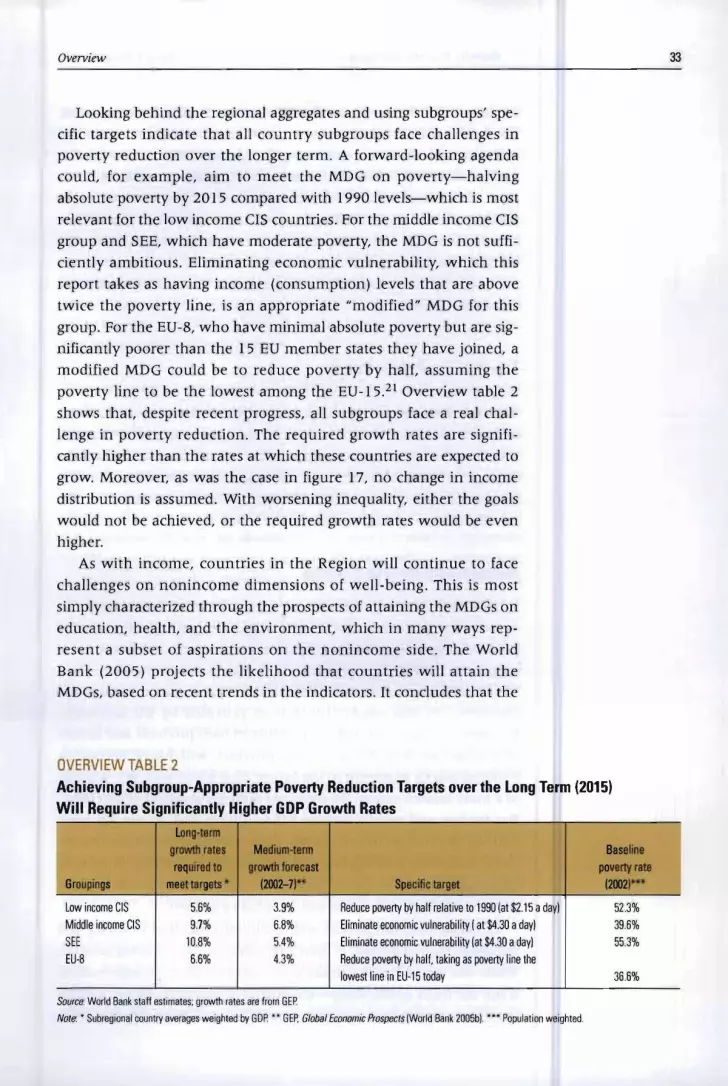

I
This report is part of a series undertaken by the Europe and Central Asia Region of
the World Bank The series draws on original data the World Banks operational
experience and the extensive literature on the Region Poverty jobs trade migration
and infrastructure will be among the topics covered


