Embed Size (px)
Citation preview
Does investing abroad affect performance at home? Comparing Italian multinational and national enterprises.
Giorgio Barba Navaretti Università di Milano and Centro Studi Luca D’Agliano
Davide Castellani*
Università di Urbino
First Draft September 2002
Abstract Foreign activities of MNEs have important effects on home economies. The debate is ambiguous: concerns that foreign investments may deplete domestic economies are often coupled with the pride for doing good business in foreign countries. This paper addresses these concerns by measuring performances at home (output, employment and TFP growth) of a sample of Italian firms which have invested abroad. The novelty of the paper is that we address the question of ‘what would have happened the firm had not invested?’. Investing firms are compared to a counterfactual of firms which have not invested abroad, constructed using propensity score matching, and we find that the formers outperform national firms with similar caractheristics. This result supports a positive causal effect of investment abroad on performance at home. Key words : multinational firms, productivity, propensity score matching JEL: F23, D21, C14 Paper prepared for the fourth conference of the TMR Network on ‘Foreign Direct Investment and the Multinational Corporation: New Theories and Evidence’, funded by the European Commission under contract FMRX-CT98-0215 to be held in Hydra, 20 & 21 September 2002 *Corresponding Author: ISE-Università di Urbino, Via Saffi, 2 – 61029 Urbino, Italy. Tel. +39 (0)722 305560. Email: [email protected]

2
Table of contents
1. Introduction 2 2. The home country effects of FDIs: which channels? 4 3. The home country effects of FDIs: empirical evidence 7 4. The evaluation problem: propensity score matching and difference- in-difference
estimators of average treatment effect 8 5. Data and construction of the counterfactual 11 6. The effects of investing abroad: results 16 7. Conclusions 19 8. References 21
1. Introduction
The activities of Multinationals (MNEs) have effects on home economies. The
laymen perceptions of these effects are mixed. They share national pride when their
MNEs do well in Fortunes’ ranking of the largest firms in the world, but they worry
when they see their companies closing down domestic plants and opening up new ones
in cheap labour countries. The issue is indeed complex and there is very little empirical
evidence supporting either the pessimist or the optimist. This paper will try to fill this
gap by looking at the performance of a sample of Italian firms and by comparing firms
that do invest abroad to firms that do not invest abroad .
How does investing abroad affect the home activities of the investing firms? First,
it has effects on the size of their domestic activities. Domestic employment and
domestic output may expand or contract depending on whether foreign activities
complement or substitute domestic ones. Second, it has effects on the way things are
done at home. The skill or the capital intensity of domestic activities may again increase
or decline depending on the relative factor intensity of the different activities carried out
by the firm and on the factor endowments of the home and foreign countries. Also,
domestic productivity may rise or decline, depending on whether foreign activities
strengthen or deplete domestic ones.
Earlier works have examined the effects on home employment (Brainard and Riker,
1997a, 1997b, Braconier and Eckholm, 2002, Konigs and Murphy, 2001, Bruno and
3
Falzoni, 2000, Blomstrom, Fors and Lipsey, 1997, Lipsey, 1999, Bassino, 1998) and
productivity (Braconier, Eckholm, Midelfart Knarvik 2001, Van Pottelsberghe de la
Potterie and Lichtenberg, 2001) of outward FDIs1. They generally find little evidence
that outward investments deplete home activities.
This paper introduces two innovations in the empirical analysis of these issues.
First, it focuses on firms that change status from national to multinational by investing
abroad for the first time, so as to single out the effects of the investment, by comparing
firms’ performance before and after the investment. Second, it compares the
performance of these firms investing abroad (henceforth MNEs), to the performance of
a counterfactual of national firms (henceforth NEs) that do not invest abroad. In fact, the
home effects of MNEs are not just relevant per se, but with respect to what would have
happened had these firms not invested abroad. Think, for example at firms in traditional
sectors like textile, facing competition from imports from cheap labour countries. For
these firms, transferring stages of production to cheap labour countries could be the
only strategy for survival. Even though home employment declines, it would have
declined even more if these firms had not invested. Albeit what would have happened
had firms not invested abroad cannot be observed, their hypothetical behaviour can be
proxied by the behaviour of a sample of other firms which have not invested.
This paper applies propensity score matching to construct an appropriate
counterfactual of NEs and uses a difference- in-difference estimator (DID) to compare
the performance of MNEs and of NEs. The performance measures analysed are growth
in output, employment and productivity.
Along with two companion papers focussing on labour demands (Barba Navaretti,
Bruno, Castellani and Falzoni, 2002) and on productivity trajectories (Castellani,
2002a), this is the first paper that uses counterfactual analysis to examine the home
effects of outward investments. Up to now, this type of approach has been used to
analyse the related issue of the impact of exporting on firms’ performance (Bernard and
Jensen, 1999, Clerides, Lach and Tybout, 1998, Aw, Chung and Roberts, 2000,
Castellani, 2001, Delgado et al., 2002, Girma , Greenaway and Kneller 2002, Kraay,
1999).
1 An exhaustive survey of this literature can be found in Barba Navaretti and Falzoni, 2003
4
The paper finds that the home performance of Italian firms that invest abroad for the
first time during the period analysed improves after the investment; it also finds that the
post-investment rate of growth of output, employment and productivity is higher than
the one observed over the same period for the counterfactual of non- investing firms.
Thus, the evidence supports the optimistic view that foreign investments do strengthen
and do not deplete economic activities at home.
The next section outlines the main channels through which foreign investments may
influence performance at home. Section three revises the available evidence on these
effects. Section 4 discusses the methodology used to construct the counterfactual of NEs
and the DID estimators. Section 5 reports the data used and the main results of the
empirical analysis. Section 6 concludes.
2. The home country effects of FDIs: which channels?
Investing abroad has effects on the level of domestic activities and on the way things
are done at home2
Effects on the level of domestic activities: output and trade. The effects of FDIs
on domestic output, whether foreign output substitutes for or complements domestic
output depends upon the nature of the investment. Vertical investments relocate stages
of production previously carried out at home and reduce the value added of domestic
production. They also have effects on trade in intermediates, in that they generate
exports and imports of semi-finished products between the home country and foreign
production bases. Exports of finished products from the home country decline when
upstream stages are transferred abroad and exports are carried out directly from the
assembly plant. Horizontal investments reduce domestic plants’ exports and therefore
output, when home and domestic products are substitute, although repatriated profits
can be viewed as payments for headquarters’ services and firm specific knowledge. In
contrast, if home and domestic products are complements, foreign affiliates may boost
domestic plants exports and outputs. Domestic output may also rise because foreign
2 This section is partly drawn from Barba Navaretti and Falzoni, 2003
5
activities make domestic production more efficient (see below) and MNEs gain market
shares
Effects on the level of domestic activities: employment. Strictly speaking,
employment is an input, but from the point of view of policy makers employment
creation is considered a key element of economic performance. Moreover, the loss of
domestic jobs is the main concern raised by outward FDIs. Changes in domestic
employment obviously match changes in domestic output. Vertical investments are
generally cost saving and often undertaken to reduce labour costs at home. The transfer
of value added abroad always impinges a reduction in domestic employment. As for
horizontal investments the relationship of substitution and complementarity between
domestic and foreign output will be mirrored in a relationship of substitution and
complementarity between foreign and domestic employment. Also, increases in
domestic output following a gain in market shares will generate increases in domestic
employment. Outward FDI, though, may also affect the labour intensity of the activities
carried out at home, for given levels of output. Labour intensity may vary in both
directions. It may decline because only capital intensive stages of production are kept at
home, or because the MNE acquires new technologies and know-how abroad,
improving in this way the efficiency of the domestic production process3. It may
increase because foreign investments must be supported by headquarter services and
larger headquarter staff4 or because domestic labour becomes more productive
compared to the other domestic inputs as foreign employment increases.
Effects on the mode of production: productivity. How do foreign subsidiaries
influence the efficiency of the parent company? We may isolate at least three reasons
why opening and running foreign subsidiaries affects domestic productivity: the
exploitation of firm-level and plant- level scale economies; the change in the
composition of inputs used in production; the opening of new channels of international
transmission and diffusion of technological and managerial knowledge. These sources
of productivity change may work in both directions: for example, home productivity
3 The decline in labour intensity for given output, may then generate gains in competitiveness , and an expansion of domestic output and employment. 4 We are not considering headquarter services as output
6
increases if the exploitation of firm-level economies of scale dominates over the
increase in unit costs due to the reduction of the scale of production in the home plant;
operating costs decline if the beneficial effect of cheaper foreign labour is not
jeopardised by the loss of vital jobs and skills at home; technology and competitiveness
improves, if foreign knowledge is acquired through spillovers, but the opposite occurs if
proprietary knowledge of the firm is dissipated through foreign production.
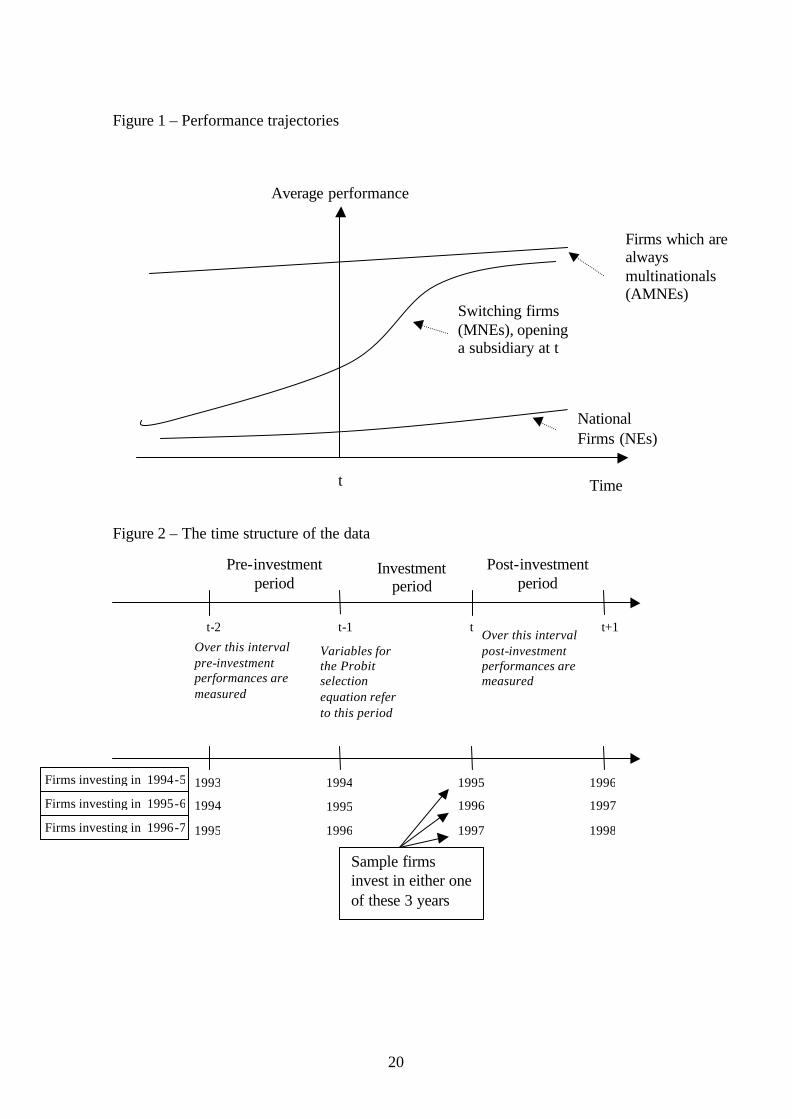
Counterfactual analysis. The home country effects of foreign investments should be
related to a benchmark: what would have happened if firms had not invested abroad.
We therefore need to compare the performance of investing firms to a counterfactual of
non investing firms. Translating Clerides, Lach and Tybout (1998) analysis of exporting
firms to the one of investing firms, in Figure 1 we draw hypothetical trajectories for
employment, output and TFP for three types of firms: those who are Always
Multinationals (AMNEs), as they have at least one foreign subsidiary in the period
observed; those who never have a foreign subsidiary in the period observed (NEs) and
those that open their first foreign subsidiary in the period observed and therefore switch
form being national into being multinational firms (MNEs) at time t. The average
performance in levels of AMNEs can be assumed to always lie above the one of NEs. A
recent work by Barba Navaretti and Falzoni (2003) based on the sample of Italian firms
analysed in this work finds robust evidence that Multinationals have employment,
output and productivity premiums over national firms. Focus now on firms changing
status, defined as MNEs. If there is self selection, switching firms are more productive
and larger than other national firms before investing. If then performance improves
because of the investment, the performance path of switching firms gets steeper in the
aftermath of the investment, or anyway relatively steeper than for the other two groups
of firms, and then it converges to the MNEs’ trajectory. Most of the benefits of the new
investment are likely to be reaped in its aftermath and we have no a priori on the
relative rate of growth of MNEs vis a vis national firms in the longer run. This is why
we focus on MNEs, i.e. firms changing status. In the empirical analysis that follows we
compare the slope of the performance path (measuring the rate of growth of
employment, output and productivity) of MNEs before and after the investment and the
slope of the performance path of MNEs to the one of NEs. As discussed below, the
7
difficulty for the empirical analysis is to single out the effect of the investment and not
to confuse it with the fact that firms with better performance self select into investing
abroad.
Figure 1 here
3. The home country effects of FDIs: empirical evidence
The empirical research on the home country effects of outward FDI has primarily
addressed the issue of whether employment or production abroad complements or
substitutes employment in parent companies. The approaches followed in the empirical
analysis are essentially two. In the first approach, the focus is on how the multinational
firm set employment in different international locations in response to changes in
relative wages. In particular, the research interest is in examining whether parent's
employment is affected differently by wage changes in low-wage countries compared
with wage changes in other high-wage regions (Brainard and Riker, 1997a, 1997b,
Braconier and Eckholm, 2000, Konigs and Murphy, 2001, Bruno and Falzoni, 2000).
Overall, the existing empirical evidence seems not to support the fear that MNEs are
exporting domestic jobs, particularly to low-wage countries. In the second approach, the
relationship between employment in the parent and foreign production is examined
testing how labour intensity of parent production changes in response to an increase in
foreign production (Blomstrom, Fors and Lipsey, 1997, Lipsey, 1999, Bassino, 1998).
A recent wave of empirical research have been focussing on the impact of foreign
investments on productivity and technology at home. Braconier, Ekholm and Midelfart
Knarvik (2001) use Swedish data to assess the impact of foreign R&D spillovers
channelled through outward and inward FDI. Their idea, which builds upon the
pioneering work on trade induced R&D spillovers by Coe and Helpman (1995), is that
the larger the inward and outward activities of multinationals and the larger the R&D
stock of the partner country the larger the spillovers from foreign R&D to domestic
operations. They find mixed evidence on outward investment induced R&D spillovers
and in particular, that the type of activity – R&D or assembly – carried out in foreign
affiliates matters significantly. Van Pottelsberghe de la Potterie and Lichtenberg, 2001
use a similar methodology, but they analyse aggregate inward and outward FDI flows
8
for 13 Oecd countries between 1971 and 1990. Their findings are that a country’s
productivity is increased by outward investments when it invests in R&D intensive
countries. Inward investments, on the contrary, channel no spillovers to the host
economy. Finally, Branstetter (2000) takes a more focussed approach and examines if
the patenting activities of a sample of Japanese firms are influenced by their foreign
operations in the US. The idea here is that R&D spillovers do not necessarily affect the
productivity of the investing firm, but they more directly impinge on innovative activity
and indeed he finds evidence of positive spillovers.
All the works discussed up to now relate foreign activities to output, employment,
skill mix and productivity changes at home, focussing just on MNEs. This type of
evidence provides just part of the picture. Firms investing abroad and becoming MNEs
face the option of not doing so. A rich literature have grown in recent years
investigating if exporting firms have higher and faster performance (productivity,
employment and output growth) than firms which only operate in national markets
(Bernard and Jensen, 1999, Clerides, Lach and Tybout, 1998, Aw, Chung and Roberts,
2000, Castellani, 2002b, Delgado et al., 2002, Girma et al. 2002, Kraay, 1999). Drawing
on the methodology developed in some of these studies, in some earlier works we
investigate the impact of the creation of foreign subsidiaries on parent company’s
productivity trajectory (Castellani, 2002a, Barba Navaretti, Castellani and Zanfei, 2002)
or labour demand (Barba Navaretti, Bruno Castellani and Falzoni, 2002) of Italian
firms. Using GMM-IV estimations to control for the endogeneity of the investment
decision, these studies seem to support both a positive productivity and employment
effect of investing abroad. In this paper we follow an alternative empirical strategy to
address the problem of endogeneity of the investment decision, and of finding the
appropriate counterfactual sample.
4. The evaluation problem: propensity score matching and difference-in-difference estimators of average treatment effect
Our aim is to evaluate the causal effect of becoming a multinational firm on
economic performance at home, y? (where y? denotes the rate of growth of
9
employment, output or total factor productivity (TFP))5. To gather this effect we need
also to understand what would have happened to the firm’s economic performance had
it not invested abroad. Let MNEit be an indicator taking value equal to one if firm i
becomes a multinational at time t (i.e. between t-1 and t). Let also 11, ?? tiy be firm i’s
post-investment performance and 01, ?? tiy the hypothetical performance achieved at t+1
had i not invested abroad. The effect of investing abroad on economic performances for
firm i would then be measured by 01,
11, ?? ??? titi yy . More formally, this average effect can
be expressed as follows6:
)1|()1|()1|(ˆ 01
11
01
11 ??????????? ???? ittittittt MNEyEMNEyEMNEyyE?
The key problem is that the last term is unobservable, i.e. we do not know what
would have been the average performance of MNEs if they had not invested. We need
to find an appropriate measure for the last term in our sample or, in other words, we
need to construct an appropriate counterfactual, based on the right control group. If we
were to run a natural experiment, we could randomly draw a sample of firms from a
population and let one half to invest and the other not to invest. This latter group would
be the appropriate control group. Unfortunately, firms choose endogenously whether to
invest or not. For example, self selection of most productive firms in the export market
is widely documented (Bernard and Jensen, 1999; Clerides et. al., 1998 among others),
as well as a technological advantage is highlighted from theory as the main driver of
foreign direct investments (Dunning, 1993, Markusen, 1995 for reviews). A path
followed in the literature to overcome self-selection is to use the Instrumental Variable
(IV) estimator7. This estimator has however the drawback that the choice of instruments
5 This is usually defined the ‘outcome’ in the evaluation literature. See Blundell and Costa Dias (1999, 2002), and Wooldridge (2002, Ch. 18) for reviews. 6 In the literature this is referred to as the average treatment effect on the treated (ATT). The original idea is derived from natural sciences, where some outcome from individuals who receive a treatment (i.e. a medical treatment) is compared to identical individuals (randomly drawn from a population) who did not receive treatment. In economics things are complicated by the fact that non-treated individuals are non-randomly selected. 7 For example, in Castellani (2002a), Barba Navaretti, Castellani and Zanfei (2002), Barba Navaretti, Castellani, Bruno and Falzoni (2002) a dynamic panel GMM-IV estimator is implemented to test the impact of foreign investments on productivity and employment.
10
is not straightforward, in particular in cross-sections, and results might be sensitive to
the choice of the instrument set8.
An alternative approach, which we follow here, is the method of matching, which
aims at re-establish the conditions of a natural experiment with non-experimental data.
Economic applications of matching estimators have been growing in recent years and
they have been used for various tasks like the evaluation of policy intervention on the
labour market (Heckman et al. 1997, Blundell et al. 2002), the impact of constitutions
on the size of governments (Persson and Tabellini, 2002), the effect of dollarization on
country’s economic growth (Edwards and Magendzo, 2001, 2002). Particulary relevant
to our paper are Girma, Greenaway and Kneller (2002) and Girma and Gorg (2002)
who evaluate the effects of exporting and of acquisitions on firms’ performances and
returns to scale.
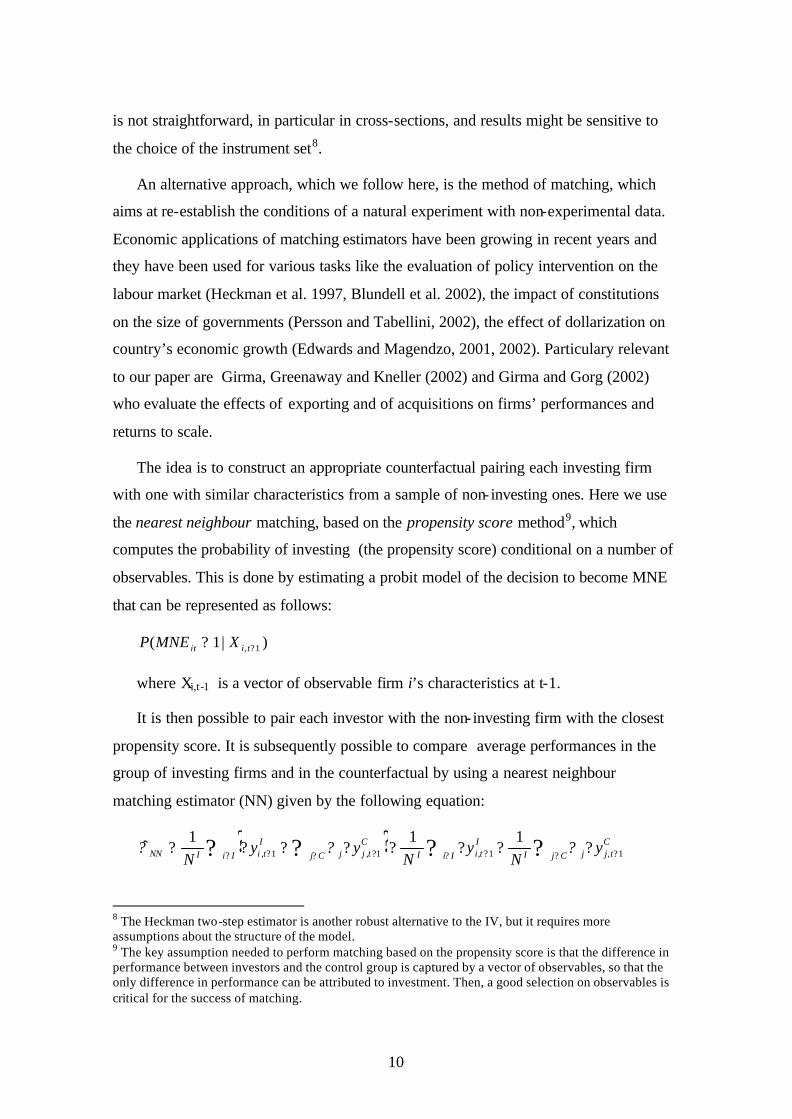
The idea is to construct an appropriate counterfactual pairing each investing firm
with one with similar characteristics from a sample of non- investing ones. Here we use
the nearest neighbour matching, based on the propensity score method9, which
computes the probability of investing (the propensity score) conditional on a number of
observables. This is done by estimating a probit model of the decision to become MNE
that can be represented as follows:
)|1( 1, ?? tiit XMNEP
where Xi,t -1 is a vector of observable firm i’s characteristics at t-1.
It is then possible to pair each investor with the non- investing firm with the closest
propensity score. It is subsequently possible to compare average performances in the
group of investing firms and in the counterfactual by using a nearest neighbour
matching estimator (NN) given by the following equation:
? ? ??? ? ? ?? ?? ? ?? ????????Cj
CtjjIIi
ItiIIi Cj
Ctjj
ItiINN y
Ny
Nyy
N 1,1,1,1,
111ˆ ???
8 The Heckman two-step estimator is another robust alternative to the IV, but it requires more assumptions about the structure of the model. 9 The key assumption needed to perform matching based on the propensity score is that the difference in performance between investors and the control group is captured by a vector of observables, so that the only difference in performance can be attributed to investment. Then, a good selection on observables is critical for the success of matching.
11
where NI is the number of investing firms, C is the set of controls matched and
j? denotes the number of investors matched to control j. Since we constrained the sum
of weights ( j? ) to equal NI, it is straightforward to see that in this case NN? is given by
the comparison of the mean performances of the group of investing firms and of the
weighted mean of control group.
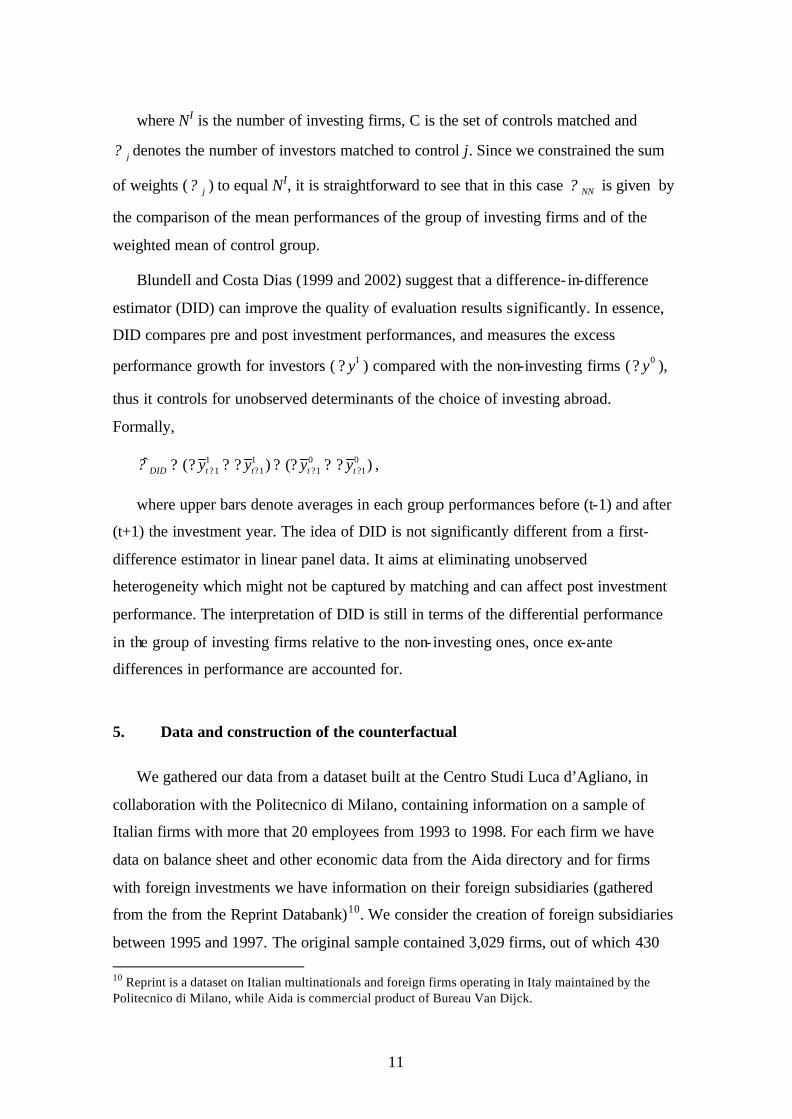
Blundell and Costa Dias (1999 and 2002) suggest that a difference- in-difference
estimator (DID) can improve the quality of evaluation results significantly. In essence,
DID compares pre and post investment performances, and measures the excess
performance growth for investors ( 1y? ) compared with the non-investing firms ( 0y? ),
thus it controls for unobserved determinants of the choice of investing abroad.
Formally,
)()(ˆ 01
01
11
11 ???? ???????? ttttDID yyyy? ,
where upper bars denote averages in each group performances before (t-1) and after
(t+1) the investment year. The idea of DID is not significantly different from a first-
difference estimator in linear panel data. It aims at eliminating unobserved
heterogeneity which might not be captured by matching and can affect post investment
performance. The interpretation of DID is still in terms of the differential performance
in the group of investing firms relative to the non- investing ones, once ex-ante
differences in performance are accounted for.
5. Data and construction of the counterfactual
We gathered our data from a dataset built at the Centro Studi Luca d’Agliano, in
collaboration with the Politecnico di Milano, containing information on a sample of
Italian firms with more that 20 employees from 1993 to 1998. For each firm we have
data on balance sheet and other economic data from the Aida directory and for firms
with foreign investments we have information on their foreign subsidiaries (gathered
from the from the Reprint Databank)10. We consider the creation of foreign subsidiaries
between 1995 and 1997. The original sample contained 3,029 firms, out of which 430 10 Reprint is a dataset on Italian multinationals and foreign firms operating in Italy maintained by the Politecnico di Milano, while Aida is commercial product of Bureau Van Dijck.
12
were preliminary dropped since no data on employment, output or TFP were available
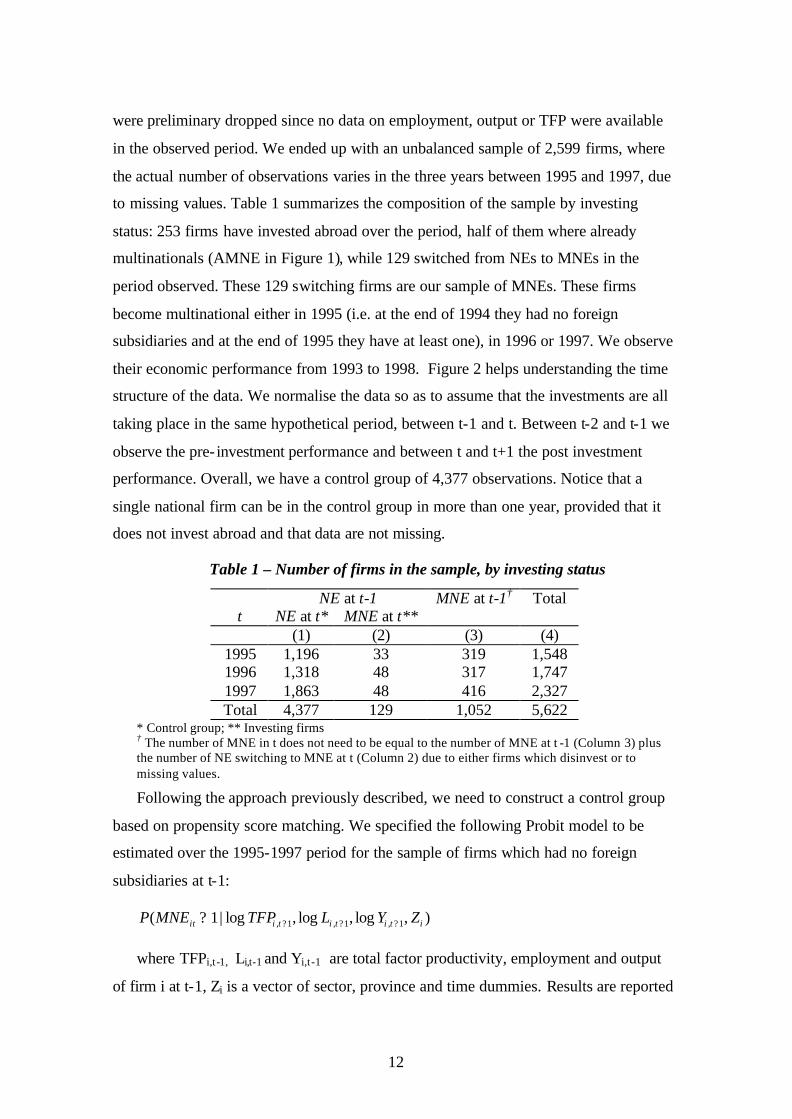
in the observed period. We ended up with an unbalanced sample of 2,599 firms, where
the actual number of observations varies in the three years between 1995 and 1997, due
to missing values. Table 1 summarizes the composition of the sample by investing
status: 253 firms have invested abroad over the period, half of them where already
multinationals (AMNE in Figure 1), while 129 switched from NEs to MNEs in the
period observed. These 129 switching firms are our sample of MNEs. These firms
become multinational either in 1995 (i.e. at the end of 1994 they had no foreign
subsidiaries and at the end of 1995 they have at least one), in 1996 or 1997. We observe
their economic performance from 1993 to 1998. Figure 2 helps understanding the time
structure of the data. We normalise the data so as to assume that the investments are all
taking place in the same hypothetical period, between t-1 and t. Between t-2 and t-1 we
observe the pre- investment performance and between t and t+1 the post investment
performance. Overall, we have a control group of 4,377 observations. Notice that a
single national firm can be in the control group in more than one year, provided that it
does not invest abroad and that data are not missing.
Table 1 – Number of firms in the sample, by investing status
NE at t-1 MNE at t-1† Total t NE at t* MNE at t** (1) (2) (3) (4)
1995 1,196 33 319 1,548 1996 1,318 48 317 1,747 1997 1,863 48 416 2,327 Total 4,377 129 1,052 5,622
* Control group; ** Investing firms † The number of MNE in t does not need to be equal to the number of MNE at t -1 (Column 3) plus the number of NE switching to MNE at t (Column 2) due to either firms which disinvest or to missing values.
Following the approach previously described, we need to construct a control group
based on propensity score matching. We specified the following Probit model to be
estimated over the 1995-1997 period for the sample of firms which had no foreign
subsidiaries at t-1:
),log,log,log|1( 1,1,1, itititiit ZYLTFPMNEP ????
where TFPi,t -1, Li,t-1 and Yi,t -1 are total factor productivity, employment and output
of firm i at t-1, Zi is a vector of sector, province and time dummies. Results are reported
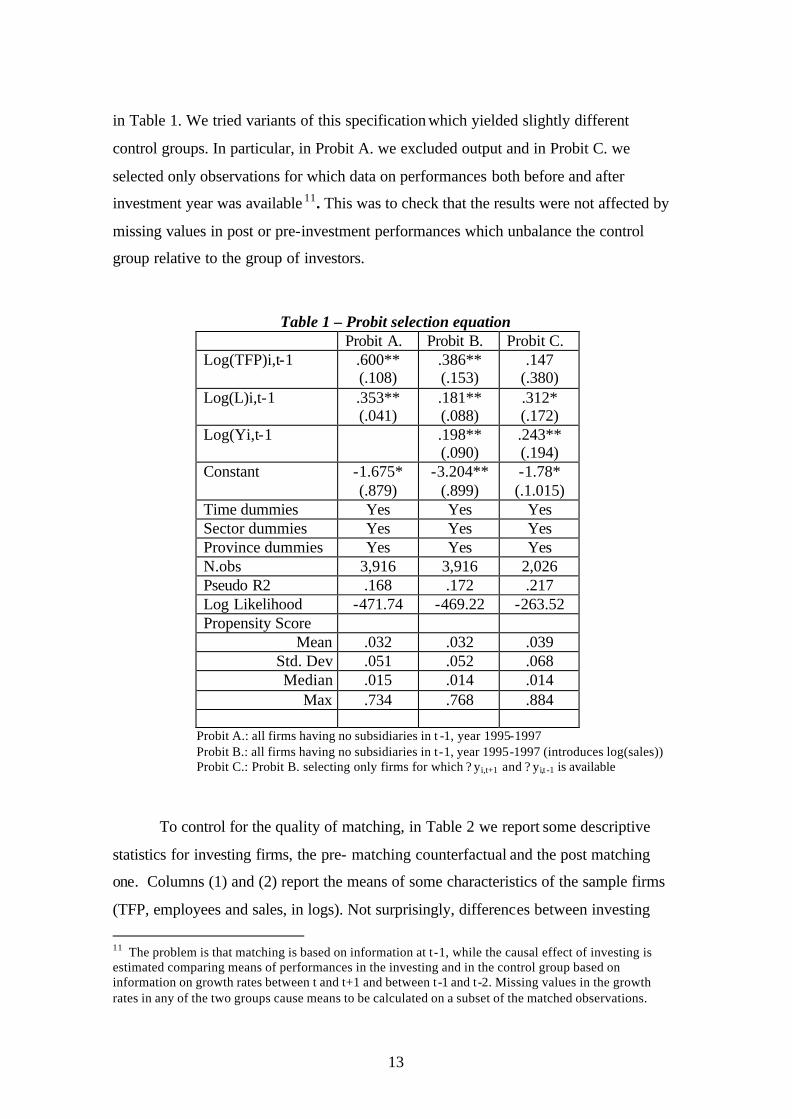
13
in Table 1. We tried variants of this specification which yielded slightly different
control groups. In particular, in Probit A. we excluded output and in Probit C. we
selected only observations for which data on performances both before and after
investment year was available 11. This was to check that the results were not affected by
missing values in post or pre-investment performances which unbalance the control
group relative to the group of investors.
Table 1 – Probit selection equation Probit A. Probit B. Probit C. Log(TFP)i,t-1 .600**
(.108) .386** (.153)
.147 (.380)
Log(L)i,t-1 .353** (.041)
.181** (.088)
.312* (.172)
Log(Yi,t-1 .198** (.090)
.243** (.194)
Constant -1.675* (.879)
-3.204** (.899)
-1.78* (.1.015)
Time dummies Yes Yes Yes Sector dummies Yes Yes Yes Province dummies Yes Yes Yes N.obs 3,916 3,916 2,026 Pseudo R2 .168 .172 .217 Log Likelihood -471.74 -469.22 -263.52 Propensity Score
Mean .032 .032 .039 Std. Dev .051 .052 .068 Median .015 .014 .014
Max .734 .768 .884
Probit A.: all firms having no subsidiaries in t -1, year 1995-1997 Probit B.: all firms having no subsidiaries in t-1, year 1995-1997 (introduces log(sales)) Probit C.: Probit B. selecting only firms for which ? yi,t+1 and ? yi,t -1 is available
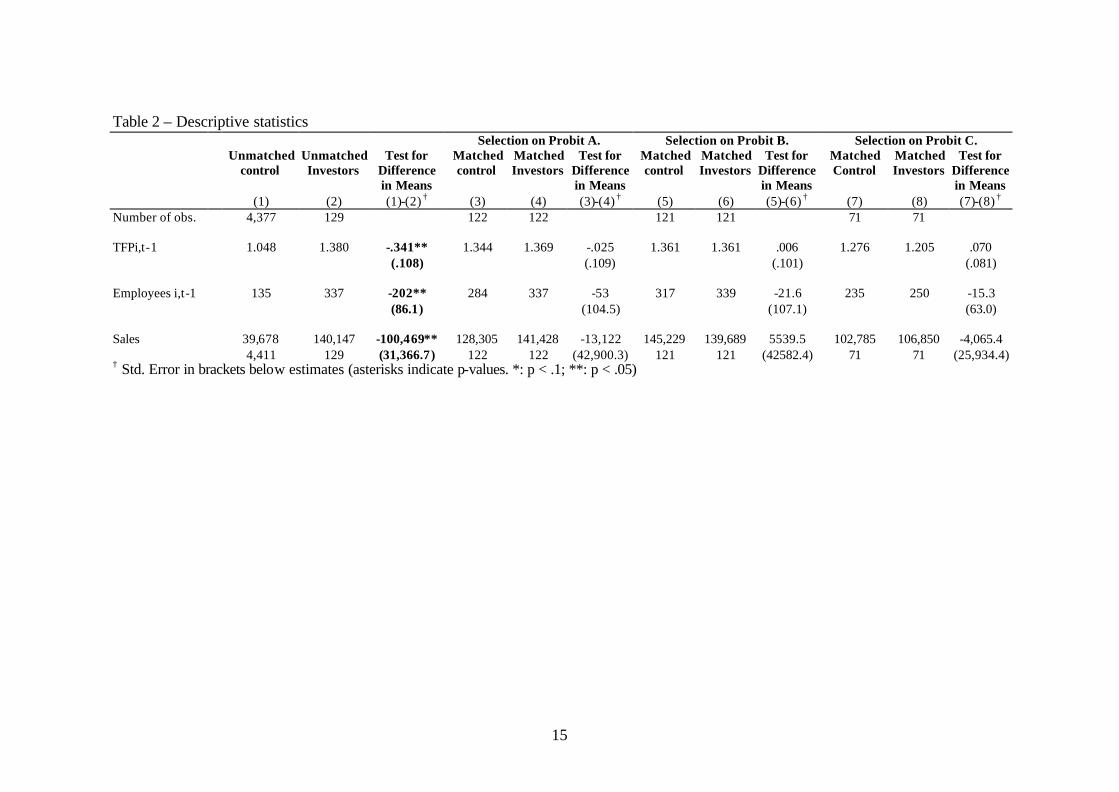
To control for the quality of matching, in Table 2 we report some descriptive
statistics for investing firms, the pre- matching counterfactual and the post matching
one. Columns (1) and (2) report the means of some characteristics of the sample firms
(TFP, employees and sales, in logs). Not surprisingly, differences between investing
11 The problem is that matching is based on information at t-1, while the causal effect of investing is estimated comparing means of performances in the investing and in the control group based on information on growth rates between t and t+1 and between t-1 and t-2. Missing values in the growth rates in any of the two groups cause means to be calculated on a subset of the matched observations.
14
firms and the control group are marked. Investing firms are larger (twice the size in
terms of sales and 20% in terms of employees) and more productive (TFP is about 25%
higher). As we illustrated in the previous section these difference suggest self-selection
of investing firms, which in turn is likely to bias the evaluation of the causal impact of
the decision to invest on economic performance. Note that, as expected, differences in
the characteristics of the two groups disappear after matching (Columns (3) to (8)12.
12 Matching is performed in Stata 7 using the – psmatch – command developed by Sianesi (2001).
15
Table 2 – Descriptive statistics Selection on Probit A. Selection on Probit B. Selection on Probit C. Unmatched
control Unmatched Investors
Test for Difference in Means
Matched control
Matched Investors
Test for Difference in Means
Matched control
Matched Investors
Test for Difference in Means
Matched Control
Matched Investors
Test for Difference in Means
(1) (2) (1)-(2) † (3) (4) (3)-(4) † (5) (6) (5)-(6) † (7) (8) (7)-(8) † Number of obs. 4,377 129 122 122 121 121 71 71 TFPi,t-1 1.048 1.380 -.341** 1.344 1.369 -.025 1.361 1.361 .006 1.276 1.205 .070 (.108) (.109) (.101) (.081) Employees i,t-1 135 337 -202** 284 337 -53 317 339 -21.6 235 250 -15.3 (86.1) (104.5) (107.1) (63.0) Sales 39,678 140,147 -100,469** 128,305 141,428 -13,122 145,229 139,689 5539.5 102,785 106,850 -4,065.4 4,411 129 (31,366.7) 122 122 (42,900.3) 121 121 (42582.4) 71 71 (25,934.4) † Std. Error in brackets below estimates (asterisks indicate p-values. *: p < .1; **: p < .05)
16
6. The effects of investing abroad: results
We now use the matched sample to estimate the causal impact of the creation of
foreign subsidiaries on firms’ performances. We use both the standard nearest
neighbour matching estimator (NN) and the difference- in-difference (DID) estimator on
the matched sample described in section 3. Our outcome variables are three indicators
of firms’ economic performances: TFP growth, employment growth and output
(measured by total sales) growth. There are obvious relations among these three
indicators, such as for example the effect of an expansion in output on employment
growth and on productive efficiency (through economies of scale), or the impact of an
increase in TFP on output growth (through an increase of international competitiveness
or employment (through factor mix reallocation), which we leave for further
investigation. Here we just concentrate on a robust estimation of the partial effect of
investing abroad on the three indicators, without discussing the channels through which
these effects occur.
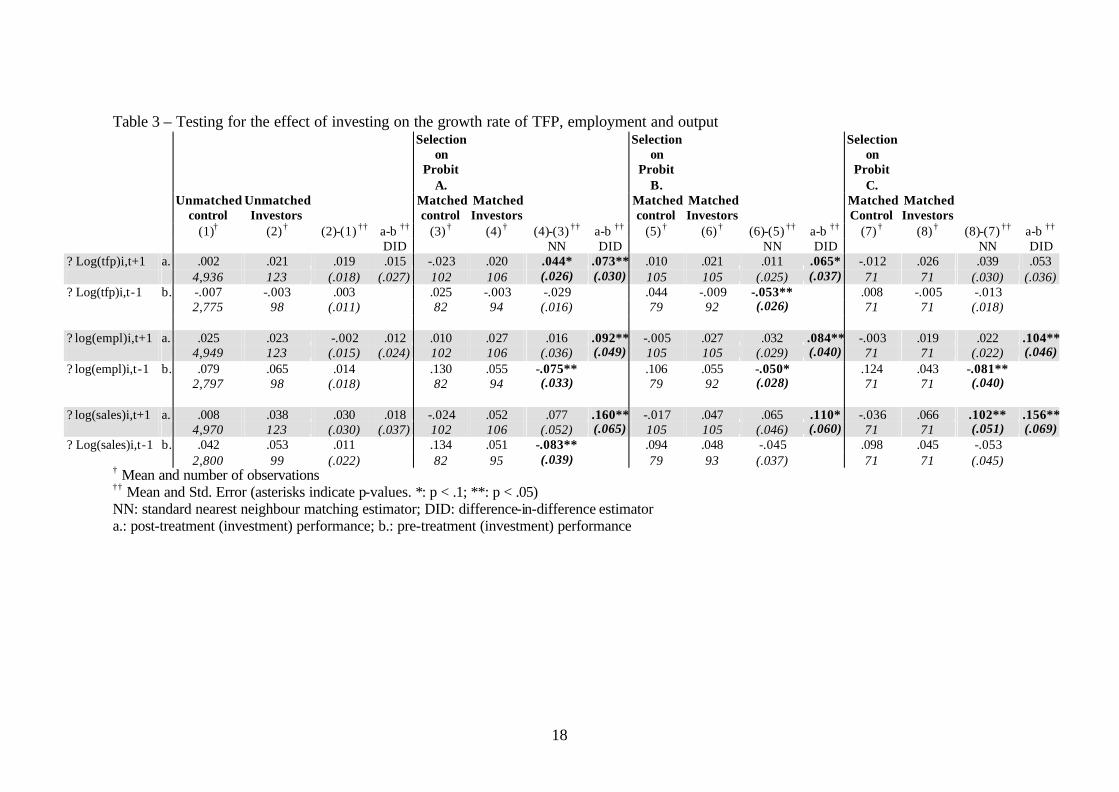
The economic performance of investing firms is not significantly different from the
unmatched sample of non- investing firms (column 1 and 2 of Table 3). On the contrary,
matching estimators provide some evidence that investing abroad causes an increase in
economic performance. In particular, DID estimates suggest that investing firms have
better performance than firms with similar characteristics but did not invest abroad. TFP
growth is between 5.3 and 7 % higher (according to specification used for the selection
Probit), employment growth between 8.4-10% higher and sales growth by 10-16%
higher13. Overall, these results support the need for an accurate choice of the
counterfactual group, in order to take into account the self-selection problems that
occurs with non-experimental data, and confirm that matching estimators can improve
accuracy of the evaluation.
It is worth mentioning that standard NN yields lower causal effect of investing on
performances then DID and, in many cases it turns out non significantly different from
zero. This result is consistent with the view that DID can improve upon standard
13 These results are also rather robust to the different specifications of the Probit.

17
matching estimators as it controls for unobserved heterogeneity in performances of
investing firms as opposed to non-investing ones (Blundell and Costa Dias, 1999,
2002).
18
Table 3 – Testing for the effect of investing on the growth rate of TFP, employment and output Selection
on Probit
A.
Selection on
Probit B.
Selection on
Probit C.
Unmatched control
Unmatched Investors
Matched control
Matched Investors
Matched control
Matched Investors
Matched Control
Matched Investors
(1)† (2) † (2)-(1) †† a-b †† (3) † (4) † (4)-(3) †† a-b †† (5) † (6) † (6)-(5) †† a-b †† (7) † (8) † (8)-(7) †† a-b †† DID NN DID NN DID NN DID ? Log(tfp)i,t+1 a. .002 .021 .019 .015 -.023 .020 .044* .073** .010 .021 .011 .065* -.012 .026 .039 .053 4,936 123 (.018) (.027) 102 106 (.026) (.030) 105 105 (.025) (.037) 71 71 (.030) (.036) ? Log(tfp)i,t-1 b. -.007 -.003 .003 .025 -.003 -.029 .044 -.009 -.053** .008 -.005 -.013 2,775 98 (.011) 82 94 (.016) 79 92 (.026) 71 71 (.018) ? log(empl)i,t+1 a. .025 .023 -.002 .012 .010 .027 .016 .092** -.005 .027 .032 .084** -.003 .019 .022 .104** 4,949 123 (.015) (.024) 102 106 (.036) (.049) 105 105 (.029) (.040) 71 71 (.022) (.046) ? log(empl)i,t-1 b. .079 .065 .014 .130 .055 -.075** .106 .055 -.050* .124 .043 -.081** 2,797 98 (.018) 82 94 (.033) 79 92 (.028) 71 71 (.040) ? log(sales)i,t+1 a. .008 .038 .030 .018 -.024 .052 .077 .160** -.017 .047 .065 .110* -.036 .066 .102** .156** 4,970 123 (.030) (.037) 102 106 (.052) (.065) 105 105 (.046) (.060) 71 71 (.051) (.069) ? Log(sales)i,t-1 b. .042 .053 .011 .134 .051 -.083** .094 .048 -.045 .098 .045 -.053 2,800 99 (.022) 82 95 (.039) 79 93 (.037) 71 71 (.045)
† Mean and number of observations †† Mean and Std. Error (asterisks indicate p-values. *: p < .1; **: p < .05) NN: standard nearest neighbour matching estimator; DID: difference-in-difference estimator a.: post-treatment (investment) performance; b.: pre-treatment (investment) performance
19
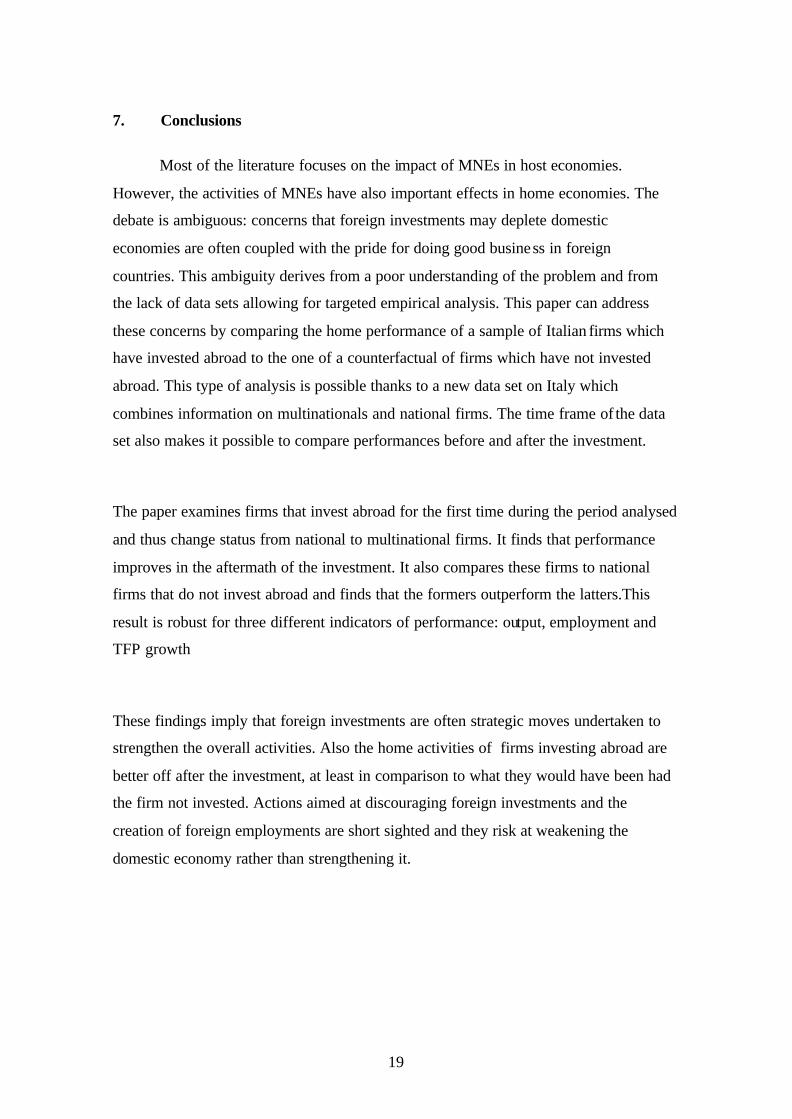
7. Conclusions
Most of the literature focuses on the impact of MNEs in host economies.
However, the activities of MNEs have also important effects in home economies. The
debate is ambiguous: concerns that foreign investments may deplete domestic
economies are often coupled with the pride for doing good business in foreign
countries. This ambiguity derives from a poor understanding of the problem and from
the lack of data sets allowing for targeted empirical analysis. This paper can address
these concerns by comparing the home performance of a sample of Italian firms which
have invested abroad to the one of a counterfactual of firms which have not invested
abroad. This type of analysis is possible thanks to a new data set on Italy which
combines information on multinationals and national firms. The time frame of the data
set also makes it possible to compare performances before and after the investment.
The paper examines firms that invest abroad for the first time during the period analysed
and thus change status from national to multinational firms. It finds that performance
improves in the aftermath of the investment. It also compares these firms to national
firms that do not invest abroad and finds that the formers outperform the latters.This
result is robust for three different indicators of performance: output, employment and
TFP growth
These findings imply that foreign investments are often strategic moves undertaken to
strengthen the overall activities. Also the home activities of firms investing abroad are
better off after the investment, at least in comparison to what they would have been had
the firm not invested. Actions aimed at discouraging foreign investments and the
creation of foreign employments are short sighted and they risk at weakening the
domestic economy rather than strengthening it.
20
Time
Average performance
t
Switching firms (MNEs), opening a subsidiary at t
Figure 1 – Performance trajectories
Figure 2 – The time structure of the data
t-2
Variables for the Probit selection equation refer to this period
t t+1
Investmentperiod
Over this interval post-investment performances are measured
Over this interval pre-investment performances are measured
1993 1994 1995 1996
1995 1996 1997
1995 1996 1997 1998
1994
Pre-investment period
Post-investment period
t-1
Firms which are always multinationals (AMNEs)
National Firms (NEs)
Sample firms invest in either one of these 3 years
Firms investing in 1994-5
Firms investing in 1995-6
Firms investing in 1996-7
21
References
Aw B., Chung S., Roberts M. (2000) Productivity and the Decision to Export: Micro Evidence from Taiwan and South Korea, World Bank Economic Review, 14, 1, 65-90.
Barba Navaretti G. Bruno G., Castellani D. and Falzoni A. (2002) “Does Investing Abroad Create or Destroy Jobs at Home? The case of Italian Multinationals”, Paper presented at the CEPR/LdA Workshop on “Labour Market Effects of European Foreign Investment”, Turin, 10/11 May 2002.
Barba Navaretti G., Castellani D., Zanfei A. (2002) Foreign Investments and Productivity. A Comparative Analysis of Italy, France and Spain, mimeo.
Barba Navaretti G., Falzoni A. (2003) “Home country effects of Foreign Direct Investment”, mimeo.
Bernard A., Jensen B. (1999a) "Exceptional Exporter Performance: Cause, Effect or Both?", Journal of International Economics, 47, 1-25.
Blomstrom M., Fors G., Lipsey R. (1997) ‘Foreign direct investment and employment: Home country experience in the United States and Sweden’. The Economic Journal 107, 1787-1797.
Blundell R., Costa Dias M. (2000) “Evaluation Methods for Non-Experimental Data”, Fiscal Studies, 21, 4, 427-468.
Blundell R., Costa Dias M. (2002) “Alternative Approached to Evaluation in Empirical Microeconomics”, Cemmap Working Paper CWP 10/02.
Blundell R., Costa Dias M., Meghir C., Van Reenen J. (2001) “Evaluating the Employment Impact of a Mandatory Job Search Assistance Program”, IFS Working Paper 01/20.
Braconier H., Ekholm K., Midelfart Knarvik K. (2001) “In Search of FDI-Transmitted R&D Spillovers: A Study Based on Swedish Data”, Weltwirtshaftliches Archiv, 137, 4,
Braconier H., Ekholm K., (2000) ‘Swedish multinationals and competition from high- and low-wage locations’. Review of International Economics 8, 448-461.
Braconier H., Ekholm K., (2002) "Competition for Multinational Activity in Europe: The Role Played by Wages and Market Size", mimeo.
Brainard L., Riker D. (1997a) ‘Are US multinationals exporting US jobs?. NBER Working Paper No. 5958.
Brainard L., Riker D. (1997b) ‘US multinationals and competition from low-wage countries’. NBER Working Paper No. 5959.
Branstetter L. (2000) “Is Foreign Direct Investment a Channel of Knowledge Spillovers? Evidence from Japan’s FDI in the United States” NBER Working Paper No.8015, November
22
Bruno G., Falzoni A. (2000), "Multinational corporations, wages and employment: Do adjustment costs matter?", CEPR Discussion Paper No. 2471.
Castellani D (2002a) “Firms’ technological trajectories and the creation of foreign subsidiaries”, International Review of Applied Economics, 16, 3.
Castellani D. (2002b) “Export behavior and productivity growth: evidence from Italian manufacturing firms”, Welwirtshaftliches Archiv, 138, 4
Clerides S.K., Lach S., Tybout J.R (1998) "Is Learning by Exporting Important? Micro-Dynamic evidence from Colombia, Mexico, and Morocco", Quarterly Journal of Economics, August, 903-48.
Coe D., Helpman E. (1995), “International R&D Spillovers”, European Economic Review 39, pp. 859-887
Delgado M., Farinas J., Ruano S. (2002) “Firm productivity and export markets: a non-parametric approach”, Journal of international Economics, 57, 397-422.
Dunning J. (1993) Multinational Enterprises and the Global Economy, Addison Wesley, Wokingham, England.
Edwards S., Magendzo I. (2002) A currency of one’s own. An empirical investigation on dollarization and independent currency unions”,mimeo.
Girma S., Gorg H. (2002) “Foreign Ownership, Returns to Scale and Productivity: Evidence from UK Manufacturing Establishments”, Paper presented at the CEPR/LdA Workshop on “Labour Market Effects of European Foreign Investment”, Turin, 10/11 May 2002.
Girma S., Greenaway D., Kneller R. (2002) “Does exporting lead to better performance? A microeconometric analysis of matched firms?”, mimeo.
Heckman J., Ichimura H., Todd P. (1997) “Matching as an Econometric Evaluation Estimator: Evidence from Evaluating a Job Training Program, Review of Economic Studies, 64, 605-654.
Konings J., Murphy A. (2001), "Do multinational enterprises substitute parent jobs for foreign ones? Evidence from European firm-level panel data", CEPR Discussion Paper No. 2972.
Kraay A. (1999) “Exports and Economic Performance: Evidence from a Panel of Chinese Enterprises”, Revue d’Economie du Developpement, 1-2/1999, pp. 183-207.
Lipsey R.E. (1999) ‘Foreign production by US firms and parent firm employment’. NBER Working Paper No. 7357.
Markusen J. (1995) “The boundaries of multinational firms and the theory of international trade”, Journal of Economic Perspectives, 92, 169-189.
Persson T., Tabellini G. (2002) “Do constitutions cause large governements? Quasi-experimental evidence, European Economic Review, 46, 908-918.
Sianesi B. (2001) “Implementing Propensity Score Matching Estimators with Stata” UK Stata Userrs Group, VII Meeting, London, May 2001.

23
van Pottelsberghe de la Potterie B., Lichtenberg F. (2001) “Does Foreign Direct Investment Transfer Technology Across Borders?”, Review of Economics and Statistics, forthcoming.
Wooldridge J. (2002) Econometric Analysis of Cross Section and Panel Data, MIT Press.