Embed Size (px)
Citation preview

Australian Institute of Health and Welfare Canberra
Cat. no. PHE 133
Drinking patterns in Australia, 2001–2007
December 2010

© Australian Institute of Health and Welfare 2010 This work is copyright. Apart from any use as permitted under the Copyright Act 1968, no part may be reproduced without prior written permission from the Australian Institute of Health and Welfare. Requests and enquiries concerning reproduction and rights should be directed to the Head of the Communications, Media and Marketing Unit, Australian Institute of Health and Welfare, GPO Box 570, Canberra ACT 2601. A complete list of the Institute’s publications is available from the Institute’s website <www.aihw.gov.au>. ISBN 978-1-74249-100-4
Suggested citation
Australian Institute of Health and Welfare 2010. Drinking patterns in Australia, 2001-2007. Cat. no. PHE 133. Canberra: AIHW.
Australian Institute of Health and Welfare
Board Chair Hon. Peter Collins, AM, QC Director Penny Allbon Any enquiries about or comments on this publication should be directed to: Population Health Unit Australian Institute of Health and Welfare GPO Box 570 Canberra ACT 2601 Phone: (02) 6244 1000 Published by the Australian Institute of Health and Welfare
The Australian Institute of Health and Welfare is Australia’s national health and welfare statistics and information agency. The Institute’s mission is
better information and statistics for better health and wellbeing.
Please note that there is the potential for minor revisions of data in this report. Please check the online version at <www.aihw.gov.au> for any amendments.

iii
Contents
Acknowledgments.............................................................................................................................. iv Symbols and definitions.................................................................................................................... v Summary .............................................................................................................................................. vi 1 Introduction....................................................................................................................................1 2 Prevalence of alcohol consumption ...........................................................................................3
2.1 Prevalence of recent alcohol consumption ...........................................................................3 2.2 Alcohol consumption and risk levels ....................................................................................6 2.3 Correlates of alcohol use ......................................................................................................10 2.4 Determinants of risky alcohol consumption ......................................................................17
3 Alcohol-related harm..................................................................................................................21 3.1 Incidence of physical or verbal abuse by someone affected by alcohol .........................21 3.2 Perception and knowledge about alcohol-related harm ..................................................22
4 Type of alcohol consumed.........................................................................................................25 4.1 Trends in preference for alcoholic beverages.....................................................................25 4.2 Relative consumption of alcohol beverages .......................................................................27
5 Alcohol and young people ........................................................................................................30 5.1 Alcohol consumption in young people...............................................................................30 5.2 Availability of alcohol to young people..............................................................................31
Appendix A Survey design and limitations...........................................................................33 Appendix B Additional tables..................................................................................................38 References............................................................................................................................................48
iv
Acknowledgments
The authors of this report were Pramod Adhikari, David Batts, and Tim Harrold, from the Drug Surveys and Services Unit and Population Health Unit at the Australian Institute of Health and Welfare.
Mark Cooper-Stanbury provided advice on the design, content and statistical analysis, and undertook overall editing.
The authors also acknowledge the support provided by staff in the Institute’s Information Services and Publishing Unit and Media and Communications Unit.
This report was funded by DrinkWise Australia. The 2001, 2004 and 2007 National Drug Strategy Household Surveys on which the report is based were mostly funded by the Australian Government Department of Health and Ageing.

v
Symbols and definitions
Symbols Symbol Explanation
— zero
<0.1 non-zero estimate less than 0.1%
. . not applicable—no valid entry
* estimate has a relative standard error greater than 50%
RSE relative standard error
Note: Statistical significance based on a normal model 2-tailed test, α = 0.05.
Definitions ‘Recent use’ is equivalent to ‘use in the previous 12 months’ and the terms are used interchangeably. Both terms refer to the 12 months before completion of the survey.

vi
Summary
This report is based on the three most recent National Drug Strategy Household Surveys; namely 2001, 2004 and 2007. Using these surveys, the report looks at the trends in alcohol consumption, alcohol-related harm, alcohol beverage of choice, and under-age drinking. Using the 2007 data, the paper identifies factors that are associated with short-term risky or high-risk drinking behaviour. The major findings are summarised here.
Alcohol consumption • The trends in recent alcohol consumption have remained fairly similar over the years:
around 83% of all Australians aged 14 years or over were recent alcohol drinkers. • Proportionately more drinkers were found among the employed, people from
socioeconomically advantaged areas, and people from Remote and Very remote areas.
Youth alcohol consumption (aged 14–17 years) • Alcohol consumption by young people has slightly declined from 66% in 2001 to 62% in
2007. • More than seven in ten young people sourced their alcohol from friends or parents, and
nine in ten young drinkers report that it is very easy or fairly easy to obtain alcohol.
Type of alcohol consumed • The most preferred alcoholic beverage among male drinkers was regular-strength beer,
and among females it was bottled wine. • In 2007, on a typical day, Australians aged 14 years or over consumed 28 million
standard drinks. The two beverages consumed most in terms of standard drinks were bottled wine (29%) and regular-strength beer (28%).
Determinants of short-term risky alcohol consumption • Using a statistical technique that takes many factors into account simultaneously, an
increased propensity for risky or high-risk drinking in the short term was seen to be associated with youthfulness, smoking daily, and having most friends that also drink.
• Again accounting for other factors, a reduced propensity for risky or high-risk drinking in the short term was associated with being male, speaking a language other than English at home, and higher education.
• Employment status and family type had no statistically significant effect on the propensity for risky or high-risk drinking.

1
1 Introduction
1.1 Purpose of the report This report presents analysis of the alcohol-related data from the three most recent National Drug Strategy Household (NDSH) Surveys (2001, 2004 and 2007). To gain a comprehensive and in-depth understanding of the prevalence and patterns of alcohol consumption among Australians over the years 2001, 2004 and 2007, the report aims to determine the: • prevalence of drinkers and non-drinkers in each sex and age group, and the statistical
reliability of these estimates • correlates of Australian drinkers and non-drinkers and patterns of consumption in each
sex and age group • prevalence rates of long-term ‘low-risk’, ‘risky’ and ‘high-risk’ drinking in each sex and
age group, and the statistical reliability of these estimates • prevalence rates of short-term ‘low-risk’, ‘risky’ and ‘high-risk’ drinking in each sex and
age group, and the statistical reliability of these estimates • alcohol consumption variation according to sex, age group, SES, location and household
income • incidence of alcohol-related harm in each sex and age group, and the statistical reliability
of these estimates • perceptions of short-term and long-term harm by sex and age group • perceptions, knowledge and attitudes toward alcohol-related harm by sex, age group
and SES • relative consumption of wine, beer and spirits for each sex and age group • alcoholic beverage of choice for each sex and age group • perceptions of the ease of obtaining alcohol by sex and SES for the under-age and their
usual source.
1.2 Background The NDSH Surveys are a series of cross-sectional surveys that are designed to provide data on alcohol and other drug use in Australia. The surveys also measure support for policy initiatives, perceptions of alcohol and other drug-related harms and to identify groups with a high risk for drug abuse.
The surveys are conducted 3-yearly by the Australian Institute of Health and Welfare (AIHW), and are predominantly funded by the Australian Government Department of Health and Ageing.
Generally, the summary reports arising from the surveys are unable to provide information that reflects the richness of the full data sets. The analysis reported is primarily focused on descriptions of consumption patterns. This report aims to expand on the alcohol-related analysis reported and to explore factors associated with risky levels of alcohol drinking.

2
The National Alcohol Strategy 2006–2009 (MCDS 2006), now extended to 2011, notes ‘Australia’s drinking cultures are driven by a mix of powerful, intangible social forces—such as habits, customs, images and norms, and other interlocking and equally powerful tangible forces relating to the social, economic and physical availability of alcohol—such as promotion and marketing, age restrictions, price, outlets, hours of access and service practices’.
1.3 Comparability of surveys The analysis undertaken for this report was drawn from the 2001, 2004 and 2007 NDSH Surveys. The questionnaires used for each survey were similar, with some structural changes and a few questions added or changed. For example, income questions were asked in the form of income ranges, due to the sensitive nature of the subject matter. The ranges used have changed from survey-to-survey to reflect the changed income levels.
Where changes in survey questionnaires have affected the analysis, results are shown as ‘..’ (not applicable).
1.4 Consumption versus risk In this report, consumption is categorised as alcohol drinking by frequency: daily, weekly, less than weekly, not in the previous 12 months, never. These categories are usually brought together to form a dichotomous, drinkers and non-drinkers, analysis.
By contrast, ‘risk’ has been categorised as alcohol drinking consistent with short or long-term harm: high risk, risky, low risk, not in the previous 12 months, never (sometimes presented as high risk and risky, low risk, and non-drinkers).
The non-drinker categories—not in the previous 12 months and never—represent the same people for both consumption and risk.
The risk categories are based on the 2001 Australian Alcohol Guidelines (NHMRC 2001). The 2009 guidelines were not used as the survey concept and questions were designed to report against the earlier guidelines.
1.5 Structure of the report Chapter 2 presents the findings of the prevalence of recent alcohol consumers, risky alcohol consumers, the correlates of risky alcohol consumption and the findings of a regression model to determine the correlates of risky alcohol consumption.
Chapter 3 examines various aspects of alcohol-related harm.
Chapter 4 analyses the preferences for different types of alcoholic beverages.
Chapter 5 presents information on alcohol and young people, in particular, consumption patterns and availability of alcoholic drinks to those aged 14–17 years.
The appendixes include more detailed tables, a discussion of the survey methodology and some of the factors that may influence the accuracy and generalisability of the report’s analysis.

3
2 Prevalence of alcohol consumption
This chapter presents alcohol consumption in the dichotomous form of drinkers and non-drinkers. This measure of consumption is analysed by age group, sex, and year. Various population characteristics are added to the analysis to gain an appreciation for the differences in subpopulations.
2.1 Prevalence of recent alcohol consumption A recent alcohol drinker is a respondent that had drunk at least a full serve of alcohol at some time in the last 12 months. A non-drinker has either never consumed a full glass of alcohol, or, if consumed, then it was not in the previous 12 months. By definition, all ex-drinkers that have abstained from alcohol for the past year are grouped as non-drinkers in the analysis. The data show that 8 in 10 Australians aged 14 years or older are recent drinkers (Table 2.1). This statistic has remained largely unchanged at each of the three most recent NDSH Surveys. Across the age groups, males generally have a higher prevalence of drinking than females, and the middle age groups have higher prevalence than the youngest and oldest age groups.
Table 2.1: Recent(a) alcohol consumption, Australians aged 14 years or older, 2001, 2004 and 2007 (per cent)
2001 2004 2007
Age group Recent drinker
Non- drinker
Recent drinker
Non-drinker
Recent drinker
Non- drinker
Males 14–19 72.7 27.3 69.6 30.4 70.8 29.2 20–29 91.6 8.4 92.2 7.8 88.9 11.1 30–39 90.1 9.9 91.1 8.9 89.1 10.9 40–49 88.5 11.5 91.4 8.6 89.2 10.8 50–59 87.5 12.5 89.5 10.5 90.1 9.9 60+ 79.8 20.2 82.7 17.3 82.7 17.3 Aged 14+ 85.8 14.2 87.1 12.9 86.0 14.0
Females 14–19 74.6 25.4 72.4 27.6 71.3 28.7 20–29 88.6 11.4 86.6 13.4 85.2 14.8 30–39 84.0 16.0 87.0 13.0 86.5 13.5 40–49 83.6 16.4 86.2 13.8 86.1 13.9 50–59 78.0 22.0 80.5 19.5 81.9 18.1 60+ 66.5 33.5 68.4 31.6 68.9 31.1 Aged 14+ 79.1 20.9 80.2 19.8 79.9 20.1
Total 14–19 73.6 26.4 71.0 29.0 71.0 29.0 20–29 90.1 9.9 89.4 10.6 87.1 12.9 30–39 87.0 13.0 89.0 11.0 87.8 12.2 40–49 86.1 13.9 88.8 11.2 87.6 12.4 50–59 82.8 17.2 85.0 15.0 86.0 14.0 60+ 72.6 27.4 75.0 25.0 75.3 24.7 Aged 14+ 82.4 17.6 83.6 16.4 82.9 17.1
(a) Daily, weekly or less-than-weekly consumed in the previous 12 months.

4
The data also show that, over the years 2001–2007 there was a decline in reported alcohol consumption among people aged 29 years or less, whereas there was a slight increase among the older age groups (Figure 2.1).
Males Females
0
10
20
30
40
50
60
70
80
90
100
14–19 20–29 30–39 40–49 50–59 60+Age group
Per
cen
t 2001
2004
2007
0
10
20
30
40
50
60
70
80
90
100
14–19 20–29 30–39 40–49 50–59 60+Age group
Per c
ent
Figure 2.1: Trend in recent alcohol consumption, by age group, 2001, 2004 and 2007
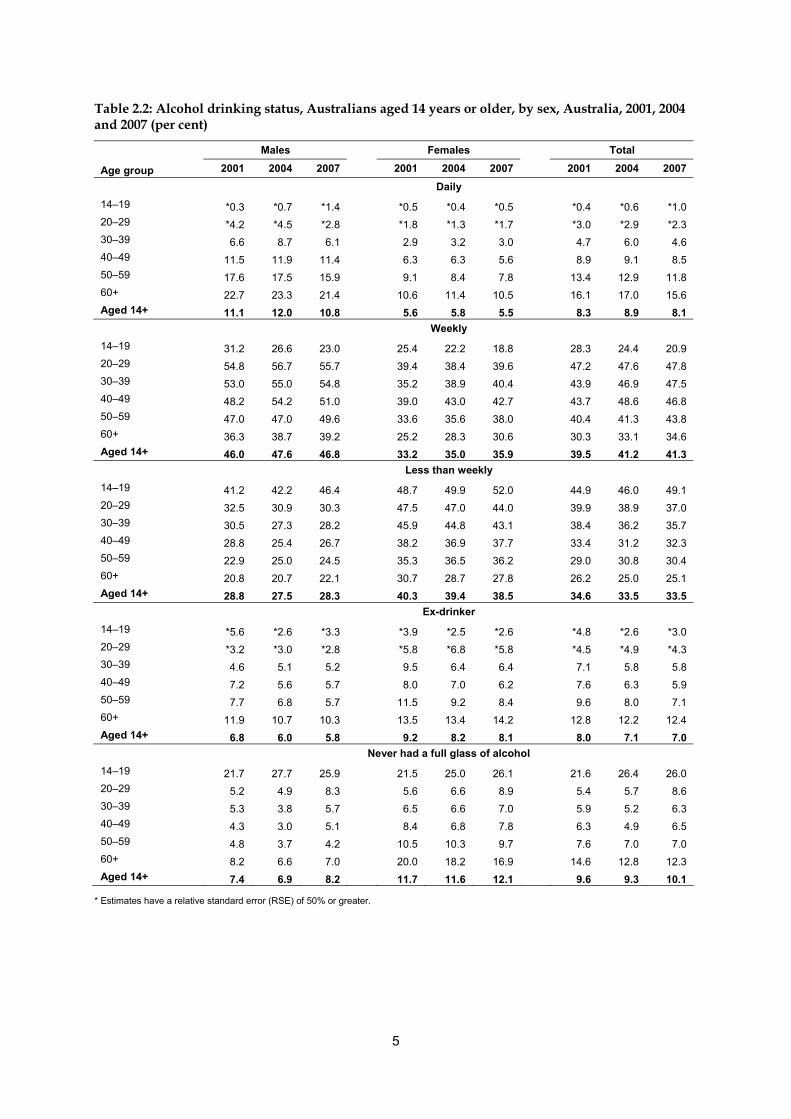
Recent alcohol consumption status does not capture the frequency or the amount of alcohol consumed. To get a clearer picture of how drinking status has changed over time, we need to explore the drinking patterns. The data show that proportionately more males drink alcohol frequently (daily or weekly) than females (Table 2.2). There is some evidence that the proportion of younger Australians that drink frequently (at least weekly) has declined since 2001, with a corresponding increase in drinking less than weekly (that is, it appears that these drinkers have reduced frequency but not stopped altogether). Apart from this youngest age group, and the oldest age group, the proportions of ex-drinkers have declined slightly in recent years.
5
Table 2.2: Alcohol drinking status, Australians aged 14 years or older, by sex, Australia, 2001, 2004 and 2007 (per cent)
Males Females Total
Age group 2001 2004 2007 2001 2004 2007 2001 2004 2007 Daily 14–19 *0.3 *0.7 *1.4 *0.5 *0.4 *0.5 *0.4 *0.6 *1.0 20–29 *4.2 *4.5 *2.8 *1.8 *1.3 *1.7 *3.0 *2.9 *2.3 30–39 6.6 8.7 6.1 2.9 3.2 3.0 4.7 6.0 4.6 40–49 11.5 11.9 11.4 6.3 6.3 5.6 8.9 9.1 8.5 50–59 17.6 17.5 15.9 9.1 8.4 7.8 13.4 12.9 11.8 60+ 22.7 23.3 21.4 10.6 11.4 10.5 16.1 17.0 15.6 Aged 14+ 11.1 12.0 10.8 5.6 5.8 5.5 8.3 8.9 8.1 Weekly 14–19 31.2 26.6 23.0 25.4 22.2 18.8 28.3 24.4 20.9 20–29 54.8 56.7 55.7 39.4 38.4 39.6 47.2 47.6 47.8 30–39 53.0 55.0 54.8 35.2 38.9 40.4 43.9 46.9 47.5 40–49 48.2 54.2 51.0 39.0 43.0 42.7 43.7 48.6 46.8 50–59 47.0 47.0 49.6 33.6 35.6 38.0 40.4 41.3 43.8 60+ 36.3 38.7 39.2 25.2 28.3 30.6 30.3 33.1 34.6 Aged 14+ 46.0 47.6 46.8 33.2 35.0 35.9 39.5 41.2 41.3 Less than weekly 14–19 41.2 42.2 46.4 48.7 49.9 52.0 44.9 46.0 49.1 20–29 32.5 30.9 30.3 47.5 47.0 44.0 39.9 38.9 37.0 30–39 30.5 27.3 28.2 45.9 44.8 43.1 38.4 36.2 35.7 40–49 28.8 25.4 26.7 38.2 36.9 37.7 33.4 31.2 32.3 50–59 22.9 25.0 24.5 35.3 36.5 36.2 29.0 30.8 30.4 60+ 20.8 20.7 22.1 30.7 28.7 27.8 26.2 25.0 25.1 Aged 14+ 28.8 27.5 28.3 40.3 39.4 38.5 34.6 33.5 33.5 Ex-drinker 14–19 *5.6 *2.6 *3.3 *3.9 *2.5 *2.6 *4.8 *2.6 *3.0 20–29 *3.2 *3.0 *2.8 *5.8 *6.8 *5.8 *4.5 *4.9 *4.3 30–39 4.6 5.1 5.2 9.5 6.4 6.4 7.1 5.8 5.8 40–49 7.2 5.6 5.7 8.0 7.0 6.2 7.6 6.3 5.9 50–59 7.7 6.8 5.7 11.5 9.2 8.4 9.6 8.0 7.1 60+ 11.9 10.7 10.3 13.5 13.4 14.2 12.8 12.2 12.4 Aged 14+ 6.8 6.0 5.8 9.2 8.2 8.1 8.0 7.1 7.0 Never had a full glass of alcohol 14–19 21.7 27.7 25.9 21.5 25.0 26.1 21.6 26.4 26.0 20–29 5.2 4.9 8.3 5.6 6.6 8.9 5.4 5.7 8.6 30–39 5.3 3.8 5.7 6.5 6.6 7.0 5.9 5.2 6.3 40–49 4.3 3.0 5.1 8.4 6.8 7.8 6.3 4.9 6.5 50–59 4.8 3.7 4.2 10.5 10.3 9.7 7.6 7.0 7.0 60+ 8.2 6.6 7.0 20.0 18.2 16.9 14.6 12.8 12.3 Aged 14+ 7.4 6.9 8.2 11.7 11.6 12.1 9.6 9.3 10.1
* Estimates have a relative standard error (RSE) of 50% or greater.

6
2.2 Alcohol consumption and risk levels In Australia, the National Health and Medical Research Council (NHMRC) has developed guidelines regarding safe drinking levels. Although the NHMRC (2009) recently revised the 2001 guidelines, the estimation of risk of harm in this publication is still based on the 2001 guidelines. The guidelines divide alcohol consumption risk into two categories: long-term and short-term risk. Long-term risk is the risk level associated with regular daily patterns of drinking, defined by the total amount of alcohol typically consumed per week. Excessive alcohol consumption over time increases the risk of developing some cancers, cirrhosis of the liver, cognitive problems and dementia, and alcohol dependence.
The short-term risk relates to the risk of harm (particularly injury, motor vehicle accidents or death) in the short term that is associated with certain levels of drinking on a single day. These levels assume that overall drinking patterns remain within the levels set for long-term risk, and that these heavier drinking days occur a maximum of 3 times per week. Alcohol consumption beyond these limits corresponds to a greater risk of injury, certain medical conditions, or the aggravation of certain psychological disorders.
The NHMRC guidelines also define alcohol consumption risk in terms of risk levels—low, risky, and high-risk levels. Low-risk levels define a level of drinking at which there is only a minimal risk of harm. At this level, there may be health benefits for some of the population. For instance, epidemiological evidence indicates that older females with a low to moderate level of alcohol consumption are at a reduced risk of stroke and coronary heart disease. Risky levels are those at which risk of harm is significantly increased beyond any possible benefits. High-risk drinking levels are those at which there is substantial risk of serious harm, and above which risk continues to increase rapidly. The risk levels, defined differently for men and women, are set out in Table 2.3 below.
Table 2.3: National Health and Medical Research Council Australian Alcohol Guidelines, 2001
Type of risk Low risk Risky High risk
(Standard drinks)
Risk of harm in the short-term Males Up to 6
(on any day, no more than 3 days per week)
7 to 10 (on any day)
11 or more(on any day)
Females Up to 4 (on any day, no more than
3 days per week)
5 to 6 (on any day)
7 or more(on any day)
Risk of harm in the long-term
Males
On an average day Up to 4 (per day)
5 to 6 (per day)
7 or more(per day)
Overall weekly level Up to 28
(per week) 29 to 42
(per week) 43 or more(per week)
Females
On an average day Up to 2(per day)
3 to 4 (per day)
5 or more(per day)
Overall weekly level Up to 14
(per week) 15 to 28
(per week) 29 or more(per week)
Source: NHMRC 2001.
7
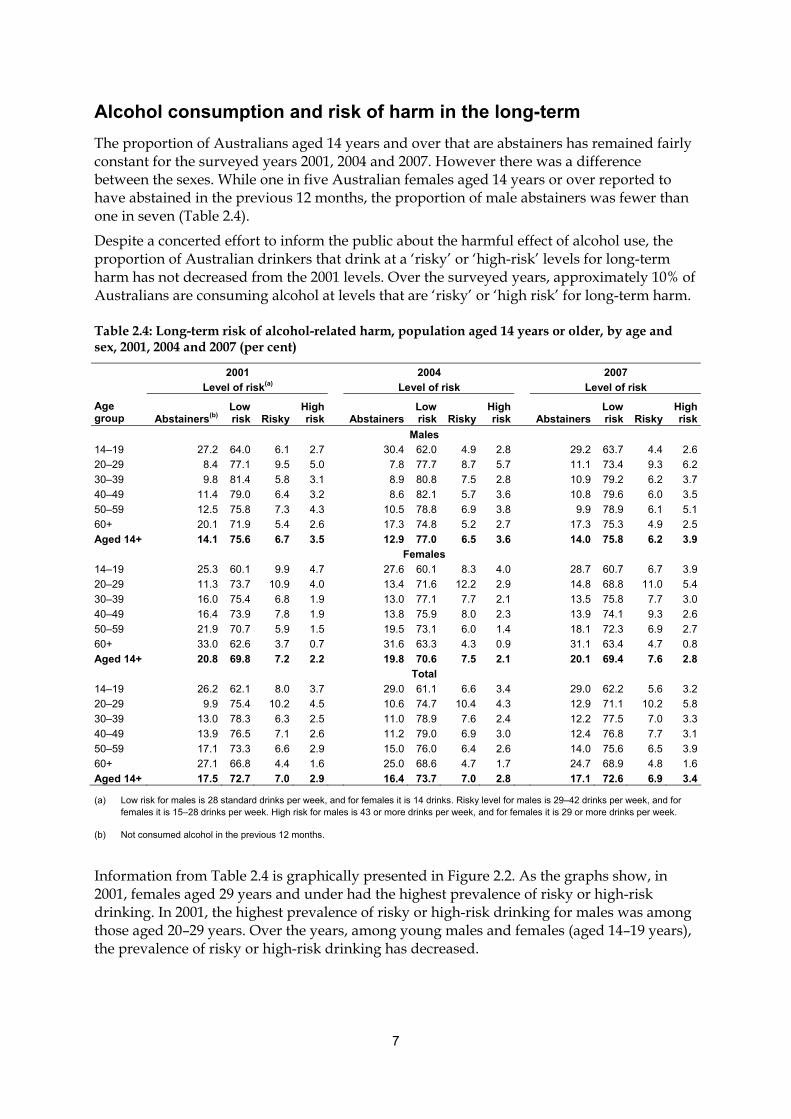
Alcohol consumption and risk of harm in the long-term The proportion of Australians aged 14 years and over that are abstainers has remained fairly constant for the surveyed years 2001, 2004 and 2007. However there was a difference between the sexes. While one in five Australian females aged 14 years or over reported to have abstained in the previous 12 months, the proportion of male abstainers was fewer than one in seven (Table 2.4).
Despite a concerted effort to inform the public about the harmful effect of alcohol use, the proportion of Australian drinkers that drink at a ‘risky’ or ‘high-risk’ levels for long-term harm has not decreased from the 2001 levels. Over the surveyed years, approximately 10% of Australians are consuming alcohol at levels that are ‘risky’ or ‘high risk’ for long-term harm.
Table 2.4: Long-term risk of alcohol-related harm, population aged 14 years or older, by age and sex, 2001, 2004 and 2007 (per cent)
2001 2004 2007 Level of risk(a) Level of risk Level of risk
Age group Abstainers(b)
Low risk Risky
High risk Abstainers
Low risk Risky
High risk Abstainers
Low risk Risky
High risk
Males 14–19 27.2 64.0 6.1 2.7 30.4 62.0 4.9 2.8 29.2 63.7 4.4 2.620–29 8.4 77.1 9.5 5.0 7.8 77.7 8.7 5.7 11.1 73.4 9.3 6.230–39 9.8 81.4 5.8 3.1 8.9 80.8 7.5 2.8 10.9 79.2 6.2 3.740–49 11.4 79.0 6.4 3.2 8.6 82.1 5.7 3.6 10.8 79.6 6.0 3.550–59 12.5 75.8 7.3 4.3 10.5 78.8 6.9 3.8 9.9 78.9 6.1 5.160+ 20.1 71.9 5.4 2.6 17.3 74.8 5.2 2.7 17.3 75.3 4.9 2.5Aged 14+ 14.1 75.6 6.7 3.5 12.9 77.0 6.5 3.6 14.0 75.8 6.2 3.9 Females 14–19 25.3 60.1 9.9 4.7 27.6 60.1 8.3 4.0 28.7 60.7 6.7 3.920–29 11.3 73.7 10.9 4.0 13.4 71.6 12.2 2.9 14.8 68.8 11.0 5.430–39 16.0 75.4 6.8 1.9 13.0 77.1 7.7 2.1 13.5 75.8 7.7 3.040–49 16.4 73.9 7.8 1.9 13.8 75.9 8.0 2.3 13.9 74.1 9.3 2.650–59 21.9 70.7 5.9 1.5 19.5 73.1 6.0 1.4 18.1 72.3 6.9 2.760+ 33.0 62.6 3.7 0.7 31.6 63.3 4.3 0.9 31.1 63.4 4.7 0.8Aged 14+ 20.8 69.8 7.2 2.2 19.8 70.6 7.5 2.1 20.1 69.4 7.6 2.8 Total 14–19 26.2 62.1 8.0 3.7 29.0 61.1 6.6 3.4 29.0 62.2 5.6 3.220–29 9.9 75.4 10.2 4.5 10.6 74.7 10.4 4.3 12.9 71.1 10.2 5.830–39 13.0 78.3 6.3 2.5 11.0 78.9 7.6 2.4 12.2 77.5 7.0 3.340–49 13.9 76.5 7.1 2.6 11.2 79.0 6.9 3.0 12.4 76.8 7.7 3.150–59 17.1 73.3 6.6 2.9 15.0 76.0 6.4 2.6 14.0 75.6 6.5 3.960+ 27.1 66.8 4.4 1.6 25.0 68.6 4.7 1.7 24.7 68.9 4.8 1.6Aged 14+ 17.5 72.7 7.0 2.9 16.4 73.7 7.0 2.8 17.1 72.6 6.9 3.4
(a) Low risk for males is 28 standard drinks per week, and for females it is 14 drinks. Risky level for males is 29–42 drinks per week, and for females it is 15–28 drinks per week. High risk for males is 43 or more drinks per week, and for females it is 29 or more drinks per week.
(b) Not consumed alcohol in the previous 12 months.
Information from Table 2.4 is graphically presented in Figure 2.2. As the graphs show, in 2001, females aged 29 years and under had the highest prevalence of risky or high-risk drinking. In 2001, the highest prevalence of risky or high-risk drinking for males was among those aged 20–29 years. Over the years, among young males and females (aged 14–19 years), the prevalence of risky or high-risk drinking has decreased.

8
Males Females
0
5
10
15
20
14–19 20–29 30–39 40–49 50–59 60+Age group
Per c
ent
2001
2004
2007
0
5
10
15
20
14–19 20–29 30–39 40–49 50–59 60+Age group
Per c
ent
Figure 2.2: Long-term risk of alcohol-related harm, population aged 14 years or older, by age group, 2001, 2004 and 2007
Alcohol consumption and risk levels in the short term The short-term risk of harm, in particular injury, motor vehicle accidents or death is associated with given levels of alcohol consumption on any particular drinking occasion. Short-term risk can be reported on a weekly, monthly or yearly basis. In this report, unless otherwise noted, we have used a monthly measure of short-term risk—that is, risk of harm occurring once or more in a month.
The data show that the proportion of the Australian population aged 14 years and over that drink alcohol at a ‘high-risk’ level for short-term harm was about 10% across the surveyed years 2001, 2004 and 2007 (Table 2.5). Proportionately more males than females reported high-risk levels of drinking. There is some evidence of age differences in the short-term risk levels, with slightly higher proportions of young females engaged in high-risk drinking behaviour compared with young males (Figure 2.3).

9
Table 2.5: Short-term risk of alcohol-related harm, population aged 14 years or older, by age group and sex, 2001, 2004 and 2007 (per cent)
2001 2004 2007 Level of risk(a) Level of risk Level of risk
Age group Abstainers(b)
Low risk Risky
High risk Abstainers
Low risk Risky
High risk Abstainers
Low risk Risky
High risk
Males 14–19 27.2 43.4 13.2 16.2 30.4 43.6 10.5 15.5 29.2 46.3 11.2 13.320–29 8.4 49.1 18.0 24.5 7.8 48.2 17.2 26.8 11.1 45.1 14.5 29.330–39 9.8 62.0 14.1 14.2 8.9 61.9 15.1 14.1 10.9 61.7 13.9 13.640–49 11.4 67.9 13.2 7.4 8.6 68.9 13.4 9.1 10.8 65.9 14.2 9.050–59 12.5 70.8 11.6 5.1 10.5 71.8 11.7 6.1 9.9 72.4 11.5 6.260+ 20.1 72.3 5.6 2.0 17.3 74.6 5.8 2.2 17.3 74.2 5.8 2.7Aged 14+ 14.1 62.1 12.6 11.3 12.9 63.0 12.3 11.9 14.0 62.3 11.7 12.0 Females 14–19 25.3 41.7 11.9 21.1 27.6 43.1 10.7 18.6 28.7 43.0 12.0 16.320–29 11.3 52.5 16.7 19.4 13.4 49.7 13.9 23.0 14.8 49.9 13.2 22.130–39 16.0 66.4 9.8 7.8 13.0 67.3 9.6 10.1 13.5 66.4 9.3 10.840–49 16.4 69.8 8.8 5.1 13.8 70.2 9.5 6.5 13.9 69.6 9.3 7.250–59 21.9 70.6 4.7 2.8 19.5 72.8 5.3 2.5 18.1 72.7 6.1 3.260+ 33.0 64.3 1.8 0.9 31.6 65.3 2.1 1.0 31.1 65.3 2.7 1.0Aged 14+ 20.8 62.3 8.5 8.4 19.8 62.9 8.1 9.2 20.1 62.7 8.1 9.0 Total 14–19 26.2 42.6 12.6 18.6 29.0 43.4 10.6 17.0 29.0 44.7 11.6 14.720–29 9.9 50.8 17.4 22.0 10.6 48.9 15.6 24.9 12.9 47.5 13.9 25.830–39 13.0 64.2 11.9 10.9 11.0 64.6 12.3 12.1 12.2 64.1 11.6 12.240–49 13.9 68.8 11.0 6.3 11.2 69.6 11.4 7.8 12.4 67.8 11.7 8.150–59 17.1 70.7 8.2 4.0 15.0 72.3 8.5 4.3 14.0 72.5 8.8 4.760+ 27.1 67.9 3.5 1.4 25.0 69.6 3.8 1.5 24.7 69.4 4.1 1.8Aged 14+ 17.5 62.2 10.5 9.8 16.4 62.9 10.1 10.5 17.1 62.5 9.9 10.5
(a) Low risk for males is up to 6 standard drinks per session, and for females it is 4 drinks or less. Risky level for males is 7–10 drinks per session, and for females it is 5–6 drinks. High risk for males is 11 or more drinks per session, and for females it is 7 or more drinks per session.
(b) Not consumed alcohol in the previous 12 months.
Across the survey years there were small, but statistically non-significant, increases in short-term risky alcohol consumption for most age groups (Figure 2.3).

10
Males Females
0
10
20
30
40
50
14–19 20–29 30–39 40–49 50–59 60+Age group
Per
cen
t 200120042007
0
10
20
30
40
50
14–19 20–29 30–39 40–49 50–59 60+Age group
Per c
ent
Figure 2.3: Short-term risk of alcohol-related harm, population aged 14 years or older, by age group, 2001, 2004 and 2007
2.3 Correlates of alcohol use In earlier sections, alcohol consumption patterns by age group and sex over the surveyed years 2001, 2004 and 2007 and the prevalence of drinking at short-term and long-term risky levels were presented. In this section we investigate if there are differences in prevalence of alcohol consumption by sociodemographic characteristics. Alcohol consumption in the analysis is defined as recent use of alcohol, that is, consumption of a full serve of alcohol in the previous 12 months.
Employment status and alcohol consumption A little over four in five Australians aged 14 years or over consumed alcohol in the last 12 months. When alcohol consumption is disaggregated by employment status, the data show that there are differences in recent alcohol consumption. Notably, people that are currently employed are most likely to be recent consumers of alcohol. This has remained relatively consistent over the 3 years surveyed (Table 2.6).
Table 2.6: Recent(a) alcohol consumption by employment status, population aged 14 years or older, by sex, 2001, 2004 and 2007 (per cent)
2001 2004 2007 Employment status Males Females Total Males Females Total Males Females Total Currently employed 90.8 87.4 89.4 92.0 89.0 90.7 90.9 88.4 89.8 Student 71.7 75.0 73.4 69.5 73.9 71.8 66.3 70.7 68.5 Unemployed 86.7 83.5 85.7 88.0 79.8 84.5 88.4 77.1 83.6 Engaged in home duties 82.7 76.9 77.3 79.7 77.5 77.5 81.2 79.9 79.9 Retired or on a pension 78.5 67.2 72.4 82.1 68.3 74.5 82.9 68.1 74.9 Unable to work .. .. .. 78.6 68.5 74.1 70.6 66.7 68.6 Other .. .. .. 81.6 72.7 76.3 77.5 74.9 75.6
(a) Daily, weekly or less-than-weekly consumed in the previous 12 months.
.. These employment categories were not used in the 2001 NDSH Survey.
11
The data on prevalence of alcohol consumption by employment status also shows that for all categories, males have higher prevalence of alcohol use than females, except among students, where females have a higher prevalence than males. This has been relatively consistent across all three surveys since 2001.
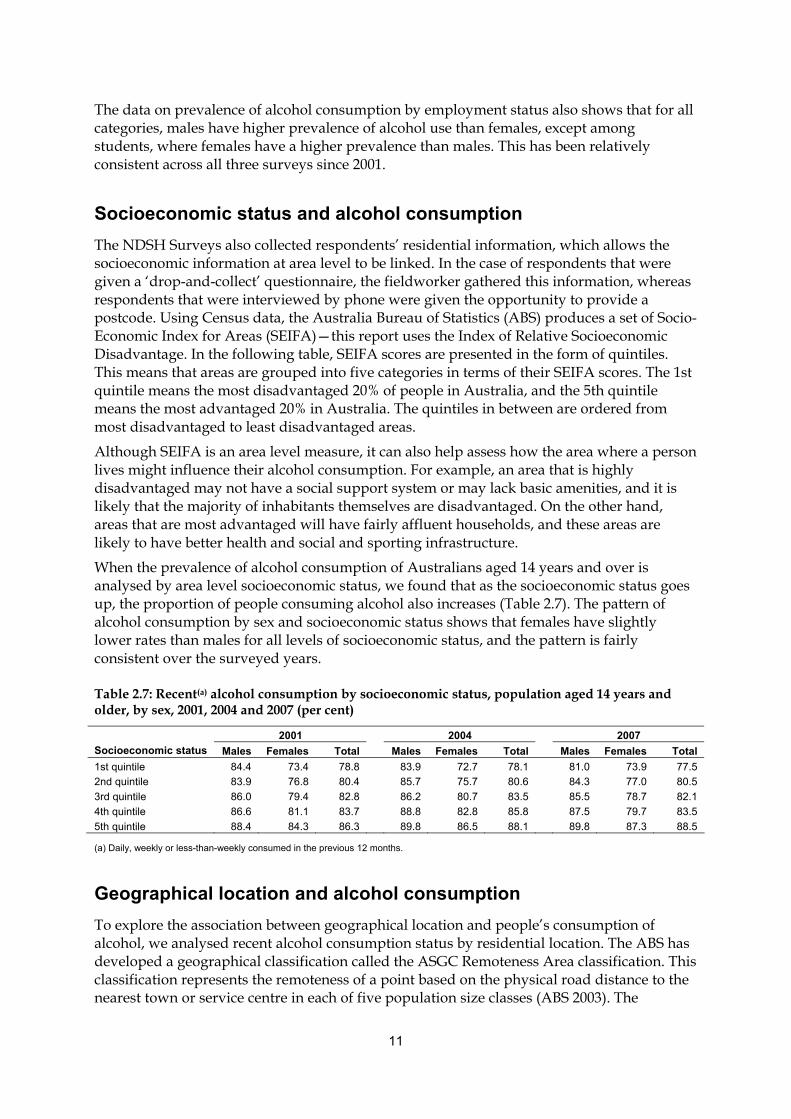
Socioeconomic status and alcohol consumption The NDSH Surveys also collected respondents’ residential information, which allows the socioeconomic information at area level to be linked. In the case of respondents that were given a ‘drop-and-collect’ questionnaire, the fieldworker gathered this information, whereas respondents that were interviewed by phone were given the opportunity to provide a postcode. Using Census data, the Australia Bureau of Statistics (ABS) produces a set of Socio-Economic Index for Areas (SEIFA)—this report uses the Index of Relative Socioeconomic Disadvantage. In the following table, SEIFA scores are presented in the form of quintiles. This means that areas are grouped into five categories in terms of their SEIFA scores. The 1st quintile means the most disadvantaged 20% of people in Australia, and the 5th quintile means the most advantaged 20% in Australia. The quintiles in between are ordered from most disadvantaged to least disadvantaged areas.
Although SEIFA is an area level measure, it can also help assess how the area where a person lives might influence their alcohol consumption. For example, an area that is highly disadvantaged may not have a social support system or may lack basic amenities, and it is likely that the majority of inhabitants themselves are disadvantaged. On the other hand, areas that are most advantaged will have fairly affluent households, and these areas are likely to have better health and social and sporting infrastructure.
When the prevalence of alcohol consumption of Australians aged 14 years and over is analysed by area level socioeconomic status, we found that as the socioeconomic status goes up, the proportion of people consuming alcohol also increases (Table 2.7). The pattern of alcohol consumption by sex and socioeconomic status shows that females have slightly lower rates than males for all levels of socioeconomic status, and the pattern is fairly consistent over the surveyed years.
Table 2.7: Recent(a) alcohol consumption by socioeconomic status, population aged 14 years and older, by sex, 2001, 2004 and 2007 (per cent)
2001 2004 2007 Socioeconomic status Males Females Total Males Females Total Males Females Total 1st quintile 84.4 73.4 78.8 83.9 72.7 78.1 81.0 73.9 77.5 2nd quintile 83.9 76.8 80.4 85.7 75.7 80.6 84.3 77.0 80.5 3rd quintile 86.0 79.4 82.8 86.2 80.7 83.5 85.5 78.7 82.1 4th quintile 86.6 81.1 83.7 88.8 82.8 85.8 87.5 79.7 83.5 5th quintile 88.4 84.3 86.3 89.8 86.5 88.1 89.8 87.3 88.5
(a) Daily, weekly or less-than-weekly consumed in the previous 12 months.
Geographical location and alcohol consumption To explore the association between geographical location and people’s consumption of alcohol, we analysed recent alcohol consumption status by residential location. The ABS has developed a geographical classification called the ASGC Remoteness Area classification. This classification represents the remoteness of a point based on the physical road distance to the nearest town or service centre in each of five population size classes (ABS 2003). The

12
geographical classification is based on the index value calculated for 1 kilometre square grids across all of Australia.
In our analysis, Remote and Very remote Australia were combined, as there were only a few respondents from Very remote Australia.
The data show that alcohol consumption is associated with remoteness, with proportionately more of the population in Remote and Very remote areas reporting recent alcohol consumption compared with Major cities (Table 2.8). This difference appears to have widened over the three reported periods.
Table 2.8: Recent(a) alcohol consumption by geographical remoteness, population aged 14 years and over, by sex, 2001, 2004 and 2007 (per cent)
2001 2004 2007 Geography Males Females Total Males Females Total Males Females Total Major cities 85.4 79.0 82.2 86.6 79.8 83.1 85.5 79.9 82.7 Inner regional 86.6 80.1 83.3 88.0 81.9 84.9 87.0 79.1 82.8 Outer regional 86.3 78.1 82.2 88.3 79.0 83.5 86.4 80.6 83.5 Remote and Very remote 87.2 79.7 83.4 89.4 83.0 86.3 89.1 85.6 87.4
(a) Daily, weekly or less-than-weekly consumed in the previous 12 months.
Generational effect on alcohol consumption In earlier sections we analysed prevalence of alcohol consumption by ten-year age groups, with the exception of the groups 14–19 years and 60 years or older. In this section, we expand the analysis further to express age in terms of generation.
The ABS (2009) in defining the generations considers a number of factors including birth rates, significant world events and shared life experiences. Each generation covers a similar sized age group (generally 20 years) to allow more meaningful comparisons across generations. For example, Generation X and Y, while separately identified by some social commentators, have many characteristics in common, and ABS combines them to form a 20-year birth cohort. ABS names and definitions are used for these generations with the age threshold slightly modified to align with the age breakdown presented in other parts of this report.
The ABS defines the Oldest Generation as those born between 1891 and 1926; the Lucky Generation are those born between 1927 and 1946; the Baby Boomers are those born between 1947 and 1966; Generation X and Y are those born between 1967 and 1986; and the Internet or iGeneration are those born between 1987 and 2006. The 2006 Census showed that iGeneration, Generation X and Y and Baby Boomers each constituted between 27% and 28% of the total population (a combined total of 81.8%), while the Lucky Generation constituted 14.5% and the Oldest Generation 3.7%.
The respondents’ age at survey year was used to estimate the year of birth, which was then categorised by a generation. This means that a respondent in one survey whose age was the same as a respondent in another survey may be assigned to a different generation. For example, a respondent aged 40 years in the 2001 NDSH Survey would be categorised as a Baby boomer because they were born in 1961, whereas a respondent aged 40 years in 2007 will be categorised as Generation X and Y as their year of birth is 1967.
This form of analysis is also called a synthetic cohort analysis (Campbell & Hudson 1985). A typical cohort analysis would require follow-up from study participants, usually in the form of a longitudinal survey. Although the respondents across years are not identical, it is

13
expected that various characteristics of this population, after taking into account population level weighting, could be used as a proxy for a cohort. By converting age into generation, we aim to capture the effect of various social and economic factors on alcohol consumption associated with each generation. The iGeneration group is only reported here for 2007, as only this survey included enough members of this cohort in the sample (people aged 14–19 years in 2007).
The data show that the cohort rates are relatively stable over the three surveys, with higher rates in the Generation X and Y and Baby Boomer generations (Table 2.9). This is consistent with the results presented by age group, that is, higher consumption reported among those aged 20–59 years.
Table 2.9: Recent(a) alcohol consumption by generation, population aged 14 years or older, by sex, 2001, 2004 and 2007 (per cent)
2001 2004 2007 Generation Males Females Total Males Females Total Males Females Total iGeneration . . . . . . . . . . . . 73.2 73.6 73.4 Generation X and Y 87.8 84.5 86.2 90.9 87.1 89.0 89.1 86.0 87.5 Baby Boomers 88.9 82.9 85.9 90.8 84.3 87.5 89.5 83.6 86.5 Lucky Generation 83.3 70.6 76.6 84.1 70.5 76.9 83.8 69.4 76.2 Oldest Generation 74.1 58.5 66.0 79.5 62.3 70.4 72.0 57.2 63.7
(a) Daily, weekly or less-than-weekly consumed in the previous 12 months.
Main language spoken at home and alcohol consumption The data on alcohol use show that there is a difference in the prevalence of alcohol consumption by sex, age group, geography and socioeconomic status. Numerous studies have shown that there are cultural effects on alcohol consumption in general, and alcohol abuse in particular. For example, research has shown that in some ethnic communities, due to good parental supervision, substance use among adolescents is relatively low (Loxley et al. 2004).
In our analysis, we have used main language spoken at home as a proxy for ethnicity. The NDSH Survey collects information on the main language spoken at home. According to the NDSH Surveys, although around nine in ten people aged 14 years and over chose English as their main language, the proportion has been declining slowly since the 2001 survey (92.5% in 2001, 91.8% in 2004 and 89.7% in 2007).
When recent alcohol use by age group and sex was analysed, a higher proportion of people whose main language spoken at home is English were recent drinkers, compared with those that speak other languages at home (Table 2.10). For example, in 2007 nearly nine in ten males whose main language at home was English were recent drinkers, compared with just over six in ten males whose main language at home was not English. Among females, the proportion of recent drinkers among English-speaking households was more than eight in ten, compared with less than five in ten among those whose main language at home was other than English. This pattern was consistent across the three surveyed years.

14
Table 2.10: Recent(a) alcohol consumption by main language spoken at home, population aged 14 years or older, by sex, 2001, 2004 and 2007 (per cent)
2001 2004 2007
Age group English Other
language English Other
language English Other
language Males 14–19 75.6 43.9 72.6 45.9 72.3 50.9 20–29 94.4 70.7 94.3 72.9 95.2 63.0 30–39 93.0 64.8 92.7 71.7 92.8 62.2 40–49 90.0 70.3 93.2 70.6 91.6 63.8 50–59 88.8 65.1 91.5 63.8 91.4 71.3 60+ 80.8 68.5 83.6 73.1 83.9 67.1 Aged 14+ 87.8 65.1 88.9 67.4 88.6 63.6 Females 14–19 77.7 47.5 75.6 37.7 74.8 32.7 20–29 91.5 58.3 89.5 60.7 90.6 49.7 30–39 86.8 39.3 89.6 51.4 89.8 42.8 40–49 85.1 47.7 88.5 46.3 88.7 51.3 50–59 79.5 45.0 82.7 39.6 82.9 59.3 60+ 67.2 53.3 69.1 56.8 69.5 58.1 Aged 14+ 81.0 49.0 82.3 51.3 82.3 48.6 Total 14–19 76.6 45.7 74.1 42.7 73.5 40.8 20–29 92.9 65.5 91.9 66.9 92.8 57.3 30–39 89.8 54.9 91.1 62.1 91.3 54.6 40–49 87.5 62.4 90.8 61.5 90.2 58.4 50–59 84.2 56.2 87.0 54.3 87.1 67.4 60+ 73.3 62.4 75.7 65.7 76.2 63.5 Aged 14+ 82.4 58.4 85.5 60.3 85.3 57.3
(a) Daily, weekly or less-than-weekly consumed in the previous 12 months.
Marital status and alcohol consumption Another demographic variable the survey collected was marital status. The question was ‘Which one of the following best describes your present marital status?’ There were five possible responses: ‘never married’, ‘widowed’, ‘divorced’, ‘separated, but not divorced’, and ‘married (including de facto or living with life partner)’. In the analysis, we combined widowed, divorced and separated as one category to represent a group of people that were at one stage married but are no longer.
When recent alcohol consumption pattern by marital status was analysed, the data show that higher proportions of married people were recent drinkers, compared with those that never married or are no longer married (Table 2.11). Amongst the different classifications of marital status, there were some differences in recent alcohol consumption across the sexes. While divorced, separated or widowed females reported the lowest proportion of alcohol use, among males it was the never married group that had the lowest proportion of alcohol use across the surveys.

15
Table 2.11: Recent(a) alcohol consumption(b) by marital status for the population aged 14 years or older, by sex, 2001, 2004 and 2007 (per cent)
2001 2004 2007 Marital status Males Females Total Males Females Total Males Females TotalNever married 82.8 80.6 81.8 83.2 80.6 82.0 80.8 79.1 80.1Divorced/Separated/Widowed 86.0 72.2 76.8 86.3 75.4 78.9 86.3 73.7 77.9Married/De facto 87.4 80.3 83.9 89.3 81.6 85.4 88.7 82.0 85.3
(a) Daily, weekly or less-than-weekly consumed in the previous 12 months.
(b) Consumed at least a full serve of alcohol, in life-time.
Personal income and alcohol consumption All the NDHS Surveys collect information on personal and household income. As income-related questions are considered by some respondents as being intrusive, to minimise item non-response respondents are given the chance to select an income bracket that contains their income. The question for personal income was, ‘Which of the following groups would represent your personal annual income, before tax, from all sources?’ In addition to the ranges shown in Table 2.12, there were valid response options of ‘Nil income’, ‘Negative income’, ‘Prefer not to say’ and ‘Don’t know’.
The frequency distribution of personal income from the 2007 survey shows that, of the 22,912 completed surveys, 1,525 respondents did not answer this question, 1,406 reported nil income, a further 142 reported negative income, 1,920 preferred not to say, and 1,224 respondents said they did not know their income. As with other collections, income data in this survey are possibly unreliable, and any findings should be interpreted with care.
When personal income by alcohol drinking status was analysed, the data show that as personal income increases, so does the prevalence and frequency of drinking (Table 2.12). For example, the prevalence of any alcohol consumption is 95% among the highest income group, compared with around 80% among the lowest income group, and there is a fairly constant gradient across these groups. This applies for both sexes.

16
Table 2.12: Alcohol consumption by personal income, population aged 14 years or older, by sex, 2007
Income range Daily Weekly Less than
weekly Non-drinker(a) Males $104,000 or more ($2,000 or more/week) 12.0 64.7 18.5 4.8
$83,200–$103,999 ($1,600–$1,699/week) 9.7 61.5 23.0 5.9
$67,600–$83,199 ($1300–$1,599/week) 13.3 56.8 24.3 5.7
$52,000–$67,599 ($1,000–$1,299/week) 9.8 56.2 27.1 6.9
$41,600–$51,999 ($800–$999/week) 12.8 51.1 28.2 7.9
$31,200–$41,599 ($600–$799/week) 10.9 49.3 25.9 14.0
$20,800–$31,199 ($400–$599/week) 12.2 49.8 24.3 13.8
$13,000–$20,799 ($250–$399/week) 11.3 43.7 28.9 16.1
$7,800–$12,999 ($150–$249/week) 12.9 37.5 31.5 18.0
$1–$7,799 ($1–$149/week) 4.6 28.4 45.3 21.7
Other(b) 9.4 32.5 33.2 24.8
Females $104,000 or more ($2,000 or more/week) 7.7 67.2 20.1 5.1
$83,200–$103,999 ($1,600–$1,699/week) 7.8 56.5 28.6 7.1
$67,600–$83,199 ($1300–$1,599/week) 6.2 48.1 33.6 12.2
$52,000–$67,599 ($1,000–$1,299/week) 4.8 48.7 37.0 9.5
$41,600–$51,999 ($800–$999/week) 6.4 46.6 35.4 11.6
$31,200–$41,599 ($600–$799/week) 5.7 45.0 38.6 10.8
$20,800–$31,199 ($400–$599/week) 6.5 41.8 39.3 12.4
$13,000–$20,799 ($250–$399/week) 6.6 34.2 40.6 18.6
$7,800–$12,999 ($150–$249/week) 5.0 28.3 40.1 26.7
$1–$7,799 ($1–$149/week) 2.9 30.9 47.0 19.2
Other(b) 5.2 27.1 37.9 29.8
Total
$104,000 or more ($2,000 or more/week) 11.3 65.2 18.8 4.8
$83,200–$103,999 ($1,600–$1,699/week) 9.3 60.4 24.2 6.1
$67,600–$83,199 ($1300–$1,599/week) 11.0 54.0 27.3 7.7
$52,000–$67,599 ($1,000–$1,299/week) 8.0 53.5 30.7 7.9
$41,600–$51,999 ($800–$999/week) 10.1 49.2 31.3 9.5
$31,200–$41,599 ($600–$799/week) 8.4 47.2 32.1 12.4
$20,800–$31,199 ($400–$599/week) 9.1 45.4 32.5 13.0
$13,000–$20,799 ($250–$399/week) 8.3 37.6 36.5 17.7
$7,800–$12,999 ($150–$249/week) 8.0 31.8 36.8 23.4
$1–$7,799 ($1–$149/week) 3.6 29.9 46.3 20.2
Other(b) 6.9 29.3 36.0 27.8
(a) Non-drinker includes ex-drinker and those that never had a full serve of alcohol in their lifetime.
(b) Includes negative, nil and not reported.

17
2.4 Determinants of risky alcohol consumption Earlier in this chapter we explored alcohol consumption patterns by sex, age and a range of other sociodemographic characteristics. The analysis showed that, proportionately: • more males are recent drinkers than females • more employed people drink compared with other employment categories • consumption increases as the area level disadvantage increases • consumption increases with distance from major urban areas • more people who speak English at home drink compared with those who speak
languages other than English at home • more married people are recent drinkers than those who aren’t married.
As some of these factors are themselves correlated, the individual effect of these correlates on drinking status is unknown. For example, the alcohol drinking status of a male, who is employed, lives in a remote area, and is in his 30s compared with another 18-year-old male is unknown. Cross-tabulations are good for exploratory analysis, but multivariate statistical tools help determine the effect of individual correlates on drinking status.
Instead of focusing on recent drinking status, this section focuses on the factors influencing short-term risky drinking, and uses a statistical model to incorporate the relative, simultaneous contribution of several factors to the likelihood of risky drinking. The ‘short-term risk at least monthly’ outcome was chosen, as previous AIHW analysis has shown this as the most policy-relevant measure of the four different risk measures available.
Logistic regression was used to investigate the individual effects of each variable on the risky level of drinking, in particular, binary logistic regression. The number of cases available was 11,248 since only cases that had no missing values for all the characteristics in the multivariate analysis were included.
We assigned a value of 1 for a person who was drinking at risky or high-risk levels for short-term risk at least once a month, and 0 to those recent drinkers who did not meet this consumption threshold. The output from the logistic regression is presented in Table 2.13, with additional model statistics shown in Table B.4 in Appendix B.
Some of the key outputs of a logistic regression are the baseline odds and the odds ratios of the variables. The baseline odds are the odds that someone within the baseline category for all variables would be a risky drinker. In our analysis the baseline odds were for a person who was retired, married, female, aged in her 60s, who speaks English at home, has no post-school qualification, smokes daily, lives with her husband, has many friends who also drink alcohol, and is not aware of any harmful effect on health from her drinking habit.
An odds ratio, as the name suggests, is the ratio of two ‘odds’, where the ‘odds’ for a particular characteristic is calculated as the number of people drinking at the risky level divided by the number drinking at the low-risk level. Any category that has an odds ratio of greater than 1 means that the likelihood of an individual with that characteristic drinking at a risky level is increased with respect to the baseline category. A category with an odds ratio of less than 1 represents a lower propensity for drinking at the risky level.
For example, the odds ratio of 0.82 in the first row of Table 2.13 indicates that risky drinking among males is 18% less likely than among females, all other factors considered.

18
Results The analysis shows that employment status and family type do not have a statistically significant effect on a person’s short-term risky drinking, once the effects of other variables are controlled.
Factors reducing the propensity for short-term risky drinking are being male (18% less likely than females), main language not English (73% less likely than English), and having a bachelor or higher degree (30% less likely than no post-school qualification). Not surprisingly, people who associated with friends who do not drink were statistically significantly less likely to engage in risky drinking behaviour than those for whom most of their friends consumed alcohol.
Factors increasing the propensity for short-term risky drinking are being never married (33% more likely than married people), younger age (up to nearly 6 times as likely as the oldest age group), preference for beer (twice as likely as those that did not prefer beer), and being a daily smoker (twice as likely as non-daily smokers).
Somewhat paradoxically, those who perceive their drinking habit as harmful to their health were nearly 5 times as likely to engage in risky drinking behaviour compared with those who rated their drinking as non-harmful. This suggests that there are groups of people that may understand their exposure to harm, but are unable or unwilling to reduce their consumption.

19
Table 2.13: Odds ratio for short-term risky drinking, recent drinkers aged 14 years or older, 2007
Characteristic Odds
ratio(a) P>|t|
(95 % confidence
interval) Sex (Female as base) Male 0.82 0.009 (0.71–0.95) Age (Age 60+ as base) 14–19 years 5.71 0.000 (3.69–8.83)
20–29 years 5.43 0.000 (3.89–7.57)
30–39 years 2.99 0.000 (2.19–4.07)
40–49 years 2.19 0.000 (1.62–2.94)
50–59 years 1.52 0.003 (1.16–2.00)
Main language spoken at home (English as base) Other than English 0.27 0.000 (0.17–0.44) Post school qualification (No post school qualification as base) Trade qualification 1.11 0.239 (0.93–1.33) Non trade qualification (including diploma and associate diploma) 1.06 0.100 (0.88–1.27) Bachelor higher degree 0.70 0.000 (0.59–0.83) Preferred alcoholic beverages (Not preferring that type as base) Cask wine 1.34 0.001 (1.13–1.59) Bottled wine 0.86 0.029 (0.75–0.98) Beer (all types) 2.22 0.000 (1.94–2.55) Pre-mixed spirits (bottles or cans) 0.87 0.141 (0.72–1.05) Bottled spirits and fortified wine 1.80 0.000 (1.50–2.17) Smoking status (Not a daily smoker including non-smoker as base) Daily smoker 2.04 0.000 (1.76–2.37) Employment status (Retired as base) Self-employed 1.30 0.082 (0.97–1.74) Employed for wages 1.25 0.086 (0.97–1.62) Unemployed 1.39 0.177 (0.86–2.24) Student 0.72 0.085 (0.50–1.05) Other (home duties, and unable to work) 0.82 0.207 (0.60–1.11) Marital status (Married as base) Never married 1.33 0.025 (1.04–1.71) Widowed 0.80 0.392 (0.48–1.34) Separated (including divorced) 1.20 0.199 (0.91–1.59) Family type (Couple living alone or living with non-dependent children as base) Person living alone 1.24 0.101 (0.96–1.61) Couple with dependent children 0.92 0.080 (0.78–1.09) Single parents (living with dependent and non-dependent children) 1.02 0.153 (0.76–1.37) Living with non-related adults, and other family types 1.13 0.151 (0.87–1.47) Peer group (Most friends drink alcohol as base) Half or fewer friends drink alcohol 0.29 0.000 (0.24–0.35) Perception of harm from own drinking status (Not harmful as base) Somewhat or very harmful 4.83 0.000 (4.21–5.51)
Baseline odds(b) 0.06
(a) Ratio compared with the ‘base’ characteristic for each category, controlling for all other variables.
(b) This is the odds that someone with all the ‘base’ characteristics would be a risky/high-risk drinker.

20
Changes in baseline odds, when taking into account changes in selected correlates, are shown in Figure 2.4. As noted above, the odds of drinking at a risky level for male, or for those whose majority of friends do not drink, are lower than the baseline odds.
-0.2 -0.1 0 0.1 0.2 0.3
Male
Male 14–19 years
Male 20–29 years
Female 14–19 years
Female 20–29 years
Male daily smoker
Female daily smoker
Most friends do not drink
Own drinking status is harmful
Change in Odds Figure 2.4: Change in baseline odds of short-term risky risking, selected variables, 2007

21
3 Alcohol-related harm
The NDSH Surveys collected information on whether respondents were verbally or physically abused, or put in fear, by someone affected by alcohol. Apart from the incidence of physical harm, respondents were also asked if they felt their level of alcohol consumption (including not drinking any alcohol) was beneficial or not for their health. This section first analyses the incidence of physical or verbal abuse across the three surveys and then explores recent alcohol drinkers’ perceptions of the beneficial or harmful effects of alcohol.
3.1 Incidence of physical or verbal abuse by someone affected by alcohol
Respondents were asked to recall from the previous 12 months any incidents of violence (physical or verbal abuse, or put in fear) by someone affected by alcohol. While the physical and verbal abuse have a clear definition, being put in fear refers to the intimidation that a respondent may have felt from someone who they perceived to be intoxicated at the time. The survey data show that nearly one in three Australians aged 14 years or over had been physically or verbally abused, or put in fear, by a person affected by alcohol (based on self-reported data) (Table 3.1).
Overall, slightly more males than females reported that they had been abused or put in fear, and the incidence of such abuse has remained the same across the period 2001–2007. However, the data show that people from different age groups reported differential incidence. For both males and females across the years, those aged 20–29 years reported the highest incidence of abuse by someone affected by alcohol.
Table 3.1: Incidence of alcohol-related harm, population aged 14 years or older, by age and sex, 2001, 2004 and 2007 (per cent)
2001 2004 2007 Age group Males Females Total Males Females Total Males Females Total14–19 38.3 40.3 39.3 33.8 39.2 36.4 33.3 33.5 33.4
20–29 49.0 46.3 47.7 48.7 42.8 45.8 51.3 39.2 45.3
30–39 40.6 31.6 35.9 36.1 29.5 32.7 37.2 28.2 32.640–49 29.0 30.0 29.5 29.9 30.2 30.0 33.7 28.5 31.1
50–59 26.1 22.0 24.1 24.6 21.4 23.0 28.9 25.7 27.3
60+ 10.9 10.4 10.6 12.3 10.4 11.3 15.0 11.6 13.2Aged 14+ 32.3 40.3 30.6 31.2 39.2 29.7 32.8 26.5 29.6

22
3.2 Perception and knowledge about alcohol-related harm In Chapter 2, we described in detail the NHMRC guidelines for safe alcohol consumption within the limits of short and long-term harm. In this chapter we assess how knowledgeable respondents are about the quantity of alcohol and the associated adverse effect on a person’s health. The description of the drinking quantities against risk in the short and long-term, according to the NHMRC guidelines, were shown earlier in Table 2.3.
In the survey, a series of questions were asked to assess respondents’ knowledge about the amount of alcohol a person can drink safely every day for many years without adversely affecting their health. The survey also asked questions about short-term risk where a person can put his or her life at risk and other people’s lives at risk.
Perception and knowledge about long-term alcohol-related harm The Australian Alcohol Guidelines (NHMRC 2001) state that a male can consume up to 4 standard drinks each day without adversely affecting his health in the long term. For females, it is 2 standard drinks a day. The survey data show that, in 2007, nearly one in 10 Australians overestimated the number of standard drinks an adult male could drink without affecting their health (Table 3.2). One in ten Australians aged 14 years or over considered that there is no safe level of alcohol drinking. Over the surveyed years, people’s awareness about long-term harm for males has been fairly stable.
Table 3.2: Perception of the number of standard drinks an adult male could drink every day for many years without affecting health, population aged 14 years or older, by sex, 2001, 2004 and 2007 (per cent)
2001 2004 2007 Number of standard drinks Males Females Total Males Females Total Males Females Total
7 or more 4.8 3.2 4.0 3.5 2.6 3.0 3.1 1.3 2.3
5–6 7.9 5.4 6.6 6.7 4.5 5.6 7.1 4.2 5.7
3–4 38.3 33.7 36.0 35.5 31.4 33.5 32.9 30.7 31.8
1–2 40.2 43.8 42.0 44.1 47.0 45.6 48.2 50.8 49.4
None 8.8 13.9 11.4 10.1 14.6 12.4 8.7 13.1 10.8
Note: Shading indicates low-risk levels.
When respondents were asked about their awareness of how many drinks a female can consume every day for many years without affecting her health, the data show that around one in seven overestimated the number of drinks that was safe (Table 3.3). However, awareness appears to have improved over the three surveys.

23
Table 3.3: Perception of number of standard drinks an adult female could drink every day for many years without affecting health, population aged 14 years or older, by sex, 2001, 2004 and 2007 (per cent)
2001 2004 2007 Number of standard drinks Males Females Total Males Females Total Males Females Total
7 or more 2.4 1.5 1.9 1.7 1.3 1.5 1.3 0.5 0.9
5–6 3.0 1.6 2.3 2.2 1.4 1.8 1.8 1.0 1.4
3–4 22.1 15.1 18.6 18.8 13.0 15.9 13.8 9.1 11.5
1–2 61.1 63.8 62.5 64.8 65.5 65.2 68.7 71.4 70.0
None 11.4 18.0 14.7 12.4 18.8 15.6 14.5 18.0 16.2
Note: Shading indicates low-risk levels.
Perception and knowledge about short-term alcohol-related harm According to the Guidelines, a male who drinks more than 6 standard drinks within a 6-hour period will put their life at risk. For a female, it is only 4 standard drinks within a 6-hour period. The survey data show that, in 2007, nearly two-fifths of Australians aged 14 years or over estimated the number of standard drinks a male could drink in a 6-hour period before they were at risk (Table 3.4). Over the surveyed years, people’s knowledge about the amount of alcohol that can be safely consumed has not changed much.
Table 3.4: Perception of number of standard drinks an adult male could drink in a 6-hour period before he puts his health at risk, population aged 14 years or older, by sex, 2001, 2004 and 2007 (per cent)
2001 2004 2007 Number of standard drinks Males Females Total Males Females Total Males Females Total
7 or more 40.5 28.6 34.6 39.2 27.7 33.5 43.9 29.9 37.3
5–6 29.2 30.9 30.1 30.5 31.7 31.1 25.0 28.6 26.7
3–4 20.0 26.2 23.0 19.8 26.6 23.2 22.4 31.2 26.5
1–2 8.7 12.0 10.3 8.6 11.6 10.1 7.0 8.3 7.6
None 1.7 2.4 2.0 2.0 2.4 2.2 1.8 2.0 1.9
Note: Shading indicates low-risk levels.
When the same question was asked to assess people’s awareness of short-term risk for females, the survey data show that a similar proportion (40%) overestimated the number of standard drinks a female could drink in a 6-hour period before they were at risk. This awareness is virtually unchanged over the three survey years (Table 3.5).

24
Table 3.5: Perception of the number of standard drinks an adult female could drink in a 6-hour period before she puts her health at risk, population aged 14 years or older, by sex, 2001, 2004 and 2007 (per cent)
2001 2004 2007 Number of standard drinks Males Females Total Males Females Total Males Females Total
7 or more 17.4 10.9 14.2 16.7 10.3 13.5 24.9 13.0 19.2
5–6 27.6 22.9 25.2 28.1 22.9 25.5 22.7 21.0 21.9
3–4 34.8 38.4 36.6 36.6 39.8 38.2 32.9 40.3 36.4
1–2 17.9 24.6 21.2 16.2 23.7 19.9 17.4 23.3 20.2
None 2.3 3.2 2.8 2.4 3.4 2.9 2.1 2.5 2.3
Note: Shading indicates low-risk levels.
Perception of beneficial effect of drinking alcohol As part of assessing awareness of the harmful effect of a respondents’ own alcohol consumption, the NDSH Surveys have included a question asking how people think their use of alcohol has affected their health. The question has been asked since the 2001 survey but due to different structures in the response categories, only data from the two most recent surveys are included. In the 2004 and 2007 surveys, respondents were asked to choose if their current alcohol consumption (including not drinking any alcohol) has been ‘very harmful’, ‘somewhat harmful’, ‘neither harmful nor beneficial’, ‘somewhat beneficial’, ‘very beneficial’, or ‘don’t know’. We have reduced the six alternative responses to four: harmful, neither harmful nor beneficial, beneficial, and don’t know. The data show that more females than males perceive their alcohol consumption as beneficial for health (Table 3.6). About two in five Australians aged 14 years and over reported that their alcohol consumption was neither harmful nor beneficial for their health. In 2004, 10% of Australians aged 14 years and over did not know what effect their alcohol consumption had on their health, compared with 14% in 2007.
Table 3.6: Perception of harmful effect on health for the population aged 14 years or older, by sex, 2004 and 2007 (per cent)
2004 2007
Effect on health Males Females Total Males Females Total
Harmful 17.3 12.2 14.7 17.0 13.3 15.1
Neither harmful nor beneficial 40.9 37.2 39.1 41.2 38.5 39.9
Beneficial 32.6 39.9 36.3 28.3 33.7 31.1
Don’t know 9.2 10.7 9.9 13.4 14.5 14.0

25
4 Type of alcohol consumed
This chapter presents data on the type of alcohol consumed, in terms of alcohol preferences and relative consumption on a typical day.
The NDSH Surveys asked respondents to nominate the types of alcohol they usually drank (respondents were allowed to choose more than one category of drink). From these data, overall trends in preferences for different types of alcohol were inferred.
The surveys also collected information on the amount of each type of beverage the respondent consumed ‘yesterday’. From these data, estimates of the relative consumption at a population level on a typical day were made.
4.1 Trends in preference for alcoholic beverages The data show that the most frequently cited alcoholic drink over the surveyed years has been bottled wine, followed by bottled spirits and liqueurs and regular-strength beer (Table 4.1). The data also show that, over the years, the proportion of recent drinkers preferring bottled wine has been increasing: 48.3% in 2001, 53.5% in 2004 and 55.0% in 2007. Although bottled spirits and liqueurs is the second most frequently cited alcoholic beverage of choice, its preference over the years has not seen any increase.
The data show that regular-strength beer was the most frequently cited alcoholic drink of choice among male drinkers, and bottled wine among females.
The popularity of pre-mixed spirits in a can increased among both male and female drinkers, while pre-mixed spirits in a bottle has been more popular among female drinkers than males. Proportionately more female than male drinkers cited bottled spirits and liqueurs as their preferred choice over other types of spirits. The proportion of the population that preferred bottled spirits and liqueurs also remained fairly stable over the surveyed years.
Table 4.1: Trend in preference for alcoholic beverages, population of recent drinkers aged 14 years or older, by sex, 2001, 2004 and 2007 (per cent)
2001 2004 2007 Type of alcoholic drink Males Females Total Males Females Total Males Females TotalCask wine 16.0 23.9 19.8 16.5 21.4 18.8 12.1 15.4 13.7 Bottled wine 39.7 57.3 48.3 45.5 62.0 53.5 45.6 65.0 55.0 Regular-strength beer 50.1 15.2 33.1 48.3 14.8 32.1 50.3 14.5 32.9 Mid-strength beer 20.0 6.2 13.3 21.7 6.5 14.3 21.7 6.7 14.4 Low-alcohol beer 28.3 11.9 20.3 27.2 11.3 19.5 22.5 9.0 15.9 Home-brewed beer 6.7 2.0 4.4 5.5 1.4 3.5 4.1 1.2 2.7 Pre-mixed spirits in a can 18.2 18.6 18.4 22.7 20.4 21.6 24.5 21.6 23.1 Bottled spirits and liqueurs 40.3 45.4 42.8 38.6 43.6 41.0 39.1 43.1 41.0 Pre-mixed spirits in a bottle 9.6 24.8 17.0 11.5 27.2 19.1 11.6 25.7 18.5 Cider 3.4 4.6 4.0 3.1 3.7 3.4 3.3 4.2 3.7
Fortified wine, port, etc. 13.5 13.3 13.4 14.3 12.6 13.5 12.8 11.6 12.2
Other 1.5 2.7 2.1 2.2 2.3 2.2 2.3 2.5 2.4
Notes
1. These categories are not mutually exclusive, so they should not be added together.
2. The categories above are as listed in the questionnaire.

26
Trends in preference for wine The following information presents Australians’ preference for wine over the surveyed years 2001, 2004 and 2007. The data show that the popularity of wine has slowly declined among the youngest age group, but reasonably stable or increasing for the other age groups (Figure 4.1).
Males Females
0
1020
30
40
5060
70
80
14–19 20–29 30–39 40–49 50–59 60+Age group
Per c
ent 2001
20042007
0
10
20
3040
50
60
70
80
14–19 20–29 30–39 40–49 50–59 60+Age group
Per
cen
t
Figure 4.1: Trends in preference for wine, recent drinkers aged 14 years or older, by age group, 2001, 2004 and 2007
Trends in preference for beer Beer of all types—regular-strength, mid-strength or low-alcohol—was substantially more popular among males than females. The data show that there is differential preference of beer by age and sex (Figure 4.2), but, unlike wine and spirits (see below), preference is reasonably constant across the age groups.
Males Females
102030405060708090
14–19 20–29 30–39 40–49 50–59 60+Age group
Per
cent 2001
20042007
102030405060708090
14–19 20–29 30–39 40–49 50–59 60+Age group
Per c
ent
Figure 4.2: Trends in preference for beer, recent drinkers aged 14 years or older, by age group, 2001, 2004 and 2007

27
Trends in preference for spirits and liqueur Spirits of all kinds, whether pre-mixed or bottled, were more popular among females than males (Figure 4.3). For both sexes, as age increases their preference for spirits declines, although preference for spirits appears to have increased amongst the majority of age categories since 2001.
Males Females
0
20
40
60
80
100
14–19 20–29 30–39 40–49 50–59 60+Age group
Per c
ent
200120042007
0
20
40
60
80
100
14–19 20–29 30–39 40–49 50–59 60+Age group
Per
cen
t
Figure 4.3: Trends in preference for spirits, recent drinkers aged 14 years or older, by age group, 2001, 2004, and 2007
4.2 Relative consumption of alcohol beverages While information about preferred types of alcohol is useful in understanding drinking choices, a more helpful view for targeting intervention programs is the relative proportion of each type of alcoholic beverage being consumed.
In this section, the relative consumption of various types of alcoholic beverages are estimated. The survey collects information on the amount of beverages consumed for beer, wine, spirits and fortified wine. Four types of beer are included in the question—home-brewed, regular-strength, mid-strength and low-alcohol beer. As for wines, three types of wines were included in the question—homemade, cask and bottled. Both types of pre-mixed alcohol (pre-mixed in cans or in bottles) as well as bottled spirits are included. A separate category for fortified wine is also included to estimate the consumption of port, vermouth or sherry.
Information on the amount of alcohol a respondent consumed was collected with the question, ‘How many bottles, glasses, cans or nips of alcohol did you drink yesterday?’ A matrix of drink types and volumes is provided on the survey form where respondents need to provide the quantity of drink they consumed the previous day. The number of drinks for each beverage category was converted into the number of standard drinks, based on the alcohol content and size.
It is highly likely that a person may drink different varieties of alcoholic beverages throughout the year, and it is unlikely that this person will drink all types of alcoholic beverages the day before the survey is completed. The purpose of this analysis is therefore to find the total amount and types of alcohol consumed the day before the survey. With a large sample, as is the case with these surveys, it is reasonable to assume that at a population level, a representative total amount of each type of alcohol consumed in one day will be captured.

28
Since the information is based on the respondents’ drinking of alcoholic beverages the day before the survey was completed, the estimates obtained from this question can be biased depending upon what day of the week respondents fill in the survey. Further, without knowing the alcohol contents of home-brewed beer, and other alcohol types, the estimates of alcohol consumption obtained will likely to be biased downwards.
Relative consumption for 2001 Estimates obtained from the 2001 survey showed that a total of 34.3 million standard drinks were consumed the day before the survey (Table 4.2). The general pattern by gender showed that males were more likely to have consumed beer while females were more likely to have consumed wine. However, there seems to be age differentials on what people drank, with younger drinkers (aged 29 years or less) overwhelmingly drinking bottled spirits (Table B.5 in Appendix B).
Table 4.2: Relative consumption of alcoholic beverages by sex, 2001
Amount consumed (’000 standard drinks) Relative consumption (per cent) Beverage type Males Females Total Males Females Total Home-brewed beer 452 62 514 1.3 0.2 1.5 Regular-strength beer 7,163 1,048 8,212 20.9 3.1 23.9 Mid-strength beer 1,227 157 1,383 3.6 0.5 4.0 Low-alcohol beer 798 132 929 2.3 0.4 2.7 Total beer 9,639 1,399 11,038 28.1 4.1 32.2
Homemade wine . . . . . . . . . . . . Cask wine 1,927 2,052 3,979 5.6 6.0 11.6 Bottled wine 3,277 3,584 6,861 9.5 10.4 20.0 Total wine 5,204 5,636 10,841 15.2 16.4 31.6
Pre-mixed spirits in cans 1,100 464 1,563 3.2 1.4 4.6 Pre-mixed spirits in bottles 94 322 416 0.3 0.9 1.2 Bottled spirits 5,532 4,088 9,620 16.1 11.9 28.0 Total spirits 6,726 4,874 11,600 19.6 14.2 33.8
Fortified wine, port, etc. 464 375 839 1.4 1.1 2.4 Total 22,034 12,284 34,318 64.2 35.8 100.0
Relative consumption for 2004 In 2004, a total of 30.3 million standard drinks were consumed the day before the survey (Table 4.3). Males drank more than twice the number of standard drinks than females. Males mostly consumed beer and bottled wine, while females preferred bottled wine and bottled spirits. Younger males and females continued to prefer spirits (either pre-mixed or bottled)(Table B.6 in Appendix B).

29
Table 4.3: Relative consumption of alcoholic beverages by sex, population aged 14 years or older, 2004
Amount consumed (’000 standard drinks) Relative consumption (per cent) Beverage type Males Females Total Males Females Total Home-brewed beer 693 65 758 2.3 0.2 2.5 Regular-strength beer 7,411 812 8,222 24.5 2.7 27.1 Mid-strength beer 1,217 150 1,367 4.0 0.5 4.5 Low-alcohol beer 709 127 836 2.3 0.4 2.8 Total beer 10,029 1,154 11,183 33.1 3.8 36.9
Homemade wine 194 91 286 0.6 0.3 0.9 Cask wine 1,593 1,460 3,053 5.3 4.8 10.1 Bottled wine 3,820 3,567 7,387 12.6 11.8 24.4 Total wine 5,607 5,118 10,726 18.5 16.9 35.4
Pre-mixed spirits in cans 1,493 596 2,089 4.9 2.0 6.9 Pre-mixed spirits in bottles 290 335 625 1.0 1.1 2.1 Bottled spirits 3,653 1,602 5,256 12.1 5.3 17.4 Total spirits 5,436 2,533 7,969 17.9 8.4 26.3
Fortified wine, port, etc. 271 138 410 0.9 0.5 1.4 Total 21,344 8,943 30,287 70.5 29.5 100.0
Relative consumption for 2007 In 2007, a total of 28.4 million standard drinks were consumed the day before the survey (Table 4.4). Again, males consumed about two-thirds of the total alcohol. Consistent with the previous surveys, males had a preference for regular-strength beer and females had a preference for bottled wine. Young males and females continued to prefer spirits (Table B.7 in Appendix B).
Table 4.4: Relative consumption of alcoholic beverages by sex, population aged 14 years or older, 2007
Amount consumed
(’000 standard drinks) Relative consumption (per cent) Beverage type Males Females Total Males Females Total Home-brewed beer 541 61 601 1.9 0.2 2.1 Regular-strength beer 7,070 923 7,992 24.9 3.2 28.1 Mid-strength beer 1,324 200 1,524 4.7 0.7 5.4 Low-alcohol beer 501 121 623 1.8 0.4 2.2 Total beer 9,436 1,305 10,740 33.2 4.6 37.8
Homemade wine 147 91 238 0.5 0.3 0.8 Cask wine 1,169 1,208 2,377 4.1 4.3 8.4 Bottled wine 3,853 4,312 8,165 13.6 15.2 28.7 Total wine 5,169 5,611 10,780 18.2 19.7 37.9
Pre-mixed spirits in cans 1,676 683 2,359 5.9 2.4 8.3 Pre-mixed spirits in bottles 325 333 657 1.1 1.2 2.3 Bottled spirits 2,049 1,374 3,423 7.2 4.8 12.0 Total spirits 4,050 2,390 6,440 14.3 8.4 22.7
Fortified wine, port, etc. 234 222 456 0.8 0.8 1.6 Total 18,889 9,527 28,416 66.5 33.5 100.0

30
5 Alcohol and young people
In earlier chapters we analysed the alcohol drinking behaviour of Australians aged 14 years and over, with the youngest age group range set at 14–19 years. In this chapter, we specifically analyse alcohol drinking patterns of Australians aged 14–17 years old (referred to as young people).
Since the sale of alcohol to people under the age of 18 years is illegal in Australia, analysis of the source of supply is also included in this section.
Finally, data on the perceived ease of obtaining alcohol by young people are presented to show how apparent availability of alcohol has changed over time.
Although data from the last three NDSH Surveys are used, not all questions were asked in all surveys, and therefore some analyses were restricted to the last two NDSH Surveys. Between 1,000 and 1,900 people aged 14–17 years participated in the surveys each year.
5.1 Alcohol consumption in young people Over the years, the proportion of young people (aged 14–17 years) that reported being a recent drinker has remained above 60% (Table 5.1), with the majority of these drinking less than weekly. A slightly higher proportion of young females were recent drinkers compared with young males.
Table 5.1: Alcohol drinking status, people aged 14–17 years old, by sex, 2001–2007 (per cent)
2001 2004 2007 Drinking status Males Females Total Males Females Total Males Females TotalDaily *0.2 *0.5 *0.3 *0.5 *0.2 *0.3 *0.8 *0.5 *0.7
Weekly 19.6 16.7 18.2 14.0 13.5 13.7 11.1 10.5 10.8
Less than weekly 44.3 51.6 47.8 47.0 50.5 48.7 49.1 52.0 50.5
Recent drinker 64.1 68.7 66.4 61.5 64.1 62.8 61.0 62.9 62.0
Ex-drinker (not in last 12 months) 6.7 4.3 5.5 3.3 3.2 3.2 4.2 3.0 3.6
Never a full serve of alcohol 29.2 27.0 28.1 35.2 32.7 34.0 34.8 34.1 34.4
* Estimates have an RSE of 50% or greater.
The trends in alcohol consumption over the years suggest that the proportion of young people who were recent drinkers has slightly but steadily declined since 2001 (Figure 5.1). Conversely, the proportions of young males and females who have never consumed a full serve of alcohol have increased in the surveyed years. The largest changes appear to have occurred between the 2001 and 2004 surveys.

31
Recent drinkers Never drinkers
0
10
20
30
40
50
60
70
80
Males Females
Per c
ent 2001
20042007
0
10
20
30
40
50
60
70
80
Males Females
Per c
ent
Figure 5.1: Recent drinkers and never drinkers, population aged 14–17 years, by sex, 2001, 2004 and 2007
5.2 Availability of alcohol to young people The survey data show that more than six in ten young people were recent drinkers, and being under age, could not have legally purchased alcohol. Some of the ways that under-age people could have obtained alcohol include theft, from friends and parents. When these young recent drinkers were asked to name the source of their usual supply of alcohol, friends and acquaintances were the most cited source, followed by parents. A little over 8% of recent drinkers reported buying their alcohol from retailers. Since a comparable question was not asked in 2001, the results in Table 5.2 relate to the 2004 and 2007 surveys.
Table 5.2: Source of alcohol for young people, 14–17 years old, by sex, 2004 and 2007 (per cent)
2004 2007 Usual source of alcohol for young people Males Females Total Males Females Total Friend or acquaintance 39.9 39.7 39.8 40.4 35.7 38.1 Brother or sister 3.9 4.6 4.3 2.6 3.9 3.2 Parent 32.4 36.6 34.5 33.3 37.9 35.6 Spouse or partner 0.0 4.0 2.0 *0.4 5.3 2.8 Other relative 1.8 2.3 2.1 1.6 1.6 1.6 Steal it *0.4 *0.3 *0.3 *0.8 0.0 *0.4 Purchase it myself from retailer 9.4 8.0 8.7 9.3 7.5 8.4 Get stranger/someone not known to me to get it 1.8 1.2 1.5 1.7 *1.0 1.3 Other 8.0 2.7 5.3 5.4 3.8 4.6 Not answered 2.4 *0.6 1.5 4.6 3.5 4.0
* Estimates have an RSE of 50% or greater.
The surveys asked the respondents to rate the ease or difficulty in obtaining alcohol if they wanted some. The information was collected using a 5-point Likert scale—‘Probably impossible’, ‘Very difficult’, ‘Fairly difficult’, ‘Fairly easy’, and ‘Very easy’. The data were available for only the two most recent surveys. The data show that nine in ten youth drinkers reported that it would be fairly or very easy to obtain alcohol if they wanted some (Table 5.3). The proportion of youth drinkers reporting that it would be at all difficult to obtain alcohol was very small (less than 5%).

32
Table 5.3: Ease of getting alcohol, recent drinkers aged 14–17 years, by sex, 2004 and 2007 (per cent)
2004 2007 Ease of getting alcohol Males Females Total Males Females Total Probably impossible *0.6 *0.2 *0.4 2.1 *0.3 1.2 Very difficult *0.3 *0.8 *0.6 1.7 *1.4 1.5 Fairly difficult 3.4 1.3 2.3 5.2 3.2 4.2 Fairly easy 18.8 18.8 18.8 32.6 25.2 28.9 Very easy 72.4 77.2 74.8 56.8 68.3 62.5 Don’t know/Not answered 4.5 1.8 3.2 1.6 1.6 1.6
* Estimates have an RSE of 50% or greater.

33
Appendix A Survey design and limitations
A.1 Survey design Respondents to the National Drug Strategy Household (NDSH) Surveys were sampled based on a multistage, stratified area random sample design. This was done in an attempt to achieve samples representative of the population within those areas while minimising interviewer costs.
In 2004 and 2007, the NDSHS questionnaire was conducted in two modes: drop-and-collect, and computer-assisted telephone interview (CATI). In 2001, the survey was also delivered in the form of a face-to-face interview, where the respondents completed the more sensitive question in privacy, while an interviewer guided them through the less sensitive questions.
A summary of the sample size for each mode across the survey years is shown in Table A.2.
Table A.1: Number of survey respondents, aged 14 years or older, to the NDSHS by survey mode and sex, 2001, 2004, 2007
2001 2004 2007
Survey mode Males Females Total Males Females Total Males Females Total
Drop-and-collect 10,001 12,648 22,649 10,283 13,249 23,532 8,588 10,855 19,443
CATI 973 1,082 2,055 2,145 2,905 5,050 1,421 2,048 3,469
Face-to-face interview 898 1,142 2,040 — — — — — —
Total 11,872 14,872 26,744 12,428 16,154 28,582 10,009 12,903 22,912
Note: Face-to-face interviews were not conducted for the NDSH Survey after 2001.
Drop-and-collect survey methodology
Geographical classification and sampling frame Any references to geographical location usually refer to the Australian Standard Geographical Classification (ASGC), produced annually by the Australian Bureau of Statistics (ABS). For the approximate size of a geographical area, a census collection district (CCD) usually comprises about 220 dwellings. A Statistical Local Area (SLA) generally consists of one or more whole CCDs.
Survey sampling design The drop-and-collect questionnaire was designed for self-administered completion. The sampling units for this part of the survey were residential households. Residential households do not include aged-care, correctional or psychiatric facilities. This also meant that people that were homeless at the time of the survey were not included in the target population. Households that qualified for the survey were those containing at least one person aged 12 years or over (14 years or over in 2001).

34
Stratification and oversampling Stratified variables are those classified according to a set of categories. The sample was stratified by capital cities and the remainder from each state or territory, except for the Australian Capital Territory that represented one stratum. The smaller states and territories had a larger sample proportional to the size of their population. One advantage of boosting the sample size of the smaller states and territories is the precision of the estimates for those states is greater than what would have been accomplished had sampling been completed proportional to the size of the population.
Capital cities sampling Within capital cities, households were sampled from CCDs, with the goal of obtaining 12 completed, or useable, questionnaires per CCD. The CCDs were selected with a probability proportional to the number of private households at the most recent Census.
Rest of state sampling For the rest of the state, households were sampled by selecting SLAs with probability proportional to the number of households at the most recent Census. From within each SLA, CCDs were selected again with probability proportional to the number of households at the Census, with the goal of obtaining 12 completed, or useable, questionnaires per CCD.
Household member selection Once the households were approached and the offer to complete the survey was accepted, one eligible person within each household was selected for interview using the ‘next birthday method’. This method is used to choose someone at random within the household and is quick to implement. But there has been some criticism about the recall accuracy of the selection method for larger households (Lind et al. 1997). And although respondents might find the ‘next birthday’ method easier to understand, the ‘last birthday’ method might actually be applied correctly more often (Lind et al. 1997). This technique is relatively inexpensive to replicate and led to a reasonably similar sample distribution by age and sex compared with the population at those points in time.
CATI survey methodology
Differences in questionnaire design The CATI version of the questionnaire was an abridged version of the drop-and-collect questionnaire. The CATI version was abridged to reduce the length of the survey for telephone respondents, and to remove certain questions difficult to answer via CATI, for instance questions that made use of a Likert scale.
Sampling frame In runs of the survey prior to 2007, the Desktop Marketing Systems’ version of the white pages was used as a sampling frame. However the 2004 edition of that system was the last list produced. As a consequence, the first eight digits, including the area code, were used as a seed for a random number generator. Once this step was applied, the numbers were then

35
compared against the latest electronic business listings to remove business phone numbers, creating a sampling frame from which the CATI respondents were selected.
List-assisted random digit dialling (RDD) is a sampling methodology designed to overcome the inherent biases of using something like the White Pages as the sampling frame. These biases include non-coverage of households with unlisted numbers, and new listings, and over-representation of groups such as middle-aged households and retirees.
The CATI mode involved interviewing respondents via a computer-assisted telephone interview. Due to the large number of phone numbers and the requirement to sample from households, a range of people were excluded. These include people: • only contactable by business and fax numbers • with no fixed address • incapable of undertaking the interview due to a health condition, temporary incapacity,
or language difficulties.
Stratification and oversampling Similar to the drop-and-collect mode, each jurisdiction had a minimum sample size, with smaller states and territories oversampled relative to the size of their population. The remainder of the sample was distributed according to the probability of selection according to the size of the state.
Face-to-face survey methodology The face-to-face methodology was only used in 2001. Subsequent runs of the survey only employed the drop-and-collect mode and the CATI mode.
Differences in questionnaire design The questionnaire was administered in two parts—a section for self-completion that covered the more sensitive issues, such as drug use, and another section where the questions were prompted by a field worker.
Survey sampling design Face-to-face interviews were only conducted in the 8 capital cities. A target of 2,000 respondents was established, with the distribution of interviews made proportional to the size of the population of the capital cities. A target of 16 interviews was set per CCD. CCDs that had less than a viable number of private households were excluded from the sampling frame. CCDs were then randomly chosen, and subsequently excluded from the sampling frame for the drop-and-collect and CATI modes of the questionnaire.
Weighting Although the sample was a probability sample, the selection probability of each individual differed. Weights are attached to each respondent to reflect the selection probability at each stage. The sampling weights were then adjusted to reflect non-response in the survey. Finally a post-stratification benchmark weight was created so that the weighted totals added to estimated resident population totals by sex, age group and geography level. All the estimates presented in the report are weighted results.

36
A.2 Limitations
Differences between a census and a survey While a census is capable of capturing all of the respondents within a target population, it is also one of the most costly methods to obtain information related to that population. Surveys, when designed effectively and with a sufficiently large sample size, can be used to infer a population distribution of a variety of characteristics. One of the tradeoffs of using a survey however is that estimates of the characteristics of the population are subject to sampling error, the quality and effectiveness of survey design and sample size.
Sampling error is just one part of total error. Sampling error can be minimised by proper sample design and by increasing the sample size. However, survey estimates also suffer from another form of error. Non-sampling errors can be defined as errors arising during the course of survey activities rather than resulting from the sampling procedure. Unlike sampling errors, there is no simple and direct method of estimating the size of non-sampling errors. Recall error, non-response error, and error during data entry, coding, respondents not understanding the question all contribute to non-sampling error. If a survey is properly administered, the questionnaire is properly tested, non-response is minimal, and coding and data entry is error-free, then non-sampling error can be minimised.
Relative standard error The relative standard error (RSE) is used in a variety of ABS and AIHW publications to denote the quality of an estimate. The RSE is calculated by taking the estimated standard error, taking into account the survey design, and dividing by the estimate obtained from the survey. For most purposes, a relative standard error greater than 50% is indicative of an estimate considered to be poor quality.
Social desirability bias The 2004 and 2007 NDSH Surveys were distributed as a drop-and-collect questionnaire and a CATI. For the year 2001, in addition to the drop-and-collect questionnaire and the CATI version, the questionnaire was also distributed in the form of a face-to-face interview. A drop-and-collect questionnaire is a paper version of the survey, where the respondent completes the survey in their own time. Computer-assisted telephone interviews usually involve the human interviewer being prompted by the computer to only ask questions that are relevant to the respondent. For instance, if a respondent were to tell the interviewer they’d never tried alcohol in any of the surveys, upon entering this information into the computer, the interviewer would skip all questions that required the respondent to have tried alcohol.
Due to the range and nature of the topics covered by the survey, some of the questions may be susceptible to social desirability bias. Social desirability bias is the tendency to respond to questions according to social norms, which in some cases might not be a completely accurate account of what has actually happened (Kreuter et al. 2008). For instance, respondents might not feel comfortable answering questions about the way that they’ve acquired alcohol or other drugs, if it was in a way that would not be considered socially acceptable.
As a consequence of this, one of the most common problems of any large scale epidemiological survey is the problem of validating the data. Data validation involves

37
verifying the information that respondents choose to provide. Some variables can be verified by means of cross checking responses against others. For instance, if a person were to say that they first tried alcohol when they were 14 years old, and their age was 16 years, this would be an example of a valid response. However other variables, such as questions about recent drug use, would realistically only be validated by means of drug testing, which is highly impractical for any reasonably sized survey.
Non-response bias Non-response bias is defined as being the susceptibility of a topic or a set of questions to non-response to a particular group of people. Non-response for survey questions can exist for a variety of reasons, including the sensitive nature of a question, the length and time to complete a survey, and a sense of personal relevance of a set of questions to a person’s lifestyle.
For instance, non-response to income-related questions in surveys can be high, and non-response can be significantly associated with education level, employment status, and age (Wilks et al. 2007). One of the ways that non-response bias can be dealt with is by using weightings. Weightings are used under the assumption that the demographics and associated non-missing characteristics of the non-respondents are relatively similar to those of people who did respond. Another method of dealing with non-response is the use of categorical responses instead of an exact number. Categories allow for a level of confidentiality by masking the true response.
Scope of the survey The scope of the NDSH Surveys was Australians aged 14 years or older (12 years or older from 2004) in residential households. As such, homeless and institutionalised people were not included in the survey. Non-private dwellings, such as hospitals, nursing homes, prisons, drug and alcohol rehabilitation centres, military and university halls were excluded from the scope of the survey.
Although the survey included questions on Indigenous status, this variable was not used in these analyses due to the small sample size for this population.
The response rate of the survey across years has been quite varied, especially for the CATI mode (Table A.1). The face-to-face mode performed relatively poorly compared with the CATI and drop-and-collect modes.
Table A.2: Response rate (per cent) and total number of complete responses, by survey mode, respondents aged 14 years or older, 2001, 2004, 2007
Response rate Total complete responses Survey mode 2001 2004 2007 2001 2004 2007 Drop-and-collect 51 48 52 22,649 23,532 19,443 CATI 49 38 39 2,055 5,050 3,469 Face-to-face 39 — — 2,040 — — Total 50 46 49 26,744 28,582 22,912

38
Appendix B Additional tables
Table B.1a: Alcohol consumption(a) characteristics, males aged 14 years or older, by age group, 2001, 2004 and 2007 (per cent)
Characteristic Survey 14–19 20–29 30–39 40–49 50–59 60+ Aged 14+
Employment
Currently employed 2001 88.9 93.1 91.9 89.6 89.9 86.8 90.8
2004 85.3 93.6 92.2 92.9 92.1 87.3 92.0
2007 90.4 93.3 90.2 90.2 91.8 87.4 90.9 Student 2001 66.3 86.6 68.2 76.5 71.9 100.0 71.7
2004 62.3 85.4 89.4 100.0 56.1 100.0 69.5
2007 61.6 74.0 81.5 91.0 92.4 100.0 66.3 Unemployed 2001 88.4 88.3 81.5 88.4 87.1 83.6 86.7
2004 95.3 92.7 85.1 85.7 85.8 78.0 88.0
2007 93.6 91.3 80.9 88.5 91.0 79.5 88.4 Engaged in home duties 2001 72.8 100.0 88.4 76.5 96.1 56.7 82.7
2004 100.0 100.0 73.8 90.6 66.8 72.8 79.7
2007 100.0 100.0 83.3 82.8 74.4 62.5 81.2
Retired or on a pension 2001 59.7 77.2 76.7 78.5 78.4 78.7 78.5
2004 9.4 75.6 87.7 83.1 84.2 81.8 82.1
2007 100.0 91.2 73.7 94.7 87.1 81.9 82.8
Unable to work 2001 . . . . . . . . . . . . . .
2004 100.0 83.3 83.4 73.1 79.4 76.7 78.6
2007 100.0 89.5 71.8 68.3 73.7 54.0 70.6
Other 2001 . . . . . . . . . . . . . .
2004 84.0 86.1 73.2 76.5 94.2 78.8 81.6
2007 51.2 60.6 95.3 68.6 88.8 92.1 77.5 Main language spoken at home
English 2001 75.6 94.4 93.0 90.0 88.8 80.8 87.8
2004 72.6 94.3 92.7 93.2 91.5 83.6 88.9
2007 72.3 95.2 92.8 91.6 91.4 83.9 88.6
Other 2001 43.9 70.7 64.8 70.3 65.1 68.5 65.1
2004 45.9 72.9 71.7 70.6 63.8 73.1 67.4
2007 50.9 63.0 62.2 63.8 71.3 67.1 63.6 Socioeconomic status
1st quintile 2001 72.6 92.4 86.7 87.0 84.9 78.5 84.4
2004 57.8 94.0 88.6 85.2 90.1 80.1 83.9
2007 64.9 87.6 81.2 85.5 84.9 77.3 81.0
2nd quintile 2001 68.0 90.6 88.0 88.4 86.3 76.8 83.9
2004 71.7 91.7 92.4 89.8 87.0 79.3 85.7
2007 66.7 89.4 90.1 86.8 88.5 79.8 84.3 (continued)

39
Table B.1a (continued): Alcohol consumption(a) characteristics, males aged 14 years or older, by age group, 2001, 2004 and 2007 (per cent)
Characteristic Survey 14–19 20–29 30–39 40–49 50–59 60+ Aged 14+ 3rd quintile 2001 71.6 90.9 91.4 88.9 85.7 81.4 86.0 2004 69.6 89.3 90.8 92.2 88.0 81.1 86.2 2007 78.4 88.9 87.1 84.0 89.2 83.3 85.5 4th quintile 2001 73.2 91.8 93.2 86.7 86.6 82.7 86.6 2004 72.4 92.9 90.4 93.7 91.4 85.1 88.7 2007 72.5 88.9 91.8 93.1 90.4 82.4 87.5 5th quintile 2001 78.3 92.6 92.5 90.7 92.5 81.5 88.4 2004 73.0 92.9 92.7 94.3 90.9 87.4 89.8 2007 70.2 89.4 92.6 93.7 95.0 90.0 89.8
Geography Major cities 2001 71.7 91.0 88.4 87.6 88.1 80.7 85.4 2004 67.6 90.7 90.8 90.5 89.2 82.9 86.6 2007 68.5 87.5 87.3 88.9 90.3 84.3 85.5 Inner regional 2001 70.7 91.8 94.4 90.9 87.2 78.1 86.6 2004 74.8 95.2 90.6 94.8 90.6 82.0 88.0 2007 78.8 90.3 93.3 90.8 88.7 80.8 87.0 Outer regional 2001 77.2 93.3 92.5 89.1 87.1 79.0 86.3 2004 73.0 97.6 93.2 88.3 90.5 82.6 88.3 2007 70.1 97.3 93.2 88.9 91.4 78.0 86.4 Remote and Very remote 2001 88.1 99.7 89.2 92.9 71.1 71.0 87.2 2004 60.5 99.3 94.9 98.0 87.3 84.4 89.4 2007 69.6 98.4 97.7 87.0 91.4 81.8 89.1
Marital status Never married 2001 72.9 91.0 87.3 82.8 85.2 67.9 82.8 2004 69.8 92.4 89.5 86.7 85.6 78.8 83.2 2007 70.4 87.6 84.4 87.6 79.3 78.3 80.8 Divorced/separated/widowed 2001 60.9 93.4 91.0 90.2 89.6 76.4 86.0 2004 0.0 98.5 88.9 92.8 85.3 80.7 86.3 2007 100.0 91.9 92.0 90.4 90.9 79.5 86.3 Married/de facto 2001 64.5 93.2 90.9 89.1 87.4 80.9 87.4 2004 82.9 91.2 91.8 92.1 90.4 83.4 89.3 2007 80.1 94.0 90.4 89.6 91.0 83.7 88.7
(a) Daily, weekly or less-than-weekly consumed in the previous 12 months.

40
Table B.1b: Alcohol consumption(a) characteristics, females aged 14 years or older, by age group, 2001, 2004 and 2007 (per cent)
Characteristic Survey 14–19 20–29 30–39 40–49 50–59 60+ Aged 14+ Employment
Currently employed 2001 87.9 92.4 87.4 87.4 84.4 75.4 87.4 2004 89.4 91.1 90.1 90.1 85.9 82.3 89.0 2007 87.8 89.2 90.0 89.0 86.4 84.5 88.4 Student 2001 72.1 82.5 65.7 89.9 78.3 86.2 75.0 2004 66.8 85.4 88.2 92.7 85.5 0.0 73.9 2007 65.8 82.2 68.1 84.6 72.7 49.7 70.7 Unemployed 2001 79.3 97.0 83.6 71.6 83.6 100.0 83.5 2004 91.8 85.1 73.2 74.0 78.9 83.7 79.8 2007 81.6 77.0 72.7 72.8 84.7 86.0 77.1 Engaged in home duties 2001 59.7 82.8 80.4 76.9 69.4 67.2 76.9 2004 88.4 73.2 84.3 79.3 68.6 70.1 77.5 2007 87.4 80.8 83.6 83.0 77.4 65.5 79.9 Retired or on a pension 2001 95.0 84.6 77.6 67.1 70.3 66.0 67.2 2004 34.7 78.6 86.1 72.4 75.2 66.7 68.2 2007 100.0 85.6 72.9 68.5 76.7 66.8 68.1 Unable to work 2001 . . . . . . . . . . . . . . 2004 100.0 90.8 61.9 67.5 71.2 50.5 68.5 2007 31.0 65.9 76.1 71.2 67.0 60.8 66.7 Other 2001 . . . . . . . . . . . . . . 2004 82.6 72.9 80.3 69.0 73.3 58.4 72.7 2007 60.7 76.7 77.5 77.7 71.8 72.3 74.9
Main language spoken at home English 2001 77.7 91.5 86.8 85.1 79.5 67.2 81.0 2004 75.6 89.5 89.6 88.5 82.7 69.1 82.3 2007 74.8 90.6 89.8 88.7 82.9 69.5 82.3 Other 2001 47.5 58.3 39.3 47.7 45.0 53.3 49.0 2004 37.7 60.7 51.4 46.3 39.6 56.8 51.3 2007 32.7 49.7 42.8 51.3 59.3 58.1 48.6
Socioeconomic status 1st quintile 2001 70.6 82.7 79.8 77.9 71.4 61.1 73.4 2004 68.2 80.5 84.0 80.1 71.8 57.7 72.7 2007 76.0 82.3 83.2 84.3 76.2 58.0 73.9 2nd quintile 2001 72.8 87.5 80.6 83.0 75.5 63.1 76.8 2004 68.0 87.4 83.5 80.5 74.5 63.1 75.7 2007 72.4 86.9 81.7 82.0 78.8 63.9 77.0 3rd quintile 2001 72.4 91.3 83.8 81.3 82.4 66.4 79.4 2004 76.6 84.1 89.2 86.1 81.8 67.8 80.7 2007 71.5 82.7 87.3 84.3 79.9 67.3 78.7
(continued)

41
Table B.1b (continued): Alcohol consumption(a) characteristics, females aged 14 years or older, by age group, 2001, 2004 and 2007 (per cent)
Characteristic Survey 14–19 20–29 30–39 40–49 50–59 60+ Aged 14+
2004 77.4 87.6 86.5 88.5 84.9 70.2 82.8
2007 65.3 82.1 85.7 86.0 84.5 69.9 79.7
5th quintile 2001 81.3 91.4 89.1 88.3 82.1 74.5 84.3
2004 71.7 91.4 90.4 92.6 86.5 81.6 86.5
2007 73.3 91.3 92.5 91.5 87.5 83.1 87.3
Geography
Major cities 2001 72.2 87.0 82.1 83.4 79.8 68.1 79.0
2004 70.7 85.1 85.2 85.3 80.0 70.3 79.7
2007 68.0 83.4 85.3 85.2 83.1 72.0 79.9
Inner regional 2001 80.8 92.3 85.5 83.4 76.1 66.1 80.1
2004 79.1 90.9 90.4 89.2 81.9 67.6 81.9
2007 74.9 88.1 88.4 86.9 79.8 63.2 79.1
Outer regional 2001 72.7 90.8 90.4 84.7 73.7 63.2 78.1
2004 68.1 91.6 90.0 86.7 80.6 60.0 79.0
2007 83.1 92.4 90.5 89.4 79.7 60.9 80.6
Remote and Very remote 2001 97.2 93.2 83.2 78.8 71.8 44.4 79.7
2004 85.1 87.0 96.9 84.7 79.2 54.3 83.0
2007 85.8 96.2 88.0 87.8 80.3 71.9 85.6
Marital status Never married 2001 74.0 90.0 81.7 76.0 67.1 66.3 80.6
2004 72.3 88.6 86.4 80.9 82.1 61.2 80.6
2007 70.8 86.1 87.4 84.0 83.0 64.1 79.1
Divorced/separated/widowed 2001 91.9 86.8 84.8 83.5 78.8 61.3 72.2
2004 0.0 78.0 87.9 87.1 82.1 66.3 75.4
2007 100.0 86.5 81.8 83.5 83.8 65.7 73.7
Married/de facto 2001 85.9 87.1 84.3 84.4 78.3 69.4 80.3
2004 96.5 84.3 87.2 86.9 80.1 70.0 81.6
2007 85.4 84.3 86.6 87.2 81.9 71.5 82.0
(a) Daily, weekly or less-than-weekly consumed in the previous 12 months.

42
Table B.2: Characteristics of Australians aged 14 years and over by drinking status, 2007 (per cent)
Characteristic Daily Weekly
Less than
weekly Ex-
drinker
Never a full
serve Main language spoken at home English 8.2 41.8 32.8 6.7 10.2 Other than English 4.8 24.2 32.0 7.3 31.8 Post school qualification Trade related qualification 11.6 47.7 30.6 6.3 3.8 Non-trade qualification (including diploma and associate diploma) 8.1 45.1 33.1 7.0 6.7 Bachelor or higher 7.3 49.6 31.0 4.3 7.8 No post-school qualification 6.5 31.4 34.1 7.9 20.1 Preferred alcoholic beverages Cask wine 21.0 57.8 21.3 — — Bottled wine 9.9 56.5 33.7 — — Beer (all types) 11.7 58.0 30.3 — — Pre-mixed (bottles or cans) 3.9 47.4 48.7 — — Bottled spirits and fortified wine 4.1 50.2 45.6 — — Smoking status Daily smoker 13.2 44.1 33.3 7.2 2.3 Ex-smoker 14.0 49.6 27.3 7.5 1.6 Non-smoker 3.8 33.6 35.6 6.6 20.7 Occasional smoker 7.0 66.9 22.8 1.9 1.4 Employment status Self-employed 10.9 52.1 26.2 5.5 5.3 Employed for wages 7.0 49.8 33.2 4.5 5.6 Unemployed 6.1 32.8 44.7 7.3 9.1 Student 0.9 22.0 45.6 3.7 27.7 Retired 15.3 33.1 26.5 12.9 12.2 Other (home duties, and unable to work) 4.4 31.0 42.1 11.1 11.4 Marital status Never married 2.7 33.3 36.6 4.5 22.8 Widowed 12.4 25.8 29.6 14.7 17.5 Separated (including divorced) 10.3 40.2 32.7 10.3 6.4 Married (including de facto) 9.7 44.3 31.4 6.9 7.8 Family type Person living alone 11.8 36.1 29.1 12.2 10.9 Couple living alone or living with non-dependent children 11.2 43.1 29.4 7.5 8.9 Couple with dependent children 5.3 38.9 35.6 4.9 15.3 Single parents (living with dependent and non-dependent children) 4.1 35.2 39.6 7.2 13.9 Living with non related adults, and other family types 5.8 41.8 34.0 6.5 11.9 Peer group All or most friends drink alcohol 10.1 52.8 31.1 3.5 2.9 Fewer than half drink alcohol 4.2 18.1 35.8 12.6 29.4 Perception of harm from own drinking status Somewhat or very harmful 14.8 56.3 15.4 3.8 9.7 Not harmful 6.7 37.5 36.0 7.0 12.6

43
Table B.3: Characteristics of Australians aged 14 years and over by short-term risk, 2007 (per cent)
Characteristic Abstainer Low risk Risky High risk Main language spoken at home English 16.9 62.0 10.2 10.6 Other than English 39.1 50.4 4.3 6.2 Post school qualification Trade related qualification 10.2 66.5 10.1 13.3 Non trade qualification (including diploma and associate diploma) 13.7 65.0 10.3 11.0 Bachelor or higher 12.0 70.0 10.0 7.9 No post school qualification 28.0 53.4 8.8 9.7 Preferred alcoholic beverages Cask wine — 75.5 10.6 13.9 Bottled wine — 78.5 11.3 10.2 Beer (all types) — 68.1 15.2 16.7 Pre-mixed spirits (bottles or cans) — 62.8 15.0 22.2 Bottled spirits and fortified wine — 57.6 15.9 26.5 Smoking status Daily smoker 9.4 54.6 13.9 22.1 Ex-smoker 9.2 71.3 11.8 7.8 Non-smoker 27.4 59.3 6.9 6.8 Occasional smoker 3.3 44.2 20.1 32.4 Employment status Self employed 10.8 68.2 12.1 8.9 Employed for wages 10.1 63.2 12.6 14.1 Unemployed 16.4 54.6 12.4 16.6 Student 31.5 46.4 9.4 12.7 Retired 25.1 67.9 4.5 2.5 Other (home duties, and unable to work) 22.5 64.1 6.1 7.3 Marital status Never married 27.3 43.2 11.5 17.9 Widowed 32.2 63.1 3.3 1.4 Separated (including divorced) 16.8 64.2 10.4 8.7 Married (including de facto) 14.7 69.3 9.0 7.2 Family type Person living alone 23.0 60.5 8.7 7.7 Couple living alone or living with non-dependent children 16.3 67.0 8.5 8.2 Couple with dependent children 20.3 60.9 9.9 8.9 Single parents (living with dependent and non-dependent children) 21.1 53.1 11.8 14.1 Living with non related adults, and other family types 18.5 49.1 10.9 21.5 Peer group All or most friends drink alcohol 6.4 65.5 13.7 14.8 Fewer than half drink alcohol 42.0 53.3 2.5 2.3 Perception of harm from own drinking status Somewhat or very harmful 13.4 38.2 19.5 28.9 Not harmful 19.6 65.4 7.9 7.0

44
Table B.4: Logistic regression details: risky and high-risk drinking behaviour, drinkers aged 14 years and over, 2007
Variables Coefficient
Linearised standard
error t P>|t| 95% confidence
interval Sex (Female as base) Male –0.1956 0.0750 –2.61 0.009 –0.3428 –0.0485Age (Age 60+ as base) 14–19 years 1.7426 0.2223 7.84 0.000 1.3066 2.1786 20–29 years 1.6913 0.1697 9.96 0.000 1.3583 2.0243 30–39 years 1.0947 0.1581 6.92 0.000 0.7846 1.4048 40–49 years 0.7818 0.1512 5.17 0.000 0.4853 1.0784 50–59 years 0.4205 0.1397 3.01 0.003 0.1464 0.6946Main language spoken at home (English as base)
Other than English –1.2988 0.2438 –5.33 0.000 –1.7771 –0.8205Post school qualification (no post school qualification as base)
Trade qualification 0.1059 0.0899 1.18 0.239 –0.0705 0.2822
Non trade qualification (including diploma/associate diploma) 0.0569 0.0948 0.60 0.549 –0.1291 0.2428
Bachelor higher –0.3546 0.0880 –4.03 0.000 –0.5273 –0.1819
Preferred alcoholic beverages
Cask wine 0.2921 0.0881 3.32 0.001 0.1193 0.4649 Bottled wine –0.1507 0.0690 –2.18 0.029 –0.2860 –0.0154 Beer (all types) 0.7993 0.0706 11.32 0.000 0.6608 0.9377 Pre-mixed spirits (bottles or cans) –0.1389 0.0943 –1.47 0.141 –0.3240 0.0461 Bottled spirits and fortified wine 0.5877 0.0945 6.22 0.000 0.4023 0.7731
Smoking status (not a daily smoker including non-smoker as base)
Daily smoker 0.7146 0.0754 9.48 0.000 0.5667 0.8625
Employment status (Retired as base)
Self employed 0.2605 0.1499 1.74 0.082 –0.0335 0.5545 Employed for wages 0.2262 0.1318 1.72 0.086 –0.0323 0.4847 Unemployed 0.3286 0.2435 1.35 0.177 –0.1491 0.8064 Student –0.3239 0.1878 –1.72 0.085 –0.6924 0.0445 Other (home duties, and unable to work) –0.1969 0.1559 –1.26 0.207 –0.5026 0.1088
Marital status (Married as base)
Never married 0.2871 0.1280 2.24 0.025 0.0361 0.5382 Widowed –0.2238 0.2616 –0.86 0.392 –0.7369 0.2893 Separated (including divorced) 0.1841 0.1435 1.28 0.199 –0.0973 0.4656
Family type (Couple living alone or living with non-dependent children as base)
Person living alone 0.2170 0.1324 1.64 0.101 –0.0427 0.4768 Couple with dependent children –0.0815 0.0863 –0.94 0.345 –0.2507 0.0878
Single parents (living with dependent/non-dependent children) 0.0242 0.1492 0.16 0.871 –0.2684 0.3168
Living with non related adults, and other family types 0.1225 0.1337 0.92 0.360 –0.1397 0.3848
Peer group (Most friends drink alcohol as base)
Half or fewer friends drink alcohol –1.2408 0.1004 –12.36 0.000 –1.4376 –1.0439
Perception of harm from own drinking status (Not harmful as base)
Somewhat or very harmful 1.5758 0.0707 22.30 0.000 1.4372 1.7144
Constant –2.8339 0.1290 –21.96 0.000 –3.0870 –2.5808
Number of strata = 8 Number of obs = 11,248 Number of PSUs = 1,499 Population size = 8,501,905
Design df = 1,491 F(30,1462) = 48.48 Prob > F = 0.0000

45
Table B.5: Relative consumption of alcoholic beverages by age and sex, population aged 14 years or older, 2001 (per cent)
Beverage type 14–19 20–29 30–39 40–49 50–59 60+ Aged 14+ Males Home-brewed beer 0.4 0.8 1.2 3.4 3.3 2.9 2.0 Regular-strength beer 27.2 38.9 40.6 28.0 32.5 22.1 32.5 Mid-strength beer 1.8 2.5 6.3 7.7 8.0 6.1 5.6 Low-alcohol beer 0.3 1.2 2.4 4.6 6.2 6.9 3.6 Total beer 29.7 43.4 50.5 43.7 50.0 38.1 43.7 Homemade wine . . . . . . . . . . . . . . Cask wine 1.6 2.1 5.5 10.2 13.8 20.4 8.7 Bottled wine 1.6 6.2 16.0 19.3 23.2 20.1 14.9 Total wine 3.2 8.3 21.5 29.5 37.0 40.5 23.6 Pre-mixed spirits in cans 14.8 8.4 6.0 2.2 0.7 0.3 5.0 Pre-mixed spirits in bottles 1.5 0.7 0.4 0.3 0.0 0.0 0.4 Bottled spirits 50.7 38.7 20.1 21.9 9.2 15.8 25.1 Total spirits 67.0 47.9 26.5 24.3 9.9 16.2 30.5 Fortified wine, port, etc. 0.1 0.4 1.5 2.4 3.1 5.2 2.1 Total males (’000 standard drinks) 2,240 4,727 4,038 4,227 3,738 3,064 22,034 Females Home-brewed beer 0.0 0.3 1.0 0.7 0.5 0.4 0.5 Regular-strength beer 7.1 13.8 11.6 6.4 3.5 4.2 8.5 Mid-strength beer 0.4 1.2 1.2 2.1 1.2 1.1 1.3 Low-alcohol beer 0.4 0.4 1.3 1.4 1.6 1.6 1.1 Total beer 7.8 15.7 15.1 10.6 6.8 7.3 11.4 Homemade wine . . . . . . . . . . . . . . Cask wine 6.9 9.5 13.1 18.1 24.8 33.0 16.7 Bottled wine 4.8 19.9 30.0 41.8 44.7 32.3 29.2 Total wine 11.7 29.4 43.1 59.9 69.4 65.4 45.9 Pre-mixed spirits in cans 8.2 5.2 5.8 1.7 1.1 0.1 3.8 Pre-mixed spirits in bottles 6.4 4.4 2.7 1.1 0.6 0.2 2.6 Bottled spirits 65.0 44.8 31.5 24.4 18.6 15.3 33.3 Total spirits 79.6 54.3 40.0 27.3 20.3 15.6 39.7 Fortified wine, port, etc. 0.9 0.6 1.8 2.2 3.5 11.7 3.1 Total females (’000 standard drinks) 1,451 2,828 2,404 2,322 1,618 1,660 12,284

46
Table B.6: Relative consumption of alcoholic beverages by age and sex, population aged 14 years or older, 2004 (per cent)
Beverage type 14–19 20–29 30–39 40–49 50–59 60+ Aged 14+
Males Home-brewed beer 1.7 1.4 4.7 2.7 3.6 5.2 3.2 Regular-strength beer 27.2 41.7 39.9 40.6 27.9 20.7 34.7 Mid-strength beer 2.6 3.0 6.7 7.6 6.0 7.4 5.7 Low-alcohol beer 1.7 0.7 2.8 3.6 4.4 7.1 3.3 Total beer 33.2 46.7 54.2 54.6 42.0 40.4 47.0
Homemade wine 0.4 0.5 0.7 1.2 0.8 1.9 0.9 Cask wine 7.0 1.1 3.2 8.3 11.6 17.1 7.5 Bottled wine 11.9 6.9 18.5 22.8 23.7 24.7 17.9 Total wine 19.4 8.5 22.4 32.3 36.1 43.7 26.3
Pre-mixed spirits in cans 18.1 11.5 10.3 4.7 2.4 0.4 7.0 Pre-mixed spirits in bottles 9.4 2.7 0.5 0.5 0.1 0.2 1.4 Bottled spirits 18.9 30.2 12.3 6.8 17.0 12.6 17.1 Total spirits 46.3 44.3 23.1 12.0 19.5 13.2 25.5
Fortified wine, port, etc. 1.1 0.4 0.3 1.1 2.4 2.7 1.3 Total males (’000 standard drinks) 1,011 5,508 3,783 3,855 3,800 3,387 21,344
Females
Home-brewed beer 0.9 0.1 1.0 0.3 1.0 1.2 0.7 Regular-strength beer 13.1 12.8 14.6 8.0 4.1 4.8 9.1 Mid-strength beer 1.1 1.4 1.7 2.0 2.3 1.1 1.7 Low-alcohol beer 0.7 0.5 1.7 1.6 1.8 1.7 1.4 Total beer 15.8 14.8 19.0 11.9 9.2 8.7 12.9
Homemade wine 0.3 0.2 0.3 2.4 0.6 1.5 1.0 Cask wine 3.5 5.8 11.6 22.3 16.6 28.5 16.3 Bottled wine 5.8 29.2 42.3 45.4 47.2 46.2 39.9 Total wine 9.7 35.2 54.2 70.1 64.4 76.2 57.2
Pre-mixed spirits in cans 22.9 13.9 10.2 2.8 1.2 0.3 6.7 Pre-mixed spirits in bottles 15.1 10.2 2.4 1.5 0.8 0.3 3.7 Bottled spirits 36.0 25.5 13.5 12.2 22.9 10.4 17.9 Total spirits 74.0 49.6 26.2 16.6 24.9 10.9 28.3
Fortified wine, port, etc. 0.5 0.4 0.6 1.5 1.4 4.2 1.5 Total females (’000 standard drinks) 590 1,546 1,631 1,962 1,611 1,604 8,943

47
Table B.7: Relative consumption of alcoholic beverages by age and sex, population aged 14 years or older, 2007
Beverage type 14–19 20–29 30–39 40–49 50–59 60+ Aged 14+
Males Home-brewed beer 3.4 1.1 1.8 2.4 3.8 5.0 2.9 Regular-strength beer 30.0 48.6 44.7 43.3 33.2 20.7 37.4 Mid-strength beer 2.7 2.3 7.8 11.0 7.8 7.7 7.0 Low-alcohol beer 0.2 0.5 2.5 2.3 4.3 4.6 2.7 Total beer 36.3 52.5 56.8 59.0 49.1 38.0 50.0
Homemade wine 0.0 0.4 0.7 0.4 0.7 1.9 0.8 Cask wine 3.4 1.4 3.0 3.7 8.5 15.1 6.2 Bottled wine 2.9 8.1 16.7 21.1 30.1 32.7 20.4 Total wine 6.3 9.9 20.4 25.2 39.3 49.7 27.4
Pre-mixed spirits in cans 24.3 17.2 12.2 5.6 2.9 0.6 8.9 Pre-mixed spirits in bottles 12.4 1.6 1.6 1.0 0.4 0.0 1.7 Bottled spirits 20.3 18.6 8.5 8.3 5.9 9.2 10.8 Total spirits 57.0 37.4 22.3 14.9 9.2 9.8 21.4
Fortified wine, port, etc. 0.2 0.3 0.3 1.0 2.3 2.6 1.2 Total males (’000 standard drinks) 1,364 3,509 3,435 3,586 3,345 3,650 18,889
Females
Home-brewed beer 0.8 1.0 0.1 0.1 0.8 1.2 0.6 Regular-strength beer 5.9 10.7 15.7 9.5 8.7 5.1 9.7 Mid-strength beer 10.7 1.7 1.3 1.9 1.3 1.3 2.1 Low-alcohol beer 0.3 0.3 2.9 1.2 1.0 1.5 1.3 Total beer 17.7 13.7 20.0 12.7 11.8 9.1 13.7
Homemade wine 0.0 1.0 0.6 0.3 1.6 1.7 1.0 Cask wine 1.7 6.2 9.5 13.4 16.9 22.7 12.7 Bottled wine 4.1 35.7 47.5 52.7 57.5 49.5 45.3 Total wine 5.8 42.9 57.6 66.4 76.0 73.9 59.0
Pre-mixed spirits in cans 27.4 9.1 8.4 6.2 4.7 0.1 7.2 Pre-mixed spirits in bottles 15.7 5.7 3.0 3.2 0.4 0.1 3.5 Bottled spirits 32.7 27.4 9.6 9.2 6.0 10.4 14.4 Total spirits 75.8 42.2 21.0 18.6 11.1 10.6 25.1
Fortified wine, port, etc. 0.6 1.2 1.5 2.2 1.1 6.3 2.3 Total females (’000 standard drinks) 585 2,097 1,646 1,917 1,528 1,754 9,527

48
References
ABS (Australian Bureau of Statistics) 2003. ASGC Remoteness classification: Purpose and use. ABS Census paper 03/01. Canberra.
ABS 2009. A picture of the nation: The Statistician’s report on the 2006 Census. ABS Cat. no. 2070.0. Canberra: ABS.
Campbell RT & Hudson CM 1985. Synthetic cohorts from panel surveys: an approach to studying rare events. Research on Ageing 7(1):81–93.
Kreuter F, Presser S & Tourangeau R 2008. Social desirability bias in CATI, IVR and web surveys: The effects of mode and question sensitivity. Public Opinion Quarterly 72(5):847–865.
Lind K, Link M & Oldendick R 1997. A comparison of the accuracy of the last birthday versus the next birthday methods for random selection of household respondents. 55th Annual Conference of the American Association for Public Opinion Research &World Association for Public Opinion Research. May 17–21, 2000, Portland, Oregon.
Loxley W, Toumbourou J, Stockwell T, Haines B, Scott K, Godfrey C et al. 2004. The prevention of substance use, risk and harm in Australia: a review of the evidence. Canberra: Department of Health and Ageing.
MCDS (Ministerial Council on Drug Strategy) 2006. National alcohol strategy 2006–2009. Canberra: MCDS.
NHMRC (National Health and Medical Research Council) 2001. Australian alcohol guidelines: health risks and benefits. Canberra: Commonwealth of Australia.
NHMRC 2009. Australian guidelines to reduce health risk from drinking alcohol. Canberra: NHMRC.
Unwin E & Serafino F 1995. A study of hospitalisation and mortality due to alcohol use in the Pilbara region and Western Australia. Perth: Health Department of Western Australia.
Wilks R, Younger N, Mullings J, Zohoori N, Figueroa P, Tulloch-Reid M et al. 2007. Factors affecting study efficiency and item non-response in health surveys in developing countries: the Jamaica national healthy lifestyle survey. BMC Medical Research Methodology 7(13).


![ETHICAL RESEARCH AND INDIGENOUS AUSTRALIA [2001]](https://img.pdfslide.net/doc/110x75/63463a00596bdb97a9094b6b/ethical-research-and-indigenous-australia-2001.jpg)

