Embed Size (px)
Citation preview

Dual Regulation of Muscle Glycogen Synthase duringExercise by Activation and Compartmentalization*
Received for publication, February 5, 2009, and in revised form, March 30, 2009 Published, JBC Papers in Press, April 1, 2009, DOI 10.1074/jbc.M900845200
Clara Prats‡1, Jørn W. Helge‡, Pernille Nordby‡, Klaus Qvortrup‡, Thorkil Ploug‡, Flemming Dela‡,and Jørgen F. P. Wojtaszewski§2
From the ‡Copenhagen Muscle Research Center, Center for Healthy Ageing, Department of Biomedical Sciences, and §MolecularPhysiology Group, Institute of Exercise and Sport Sciences, University of Copenhagen, DK-2200 Copenhagen N, Denmark
Glycogen synthase (GS) is considered the rate-limitingenzyme in glycogenesis but still today there is a lack of under-standing on its regulation.We have previously shown phospho-rylation-dependent GS intracellular redistribution at the startof glycogen re-synthesis in rabbit skeletal muscle (Prats, C.,Cadefau, J. A., Cusso, R., Qvortrup, K., Nielsen, J. N., Wojtasze-wki, J. F., Wojtaszewki, J. F., Hardie, D. G., Stewart, G., Hansen,B. F., and Ploug, T. (2005) J. Biol. Chem. 280, 23165–23172). Inthe present studywe investigate the regulation of humanmuscleGS activity by glycogen, exercise, and insulin. Using immunocy-tochemistry we investigate the existence and relevance of GSintracellular compartmentalization during exercise and duringglycogen re-synthesis. The results show thatGS intrinsic activityis strongly dependent on glycogen levels and that such regula-tion involves associated dephosphorylation at sites 2�2a, 3a,and 3a � 3b. Furthermore, we report the existence of severalglycogenmetabolismregulatorymechanismsbasedonGS intra-cellular compartmentalization. After exhausting exercise, epi-nephrine-inducedprotein kinaseAactivation leads toGS site 1bphosphorylation targeting the enzyme to intramyofibrillar gly-cogen particles, which are preferentially used during musclecontraction. On the other hand, when phosphorylated at sites2�2a, GS is preferentially associated with subsarcolemmal andintermyofibrillar glycogen particles. Finally, we verify the exist-ence in human vastus lateralismuscle of the previously reportedmechanism of glycogen metabolism regulation in rabbit tibialisanterior muscle. After overnight low muscle glycogen leveland/or in response to exhausting exercise-induced glycogenol-ysis, GS is associated with spherical structures at the I-band ofsarcomeres.
The desire to understand metabolism and its regulationdates back several centuries, but it has exponentially increasedduring the last decades in an effort to treat or prevent type 2
diabetes mellitus (T2DM).3 Defective muscle glycogen synthe-sis has been repeatedly reported in patients with T2DM (1–3).Several studies have shown impairments of insulin-inducedglycogen synthase (GS) activation in skeletal muscle fromT2DM patients and in healthy subjects at increased risk forT2DM, such as healthy obese and first-degree relatives ofpatients with T2DM (4–9).The first scientific studies onGSdate from the 1960s, but still
today there is a lack of understanding on its regulation.GS is therate-limiting enzyme in glycogenesis and is classically used asan example of an allosterically and covalently regulatedenzyme. It is well accepted that GS is complexly regulated bysequences of hierarchal phosphorylations (10) in at least ninesites and by its allosteric activator, glucose 6-phosphate (G6P)(11, 12). However, the exact effects of GS phosphorylation atdifferent sites on its regulation are still not clear. GS phospho-rylation sites are distributed between theNH2- and theCOOH-terminal domains. The NH2 terminus domain contains twosites, 2 (Ser7) and 2a (Ser10), that are phosphorylated in a hier-archal mode. Phosphorylation of site 2 is needed as a recogni-tion motif for casein kinase 1 to phosphorylate site 2a (13, 14).Several protein kinases have been reported to phosphorylatesite 2 in vitro, among them PKA, CaMKII, PKC, AMPK, GPhK,and MAPKAPKII (15–17). At the COOH terminus of muscleGS, there are at least seven phosphorylation sites; sites 3a(Ser640), 3b (Ser644), 3c (Ser648), 4 (Ser652), 5 (Ser656), 1a (Ser697),and 1b (Ser710). Sites 3, 4, and 5 are phosphorylated in a hierar-chalmode. Casein kinase II phosphorylates site 5, establishing arecognitionmotif forGSK-3 to phosphorylate sequentially sites4, 3c, 3b, and 3a (18–21). Dephosphorylation of sites 2 and 3increase GS intrinsic activity much more than dephosphoryla-tion of the remaining sites, which have little or no effect on theenzyme activity (22). The effect of GS phosphorylation at sites1a and 1b remains elusive. G6P binding reverses covalent inac-tivation of GS by phosphorylation (11) and increases suscepti-bility of the enzyme to be activated by the action of proteinphosphatases (23), mainly by glycogen-targeted protein phos-phatase 1.Intracellular compartmentalization of GS has been reported
in several studies. In isolated hepatocytes, incubation with glu-cose induces GS activation and intracellular translocation to
* This work was supported in part by The Copenhagen Muscle Research Cen-tre, the Novo Nordisk Research Foundation, The Danish Diabetes Associa-tion, the Lundbeck Foundation, the Velux Foundation, the Foundation of1870, Direktør Jacob and Olga Madsens Foundation, Aase and EjnarDanielsens foundation, and an Integrated Project (Grant LSHM-CT-2004-005272) funded by the European Commission and The Danish MedicalResearch Council.
1 To whom correspondence should be addressed: Blegdamsvej 3, 2200Copenhagen N, Denmark. Tel.: 45-3532-7423; Fax: 45-3532-7555; E-mail:[email protected].
2 Supported by a Hallas Møller Fellowship from The Novo NordiskFoundation.
3 The abbreviations used are: T2DM, type 2 diabetes mellitus; GS, glycogensynthase; G6P, glucose 6-phosphate; PKA, protein kinase A; VL, vastus late-ralis; FV, fractional velocity; glc, glucose; CHO, carbohydrate; GSI, glycogensynthase glucose 6-phosphate-independent form.
THE JOURNAL OF BIOLOGICAL CHEMISTRY VOL. 284, NO. 23, pp. 15692–15700, June 5, 2009© 2009 by The American Society for Biochemistry and Molecular Biology, Inc. Printed in the U.S.A.
15692 JOURNAL OF BIOLOGICAL CHEMISTRY VOLUME 284 • NUMBER 23 • JUNE 5, 2009
at Copenhagen U
niversity Library, on May 1, 2012
ww
w.jbc.org
Dow
nloaded from

the cell periphery (24). In contrast, in the absence of glucose,GShas been shown to be mainly located inside the nucleus of bothcultured liver and muscle cells; however, following addition ofglucose GS translocates to the cytosol (25). In a previous study,we reported a novel regulatory mechanism of skeletal muscleglycogen metabolism (26). We showed that severe glycogendepletion induced by muscle contraction leads to rearrange-ment of cytoskeleton actin filaments to form dynamic intracel-lular compartments. BothGS and phosphorylase associate withsuch compartments to start glycogen re-synthesis. Further-more, we showed that GS phosphorylated at site 1b (P-GS1b)was located at the cross-striations, the I-band of sarcomeres,whereas when phosphorylated at sites 2�2a (P-GS2�2a), GSformed some clusters homogeneously distributed alongmusclefibers. In the present study we investigate the existence andrelevance of such regulatory mechanism in human musclemetabolism.
EXPERIMENTAL PROCEDURES
Ten healthy young well trained male subjects (age 26 � 1years, body mass index of 24.4 � 0.7 kg � m�2 and VO2max of57 � 2 ml of O2 � (min � kg)�1 were included in the study; allsubjects gave verbal and written consent to participate. Thestudy was approved by the ethical committee of Copenhagenand Frederiksbergmunicipality (01-257174) and adhered to theHelsinki Declaration.The experiment was performed on two consecutive days. On
day 1 a leg was randomly appointed as the glycogen pre-de-pleted leg, and this leg completed a glycogen depletion exerciseprotocol using a knee extension ergometer (27). The protocolconsisted of a 30-min warm-up exercise (50% Wmax) followedby a total of 39 consecutive 3-min intervals of kicking at maxi-mal sustainable workload. Between each working interval, sub-jects were allowed to rest for 2 min by kicking at 0% Wmax.When unable to complete the working interval, the workloadwas lowered 5%. Afterward subjects performed 1 h of armcranking at 75% of maximal heart rate using an Angio armergometer (Lode BV, Groningen, TheNetherlands) to decreaseupper-body muscles and liver glycogen stores. Thereafter, sub-jects went home and were only allowed to eat 6500 kJ of a stan-dardizedmeal containing 25% energy (E%) protein, 5 E% carbo-hydrate, and 70 E% fat until the next day. On day 2, the subjectsreturned overnight fasted, muscle biopsies were obtained fromvastus lateralis (VL) muscle, as previously described (28). Next,subjects initiated an exhausting exercise protocol, whichstarted as a two-leg knee extensor exercise at 85% of Wmax.Blood samples were collected every 30min until and at exhaus-tion. After 60 min of exercise the workload was increased to90% Wmax, after 90 min to 95% Wmax, after 105 min to 100%Wmax, and after 120 min to 105% Wmax until exhaustion. Atexhaustion of the first leg, exercise was stopped and a musclebiopsy was obtained, after that the unexhausted leg kept onkicking until exhaustion, when a biopsy from the secondexhausted VLmuscle was taken. All subjects but one exhaustedthe pre-depleted leg before the control leg. Subjects were thenmoved to a bed where they ingested 1 g of glucose per kilogramof body mass dissolved in 500 ml of water. After 30 min of rest,a muscle biopsy was obtained from the pre-depleted leg and,
immediately after, subjects consumed a high glycemic indexsandwich (1 g of glucose per kilogram of body mass). After 120min of rest a final pre-depleted muscle biopsy was obtained.Throughout the experiment, subjects were allowed unlimitedaccess to water and were encouraged to drink.Analyses of Blood Plasma Substrate and Hormones—Blood
for determination of plasma glucose were analyzed usingconventional commercially available assays on an automaticanalyzer (Hitachi, 612 Automatic Analyzer, and RocheApplied Science). Plasma insulin concentrations were deter-mined by a commercial enzyme-linked immunosorbentassay (DakoCytomation, Great Britain). Arterial plasma epi-nephrine concentrations were determined by a commercialradioimmunoassay (High Sensitive 2 CAT RIA, Labor Diag-nostika, Nord, Germany).Processing of Muscle Biopsies—After the biopsies were
excised the tissue was carefully dissected and a fraction wasrapidly frozen in liquid nitrogen, whereas a second fraction wasimmersed in cold Krebs-Henseleit bicarbonate buffer contain-ing procaine hydrochloride (1 g/liter) for 5min and either fixedfor light or electron microscopy analysis (29, 30).Muscle Glycogen—Muscle glycogen was measured as previ-
ously described (31).Muscle GS Activity—Muscle GS activity was measured in
triplicates using a 96-well plate assay (Unifilter 350 Plates,Whatman, Cambridge, UK) (36). GS activity was determined inthe presence of 8, 0.17, or 0.02 mM G6P and reported as %GSI(100� [activity (0.02mMG6P)/activity (8mMG6P)]) or as %FV(100 � [activity (0.17 mM G6P)/activity (8 mM G6P)]).SDS-PAGE and Western Blotting—Muscle proteins were
separated using 7.5% Tris-HCl gels (Bio-Rad, Denmark), andtransferred (semi-dry) to polyvinylidene difluoride membranes(Immobilon Transfer Membrane, Millipore A/S, Denmark)(32). Primary antibodies used for Western blotting: Anti-GSwas a polyclonal rabbit antibody (32). For detection ofP-GS3a�3b, P-GS2, P-GS2�2a, P-GS1a, and P-GS1b, antibod-ieswere raised against different peptides as described (26, 33). Thespecificity of these antibodies has previously been reported (33).The antibody against P-GS3a was purchased fromCell Signaling.Fluorescence Immunohistochemistry in Single Muscle Fibers—
This was performed as previously described (26). Total GS wasimmunodetected using a rabbit polyclonal antibody (Abcam)or a rabbit antibody raised against a synthetic peptide contain-ing the last nine monoacids from human muscle GS: 729TSSL-GEERN737 (A gift from Prof. Joan J. Ginovart). GS phosphoryl-ated at sites 1a, 1b, 2, 2�2a, or 3a�3b were immunodetectedusing the same phospho-specific antibodies as for Westernblotting. Secondary antibodies conjugated with Alexa 488 orAlexa 568 (Invitrogen)were used. All antibodies were diluted in50 mM glycine, 0.25% bovine serum albumin, 0.03% saponin,and 0.05% sodium azide in phosphate-buffered saline. Betweenincubation periods, muscle fibers were washed with the samebuffer, but the last wash was performed with phosphate-buff-ered saline. Negative controls for each of the staining condi-tions were performed by staining without primary antibody orwithout primary and secondary antibodies. Muscle fibers weremounted in Vectashieldmountingmedium and analyzed. Con-focal images were collected with a TCS SP2microscope (Leica)
GS Regulation by Activation and Compartmentalization
JUNE 5, 2009 • VOLUME 284 • NUMBER 23 JOURNAL OF BIOLOGICAL CHEMISTRY 15693
at Copenhagen U
niversity Library, on May 1, 2012
ww
w.jbc.org
Dow
nloaded from

using a Plan-Apo �63/1.32 oil objective at 20 °C. Imaging set-tings were set so that no signal was detected in the respectivenegative controls and a low fraction of pixels showed saturationintensity values. Confocal z-stack images were collected fromthe surface to the center of muscle fibers, spaced 0.35 �m apartin the z-plane. Projections of four z-planes were constructedand analyzed using Metamorph software (Universal ImagingCorp.).Transmission Electron Microscopy—To perform immuno-
gold labeling of P-GS1b or P-GS2�2a, singlemuscle fiberswereisolated, and immunohistochemistry was performed asdescribed above. Secondary antibodies conjugated to nano-gold particles (Nanoprobes) were used. After the final washsingle muscle fibers were fixed with 2% glutaraldehyde for 1 h,washed 3 � 5 min with 0.1 M Sorensen buffer (pH 7.4) (34) and3 � 5 min with milliQ H2O. Silver enhancement (Nanoprobes)was performed, and muscle fibers were postfixed with 1%osmium in 0.1 M Sorensen buffer (pH 7.4) for 20 min. Musclefibers were then dehydrated in a graded series of ethanol, trans-ferred to propylene oxide, and embedded in Epon according tostandard procedures. Ultrathin sections were cut with aReichert-Jung Ultracut Emicrotome and collected on one-holecopper grids with Formvar supporting membranes. Sectionswere stained with uranyl acetate and lead citrate and examinedwith a Phillips CM100 transmission electronmicroscope oper-ated at an accelerating voltage of 80 kV. Images were collectedusing a Megaview 2 camera and processed with the Analysissoftware package.Statistic Analysis—The data were analyzed using SigmaStat
software. Results are expressed as means � S.E. A one-way
analysis of variance test was used to assess statistical signifi-cance of the difference between groups. The linear dependencebetween different groups of data was assessed by the Pearsonproduct-moment correlation coefficient.
RESULTS
Ten healthy young subjects performed a glycogen depletionexercise protocol with one leg, the pre-depleted leg. Liver andupper-body muscle glycogen storages were also depleted byusing an arm cranking exercise protocol. Subjects went homeandwere only allowed to eat a low carbohydratemeal. Next day,subjects were asked to perform an exhausting exercise withboth legs. Subjects were then given a high glucose drink at theend of the exhausting exercise and a high CHO sandwich after30 min rest.Plasma Glucose and Hormones—Blood samples were col-
lected before and after exhausting exercise and after 30, 60, 90and 120 min of rest. Glucose, insulin and epinephrine bloodconcentrations were measured (Fig. 1, left panel). Duringexhausting exercise, epinephrine increased from 0.43 � 0.05 to2.55 � 0.21 nmol�liter�1, and gradually reversed to basal levelsafter 120 min rest. Glucose levels remained constant duringexhausting exercise. Insulin decreased from 23.2 � 2.0 to 9.8 �1.3 pmol�liter�1 (p � 0.05) during exhausting exercise. Thirtyminutes after the ingestion of glucose drink, glucose and insulinlevels increased to 9.1 � 0.33 mmol�liter�1 (p � 0.001) and183.5 � 15.2 pmol�liter�1 (p � 0.0001), respectively. At thispoint subjects were asked to eat a high CHO sandwich. Thirtyminutes later, glucose levels had further increased to 11.0 �0.46 mmol�liter�1, while plasma insulin concentration had
FIGURE 1. Plasma glucose and hormones. Blood samples were taken every 30 min during the intervention. Vastus lateralis biopsies from nine subjects weretaken before (Basal) and after exhausting exercise (Exhausted) from both Control and Pre-depleted legs. Afterward, subjects ingested 1g of glucose perkilogram body weight and rested for 30 min. Biopsies were taken and subjects ingested another gram of glucose per kilogram body weight. Last biopsies weretaken 2 h after the end of exhausting exercise. Left, plasma glucose, insulin, and epinephrine concentrations were measured before and at 0, 30, 60, 90, and 120min after exhausting exercise. Arrows indicate the intake of 1 g of glucose per kilogram body weight. Results are expressed as means � S.E. (n � 9). Basal plasmaglucose values are 4.85 � 0.073 mmol�liter�1, 4.32 � 0.17 mmol�liter�1 at exhaustion, 9.10 � 0.33 mmol�liter�1 after 30 min rest, 11.03 � 0.462 mmol�liter�1
after 60-min rest, 9.64 � 0.53 mmol�liter�1 after 90-min rest, and 8.05 � 0.417 mmol�liter�1 after 2-h rest. Right, glycogen content, percentage of GS fractionalactivity (%FV) and percentage of GS I form (%GSI) were measured as described under “Experimental Procedures.” Results are expressed as mean � S.E.Statistical significance was assessed by one-way analysis of variance and is represented as *, p � 0.05; **, p � 0.01; and ***, p � 0.005 versus basal; ###, p � 0.005between basal; and §§, p � 0.01 exhausted versus rested.
GS Regulation by Activation and Compartmentalization
15694 JOURNAL OF BIOLOGICAL CHEMISTRY VOLUME 284 • NUMBER 23 • JUNE 5, 2009
at Copenhagen U
niversity Library, on May 1, 2012
ww
w.jbc.org
Dow
nloaded from
increased to 355.7 � 19.2 pmol�liter�1, remaining both signifi-cantly increased after 120 min of rest (Fig. 1, left panel).Muscle Glycogen Content—VL muscle biopsies from both
legs were obtained before and after exhausting exercise, 30minafter the ingestion of the glucose drink and 90min after the inges-tion of the high CHO sandwich biopsies were taken from the pre-depletedmuscle. Before starting the exhausting exercise, glycogencontent in VL muscle was significantly lower in the pre-depletedcomparedwith the controlmuscle, 180.0� 12.3 and 370.0� 24.4nmol glc�(mgdryweight)�1 (p� 0.0005), respectively (Fig. 1, rightpanel). After exhausting exercise, glycogen levels furtherdecreased 54 and 47% in control and pre-depletedmuscle, respec-tively. Glycogen content in exhausted pre-depleted muscle was75% lower than in basal control (p� 0.0005). After 30min of rest,glycogen levels had increased from95�14.3 to 124.5�12.5nmolglc�(mg dry weight)�1, but a statistically significant glycogen re-synthesis (185.0 � 8.8 nmol glc�(mg dry weight)�1) was firstdetected after 120min rest (Fig. 1, right panel).GS Activity and Phosphorylation after Exhausting Exercise
and at the Start of Glycogen Re-synthesis—GS activity wasmeasured in the presence of 8 mM, 0.17 mM, and 0.02 mM G6P.From these, the percentage of fractional velocity (%FV) and ofGSI form (%GSI) were calculated. In control muscle, GS wasactivated by exercise detected both as increased %FV (from30.2 � 2.9 to 51.8 � 5.5% (p � 0.005)) and %GSI (from 20.6 �2.0 to 40.4 � 4.4% (p � 0.005)) (Fig. 1, right panel). Beforeexhausting exercise, pre-depleted muscle had markedly higherGS activity compared with control muscle, with 62.3� 3.8%FVand 51.2 � 4.4%GSI, respectively (Fig. 1, right panel).No significant changes in total GS protein or phosphoryla-
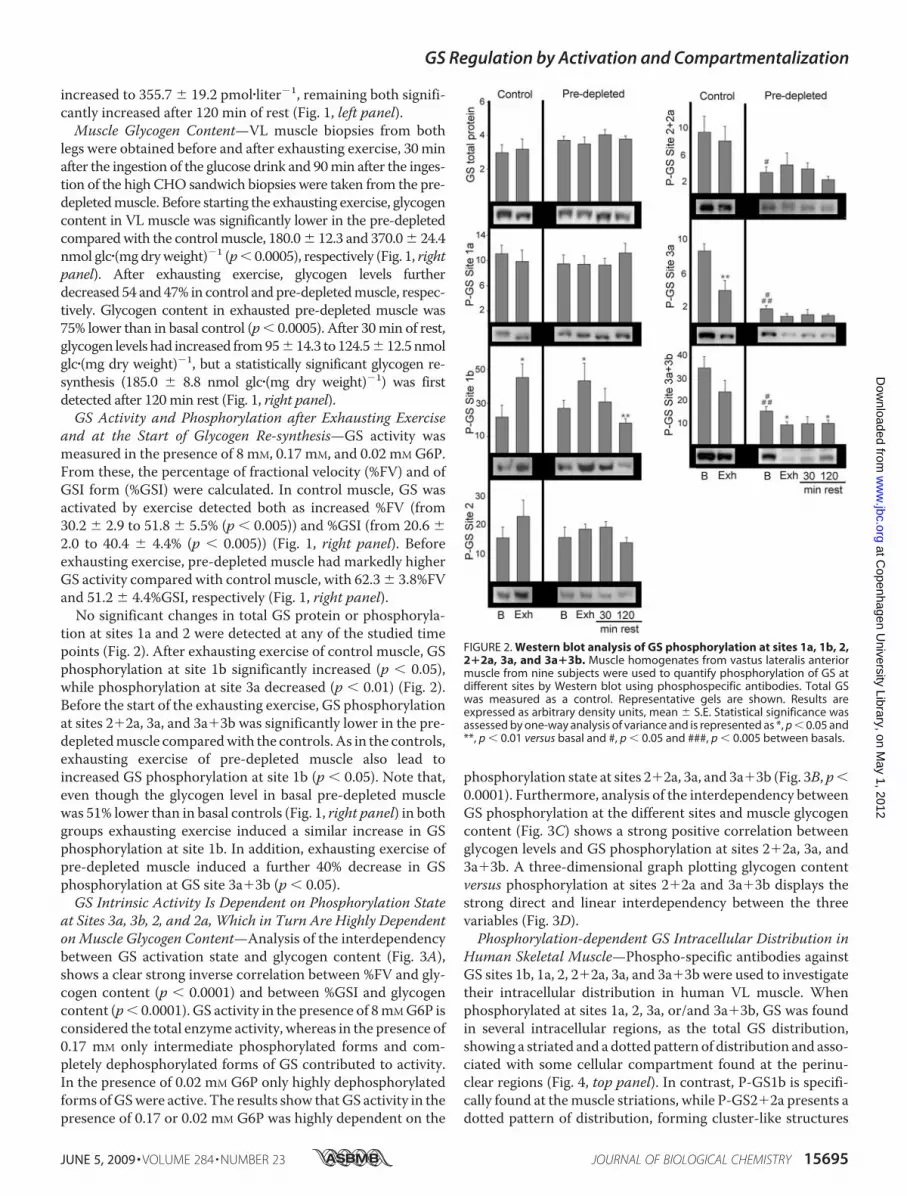
tion at sites 1a and 2 were detected at any of the studied timepoints (Fig. 2). After exhausting exercise of control muscle, GSphosphorylation at site 1b significantly increased (p � 0.05),while phosphorylation at site 3a decreased (p � 0.01) (Fig. 2).Before the start of the exhausting exercise, GS phosphorylationat sites 2�2a, 3a, and 3a�3b was significantly lower in the pre-depletedmuscle comparedwith the controls. As in the controls,exhausting exercise of pre-depleted muscle also lead toincreased GS phosphorylation at site 1b (p � 0.05). Note that,even though the glycogen level in basal pre-depleted musclewas 51% lower than in basal controls (Fig. 1, right panel) in bothgroups exhausting exercise induced a similar increase in GSphosphorylation at site 1b. In addition, exhausting exercise ofpre-depleted muscle induced a further 40% decrease in GSphosphorylation at GS site 3a�3b (p � 0.05).GS Intrinsic Activity Is Dependent on Phosphorylation State
at Sites 3a, 3b, 2, and 2a, Which in Turn Are Highly DependentonMuscle Glycogen Content—Analysis of the interdependencybetween GS activation state and glycogen content (Fig. 3A),shows a clear strong inverse correlation between %FV and gly-cogen content (p � 0.0001) and between %GSI and glycogencontent (p� 0.0001). GS activity in the presence of 8mMG6P isconsidered the total enzyme activity, whereas in the presence of0.17 mM only intermediate phosphorylated forms and com-pletely dephosphorylated forms of GS contributed to activity.In the presence of 0.02 mM G6P only highly dephosphorylatedforms ofGSwere active. The results show thatGS activity in thepresence of 0.17 or 0.02 mM G6P was highly dependent on the
phosphorylation state at sites 2�2a, 3a, and 3a�3b (Fig. 3B, p�0.0001). Furthermore, analysis of the interdependency betweenGS phosphorylation at the different sites and muscle glycogencontent (Fig. 3C) shows a strong positive correlation betweenglycogen levels and GS phosphorylation at sites 2�2a, 3a, and3a�3b. A three-dimensional graph plotting glycogen contentversus phosphorylation at sites 2�2a and 3a�3b displays thestrong direct and linear interdependency between the threevariables (Fig. 3D).Phosphorylation-dependent GS Intracellular Distribution in
Human Skeletal Muscle—Phospho-specific antibodies againstGS sites 1b, 1a, 2, 2�2a, 3a, and 3a�3b were used to investigatetheir intracellular distribution in human VL muscle. Whenphosphorylated at sites 1a, 2, 3a, or/and 3a�3b, GS was foundin several intracellular regions, as the total GS distribution,showing a striated and a dotted pattern of distribution and asso-ciated with some cellular compartment found at the perinu-clear regions (Fig. 4, top panel). In contrast, P-GS1b is specifi-cally found at themuscle striations, while P-GS2�2a presents adotted pattern of distribution, forming cluster-like structures
FIGURE 2. Western blot analysis of GS phosphorylation at sites 1a, 1b, 2,2�2a, 3a, and 3a�3b. Muscle homogenates from vastus lateralis anteriormuscle from nine subjects were used to quantify phosphorylation of GS atdifferent sites by Western blot using phosphospecific antibodies. Total GSwas measured as a control. Representative gels are shown. Results areexpressed as arbitrary density units, mean � S.E. Statistical significance wasassessed by one-way analysis of variance and is represented as *, p � 0.05 and**, p � 0.01 versus basal and #, p � 0.05 and ###, p � 0.005 between basals.
GS Regulation by Activation and Compartmentalization
JUNE 5, 2009 • VOLUME 284 • NUMBER 23 JOURNAL OF BIOLOGICAL CHEMISTRY 15695
at Copenhagen U
niversity Library, on May 1, 2012
ww
w.jbc.org
Dow
nloaded from

throughout muscle fibers (Fig. 4, lower panel). These observa-tions are in agreementwith our previous study in rabbit skeletalmuscle, where the same specific intracellular distribution ofP-GS1b and P-GS2�2a was observed (26).Phosphorylation-dependent GS Association with Distinct
Pools of Glycogen Particles—Control single muscle fibers wereimmunostained against P-GS1b or P-GS2�2a. The stainingwas detected with nano-gold and silver enhanced for transmis-sion electron microscopy. Representative images of P-GS1band P-GS2�2a distribution are shown in Fig. 5. The resultsshow that both phospho-specific forms of GS are associatedwith glycogen particles, the diameter of which is �25 nm (Fig.5, C and G, arrows) agreeing with previously reported data (35,36). The GS phospho-specific intracellular distributionresponds to differential binding of GS with two pools of glyco-gen particles depending on its phosphorylation state. P-GS1b ismainly found associated with intramyofibrillar glycogen parti-cles (Fig. 5,A and B), while P-GS2�2a ismainly associated withglycogen particles accumulated in the cytoplasm between themyofibrils, intermyofibrillar particles (Fig. 5, D–F). Note thatimmunolabeling against P-GS shows several silver enhancednano-gold particles in each glycogen particle.GS Intracellular Redistribution during Exhausting Exercise
and at the Beginning of Glycogen Re-synthesis—GS intracellulardistribution was investigated using fluorescence immunocyto-chemistry in single muscle fibers. In basal control fibers, GSpresents a diffused pattern of distribution, particularly in thecross-striations and around the myonuclei (Fig. 6A). Afterexhausting exercise of control legs GS distribution changesfrom a diffuse to a more prominently striated pattern, indicat-
ingGS translocation tomyofilaments in response to exhaustingexercise (Fig. 6B). In exhausted pre-depleted muscle fibers, GSwas found both in the striations as some spherical clusters andaround myonuclei (Fig. 6C). Already before the exhaustingexercise in some muscle fibers from pre-depleted muscle,which had been depleted of glycogen the day before and hadbeen kept without glucose supply, GS was found associatedwith similar spherical clusters with a diameter of 200–500 nm.After exhausting exercise glycogen re-synthesis was investi-gated in pre-depleted legs. Thirty minutes after the end ofexhausting exercise and the ingestion of a high glucose drink,GS was mainly detected associated with spherical particles atthe striations of sarcomeres (Fig. 6D, lower panel).
DISCUSSION
Our results show that GS intrinsic activity is strongly associ-ated with glycogen levels (Fig. 3A), supporting the hypothesisthat GS is regulated through negative feedback by glycogen (37,38). Furthermore, we show that GS activity in the presence of0.02mM or 0.17mMG6P is strongly dependent on its phospho-rylation state at sites 2�2a, 3a, and 3a�3b (Fig. 3B), and suchphosphorylation states are in turn strongly dependent on mus-cle glycogen content (Fig. 3, C and D). Note that, in basal pre-depleted muscle, in which glycogen levels have been low over-night and are 49% of the level in basal control muscle, GSphosphorylation at sites 2�2a, 3a, and 3a�3b is significantlylower than in basal control legs (Fig. 2). This is in agreementwith a previous study, which reported that GS phosphorylationat sites 3a and 2 is decreased in rested rat muscle with lowglycogen levels (39, 40). Altogether our results indicate that GS
FIGURE 3. Regulation of GS intrinsic activity by glycogen content and phosphorylation at sites 2�2a and 3a�3b. A, glycogen content is plotted versusGS intrinsic activity, %FV and %GSI. B, GS activity in the presence of 8 mM, 0.17 mM, or 0.02 mM G6P is plotted versus GS phosphorylation at sites 2, 2�2a, 3a, and3a�3b. C, glycogen content is plotted versus GS phosphorylation at sites 1a, 1b, 2, 2�2a, 3a, and 3a�3b. D, three-dimensional plot of glycogen content versusGS phosphorylation at site 2�2a and site 3a�3b is shown. Note the strong correlation between the three variables. The Spearman rank correlation coefficientwas calculated, and interdependency between the two variables was considered statistically significant if p � 0.05.
GS Regulation by Activation and Compartmentalization
15696 JOURNAL OF BIOLOGICAL CHEMISTRY VOLUME 284 • NUMBER 23 • JUNE 5, 2009
at Copenhagen U
niversity Library, on May 1, 2012
ww
w.jbc.org
Dow
nloaded from

phosphorylation is strongly dependent on glycogen levels andthat such regulation involves coordinate dephosphorylation ofsites 2�2a, 3a, and 3a�3b (Fig. 3D). The regulatorymechanismby which glycogen content could regulate GS phosphorylation/dephosphorylation and intrinsic activity remains elusive. Arecent study reports differential inhibitory properties of glyco-gen on AMPK activity depending on its branching degree (41),pointing toward AMPK as a potential mediator of the negativefeedback of glycogen on GS activity. The phosphatase RGL/GMPP1 has been shown to play an essential role for musclecontraction-induced GS activation (42), but it is not knownwhether PP1 acts preferentially on specific GS sites.Interestingly, even though phosphorylation of GS at sites
2�2a is strongly correlatedwith the enzyme activity in the pres-ence of 0.17 and 0.02mMG6P, dephosphorylated forms ofGS atthese sites can have a broad range of activity (Fig. 3B). In con-trast, whendephosphorylated at sites 3a�3b,GS is highly activein the presence of 0.17 and 0.02mMG6P. These results indicatethat sites 3a and 3b are stronger regulators of GS intrinsic activ-ity than sites 2�2a, because some samples had highly dephos-phorylated GS at sites 2�2a but presented low activity.
Glycogen content in control legs after exhausting exerciseand in basal pre-depleted legs were similar, but GS phosphoryl-ation at sites 2�2a and 3a�3bwere significantly decreased onlyafter overnight low glycogen levels (Fig. 2). These observationsindicate that the effect of glycogenolysis onGSphosphorylationis not immediate but time-dependent. Even though quite con-troversial, it has been proposed thatO-linkedN-acetylglucosa-mine modification of GS can inactivate the enzyme (43) bydecreasing its susceptibility toGS phosphatases (44). If verified,one could speculate that overnight low glycogen levels couldlead to enzymatic removal of O-linked N-acetylglucosaminemodification of GS allowing phosphatases to completelydephosphorylate sites 2�2a and 3a�3b. This hypothesis is sup-ported by a previous study (44), where GS from muscle withhigh glycogen levels was never fully activated in the absence ofthe phosphatase inhibitor sodium fluoride, indicating thatsomething more than phosphorylation is down-regulating GSactivity inmuscle with high glycogen content but not inmusclewith low glycogen content. Another possibility could be thatexhausting exercise-induced activation of GS kinases, such asAMPK, PKA, calmodulin kinase II, or protein kinase C, couldcounteract glycogenolysis-induced GS dephosphorylation.This would explain the fact that only after certain rest timewithlow glycogen levels a significant decrease in GS phosphoryla-tion at sites 3a�3b and 2�2a is detected. Furthermore, afterovernight low glycogen levels, a clear decrease in GS phospho-rylation at sites 2�2a was detected (Fig. 2). It has been shownthat insulin stimulation leads to GS dephosphorylation at sites2�2a and that such response is impaired in patients withT2DM and in women with polycystic ovary syndrome (5, 45).Considering that subjects after the glycogen depletion protocolon day 1 went home and had a low carbohydrate dinner,dephosphorylation of GS at sites 2�2a in pre-depleted musclecould respond to insulin stimulation during the postprandialstate. Because limited glucose was available for GS to start gly-cogen re-synthesis, GSwould remain activated on day 2 in basalpre-depleted muscle.It is well known that GS phosphorylation sites mainly
involved in the regulation of its intrinsic activity are sites2�2a and 3a�3b (Fig. 3B) (22) and that sites 4 and 5 arelinked to phosphorylation of site 3 (21). The question arisesas to the role of GS phosphorylation at sites 1a and 1b. Anal-ysis of interdependency between all phosphorylation sitesand plasma insulin or epinephrine concentrations was per-formed, and only a statistically significant correlationbetween P-GS1b and epinephrine (correlation coefficient �0.35, p � 0.0075) and insulin levels (correlation coefficient ��0.49, p � 0.0005) were detected. It is important to note thatplasma insulin and epinephrine levels presented a strong nega-tive correlation (correlation coefficient � �0.54, p � 0.0005).This correlation is mainly due to our experimental settings.Epinephrine levels increased during exhausting exercise andprogressively decreased back to basal levels after 2-h rest,whereas insulin levels increased in response to the ingestedhigh glucose drink and sandwich (Fig. 1, left panel). Consider-ing that PKA is known to phosphorylate GS site 1b (46), andthat after exhausting exercise an increase in site 1b phosphoryl-ation was detected independent of glycogen levels (Fig. 2),
FIGURE 4. Phosphorylation-dependent intracellular distribution of GS.Single muscle fibers were obtained from vastus lateralis biopsies from sixsubjects at different time points. Immunostaining against total GS, GS phos-phorylated at site 1b, or GS phosphorylated at site 2�2a was performed.Co-staining against myosin heavy chain type 1 (MHCI) was done to fiber type.Top panel, representative image of total GS intracellular distribution in a basalcontrol muscle fiber is shown. Bar represents 10 �m. Lower panel, represent-ative images of P-GS1b, P-GS2�2a, and MHCI distribution are shown. In bothtype I and II muscle fibers phosphorylated at site 1b, GS shows a striatedpattern of distribution but, when phosphorylated at sites 2�2a, shows a dot-ted pattern of distribution. Note the presence of a lipofuscin granule (LF) nextto the nucleus detected in the MHCI channel, lower panel. Merged images areshown in the right-hand panel. Bars represent 10 �m for the lower magnifica-tion images and 5 �m for the higher magnification images.
GS Regulation by Activation and Compartmentalization
JUNE 5, 2009 • VOLUME 284 • NUMBER 23 JOURNAL OF BIOLOGICAL CHEMISTRY 15697
at Copenhagen U
niversity Library, on May 1, 2012
ww
w.jbc.org
Dow
nloaded from

which coincides with the peak level of epinephrine in plasma(Fig. 1, left panel), our results indicate that, in response to exer-cise, epinephrine-induced PKA activation leads to muscle GSsite 1b phosphorylation.Furthermore, we show that P-GS1b ismainly found localized
to the muscle cross-striations, specifically to the I-band of thesarcomeres (Fig. 4), while P-GS2�2a presents a dotted patternof distribution. These observations support and extend our pre-vious observations in rabbit skeletalmuscle (26). To identify theexact cellular structures with which P-GS1b and P-GS2�2aassociate, analysis of nano-gold immunocytochemistry by elec-tronmicroscopy was performed. The results show that P-GS1bis mainly associated with glycogen particles located at theI-band, the so-called intramyofibrillar glycogen particles (Fig.5). Skeletalmuscle glycogen particles have been classified based
on their intracellular location as subsarcolemmal, intra- orintermyofibrillar (47). All together, we report a mechanism ofGS regulation based on intracellular compartmentalization. Inresponse to exhausting exercise, elevated epinephrine plasmaconcentration leads tomuscle PKA activation, which phospho-rylates GS at site 1b targeting the enzyme to the intramyofibril-lar glycogen particles.Furthermore, electron microscopy analysis shows that
P-GS2�2a is mainly associated with intermyofibrillar glycogenparticles (Fig. 6), which form clusters of glycogen particles inbetween myofibrills, explaining the intracellular distributionobserved by fluorescence immunocytochemistry (Fig. 4). Thequestion arises: how does GS phosphorylation at different sitesincrease its affinity for a certain pool of glycogen particles? Inaddition, what is the difference between glycogen particles
FIGURE 5. Transmission electron microscopy analysis of P-GS1b and P-GS2�2a intracellular distribution. Basal control biopsies were used to obtainsingle muscle fibers and perform nano-gold immunolabeling against P-GS1b (A–C) or P-GS2�2a (D–G). A, P-GS1b is mainly found at the A-band of thesarcomeres associated with actin filaments. Bar represents 0.5 �m. B, even though some P-GS1b is found associated with intermyofibrillar glycogen particles,most of it is associated with intramyofibrillar glycogen. Bar represents 200 nm. C, detail of P-GS1b positive glycogen particles. Bar represents 125 nm. Note thatthe diameter of the particles is around 25 nm (arrows), and there are several nano-gold silver-enhanced particles associated with each glycogen particle.D–F, P-GS2�2a is mainly found associated with the intermyofibrillar particles. Bars represent 500 nm in D, 1 �m in E, and 500 nm in F. Some can be found at theI-band of the sarcomeres, but in contrast to P-GS1b, it forms clusters. G, detail of P-GS2�2a-positive glycogen particles. Note that several P-GS2�2a areassociated with each glycogen particle. Lipid droplet (LD) and mitochondrion (M).
FIGURE 6. GS intracellular redistribution during exhausting exercise and glycogen re-synthesis. Single muscle fibers were obtained from vastus lateralisbiopsies and used to analyses total GS intracellular distribution by fluorescence immunohistochemistry. Representative images of total GS intracellulardistribution in a basal control muscle fiber (A), in a exhausted control muscle fiber (B), in a pre-depleted exhausted muscle fiber (C), and pre-depleted rested for30 min muscle fiber (D) are shown. Bars, 12 �m. Details of the striation pattern at the different conditions are shown (lower panel). Note that GS distribution ismore diffuse in basal control muscle fibers, whereas in both exhausted control or pre-depleted (B and C) muscle fibers GS is more concentrated at the A-band:the striations are easier to see. At the exhausted pre-depleted muscle fibers, clusters of GS start to appear, mainly located at the A-band of sarcomeres (C, lowerpanel: arrows). After 30-min rest, when glycogen re-synthesis is taking place, GS was found to form big clusters mainly at the A-band of sarcomeres (D, lowerpanel: arrows).
GS Regulation by Activation and Compartmentalization
15698 JOURNAL OF BIOLOGICAL CHEMISTRY VOLUME 284 • NUMBER 23 • JUNE 5, 2009
at Copenhagen U
niversity Library, on May 1, 2012
ww
w.jbc.org
Dow
nloaded from

located at the I-band of sarcomeres and glycogen particlesfound between the myofilaments?Already in 1970Meyer et al. (36) observed that different pro-
teins were associated with glycogen particles and comparedglycogen particles with cellular organelles. Twenty-six yearslater, Rybicka (48) described glycogen particles as independentmetabolic units with specialized functions, glycosomes. Todayit is well known that several proteins can associate to glycogenparticles and that glycogen proteome is not static but canchange depending on metabolic needs (see Ref. 49 for review).Different pools of glycogen particles do not respond
equally to exercise. Sustained submaximal exercise leads toglycogen depletion of the subsarcolemmal and intermyofi-brillar pools of glycogen (50), whereas glycogen particlesassociated with sarcoplasmic reticulum are more sensitive tomuscle contraction-induced glycogenolysis (36, 51–53).Thus, glycogen metabolism is complexly regulated by intra-cellular compartmentalization, and different glycogen poolsare probably used for different cellular functions. Our resultsshow that GS association with different glycogen pools isphosphorylation-dependent and that exhausting exerciseleads to an increase in P-GS1b, which is associated with theintramyofibrillar glycogen particles (Figs. 2, 4, and 5). Notethat GS associated with the intramyofibrillar glycogen par-ticles is weakly immunodetected by the phospho-specificantibody against P-GS2�2a, indicating that it is dephospho-rylated at such sites and is therefore more active. This couldtranslate into a higher glycogen re-synthesis after exhaustingexercise in the intramyofibrillar particles, which are prefer-entially used during muscle contraction (2–5). Further stud-ies are needed to fully understand the physical binding of thedifferent phosphorylation forms of GS to specific glycogenpools and the functional implications on muscle glycogenmetabolism.Changes in glycogen content occur as a result of the net bal-
ance between GS and phosphorylase activities. To fully under-stand glycogen metabolism in response to exhausting exercise,phosphorylase activity and its intracellular distribution shouldalso be investigated.Electron microscopy analysis of basal muscle immunola-
beled against P-GS1b and P-GS2�2a (Fig. 5) show several sil-ver-enhanced nano-gold particles associated with each glyco-gen particle. There has been and still is an ongoing discussionwith regard to the number of GS molecules that can be associ-ated with one particle of glycogen. Our results show that morethan one GS molecule can be associated with each glycogenparticle (Fig. 5, C and G).In a previous study (26), using electrical stimulation of rabbit
tibialis anterior muscle, we reported a novel cellular compart-ment involved in glycogen re-synthesis. After strong glycogendepletion, actin cytoskeleton rearrangement forms somespherical structures at the A-band of the sarcomeres to whichglycogen enzymes gather at the start of glycogen re-synthesis.One of the aims of the present study was to investigate theexistence of such novel cellular compartments in human skel-etal muscle during physiological conditions. Our results showthe formation of such spherical structures already in the basalpre-depleted leg (Fig. 6C), and these become more abundant
and frequent after 30- and 120-min rest in pre-depletedexhausted muscle (Fig. 6D). These results support an emergingconcept in cellular metabolism. Dynamic cellular compart-ments are formed in response to certain metabolic situations,probably to assemble the needed enzymes and cofactors andincrease the efficiency of themetabolic processes. Further stud-ies are underway to investigate when, what, how, and how long.When are these structures needed? What are the signals thatinduce their formation?How are these structures formed?Howlong do they last?
Acknowledgments—We thank Prof. Grahame D. Hardie (Division ofMolecular Physiology, University of Dundee, Dundee, Scotland), Prof.Oluf Pedersen (Steno Diabetes Center, Denmark), and Prof. Joan J.Guinovart (Dept. of Biochemistry and Molecular Biology, Universityof Barcelona, Spain) for donating materials essential to this study,and acknowledge Betina Bolmgren and Jeppe Bach for skilled techni-cal assistance.
REFERENCES1. Bogardus, C., Lillioja, S., Stone, K., and Mott, D. (1984) J. Clin. Invest. 73,
1185–11902. Roden, M., Petersen, K. F., and Shulman, G. I. (2001) Recent Prog. Horm.
Res. 56, 219–2373. Shulman, G. I., Rothman, D. L., Jue, T., Stein, P., DeFronzo, R. A., and
Shulman, R. G. (1990) N. Engl. J. Med. 322, 223–2284. Damsbo, P., Vaag, A., Hother-Nielsen, O., and Beck-Nielsen, H. (1991)
Diabetologia 34, 239–2455. Højlund, K., Staehr, P., Hansen, B. F., Green, K. A., Hardie, D. G., Richter,
E. A., Beck-Nielsen, H., and Wojtaszewski, J. F. (2003) Diabetes 52,1393–1402
6. Højlund, K., and Beck-Nielsen, H. (2006) Curr. Diabetes Rev. 2, 375–3957. Schalin-Jantti, C., Harkonen, M., and Groop, L. C. (1992) Diabetes 41,
598–6048. Eriksson, J., Franssila-Kallunki, A., Ekstrand, A., Saloranta, C., Widen, E.,
Schalin, C., and Groop, L. (1989) N. Engl. J. Med. 321, 337–3439. Vaag, A., Henriksen, J. E., and Beck-Nielsen, H. (1992) J. Clin. Invest. 89,
782–78810. Roach, P. J. (1991) J. Biol. Chem. 266, 14139–1414211. Rothman-Denes, L. B., and Cabib, E. (1971) Biochemistry 10, 1236–124212. Villar-Palasi, C. (1991) Biochim. Biophys. Acta 1095, 261–26713. Flotow, H., and Roach, P. J. (1989) J. Biol. Chem. 264, 9126–912814. Flotow,H., Graves, P. R.,Wang, A.Q., Fiol, C. J., Roeske, R.W., and Roach,
P. J. (1990) J. Biol. Chem. 265, 14264–1426915. Carling, D., and Hardie, D. G. (1989) Biochim. Biophys. Acta 1012, 81–8616. Huang, T. S., and Krebs, E. G. (1977) Biochem. Biophys. Res. Commun. 75,
643–65017. Roach, P. J., DePaoli-Roach, A. A., and Larner, J. (1978) J. Cyclic Nucleo-
tide. Res. 4, 245–25718. DePaoli-Roach, A. A., Ahmad, Z., Camici, M., Lawrence, J. C., Jr., and
Roach, P. J. (1983) J. Biol. Chem. 258, 10702–1070919. Fiol, C. J., Mahrenholz, A. M., Wang, Y., Roeske, R. W., and Roach, P. J.
(1987) J. Biol. Chem. 262, 14042–1404820. Picton, C., Woodgett, J., Hemmings, B., and Cohen, P. (1982) FEBS Lett.
150, 191–19621. Roach, P. J. (1990) FASEB J. 4, 2961–296822. Skurat, A. V., Wang, Y., and Roach, P. J. (1994) J. Biol. Chem. 269,
25534–2554223. Villar-Palasi, C. (1995) Biochim. Biophys. Acta 1244, 203–20824. Fernandez-Novell, J. M., Bellido, D., Vilaro, S., and Guinovart, J. J. (1997)
Biochem. J. 321, 227–23125. Ferrer, J. C., Baque, S., and Guinovart, J. J. (1997) FEBS Lett. 415, 249–25226. Prats, C., Cadefau, J. A., Cusso, R., Qvortrup, K., Nielsen, J. N., Wojtasze-
wki, J. F., Wojtaszewki, J. F., Hardie, D. G., Stewart, G., Hansen, B. F., and
GS Regulation by Activation and Compartmentalization
JUNE 5, 2009 • VOLUME 284 • NUMBER 23 JOURNAL OF BIOLOGICAL CHEMISTRY 15699
at Copenhagen U
niversity Library, on May 1, 2012
ww
w.jbc.org
Dow
nloaded from

Ploug, T. (2005) J. Biol. Chem. 280, 23165–2317227. Andersen, P., Adams, R. P., Sjøgaard, G., Thorboe, A., and Saltin, B. (1985)
J. Appl. Physiol. 59, 1647–165328. Bergstrom, J. (1962) Scand. J. Clin. Lab. Invest. 14, Suppl. 68, 11–1329. Stefanini, M., De Martino, C., and Zamboni, L. (1967) Nature 216,
173–17430. Ploug, T., van Deurs, B., Ai, H., Cushman, S. W., and Ralston, E. (1998)
J. Cell Biol. 142, 1429–144631. Prats, C., Bernal, C., Cadefau, J. A., Frias, J., Tibolla, M., and Cusso, R.
(2002) Biochim. Biophys. Acta 1573, 68–7432. Højlund, K., Glintborg, D., Andersen, N. R., Birk, J. B., Treebak, J. T.,
Frøsig, C., Beck-Nielsen, H., and Wojtaszewski, J. F. (2008) Diabetes 57,357–366
33. Hojlund, K., Staehr, P., Hansen, B. F., Green, K. A., Hardie, D. G., Richter,E. A., Beck-Nielsen, H., and Wojtaszewski, J. F. P. (2003) Diabetes 52,1393–13402
34. Dawson, D. J., and Nichol, L. W. (1969) Aust. J. Biol. Sci. 22, 247–25535. Marchand, I., Chorneyko, K., Tarnopolsky, M., Hamilton, S., Shearer, J.,
Potvin, J., and Graham, T. E. (2002) J. Appl. Physiol. 93, 1598–160736. Meyer, F., Heilmeyer, L. M., Jr., Haschke, R. H., and Fischer, E. H. (1970)
J. Biol. Chem. 245, 6642–664837. Danforth, W. H. (1965) J. Biol. Chem. 240, 588–59338. Nielsen, J. N., Derave, W., Kristiansen, S., Ralston, E., Ploug, T., and Rich-
ter, E. A. (2001) J. Physiol. 531, 757–76939. Jørgensen, S. B., Nielsen, J. N., Birk, J. B., Olsen, G. S., Viollet, B., Andreelli,
F., Schjerling, P., Vaulont, S., Hardie, D. G., Hansen, B. F., Richter, E. A.,and Wojtaszewski, J. F. (2004) Diabetes 53, 3074–3081
40. Lai, Y. C., Stuenaes, J. T., Kuo, C. H., and Jensen, J. (2007) Am. J. Physiol.Endocrinol. Metab. 293, E1622–1629
41. McBride, A., Ghilagaber, S., Nikolaev, A., and Hardie, D. G. (2009) CellMetab. 9, 23–34
42. Aschenbach, W. G., Suzuki, Y., Breeden, K., Prats, C., Hirshman, M. F.,Dufresne, S. D., Sakamoto, K., Vilardo, P. G., Steele, M., Kim, J. H., Jing,S. L., Goodyear, L. J., and DePaoli-Roach, A. A. (2001) J. Biol. Chem. 276,39959–39967
43. Parker, G. J., Lund, K. C., Taylor, R. P., and McClain, D. A. (2003) J. Biol.Chem. 278, 10022–10027
44. Wojtaszewski, J. F., Jørgensen, S. B., Hellsten, Y., Hardie, D. G., and Rich-ter, E. A. (2002) Diabetes 51, 284–292
45. Glintborg, D., Højlund, K., Andersen, N. R., Hansen, B. F., Beck-Nielsen,H., and Wojtaszewski, J. F. (2008) J. Clin. Endocrinol. Metab. 93,3618–3626
46. Cohen, P., Alessi, D. R., and Cross, D. A. (1997) FEBS Lett. 410, 3–1047. Friden, J., Seger, J., and Ekblom, B. (1989) Acta Physiol. Scand. 135,
381–39148. Rybicka, K. K. (1996) Tissue Cell 28, 253–26549. Roach, P. J., Cheng, C., Huang, D., Lin, A.,Mu, J., Skurat, A. V.,Wilson,W.,
and Zhai, L. (1998) J. Basic Clin. Physiol. Pharmacol. 9, 139–15150. Sjostrom, M., Friden, J., and Ekblom, B. (1982) Histochemistry 76,
425–43851. Goldstein, M. A., Murphy, D. L., van Winkle, W. B., and Entman, M. L.
(1985) J. Muscle Res. Cell Motil. 6, 177–18752. Wanson, J. C., and Drochmans, P. (1968) J. Cell Biol. 38, 130–15053. Wanson, J. C., and Drochmans, P. (1972) J. Cell Biol. 54, 206–224
GS Regulation by Activation and Compartmentalization
15700 JOURNAL OF BIOLOGICAL CHEMISTRY VOLUME 284 • NUMBER 23 • JUNE 5, 2009
at Copenhagen U
niversity Library, on May 1, 2012
ww
w.jbc.org
Dow
nloaded from


