Embed Size (px)
Citation preview
1
University of DuhokCollege of Medicine
VOLUME 6 SUPPLEMENT 3 DECEMBER 2012
The Official Journal of Duhok College of Medicine
DuhokMedical
Journal
ISSN: 2071-7326Duhok University Press
This supplement is one of three assigned for publication of
articles presented at the Second Scientific Conference of the
Faculty of Medical Sciences / University of Duhok held on
September 19th – 20
th 2012 September 19
th – 20
th 2012

This page is left intentionally
Duhok Medical Journal Volume 6, Supplement 3, 2012
Duhok Med J
PATRONDr. ARIF Y. BALATAY, MBChB, Ph.D (Ophthalmology)
Dean, Faculty of Medical Sciences, University of Duhok
EDITOR-IN-CHIEFProf. SAMIM A. AL-DABBAGH, MBChB, DTM&H, D. Phil, FFPH
Head, Department of Family and Community Medicine, Duhok College of Medicine
MEMBERProf. DHIA J. AL-TIMIMI, BSc (pharm), Mphil, PhD
Head, Department of Clinical Biochemistry, Duhok College of Medicine
MEMBERProf. NASIR A. AL-ALLAWI, MBChB, MSc, PhD
Head, Department of Pathology, Duhok College of Medicine
MEMBERDr. FARHAD K. SULAYVANI, MBChB, CABS, FRCS
Assistant professor, Department of Surgery, Duhok College of Medicine
MEMBERDr. MAIDA Y. SHAMDEEN, MBChB, MRCOG, RECOG
Assistant professor, Department of Obstetrics and Gynecology, Duhok College ofMedicine
EDITORIAL BOARD

Duhok Medical Journal Volume 6, Supplement 3, 2012
MEMBERDr. MOHAMMED T. RASOOL, MBChB, FRCPG, FRCP (London)
Assistant professor, Head, Department of Internal Medicine, Duhok College ofMedicine
MEMBERDr. ABDULGHAFOOR S. ABDULKAREEM, MBChB, FICMS
Assistant professor of Urology, Department of Surgery, Duhok College of Medicine
EDITORIAL ASSISTANTDr. ABDULLA J. RAJAB, MBChB, MPH, PhD
Director of Department of Continuing Medical Education, Duhok Directorate of Health
DESIGNERDr. HUSHYAR M. SULAIMAN, MBChB, MSc, MHS (Health Policy)
Department of Continuing Medical Education, Duhok Directorate of Health
Submission of Manuscript:
Manuscripts should be submitted to:The Editor,Duhok Medical Journal,Duhok College of Medicine,
Post address: Nakhoshkhana Road 9, 1014, AM, Duhok, Iraq.Telephone No.: 00964-62-7224268 EXT 115E-mail: [email protected] submission of articles is also accepted
Duhok Medical Journal Volume 6, Supplement 3, 2012
Duhok Med J
Prof. GAZI ZIBARI, MD, FACS, FICSDirector of W.K./L.S.U. Regional Transplant Program, Louisiana, USA
Prof. AHMAD MB. AL-KAFAJEI, MBChB, DTM&H, PhD, MFCMHead, Department of Public Health, Jordanian College of Medical Sciences
Prof. FAYSIL A. ALNASIR, FPC, FRCGP, MICGP, PhDVice President, Arabian Gulf University, Bahrain
Dr. ASAD A. ZOMA FRCP, FRCPG, FACRConsultant Physician in Rheumatology and Senior Clinical Lecturer
Lanarkshire Health Board and Glasgow University, Scotland, United Kingdom
Dr. NADA J. AL-WARD, MBChB, MFCMPublic Health Specialist, WHO, Geneva
Dr. CHRISTINE M. EVANS, MBChB, MD Ed, FRCS, FRCS EdUrologist, North Wales, United Kingdom
Dr. FARHAD U. HUWEZ, MBChB, PhD, MRCPI, FRCP, FRCPGConsultant Physician / Lead Physician of Stroke Services, Basildon & Thurrock NHS
Trust, Basildon Hospital, United Kingdom
Dr. ABDULBAGHI AHMAD, MD, PhDConsultant Child Psychiatrist and Director of Studies, Department of Neuroscience,
Child and Adolescence Psychiatry, Uppsala University Hospital, Sweden
ADVISORY BOARD

This page is left intentionally
Duhok Medical Journal Volume 6, Supplement 3, 2012
Duhok Med J
Aims and Scope Duhok Medical Journal is a peer reviewed journal issued bi – annually by Duhok Collegeof Medicine. Scientific and clinical researches are the main issues. The journal also publishes short articles,letters to editors, review articles and case reports.
General The Duhok Medical Journal is a signatory journal to the uniform requirement for manuscriptssubmitted to biomedical journals, February 2006 [updated 2009] (http://www.icmje.org).
To present your original work for consideration three manuscript copies written in English togetherwith Kurdish and Arabic abstracts should be submitted to the editor. All authors are required to provide themanuscript on a CD labeled with the name and title of the paper.
Preparation of the manuscript The manuscript should be typed double spaced as normal text on one sideof the paper in single column format, font size 14 pt, paper type A4, 1″ margin at each side and each of thefollowing sections should begin on a new page in the following sequence:
1- Title page; should include the following: title, font size 16 pt, each author's full name,academic degree(s), scientific title (if available), institutional affiliation, full contactinformation including emails. If there are more than one author, article should include author towhom correspondence should be addressed including the scientific title (if available),institution affiliation, address, email, telephone.
2- Structured abstract; of no more than 250 words including background and objectives,methods, results, and conclusions.
3 – 10 keywords or phrases should be put at the end of each abstract (Printed in bold font;size12 pt).
3- Body of the text; structured in an IMRAD style;(Introduction, Methods, Results and Discussion).
4- Acknowledgment (if any.)5- References.6- Tables with legends.7- Illustrations with legends.8- Structured Kurdish abstract including title in Kurdish.
9- Structured Arabic abstract including title in Arabic.
اتاالستنتاج،النتائجالبحث،طرقو اهداف البحث، خلفیةTables Each table must be typed on separate page and should follow the reference list. All the tables mustbe numbered consecutively in the order of their first citation in the text. Supply a brief title for each on topand place explanatory matter in foot notes not in the heading (if needed). Tables should be simple and notduplicated in the text. Percentages are included with numbers in the same cells but in brackets.
Illustrations Graphs, line drawing, photographs, printed x rays and other illustrations are accepted only ifthey add to the evidence of the text. They should be of a high quality and suitable for reproduction. Theyshould be numbered consecutively according to the order in which they have been first cited in the text.Supply a brief title beneath each illustration. Graphs should have white background; should be colored andnon 3-dimensional figure; and should have labels for X and Y axis.
INSTRUCTIONS FOR AUTHORS
Duhok Medical Journal Volume 6, Supplement 3, 2012
Numbers and Units Measurements of length, height, weight and volume should be reported in metricunits. Temperature in degrees Celsius, blood pressure should be expressed in mmHg and all hematologicand clinical chemistry measurements in SI units.
Abbreviations should be defined on first use and then applied consistently throughout the article. Avoidabbreviations in the title and abstract.
References should be numbered both in text and in the list of references in the order in which they appearin the text. The punctuation of the Vancouver style should be followed; if the original reference is notverified by the author, it should be given in the list of references followed by (cited by) and the paper itwas referring to. The titles of journals should be abbreviated according to the style used in Index Medicus.This can be obtained from website (http://www.nlm.nih.gov/). The author is responsible for the accuracy ofreferences. The following are examples of the three most common types of citations:The article citation: if six authors or fewer list all; if seven or more authors list the first six and then add "etal":1- Nuwayhid IA, Yamout B, Azar G, Kambris MA. Narghile (hubble bubble) smoking, low birth weight,and other pregnancy outcomes. Am J Epidemiol. 1998;148(4):375-83.Book citation, noting chapter and authors:2- Arevalo JA, Nesbitt TS. Medical problems during pregnancy. In: Taylor RB, editor. Family medicine:principles and practice. 6th ed. New York: Springer – Verlag; 2003. p. 109-16.Electronic source:3- Garfinkel PE, Lin E, Goering P. Should amenorrhoea be necessary for the diagnosis of anorexianervosa? Br J Psych [Internet]. 1996 [cited 1999 Aug 17];168(4):500-6. Available from:URL:http://biomed.niss.ac.uk
Authorship and consent form All authors must give signed consent (Form No.1- Submission Form),which should accompany the manuscript. The letter should say "this manuscript is an unpublished work,which is not under consideration elsewhere in the record. Authors are requested to state an approximateestimate of their contribution in the study, sign the form and send it with the manuscript.Authors must declare if they have any competing interests in the study and to specify any funds given toconduct the study.
Ethical considerations When experiments on humans are being reported the whole work in themanuscript should conform to the ethical standards of the responsible committee on humanexperimentation.
Submission of manuscript
Manuscripts should be submitted to:The Editor,Duhok Medical Journal,Duhok College of Medicine,Post address: Nakhoshkhana Road 9, 1014, AM, Duhok, Iraq.Telephone no.: 00964-62-7224268 EXT 115E-mail: [email protected] submission of articles is also accepted
N.B.* Accepted manuscripts may be altered by the editorial board of Duhok Medical Journal to conformto details of the journal publication style.** The Editorial Board of Duhok Medical Journal accepts no responsibility for statement made byauthors in articles published by the journal.
Duhok Medical Journal Volume 6, Supplement 3, 2012
Duhok Med J
PREVALENCE AND COMPARISON BETWEEN THE EFFICACY OF DIFFERENTTECHNIQUES IN DIAGNOSIS OF TRICHOMONAS VAGINALIS IN ERBIL-IRAQMOHAMMED A. KADIR, NARMIN RAFIK ...…………………………………..…..…. 1-9
EVALUATION OF ANTI-PHOSPHOLIPID ANTIBODIES IN YOUNG PATIENTSWITH THROMBOEMBOLIC STROKEMUNA A. KASHMOOLA, MOHAMMAD M. A. ESSA, SALMAN ESSA HAZA ….. 10-17
PROTECTIVE ROLE OF SOME ANTIOXIDANTS ON SPERM ABNORMALITIESCAUSED BY NICOTINE IN ALBINO MICE MUS MUSCULUSNADHUM J. ISMAIEL, GALAWEZH O.OTHMAN …………………………...……. 18-26
THE EFFECT OF A COATING MATERIAL ON THE MICROLEAKAGE OFTEMPORARY SOFT DENTURE LINING MATERIALSNADIA T. JAFFER, BDS, MUNTHER N. KAZANJI …..…………………….…..…. 27-32
LAPAROSCOPIC ABLATION OF SYMPTOMATIC SIMPLE RENAL CYSTS ATAZADI TEACHING HOSPITAL (OUR INITIAL EXPERIENCE)NASHWAN M. RASHEED, SHAKIR S. BALINDI …………………………….……. 33-38
EFFECT OF APICAL PATENCY ON PERIAPICAL EXTRUSION DURINGDIFFERENT INSTRUMENTATION TECHNIQUESRAID F. SALMAN, ZIWAR A. QASSAB, HALA P. HANNA …..………………...…. 39-46
ANTI-CCP AS A NEW SEROLOGIC DIAGNOSTIC MARKER FOR THEDIAGNOSIS OF RHEUMATOID ARTHRITIS PATIENTSRUQAYA M. AL BARZINJI, NIAZ J. BARZINJI, DASHTY BUSTANY, FEYAN M.ABDULLAH ……………………………………………………………………………. 47-58
IMMUNOREGULATORY EFFECT OF LACTOBACILLI IN MACROPHAGESCELL LINE J744.1SAEED A., HECZKO B.P …..……………………………………………………...…. 59-66
A NEW METHOD FOR TREATMENT OF DENTIN HYPERSENSITIVITY BYUSING NANO FLUOR-HYDROXYAPATITE AND ND: YAG LASER: A SCANNINGELECTRON MICROSCOPIC STUDYSAEED ALI M, KHULOOD AL-SAFI ………………………………….……....……. 67-77
GENETIC POLYMORPHISMS OF P21 AND RISK OF PROSTATE CANCERSAJADI F, ROSTAMZADEH J, ZAREI M.A ………………………………………. 78-85
CONTENTS
Duhok Medical Journal Volume 6, Supplement 3, 2012
ANTI-MULLERIAN HORMONE IS A SIGNIFICANT MARKER FOR MALEINFERTILITYSAJEDA S. AL – CHALABI, YASIR T.AL-WATTAR, ISLAM M ALGALILI………. 86-91
SOME OF THE PHYSICAL PROPERTIES OF MODIFIED MICROHYBRIDCOMPOSITE (AN IN VITRO STUDY)SAZAN SH. SALEEM, SALEM A. AL-SAMARAI, DARA H. SAEED ………..……. 92-99
STUDY OF SERUM MAGNESIUM AND CALCIUM IN PREECLAMPSIA ANDNORMAL PREGNANCYSINAN B. GARABET ……………………………………………………...…..……. 100-106
ARTHROSCOPIC MANAGEMENT OF KNEE DISORDERS IN ERBIL HOSPITALSRETRO-PROSPECTIVE STUDYSROOD S. MATTEI, ZOHAIR M. AHMED AL- SAFFAR ………………….……. 107-116
PERIODONTAL STATUS IN PATIENTS WITH METABOLIC SYNDROMESUSAN M. SALIH, DHIA J. AL-TIMIMI ……………………………….…..……. 117- 127
EFFECTIVENESS OF A HEALTH EDUCATIONAL PROGRAM ON KNOWLEDGEOF PATIENT WITH MYOCARDIAL INFARCTIONYOUSIF M. YOUNIS, SAADIA A. KHUDER …..……………………………..…. 128-135
EFFECT OF ALENDRONATE ON SERUM GHRELIN LEVEL IN OSTEOPOROTICPOST MENOPAUSAL WOMENZAHRAA W. AL-NUIEMI, NAHLA O M. TAWFIK ………………………..……. 136-144
THE EFFECT OF ZINC SUPPLEMENTATION ON DISEASE ACTIVITY INPATIENTS WITH RHEUMATOID ARTHRITISDHIA M. SULAIMAN, DHIA J. AL-TIMIMI, MOHAMMED T. RASOOL ….…. 145-154
THE EFFECT OF METHANOL EXTRACTS OF SOME PLANTS AGAINST THEBACTERIA CAUSING DIARRHEA AMONG CHILDRENSAWSAN M. A. AL-SORCHEE, RANA M. A. ALSHWAIKH …………………… 155-169
A CYTOPATHOLOGICAL STUDY OF THE EFFECT OF SMOKING ON THEORAL EPITHELIAL CELLS IN RELATION TO ORAL HEALTH STATUS BY THEMICRONUCLEUS ASSAYSAEED H. SAEED, WASEN H. YOUNIS …………………………………....……. 170-177
1
Duhok Medical Journal Volume 6, Supplement 3, 2012
PREVALENCE AND COMPARISON BETWEEN THE EFFICACY OF DIFFERENT TECHNIQUES IN DIAGNOSIS OF TRICHOMONAS VAGINALIS IN ERBIL-IRAQ
MOHAMMED A. KADIR
NARMIN RAFIK
Submitted 18 Jun 2012; accepted 3 Sep 2012 ABSTRACT Background and objectives: This study investigated the prevalence of Trichomonas vaginalis among females attending the gynaecological out patients clinics in Maternity hospital, several health centers and some private clinics in Erbil-Iraq, from 16th July 2007 till 15th July 2008, by using different diagnostic methods. In addition, a comparative study to evaluate the efficacy of different tests for diagnosis of infection. Methods: Different diagnostic laboratory tests were used in the study like direct vaginal and urine examination, cultivation in Diamond modified broth, Papanicolaou (Pap) smears and measurement of vaginal pH value Results:Trichomonas vaginalis detected only among 5 out of 1296 examined vaginal swabs, the rate of infection was 0.39% (0.42% in urban and 0.28% in rural regions). The highest rate of infection was among women other than single and married groups (i.e. widow, divorced and separated women), and among women of child-bearing age 14-40 years, with college education. The employers revealed higher seropositivity than the housewives. Trichomoniasis was higher among the pregnant than non pregnant women. The seropositivity rate was 100% among females with high vaginal pH levels 6, 6.3 and 6.6. Pap smears revealed the highest infection rate 6.52%. Comparison between efficacies of different methods was determined and direct vaginal examination showed higher rate of positivity than cultivation technique, and Pap smear was more efficient in comparison with direct examination and cultivation of vaginal discharges, while no positive cases were detected by urine examination. Conclusions:In comparison between serological methods and direct vaginal examination, complement fixation and ELISA methods were more efficient and the statistical difference was highly significant. The rate of seropositivity among the housewives was higher than the employers using the four laboratory methods.
Duhok Med J 2012; 6 Suppl 3:1-9. Key words: prevalence, comparison, diagnosis, Trichomonas vaginalis,Erbil.
uman trichomoniasis is a widely prevalent sexually transmitted
disease of worldwide importance. An estimated 200 million women suffer from trichomoniasis every year worldwide 1. Maternal Trichomonas infection may also result in vaginitis, urinary tract infections, or respiratory distress in the premature newborn 2. Epidemiologically, T. vaginalis infections are commonly associated with other sexually transmitted diseases (STDs) and may be a particularly sensitive marker of high risk sexual behavior. Trichomoniasis is frequently seen concomitantly with other STDs, particularly gonorrhea 3. Diagnosis can be made by different
methods like pelvic examination, microscopic demonstration of trophozoites of T. vaginalis in wet mount of the sedimented urine and vaginal secretions of female and males, it may be found in urine and prostatic secretions, using acridine-orange, Papanicolaou and direct fluorescent antibody (DFA) staining methods, vaginal pH testing, culture tests, enzyme-linked immunosorbent assay (ELISA) and polymerase chain reaction PCR 4. The aims of the study were to determine the prevalence of trichomoniasis in women in Erbil governorate and to compare between the efficacy of different direct examination and serological tests for diagnosis of Trichomonas seropositivity.
* College of Medicine, Kirkuk University. ** College of Science, Salahuddin University. Correspondence author: Mohammed A. Kadir .Email: [email protected]
H
2
PREVALENCE AND COMPARISON BETWEEN THE EFFICACY OF DIFFERENT…
METHODS
Time and location One thousand two hundred and ninety six female patients were enrolled in the study, between 16th July 2007 and 15th July 2008, for detection of T. vaginalis infection, they were attended to some private clinics, gynecological out patient's clinics in Maternity hospital and several health centers in Erbil Governorate. Collection Of Specimens
Genital tract examination was carried out for each patient, two high vaginal swabs, for each patient, were obtained by a sterile cotton swab; one was kept in 3 ml saline solution for direct microscopic examination, the other swab used for culture (Diamond Modified Broth). For unmarried females low vaginal swabs were taken. Then each tube was labeled with the patients name or number and date of collection. Estimation of vaginal discharge pH was done by pH-indicator paper (Whatman International Ltd Maidstone, Germany) on which the discharge was placed for few seconds and the resultant color was compared with the color segments printed on the strip. Each patient was asked to collect urine in a clean container for general urine examination to determine the urinary tract involvement also. Papanicolaou (Pap) smears were obtained from ninety two patients, fixed, stained in Harris’s haematoxylin and eosin stains, dehydrated, mounted and examined for detection of T. vaginalis 5. Cervical smears were taken from ninety two females by using sterilized bivalve speculum which introduced into the vagina, then the small end of the cervical wooden scraper (Ayre spatula) was placed in the external os of the endocervical canal as deeply as possible and rotating it 360 degrees, energetically scraping the entire surface of the external os and part of the
internal os. The ectocervical smear was taken by using the opposite wider end of the scraper 1. Cultivation The medium used for cultivation of T. vaginalis was Diamond Modified (Que-Bact Laboratories-Technical Data 2491/Canada). Detection of anti-Trichomonas vaginalis antibodies was done using modified ELISA (BioCheck Inc. CA). Complement fixation test was done according to Santa Cruz Biotechnology, Lot No.: 1207, Germany. Statistical analysis The statistical analysis was conducted using the software program Statistical Program Social System (SPSS version 13.0). The comparison was conducted between positive and negative values for all parameters using Chi-square test as mentioned by Milton and Tsokos 7.
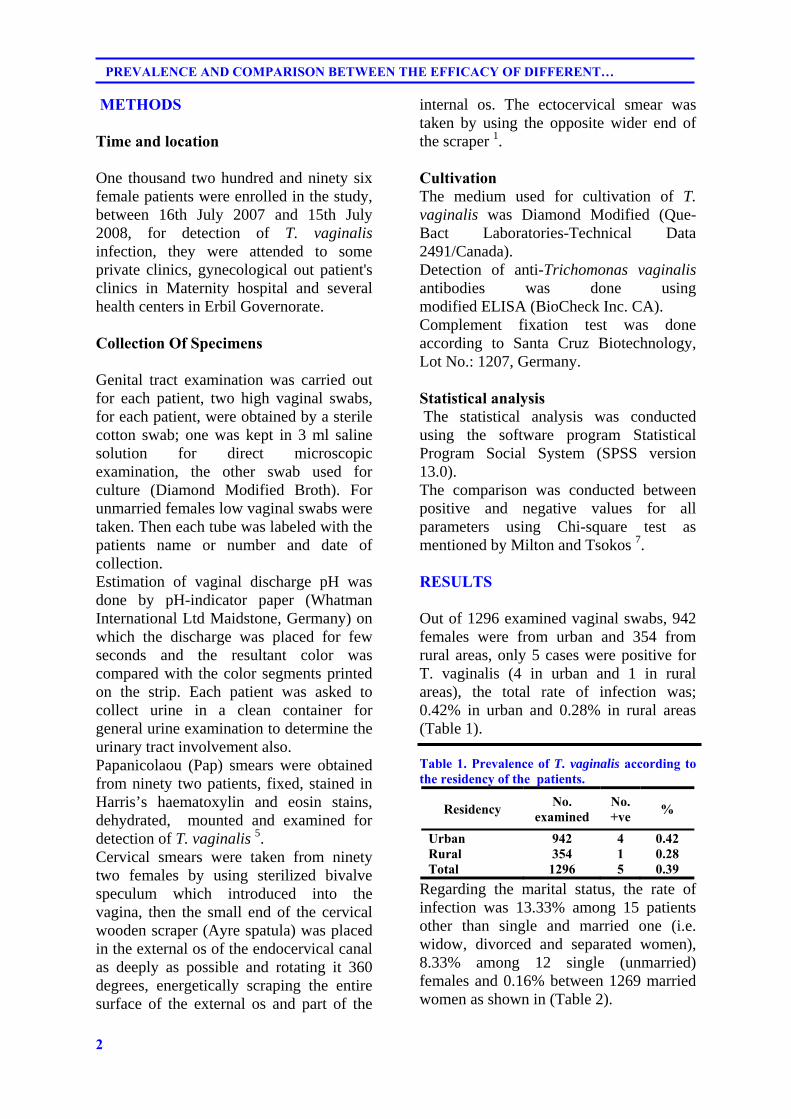
RESULTS Out of 1296 examined vaginal swabs, 942 females were from urban and 354 from rural areas, only 5 cases were positive for T. vaginalis (4 in urban and 1 in rural areas), the total rate of infection was; 0.42% in urban and 0.28% in rural areas (Table 1). Table 1. Prevalence of T. vaginalis according to the residency of the patients.
Residency No.
examined No. +ve
%
Urban Rural
942 354
4 1
0.42 0.28
Total 1296 5 0.39
Regarding the marital status, the rate of infection was 13.33% among 15 patients other than single and married one (i.e. widow, divorced and separated women), 8.33% among 12 single (unmarried) females and 0.16% between 1269 married women as shown in (Table 2).
3
Duhok Medical Journal Volume 6, Supplement 3, 2012
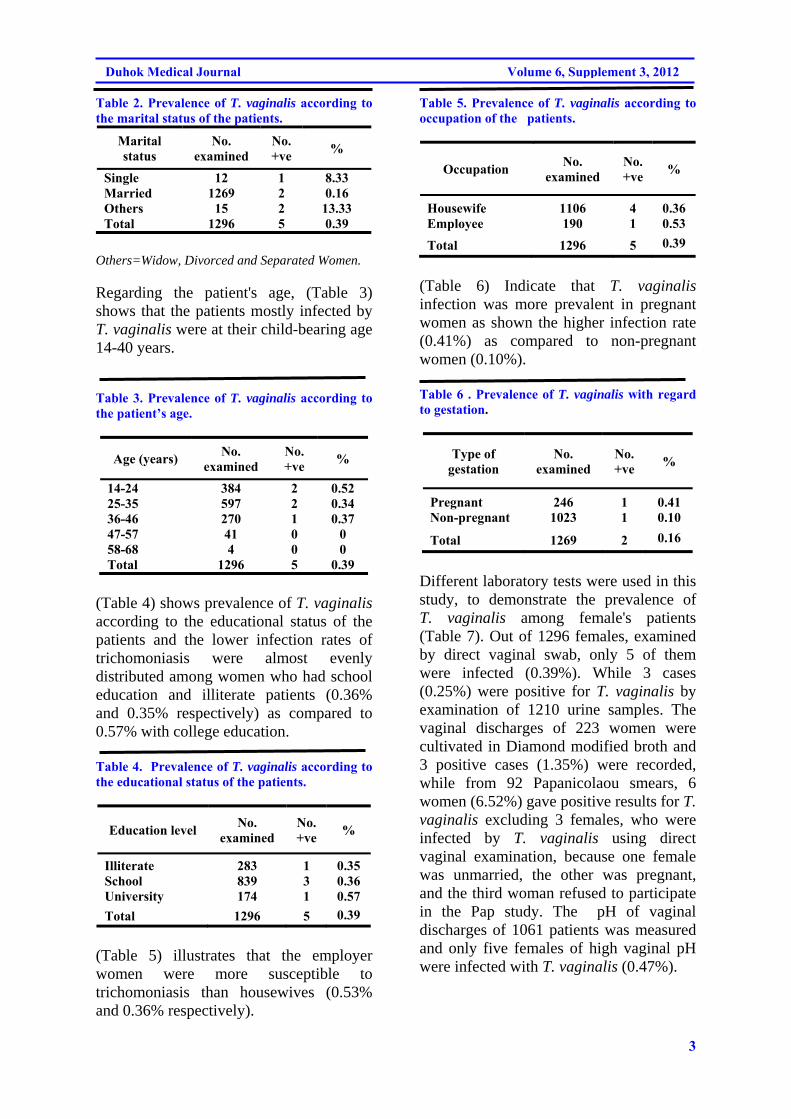
Table 2. Prevalence of T. vaginalis according to the marital status of the patients.
Marital status
No. examined
No. +ve
%
Single Married Others
12 1269 15
1 2 2
8.33 0.16
13.33 Total 1296 5 0.39
Others=Widow, Divorced and Separated Women. Regarding the patient's age, (Table 3) shows that the patients mostly infected by T. vaginalis were at their child-bearing age 14-40 years. Table 3. Prevalence of T. vaginalis according to the patient’s age.
Age (years) No.
examined No. +ve
%
14-24 25-35 36-46 47-57 58-68
384 597 270 41 4
2 2 1 0 0
0.52 0.34 0.37
0 0
Total 1296 5 0.39
(Table 4) shows prevalence of T. vaginalis according to the educational status of the patients and the lower infection rates of trichomoniasis were almost evenly distributed among women who had school education and illiterate patients (0.36% and 0.35% respectively) as compared to 0.57% with college education. Table 4. Prevalence of T. vaginalis according to the educational status of the patients.
Education level No.
examined No. +ve
%
Illiterate School University
283 839 174
1 3 1
0.35 0.36 0.57
Total 1296 5 0.39
(Table 5) illustrates that the employer women were more susceptible to trichomoniasis than housewives (0.53% and 0.36% respectively).
Table 5. Prevalence of T. vaginalis according to occupation of the patients.
Occupation No.
examined No. +ve
%
Housewife Employee
1106 190
4 1
0.36 0.53
Total 1296 5 0.39
(Table 6) Indicate that T. vaginalis infection was more prevalent in pregnant women as shown the higher infection rate (0.41%) as compared to non-pregnant women (0.10%). Table 6 . Prevalence of T. vaginalis with regard to gestation.
Type of gestation
No. examined
No. +ve
%
Pregnant Non-pregnant
246 1023
1 1
0.41 0.10
Total 1269 2 0.16
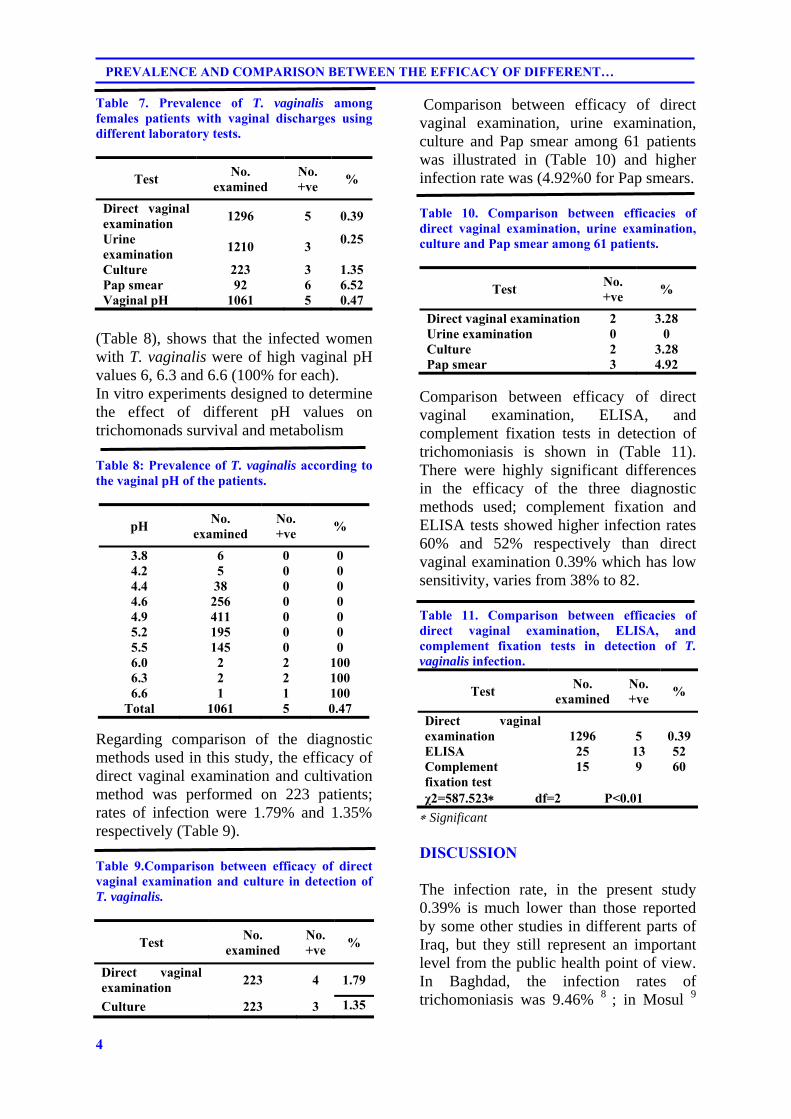
Different laboratory tests were used in this study, to demonstrate the prevalence of T. vaginalis among female's patients (Table 7). Out of 1296 females, examined by direct vaginal swab, only 5 of them were infected (0.39%). While 3 cases (0.25%) were positive for T. vaginalis by examination of 1210 urine samples. The vaginal discharges of 223 women were cultivated in Diamond modified broth and 3 positive cases (1.35%) were recorded, while from 92 Papanicolaou smears, 6 women (6.52%) gave positive results for T. vaginalis excluding 3 females, who were infected by T. vaginalis using direct vaginal examination, because one female was unmarried, the other was pregnant, and the third woman refused to participate in the Pap study. The pH of vaginal discharges of 1061 patients was measured and only five females of high vaginal pH were infected with T. vaginalis (0.47%).
4
PREVALENCE AND COMPARISON BETWEEN THE EFFICACY OF DIFFERENT…
Table 7. Prevalence of T. vaginalis among females patients with vaginal discharges using different laboratory tests.
Test No.
examined No. +ve
%
Direct vaginal examination
1296 5 0.39
Urine examination
1210 3 0.25
Culture 223 3 1.35 Pap smear 92 6 6.52 Vaginal pH 1061 5 0.47
(Table 8), shows that the infected women with T. vaginalis were of high vaginal pH values 6, 6.3 and 6.6 (100% for each). In vitro experiments designed to determine the effect of different pH values on trichomonads survival and metabolism Table 8: Prevalence of T. vaginalis according to the vaginal pH of the patients.
pH No.
examined No. +ve
%
3.8 4.2 4.4 4.6 4.9 5.2 5.5 6.0 6.3 6.6
6 5
38 256 411 195 145 2 2 1
0 0 0 0 0 0 0 2 2 1
0 0 0 0 0 0 0
100 100 100
Total 1061 5 0.47
Regarding comparison of the diagnostic methods used in this study, the efficacy of direct vaginal examination and cultivation method was performed on 223 patients; rates of infection were 1.79% and 1.35% respectively (Table 9). Table 9.Comparison between efficacy of direct vaginal examination and culture in detection of T. vaginalis.
Test No.
examined No. +ve
%
Direct vaginal examination
223 4 1.79
Culture 223 3 1.35
Comparison between efficacy of direct vaginal examination, urine examination, culture and Pap smear among 61 patients was illustrated in (Table 10) and higher infection rate was (4.92%0 for Pap smears. Table 10. Comparison between efficacies of direct vaginal examination, urine examination, culture and Pap smear among 61 patients.
Test No. +ve
%
Direct vaginal examination Urine examination Culture Pap smear
2 0 2 3
3.28 0
3.28 4.92
Comparison between efficacy of direct vaginal examination, ELISA, and complement fixation tests in detection of trichomoniasis is shown in (Table 11). There were highly significant differences in the efficacy of the three diagnostic methods used; complement fixation and ELISA tests showed higher infection rates 60% and 52% respectively than direct vaginal examination 0.39% which has low sensitivity, varies from 38% to 82. Table 11. Comparison between efficacies of direct vaginal examination, ELISA, and complement fixation tests in detection of T. vaginalis infection.
Test No.
examined No. +ve
%
Direct vaginal examination ELISA Complement fixation test
1296 25 15
5 13 9
0.39 52 60
χ2=587.523 df=2 P<0.01
Significant DISCUSSION
The infection rate, in the present study 0.39% is much lower than those reported by some other studies in different parts of Iraq, but they still represent an important level from the public health point of view. In Baghdad, the infection rates of trichomoniasis was 9.46% 8 ; in Mosul 9
5
Duhok Medical Journal Volume 6, Supplement 3, 2012
33%; and 13% in Basrah. In Tikrit and Kirkuk several studies were carried out by 11-13, they recorded infection rates of 4.3%, 1.33% and 78% respectively. In another study in Kirkuk a lower rate 2.8% was reported 14, while in Sulaimani, a much lower rate 1.6% was reported 15. The frequency of T. vaginalis has diminished markedly in the present study, raising the hypothesis that this may be a consequence of the improvement in conditions of hygiene and sanitary habits. This study showed a lower infection rate of trichomoniasis among women in the rural areas 0.28% as compared with that of urban region 0.42%. This is in agreement with the study of Al-Somaeday 12 in Tikrit who reported rates for rural and urban (0% and 2.06%) inhabitants, respectively. While disagreed with the results of Al-Zubaidi 16 in Mosul, she indicated higher infection rate among women living in the rural areas. In general, socioeconomic factors such as low level of education or economic income, and strong sexual desire are associated with a higher prevalence rate of trichomoniasis 17. However, in the present study, it was found that a lower level of education or economic income tended to confer protection against trichomoniasis, in the rural area. The rate of infection was 13.33% among 15 (widow, divorced and separated women), 8.33% among 12 single females and 0.16% among married women These results disagree with those of Kadir 11 in Tikrit and Fattah 15 in Sulaimani, who recorded the highest rate of infection among married women 3.74. The high infection rates in widows and unmarried females may be due to the small sample size taken from these patients. Regarding the patient's age, the patients mostly infected by T. vaginalis were at their child-bearing age 14-40 years. This is in agreement with that reported by Al-Mudhaffar 18, from Baghdad, who showed that the highest rate of infection 10.7% among women with age group 20-40
years, and also with Kadir 11 in Tikrit city, and Mahdi et al. 10 in Basrah that the child-bearing bearing age 14-40 years. The presence of infection with T. vaginalis in women of reproductive age may be related to the high level of sexual activity which increases the level of reproductive hormones and decreases with progression of age 19. In addition, there are many factors which cause differences in rates of infection among different age groups like the pH of vagina, secretion of estrogen and progesterone hormones for maintaining the pH of the vagina through the birthing age as well as abortion and frequency of pregnancy and immunodeficiency of the body defense after menstruation period 20. The lower infection rates of trichomoniasis were almost evenly distributed among women who had school education and illiterate patients 0.36% and 0.35% respectively compared to 0.57% with college education. This finding is in agreement with Mahdi et al. 10 in Basra, who recorded the rates of T. vaginalis infection 10.6%, 12.2% and 18.6% among low, moderate and high education levels respectively The employed women were more susceptible to trichomoniasis than housewives 0.53% and 0.36% respectively and this may be due to the fact that the employer women are more obligated to use contraceptives, thus they are sexually more active than the housewives. In a study performed by Darogha 21, she observed that T. vaginalis infection was more common among women who used contraceptives 60.2% than those who did not use any kind of contraceptives 39.8% in Erbil city. This finding is in agreement with the study of Mahdi et al. 10 in Basra, who detected the infection rate by T. vaginalis 18.4% in the workers outside home and 11% in the housewives. The higher infection rate of in women during gestation and pregnancy 0.41% in comparison to non-pregnant women 0.10% is also reported by several researchers, such as Mahdi et al. 10 in Basra, 18.6%,
6
PREVALENCE AND COMPARISON BETWEEN THE EFFICACY OF DIFFERENT…
Mawlood 22 in Erbil 21.65%, Sulaimany governorate 1.6% and Bebany 13 in Kirkuk and Tikrit cities 48% and 22.22% respectively. While the results of the present study disagreed with the findings of other studies which recorded the lower infection rates with trichomoniasis among pregnant women such as Kadir et al. 11; Darogha 21 9.1% and 5.1% respectively. The higher rate during pregnancy may be attributed to the hormonal disturbances during pregnancy period such as hyperestrogenism and an excess of glycogen levels in vaginal mucoid since it is a suitable environment for the growth and multiplication of the parasite . The high vaginal pH values 6 of infected women are similar to values of pH 5-6 and 6 were recorded by Kanno and Sobel 24. Sulyman 1 4 reported the infection rates 6.7%, 2.4% and 2.0% among infected women with vaginal secretion pH values of 7-8, 5-6 and 3-4 respectively in Kirkuk city. In vitro experiments designed to determine the effect of different pH values on trichomonads survival and metabolism, Diamond 25 indicated that this parasite grow optimally at a pH of 6.0 – 6.3, and Connaris 26 observed that cultures buffered between pH 5 and pH 9 all had a pH of 6 after two day's growth and this result implies that this parasite has a mechanism for both raising and lowering the pH of the microenvironment. However, organism began to die below pH 5. The increase in vaginal pH causes a decrease or elimination of endogenous Lactobacillus species and thus creates a better environment for the growth of the parasite and T. vaginalis flourish best. In addition, there are certain other factors contributing to the pathogencity, such as cell-detaching factors, which are inactivated at a pH of less than 5 27 . Comparison between efficacy of direct vaginal examination and cultivation method; rates of infection were 1.79% and 1.35% respectively. The results disagree with several studies which demonstrated
that the culture technique is more efficient than direct microscopic examination of vaginal secretions to diagnose trichomoniasis such as: Negm and el-Haleem 28 who reported 56.5% by wet mount microscopy and 72.9% by culture in Egypt. Sulyman 14 , in Kirkuk city, reported a rate of 2.4% by wet mount and 2.8% by cultivation method. Comparison between efficacy of direct vaginal examination, urine examination, culture and Pap smear, (Table 10) shows higher infection rate 4.92% for Pap smears which is in agreement with Ryu et al. 29 , who observed similar result 4.6% in comparison with vaginal wet mount 2% and culture 3.3%; also in a group of 290 symptomatic patients with cervico-vaginitis and 160 asymptomatic women in Egypt, Mahmoud et al. 30 detected 35 positive samples using culture techniques, of these, 12 were positive by wet mount and 21 by Pap Smear. In this study no positive cases (0%) were recorded by wet mount examination of urine. Several studies reported higher infection rate in vaginal swabs than urine 10, 11,20 .This is due to fact that genital tract is the normal habitat of T. vaginalis. There were highly significant differences in the efficacy of the three diagnostic methods used; complement fixation and ELISA tests showed higher infection rates 60% and 52% respectively than direct vaginal examination 0.39% which has low sensitivity, varies from 38% to 82%, due to several reasons, it is dependent on the inoculum size because fewer than 104 organisms/ml will not be seen. This finding is in comparable with Kharofa 9 in Mosul, who demonstrated infection rates with trichomoniasis by using ELISA method 64%, and direct microscopic observation of motile protozoa from vaginal samples 33%. It is concluded that trichomoniasis in women is not highly prevalent in Erbil Governorate. Higher infection rate was in urban inhabitants, women of reproductive or child-bearing age,
7
Duhok Medical Journal Volume 6, Supplement 3, 2012
employer and with college education level. Single and married women showed lower infection rate than other women. High pH values of vaginal discharges were recorded among trichomonad infected women. Pap smears revealed higher efficacy in comparison with direct vaginal examination and cultivation techniques, Serological methods were highly significant diagnostic methods in comparison with direct vaginal examination. It is recommended to carry on further studies, on patients attending the primary health care centers and gynecological clinics in different parts ofr the country.
REFERENCES
1. Parija SC. Text book of Medical Parasitology. 2nd ed. Chennai :Medical Books Publishers;2004.
2. Hoffman DJ, Brown GD, Wirth FH, Gebert BS, Baily CL, Anday EK. Urinary tract infection with Trichomonas vaginalis in a premature newborn infant and the development of chronic lung diseases. J Perinatol.2003; 23: 59-61.
3. Schwebke JR. Update of Trichomoniasis. Sex Transm Infect.2002; 78(5): 378-9.
4. Schwebke JR, Burgess D. Trichomoniasis. Clin Microbiol Rev.2004; 17(4): 794-803.
5. Naib, Z.M. Exfoliative cytopathology. 2nd ed. Boston: Little, Brown and Company;1976.
6. Koss, LG.. Diagnostic cytology and its histopathologic bases. 4th ed. Philadelphia: J B Lippincott company;1992.
7. Milton JS, Tsokos JO. Statistical methods in the biological and health sciences. McGraw-Hill international book company;1983.
8. Al-Mahdawy HSM. Laboratory diagnosis of Trichomonas.
vaginalis in patients with vaginal discharge. M.Sc. Thesis, College of Health and Medical Technology, University of Baghdad;2006.
9. Kharofa WAM. Experimental studies on isolated Trichomonas vaginalis parasite from females in Ninevah Government. Ph.D. Thesis, College of Science, University of Mosul;2006.
10. Mahdi NK, Gany ZH, Sharief M.Risk factors for vaginal trichomoniasis among women in Basra, Iraq. EMHJ.2001; 7(6): 918-24..
11. Kadir SM. Prevalence of Trichomonas vaginalis among females with vaginal discharge in Tikrit City. Diploma Dissertation, College of Medicine, University of Tikrit;1996.
12. Al-Somaeday EG. Study on the prevalence of trichomoniasis in married women intended Tikrit teaching hospital and the effect of some plant extracts on the parasite. M.Sc. Thesis, College of Education for Girls, University of Tikrit;2006.
13. Bebany BAM. Relationship between Trichomonas vaginalis infection with Chlamydia and bacterial vaginosis infections among women in Kirkuk and Tikrit Cities. M.Sc. Thesis, College of Science, University of Tikrit;2008.
14. Sulyman MA. A study on Trichomonas vaginalis and associated bacteria that causing sexual transmitted diseases in Kirkuk city. M.Sc. Thesis, College of Science, University of Tikrit;2008.
15. Fattah COD. Prevalence of Trichomonas vaginalis among women with vaginal discharge in Sulaimani Governorate. M.Sc. Thesis, College of Medicine, University of Sulaimani ;2007.
16. Al-Zubaidi NMA.Epidemiological study of the infection with
8
PREVALENCE AND COMPARISON BETWEEN THE EFFICACY OF DIFFERENT…
Trichomonas vaginalis and associated microorganisms in females of Mosul City. M.Sc. Thesis, College of Science, University of Mosul;2005.
17. van den Hoek A, Yuliang F, Dukers NH, Zhiheng C, Jiangting F, Lina Z, et al. High prevalence of syphilis and other sexually transmitted diseases among sex workers in China: potential for fast spread of HIV. AIDS.2001; 15(6): 753-9 .
18. Al-Mudthafar ZM, Al-Jeboori TI. Characterisation of Trichomonas vaginalis isolates from patients in Baghdad by isoenzyme electrophoresis. J Fac Med. 2001; 43(2): 325-8.
19. Benenson AS. Control of communicable diseases manual. 16th ed. Washington: Am Publ Health Assoc;1995.
20. Levison ME, Corman LC, Carrington ER, Kaye D. Quantitative microflora of the vagina. Am J Obstet Gynecol.1977; 127(1): 80-5.
21. Darogha SN. Studies of some immunological and epidemiological aspects of Trichomonas vaginalis, Candida albicans and Neisseria gonorrhoeae in Erbil province. Ph.D. Thesis, College of Education (Ibn Al-Haitham), University of Baghdad;2005.
22. Maulood HH. Epidemiology and identification study for Trichomonas vaginalis in Erbil province. M.Sc. Thesis, College of Education, University of Al-Qadisiya;2006.
23. Campbell S, Monga A. Gynaecology by ten teachers. 17th ed. London :Arnold ;2000.
24. Kanno M, Sobel JD.Late recurrence of resistant Trichomonas vaginalis vaginitis: relapse or re-infection? Sex Transm Infect.2003; 79(3): 260-1.25.
25. Diamond LS. In vitro cultivation of the Trichomonadidae: A state of art review. Acta Univ Carol Biol.1986; 30: 221-8.
26. Connaris S. A study of the protozoan Trichomonas foetus with particular relevance to glycosidase production. Ph.D. Thesis , University of Westminister.;1997.
27. Cudmore SL , Delgaty KL, Hayward-McClelland SF, Petrin, DP, Garber GE. Treatment of infections caused by metronidazole-resistant Trichomonas vaginalis. Clin Microbiol Rev.2004; 17(4): 783-93.
28. Negm AY, el-Haleem DA. Detection of trichomoniasis in vaginal specimens by both conventional and modern molecular tools. J Egypt Soc Parasitol.2004; 34(2): 589-600.
29. Ryu JS , Chung HL , Min DY, Cho YH, Ro YS, Kim SR. Diagnosis of trichomoniasis by polymerase chain reaction. Yonsei Med J.1999; 40 (1): 56-60.
30. Mahmoud MS, Abdel-Aziz SS, El-Sherif EA, Swidan KH. Diagnosis of symptomatic and asymptomatic Trichomonas vaginalis infection by applying one tube nested PCR to vaginal discharge.J Egypt Soc Parasitol.1999;29(3):1031-46 .
9
Duhok Medical Journal Volume 6, Supplement 3, 2012
ón‚íq
@@ÜbåîbubÄ@‘bäíàíÙîa‹m@bä‹Ùäb“ïånò†@æŽïî@a†íu@æŽïÙŽîŠ@båmbè‹ŽïÙi@bä‹Ø†ŠìaŠói@ì@ŽôäìíjÄýói@a‰ŽîŠ Žõ‹ŽïÜìóè@ß@M×aÈ@@
@ì@ŽôäìíjØìŠaŒ@bäbƒ’í‚óä@bî@óÄŠò†@bÙïåïÝØ@bäa†òŠó@æŽïmò‹Ðb÷@Äbä†@ç‹ÙïÔbm@ómbè@‘bäíàíÙîa‹m@bäìíjÄýói@a‰ŽîŠ@a†@ŽôåïÜíØóÄ@ŽôĆ@Ûò‡åè
åi@ˆ@Šóè@Žõ‹ŽïÜìóè@ß@pójîbm@æŽïÙïåïÝØ@ì@ôàóÝ‚b@æŽïèó16@bèóàm@õ2007@bmóè@Žõ15@bèóàm@õ2008@@@a†íu@æŽïÙŽîŠ@bäbåï÷ŠbÙi@ŽõçbÙŽîŠ@çaì@båmbè‹ŽïÙi@bä‹Ø†ŠìaŠói@õŠbiò‡ŽîŒ@LŽôä‹Ùäb“ïånò†@æŽïîN@@
@Óò‡Ü@´î†@ómbè@ó“Žï÷@Äó÷5@@ˆ1296@íj’ím@a‰ŽîŠ@íØ@ç‹ÙïÔbm@óåïmbè@æŽïäí¹@ónïi†@Žôäì[email protected]@E@ì@ça‹ŽîˆbjÜ0.28@EçaŠóiìŠìò‡Ü@N@Žô@æŽîìó÷@æî‰Äóè@Žôi@óåîbà@Žôä‹Ùîí’@ôn“q@æŽïî@çìíi@pò‹Ðb÷@ìó÷@çaì@bïäa‹q14M40@a†@¶b@N@@ìíi@q@ò‰ŽîŠ@bòìŠóè
çýbàŠói@æŽïäˆ@ˆ@çó؆ŠbØ@æŽïmò‹Ðb÷@Óò‡ÜN@@båï÷ŠbÙi@óåmbè@Žôä‹Ùäb“ïånò†@æŽïî@a†íu@æŽïÙŽîŠç@~@@@@Žô“Žï÷@ŽôÄ@oîŠb؆@q@çbïàóèˆ@tbq@Žôäìí¹@bÙŽîŠ@íØ@ìíi@Šbî†@Žôä‹Ø†ŠìaŠói@Žôàò‡Üì
ò‹Ðb÷@Žô’óÜ@bÄb÷ˆ@ŠóÙŽï÷@Žôäìí¹@bä‹ÙïÔbm@ôØòì@õ†@æŽïَ@ìíi@’bi@Žôä‹Ùäb“ïånò†@íi@ŽôÙŽîŠ@ŽôÄ@båmbè‹ŽïÙi@ì@LpóÙäb“ïånò†ŽômN
ó–þ©a@ @@@
ê—nÜ@óÑÝnƒ¾a@׋Üa@óïÜbÉÐ@óäŠbÕàì@ÜbåîbubÐ@‘bäíàíÙîaÜa@‹à@Šb“näa@߇Éà ÞïiŠc@À@M×a‹ÉÜa@@@@
@@@@@@@óïz—Üa@Øa‹¾a@Éi@ì@ò†ýíÜa@ôÑ“n¾@óïuŠb©a@ò†bïÉÜa@À@öbåÜa@õ‡Ü@‘bäíàíÙîaÜa@‹·@óib–ýa@߇Éà@óaŠ†@szjÜa@a‰è@Þ@æà@òÑÝÜ@ÞïiŠc@À@ó–b©a@pa†bïÉÜaì16@¸@Œí2007@@¶a15@@Œí¸2008@@@@@@@@ë‰è@óïÜbÉÐ@óäŠbÕà@Êà@˜ïƒ“nÝÜ@óÑÝn¬@׋ @ãa‡ƒnbi
˜ïƒ“nÝÜ@׋ÜaN@@@õ‡Ü@‹¾a@‡uì5@@μi@æà1296@@@@óib–ýa@ójä@oäbØ@ì@bé—zÐ@@Üa@óïÝjé¾a@xˆbáåÜa@æà[email protected]@E@@ì@‹›¨a@À0.28@E
ÓbîŠÿa@À@NHŠÿa@öbåÜa@μi@óib–þÜ@‹rØÿa@߇ɾa@çbØì@@@@@ðib−ýa@‹áÉÜa@À@ðmaíÝÜaì@LæèÌ@æà@‹rØc@pþ—Ñå¾a@ìa@pbÕݾaì@Þàa14M40@óå@NpíïjÜa@pbiŠ@æà@‹rØc@oäbØ@pbÑÄí¾a@õ‡Ü@ójåÜa@Ú܉ØN@@
@@@@@@@˜zÑÜa@Þrà@׋Üa@æà@bèÌ@æà@˜ïƒ“nÜa@À@òöbÑØ@‹rØÿa@lbi@󱋒@óÕî‹ @oäbØ@óäŠbÕ¾a@‡åÈ@ì@˜ïƒ“nÝÜ@óÑÝn¬@׋ @oà‡ƒnaà@‹’bj¾aóïÝjé¾a@ózN@@
@@
10
EVALUATION OF ANTI-PHOSPHOLIPID ANTIBODIES IN YOUNG PATIENTS…
EVALUATION OF ANTI-PHOSPHOLIPID ANTIBODIES IN YOUNG PATIENTS WITH THROMBOEMBOLIC STROKE
MUNA A. KASHMOOLA MOHAMMAD M. A. ESSA
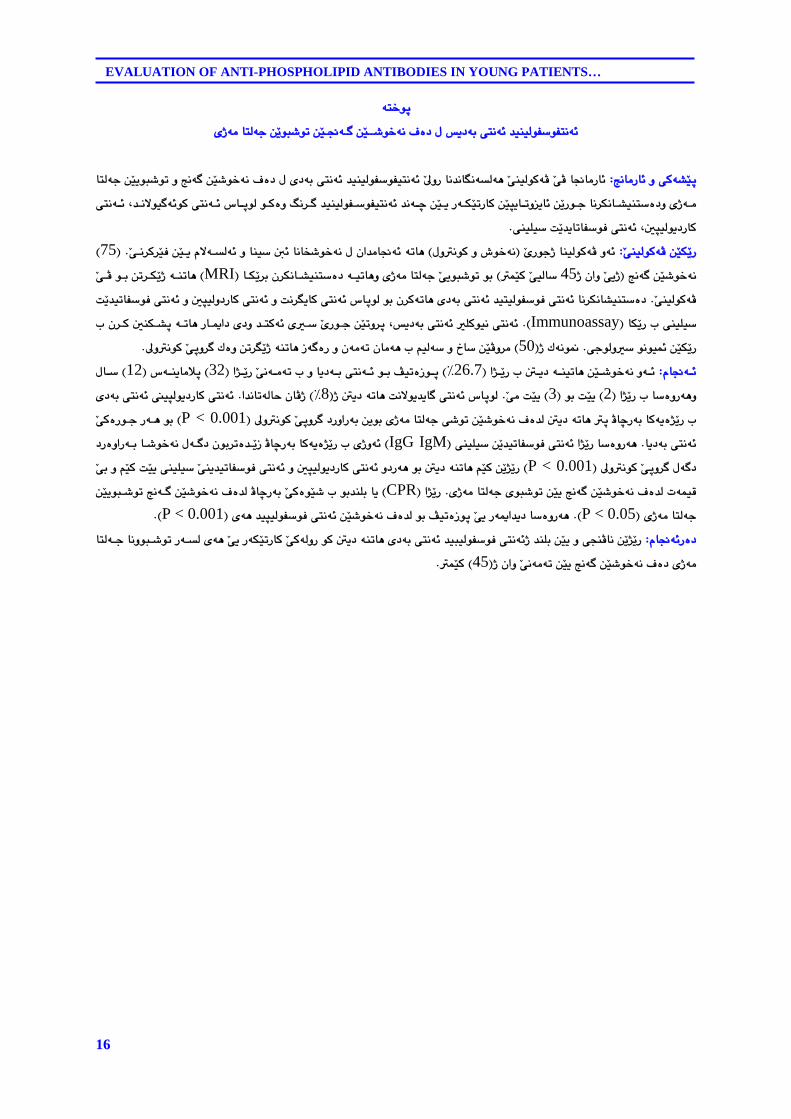
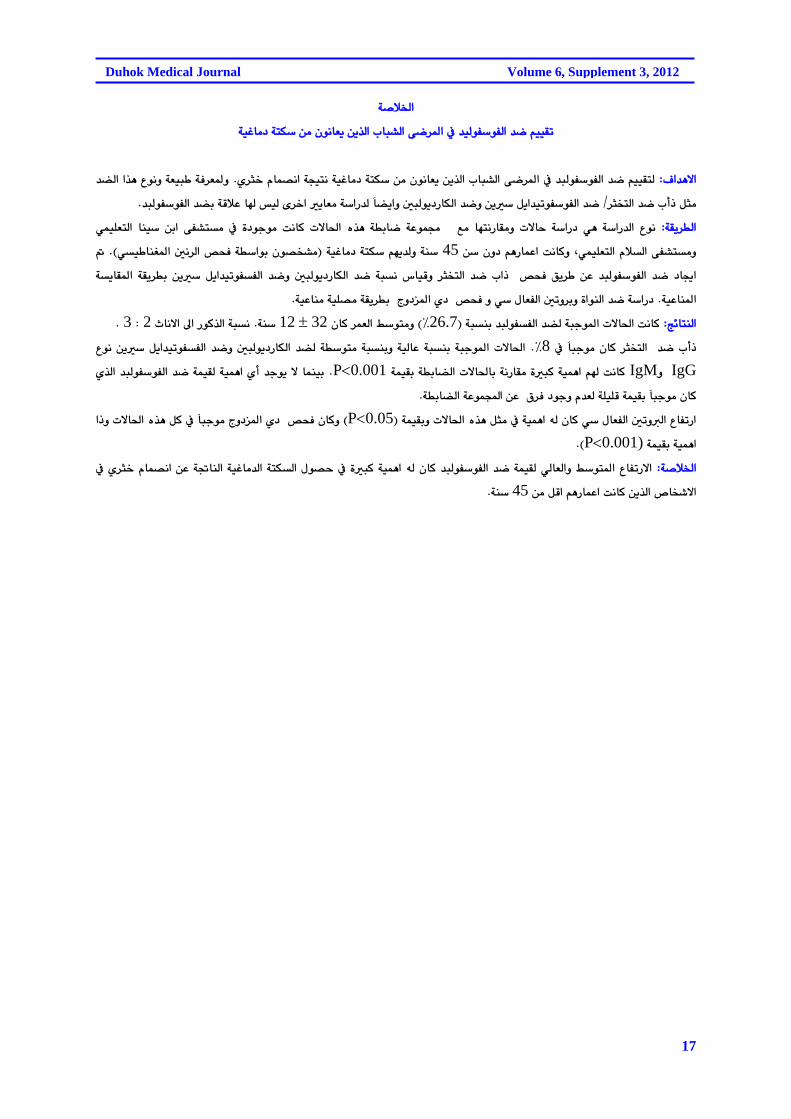
SALMAN ESSA HAZA Submitted 18 Jun 2012; accepted 3 Sep 2012 ABSTRACT Background and objective: To evaluate the antiphospholipid antibodies in young patients with thromboembloic stroke and to define the types and effective isotypes of some important antiphospholipids which are lupus anticoagulant, anticardiolipin and antiphosphatidyle serine antibodies, also to find any concomitant effect of some non antiphospholipid parameters. Methods: A case control study performed in Ibn-Sina and Al-Salam Teaching Hospitals. Seventy five young patients (age less than 45 years) with thromboembolic stroke diagnosed by magnetic resonance imaging and without any clear recognizable factors. Detection of antiphospholipid antibodies was done for lupus anticoagulant and assay of anticardiolipin and antiphosphatidyl serine antibodies by enzyme linked immunoassay. Anti-nuclear antibodies, C-reactive protein and D-Dimer reaction were tested by immunoserological methods. Fifty healthy, age and sex matched blood donors as healthy volunteers were studied as control group. Results: The detected cases with positive antibodies formed(26.7%),and the mean age was 32±12 year and male to female ratio 2:3. Lupus anticoagulant was positive in 8% of cases. Moderately and highly positive anticardiollipin antibodies (IgG and IgM) level were significantly more seen in patients with stroke than the control with P(<0.001) for each type of antibodies. Moderately and highly positive antiphosphatidyl serine antibodies (IgG and IgM) levels were significantly more seen in patients with stroke than the control with P value <0.001 for each type of antibodies. Low positive level for both anticardiolipin and antiphosphatidyl serine antibodies were of no value in young patients with thromboembolic stroke. High CRP level was of significant in young patients with thromboembolic stroke and positive antiphospholipid (P<0.05) . Positive D-dimer reaction was seen in positive antiphospholipid patients P(<0.001). Conclusion: Moderately and highly positive antiphospholipid antibodies were shown to play an important role in the development of thromboembolic stroke in young patients less than 45 years.
Duhok Med J 2012; 6 Suppl 3 :10-17. Key words: Antiphospholipid , Antibodies,Stroke,Young.
nti-phospholipid antibodies (APLA) are heterogenous group of
circulating serum polyclonal, immunoglobulins IgG and IgM that bind negatively charged or neutral phospholipids component of cell membrane and may induce thrombotic disorders 1. The anti-cardiolipin antibodies (aCl-Abs) and lupus anticoagulant (LA) are the most two important antibodies to be studied. 2,3 Other autoantibodies against negatively charged phospholipids rather than (aCl) and (LA) were also mentioned as
phosphatidylserine (aPS) 4,5. The (LA) can be detected by lupus anticoagulant sensitive activated partial throboplastin time (APTT) or diluted Russel, S. Viper Venom Time (DRVVT), while (aCL, Ab) can be tested by enzyme linked immunoassay (ELISA) method for B2-glycoprotein dependent antibodies including IgG and IgM 2,6. Such antibodies occur with undue frequency in young patients with stroke and or transient ischaemic attack and are not associated with concurrent diagnosis of systemic lupus erythematosis in most cases. 7 and in
* Department of Haematology, Mosul Medical College. ** Department of Medicine, Mosul Medical College. *** Neurology Unit ,AL_Salam Teaching Hospital . Corresponding Author: Muna A. Kashmoola.Email:[email protected].
A
11
Duhok Medical Journal Volume 6, Supplement 3, 2012
the absence of the usual important risk factors for cerebrovascular disease 8. The aim of this study was to evaluate the APLA in young patients with stroke and to define the types and effective isotypes of some important APLAs which are (LA) , (aCl) and (aPS), also to find any concomitant effect of some non-APLA parameters. METHODS After proval was obtained from the local ethics committee and informed consent obtained from each patients,and this study was carried out on 75 patients admitted to the Neurology Units in Ibn-Sina and Al-Salam Teaching Hospital in Mosul during a period of 2 years (January 2010-January 2012). The criteria for patient selection were less than 45 years of age and have no history of risk factors for stroke including smoking, diabetes mellitus, hypertension, prolonged immobilization, sickle cell disease, cardiac arrhythmia, family history of stroke and there was no laboratory evidence of hyperlipidaemia. Full investigations were done including complete blood count, activated partial thromboplastine time, prothrombine time, lipid profile, renal and liver function tests, echocardiography, Doppler ultrasound of both carotid arteries and magnetic resonance imaging (MRI). The diagnosis of thromboembolic stroke was clinically made by neurologist and confirmed by MRI. The APLAs were tested by estimation of IgG and IgM for both (aCl) and (aPS) antibodies by (ELISA) as (GPL and MPL unit /ml) (pharmacia and Upjohn, Freiburg, Germany). These antibodies were considered as negative (<15MPL or GPL unit/ml) low positive (15-25MPL or GPL unit/ml) and highly positive (>60 MPL or GPL unit/ml). Blood samples for (LA) were collected in tube containing 3.2 trisodium citrate, centrifuged at 2500 xg for 15 minute
within 30 minute of collection then centrifuged at 4oC to obtain platelet poor plasma, clotting based test for (LA) was done using start 4 (from Stago Diagnostica France). The ANA, CRP, and D-dimer were tested. All the laboratory kits and reagents used in this study were purchased from international suppliers and companies. CRP(from plasmatic…) titre of >12mg/L was considered of significant value.D_dimer reaction(qualitative and semiquantitative) (from ATLAS ,UK) Fifty healthy, age and sex matched blood donors as healthy volunteers were taken as control. The proportions were compared using the chi-square test with df 1 or df(r-1)and student t- test wherever indicated. The significant level was set at P<0.05. RESULTS
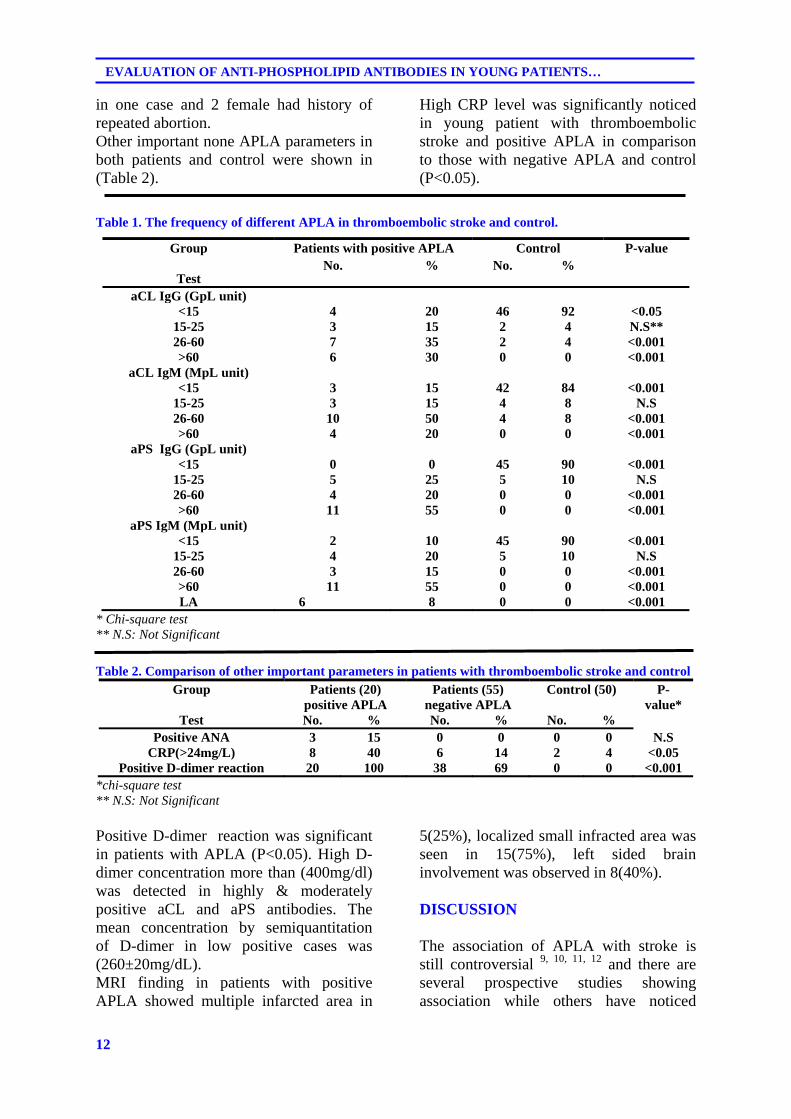
The detected cases with positive APLAs were 20 out of 75(26.7%). The age range of positive cases was 20-44 years (mean ±SD, 32±12 year), 12 female (60%) and eight male (40%), with male to female ratio 2:3. The detected frequencies of different types of APLAs in patients with stroke and the controls are shown in (Table 1). Moderately and highly positive aCl (IgG and IgM) were significantly seen in young patients with thromboembolic stroke with P value <0.001 in comparison to control. Moderately and highly positive aPS (IgG and IgM) were significantly seen in patients with thromboembolic stroke with P value <0.001 in comparison to control. Low positive aCL and aPS antibodies (IgG and IgM) in both patients and control were not significantly different. Lupus anticoagulant was of significance in young patients with thromboembolic stroke, with P<0.001. (seen in 8% of positive cases for APLA). History of previous stroke was seen in 2 patients, previous deep venous thrombosis
12
EVALUATION OF ANTI-PHOSPHOLIPID ANTIBODIES IN YOUNG PATIENTS…
in one case and 2 female had history of repeated abortion. Other important none APLA parameters in both patients and control were shown in (Table 2).
High CRP level was significantly noticed in young patient with thromboembolic stroke and positive APLA in comparison to those with negative APLA and control (P<0.05).
Table 1. The frequency of different APLA in thromboembolic stroke and control.
Group
Test
Patients with positive APLA Control P-value No. % No. %
aCL IgG (GpL unit) <15 4 20 46 92 <0.05
15-25 3 15 2 4 N.S** 26-60 7 35 2 4 <0.001 >60 6 30 0 0 <0.001
aCL IgM (MpL unit) <15 3 15 42 84 <0.001
15-25 3 15 4 8 N.S 26-60 10 50 4 8 <0.001 >60 4 20 0 0 <0.001
aPS IgG (GpL unit) <15 0 0 45 90 <0.001
15-25 5 25 5 10 N.S 26-60 4 20 0 0 <0.001 >60 11 55 0 0 <0.001
aPS IgM (MpL unit) <15 2 10 45 90 <0.001
15-25 4 20 5 10 N.S 26-60 3 15 0 0 <0.001 >60 11 55 0 0 <0.001 LA 6 8 0 0 <0.001
* Chi-square test ** N.S: Not Significant Table 2. Comparison of other important parameters in patients with thromboembolic stroke and control
Group
Test
Patients (20) positive APLA
Patients (55) negative APLA
Control (50) P-value*
No. % No. % No. % Positive ANA 3 15 0 0 0 0 N.S
CRP(>24mg/L) 8 40 6 14 2 4 <0.05 Positive D-dimer reaction 20 100 38 69 0 0 <0.001
*chi-square test ** N.S: Not Significant Positive D-dimer reaction was significant in patients with APLA (P<0.05). High D-dimer concentration more than (400mg/dl) was detected in highly & moderately positive aCL and aPS antibodies. The mean concentration by semiquantitation of D-dimer in low positive cases was (260±20mg/dL). MRI finding in patients with positive APLA showed multiple infarcted area in
5(25%), localized small infracted area was seen in 15(75%), left sided brain involvement was observed in 8(40%).
DISCUSSION
The association of APLA with stroke is still controversial 9, 10, 11, 12 and there are several prospective studies showing association while others have noticed
13
Duhok Medical Journal Volume 6, Supplement 3, 2012
otherwise1,13. The mean age for cases with positive APLA was 32±12 year, Danagariya (14) et al noticed on comparing the APLA positive and APLA negative stroke patients, that APLA positive patients had an average age of 36.8 years which was younger than average age for APLA negative group. The detected frequency of APLA in thromboembolic stroke in our study was (26.7%). Nagaraja et al in a study of 60 cases of young with stroke found elevated aCL in (23%). Other study have demonstrated the presence of APLA (LA, aCL or both) in (41%) with stroke. 16
Lupus anticoagulant was detected in nearly 8% of patients and it was of significance. Mishra and Rhohatg (2009) noticed that both LA and APLA showed significant correlation with the occurrence of stroke in young patients 16 which was different from the observation of Gat et al who conclused that measuring LA is helpful to define a patient's risk for arterial and venous thrombosis17. Lupus anticoagulant was detected in nearly 20% of patients by Mishra et al. Moderately positive and highly positive aCL and aPS were significant in young patients with thromboembolic stroke. Ali and Abdulla 18 demonstrated an association between aCL( IgG and IgM ) with concentration above 30 units/ml and a PS (IgG) and increased stroke and / or transient ischaemic attack risk. In other study elevation of aCL( IgG) was seen in 21.4% of patients and in 4% of control 16. In other stroke study,they found ,patients with APLA, the risk of cerebral infarction was 2.3 times higher than in those negative for the antibody19. The highly positive concentration of APLA was detected in two cases with history of previous stroke. Van Goor et al noticed that antiphospholipid is not a strong risk factor for recurrent strokes, TIA or other thrombotic episode in young women with previous stroke in 28 consecutive patients with stroke or transient ischemic attack. Case-control
studies of stroke in young people have been uniformly positive for APLA
20,21,22,23; other case-control studies among older adults have found aPLs to be associated with ischemic stroke 24,25,26,27. Robert J et mentioned that their study support the importance of antiphospholipid antibodies as an independent risk factor for stroke in young women. The presence of positive anti-nuclear antibody in some of studied patients may by itself represent the existence of antiphospholipid syndrome and the frequency of this parameter differs between the stroke cases and control. High CRP level more than 24mg/L among APLA positive cases was significant (P<0.05). Recently it has been noticed that high CRP level is associated with highly positive aCL 28,29 antibody, therefore this marker could be considered as an important acute phase reactant to APLA. D-dimer reaction was significantly important in moderately and highly positive APLA. Indeed most patients with recent cerebrovascular thrombosis CVT, D-dimer concentration were increased & negative D-dimer assay may make the diagnosis of CVT very unlikely(30). Elevation of D-dimer in antiphospholipid syndrome had been suspected 31. The increasing use of the D-dimer assay in clinical practice could be extended to patients presenting with acute cerebrovascular ischemic events to help predict stroke subtype32. REFERENCES
1- Alarcon-Segovia D, Delez M, Oria C.
Antiphospholipid antibodies and the antiphospholipid syndrome in systemic lupus erythromatosis. A prospective analysis of 500 consecutive patients. Medicine (Baltimore) .1989; 68:353.
2- Kumar KS, Parkash MS, Joythy. Glycoprotein I dependent anticardiolipin antibodies in women experiencing recurrent pregnancy loss. JHJ. 2002; 2(1): 65-7.
14
EVALUATION OF ANTI-PHOSPHOLIPID ANTIBODIES IN YOUNG PATIENTS…
3- Miyakis S, Lockchine MD, Atsumi T, Branch DW,Brey RL,Cervera et al. international consensus statement on an update of the classification criteria for definite antiphospholipid syndrome. JTH. 2006;4: 295-6.
4- López-Soto A, Cervera R, Font J, Bové A, Reverter JC, Muñoz FJ,et al. Isotype distribution and clinical significance of antibodies to cardiolipiun, phosphatidic acid, phosphotidylinositol and phosphatidylserine in systemic lupus erthymatosis: Prospective analysis of a series of 92 patients. Clin Exp Rheumatol. 1997;15: 143-9.
5- Rauch J, Janoff AS. Antibodies against phospholipids other than cardiolipin: potential role for both phospholipids and protein. Lupus. 1996;5: 498-502.
6- Hoffbrand AV,Catovsky D.Tuddenham EGD et al.Postgraduate haematology .6th ed. Oxford: Butterworth-Heinemann ;2011
7- Brey RL, Hart RG, Sherman DG, Tegeler CH. Antiphospholipid antibodies and cerebral ischemia in young people. Neurology. 1990; 4:1190-6.
8- Weingarten K, Filippi C, Barbut D,Ziemmerman RD. The neuroimaging features of the cardiolipin antibody syndrome. Clin imaging. 1997; 21(1): 6-12.
9- Gatenby PA. Controversies in the antiphospholipid syndrome and stroke. Thromb Res. 2004;114: 483-8.
10- Chandrashekhara S, Kirthi R, Varhese J. Prevalence of anticardiolipin antibodies in various thrombotic conditions: a hospital based study. J Assoc Physicians India. 2003; 51: 359-62.
11- Kitagawa Y. Ohkuma H, Tokuoka K. Ischemic stroke with antiphospholippid antibody. Brain nerve. 2008; 60: 1144-55.
12- Mishra MN, Gupta S, Gupta MK. Significance of antiphospholipid antibodies in a patients with bad
obstetric history. Indian J Med Sci. 2007; 61(12): 663-4.
13- Haywood S, Liesner R, Pindora S,Ganesan V, et al. thrombophilia and first arterial ischaemic stroke. A systemic review. Arch Dis Child. 2005; 90: 402-5.
14- Panagariya A, Grag A, Sureka RK. Antiphospholipid positive in young stroke: an analysis of 12 cases. J postgrad Med .2000; 46(4):528-61.
15- Nagargia D, Christopher R, Manjari T. Anticardiolipin antibodies in ischaemic stroke in the young: Indian Experience .J Neurol Sci. 1997; 150(2): 137-42.
16- Mishra MN, Rhohatg S. Antiphospholipid antibodies in young Indian patients with stroke. J Postgrad Med. 2009;55(3): 161-4.
17- Galli M, Luciani D, Bertolini G,Barbui T. lupus anticoagulants are stronger risk factors for thrombosis than anticardiolipin antibodies in the antiphospholipid syndrome. A systemic review of the literature. Blood. 2003;101(5) : 1827-2.
18- Ali H, Abdulla Z. The role of antiphospholipid autoantibodies syndrome in cerebrovascular disease. 2007; 16: 41-6.
19- Van Goor MP, Alblas CL, Leebeek FW,Koudstaal PJ,Dippel DW .Do antiphospholipid antibodies increase the long term risk of thrombotic complications in young patients with a recent transient ischaemic attack or ischaemic stroke?. Acta Neurol Scand. 2004; 109(6): 410-5.
20- Angelini L, Ravelli A, Caporali R, Rumi V, Nardocci N, Martini A. High prevalence of antiphospholipid antibodies in children with idiopathic cerebral ischemia. Pediatrics. 1994; 94 (4pt 1): 500–3.
21- Brey RL, Hart RG, Sherman DG, Tegeler CH. Antiphospholipid antibodies in cerebral ischemia in young people. Neurology. 1990; 40 (8): 1190–6.
15
Duhok Medical Journal Volume 6, Supplement 3, 2012
22. Ahmed E, Stegmayr B, Trifunovic J, Weinehall L, Hallmans G, Lefvert AK. Anticardiolipin antibodies are not an independent risk factor for stroke: an incident case-referent study nested within the MONICA and Vasterbotten cohort project. Stroke. 2000;31(6): 1289–93.
23. Tuhrim S, Rand JH, Wu XX, Weinberger J, Horowitz DR, Goldman ME, te al. Elevated anticardiolipin antibody titer is a stroke risk factor in a multiethnic population independent of isotype or degree of positivity. Stroke. 1999; 30 (8): 1561–5.
24. Nencini P, Baruffi MC, Abbate R, Massai G, Amaducci L, Inzitari D. Lupus anticoagulant and anticardiolipin antibodies in young adults with cerebral ischemia. Stroke. 1992; 23 (2): 189–93.
25. Antiphospholi Anticardiolipin antibodies are an independent risk factor for first ischemic stroke. The Antiphospholipid Antibodies in Stroke Study (APASS) Group.Neurology. 1993; 43 (10): 2069–73.
26. Chakravarty KK, Al-Hillawi AH, Byron MA, Durkin CJ. Anticardiolipin antibody associated ischemic strokes in elderly patients without system lupus erythematosus. Age Ageing. 1990; 19 (2): 114–8.
27. Brey RL, Stallworth CL, McGlasson DL, Wozniak MA, Wityk RJ, Stern
BJ, et al. Antiphospholipid antibodies and stroke in young women .Stroke .2002;33(10):2396-400.
28. Warss (the world antiphospholipid antibodies Research Stroke Study Group) and GENESIS Study Group). The feasibility of collaborative double-blind study using an anticoagulant. Cerebrovasc Dis. 1997; 7: 1
29. Kosinski CM, Mull M, Schwarz M, Koch B, Biniek R, Schläfer J, et al. Do normal D-dimer levels reliably exclude cerebral sinus thrombosis?. Stroke. 2004; 35(12): 2820-5.
30. Tardy B, Tardy-Poncet B, Viallon A, Piot M, Garnier P, Mohamedi R,et al. D-dimer level in patients with suspected acute cerebral venous thrombosis. Am J Med. 2002; 113 (3): 238-41.
31. Eichinger S, Minar E, Bialonczyk C, Hirschl M, Quehenberger P, Schneider B,et al. D-dimer level and risk of recurrent venous thromboembolism. JAMA. 2003; 290 (8): 1071-4.
32. Ageno W, Finazzi S, Steidl L, Biotti MG, Mera V, Melzi D'Eril G, et al. Plasma measurement of D-Dimer level for the early diagnosis of ischemic stroke subtypes. Arch Intern Med. 2002; 162 (22): 2589-93.
16
EVALUATION OF ANTI-PHOSPHOLIPID ANTIBODIES IN YOUNG PATIENTS…
ón‚íq
î†ói@ônäó÷@‡ïåïÜíÑíÑnäó÷ õˆóà@bnÜóu@æŽîíj’ím@æŽï−ó @æŽï’í‚óä@Óò†@ß@@@@
wäbàŠb÷@ì@ôØó“ŽïqZ@@bnÜóu@æŽïîíj’ím@ì@wäó @æŽï’í‚óä@Óò†@ß@õ†ói@ônäó÷@‡ïåïÜíÑíÑïnäó÷@Ž¶ìŠ@bä‡äbäóÜóè@ŽôåïÜíØóÄ@ŽôÄ@b−bàŠb÷@@@@ŠóÙŽïmŠbØ@æŽïrîbmìîb÷@æŽîŠíu@bä‹Ùäb“ïånò†ì@õˆóà@@@@@@@@ônäó÷@L‡äýíï ó÷íØ@ônäó÷@‘bqíÜ@íØòì@Âä‹ @‡ïåïÜíÑíÑïnäó÷@‡äóš@æŽïî
ôåïÝï@oŽî‡îbmbÑíÐ@ônäó÷@LμrïÜíbØN@@ŽôåïÜíØóÄ@æŽïÙŽîŠZ@@ŽõŠíuˆ@båïÜíØóÄ@ìó÷IßìäíØ@ì@•í‚óä@H@@@Žôä‹Ø‹ŽïÐ@æŽïî@ãýóÜó÷@ì@båï@³÷@bäbƒ’í‚óä@ß@ça‡àb−ó÷@ómbèI@N75@H@wäó @æŽï’í‚óäIçaì@Žôîˆ@ˆ45@áŽïØ@ŽôïÜb@H@@@@bÙŽî‹i@ç‹Ùäb“ïånò†@óïmbèì@õˆóà@bnÜóu@Žôîíj’ím@íiIMRI@H@@@@@ŽôÄ@íi@æm‹ÙŽîˆ@óåmbè
ŽôåïÜíØóÄ@N@oŽî‡ïmbÑíÐ@ônäó÷@ì@μrïÜ솊bØ@ônäó÷@ì@oä‹îbØ@ônäó÷@‘bqíÜ@íi@ç‹Øómbè@õ†ói@ônäó÷@‡ïnïÜíÑíÐ@ônäó÷@bä‹Ùäb“ïånò†@bÙŽîŠ@l@ôåïÝïIImmunoassay@NH@ônäó÷@@@@@@@@l@ç‹Ø@μåÙ“q@ómbè@Šbºa†@ñ†ì@‡nØó÷@ñ@ŽõŠíu@æŽïmì‹q@Lî†ói@ônäó÷@ÝØíïä
ôuíÜì@íäíïá÷@æŽïÙŽîŠ@Nˆ@Ûóäí¹I50@H¶ìäíØ@Žôqì‹ @Ûòì@æm‹Žîˆ@óåmbè@Œó òŠ@ì@çóàóm@çbàóè@l@âïÜó@ì@…b@æŽïÄì‹àN@@ãb−ó÷Z@@a‰ŽîŠ@l@´î†@óåïmbè@æŽï’í‚óä@ìó÷I26.7@HE@ônäó÷@íi@ÆïmòŒíq@a‰ŽîŠ@Žôäóàóm@l@ì@bî†óiI32@H@‘óåîbàþqI12@H@ßb
@a‰ŽîŠ@l@bòìŠóèìI2@H@íi@oŽïîI3@HŽôà@oŽïî@Nˆ@´î†@ómbè@oäýíî‡îb @ônäó÷@‘bqíÜI8@HEa‡äbmóÜby@çbĈ@N@õ†ói@ônäó÷@ïrÜíbØ@ônäó÷Žôqì‹ @†ŠìaŠói@æîíi@õˆóà@bnÜóu@ô’ím@æŽï’í‚óä@Óò‡Ü@´î†@ómbè@q@ÄbšŠói@bØóîò‰ŽîŠ@l@@¶ìäíØIP < 0.001@H@@@ŽôØòŠíu@Šóè@íi
bî†ói@ônäó÷@N@ôåïÝï@æŽî‡ïmbÑíÐ@ônäó÷@a‰ŽîŠ@bòìŠóèIIgG IgM@H@@@@@†ŠòìaŠói@b’í‚óä@ßó †@çíi‹mò‡ŽîŒ@ÄbšŠói@bØóîò‰ŽîŠ@l@õˆìó÷@¶ìäíØ@Žôqì‹ @ßó †IP < 0.001@HïmbÑíÐ@ônäó÷@ì@μrïÜíbØ@ônäó÷@솊óè@íi@´î†@óåmbè@âŽïØ@æŽî‰ŽîŠ@Žôi@ì@âŽïØ@oŽïî@ôåïÝï@Žôåî‡
õˆóà@bnÜóu@õíj’ím@æŽïî@wäó @æŽï’í‚óä@Óò‡Ü@póáïÔ@N@a‰ŽîŠICPR@H@@@æŽïîíj’ím@wäó @æŽï’í‚óä@Óò‡Ü@ÄbšŠói@ŽôØòíŽï’@l@íi‡åÝi@bîõˆóà@bnÜóu IP < 0.05@NH@õóè@‡ïrïÜíÑíÐ@ônäó÷@æŽï’í‚óä@Óò‡Ü@íi@ÆïmòŒíq@Žôî@Šóºa‡î†@bòìŠóèIP < 0.001NH@@
−ó÷Šò†ãbZ@@@@@bnÜóu@bäìíj’ím@ŠóÜ@õóè@Žôî@ŠóÙŽïmŠbØ@ŽôØóÜìŠ@íØ@´î†@óåmbè@õ†ói@ônäó÷@‡ïjïÜíÑíÐ@ônäó÷ˆ@‡åÝi@æŽïî@ì@ôvåÄbä@æŽî‰ŽîŠˆ@çaì@Žôäóàóm@æŽïî@wäó @æŽï’í‚óä@Óò†@õˆóàI45@HáŽïØN@@
17
Duhok Medical Journal Volume 6, Supplement 3, 2012
ó–þ©a@ @‡ïÜíÑíÑÜa@‡š@âïïÕm@óïÌbà†@ónÙ@æà@çíäbÉî@æî‰Üa@lbj“Üa@ôš‹¾a@À@@
@@Óa‡èýaZ@ñ‹r‚@ãbá—äa@óvïnä@óïÌbà†@ónÙ@æà@çíäbÉî@æî‰Üa@lbj“Üa@ôš‹¾a@À@‡jÜíÑíÑÜa@‡š@âïïÕnÜ@N@‡›Üa@a‰è@Ëíäì@óÉïj @óЋɾì
‹rƒnÜa@‡š@lcˆ@Þrà@O‡jÜíÑíÑÜa@‡›i@óÔþÈ@b@ïÜ@õ‹‚a@îbÉà@óaŠ‡Ü@b›îaì@μjÜíbÙÜa@‡šì@æî@Þîa‡ïmíÑíÑÜa@‡šN@@óÕî‹ÜaZ@aŠ‡Üa@ Ëíä@ðáïÝÉnÜa@ båï@ æia@ ôÑ“nà@ À@ ò†íuíà@oäbØ@ pýb¨a@ ë‰è@ óibš@ óÈíáª@ @ @ Êà@ bénäŠbÕàì@ pýby@ óaŠ†@ ðè@ ó
@æ@çì†@âèŠbáÈa@oäbØì@LðáïÝÉnÜa@ãþÜa@ôÑ“nàì45@@óïÌbà†@ónÙ@âéî‡Üì@óåIðï bå;a@μä‹Üa@˜zÐ@óaíi@çí—ƒ“à@NH@rƒnÜa@ ‡š@laˆ@ @˜zÐ@Öî‹ @æÈ@ ‡jÜíÑíÑÜa@ ‡š@ †b°a@óîbÕ¾a@ óÕî‹i@ æî@Þîa‡ïmíÑÑÜa@ ‡šì@μjÜíbÙÜa@ ‡š@ ójä@‘bïÔì@ ‹
óïÈbå¾a@NóïÈbåà@óïÝ—à@óÕî‹i@@x솾a@ñ†@@˜zÐ@ì@ð@ßbÉÑÜa@μmì‹iì@òaíåÜa@‡š@óaŠ†N@@w÷bnåÜaZ@@ójåi@‡jÜíÑÑÜa@‡›Ü@ójuí¾a@pýb¨a@oäbØI26.7@HE@çbØ@‹áÉÜa@Âínàì32@@12@óå@N@¶a@Ší؉Üa@ójä@tbäýa2@@Z3@@N@@
@À@ bjuíà@çbØ@‹rƒnÜa@ @‡š@lcˆ8@NE@Ëíä@æî@Þîa‡ïmíÑÑÜa@‡šì@μjÜíbÙÜa@‡›Ü@óínà@ójåiì@óïÜbÈ@ ójåi@ójuí¾a@pýb¨aIgG@@ì IgM@óáïÕi@óib›Üa@pýb¨bi@óäŠbÕà@òjØ@óïáèa@â@oäbØP0.001@N@ñ‰Üa@‡jÜíÑíÑÜa@‡š@óáïÕÜ@óïáèa@ñc@‡uíî@ý@báåïiçbØ@óib›Üa@óÈíáa@æÈ@@׋Ð@†íuì@ã‡ÉÜ@óÝïÝÔ@óáïÕi@bjuíàN@@
@óáïÕiì@pýb¨a@ë‰è@Þrà@À@óïáèa@êÜ@çbØ@ð@ßbÉÑÜa@μmìÜa@ËbÑmŠaIP0.05@H@aˆì@pýb¨a@ë‰è@ÞØ@À@bjuíà@x솾a@ñ†@@˜zÐ@çbØì@óáïÕi@óïáèaP0.001)NH@@
ó–þ©aZ@‡jÜíÑíÑÜa@‡š@óáïÕÜ@ðÜbÉÜaì@Âín¾a@ËbÑmŠýa@@À@ñ‹r‚@ãbá—äa@æÈ@ó¤båÜa@óïÌbà‡Üa@ónÙÜa@ßí—y@À@òjØ@óïáèa@êÜ@çbØ@æà@ÞÔa@âèŠbáÈa@oäbØ@æî‰Üa@™bƒ’ýa45@óåN@@
@@
18
Protective role of some antioxidants on sperm abnormalities …..
PROTECTIVE ROLE OF SOME ANTIOXIDANTS ON SPERM ABNORMALITIES CAUSED BY NICOTINE IN ALBINO MICE MUS MUSCULUS
NADHUM J. ISMAIEL
GALAWEZH O.OTHMAN Submitted 18 Jun 2012; accepted 3 Sep 2012 ABSTRACT To study the preventive effect of both vitamin C (Ascorbic acid) and vitamin E (a- tocopherol) on the sperm abnormalities in laboratory albino mice Mus musculus nicotine was administrated using three concentrations (10,20 and 30 µg/ mouse) through four doses daily (from 7:00 am to 7:00 pm) and for three different periods (15,30 and 45 days) while vitamin C & E were administrated half hour before and after nicotine administration with dose (100 µg/ mouse & 0.6 I.U/mouse) respectively. The following results were observed: 1-Ability of nicotine to increase all types of qualitative sperm abnormalities in male mice significantly at (P≤ 0.01). 2- Vitamin (C) showed a strong antagonized affect against nicotine, while vitamin (E) did not show a
significant effect. Duhok Med J 2012; 6 Suppl 3:18-26.
Key words: Nicotine effect, sperm abnormalities, and antioxidant.
moking have a cytotoxic effect on spermatozoa by reducing their
number and decreasing their ability to function 1 or it could lead to cytogenetic abnormalities or mutation in spermatozoa that inherited to off -spring, potentially resulting in adverse reproductive and developmental out come such as spontaneous abortion 2. Many studies have been revealed the protective effects of antioxidant vitamins on the risk of anomalies caused by the damage of free radicals resulted from smoking 3. Antioxidants reduce teratogenicity and sexual abnormality of germ cells also that caused by chemical and environmental factors 4. The aim of the present study is to study the effect of nicotine on sperm and the antagonistic effect of antioxidant with vitamin on sperm abnormalities if happened. METHODS
One hundred sixty five mature males
mice weighing between (29-32 gm) were obtained from animal house of college of education- Salahaddin University- Erbil-Iraq. Hundred thirty five mice were treated with different concentration of nicotine (10,20 and 30 ug/ mouse) for three different periods(15,30 and 45 days) nicotine administrated four times daily from (7:00 am to 7:00 pm). Forty five mice treated with (100ug/ mouse) of vitamin C half hours before and after administration of nicotine while other forty five mice were treated with (0.6 I.U./mouse) vitamin E also half hours before and after administration the 15 other mice were administrated only (0.2ml) olive oil which considered as a control for (vitamin E and nicotine), the last 15 mice were maintained under normal condition with normal diet and drinking water which represent the control group for both (nicotine and nicotine with vitamin C) treatment. Karanaweska(1976) method was used with slight modification to prepare sperm from epididymus and vas deferent. For
* Dean college of science ,University of Salahadin-Erbil- Kurdistan Region- Iraq. ** College of Education- scientific Dept. University of Salahadin-Erbil- Kurdistan Region- Iraq. Correspondence author: Galawezh O.Othman.Email: [email protected].
S
19
Duhok Medical Journal Volume 6, Supplement 3, 2012
statistical analysis of data the factorial experiment was used. RESULTS
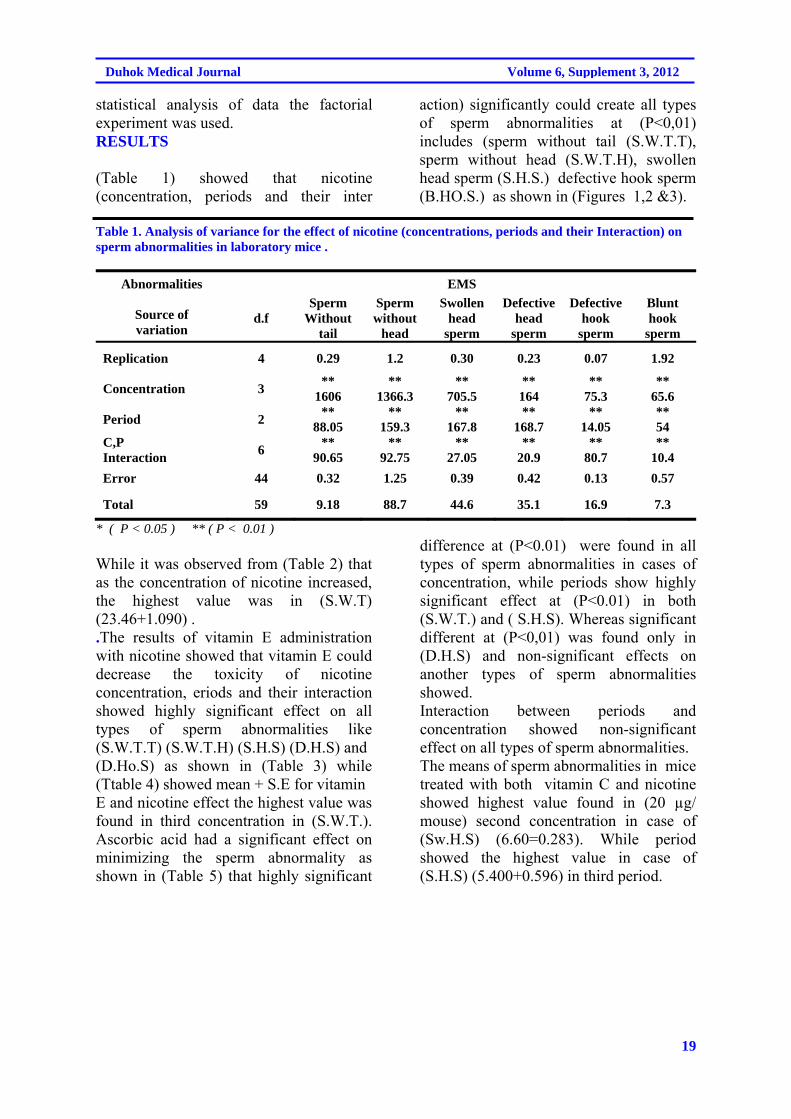
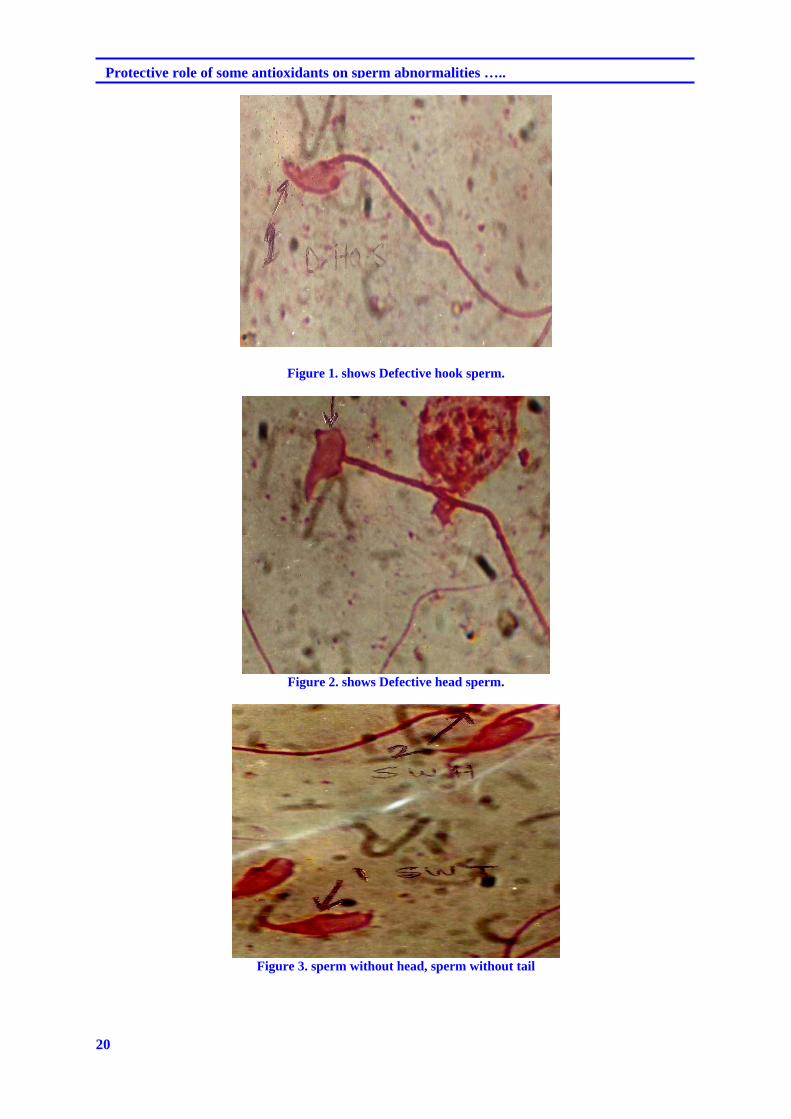
(Table 1) showed that nicotine (concentration, periods and their inter
action) significantly could create all types of sperm abnormalities at (P<0,01) includes (sperm without tail (S.W.T.T), sperm without head (S.W.T.H), swollen head sperm (S.H.S.) defective hook sperm (B.HO.S.) as shown in (Figures 1,2 &3).
Table 1. Analysis of variance for the effect of nicotine (concentrations, periods and their Interaction) on sperm abnormalities in laboratory mice .
Abnormalities
Source of variation
EMS
d.f Sperm
Without tail
Sperm without
head
Swollen head
sperm
Defective head
sperm
Defective hook
sperm
Blunt hook
sperm
Replication 4 0.29 1.2 0.30 0.23 0.07 1.92
Concentration 3 **
1606 **
1366.3 **
705.5 ** 164
** 75.3
** 65.6
Period 2 **
88.05 **
159.3 **
167.8 **
168.7 **
14.05 ** 54
C,P Interaction
6 **
90.65 **
92.75 **
27.05 **
20.9 **
80.7 **
10.4
Error 44 0.32 1.25 0.39 0.42 0.13 0.57
Total 59 9.18 88.7 44.6 35.1 16.9 7.3
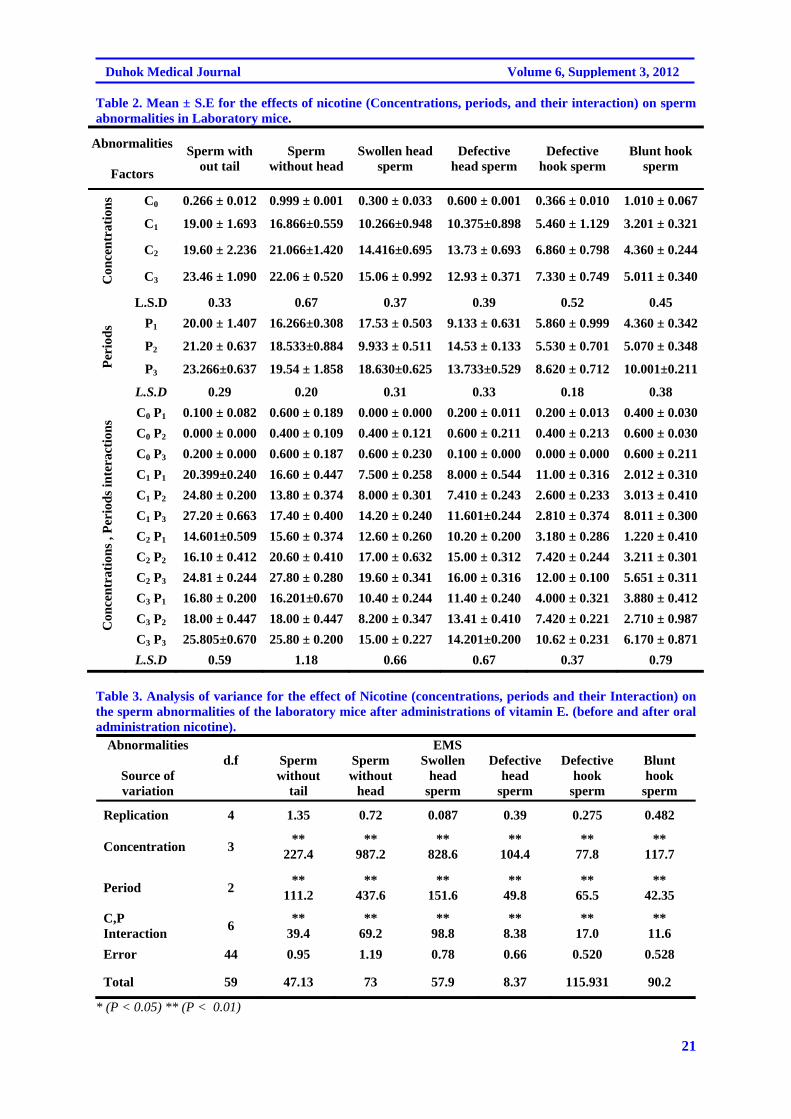
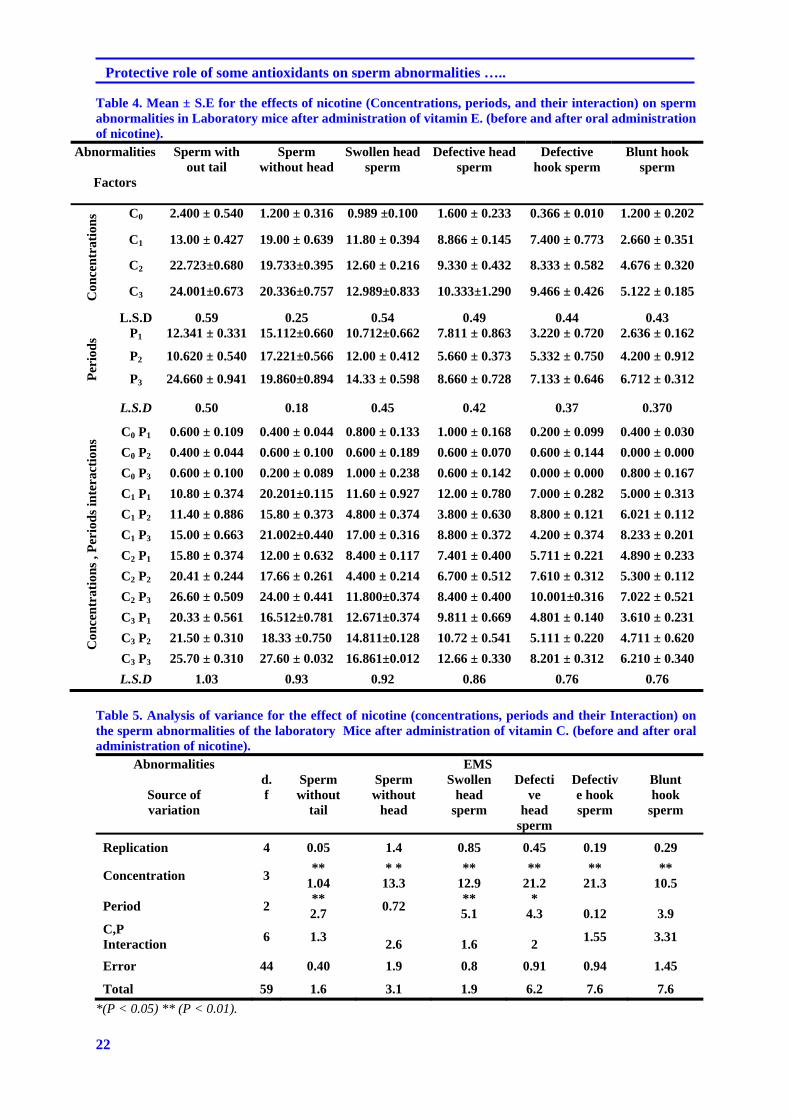
* ( P < 0.05 ) ** ( P < 0.01 ) While it was observed from (Table 2) that as the concentration of nicotine increased, the highest value was in (S.W.T) (23.46+1.090) . .The results of vitamin E administration with nicotine showed that vitamin E could decrease the toxicity of nicotine concentration, eriods and their interaction showed highly significant effect on all types of sperm abnormalities like (S.W.T.T) (S.W.T.H) (S.H.S) (D.H.S) and (D.Ho.S) as shown in (Table 3) while (Ttable 4) showed mean + S.E for vitamin E and nicotine effect the highest value was found in third concentration in (S.W.T.). Ascorbic acid had a significant effect on minimizing the sperm abnormality as shown in (Table 5) that highly significant
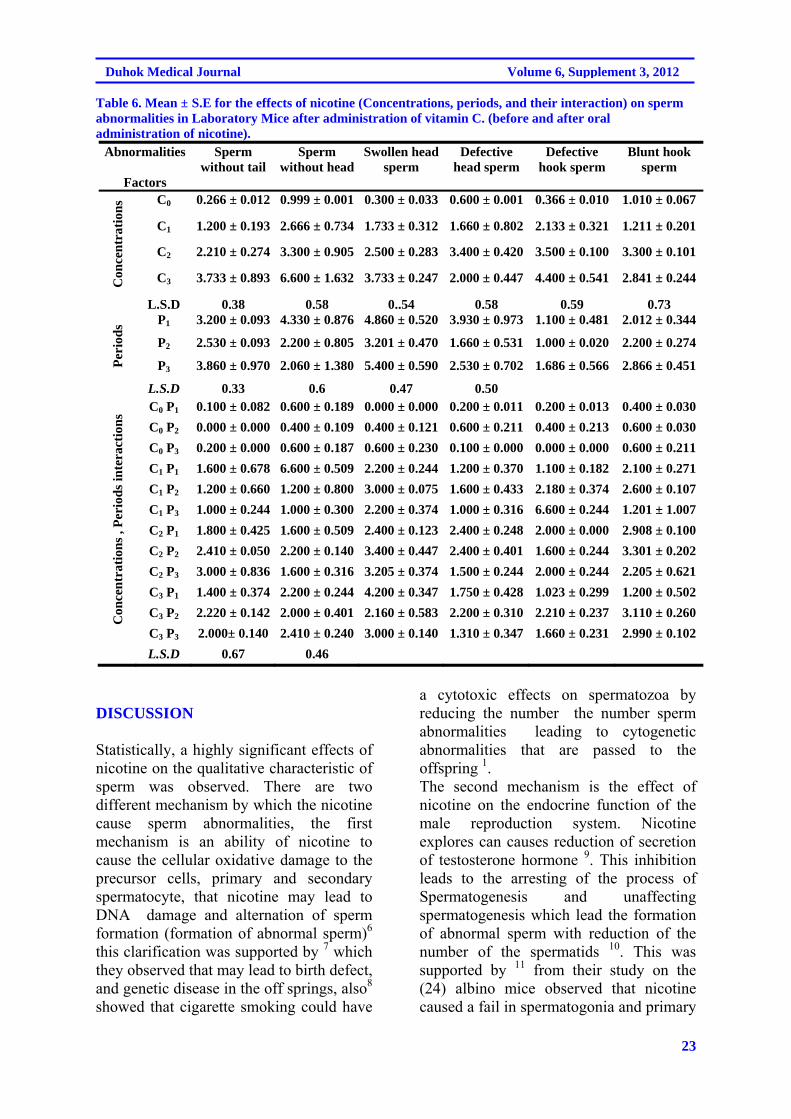
difference at (P<0.01) were found in all types of sperm abnormalities in cases of concentration, while periods show highly significant effect at (P<0.01) in both (S.W.T.) and ( S.H.S). Whereas significant different at (P<0,01) was found only in (D.H.S) and non-significant effects on another types of sperm abnormalities showed. Interaction between periods and concentration showed non-significant effect on all types of sperm abnormalities. The means of sperm abnormalities in mice treated with both vitamin C and nicotine showed highest value found in (20 µg/ mouse) second concentration in case of (Sw.H.S) (6.60=0.283). While period showed the highest value in case of (S.H.S) (5.400+0.596) in third period.
20
Protective role of some antioxidants on sperm abnormalities …..
Figure 1. shows Defective hook sperm.
Figure 2. shows Defective head sperm.
Figure 3. sperm without head, sperm without tail
21
Duhok Medical Journal Volume 6, Supplement 3, 2012
Table 2. Mean ± S.E for the effects of nicotine (Concentrations, periods, and their interaction) on sperm abnormalities in Laboratory mice.
Abnormalities
Factors
Sperm with out tail
Sperm without head
Swollen head sperm
Defective head sperm
Defective hook sperm
Blunt hook sperm
Con
cen
trat
ion
s C0 0.266 ± 0.012 0.999 ± 0.001 0.300 ± 0.033 0.600 ± 0.001 0.366 ± 0.010 1.010 ± 0.067
C1 19.00 ± 1.693 16.866±0.559 10.266±0.948 10.375±0.898 5.460 ± 1.129 3.201 ± 0.321
C2 19.60 ± 2.236 21.066±1.420 14.416±0.695 13.73 ± 0.693 6.860 ± 0.798 4.360 ± 0.244
C3 23.46 ± 1.090 22.06 ± 0.520 15.06 ± 0.992 12.93 ± 0.371 7.330 ± 0.749 5.011 ± 0.340
L.S.D 0.33 0.67 0.37 0.39 0.52 0.45
Per
iod
s P1 20.00 ± 1.407 16.266±0.308 17.53 ± 0.503 9.133 ± 0.631 5.860 ± 0.999 4.360 ± 0.342
P2 21.20 ± 0.637 18.533±0.884 9.933 ± 0.511 14.53 ± 0.133 5.530 ± 0.701 5.070 ± 0.348
P3 23.266±0.637 19.54 ± 1.858 18.630±0.625 13.733±0.529 8.620 ± 0.712 10.001±0.211
L.S.D 0.29 0.20 0.31 0.33 0.18 0.38
Con
cen
trat
ion
s , P
erio
ds
inte
ract
ion
s
C0 P1 0.100 ± 0.082 0.600 ± 0.189 0.000 ± 0.000 0.200 ± 0.011 0.200 ± 0.013 0.400 ± 0.030
C0 P2 0.000 ± 0.000 0.400 ± 0.109 0.400 ± 0.121 0.600 ± 0.211 0.400 ± 0.213 0.600 ± 0.030
C0 P3 0.200 ± 0.000 0.600 ± 0.187 0.600 ± 0.230 0.100 ± 0.000 0.000 ± 0.000 0.600 ± 0.211
C1 P1 20.399±0.240 16.60 ± 0.447 7.500 ± 0.258 8.000 ± 0.544 11.00 ± 0.316 2.012 ± 0.310
C1 P2 24.80 ± 0.200 13.80 ± 0.374 8.000 ± 0.301 7.410 ± 0.243 2.600 ± 0.233 3.013 ± 0.410
C1 P3 27.20 ± 0.663 17.40 ± 0.400 14.20 ± 0.240 11.601±0.244 2.810 ± 0.374 8.011 ± 0.300
C2 P1 14.601±0.509 15.60 ± 0.374 12.60 ± 0.260 10.20 ± 0.200 3.180 ± 0.286 1.220 ± 0.410
C2 P2 16.10 ± 0.412 20.60 ± 0.410 17.00 ± 0.632 15.00 ± 0.312 7.420 ± 0.244 3.211 ± 0.301
C2 P3 24.81 ± 0.244 27.80 ± 0.280 19.60 ± 0.341 16.00 ± 0.316 12.00 ± 0.100 5.651 ± 0.311
C3 P1 16.80 ± 0.200 16.201±0.670 10.40 ± 0.244 11.40 ± 0.240 4.000 ± 0.321 3.880 ± 0.412
C3 P2 18.00 ± 0.447 18.00 ± 0.447 8.200 ± 0.347 13.41 ± 0.410 7.420 ± 0.221 2.710 ± 0.987
C3 P3 25.805±0.670 25.80 ± 0.200 15.00 ± 0.227 14.201±0.200 10.62 ± 0.231 6.170 ± 0.871 L.S.D 0.59 1.18 0.66 0.67 0.37 0.79
Table 3. Analysis of variance for the effect of Nicotine (concentrations, periods and their Interaction) on the sperm abnormalities of the laboratory mice after administrations of vitamin E. (before and after oral administration nicotine).
Abnormalities
Source of variation
EMS d.f Sperm
without tail
Sperm without
head
Swollen head
sperm
Defective head
sperm
Defective hook
sperm
Blunt hook
sperm
Replication 4 1.35 0.72 0.087 0.39 0.275 0.482
Concentration 3 **
227.4 **
987.2 **
828.6 **
104.4 **
77.8 **
117.7
Period 2 **
111.2 **
437.6 **
151.6 **
49.8 **
65.5 **
42.35
C,P Interaction
6 **
39.4 **
69.2 **
98.8 **
8.38 **
17.0 **
11.6
Error 44 0.95 1.19 0.78 0.66 0.520 0.528
Total 59 47.13 73 57.9 8.37 115.931 90.2
* (P < 0.05) ** (P < 0.01)
22
Protective role of some antioxidants on sperm abnormalities …..
Table 4. Mean ± S.E for the effects of nicotine (Concentrations, periods, and their interaction) on sperm abnormalities in Laboratory mice after administration of vitamin E. (before and after oral administration of nicotine).
Abnormalities
Factors
Sperm with out tail
Sperm without head
Swollen head sperm
Defective head sperm
Defective hook sperm
Blunt hook sperm
Con
cen
trat
ion
s C0 2.400 ± 0.540 1.200 ± 0.316 0.989 ±0.100 1.600 ± 0.233 0.366 ± 0.010 1.200 ± 0.202
C1 13.00 ± 0.427 19.00 ± 0.639 11.80 ± 0.394 8.866 ± 0.145 7.400 ± 0.773 2.660 ± 0.351
C2 22.723±0.680 19.733±0.395 12.60 ± 0.216 9.330 ± 0.432 8.333 ± 0.582 4.676 ± 0.320
C3 24.001±0.673 20.336±0.757 12.989±0.833 10.333±1.290 9.466 ± 0.426 5.122 ± 0.185
L.S.D 0.59 0.25 0.54 0.49 0.44 0.43
Per
iod
s P1 12.341 ± 0.331 15.112±0.660 10.712±0.662 7.811 ± 0.863 3.220 ± 0.720 2.636 ± 0.162
P2 10.620 ± 0.540 17.221±0.566 12.00 ± 0.412 5.660 ± 0.373 5.332 ± 0.750 4.200 ± 0.912
P3 24.660 ± 0.941 19.860±0.894 14.33 ± 0.598 8.660 ± 0.728 7.133 ± 0.646 6.712 ± 0.312
L.S.D 0.50 0.18 0.45 0.42 0.37 0.370
Con
cen
trat
ion
s , P
erio
ds
inte
ract
ion
s
C0 P1 0.600 ± 0.109 0.400 ± 0.044 0.800 ± 0.133 1.000 ± 0.168 0.200 ± 0.099 0.400 ± 0.030
C0 P2 0.400 ± 0.044 0.600 ± 0.100 0.600 ± 0.189 0.600 ± 0.070 0.600 ± 0.144 0.000 ± 0.000
C0 P3 0.600 ± 0.100 0.200 ± 0.089 1.000 ± 0.238 0.600 ± 0.142 0.000 ± 0.000 0.800 ± 0.167
C1 P1 10.80 ± 0.374 20.201±0.115 11.60 ± 0.927 12.00 ± 0.780 7.000 ± 0.282 5.000 ± 0.313
C1 P2 11.40 ± 0.886 15.80 ± 0.373 4.800 ± 0.374 3.800 ± 0.630 8.800 ± 0.121 6.021 ± 0.112
C1 P3 15.00 ± 0.663 21.002±0.440 17.00 ± 0.316 8.800 ± 0.372 4.200 ± 0.374 8.233 ± 0.201
C2 P1 15.80 ± 0.374 12.00 ± 0.632 8.400 ± 0.117 7.401 ± 0.400 5.711 ± 0.221 4.890 ± 0.233
C2 P2 20.41 ± 0.244 17.66 ± 0.261 4.400 ± 0.214 6.700 ± 0.512 7.610 ± 0.312 5.300 ± 0.112
C2 P3 26.60 ± 0.509 24.00 ± 0.441 11.800±0.374 8.400 ± 0.400 10.001±0.316 7.022 ± 0.521
C3 P1 20.33 ± 0.561 16.512±0.781 12.671±0.374 9.811 ± 0.669 4.801 ± 0.140 3.610 ± 0.231
C3 P2 21.50 ± 0.310 18.33 ±0.750 14.811±0.128 10.72 ± 0.541 5.111 ± 0.220 4.711 ± 0.620
C3 P3 25.70 ± 0.310 27.60 ± 0.032 16.861±0.012 12.66 ± 0.330 8.201 ± 0.312 6.210 ± 0.340 L.S.D 1.03 0.93 0.92 0.86 0.76 0.76
Table 5. Analysis of variance for the effect of nicotine (concentrations, periods and their Interaction) on the sperm abnormalities of the laboratory Mice after administration of vitamin C. (before and after oral administration of nicotine).
Abnormalities
Source of variation
EMS d.f
Sperm without
tail
Sperm without
head
Swollen head
sperm
Defective
head sperm
Defective hook sperm
Blunt hook
sperm
Replication 4 0.05 1.4 0.85 0.45 0.19 0.29
Concentration 3 **
1.04 * *
13.3 **
12.9 **
21.2 **
21.3 **
10.5
Period 2 ** 2.7
0.72 ** 5.1
* 4.3
0.12
3.9
C,P Interaction
6 1.3
2.6
1.6
2 1.55 3.31
Error 44 0.40 1.9 0.8 0.91 0.94 1.45
Total 59 1.6 3.1 1.9 6.2 7.6 7.6
*(P < 0.05) ** (P < 0.01).
23
Duhok Medical Journal Volume 6, Supplement 3, 2012
Table 6. Mean ± S.E for the effects of nicotine (Concentrations, periods, and their interaction) on sperm abnormalities in Laboratory Mice after administration of vitamin C. (before and after oral administration of nicotine).
Abnormalities
Factors
Sperm without tail
Sperm without head
Swollen head sperm
Defective head sperm
Defective hook sperm
Blunt hook sperm
Con
cen
trat
ion
s C0 0.266 ± 0.012 0.999 ± 0.001 0.300 ± 0.033 0.600 ± 0.001 0.366 ± 0.010 1.010 ± 0.067
C1 1.200 ± 0.193 2.666 ± 0.734 1.733 ± 0.312 1.660 ± 0.802 2.133 ± 0.321 1.211 ± 0.201
C2 2.210 ± 0.274 3.300 ± 0.905 2.500 ± 0.283 3.400 ± 0.420 3.500 ± 0.100 3.300 ± 0.101
C3 3.733 ± 0.893 6.600 ± 1.632 3.733 ± 0.247 2.000 ± 0.447 4.400 ± 0.541 2.841 ± 0.244
L.S.D 0.38 0.58 0..54 0.58 0.59 0.73
Per
iod
s P1 3.200 ± 0.093 4.330 ± 0.876 4.860 ± 0.520 3.930 ± 0.973 1.100 ± 0.481 2.012 ± 0.344
P2 2.530 ± 0.093 2.200 ± 0.805 3.201 ± 0.470 1.660 ± 0.531 1.000 ± 0.020 2.200 ± 0.274
P3 3.860 ± 0.970 2.060 ± 1.380 5.400 ± 0.590 2.530 ± 0.702 1.686 ± 0.566 2.866 ± 0.451
L.S.D 0.33 0.6 0.47 0.50
Con
cen
trat
ion
s , P
erio
ds
inte
ract
ion
s
C0 P1 0.100 ± 0.082 0.600 ± 0.189 0.000 ± 0.000 0.200 ± 0.011 0.200 ± 0.013 0.400 ± 0.030
C0 P2 0.000 ± 0.000 0.400 ± 0.109 0.400 ± 0.121 0.600 ± 0.211 0.400 ± 0.213 0.600 ± 0.030
C0 P3 0.200 ± 0.000 0.600 ± 0.187 0.600 ± 0.230 0.100 ± 0.000 0.000 ± 0.000 0.600 ± 0.211
C1 P1 1.600 ± 0.678 6.600 ± 0.509 2.200 ± 0.244 1.200 ± 0.370 1.100 ± 0.182 2.100 ± 0.271
C1 P2 1.200 ± 0.660 1.200 ± 0.800 3.000 ± 0.075 1.600 ± 0.433 2.180 ± 0.374 2.600 ± 0.107
C1 P3 1.000 ± 0.244 1.000 ± 0.300 2.200 ± 0.374 1.000 ± 0.316 6.600 ± 0.244 1.201 ± 1.007
C2 P1 1.800 ± 0.425 1.600 ± 0.509 2.400 ± 0.123 2.400 ± 0.248 2.000 ± 0.000 2.908 ± 0.100
C2 P2 2.410 ± 0.050 2.200 ± 0.140 3.400 ± 0.447 2.400 ± 0.401 1.600 ± 0.244 3.301 ± 0.202
C2 P3 3.000 ± 0.836 1.600 ± 0.316 3.205 ± 0.374 1.500 ± 0.244 2.000 ± 0.244 2.205 ± 0.621
C3 P1 1.400 ± 0.374 2.200 ± 0.244 4.200 ± 0.347 1.750 ± 0.428 1.023 ± 0.299 1.200 ± 0.502
C3 P2 2.220 ± 0.142 2.000 ± 0.401 2.160 ± 0.583 2.200 ± 0.310 2.210 ± 0.237 3.110 ± 0.260
C3 P3 2.000± 0.140 2.410 ± 0.240 3.000 ± 0.140 1.310 ± 0.347 1.660 ± 0.231 2.990 ± 0.102 L.S.D 0.67 0.46
DISCUSSION
Statistically, a highly significant effects of nicotine on the qualitative characteristic of sperm was observed. There are two different mechanism by which the nicotine cause sperm abnormalities, the first mechanism is an ability of nicotine to cause the cellular oxidative damage to the precursor cells, primary and secondary spermatocyte, that nicotine may lead to DNA damage and alternation of sperm formation (formation of abnormal sperm)6 this clarification was supported by 7 which they observed that may lead to birth defect, and genetic disease in the off springs, also8 showed that cigarette smoking could have
a cytotoxic effects on spermatozoa by reducing the number the number sperm abnormalities leading to cytogenetic abnormalities that are passed to the offspring 1. The second mechanism is the effect of nicotine on the endocrine function of the male reproduction system. Nicotine explores can causes reduction of secretion of testosterone hormone 9. This inhibition leads to the arresting of the process of Spermatogenesis and unaffecting spermatogenesis which lead the formation of abnormal sperm with reduction of the number of the spermatids 10. This was supported by 11 from their study on the (24) albino mice observed that nicotine caused a fail in spermatogonia and primary
24
Protective role of some antioxidants on sperm abnormalities …..
spermatocytes number in the treated animals together with increase of spermatocytes, spermatid development process, they also observed that sertoli cells seems to be not affected by Nicotine administration in the doses equivalent to 10,20 except on day (14) of third dose equivalent to 30 cigarettes treatment. It seem likely that vitamins causes alterations in testicular DNA that disrupts the process of differentiation of sperm during spermatogenesis resulting in induced sperm abnormalities 12, described sperm abnormalities as a consequences of chromosomal aberrations and late change in the genes responsible for spermatogenesis. While results of nicotine with vitamin C showed that this water soluble vitamin have ability to cause significantly reduction in the qualitative sperm abnormalities created by nicotine toxicity, these results were supported by 13 who administrates vitamin C with nicotine and he cocluded that teratogenic effect of nicotine was reduced by ascorbic acid and he returned the preventative effect of vitamin to its ability to alter the metabolic pathway of nicotine which lead to reduction of its toxicity. The reduction through using β-tocopherol is may be due to its antioxidant effect, which inhibit the genotoxicity of nicotine on the testicular cells 14 and this was supported by 15 a study conducted that vitamin E supplementation can reduce the amount of sperm abnormalities caused by toxic effect of sodium fluoride on the reproductive organ of male mice. REFERENCES
1. Zavos PM, Correa JR,
Karagounis C S, Apharaki, A, Phoroglon C, Hicks GI. An election microscope study of the exonemal ultra structure in human spermatozoa from male smokers an non-smokers. Fert And Ster.1998; 69(3): 430-4.
2. Ostermeir GC. Spermatogenesis and the effects of smoking. Gamete and embryo biology, An. Sci, Dairy Sci, and AHABS;1998.p. 875.
3. Esland Stephenic, (1997). Antioxidant. Honors Biology resea. www.Bublic.iastate.edu.com.
4. Güven MC, Can B, Ergün A, Saran Y, Aydos K. Ultra Structural effect of cigarette smoke on rat testis. Eur Urol. 1999;36(6):645-9.
5. Fraga CG, Matehnik PA, Myrobek AJ, Remped. O M, Ames B N. Smoking and low antioxidant levels increase oxidative damages to sperm DNA. Mutat. Res.1996; 351(2): 199-203.
6. London Kar R.L, Srinivasreddy P, Somanathreddy P, Patil SB. Nicotine induced inhibition of the activities accessory reproductive ducts in male rats. J Ethno phorma. 1998;60:215-221.
7. Steinberger E, Ficher M, Smith K D. Relations of in vitro metabolism of steroids in human testicular tissue to histological and clinical finding. In human testis. E. Rosemberg and C. PAULSEN (Eds.) New York: Plenum;1970.p. 439.
8. Biswas NM, Patra PB. Role of Testosterone propionate in spermatogenesis following chronic nicotine administration in immature rats. Indian J Exp Biol. 1981; 19 (7): 604-6.
9. Al-Wachi SN, Muhanad FA, Faiza A, Mahmod ,Zuheir RZ. Possible togeesis and testicular activity of the mature male albino mice. J Biol Sci Res.1986; 17(3): 185-95.
10. Kumar KB, Kuttan B. Chemoprotective activity of an extract of Phyllanthus amarus against cyclophosphamide induced toxicity in mice. Phytomedicine. 200; l2, 494-500
25
Duhok Medical Journal Volume 6, Supplement 3, 2012
11. Bruce WR, Furrer R, Wyrobe AJ. Abnormalities in the shape of murine sperm after acute testicular x- Irradeation. Mutat Res.1974; 23: 381-6.
12. Ames. Effect of vitamin C in smokers fertility, Effect of smoking on vitamin (C) content in the body. Nutrition Health Review Issue.1992; 62:4.
13. Palan PR, Mikhail MS, Basu J, Romney SL. Plasma levels of antioxidants beta-carotene and alpha tocopherol in uterine
cerridyplasia and cancer.Nutr Cancer.1991;15(1): 13-20.
14. Chinoy NJ, Artix. Amelioration of fluoride toxicity by vitamin (E) and (D) in reproductive functions of male mice. Flouride J.1998; 31(4): 203-6.
15. Karanowska L. Chromosomal mutation cited by R.Sahia Advances in cytogenetics and their application in Livestock improvement and production, NDRIK. Kamal Indid.1978; 35: 166.
26
Protective role of some antioxidants on sperm abnormalities …..
ón‚íq@@@çbØóäbØŽí÷@òˆ†@óÜ@ÚŽî‡äóè@õòìó䆋Ø@ôÔbmì@μmŽíÙïä@ôäa†Œbi@õŠóîŠbØ@óÜIçbØóåïàbnïÄ@H@ôîóïÔbm@ôr@ôÙ“à@õò‹Žïä@ŠóóÜ@pbØò†
Mus musculus @õŠüuóÜBalb/c @L @@@@@
ŽíÙïä@ôäa†Œbi@õŠóîŠbØ@óÜ@‘bi@óîòìóåîím@ãó÷@@@@@@çbØóäbØŽí÷@òˆ†@óÜ@ÚŽî‡äóè@õòìó䆋Ø@ôÔbmì@μmI@çbØóåïàbnïÄ@H@@pbØò†@@@@ôîóïÔbm@ôr@ôÙ“à@õò‹Žïä@ŠóóÜMus musculus @@õŠüuóÜBalb/c @@@@@u@ônó‚@Žô@ôäbåŽïè@ŠbØói@ói@L@@@μmüÙïä@õŒaìbï
I10،20@òì30@âÙà@H@‹Žïà‰mbØ@óÜ@a‡ÙŽîˆûŠ@óÜ@‹i@Šaíš@ói@aŠ†@óäbïnó‚@ãó÷@òìI7H@bm@ôäbîói@õ@‹Žïà‰mbØ@íØòìI7H@@@@Žô@üi@òìòŠaíŽï÷@õŒaìbïu@õòìbà@I15،30òì45H@ˆûŠ@N@çbØóåïàbnïÄ@ãýóiI@~E@òìC@Hó‚@ói@[email protected]@@@@òì@ðÜìò†@ñóØóî100@@âÙà@H@@@ñaì†@ói@Ûóî
@Ûóî@N@@@õòìbà@Žíi@ìíi@ãaìò†Šói@óîòìó䆋Ø@ôÔbm@ãó÷@òì@L@μmüÙïä@ôäa‡Žïq@ô’bqì@”Žïq@pbÈó@íïä@aŠ†@ôŽïqI15،30òì45@@H@òì@L@ˆìŠça‹Ø@õŠbî†@òìòŠaí‚@õóäbàó÷.@@Z@@
1H @õìüm@Ûòìóîóè@a†ìüm@óÜ@õìaìómbä@ô䆋Ø@†bîŒ@õbäaím@μmüÙïä@I@@@@Lìí›ÙŽïm@lýíÔ@Lìí›ÙŽïm@Šó@LìbìbøÜóè@Šó@LŠóŽõi@LÚÝÙŽõiòìbàóš@lýíÔNH@IP@≥@0.01NH
2H @@μàbnïÄC@ôäa†Œbi@õŠóîŠbØŠóóÜ@ìíióè@õŽïèójõóäaìó›Žïq@ôØóîŠóîŠbØ@@@õŒ†@μàbnïÄL@ãłói@μmüÙïäE@@@@ói@aì@ôØóîŠóîŠbØìíióä@õŽïèN@@
ó–þ©a@ @@ò‡Øÿa@pa†b›à@Éi@qdm@Šbjn‚a@ì@μmíÙïåÝÜ@óîÑnÜa@@paqdnÜa@I@pbåïàbnïÑÜa@H@êînƒ¾aöb›ïjÜa@ça‹øÑÜa@Ší؈@ÀMus
musculus @@l‹š@æàBALB/C@@@ò‡Øÿa@pa†b›à@Éi@qdm@Šbjn‚a@ì@μmíÙïåÝÜ@óîÑnÜa@@paqdnÜa@æÈ@óïÜb¨a@óaŠ‡Üa@szjm@I@pbåïàbnïÑÜa@H@@@ça‹øÑÜa@Ší؈@À
@êînƒ¾aöb›ïjÜaMus musculus @@l‹š@æàBALB/C@N@@@æà@óÑÝn¬@ïØa‹m@óqþq@ãa‡ƒnbiì@@@@μmíÙïåÜaI10@L20ì30@@âÍÙà@@HìØaÜa@ë‰è@oïÈcï@óÉiŠdi@@@@@óÑÝn¬@paÑÜì@aöbà@óÉibÜa@ônyì@bybj–@óÉibÜa@óÈbÜa@æà@ćöa‡nia@ãíïÜa@À@pbÈ‹uI15@@L30@@ì45@@H
@báåïi@Lbïàíîc@pbåïàbnïÑÜa@oïÈIA , E @ìC @@HïØai@I200ìN†N~0,6ìN†@Nì100âÍÙàH@@@@öbÈa@‡Éi@ì@ÞjÔ@óÈb@Ò—ä@ðÜaínÜa@ôÝÈò‡¾@ói‹vnÜa@p‹ána@‡ÔìL@μmíÙïåÜaI15،30@@ì45@@Hbàíî@N
ðÝî@bà@xbnåna@ìZ@@1M @@@@i@óÝrán¾a@ì@óînƒ¾a@ça‹øÑÜa@æàbïy@À@pbèí“nÜa@ta‡yg@ôÝÈ@μmíÙïåÜa@óïÝibÔI@@@@Þî‰Üa@‡ÔbÐ@æáïysperm without
tail@‘c‹Üa@‡ÔbÐ@æáïy@Lsperm without head@@@‘c‹Üa@„Ñnåà@æáïy@LSwollen head sperm @@@@â«@æáïy@L@‘c‹ÜaDefective head sperm lþØ@â«@æáïy@LDefective hook sperm @@@lþØ@Ó‹zåà@æáïy@ìBlunt
hook spermNH@IP@≥@0.01NH
2M @μàbnïÐ@çbi@‡uìIC@H@ê܆b›à@qdm@paqdnÜa@ôÝÈ@@óîÑnÜaμmíÙïåÝÜ,@@μàbnïÐ@bàcIE@H@âÝÐêÜ@æÙî@@qdmõíÔN@@@@
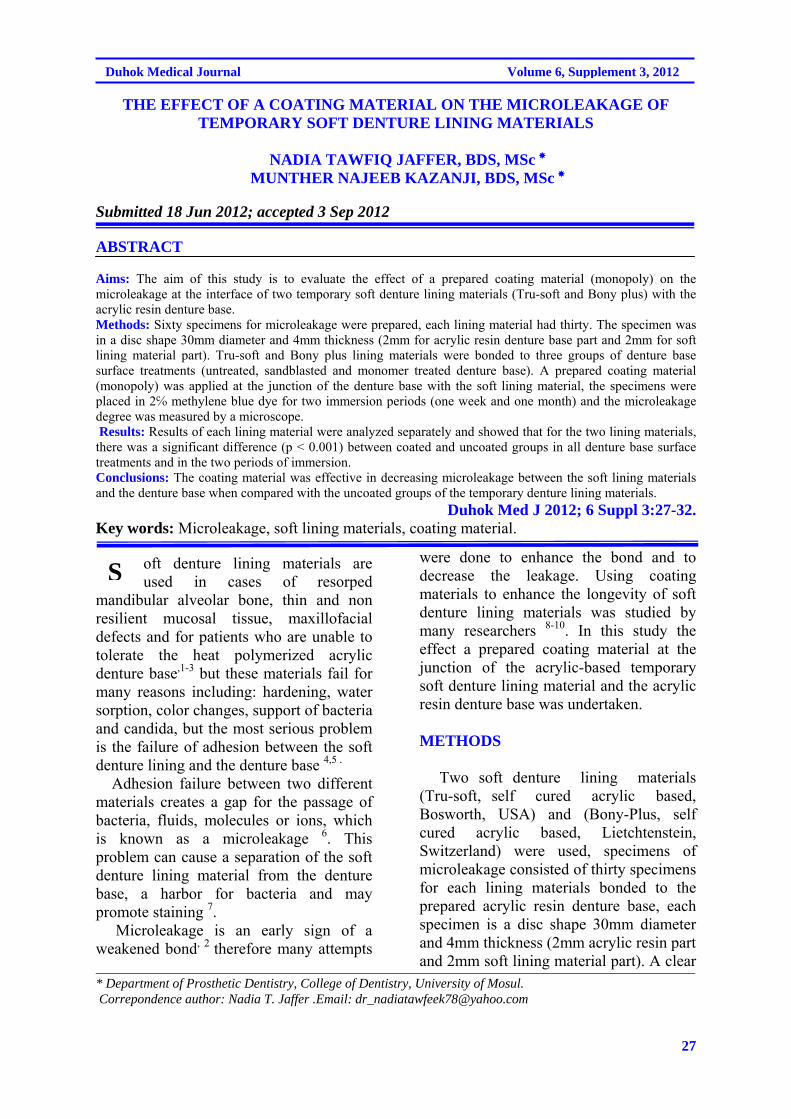
27
Duhok Medical Journal Volume 6, Supplement 3, 2012
THE EFFECT OF A COATING MATERIAL ON THE MICROLEAKAGE OF TEMPORARY SOFT DENTURE LINING MATERIALS
NADIA TAWFIQ JAFFER, BDS, MSc
MUNTHER NAJEEB KAZANJI, BDS, MSc Submitted 18 Jun 2012; accepted 3 Sep 2012 ABSTRACT Aims: The aim of this study is to evaluate the effect of a prepared coating material (monopoly) on the microleakage at the interface of two temporary soft denture lining materials (Tru-soft and Bony plus) with the acrylic resin denture base. Methods: Sixty specimens for microleakage were prepared, each lining material had thirty. The specimen was in a disc shape 30mm diameter and 4mm thickness (2mm for acrylic resin denture base part and 2mm for soft lining material part). Tru-soft and Bony plus lining materials were bonded to three groups of denture base surface treatments (untreated, sandblasted and monomer treated denture base). A prepared coating material (monopoly) was applied at the junction of the denture base with the soft lining material, the specimens were placed in 2 methylene blue dye for two immersion periods (one week and one month) and the microleakage degree was measured by a microscope. Results: Results of each lining material were analyzed separately and showed that for the two lining materials, there was a significant difference (p < 0.001) between coated and uncoated groups in all denture base surface treatments and in the two periods of immersion. Conclusions: The coating material was effective in decreasing microleakage between the soft lining materials and the denture base when compared with the uncoated groups of the temporary denture lining materials.
Duhok Med J 2012; 6 Suppl 3:27-32. Key words: Microleakage, soft lining materials, coating material.
oft denture lining materials are used in cases of resorped
mandibular alveolar bone, thin and non resilient mucosal tissue, maxillofacial defects and for patients who are unable to tolerate the heat polymerized acrylic denture base,1-3 but these materials fail for many reasons including: hardening, water sorption, color changes, support of bacteria and candida, but the most serious problem is the failure of adhesion between the soft denture lining and the denture base 4,5 . Adhesion failure between two different materials creates a gap for the passage of bacteria, fluids, molecules or ions, which is known as a microleakage 6. This problem can cause a separation of the soft denture lining material from the denture base, a harbor for bacteria and may promote staining 7. Microleakage is an early sign of a weakened bond, 2 therefore many attempts
were done to enhance the bond and to decrease the leakage. Using coating materials to enhance the longevity of soft denture lining materials was studied by many researchers 8-10. In this study the effect a prepared coating material at the junction of the acrylic-based temporary soft denture lining material and the acrylic resin denture base was undertaken. METHODS
Two soft denture lining materials (Tru-soft, self cured acrylic based, Bosworth, USA) and (Bony-Plus, self cured acrylic based, Lietchtenstein, Switzerland) were used, specimens of microleakage consisted of thirty specimens for each lining materials bonded to the prepared acrylic resin denture base, each specimen is a disc shape 30mm diameter and 4mm thickness (2mm acrylic resin part and 2mm soft lining material part). A clear
* Department of Prosthetic Dentistry, College of Dentistry, University of Mosul. Correpondence author: Nadia T. Jaffer .Email: [email protected]
S
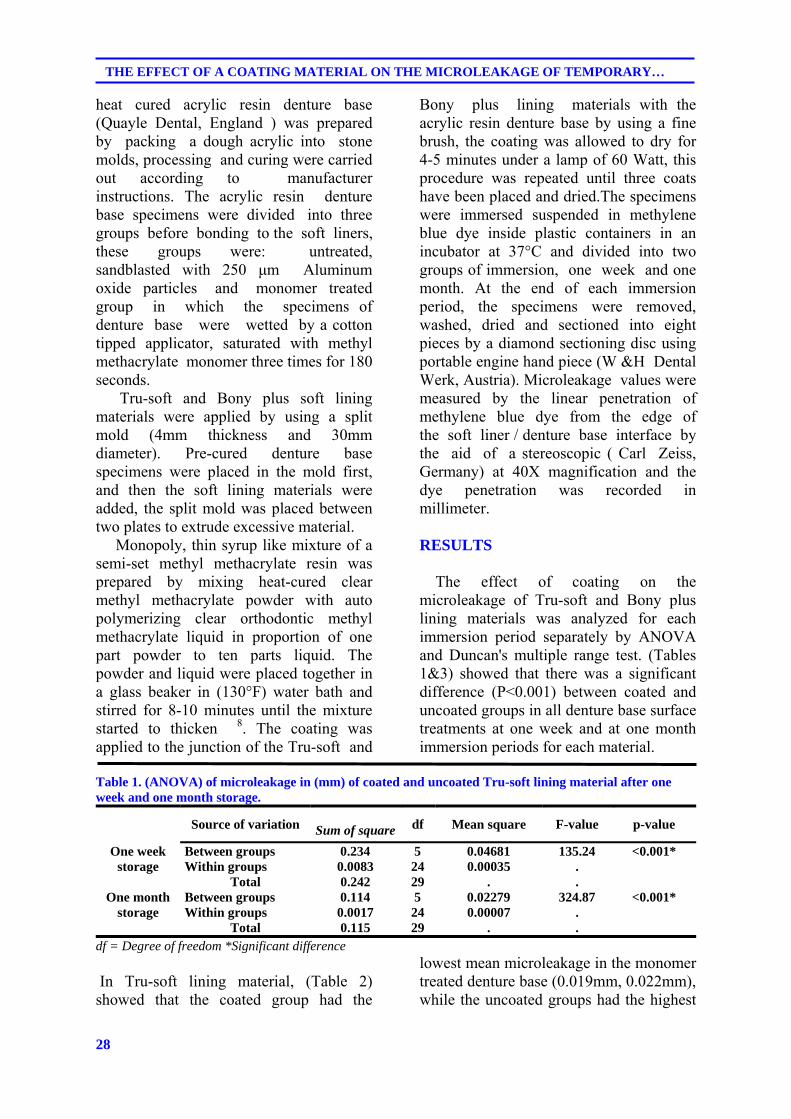
28
THE EFFECT OF A COATING MATERIAL ON THE MICROLEAKAGE OF TEMPORARY…
heat cured acrylic resin denture base (Quayle Dental, England ) was prepared by packing a dough acrylic into stone molds, processing and curing were carried out according to manufacturer instructions. The acrylic resin denture base specimens were divided into three groups before bonding to the soft liners, these groups were: untreated, sandblasted with 250 μm Aluminum oxide particles and monomer treated group in which the specimens of denture base were wetted by a cotton tipped applicator, saturated with methyl methacrylate monomer three times for 180 seconds. Tru-soft and Bony plus soft lining materials were applied by using a split mold (4mm thickness and 30mm diameter). Pre-cured denture base specimens were placed in the mold first, and then the soft lining materials were added, the split mold was placed between two plates to extrude excessive material. Monopoly, thin syrup like mixture of a semi-set methyl methacrylate resin was prepared by mixing heat-cured clear methyl methacrylate powder with auto polymerizing clear orthodontic methyl methacrylate liquid in proportion of one part powder to ten parts liquid. The powder and liquid were placed together in a glass beaker in (130°F) water bath and stirred for 8-10 minutes until the mixture started to thicken 8. The coating was applied to the junction of the Tru-soft and
Bony plus lining materials with the acrylic resin denture base by using a fine brush, the coating was allowed to dry for 4-5 minutes under a lamp of 60 Watt, this procedure was repeated until three coats have been placed and dried.The specimens were immersed suspended in methylene blue dye inside plastic containers in an incubator at 37°C and divided into two groups of immersion, one week and one month. At the end of each immersion period, the specimens were removed, washed, dried and sectioned into eight pieces by a diamond sectioning disc using portable engine hand piece (W &H Dental Werk, Austria). Microleakage values were measured by the linear penetration of methylene blue dye from the edge of the soft liner / denture base interface by the aid of a stereoscopic ( Carl Zeiss, Germany) at 40X magnification and the dye penetration was recorded in millimeter. RESULTS
The effect of coating on the microleakage of Tru-soft and Bony plus lining materials was analyzed for each immersion period separately by ANOVA and Duncan's multiple range test. (Tables 1&3) showed that there was a significant difference (P<0.001) between coated and uncoated groups in all denture base surface treatments at one week and at one month immersion periods for each material.
Table 1. (ANOVA) of microleakage in (mm) of coated and uncoated Tru-soft lining material after one week and one month storage.
Source of variation Sum of square df Mean square F-value p-value
One week storage
Between groups 0.234 5 0.04681 135.24 <0.001* Within groups 0.0083 24 0.00035 .
Total 0.242 29 . . One month
storage Between groups 0.114 5 0.02279 324.87 <0.001* Within groups 0.0017 24 0.00007 .
Total 0.115 29 . . df = Degree of freedom *Significant difference In Tru-soft lining material, (Table 2) showed that the coated group had the
lowest mean microleakage in the monomer treated denture base (0.019mm, 0.022mm), while the uncoated groups had the highest
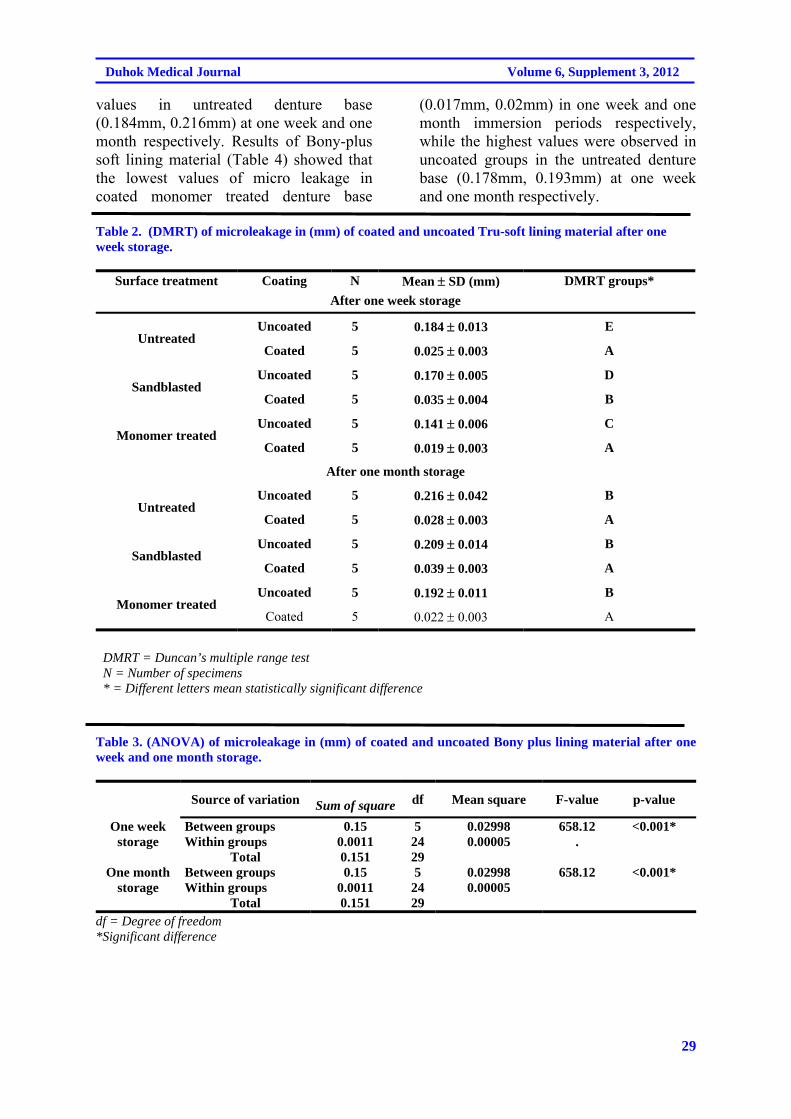
29
Duhok Medical Journal Volume 6, Supplement 3, 2012
values in untreated denture base (0.184mm, 0.216mm) at one week and one month respectively. Results of Bony-plus soft lining material (Table 4) showed that the lowest values of micro leakage in coated monomer treated denture base
(0.017mm, 0.02mm) in one week and one month immersion periods respectively, while the highest values were observed in uncoated groups in the untreated denture base (0.178mm, 0.193mm) at one week and one month respectively.
Table 2. (DMRT) of microleakage in (mm) of coated and uncoated Tru-soft lining material after one week storage.
Surface treatment Coating N Mean SD (mm) DMRT groups*
After one week storage
Untreated Uncoated 5 0.184 0.013 E
Coated 5 0.025 0.003 A
Sandblasted
Uncoated 5 0.170 0.005 D
Coated 5 0.035 0.004 B
Monomer treated Uncoated 5 0.141 0.006 C
Coated 5 0.019 0.003 A
After one month storage
Untreated Uncoated 5 0.216 0.042 B
Coated 5 0.028 0.003 A
Sandblasted
Uncoated 5 0.209 0.014 B
Coated 5 0.039 0.003 A
Monomer treated Uncoated 5 0.192 0.011 B
Coated 5 0.022 0.003 A
DMRT = Duncan’s multiple range test N = Number of specimens
* = Different letters mean statistically significant difference Table 3. (ANOVA) of microleakage in (mm) of coated and uncoated Bony plus lining material after one week and one month storage.
Source of variation Sum of square df Mean square F-value p-value
One week storage
Between groups 0.15 5 0.02998 658.12 <0.001* Within groups 0.0011 24 0.00005 .
Total 0.151 29 One month
storage Between groups 0.15 5 0.02998 658.12 <0.001* Within groups 0.0011 24 0.00005
Total 0.151 29 df = Degree of freedom *Significant difference
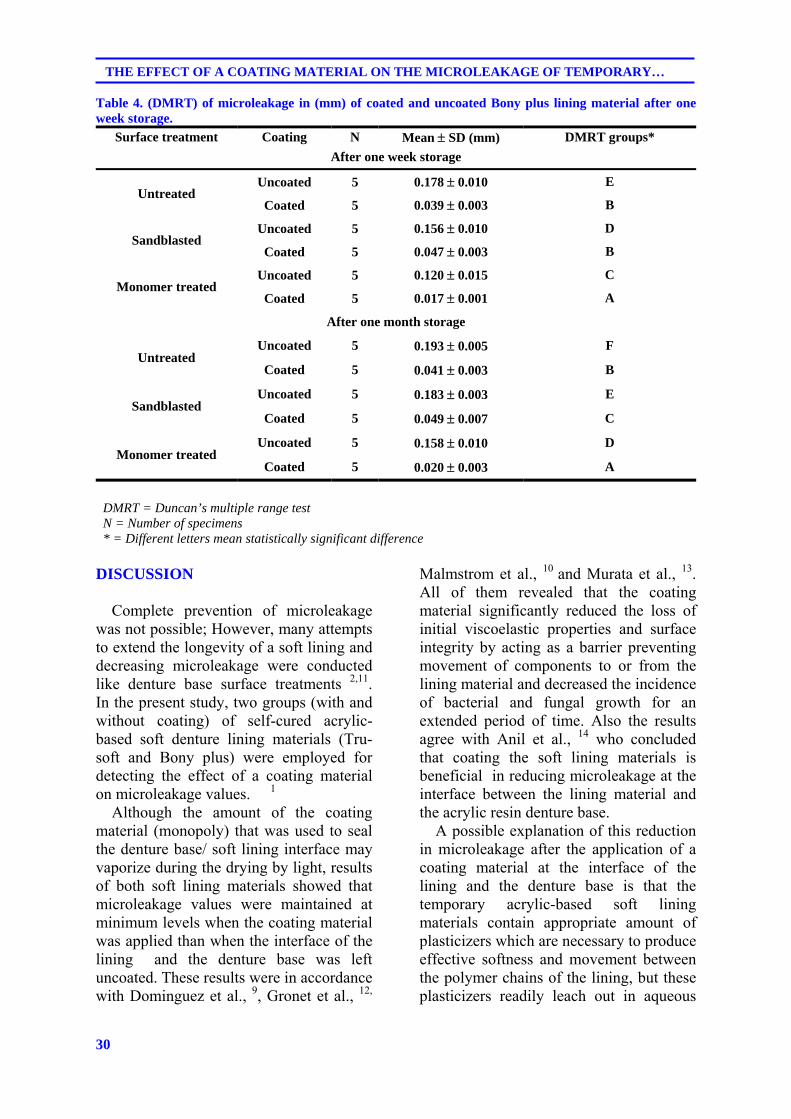
30
THE EFFECT OF A COATING MATERIAL ON THE MICROLEAKAGE OF TEMPORARY…
Table 4. (DMRT) of microleakage in (mm) of coated and uncoated Bony plus lining material after one week storage.
Surface treatment Coating N Mean SD (mm) DMRT groups*
After one week storage
Untreated Uncoated 5 0.178 0.010 E
Coated 5 0.039 0.003 B
Sandblasted
Uncoated 5 0.156 0.010 D
Coated 5 0.047 0.003 B
Monomer treated Uncoated 5 0.120 0.015 C
Coated 5 0.017 0.001 A
After one month storage
Untreated Uncoated 5 0.193 0.005 F
Coated 5 0.041 0.003 B
Sandblasted
Uncoated 5 0.183 0.003 E
Coated 5 0.049 0.007 C
Monomer treated Uncoated 5 0.158 0.010 D
Coated 5 0.020 0.003 A
DMRT = Duncan’s multiple range test N = Number of specimens
* = Different letters mean statistically significant difference
DISCUSSION
Complete prevention of microleakage was not possible; However, many attempts to extend the longevity of a soft lining and decreasing microleakage were conducted like denture base surface treatments 2,11. In the present study, two groups (with and without coating) of self-cured acrylic-based soft denture lining materials (Tru-soft and Bony plus) were employed for detecting the effect of a coating material on microleakage values. 1 Although the amount of the coating material (monopoly) that was used to seal the denture base/ soft lining interface may vaporize during the drying by light, results of both soft lining materials showed that microleakage values were maintained at minimum levels when the coating material was applied than when the interface of the lining and the denture base was left uncoated. These results were in accordance with Dominguez et al., 9, Gronet et al., 12,
Malmstrom et al., 10 and Murata et al., 13. All of them revealed that the coating material significantly reduced the loss of initial viscoelastic properties and surface integrity by acting as a barrier preventing movement of components to or from the lining material and decreased the incidence of bacterial and fungal growth for an extended period of time. Also the results agree with Anil et al., 14 who concluded that coating the soft lining materials is beneficial in reducing microleakage at the interface between the lining material and the acrylic resin denture base. A possible explanation of this reduction in microleakage after the application of a coating material at the interface of the lining and the denture base is that the temporary acrylic-based soft lining materials contain appropriate amount of plasticizers which are necessary to produce effective softness and movement between the polymer chains of the lining, but these plasticizers readily leach out in aqueous
31
Duhok Medical Journal Volume 6, Supplement 3, 2012
environment and the microbes and saliva on the other hand are absorbed by the porosities of the material causing degradation of the bonding interface and microleakage; consequently, the lining cease to be effective and should be replaced. By adding a coating material to seal the gap between the lining and the denture base, absorption and solubility of the lining material which is a contributing factor to the hardening and bond loss will be reduced because the porosities in the lining are obstructed. Eventually microleakage is decreased 9, 10 . CONCLUSIONS Application of the coating material on the denture base/ soft denture lining interface is significantly beneficial in reducing microleakage for the acrylic based temporary soft lining materials (Tru-soft and Bony plus).
REFERENCES 1. Kimoto S, Kitamura M, Kodaira M,
Yamamoto S, Ohno Y, Kawai Y, et al. Randomized controlled clinical trail on satisfaction with resilient denture liners among edentulous patients. Int J Prosthodont.2004; 17(2): 236-40.
2. Saraç YS, Basoglu T, Ceylan GK, Saraç D, Yapici O . Effect of denture base surface pretreatment on microleakage of a silicone–based resilient liner. J Prosthet Dent.2004; 92(3): 283-7.
3. Pinto JR, Mesquita MF, Nobilo MA, Henriques GE. Evaluation of varying amounts of thermal cycling on bond strength and permanent deformation of two resilient denture liners. J Prosthet Dent.2004; 92(3): 288-93.
4. Anil N, Hekimoglu C, Sahin S . Color stability of heat-polymerized and autopolymerized soft denture liners. J Prosthet Dent.1999; 81(4): 481-4.
5. Sertgöz A, Kulak Y, Gedik H, Taskonak B. The effect of
thermocycling on peel strength of six soft lining materials. J Oral Rehabil.2002; 29: 583-7.
6. Kimura Y, Yonaga K, Yokoyama K, Matsuoka E, Sakai K, Matsumoto K . Apical leakage of obturated canals prepared by Er: YAG laser. J Endod.2001; 27(9): 567-70.
7. Mese A, Güzel KG, Uysal E. Effect of storage duration on tensile bond strength of acrylic or silicone-based soft denture liners to a processed denture base polymer. Acta Odontol Scand . 2005; 63: 31-5.
8. Gardner LK, Parr GR. Extending the longevity of temporary soft liners with a mono-poly coating. J Prosthet Dent.1988; 59(1):71-2.
9. Dominguez NE, Thomas CJ, Gerzina T . Tissue conditioners protected by a poly (methylmethacrylate) coating. Int J Prosthodont.1996; 9(2): 137-41.
10. Malmstrom HS, Mehta N, Sanchez R, Moss ME . The effect of two different coatings on the surface integrity and softness of a tissue conditioner. J Prosthet Dent.2002; 87(2): 153-7.
11. Saraç D, Saraç YS, Basoglu T, Yapici O, Yuzbasioglu E . The evaluation of microleakage and bond strength of a silicone-based resilient liner following denture base surface pretreatment. J Prosthet Dent.2005; 95(2): 143-51.
12. Gronet PM, Driscoll CF, Hondrum SO . Resiliency of surface-sealed temporary soft denture liners. J Prosthet Dent.1997; 77(4): 370-4.
13. Murata H, Narasaki Y, Hamada T, McCabe JF . An alcohol-free tissue conditioner – A laboratory evaluation. J Dent.2006; 34(4): 307-15.
14. Anil N, Hekimoglu C, Büyükbas N, Ercan M. Microleakage study of various denture liners by autoradiography: Effect of accelerated aging. J Prosthet Dent.2000; 84(4): 394-9.
32
THE EFFECT OF A COATING MATERIAL ON THE MICROLEAKAGE OF TEMPORARY…
ón‚íq@@@@båmbèŠóiˆ@óÄŠó@l@ŽônòŠóØ@bä‹ÙŽïmŠbØ o‚òìŠói@bî@ì@ãŠóä@bî@bäa††@bäómói@@
@@wäbàŠb÷Z@@@@bäa††@æŽïäómói@ìì†@bî@Žôä‡äbèó @ýb‚@ŠóÜ@ŽôåmbèŠóiˆ@Šó@õ‹Ùn슆@bØóäómói@bä‹ÙŽïmŠbØ@bä‡äbäóÜóè@ŽôåïÜíØóÄ@ŽôÄ@b−bàŠb÷
Ýî‹Øó÷@bäbåï÷ŠbÙi@bÙŽîŠ@l@o‚òìŠói@ì@ãŠóä@æŽïîôäa††@íi@óÌbåi@Ûòì@æîîŠ@ÚïN@@ŽôåïÜíØóÄ@æŽïÙŽîŠZ@I60@H@@@@íØ@‹Äì‹ @ŽôØóîòíŽï’@çaìˆ@ÚŽï÷@Šóè@óäìí¹@ìó÷@ç‹Øò†bàb÷@óåmbè@ŽôåmbèŠóiˆ@æŽïäí¹I30H@@@@ôma‹îín@ì@íi@âà
I4HŠbš@óåïmbè@aì@oŽïÌbåi@æŽîìó÷@bäa††@æŽïqì‹ @ßó †@ça‡Žî‹ @óäìíjmbè@o‚òìŠói@ì@ãŠóä@æŽïäómói@ìì†@Šóè@âà@@@ì@‡nþi@‡äb@l@ç‹ØŠóòŠóàíäíà@N@@@@@@@@@@@@@@bòìŠóè@óäìí¹@ìó÷@LãŠóä@bî@ôäa††@b‚óm@ßó †@ôäa††@ŽôÌbåi@bäìíša‹ÙŽïm@Žôéu@ŠóÜ@çbäa†@ómbè@õ‹Øò†bàb÷@ŽôØóäómói
@çbäa†@óäìíjmbèI2@HE@@@@@bÙŽîŠ@l@Žôäì횊óiˆ@a‰ŽîŠ@ì@ŽôØòŠbu@Šóè@aŠójÄbä†@ÛóÅîóè@ì@ÛóïnÐóy@aŠbu@ìì†@íi@íÝi@ŽôåïÝïïà@ˆ@@ŽôqíÙì‹ÙïàæmŠbàˆóè@ómbèN@@
ãb−ó÷Z@@ÄbšŠói@bØóîŒaìbïu@íØ@íiŠbî†ì@a†íua†íu@ç‹ØóÄíÝ’@óåmbè@ôØóäómói@Šóè@æŽïàb−ó÷IP < 0.001@H@@æŽïÌbåi@æŽïqì‹ @aŠójÄb䆴Ðb¯@óåïmbèóä@ì@´Ðb¯@óåïmbè@æŽîìó÷@bäa††N@@
ãb−ó÷Šò†Z@@@a‰ŽîŠ@bä‹ÙáŽïØ@ß@íi@ŠóîŠbØ@bî@ŽôånÐb¯@bnòŠóØ@@@@@@@@@@@Žôàò†@ß@ôäa††@ŽôÌbåi@ì@ŽôånÐb¯@bî@ãŠóä@bäómói@aŠójÄbä†@Žôäì횊óiˆo‚òìŠói@æŽïäa††@æŽîbÌóåiˆ@ônÐb¯@Žôîóä@Žôqì‹ @ßó †@õŠbØ@ôÄ@bä‹Ø†ŠòìaŠóiN@@
@@
ó–þ©a@ @@@
ónÔü¾a@óî‹Üa@çbåÿa@âÕ @óäbi@†aí¾@ÖïÔ‡Üa@l‹nÜa@ôÝÈ@óï÷þ @ò†bà@qdm@@@@
Ó‡aZ@þÜa@ò†bà@qdm@âïïÕma@öò‹›@Imono-poly@H@ôÝÈ@ó䋾a@çbåÿa@âÕ @óäbi@æà@μm†bà@μi@ÖïÔ‡Üa@l‹nÜaITru-soft
and Bony plus@H@ò‡ÈbÔ@Êà@æà@âÕÜaÿa@wåma‹ÜaðÝî‹Ø@N@@׋ ì@†aí¾a@ÞáÉÜaZ@@@›¥60@ÖïÔ‡Üa@l‹nÜa@‘bïÕÜ@óåïÈ@L@âÕÜa@óäbi@æà@ò†bà@ÞÙÜ30@óåïÈ@NäbØo@åïÉÜa@™‹Ô@ÞÙ“i@ó@Õi@‹
30âÝà@ì@@Ú4@âÝà@I2@@ðÝî‹Øýa@âÕÜa@ò‡ÈbÔ@ö§@âÝà@ì2@@óî‹Üa@âÕÜa@óäbi@ò†bà@ö§@âÝàH@N@ðm†bà@ÂiŠ@ITru-soft and
Bony plus@ H@âÕÜa@ ò‡ÈbÔ@|@pb§bÉà@æà@Êïàbª@tþq@ÊàI@bɾa@|Üaì@ðÝà‹Üa@„ÑåÜbi@bɾa@|Üa@ L‹›a@Ì@|ÜaâÕÜa@ò‡ÈbÔ@ßíÝz·HN@@óÐbšg@@ò‹›a@óï÷þÜa@ò†b¾aImono-poly@H@‡åÈó䋾a@âÕÜa@óäbi@ò†bà@Êà@âÕÜa@ò‡ÈbÔ@ßb—ma@óÕåàN@@À@pbåïÉÜa@oÉšìI2HE@@óÍj–@æà׊Œÿa@μÝïrï¾a@ÑÜμm@@‹áÍÜa@æàI‡yaì@‹é’ì@‡yaì@Ëíjc@H@óuŠ†@‘bïÔ@ìóaíi@ÖïÔ‡Üa@l‹nÜa@
‹éa@xŠ‡¾a@N@@w÷bnåÜaZ@åÜa@oåïiñíåÉà@Ím@†íuì@óî‹Üa@âÕÜa@ðm†bà@þÙÜ@w÷bn@Ip <0.001@Ha@μi@À@öþ @çì‡i@oØ‹m@Üaì@bèûþ @@Üa@Êïàb
Êïàbª@@ÞØ@âÕÜa@ò‡ÈbÔ@|@pb§bÉà@@ðmÐ@Àì‹áÍÜaN@@pbubnånýaZ@@ò†bà@oäbØbÉÐ@öþÜa@À@óÜ@Ñ‚óî‹Üa@âÕÜa@óäbi@†aíà@μi@ÖïÔ‡Üa@l‹nÜa@ì@âÕ @ò‡ÈbÔ@@‡åÈ@ðÝî‹Øÿa@wåma‹Üa@æà@çbåÿa
bèûþ @ânî@@Üa@Êïàba@Êà@bénäŠbÕàN@@
33
Duhok Medical Journal Volume 6, Supplement 3, 2012
LAPAROSCOPIC ABLATION OF SYMPTOMATIC SIMPLE RENAL CYSTS AT AZADI TEACHING HOSPITAL (OUR INITIAL EXPERIENCE)
NASHWAN M. RASHEED, MBChB, FIBMS (Urology)
SHAKIR SALEEM BALINDI, MBChB, FICMS (Urology) Submitted 18 Jun 2012; accepted 3 Sep 2012 ABSTRACT Objective: To evaluate our experience with the use of laparoscopy in the management of patients with symptomatic renal cysts regarding out comes and to report any undesirable complication that may occur (if any) during and/or after this procedure. Background: Renal cystic disease is a common finding in older persons, which may be discovered either incidentally or radiographically. Most of renal cystic diseases are asymptomatic, in a small number symptoms or complications develops, in whom laparoscopic surgery either trans- or retroperitoneally is now an option. Methods: From March 2010 to July 2011, a total of 33 patients with symptomatic renal cysts underwent laparoscopic ablation (decortications) for their cysts in Azadi teaching hospital. Clinical assessment, operative details and complication were reported for all the patients. Results: Laparoscopic ablation of renal cysts was successful in all patients. No open conversions or transfusions were necessary. The mean operative time was 53 minutes. The mean hospital stay was 1 day. Symptomatic relief was achieved in all patients. Only 2 patients developed minor complications which had been managed conservatively. No evidence of recurrence at the end of 6 months follow-up period. Conclusion: Our results have confirmed that laparoscopy is a safe, feasible and effective procedure for treating symptomatic renal cysts, and it offers a favorable minimally invasive treatment option for symptomatic renal cysts.
Duhok Med J 2012; 6 Suppl 3:33-38. Key words: Laparoscopic, renal cyst, Azadi.
he use of laparoscopic surgery has rapidly expanded since the
laparoscope merged with the video camera in the mid-1980s. Since then, significant developments of laparoscopic equipment and instruments have been made.1 The development of laparoscopy in urology paralleled, to a large extent, the changes in general surgery. Up until the late 1980s, laparoscopy had limited applications in urology. Indeed, aside from Cortesi and colleagues' (1976) report of using the laparoscope in pediatric patients to explore for undescended testes3. Clayman and coworkers (1991b) performed the first clinical laparoscopic nephrectomy4. With the development of new techniques and instruments a new era in operative
urology had begun. Soon, a steady stream of newly developed laparoscopic procedures started to challenge their conventional open surgical counterparts and the Initial emphasis was on ablative procedures5. With an increasing number of multi-institutional studies emerging in which laparoscopic procedures are compared with their open surgical counterparts, it becomes clear that, owing to equivalent efficacy combined with distinct advantages in postoperative pain, cosmesis, recovery, and length of hospital stay, that laparoscopy has moved into the mainstream of urologic surgery6 . Renal cysts are believed to develop in tubular segments and Bowman's capsule, with simple cysts developing from the convoluted tubule, whereas the acquired
* Lecturer, School of Medicine, Faculty of Medical sciences, University of Duhok, Duhok, Kurdistan Region. ** Assistant professor, School of Medicine, Faculty of Medical sciences, University of Duhok, Duhok, Kurdistan Region. Correspondence author: Nashwan M. Rasheed. Email: [email protected]: Tel.:0096407504293052
T
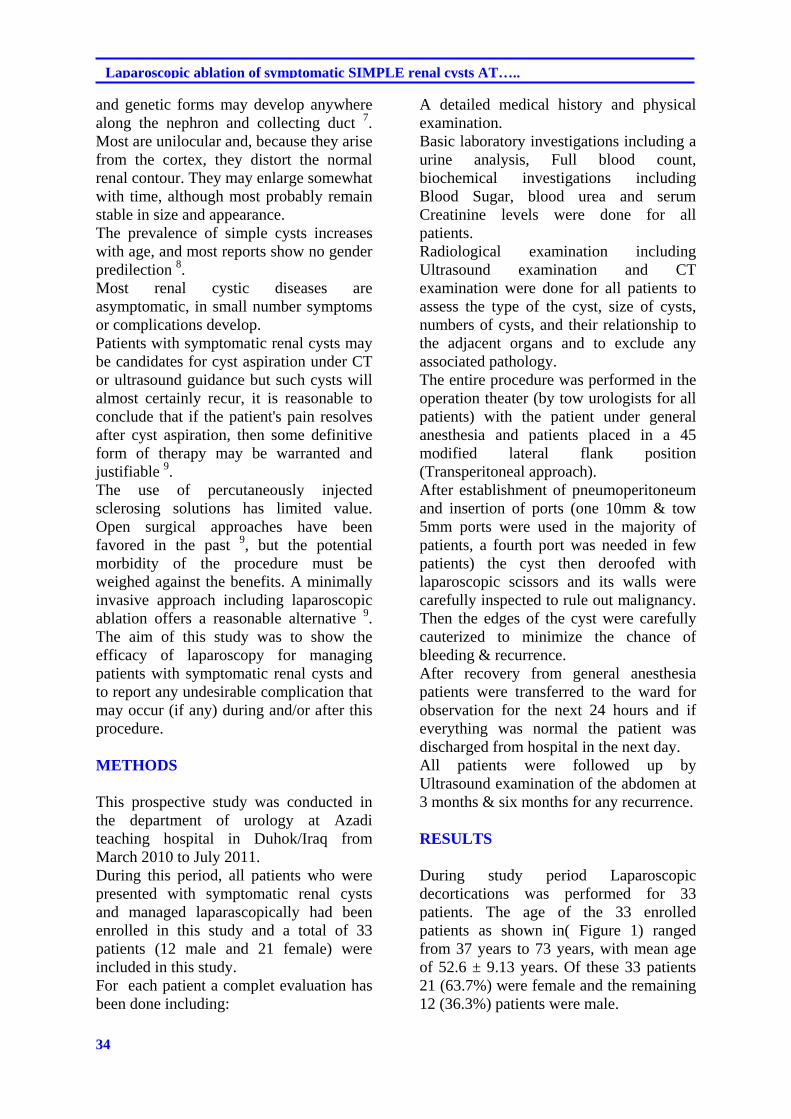
34
Laparoscopic ablation of symptomatic SIMPLE renal cysts AT…..
and genetic forms may develop anywhere along the nephron and collecting duct 7. Most are unilocular and, because they arise from the cortex, they distort the normal renal contour. They may enlarge somewhat with time, although most probably remain stable in size and appearance. The prevalence of simple cysts increases with age, and most reports show no gender predilection 8. Most renal cystic diseases are asymptomatic, in small number symptoms or complications develop. Patients with symptomatic renal cysts may be candidates for cyst aspiration under CT or ultrasound guidance but such cysts will almost certainly recur, it is reasonable to conclude that if the patient's pain resolves after cyst aspiration, then some definitive form of therapy may be warranted and justifiable 9. The use of percutaneously injected sclerosing solutions has limited value. Open surgical approaches have been favored in the past 9, but the potential morbidity of the procedure must be weighed against the benefits. A minimally invasive approach including laparoscopic ablation offers a reasonable alternative 9. The aim of this study was to show the efficacy of laparoscopy for managing patients with symptomatic renal cysts and to report any undesirable complication that may occur (if any) during and/or after this procedure. METHODS
This prospective study was conducted in the department of urology at Azadi teaching hospital in Duhok/Iraq from March 2010 to July 2011. During this period, all patients who were presented with symptomatic renal cysts and managed laparascopically had been enrolled in this study and a total of 33 patients (12 male and 21 female) were included in this study. For each patient a complet evaluation has been done including:
A detailed medical history and physical examination. Basic laboratory investigations including a urine analysis, Full blood count, biochemical investigations including Blood Sugar, blood urea and serum Creatinine levels were done for all patients. Radiological examination including Ultrasound examination and CT examination were done for all patients to assess the type of the cyst, size of cysts, numbers of cysts, and their relationship to the adjacent organs and to exclude any associated pathology. The entire procedure was performed in the operation theater (by tow urologists for all patients) with the patient under general anesthesia and patients placed in a 45 modified lateral flank position (Transperitoneal approach). After establishment of pneumoperitoneum and insertion of ports (one 10mm & tow 5mm ports were used in the majority of patients, a fourth port was needed in few patients) the cyst then deroofed with laparoscopic scissors and its walls were carefully inspected to rule out malignancy. Then the edges of the cyst were carefully cauterized to minimize the chance of bleeding & recurrence. After recovery from general anesthesia patients were transferred to the ward for observation for the next 24 hours and if everything was normal the patient was discharged from hospital in the next day. All patients were followed up by Ultrasound examination of the abdomen at 3 months & six months for any recurrence. RESULTS
During study period Laparoscopic decortications was performed for 33 patients. The age of the 33 enrolled patients as shown in( Figure 1) ranged from 37 years to 73 years, with mean age of 52.6 ± 9.13 years. Of these 33 patients 21 (63.7%) were female and the remaining 12 (36.3%) patients were male.
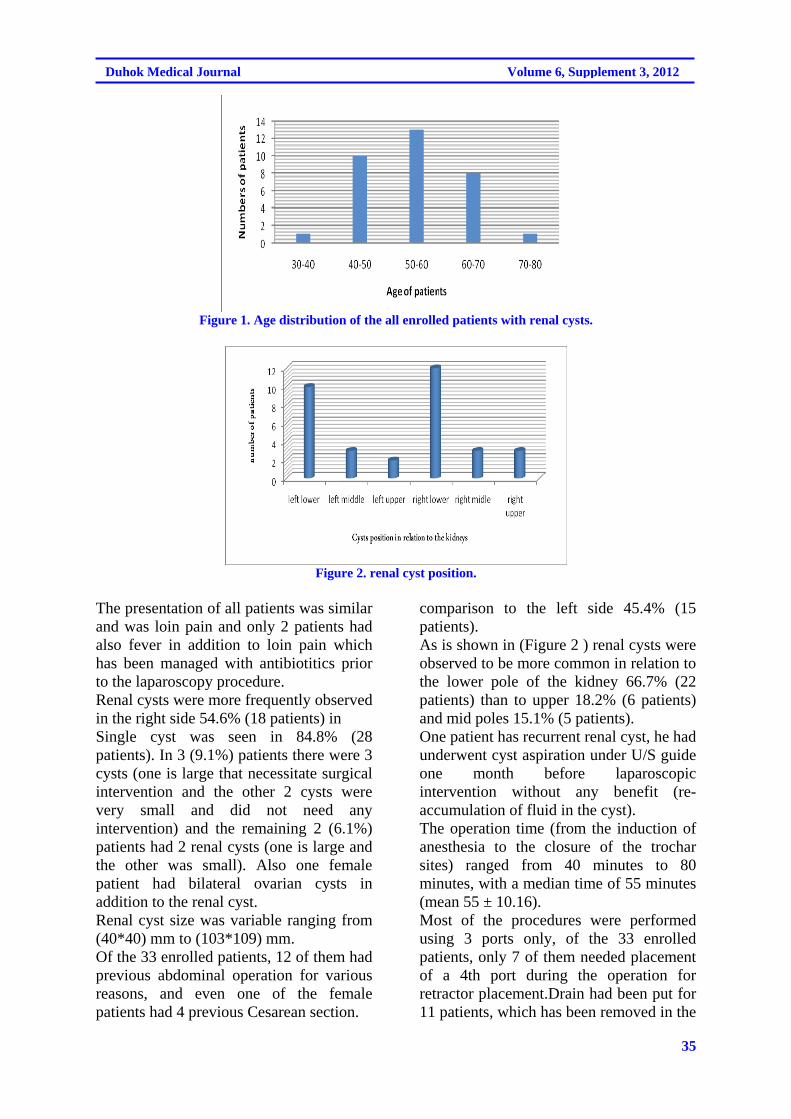
35
Duhok Medical Journal Volume 6, Supplement 3, 2012
Figure 1. Age distribution of the all enrolled patients with renal cysts.
Figure 2. renal cyst position.
The presentation of all patients was similar and was loin pain and only 2 patients had also fever in addition to loin pain which has been managed with antibiotitics prior to the laparoscopy procedure. Renal cysts were more frequently observed in the right side 54.6% (18 patients) in
comparison to the left side 45.4% (15 patients). As is shown in (Figure 2 ) renal cysts were observed to be more common in relation to the lower pole of the kidney 66.7% (22 patients) than to upper 18.2% (6 patients) and mid poles 15.1% (5 patients).
Single cyst was seen in 84.8% (28 patients). In 3 (9.1%) patients there were 3 cysts (one is large that necessitate surgical intervention and the other 2 cysts were very small and did not need any intervention) and the remaining 2 (6.1%) patients had 2 renal cysts (one is large and the other was small). Also one female patient had bilateral ovarian cysts in addition to the renal cyst. Renal cyst size was variable ranging from (40*40) mm to (103*109) mm. Of the 33 enrolled patients, 12 of them had previous abdominal operation for various reasons, and even one of the female patients had 4 previous Cesarean section.
One patient has recurrent renal cyst, he had underwent cyst aspiration under U/S guide one month before laparoscopic intervention without any benefit (re-accumulation of fluid in the cyst). The operation time (from the induction of anesthesia to the closure of the trochar sites) ranged from 40 minutes to 80 minutes, with a median time of 55 minutes (mean 55 ± 10.16). Most of the procedures were performed using 3 ports only, of the 33 enrolled patients, only 7 of them needed placement of a 4th port during the operation for retractor placement.Drain had been put for 11 patients, which has been removed in the
36
Laparoscopic ablation of symptomatic SIMPLE renal cysts AT…..
next day for all patients except one who developed intra-operative bleeding and his drain has been removed after 2 days. Two patients (6.1%) developed complication intra-operatively, one of them developed mild liver contusion and was managed conservatively, by increasing carbon dioxide insufflations (intra-operatively), tube drain and observation & after 24 hours the oozing completely stopped. Other patient developed intra-operative bleeding from the edge of the cyst & was managed by suturing of the edge of the cyst and tube drainage which was kept for 48 hours. All patients had been discharged from the hospital in the next day except one who developed intra-operative bleeding and had been discharged from hospital after 2 days after removal of the drain. The result of histopathologyical examination of the cyst wall was negative for malignancy in all patients. DISCUSSION
Although the foundation of modern laparoscopy was laid in 1805 by Bozzini ( Bozzini, 1806 ) 10, laparoscopy was not used widely in surgery till mid-1980s when it has been merged with the video camera1. From that time, laparoscopy was used widely in surgery including urology 2. As urologists became more skilled, they expanded their laparoscopic procedures into the realm of more difficult ablative surgery10. This study has been conducted in our center in order to evaluate our laparoscopic experience in treating renal cysts. Renal cystic disease generally is the ailment of older patients and this was observed in the present study were the mean age of patients was 54 years old. Most of the patients were females and this may be due to low pain threshold of females that bring the cysts under clinical observation and diagnosis as the pain was the chief presentation of the renal cysts.
This study also revealed that most cysts were arising from the lower pole of the kidney (both from the right and left sides) and this may be related to the drainage of the lower poles in contrast to the mid and upper poles. Laparoscopic interference was possible even in those with previous abdominal operation (even if multiple) as 12 out of 33 of our patients had previous abdominal operation. The complication rates for urologic laparoscopy were varied significantly from one series to another ranging from 4.4% to 19%. Which may be due to variable opinions as to what constitutes a complication and differing degrees of technical difficulty between laparoscopic procedure 11. In our study the complication rate was 6.1% (2 out of 33 patients) and these complications were mostly bleeding, as the most common complications of laparoscopic interference are vascular 11, and both of our patients developed oozing intraoperatively and had been managed conservatively by increasing carbon dioxide insufflations pressure (intra-operatively), intraperitoneal drainage via a tube drain & monitoring for one to two days. Almost all renal cysts recur after aspiration and need more definite procedure for complete resolution as it has been seen in one patient who has been previously managed by aspiration under U/S guide and recur after 1 month & so laparoscopic decortications was done for him. The operative time varies from one patient to other depending on the size & constituent of the cyst & surgeon experience, in our study the mean operation time was 55 minutes which is comparable to most reported series 12-15. The recurrence rate was zero as no patient developed recurrence of cyst as documented twice post-operatively at 3months and 6 months post-operatively by ultrasound and renal function tests. These results were comparable to most reported series which give a nearly 100% success
37
Duhok Medical Journal Volume 6, Supplement 3, 2012
rate for laparoscopic decortications of renal cysts 12-15. CONCLUSIONS
Laparoscopy offers a safe and efficacious means of ablating symptomatic simple renal cysts with a high success rate and low recurrence rate. Most complications that occur are simple and can be managed conservatively. REFERENCES
1. Eshghi AM, Roth JS, Smith AD.
Percutaneous transperitoneal approach to a pelvic kidney for endourological removal of staghorn calculus. J Urol. 1985; 134(3):525-7 .
2. Ruddock JC. Peritoneoscopy: A critical clinical review. Surg Clin North Am .1957; 37(5):1249-60.
3. Cortesi N, Ferrari P, Zambarda E, Manenti A, Baldini A, Morano FP, et al. Diagnosis of bilateral abdominal cryptorchidism by laparoscopy. Endoscopy. 1976; 8(1):33-4 .
4. Clayman RV, Kavoussi LR, Soper NJ, Dierks SM, Meretyk S, Darcy MD, et al. Laparoscopic nephrectomy: Initial case report. J Urol 1991b;146:278282, et al: Laparoscopic nephrectomy: Initial case report. J Urol. 1991; 146 (2): 278-82 .
5. Gill IS, Kerbl K, Meraney AM, Clayman RV. Basics of Laparoscopic Urologic Surgery: Campbell's Urology, 8th ed. Philadelphia :WB Saunders; 2002.p. 3456-73.
6. Guillonneau B, Vallancien G. Laparoscopic radical prostatectomy: The Monsouris
technique. J Urol. 2000;163(6):1643-9.
7. Glassberg KI. Campbell's urology. 6th ed. Philadelphia: WB Saunders; 1992.p. 1443.
8. Hartman DS, Aronson S, Frazer H. Current status of imaging indeterminate renal masses. Radiol Clin North Am. 1991; 29(3):475–96.
9. Walton KN. Urologic surgery. 4th ed. Philadelphia: JB Lippincott; 1991.p. 138.
10. Mintz M. Risks and prophylaxis in laparoscopy: A survey of 100,000 cases. J Reprod Med. 1977; 18(5):269-72.
11. Parsons JK, Varkarakis I, Rha KH, Jarrett TW, Pinto PA, Kavoussi LR. Complications of abdominal urologic laparoscopy: Longitudinal five-year analysis. Urology. 2004; 63(1):27-32.
12. 1Winfield HN, Donovan JF, See WA, Loening SA, Williams RD. Urological laparoscopic surgery. J Urol .1991; 146(1):941-8.
13. Chapron C, Dubuisson JB, Ansquer Y, Gregorakis SS, Morice P, Zerbib M. Bladder injuries during total laparoscopic hysterectomy: Diagnosis, management and prevention. J Gynecol Surg. 1995; 11:95-8.
14. Fahlenkamp D, Rassweiler J, Fornara P, Frede T, Loening SA. Complications of laparoscopic procedures in urology: Experience with 2,407 procedures at 4 German centers. J Urol. 1999; 162:765-70.
15. Härkki-Siren P, Sjoberg J, Kurki T. Major complications of laparoscopy: A follow-up Finnish study. Obstet Gynecol .1999; 94:94-8.
38
Laparoscopic ablation of symptomatic SIMPLE renal cysts AT…..
ón‚íq
熋ØÐ@@õ†aŒb÷@óäbƒ’í‚óä@ß@líÙì‹qý@õàb÷@ôäbåïèŠbÙi@õbŽîŠ@l@óÝí @ß@ò†b@ñ‹îím@ôåm‹Üóè@@@@
wäbàŠb÷Z@@@@ôä‹ØŠbî†ì@óÝìó @ß@ò†b@õ‹îím@ôåm‹Üóè@íi@líÙì‹qý@õàb÷@ôäbåïèŠbÙi@ôä‡äbäbÜóè@íi@熋Ø@ónîbè@òìóåîˆím@ãó÷bØ@ß@o슆@óä@õóäaìa†ììŠ@í÷@ìíàóèóîŠó ón“ä@òŠíu@ãó÷@ôäa‡àb−ó÷@o“q@ß@ì@ôm@N@@
@çóàómói@ôÄì‹à@ß@òìýóiŠói@óÙmóÜby@òŠíu@óÝí @õò†b@õ‹îím@N@@@@@ôåm‹ Šòì@ômbØ@ß@熋Ø@ónî†@óm@óÜby@ãó÷@ô䆋Ùäb“ïä@oò†ŠaŒb÷@çbî@çb“ïä@Ûò‡åè@ôäìíiŠbî†@ômbØ@ß@çbî@õ†@ôØóîíè@Šóè@íi@Ú“mN@@ŠaŒb÷@ôäìíiŠbî†@ômbØ@ßì@~@@
ŽïَôåïÜíØóÄ@æZ@@líÙì‹qý@õbîŠ@l@@æm‹Üóè@@ónî†@l@ò‹îím@ãó÷N@@@õŠa†b÷@õòìbà@ß2010@@õ‰îìýó @ì2011@~I33@@H@óïmbè@@çbØò‹îím@ì@熋؊óòŠbš@óåïmbè@óÝïuŠí @õò†b@õ‹îím@ô’ìím@•í‚óä
Ûíè†@õŠb’@ß@õ†aŒb÷@óäbƒ’í‚óä@ß@@líÙì‹qý@@õàb÷@ôäbåïèŠbÙi@õbîŠ@l@æm‹Üóè@N@@b−ó÷ãZóØ@pìóØ@Šbî†@a‡àb−ó÷@ß@~íi@ìímìóØŠó@çbØbîŠó ón“ä@ìóàóè@~@‡äòìbä@ì@æîí‚@ôäbäa†@bî@ÃŒ@õòìó䆋Ø@íi@ìíióä@ônîíïq@ïè
@õŠó ón“ä@ômbØI53@H@ìíi@ ŽìŠ@Ûóî@óäbƒ’í‚óä@ß@çbØó’í‚óä@òìóäbà@õ‡äòìbä@ì@ìíi@@ÛóÜí‚@N@@@@õìa†ììŠ@‡äóè@ô’ìím@•í‚óä@ìì†@ìØŠóòŠbš@óåïmbèì@çìíi@ÛíõŠó ón“ä@ôi@ç‹@N@õòbà@ß@òìóä@@çíióä@ò†b@õ‹îím@ôäìíi@o슆@òŠbiìì†@ô’ìím@•í‚óä@ïè@ìI6@H
õŠó ón“ïä@•bq@@ÂäbàN@@Šò†ãb−ó÷@Z@óîbîŠ@μmóàþì@æî’bi@óÝí @õò†b@õ‹îím@ôåm‹Üóè@íi@líÙì‹qý@õàb÷@ôäbåï÷ŠbÙi@óØ@íiŠbî†@òìóåîˆím@ãó÷N@@
ó–þ©a@ @@@
a@‘bïØa@ßb—øna@ŠbÅå¾bi@óïjÜa@ôÝÙÜÀ@ñ†aŒe@ôÑ“nà@@ðáïÝÉnÜaIóïÜìýa@båm‚H@@@@
‹ÍÜa@ZâïïÕnÜ@w÷bnä@@båni‹¤ý@À@æjÜa@ŠbÅåà@ãa‡ƒn@ó§bÉà@@æà@çíäbÉî@æî‰Üa@ôš‹¾a‘bïØýa@@óîíÝÙÜaóïjÜa@óïš‹ÉÜa@çbïjÜì@@ñc@t‡¥@‡Ô@@béïÐ@líÌ‹à@Ì@pbÑÈb›àIp‡uì@çg@H@öbåqcóïÝáÉÜa@bè‡Éi@ìcN@@
©aóïÑÝZ@@‹àïÙm@ÝÙÜaô@nÉî@b—m@bÉ÷b’@@óЇ–@bàg@béÐb“nØa@ânî@‡Ô@Üaì@LæÜa@ŠbjØ@õ‡Ü@Öî‹ @æÈÜa@ìa@óïÈbÉ’ýa@pb–ízÑa‹Èýa@ŠíéÄ@óvïnä@Na‹àc@âÅÉà@ïÙm@@ôÝÙÜaóº‡È@a‹ÈýaÞïÝÔ@†‡È@À@L@‹éÅm@ôš‹¾a@æà@@L@pbÑÈb›¾a@ìc@a‹Èÿa@‡Ém@sïy
§a@óya‹@óaíiÅåàbŠ@æjÜa@È@bàgçýa@×bÑ—Üa@ÒÝ‚@ìa Šbï‚xþÉÝÜ@aN@@Üa׋Z@@‘Šbà@æà@òÑÜa@À2010@@íïÜíî@¶a2011@Ê›‚@L33@‹àî›b@@æà@çíäbÉîpbïÙm@š‹È@óîíÝØóï@‘bïØýa@ßb—øný@ŠbÅå¾bi
(decortications) ñ†aŒe@ôÑ“nà@À@ðáïÝÉnÜa.@@ìçì†@‡Ô@Ü@pbÑÈb›¾aì@óïÝáÉÜa@Þï–bÑm@Lñ‹î‹Üa@âïïÕnÜaa@óÐbÙôš‹¾.@@
w÷bnåÜa:@@óîíÝÙÜa@‘bïØýa@ßb—øna@óïÝáÈi@óaíŠbÅå¾a@oäbØ@ôš‹¾a@Êï»@À@ózubä@N@sïym@@ìa@æi@|nÐ@pbïÝáÉÜ@òŠì‹›Üa@ðȇnã‡Üa@ÞÕä@@N@çbØìóïÝáÉÜa@æàŒ@Âínà@53@óÕïÔ†@NÂínà@çbØ@ì@àíî@@ôÑ“n¾a@À@óàbÔfiaa‡yaì@bN@@ì@μ›î‹à@À@óïi@pbÑÈb›à@oÝ—y
abïÅÑ¥@o§íÈ@‡Ô@Ü@Nó܆c@‡uaínm@@Ša‹Ùm@ôÝÈ@pbïÙnÜa@ôny@óîbéä@óÉibn¾a@òÐI@6@é’c‹H.@@ýapbubnån:@p‡Øc@@æàe@öa‹ug@íè@æjÜa@Ååm@çc@båv÷bnä~ßbÉÐì@ñ‡ª@À@@xþÈpbïÙm@@ôÝÙÜaóïš‹ÉÜauþÈ@Šbï‚@ã‡Õî@êäcì@L@bá÷þà@bïìI minimally invasive@@HpbïÙnÜ@ôÝÙÜa.@@
39
Effect of apical patency on periapical extrusion during different ..........
EFFECT OF APICAL PATENCY ON PERIAPICAL EXTRUSION DURING DIFFERENT INSTRUMENTATION TECHNIQUES
RAID F. SALMAN, BDS, MSc, PhD
ZIWAR A. QASSAB, BDS, MSc, PhD
HALA P. HANNA ,BDS, MSc Submitted 3 Jul 2012; accepted 3 Sep 2012 ABSTRACT Background and objectives: Establishing apical patency is leaving the apical foramen accessible, free from dentin chips, pulp fragments and other debris. This in vitro study compared the apical foramen patency for two different instrumentation techniques. Methods: Thirty single-rooted human teeth were used in this study & the teeth were de-coronated at Cemento-enamel Junction. After that roots were fixed in holes cut through pieces of rubber dam covering plastic containers. The roots were divided into two groups, the first 15 were instrumented using a step-back technique & other 15were instrumented using crown-down technique. Both instrumentation techniques were used twice; once without a patency file & the other with a patency file. Finally the collection vials (the bottles) were weighed after instrumentation, i.e. with the irrigating solution (the amount of NaOCl + debris that was extruded through the apical foramen into the collection vials) on an electronic balance to the third decimal digit. Results: By using t-test, there was non-significant difference between the Group A1 (step-back hand instrumentation without use of patency file) & A2 (step-back hand instrumentation with use of patency file) at p> 0.05, with in favor of without use of patency file group. There was highly significant difference between Group B1 (crown-down rotary instrumentation without use of patency file) & B2 (crown-down rotary instrumentation with use of patency file) at p< 0.01, with in favor of without use of patency file group. For the instrumentation techniques, the rotary crown-down technique showed lesser debris extrusion than the hand step-back technique both with & without use of patency file, however, the difference was non-significant at p> 0.05. Conclusions: there is a strong relationship between the patency file & the extrusion of debris & the irrigation solution. Duhok Med J 2012; 6 Suppl 3: 39-46. Key words: Apical patency, periapical extrusion.
uring root canal preparation, dentin chips produced by instrumentation
and fragments of apical pulp tissue tend to be compacted into the foramen, which may cause apical blockage and interfere with the working length. The repeated penetration of the apical foramen with a file of adequate size during instrumentation prevents the accumulation of debris in this area leaving the foramen unblocked, i.e., patent. This concept has been defined as apical foramen patency. 9 Therefore , establishing patency is leaving the apical foramen accessible, free from dentin chips, pulp fragments and other debris. 2
Some authors have suggested that apical patency should be gained with an instrument that binds to the foramen. However, one of the arguments against this procedure is that a file that binds to the foramen will act like an embolus, increasing the possibility that debris are inadvertently extruded beyond the apex. 9
On the other hand, the use of a file that is not adjusted to the apical portion will offer a lesser risk of extrusion of debris or, at least, minimize its occurrence. Considering that the purpose of this procedure is to prevent the accumulation of dentin chips in the apical area, the use of an instrument of smaller size than the foramen will be effective with the advantage of offering a
* Assistant Professor at College of Dentistry, Hawler Medical University. ** Assistant Professor ,Dean ,t College of Dentistry, Hawler Medical University. *** Assistant lecturer at College of Dentistry, Hawler Medical University. Correspondence author: Raid F. Salman .Email: [email protected]
D
40
Duhok Medical Journal Volume 6, Supplement 3, 2012
lesser risk of displacement of toxic products and dentin fragments from the root canal into the peri-apical space. 9 While Buchanan 1, pointed out that apical canal blockage can be avoided during instrumentation using a patency file. He defines a patency file “as a small flexible K-file, which will passively move through the apical constrictor without widening it.” The apical limit of root canal instrumentation is still a very controversial topic in endodontics. The possibility of aggressions to apical and periapical tissues has supported the principle of the working length staying short of the radiographic apex. Different working lengths have been proposed, but the most widely accepted approach seems to be choosing a working length of 1 mm coronal to the root apex. 9 Lambrianidis et al 5 evaluated the roles of the apical constriction and foramen and the use of a patency file on the apical extrusion of NaOCl and debris. The results indicated that there was significant difference in the amounts of extruded material before and after the enlargement of the apical constriction with greater extrusion when the constriction remained intact. Goldberg & Massone 2 assessed the transportation produced at the apical foramen when stainless steel or nickel titanium K-files #10, #15, #20, and #25 were used as a patency file. They showed that transportation of the apical foramen was detected in 18 of the 30 specimens analyzed. No statistical differences were observed when stainless steel or nickel-titanium K-files were used as a patency file. They suggested that if a patency file is used, one should use the smallest file size possible. Tinaz et al 10 compared the amount of apical extrusion during manual instrumentation and engine-driven rotary instrumentation in teeth with disrupted apical constriction. They found that there was a tendency with both techniques to extrude apically more material as the diameter of the apical patency increased.
Leonardi et al 6 assessed the presence of apically extruded debris and evaluated the influence of canal curvature on the amount of debris produced by manual and mechanical techniques. They found no statistically significant difference between the manual and mechanical instrumentation, and no statistically significant differences were found between slight and moderate curvatures in terms of the amount of extruded debris. Kustarci et al 3 compared the amount of debris and irrigant extruded apically, using manual technique and crown-down pressure less technique by K3, RaCe, and FlexMaster instruments. They found that all instrumentation techniques produced extruded debris and irrigant; however, the engine-driven nickel-titanium systems were associated with less apical extrusion and irrigant. This in vitro study tried to compare the apical foramen patency for two different instrumentation techniques (hand step-back & rotary crown-down). METHODS Thirty single-rooted human teeth were used in this study. Visual examination had been done to ensure the existence of a completely formed apex and the presence of straight roots & the teeth then were stored at room temperature in distilled water. The teeth were de-coronated at CEJ using carborandom disk in low speed hand piece. Size #15 K-file was extended just beyond the apical foramen to ensure the patency of the root canals before instrumentation, the same file was used for working length determination by subtracting 0.5 mm from this length. The roots were mounted in holes cut through pieces of rubber dam covering plastic containers and these rubbers were secured in place with the aid of wires tightened around the plastic containers which with the roots in placed were weighed on an electronic balance to the third decimal digit.
41
Effect of apical patency on periapical extrusion during different ..........
The irrigation solution used was 5.25% NaOCl. The collection vials were hand-held vertically at all times. The roots were divided into two groups, the first 15 were instrumented using a step-back technique & other 15 instrumented using crown-down technique. The two instrumentation techniques were used twice; once without a patency file & the other with a patency file. In the first group in which the step-back technique was used without the patency file, the canals enlarged till no. #35 file to the apical constriction and sizes #40, #45 & #50 were 1, 2 & 3 mm short of the working length respectively, after each instrument the canal was irrigated by 0.5 ml NaOCl irrigation solution with constant delivery every second instrument by means of a 5-ml plastic syringe with an attached 23-gauge endodontic needle except for last recapitulation step with the MAF # 35 in which 1.5 ml was delivered into the canal. The needle tip was loosely placed in the canal. In total, 5 ml of NaOCl per root were used. The collection vials (the bottles) were weighed after instrumentation, i.e. with the irrigating solution (the amount of NaOCl + debris that was extruded through the apical foramen into the collection vials) on an electronic balance to the third decimal digit. The same roots were instrumented again in which a patency file was used. The roots were replaced on the washed and dried vials and new root canal instrumentation followed starting with a #50 file that was worked to 3 mm short of the original working length to create a ledge till #70 which considered as MAF and then continued with sizes #80, #90 & #100 files which were used coronally 4, 5 & 6 mm to the enlarged apical constriction respectively. They were then hand-held and the apical patency was done with a #25 file protruding apically 3 mm more than the new working length. After each instruments the canal was irrigated by 0.5 ml NaOCl irrigation solution with constant
delivery every second instrument by means of a 5-ml plastic syringe with an attached 23-gauge endodontic needle except for the last step with the patency file in which 1.5 ml was delivered into the canal. The needle tip was loosely placed in the canal. In total, 5 ml of NaOCl per root were used. The collection vials (the bottles) were weighed after instrumentation, i.e. with the irrigating solution (the amount of NaOCl + debris that was extruded through the apical foramen into the collection vials) on an electronic balance to the third decimal digit. The other 15 roots were instrumented using crown-down technique without a patency file, in which instrumentation started with S1 & S2, F2, F3 and F4 Protaper rotary system. Irrigation was identical to that used during step-back root canal preparation but 1ml of NaOCl was used after each instrument, in total, 5 ml of NaOCl per root were used. The collection vials (the bottles) were weighed after instrumentation, i.e. with the irrigating solution (the amount of NaOCl + debris that was extruded through the apical foramen into the collection vials) on an electronic balance to the third decimal digit. The same roots were instrumented again in which a patency file was used. The roots were replaced on the washed and dried vials and new root canal instrumentation followed starting with G.G drill that was worked to 3 mm short of the original working length to create a ledge, no. 6 G.G drill was used coronally ½ mm of the new working length, followed by no. 5 G.G drill inserted 2/3 of the new working length. Then F4 & F5 Protaper system was used to the new working length which is 3 mm shorter from the original working length. They were then hand-held and the apical patency was done with a #25 file protruding apically 3 mm more than the new working length. After each instruments the canal was irrigated by 1 ml NaOCl irrigation solution. In total, 5 ml of NaOCl per root were used. The
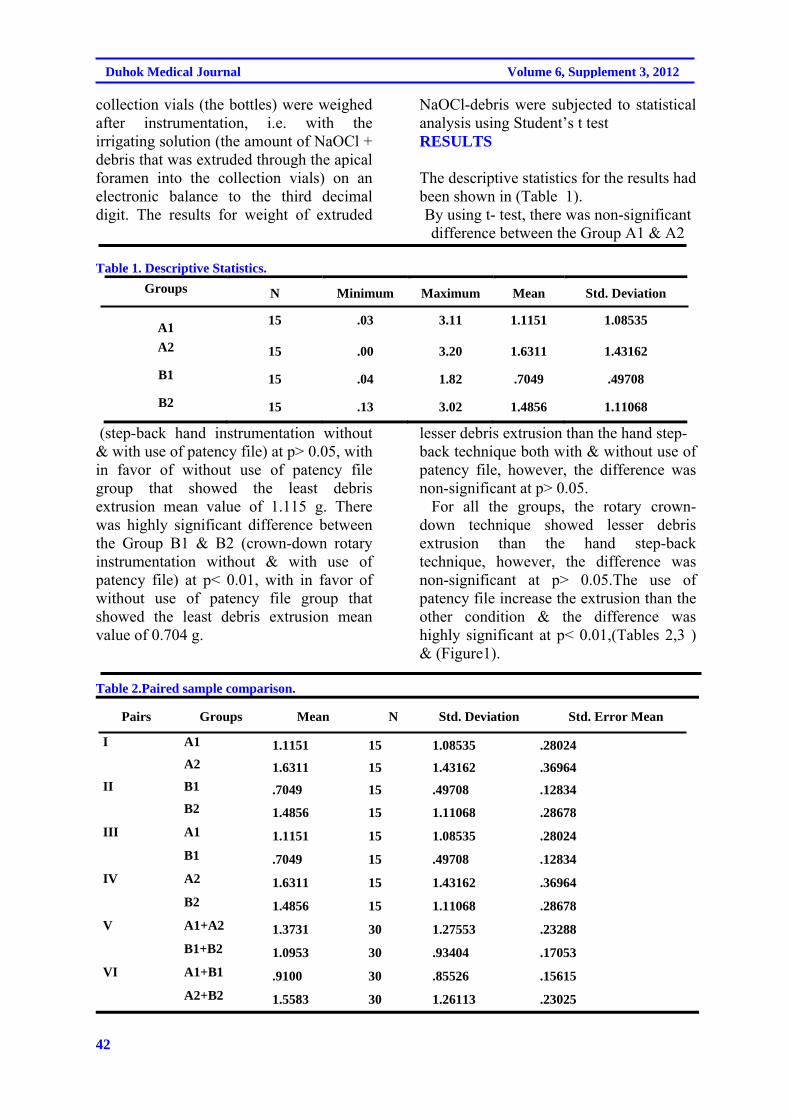
42
Duhok Medical Journal Volume 6, Supplement 3, 2012
collection vials (the bottles) were weighed after instrumentation, i.e. with the irrigating solution (the amount of NaOCl + debris that was extruded through the apical foramen into the collection vials) on an electronic balance to the third decimal digit. The results for weight of extruded
NaOCl-debris were subjected to statistical analysis using Student’s t test RESULTS The descriptive statistics for the results had been shown in (Table 1). By using t- test, there was non-significant difference between the Group A1 & A2
Table 1. Descriptive Statistics.
Groups N Minimum Maximum Mean Std. Deviation
A1
15 .03 3.11 1.1151 1.08535
A2 15 .00 3.20 1.6311 1.43162
B1 15 .04 1.82 .7049 .49708
B2 15 .13 3.02 1.4856 1.11068
(step-back hand instrumentation without & with use of patency file) at p> 0.05, with in favor of without use of patency file group that showed the least debris extrusion mean value of 1.115 g. There was highly significant difference between the Group B1 & B2 (crown-down rotary instrumentation without & with use of patency file) at p< 0.01, with in favor of without use of patency file group that showed the least debris extrusion mean value of 0.704 g.
lesser debris extrusion than the hand step- back technique both with & without use of patency file, however, the difference was non-significant at p> 0.05. For all the groups, the rotary crown-down technique showed lesser debris extrusion than the hand step-back technique, however, the difference was non-significant at p> 0.05.The use of patency file increase the extrusion than the other condition & the difference was highly significant at p< 0.01,(Tables 2,3 ) & (Figure1).
Table 2.Paired sample comparison.
Pairs Groups Mean N Std. Deviation Std. Error Mean
I A1 1.1151 15 1.08535 .28024
A2 1.6311 15 1.43162 .36964
II B1 .7049 15 .49708 .12834
B2 1.4856 15 1.11068 .28678
III A1 1.1151 15 1.08535 .28024
B1 .7049 15 .49708 .12834
IV A2 1.6311 15 1.43162 .36964
B2 1.4856 15 1.11068 .28678
V A1+A2 1.3731 30 1.27553 .23288
B1+B2 1.0953 30 .93404 .17053
VI A1+B1 .9100 30 .85526 .15615
A2+B2 1.5583 30 1.26113 .23025
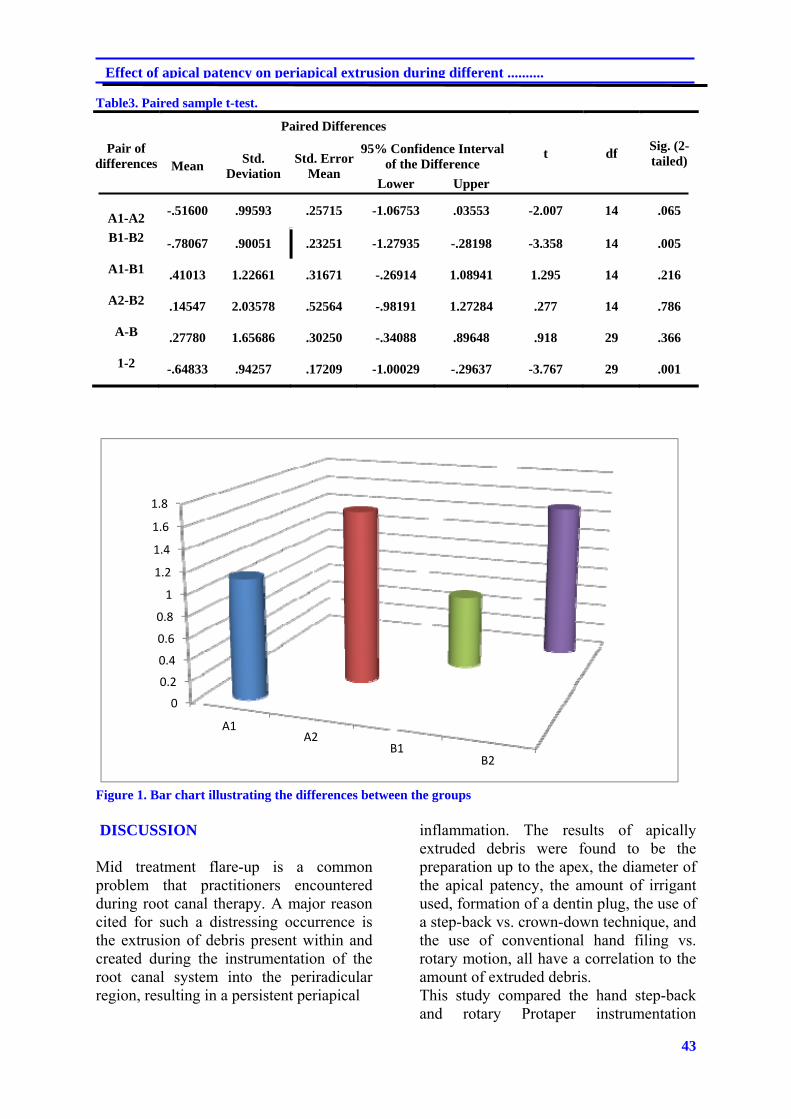
43
Effect of apical patency on periapical extrusion during different ..........
Table3. Paired sample t-test.
Paired Differences
t df Sig. (2-tailed)
Pair of differences Mean
Std. Deviation
Std. Error Mean
95% Confidence Interval of the Difference
Lower Upper
A1-A2
-.51600 .99593 .25715 -1.06753 .03553 -2.007 14 .065
B1-B2 -.78067 .90051 .23251 -1.27935 -.28198 -3.358 14 .005
A1-B1 .41013 1.22661 .31671 -.26914 1.08941 1.295 14 .216
A2-B2 .14547 2.03578 .52564 -.98191 1.27284 .277 14 .786
A-B .27780 1.65686 .30250 -.34088 .89648 .918 29 .366
1-2 -.64833 .94257 .17209 -1.00029 -.29637 -3.767 29 .001
0
0.2
0.4
0.6
0.8
1
1.2
1.4
1.6
1.8
A1A2
B1B2
Figure 1. Bar chart illustrating the differences between the groups DISCUSSION Mid treatment flare-up is a common problem that practitioners encountered during root canal therapy. A major reason cited for such a distressing occurrence is the extrusion of debris present within and created during the instrumentation of the root canal system into the periradicular region, resulting in a persistent periapical
inflammation. The results of apically extruded debris were found to be the preparation up to the apex, the diameter of the apical patency, the amount of irrigant used, formation of a dentin plug, the use of a step-back vs. crown-down technique, and the use of conventional hand filing vs. rotary motion, all have a correlation to the amount of extruded debris. This study compared the hand step-back and rotary Protaper instrumentation
44
Duhok Medical Journal Volume 6, Supplement 3, 2012
techniques in relation to extrusion of debris and irrigating solution with and without apical patency. In this study there was a highly significant difference between the group that patency file was used & the one that patency file was not used when hand step-back technique was used. Agreed with this Lambrianidis et al at 2001 in which they used step-back technique & NaOCl as irrigant, and found a significant difference in the amounts of extruded material before and after the enlargement of the apical constriction with greater extrusion when the constriction remained intact. While in case of rotary crown-down technique, there was a significant difference between the same types of groups although there was no significant difference between hand step-back & rotary crown-down techniques in relation to whether patency file was used or not. Some authors prefer to use sterile water as irrigants instead of NaOCl which is used clinically because the latter may produce crystals that could result in an increase in weight. 6 Tinaz et al 10 used NaOCl & revealed no significant difference between instrumentation with K-files and ProFile .04 taper files in relation to the amount of apical extrusion. There was a tendency with both techniques to extrude apically more material as the diameter of the apical patency increased. Logani and Shan 7 evaluated the amount of extruded debris using ProTaper hand, ProTaper rotary and ProFile, and the sterile water as an irrigant between instrumentation. They concluded that all rotary instruments tested produced apical extrusion of debris and that the ProTaper rotary extruded a significantly higher amount of debris than the Pro File. Kuştarci et al 4 compared in vitro the amount of debris and irrigant extruded apically, using manual technique and
crown-down pressure-less technique by K3, RaCe, and FlexMaster instruments. They used NaOCl as irrigants. They noted that all instrumentation techniques produced extruded debris and irrigant; however, the engine-driven nickel-titanium systems were associated with less apical extrusion and irrigant. Reddy & Hicks at 1998 used step-back instrumentation with K-files, balanced force with Flex-R files, Light-speed nickel titanium instruments, and .04 taper ProFile rotary nickel-titanium files, and found that all instrumentation techniques produced apically extruded debris, however, step-back instrumentation produced significantly more debris than the other methods. There was no difference between balanced force hand instrumentation and the two rotary nickel-titanium instrumentation methods. Hand or engine-driven instrumentation that uses rotation seems to reduce significantly the amount of debris extruded apically when compared with a push-pull technique. The results of this in vitro study should not be directly extrapolated to clinical practice, since the presence of periapical and pulpal tissue may show resistance to apical extrusion of debris. Furthermore, measuring the amount of extruded debris in terms of weight is not adequate enough to make a speculation concerning a mid-treatment flare-up. There may be other factors such as extruded irrigant, intra-canal medication, virulence of bacteria and the host response that can trigger such a flare up. 7 CONCLUSIONS It was appeared that using of a patency file appears to be more important than the technique of instrumentation of the canals in relation to the extrusion of debris & irrigating solution.
45
Effect of apical patency on periapical extrusion during different ..........
REFERENCES
1. Buchanan LS. Management of the curved root canal. J Calif Dent Assoc. 1989; 17(4):18-25.
2. Goldberg F, Massone EJ. Patency File and Apical Transportation: An In Vitro Study. J Endod. 2002; 28(7):510-1.
3. Kustarci A, Akpinar K, Er K. Apical extrusion of intra-canal debris and irrigant following use of various instrumentation techniques. Oral Surg Oral Med Oral Pathol Oral Radiol Endod. 2008; 105 (2):257-62.
4. Kustarcia A, Akdemira N, Sisob SH , Altunbas D. Apical Extrusion of Intra-canal Debris Using Two Engine Driven and Step-Back Instrumentation Techniques: An In-Vitro Study. Eur J Dent. 2008; 2(4):233-9.
5. Lambrianidis T, Tosounidou E, Tzoanopoulou M. The effect of maintaining apical patency on periapical extrusion. J Endod. 2001; 27(11):696-8.
6. Leonardi L, Atlas D, Raiden G. Apical extrusion of debris by manual and mechanical instrumentation. Braz Dent J. 2007; 18(1):16-9.
7. Logani A, Shan N. Apically extruded debris with three contemporary Ni-Ti instrumentation systems: An ex vivo comparative study. Indian J Dent Res. 2008;19(3)l:182-5..
8. Reddy SA, Hicks ML. Apical extrusion of debris using two hand and two rotary instrumentation techniques. J Endod. 1998; 24(3):180-3.
9. Souza RA. The importance of apical patency and cleaning of the apical foramen on root canal preparation. Braz. Dent. J. 2006; 17(1).
10. Tinaz AC, Alacam T, Uzun O, Maden M, Kayaoglu G. The effect of disruption of apical constriction on periapical extrusion. J Endod. 2005; 31(7):533-5.
46
Duhok Medical Journal Volume 6, Supplement 3, 2012
ón‚íq@ôîóÙmíÜ@õŠó‚a†@ì@òìó䆋؋q@ŠóóÜ@熋Ø@ò†bàb÷@ôäbØóÙïåØómóÜ@çaìì†@õŠóîŠbØ@ô䆋Ø@õŠbî†@Žßó @óÜ@@ôîóÙmíÜ@ôån‚a†@õbäaímN@@
@@ôØó“ŽïqZaŠ@ói@a†òìóåîím@ãóÜ@õŠbî†@ Žßó @óÜ@La‹Ø@Šó‚a†@Šüu@ìì†@ì@òìó䆋؋q@ôÙïåØóm@ Žô@üi@ôîóÙmíÜ@ôån‚a†@õbäaím@ô䆋؆Šì
ôîóÙmíÜ@õŠó‚a†@ì@òìó䆋؋q@ŠóóÜ@熋Ø@ò†bàb÷@ôäbØóÙïåØómóÜ@çaìì†@õŠóîŠbØ@ô䆋ØN@@@L@tìì‹ @ìì†@üi@ça‹Ø@•óia†@ôØóàòŠóè@ôØóîòíčï’ói@çb’bqL@òìóäa‹Ø@üØ@ça††@@oïi@ì@†ó30@@ôäbåčïèŠbØói@ói@ça‹Ø@ò†bàb÷@ÃòŠ
@ôïÙïåØómstep-back)@H~@30@ôÙïåØóm@@ôäbåčïè@ŠbØói@ói@ça‹Ø@ò†bàb÷@‹m@õóØó òŠstep down)@H@~@óÜ@ÛóîóÜóàüØ@Šóè@ô䆋iý@üiòìó䆋؋q@õóÜóàüØ@Žô@Šóói@ça‹Ù’óia†@ôØóàòŠóè@ôØóîòíčï’ói@çbØòìa‹Øò†bàb÷@óäa††N@@
@ãb−ó÷Zçbàüi@òìóàóÜ@@očîìóØò†Šò†@Z@čßó óÜ@çìíi@oòíîóq@ói@òìó䆋؋q@ôÙïåØóm@Ûòì@ãŠó @ôÜìíÔb’@ôäaŠünčïnóq@ôäbåčïèŠbØói@óØ@očïnò‡Üóè@õŠó‚a†N@@
ãb−ó÷Šò†ZôÙïåØómì@çì훎ïÜ@õ‹i@æîàóØói@çbØó òŠ@ñòìó䆋؋q@ôäa†@ ãb−ó÷óistep-back@@çbØó òŠ@ ói@pa†ò†@òíčï’@æî’biôîóÙmìíÜ@ôån‚a†@ñììŠóÜN@@
©ó–þا @
@qbmöínä@ôÝÈ@ðááÕÜa@bnÑäfia@qcóáÕÝÜ@Šìba@@óÑÝn¬@pbïåÕm@öbåqc @@
óà‡ÕàZ@ ôÝÈ@ oî‹ua@ óaŠ‡Üa@ ë‰è30@μnÈíáª@ ¶a@ çbåýa@ oáÔì@ ðÙïnþi@ õín@ óznÐ@ À@ oÉšìì@ oÉÔì@ ò‡yaì@ òbåÕÜ@ æ@ZóÈíáa@@@ìa@|mbÑÜa@†¾a@béÉà@oà‡ƒna@óÈíáª@ÞØì@ÞÑa@¶a@ÞïÝÕnÜa@óÕî‹i@óïäbrÜa@óÈíáaì@ôÝÈa@¶a@ÞïÝÕnÜa@óÕî‹i@‹›¥@¶ìýa㇃nîN@@
@w÷bnåÜa:|mbÑÜa@†¾a@ãa‡ƒna@‡åÈ@ñíåÉà@׋Ð@‡uíîì@μnÈíáa@μi@ñíåÉà@׋Ð@‡uíî@ý@êäa@p‹éÄa@ ~@óÕî‹ @ça@w÷bnåÜa@p‹éÄa@ báØnÜaõ‹‚ýa@óÕî‹Üa@æÈ@ò†aÜa@æà@ÞÔa@Œ‹Ñm@ÞÑa@¶a@ÞïÝÕN@@
xbnåna:@ó¤båÜa@ò†aÜaì@|mbÑÜa@†¾a@ãa‡ƒna@μi@ñíÔ@ÃbjmŠa@‡uíîN@@
47
Duhok Medical Journal Volume 6, Supplement 3, 2012
ANTI-CCP AS A NEW SEROLOGIC DIAGNOSTIC MARKER FOR THE DIAGNOSIS OF RHEUMATOID ARTHRITIS PATIENTS
RUQAYA MUHAMMED AL BARZINJI
NIAZ J. BARZINJI DASHTY BUSTANY
FEYAN M. ABDULLAH Submitted 18 Jun 2012; accepted 3 Sep 2012 ABSTRACT Background and objective: Rheumatoid arthritis (RA) is a systemic autoimmune disease of unknown etiology with chronic joint inflammation. Anti-cyclic citrullinated peptide (anti-CCP)antibody testing is particularly useful in the diagnosis of RA, with high specificity. These antibodies also identify a subset of patients who are likely to have substantial ongoing disease activity, more damage, and who will probably benefit most from early aggressive treatment. This study was conducted to assess the diagnostic value of anti-CCP RA patients. Methods: This study was carried out on 90 RA patients 17(18.9%) males and 73(81.1%) females who admitted Rizgari Teaching Hospital and 30 healthy controls (HC) in a period between November 2008 and November 2009. Parameters like RF-latex, erythrocyte sedimentation rate(ESR), C-reactive protein (CRP)tests were performed on 90 RA patients and 30 HC. Study groups were tested for enzyme linked immuno-sorbent assay (ELISA) anti-CCP, RF-IgM, RF-IgG and RF-IgA. Results: Out of 90 RA patients assessed, 60(66.7%) were RF-latex test positive. Regarding RA serological markers, the best specificity and sensitivity recorded by anti-CCP antibodies were (96.2%) and (73.7%). Anti-CCP test showed significant and highly significant correlation with RF-latex and RF-isotypes respectively. Moreover, a significant difference (P<0.05) was observed in mean serum concentration between anti-CCP+ve and anti-CCP-ve patients concerning RF-(latex and IgA) and P<0.01 was observed regarding RF-(IgM and IgG). Conclusion: Anti-CCP mostly considered as diagnostic disease specific RA marker. Duhok Med J 2012; 6 Suppl 3:47-58. Key words: Rheumatoid arthritis; Anti-cyclic citrrulinated peptides; Rheumatoid factor
heumatoid arthritis is a chronic progressive autoimmune disease
with varying systemic features that affects multiple tissues but principally attacking the joints to produce a non suppurtive proliferative synovitis that frequently progresses to destroy articular cartilage and the underlying bone with resulting disabling arthritis1. The disease is much more common in women than men with a ratio 3:1 while the most common age of onset is between the ages of 30 and 50 years, but over the age of 60 years the disease occurs with equal incidence in men and women2. Because the diagnosis of RA is primarily based on clinical symptoms, so it is often difficult to diagnose RA in very early stages of the
disease 3. Furthermore, RF has a limited specificity for RA, therefore other more specific antibodies have been sought4. Most promising for the future appears to be the growing family of antigens containing one or more citrulline residues. Some of these antigens have recently been applied in simple and easy to use as ELISA tests, and have been shown to be very specific for RA, to be able to diagnose RA in a very early phase of the disease, and to predict erosive disease3. The serological parameter that meets these requirements for a good and useful marker for RA is the anti-citrullinated peptide antibody5. The sensitivity of this antibody is comparable to that of the RF
* Assistant .Professor, College of Medicine; Hawler Medical University. **Lecturer, College of Medicine; Hawler Medical University. Correspondence author: Ruqaya M. Al Barzinji .Email:[email protected]
R
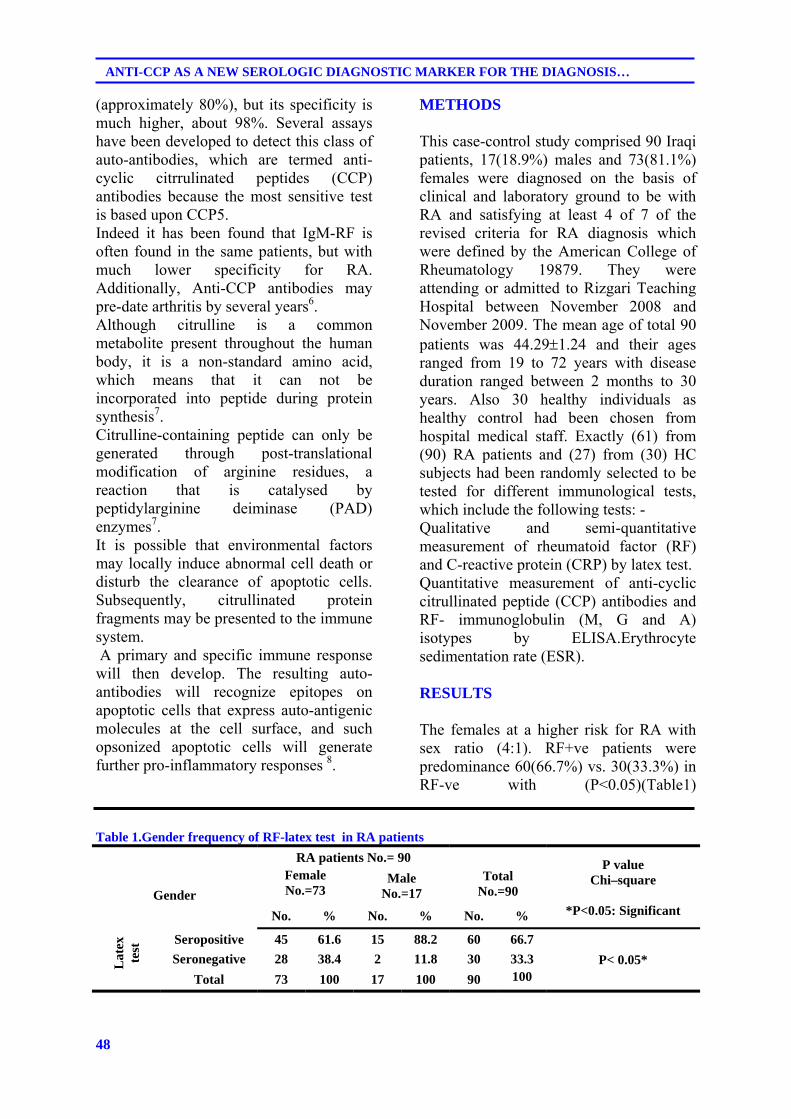
48
ANTI-CCP AS A NEW SEROLOGIC DIAGNOSTIC MARKER FOR THE DIAGNOSIS…
(approximately 80%), but its specificity is much higher, about 98%. Several assays have been developed to detect this class of auto-antibodies, which are termed anti-cyclic citrrulinated peptides (CCP) antibodies because the most sensitive test is based upon CCP5. Indeed it has been found that IgM-RF is often found in the same patients, but with much lower specificity for RA. Additionally, Anti-CCP antibodies may pre-date arthritis by several years6. Although citrulline is a common metabolite present throughout the human body, it is a non-standard amino acid, which means that it can not be incorporated into peptide during protein synthesis7. Citrulline-containing peptide can only be generated through post-translational modification of arginine residues, a reaction that is catalysed by peptidylarginine deiminase (PAD) enzymes7. It is possible that environmental factors may locally induce abnormal cell death or disturb the clearance of apoptotic cells. Subsequently, citrullinated protein fragments may be presented to the immune system. A primary and specific immune response will then develop. The resulting auto-antibodies will recognize epitopes on apoptotic cells that express auto-antigenic molecules at the cell surface, and such opsonized apoptotic cells will generate further pro-inflammatory responses 8.
METHODS This case-control study comprised 90 Iraqi patients, 17(18.9%) males and 73(81.1%) females were diagnosed on the basis of clinical and laboratory ground to be with RA and satisfying at least 4 of 7 of the revised criteria for RA diagnosis which were defined by the American College of Rheumatology 19879. They were attending or admitted to Rizgari Teaching Hospital between November 2008 and November 2009. The mean age of total 90 patients was 44.291.24 and their ages ranged from 19 to 72 years with disease duration ranged between 2 months to 30 years. Also 30 healthy individuals as healthy control had been chosen from hospital medical staff. Exactly (61) from (90) RA patients and (27) from (30) HC subjects had been randomly selected to be tested for different immunological tests, which include the following tests: - Qualitative and semi-quantitative measurement of rheumatoid factor (RF) and C-reactive protein (CRP) by latex test. Quantitative measurement of anti-cyclic citrullinated peptide (CCP) antibodies and RF- immunoglobulin (M, G and A) isotypes by ELISA.Erythrocyte sedimentation rate (ESR). RESULTS
The females at a higher risk for RA with sex ratio (4:1). RF+ve patients were predominance 60(66.7%) vs. 30(33.3%) in RF-ve with (P<0.05)(Table1)
Table 1.Gender frequency of RF-latex test in RA patients
Gender
RA patients No.= 90 Total
No.=90
P value Chi–square
*P<0.05: Significant
Female No.=73
Male No.=17
No. % No. % No. %
Lat
ex
test
Seropositive 45 61.6 15 88.2 60 66.7
P< 0.05* Seronegative 28 38.4 2 11.8 30 33.3
Total 73 100 17 100 90 100
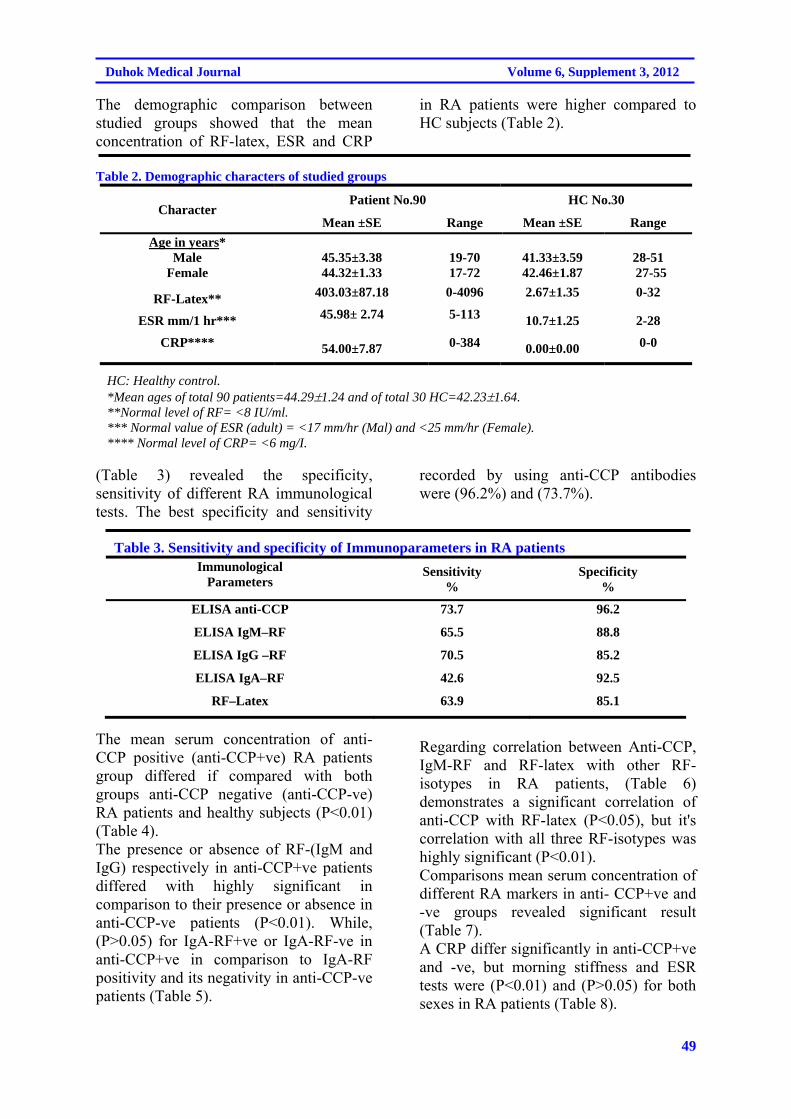
49
Duhok Medical Journal Volume 6, Supplement 3, 2012
The demographic comparison between studied groups showed that the mean concentration of RF-latex, ESR and CRP
in RA patients were higher compared to HC subjects (Table 2).
Table 2. Demographic characters of studied groups
HC No.30 Patient No.90 Character
Range Mean ±SE Range Mean ±SE
28-51 27-55
41.33±3.59 42.46±1.87
19-70 17-72
45.35±3.38 44.32±1.33
Age in years* Male
Female
0-32 2.67±1.35 0-4096 403.03±87.18 RF-Latex**
2-28 10.7±1.25 5-113 45.98± 2.74 ESR mm/1 hr***
0-0
0.00±0.00 0-384 54.00±7.87 CRP****
HC: Healthy control. *Mean ages of total 90 patients=44.291.24 and of total 30 HC=42.231.64. **Normal level of RF= <8 IU/ml. *** Normal value of ESR (adult) = <17 mm/hr (Mal) and <25 mm/hr (Female). **** Normal level of CRP= <6 mg/I.
(Table 3) revealed the specificity, sensitivity of different RA immunological tests. The best specificity and sensitivity
recorded by using anti-CCP antibodies were (96.2%) and (73.7%).
Table 3. Sensitivity and specificity of Immunoparameters in RA patients Immunological
Parameters Sensitivity
% Specificity
%
ELISA anti-CCP 73.7 96.2
ELISA IgM–RF 65.5 88.8
ELISA IgG –RF 70.5 85.2
ELISA IgA–RF 42.6 92.5
RF–Latex 63.9 85.1
The mean serum concentration of anti-CCP positive (anti-CCP+ve) RA patients group differed if compared with both groups anti-CCP negative (anti-CCP-ve) RA patients and healthy subjects (P<0.01) (Table 4). The presence or absence of RF-(IgM and IgG) respectively in anti-CCP+ve patients differed with highly significant in comparison to their presence or absence in anti-CCP-ve patients (P<0.01). While, (P>0.05) for IgA-RF+ve or IgA-RF-ve in anti-CCP+ve in comparison to IgA-RF positivity and its negativity in anti-CCP-ve patients (Table 5).
Regarding correlation between Anti-CCP, IgM-RF and RF-latex with other RF- isotypes in RA patients, (Table 6) demonstrates a significant correlation of anti-CCP with RF-latex (P<0.05), but it's correlation with all three RF-isotypes was highly significant (P<0.01). Comparisons mean serum concentration of different RA markers in anti- CCP+ve and -ve groups revealed significant result (Table 7). A CRP differ significantly in anti-CCP+ve and -ve, but morning stiffness and ESR tests were (P<0.01) and (P>0.05) for both sexes in RA patients (Table 8).
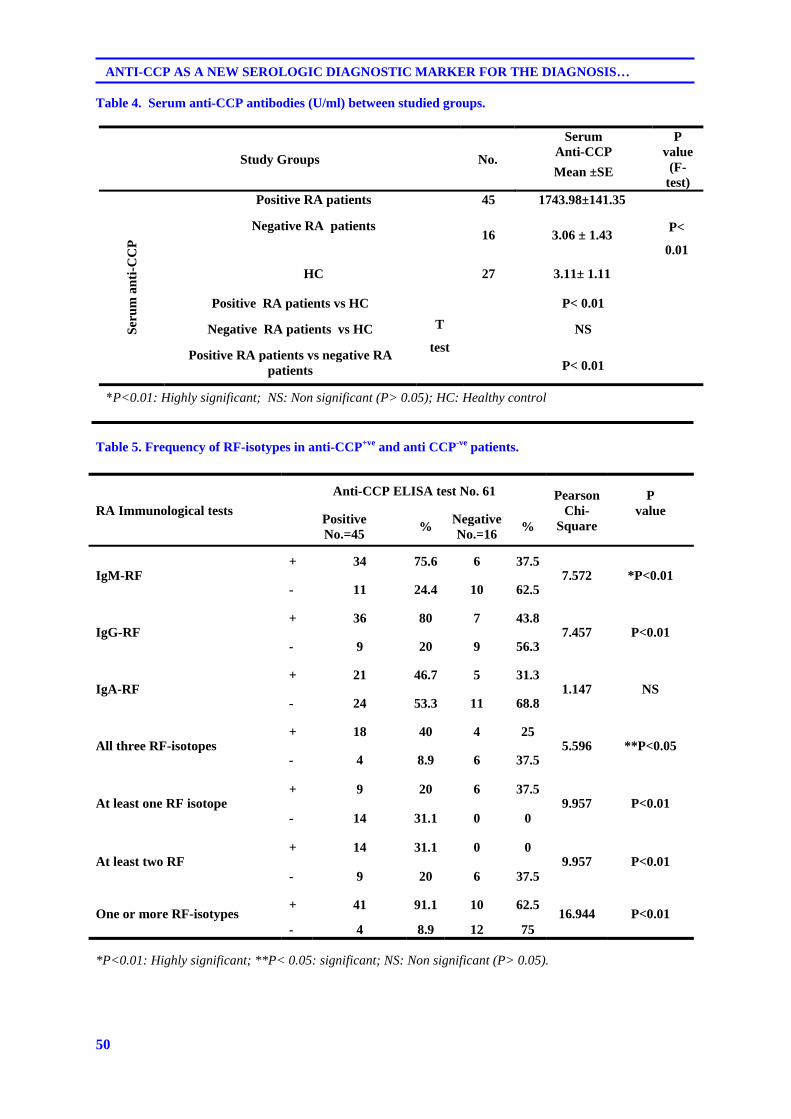
50
ANTI-CCP AS A NEW SEROLOGIC DIAGNOSTIC MARKER FOR THE DIAGNOSIS…
Table 4. Serum anti-CCP antibodies (U/ml) between studied groups.
Study Groups No.
Serum Anti-CCP
P value
(F-test)
Mean ±SE
Ser
um
an
ti-C
CP
Positive RA patients 45 1743.98±141.35
P<
0.01
Negative RA patients 16 3.06 ± 1.43
HC 27 3.11± 1.11
Positive RA patients vs HC
T
test
P< 0.01
Negative RA patients vs HC NS
Positive RA patients vs negative RA patients P< 0.01
*P<0.01: Highly significant; NS: Non significant (P> 0.05); HC: Healthy control
Table 5. Frequency of RF-isotypes in anti-CCP+ve and anti CCP-ve patients.
RA Immunological tests
Anti-CCP ELISA test No. 61 Pearson Chi-
Square
P value
Positive No.=45
% Negative No.=16
%
IgM-RF + 34 75.6 6 37.5
7.572 *P<0.01 - 11 24.4 10 62.5
IgG-RF + 36 80 7 43.8
7.457 P<0.01 - 9 20 9 56.3
IgA-RF + 21 46.7 5 31.3
1.147 NS - 24 53.3 11 68.8
All three RF-isotopes + 18 40 4 25
5.596 **P<0.05 - 4 8.9 6 37.5
At least one RF isotope + 9 20 6 37.5
9.957 P<0.01 - 14 31.1 0 0
At least two RF + 14 31.1 0 0
9.957 P<0.01 - 9 20 6 37.5
One or more RF-isotypes + 41 91.1 10 62.5
16.944 P<0.01 - 4 8.9 12 75
*P<0.01: Highly significant; **P< 0.05: significant; NS: Non significant (P> 0.05).
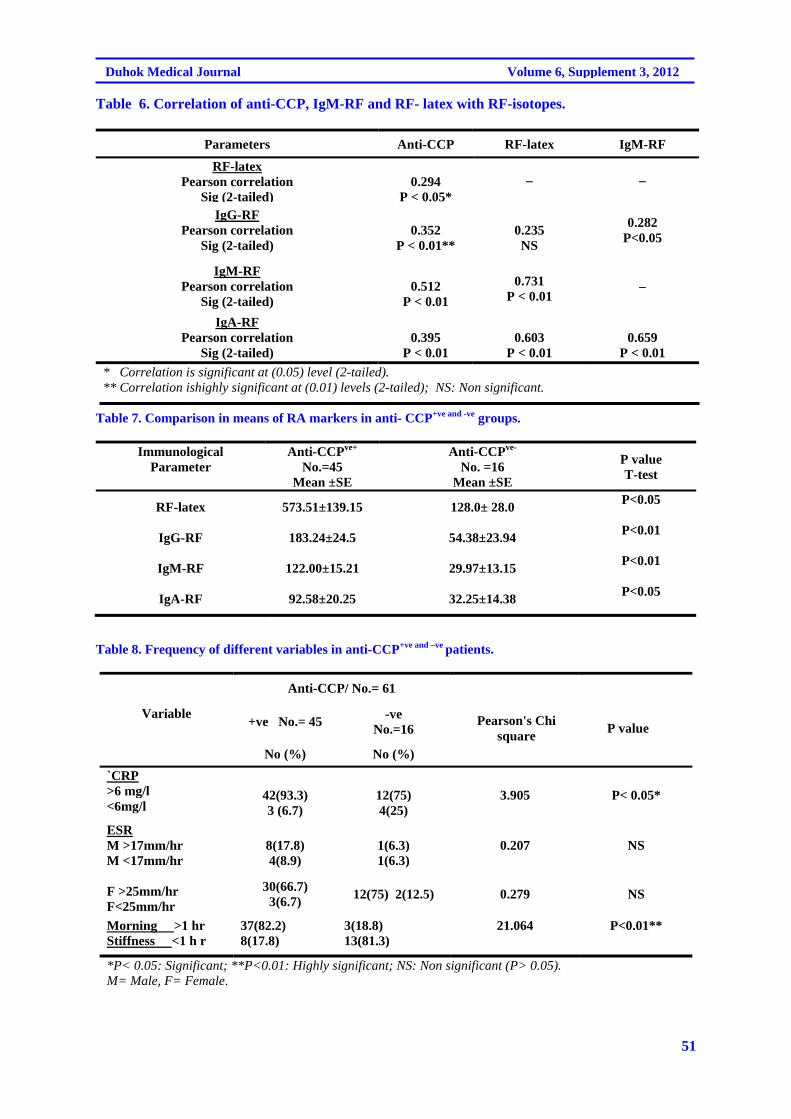
51
Duhok Medical Journal Volume 6, Supplement 3, 2012
Table 6. Correlation of anti-CCP, IgM-RF and RF- latex with RF-isotopes.
Parameters Anti-CCP RF-latex IgM-RF
RF-latex Pearson correlation
Sig (2-tailed)
0.294
P < 0.05*– –
IgG-RF Pearson correlation
Sig (2-tailed)
0.352
P < 0.01**
0.235 NS
0.282 P<0.05
IgM-RF Pearson correlation
Sig (2-tailed)
0.512
P < 0.01
0.731
P < 0.01 –
IgA-RF Pearson correlation
Sig (2-tailed)
0.395
P < 0.01
0.603
P < 0.01
0.659
P < 0.01
* Correlation is significant at (0.05) level (2-tailed). ** Correlation ishighly significant at (0.01) levels (2-tailed); NS: Non significant.
Table 7. Comparison in means of RA markers in anti- CCP+ve and -ve groups.
Immunological Parameter
Anti-CCPve+ No.=45
Mean ±SE
Anti-CCPve- No. =16
Mean ±SE
P value T-test
RF-latex 573.51±139.15 128.0± 28.0 P<0.05
IgG-RF 183.24±24.5 54.38±23.94 P<0.01
IgM-RF 122.00±15.21 29.97±13.15 P<0.01
IgA-RF 92.58±20.25 32.25±14.38 P<0.05
Table 8. Frequency of different variables in anti-CCP+ve and –ve patients.
Variable
Anti-CCP/ No.= 61
Pearson's Chi square
P value +ve No.= 45
-ve No.=16
No (%) No (%)
`CRP >6 mg/l <6mg/l
42(93.3) 3 (6.7)
12(75) 4(25)
3.905 P< 0.05*
ESR M >17mm/hr M <17mm/hr F >25mm/hr F<25mm/hr
8(17.8) 4(8.9)
1(6.3) 1(6.3)
0.207
NS
30(66.7) 3(6.7)
12(75) 2(12.5) 0.279 NS
Morning >1 hr Stiffness <1 h r
37(82.2) 8(17.8)
3(18.8) 13(81.3)
21.064 P<0.01**
*P< 0.05: Significant; **P<0.01: Highly significant; NS: Non significant (P> 0.05). M= Male, F= Female.
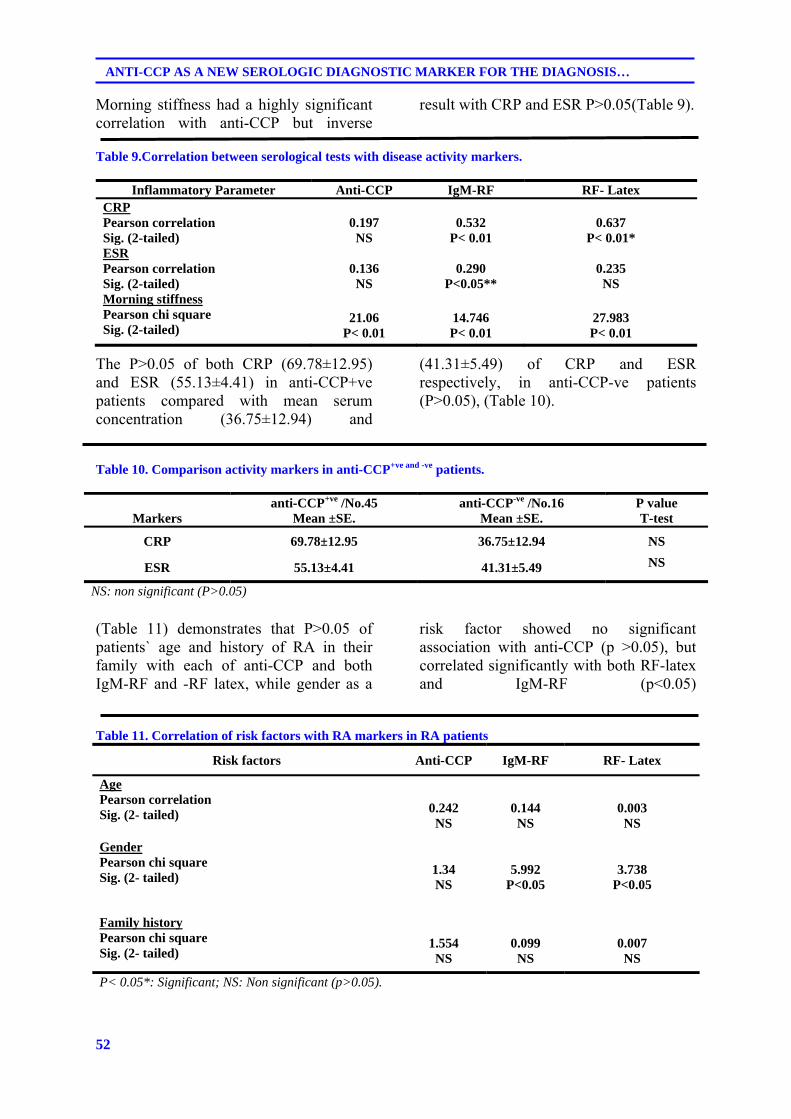
52
ANTI-CCP AS A NEW SEROLOGIC DIAGNOSTIC MARKER FOR THE DIAGNOSIS…
Morning stiffness had a highly significant correlation with anti-CCP but inverse
result with CRP and ESR P>0.05(Table 9).
Table 9.Correlation between serological tests with disease activity markers.
Inflammatory Parameter Anti-CCP IgM-RF RF- Latex CRP Pearson correlation Sig. (2-tailed)
0.197 NS
0.532
P< 0.01
0.637
P< 0.01* ESR Pearson correlation Sig. (2-tailed)
0.136 NS
0.290
P<0.05**
0.235 NS
Morning stiffness Pearson chi square Sig. (2-tailed)
21.06
P< 0.01
14.746 P< 0.01
27.983 P< 0.01
The P>0.05 of both CRP (69.78±12.95) and ESR (55.13±4.41) in anti-CCP+ve patients compared with mean serum concentration (36.75±12.94) and
(41.31±5.49) of CRP and ESR respectively, in anti-CCP-ve patients (P>0.05), (Table 10).
Table 10. Comparison activity markers in anti-CCP+ve and -ve patients.
Markers
anti-CCP+ve /No.45 Mean ±SE.
anti-CCP-ve /No.16 Mean ±SE.
P value T-test
CRP 69.78±12.95 36.75±12.94 NS
ESR 55.13±4.41 41.31±5.49 NS
NS: non significant (P>0.05)
(Table 11) demonstrates that P>0.05 of patients` age and history of RA in their family with each of anti-CCP and both IgM-RF and -RF latex, while gender as a
risk factor showed no significant association with anti-CCP (p >0.05), but correlated significantly with both RF-latex and IgM-RF (p<0.05)
Table 11. Correlation of risk factors with RA markers in RA patients
Risk factors Anti-CCP IgM-RF RF- Latex
Age Pearson correlation Sig. (2- tailed)
0.242 NS
0.144 NS
0.003 NS
Gender Pearson chi square Sig. (2- tailed)
1.34 NS
5.992 P<0.05
3.738 P<0.05
Family history Pearson chi square Sig. (2- tailed)
1.554 NS
0.099 NS
0.007 NS
P< 0.05*: Significant; NS: Non significant (p>0.05).
53
Duhok Medical Journal Volume 6, Supplement 3, 2012
DISCUSSION It is generally accepted that the distribution of RA is usually predominant in women. Current data verified this concept as 73(81.1%) of patients were female and 17(18.9%) were male, P<0.01 with female to male ratio (4:1). Similar results were recorded in Iraq/ Baghdad city (4.5:1) and in Hawler city (5:1) 10,11 respectively. Indeed, out of 90 patients with RA 60(66.7%) were seropositive and 30(33.3%) were seronegative with (P<0.05), (Table 1). Hormonal factors like estrogen and progesterone could potentially explain some of the gender effect. Estrogen might have detrimental effects through its ability to decrease apoptosis of B cells, potentially permitting the selection of auto-reactive clones. Hormones also have a complex influence on the balance of T-cell subsets with distinct cytokine profiles12. In the present study the mean age of total 90 patients was 44.291.24, (Table 2). These results somewhat agree with previous studies done in Iraq 10-13, 42±11.3, 44.8±10.2 and 43.97 respectively. Elevation of ESR and the CRP are frequent in RA. In aggressive or explosive disease, ESR may even approach 100 mm/h but CRP is considered by many rheumatologists to be a more sensitive indicator of inflammation and might be increased in circumstances in which the ESR is either normal or minimally elevated14 (Table 2). The best sensitivity in the present study was obtained by anti-CCP antibodies (73.7%) (Table 3) this is nearly agreed with results of other studies which are 70%, 72.3% and 72.8%14 and 16. This level of sensitivity for anti-CCP antibodies test implies that the test can be successfully applied for the majority of RA patients. However, the results of several experiments indicate that the antibody response to citrullinated epitopes is strongly polyclonal17. By increasing the number of citrullinated epitopes that are
presented in the anti-CCP test, it should be possible to increase the sensitivity of the assay 5. RF-IgM in our result showed moderate specificity 88.8% which was not high as that found for anti-CCP test. The result of this study is consistent with percentage of other studies 84.6% and 86.4%1,18, but not supported result of other studies 100%, 82.1% and 69%13; 19,20. The variability in the sensitivity and specificity among different studies may relate to slightly different cut-off points for positivity, differences in disease duration, severity and other clinical characteristics of there groups being tested. It can also explain by differences in patients' selection and study designs 21. Current study revealed highly P<0.01 of anti-CCP concentration in anti-CCP+ve RA patients when compared with anti-CCP-ve patients and HC, (Table 4). Currents results agree with results that obtained by Skaik, 20. Although only a few studies have analyzed the relationship between anti-CCP antibody concentration and the patient’s progress, antibody concentrations are probably important for prognostic and therapeutic reasons, because high anti-CCP concentrations on diagnosis have been shown to predict a more severe course of the disease 22. According to the results of present study, patients who were anti-CCP+ve found to show higher frequency for RF-isotypes than those with anti-CCP-ve except RF-IgA (Table 5). Although the presence of these isotopyes in SLE indicated that RF is not specific for RA, but suggested more central role for RF in RA disorder because RF-seropositive RA patients had significantly greater concentrations of all classes of RF compared to RF seropositive SLE23. Current study revealed a significant correlation between anti-CCP and RF- isotypes (P<0.01) (Table 6). The same significant association results between anti-CCP, and RF isotypes present was found with Bizzaro et al 24 who showed such association between anti-CCP and all RF-isotypes.
54
ANTI-CCP AS A NEW SEROLOGIC DIAGNOSTIC MARKER FOR THE DIAGNOSIS…
This provided an additional diagnostic value of anti-CCP since it confirmed the presence of RA in those patients in whom the presence of the disease was uncertain or they were suspected to have RA, once again because of high anti-CCP specificity for this disease. Evidence has suggested that RF and anti-CCP antibodies are two separate auto-antibodies. Data from De Rycke et al, 25 indicate that the RF and anti-CCP antibodies may provide different and eventually, complementary biological information on the disease process in RA. The anti-CCP could act as a disease specific marker for RA, whereas RF titers could be related to disease activity 25. In contrast to anti-CCP, RF-IgM showed a significant relation with ESR (P<0.05) and highly significant relation was found between both RF-latex and RF-IgM with CRP (P<0.01) (Table 6). Also, (Table 7) demonstrated no significant difference between anti-CCP+ve and anti-CCP-ve in CRP and ESR (P>0.05). The same result was obtained by Lee et al, 26. Numerous considerations could explain the lack of correlation between anti-CCP titer and other disease parameters like ESR or CRP or with age (Table 8) including auto-antibody isotype profile, autoantibody glycosylation state 27 or the subset of anti-citrulline autoantibodies captured in the commercial anti-CCP ELISA assays. This observation underscores the complexity of pathogenic processes in RA and the continued need for research into the role of auto-antibodies in this disease 26. Interestingly, ESR test does not agree with the other disease activity markers that measured in current study such as CRP, morning stiffness that result of each one supported result of the other one as all of these tests showed significant difference in comparison to their presence or absence in positive and negative results for anti-CCP, (Table 8). Numerous considerations could explain the lack of correlation between anti-CCP titer and other disease parameters like ESR or CRP or with age
(Table 9) including auto-antibody isotype profile, autoantibody glycosylation state 27 or the subset of anti-citrulline autoantibodies captured in the commercial anti-CCP ELISA assays. This observation underscores the complexity of pathogenic processes in RA and the continued need for research into the role of auto-antibodies in this disease 26 .Also, (Table 10) demonstrated no significant difference between anti-CCP+ve and anti-CCP-ve in CRP and ESR (P>0.05). The same results were obtained by Lee et al, 26.Anti-CCP showed no correlation with age, gender and family history of patients group. Both RF-latex and RF-IgM showed same results except that for gender, (Table 11). Such results reported by many 15,20,26 . In addition to what mentioned above result of current study regarding age could be explain that the disease can be occur at any age because no age is protect from the disease , while hormonal variation may affect on auto-antibodies production especially in the presence of certain shared epitope. Further genetic studies required to found out any genetic risk factor in patients with family history.
REFERENCES
1. Von Roenn JH, Paice JA , Preodor
ME. Current diagnosis and treatment of pain. USA:Lunge medical book/ McGraw-Hill Companies;2006.p. 215-9.
2. Paget SA, Lockshin MD , Loebl S. The Hospital for Special Surgery; Rheumatoid Arthritis. Handbook. Canada: Published by John Wiley and Sons Inc;2002.p. 33-60.
3. Van Boekel MA, Vossenaar ER, van den Hoogen FH, van Venrooij WJ. Autoantibody systems in rheumatoid arthritis: specificity, sensitivity and diagnostic value. Arthritis Res.2002; 4(2):87-93.
4. Koivula M, Aman S, Karjalainen A, Hakala M, Risteli J . Are there auto-antibodies reacting against
55
Duhok Medical Journal Volume 6, Supplement 3, 2012
citrullinated peptides derived from type I and type II collagens in patients with rheumatoid arthritis?. Ann Rheum Dis.2005; 64(10): 1443-50.
5. Pruijn GJ,Vossenaar ER, Drijfhout JW, van Venrooij1WJ , Zendman AJ. Anti-CCP Antibody Detection Facilitates Early Diagnosis and Prognosis ofRheumatoid Arthritis. Current Rheumatology Reviews.2005; 1(1): 1-7.
6. Rantapää-Dahlqvist S, de Jong BA, Berglin E, Hallmans G, Wadell G, Stenlund H, et al . Antibodies against cyclic citrullinated peptide and IgA rheumatoid factor predict the development of rheumatoid arthritis. Arthritis Rheum.2003; 48(10): 2741-9.
7. Vossenaar ER, Zendman AJ, van Venrooij WJ, Pruijn GJ . PAD a growing family of citrullinating enzymes. BioEssays.2003; 25(11):1106-18.
8. Van Venrooij WJ , Pruijn GJ . Citrullination: A small change for a protein great consequences for rheumatoid arthritis. Arthritis Res.2000; 2(4):249-51.
9. Arnett FC, Edworthy SM, Bloch DA, McShane DJ, Fries JF, Cooper NS ,et al . The American rheumatism association 1987 revised criteria for the classification of rheumatoid arthritis. Arthritis Rheum.1988; 31(3): 315-24.
10. Al-Baiatti AH. A study on the possible role of some micro-organism in rheumatoid arthritis. MSc thesis. College of Medicine. Univ Baghdad, Iraq;2004.
11. Abu-Baker DA. Prevalence of hand deformities and factors that influence it in patients with rheumatoid arthritis. MSc thesis. College of Medicine. Hawler Medical University, Iraq;2009.
12. Waldburger JM ,Firestein GS. In: Klippel JH, Stone JH, Crofford LJ and White PH editors. Primer on the Rheumatic Diseases. 13th ed. New York: Springer Science Business Media;2008.p. 123-31.
13. Abbas NR. Some immunological aspects in patients with rheumatoid arthritis. M Sc thesis. College of Medicine. Univ Baghdad, Iraq;2003.
14. South-Paul JE, Matheny SC , Lewis EL. Current diagnosis and treatment in family medicine. USA: McGraw-Hill Companies; 2004.p. 275-83.
15. Altun S, Caliskan R, Alionor Y, Aslan M, Saribas S, Artinyan E, et al . A new marker in rheumatoid arthritis-autoimmunity relation: Anti-cyclic citrullinated peptide antibody. Turk J Immunol.2004; 9: 21-6.
16. Abreu I, Laroche P, Bastos A, Issert V, Cruz M, Nero P, et al. Multiplexed immunoassay for detection of rheumatoid factors by FIDIS™ technology. Ann NY Acad Sci.2005; 1050: 357–63.
17. Schellekens GA, de Jong BA, van den Hoogen FH, van de Putte LB, van Venrooij WJ . Citrulline is an essential constituent of antigenic determinants recognized by rheumatoid arthritis-specific autoantibodies. J Clin Invest.1998; 101(1): 273-81.
18. Stropuviene S, Lapiniene G, Redaitiene E, Kirdaite G , Dadoniene J. Rheumatoid arthritis markers: Antibodies against citrullinated peptides. Acta Medica Lituanica.2005; 12 (3): 37-41.
19. Vallbracht I, Rieber J, Oppermann M, Förger F, Siebert U , Helmke K .Diagnostic and clinical value of anti-cyclic citrullinated peptide antibodies compared with rheumatoid factor isotypes in
56
ANTI-CCP AS A NEW SEROLOGIC DIAGNOSTIC MARKER FOR THE DIAGNOSIS…
rheumatoid arthritis. Ann Rheum Dis.2004; 63(9);1079-84.
20. Skaik BM. Comparison of Anti cyclic citrullinated protein serum levels with rheumatoid factor for the diagnosis of rheumatoid arthritis in Gaza strip. M.Sc. thesis. The Islamic University of Gaza, Palastiene;2008.
21. Niewold TB, Harrison MJ, Paget SA. Anti-CCP antibody testing as a diagnostic and prognostic tool in rheumatoid arthritis. QJM.2007; 100(4):193-201.
22. Sivhonen S, Korpela M, Mustila A, Mustonen J . The predictive value of rheumatoid factor isotypes, anti-cyclic citrullinated peptide antibodies, and antineutrophil cytoplasmic antibodies for mortality in patients with rheumatoid arthritis. J Rheumatol.2005; 32(11): 2089-94.
23. Pope RM, Yoshinoya S , McDuffy SJ . Detection of immune complexes and their relationship to rheumatoid factor in a variety of autoimmune disorders. Clin Exp Immunol.1981; 46(2): 259-67.
24. Bizzaro N, Mazzanti G, Tonutti E, Villalta D ,Tozzoli R . Diagnostic accuracy of the anti-citrulline antibody assay for rheumatoid arthritis. Clin Chem.2001; 47(6): 1089-93.
25. De Rycke L, Verhelst X, Kruithof E, Van den Bosch F, Hoffman IE, Veys EM,et al. Rheumatoid factor, but not anti-cyclic citrullinated peptide antibodies, is modulated by infliximab treatment in rheumatoid arthritis. Ann Rheum Dis.2005; 64(2): 299-302.
26. Lee DM, Phillips R, Hagan EM, Chibnik LB, Costenbader KH, Schur PH. Quantifying anti-cyclic citrullinated peptide titres: Clinical utility and association with tobacco exposure in patients with rheumatoid arthritis. Ann Rheum Dis.2009; 68(2): 201-8.
27. Parekh RB, Dwek RA, Sutton BJ, Fernandes DL, Leung A, Stanworth D, et al . Association of rheumatoid arthritis and primary osteoarthritis with changes in the glycosylation pattern of total serum IgG. Nature.1985;316(6027):452–7.
57
Duhok Medical Journal Volume 6, Supplement 3, 2012
ón‚íq@@@@
@ôäómòˆ†CCP@ô䆋Ùäb“ïånò†@üi@Žñíä@ô䆋Ùäb“ïånò†@ôàò@ôØóîóäb“ïä@íØòì@@ôàïmbàûŠ@õóàíu@ôäbØóï’ü‚óäçóîb‚‰ŽîŠ†@@
@@wäbàb÷Z@@ôäbØóàa‡åõ÷üØ@ìíàóè@óÜ@òìóåiò†@†í‚@ñ‹ Šói@ð’ím@óØ@óîóäbï’ü‚óä@óÜ@çóîb‚‰ŽîŠ†@ôàïmbàûŠ@õóàíu@ð䆋Øìóè@ð’ü‚óä•óÜ@N@@@@@@@@@b‚‰ŽîŠ†@ôàïmbàûŠ@õóàíu@ôäbØó䆋Øìóè@õóiŠûŒ@ßó óÜ@òŠbî†bä@ðäìíi@o슆@õŠbØüè@óØóØóï’ü‚óä@òì@çóî@N@@ôäómòˆ†
Anti-CCP@@@@@óîóè@õŒŠói@ôØóïî‡äó¸ójîbm@òì@Lçóîb‚‰ŽîŠ†@ôàïmbàûŠ@õóàíu@ð䆋Øìóè@ð’ü‚óä@ô䆋ÙîŠbî†@üi@ò†ìíói@N@@ãó÷@@@@@@@@@òì@çóØò†@ñŠbî†@óØóï’ü‚óä@ôØýbš@ñóäbº‹ @óØ@ð’ü‚óä@õ‹m@õŠûŒ@ôØóîóÜóàüØ@ô䆋ÙîŠbî†@üi@oŽî†ŠbØói@bèòìŠóè@óäbäóm@òˆ†
bî†@üi@oŽî†ŠbØói@@@@@@@@ç‹ ò†Šòì@Žïèói@õììŒ@õŠóòŠbš@óÜ@†ìí@õóäaìó÷@ô䆋ÙîŠbî†@ì@LóØóï’ü‚óä@ôäbØóïî‡äóàòŠòŒ@ô䆋ÙîŠ@N@@ãó÷ô䆋Ø@çb“ånò†@õbèói@ô䆋ÙîŠbî†@üi@òìaŠ†@ãb−ó÷@òìóåîím Anti-CCP@@@ôàïmbàûŠ@õóàíu@ð䆋Øìóè@ð’ü‚óä@@üi
çóîb‚‰ŽîŠ†N@@bŽîŠ@ôåïÜíØóÄZ@Š‡àb−ó÷@òìóåîím@ãó÷@ŠóóÜ@aI90@H@óØ@çóîb‚‰ŽîŠ†@ôàïmbàûŠ@õóàíu@ô䆋Øìóè@ð’ü‚óä[email protected]@HE@ì@‹Žïä@æà[email protected]@HE@@@•óäaìó÷@ßó óÜ@ìíi†‹Ø@çbî@ñŠb ŒŠ@õóäbƒ’ü‚óä@ôäa†Šó@óØ@õóäaìó÷@çìíi@Žðà30@@@@@@@óÜ@çìa Šòì@”î@Ïb@ðóØ
@ôàòìì†@ôåî“m@ôäbà@õòìbà@çaíŽïä2008@@@ôàòìì†@ôåî‹“m@ôäbà@bm2009@N@@@Ûòì@çìa Šòì@õóäaŠónïàaŠbq@ìó÷@Z@@ÙŽïmýRF@L@çbØòŠìí@óØû‹‚@ôån“ïä@õò‰ŽîŠE.S.R.@@ìCRP@N@@@@Šóè@ŠóóÜ@ðîóïÔbm@õòìóåîím90@@@ì@•ü‚óä30@@@@@ói@aŠ‡àb−ó÷@óØóÌb
@õóŽîŠ(ELISA)@@ôäómòˆ†@ô䆋ÙîŠbî†@üiCCP@@ìRF-IgM, RF-IgG and RF-IgAN@@ãb−ó÷Z@@óÜI90@H@õóàíu@ð’ü‚óä@çóîb‚‰ŽîŠ†@ôàïmbàûŠ[email protected]@HE@@@@@@@@ói@pòŠbióòì@Lìíi@ÆïmòŒüq@ÙŽïmý@ôåïåÙ“q@óäaìóÜ
@@@ôäómòˆ†@õŠbïnóè@ì@ñ‡äó¸ójîbm@óØ@pìóØŠò†@çbàüi@çóîb‚‰ŽîŠ†@ôàïmbàûŠ@õóàíu@ð’ü‚óä@ôàò@õóäb“ïäCCP@ @(96.2٪)ì (73.7٪).@Ü@óîóè@Âä‹ @ì@òŠìó @ôØóî‡äòíîóq@óØ@o²Šò†@óØóäómòˆ†@ì@@@@ì@ÙŽïmý@ôåïåÙ“q@ßó óisotypes RF@
Ûóî@õaì†óÜ@ÛóîN@@@@@@ð‚‹ä@óÜ@óîóè@õìóåÈóà@ôØóïîŒaìbïu@óØ@a‹åïi@óäbàó÷@ñaŠòŠó(P <0.05)@@@@@@@ôäómòˆ†@üi@ãò@õ‹š@óÜCCP @@@@@óÜ@ÆïmòŒüq
@@ßó óÜ@õ‡äòíîóq@ói@ÆïmóŽïä@ßó óÜ@•ü‚óäRF-(latex and IgA) @ @@@@@@ð‚‹ä@óØ@a‹Ø@ôåïjŽïm@òìP <0.01 @@@@@@@@ói@pòŠbióRF-(IgM and IgG).N@@
@ãb−òŠò†Z@@ôäóm@òˆ†CCP@çóîb‚‰ŽîŠ†@ôàïmbàûŠ@õóàíu@ðü‚óä@ô䆋Ùäb“ïånò†@ômójîbm@ôØóîóäb“ïä@ói@oŽî‹äò†a†N@@@@
58
ANTI-CCP AS A NEW SEROLOGIC DIAGNOSTIC MARKER FOR THE DIAGNOSIS…
ó–þ©a@ @@ò†b›àCCP @ðäbïq‹Üa@Þ–bѾa@ôš‹à@˜ïƒ“nÜ@ò‡î‡u@˜ïƒ“m@Þ—à@óàþÉØ@@
@@
Ó‡aì@óïÑÝ©aZ@@ðäbïq‹Üa@Þ–bѾa@lbénÜa@Êà@kjÜa@Óì‹Éà@Ì@‹à@íèì@Lâ§a@óáÅäa@kï—m@Üa@óïma‰Üa@óÈbå¾a@a‹àýa@æà@íèóåà¾a@ Þ–bѾa@ lbénÜa@ N@ Šbjn‚aAnti-CCP@ @óïÜbÈ@ óï–í—‚@ Êà@ Lðäbïq‹Üa@ Þ–bѾa@ lbénÜa@˜ï¦@À@™b‚@ ÞÙ“i@ ‡ïÑà@ N@ë‰è
c@Þána@æà@æî‰Üa@ôš‹¾a@æà@óïÈ‹Ð@óÈíáª@†‡¥@b›îc@ò†b›¾a@ãbuÿaâéî‡Ü@òjØ@‹¾a@Ãb“ä@çíÙî@ç@N@Š‹›Üa@æà@‡îà@†‡±ìñíÕÜa@xþÉÜbi@jÙnÜa@æà@çì‡ïÑnï@æî‰Üa@†‡±ì@L‹áÝÜ@N@ò†b›¾@óï—nÜa@óáïÕÜa@âïïÕnÜ@óaŠ‡Üa@ë‰è@oî‹uc@‡ÔìCCP@@@ôš‹¾
ðäbïq‹Üa@Þ–bѾa@lbénÜa@N@@
szjÜa@׋Z@ôÝÈ@óaŠ‡Üa@ë‰è@oî‹ucI90@H‹Üa@Þ–bѾa@lbénÜa@ôš‹à@ðäbï[email protected]@HE@ì@Ší؉Üa@æà[email protected]@HE@æà@Ltbäfia@æà@ b›îa@szjÜa@ßìbåmì@ðáïÝÉnÜa@õŠbØŒŠ@ôÑ“nà@ aíÝ‚†@æî‰Üa@ôš‹¾a30@@ðäbrÜa@æî‹“m@òÐ@μi@ bzïz–@b—ƒ’2008@@æî‹“m@ôny
@ðäbrÜa2009@NÙmþÜa@Þrà@pbáÝɾa@oäbØì@M@RF@@öa‹á¨a@ã‡Üa@pbî‹Ø@kï‹m@߇Éà@LE.S.R.@@LCRP@ßa@ôÝÈ@oî‹ua@L90@@aßaì30@|ïz—Üa@ N@ ó–b¾a@ †aí¾a@ óîbÕà@Âjm‹¾a@ðÈbå¾a@ âîäý@ óaŠ‡Üa@pbÈíáª@ Šbjn‚a@(ELISA) ÞÜ@ ò†b›¾aCCPL RF-
IgM, RF-IgG and RF-IgA.N@@
w÷bnåÜaZ@ßa@æàI90@ H@çbØ@ðäbïq‹Üa@Þ–bѾa@ôš‹à@æà@ b›î‹à[email protected]@ HEïÐì@ Lkuíà@ÙmþÜa@ Šbjn‚a@ @ âéåà@pbàþÉÜbi@ÒÝÉnî@ bá@bénÝv@Üa@óïbyì@óï–í—‚@Þ›Ðc@çc@μjm@Lðäbïq‹Üa@Þ–bѾa@ôš‹¾@óïÝ—¾aanti-CCP @(96.2٪) ì (73.7٪). @p‹éÄcì
@Šbjn‚þÜ@ò†b›¾aCCP @Êà@óîbÍÝÜ@ãbèì@jØ@ÃbjmŠaRF-ì@ÙmþÜa isotypes RF- ðÜaínÜa@ôÝÈN@@
óîíåÉà@×ì‹Ð@†íuì@ÆyíÜ@LÚ܈@ôÝÈ@òìþÈì (P <0.05) @μi@Þ—¾a@ïØ‹m@À @ÞÜ@ò†b›¾aCCP @@ò†b›¾a@μiì@ôš‹áÝÜ@ðib°ýa@Êà@óÔþÉÜbi@óïjÝÜaRF-(latex and IgA) @ @ÆyíÜìP <0.01 @@@@@çd“iRF-(IgM and IgG). @N@@
xbnånýa :@@@ò†b›à@nÉmCCP @ðäbïq‹Üa@Þ–bѾa@‹à@˜ïƒ“m@À@ó–b‚@óàþÈN@@
59
Duhok Medical Journal Volume 6, Supplement 3, 2012
IMMUNOREGULATORY EFFECT OF LACTOBACILLI IN MACROPHAGES CELL LINE J744.1
SAEED A.
HECZKO B.P Submitted 18 Jun 2012; accepted 3 Sep 2012 ABSTRACT Ten Lactobacilli which showed high antagonistic activity against oral pathogen were selected among 111 lactobacillus strains and their immunomodulating effect was studied in both naïve and lipopolysaccharied induced murine macrophage cell line J774.1. Lactobacilli showed significant differences in the profile of released cytokines among the strains. All Lactobacillus strains exhibited TNF-α/ IL-10 ratio above 24:1, while one strain Lactobacillus acidophilus (K44/3) exhibited high ratio which was 110:1 indicating that this strain is the strongest for stimulating of pro-inflammatory cytokines.
Duhok Med J 2012; 6 Suppl 3:59-66. Key words: Lactobacilli, immunoregulation, macrophages
he genus Lactobacilli is a heterogeneous group of
microorganisms comprising more than 70 species and subspecies with a broad ecological distribution 1. Lactobacilli are one of the main constituents of the normal indigenous flora of humans, especially in the oral cavity, the female genital tract and the digestive tract, where they contribute to health 2,3 . Lactobacilli have long been used in the preparation of the fermented foods, in which form also they contribute to health 4. Evidence from clinical and animal studies has supported the idea that Lactobacilli, especially some selected strains, can modify immune responses of the host 5. However, the mechanisms by which Lactobacilli alter the immunological responses are unclear. Macrophages are tissue – based phagocytes derived from monocytes. They participate in both innate and adaptive immune responses 6,7. Macrphages are activated by microbial metabolites such as Lipopolysaccharide (LPS), molecules such as CD40 ligands and by T cell cytokines such as interferon –γ (IFN- γ). Activated macrophages phagocytose microorganisms; secrete proinflammatory
cytokines and present antigens to helper T cells. Many of these activities are mediated through the release of different cytokines. Therefore, a change in profile of macrophages –derived cytokines can skew toward either humoral (Th1 cells activation) and cell mediated immune responses (Th2 cells activation). Recently researchers found that Bifidobacteria stimulate the production of macrophages-derived cytokines in a strain dependent manner 8. The purpose of this paper was to study the ability of Lactobacilli to induce cytokines secretion by macrophages cell line J774.1. METHODS
Bacterial Strains Ten Lactobacillus strains were selected, Lactobacillus rhamnosus (31), Lactobacillus fermentum (19), Lactobacillus rhamnosus (7/1), Lactobacillus rhamnosus (37/1), Lactobacillus rhamnosus (38/1), Lactobacillus plantarum (K5), Lactobacillus acidophilus (K44/1), Lactobacillus rhamnosus (GG),
*Faculty of Veterinary Medicine/Duhok University. * *Department of Microbiology, College of Medicine, Jagiellonain University, Cracow, Poland Corresponding author: Saeed A Email:[email protected].
T
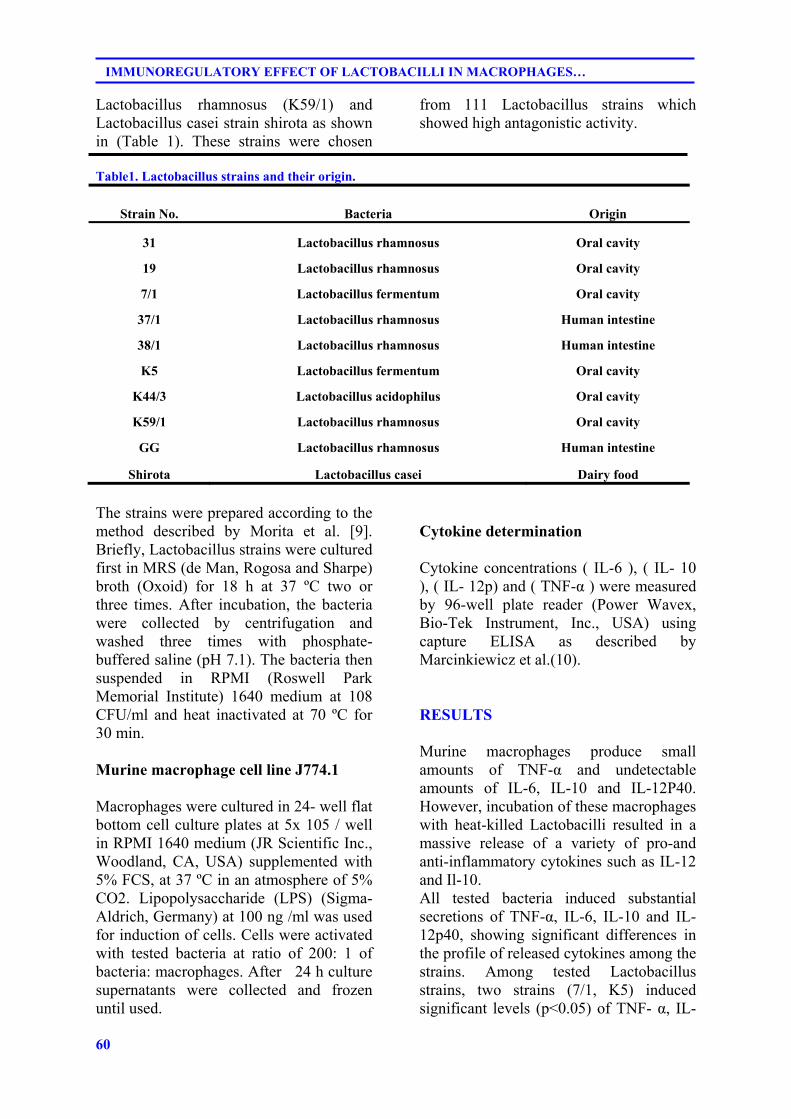
60
IMMUNOREGULATORY EFFECT OF LACTOBACILLI IN MACROPHAGES…
Lactobacillus rhamnosus (K59/1) and Lactobacillus casei strain shirota as shown in (Table 1). These strains were chosen
from 111 Lactobacillus strains which showed high antagonistic activity.
Table1. Lactobacillus strains and their origin.
Strain No. Bacteria Origin
31 Lactobacillus rhamnosus Oral cavity
19 Lactobacillus rhamnosus Oral cavity
7/1 Lactobacillus fermentum Oral cavity
37/1 Lactobacillus rhamnosus Human intestine
38/1 Lactobacillus rhamnosus Human intestine
K5 Lactobacillus fermentum Oral cavity
K44/3 Lactobacillus acidophilus Oral cavity
K59/1 Lactobacillus rhamnosus Oral cavity
GG Lactobacillus rhamnosus Human intestine
Shirota Lactobacillus casei Dairy food
The strains were prepared according to the method described by Morita et al. [9]. Briefly, Lactobacillus strains were cultured first in MRS (de Man, Rogosa and Sharpe) broth (Oxoid) for 18 h at 37 ºС two or three times. After incubation, the bacteria were collected by centrifugation and washed three times with phosphate-buffered saline (pH 7.1). The bacteria then suspended in RPMI (Roswell Park Memorial Institute) 1640 medium at 108 CFU/ml and heat inactivated at 70 ºС for 30 min. Murine macrophage cell line J774.1 Macrophages were cultured in 24- well flat bottom cell culture plates at 5x 10⁵ / well in RPMI 1640 medium (JR Scientific Inc., Woodland, CA, USA) supplemented with 5% FCS, at 37 ºС in an atmosphere of 5% CO2. Lipopolysaccharide (LPS) (Sigma- Aldrich, Germany) at 100 ng /ml was used for induction of cells. Cells were activated with tested bacteria at ratio of 200: 1 of bacteria: macrophages. After 24 h culture supernatants were collected and frozen until used.
Cytokine determination Cytokine concentrations ( IL-6 ), ( IL- 10 ), ( IL- 12p) and ( TNF-α ) were measured by 96-well plate reader (Power Wavex, Bio-Tek Instrument, Inc., USA) using capture ELISA as described by Marcinkiewicz et al.(10). RESULTS
Murine macrophages produce small amounts of TNF-α and undetectable amounts of IL-6, IL-10 and IL-12P40. However, incubation of these macrophages with heat-killed Lactobacilli resulted in a massive release of a variety of pro-and anti-inflammatory cytokines such as IL-12 and Il-10. All tested bacteria induced substantial secretions of TNF-α, IL-6, IL-10 and IL-12p40, showing significant differences in the profile of released cytokines among the strains. Among tested Lactobacillus strains, two strains (7/1, K5) induced significant levels (p<0.05) of TNF- α, IL-
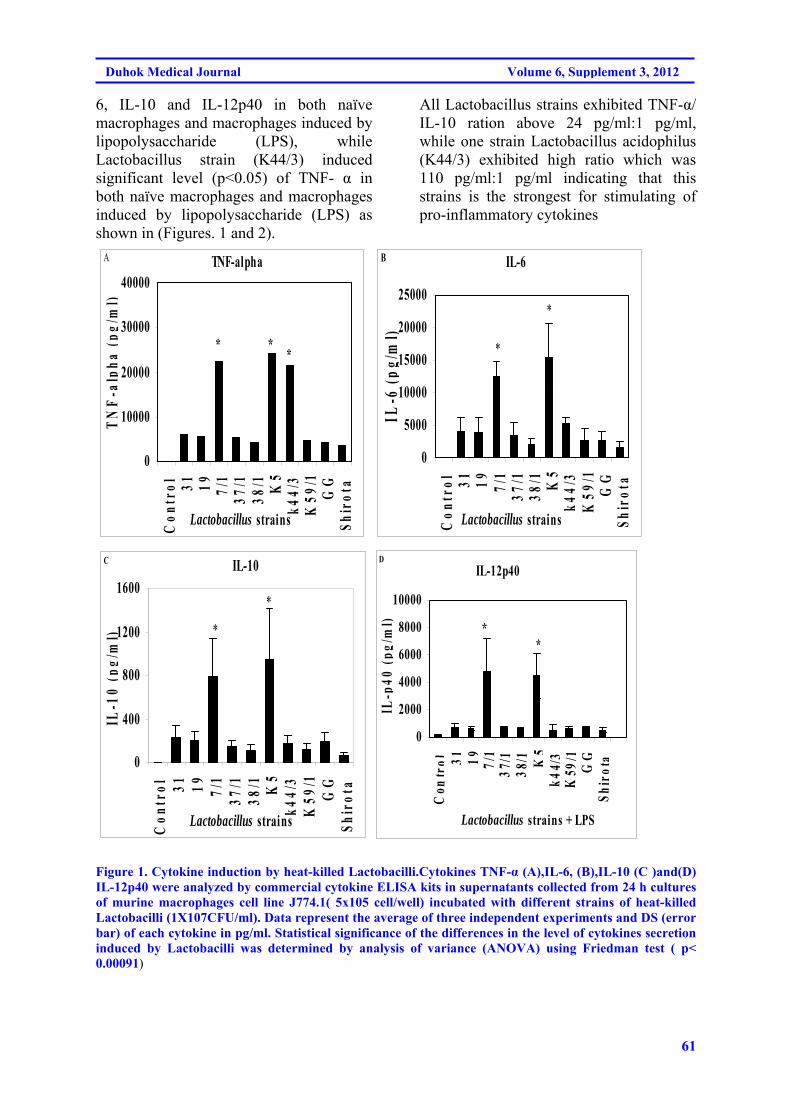
61
Duhok Medical Journal Volume 6, Supplement 3, 2012
6, IL-10 and IL-12p40 in both naïve macrophages and macrophages induced by lipopolysaccharide (LPS), while Lactobacillus strain (K44/3) induced significant level (p<0.05) of TNF- α in both naïve macrophages and macrophages induced by lipopolysaccharide (LPS) as shown in (Figures. 1 and 2).
All Lactobacillus strains exhibited TNF-α/ IL-10 ration above 24 pg/ml:1 pg/ml, while one strain Lactobacillus acidophilus (K44/3) exhibited high ratio which was 110 pg/ml:1 pg/ml indicating that this strains is the strongest for stimulating of pro-inflammatory cytokines
TNF-alpha
0
10000
20000
30000
40000
Con
trol 31 19 7/
137
/138
/1 K5
k44/
3K
59/1
GG
Shir
ota
Lactobacillus strains
TN
F-a
lpha
(pg
/ml)
A
* **
IL-6
0
5000
10000
15000
20000
25000
Con
trol 31 19 7/
137
/138
/1 K5
k44/
3K
59/1
GG
Shir
ota
Lactobacillus strains
IL-6
(p
g/m
l)
B
*
*
IL-10
0
400
800
1200
1600
Con
trol 31 19 7/
137
/138
/1 K5
k44/
3K
59/1
GG
Shir
ota
Lactobacillus strains
IL-1
0 (p
g/m
l)
C
*
*
IL-12p40
0
2000
4000
6000
8000
10000
Con
tro l 31 1 9 7 /
137
/ 13 8
/ 1 K5
k44 /
3K
59/ 1
GG
S hi r
o ta
Lactobacillus strains + LPS
IL-p
40 (
pg/m
l)
D
**
Figure 1. Cytokine induction by heat-killed Lactobacilli.Cytokines TNF-α (A),IL-6, (B),IL-10 (C )and(D) IL-12p40 were analyzed by commercial cytokine ELISA kits in supernatants collected from 24 h cultures of murine macrophages cell line J774.1( 5x10⁵ cell/well) incubated with different strains of heat-killed Lactobacilli (1X10⁷CFU/ml). Data represent the average of three independent experiments and DS (error bar) of each cytokine in pg/ml. Statistical significance of the differences in the level of cytokines secretion induced by Lactobacilli was determined by analysis of variance (ANOVA) using Friedman test ( p< 0.00091)
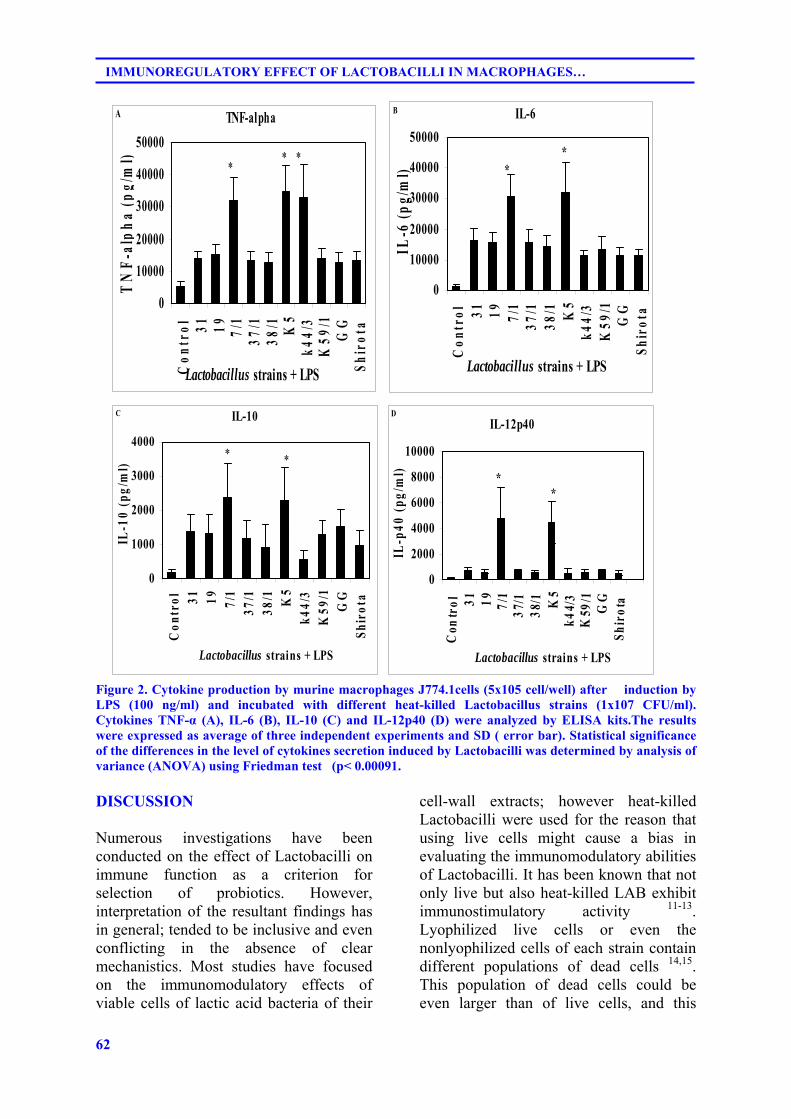
62
IMMUNOREGULATORY EFFECT OF LACTOBACILLI IN MACROPHAGES…
TNF-alpha
0
10000
20000
30000
40000
50000
Con
trol 31 19 7/
137
/138
/1 K5
k44/
3K
59/1
GG
Shir
ota
Lactobacillus strains + LPS
TN
F-a
lph
a (p
g/m
l)A
** *
IL-6
0
10000
20000
30000
40000
50000
Con
trol 31 19 7/
137
/138
/1 K5
k44/
3K
59/1
GG
Shir
ota
Lactobacillus strains + LPS
IL-6
(p
g/m
l)
B
**
IL-10
0
1000
2000
3000
4000
Con
trol 31 19 7/
137
/138
/1 K5
k44/
3K
59/1
GG
Shir
ota
Lactobacillus strains + LPS
IL-1
0 (p
g/m
l)
C
* *
IL-12p40
0
2000
4000
6000
8000
10000C
ontr
ol 31 1 9 7 /1
3 7/ 1
38/ 1 K
5k4
4 /3
K59
/ 1G
GSh
i ro t
a
Lactobacillus strains + LPS
IL-p
40 (
pg/m
l)D
**
Figure 2. Cytokine production by murine macrophages J774.1cells (5x10⁵ cell/well) after induction by LPS (100 ng/ml) and incubated with different heat-killed Lactobacillus strains (1x10⁷ CFU/ml). Cytokines TNF-α (A), IL-6 (B), IL-10 (C) and IL-12p40 (D) were analyzed by ELISA kits.The results were expressed as average of three independent experiments and SD ( error bar). Statistical significance of the differences in the level of cytokines secretion induced by Lactobacilli was determined by analysis of variance (ANOVA) using Friedman test (p< 0.00091. DISCUSSION
Numerous investigations have been conducted on the effect of Lactobacilli on immune function as a criterion for selection of probiotics. However, interpretation of the resultant findings has in general; tended to be inclusive and even conflicting in the absence of clear mechanistics. Most studies have focused on the immunomodulatory effects of viable cells of lactic acid bacteria of their
cell-wall extracts; however heat-killed Lactobacilli were used for the reason that using live cells might cause a bias in evaluating the immunomodulatory abilities of Lactobacilli. It has been known that not only live but also heat-killed LAB exhibit immunostimulatory activity 11-13. Lyophilized live cells or even the nonlyophilized cells of each strain contain different populations of dead cells 14,15. This population of dead cells could be even larger than of live cells, and this
63
Duhok Medical Journal Volume 6, Supplement 3, 2012
situation could occur during the preparation procedures, depending on the viability of the strains 16. This must affect the evaluation of the stimulatory ability when the dosage is controlled by the number of live cells. Therefore, dead cells were used to ensure that the total cells amount in all the strains was approximately the same; this would allow evaluation of their ability under the same condition. All heat-killed Lactobacillus strains were able to activate non stimulated or LPS-stimulated mouse macrophages to induce T cells toward Th1 immune responses in which two strains of Lactobacilli, Lactobacillus fermentum (7/1) and Lactobacillus fermentum (K5) produced the highest concentrations of TNF-α, IL-6, IL-10 and IL-12P40 compared to low levels induced by other strains. This capacity of Lactobacilli to variably induce cytokines indicates that species of Lactobacilli may differentially determine the immune responses. Macrophage recognition of and response to molecular structures on bacteria (pathogen-associated molecular patterns) occurs through a family of pattern recognition receptors designated Toll-like receptors (TLRs). Activation of these surface receptors by bacterial components are believed to be a key factor for recognition of the immune response and to mediate a link between the innate and the adaptive immune response 6.Differential activation of TLR by multiple pathogen-associated molecular patterns could induce different cytokine patterns. This fact might explain the observed differences in cytokine induction. TLRs have been found to be signal transducer for cell activation by peptidoglycan, lipoteichoic acid and bacterial lipoprotein in addition to LPS 17 However, as LPS also binds to TLR4 and CD14, these receptors constitute alternative activation pathways for LPS 18. Other TLRs activated by the bacteria may be involved. Notably, no isolated bacterial component has been found entirely responsible for the potent induction of pro-
inflammatory cytokines seen for whole bacteria, indicating that multiple receptors may be involved in mechanisms of stimulation 19. Pro-inflammatory cytokines such as IL-12, TNF-α are among the first cytokines produced by phagocytic cells in response to encounters with pathogenic bacteria. Macrophage derived IL-12 stimulates INF-γ production in T cells and natural killer cells, which accelerates the development of native CD4+ T cells into Th1-type cells 20,12. Therefore, IL-12 is a key immunoregulator favoring Th1-type responses. These results agree with those of Hessele and co-workers 22 who found that Gram-positive bacteria are, in general more potent IL-12 inducers than Gram-negative bacteria, while Christensen and co-workers 17 observed that Lactobacillus concentration giving rise to the highest level of IL-12 and TNF- α was much lower than the concentration inducing the highest level of anti-inflammatory cytokines such as IL-10.
REFERENCES
1. Hammes, WP, Vogel RF. The
genus Lactobacillus, Glasgow, Blackie Academic & Professional .1995.
2. Ahrne S, Nobaek S, Jeppson B.The normal Lactobacillus flora of healthy human and rectal and oral mucosa. J Appl Microbiol.1994; 85: 88-94 .
3. Molin G, Jeppsson B, Johansson ML,Nobaek S, Ståhl M, Bengmark S. Numerical taxonomy of Lactobacillus spp. Associated with healthy and diseased mucosa of the human intestine. J Appl Microbiol., 1993; 74 (3): 314-23 .
4. Salminen S, Isolauri E, Salminen E. Clinical uses of probiotics for stabilizing the gut mucosal barrier: Successful strain and future challenges. Antonie Van Leeuwnhoek.1996; 70 (2-4): 347-58.
64
IMMUNOREGULATORY EFFECT OF LACTOBACILLI IN MACROPHAGES…
5. Gill HS. Stimulation of the immune system by lactic cultures. Int. Dairy J.1998; 8: 535-44.
6. Trinchieri G. Proinflammatory and immunoregulatory functions of interleukin-12. Int Rev Immunol.1998; 16(3-4): 365-96 .
7. Peakman M, Vergani D. Basic and clinical immunology.1st ed. Hong Kong :Churchill Livingstone; 1997.p.1-388 .
8. He F, Morita H, Hashimoto H, Hosoda M, Kurisaki J, Ouwehand AC,etal. Intestinal Bifidobacterium species induce varying cytokine production. J Allergy Clin Immunol.2002; 109(6): 1035-36.
9. Morita H, He F, Fuse T, Duwehand A C, Hashimoto H, Hosada M, et al. Cytokine production by the Murine Macrophages Cell line J774.1 after exposure to Lactobacilli. Biosci. Biotechnol. Biochem. 2002; 66(9): 1963-6.
10. Marcienkiewicz J, Grabowska A, Bereta J, Bryniarski K, Nowak B. Taurine chloramine down-regulates the generation of murine neutrophil inflammatory mediates. Immuno- pharmacol.1998; 40(1): 27-38.
11. Morita H, He F, Fuse T, Ouwenhand AC, Hashimoto H, Hosoda M,et al. Cytokine production by murine macrophages cell line J744.1 after exposure to Lactobacilli .Biosci. Biotechnol. Biochem.2002; 66(9): 1963-6.
12. Maassen CBM, Van Holten-Neelen C, Balk F, den Bak-Glashouwer MH, Leer RJ,et al. Strain- dependent induction of cytokine profiles in the gut by orally administered Lactobacillus strains. Vaccine.2000; 18(23): 2613-23.
13. Fujiwara D, Inoue S, Wakabayashi H, Fujii T. The anti-allergic effects of lactic acid bacteria are strain dependent and mediated by effects of both Th1/ Th2 cytokine expression and balance. Int Arch
Allergy Immumol.2004; 135(3): 205-15.
14. Nighswonger B D, Brashears M M, Gilliland SE. Viability of Lactobacillus acidophilus and Lactobacillus casei in fermented milk products during refrigerated storages. J Dairy Sci. 1996; 79(2): 212-9.
15. Corcoran BM, Ross RP, Fitzgerald GF, Stanton C. Comparative survival of probiotic Lactobacilli spray-dried in the presence of probiotic substances. J Appl. Microbiol.2004; 96(5): 1024- 39.
16. Bucio A, Hartemink R, Schrama JW, Verreth J, Rombouts F M. Survival of Lactobacillis plantarum 44a after spraying and drying in feed and during exposure to gastrointestinal tract fluids in vitro. J. Gen. Appl. Microbiol.2005; 51(4): 221-7.
17. Chritensen HR, Frokiaer H, Pestka JJ. Lactobacilli Differentially Modulate Expression of Cytokines and Maturation Surface Markers in Murine Dendritic Cells.The Journal of Immunology.2002; 168(1): 171-8.
18. Medzhitov R, Janeway C Jr. Innate immune recognition: mechanisms and pathways. Immunol. Rev. 2000; 173: 89-97.
19. Thoma-Uszynski S, Kiertscher S M, Ochoa MT, Bouis DA, Norgard MV, Miyake K,et al. Activation of toll-like receptors 2 on human dendritic cells triggers induction of IL-12, but not IL-10. J Immunol. 2000; 165(7): 3804-10
20. Yoshimura A, Lien E, Ingalls RR. Tuomanen E, Dziarski R, Golenbock D. Cutting edge: recognition of Gram-positive bacterial cell wall components by the innate immune system ocuurs via Toll-like receptor 2. J Immunol. 1999; 163(1):1-5.

65
Duhok Medical Journal Volume 6, Supplement 3, 2012
21. Hessle C, Andersson B, Wold AE. Gram positive bacteria are potent inducers of monocytic interleukin-12 (IL-12) while Gram-negative bacteria preferentially stimulate IL-10 production. Infect Immun. 2000; 68(6): 3581-6.
22. Hessle C, Hanson LA, Wold AE. Lactobacilli from human gastointestinal mucosa are strong stimulators of IL-12 production. Clin Exp Immunol.1999;116(2): 276-82.
66
IMMUNOREGULATORY EFFECT OF LACTOBACILLI IN MACROPHAGES…
ón‚íq@@@@
îŠbåèŠói@bånƒÙŽîŠ@bä‹ÙŽïmŠbØ@bîØóibILactobacilli@H@oŽïäb’@ŠóÜ@ImacrophagesH@@@@
10@@bîØói@õŠíu@æŽî‹ŽïäILactobacilli@H@aŠóïÄbä†@@ç‹Ùäb“ïä@oò†@óåmbèI110@H@@@@@æŽïï’í‚óä@õˆ†@ôØýbš@æî’bi@æŽîìó÷@a†a‹Žïmæîa‡äb“ïä@ôÄò†@@N@@
@@@Žïm@çbÄó÷@õŠbåèŠói@bånƒÙŽîŠ@bä‹ÙïmŠbØ@ŠóÜ@ça‡àb−ó÷@ómbè@μÜíØóÄ@@@oŽïäb’@ŠóÜ@a‹Imacrophages@@@H@@@@çbî@Šbï“èóä@æŽîìó÷@ônòŠóØ@íi@õ‹Ø@Šbï“è@ILipopoly saccharideN@H@@
μn“îŠ@óåŽïmbè@æŽîìó÷@@oŽïåîbØínîb@ŽõŠíu@@ŠóÜ@æîóè@æŽïî@ÄbuŠói@æŽïîŒaìbïu@íØ@@‹Ø@Šbî†@ŽôåïÜíØóÄ@N@@@@@a‡äb“ïä@ŽôîbîØói@æŽîm@ôàóè@@a‰ŽîŠ TNF-α:IL-10@@@ˆ24:1@@Ž¶ói@@@@õŠíš@ôØòm@Žôåni@Lacto bacillus acidophilus (K44/13) @@@@a†ò‰îŠ@æî‹mŒŠóiõˆìó÷110:1@@@bîØóibî@íi@‹Žïm@@æŽî‹mŽïéi@ò‹Žïm@Äó÷@íØ@íi@Šbî†@óÄó÷òìILactobacilli@HŽôäa†ìóè@oïŽïåîbØínîb@bä‡äb’Š@íi@N@@
ó–þ©a@ @@@
@âïqa‹¡@ôÈbå¾a@âïÅånÜa@qbmILactobacilli@H©a@À@@bîþ@Imacrophages@HóïáÉÝjÜa@@Ëíä@òjÙÜaJ 744.1@@@@
@Šbïn‚a@I10@ H@μi@æà@òÈI111@ Hâïqa‹u@æà@òÈ@ILactobacilli@ @ H@ÒîívnÜa@pbš‹¿@‡š@ñ†b›m@Ãb“ä@ôÝÈa@p‹éÄa@Üaì@ò†b·@òÑ«@òjÙÜa@óïáÉÝjÜa@bîþ©a@À@óÈbåáÝÜ@ðáïÅånÜa@bèqdm@oŠ†ì@ðáÑÜaILipopoly saccharide@HòÑa@ÌìN@@
@ ójä@paÉÜa@Êï»@p‹éÄa@sïy@paÉÜa@μi@ òŒ‹Ñ¾a@ óîíÝ©a@pbØ‹a@¹@À@ óîíåÉà@pbÐþn‚a@†íuíi@ óaŠ‡Üa@oåïiTNF-α:IL-
10æà1:24báåïi@@
@ò‡yaì@òÈLacto bacillus acidophilus K4413) H@oäbØ@Üaì@ójä@õíÔa@p‹éÄa 1:110 è@òÉÜa@ò‰è@ça@ôÝÈ@߇m@ò‰èì@ð@ðibénÜýa@qdnÜa@paˆ@óîíÝ©a@pbØ‹a@ïÑ¥@À@õíÔýaN@@
67
Duhok Medical Journal Volume 6, Supplement 3, 2012
A NEW METHOD FOR TREATMENT OF DENTIN HYPERSENSITIVITY BY USING NANO FLUOR-HYDROXYAPATITE AND ND: YAG LASER: A SCANNING
ELECTRON MICROSCOPIC STUDY
SAEED ALI M, BDS, MSc KHULOOD AL-SAFI, BDS, MSc, PhD
Submitted 30 Jun 2012; accepted 3 Sep 2012 ABSTRACT Objectives: The purpose of this study was to use a new method for treatment of dentin hypersensitivity and closure of dentinal tubules by combination of Nd:YAg laser and Nano Fluor-hydroxyapatite and compare the occluding effect of dentinal tubules of this type of treatment with other modalities like Cyanoacrylate and sodium fluoride by using scanning electron microscope. Method: Sixty freshly extracted human premolar teeth had been collected randomly for this study. The coronal portion of each tooth was removed and the canals were instrumented and obturated with gutta percha. A 3 mm wide ring of root surface, 2 mm apical to the coronal rim of each specimen was cut by a rotary instrument attached to a special microlathe to expose underlining dentin. The teeth were divided randomly into six groups : Group 1: Ten teeth were treated with Nano Fluor – hydroxyapatite and Nd:YAG laser ,Group 2: Ten teeth were treated with Nd:YAG laser only, Group 3: Ten teeth were treated with Nano Fluor – hydroxyapatite only, Group 4: Ten teeth were treated with desensitizing cyanoacrylate resin bonding (Tetric N ceram), Group 5. Ten teeth were treated with 2% sodium fluoride, and Group 6: Ten teeth were not treated with any modality mentioned above (control group). Scanning electron micrograph with 5000X were taken to show the topography of each group after treatment. Result and conclusion: The combination of Nano fluor hydroxyapatite and Nd:YAG laser is a promising treatment modality for dentin hypersensitivity and excellent method for closure of exposed dentinal tubules with significant difference when compared with other treatment modalities. Duhok Med J 2012;6 Suppl 3: 67-77. Key words:Dentin Hypersensitivity ,Nano.Laser, Electeon Microscopy.
entin hypersensitivity is characterized by a sharp, localized
and short pain in response to thermal, chemical, mechanical or osmotic stimuli, ceasing after their removal. The etiology of hypersensitivity is multifactorial, but the factors involved are not very clear 1 . Several theories have been cited to explain the mechanism involved in dentinal hypersensitivity. The transducer theory, the modulation theory, the “gate” control and vibration theory, and the hydrodynamic theory have all been presented and discussed throughout the years. The latter, “hydrodynamic theory”, developed in the 1960’s and based upon two decades of research, is widely accepted as the cause of tooth sensitivity.
Assumptions of the hydrodynamic theory conclude that when the fluids within the dentinal tubules are subjected to temperature changes or physical osmotic changes, the movement stimulates a nerve receptor sensitive to pressure, which leads to the transmission of the stimuli Based on the hydrodynamic theory, dentinal hypersensitivity is a transient tooth pain. The disease is characterized by a short, sharp pain arising from exposed dentin in response to a stimulus that cannot be ascribed to any other form of dental defect or pathology 2. Therefore, in order to exhibit a response to the stimuli, the tubules would have to be open at the dentin surface as well as the pulpal surface of the tooth. The most
*Assistant lecturer, School of Dentistry, Faculty of Medical Science ,University of Dohuk. ** Professor, College of Dentistry, University of Baghdad. Correspondence author: Saeed Ali M.Email:[email protected]
D
68
A new Method for Treatment of Dentin Hypersensitivity by Using Nano ……….
important variable affecting the fluid flow in dentin is the radius of the tubuli. If the radius is reduced by one-half, the fluid flow within the tubuli falls to one-sixteenth of its original rate. Consequently, the creation of a smear layer or obliteration of the tubule can greatly increase the effectiveness of the treatment of this malady 3. Various findings concerning the occluding effect of desensitizing agents on open dentinal tubules have been reported, but the problem of permeation through dentinal tubules has not been solved 4 . Sealing of dentinal tubules with resins and adhesives (cyanoacrylate) has been advocated for many years as a means of managing dentinal hypersensitivity. In general, results have been good but problems arise when the adhesive breaks away resulting in exposure of the tubules. This technique is generally reserved for cases of specific and localized dentinal hypersensitivity rather than generalized dentinal pain 3 . Many clinical studies have shown that treatment of exposed root surfaces with sodium fluoride toothpaste and concentrated fluoride solutions is very efficient in managing dentinal hypersensitivity 5 . The improvement appears to be due to an increase in the resistance of dentine to acid decalcification as well as to precipitations in the exposed dentinal tubules. Tal et al., suggested that the probable desensitizing effects of fluoride are related to precipitated fluoride compounds mechanically blocking exposed dentinal tubules or fluoride within the tubules blocking transmission of stimuli 6 . HydroxyapatiteHA (Ca10(PO4)6(OH)2) has attracted much interest as an implant material for teeth and bones due to the similarity of its crystallography and chemical composition to that of human hard tissues . In most cases, the controlled solubility of HA is an important factor, since it induces bioactivity,
osteoconductivity, and therapeutic effects. On the other hand, pure fluorapatite (FA) with a chemical formula, Ca10(PO4)6(F)2 is thought to have a much lower solubility than HA due to greater chemical and structural stability 7 . Moreover, the FHA (Ca10(PO4)6(OH,F)2) forms solid solutions with HA by the replacement of OH− by F−. Hence, modulation of the extent of fluoride substitution provides an effective way of controlling the solubility of the apatite. In addition, F− enhances the mineralization and crystallization of calcium phosphate compounds during the bone regeneration 8 . Laser technology has been used in many dental applications. When laser is used at a level of 150—190 millijoules (mJ), the dentine is not only vaporized, but it also melts and closes off partially the dentinal tubules. Chiang et al., demonstrated that the use of mesoporous silica biomaterial, which contain Nano-sized calcium oxide particles( 40 nm), can penetrate through dentinal tubules with a depth of 100 μm and significantly reduce dentin permeability. Thus, using Nano sized particles has great potential applications for the clinical treatment of dentin hypersensitivity 9 . To the Researchers knowledge, there are no published papers available concerning the use of Nano Fluor –hydroxyapatite with laser as a treatment modality for dentin hypersensitivity. Accordingly, this study design will be show the effect of using the combination of Nd:YAg laser and Nano Fluor-hydroxyapatite in closing the dentinal tubules and treating dentin hypersensitivity and compare this type of treatment with other modalities by using a scanning electron microscope. METHODS Sample selection Sixty freshly extracted human premolar teeth had been collected randomly for this study. The age range was
69
Duhok Medical Journal Volume 6, Supplement 3, 2012
between 18 – 30 years. Sex, pulpal status or reasons for extraction are not recorded. Sample preparation After extraction, all teeth were stored in normal saline solution at room temperature. External soft tissue and debris were removed using an ultrasonic scaler. The coronal portion of each tooth was removed to the level of the cervical line using a diamond disc with a straight handpiece. The patency of each canal was established by passing a no. 10 k-type file through the apical foramen, the pulpal tissue was removed by using barbed broaches, and the working length was determined by subtracting 1 mm from the length at which the tip of the no.10 file just appeared at the apical foramen. The canals were instrumented using a conventional hand instrumentation technique with circumferential filing action to master apical file no. 60 k-type files. Each canal was irrigated after each instrument size with 2.5% sodium hypochlorite solution throughout the canal preparations, and the canals were dried with paper points. Master gutta percha cones were fitted to within 1 mm of the working length. The canals were obturated completely using the lateral condensation technique (using zinc oxide type sealer). Excess gutta percha was removed with a heated instrument to a level 2 mm apical to the orifices of the canals, and then the coronal access preparations were closed with zinc phosphate cement. All teeth were stored in 100% humidity at 37 C for 48 h to allow time for the sealer to set. A 3 mm wide ring of root surface, 2 mm apical to the coronal rim of each specimen was cut by a rotary instrument attached to a special microlathe to expose underlining dentin 10 . Sample grouping The teeth were divided randomly into six groups: Group 1. Ten teeth were treated with Nano Fluor – hydroxyapatite and Nd:YAG
laser (focus mode at a wavelength of 1064 nm, 100 mJ, 100 Hz repetition rate for 2 second ) . Group 2. Ten teeth were treated with Nd:YAG laser only (focus mode at a wavelength of 1064 nm, 100 mJ, 100 Hz repetition rate for 2 second ) . Group 3. Ten teeth were treated with Nano Fluor – hydroxyapatite only. Group 4. Ten teeth were treated with desensitizing cyanoacrylate resin bonding (Tetric N ceram). Group 5. Ten teeth were treated with 2% sodium fluoride. Group 6. Ten teeth were not treated with any modality mentioned above (control group). The teeth from Group one, the exposed dentinal tubules were swiped with Nano Fluor –hydroxyapatite and subjected to the Nd:YAG laser (focus mode at a wavelength of 1064 nm, 100 mJ, 100 Hz repetition rate for 2 seconds) . The teeth from the second testing group were treated with Nd:YAG laser only(focus mode at a wavelength of 1064 nm, 100 mJ, 100 Hz repetition rate for 2 seconds) . The teeth from the third testing group were treated with Fluor -hydroxyapatite by applying a single layer on the surface of exposed dentinal tubules. The teeth from the fourth group were treated with a cyanoacrylate adhesive system (Tetric N ceram) by applying a single layer on the surface of exposed dentinal tubules. While the teeth from the fifth group will be treated with a single application of 2% sodium fluoride. The sixth group will be left without treatment as control group. Scanning electron microscope examination The teeth were air-dried and mounted on aluminum stubs. After sputtering with a 40 nm layer of gold by using Balzers SCD 050 apparatus, wall surfaces of the treated samples were examined using a scanning electron microscope (5000X) operating at 10—15 kV. This showed the surface topography of the dentine substrate after
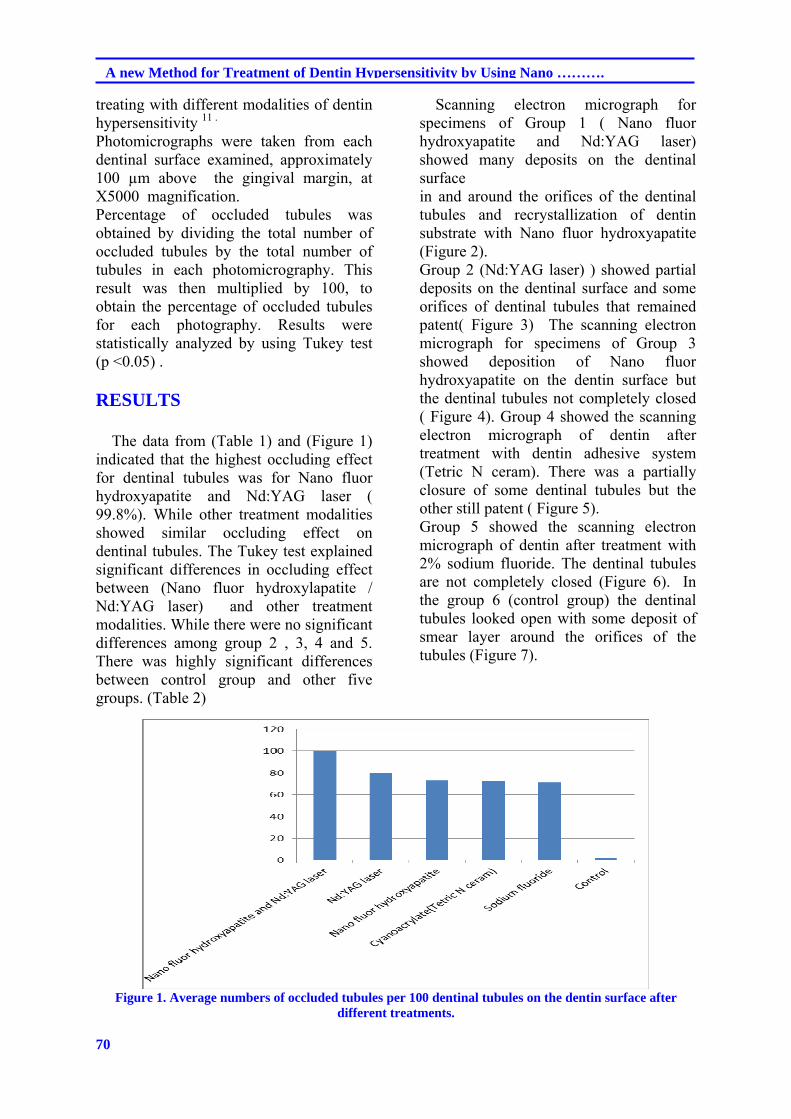
70
A new Method for Treatment of Dentin Hypersensitivity by Using Nano ……….
treating with different modalities of dentin hypersensitivity 11 . Photomicrographs were taken from each dentinal surface examined, approximately 100 µm above the gingival margin, at X5000 magnification. Percentage of occluded tubules was obtained by dividing the total number of occluded tubules by the total number of tubules in each photomicrography. This result was then multiplied by 100, to obtain the percentage of occluded tubules for each photography. Results were statistically analyzed by using Tukey test (p ˂0.05) . RESULTS The data from (Table 1) and (Figure 1) indicated that the highest occluding effect for dentinal tubules was for Nano fluor hydroxyapatite and Nd:YAG laser ( 99.8%). While other treatment modalities showed similar occluding effect on dentinal tubules. The Tukey test explained significant differences in occluding effect between (Nano fluor hydroxylapatite / Nd:YAG laser) and other treatment modalities. While there were no significant differences among group 2 , 3, 4 and 5. There was highly significant differences between control group and other five groups. (Table 2)
Scanning electron micrograph for specimens of Group 1 ( Nano fluor hydroxyapatite and Nd:YAG laser) showed many deposits on the dentinal surface in and around the orifices of the dentinal tubules and recrystallization of dentin substrate with Nano fluor hydroxyapatite (Figure 2). Group 2 (Nd:YAG laser) ) showed partial deposits on the dentinal surface and some orifices of dentinal tubules that remained patent( Figure 3) The scanning electron micrograph for specimens of Group 3 showed deposition of Nano fluor hydroxyapatite on the dentin surface but the dentinal tubules not completely closed ( Figure 4). Group 4 showed the scanning electron micrograph of dentin after treatment with dentin adhesive system (Tetric N ceram). There was a partially closure of some dentinal tubules but the other still patent ( Figure 5). Group 5 showed the scanning electron micrograph of dentin after treatment with 2% sodium fluoride. The dentinal tubules are not completely closed (Figure 6). In the group 6 (control group) the dentinal tubules looked open with some deposit of smear layer around the orifices of the tubules (Figure 7).
Figure 1. Average numbers of occluded tubules per 100 dentinal tubules on the dentin surface after
different treatments.
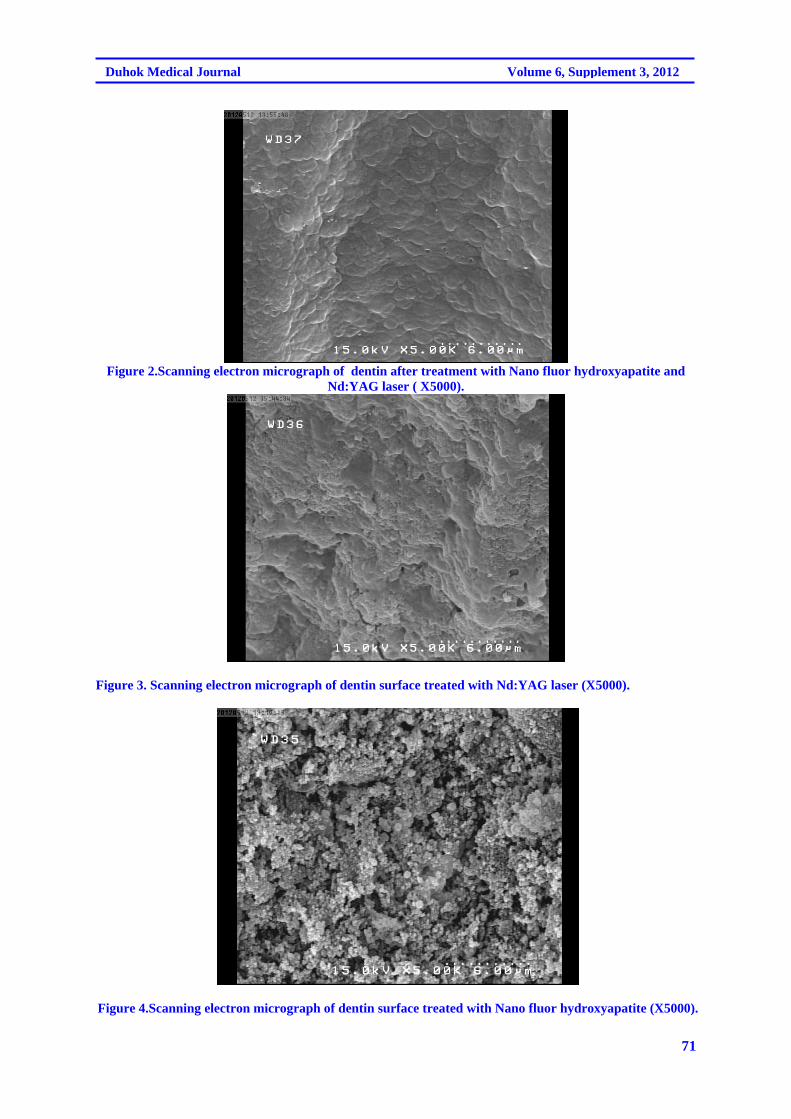
71
Duhok Medical Journal Volume 6, Supplement 3, 2012
Figure 2.Scanning electron micrograph of dentin after treatment with Nano fluor hydroxyapatite and
Nd:YAG laser ( X5000).
Figure 3. Scanning electron micrograph of dentin surface treated with Nd:YAG laser (X5000).
Figure 4.Scanning electron micrograph of dentin surface treated with Nano fluor hydroxyapatite (X5000).
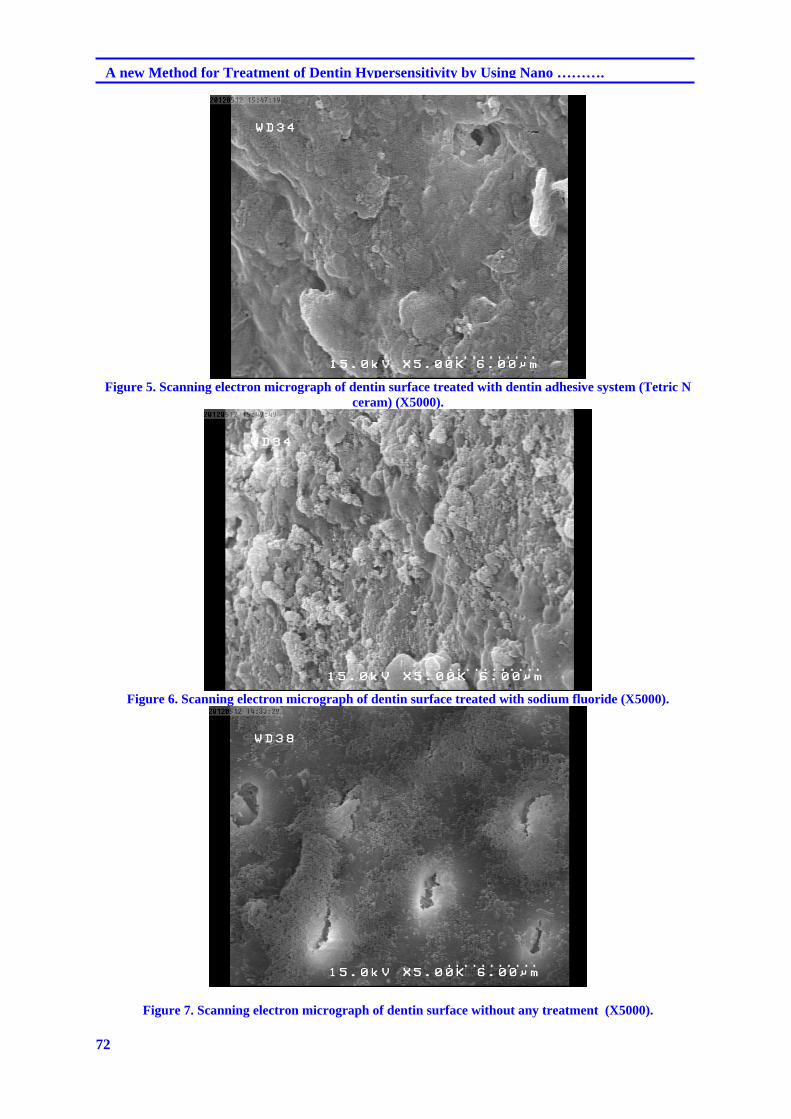
72
A new Method for Treatment of Dentin Hypersensitivity by Using Nano ……….
Figure 5. Scanning electron micrograph of dentin surface treated with dentin adhesive system (Tetric N
ceram) (X5000).
Figure 6. Scanning electron micrograph of dentin surface treated with sodium fluoride (X5000).
Figure 7. Scanning electron micrograph of dentin surface without any treatment (X5000).
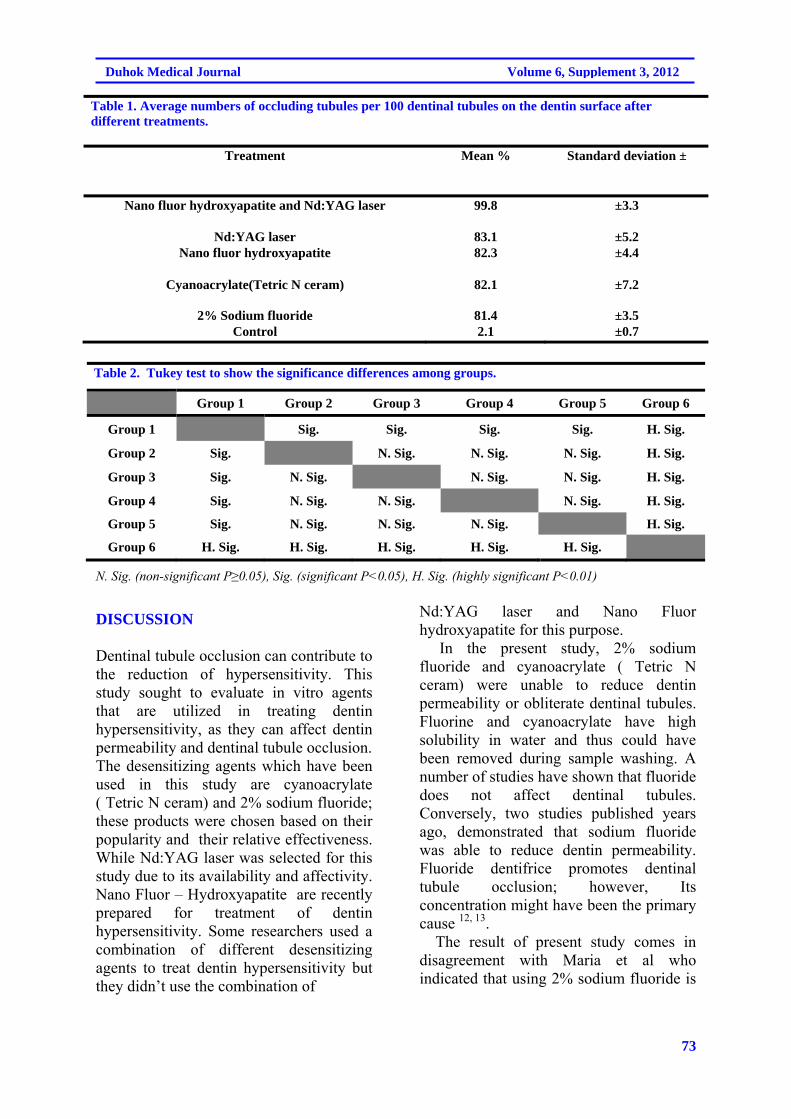
73
Duhok Medical Journal Volume 6, Supplement 3, 2012
Table 1. Average numbers of occluding tubules per 100 dentinal tubules on the dentin surface after different treatments.
Treatment Mean % Standard deviation ±
Nano fluor hydroxyapatite and Nd:YAG laser 99.8 ±3.3
Nd:YAG laser 83.1 ±5.2 Nano fluor hydroxyapatite 82.3 ±4.4
Cyanoacrylate(Tetric N ceram) 82.1 ±7.2
2% Sodium fluoride 81.4 ±3.5 Control 2.1 ±0.7
Table 2. Tukey test to show the significance differences among groups.
Group 1 Group 2 Group 3 Group 4 Group 5 Group 6
Group 1 Sig. Sig. Sig. Sig. H. Sig.
Group 2 Sig. N. Sig. N. Sig. N. Sig. H. Sig.
Group 3 Sig. N. Sig. N. Sig. N. Sig. H. Sig.
Group 4 Sig. N. Sig. N. Sig. N. Sig. H. Sig.
Group 5 Sig. N. Sig. N. Sig. N. Sig. H. Sig.
Group 6 H. Sig. H. Sig. H. Sig. H. Sig. H. Sig.
N. Sig. (non-significant P≥0.05), Sig. (significant P˂0.05), H. Sig. (highly significant P˂0.01)
DISCUSSION Dentinal tubule occlusion can contribute to the reduction of hypersensitivity. This study sought to evaluate in vitro agents that are utilized in treating dentin hypersensitivity, as they can affect dentin permeability and dentinal tubule occlusion. The desensitizing agents which have been used in this study are cyanoacrylate ( Tetric N ceram) and 2% sodium fluoride; these products were chosen based on their popularity and their relative effectiveness. While Nd:YAG laser was selected for this study due to its availability and affectivity. Nano Fluor – Hydroxyapatite are recently prepared for treatment of dentin hypersensitivity. Some researchers used a combination of different desensitizing agents to treat dentin hypersensitivity but they didn’t use the combination of
Nd:YAG laser and Nano Fluor hydroxyapatite for this purpose. In the present study, 2% sodium fluoride and cyanoacrylate ( Tetric N ceram) were unable to reduce dentin permeability or obliterate dentinal tubules. Fluorine and cyanoacrylate have high solubility in water and thus could have been removed during sample washing. A number of studies have shown that fluoride does not affect dentinal tubules. Conversely, two studies published years ago, demonstrated that sodium fluoride was able to reduce dentin permeability. Fluoride dentifrice promotes dentinal tubule occlusion; however, Its concentration might have been the primary cause 12, 13. The result of present study comes in disagreement with Maria et al who indicated that using 2% sodium fluoride is
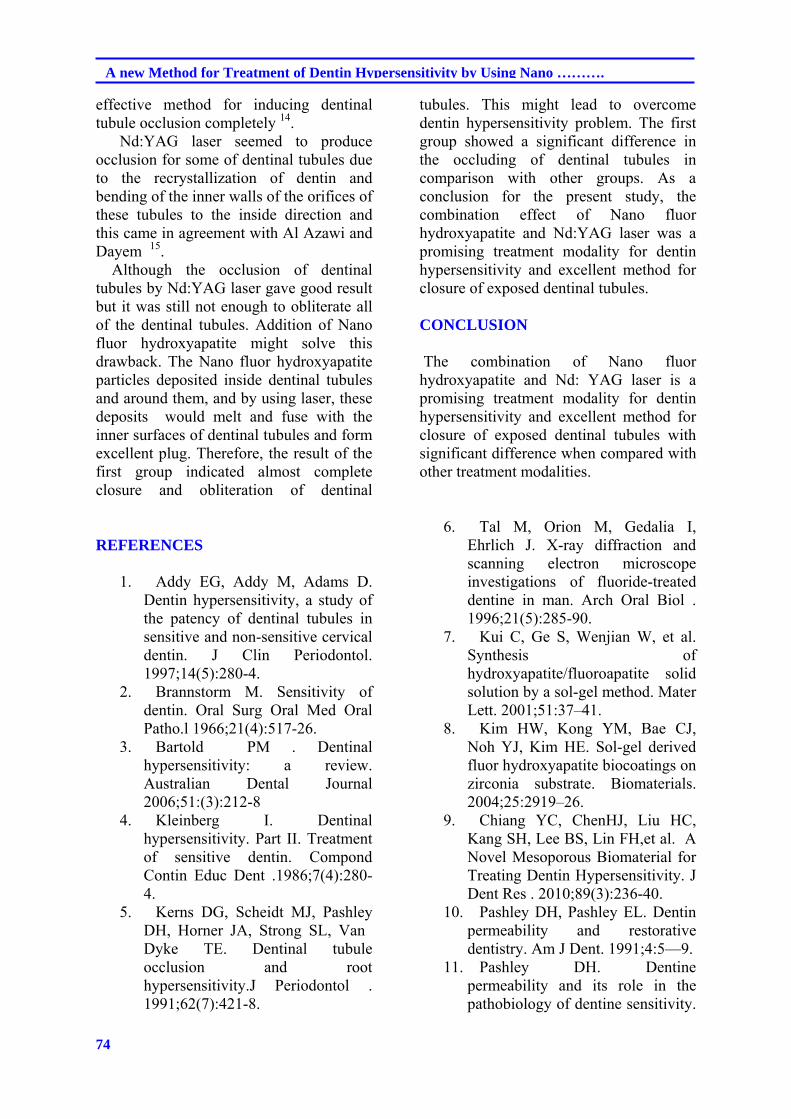
74
A new Method for Treatment of Dentin Hypersensitivity by Using Nano ……….
effective method for inducing dentinal tubule occlusion completely 14. Nd:YAG laser seemed to produce occlusion for some of dentinal tubules due to the recrystallization of dentin and bending of the inner walls of the orifices of these tubules to the inside direction and this came in agreement with Al Azawi and Dayem 15. Although the occlusion of dentinal tubules by Nd:YAG laser gave good result but it was still not enough to obliterate all of the dentinal tubules. Addition of Nano fluor hydroxyapatite might solve this drawback. The Nano fluor hydroxyapatite particles deposited inside dentinal tubules and around them, and by using laser, these deposits would melt and fuse with the inner surfaces of dentinal tubules and form excellent plug. Therefore, the result of the first group indicated almost complete closure and obliteration of dentinal
tubules. This might lead to overcome dentin hypersensitivity problem. The first group showed a significant difference in the occluding of dentinal tubules in comparison with other groups. As a conclusion for the present study, the combination effect of Nano fluor hydroxyapatite and Nd:YAG laser was a promising treatment modality for dentin hypersensitivity and excellent method for closure of exposed dentinal tubules. CONCLUSION The combination of Nano fluor hydroxyapatite and Nd: YAG laser is a promising treatment modality for dentin hypersensitivity and excellent method for closure of exposed dentinal tubules with significant difference when compared with other treatment modalities.
REFERENCES
1. Addy EG, Addy M, Adams D. Dentin hypersensitivity, a study of the patency of dentinal tubules in sensitive and non-sensitive cervical dentin. J Clin Periodontol. 1997;14(5):280-4.
2. Brannstorm M. Sensitivity of dentin. Oral Surg Oral Med Oral Patho.l 1966;21(4):517-26.
3. Bartold PM . Dentinal hypersensitivity: a review. Australian Dental Journal 2006;51:(3):212-8
4. Kleinberg I. Dentinal hypersensitivity. Part II. Treatment of sensitive dentin. Compond Contin Educ Dent .1986;7(4):280-4.
5. Kerns DG, Scheidt MJ, Pashley DH, Horner JA, Strong SL, Van Dyke TE. Dentinal tubule occlusion and root hypersensitivity.J Periodontol . 1991;62(7):421-8.
6. Tal M, Orion M, Gedalia I, Ehrlich J. X-ray diffraction and scanning electron microscope investigations of fluoride-treated dentine in man. Arch Oral Biol . 1996;21(5):285-90.
7. Kui C, Ge S, Wenjian W, et al. Synthesis of hydroxyapatite/fluoroapatite solid solution by a sol-gel method. Mater Lett. 2001;51:37–41.
8. Kim HW, Kong YM, Bae CJ, Noh YJ, Kim HE. Sol-gel derived fluor hydroxyapatite biocoatings on zirconia substrate. Biomaterials. 2004;25:2919–26.
9. Chiang YC, ChenHJ, Liu HC, Kang SH, Lee BS, Lin FH,et al. A Novel Mesoporous Biomaterial for Treating Dentin Hypersensitivity. J Dent Res . 2010;89(3):236-40.
10. Pashley DH, Pashley EL. Dentin permeability and restorative dentistry. Am J Dent. 1991;4:5—9.
11. Pashley DH. Dentine permeability and its role in the pathobiology of dentine sensitivity.
75
Duhok Medical Journal Volume 6, Supplement 3, 2012
Arch Oral Biol.1994; 39(Suppl):735-805.
12. Minkov B, Marmari I, Gedalia I, Garfunkel A. The effectiveness of sodium fluoride treatment with and without iontophoresis on the reduction of hypersensitive dentin. J Periodontol. 1975;46:246-9.
13. Aoba T. The effect of fluoride on apatite structure and growth. Crit Rev Oral Biol Med. 1997;8:136–3.
14. Maria Demi, Katleen LM, Roeland JG. Conventional vs Laser
Part1: conventional treatment of dentin hypersensitivity. J oral laser applications. 2009;9:7-20.
15. Al azawi L, Dayem RN. A comparison between the occluding effects of the Nd:YAG laser and the desensitising agent sensodyne on permeation through exposed dentinal tubules of endodontically treated teeth: An in vitro study. Archives of Oral Biology . 2006; 51(7): 535-40.
76
A new Method for Treatment of Dentin Hypersensitivity by Using Nano ……….
@ @ ón‚íq@@@@
ŠíÝÐíäbä@bäbåï÷ŠbØ@bÙŽî‹i@bäa††@båïnä†@bî@Ša숆@bïÙbä@bä‹ØŠóòŠbu@bÙŽîŠ@M@ì@oïmbic@ðØ슇ïèNd@ZYAG@@ŠïÜ@Z@bØòìóåîímÚïäìÙïÜó÷@ŽôiíÙì‹Ùîbà@båïÜbàóÄ@@
@@wäbàŠb÷Z@ýˆ@Žôåïnä†@oŽîŠíi@båm‹ @ì@bäa††@båïnä†@bî@Ša숆@bïÙbä@bä‹ØŠóòŠbu@íiˆ@@ìíi@ôä@bØóÙŽîŠ@bäbåï÷@ŠbÙi@Žõìóåîím@ŽôÄ@ˆ@wäbàŠb÷@Žôî
@ ŽôØóqì‹ Nd@ ZYAG@ŠíÝÐíäbäì@ ŠïÜM@؆ŠìaŠóiì@ ì@ @oïmbic@ðØ슇ïè@ôÄ@oŽî@ Žôåïnä†@oŽîŠíi@ båm‹ @ ßóÜ@ ç‡äbäóÜóèì@ Žõì@ b䆋@ Ûòì@ ŽôîŠóòŠbu@ oŽî@ õ†@ oŽïÙŽîŠ@ ßóÜ@ Žôä‹ØŠóòŠbu@ ŽõŠíucyanoacrylates@@båïÜbàóÄ@ bäbåï÷ŠbØ@ bÙŽî‹i@ ãíî†í–@ ‡îaŠíÝÐì
@ÚïäìÙïÜó÷@ŽôiíÙì‹ÙîbàN@@Žõìóåîím@bÙŽîŠZ@åmbè@Žôånïu@õŠ@êi@knŽî@bÄì‹à@oŽïäa††@ˆ@oŽï’@íi@@óÄ@@ôm‹ @Äbu@bØóÙŽî‹i@ç‹ØóÄ@ãíØ@êåmbè@ì@Úîïä@ŽôØóàò‡Ü@çb“ŽïØ@ó
bÙŽïq@bmó @l@æm‹ @êåmbè@ì@ç‹Ø‰Ôbq@óåmbè@bäa††@oŽïèŠ@•bq@ì@æî‹i@êmbè@ôØóäa††@Šóè@ŽõŠó@Žõìóåîím@ŽôÄN@@@3@mm@@ ì@ôäa††@ bèŠ@ Žôîý@ ˆ@ôèò‹Ð2mmŽî‹i@ æî‹i@ óåmbè@ôØóäa††@ Šóè@ bî@ôäa††@ ŽõŠó@ Žôîý@ ˆ@l@õa‡Žî‹ @ íØ@Ûì‹ÐŒ@ ŽôØòàb÷@ bÙ
@oïÄóØŠò‡i@@@a‡ïåi@†@@@båïnä†@íØ@a†@@êÄ@ïÜì‹ÙîbàNbiì‹ @•ó’@ŠóÜ@ç‹Ø@•óia†@êåmbè@óÅïm‹ @Äbu@l@ça††Z@@@lì‹ 1@@Z10@ŠíÝÐíäbä@@l@ç‹ØŠóòŠbu@êåmbè@ça††@M@ì@oïmbic@ðØ슇ïèNd@ZYAG@@ŠïÜ~@lì‹ 2@Z10@@ç‹ØŠóòŠbu@êåmbè@bäa††
@lNd@ZYAG@ïÜ@ Žôåm@l@Š~@lì‹ 3@@Z10@ŠíÝÐíäbä@@@l@ç‹ØŠóòŠbu@êåmbè@ça††M@@ Žôåm@knïmbic@ðØ슇ïè~@lì‹ 4@Z10@@ça††@ôŽïÙbä@õˆ†@ ŽôäbàŠò†@l@ç‹ØŠóòŠbu@êåmbècyanoacrylate resin bonding (Tetric N ceram)~@lì‹ 5@@Z10@@ça††
@l@ç‹ØŠóòŠbu@êåmbè2@E@‡îaŠíÝÐ@ãíî†í~lì‹ 6@Z10@†@Žôqì‹ @Ûòì@æmí @êåïmbè@õŠó@oŽïÄó÷@ˆ@@x@l@ç‹Ø@ŠóòŠbu@êåmbè@êä@ça†çbà@Ž¶ìåØN@@
ón‚íq@ ì@ôîbmíØ@oŽïàb−ó÷@ Šò†Z@ŠíÝÐíäbä@ ì솊óè@ bä‹ÙÜóÙŽïmM@ì@oïmbic@ðØ슇ïèNd@ ZYAG@@ó’bqì@ ëŠò‡äbè@ íØ@póØŠò†@ ŠïÜŠíi@båm‹ @íi@ˆ@ì@ Žôåïä†@bïÙbä@bä‹ØŠóòŠbu@íi@ˆ@óîóè@•bi@bØòˆìŠ@çŒóà@ì@Šbî†@ßó @oŽïèa†íu@ßóÜ@ó’bi@òŠóè@ŽôØón“m@Žôåïnä†@oŽî
Žôä‹ØŠóòŠbu@oŽî@õ†@oŽîŠíu@ßóÜ@æîó؆@†Šìa‹i@ôàò†N@@
77
Duhok Medical Journal Volume 6, Supplement 3, 2012
ó–þ©a@ @@@
ŠíÝÐíäbåÜa@ãa‡ƒnbi@xbÉÜa@óïb¨a@ËÐ@xþÉÜ@ò‡î‡u@óÕî‹ @M@ì@oïmbic@ðØ슇ïèNd@ZYAG@ŠïÜ@Z|b¾a@ðäìÙÜfia@óî‹éª@óaŠ†@@@@
a@Óa‡ècì@óïÑÝ‚szjÜZ@@Ò–aíÜa@óÜbŠ@ÙÉm@sïy@‡yaì@ça@À@æÐì@âÝÈ@ðè@óÑ–íÜa@óibnØIkïjÜa@Hî‹áÝÜ@N@âèa@æà@@ðè@óÑ–íÜa@óibnØkïjÜa@ béubn±@Üa@ óïbýa@ ú†bj¾a@ N@ óïjÜa@ pbÑ–íÝÜ@ |à@ öa‹uý@ íè@ óaŠ‡Üa@ Ó‡è@ çaIöbj ýa@ ÞjÔ@ æà@ ojnØ@Üa@ H@‹–båÉÝÜ
óÑ–íÝÜ@óïbýaN@@
Óa‡èÿaZ@ÍÜa@çbØì@æà@óÈíáª@ÞjÔ@æà@óïubÉÜa@kïibäÿa@×þÌgì@xbÉÜa@óïb¨a@ËÐ@xþÉÜ@ò‡î‡u@óÕî‹ @ãa‡ƒna@íè@óaŠ‡Üa@ë‰è@æà@‹Nd@ZYAG@ŠíÝÐíäbåÜaì@ŠïÜM@@†a‡äa@qdm@óäŠbÕàì@oïmbic@ðØ슇ïè@@׋Üa@æà@bèÌ@Êà@xþÉÜa@æà@ËíåÜa@a‰è@æà@óïubÉÜa@kïibäÿa@Þràcyanoacrylates@aŠíÝÐì|b¾a@ðäìÙÜfia@‹éa@ãa‡ƒnbi@ãíî†í—Üa@‡îN@@
ïvéå¾aó@ZóaŠ‡Üa@ë‰@bï÷aí“È@oÉ»@Üaì@brî‡y@ñ‹“jÜa@æyaíÜa@ÞjÔ@çbåc@æà@bå@μn@xa‹ƒna@@N@ðÝïÝØfia@æà@öu@óÜaŒg@o¸ìì@òéa@paíåÕÜa@oäbØì@æ@ÞÙÜobturated@@Êàgutta percha@N@óÕÝy@@ÞáÈ@o¸ì3@à@óÉaì@âà@ðáÕÜa@ÊÔì@LŠ‰§a@|@æ2@@âà
@À@ónjrà@òŠaì†@òa†c@æà@óåïÈ@ÞØ@æà@óïÝïÝØýa@óÐby@¶gmicrolathe@xbÉÜa@‹ÉnÜ@a‡Øüà@ó–b©a@N@o@¶g@çbåcþÜ@ð÷aí“È@âïÕm@ìpbÈíáª@Z@óÈíáa@çbåa@ò‹“È@æà@ÒÜdnm@óÈíáª@ÞØì1@ZŠíÝÐíäbåÜa@Êà@ò‹“ÉÜa@çbåÿa@xþÈ@@M@ïmbic@ðØ슇ïèì@oNd@ZYAG@
@ óÈíáa@ L@ ŠïÜ2@ Z@ Êà@ ò‹“ÉÜa@ çbåÿa@ xþÈ@ Nd@ ZYAG@@ óÈíáa@ LÂÕÐ@ ŠïÜ3@ ZŠíÝÐíäbåÜa@ Êà@ ò‹“ÉÜa@ @ çbåÿa@ xþÈ@ M@@óÈíáa@LÂÕÐ@oïmbic@ðØ슇ïè4@Z@znÝÜ@Þîà@Êà@ò‹“ÉÜa@çbåÿa@xþÈ@CYANOACRYLATE@@wåma‹Üa@ÂiaÜaIN
Tetric CERAMH@óÈíáa@L5@Z@ãíî†í—Üa@‡îaŠíÝÑi@çbåc@ò‹“È@íÈì2٪@óÈíáªì@L6@Z@óÕî‹ @ñc@Êà@çbåc@ò‹“È@aíÝàbÉî@@ëþÈc@òŠí؉¾aIóib›Üa@óÈíáaNH@@
ó¸b‚ì@óvïnäZ@ŠíÝÐíäbåÜa@æà@wîàM@ì@oïmbic@ðØ슇ïèNd@ZYAG@@òŒbn¿@óÝïì@ì@xbÉÜa@óïb¨a@ËÐ@xþÉÜ@ò‡Èaì@óÕî‹ @íè@ŠïÜÜa@kïibäÿa@×þÌfiõ‹‚ÿa@xþÉÜa@׋ @Êà@óäŠbÕ¾bi@jØ@Óþn‚a@Êà@óïubÉN@@
@@
@@
78
GENETIC POLYMORPHISMS OF P21 AND RISK OF PROSTATE CANCER
GENETIC POLYMORPHISMS OF P21 AND RISK OF PROSTATE CANCER
SAJADI F ROSTAMZADEH J
ZAREI M.A Submitted 18 Jun 2012; accepted 3 Sep 2012 ABSTRACT P21 is a cyclin-dependent kinase inhibitor that is pivotal in arresting cellular growth, in terminal differentiation and in apoptosis. Two polymorphisms in the p21Waf1/Cip1gene, i.e., codon 31 in the coding region and 3’UTR, have been identified and appeared to influence the expression of p21Waf1/Cip1. Several epidemiologic studies have examined the effect of these polymorphisms on cancer risk, which has motivated us to study the relationship between p21 codon 31 and 3’UTR polymorphism and the risk of prostate cancer among a sample population of Kurdistan province of IRAN. Genotyping was done by PCR-RFLP using DNA from (i) 45 prostate cancer paraffin embedded tissues, and (ii) a total of 45 normal blood samples. The PCR-RFLP products were 169bp for C allele, 115bp and 54bp for A allele in codone 31 and were 191 bp for C allele, 76bp and 115bp for T allele in 3’UTR. Frequencies of C/C and C/A plus A/A genotypes in 31 codone, were 31 (68.8%), 14 (31.2%) in carcinoma cases and 18 (60.0%), 12 (40.0%) in control cases, respectively. Allelic frequencies for controls were 0.866 for C and 0.124 for A and for patients were 0.84 and 0.16 for C and A respectively. For 3’UTR the only observed genotype were C/C for both control and cases. Although the sample size is relatively small, these findings suggest that a codon 31 polymorphism in p21 may be associated with the development of prostate cancer.
Duhok Med J 2012; 6 Suppl 3:78-85. Key words: P21 codon 31; Prostate cancer; Genetic polymorphism; PCR-RFLP
he p21 (also known as Waf1/Cip1/CDKN1A) protein is a
CDK inhibitor that is essential for cellular growth, differentiation and apoptosis 1 . p21, a putative tumor suppressor gene, is located on chromosome 6p21.2 and encodes a 21-kDa protein 2 that belongs to the CIP/KIP family, which includes p27 (1) and p57 3,4 . The CIP/KIP proteins share some common sequence motifs that mediate interaction between CDK inhibitors and cyclin-CDK complexes 5,6. The expression of p21 itself is up-regulated by p53 in response to DNA damage, leading to either cell-cycle arrest at the G1 checkpoint or apoptosis 1 p21 expression can suppress tumor growth by inhibiting PCNA-dependent DNA replication and mismatch repair in vitro 7,8, and increased expression of p21 and the accompanying reduction in overall CDK activity are associated with cell differentiation 9. Somatic mutations in the
p21 gene are rare in human malignancies 10, but reduced p21 expression in tumors has been associated with poor prognosis in humans 11-13 , including patients with laryngeal SCC 13. It is, therefore, likely that genetic variants in p21 may modulate its expression and thereby affect carcinogenesis. A total of 40 polymorphisms of p21 have been identified (available at http://egp.gs.washington.edu) (14), of which 35 are intronic. Sun and his colleagues (15) reported a polymorphism in the p21 codon 31 that produces a C to A transversion and causes a substitution from serine (ser) to arginine (arg). Subsequently, a series of epidemiologic studies have examined the effect of this polymorphism on lung cancer, cervical cancer, breast cancer and nasopharyngeal cancer with conflicting results 16-22. The ser allele has been suggested to be a risk factor for cancers in breast and cervix 17, 18, whereas the arg allele has been associated with the
* Department of Biological sciences and Biotechnology, Faculty of science, University of Kurdistan, Sanandaj,IRAN. Correspondence author: Zarei MA. Email: [email protected]. Mobile: 0098 918 871 0632
T
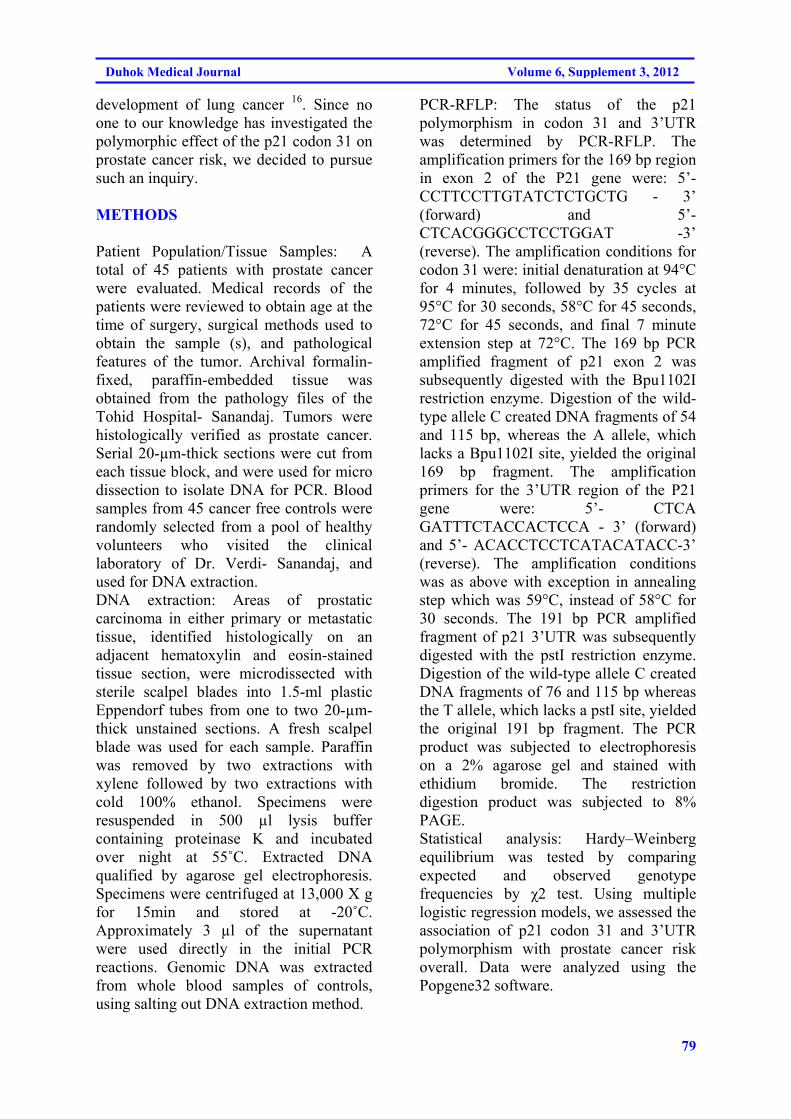
79
Duhok Medical Journal Volume 6, Supplement 3, 2012
development of lung cancer 16. Since no one to our knowledge has investigated the polymorphic effect of the p21 codon 31 on prostate cancer risk, we decided to pursue such an inquiry. METHODS
Patient Population/Tissue Samples: A total of 45 patients with prostate cancer were evaluated. Medical records of the patients were reviewed to obtain age at the time of surgery, surgical methods used to obtain the sample (s), and pathological features of the tumor. Archival formalin-fixed, paraffin-embedded tissue was obtained from the pathology files of the Tohid Hospital- Sanandaj. Tumors were histologically verified as prostate cancer. Serial 20-µm-thick sections were cut from each tissue block, and were used for micro dissection to isolate DNA for PCR. Blood samples from 45 cancer free controls were randomly selected from a pool of healthy volunteers who visited the clinical laboratory of Dr. Verdi- Sanandaj, and used for DNA extraction. DNA extraction: Areas of prostatic carcinoma in either primary or metastatic tissue, identified histologically on an adjacent hematoxylin and eosin-stained tissue section, were microdissected with sterile scalpel blades into 1.5-ml plastic Eppendorf tubes from one to two 20-µm-thick unstained sections. A fresh scalpel blade was used for each sample. Paraffin was removed by two extractions with xylene followed by two extractions with cold 100% ethanol. Specimens were resuspended in 500 µl lysis buffer containing proteinase K and incubated over night at 55˚C. Extracted DNA qualified by agarose gel electrophoresis. Specimens were centrifuged at 13,000 X g for 15min and stored at -20˚C. Approximately 3 µl of the supernatant were used directly in the initial PCR reactions. Genomic DNA was extracted from whole blood samples of controls, using salting out DNA extraction method.
PCR-RFLP: The status of the p21 polymorphism in codon 31 and 3’UTR was determined by PCR-RFLP. The amplification primers for the 169 bp region in exon 2 of the P21 gene were: 5’- CCTTCCTTGTATCTCTGCTG - 3’ (forward) and 5’- CTCACGGGCCTCCTGGAT -3’ (reverse). The amplification conditions for codon 31 were: initial denaturation at 94°C for 4 minutes, followed by 35 cycles at 95°C for 30 seconds, 58°C for 45 seconds, 72°C for 45 seconds, and final 7 minute extension step at 72°C. The 169 bp PCR amplified fragment of p21 exon 2 was subsequently digested with the Bpu1102I restriction enzyme. Digestion of the wild-type allele C created DNA fragments of 54 and 115 bp, whereas the A allele, which lacks a Bpu1102I site, yielded the original 169 bp fragment. The amplification primers for the 3’UTR region of the P21 gene were: 5’- CTCA GATTTCTACCACTCCA - 3’ (forward) and 5’- ACACCTCCTCATACATACC-3’ (reverse). The amplification conditions was as above with exception in annealing step which was 59°C, instead of 58°C for 30 seconds. The 191 bp PCR amplified fragment of p21 3’UTR was subsequently digested with the pstI restriction enzyme. Digestion of the wild-type allele C created DNA fragments of 76 and 115 bp whereas the T allele, which lacks a pstI site, yielded the original 191 bp fragment. The PCR product was subjected to electrophoresis on a 2% agarose gel and stained with ethidium bromide. The restriction digestion product was subjected to 8% PAGE. Statistical analysis: Hardy–Weinberg equilibrium was tested by comparing expected and observed genotype frequencies by χ2 test. Using multiple logistic regression models, we assessed the association of p21 codon 31 and 3’UTR polymorphism with prostate cancer risk overall. Data were analyzed using the Popgene32 software.
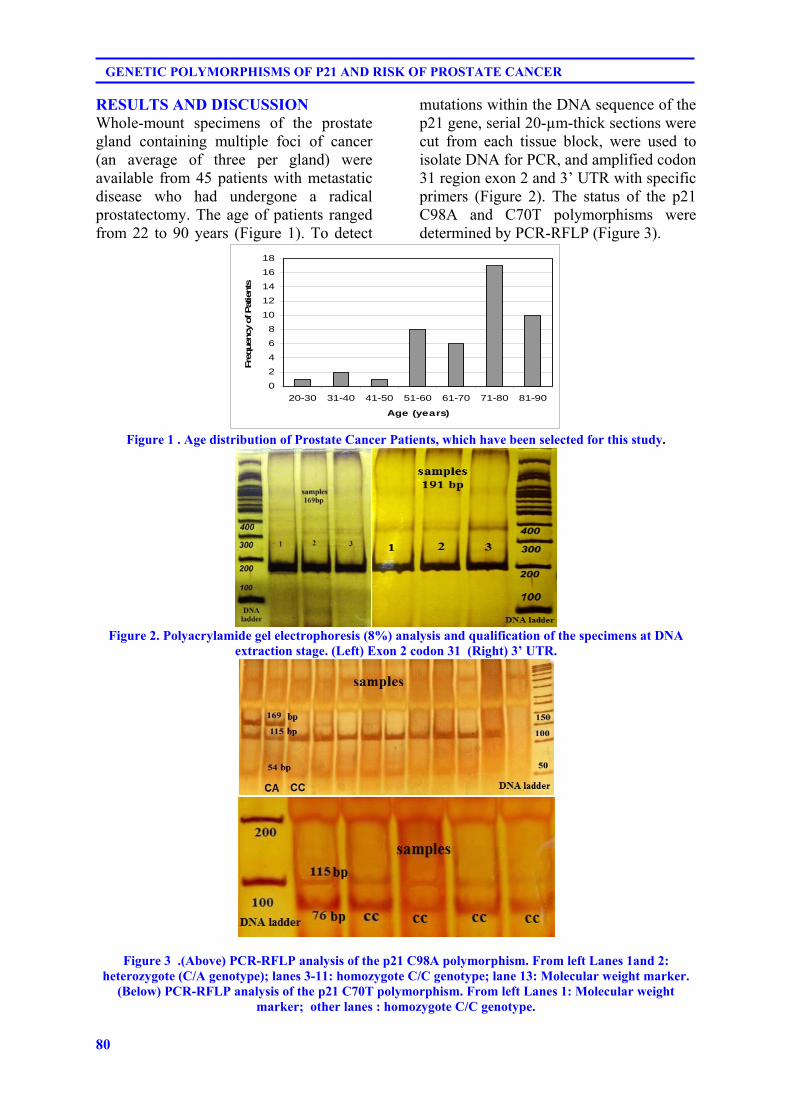
80
GENETIC POLYMORPHISMS OF P21 AND RISK OF PROSTATE CANCER
RESULTS AND DISCUSSION Whole-mount specimens of the prostate gland containing multiple foci of cancer (an average of three per gland) were available from 45 patients with metastatic disease who had undergone a radical prostatectomy. The age of patients ranged from 22 to 90 years (Figure 1). To detect
mutations within the DNA sequence of the p21 gene, serial 20-µm-thick sections were cut from each tissue block, were used to isolate DNA for PCR, and amplified codon 31 region exon 2 and 3’ UTR with specific primers (Figure 2). The status of the p21 C98A and C70T polymorphisms were determined by PCR-RFLP (Figure 3).
0
2
4
6
8
10
12
14
16
18
20-30 31-40 41-50 51-60 61-70 71-80 81-90
Age (years)
Fre
quen
cy o
f Pat
ients
Figure 1 . Age distribution of Prostate Cancer Patients, which have been selected for this study.
Figure 2. Polyacrylamide gel electrophoresis (8%) analysis and qualification of the specimens at DNA
extraction stage. (Left) Exon 2 codon 31 (Right) 3’ UTR.
Figure 3 .(Above) PCR-RFLP analysis of the p21 C98A polymorphism. From left Lanes 1and 2: heterozygote (C/A genotype); lanes 3-11: homozygote C/C genotype; lane 13: Molecular weight marker.
(Below) PCR-RFLP analysis of the p21 C70T polymorphism. From left Lanes 1: Molecular weight marker; other lanes : homozygote C/C genotype.
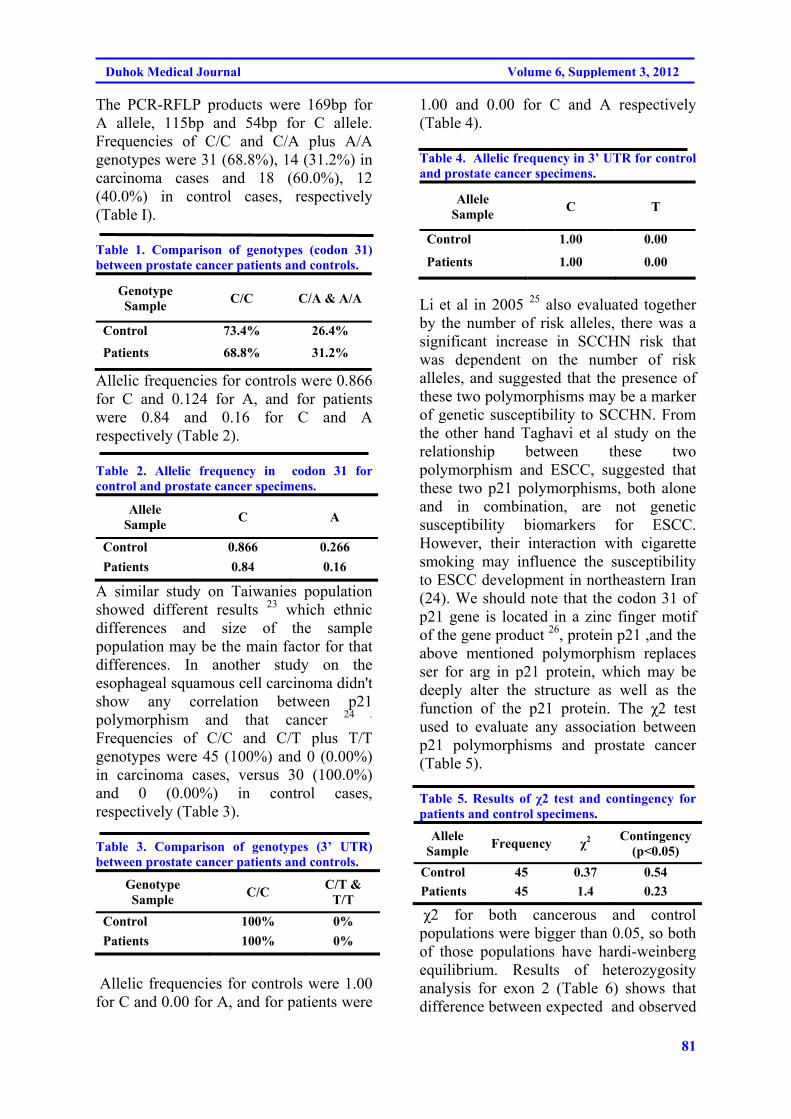
81
Duhok Medical Journal Volume 6, Supplement 3, 2012
The PCR-RFLP products were 169bp for A allele, 115bp and 54bp for C allele. Frequencies of C/C and C/A plus A/A genotypes were 31 (68.8%), 14 (31.2%) in carcinoma cases and 18 (60.0%), 12 (40.0%) in control cases, respectively (Table I). Table 1. Comparison of genotypes (codon 31) between prostate cancer patients and controls.
Genotype Sample
C/C C/A & A/A
Control 73.4% 26.4%
Patients 68.8% 31.2%
Allelic frequencies for controls were 0.866 for C and 0.124 for A, and for patients were 0.84 and 0.16 for C and A respectively (Table 2). Table 2. Allelic frequency in codon 31 for control and prostate cancer specimens.
Allele Sample
C A
Control 0.866 0.266
Patients 0.84 0.16
A similar study on Taiwanies population showed different results 23 which ethnic differences and size of the sample population may be the main factor for that differences. In another study on the esophageal squamous cell carcinoma didn't show any correlation between p21 polymorphism and that cancer 24 . Frequencies of C/C and C/T plus T/T genotypes were 45 (100%) and 0 (0.00%) in carcinoma cases, versus 30 (100.0%) and 0 (0.00%) in control cases, respectively (Table 3). Table 3. Comparison of genotypes (3’ UTR) between prostate cancer patients and controls.
Genotype Sample
C/C C/T &
T/T
Control 100% 0%
Patients 100% 0%
Allelic frequencies for controls were 1.00 for C and 0.00 for A, and for patients were
1.00 and 0.00 for C and A respectively (Table 4). Table 4. Allelic frequency in 3’ UTR for control and prostate cancer specimens.
Allele Sample
C T
Control 1.00 0.00
Patients 1.00 0.00
Li et al in 2005 25 also evaluated together by the number of risk alleles, there was a significant increase in SCCHN risk that was dependent on the number of risk alleles, and suggested that the presence of these two polymorphisms may be a marker of genetic susceptibility to SCCHN. From the other hand Taghavi et al study on the relationship between these two polymorphism and ESCC, suggested that these two p21 polymorphisms, both alone and in combination, are not genetic susceptibility biomarkers for ESCC. However, their interaction with cigarette smoking may influence the susceptibility to ESCC development in northeastern Iran (24). We should note that the codon 31 of p21 gene is located in a zinc finger motif of the gene product 26, protein p21 ,and the above mentioned polymorphism replaces ser for arg in p21 protein, which may be deeply alter the structure as well as the function of the p21 protein. The χ2 test used to evaluate any association between p21 polymorphisms and prostate cancer (Table 5). Table 5. Results of χ2 test and contingency for patients and control specimens.
Allele Sample
Frequency χ2 Contingency
(p<0.05)
Control 45 0.37 0.54
Patients 45 1.4 0.23
χ2 for both cancerous and control populations were bigger than 0.05, so both of those populations have hardi-weinberg equilibrium. Results of heterozygosity analysis for exon 2 (Table 6) shows that difference between expected and observed
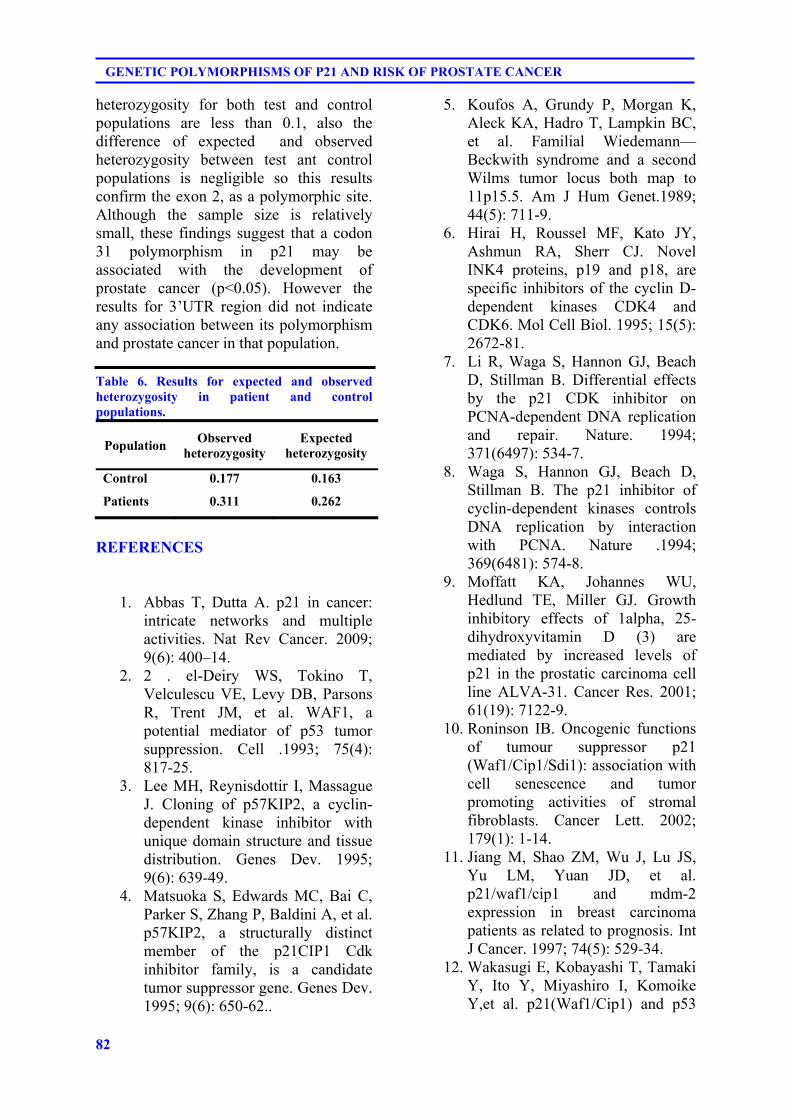
82
GENETIC POLYMORPHISMS OF P21 AND RISK OF PROSTATE CANCER
heterozygosity for both test and control populations are less than 0.1, also the difference of expected and observed heterozygosity between test ant control populations is negligible so this results confirm the exon 2, as a polymorphic site. Although the sample size is relatively small, these findings suggest that a codon 31 polymorphism in p21 may be associated with the development of prostate cancer (p<0.05). However the results for 3’UTR region did not indicate any association between its polymorphism and prostate cancer in that population. Table 6. Results for expected and observed heterozygosity in patient and control populations.
Population Observed
heterozygosity Expected
heterozygosity
Control 0.177 0.163
Patients 0.311 0.262
REFERENCES
1. Abbas T, Dutta A. p21 in cancer: intricate networks and multiple activities. Nat Rev Cancer. 2009; 9(6): 400–14.
2. 2 . el-Deiry WS, Tokino T, Velculescu VE, Levy DB, Parsons R, Trent JM, et al. WAF1, a potential mediator of p53 tumor suppression. Cell .1993; 75(4): 817-25.
3. Lee MH, Reynisdottir I, Massague J. Cloning of p57KIP2, a cyclin-dependent kinase inhibitor with unique domain structure and tissue distribution. Genes Dev. 1995; 9(6): 639-49.
4. Matsuoka S, Edwards MC, Bai C, Parker S, Zhang P, Baldini A, et al. p57KIP2, a structurally distinct member of the p21CIP1 Cdk inhibitor family, is a candidate tumor suppressor gene. Genes Dev. 1995; 9(6): 650-62..
5. Koufos A, Grundy P, Morgan K, Aleck KA, Hadro T, Lampkin BC, et al. Familial Wiedemann—Beckwith syndrome and a second Wilms tumor locus both map to 11p15.5. Am J Hum Genet.1989; 44(5): 711-9.
6. Hirai H, Roussel MF, Kato JY, Ashmun RA, Sherr CJ. Novel INK4 proteins, p19 and p18, are specific inhibitors of the cyclin D-dependent kinases CDK4 and CDK6. Mol Cell Biol. 1995; 15(5): 2672-81.
7. Li R, Waga S, Hannon GJ, Beach D, Stillman B. Differential effects by the p21 CDK inhibitor on PCNA-dependent DNA replication and repair. Nature. 1994; 371(6497): 534-7.
8. Waga S, Hannon GJ, Beach D, Stillman B. The p21 inhibitor of cyclin-dependent kinases controls DNA replication by interaction with PCNA. Nature .1994; 369(6481): 574-8.
9. Moffatt KA, Johannes WU, Hedlund TE, Miller GJ. Growth inhibitory effects of 1alpha, 25-dihydroxyvitamin D (3) are mediated by increased levels of p21 in the prostatic carcinoma cell line ALVA-31. Cancer Res. 2001; 61(19): 7122-9.
10. Roninson IB. Oncogenic functions of tumour suppressor p21 (Waf1/Cip1/Sdi1): association with cell senescence and tumor promoting activities of stromal fibroblasts. Cancer Lett. 2002; 179(1): 1-14.
11. Jiang M, Shao ZM, Wu J, Lu JS, Yu LM, Yuan JD, et al. p21/waf1/cip1 and mdm-2 expression in breast carcinoma patients as related to prognosis. Int J Cancer. 1997; 74(5): 529-34.
12. Wakasugi E, Kobayashi T, Tamaki Y, Ito Y, Miyashiro I, Komoike Y,et al. p21(Waf1/Cip1) and p53
83
Duhok Medical Journal Volume 6, Supplement 3, 2012
protein expression in breast cancer. Am J Clin Pathol. 1997;107(6): 684-91.
13. Pruneri G, Pignataro L, Carboni N, Buffa R, Di Finizio D, Cesana BM, et al. Clinical relevance of expression of the CIP/KIP cellcycle inhibitors p21 and p27 in laryngeal cancer. J Clin Oncol.1999; 17(10): 3150-9.
14. National Institute of Environmental Health Sciences, Environmental Genome Projects. NIEHS SNPS, Dec. 2004. (http://egp.gs.washington.edu)
15. Sun Y, Hildesheim A, Li H, Li Y, Chen JY, Cheng YJ, et al. No point mutation but a codon 31ser to arg polymorphism of the WAF-1/CIP-1/p21 tumor suppressor gene in nasopharyngeal carcinoma (NPC): the polymorphism distinguishes Caucasians from Chinese. Cancer Epidemiol Biomarkers Prev. 1995; 4(3):261–7.
16. Sjalander A, Birgander R, Rannug A, Alexandrie AK, Tornling G, Beckman G. Association between the p21 codon 31 A1 (arg) allele and lung cancer. Hum Hered. 1996; 46(4):221–5.
17. Roh J, Kim M, Kim J, Park N, Song Y, Kang S, Lee H. Polymorphisms in codon 31 of p21 and cervical cancer susceptibility in Korean women. Cancer Lett. 2001 ;165(61):59–62.
18. Yang W, Qi Q, Zhang H, Xu W, Chen Z, Wang L, Wang Y, et al. p21 Waf1/Cip1 polymorphisms and risk of esophageal cancer. Ann Surg Oncol. 2010;17(5):1453-8.
19. Powell BL, van Staveren IL, Roosken P, Grieu F, Berns EM, Iacopetta B. Associations between common polymorphisms in TP53 and p21WAF1/Cip1 and phenotypic features of breast cancer.Carcinogenesis .2002; 23(2): 311–5.
20. Tsai MH, Chen WC, Tsai FJ. Correlation of p21 gene codon 31 polymorphism and TNF-alpha gene polymorphism with nasopharyngeal carcinoma. J Clin Lab Anal. 2002; 16(3):146–50.
21. Su L, Liu G, Zhou W, Xu LL, Miller DP, Park S,et al. No Association between the p21 codon 31 serine–arginine polymorphism and lung cancer risk.Cancer Epidemiol Biomarkers Prev. 2003; 12(2): 174–5.
22. Konishi R, Sakatani S, Kiyokane K, Suzuki K. Polymorphisms of p21 cyclin-dependent kinase inhibitor and malignant skin tumors. J Dermatol Sci. 2000; 24(3):177–83.
23. Huang SP, Wu WJ, Chang WS, Wu MT, Chen YY, Chen YJ, et al. P53 Codon 72 and p21 codon 31 polymorphisms in prostate cancer. Cancer Epidemiol Biomarkers Prev. 2004; 13:2217-24.
24. Taghavi N, Biramijamal F, Abbaszadegan MR, Khademi H, Sotoudeh M, Khoshbakht S. P21(waf1/cip1) gene polymorphisms and possible interaction with cigarette smoking in esophageal squamous cell carcinoma in northeastern Iran: a preliminary study. Arch Iran Med. 2010;13(3):235-42.
25. Li G, Liu Z, Sturgis EM, Shi Q, Chamberlain RM, Spitz MR, et al. Genetic polymorphisms of p21 are associated with risk of squamous cell carcinoma of the head and neck. Carcinogenesis .2005;26(9):1596-602.
26. Wu MT, Wu DC, Hsu HK, Kao EL, Yang CH, Lee JM. Association between p21 codon 31 polymorphism and esophageal cancer risk in a Taiwanese population. Cancer Lett .2003; 201(2):175-80.
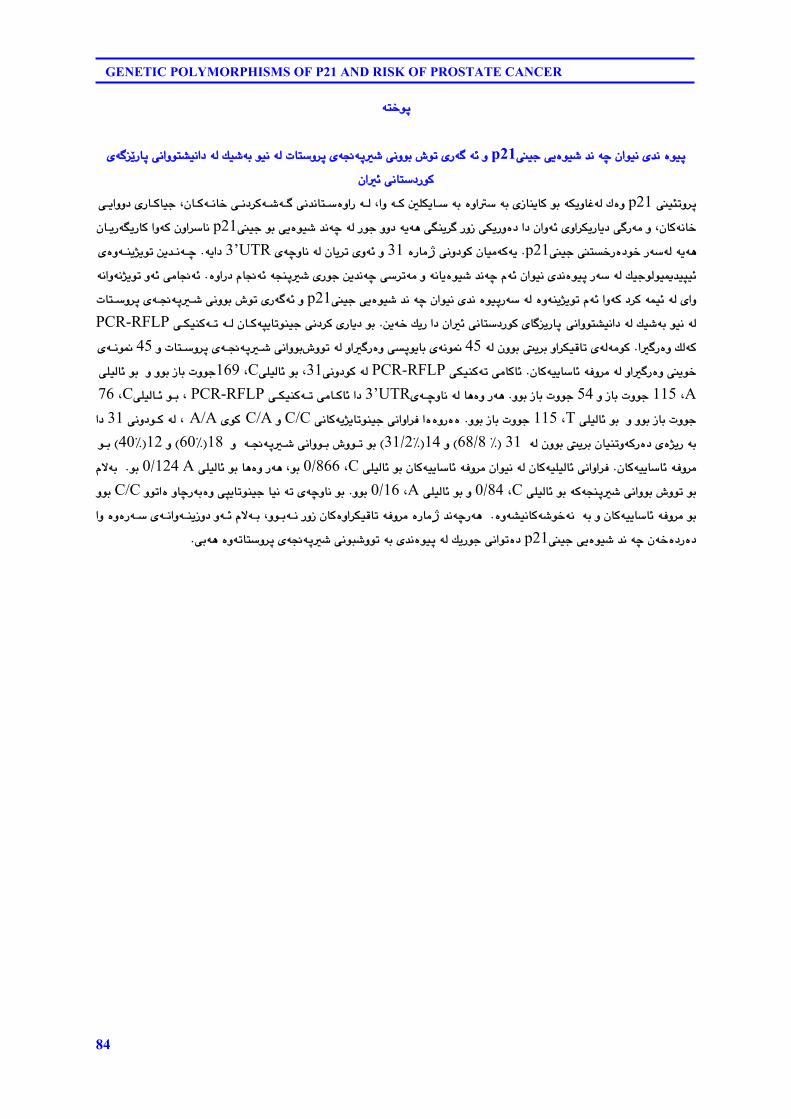
84
GENETIC POLYMORPHISMS OF P21 AND RISK OF PROSTATE CANCER
ón‚íq@@@@
qíïò@ñ‡ä@çaíïä@óš@‡ä@íï’òðî@ïup21@ì@÷@ó@ó @ñŠ@•ím@ðäìíi@’óq@−ó@ñ@qpbnì‹@Üó@íïä@ió@Úï’@Üó@ðäaìín“ïäa†@qŽîŠb óñ@ðäbn†ŠíØ@÷ça@@
qïømì‹@p21@ìò@Û@Üó@ÙîìbÌó@íi@ñŒbåîbØ@ió@ìaò@ió@@μÝÙîb@@Øó@Laì@@Üó@ìaŠò@@ðä‡äbn@@ó @@’ó@@ð䆋Ø@@äb‚ó@@LçbØ@@ñŠbØbïu@ìì†@ðîa@äb‚ó@LçbØ@ì@àó@Š ð@ñìa‹ÙîŠbî†@÷ó@çaì@a†@†ò@ðÙîŠì@ŠìŒ@ åî‹ð@èó@@óî@ìì†@Šíu@Üó@óš@‡ä@íï’ò@ðî@íi@ïup21@çìa‹bä@Øó@aì@îŠbØó@@çbîŠ@èó@îó@Üó@ó@Š@†í‚ò@n‚Š@ïup21@Nîó@Øó@çbïà@ðäì†íØ@ژŠbàò@31@ì@÷ó@ñì@çbî‹m@Üó@ìbäóš@ñ@3’UTR@îa†ó@N@óš@@æî‡ä@îím‰@åîó@ìò@ñ@ï÷rÚïuíÜíﺇï@Üó@ó@Š@qíïò@ñ‡ä@çaíïä@÷ó@ã@óš@‡ä@íï’ò@äbîó@ì@àó@ð‹m@óš@æî‡ä@ñŠíu@’qvåó@÷ó@ãb−@ìaŠ†ò@N÷ó@ðàb−@÷ó@ì@îím‰äó@äaìó@
ñaì@Üó@áï÷ó@†‹Ø@Øó@aì@÷ó@ã@îím‰åîó@ìò@Üó@ó@Šqíïò@ñ‡ä@çaíïä@óš@‡ä@íï’ò@ðî@ïup21@ì@÷ó@ó @ñŠ@•ím@ðäìíi@@’qó@@−ó@ñ@q@pbnì‹@Üó@ïäí@ió@Úï’@Üó@ðäaìín“ïäa†@qîŠb ñb@ðäbn†ŠíØ@ça÷@a†@ÚîŠ@‚ó@æî@Níi@ñŠbî†@ð䆋Ø@îbmíåïuró@@çbØ@@Üó@@mó@@ðÙïåØ@PCR-RFLP@Øó@ÚÜ@ìò@Š a@NàíØó@Üó@ñ@ìa‹ÙïÔbm@î‹i@çìíi@Üó@45@äí¹ó@ñ@íîbiqð@ìò@Š ìa@Üó@•ìím@ðäaìíi@@’qó@@−ó@ñ@q@pbnì‹@ì@45@@äí¹ó@ñ@
îí‚@ìò@Š ìa@Üó@Ðì‹àó@ïîbb÷ó@çbØ@NðàbØb÷@mó@ðÙïåØ@PCR-RFLP@Üó@ðäì†íØ31L@íi@ðÝïÜb÷CL@169pìíu@Œbi@ìíi@ì@@íi@ðÝïÜb÷@AL@115@pìíu@Œbi@ì@54@pìíu@Œbi@ìíi@Nèó@Š@ìò@èb@Üó@ìbä@óš@ñ3’UTR@a†@@ðàbØb÷@@mó@@ðÙïåØ@PCR-RFLP@L@@íi@@ðÝïÜb÷CL@76@
pìíu@Œbi@ìíi@ì@@íi@ðÝïÜb÷@TL@115@pìíu@Œbi@ìíi@Nòò@ìŠò@òa@ðäaìa‹Ð@îbmíåïu‰îó@ðäbØ@C/C@ì@ C/AñíØ@ A/AL@Üó@@ðäì†íØ@31@a†@ió@ò@ñ@†ò@ØŠó@çbïåmì@î‹i@çìíi@Üó@@31@@EI8O68@Hì@14EI2O31@Híi@@•ìím@@ðäaìíi@@’qó@@−ó@@ì@@18EI60@Hì@12EI40@H@íi@
Ðì‹àó@ïîbb÷ó@çbØ@Nðäaìa‹Ð@ïÝïÜb÷ó@çbØ@Üó@çaíïä@Ðì‹àó@ïîbb÷ó@çbØ@íi@ðÝïÜb÷@CL@866O0@Líi@èó@Š@ìò@èb@íi@ðÝïÜb÷@A@124O0@íiN @ió@ãý@íi@•ìím@ðäaìíi@’qvåó@Øó@íi@ðÝïÜb÷@CL@84O0@ì@íi@ðÝïÜb÷@AL@16O0@ìíi@Níi@ìbäóš@ñ@mó@bïä@îbmíåïurð@ìò@ió@Ššìb@òìíma@C/C@ìíi@íi@Ðì‹àó@ïîbb÷ó@çbØ@ì@ió@@äó@’í‚ó@“ïäbØó@ìòN @èó@Šóš@‡ä@ژŠbàò@Ðì‹àó@ìa‹ÙïÔbmò@çbØ@ŠìŒ@@äó@@Lìíi@@ió@ãý@@÷ó@ì@@åîŒì†ó@@äaìó@ñ@@ó@Šò@ìò@aì@†ò@†Šò@‚ó@ç@óš@‡ä@íï’ò@ðî@ïup21@†ò@ðäaím@ÚîŠíu@Üó@qíïò@ñ‡ä@ió@ðäíj’ìím@’óq@−ó@ñ@qmbnì‹ó@ìò@óè@ðiN@@
@@
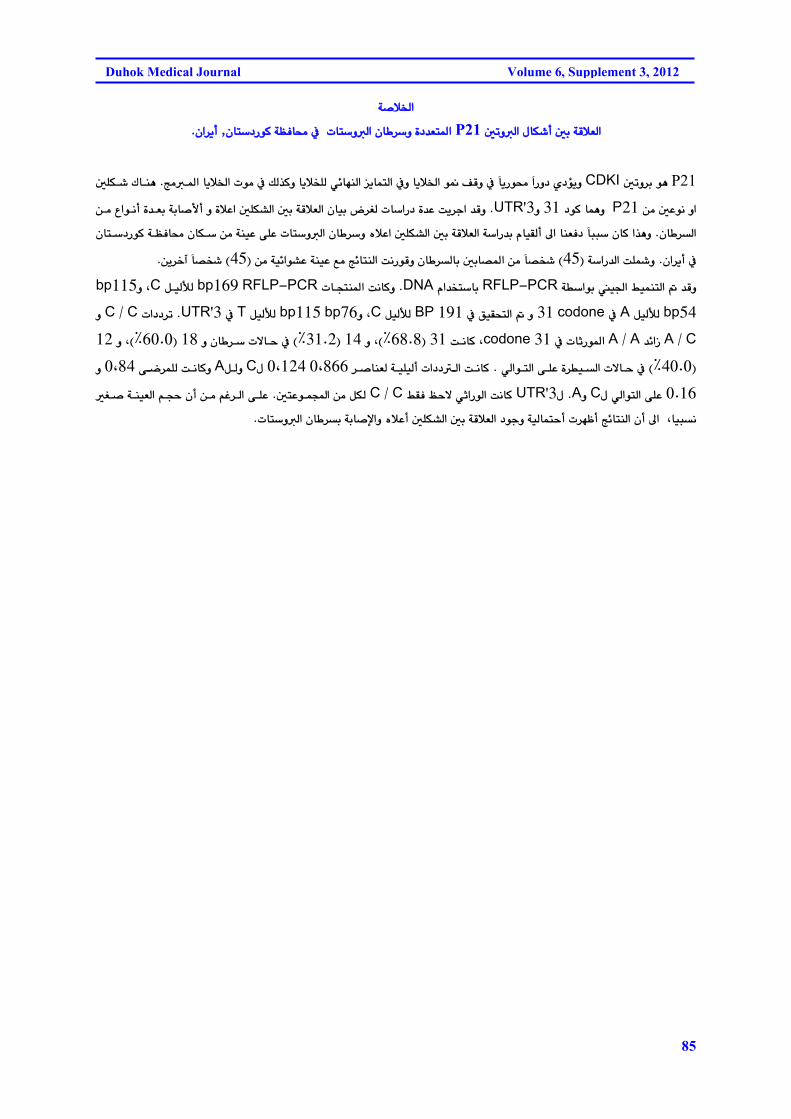
85
Duhok Medical Journal Volume 6, Supplement 3, 2012
ó–þ©a@ @@μmìÜa@ßbÙ’c@μi@óÔþÉÜaP21@@ò†‡Én¾apbnìÜa@çb ‹ì @çbn†ŠíØ@óÅÐb«@À@~ça‹îcN@@
@@P21@@μmì‹i@íèCDKI@@wà¾a@bîþ©a@píà@À@Ú܉Øì@bîþƒÝÜ@ð÷béåÜa@îbánÜa@Àì@bîþ©a@í¹@ÒÔì@À@bîŠí«@aŠì†@ñ†üîì@N@@@@μÝÙ’@Ûbåè
@æà@μÈíä@ìaP21@@@†íØ@báèì31@ì3'UTR@N@@@@æà@Ëaíäc@ò‡Éi@óib–ÿc@ì@òþÈa@μÝÙ“Üa@μi@óÔþÉÜa@çbïi@‹ÍÜ@pbaŠ†@ò‡È@oî‹ua@‡Ôìçb ‹Üa@N‰èì@@@@çbn†ŠíØ@óÅÐb«@çbÙ@æà@óåïÈ@ôÝÈ@pbnìÜa@çb ‹ì@ëþÈa@μÝÙ“Üa@μi@óÔþÉÜa@óaŠ‡i@ãbïÕÜc@¶a@båÉІ@bjj@çbØ@aça‹îc@À@N@óaŠ‡Üa@oÝìI45@H@æà@óï÷aí“È@óåïÈ@Êà@w÷bnåÜa@oäŠíÔì@çb ‹Übi@μib—¾a@æà@b—ƒ’I45@Hæî‹‚e@b—ƒ’N
@óaíi@ï§a@ÂïáånÜa@@‡ÔìPCRMRFLP@@ãa‡ƒnbiDNA@N@@pbvnå¾a@oäbØìPCRMRFLP@169bp@@@ÞïÜŁÜCì@L115bp@54bp@@ÞïÜŁÜA@@Àcodone@31@@À@ÖïÕznÜa@@ì191@BP@@ÞïÜŁÜCì@L76bp@115bp@@ÞïÜŁÜT@@À3'UTR@N@pa††‹mC@@OC@@ìC@@OA@@‡÷aŒA@@OA@@À@pbqŠí¾a31@codone@@oäbØ@[email protected]٪H@ì@[email protected]٪@H@@@ì@çb ‹@pýby@À[email protected]٪H@ì@[email protected]٪@H@@@@@ðÜaínÜa@ôÝÈ@ò‹ïÜa@pýby@À@N@@@@‹–båÉÜ@óïÝïÜc@pa††Üa@oäbØ0،866@0،124@ßC@@ÞÜìA@@@ôš‹áÝÜ@oäbØì0،84@@ì
0.16@ß@ðÜaínÜa@ôÝÈC@ìA@Nß3'UTR@@ÂÕÐ@Æyý@ðqaŠíÜa@oäbØC@@OC@@μnÈíáa@æà@ÞÙÜ@N@@@@@@@Í–@óåïÉÜa@âvy@çc@æà@âÌ‹Üa@ôÝÈw÷bnåÜa@çc@¶a@@Lbïjä@ì@ëþÈc@μÝÙ“Üa@μi@óÔþÉÜa@†íuì@óïÜbányc@p‹éÄcafipbnìÜa@çb ‹i@óib–N@@
@@
86
ANTI-MULLERIAN HORMONE IS A SIGNIFICANT MARKER FOR MALE INFERTILITY
ANTI-MULLERIAN HORMONE IS A SIGNIFICANT MARKER FOR MALE INFERTILITY
SAJEDA S. AL – CHALABI, MBChB, MSc YASIR T.AL-WATTAR, MBChB, FICMS
ISLAM M ALGALILI, BSc, MSc, PhD Submitted 18 Jun 2012; accepted 3 Sep 2012 ABSTRACT Background & objective: Anti-Mullerian hormone is a glycoprotein that belongs to the transforming growth factor- B(TGF-B) a member of the super family of growth & differentiation factors. It is thought to be involved in the inhibition of steroid hormone production in women of reproductive age. We aimed to evaluate serum anti-Mullerian hormone (AMH) in men with normal, reduced sperm concentration and in azoospermic men as a possible clinical marker of male factor infertility. Design Prospective study SettingPrivate clinic of Dr. Yasir Al-Wattar and Al-Batool Teaching Hospital in Mosul. Subjects & Methods: This study was conducted on one hundred male subjects aged less than 50 years for the period from July2011-November2011, infertile men were classified according to their sperm count into oligospermics (n=28) and azoospermics(n=47), twenty five men were normal fertile (n=25).Serum concentrations of FSH and Testosterone were measured using ELISA,serum Anti-Mullerian hormone concentrations were measured using AMH/MIS enzyme linked immunosorbant assay kit. Results: Significant differences in serum Anti- Mullerian hormone, follicle stimulating hormone and Testosterone concentrations were found between normal, oligospermic & azoospermic men.Anti-Mullerian hormone negatively correlated with follicle stimulating hormone in oligospermic and azoospermic men and positively with testosterone in azoospermics and negatively with testosterone in oligospermics. Conclusion: Anti-Mullerian hormone may serve as a marker of male infertility.
Duhok Med J 2012; 6 Suppl 3:86-91. Key words: Anti-Mullerian hormone, male fertility, follicle stimulating hormone, azoospermia.
nti-Mullerian hormone (AMH) is a glycoprotein that belongs to the
transforming growth factor- B (TGF-B) a member of the super family of growth and differentiation factors. It was identified as a factor which is being synthesized by testicular Sertoli cells, induces regression of the Mullerian ducts during male fetal development. 1,2 It continues to produced by the testes throughout life. It is thought to be involved in the inhibition of steroid hormone production in women through the reproductive age. 3 AMH not only induces regression of the Mullerian ducts during male sexual differentiation 4-6 but also plays a critical paracrine role in the regulation of Leydig
cell development and testosterone biosynthesis. 7,8 AMH has also been shown to inhibit proliferation of prepubertal progenitor Leydig cells and prevent regeneration of Leydig cells after chemical ablation. 9 In the male, AMH level rises rapidly after birth, is highest during late infancy, then gradually declines until puberty. 10 The decrease of AMH corresponds to the Sertoli cell maturation status with the onset of puberty and spermatogenesis, AMH is expressed only by immature Sertoli cells and by immunohistochemistry found only in tubules with spermatogenic arrest or Sertoli-cell-only syndrome. 11,12
The aim of the study is to verify in well-
* Medical Phyisology, College of Medicine ,University of Mosul,Iraq. ** Consultant Urologist , Al-JumhoryTeaching Hospital Mosul, Iraq. *** Medical Microbiology Al-BatoolTeaching Hospital Mosul, Iraq. Correspondence author: Sajeda Saed H. Al – Chalabi. Email:[email protected].
A
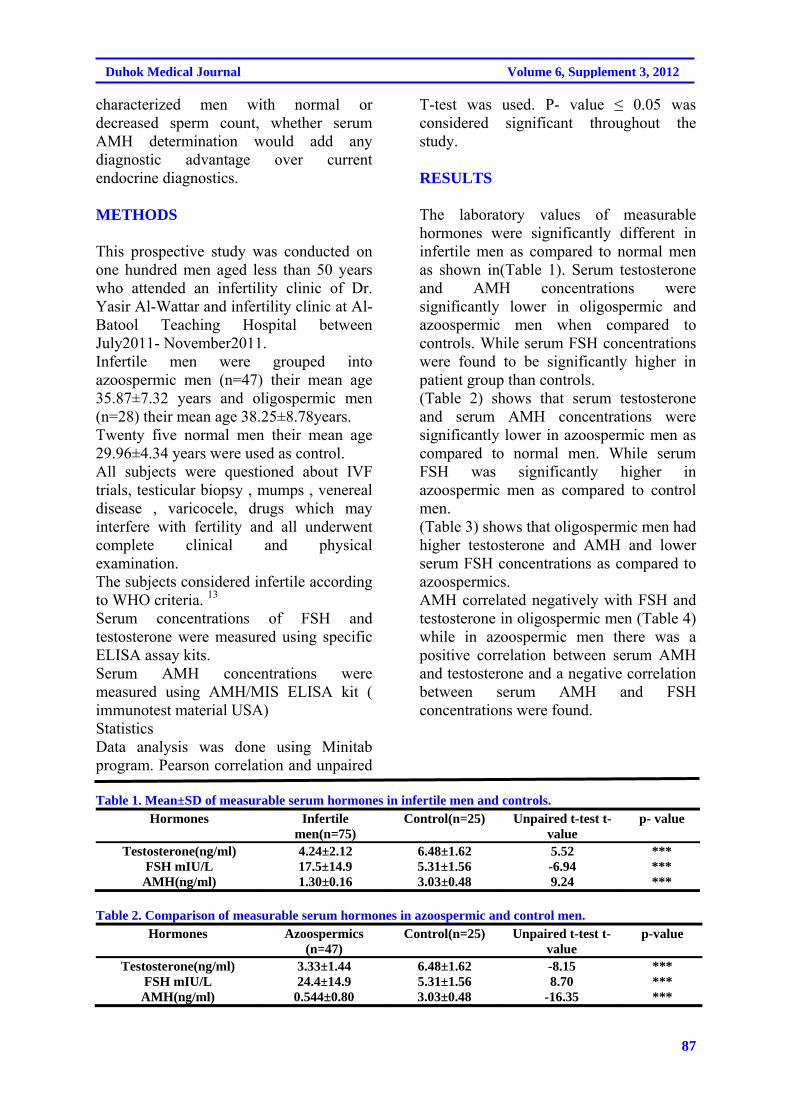
87
Duhok Medical Journal Volume 6, Supplement 3, 2012
characterized men with normal or decreased sperm count, whether serum AMH determination would add any diagnostic advantage over current endocrine diagnostics. METHODS
This prospective study was conducted on one hundred men aged less than 50 years who attended an infertility clinic of Dr. Yasir Al-Wattar and infertility clinic at Al- Batool Teaching Hospital between July2011- November2011. Infertile men were grouped into azoospermic men (n=47) their mean age 35.87±7.32 years and oligospermic men (n=28) their mean age 38.25±8.78years. Twenty five normal men their mean age 29.96±4.34 years were used as control. All subjects were questioned about IVF trials, testicular biopsy , mumps , venereal disease , varicocele, drugs which may interfere with fertility and all underwent complete clinical and physical examination. The subjects considered infertile according to WHO criteria. 13
Serum concentrations of FSH and testosterone were measured using specific ELISA assay kits. Serum AMH concentrations were measured using AMH/MIS ELISA kit ( immunotest material USA) Statistics Data analysis was done using Minitab program. Pearson correlation and unpaired
T-test was used. P- value ≤ 0.05 was considered significant throughout the study. RESULTS
The laboratory values of measurable hormones were significantly different in infertile men as compared to normal men as shown in(Table 1). Serum testosterone and AMH concentrations were significantly lower in oligospermic and azoospermic men when compared to controls. While serum FSH concentrations were found to be significantly higher in patient group than controls. (Table 2) shows that serum testosterone and serum AMH concentrations were significantly lower in azoospermic men as compared to normal men. While serum FSH was significantly higher in azoospermic men as compared to control men. (Table 3) shows that oligospermic men had higher testosterone and AMH and lower serum FSH concentrations as compared to azoospermics. AMH correlated negatively with FSH and testosterone in oligospermic men (Table 4) while in azoospermic men there was a positive correlation between serum AMH and testosterone and a negative correlation between serum AMH and FSH concentrations were found.
Table 1. Mean±SD of measurable serum hormones in infertile men and controls.
Hormones Infertile men(n=75)
Control(n=25) Unpaired t-test t-value
p- value
Testosterone(ng/ml) 4.24±2.12 6.48±1.62 5.52 *** FSH mIU/L 17.5±14.9 5.31±1.56 -6.94 *** AMH(ng/ml) 1.30±0.16 3.03±0.48 9.24 ***
Table 2. Comparison of measurable serum hormones in azoospermic and control men.
Hormones Azoospermics (n=47)
Control(n=25) Unpaired t-test t- value
p-value
Testosterone(ng/ml) 3.33±1.44 6.48±1.62 -8.15 *** FSH mIU/L 24.4±14.9 5.31±1.56 8.70 *** AMH(ng/ml) 0.544±0.80 3.03±0.48 -16.35 ***
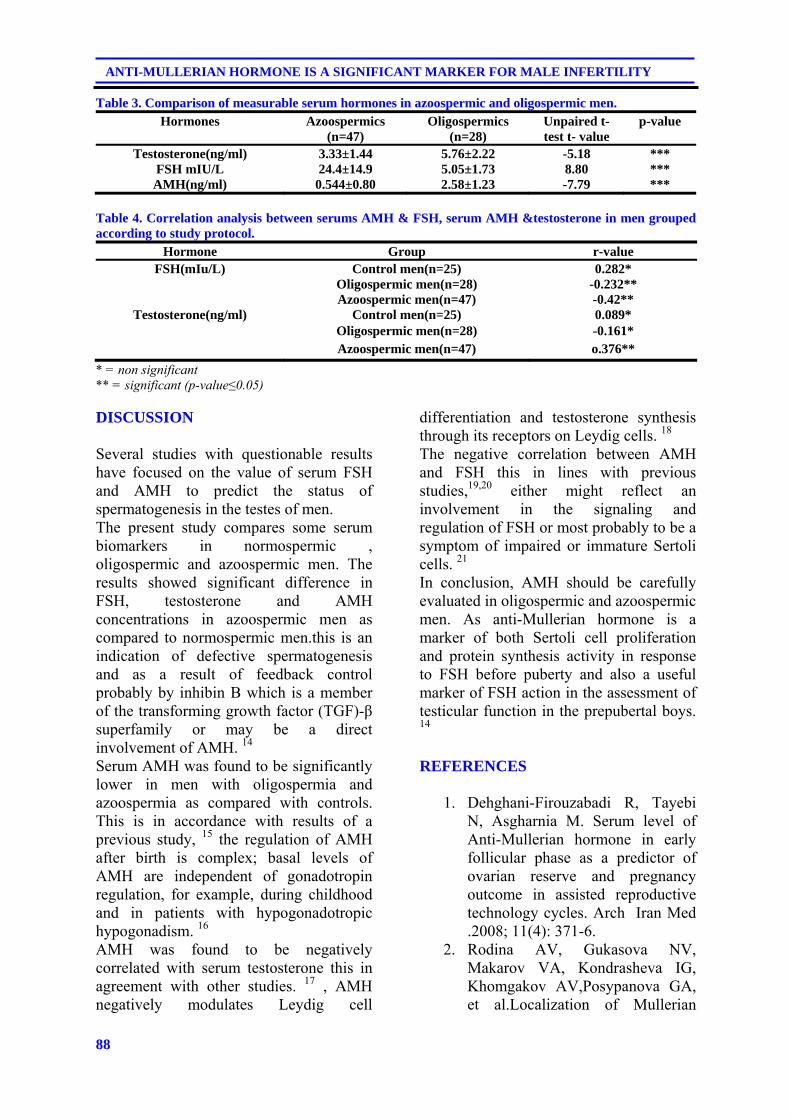
88
ANTI-MULLERIAN HORMONE IS A SIGNIFICANT MARKER FOR MALE INFERTILITY
Table 3. Comparison of measurable serum hormones in azoospermic and oligospermic men. Hormones Azoospermics
(n=47) Oligospermics
(n=28) Unpaired t-test t- value
p-value
Testosterone(ng/ml) 3.33±1.44 5.76±2.22 -5.18 *** FSH mIU/L 24.4±14.9 5.05±1.73 8.80 *** AMH(ng/ml) 0.544±0.80 2.58±1.23 -7.79 ***
Table 4. Correlation analysis between serums AMH & FSH, serum AMH &testosterone in men grouped according to study protocol.
Hormone Group r-value FSH(mIu/L) Control men(n=25) 0.282*
Oligospermic men(n=28) -0.232** Azoospermic men(n=47) -0.42**
Testosterone(ng/ml) Control men(n=25) 0.089* Oligospermic men(n=28) -0.161* Azoospermic men(n=47) o.376**
* = non significant ** = significant (p-value≤0.05) DISCUSSION
Several studies with questionable results have focused on the value of serum FSH and AMH to predict the status of spermatogenesis in the testes of men. The present study compares some serum biomarkers in normospermic , oligospermic and azoospermic men. The results showed significant difference in FSH, testosterone and AMH concentrations in azoospermic men as compared to normospermic men.this is an indication of defective spermatogenesis and as a result of feedback control probably by inhibin B which is a member of the transforming growth factor (TGF)-β superfamily or may be a direct involvement of AMH. 14 Serum AMH was found to be significantly lower in men with oligospermia and azoospermia as compared with controls. This is in accordance with results of a previous study, 15 the regulation of AMH after birth is complex; basal levels of AMH are independent of gonadotropin regulation, for example, during childhood and in patients with hypogonadotropic hypogonadism. 16 AMH was found to be negatively correlated with serum testosterone this in agreement with other studies. 17 , AMH negatively modulates Leydig cell
differentiation and testosterone synthesis through its receptors on Leydig cells. 18
The negative correlation between AMH and FSH this in lines with previous studies,19,20 either might reflect an involvement in the signaling and regulation of FSH or most probably to be a symptom of impaired or immature Sertoli cells. 21
In conclusion, AMH should be carefully evaluated in oligospermic and azoospermic men. As anti-Mullerian hormone is a marker of both Sertoli cell proliferation and protein synthesis activity in response to FSH before puberty and also a useful marker of FSH action in the assessment of testicular function in the prepubertal boys. 14
REFERENCES
1. Dehghani-Firouzabadi R, Tayebi
N, Asgharnia M. Serum level of Anti-Mullerian hormone in early follicular phase as a predictor of ovarian reserve and pregnancy outcome in assisted reproductive technology cycles. Arch Iran Med .2008; 11(4): 371-6.
2. Rodina AV, Gukasova NV, Makarov VA, Kondrasheva IG, Khomgakov AV,Posypanova GA, et al.Localization of Mullerian
89
Duhok Medical Journal Volume 6, Supplement 3, 2012
inhibiting substance receptors in various human cancer cell lines. Biochemistry (Mosc).2008; 73(7): 797-805.
3. Jang H Kim.Mullerian inhibiting substance, physiology and clinical applications . J of women,s Med. 2009;2(2): 45-7.
4. Arango NA, Lovell-Badge R, Behringer RR. Targeted mutagenesis of the endogenous mouse MIS gene promoter. In vivo definition of genetic pathways of vertebrate sexual development. Cell. 1999; 99(4):409-19.
5. Behringer RR, Cate RL, Froelick GJ, Palmiter RD, Brinster RL. Abnormal sexual development in transgenic mice chronically expressing Mullerian inhibiting substance. Nature .1990; 345(6271): 167-70.
6. Lee MM, Donahoe PK, Mullerian inhibiting substance: a gonadal hormone with multiple functions. Endocr Rev. 1993; 14(2):152-64.
7. Lee MM.MIS actions in the developing testes in: Goldberg Eed. The testis: from stem cell to sperm function. New York: Springer- verlag;2000.p. 30-42.
8. Srivaman V, Niu E, Matias JR, Donahoe PK, Maclaughlin DT, Hardy MP, et al. Mullerian inhibiting substance inhibits testosterone synthesis in adult rats. J Androl. 2001; 22(5): 750-8.
9. Salva A , Hardy MP, Wu XF, Sottas CM, Maclaughlin DT, Donahoe PK, et al.Mullerian inhibiting substance inhibits rat Leydig cell regeneration after ethylene dimethane sulphonate ablation. Boil Reprod. 2004; 70(3):600-7.
10. Lee MM, Donahoe PK, Hasegawa T, SilvermanB, Crist GB, Best S, et al. Mullerian inhibiting substance in humans: normal levels from infancy to adulthood. J Clin
Endocrinol Metab .1996; 81(2): 571-6.
11. Maymon BB, Toger L, Paz G, Kleiman SE, Schreiber L,Botchan A,et al. Sertoli cell maturation in men with azoospermia of different etiologies. Fertil Steril. 2002; 77(5):904-9.
12. Steger K, Rey R, Louis F, KlieschS, Behre HM, NieschlagE,et al. Revertion of the differentiated phenotype and maturation block in Sertoli cells in pathological human testis. Hum Reprod. 1999; 14(1): 136-43.
13. World Health Organization. Laboratory manual for the examination of human semen and semen- cervical mucus interaction.4th ed. New York: Cambridge University Press ; 1999. Appendix IA: 60-1.
14. Tuttelmann F, Nina D, Axel PN, Jenny AV, Eberhard N , Manuela S. Anti- Mullerian hormone in men with normal and reduced sperm concentration and men with maldescended testes.Fertil Steril. 2009; 91(5):1812-8.
15. Al- Qahtani A, Muttukvishna S, Appasamy M, Johous J, Granfield M, Visser JA,et al. Development of a sensitive enzyme immunoassay for anti- Mullerian hormone and the evaluation of potential clinical applications in males and females. Clin Endocrinol. 2005; 63(3): 267-73.
16. Young J, Rey R, Couzine B, Chanson P, Josso N, Schaison G. Anti-Mullerian hormone in patients with hypogonadotropic hypogonadism.J Clin Endocrinol Metab. 1999; 84(8):2696-9.
17. Rey R, Lordereun RI , Carl JC, Barbet P, Cate RL, Roger M,et al. Anti-mullerian hormone and testosterone serum levels are inversely related during normal and precious pubertal development. J
90
ANTI-MULLERIAN HORMONE IS A SIGNIFICANT MARKER FOR MALE INFERTILITY
Clin Endocrinol Metab. 1993; 77(5): 1220-6.
18. 1Racine C, Rey R, Forest MG, Louis F, Ferré A, Huhtaniemi I,et al.Receptors for anti-Mullerian hormone on Leydig cells are responsible for its effects on steroidogenesis and cell differentiation.Proc Nati Acad Sci USA.1998;95(2):594-9.
19. 1Fujisawa M, Yamasaki T, Okada H, Kamidono S. The significance of antimullerian hormone concentration in seminal plasma for spermatogenesis. Hum Reprod. 2002; 17(4): 968-70.
20. EI Garem YF, EI Arini AF, EI Beheiry AH, Zeid SA, Comhaire FH. Possible relationship between seminal plasma inhibin B and spermatogenesis in patients with azoospermia J Androl. 2002; 23(6) : 825-9.
21. Appasamy M, Muttukrishna S, Pizzey AR, Ozturk O, Groome NP, Serhal P, et al.Relationship between male reproductive sperm DNA damage and markers of oxidative stress in infertility. Reprod Biomed Online. 2007; 14(2): 159-65.
91
Duhok Medical Journal Volume 6, Supplement 3, 2012
ón‚íq@@@@
çbàýòŒ@bïØìŒóä@íi@óÄbšŠói@bØóäb“ïä@çbî‹ŽïÜíà@õˆ†@ŽôäíàŠíè@@@@
wäbàŠb÷ì@ôØó“ŽïqZ@@âŽïØ@Žômò‹Ðb÷@Óò‡Ü@õ‡îìn@æŽïäíàŠíè@a‰ŽîŠ@òŠbî†@Žôî@íØ@ŽõŠaŠòì@æŽîŠónØbÐ@Žôqì‹ @ˆ@óØóåïmì‹q@çbî‹ŽïÜíà@õˆ†@ŽôäíàŠíè@@pó؆@NÄb½ím@Žôi@æŽïî@ì@âŽïØ@LßbàŠíä@çaì@bÄb½ím@æŽîìó÷@çbàýòŒ@Óò‡Ü@ŽôäíàŠíè@ôÄ@Žônb÷@bä‡äbäóÜóè@ŽôåïÜíØóÄ@bªbàŠb÷N@@
ŒaíŽï’Z@óî@ôäìí›Ñîì†@bØóåïÜíØóÄN@@ŽôåïÜíØóÄ@æŽïÙŽîŠZ@@ˆ@ìíi@áŽïØ@çaì@Žôîˆ@íØ@çìíi@ŽôåïÜíØóÄ@ŽôÄ@õŠa‡’ói@ãýòŒ@†ó50@m@aŠójÄbä†@çýb@@bèóà2011@@@Žõì†@bî‹š@bmóè@Žõ2011@N
@@@æióä@ïè@æŽïî@La†@çaì@bÄb÷†@bÄb½ím@aŠbàˆ@Òîì‡Ü@ç‹Ùqì‹ @ìíjmbè@çbàýòŒ@çbÄ@bïØìŒóäI47@@‘óØH@@@@æióè@âŽïØ@æŽïî@LI28@H@@@ßbàŠíä@æŽïî@ìI25@NH@bÙŽî‹i@çbÅïq@óåmbè@õŒó òŠ@æŽïäíàŠíèELISA@@bÙŽî‹i@çbî‹ŽïÜíà@õˆ†@ŽôäíàŠíèìAMH/MISN@@
ãb−ó÷Z@@@@ŽïØ@çaì@æŽïÄb½ím@LŽðî@ì@ßbàŠíä@æŽïàýòŒ@aŠójÄbä†@õŒó òŠ@LŽðäíàŠíè@ßó †@çbî‹ŽïÜíà@õˆ†@ŽôäíàŠíè@bî@´î†@ómbè@ÄbšŠói@bØóïîŒaìbïu@@çbî@âõóä@N@ŽôäíàŠíè@ßó †@ìíi@ôåîŠóä@bî@çbî‹ŽïÜíà@õˆ†@ŽôäíàŠíè@bî‡äòíîóqFSH@@Óò‡ÜçìnínŽïm@ŽôäíàŠíè@ßó †@ìíi@ôåîŠó÷@bî@ì@ÛìŒóä@æŽïàýòŒN@@
ãb−ó÷Šò†ZçbàýòŒ@bïØìŒóä@íi@ÛòŠò‡äb“ïä@Ûòì@çbåï÷ŠbÙi@ónŽïéi@oïi†@çbî‹ŽïÜíà@õˆ†@ŽôäíàŠíèN@@
ó–þ©a@ @ßbu‹Üa@âÕÉÜ@óÔŠbÐ@óàþÉØ@æîŠ@ðÜíà@ôåmbäíà‹è@@
@@óà‡ÕàZæà@ÞÔa@âèŠbáÈc@߇Éà@ÞuŠ@óøà@ôÝÈ@óaŠ‡Üa@oî‹uc@@Œí¸@æà@òÑÝÜ@óå@μ½2011M@ðäbrÜa@æî‹“m2011@@ïØ‹m@âïïÕnÜ@Ú܈ì
æà@çbØ@ aˆg@óЋɾì@ÒåÜa@ãa‡Éäa@âéî‡Ü@æî‰ÝÜaì@ÒåÜa@ïØ‹m@À@óÝÔ@âéî‡Ü@æî‰ÝÜa@ßbu‹Üaì@μïÉïjÜa@ßbu‹Üa@À@æîŠ@ðÜíà@äc@çíà‹è@ßbu‹Üa@âÕÈ@À@óàþÉØ@êàa‡ƒna@æÙá¾aN@@
szjÜa@׋ Z@bu‹Üa@Òïå—m@@ó½@óaŠ‡Üa@oÝ@Ú܉Ø@ÒåÜa@ãa‡Éäa@óÈíáª@¶aì@ÒåÜa@óÝÔ@óÈíáª@¶a@ÒåÜa@†‡È@ky@μáïÕÉÜa@ßðÉïj @ÞuŠ@çì‹“ÈìN@@
@ßc@Œbéu@óaíi@ñ‹Ø‰Üa@çíà‹aì@kî‹vÝÜ@Ña@çíà‹èì@æîŠ@ðÜíà@äc@çíà‹è@õínà@‘bïÔ@ELISAN@@
w÷bnåÜaZýg@çíà‹è@ïØ‹m@À@|šaì@Óþn‚a@w÷bnåÜa@p‹éÄc@æîŠ@ðÜíà@ä@~@μi@âénäŠbÕà@o¸@bà‡åÈ@ñ‹Ø‰Üa@çíà‹aì@kî‹vÝÜ@Ña@çíà‹a@μáïÕÉÜa@ßbu‹Üaì@μïÉïjÜa@ßbu‹ÜaN@@
pbubånÿcZ@Ûbåè@çbØ@ báåïi@μáïÕÉÜa@ßbu‹Üa@À@kî‹vÝÜ@ Ña@çíà‹aì@æîŠ@ðÜíà@äc@çíà‹è@μi@ óïÙÈ@ óÔþÈ@†íuì@ÆyíÜ@Ú܉Øäc@çíà‹è@μi@ ó @ óÔþÈ@À@ñ‹Ø‰Üa@ çíà‹a@ Êà@ óïÙÈ@ óÔþÉÜa@oäbØ@ báåïi@ÒåÜa@ ãa‡Éäa@ óÈíáª@À@ñ‹Ø‰Üa@ çíà‹aì@æîŠ@ðÜíà@
ÒåÜa@ãa‡Éäa@óÈíáªN@@
92
SOME OF THE PHYSICAL PROPERTIES OF MODIFIED MICROHYBRID…
SOME OF THE PHYSICAL PROPERTIES OF MODIFIED MICROHYBRID COMPOSITE
(AN IN VITRO STUDY)
SAZAN SHERDIL SALEEM, BDS, MSc SALEM AL SALEM AL-SAMARAI, BDS, HDD, PhD
DARA HAMARASHED SAEED, BDS, MSc, PhD Submitted 18 Jun 2012; accepted 3 Sep 2012 ABSTRACT Background and Objectives: The aim of this study was to measure the water sorption (WS), water solubility (SO) and depth of cure (DC) of modified microhybrid composite resins by adding 2 types of nanofillers in two concentration 3% and 5% and comparing them to unmodified microhybrid composite resins and to nanofilled composite resin. Methods: For water sorption (WS) and solubility (SO), ten disk-shaped specimens of each resin composite were made for each group and stored in desiccators until constant mass was achieved. Specimens were then stored in water for 7 days, and the mass of each specimen was measured. The specimens were dried again and weighed. The WS and SO were calculated from these measurements. For depth of cure test ten metal moulds with 6 mm long and 4 mm in diameter were prepared then filled with the tested materials. After irradiation, the uncured material gently removed, and measured by micrometer. Data analyzed by one-way ANOVA. Results: The results showed there were significant differences among the groups in the WS mean values which ranged from 10.05 to 20.69 μm/ mm³, while the SO mean values were ranged from 0.2727 to5.8765 μm/ mm³. The results of depth of cure showed significance differences among the groups and mean value ranged from 0.99500 to 1.9325 mm. Conclusion: The addition of ZnO to microhybrid composite increased the WS and SO values and decreased the depth of cure values compared to the control group, while the addition of CaCO3 to microhybrid composite had no significant effect on the SO and DC values but they significantly increases the WS compared to the control.
Duhok Med J 2012; 6 Suppl 3:92-99. Key words: Resin composite, Sorption, Solubility, Depth of cure
he current trend in modern resin based composites (RBCs) of
minimizing filler size whilst aiming to improve the filler loading has sought to optimize the resultant mechano-physical properties and clinical performance. The introduction of so-called ‘nanofilled’ and ‘nano-hybrid’ materials therefore appears a logical continuation of this trend 1,2. Water sorption by composite materials is a diffusion-controlled process, and the water uptake occurs largely in the resin matrix. The water sorbed by the polymer matrix could cause filler – matrix debonding or even hydrolytic degradation of the fillers, and may affect composite materials by
reducing their mechanical properties 3,4 . The other physical properties is the depth of cure (DC), it is usually referring to the thickness of a RBC that is “adequately” cured, which is influenced by numerous factors, including the amount, size and type of fillers, RBC shade, photoinitiator type and concentration refractive index mismatch, light irradiation source and irradiation duration 5,6 . Quadrent anterior shine is a microhybrid composite composite resin commonly used for anterior teeth. To use it for posterior teeth, certain modification should be investigated. Accordingly this study was designed to evaluate the physical properties of previously mentioned
*PhD candidate in conservative dentistry, Presidency of The Foundation of Technical Education/Erbil, MedicalTechnical Institute, Dental Department. ** Professor. Hawler Medical University, College of Dentistry. ***. Hawler Medical University, College of Dentistry. Correspondence author: Sazan Sherdil Saleem. Email; [email protected]: 07504623161
T
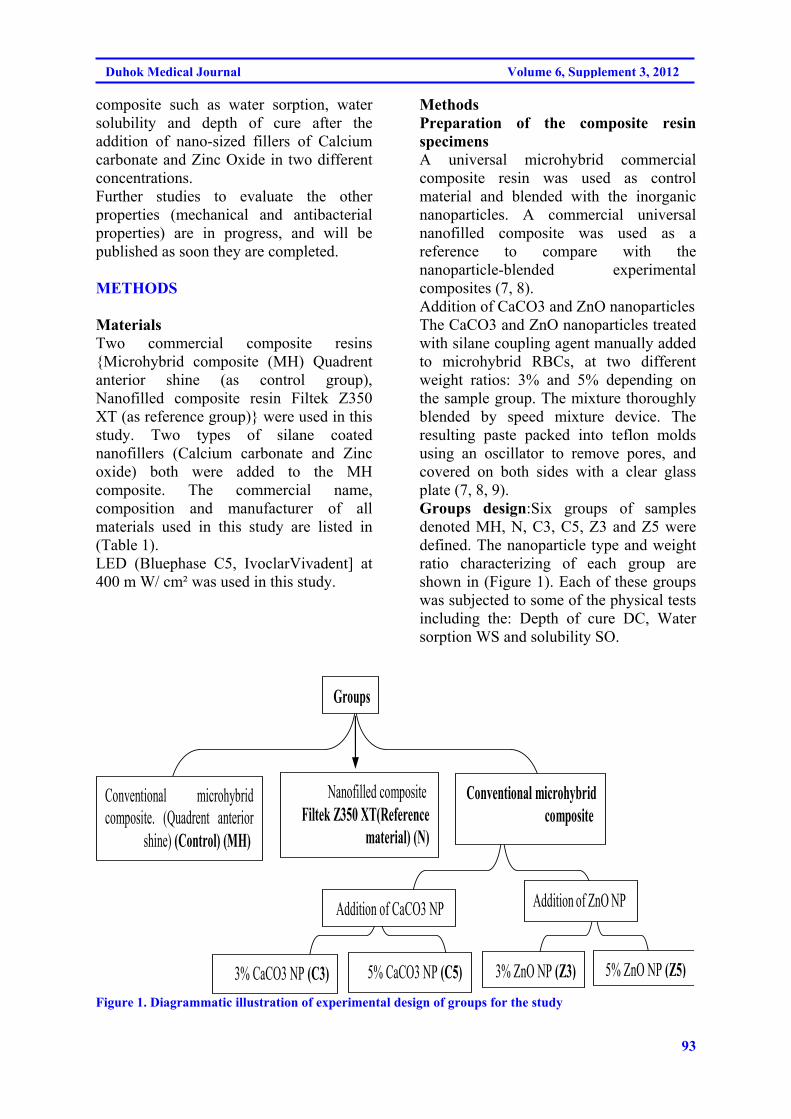
93
Duhok Medical Journal Volume 6, Supplement 3, 2012
composite such as water sorption, water solubility and depth of cure after the addition of nano-sized fillers of Calcium carbonate and Zinc Oxide in two different concentrations. Further studies to evaluate the other properties (mechanical and antibacterial properties) are in progress, and will be published as soon they are completed.
METHODS
Materials Two commercial composite resins Microhybrid composite (MH) Quadrent anterior shine (as control group), Nanofilled composite resin Filtek Z350 XT (as reference group) were used in this study. Two types of silane coated nanofillers (Calcium carbonate and Zinc oxide) both were added to the MH composite. The commercial name, composition and manufacturer of all materials used in this study are listed in (Table 1). LED (Bluephase C5, IvoclarVivadent] at 400 m W/ cm² was used in this study.
Methods Preparation of the composite resin specimens A universal microhybrid commercial composite resin was used as control material and blended with the inorganic nanoparticles. A commercial universal nanofilled composite was used as a reference to compare with the nanoparticle-blended experimental composites (7, 8). Addition of CaCO3 and ZnO nanoparticles The CaCO3 and ZnO nanoparticles treated with silane coupling agent manually added to microhybrid RBCs, at two different weight ratios: 3% and 5% depending on the sample group. The mixture thoroughly blended by speed mixture device. The resulting paste packed into teflon molds using an oscillator to remove pores, and covered on both sides with a clear glass plate (7, 8, 9). Groups design:Six groups of samples denoted MH, N, C3, C5, Z3 and Z5 were defined. The nanoparticle type and weight ratio characterizing of each group are shown in (Figure 1). Each of these groups was subjected to some of the physical tests including the: Depth of cure DC, Water sorption WS and solubility SO.
Nanofilled composite Filtek Z350 XT(Reference
material) (N)
3% ZnO NP (Z3) 5% ZnO NP (Z5) 3% CaCO3 NP (C3)
Conventional microhybrid composite
Addition of ZnO NP
Conventional microhybrid composite. (Quadrent anterior
shine) (Control) (MH)
Groups
5% CaCO3 NP (C5)
Addition of CaCO3 NP
Figure 1. Diagrammatic illustration of experimental design of groups for the study
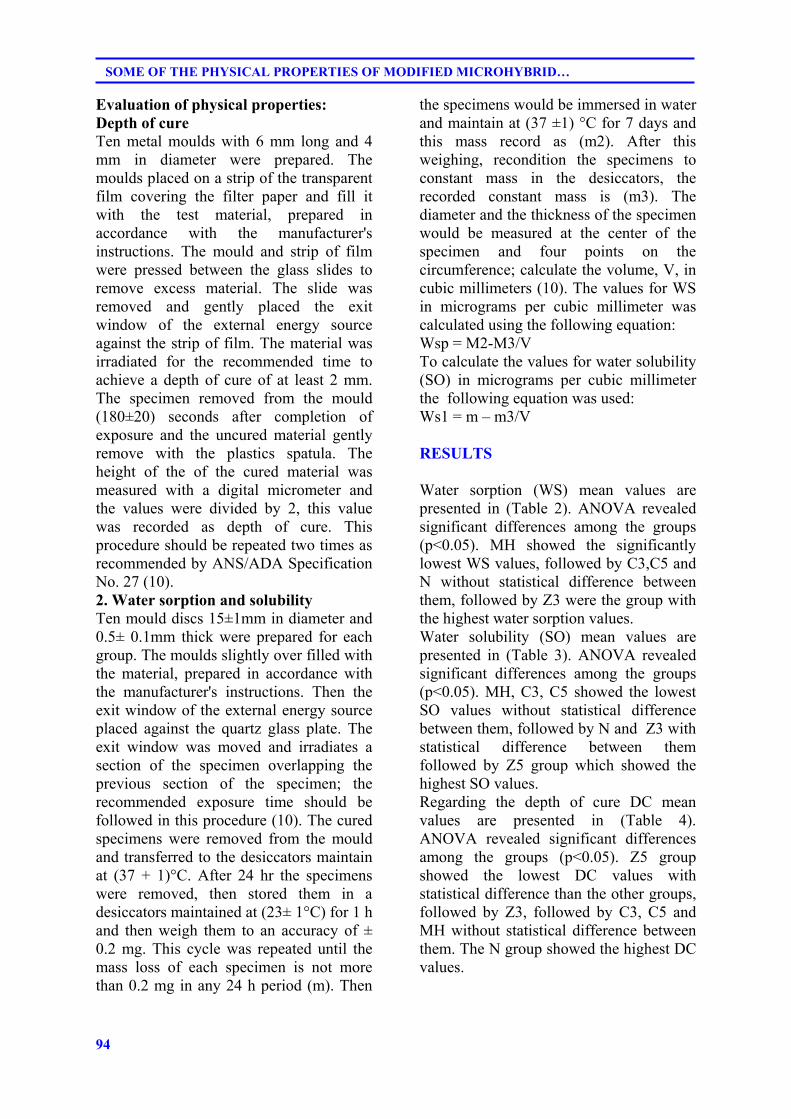
94
SOME OF THE PHYSICAL PROPERTIES OF MODIFIED MICROHYBRID…
Evaluation of physical properties: Depth of cure Ten metal moulds with 6 mm long and 4 mm in diameter were prepared. The moulds placed on a strip of the transparent film covering the filter paper and fill it with the test material, prepared in accordance with the manufacturer's instructions. The mould and strip of film were pressed between the glass slides to remove excess material. The slide was removed and gently placed the exit window of the external energy source against the strip of film. The material was irradiated for the recommended time to achieve a depth of cure of at least 2 mm. The specimen removed from the mould (180±20) seconds after completion of exposure and the uncured material gently remove with the plastics spatula. The height of the of the cured material was measured with a digital micrometer and the values were divided by 2, this value was recorded as depth of cure. This procedure should be repeated two times as recommended by ANS/ADA Specification No. 27 (10). 2. Water sorption and solubility Ten mould discs 15±1mm in diameter and 0.5± 0.1mm thick were prepared for each group. The moulds slightly over filled with the material, prepared in accordance with the manufacturer's instructions. Then the exit window of the external energy source placed against the quartz glass plate. The exit window was moved and irradiates a section of the specimen overlapping the previous section of the specimen; the recommended exposure time should be followed in this procedure (10). The cured specimens were removed from the mould and transferred to the desiccators maintain at (37 + 1)°C. After 24 hr the specimens were removed, then stored them in a desiccators maintained at (23± 1°C) for 1 h and then weigh them to an accuracy of ± 0.2 mg. This cycle was repeated until the mass loss of each specimen is not more than 0.2 mg in any 24 h period (m). Then
the specimens would be immersed in water and maintain at (37 ±1) °C for 7 days and this mass record as (m2). After this weighing, recondition the specimens to constant mass in the desiccators, the recorded constant mass is (m3). The diameter and the thickness of the specimen would be measured at the center of the specimen and four points on the circumference; calculate the volume, V, in cubic millimeters (10). The values for WS in micrograms per cubic millimeter was calculated using the following equation: Wsp = M2-M3/V To calculate the values for water solubility (SO) in micrograms per cubic millimeter the following equation was used: Ws1 = m – m3/V RESULTS Water sorption (WS) mean values are presented in (Table 2). ANOVA revealed significant differences among the groups (p<0.05). MH showed the significantly lowest WS values, followed by C3,C5 and N without statistical difference between them, followed by Z3 were the group with the highest water sorption values. Water solubility (SO) mean values are presented in (Table 3). ANOVA revealed significant differences among the groups (p<0.05). MH, C3, C5 showed the lowest SO values without statistical difference between them, followed by N and Z3 with statistical difference between them followed by Z5 group which showed the highest SO values. Regarding the depth of cure DC mean values are presented in (Table 4). ANOVA revealed significant differences among the groups (p<0.05). Z5 group showed the lowest DC values with statistical difference than the other groups, followed by Z3, followed by C3, C5 and MH without statistical difference between them. The N group showed the highest DC values.
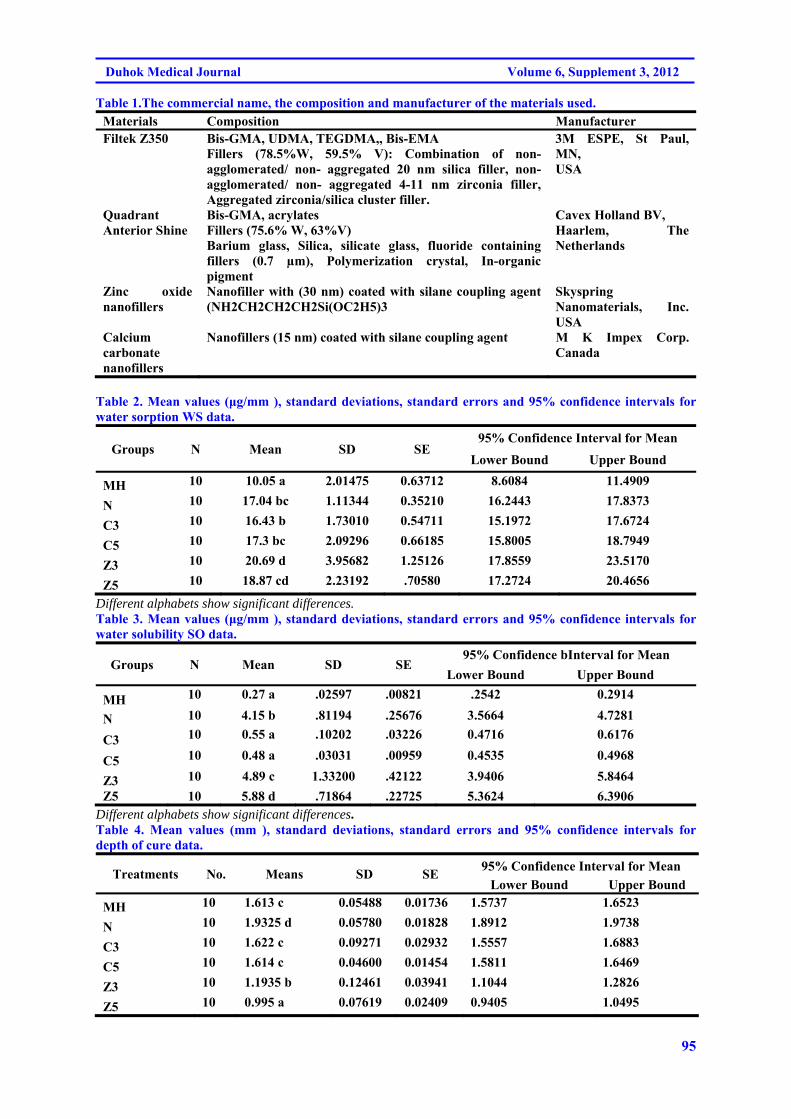
95
Duhok Medical Journal Volume 6, Supplement 3, 2012
Table 1.The commercial name, the composition and manufacturer of the materials used. Materials Composition Manufacturer Filtek Z350 Bis-GMA, UDMA, TEGDMA,, Bis-EMA
Fillers (78.5%W, 59.5% V): Combination of non- agglomerated/ non- aggregated 20 nm silica filler, non- agglomerated/ non- aggregated 4-11 nm zirconia filler, Aggregated zirconia/silica cluster filler.
3M ESPE, St Paul, MN, USA
Quadrant Anterior Shine
Bis-GMA, acrylates Fillers (75.6% W, 63%V) Barium glass, Silica, silicate glass, fluoride containing fillers (0.7 µm), Polymerization crystal, In-organic pigment
Cavex Holland BV, Haarlem, The Netherlands
Zinc oxide nanofillers
Nanofiller with (30 nm) coated with silane coupling agent (NH2CH2CH2CH2Si(OC2H5)3
Skyspring Nanomaterials, Inc. USA
Calcium carbonate nanofillers
Nanofillers (15 nm) coated with silane coupling agent M K Impex Corp. Canada
Table 2. Mean values (μg/mm ), standard deviations, standard errors and 95% confidence intervals for water sorption WS data.
Groups N Mean SD SE 95% Confidence Interval for Mean
Lower Bound Upper Bound
MH 10 10.05 a 2.01475 0.63712 8.6084 11.4909
N 10 17.04 bc 1.11344 0.35210 16.2443 17.8373
C3 10 16.43 b 1.73010 0.54711 15.1972 17.6724
C5 10 17.3 bc 2.09296 0.66185 15.8005 18.7949
Z3 10 20.69 d 3.95682 1.25126 17.8559 23.5170
Z5 10 18.87 cd 2.23192 .70580 17.2724 20.4656
Different alphabets show significant differences. Table 3. Mean values (μg/mm ), standard deviations, standard errors and 95% confidence intervals for water solubility SO data.
Groups N Mean SD SE 95% Confidence bInterval for Mean
Lower Bound Upper Bound
MH 10 0.27 a .02597 .00821 .2542 0.2914
N 10 4.15 b .81194 .25676 3.5664 4.7281
C3 10 0.55 a .10202 .03226 0.4716 0.6176
C5 10 0.48 a .03031 .00959 0.4535 0.4968
Z3 10 4.89 c 1.33200 .42122 3.9406 5.8464
Z5 10 5.88 d .71864 .22725 5.3624 6.3906 Different alphabets show significant differences. Table 4. Mean values (mm ), standard deviations, standard errors and 95% confidence intervals for depth of cure data.
Treatments No. Means SD SE 95% Confidence Interval for Mean
Lower Bound Upper Bound
MH 10 1.613 c 0.05488 0.01736 1.5737 1.6523
N 10 1.9325 d 0.05780 0.01828 1.8912 1.9738
C3 10 1.622 c 0.09271 0.02932 1.5557 1.6883
C5 10 1.614 c 0.04600 0.01454 1.5811 1.6469
Z3 10 1.1935 b 0.12461 0.03941 1.1044 1.2826
Z5 10 0.995 a 0.07619 0.02409 0.9405 1.0495
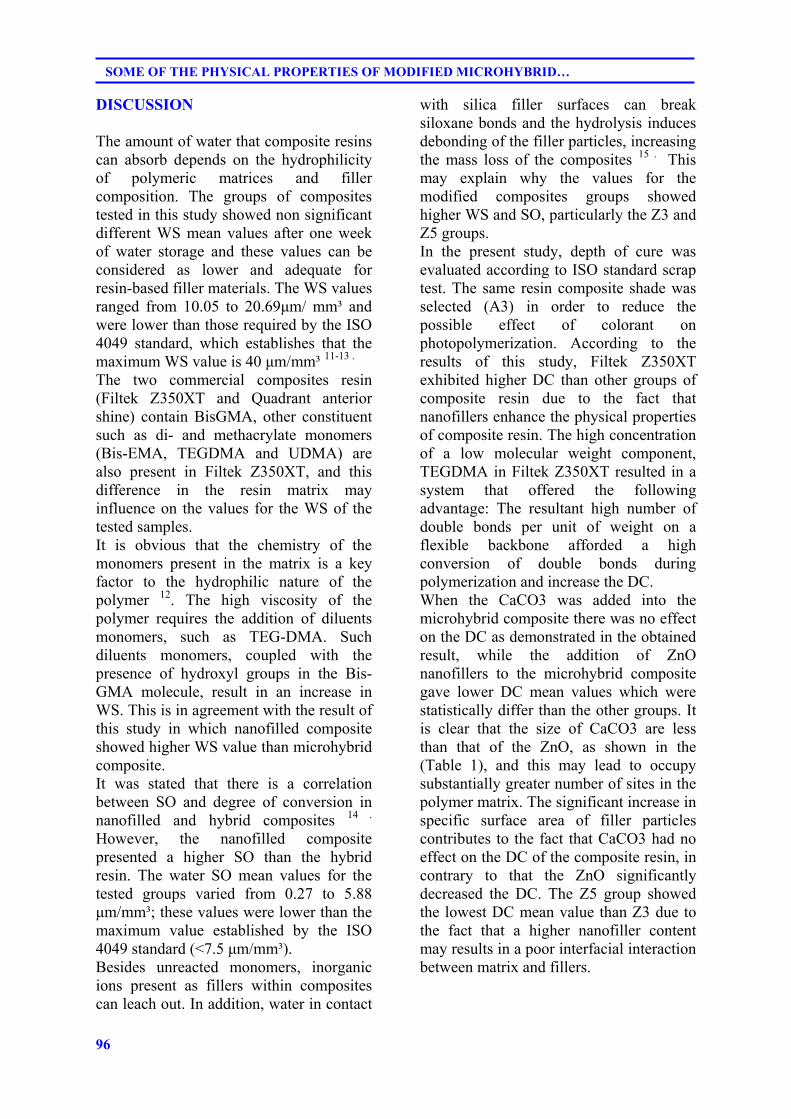
96
SOME OF THE PHYSICAL PROPERTIES OF MODIFIED MICROHYBRID…
DISCUSSION The amount of water that composite resins can absorb depends on the hydrophilicity of polymeric matrices and filler composition. The groups of composites tested in this study showed non significant different WS mean values after one week of water storage and these values can be considered as lower and adequate for resin-based filler materials. The WS values ranged from 10.05 to 20.69μm/ mm³ and were lower than those required by the ISO 4049 standard, which establishes that the maximum WS value is 40 μm/mm³ 11-13 .
The two commercial composites resin (Filtek Z350XT and Quadrant anterior shine) contain BisGMA, other constituent such as di- and methacrylate monomers (Bis-EMA, TEGDMA and UDMA) are also present in Filtek Z350XT, and this difference in the resin matrix may influence on the values for the WS of the tested samples. It is obvious that the chemistry of the monomers present in the matrix is a key factor to the hydrophilic nature of the polymer 12. The high viscosity of the polymer requires the addition of diluents monomers, such as TEG-DMA. Such diluents monomers, coupled with the presence of hydroxyl groups in the Bis-GMA molecule, result in an increase in WS. This is in agreement with the result of this study in which nanofilled composite showed higher WS value than microhybrid composite. It was stated that there is a correlation between SO and degree of conversion in nanofilled and hybrid composites 14 . However, the nanofilled composite presented a higher SO than the hybrid resin. The water SO mean values for the tested groups varied from 0.27 to 5.88 μm/mm³; these values were lower than the maximum value established by the ISO 4049 standard (<7.5 μm/mm³). Besides unreacted monomers, inorganic ions present as fillers within composites can leach out. In addition, water in contact
with silica filler surfaces can break siloxane bonds and the hydrolysis induces debonding of the filler particles, increasing the mass loss of the composites 15 . This may explain why the values for the modified composites groups showed higher WS and SO, particularly the Z3 and Z5 groups. In the present study, depth of cure was evaluated according to ISO standard scrap test. The same resin composite shade was selected (A3) in order to reduce the possible effect of colorant on photopolymerization. According to the results of this study, Filtek Z350XT exhibited higher DC than other groups of composite resin due to the fact that nanofillers enhance the physical properties of composite resin. The high concentration of a low molecular weight component, TEGDMA in Filtek Z350XT resulted in a system that offered the following advantage: The resultant high number of double bonds per unit of weight on a flexible backbone afforded a high conversion of double bonds during polymerization and increase the DC. When the CaCO3 was added into the microhybrid composite there was no effect on the DC as demonstrated in the obtained result, while the addition of ZnO nanofillers to the microhybrid composite gave lower DC mean values which were statistically differ than the other groups. It is clear that the size of CaCO3 are less than that of the ZnO, as shown in the (Table 1), and this may lead to occupy substantially greater number of sites in the polymer matrix. The significant increase in specific surface area of filler particles contributes to the fact that CaCO3 had no effect on the DC of the composite resin, in contrary to that the ZnO significantly decreased the DC. The Z5 group showed the lowest DC mean value than Z3 due to the fact that a higher nanofiller content may results in a poor interfacial interaction between matrix and fillers.
97
Duhok Medical Journal Volume 6, Supplement 3, 2012
CONCLUSION Filler particles in composite resin seem to have influence upon WS and SO value. The addition of ZnO to microhybrid composite lead to increase the WS and SO values (Although the obtained values are within the acceptable normal limit of ANS/ADA) but it decreases the DC values when compared to the control and reference groups, on the other hand the addition of CaCO3 to microhybrid composite had no significant effect on the SO and DC values but they significantly increased the WS compared to the control and reference groups. REFERENCES
1. Harris J, Ure D. Exploring whether ‘nano’ is always necessary. Nanotechnology Perceptions. 2006; 2: 1-15.
2. Curtis AR, Shortall AC, Marquis PM, Palin WM. Water uptake and strength characteristics of a nanofilled resin-based composite.J Dent.2008;36(3):186-93.
3. Braden M, Clarke RL. Water absorption characteristics of dental microfine composite filling materials. Biomaterials. 1984; 5(6): 369—72.
4. El-Hadary A, Drummond JL. Comparative study of water sorption, solubility, and tensile bond strength of two soft lining materials. Journal of Prosthetic Dentistry. 2000; 83(3): 356—61.
5. Leprince JG, Hadis M, Shortall AC, Ferracane JL, Devaux J, Leloup G,et al.Photoinitiator type and applicability of exposure reciprocity law in filled and unfilled photoactive resins. Dent Mater. 2011; 27(2): 157–64.
6. Leprince L, Leveque P, Nysten B, Gallez G, Devaux J, Leloup G. New insight into the “depth of cure” of dimethacrylate-based
dental composites. Dental mater. 2012; 28(5): 512–20.
7. Xia Y, Zhang F, Xie H, Gu N. Nanoparticle-reinforced resin-based dental composites. J Dent. 2008; 36(6): 450- 5.
8. Aydin Sevinç B, Hanley L. Antibacterial activity of dental composites containing zinc oxide nanoparticles. J Biomed Mater Res B Biomater. 2010; 94(1), 22–31.
9. Beyth N, Yudovin-Farber I, Bahir R, Domb AJ, Weiss EI. Antibacterial activity of dental composites containing quaternary ammonium polyethylenimine nanoparticles against Streptococcus mutans. Biomaterials. 2006; 27(21): 3995–4002.
10. American National Standard/ American Dental Association Specification No.27- 2005, Resin based Filling Materials. Chicago: American Dental Association.
11. Sideridou I, Tserki V , Papanastasiou G. Study of water sorption, solubility and modulus of elasticity of light-cured dimethacrylatebased dental resins. Biomaterials. 2003; 24(4): 655-65.
12. Ito S, Hashimoto M, Wadgaonkar B, Svizero N, Carvalho RM, Yiu C, et al. Effects of resin hydrophilicity on water sorption and changes in modulus of elasticity. Biomaterials. 2005; 26(33): 6449-59.
13. Berger SB, Palialol AR, Cavalli V, Giannini M. Characterization of Water Sorption, Solubilityand Filler Particles of Light-Cured Composite Resins. Braz Dent J. 2009; 20(4): 314-8.
14. Da Silva EM, Almeida GS, Poskus LT, Guimarães JG. Relationship between the degree of conversion, solubility and salivary sorption of a hybrid and a nanofilled resin composite. J Appl Oral Sci. 2008; 16(2): 161-6.

98
SOME OF THE PHYSICAL PROPERTIES OF MODIFIED MICROHYBRID…
15. Yap AU, Wee KE. Effects of cyclic temperature changes on water sorption and solubility of
composite restoratives. Oper Dent. 2002; 27(2): 147-53.
99
Duhok Medical Journal Volume 6, Supplement 3, 2012
ón‚íq@@ça††@õòìó䆋؋q@ôr@õò††bà@ôîbîïÐ@ôÙŽïmóÑï@‡äóš@õòŠbiŠò†@Ûòìóåîím@@
ÛóîómbéÙŽïq@‡äóš@ô䆋؆bîŒ@•bq@@@@
wäbàb÷Z@@@@@@@@@@ôr@õò††bà@ôäìíi@×òŠ@õŠòíŽïq@ì@ìb÷@ôåî‰à@ì@ìb÷@õòìóäaím@õò†aŠ@ô䆋Ø@õŠbî†@óÜ@óî@î‹i@óî@òìóåîím@ãó÷@ô−bàb÷ìíi†bîŒ@•bq@ça††@õòìó䆋؋q@@ò‰ŽîŠ@ìì†@ói@Žíäbä@õò††bà@óÜ@ŠŽíu@ìì†@ôä3@E@ì5@E@@@@@@õòìó䆋؋q@õò††bà@ßó óÜ@ô䆋ØììaŠói@çb’bq
ça††@õòìó䆋؋q@õŽíäbä@õò††bà@ì@ôØòŠó@ôäa††N@@@@óØòìóåîím@õbŽîŠZ@@@@@ìb÷@ôåî‰à@ì@ìb÷@õòìóäaím@Žíi@~10@@@@@@ça††@õòìó䆋؋q@ôr@õò††bà@óÜ@@ôÙî†I@ìa‹Ø†bîŒ@H@oŽî‹Øò†ò†bàb÷
óèìoŽïiò†@‹Žïu@óØ@óÙî†@ô“ŽïØ@bm@òìòŠóØ@Ú’ìì@ôÙŽî‹Ðò†@ìbä@óÜ@oŽî ò‡Ü@~@@@@õòìbà@Žíi@ìb÷@ìbä@óÜ@oŽî ò‡Üóè@çbØóÙî†@a‡îaì†@óÜ7@ŽìŠ@~oŽî‹Øò†@”ŽïØ@çbî†@ì@òìónŽî‹Øò†@õŠbî†@çbØóÙî†@ô“ŽïØ@çb’bqN@@
i@×òŠ@õýìíÔ@ì@çìíi@×òŠ@õò†aŠ@ô䆋Ø@õŠbî†@ŽíióØò††bà@ôäìí@~10@@@@@@aìóØ@oŽî‹Øò†@ò†bàb÷@óØò††bà@õóàìí¹6@@@@ì@oŽïi@‰ŽîŠ†@áïÝà4oŽïi@çbq@áïÝà@~@ônîý@õŽíè@ói@óØò††bà@ôäìíi@×òŠ@ôîaì†ILEDH@~@õ‹Žïàb÷@ói@ì@oŽîŠ†ò†ý@•aíŽïè@ói@óØòìíi@×òŠ@ò††bà
oŽîŠíŽïqò†@ŠónïàŽì‹Ùîbà@N@õóŽîŠ@ói@óØbma†ANOVA@ìónŽîŠ†ò†@ÚŽïÜ@õŠbàb÷òN@@óØóàb−ó÷Z@a‡äbØóqì‹ @çaíŽïä@óÜ@óîóè@ìaìóm@ôØóîŒaìbïu@aì@óØ@pìóØŠò†@óØòìóåîím@ôàb−ó÷N
ó–þ©a@ @@@
óaŠ†@æÈ@Éi@™aí©a@óîìbîïÑÜa@kØ‹áÝÜ@ðvåma‹Üa@Ščía@@@@
Ó‡aZ@Ó‡a@æà@ë‰è@óaŠ‡Üa@oäbØ@‘bïÔ@™b—nàýa@çbiì‰Üaì@ð÷b¾a@Úì@kÝ—nÜa@kØ‹áÝÜ@ðvåma‹Üa@číaŠ@‡Éi@óÐbša@μÈíä@æà@pbjïj¨a@óïèbån¾a@‹Í—Üa@pbäíiŠbÙÜ@ãíïÜbÙÜa@ì@‡ïØìa@ÚäÜa@æîïØi@I3@Eì@5@@HEênäŠbÕàì@Êà@kØ‹¾a@ðvåma‹Üa@Ščí«ÍÜaN@@
óÕî‹ÜaZ@‘bïÕÜ@™b—nàýa@çbiì‰Üaì@ð÷b¾a@ò†báÝÜ@@ßbáÉna@ò‹“È@™a‹Ôc@ÞÙÜ@óÈíáª@oÅÑyì@À@Œbéu@ÒïÑvnÜa@(Dessicator)@μï¨@ßí—¨a@ôÝÈ@çŒì@oibq@~bè‡Éi@@ç‚@pbåïÉÜa@À@öb¾a@ò‡¾@óÉj@ãbîc@ì@‘bïÔ@çŒíÜa@ÞÙÜ@óåïÈ@Nbè‡Éi@@ÒïѤ@™a‹Ôÿa@‘bïÔì@çŒíÜa@ð÷béåÜa@N‘bïÕÜ@Ú@kÝ—nÜa@@›¥@ò‹“È@pbåïÈ@ÞÙÜ@óÈíáª@æà@ßþ‚@ùÝà@óäaía@óïä‡Éà@~†bÉidi@6âÝà@ßí @ì4âÝà@‹Ô@~
†aí¾bi@bè‡Éiì@@bé›î‹Ém@öí›Ü@kÝ—nÜa@ ~@†bÉjna@kØ‹¾a@ðvåma‹Üa@ÍÜa@kÝ—nà@ ~ì@‘bïÔ@ö§a@kÝ—n¾a@Ûbá¾bi@‹čÍč—¾a@IMicrometer@NH@@
w÷bnåÜaZ@p‹éÄc@w÷bnåÜa@ça@Ûbåè@׋Ð@|šaì@μi@Êïàba@À@óáïÔ@pý‡Éà@™b—nàýa@çbiì‰Üaì@ð÷b¾a@Úì@kÝ—nÜaN@@
pbubnånýaZ@ @ça@pbjïj¨a@¾aóïèbån@‹Í—Üa@pbäíiŠbÙÜ@ãíïÜbÙÜa@ì@‡ïØìa@ÚäÜa@b@p‹qc@ôÝÈ@âčïÔ@™b—nàýa@çbiì‰Üaì@ð÷b¾a@ Nça@óÐbša@pbjïjy@‡ïØìa@ÚäÜa@kØ‹áÝÜ@ðvåma‹Üa@‡îî@æà@óáïÔ@™b—nàýa@çbiì‰Üaì@ð÷b¾a@ÞÝÕîì@æà@óáïÔ@Ú@kÝ—nÜa@óäŠbÕ¾bi@Êà@kØ‹¾a@ðvåma‹Üa@ÍÜa@Ščía@æÙÜì@óÐbša@ypbjïj@pbäíiŠbÙÜa@ãíïÜbÙÜa@ïÜ@b@ñc@qdm@|šaì@ôÝÈ@âčïÔ@çbiì‰Üa@ð÷b¾a@Úì@kÝ—nÜa@béåÙÜì@‡îm@æà@óáïÔ@™b—nàýa@ð÷b¾a@óäŠbÕ¾bi@Êà@kØ‹¾a@ðvåma‹Üa@ÍÜa@ŠčíaN@@
@@
100
STUDY OF SERUM MAGNESIUM AND CALCIUM IN PREECLAMPSIA...
STUDY OF SERUM MAGNESIUM AND CALCIUM IN PREECLAMPSIA AND NORMAL PREGNANCY
SINAN BUTRUS GARABET, MBChB, FICMS
Submitted 18 Jun 2012; accepted 3 Sep 2012 ABSTRACT Background and objectives: The cause of pre-eclampsia remains unknown; calcium and magnesium have been blamed to play a role in its pathtogensis. The objective of this study was to assess variations in serum levels of those cations in healthy pregnant women and those with pre-eclampsia. Methods:This prospective study evaluated the serum levels of magnesium and calcium in the second half of pregnancy in 30 healthy normotensive pregnant women, 30 pre-eclamptic cases, thirty five age - matched healthy non-pregnant women served as a control. The study was conducted in the period of July 2010 - May 2011 Results: Pre-eclamptic women had a significant decrease in mean serum magnesium concentration (1.53 ± 0.65 mg/dL) compared with the healthy normotensive pregnant women (2.26 ± 0.73 mg/dL) and the healthy non-pregnant controls (2.31± 0.29 mg/dL). Pre-eclamptic women had a decrease in mean serum calcium concentration (8.72±0.59 mg/dL) compared with the healthy normotensive pregnant women (8.97 ± 0.52 mg/dL) and the healthy non-pregnant controls (9.12 ± 0.31 mg/dL) but these differences were not significant. Conclusion: Pre-eclampsia was clearly associated with significant hypomagnesaemia. This association may be significant in understanding the pathophysiological processes of pre-eclampsia. However, the association was not so clear for serum calcium.
Duhok Med J 2012; 6 Suppl 3: 100:106. Key words: Pre-eclampsia, hypomagnesaemia, hypocalcemia
re-eclampsia is defined as the triad of hypertension, proteinuria occurring
after 20 weeks gestation in a previously normo-tensive woman. It is specific to human pregnancies and complicates 6 – 8 % of pregnancies after week 20. Preeclampsia is still one of the leading causes of maternal and fetal morbidity and mortality. Despite intensive research for many years; the etiology of this disorder remains,unknown1-3. Magnesium is the 4th most abundant cation in the body and is present in more than 300 enzymatic systems where it is crucial for ATP metabolism4,5 .Magnesium also plays an important role in neurochemical transmission and peripheral vasodilatation and may influence blood pressure by modulating vascular tone and structure through its effects on a myriad of biochemical reactions that control vascular contraction/dilation. Magnesium acts as a
calcium channel antagonist. It stimulates the production of vasodilator prostacyclins and nitric oxide and alters vascular responses to vasoconstrictor agents. Its deficiency can also play a role in hypertension of pregnancy6-8. Magnesium and calcium have been implicated in seizure disorders, which often complicate preeclampsia9-12. Magnesium sulfate, as it appears to be safe and effective for the prevention of seizures, has been used as the drug of choice in severe pre-eclampsia and eclampsia treatment11,12. It is imperative to evaluate the levels of this cation in our pregnant ladies. Calcium plays an important role in muscle contraction and regulation of the water balance in cells. Modification of plasma calcium concentration leads to the alteration of blood pressure. The lowering of serum calcium and the increase of intracellular calcium can cause an elevation of blood pressure in pre-
* Directory of Clinical standards and Guidelines. Kurdistan Board for Medical Specialties. Email: [email protected] Mobile: 07506486747
P
101
Duhok Medical Journal Volume 6, Supplement 3, 2012
eclamptic,mothers13-16. There are several studies in this field, while some studies support the hypothesis that low serum magnesium and or calcium play an important role in the pathophysiology of systemic arterial hypertension and in the etiology of pre-eclampsia; other studies do not support this notion. The objective of this study was to assess serum magnesium and calcium levels in healthy normotensive pregnant women in order to compare them with those in pre-eclamptic cases with the aim of providing preliminary data that could be useful in the management of pre-eclampsia and eclampsia. METHODS This cross-sectional study was conducted in Kurdistan region, Erbil maternity teaching hospital between July 2010 and May2011. The participants were aged 21-33 years and divided into three groups: First group (G1) comprised 35 healthy non-pregnant women who served as controls. Second group (G2) comprised 30 normotensive primigravida, > 28 weeks of gestation. Third group (G3) consisted 30 pre-eclamptic primigravida, > 28 weeks of gestation. Normotensive non-pregnant and normotensive pregnant women were carefully matched for age with the pre-eclamptic,group. Pre-eclampsia was defined as development of blood pressure >140/90 mm Hg after the second half of gestation and proteinuria of at least 1+ on dipstick testing with or without abnormal heamogram, renal, liver or-coagulation-tests. Patients with a history of medical diseases such as hypertension, renal disease, diabetes mellitus, heart failure, ischaemic heart diseases, endocrine abnormalities and patients on magnesium sulphate and or calcium lactate medications were excluded
from the study. All participants gave informed consent after due explanation before enrollment in .All participants gave informed consent after due explanation before enrollment in the study. Blood samples were collected from the anticubital vein, centrifuged at 5,000 rpm for 5 minutes. The serum was analyzed for magnesium and calcium using bt 35i auto - analyzer. The blood sample was also sent for complete blood count, prothrombin time, partial thromboplastin time, sugar, renal and liver function tests. Statistical Analysis The values of the laboratory parameters are presented as the Mean±SD. A Student’s unpaired t-test was used for cross sectional comparisons of variables between the groups. The results were considered statistically significant when the probability of the null hypothesis in this study was less than 5% (p<0.05). RESULTS The mean age of the participants was matched in the three groups (26±8.1, 27±3.4, and 24±9.8 years) respectively. The mean systolic blood pressure (MSBP) was 115.6 ± 10.1 in healthy non-pregnant group G1, 121.3± 8.4 mmHg for normotensive pregnant women G2 and 169.4 ± 22.1 mmHg for pre-eclamptic pregnant women G3. The mean diastolic blood pressure (MDBP) for the three groups was 72.1 ± 12.5 in G1 mmHg, 69.3± 9.2 mmHg in G2 and 109.3 ± 11.8 mmHg in G3. There was no significant difference in serum magnesium level between healthy non-pregnant women G1 (2.31± 0.29 mg/dL) and normotensive pregnant women G2 (2.26 ± 0.73 mg/dL), but the serum magnesium level was significantly higher in these 2 groups as compared to the pre-eclamptic pregnant women (1.53 ± 0.65 mg/dL). Although the plasma calcium was higher
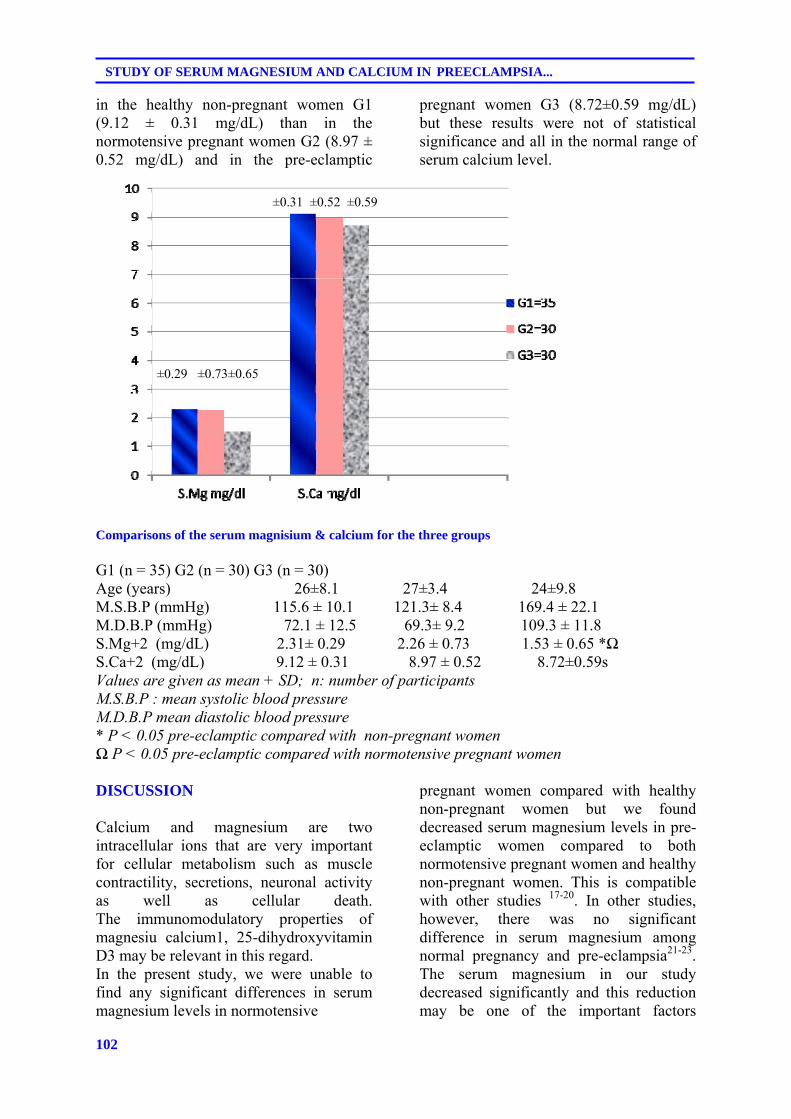
102
STUDY OF SERUM MAGNESIUM AND CALCIUM IN PREECLAMPSIA...
in the healthy non-pregnant women G1 (9.12 ± 0.31 mg/dL) than in the normotensive pregnant women G2 (8.97 ± 0.52 mg/dL) and in the pre-eclamptic
pregnant women G3 (8.72±0.59 mg/dL) but these results were not of statistical significance and all in the normal range of serum calcium level.
Comparisons of the serum magnisium & calcium for the three groups G1 (n = 35) G2 (n = 30) G3 (n = 30) Age (years) 26±8.1 27±3.4 24±9.8 M.S.B.P (mmHg) 115.6 ± 10.1 121.3± 8.4 169.4 ± 22.1 M.D.B.P (mmHg) 72.1 ± 12.5 69.3± 9.2 109.3 ± 11.8 S.Mg+2 (mg/dL) 2.31± 0.29 2.26 ± 0.73 1.53 ± 0.65 *Ω S.Ca+2 (mg/dL) 9.12 ± 0.31 8.97 ± 0.52 8.72±0.59s Values are given as mean + SD; n: number of participants M.S.B.P : mean systolic blood pressure M.D.B.P mean diastolic blood pressure * P < 0.05 pre-eclamptic compared with non-pregnant women Ω P < 0.05 pre-eclamptic compared with normotensive pregnant women DISCUSSION Calcium and magnesium are two intracellular ions that are very important for cellular metabolism such as muscle contractility, secretions, neuronal activity as well as cellular death. The immunomodulatory properties of magnesiu calcium1, 25-dihydroxyvitamin D3 may be relevant in this regard. In the present study, we were unable to find any significant differences in serum magnesium levels in normotensive
pregnant women compared with healthy non-pregnant women but we found decreased serum magnesium levels in pre-eclamptic women compared to both normotensive pregnant women and healthy non-pregnant women. This is compatible with other studies 17-20. In other studies, however, there was no significant difference in serum magnesium among normal pregnancy and pre-eclampsia21-23. The serum magnesium in our study decreased significantly and this reduction may be one of the important factors
±0.29 ±0.73±0.65
±0.31 ±0.52 ±0.59
103
Duhok Medical Journal Volume 6, Supplement 3, 2012
responsible for the pathophysiological changes of pre-eclampsia. This support Kesteloot `s hypothesis that the hemodilution effect of oestrogen and increased demand of the fetus in normal pregnancy slightly decreases the serum magnesium level and in pre-eclampsia there will be further decreases in the serum magnesium level due to increased urinary excretion of magnesium24. Magnesium deficiency causes hemodynamic abnormalities such as arterial wall thickening, abnormal vascular tone and endothelial dysfunction which are due to alteration in the biology of cellular and non cellular components of the arterial wall.This may be an important aetiological factor and explain causal relationship between hypomagnesaemia and pre-eclampsia since magnesium is involved in blood pressure regulation through an intracellular inhibition of NO synthase in endothelialcells25,Hypomagnesemia is associated with impaired production of ATP and ATP dependent sodium / potassium and calcium pump, providing another hypothesis to explain the association of hypomagnesemia with pre-eclampsia26. In the present study, the variables of serum calcium showed some reduction from the first group down to the third one but these changes were not statistically significant. Ingec27,Szmidt-Adjide28and ahidrodsari,29 ; supported, but Lopez-Jaramillo30and others31-33 didn’t support this finding; as there have been conflicting results among those studies raising doubts about the exact role of calcium in the pathophysiology of pre-eclampsia. Those studies who revealed a significant reduction in serum calcium level in pre-eclampsia supported the hypothesis that calcium might be a cause in the development of preeclampsia and stated that the effect of serum calcium on changes in the blood pressure could be explained by the level of intracellular concentration of calcium as the increase of intracellular calcium concentration when the serum calcium decreased led to
constriction of smooth muscles in the blood vessels and increase of vascular resistance. They claimed that hypocalcemia related to maternal vitamin D deficiency may predispose to the increased inflammatory response. Notably, Vitamin D deficiency may also elevate blood pressure as vascular structure and function including vascular compliance, elasticity and intima media thickness is less favorable among those women.As vitamin D plays an important role in calcium metabolism; it had been found that maternal vitamin D deficiency at less than 22 wk gestation was a strong, independent risk factor for preeclampsia34. Importantly, there was a monotonic dose-response relation between maternal serum 25(OH) D and risk of preeclampsia35. Haugen et al36 claimed that there will be 27% reduction in risk of pre-eclampsia for women on vitamin D intake 10-15 microg/day with /out 1000 mg/day calcium. Studies of seasonal patterns in preeclampsia showed the lowest incidence in summer, when sunlight is plentiful and serum 25(OH) D concentrations are at their peak, and the highest incidence in winter, when synthesis of vitamin D3 is limited in temperate zones and serum 25(OH) D levels are at their nadir37. However, our present finding showed that the mean serum calcium level in pre-eclampsia was not significantly different from healthy non-pregnant and normal pregnant-participants. These contradictory outcomes may be explained by the variations of the studied population and the difference in daily dietary intake of calcium among different populations. CONCLUSION This study clearly revealed a significant reduction of serum magnisium in pre-eclamptic cases supporting the important contribution of magnisium in the
104
STUDY OF SERUM MAGNESIUM AND CALCIUM IN PREECLAMPSIA...
pathophysiology of pre-eclampsia and explaining the importance of magnisium in the management. The difference in serum calcium was not significant, adding further dilemma to the role of calcium in the pathogenesis of pre-eclampsia, necessitating further studies to investigate such important issue. REFERENCES 1- ACOG practice bulletin. Diagnosis
and management of pre-eclampsia and eclampsia. Number 33, January 2002. Obstet Gynecol. 2002; 99(1): 159-67.
2- Cunningham FG, Leveno KJ, Bloom SL,Hauth J, Gilstrap LC,Wenstrom KD, et al. Williams’s obstetrics 22nd ed .New York: McGraw-Hill; 2005; 761-808.
3- Walker JJ. Pre-eclampsia. Lancet .2000; 356(9237): 1260-126.
4- Martínez F, Uribe A, Milán R, Teresa
Espinosa-García M, Gracía-Pérez C, Flores-Herrera O. Differential effects of magnesium on the hydrolysis of ADP and ATP in human term placenta .Effect of substrates and potassium.Int J Biochem Cell Biol. 2002; 34 (8): 1004–16.
5- Byrd RP Jr, RoyTM.Magnesium: Its proven and potential clinical significance.South Med J. 2003; 96(1): 104.
6- Tong GM, Rude RK. Magnesium deficiency in critical illness. J Intensive Care Med. 2005; 20(1): 3-17.
7- Touyz RM. Role of magnesium in the pathogenesis of hypertension. Mol Aspects Med. 2003; 24(1-3): 107 36.
8- Macdonald RL, Curry DJ, Aihara Y, Zhang ZD, Jahromi BS, Yassari R. Magnesium and experimental vasospasm. J Neurosurg. 2004; 100 (1): 106 – 10.
9. Wang T, Wang J, Cottrell JE, Kass IS.
Small physiologic changes in calcium
and magnesium alter excitability and burst firing of CIA pyramidal cells in rat hippocampal slices. J Neurosurg Anesthesiol. 2004 ; 16(3): 201 – 9.
10. Pyne G J, Cadoux – Hudson TA, Clark J F. Magnesium protection against invitro cerebral vasospasm after subarachnoid haemorrhage. Br J Neurosurg. 2001;15(5): 409 – 15.
11. Singh J, O'Donovan M, Coulter-Smith SD, Geary M.An audit of the use of magnesium sulphate in severe pre-eclampsia and eclampsia. J Obstet Gynaecol .2005; 25(1): 15-7.
12. Standley CA, Whitty JE, Mason BA, Cotton DB.Serum ionized magnesium levels in normal and pre-eclamptic gestation. Obstet Gynecol .1997; 89(1): 24-7.
13. Kosch M, Hausberg M, Louwen F, Barenbrock M, Rahn KH, Kisters K. Alterations of plasma calcium and intracellular and membrane calcium in erythrocytes of patients with pre-eclampsia. J Hum Hypertens. 2000; 14 (5): 333-6.
14. Lopez-Jaramillo P. Calcium, nitric oxide, and preeclampsia. Semin Perinatol. 2000; 24(1): 33-6.
15. Ingec M, Nazik H, Kadanali S. Urinary calcium excretion in severe pre-eclampsia and eclampsia. Clin Chem Lab Med. 2006; 44(1): 51-3.
16. Szmidt-Adjidé V, Vendittelli F, David S, Brédent-Bangou J, Janky E. Calciuria and pre-eclampsia: a case-control study. Eur J Obstet Gynecol Reprod Biol .2006; 125(2): 193-8.
17. Borekci B, Gulaboglu M, Gul M. Iodine and magnesium levels in maternal and umbilical cord blood of pre-eclamptic and normal pregnant women. Biol Trace Elem Res. 2009; 129(1-3): 1-8.
18. Sukonpan K, Phupong V. Serum calcium and serum magnesium in normal and pre-eclamptic pregnancy. Arch Gynecol Obstet .2005; 273(1): 12-6.
105
Duhok Medical Journal Volume 6, Supplement 3, 2012
19. SAali S, Khazaeli P, Ghasemi F, Mehdizadeh A.Serum magnesium and calcium ions in patients with severe pre-eclampsia/eclampsia undergoing magnesium sulfate therapy. Med Sci Monit. 2007; 13(4): 191 – 4.
20. Shalini M, Rashmi R,Ntitin M, Anjali S. Study of Serum Lipid Profile and Magnesium in Normal Pregnancy and in Pre-Eclampsia: A Case Control Study. Asian Jof Biochem. 2011; 6: 228-39.
21- Punthumapol C, Kittichotpanich B.Serum calcium, magnesium and uric acid in Pre-eclampsia and normal pregnancy. J Med Assoc Thai. 2008; 91(7): 968-73.
22- Kumru S, Aydin S, Simsek M, Sahin K, Yaman M, Ay G. Comparison of serum copper, zinc, calcium and magnesium levels in pre-eclamptic and healthy pregnant women. Biol Trace Elem Res. 2003; 94(2): 105-12.
23- Khan AM, Sullivan L, McCabe E, Levy D, Vasan RS, Wang TJ.Lack of association between serum magnesium and the risks of hypertension and cardiovascular disease. Am HeartJ. 2010; 160(4): 715-20.
24- Kesteloot H. Urinary cations and blood pressure-Population studies. Ann Clin Res. 1984; 16: 72-80
25- Sanders R, Konijnenberg A, Huijgen HJ, Wolf H, Boer K, Sanders GT. Intracellular and extracellular, ionized and total magnesium in pre-eclampsia and uncomplicated pregnancy. Clin Chem Lab Med. 1999; 37(1): 55-9.
26- Newman JC, Amarasingham JL.The pathogenesis of eclampsia:The Magnesium ischaemia hypothesis. Med Hypotheses. 1993; 40 (4): 250-6.
27- Ingec M, Nazik H, Kadanali S. Urinary calcium excretion in severe pre-eclampsia and eclampsia. Clin Chem Lab Med. 2006; 44(1): 51-3.
28- Szmidt-Adjidé V, Vendittelli F, David S, Brédent-Bangou J, Janky
E.Calciuria and pre-eclampsia: a case-control study .Eur J Obstet Gynecol Reprod Biol .2006; 125(20: 193-8.
29- Vahid-Roodsari F , Ayati S, Torabizadeh A, Ayatollah H, Esmaeli H, Shahabian M.Serum Calcium and Magnesium in Pre-eclamptic and Normal Pregnancies; A Comparative Study. J Reprod Infertil. 2008; 9(3):256-62
30- Lopez-Jaramillo P. Calcium, nitric oxide, and pre-eclampsia. Semin Perinatol .2000; 24(1): 33-6.
31- Selina A, Shelina B. Calcium and Zinc Deficiency in Pre-eclamptic Women.J Bangladesh Soc Physiol. 2011; 6(2): 94-9.
32- Sukonpan K, Phupong V. Serum calcium and serum magnesium in normal and pre-eclamptic pregnancy. Arch Gynecol Obstet. 2005; 273(1): 12-6.
33- Hofmeyr GJ, Lawrie TA, Atallah AN, Duley L.Calcium supplementation during pregnancy for preventing hypertensive disorders and related problems.Cochrane Database Syst Rev. 2010; 8.
34- Lisa Bodnar LM, Catov JM, Simhan HN, Holick MF, Powers RW, Roberts JM. Maternal Vitamin D Deficiency Increases the Risk of Pre-eclampsia. J Clin Endocrinol Metab . 2007; 92(9): 3517–22.
35- Astrup A . Calcium reduces risk of pre-eclampsia. Lancet. 2010 ; 376( 9757): 1986.
36- Haugen M, Brantsaeter AL, Trogstad L, Alexander J, Roth C, Magnus P, Meltzer HM. Vitamin D supplementation and reduced risk of pre-eclampsia in nulliparous women. Epidemiology. 2009; 20(5):720-6.
37- Magnus P, Eskild A. Seasonal variation in the occurrence of pre-eclampsia. BJOG. 2001; 108 (1): 1116–9.
106
STUDY OF SERUM MAGNESIUM AND CALCIUM IN PREECLAMPSIA...
íqón‚@@@ñ‹rÙ@ðäìíi@‹èòˆ@”Žïq@ì@ôîbb÷@ñ‹rÙ@çaíïä@óÜ@@pbØò†@ãüïÜbØ@ì@ãüïïå óà@@ðÝóà@@ðä‡åäbđÜóè@@
ì솋iaŠ@ðîaŒòŠb’@ì@wäbàb÷Z@@ãüïïå óà@ì@ãüïÜbØ@üi@òìónŽîŠó ò†@ð’óØóîüè@ò@ì@L@òŠbî†bä@ñ‹rÙ@@ðmò‹Ðb÷@ðäìíi@ñìa‹èòˆ@bnŽï÷@bmè@çbïØòŠó@ðÙŽïÜûŠ@çbïØ솊óè@óØ@@@óÜ@óîópathtogensis.@@@@@@@@@@@@b÷@óÜ@ñŠbÙäaŠü @ðä‡äbäóÜóè@üi@@óîòìóåïÜüÝÙŽïÜ@ãóÜ@wäbàb÷
@ðÝóà@ìbäóÜ@æîí‚æiò†@@ñ‹rÙ@ðäìíi@‹èòˆ@”Žïq@@ñóäaìó÷@ÿó óÜ@óîóè@@•bi@슇äóm@ñ‹rÙ@ðmò‹Ðb÷@óÜ@óØ@@óîóäbmbäüïmbØ@ìó÷@N@@çbïäbØbŽîŠ@@ì@çbØó’ü‚óäZ@đÜóè@óîòìóåïÜüÙŽïÜ@ãó÷@@@@ñ‹rÙ@ñòìbà@ãòìì†@ñòíïä@óÜ@@pbØò†@ãüïÜbØ@ì@ãüïïå óà@@ðÝóà@@ðä‡åäb
@üi30@@ì@óïîbb÷@@çbåïåŽîí‚@‚òŒ@óØ@ñóäaìó÷@ÿó óÜ@•bi@Šì‡äóm@@‹rÙ@ðmò‹Ðb÷30@@@@@@ðäìíi@‹èòˆ@”Žïq@ðmóÜby@óÜ@”ïmò‹Ðb÷@ßó óÜ@ãó÷òì@ñ‹rÙ35@äóm@ì@μä@‹rÙ@óØ@ñóäbmò‹Ðb÷@@ì@óÜ@”ïmóÜby@†ŠììaŠói@ðqì‹ @Ûòì@a‡äóàóm@óÜ@çòíŽï’ìbè@óØ@ó’bi@çbïn슇
@@N@ðäa‹îòŒíy@ðäbà@@óÜ@òìa‹ÙŽï¡óŽïu@óîòìbà@ãóÜ@óîòìóåïÜüÙŽïÜ@ãó÷2010@@ñŠbîb÷@ðäbà@@bm2011@N@@çbØóàb−òŠò†Z@@óÜ@a‹Ù’b÷@ói@ŠûŒ@ãüïïå óà@ó‚@ðàóØ@@çìíi@ñ‹rÙ@ðäìíi‹èòˆ@”Žïq@ð’ìím@óØ@ñóäbmò‹Ðb÷@ìó÷@ìíiŠbî†@a‡åîí‚
I1.53 ± 0.65 mg/dL@H@@@@î‹ióØ@@ðîbb÷@Žîí‚@‚òŒ@ì@•bi@슇äómói@@çìíi@‹rÙ@óØ@ñóäbmò‹Ðb÷@ìó÷@ÿó óÜ@†ŠììaŠóiói@óÜ@ìíiImg/dL2.26 ± 0.73 @@N@H†ŠììaŠói@ðqì‹ @íØòì@μä@‹rÙ@óØ@ñóäbmò‹Ðb÷@ìó÷@@ÿó óÜImg/dL2.31± 0.29 @@@H@@
Ðb÷@aìóØ@aî†@óîüiäìíi‹èòˆ@”Žïq@ðmò‹@‹rÙ@ð@@@@@@@@@@æîí‚@ìbä@óÜ@@ãüïÜbØ@ó‚@óÜ@óîóè@ñŠûŒ@ðØóîòìóäìíi@ãóØI0.59 ±8.72
mg/dL@H@@@@@@@@@@@ðîbb÷@îí‚@‚òŒ@òì@•bi@ì‡äóm@ñ‹rÙ@ðmò‹Ðb÷@ÿó óÜ@†ŠììaŠóióiImg/dL 0.52 ±8.97 @@H@@ÿó óÜ@ðîbb÷@îí‚@‚òŒ@ì@•bi@Šì‡äómói@‹rÙbä@ðmò‹Ðb÷Img/dL0.31 ± 9.12@H@@@@óäbîŠbÙäaŠü @ãó÷@ãýói@ò솋Ø@ðÜûäíØ@óØ
μä@ŠûŒ@@@N@@ón‚ìíqZ@@@@@@ð‚óîbi@ì@Âä‹ @ói@ñ‡äòíîóq@ñ‹rÙ@”Žïq@ðäìíi‹èòˆhypomagnesaemia@@@@@@@@@@@óî‡äòíîóq@ãó÷òì@ìíi@Šbî†@•bi
@@@@@@@ñaŠòŠó@ãłói@ñ‹rÙ@óÜ@o‚òì@”Žïq@ðäìíi‹èòˆ@óÜ@a‡’ü‚óä@ð’óÜ@óÜ@@ð’ü‚óä@ðäbØóŽïû‹q@n“îó @üi@@oŽïi@Âä‹ @óîóäaìóÜãüïÜbØ@ðÝóà@b÷@óÜ@ìíióä@a‹Ù’b÷@óî‡äòíîóq@ãó÷@•óàó÷@@N@@
@@
ó–þ©a@ @@óaŠ†íïÜbÙÜaì@ãíïïå;a@pbîínàã@@ã‡Üa@À@@μi@öbåÜaÞàaí¨a@Þàaí¨aì@öbv–ÿc@Þá¨a@âám@ÞjÔ@@
Óa‡èÿaì@óïÑÝ©aZ@ýíéª@ßaŒ@bà@Þá¨a@âám@kj@çg@@ôÝÈ@ãíÝÜbi@ðÕÜc@‡Ôì@L@ñ‹—åÈ@ãíïïå;aì@ãíïÜbÙÜa@‡Ô@ça‰ÝÜa@ìjÉÝî@çb@À@aŠì†@‹¾a@tì‡y N@óaŠ‡Üa@ë‰è@æà@Ó‡a@çbØíèà@pbîínà@À@paÍnÜa@âïïÕm@Þ—@ã‡Üaì@öbz–ÿa@Þàaí¨a@öbåÜa@À@pbäíïmbÙÜa@ÚÝm@æà@æà
óÜb¢@pbib—¾a@Þá¨a@âám@ÞjÔ@bà.@@
׋Üaì@ôš‹¾aZ@À@@ë‰èÜa@óaŠ‡óïÝjÕn¾aL@@‘bïÔ@ãíïÜbÙÜaì@ãíïïå;a@pbîínà@ã‡Üa@À@@Þá¨a@æà@ðäbrÜa@Ò—åÜa@ÀÜ@30@@òc‹àaÞàby@@Êàã‡Üa@ÂÍš@ñ†bïnÈýaL@@ì@30@@óÜbyàÞá¨a@âám@ÞjÔ@b@@ì@35@@öbz–ÿa@öbåÜa@æàÞàaí¨a@Ì@@óÈíáváØ@óiŠbÕnà@ŠbáÈdi@ìóäŠbÕàN @@æà@òÑÜa@À@óaŠ‡Üa@oî‹uc@‡Ôì@ça‹îy@2010@@@Šbîa@¶a@2011@@N@@
w÷bnåÜaZ@óÜby@æà@μäbÉî@ðmaíÝÜa@öbåÜa@çg@Þá¨a@âám@ÞjÔ@@æéî‡Ü@Âínà@À@ÄízÝà@bѯaÀ@ãíïïå;a@ïØ‹m@@ã‡Üa@I(0.65±
1.53 @ÎÝà@ OÞ†@H¾bi@Þàaí¨a@öbåÜa@Êà@óäŠbÕ@paìˆ@ @öbz–ÿaã‡Üa@ÂÍš@@@ñ†bïnÈý[email protected]± 2.26@àÝ@Î@O†Þ@H@ì@öbåÜa@Ìöbz–ÿa@Þàaí¨a@@@óäŠbÕ¾a@óÈíáª@æàI2.31@±@0.29@ÎÝà / †Þ@H@Þá¨a@âám@ÞjÔ@bà@@öbä@õ‡Ü@ÆyíÜ@Âínà@À@bšbѯa@ïØ‹m
íïÜbÙÜa@ ã‡Üa@ À@ ãI8.72 0.59± @ ÎÝà@ OÞ†@ H¾biÞàaí¨a@ öbåÜa@ Êà@ óäŠbÕ@@ öbz–ÿa@@ ñìˆ@ã‡Üa@ ÂÍš@@@@@@@@@@@@@@@@@@@@@@@@@@ñ†bïnÈýaI8.97 0.52±àÝ@Î@O†Þ@H@öbåÜa@Êàöbz–ÿa@Þàaí¨a@Ì@@I9.12@±@0.31@àÝ@Î@O†Þ@@Hë‰è@æÙÜì@pbÐþn‚ýa@@oïÜòjØ@@
ó–þ©aZ@äbØ@óÜby@oÔ@bàÞá¨a@âám@Þj@jm‹àó@@|šaì@ÞÙ“iã‡Üa@À@ãíïå;a@õínà@bѯdi @@ì@ÃbjmŠýa@a‰è@çíÙî@‡ÔÜajÙ@báéà@@À@óïš‹¾a@pbïÝáÉÜa@âéÐ@ÀóÜby@Þá¨a@âám@ÞjÔ@bà@@Êàì@a‰è@a@õín¾@@ójåÜbi@bzšaì@æÙî@@ÃbjmŠýa@çdÐ@ãíïÜbÙÜ.@@
@@
107
Duhok Medical Journal Volume 6, Supplement 3, 2012
ARTHROSCOPIC MANAGEMENT OF KNEE DISORDERS IN ERBIL HOSPITALS RETRO-PROSPECTIVE STUDY
SROOD SALIEM MATTEI, MBChB
ZOHAIR MOHSEN AHMED AL- SAFFAR, MBChB, FICMS (Ortho.) Submitted 18 Jun 2012; accepted 3 Sep 2012 ABSTRACT Objective: To analyze and evaluate the findings of our twelve months arthroscopy practice starting February 1, 2010 till January 31, 2011 in the department of Orthopedics for patient underwent operation of arthroscopy for management of meniscal lesions within Erbil city hospitals, governmental and private. Aim of Study: The aim of this study is to evaluate the short term result and to analyze their data according to age, sex distribution, mode of trauma, clinical findings, radiographic x ray and MRI findings, anaesthesia type, duration of hospital stay, performed procedures and arthroscopic findings and their short term clinical and functional outcomes . Methods: This is a retro - prospective study of 160 patients who underwent knee arthroscopy for meniscal lesions at Erbil city hospitals. Patient ages ranged from 21 to 70 years old with an average age of 39.5 years. Results: Arthroscopy was performed on 82 right and 78 left symptomatic knees of 113 males and 47 females, the etiology were classified as sport injury in 82 knees (51.25 %), falling 30 knees (18.75 %), traffic accident 17 knees (10.62 %), working accident 8 knees (5%) and un known 23 knees (14.37 %). Arthroscopic findings of patients were posterior horn tear of medial meniscus in 61 knees( 38%), anterior horn tear of medial meniscus in 30 knees ( 18%), anterior and posterior horn tear of medial meniscus in 2 knees (1.25%), bucket handle tear of medial meniscus in 24 knees ( 15%), Degenerative tear of medial meniscus in 8 knees (5 %), and anterior horn tear of lateral meniscus 14 knees (8.75%) and posterior horn tear of lateral meniscus 3 knees (1.25%), bucket handle tear of lateral meniscus in 1 knee (0.6%) and tears involving both menisci in 6 knees (5.6%) and normal menisci in 11 knees ( 6.8%). Meniscal lesions were associated with complete tear of ACL in 12 knees (7.5%), partial tear of ACL in 30 knees (18%), partial tear of PCL in 3 knees ( 2%), complete tear of PCL in 4 knees ( 2.5%). Tight and tethered plica was founded in 19 knees (11%) distributed as medial patellar plica in 13 knees, infrapatellar plica – ligamentum mucosum in 5 knees and suprapatellar plica in 1 knee. Small tiny osteochondral bodies were found in 2 knees and in 1 patient there was cyst in lateral meniscus. Conclusion: because of many advantages and few complication rate and arthroscopic partial menisectomy to be the definite means of therapy for the isolated meniscal lesion of the knee joint. Quick recovery and excellent early results after surgery are characteristics of the method. Also arthroscopy is the method of choice in the diagnosis of knee disorders Duhok Med J 2012; 6 Suppl 3:107 -116. Key words: Arthroscopy, Knee disorder
nee arthroscopy is the most common procedure performed among
orthopedic sport surgeons1. With the advent of magnetic resonance imaging and other non-invasive techniques, therapeutic arthroscopy comes into practice. Indications for knee arthroscopy include the treatment of meniscal pathology, specified articular cartilage lesions, costeochondral lesions, loose bodies, advanced synovitis and performing
synovial biopsy, cruciate ligament tears and certain tibia plateau fractures 2. Contraindications for the use of knee arthroscopy are Damage to the posterior capsule of the knee 3 may allow travasation of the fluid into the surrounding tissues. This will lead to swelling and may result in compartment syndrome, joint ankylosis, local skin infection around the potential portal sites which may lead to joint infection sepsis 4.
Erbil teaching hospital, Hawler Medical University. Corresponding author: Zohair Mohsen Ahmed Al- Saffar .Email: [email protected]
K
108
Arthroscopic Management of Knee Disorders in Erbil Hospitals...
The advantages of arthroscopic procedures far out weigh the disadvantages. Among the advantages when compared with arthrotomy are the following: reduced postoperative morbidity; smaller incision; less intense inflammatory response; improved thoroughness of diagnosis; absence of secondary effects; reduced hospital cost5,6,7; reduced complication rate which varies from 0.5% with usual procedures as menisectomy and cruciate ligament repair to 2.4% with newer procedure as meniscal repair; improved evaluation at follow-up; possibility of performing surgical procedures that were difficult or impossible to perform through open arthrotomy8,9,10. The most common complications are haemarthrosis, infection, thromboembolic disease, complication of anaesthsia, instrument failure, reflex sympathetic dystrophy, ligament injury11.12.13. METHODS This study covers 160 patients underwent arthroscopy operation for management meniscal lesions within Erbil city hospital, during the period from February 1, 2010 till January 31, 2011, data were obtained from the database of the theater, and entered into a proforma sheet, the following points were noted with the history Age, sex, Occupation, Mode of Trauma: ( Sport injury, Falling, Traffic Accident, Working Accident, Not Remembered), Joint Involved, Clinical Finding , X Ray Findings, MRI Findings, Type of Anaesthesia, Arthroscopy Findings, Type of Management, and Duration of Stay in Hospital. Routine preoperative investigations and X- ray of the involved joint were done; MRI was done in only 110 patients. Torn menisci were excised, the aim was to excise the unstable segment of the meniscus and preserve the table and well balanced rim as much as possible. In patients with degenerative joint disease, hypertrophied synovium was shaved. Tight
and tethered plicae was found in 19 patient and plica excision was done for them, degenerate menisci were trimmed and osteochondral fragments founded in two patient, they were small and tiny that dose not demands fixation and fragments removal was done for them. Anterior cruciate ligament reconstruction was done arthroscopically for three patients with anterior cruciate ligament tear. Portal sites were closed with single suture for each and the knee covered by double layers of cotton and elastic bandages. All patients instructed and trained to practice physical exercised in the same post operative day in full range of motions concentrating on straight leg – raising and strengthening of quadriceps muscles, weight bearing was encouraged as tolerated with crutches. The total agreement between the MRI findings and arthroscopic findings were calculated using the positive predictive value PPV and negative predictive value NPV, the PPV is defined as the probability that patient has the disease when restricted to those patient who test positive, and the NPV is defined as patient with negative test that do not have disease. Inclusion Criteria All cases with meniscal derangements and pathologies and are undergoing knee arthroscopy within Erbil city hospitals will be included in this analysis. This group includes: 1- Patient with torn meniscus proved clinically or radiologically. 2- Symptoms persisted or recurred after previous meniscal surgery with possibility of retained fragment or a recent tear. Exclusion Criteria 1- Arthroscopy performed for knee lesions other than meniscus lesions.
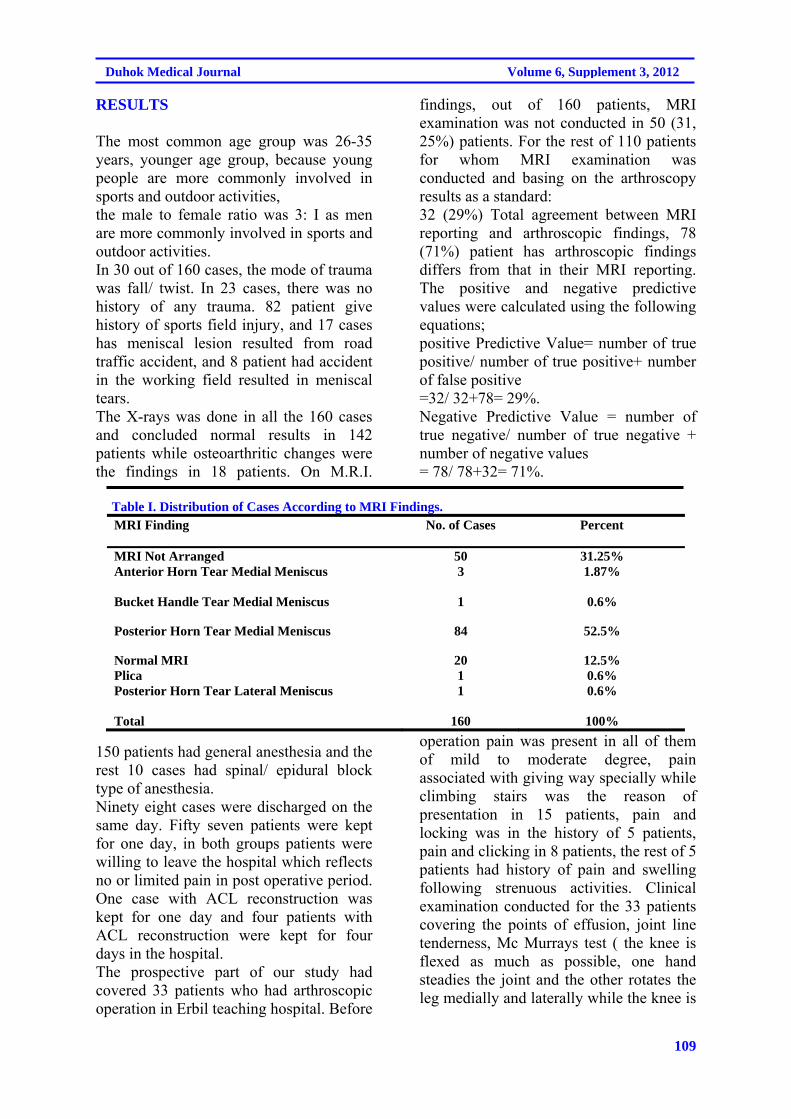
109
Duhok Medical Journal Volume 6, Supplement 3, 2012
RESULTS The most common age group was 26-35 years, younger age group, because young people are more commonly involved in sports and outdoor activities, the male to female ratio was 3: I as men are more commonly involved in sports and outdoor activities. In 30 out of 160 cases, the mode of trauma was fall/ twist. In 23 cases, there was no history of any trauma. 82 patient give history of sports field injury, and 17 cases has meniscal lesion resulted from road traffic accident, and 8 patient had accident in the working field resulted in meniscal tears. The X-rays was done in all the 160 cases and concluded normal results in 142 patients while osteoarthritic changes were the findings in 18 patients. On M.R.I.
findings, out of 160 patients, MRI examination was not conducted in 50 (31, 25%) patients. For the rest of 110 patients for whom MRI examination was conducted and basing on the arthroscopy results as a standard: 32 (29%) Total agreement between MRI reporting and arthroscopic findings, 78 (71%) patient has arthroscopic findings differs from that in their MRI reporting. The positive and negative predictive values were calculated using the following equations; positive Predictive Value= number of true positive/ number of true positive+ number of false positive =32/ 32+78= 29%. Negative Predictive Value = number of true negative/ number of true negative + number of negative values = 78/ 78+32= 71%.
Table I. Distribution of Cases According to MRI Findings.
MRI Finding No. of Cases Percent
MRI Not Arranged 50 31.25% Anterior Horn Tear Medial Meniscus 3 1.87%
Bucket Handle Tear Medial Meniscus 1 0.6%
Posterior Horn Tear Medial Meniscus 84 52.5%
Normal MRI 20 12.5% Plica 1 0.6% Posterior Horn Tear Lateral Meniscus 1 0.6%
Total 160 100%
150 patients had general anesthesia and the rest 10 cases had spinal/ epidural block type of anesthesia. Ninety eight cases were discharged on the same day. Fifty seven patients were kept for one day, in both groups patients were willing to leave the hospital which reflects no or limited pain in post operative period. One case with ACL reconstruction was kept for one day and four patients with ACL reconstruction were kept for four days in the hospital. The prospective part of our study had covered 33 patients who had arthroscopic operation in Erbil teaching hospital. Before
operation pain was present in all of them of mild to moderate degree, pain associated with giving way specially while climbing stairs was the reason of presentation in 15 patients, pain and locking was in the history of 5 patients, pain and clicking in 8 patients, the rest of 5 patients had history of pain and swelling following strenuous activities. Clinical examination conducted for the 33 patients covering the points of effusion, joint line tenderness, Mc Murrays test ( the knee is flexed as much as possible, one hand steadies the joint and the other rotates the leg medially and laterally while the knee is
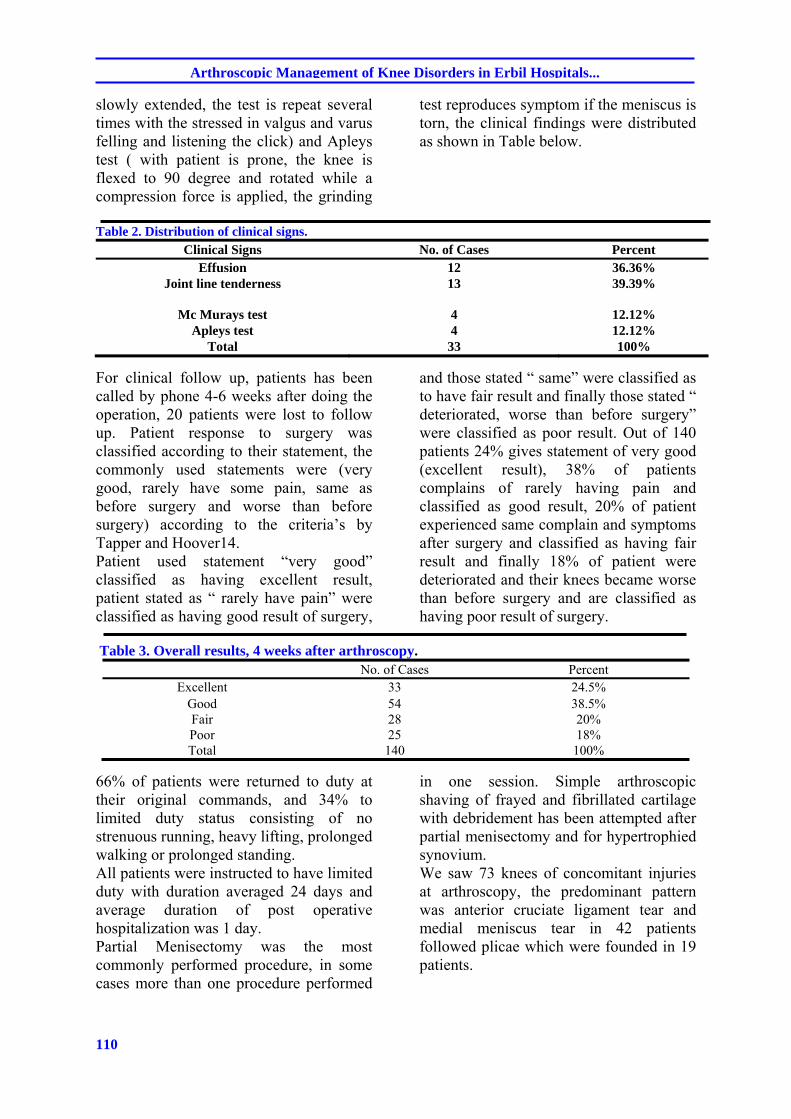
110
Arthroscopic Management of Knee Disorders in Erbil Hospitals...
slowly extended, the test is repeat several times with the stressed in valgus and varus felling and listening the click) and Apleys test ( with patient is prone, the knee is flexed to 90 degree and rotated while a compression force is applied, the grinding
test reproduces symptom if the meniscus is torn, the clinical findings were distributed as shown in Table below.
Table 2. Distribution of clinical signs.
Clinical Signs No. of Cases Percent Effusion 12 36.36%
Joint line tenderness 13 39.39%
Mc Murays test 4 12.12% Apleys test 4 12.12%
Total 33 100%
For clinical follow up, patients has been called by phone 4-6 weeks after doing the operation, 20 patients were lost to follow up. Patient response to surgery was classified according to their statement, the commonly used statements were (very good, rarely have some pain, same as before surgery and worse than before surgery) according to the criteria’s by Tapper and Hoover14. Patient used statement “very good” classified as having excellent result, patient stated as “ rarely have pain” were classified as having good result of surgery,
and those stated “ same” were classified as to have fair result and finally those stated “ deteriorated, worse than before surgery” were classified as poor result. Out of 140 patients 24% gives statement of very good (excellent result), 38% of patients complains of rarely having pain and classified as good result, 20% of patient experienced same complain and symptoms after surgery and classified as having fair result and finally 18% of patient were deteriorated and their knees became worse than before surgery and are classified as having poor result of surgery.
Table 3. Overall results, 4 weeks after arthroscopy.
No. of Cases Percent Excellent 33 24.5%
Good 54 38.5% Fair 28 20% Poor 25 18% Total 140 100%
66% of patients were returned to duty at their original commands, and 34% to limited duty status consisting of no strenuous running, heavy lifting, prolonged walking or prolonged standing. All patients were instructed to have limited duty with duration averaged 24 days and average duration of post operative hospitalization was 1 day. Partial Menisectomy was the most commonly performed procedure, in some cases more than one procedure performed
in one session. Simple arthroscopic shaving of frayed and fibrillated cartilage with debridement has been attempted after partial menisectomy and for hypertrophied synovium. We saw 73 knees of concomitant injuries at arthroscopy, the predominant pattern was anterior cruciate ligament tear and medial meniscus tear in 42 patients followed plicae which were founded in 19 patients.
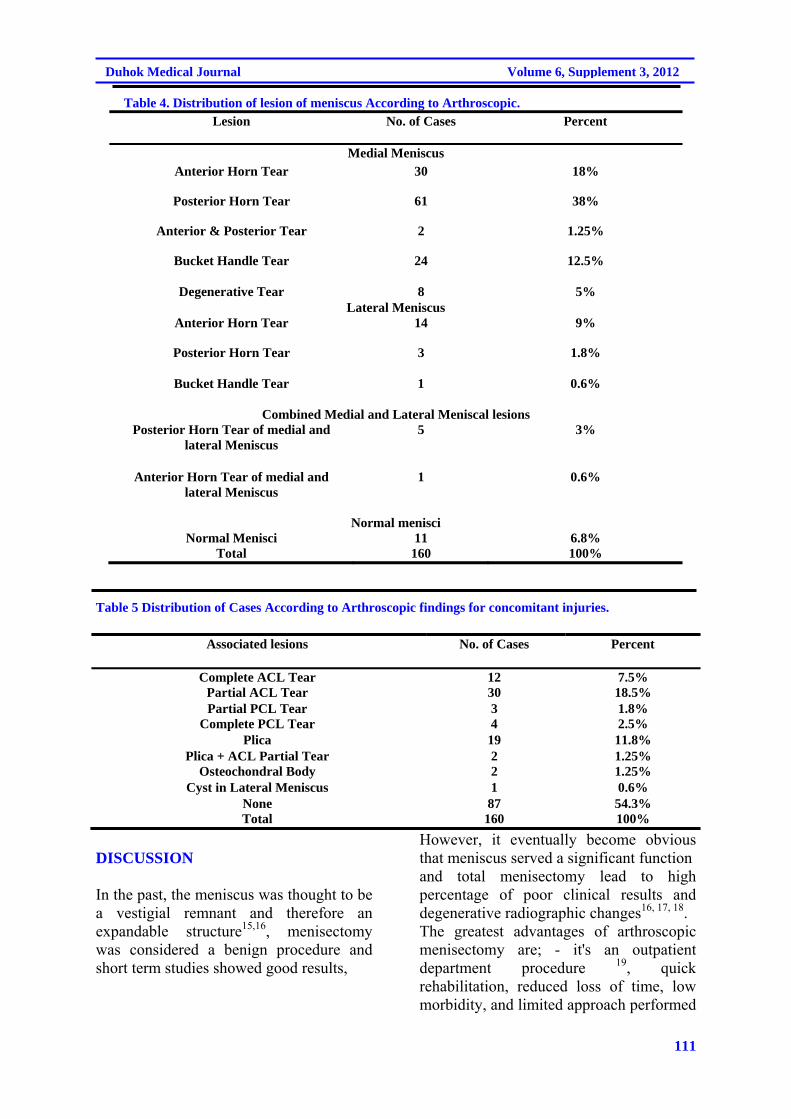
111
Duhok Medical Journal Volume 6, Supplement 3, 2012
Table 4. Distribution of lesion of meniscus According to Arthroscopic. Lesion No. of Cases Percent
Medial Meniscus Anterior Horn Tear 30 18%
Posterior Horn Tear 61 38%
Anterior & Posterior Tear 2 1.25%
Bucket Handle Tear 24 12.5%
Degenerative Tear 8 5% Lateral Meniscus
Anterior Horn Tear 14 9%
Posterior Horn Tear 3 1.8%
Bucket Handle Tear 1 0.6%
Combined Medial and Lateral Meniscal lesions Posterior Horn Tear of medial and
lateral Meniscus 5 3%
Anterior Horn Tear of medial and lateral Meniscus
1 0.6%
Normal menisci Normal Menisci 11 6.8%
Total 160 100%
Table 5 Distribution of Cases According to Arthroscopic findings for concomitant injuries.
Associated lesions No. of Cases Percent
Complete ACL Tear 12 7.5% Partial ACL Tear 30 18.5% Partial PCL Tear 3 1.8%
Complete PCL Tear 4 2.5% Plica 19 11.8%
Plica + ACL Partial Tear 2 1.25% Osteochondral Body 2 1.25%
Cyst in Lateral Meniscus 1 0.6% None 87 54.3% Total 160 100%
DISCUSSION In the past, the meniscus was thought to be a vestigial remnant and therefore an expandable structure15,16, menisectomy was considered a benign procedure and short term studies showed good results,
However, it eventually become obvious that meniscus served a significant function and total menisectomy lead to high percentage of poor clinical results and degenerative radiographic changes16, 17, 18. The greatest advantages of arthroscopic menisectomy are; - it's an outpatient department procedure 19, quick rehabilitation, reduced loss of time, low morbidity, and limited approach performed
112
Arthroscopic Management of Knee Disorders in Erbil Hospitals...
for suspected meniscal lesions on clinical or radiological basis. In our series, there were 113 males and 47 females with mean age of 39.5 years ranging from 21-70 years, however maximum number 57 patients (35.6%) were in the 26-35 years, in the study conducted by Russel J.A. Tregonning20 the mean age was 37 ranging from 15-54 years. In a similar study conducted by Gillquist J21 the range was from 18-78 years and average was 39.7 years. In the present series, there was 82 right knees and 78 left knees involved, 82 patients ( 51.25%) gives history of trauma encountered within sports field which is the commonest mode of injury and both studies of Russel J.A. Tregonning and Gillquist 20,21 also had athletics injuries as the commonest causes of meniscal lesions, 23 patient ( 14.37%) have unspecified or can not remember any kind of reason for the knee problem, 30 patients ( 18.75%) give history of falling and 17 patients ( 10.62%) presented with history of road traffic accident. Partial menisectomy was the most commonly performed arthroscopic surgery accounting for 41% of knee joint arthroscopies22 ,and in our series partial menisectomy account for 86.25% of cases, partial menisectomy was also the performed procedure but with other procedure to manage abnormalities associated with meniscal lesion or described as combined or concomitant lesions which were discovered during the arthroscopic operation as excision of plica, only the tight and tethered one which was performed in 19 patients and ACL repair performed in 3 patients, the plica fold were distributed as: medial patellar plica in 13 knees, infrapatellar plica – ligamentum mucosum in 5 knees and suprapatellar plica in 1 knee. The medial meniscus was more commonly affected and lesions involving posterior horn of medial meniscus were as high as twice of anterior horn tear of medial meniscus and three times more than bucket
handle tear and similar result was also conducted by Verdi V23, tears involving anterior and posterior horn of medial meniscus was found in 2 patients while degenerative tear found in 8 patients. Furthermore in the degenerative knee, the torn menisci may not be a source of patient symptoms and its removal may not alleviate those symptoms24, Dandy and Jakson found it's difficult to distinguish between symptom of meniscal and degenerative lesions. When meniscal tear is associated with ACL tear in young adult, ACL reconstruction is preferable to be done to prevent repeated tear due to instability25
and in our series only three patients out of twelve patients has ACL reconstruction along with partial menisectomy. And regardless the result of MRI reports, examination of the knee under anaesthesia is important to determine the status of cruciate ligaments or to detect the subtle antero-posterior laxity prior proceeding to arthroscopy. The indication for arthroscopic cruciate ligament repair includes: The locked knee, pseudo locking. The professional and highly competitive athlete. Where physiotherapy had not helped in advancing knee joint rehabilitation. Our study revealed that MRI reporting system was not reliable to pick up specific meniscal lesion and the total agreement between MRI and arthroscopy was 29% of patients, this matches with other published literature like that by Friemert et al26, which stated that MRI can not replace arthroscopy for diagnosis of cartilage damage and hence arthroscopy still has to be seen as the method of choice as the sensitivity of arthroscopic diagnosis is relatively high, Kocher et al27 mentioned that selective MRI dose not provide an enhanced diagnostic utility over arthroscopy or clinical examination and MRI should be preserved for cases where clinical diagnosis is uncertain and when
113
Duhok Medical Journal Volume 6, Supplement 3, 2012
the input of MRI is likely to alter the treatment plan. Its not recommend depend on the routine MRI reporting system in our locality to confirm diagnosis as the positive predictive value of the scan is low ( 29%) taking also into consideration the expensiveness of diagnostic investigation , in the presence of positive clinical signs, we would recommend proceeding to arthroscopy. And in 50 patients MRI was not conducted mostly due to economic load of the MRI. And the lack of expertise and deficiency of professional staff that are familial in reading the MRI films is behind this draw back. The effectiveness of MRI in diagnosis of meniscal tear can be promoted by using the 1.5 Tesla MRI. All patients were instructed to have limited duty with duration averaged 24 days and average duration of post operative hospitalization was 1 day. Results analysis according to age of patient were based according to older and younger than 40 years according to criteria’s by Dandy DJ, Jackson24,28, those who were younger than 40 years had better results compared to those who are older than 40 years who still complain of mild to moderate pain and intermittent effusion which might be due to associated degenerative changes. Those with pure menisci lesions give better results than those having combined meniscal lesion with plica or tear of ACL, PCL. Complications were infrequent, thromboembolic disease and septic arthritis are the most dangerous and were not encountered in our study, patient pose to risk of thromboembolic disease, and prophylactic anticoagulant drugs were used. CONCLUSION AND RECOMMENDATION A standardized scoring system is needed to properly evaluate and compare arthroscopic menisectomy results and
longer duration of follow up is needed to follow patient clinical deterioration and the short duration was behind this limitation. More studies are required to compare the results of partial and total menisectomy, between medial and lateral meniscal menisectomy and different types of meniscal lesions. MRI reporting system in our locality dose not provide a valuable diagnostic potential and dose not provide reliable information about the internal condition of the meniscus taking into consideration also the cost effectiveness of the MRI, and improvement of the MRI reporting system is necessary. REFERENCES
1. Marshall SC. Combined arthroscopic/ open repair of meniscal injuries. Contemp orthop. 1987; 14:15-24.
2. Mulholtan JS. Symposium on arthroscopic knee surgery. Contemp Orthop. 1982;5:79-115.
3. Bircher E. Die Arthroendoscpie. Zentralbl. Chir. J bone Joint surg Br.1881;21:141-4.
4. MC Bride GG, Constine RM, Hofmann AA, Corson RW. Arthroscopic partial menisectomy in the older patient. J Bone Joint Surg 1984;66: 547-51.
5. Watanabe, M. The development and present status of arthroscope. J Japanese Med Instruments.1954; 25:11.
6. Guhl JF. Operative Arthroscopy. AM J Sport Med.1979; 7: 328.
7. Sherman OH, Fax JM. Snyder SJ, Del Pizzo W, Friedman MJ, Ferket RD,et al. Arthroscopy- no- problem surgery, 1986; 68: 256-65.
8. Dandy DJ, Jackson RW. The diagnosis of problem after menisectomy. J Bone Joint Surg .1975; 57B: 349-52.
9. Heatley FW. The meniscus- can it be repaired? An experimental
114
Arthroscopic Management of Knee Disorders in Erbil Hospitals...
investigation in rabbits. J bone Joint Surg .1980; 62B: 397-402.
10. Clancy WG, Graf BK. Arthroscopic meniscus repair, Orthopaedics, London.S J M Boren.1983; 6: 1125-9.
11. S. Terry Canale, James H, Kay Daugherty. CampBells operative orthopaedics, 11th ed. Philadelphia, PA : Mosby/Elsevier;2008.p. 2789.
12. Delee JC. Complication of arthroscopy and arthroscopic surgery: results of a rational survey. Arthroscopy .1985;1:214-20.
13. Smith MJ. Arthroscopic treatment of septic knee. Arthroscopy. 1986; 2: 30-4.
14. Tapper EM, Hoover NW. Late results after menisectomy. J Bone Joint Surg.1969; 51:517-26.
15. McGinty JB, Johnson LJ, Jackson RW, Mcbryde AM, Goodfellow JW. Current concepts review. Uses & abuses of arthroscopy. A symposium. J Bone Joint Surg. 1997; 74: 1562-77.
16. Jonson LL. Diagnostic and surgical arthroscopy. The knee and other joints. 2nd ed., St. Louis, CV Mosby Co; 1981.p. 148-9 and 357-8.
17. Mc Ginty JB: Arthroscopic surgery in sport injuries. Orthopaedic clinics of north America. 1980; 2(4): 787-99.
18. Jackson RW. The role of arthroscopy in management of disorder of knee. J Bone Joint Surg. 1985;57: 802-10.
19. Schimmer RC, Morgenthaler W, Zund G, Brulhart KB, Glinz W. Arthroscopy operation: Wann ambulant? Wann Hospital? .Arthroscopy. 1992; 5:212-18.
20. Tregonning R. Closed partial menisectomy. J Bone Joint surg. 1993; 65: 378-84.
21. Gillquist J. Hamberg G, Lysholm J. Endoscopic partial and total menisectomy. Acta Orthop Scand. 1982;53:975-9 .
22. Small NC. Complication in arthroscopic surgery performed by experienced arthroscopists. Arthroscopy. 1988; 4: 215-21.
23. Verdi V. Meniscal movement. J. Bone Joint Surg Br. 1999;81- B:37-41.
24. Dandy DJ, Jackson Rw. The diagnosis of problem after menisectomy. J bone Joint Surg Br. 1975; 57:349-52.
25. Englund M, Ross EM, Lohmander LS. Impact on type of meniscal tear on radiographic and symptomatic knee disorders: A sixteen year follow up of menisectomy with matched controls. Arthritis Rheum. 2003; 48:2178-87.
26. Friemert B, Oberländer Y, Schwarz W, Häberle HJ, Bähren W, Gerngross H, et al, Diagnosis of chondral lesions of the knee: can MRI replace arthroscopy? A prospective study .Knee Surg Sports Traumatol Arthrosc. 2004;12(1):58-64.
27. Kocher MS, DiCanzio J, Zurakowski D, Micheli LJ. Diagnostic performance of clinical examination and selective magnetic imaging in the evaluation of intraarticular knee disorders in children and adolescents. AM J Sports Med .2001; 29(3): 292-6.
28. Messner K, Gao J. The meniscus of the knee joint. Anatomical and functional characteristics, and a rational for clinical treatment . J Anat .1998; 193(pt2): 161-78.
115
Duhok Medical Journal Volume 6, Supplement 3, 2012
íqón‚@@Úï÷@ì@çbÙ’@õ‹ ón’óä@ô’ói@óÜ@Ûíšì@óÙàíu@ôäbØóï’í‚óä@ô䆋؊óòŠbš@ô−bàb÷@@
@솋iaŠ@ðØóîòìóåîîím–@ìímbèa†@@
wäbàb÷@@Z@ônóióàói@õòìó䆋Ùï’@bà@òäaì†@çbàóØòìóåî‰îím@ôäbØóïmójîbm@óàb−ó÷ä‡äbîb‚@ô@@ß1@@ômaí’2010@@bm31@@ôäíäbØ@ãòìì†2011~@ôåïjïq@õòŠbiŠò†@ØŠóòŠbš@ô−bàb÷@ói@ÛŽíš‹óä@ô䆂Ü@ÛŽíš@õóàíu@ôäbØóï’íón’óä@ô’ói@óŠ@Úï÷ì@çbÙ’@õŠó
“îq@õ‰ïÜíØ@óÜÙq@õÜìóè@õíÙäaŒ@ôôÙ“î@ón“ä@óØ@õòóäb’í‚óä@ìó÷@ŽíiŠó õŠ@@óÜ@ìa‹ÙîŠbî†@ô−bàb÷@Žíi@a‹ØŽíi@çbïØíš@ôåïjïqƒ’í‚óäbäbØóäÜìóè@¶bàí‚ì@õà@ôN@@çbØbŽîŠZ@솋iaŠ@ôØóîòìóåî‰îím@Žíi@íib“ïØ@çbàó“‚óä_ímbèa†@@íi160@@çaíïä@çbØó’í‚óä@ôäóàómì@•í‚óä21@M70@@õ‡äìbäì@ßb
@çbïäóàóm39N5@ìíi@ßbN@@@çbØóàb−ó÷Z@ß@@õŽíØ160@@•í‚óä@~82@ìíi@oaŠ@ôØŽíu@õóàíu@Žíi@õŠó Šón’óä@~78Žíi@”î@àíuõó@@ìíi@tóš@ôØŽíu@~113@
@ì@çìíi@óåîä@•Ží‚óä47@íi@óåïïà@”ï’í‚óäçì~@82@Šòì@õŠaíi@óÜ@çìíj’ím@õŽíèói@çbïäbØóåî‹i@•í‚óäŒòìíia‡’@~30@”ï’í‚óä@òìòŠaí‚@ óåmìóØ@ õíè@ ói@òìíiŒŠói@ ôåîí’@ óÜ@ ~Øòìa†ììŠ@ ãýóiŽíšìímbè@ ôäb@@ ôäìíj’ím@ õŽíè@ ónîíi17@•í‚óä~@ ôšóØ8@@•í‚óä
ŠbØ@ôäbØòìa†ììŠ@óÜ@çìíj’ím@~@a‡ÙïmbØóÜ23@è@•í‚óäíìíia‹äaŒóä@ôäìíj’ím@ôäbØòŠbØNåïjïq@ômbØ@ßaì†@ôäa‹›q@óØ@pìóØŠò†@ô@õòìäaìóm@õó a‹Ø‹ØîóôNIðäaH@óÜaî†61@@óÜ@ôäa‹›qì@ÛŽíšIça‹Ô@H@ aî†@õó a‹Ø‹Ø@õòìó“ïq@óÜ30@ÛŽíš@~@õŠŽíu@ß@ça‹›q@ãýói@óÙà
a‹Ø‹Ø@íi@‘ì†bÔäaìóm@õóó@ß@aî†@õ24@õóäaìóm@ôäbØòìíib‚@ôšóØ@ÛŽíš@@ß@aî†8@ÛŽíšN@@@ãýóióåïî‹iõó a‹Ø‹Ø@ôäbØ@õóäaìóm@ìíj’óia†@õòíï’@ãói@ôäbØòìa‹›q@aìó÷@ô“yì@Z@ôäòŠóÔóÜ@òìó“ïq14@ìíi@ÛŽíš~ì†@ôäòŠóÔ@ßìa@ò
3@@ ìíi@ÛŽíš@ ~ìíi@Úšíš@Ûóî@‘ì†bÔ@ óÙà~@@ ón“îó @ô“yì@ôäa@õó a‹Ø‹Ø@ óÜ@ Ûóî@ Šóè@ô’ìím@ óØ@õóäbåî‹i@ ìó÷@ ãýói5,6E@~@óØ@†‹Ø@õ†ói@ôåïjïq@õŠó Šón“äì11@Š†@çbïÙšíš@õóÙàíu@•í‚óäìíi@oìN@@
ãb−ó÷Šò†Z@ä“ÛŽíš@õóÙàŽíš@õŒb@æî‹i@õŠó Šón“ä@”ïq@ónîíïq@ÛćŽíš@ôåïjïq@õŠó Šón@@ô䆋؊óòŠbš@ôäbàb−ó÷@ói@õ‹ÙiìbšòŠŽîŠì@ ’bi@ õ‡äó¸ójîbmì@ ‹m‡äóóq@ ÛŽíš@ õŠó Šón’óä@ ÛŽíš@ óàŽíu@ ôäbÙïîónóš@ óï’í‚óäì@ õòíŽï’@ ói@‡äó’óm@ ôàóØ@ ôØóîò‰
óîóè@ôäbØóïïØòìý@ ~bèòìŠóè@@ Žíi@ óäììŠì@ ìa‹Ø‹îa†@ôÙï䆋؊óòŠbš@Úšíš@õó a‹Ø‹Ø@ôÙ“q@ô䆋؋ióåiq‹Ø@óÜ@ bïäóm@ôäa‹›a‹Ø @õóŽíš@õóàŽíu@ìbä@ôäaìómÛN@@
@bèòìŠóèõóÙàŽíu@õòìóåì†@@ìbšaŠ@óàó÷@ónîíïqì@ÛŽíš@õóàíu@ôäbØóï’í‚óä@ô䆋Ø@õŠbî†@Žíi@ó䆊a‰jÜóè@æî’bi@ôåïjïq@ói@ÛŽíšåïÙ“q@”ïî@õ‹Ùióè@óÜ@ô䆋؊óòŠbš@ôäbØóîŽíè@ô䆋ْóÙ“ïq@ói@pa†ò‡îŠ@ÛŽíš@ôåïjïq@óÙäíš@ïmbå íà@ôïåïäòŠ@ôåïa‡mbØ@çbàN@@
116
Arthroscopic Management of Knee Disorders in Erbil Hospitals...
ó–þ©a@ @ÞïiŠc@pbïÑ“nà@À@ójØ‹Üa@Ååm@óaíi@óïÜþa@ÒîŠb›ÍÜa@pýþnÈýa@ó§bÉàNóïÝjÕnà@óïÉuŠ@óaŠ†@@
@@Ó‡a@ZÈ@qa@båî†@w÷bnä@âïïÕmì@ÞïÝ¥@aö‡i@Þ–bѾa@Ååm@óŠb¿@a‹é’@‹“1@@‹îaÐ2010@@ôny31@@‹îbåî2011@@óya‹u@âÔ@À
ó–b©aì@ óïàíÙ¨a@ LÞïiŠa@ óåî‡à@ pbïÑ“n¾a@ Þ‚a†@ ðÜþè@ pbÐła@ òŠa†flÜ@ Ååm@ óïÝáÉÜ@ Ê›‚@ @ ãbÅÉÜaN@ @óÕî‹ÜaZ@@óïÉu‹Üa@ðè@ë‰èM@@æà@óïÈþna@óaŠ†160@Ø‹Üa@ÅånÜ@aíÉ›‚@æî‰Üa@ôš‹¾aÞïiŠa@óåî‡à@pbïÑ“nà@À@ðÜþa@pbÐ⁄Ü@ój@N
@ôš‹¾a@ŠbáÈc@oyìa‹m21M70@@Âín·@óå@‹áÈ39.5@óåN
óaŠ‡Üa@æà@Ó‡aZ@@ÊîŒímì@ LæÝÜ@ bÕÐì@âéi@ ó–b©a@pbäbïjÜa@ÞïÝ¥ì@—ÕÜa@õ‡¾a@ôÝÈ@ óvïnåÜa@ âïïÕm@íè@ óaŠ‡Üa@ë‰è@æà@Ó‡a@çg‹î‹Üa@w÷bnåÜaì@ Lóà‡—Üa@æà@Êšìì@ Lå§a@ LóîX@@À@óàbÔfia@ ò‡àì@Ëíä@‹î‡ƒnÜaì@ðï bå;a@μä‹Übi@ ‹îí—nÜa@w÷bnäì@óïåïÜa@ðÈbÉ’g
âéi@ ó–b©a@ Þuÿa@ ò—Ô@ óïÑïÄì@ óî‹î‹Üa@ w÷bnåÜaì@ ŠbÅå¾bi@ w÷bnåÜaì@ paöa‹ufia@ ‰ïÑåm@ LôÑ“n¾aN@ @w÷bnåÜaZ@@ Öy@ ôÝÈ@ Þ–bѾa@ Ååm@ öa‹ug@ 82@@ ì78@@ æà@a‹Èc@μnjØ‹Üa@ ŠbïÜa113@@ æà@ ì@ Ší؉Üa47@@Òïå—m@ @ Ltbäfia@ æà
@μnjØ‹Üa@À@óšbî‹Üa@pbib–g@báØ@pbjj¾[email protected]٪H@ѯaì@L30@@μnjØ‹ÜaI18.75٪H@Šì‹à@t†by@L17@@μnjØ‹ÜaI10.62٪@H@ÞáÉÜa@t†by@L8@@μnjØ‹ÜaI5٪@H@μnjØ‹Üa@Óì‹É¾a@ò‡zn¾a@âàýaì[email protected]٪@NH@Þï¾a@ôš‹áÝÜ@ŠbÅå¾bi@w÷bnåÜa@oäbØì@Ëíà‡ÝÜ
@À@ðäfia@ðݗѾa@Óì‹›ÍÜa@æà@ðÑÝ©a@ç‹ÕÜa61@@μnjØ‹ÜaI38٪H@À@ðäfia@ðݗѾa@Óì‹›ÍÜa@ç‹ÕÜa@ðàbàÿa@Ëíà‡ÝÜ@Þï¾a@í܆@L30@@μnjØ‹ÜaI18٪H@μnjØ‹Üa@À@ðäfia@ðݗѾa@Óì‹›ÍÜa@ç‹ÕÜa@Ëíà‡ÝÜ@Þï¾a@ðÑÝ©aì@ðàbàÿa@[email protected]٪H@Þï¾a@Êà@ÞàbÉnÜa@L
a@æà@Ëíà‡ÝÜ@À@ðäÿa@Óì‹›ÍÜ24@@μnjØ‹ÜaI15٪Ha@Óì‹›ÍÜa@æà@óïÙånÜa@Ëíà‡ÝÜ@Þï¾a@L@À@ðäÿ8@@μnjØ‹ÜaI5٪H@Þï¾aì@L@ð“yíÜa@ðݗѾa@Óì‹›ÍÜa@æà@ðàbàÿa@ç‹ÕÜa@Ëíà‡ÝÜ14@@μnjØ‹ÜaI8.75٪@ H@ðݗѾa@Óì‹›ÍÜa@æà@ðÑÝ©a@ç‹ÕÜa@Ëíà‡ÝÜ@Þï¾aì
@ð“yíÜa3@@μnjØ‹ÜaI1.25@٪H@ójØ‹Üa@À@ð“yíÜa@ðݗѾa@Óì‹›ÍÜa@æà@Ëíà‡ÝÜ@Þï¾a@jÕà@í܆@[email protected]٪@HÜa@Ëíà‡Üaì@@ñíåm@ À@ pýþè@ öaí@ ‡y@ ôÝÈ6@@ μnjØ‹ÜaI5.6٪@ H@ À@ óî†bÉÜa@ pýþèì11@@ μnjØ‹ÜaI6.8٪NH@ @
@ðàbàÿa@ïÝ—Üa@Ãbi‹Üa@À@ÞàbØ@׸@Êà@ðÜþè@pbÐła@ojmŠaì12@@μnjØ‹ÜaI7.5٪H@ójØ‹Üa@À@ðàbàÿa@ïÝ—Üa@Ãbi‹Üa@À@ð÷u@×áni@L30@I18٪H@ À@ ð÷u@ ×áni@ LPCL 3@@ μnjØ‹ÜaI2٪H@ æà@ óÝàbØ@ Ëíà‡ÝÜ@ Þï¾a@ LPCL@@ À4@@ μnjØ‹ÜaI2.5@٪NH@ @
@À@ó íi‹¾aì@Öïš@óïårÜa@odm19@@μnjØ‹ÜaI11٪@H@À@óÑš‹Üa@ðäfia@óïårÜa@ízåÜa@ôÝÈ@óÈŒíà13@@óÑš‹Üa@o¥@óïårÜa@LμnjØ‹ÜaM@@À@ óï bƒ¾a@Ãbi‹Üa5@@ ójØ‹Üa@ À@ óÑš‹Üa@ ×íÐ@ óïårÜaì@μnjØ‹Üa1@ N‹›Ì@ðáÅÈ@sru@ôÝÈ@ ‹rÈìì@μnjØ‹Üa@ À@Í–@Í–@Àì2@@ À1@
ð“yíÜa@ ðݗѾa@ Óì‹›ÍÜa@ À@ ïØ@ Ûbåè@ çbØ@ aN@ @ó–þ©aZ@@óï÷uì@óÝïÝÔ@pbÑÈb›¾a@ójäì@bîa¾a@æà@‡î‡ÉÜa@kjimenisectomy@@óib–fi@xþÉÜa@æà@ò†‡«@óÝïì@çíÙïÜ@ŠbÅå¾bi
ójØ‹Üa@ Þ—Ñà@ æà@ óÜìɾa@ óïÜþa@ ÒîŠb›ÍÜa@ Nnäì@ Êî‹@ •bÉnäalíÝÿa@ ˜÷b—‚@ ðè@ óya‹§a@ ‡Éi@ òŒbn¿@ ò‹Ùjà@ w÷bN@ @ójØ‹Üa@pbia‹ša@˜ïƒ“m@À@ޛѾa@líÝÿa@íè@Þ–bѾa@Ååm@b›îc
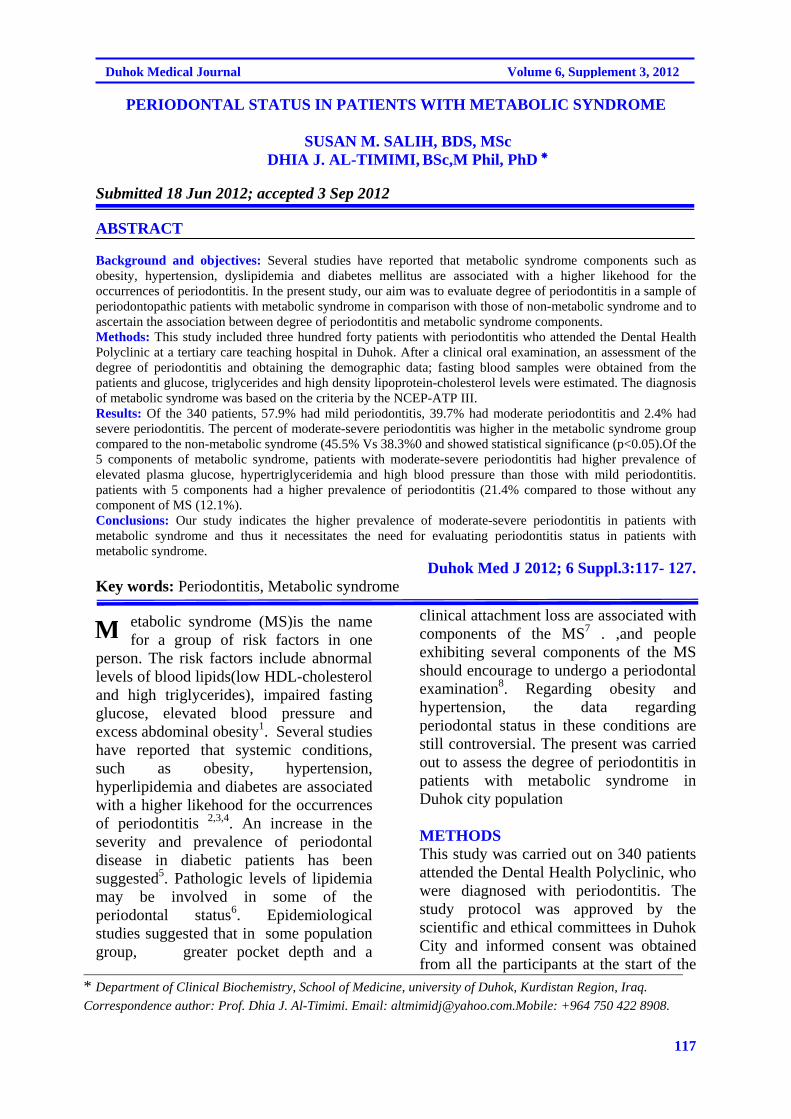
117
Duhok Medical Journal Volume 6, Supplement 3, 2012
PERIODONTAL STATUS IN PATIENTS WITH METABOLIC SYNDROME
SUSAN M. SALIH, BDS, MSc DHIA J. AL-TIMIMI, BSc,M Phil, PhD
Submitted 18 Jun 2012; accepted 3 Sep 2012 ABSTRACT Background and objectives: Several studies have reported that metabolic syndrome components such as obesity, hypertension, dyslipidemia and diabetes mellitus are associated with a higher likehood for the occurrences of periodontitis. In the present study, our aim was to evaluate degree of periodontitis in a sample of periodontopathic patients with metabolic syndrome in comparison with those of non-metabolic syndrome and to ascertain the association between degree of periodontitis and metabolic syndrome components. Methods: This study included three hundred forty patients with periodontitis who attended the Dental Health Polyclinic at a tertiary care teaching hospital in Duhok. After a clinical oral examination, an assessment of the degree of periodontitis and obtaining the demographic data; fasting blood samples were obtained from the patients and glucose, triglycerides and high density lipoprotein-cholesterol levels were estimated. The diagnosis of metabolic syndrome was based on the criteria by the NCEP-ATP III. Results: Of the 340 patients, 57.9% had mild periodontitis, 39.7% had moderate periodontitis and 2.4% had severe periodontitis. The percent of moderate-severe periodontitis was higher in the metabolic syndrome group compared to the non-metabolic syndrome (45.5% Vs 38.3%0 and showed statistical significance (p<0.05).Of the 5 components of metabolic syndrome, patients with moderate-severe periodontitis had higher prevalence of elevated plasma glucose, hypertriglyceridemia and high blood pressure than those with mild periodontitis. patients with 5 components had a higher prevalence of periodontitis (21.4% compared to those without any component of MS (12.1%). Conclusions: Our study indicates the higher prevalence of moderate-severe periodontitis in patients with metabolic syndrome and thus it necessitates the need for evaluating periodontitis status in patients with metabolic syndrome.
Duhok Med J 2012; 6 Suppl.3:117- 127. Key words: Periodontitis, Metabolic syndrome
etabolic syndrome (MS)is the name for a group of risk factors in one
person. The risk factors include abnormal levels of blood lipids(low HDL-cholesterol and high triglycerides), impaired fasting glucose, elevated blood pressure and excess abdominal obesity1. Several studies have reported that systemic conditions, such as obesity, hypertension, hyperlipidemia and diabetes are associated with a higher likehood for the occurrences of periodontitis 2,3,4. An increase in the severity and prevalence of periodontal disease in diabetic patients has been suggested5. Pathologic levels of lipidemia may be involved in some of the periodontal status6. Epidemiological studies suggested that in some population group, greater pocket depth and a
clinical attachment loss are associated with components of the MS7 . ,and people exhibiting several components of the MS should encourage to undergo a periodontal examination8. Regarding obesity and hypertension, the data regarding periodontal status in these conditions are still controversial. The present was carried out to assess the degree of periodontitis in patients with metabolic syndrome in Duhok city population METHODS This study was carried out on 340 patients attended the Dental Health Polyclinic, who were diagnosed with periodontitis. The study protocol was approved by the scientific and ethical committees in Duhok City and informed consent was obtained from all the participants at the start of the
* Department of Clinical Biochemistry, School of Medicine, university of Duhok, Kurdistan Region, Iraq.
Correspondence author: Prof. Dhia J. Al-Timimi. Email: [email protected]: +964 750 422 8908.
M
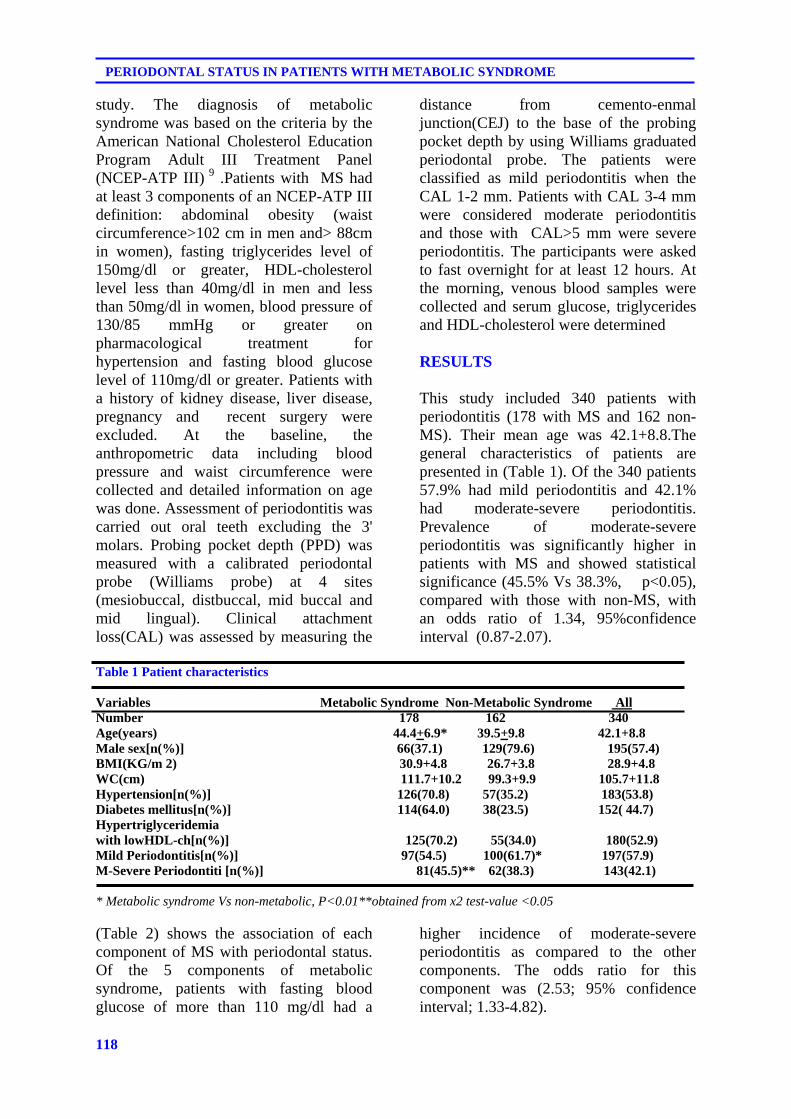
118
PERIODONTAL STATUS IN PATIENTS WITH METABOLIC SYNDROME
study. The diagnosis of metabolic syndrome was based on the criteria by the American National Cholesterol Education Program Adult III Treatment Panel (NCEP-ATP III) 9 .Patients with MS had at least 3 components of an NCEP-ATP III definition: abdominal obesity (waist circumference>102 cm in men and> 88cm in women), fasting triglycerides level of 150mg/dl or greater, HDL-cholesterol level less than 40mg/dl in men and less than 50mg/dl in women, blood pressure of 130/85 mmHg or greater on pharmacological treatment for hypertension and fasting blood glucose level of 110mg/dl or greater. Patients with a history of kidney disease, liver disease, pregnancy and recent surgery were excluded. At the baseline, the anthropometric data including blood pressure and waist circumference were collected and detailed information on age was done. Assessment of periodontitis was carried out oral teeth excluding the 3' molars. Probing pocket depth (PPD) was measured with a calibrated periodontal probe (Williams probe) at 4 sites (mesiobuccal, distbuccal, mid buccal and mid lingual). Clinical attachment loss(CAL) was assessed by measuring the
distance from cemento-enmal junction(CEJ) to the base of the probing pocket depth by using Williams graduated periodontal probe. The patients were classified as mild periodontitis when the CAL 1-2 mm. Patients with CAL 3-4 mm were considered moderate periodontitis and those with CAL>5 mm were severe periodontitis. The participants were asked to fast overnight for at least 12 hours. At the morning, venous blood samples were collected and serum glucose, triglycerides and HDL-cholesterol were determined RESULTS
This study included 340 patients with periodontitis (178 with MS and 162 non-MS). Their mean age was 42.1+8.8.The general characteristics of patients are presented in (Table 1). Of the 340 patients 57.9% had mild periodontitis and 42.1% had moderate-severe periodontitis. Prevalence of moderate-severe periodontitis was significantly higher in patients with MS and showed statistical significance (45.5% Vs 38.3%, p<0.05), compared with those with non-MS, with an odds ratio of 1.34, 95%confidence interval (0.87-2.07).
Table 1 Patient characteristics Variables Metabolic Syndrome Non-Metabolic Syndrome All Number 178 162 340 Age(years) 44.4+6.9* 39.5+9.8 42.1+8.8 Male sex[n(%)] 66(37.1) 129(79.6) 195(57.4) BMI(KG/m 2) 30.9+4.8 26.7+3.8 28.9+4.8 WC(cm) 111.7+10.2 99.3+9.9 105.7+11.8 Hypertension[n(%)] 126(70.8) 57(35.2) 183(53.8) Diabetes mellitus[n(%)] 114(64.0) 38(23.5) 152( 44.7) Hypertriglyceridemia with lowHDL-ch[n(%)] 125(70.2) 55(34.0) 180(52.9) Mild Periodontitis[n(%)] 97(54.5) 100(61.7)* 197(57.9) M-Severe Periodontiti [n(%)] 81(45.5)** 62(38.3) 143(42.1) * Metabolic syndrome Vs non-metabolic, P<0.01**obtained from x2 test-value <0.05 (Table 2) shows the association of each component of MS with periodontal status. Of the 5 components of metabolic syndrome, patients with fasting blood glucose of more than 110 mg/dl had a
higher incidence of moderate-severe periodontitis as compared to the other components. The odds ratio for this component was (2.53; 95% confidence interval; 1.33-4.82).
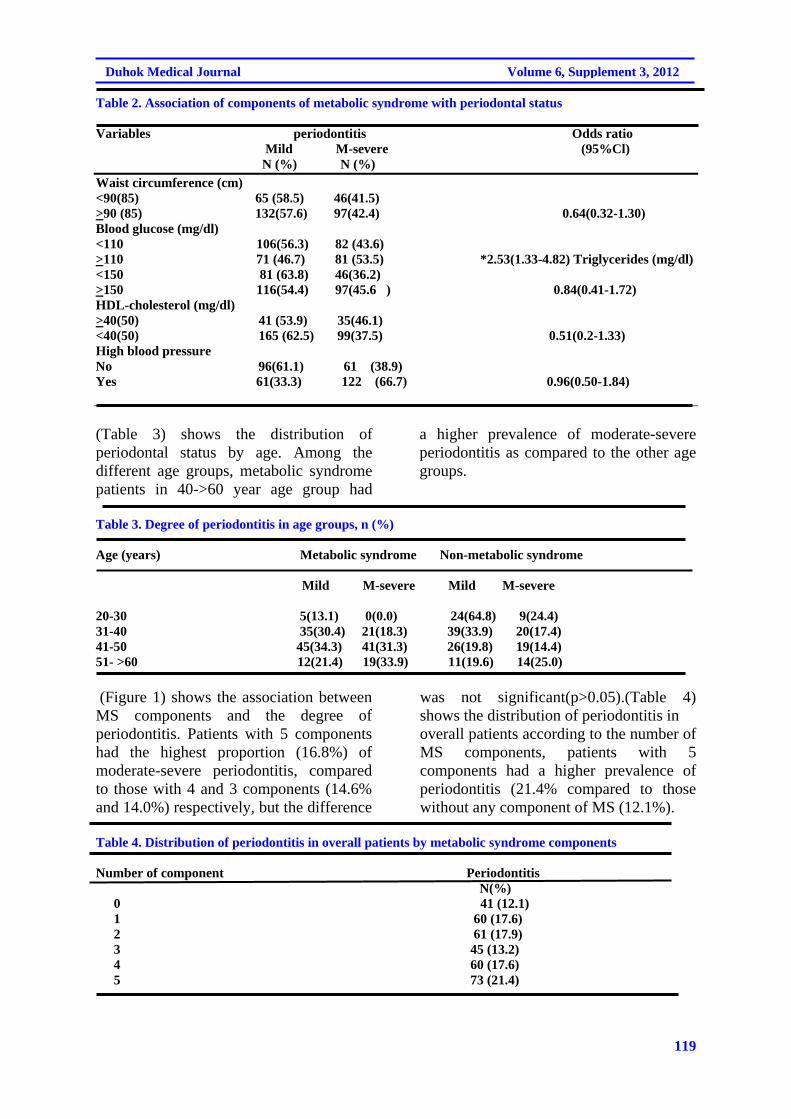
119
Duhok Medical Journal Volume 6, Supplement 3, 2012
Table 2. Association of components of metabolic syndrome with periodontal status Variables periodontitis Odds ratio Mild M-severe (95%Cl) N (%) N (%)
Waist circumference (cm) <90(85) 65 (58.5) 46(41.5) >90 (85) 132(57.6) 97(42.4) 0.64(0.32-1.30) Blood glucose (mg/dl) <110 106(56.3) 82 (43.6) >110 71 (46.7) 81 (53.5) *2.53(1.33-4.82) Triglycerides (mg/dl) <150 81 (63.8) 46(36.2) >150 116(54.4) 97(45.6 ) 0.84(0.41-1.72) HDL-cholesterol (mg/dl) >40(50) 41 (53.9) 35(46.1) <40(50) 165 (62.5) 99(37.5) 0.51(0.2-1.33) High blood pressure No 96(61.1) 61 (38.9) Yes 61(33.3) 122 (66.7) 0.96(0.50-1.84)
(Table 3) shows the distribution of periodontal status by age. Among the different age groups, metabolic syndrome patients in 40->60 year age group had
a higher prevalence of moderate-severe periodontitis as compared to the other age groups.
Table 3. Degree of periodontitis in age groups, n (%) Age (years) Metabolic syndrome Non-metabolic syndrome Mild M-severe Mild M-severe 20-30 5(13.1) 0(0.0) 24(64.8) 9(24.4) 31-40 35(30.4) 21(18.3) 39(33.9) 20(17.4) 41-50 45(34.3) 41(31.3) 26(19.8) 19(14.4) 51- >60 12(21.4) 19(33.9) 11(19.6) 14(25.0) (Figure 1) shows the association between MS components and the degree of periodontitis. Patients with 5 components had the highest proportion (16.8%) of moderate-severe periodontitis, compared to those with 4 and 3 components (14.6% and 14.0%) respectively, but the difference
was not significant(p>0.05).(Table 4) shows the distribution of periodontitis in overall patients according to the number of MS components, patients with 5 components had a higher prevalence of periodontitis (21.4% compared to those without any component of MS (12.1%).
Table 4. Distribution of periodontitis in overall patients by metabolic syndrome components Number of component Periodontitis
N(%) 0 41 (12.1) 1 60 (17.6) 2 61 (17.9) 3 45 (13.2) 4 60 (17.6) 5 73 (21.4)
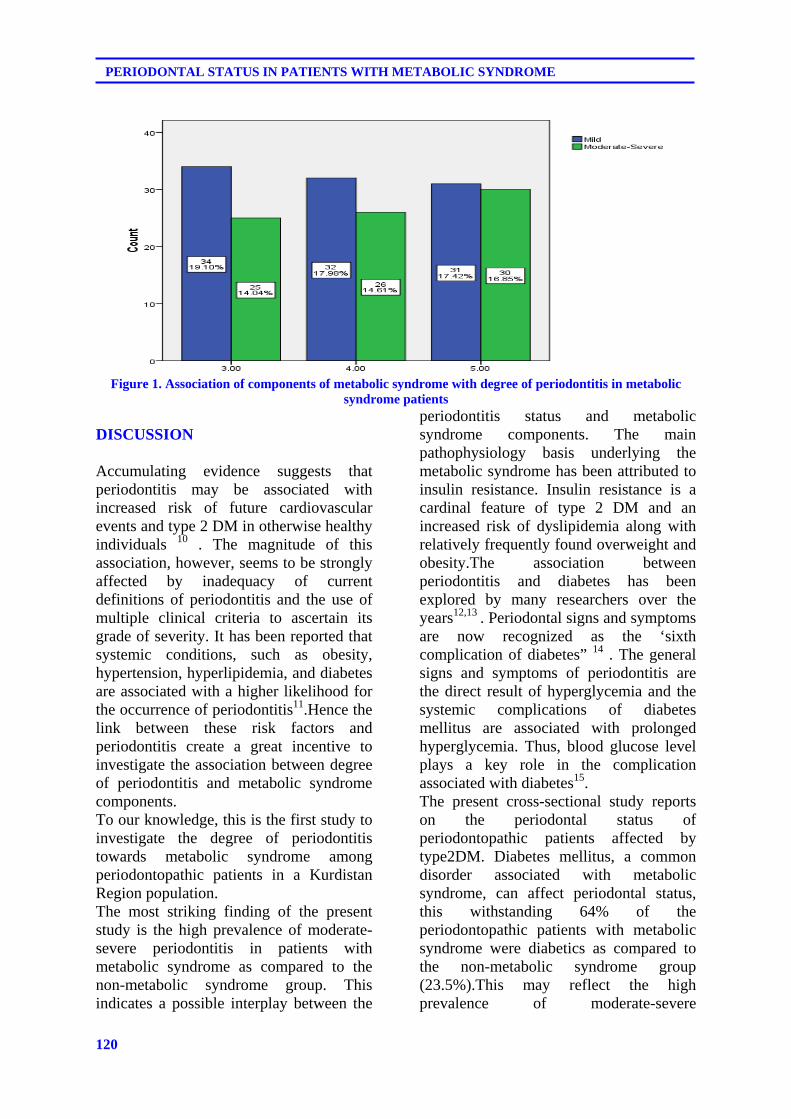
120
PERIODONTAL STATUS IN PATIENTS WITH METABOLIC SYNDROME
Figure 1. Association of components of metabolic syndrome with degree of periodontitis in metabolic
syndrome patients DISCUSSION
Accumulating evidence suggests that periodontitis may be associated with increased risk of future cardiovascular events and type 2 DM in otherwise healthy individuals 10 . The magnitude of this association, however, seems to be strongly affected by inadequacy of current definitions of periodontitis and the use of multiple clinical criteria to ascertain its grade of severity. It has been reported that systemic conditions, such as obesity, hypertension, hyperlipidemia, and diabetes are associated with a higher likelihood for the occurrence of periodontitis11.Hence the link between these risk factors and periodontitis create a great incentive to investigate the association between degree of periodontitis and metabolic syndrome components. To our knowledge, this is the first study to investigate the degree of periodontitis towards metabolic syndrome among periodontopathic patients in a Kurdistan Region population. The most striking finding of the present study is the high prevalence of moderate-severe periodontitis in patients with metabolic syndrome as compared to the non-metabolic syndrome group. This indicates a possible interplay between the
periodontitis status and metabolic syndrome components. The main pathophysiology basis underlying the metabolic syndrome has been attributed to insulin resistance. Insulin resistance is a cardinal feature of type 2 DM and an increased risk of dyslipidemia along with relatively frequently found overweight and obesity.The association between periodontitis and diabetes has been explored by many researchers over the years12,13 . Periodontal signs and symptoms are now recognized as the ‘sixth complication of diabetes” 14 . The general signs and symptoms of periodontitis are the direct result of hyperglycemia and the systemic complications of diabetes mellitus are associated with prolonged hyperglycemia. Thus, blood glucose level plays a key role in the complication associated with diabetes15. The present cross-sectional study reports on the periodontal status of periodontopathic patients affected by type2DM. Diabetes mellitus, a common disorder associated with metabolic syndrome, can affect periodontal status, this withstanding 64% of the periodontopathic patients with metabolic syndrome were diabetics as compared to the non-metabolic syndrome group (23.5%).This may reflect the high prevalence of moderate-severe
121
Duhok Medical Journal Volume 6, Supplement 3, 2012
periodontitis among metabolic syndrome patients. The association between severity of periodontitis and metabolic syndrome also has been suggested by other prospective studies16,17 For example, in a study by Pozharistkaia et al, 18 it was reported that 66.7percent of the cases with metabolic syndrome had active and aggressive course of chronic generalized showing no components of this syndrome(48.8 %).Analysis of data from 13,170 participants in the NHANES (Third National Health and Nutrition Examination) showed a direct relationship between periodontitis and the prevalence of metabolic syndrome(37% in those with severe periodontitis vs 18% in those with mild or no periodontitis19. In the present study, the results were comparable with those of the above mentioned study; the prevalence of severe periodontitis was more in patients with more than three components of the metabolic syndrome. It is noteworthy that 21.4% of the periodontopathic patients appear at risk for increase metabolic syndrome components and a reduction of metabolic syndrome components are associated with low incidence of periodontitis (12.1%). Moreover, the results of this study showed that there were significant differences between periodontopathic patients with metabolic syndrome and non-metabolic syndrome concerning degree of periodontitis. In 584 Japanese women with 5 components of metabolic syndrome, large waist circumference, low HDL-cholesterol level and high fasting plasma glucose level were associated with significantly higher odds ratios for greater pocket depth values; the adjusted odds ratio for these components were 1.8(95%Cl,1.2-2.8), 2.2(95%Cl,1.4-3.6) and 2.2(95%Cl 1.3-3.9) respectively. The results indicated that metabolic syndrome increase the risk of periodontitis and suggest that people exhibiting several components of metabolic syndrome should be encouraged to undergo a periodontal examination20 . In
comparing the finding of the present study with those of others, the present results exhibit similar outcomes to previous studies. This trend indicates an association between metabolic syndrome components and severity of periodontitis. The present study was not in the agreement with other studies21 regarding the blood pressure, because the blood pressure was similar between the mild and moderate-severe periodontitis groups. But, however periodontopathic patients appear at increased risk for hypertension and a prevalence of high blood pressure was observed in 183 out of 340 periodontopathic patients (53.8%). Periodontitis can negatively influence certain features of hypertension such as an increase in the left ventricular mass22. In general, there has been increasing evidence of a relationship between cardiovascular disease and periodontitis23, and chronic periodontitis could influence certain features of hypertension such as increased aortic stiffness and increased central blood pressure, which may in turn increase the left ventricular mass in these patients24. The various components of metabolic syndrome are all well documented cardiovascular risk factors that co-occur in an individual more often than might be expected by chance. Results of this study indicate that elevated prevalence of hypertension is related to cardiovascular risk factors in periodontopathic patients.. Many studies attempted to examine the relationship between obesity and periodontitis, the majority of these studies were primarily based on analyses of Japanese population and USA data from the third National Health Examination survey (NHANES). Furthermore, the marjory of the studies used body mass index as indicator of obesity and limited number of studies used combined indicator of overweight and obesity 25, 26. A strong association was found between body mass index and periodontitis in people with BMI>30Kg/m², it was 3 times more likely
122
PERIODONTAL STATUS IN PATIENTS WITH METABOLIC SYNDROME
to have periodontitis compared with those of the normal weight27. In the present study, BMI was not used as variable by reason of only few patients were obese. Determining waist circumference (WC) eliminates the inconsistencies of BMI. Recent large studies have indicated that measurement of WC or waist-hip ratio may be a better disease risk predictor than BMI28. However, there were no significant differences in the percentage degree of periodontitis, percentage of mild or moderate-severe in the highly elevated WC patients as compared to the normal WC group. This result agree with those obtained by Torrungruang et al,29 , but controversial to the results obtained by Al-Zahrani et al, 30 , they found that WC significantly associated with prevalence of periodontitis(adjusted OR=2.27). In another study, it had been observed that each 1 cm increase in WC was associated 5% increase risk of periodontitis 31 .This difference is because of systematic errors in estimating severity of periodontal disease in the present study and in the other studies. The observed discrepancy in the present data could be to sample derived from general population and not from obese individuals. This discrepancy can also be attributed to variation in the sample size. The investigator contributes that underlying biological mechanisms for the association of obesity with periodontitis are not well-known; however, adipose tissue-derived cytokines and hormones may play a key role. Fat tissue produces a vast amount of cytokines and hormones, collectively called adipokines or adipocytokines which in turn may modulate periodontitis 32. The association between periodontitis and dyslipidemia has been found in several cross-sectional studies 33, 34. In the present study, the mean serum triglycerides level was higher in periodontopathic patients with moderate-
severe periodontitis, and although almost all of periodontopathic patients have hypertriglyceridemia, the levels of serum triglycerides were not significantly differed compared with the levels in mild periodontitis group. The Triglycerides level for assessment of dyslipidemia was higher than 150mg/dl in 62.7% of periodontopathic patients, and it was positively associated with prevalence of periodontitis, odd ratio 0.84(95 %Cl 0.41-1.72), although statistically insignificant. The results of this study showed that there was no significant difference between the moderate-severe and mild periodontitis concerning the mean serum HDL-Cholesterol level. However, there were significant differences in the percentage of HDL-cholesterol, percentage of low HDL-cholesterol was higher in the mild periodontitis patients as compared to the moderate-severe periodontitis group. HDL-cholesterol is an important parameter to assess metabolic syndrome status and the majority of the present study population (77.6%) had a reduced HDL-cholesterol. In a study on 261 subjects , it was shown that HDL-cholesterol was directly associated with periodontitis35 .Such finding was not reported by others, which found no significant statistical result between chronic periodontitis and the plasmatic levels of total cholesterol and cholesterol fractions in study population 36. This observed difference could be due to the dissimilarity of the study population, the relationship between periodontal condition and lipid metabolism would differ because of the differences in genetic background, diet, population age, sex, structure and body habits 37 .Based on the present data, elevated prevalence of low HDL-cholesterol and hypertriglyceridemia indicate involvement of lipid metabolism in periodontitis. Further research is required to delineate this fascinating link
between dyslipidemia and degree of periodontitis. The study of Baelum,found a 45% prevalence of tooth loss among young age (20-29) year old group to 96% in the
60 years group. In the present study, the periodontopathic patients in the 20-39 year age had a high prevalence of mild periodontitis as compared to the moderate-
123
Duhok Medical Journal Volume 6, Supplement 3, 2012
severe periodontitis group 38.The prevalence of moderate-severe periodontitis was higher in patients with age range of 40->60 year. In comparing these findings with those of other studies, the present results exhibit similar outcomes to previous studies. This finding confirms the association between age and periodontitis. The difference in prevalence is explained by the fact that the various metabolic syndrome components such as diabetes mellitus, dyslipidemia and hypertension are more common in older age groups than younger age groups. ACKNOWLEDGMENT We would like to thank the staff of Dental Health Polyclinic especially Dr Mirza Murad as well as the staff of Duhok Diabetes Center Dr Yunus Aswad . REFERENCES
1. National Cholesterol Education
Treatment Panel III 2).Third report of the National Cholesterol Education Program (NCEP) Expert Panel on Detection, Evaluations, and Treatment of High Blood Cholesterol in Adults (Adult Treatment Panel III) final report. Circulation .2002; 106(25): 3143-421.
2. Han DH, Lim SY , Sun BC , Paek D, Kim HD. The association of metabolic syndrome with periodontal disease is confounded by age and smoking in a Korean population: the Shiwha-Banwol Environmental Health Study. J Clin Periodontol.2010; 37(7): 609-16.
3. Li P, He L, Sha QY, Luan QX. Relationship of Metabolic Syndrome to Chronic periodontitis . J periodontology.2009 ; 80(4):541-9.
4. Tsai C, Hayes C, Taylor GW. Glycemic control of type 2 diabetes and severe periodontal disease in the US adult population. Community Dent Oral Epidemiol.2002 ;30(3):182–92
5. Graves DT, Liu R , Oates TW . Diabetes – enhanced inflammation and apoptosis : impact on periodontal pathosis . Periodontol 2000.2007; 45: 128-37.
6. Genco RJ, Grissi SG, Ho A, Nishimura F, Murayama Y . A proposed model linking inflammation to obesity , diabetes and periodontal infections .J periodontol.2005 ; 76(11 suppl): 2075-84
7. Borges PK, Gimeno SG, Tomita NE, Ferreira SR. Prevalence and characteristics associated with metabolic syndrome in Japanese- Brazilians with and without periodontal disease. Cad Saude Publica.2007 ;23(3) : 657-68.
8. Shimazaki Y, Saito T, Yonemoto K, Kiyohara Y, Iida M, Yamashita Y. Relationship of metabolic syndrome to periodontal disease in Japanese women: the Hisayama Study. J Dent Res.2007 ;86(3):271–5
9. National Cholesterol Education Treatment Panel III .Third report of the National Cholesterol Education Program ( NCEP) Expert Panel on Detection , Evaluations, and Treatment of High Blood Cholesterol in Adults ( Adult Treatment Panel III ) final report. Circulation.2002 ; 106(25) : 3143-421.
10. Demmer RT, Jacobs DR Jr, Desvarieux M. Periodontal disease and incident type 2 diabetes: results from the First National Health and Nutrition Examination Survey and its epidemiologic follow-up study. Diabetes Care.2008 ; 31(7):1373–9
124
PERIODONTAL STATUS IN PATIENTS WITH METABOLIC SYNDROME
11. Scannapieco FA, Bush RB, Paju S.Association between periodontal disease and risk for atheroseclerosis, cardiovascular disease, and sroke.A systematic review. Ann periodontol.2003 ; 86(1) : 38-53
12. Nishimura F, Taniguchi A, Yamaguchi-Morimoto M, Soga Y, Iwamoto Y, Kokeguchi S,et al. Periodontal infection and dyslipidemia in type 2 diabetics: association with increased HMG-CoA reductase expression . Horm Metab Res.2006; 38(8): 530-5
13. Preshaw PM, Foster N, Taylor JJ . Cross- susceptibility between periodontal disease and type 2 diabetes mellitus : an immunobiological prespective. Periodontol 2000.2007 ; 45: 138-57
14. Rylander H, Ramberg P, Blohme G, Lindhe J . Prevalence of periodontal disease in young diabetics. J Clin Periodontol.1987 ;14(1):38-43.
15. Mealey BL, Rethman MP Periodontal disease and diabetes mellitus. Bidirectional relationship. Dent Today.2003 ;22(4):107–13
16. D Aiuto F , Sabbah W, Netuveli G , Donos N , Hingorani AD , Deanfield J et al . Association of the metabolic syndrome with sever periodontitis in a large U.S .population – based survey .J Clin Endocrine Metab.2008 ; 93(10): 3989-94
17. Li P, He L, Sha YQ, Luan QX. Relationship of Metabolic Syndrome to Chronic periodontitis., J periodontology.2009 ; .80(4):541-9.
18. Pozharitskaia MM , Simakova TG, Staroseltseva LK, Kirienko VV . Inflammatory disease of periodontium in patients with metabolic syndrome . Stomatologia (Mosk).2004 ; 83(6): 13-6
19. D Aiuto F , Sabbah W, Netuveli G , Donos N , Hingorani AD , Deanfield J et al . Association of the metabolic syndrome with sever periodontitis in a large U.S .population – based survey .J Clin Endocrine Metab.2008 ; 93(10): 3989-94
20. Shimazaki Y, Saito T, Yonemoto K, Kiyohara Y, Iida M, Yamashita Y.Relationship of metabolic syndrome to periodontal disease in Japanese women: the Hisayama Study. J Dent Res ;86(3):271–5
21. AL-Timimi DJ , AL-Bakir MM. Evaluation of Zinc status in patients With with metabolic syndrome .JABHS . 2009 ; 10(3) :23-8.
22. Valentaviciene G, Paipaliene P, Nedzelskiene I ,Zilinskas J, Anuseviciene OV . The relationship between blood serum lipids and periodontal condition. Stomatologija.2006 ; 8(3):96-100.
23. Dietrich T, Jimenez M , Krall Kaye EA,Vokonas PS, Garcia RI.Age-dependent association between chronic periodontitis / edentulism and risk of coronary heart disease. Circulation.2008; 117(13): 1668- 74
24. Franek E,Klamczynska E, Ganowicz E., Blach A, Budlewski T, Gorska R. Association of chronic periodontitis with left ventricular mass and central blood pressure in treated patients with essential hypertension . Am J Hypertens.2009 ; 22(2):203-7
25. Yusuf S. , Hawken S , OunpuuS , Bautista L, Franzosi M., Commerford P ,et al . Obesity and the risk of myocardial infarction in 27,000 participants from 52 countries: a case-control study . Lancet.2005 ; 366(9497): 1640-9
26. Khader YS, Bawadi HA, Haroun TF,Alomari M, Tayyem RF. The association between periodontal
125
Duhok Medical Journal Volume 6, Supplement 3, 2012
disease and obesity among adults in Jordan . J Clin Periodontol.2009 ; 36(1) :18-24.
27. Yusuf S. , Hawken S , OunpuuS , Bautista L, Franzosi M., Commerford P ,et al . Obesity and the risk of myocardial infarction in 27,000 participants from 52 countries: a case-control study . Lancet.2005 ; 366(9497): 1640-9 .
28. Torrungruang K , Tamsailom S, Rojanasomsith K , Sutdhibhisal S, Nisapakultorn K,Vanichjakvong O,et al.Risk indicators of periodontal disease in older Thai adult .J Periodontal.2005 ; 76(4): 558-65.
29. Al-Zahrani MS, Bissada NF, Borawskit EA. Obesity and periodontal disease in young, middle-aged, and older adults. J Periodontol.2003 ;74(5):610–5
30. Reeves A, Rees J, Schiff M, Hujoel
P .Total body weight and waist circumference associated with chronic periodontitis among adolescents in the United States .Arch pediatr adolesc Med.2006 ; 160(9): 894-9
31. Kershaw EE, Flier JS. Adipose tissue as an endocrine organ .J Clin Endocrinol Metab.2004 ;89(6): 2548-56
32. Dalla Vecchia C, Susin , Rosing C, Oppermann R, Albandar J. Overweight and obesity as risk indicators for periodontitis in adults . J periodontol.2005 ; 76(10): 1721-8.
33. Ylostalo P, Suominen –Taipale L,
Reunanen A, Knuuttila M . Association between body weight
and periodontal infection.J Clin periodontol.2008 ; 35(4):297-304.
34. Johnson RB, Serio FG.Leptin within healthy and diseased human gingiva. J Periodontol.2001 ; 72(9): 1254-7..
35. Eapen D, Kalra GL, Merchant N, Arora A, Khan BV. Metabolic syndrome and cardiovascular disease in south Asians. Vasc Health Risk Manag. 2009;5:731–743.
36. Friendlander AH, Weinrab J, Friendlander I, Yagiela JA.Metabolic Syndrome : Pathognesis , medical care and dental implications. J Am Dent Assoc .2007;138(2): 179-87
37. Baelum V, Luan WM, Chen X, Fejerskov O. Predictors of destructive periodontal disease incidence and progression in adults and elderly Chinese. Community Dent Oral Epidemiol.1997 ; 25(4):265-72.
38. Ogunbodede EO, Fatusi OA, Akintomide A, Kolawole K, Ajayi A. Oral health status in a population of Nigerian diabetics. J Contemp Dent Pract .2005; 6(4): 75–84.
126
PERIODONTAL STATUS IN PATIENTS WITH METABOLIC SYNDROME
ón‚íq@@ŽôàïÜíibnïà@bï‚bóä@b’ìóm@æŽï’í‚óä@@ãó§@bî‡q@b’ìòŠ@@
@@Úïjnò†Z@ìŒ@õìóÜóÔ@ôØòì@ŽôàïÜíibnïà@bï‚bóä@æŽïmbéÙŽïq@Šó@ß@båïÜíØóÄ@õóiŠ@~@@@Žôåîí‚@aŠb“ïÐ@bäíiŒŠói@~@@@æèì†@ò‡ŽîŒ@~@@bäíiŒŠói
@óÄ@Žôî‡q@l@æŽî‹ @æŽïäa†ìóè@bäíiò‡ŽîŒ@õa‡Žî‹ @Žôî@õŒíØíÜíØN@@wäbàŠb÷Z@‚bóä@ô’ím@æŽï’í‚óä@ãó§@óÄ@Žôî‡q@l@õa‡Žî‹ @æŽïîò‹ @æŽïäa†ìóè@a‰ŽîŠ@båïäaŒ@ßó †@ÛóìaŠói@ì@õóè@ŽôäŠaí‚@bî@ãïÜíibnïà@bï
@ŽôàïÜíibnïà@ßó †@Žôî‡q@æŽïïŽî‹ @æŽïäa†ìóè@aŠójÄbä†@bäa‡Žî‹ @ç‹Øbïå܆@íiˆ@æîíióä@ãïÜíibnïà@bï‚bóä@ô’ím@æŽï’í‚óäN@@ôä‹ØŠbØ@bÙŽîŠZ@@Ûíè†@bèó ŽîŠbq@ß@bäa††@bîŠa‡’íä@bî@‡äó¸ójîbm@bèóÜóàíØ@ß@óåïÜíØóÄ@Äó÷@N†ŠíØ@çbn@I@×a÷@H@b’í‚óä@Þš@ì†ó@Žô
@@@@@@@óîíi@çaì@ŠóÜ@óåïÜíØóÐ@Äó÷@bî‡q@μŽî‹ @æŽïäa†ìóè@æŽïîó“îŠb÷@æŽïî@N@@@@ôÄò†@båŽïåïåÙ“q@ôn“q@~@@@@@Žôî‡q@bäa†ìóè@þq@bä‡äbäóÜóè@I@ôÄì‹à@bä‡Žî‹ @bäíiòŒŠói@~@bî‡q@æŽïÙîŠói@bïmaŠíïØ@H@bäbåï÷óÅnò‡iì@Idemographic data@@Hbåîí‚@ŠóÜ@ì@@@@õˆì‹i@æŽï’í‚óä@‡äóš
@¶íÕŽï@Žôåèì†@ì@ŒŒíØíÜíØbäbÅïq@íiˆ@~@@ÛóÜó @m@Žôî@ôåèì†@Žôåïmì‹q@ßìíÜíØ@N@@@@@@@æŽï‚bóä@íØ@ç‹Ùäb“ïnò†@ómbè@Žôåïè@ôn“q@óïäbéïu@æŽîŠa‡äbn@Æî‡Ü@ãïÜíibnïàNational Cholesterol Education Program – Adult Treatment Panel@@
ãb−ó÷Z@340@’í‚óä@b@~57,9@@E@Ša숆@æŽïî@óä@çìíióè@bî‡q@æŽïäa†ìóè@~39,7@@E@ÚÅ@æŽïî@bî‡q@æŽïäa†ìóè@~2.4@@E@@@@bî@bî‡q@æŽïäa†ìóèŠa숆@N@@@ŽôàïÜíibnïà@æŽï‚bóä@Žôqì‹ @ˆ@çìíi@ŠìŒ@bØò‰ŽîŠ@l@ÚÅ@ì@Ša숆@bä‹Ùäb“ïnò†@I45.5@@@ESV @38.3@@H@E@@@ßó †@õ†ŠìaŠói
î†@ãïÜíibnïà@óä@æŽï‚bóä@çaìó÷@ôäbàaŠ@æŽîŠbàb÷@Æî‡Ü@íi@Šb0.05@<@p@@@@@@@@@@òŒŠói@bî@õŒíØíÝØ@a‰ŽîŠ@íØ@íi@Šbî†@ÚÅ@ì@Ša숆@æŽî‹ @æŽïäa†ìóè@æŽï‚bóä@çaìó÷@ãïÜíibnïà@æŽïî@wåŽïq@æŽïmbéÙŽïq@ˆ@~@@@Žôåèì†@bäíiŒŠói
Žïq@çaìó÷@Ša숆@óä@æŽî‹ @æŽïäa†ìóè@æŽï‚bóä@ÛóÜó @õ†ŠìaŠói@Žôåîí‚@aŠb“ïÐ@bäíiŒŠói@ì@¶íÕŽï@@@æŽî‹ @ˆ@‡åÝi@bØò‰ŽîŠ@çaìó÷@óäóè@pbéÙŽïq@w@Žôî‡q@íi@ŠbÙîŠbè21.4@@@E@õóä@ŽôàïÜíibnïà@æŽïmbéÙŽïq@@æŽîìó÷@ßó †@õ†ŠìaŠói12,1@@E@@
ãbvå÷Šò†Z@@§@bïî‡q@b’ìòŠ@óä‹ @bî@aŠìóÜ@ãïÜíibnïà@æŽï‚bóä@ãó§@Žôî‡q@æŽïäa†ìóè@bî@‡åÝi@bäíjÄýóiŠói@a‰ŽîŠ@íØ@a‡ïàóèŠói@ß@íi@Šbî†@ãóŽôàïÜíibnïà@æŽï‚bóä@@
127
Duhok Medical Journal Volume 6, Supplement 3, 2012
ó–þ©a@ @Üa@ôš‹¾a@À@órÝÜa@óÜby‰ÍÜa@îýa@óàŒþnà@çíäbÉî@æî‰ð÷a@@
@@
Ëíší¾a@óïÑÝ‚Z@@óäa‡jÜa@Þrà@óï›îýa@óàŒþn¾a@‹–båÈ@ça@onjqa@pbaŠ†@ò‡È~@ã‡Üa@ÂÍš@ËbÑmŠa@~ãíz“Üa@ò†bîŒ@~@Þ—¾a@ŒíØíÝØ@õínàórÝÜ@óáÈa‡Üa@óväýa@lbénÜa@tì‡y@ò†bîi@óÕÝÉnà@N@@
Ó‡aZ@Üa@ôš‹¾a@À@órÝÜ@óáÈa‡Üa@óväýa@lbénÜa@ójä@óЋÉà‰ÍÜa@îýa@óàŒþnà@âè‡åÈ@æî‰à@óäŠbÕà@ð÷aÜa@ôš‹¾a@ʉ@âè‡åÈ@‡uím@ý@æîóï›îýa@óàŒþn¾a@Êà@órÝÜa@óväa@lbénÜa@ójä@μi@óÔþÉÜa@‡ïØbnÜì@óï›îýa@óàŒþnàN@@
ÞáÉÜa@ óÕî‹ Z@è@oî‹uc‰@çbn†ŠíØL@Ûíè†@óåî‡à@À@çbåÿa@kÜ@ð——ƒnÜa@Êáª@À@óaŠ‡Üa@ëI×a‹ÉÜaN@ H@b›î‹à@çíÉiŠcì@ ó÷bà@tþq‡Üa@óväÿa@lbénÜa@æà@çíäbÉî@óaŠ‡Üa@À@çíÜíá“à@órÝÜ@óáÈa@N@órÝÜa@lbénÜa@óuŠ†@âïïÕmì@L@ñ‹î‹Üc@ñíáÑÜa@˜zÑÜa@‡ÉiI@ÃbjmŠýa@ça‡ÕÐ@óîírÝÜa@líï§a@ÖáÈL@ñ‹“jÜaH@ôÝÈ@ßí—¨aì demographic data@çíè‡Üa@ŒíØíÝÙÜa@‘bïÕÜ@μá÷b—Üa@ôš‹¾a@ã†@æà@pbåïÈ@ôÝÈì
ïÜbÉÜa@óïáz“Üa@pbåïmìÜa@@ßìÜíØ@LóïqþrÜaóÐbrÙÜa@óNóïÜì†@îbÉà@@ÖÐì@óï›îýa@óàŒþn¾a@ôš‹à@˜ïƒ“m@@bè‡Éiì
@ National Cholesterol Education Program –Adult Treatment Panel@@
@@
w÷bnåÜaZ@340@@@Lôš‹¾a@æà57.9@EL†b¨a@Ì@órÝÜa@lbénÜa@âè‡åÈ39.7@EL߇nɾa@órÝÜa@lbénÜa@âè‡åÈ2.4E†b¨a@órÝÜa@lbénÜa@âè‡åÈM@߇nɾaN@óï›îýa@óàŒþn¾a@óÈíáª@À@bïÜbÈ@çbØ@߇nɾa@†b¨a@˜ïƒ“mI45.5@@@@ESV@@3@@N38@@@HE@óàŒþnà@†íuì@ã‡È@Êà@óäŠbÕà
@ñíåÉà@ð÷b—yg@æîbjm@‹éÄa@‡Ôì@îý[email protected]@<@P@Üa@ôš‹¾a@çbÐ@óï›îýa@óàŒþnáÝÜ@óá©a@‹–båÉÜa@æà‰@óväýa@lbénÜa@âéî‡Ü@æîâè‡åÈ@ ߇nɾa@ †b¨a@@ Þ—¾a@ ŒíÙÝÙÜ@ óïÜbÈ@ ójä~Üa@ ôš‹¾a@ Êà@ óäŠbÕà@ ã‡Üa@ÂÍš@ ËbÑmŠaì@ óïqþrÜa@ ãíz“Üa@ ËbÑmŠa‰@lbénÜa@ âè‡åÈ@ æî
†b¨a@Ì@óväýaNÜa@ôš‹¾a‰@órÝÜ@óáÈa‡Üa@óväýa@lbénÜý@óïÜbÈ@ójä@âè‡åÈ@pbäíÙà@ó½@âè‡åÈ@æî21.4 @EÜa@Êà@óäŠbÕà‰@‡uím@ý@æîýa@óàŒþnáÝÜ@pbäíÙà@ña@âè‡åÈ@óï›î12.1E
xbnånýaZ@ì@óï›îýa@óàŒþn¾a@ôš‹à@À@órÝÜa@lbénÜa@æà@óïÜbÈ@Šb“näa@ójä@Ûbåè@çc@w÷bnåÜa@p‹éÄc‰@órÝÜa@óÜby@âïïÕm@ñŠì‹›Üa@æáÐ@@a@óï›îýa@óàŒþn¾a@ôš‹à@ÀN@@
128
EFFECTIVENESS OF A HEALTH EDUCATIONAL PROGRAM ON KNOWLEDGE OF…
EFFECTIVENESS OF A HEALTH EDUCATIONAL PROGRAM ON KNOWLEDGE OF PATIENT WITH MYOCARDIAL INFARCTION
YOUSIF MUHAMMED YOUNIS SAADIA AHMED KHUDER
Submitted 18 Jun 2012; accepted 3 Sep 2012 ABSTRACT Background and objectives: Myocardial infarction is the death of myocardial tissue as a result of prolonged lack of blood and oxygen supply. Knowledge about causes, risk factors and lifestyle, has impact on the life of patients. The objective is to assess knowledge of myocardial patient before and after implementing of health educational program about heart attack (pre and post-test). Methods: A quasi-experimental study was carried out through the application of pre-test and post-test, on patient with myocardial infarction at Hawler and Rizgary teaching hospitals in Erbil city. The study sample consist of (303) patients. The data collections were carried out from the period of the 1st of May 2008 to the 1st of May 2009. Results: The highest percentage (30.36%) of the study samples their age between (60-69) years, more than half of the study samples were illiterate. The majority (86.13%) of the study samples were not received any information about MI. There were highly significant differences of patient’s knowledge in the pre and post-test. As well as in relation between patient’s knowledge and their age, level of education and occupation between the pre and post-test. Conclusion: The findings revealed that the health educational program has an effect on increasing the knowledge of the patients with myocardial infarction in the post-test.
Duhok Med J 2012; 6 Suppl 3:128-135. Key words: Health educational program, knowledge, myocardial infarction.
ardiovascular disease it remains the major cause of mortality in the
twenty-first century, nearly one have of all deaths in industrialized nations and 25% of those in developing countries are due to coronary heart disease1. In the United Kingdom annually, it kills more people than the next five causes of death combined including cancer, chronic lower respiratory disease, accidents, diabetes, influenza and pneumonia2. Various lifestyle factors such as, cigarette smoking, lack of exercise, and unhealthy diet , abdominal obesity, high serum lipid level, high blood pressure and diabetes mellitus are risk factors of CVD 3. A study conducted in Iraq that the prevalence of cardiac disease is12 per 1000 persons, rates are slightly higher in Urban area than in rural areas 9.2 per 1000 persons and it increased after the age 50 years 4. To prevent the onset and recurrence of myocardial infarction, the most important
thing is to control the risk factors of atherosclerosis, the main cause of myocardial infarction5. A study was found that a high prevalence of cardiovascular disease, risk factors among a sample of 5840 Omanian their age was 20 and older 6. In Erbil a survey showed that urban population has the same cardiovascular disease risk factors profile as western societies including hypertension, diabetes mellitus, and smoking7. Many preventive measures can be taken to avoid heart attack. Controllable factors that can contribute to the heart disease which include smoke, high blood pressure, high serum cholesterol, stress, obesity, sedentary lifestyle and diabetes mellitus8. Improvements in diagnosis, prevention and treatment, the mortality rate from coronary heart disease has declined gradually over the past several decades9.
* College of Nursing ,Hawler Medical University, Erbil. Correspondence author: Yousif Muhammed Younis..Email:[email protected]
C
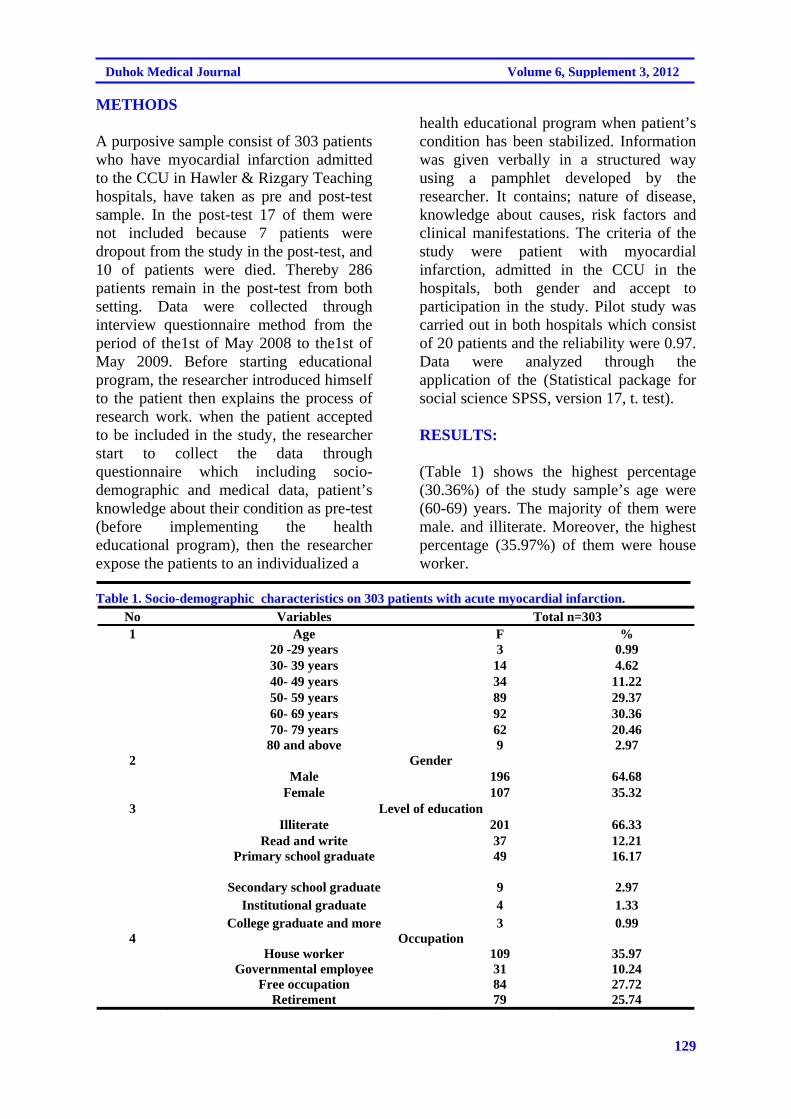
129
Duhok Medical Journal Volume 6, Supplement 3, 2012
METHODS
A purposive sample consist of 303 patients who have myocardial infarction admitted to the CCU in Hawler & Rizgary Teaching hospitals, have taken as pre and post-test sample. In the post-test 17 of them were not included because 7 patients were dropout from the study in the post-test, and 10 of patients were died. Thereby 286 patients remain in the post-test from both setting. Data were collected through interview questionnaire method from the period of the1st of May 2008 to the1st of May 2009. Before starting educational program, the researcher introduced himself to the patient then explains the process of research work. when the patient accepted to be included in the study, the researcher start to collect the data through questionnaire which including socio-demographic and medical data, patient’s knowledge about their condition as pre-test (before implementing the health educational program), then the researcher expose the patients to an individualized a
health educational program when patient’s condition has been stabilized. Information was given verbally in a structured way using a pamphlet developed by the researcher. It contains; nature of disease, knowledge about causes, risk factors and clinical manifestations. The criteria of the study were patient with myocardial infarction, admitted in the CCU in the hospitals, both gender and accept to participation in the study. Pilot study was carried out in both hospitals which consist of 20 patients and the reliability were 0.97. Data were analyzed through the application of the (Statistical package for social science SPSS, version 17, t. test). RESULTS:
(Table 1) shows the highest percentage (30.36%) of the study sample’s age were (60-69) years. The majority of them were male. and illiterate. Moreover, the highest percentage (35.97%) of them were house worker.
Table 1. Socio-demographic characteristics on 303 patients with acute myocardial infarction.
No Variables Total n=303 1 Age F % 20 -29 years 3 0.99 30- 39 years 14 4.62 40- 49 years 34 11.22 50- 59 years 89 29.37 60- 69 years 92 30.36 70- 79 years 62 20.46 80 and above 9 2.97 2 Gender Male 196 64.68 Female 107 35.32 3 Level of education Illiterate 201 66.33 Read and write 37 12.21 Primary school graduate 49 16.17
Secondary school graduate 9 2.97 Institutional graduate 4 1.33 College graduate and more 3 0.99 4 Occupation House worker 109 35.97 Governmental employee 31 10.24 Free occupation 84 27.72 Retirement 79 25.74
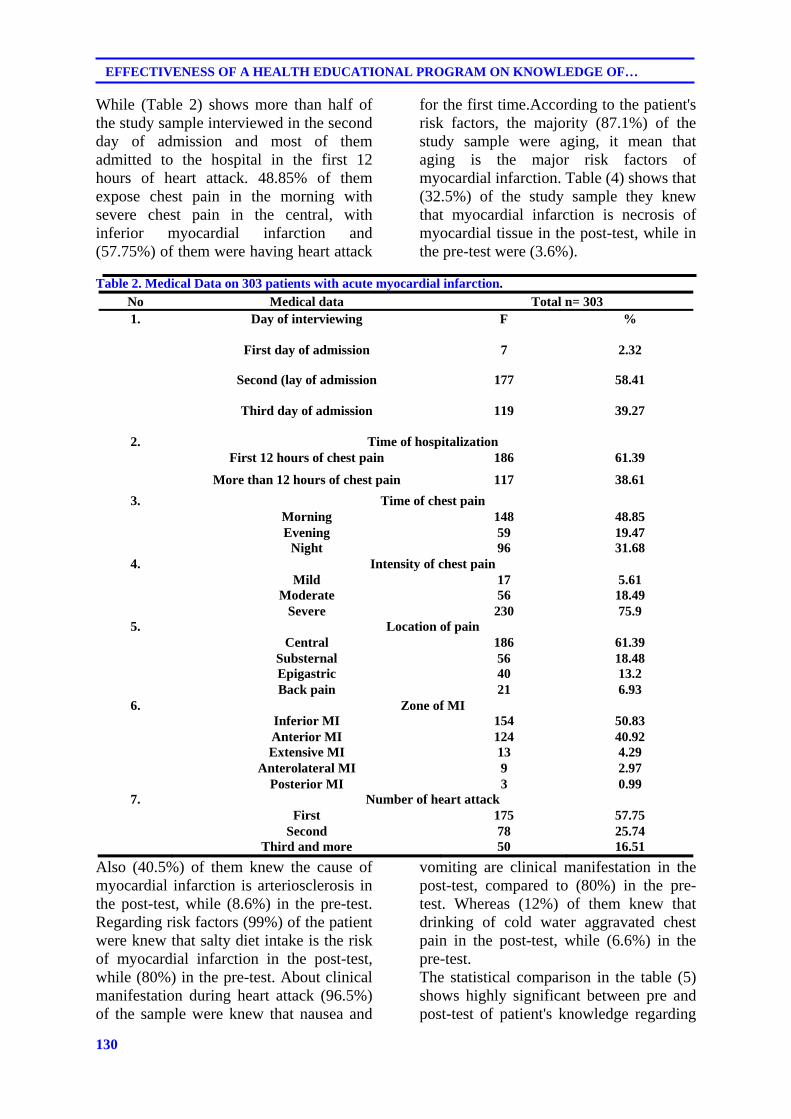
130
EFFECTIVENESS OF A HEALTH EDUCATIONAL PROGRAM ON KNOWLEDGE OF…
While (Table 2) shows more than half of the study sample interviewed in the second day of admission and most of them admitted to the hospital in the first 12 hours of heart attack. 48.85% of them expose chest pain in the morning with severe chest pain in the central, with inferior myocardial infarction and (57.75%) of them were having heart attack
for the first time.According to the patient's risk factors, the majority (87.1%) of the study sample were aging, it mean that aging is the major risk factors of myocardial infarction. Table (4) shows that (32.5%) of the study sample they knew that myocardial infarction is necrosis of myocardial tissue in the post-test, while in the pre-test were (3.6%).
Table 2. Medical Data on 303 patients with acute myocardial infarction.
No Medical data Total n= 303 1. Day of interviewing F %
First day of admission 7 2.32
Second (lay of admission 177 58.41
Third day of admission 119 39.27
2. Time of hospitalization First 12 hours of chest pain 186 61.39
More than 12 hours of chest pain 117 38.61
3. Time of chest pain Morning 148 48.85 Evening 59 19.47 Night 96 31.68
4. Intensity of chest pain Mild 17 5.61 Moderate 56 18.49 Severe 230 75.9
5. Location of pain Central 186 61.39 Substernal 56 18.48 Epigastric 40 13.2 Back pain 21 6.93
6. Zone of MI Inferior MI 154 50.83 Anterior MI 124 40.92 Extensive MI 13 4.29 Anterolateral MI 9 2.97 Posterior MI 3 0.99
7. Number of heart attack First 175 57.75 Second 78 25.74 Third and more 50 16.51
Also (40.5%) of them knew the cause of myocardial infarction is arteriosclerosis in the post-test, while (8.6%) in the pre-test. Regarding risk factors (99%) of the patient were knew that salty diet intake is the risk of myocardial infarction in the post-test, while (80%) in the pre-test. About clinical manifestation during heart attack (96.5%) of the sample were knew that nausea and
vomiting are clinical manifestation in the post-test, compared to (80%) in the pre-test. Whereas (12%) of them knew that drinking of cold water aggravated chest pain in the post-test, while (6.6%) in the pre-test. The statistical comparison in the table (5) shows highly significant between pre and post-test of patient's knowledge regarding
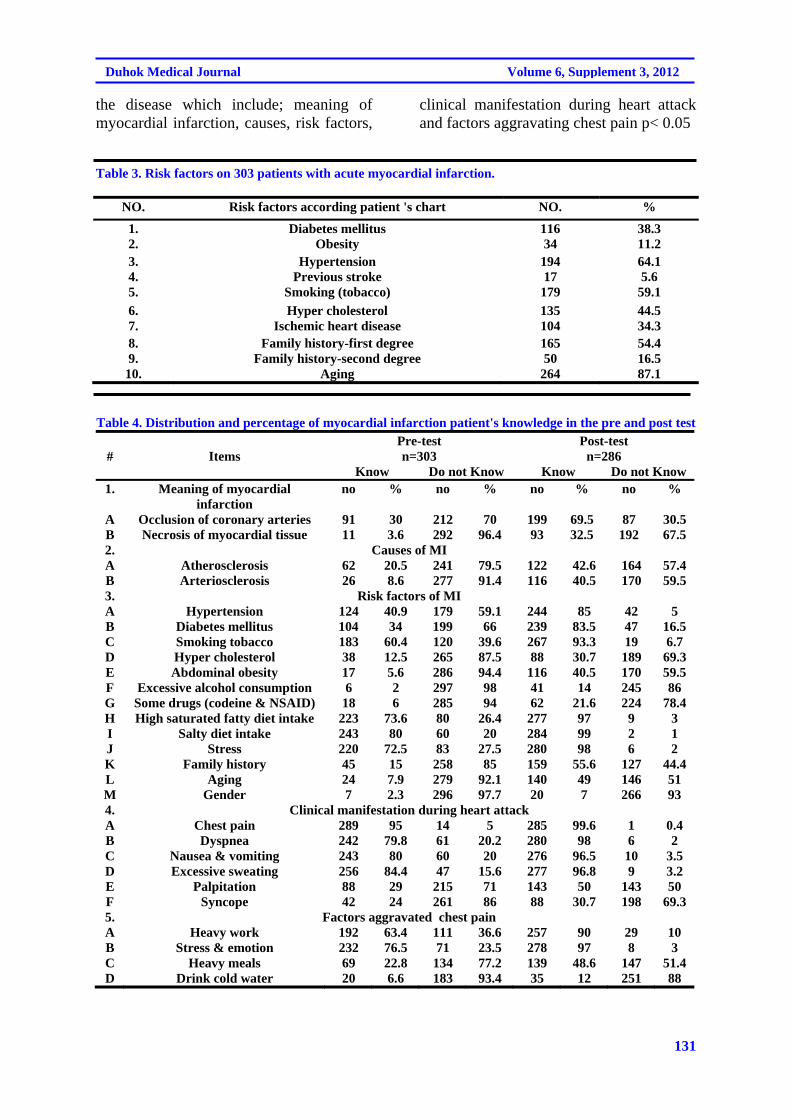
131
Duhok Medical Journal Volume 6, Supplement 3, 2012
the disease which include; meaning of myocardial infarction, causes, risk factors,
clinical manifestation during heart attack and factors aggravating chest pain p< 0.05
Table 3. Risk factors on 303 patients with acute myocardial infarction.
NO. Risk factors according patient 's chart NO. %
1. Diabetes mellitus 116 38.3 2. Obesity 34 11.2 3. Hypertension 194 64.1 4. Previous stroke 17 5.6 5. Smoking (tobacco) 179 59.1
6. Hyper cholesterol 135 44.5 7. Ischemic heart disease 104 34.3 8. Family history-first degree 165 54.4 9. Family history-second degree 50 16.5 10. Aging 264 87.1
Table 4. Distribution and percentage of myocardial infarction patient's knowledge in the pre and post test
# Items Pre-test Post-test n=303 n=286
Know Do not Know Know Do not Know 1. Meaning of myocardial
infarction no % no % no % no %
A Occlusion of coronary arteries 91 30 212 70 199 69.5 87 30.5 B Necrosis of myocardial tissue 11 3.6 292 96.4 93 32.5 192 67.5 2. Causes of MI A Atherosclerosis 62 20.5 241 79.5 122 42.6 164 57.4 B Arteriosclerosis 26 8.6 277 91.4 116 40.5 170 59.5 3. Risk factors of MI A Hypertension 124 40.9 179 59.1 244 85 42 5 B Diabetes mellitus 104 34 199 66 239 83.5 47 16.5 C Smoking tobacco 183 60.4 120 39.6 267 93.3 19 6.7 D Hyper cholesterol 38 12.5 265 87.5 88 30.7 189 69.3 E Abdominal obesity 17 5.6 286 94.4 116 40.5 170 59.5 F Excessive alcohol consumption 6 2 297 98 41 14 245 86 G Some drugs (codeine & NSAID) 18 6 285 94 62 21.6 224 78.4 H High saturated fatty diet intake 223 73.6 80 26.4 277 97 9 3 I Salty diet intake 243 80 60 20 284 99 2 1 J Stress 220 72.5 83 27.5 280 98 6 2 K Family history 45 15 258 85 159 55.6 127 44.4 L Aging 24 7.9 279 92.1 140 49 146 51 M Gender 7 2.3 296 97.7 20 7 266 93 4. Clinical manifestation during heart attack A Chest pain 289 95 14 5 285 99.6 1 0.4 B Dyspnea 242 79.8 61 20.2 280 98 6 2 C Nausea & vomiting 243 80 60 20 276 96.5 10 3.5 D Excessive sweating 256 84.4 47 15.6 277 96.8 9 3.2 E Palpitation 88 29 215 71 143 50 143 50 F Syncope 42 24 261 86 88 30.7 198 69.3 5. Factors aggravated chest pain A Heavy work 192 63.4 111 36.6 257 90 29 10 B Stress & emotion 232 76.5 71 23.5 278 97 8 3 C Heavy meals 69 22.8 134 77.2 139 48.6 147 51.4 D Drink cold water 20 6.6 183 93.4 35 12 251 88
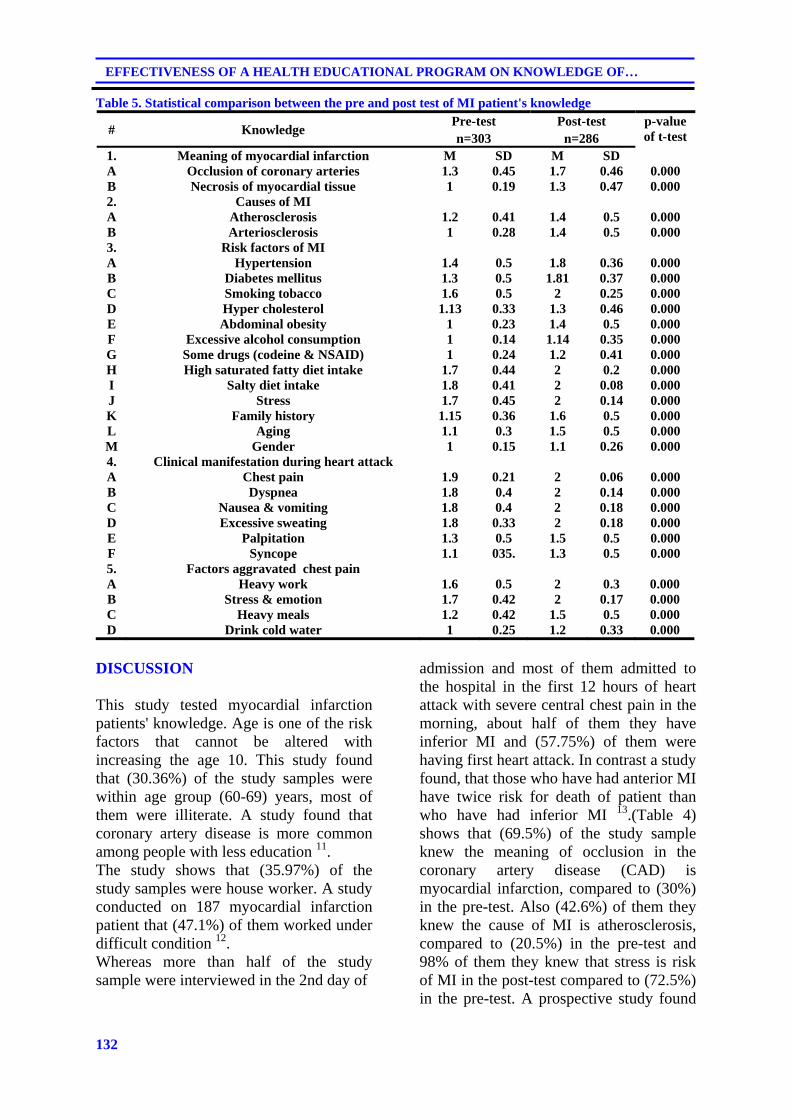
132
EFFECTIVENESS OF A HEALTH EDUCATIONAL PROGRAM ON KNOWLEDGE OF…
Table 5. Statistical comparison between the pre and post test of MI patient's knowledge
# Knowledge Pre-test Post-test p-value
of t-test n=303 n=286 1. Meaning of myocardial infarction M SD M SD A Occlusion of coronary arteries 1.3 0.45 1.7 0.46 0.000 B Necrosis of myocardial tissue 1 0.19 1.3 0.47 0.000 2. Causes of MI A Atherosclerosis 1.2 0.41 1.4 0.5 0.000 B Arteriosclerosis 1 0.28 1.4 0.5 0.000 3. Risk factors of MI A Hypertension 1.4 0.5 1.8 0.36 0.000 B Diabetes mellitus 1.3 0.5 1.81 0.37 0.000 C Smoking tobacco 1.6 0.5 2 0.25 0.000 D Hyper cholesterol 1.13 0.33 1.3 0.46 0.000 E Abdominal obesity 1 0.23 1.4 0.5 0.000 F Excessive alcohol consumption 1 0.14 1.14 0.35 0.000 G Some drugs (codeine & NSAID) 1 0.24 1.2 0.41 0.000 H High saturated fatty diet intake 1.7 0.44 2 0.2 0.000 I Salty diet intake 1.8 0.41 2 0.08 0.000 J Stress 1.7 0.45 2 0.14 0.000 K Family history 1.15 0.36 1.6 0.5 0.000 L Aging 1.1 0.3 1.5 0.5 0.000 M Gender 1 0.15 1.1 0.26 0.000 4. Clinical manifestation during heart attack A Chest pain 1.9 0.21 2 0.06 0.000 B Dyspnea 1.8 0.4 2 0.14 0.000 C Nausea & vomiting 1.8 0.4 2 0.18 0.000 D Excessive sweating 1.8 0.33 2 0.18 0.000 E Palpitation 1.3 0.5 1.5 0.5 0.000 F Syncope 1.1 035. 1.3 0.5 0.000 5. Factors aggravated chest pain A Heavy work 1.6 0.5 2 0.3 0.000 B Stress & emotion 1.7 0.42 2 0.17 0.000 C Heavy meals 1.2 0.42 1.5 0.5 0.000 D Drink cold water 1 0.25 1.2 0.33 0.000
DISCUSSION This study tested myocardial infarction patients' knowledge. Age is one of the risk factors that cannot be altered with increasing the age 10. This study found that (30.36%) of the study samples were within age group (60-69) years, most of them were illiterate. A study found that coronary artery disease is more common among people with less education 11. The study shows that (35.97%) of the study samples were house worker. A study conducted on 187 myocardial infarction patient that (47.1%) of them worked under difficult condition 12. Whereas more than half of the study sample were interviewed in the 2nd day of
admission and most of them admitted to the hospital in the first 12 hours of heart attack with severe central chest pain in the morning, about half of them they have inferior MI and (57.75%) of them were having first heart attack. In contrast a study found, that those who have had anterior MI have twice risk for death of patient than who have had inferior MI 13.(Table 4) shows that (69.5%) of the study sample knew the meaning of occlusion in the coronary artery disease (CAD) is myocardial infarction, compared to (30%) in the pre-test. Also (42.6%) of them they knew the cause of MI is atherosclerosis, compared to (20.5%) in the pre-test and 98% of them they knew that stress is risk of MI in the post-test compared to (72.5%) in the pre-test. A prospective study found
133
Duhok Medical Journal Volume 6, Supplement 3, 2012
that negative stress and emotion are risk factors for the incidence of coronary artery disease 14,15. Nearly the entire study sample knew that dyspnea is a clinical manifestation in the post-test compared to (79.8%) knew in the pre-test. While nearly half of them they knew that heavy meals is aggravated chest pain in the post-test compared to (22.8%) in the pre-test. A study found that up to 30% of MI patients are known to have CAD and such patients at risk of coronary events and their close relatives, would benefit from appropriate advice perhaps in the form of written guidelines 16. A study has shown that low levels of educations are associated with premature MI 17, 18. There were highly statistical differences between pre and post-test of patient regarding myocardial infarction disease. CONCLUSION Myocardial infarction patients improved by giving health educational program which lead to increased knowledge of all patients regarding myocardial infarction in the post-test. REFERENCES
1. Carpenter C, Griggs R , Benjamin I .Coronary Heart disease. 7th ed. Canada: Saunders Elsevier Comp; 2007.p 97-113.
2. Ignatavicius D , Workman M .Medical-Surgical Nursing. 5th ed. Vol.2.. New York: Elsevier Comp; 2006. p. 840-60.
3. Fenton D. Myocardial infarction. Available from http://www.cme.edscap.com. Accessed on Sep. 2007,10.2008.
4. World Health Organization. Iraq family Health survey. Available from http:// www.prevetive.org. 2005. Access on Oct.20, 2009.
5. Habib M , abdulrahman W .Prevalence of cardiovascular risk factors among general population
in Erbil .ZIMS. 2006;10 (1&2):69-75.
6. Jeong HS, Chae JS, Moon JS, Yoo YS.An Individualized teaching program for atherosclerotic risk factors in patients with myocardial infarction.Yonsei Med J.2002;43 (1): 93-100.
7. AL-Lawati J Riyami A ,Mohammed A .High prevalence of risk factors for cardiovascular disease in Oman, inten WHO; 2000.
8. Salem M. Cardiovascular Disease, Moon Dragon's Health information. Available from http://www.moon dragon.org. 1997. Accessed on Oct.12, 2008.
9. Timby B , Smith N. Essential of Nursing care of Adult. Sydney: Lippincott and Wilkins Comp; 2005. p. 390-6.
10. Lewis S, Heitkemper M, Dirksen S, O'Brien P , Bucher L . Medical-Surgical Nursing, Assessment and management of clinical problems, 7th ed. London :Mosby Elsevier Comp; 2007.p.740-50.
11. Sarraf-Zadegan N, Sayed-Tabatabaei FA, Bashardoost N, Maleki A, Totonchi M, Habibi HR,et al .The Prevalence of Coronary Artery disease in an Urban Population in Isfahan, Iran.Acta Cardiol.1999;54 (5):257-63.
12. Yilmaz M , Emiroglu O. The need assessment of myocardial infarction patients in discharge planning and home health care. Available from http://www.ispub.com. 2005. Accessed on Nov. 14, 2008.
13. Peterson ED, Shaw LJ, Califf RM.Risk stratification after myocardial infarction.Ann Intern Med.1997; 126(7): 561-82.
14. Albert C, Chae C, Rextrode K, Manson J, Kawaki I. Public Anxiety and Risk of Coronary
134
EFFECTIVENESS OF A HEALTH EDUCATIONAL PROGRAM ON KNOWLEDGE OF…
Heart disease and Sudden Cardiac death. Available from http://www.circ.ahaournals.org. 2005. Accessed on Sep. 11, 2008.
15. Kaiser F, Morley J ,Coe R. Cardiovascular Disease in older people. Baltimore :spring house publisher comp; 2000. p. 32-45.
16. Khan MS, Jafary FH, Jafar TH, Faruqui AM, Rasool SI, Hatcher J,,et al. Knowledge of modifiable risk factors of heart disease among patients with acute myocardial infarction in Karachi-Pakistan: a
cross sectional study.BMC Cardivasc Disord.2006;6:18.
17. Weston CF, Penny WJ ,Jullian DG. Guidelines for the early management of patients with myocardial infarction. BMJ.1994; 308(6931): 767-71.
18. Jafary F, Aslam F, Mahmud H, waheed A, Shakir M , Ahzal A,et al. Cardiovascular Health Knowledge and behavior in patient attendants at four tertiary care hospitals in Pakistan-- a cause for concern.BMC Public Health.2005;5:124.
135
Duhok Medical Journal Volume 6, Supplement 3, 2012
ón‚íq@@
ôä‡äbäóÜóè@õŠbïäaŒ@ô’Ží‚óä@•ìím@ìíi@ói@õòŠŽíä@Žß†@óÜ@Šó@ôàa‹ Žì‹q@õjäó’ŽìŠ@ôn슇äóm@@íõŠbïäaŒ@çbØó−bàb÷:@õòŠŽíä@Žß†@óïnî‹i@óÜ@ô䆋à@ôäbØóäb’@õóÙÜíbà@Žß†@ói@õŽíè@óä@ôån“îó @æŽîí‚@ì@@μvØŽí÷@@Žíi@@ôØóîòìbà@ŠŽìŒ@@NõŠbïäaŒ@õòŠbiŠò†@çbØóîŽíè@ì@ŽíèòŠbØ@çbØóØbå‹m@ì@õŒaíŽï’@çbîˆ@@~@õŠóîŠbØ@@óîóè@@óÜ@@Šó@@ôäbîˆ@@•Ží‚óä@N@çbØó−bàb÷@@óïnî‹i@@óÜ@
ôä‡äbäóÜóè@õŠbïäaŒ@ô’Ží‚óä@•ìím@ìíi@ói@õòŠŽíä@Žß†@óÜ@Šó@ôàa‹ Žì‹q@õjäó’ŽìŠ@ôn슇äóm@@I”Žïq@ì@•bq@oŽïmNH@@bŽîŠZ@ôØóîòìóåîím@ó›áïä@@óïäìíàŒó÷@Žôu@ói@Žôu@Øa‹@ói@õòíŽï’@ôäa‡àb−ó÷@@ônŽïm@@”Žïq@ì@@•bq@@ŠóóÜ@@ô’Ží‚óä@@•ìím@@ìíi@@ói@
õòŠŽíä@Žß†@óÜ@ôäbØóäbƒ’Ží‚óä@‹ŽïÜìóè@ì@õŠb ŒŠ@õŠbØ‹ŽïÐ@~õòŠbàˆ@çbØóäí¹@I303@H•Ží‚óä@çìíi@@NçbØóîŠbïäaŒ@@òìóäa‹ØŽíØ@@óÜ@@õòìbà@çaíŽïä@@1M5M2008@@íØbm@@1M5M2009N@@
çbØóàb−ó÷Z@æî‹mŒŠói@õò‰ŽîŠ@õ†ó@I30,36HEóÜ@í¹@çbØóä@@çbïäóàóm@@óÜ@çaíŽïä@I60M69@HôÜb@çìíi@@~‹mbîŒ@óÜ@@õòíïä@@çbØóäí¹@Šaìò‡åŽîí‚óä@çìíi@@~õóiŠŽìŒ@çbØóäí¹@I80,13@HEçbîŠbïäaŒ@ìíióä@ŠóóÜ@õòŠŽíä@Žß†@NôØóîŒaìbïu@ôåî‹ @ŒŠói@ìíióè@@@ŠóóÜ@@õŠbïäaŒ@
•Ží‚óä@óÜ@ôäa‡àb−ó÷@ônŽïm@@”Žïq@ì@@•bq@~@bèòìŠóè@@õ‡äòíîóq@@óîóè@@óÜ@@çaíŽïä@@@õŠbïäaŒ@@•Ží‚óä@@Žßó óÜ@@@çbïäóàóm@ì@@ôäbØónb÷@õŠaìò‡åŽîí‚@ì@çbïäbØòŠbØ@@óÜ@ôäa‡àb−ó÷@ônŽïm@”Žïq@ì@•bq@N@@
ôîbmŽíØZ@óØòìóåì†@òìónŽîŠó ò†@Žíi@õŠóîŠbØ@õóàbäŠói@õjäó’ŽìŠ@ôn슇äóm@@ŠóóÜ@†bîŒ@@ô䆋Ø@@çbØóîŠbïäaŒ@@Žíi@@ô’Ží‚óä@@•ìím@ìíi@ói@õòŠŽíä@Žß†@óÜ@ôäa‡àb−ó÷@ônŽïm@óåï’bqN@@
ó–þ©a@ @âïïÕm@pbàíÝɾa@ôš‹áÝÜ@μib—¾a@öb“nybi@óïjÝÕÜa@ÞjÔ@ì@‡Éi@Öïjm@wàbä‹i@ÒïÕrnÜa@ðz—Üa@@
óïÑÝ©a@Óa‡èýaìZ@öb“nya@óÝ›ÉÜa@óïjÝÕÜa@ðè@píà@óväý@óÝ›È@kÝÕÜa@óvïnä@ã‡ÉÜ@ßí–ì@ã‡Üa@ì@μvØìýa@òÑÜ@óÝîí @NpbàíÝɾa@ßíy@lbjýa@ì@ÞàaíÉÜa@ò‹©a@ì@¹@òbï¨a@êÜ@qbm@ôÝÈ@òbïy@a@NÓa‡èýa@íè@âïïÕm@pbàíÝɾa@ôš‹áÝÜ@μib—¾a@öb“nybi@óïjÝÕÜa@ÞjÔ@
ì@‡Éi@Öïjm@wàbä‹i@ÒïÕrnÜa@ðz—Üa@IŠbjn‚a@ðÝjÕÜa@ì@ñ‡ÉiNH@@
óïvéåà@szjÜaZðè@óaŠ†@êj’@óïj@p‰Ñä@æà@ßþ‚@ïjmÖ@Šbjn‚ýa@ðÝjÕÜa@ñ‡ÉjÜaì@ôÝÈ@ôš‹¾a@μib—¾a@öb“nybi@óÝ›ÉÜa@óïjÝÕÜa@À@pbïÑ“nà@óïáïÝÉnÜa@ÞïiŠa@ì@ñŠbØŒŠ@N†‡È@pbåïÉÜa@ñín¥@ôÝÈ@I303@Hf›î‹àL@oÉ»@pbàíÝɾa@ßþ‚@òÑÜa@æà@1M5M2008@¶a@1@M
5M2009N@@
w÷bnåÜaZ@ôÝÈc@ójä@óîíø¾a@I30,36H@Eæà@óåïÉÜa@oäbØ@âè‹áÈ@μi@I60M69@HóåL@‹rØa@æà@Ò—ä@óåïÉÜa@aíäbØ@μïàc@~óïjÜbÌ@óåïÉÜa@I80,13@HEïÜ@â@pbàíÝÉà@æÈ@öb“nya@óÝ›ÉÜa@óïjÝÕÜa@NÛbåè@pbÔì‹Ð@óîíåÉà@óïÜbÈ@pbàíÝɾ@ôš‹¾a@À@Šbjn‚a@ðÝjÕÜa@ì@ñ‡ÉjÜa@ì@
Ú܉Ø@Ûbåè@óÔþÉÜa@μi@pbàíÝÉà@a@Êà@âè‹áÈ@ì@õínà@âéáïÝÉm@ì@âéÝáÈ@@ÞjÔ@ì@‡Éi@Šbjn‚ýa@N@@
ÿcubnånpbZ@oåïi@w÷bnåÜa@çdi@ @wàbä‹i@ÒïÕrnÜa@ðz—Üa@êÜ@qdm@ôÝÈ@ò†bîŒ@pbàíÝÉà@ôš‹áÝÜ@μib—¾a@öb“nybi@óÝ›ÉÜa@óïjÝÕÜa@À@Šbjn‚ýa@ñ‡ÉjÜaN@@
136
EFFECT OF ALENDRONATE ON SERUM GHRELIN LEVEL IN OSTEOPOROTIC POST...
EFFECT OF ALENDRONATE ON SERUM GHRELIN LEVEL IN OSTEOPOROTIC POST MENOPAUSAL WOMEN
ZAHRAA W. AL-NUIEMI
NAHLA O M. TAWFIK Submitted 18 Jun 2012; accepted 3 Sep 2012 ABSTRACT Background: Osteoporosis is a systemic skeletal disorder, characterized by low bone mass and micro-architectural deterioration of bone tissue, leading to enhanced bone fragility and a consequent increase in fracture risk. In humans, changes in estrogen status due to advancing age and menopause have been associated with bone loss. Ghrelin is a novel peptide hormone consist of a (28) -amino acid primarily synthesized by the stomach and released in response to fasting, and this hormone play role in bone physiology. Objective: This study was designed to evaluate the effect of the antiresoptive a bisphosphonate(BPs) drug "Alendronate tablet" on serum ghrelin level. Methods: Twenty three postmenopausal women with( mean ± SD age, 64.3±8.3y), diagnosed as osteoporotic patients by measuring the bone mineral density (BMD ) by Dual x-ray absorptiometry (DXA) and treated by Alendronate tablets (70mg/once weekly) for three months during1st November 2011 to 1st March 2012 .The study was conducted in Ibn Sina Teaching hospital in Mosul city. Serum ghrelin hormone concentration was measured before and after treatment with a commercial Enzyme-Linked Immune Sorbent Assay (ELISA) kit. Results: This study showed that three months treatment with alendronat drug led to a statistical significant ( p<0.05 ) increment (21.41%) in the basal serum level of ghrelin hormone and there was a significant inverse correlation between ghrelin and body mass index( BMI). Conclusion: This study concluded that alendronate treatment have lead to a statistical significant increase in the serum ghrelin level in osteoporotic post-menopausal women.
Duhok Med J 2012; 6 Suppl 3: 136-144. Key words: Osteoporosis, Post-menopause women, Alendronate, Ghrelin hormone
one is a living tissue and throughout life, the skeleton is continually
remodeled in an orderly sequence of bone resorption followed by bone formation 1. The two major determinants of risk in the development of osteoporosis are peak bone mass and the rate of bone loss 2. During periods of growth, the rate of bone formation exceeds that of resorption and the reverse is true with ageing 3. Osteoporosis results from a disturbance in the remodeling process in which the net rate of bone resorption exceeds the rate of bone formation which brings about characteristic decrease in bone mass 4. It can occur not only from loss but also from failure earlier in life to make sufficient bone resulting in lower peak bone density at skeletal maturity 2. Peak bone density is the maximum bone mass reached in life
between age20-35years 4. Sex hormones plays a role in bone turnover in addition to mechanical and gravitational forces, for example, bone loss occurs with ageing as a consequence of oestrogen deficiency in postmenopausal women, as well as through oestrogen-independent, age-related mechanisms, that may involve secondary hyperparathyroidism and reduced mechanical loading1. According to the WHO study group (1994)5, osteoporosis in post menopausal women was defined in terms of BMD measurement and based on comparison of the patients measurement to the standard peak adult bone mass as follow;"osteoporosis is present when the BMD is more than 2.5 standard deviations (SD) below that of healthy pre menopausal adult females "T - score"6. BMD values can be estimated for various skeletal sites,
* Department of Dental Basic Sciences, College of Dentistry, University of Mosul. Correspondence author: Nahla O M. Tawfik .Email; [email protected]
B
137
Duhok Medical Journal Volume 6, Supplement 3, 2012
and the values are expressed in grams of hydroxyapitite per sequre cm2 (g/cm2) of the area scanned by DXA2. The management of osteoporosis is intended to prevent fractures and maximize skeletal strength3. A large number of drugs have been used to treat osteoporosis, and the patterns of use vary greatly from country to country, the choice of agent will depend not only on effectiveness of the treatment but also on other considerations such as side effects, cost and availability 2. Bisphosphonates are the most commonly prescribed medications for the treatment of osteoporosis 7. Alendronate is a nitrogen-containing bisphosphonate, which is prescribed since September1995, has the greatest amount of efficacy and safety 8. It reduces pain and improves quality of life more effectively 9.
It is available in oral form(tablet) 10mg/day, 35mg twice weekly and 70mg/once weekly 7. It is a potent inhibitor of bone resorption in vitro, recently, it has been reported that alendronate stimulates osteoblast differentiation while inhibiting adipogenesis in vitro 10. Ghrelin is a peptide hormone consist of 28 amino acids found in mammalian species as well as non mammalian species. It was identified as an endogenous ligand for an orphan receptor termed growth hormone secretagogue receptor GHS-R, which induces release of growth hormone (GH) from the pituitary via the hypothalamus, as well as by direct action on the pituitary 11. Ghrelin had a multifunctional effects including regulation of feeding behavior 12, increasing GI motility13, control of cell proliferation 14, hormone secretion 15and modulation of the reproductive axis16. Recently, ghrelin peptide was reported to play an important biological role in metabolism of bone 17. Ghrelin is produced by human bone cells and it was found to promote proliferation of human osteoblast via a mechanism that involves activity of the mitogen-activated protein (MAPK) and phosphoinositde 3-
kinase PI3K signaling pathways, although these cells express only the GHS-R1b isoform, which is considered to be inactive18. The role of ghrelin in bone physiologically reinforced by additional observation; includes the systemic ghrelin secretion correlation with BMD in healthy adolescent 19. Decreased systemic ghrelin might be associated with osteopenia after gastrectomy and this may be attenuated by either ghrelin treatment or retaining part of oxyntic gland area 20. These observations indicate that ghrelin may stimulate bone formation directly and that it may be useful in the treatment of either osteoporosis or metabolic bone disease content 21.
METHODS
This study was conducted at the rheumatology and rehabilitation department in Ibn Sina Teaching Hospitals in Mosul city. Data collection was covered a period of four months from 1ST November 2011 to 1ST March 2012. This study was carried out on twenty three postmenopausal women , diagnosed as osteoporotic with BMD measurements by using DXA (Hologic, model ASY-00409, 2008USA), with a T-score -2.5 or less, their ages was ranged between 63 to 70years (mean+SD 64.3+8.3 years). The patients in this study were provided with Alendronate tablet (PMS-Alendronate®, Canada). The dose was 70mg once weekly, and all patients were followed for three months. Patients included in this study were osteoporotic postmenopausal women had diabetes mellitus , hyperlipidemia, and hypertension. Two blood samples were collected; first sample at baseline before starting treatment with Alendronate tablet, and the second sample was collected three months after treatment. Five milliliters of blood was drawn by venipuncture and collected in plain tube kept at room temp for 30 minutes and centrifuged for 15 minutes
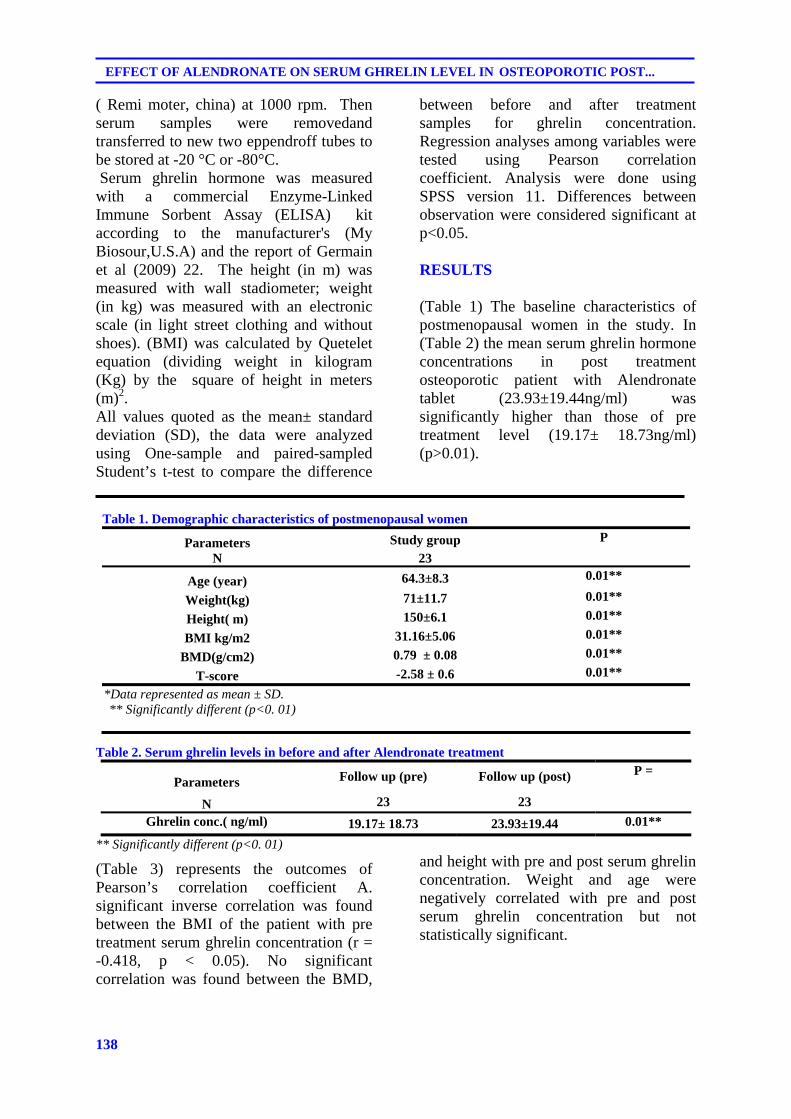
138
EFFECT OF ALENDRONATE ON SERUM GHRELIN LEVEL IN OSTEOPOROTIC POST...
( Remi moter, china) at 1000 rpm. Then serum samples were removedand transferred to new two eppendroff tubes to be stored at -20 °C or -80°C. Serum ghrelin hormone was measured with a commercial Enzyme-Linked Immune Sorbent Assay (ELISA) kit according to the manufacturer's (My Biosour,U.S.A) and the report of Germain et al (2009) 22. The height (in m) was measured with wall stadiometer; weight (in kg) was measured with an electronic scale (in light street clothing and without shoes). (BMI) was calculated by Quetelet equation (dividing weight in kilogram (Kg) by the square of height in meters (m)2. All values quoted as the mean± standard deviation (SD), the data were analyzed using One-sample and paired-sampled Student’s t-test to compare the difference
between before and after treatment samples for ghrelin concentration. Regression analyses among variables were tested using Pearson correlation coefficient. Analysis were done using SPSS version 11. Differences between observation were considered significant at p<0.05. RESULTS
(Table 1) The baseline characteristics of postmenopausal women in the study. In (Table 2) the mean serum ghrelin hormone concentrations in post treatment osteoporotic patient with Alendronate tablet (23.93±19.44ng/ml) was significantly higher than those of pre treatment level (19.17± 18.73ng/ml) (p>0.01).
Table 1. Demographic characteristics of postmenopausal women
P Study group Parameters 23 N
0.01** 64.3±8.3 Age (year) 0.01** 71±11.7 Weight(kg) 0.01** 150±6.1 Height( m) 0.01** 31.16±5.06 BMI kg/m2 0.01** 0.79 ± 0.08 BMD(g/cm2) 0.01** -2.58 ± 0.6 T-score
*Data represented as mean ± SD. ** Significantly different (p<0. 01)
Table 2. Serum ghrelin levels in before and after Alendronate treatment
P = Follow up (post) Follow up (pre) Parameters
23 23 N 0.01** 23.93±19.44 19.17± 18.73 Ghrelin conc.( ng/ml)
** Significantly different (p<0. 01)
(Table 3) represents the outcomes of Pearson’s correlation coefficient A. significant inverse correlation was found between the BMI of the patient with pre treatment serum ghrelin concentration (r = -0.418, p < 0.05). No significant correlation was found between the BMD,
and height with pre and post serum ghrelin concentration. Weight and age were negatively correlated with pre and post serum ghrelin concentration but not statistically significant.
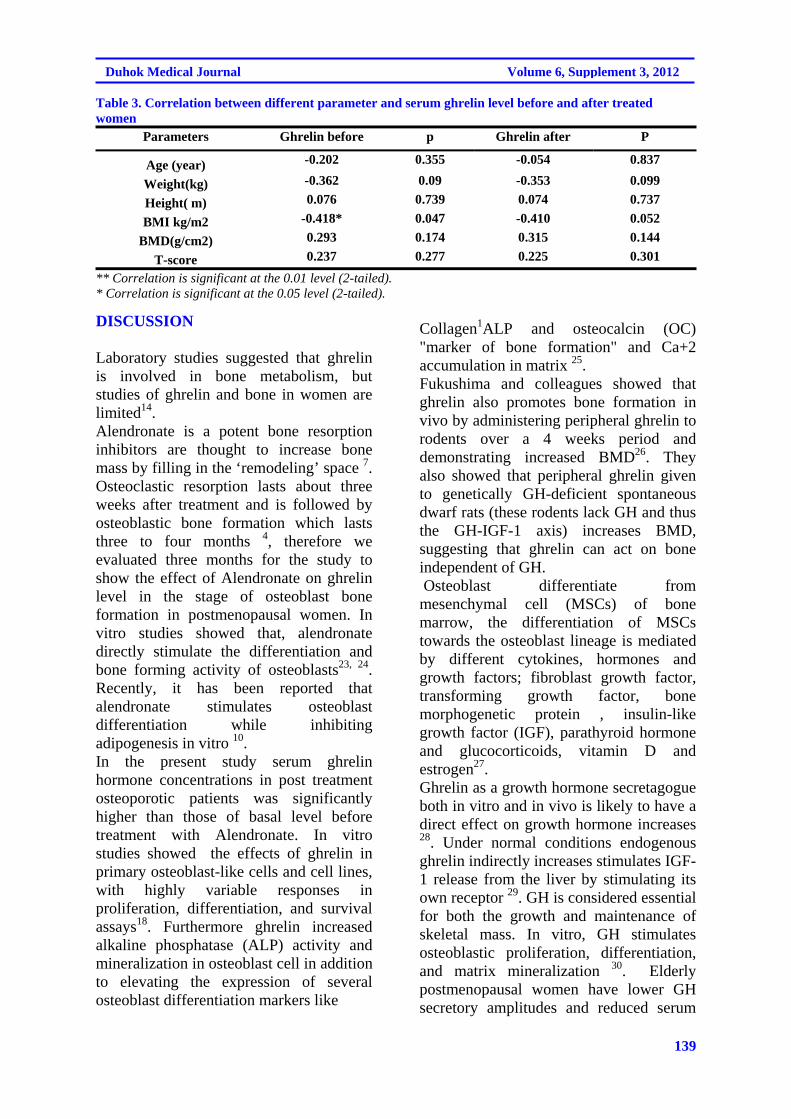
139
Duhok Medical Journal Volume 6, Supplement 3, 2012
Table 3. Correlation between different parameter and serum ghrelin level before and after treated women
P Ghrelin after p Ghrelin before Parameters
0.837 -0.054 0.355 -0.202 Age (year) 0.099 -0.353 0.09 -0.362 Weight(kg) 0.737 0.074 0.739 0.076 Height( m) 0.052 -0.410 0.047 -0.418* BMI kg/m2 0.144 0.315 0.174 0.293 BMD(g/cm2) 0.301 0.225 0.277 0.237 T-score
** Correlation is significant at the 0.01 level (2-tailed). * Correlation is significant at the 0.05 level (2-tailed).
DISCUSSION
Laboratory studies suggested that ghrelin is involved in bone metabolism, but studies of ghrelin and bone in women are limited14. Alendronate is a potent bone resorption inhibitors are thought to increase bone mass by filling in the ‘remodeling’ space 7. Osteoclastic resorption lasts about three weeks after treatment and is followed by osteoblastic bone formation which lasts three to four months 4, therefore we evaluated three months for the study to show the effect of Alendronate on ghrelin level in the stage of osteoblast bone formation in postmenopausal women. In vitro studies showed that, alendronate directly stimulate the differentiation and bone forming activity of osteoblasts23, 24. Recently, it has been reported that alendronate stimulates osteoblast differentiation while inhibiting adipogenesis in vitro 10. In the present study serum ghrelin hormone concentrations in post treatment osteoporotic patients was significantly higher than those of basal level before treatment with Alendronate. In vitro studies showed the effects of ghrelin in primary osteoblast-like cells and cell lines, with highly variable responses in proliferation, differentiation, and survival assays18. Furthermore ghrelin increased alkaline phosphatase (ALP) activity and mineralization in osteoblast cell in addition to elevating the expression of several osteoblast differentiation markers like
Collagen1ALP and osteocalcin (OC) "marker of bone formation" and Ca+2 accumulation in matrix 25. Fukushima and colleagues showed that ghrelin also promotes bone formation in vivo by administering peripheral ghrelin to rodents over a 4 weeks period and demonstrating increased BMD26. They also showed that peripheral ghrelin given to genetically GH-deficient spontaneous dwarf rats (these rodents lack GH and thus the GH-IGF-1 axis) increases BMD, suggesting that ghrelin can act on bone independent of GH. Osteoblast differentiate from mesenchymal cell (MSCs) of bone marrow, the differentiation of MSCs towards the osteoblast lineage is mediated by different cytokines, hormones and growth factors; fibroblast growth factor, transforming growth factor, bone morphogenetic protein , insulin-like growth factor (IGF), parathyroid hormone and glucocorticoids, vitamin D and estrogen27. Ghrelin as a growth hormone secretagogue both in vitro and in vivo is likely to have a direct effect on growth hormone increases 28. Under normal conditions endogenous ghrelin indirectly increases stimulates IGF-1 release from the liver by stimulating its own receptor 29. GH is considered essential for both the growth and maintenance of skeletal mass. In vitro, GH stimulates osteoblastic proliferation, differentiation, and matrix mineralization 30. Elderly postmenopausal women have lower GH secretory amplitudes and reduced serum
140
EFFECT OF ALENDRONATE ON SERUM GHRELIN LEVEL IN OSTEOPOROTIC POST...
levels of IGF-I and IGFBP compared to younger adults and likely to cause age-related metabolic and physiological dysfunction, moreover, the pulse frequency for GH is less in older people 31. Unfortunately, we did not measure serum GH level, but a 24 –hour profile of human plasma GH concentration resembles that of ghrelin 32. The clinical studies showed a relationship between GH and circulating ghrelin 33. Study have shown significant inverse correlation was found between the BMI of the patients and serum ghrelin concentration , lower ghrelin concentrations in obese subjects and who have high BMI, these results were in agreement with32,34,35. Fagerberg and colleagues reported that ghrelin level negatively correlated with body fat and waist circumference36. Body fatness was the strongest determinant of circulating ghrelin level. BMI does not indicate body fat directly, but research has shown that BMI is correlated with direct measures of body fat37. Furthermore, there is no correlation was found between the BMD and serum ghrelin level. Researchs studying the association between ghrelin and BMD is limited, but only one study in rats found that ghrelin was positively correlation with BMD26, but another study in mice found no correlation . This study is in agreement with the human study in adult which found that ghrelin were not correlated with BMD at femoral neck or lumbar spine in 80 Korean men 39. Other study showed that systemic ghrelin secretion correlation with BMD in healthy adolescent19. In the other study a significant negative correlation between ghrelin and BMD was observed in younger women34. In fact, in animal studies gastrectomy has been reported to induce osteopenia by reducing ghrelin secretion; such osteopenia can be reversed by ghrelin treatment40. In humans, after laparoscopic gastric bypass surgery for morbid obesity, a decrease in serum ghrelin levels and an increase in bone
resorption, with a subsequent reduction in bone mass, have been detected41. In our study we did find inverse correlation between ghrelin and age but statistically not significant. Studies to determine whether ghrelin levels change during aging have been inconclusive. For example, Rigamonti et al reported a decline in fasting ghrelin levels in elderly humans compared with young controls42, but Sturm et al found that, ghrelin levels were the same in young and elderly females43. Recent studies showed that mean -h acyl-ghrelin levels are lower in a group of adults’ age 60 years and older when compared to a group of young adult's age 30 years and younger where both groups had a similar BMI44. The pituitary ghrelin receptor content does not decline with aging 45, and the secretary response of the pituitary to ghrelin and GH secretagogue is sustained in the elderly 46. Conclusion: Alendronate treatment leads to increase in serum ghrelin level. No comparable study is available in this regard and further studies are needed to investigate the mechanism responsible for this finding.
REFERENCES
1. Bonjour J-P, Rizzoli R. Bone
acquisition in adolescence. In: Marcus R, Feldman D, Kelsey J, editors. Osteoporosis. San Diego :Academic Press; 1996. p. 465–76.
2. Slovic DM. Screening for osteoporosis in postmenopausal women. In: Allan H, Gorol L, Albert G, Mulley J, editors. Primary Care Medicine .6th ed. USA :Wolters Kluwer; 2008. p. 1005.
3. Colledge N R, Walker B R, Ralston S H. Davidson's Principles and Practice Of Medicine 21thed. Philadelphia:Churchill Living ;2010. p.1116.
4. Bartl R, Frisch B. Osteoporosis diagnosis 'prevention 'therapy. 2nd
141
Duhok Medical Journal Volume 6, Supplement 3, 2012
ed. Germany :Springer; 2009.p. 71-89.
5. World Health Organization. Assessment of Osteoporotic fracture risk and its role in screening for postmenopausal Osteoporosis. WHO Technical Report Series Geneva, Switzerland. 1994; 843.
6. Lindsy R, Cosman F. Osteoporosis. In: Longo DL, Fauci S, Kasper DL, Hauser SL, Jameson JL, Loscalzo JL, editors. Harrisons Principles' Of Internal Medicine.18thed. USA :Mc Graw Hill; 2012. p.3120.
7. Bone HG, Hosking D, Devogelaer JP, Tucci JR, Emkey RD, Tonino RP, et al. Ten years’ experience with alendronate for osteoporosis in postmenopausal women. N Engl J Med .2004; 350(12):1189-99.
8. de Groen PC, Lubbe DF, Hirsch LJ, Daifotis A, Stephenson W, Freedholm D, et al. Esophagitis associated with the use of alendronate. N Engl J Med .1996; 335(14): 1016-21.
9. Kawate H, Ohnaka K, Adachi M, Kono S, Ikematsu H, Matsuo H, et al. Alendronate improve QOL of postmenopausal women with osteoporosis. Clin Interv Aging. 2010; 5: 123-31.
10. Seeman E, Delmas PD. Bone quality–the material and structural basis of bone strength and fragility. N Engl J Med .2006; 354(21):2250–61.
11. 11. Kojima M, Hosoda H, Date Y, Nakazato M, Matsuo H, Kangawa K. Ghrelin is a growth hormone releasing acylated peptide from stomach. Nature. 1999; 402(6762):656-60.
12. Wren AM, Seal LJ, Cohen MA, Brynes AE, Frost GS, Murphy KG, et al. Ghrelin enhances appetite and increases food intake in humans. J
Clin Endocrinol Metab .2001; 86(12):5992.
13. Tack J, Koliakos G, Rousso D, Kourtis A, Katsikis , et al. influence of ghrelin on interdigestive gastrointestinal motility in humans. Gut .2006; 55:327-33.
14. Dong XY, Tang SQ, LiH Y, Jiang QY, Zou XT. Ghrelin and its biological effects on pigs. Peptides . 2009; 30(6):1203-11.
15. Nagaya N, Kojima M, Uematsu M, Yamagishi M, Hosoda H, Oya H, et al.Hemodynamic and hormonal effects of human ghrelin in healthy volunteers. Am J Physiol .2001;280:1483–7.
16. 1Panidis D, Farmakiotis D, Koliakos G, Rousso D, Kourtis A, Katsikis I, et al. Comparative study of plasma ghrelin level in women with polycystic ovary syndrome, in hyperandrogenic women and in normal controls . Hum Reprod. 2005;20(8):2127-32.
17. 1Leite-Moreira AF, Soares JB. Physiological, pathological and potential therapeutic roles of ghrelin. Drug Discov Today. 2007; 12(7-8): 276-88.
18. Delhanty PJ, van der Eerden BC, van der Velde M, Gauna C, Pols HA, Jahr H, et al. Ghrelin and unacylated ghrelin stimulate human osteoblast growth via mitogen-activated protein kinase(MAPK) phosphoinositde 3-kinase(PI3K) pathways in the absence of GHS- R1a .J Endocrinol. 2006; 188(1):37-47.
19. Kasimay O, ohn B, Ammori MD, Wei-Zhen Zhang, MD, PhD, Ji-Yao Li, et al. Ghrelin and bone metabolism in adolescent girls with anorxia nervousa &healthy adolescents.J Clin Endocrinol Metab .2006;90:5082-7.
20. Lehto-Axtelius D, Chen D, Surve VV, Hakanson R. Post gastrectomy
142
EFFECT OF ALENDRONATE ON SERUM GHRELIN LEVEL IN OSTEOPOROTIC POST...
osteopenia in the rat, bone structure is preserved by retaining 10%-30% of oxyntic gland area. Scand J Gastroenteral .2002; 37(4):437-47.
21. Barazzoni R, Bosutti A, Stebel M, Cattin MR, Roder E, Visintin L, et al. Ghrelin regulates mitochondrial lipid metabolism genes expression and tissue fat distribution in liver and skeletal. muscle. Am J physiol Endocrinol Metb. 2005; 288(1):E288-35.
22. Germain N, Galusca B, Grouselle D, Frere D, Tolle V, Zizzari P, et al. Ghrelin/obestatin ratio in two populations with low body weight: constitutional thinness and anorexia nervosa. Psychoneuroendocrinology . 2009; 34:413–9.
23. Fromigue O, Body JJ. Bisphosphonates influence the proliferation and the maturation of normal human osteoblasts. J Endocrinol Invest. 2003; 25(6):539–46.
24. D'Amelio P, Grimaldi A, Di Bella S, Tamone C, Brianza SZ, Ravazzoli MG, et al. Risedronate reduces osteoclast precursors and cytokine production in postmenopausal osteoporotic women. J Bone Miner Res .2008;23(3):373–9.
25. Maccarinelli G, Sibilia V, Torsello A, Raimondo F, Pitto M, Giustina A, et al. Ghrelin regulates proliferation and differentiation of osteoblast cells. J Endocrinol .2005; 184(1):249-56.
26. Fukushima N, Hanada R, Teranishi H, Fukue Y, Tachibana T, Ishikawa H, et al. Ghrelin directly regulates bone formation. J Bone Miner Res. 2005;20(5): 790–8.
27. Aubin JE , Triffit JT. Mesemchymal stem cells and osteoblasts differentiation. In: Bilezikian JP, Raisz LG, Rodan GA editors. Principles of bone
biology. San Diego :Academic press; 2002. p.59-81.
28. Broglio F, Benso A, Castiglioni C, Gottero C, Prodam F, Destefanis S, et al. The endocrine response to ghrelin as a function of gender in humans in young and elderly subjects. J Clin Endocrinol Metab. 2003; 88(4): 1537-42.
29. Sun Y, Wang P, Zheng H, Smith R G. Ghrelin stimulation of growth hormone release and appetite is mediated through the growth hormone secretagogue receptor. Proc Natl Acad Sci USA .2004; 101(13): 4679–84.
30. Ernst M , Rodan GA. Increased activity of insulin-like growth factor (IGF) in osteoblastic cells in the presence of growth hormone (GH): positive correlation with the presence of the GH-induced IGF-binding protein BP-3. Endocrinology. 1990; 127(2):807–14.
31. Kelijman M. Age-related alterations of the growth hormone/insulin- like-growth-factor I axis. J Am Geriatr Soc .1991; 39(3): 295–307.
32. Shiiya T, Nakazato M, Mizuta M, Date Y, Mondal MS, Tanaka M, et al. Plasma ghrelin levels in lean and obese humans and the effect of glucose on ghrelin secretion. J Chin Endocrinol Metab .2002; 87(1): 240–4.
33. 33. Koutkia P, Canavan B, Breu J, Johnson ML, Grinspoon SK. Nocturnal ghrelin pulsatility and response to growth hormone secretagogues in healthy men. Am J Physiol Endocrinol Metab. 2004; 287(4): E506–12.
34. Makovey J, Naganathan V, Seibel M, Sambrook P. Gender differences in plasma ghrelin and its relations to body composition and bone—an opposite-sex twin
143
Duhok Medical Journal Volume 6, Supplement 3, 2012
study. Clin Endocrinol (Oxf) .2007; 66(4): 530–7.
35. Costa JL, Naot D, Lin JM, Watson M, Callon KE, Reid IR,et al. Ghrelin is an Osteoblast Mitogen and Increases Osteoclastic Bone Resorption In Vitro. Int J Pept. 2011:605193.
36. Fagerberg B, Hulten LM, Hulthe J. Plasma ghrelin, body fat, insulin resistance, and smoking in clinically healthy men: the atherosclerosis and insulin resistance study. Metabolism. 2003; 52(11): 1460–3.
37. Mei Z, Grummer-Strawn LM, Pietrobelli A, Goulding A, Goran MI, Dietz WH. Validity of body mass index compared with other body-composition screening indexes for the assessment of body fatness in children and adolescents. Am J Clin Nutr. 2002;75(6):978–85.
38. Sun Y, Ahmed S, Smith RG. Deletion of ghrelin impairs neither growth nor appetite. Mol Cell Biol .2003; 23(22): 7973–81.
39. Oh KW, Lee WY, Rhee EJ, Baek KH, Yoon KH, Kang MI,et al. The relationship between serum resistin, leptin, adeponectin, ghrelin levels and bone mineral density in middle-aged men. Clin Endocrinol(Oxf). 2005; 63(2): 131-8.
40. Dornonville de la Cour C, Lindqvist A, Egecioglu E, Tung YC, Surve V, Ohlsson C ,et al. Ghrelin treatment reverses the reduction in weight gain and body fat in gastrectomised mice. Gut .2005; 54(7): 907–13.
41. Coates PS, Fernstrom JD, Fernstrom MH, Schauer PR, Greenspan SL. Gastric bypass surgery for morbid obesity leads to an increase in bone turnover and a decrease in bone mass. J Clin Endocrinol Metab .2004; 89(3): 1061-5.
42. Rigamonti AE, Pincelli AI, Corrà B, Viarengo R, Bonomo SM, Galimberti D, et al. Plasma ghrelin concentrations in elderly subjects: comparison with anorexic and obese patients. J Endocrinol .2002; 175(1): 1–5.
43. Sturm K, MacIntosh CG, Parker BA. Appetite, food intake, and plasma concentrations of cholecystokinin, ghrelin, and other gastrointestinal hormones in undernourished older women and well-nourished young and older women. J Clin Endocrinol Metab. 2003; 88: 3747–55.
44. Nass R, Liu J, Pezzoli S, Oliveri M, Gaylinn B, Thorner M. -h Mean acyl-ghrelin levels are decreased in older adults. In: 4th International Congress of the GRS and the IGF Society , Italy; 2008. p. 51.
45. Sun Y, Garcia J M, Smith RG. Ghrelin and growth hormone secretagogue receptor expression in mice during aging. Endocrinol ogy. 2007; 148(3): 1323–9.
46. Broglio F, Benso A, Castiglioni C, Gottero C, Prodam F, Destefanis S, et al. The endocrine response to ghrelin as a function of gender in humans in young and elderly subjects. J Clin Endocrinol Metab .2003; 88(4): 1537-42.
144
EFFECT OF ALENDRONATE ON SERUM GHRELIN LEVEL IN OSTEOPOROTIC POST...
ón‚íq@@@@@@@@@@@õbm@ôäbàŠò†@oŽïä슇Üa@ß@Šó@õò‰ŽîŠ@ôäíà‹è@μÝî‹ Úï÷@ôäìíjàŠóä@ô’ím@ôäbmò‹Ðb÷@ß@@ôØó“ŽïqZ@@oïiò†@ŠóÙïq@óÙï÷@ôàa‡äó÷íØ@ôìím@óÙï’í‚óä@òŠíu@Úï÷@ôäìíi@ãŠóä~@@@@@@@ì@òì@ónïiò†@ãóØ@Úï÷@õónŠbi@ó“ï÷@ãóÜ
oïiò†@‹mbîŒ@Úï÷@ôä‡äbÙ’@ð‹móà@N@ìó÷@a†@Äì‹à@ß@@@@@@@ói@ì@Äì‹à@ôäóàóm@ôäìíi†bîŒ@ßóÜ@pa†ò†ììŠ@μuìï÷@ôäíà‹è@ß@õŠbÙ䊎í @a†@pò‹Ôb÷@ß@ômójîbmónïiò†@õŠbØíè@âïØ@ôäìíi@õónŠbi@Úï÷@ì@@†bîŒ@ôäìíî@ð‹móà@ôä‡äbÙ’@Úï÷@@l@õŠó ó÷@ôØòìa†ììŠ@Ûìí›i@N@@
ôäíà‹è@μÝî‹ @òŠíu@ôäíà‹è@õíä@óî@oî‡ÙŽïq@ß@I28@Hð’‹m@@μàc@ì@ß@@ò‡ @†@oìŠ@@oïiò†@@óÜ@@ômbØ@@ói@@çíjî ŽìŠI@çbä@@熊aí‚óä@NHôäíà‹è@μÝî‹ @ôØóÜŽìŠ@õŒŠói@óîóè@ß@o슆@ôäìíi@Úï÷@ì@oîbåi@õòìóäa†@Úï÷N@@wäbàb÷:@ãó÷@òìóåîˆím@póa‹î†@ô䆋Ø@õbm@ôäbàŠò†@oŽïä슇Üa@ß@Šó@õò‰ŽîŠ@ôäíà‹è@μÝî‹ @ß@ìbä@æîí‚N@@
óÜ@ã@òìóåîˆím@I23@Hpò‹Ðb÷@çìíiŠa‡’ói@óØ@çbïäóàóm@IS~VT@±S~X@ßb@Hçìíi@ì@ô’ìím@ô“ï÷@óä@ãŠ@ôäìíi@Úï÷@çìíi@@~çbîóÙ“ï÷ì@óäìíjmbè@oò†@çb“ïä@熋Ø@ß@õóŽîŠ@ôäbåï÷ŠbÙi@õàb÷@@pìíu@Øc@ß@ñóäbƒ’í‚óä@@æia@@båï@@ô䆋ØÐ@ß@@õŠb’@@Þíà@N@ìíàóè@
çbØó’í‚óä@ôäbàŠò†@çbnïä슇Üa@p‹ òŠì@ì@l@ñŒì†@70@ãa‹ïÝà@óäbïnÐóy@ì@íi@õòìbà@I3@HÂäbà@@ß@ôÙäbà@ôåî‹“m@@ôàòìì†@2011@ì@õŠa†b÷@2012@Nì@ôäìíà‹è@μÝî‹ @óïmbè@òìó䆋Ùï’@õŠói@ì@ôn“q@ôäbåï÷ŠbÙi@ôäbàŠò†@oïä슇Üa@l@õbîŠ@ôäbåï÷ŠbÙ÷@õàb÷@aïÜa@N@@
@Šò†ãb−b÷Z@ãó÷@òìóåîˆím@Šbî†@ìíi@@ôäbåï÷ŠbÙi@oïä슇Üa@ónïiò†@õíè@ôäìíi‡îaŒ@ôäíà‹è@@‹ μÝî@ß@@ôåîí‚@@Äì‹à@@a†@@ói@@õóØò‰ŽîŠ@@Šói@ììbšN@@
ó–þ©a@ @qdm@ŠbÕÈ@c™a‹Ô@oïä슇Üa@ôÝÈ@õínà@μÝî‹ÍÜa@À@Þ—à@ã‡Üa@öbåÝÜ@À@æ@‘dïÜa@pbib—à@ó’b“éi@ãbÅÉÜa@@
óà‡Õ¾aZ@ó’b“è@ãbÅÉÜa@óÜby@óïš‹à@kï—m@Œbé§a@ðÝÙïa@~ïánm@bѯbi@óÝnØ@âÅÉÜa@Šíè‡mì@öbåjÜa@ðÝÙïa@Ô‡ÜaÖï@óväÿ@ãbÅÉÜa@b¿@ñ†üî@¶g@ò†bîÜa@À@æèì@âÅÉÜa@ì@êÝÉ°@‹rØc@óš‹È@‹ÙÝÜ@NÀ@çbäfiaL@‡Ém@paÍnÜa@Üa@t‡¥@À@çíà‹è@μuìýa@óvïnä@ã‡ÕnÜa@À@‹áÉÜa@æì@‘dïÜa@biíz—à@À@bѯa@óÝnØ@âÅÉÜa@æàan¾a@Êà@ò†bîŒ@òŠí‚@óiaÿa@ŠíÙÜbi@N‡Éîì@μÝî‹ÍÜa@çíà‹è@bîíÉà@@bî‡ïnji@a‡î‡u@çíÙnî@æà@IRX@Hàby@ïàc@댋Ñm@ò‡É¾a@êÕÝmì@À@óÜby@ãí—ÜaN@ñ†üîì@a‰è@çíà‹a@aŠì†@aŒŠbi@À@kïØÜa@ñí›ÉÜa@âÅÉÝÜ@óïÝáÈì@ò†bÈa@ê÷båiN@@
Ó‡è@óaŠ‡ÜaZ@Ó‡ém@óaŠ‡Üa@óïÜb¨a@¶a@âïïÕm@qdm@ŠbÕÈ@oïäíÑíÑjÜa@Ic™a‹Ô@oïä슇Üa@ Hу¾a@Ób“mŠý@âÅÉÜa@ÈôÝ@õínà@μÝî‹ÍÜa@À@Þ—à@ã‡Üa@öbåÝÜ@À@æ@‘dïÜa@pbib—à@ó’b“éi@ãbÅÉÜaN@@
†aí¾a@Ö÷a‹ ì@ÞáÉÜaZ@oÝ@óaŠ‡Üa@I23@@Hòc‹àa@À@æ@‘dïÜa@Âínà@âèŠbáÈc@IS~VT@±S~X@óå@H@˜ïƒ“m@ó’b“è@ãbÅÉÜa@óaíi@‘bïÔ@óÐbrØ@âÅÉÜa@óïä‡É¾a@ãa‡ƒnbi@Œbéu@‘bïÕà@óÉ’c@Øa@xì†à@óÔbÜa@Ib؆@NHp‰‚c@pbåïÉÜa@æà@ôÑ“nà@æia@båï@ðáïÝÉnÜa@À@óåî‡à@@Þ–í¾a@~sïy@ðÈc@Êï»@ôš‹¾a@ŠbÕÈ@oïä슇Üýa@óÈ‹¡ì@I70@HâÍÝàObïÈíjc@~ì@âénÉibnà@òÑÜ@óqþq@‹é’c@À@òÑÜa@Üa@ìam@@bà@μi@ßìÿa@æà@æî‹“m@ðäbrÜa@I2011@@HóîbÍÜ@ßìÿa@æà@Šaˆe@I2012@NH@‘bïÔ@çíà‹è@μÝî‹ÍÜa@À@Þ—à@ã‡Üa@Êïá§@ôš‹¾a@ÞjÔ@‡Éiì@xþÉÜa@óaíi@ò‡È@óï—m@ó–b‚@óÕî‹i@óîbÕà@ná¾a@Âjm‹¾a@âîäÿbi@IaïÜýaNH@@
w÷bnåÜa@ Zp‹éÄc@óaŠ‡Üa@çc@ŠbÕÈ@oïä슇Üa@ôɾa@óqþrÜ@‹é’c@õ†c@¶g@ò†bîŒ@óîíåÉà@À@çíà‹è@μÝî‹ÍÜa@À@Þ—à@ã‡Üa@ @Êà@†íuì@óÔþÈ@@óïÙÈ@μi@õínà@çíà‹è@μÝî‹ÍÜa@ì@‹’üà@óÝnØ@â§aN@@
pbubnånýaZ@@ovnåna@óaŠ‡Üa@óïÜb¨a@ça@ŠbÕÈ@oïä슇Üÿa@‡Ô@õ†a@¶a@ò†bîŒ@óîíåÉà@óÄízÝà@õín¾@μÝî‹ÍÜa@À@Þ—à@ã‡Üa@õ‡Ü@öbåÜaN@@
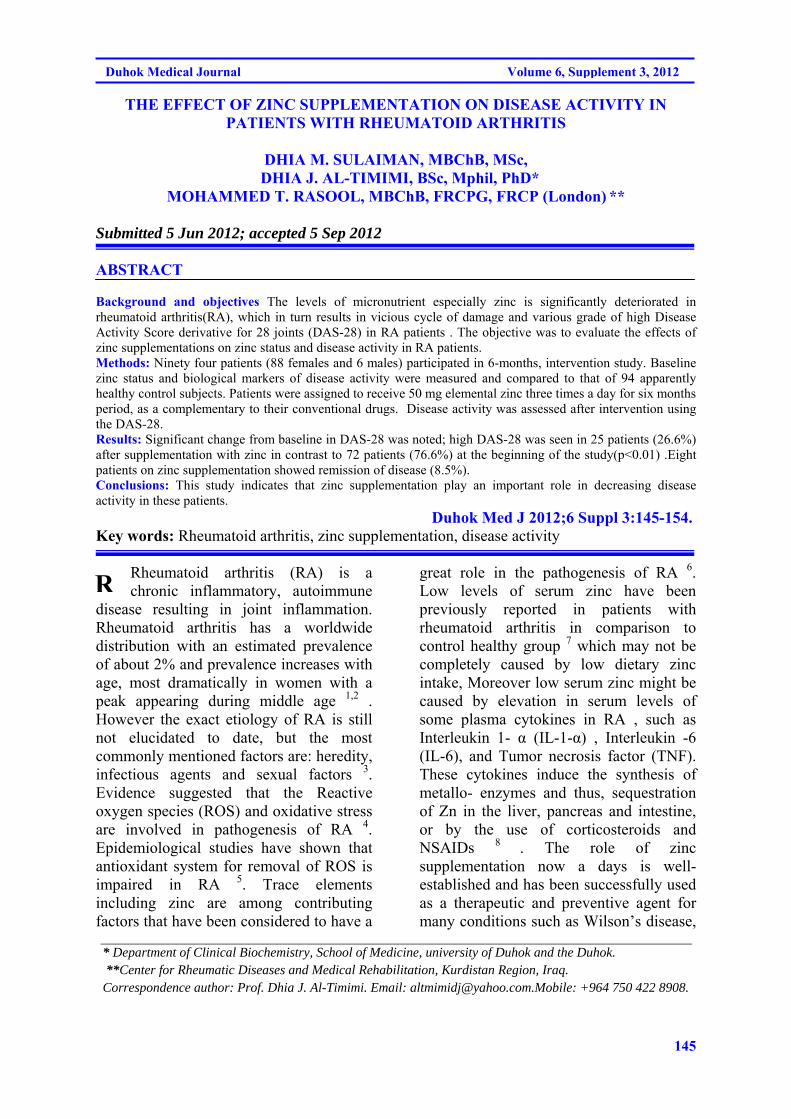
145
Duhok Medical Journal Volume 6, Supplement 3, 2012
THE EFFECT OF ZINC SUPPLEMENTATION ON DISEASE ACTIVITY IN PATIENTS WITH RHEUMATOID ARTHRITIS
DHIA M. SULAIMAN, MBChB, MSc,
DHIA J. AL-TIMIMI, BSc, Mphil, PhD* MOHAMMED T. RASOOL, MBChB, FRCPG, FRCP (London) **
Submitted 5 Jun 2012; accepted 5 Sep 2012 ABSTRACT Background and objectives The levels of micronutrient especially zinc is significantly deteriorated in rheumatoid arthritis(RA), which in turn results in vicious cycle of damage and various grade of high Disease Activity Score derivative for 28 joints (DAS-28) in RA patients . The objective was to evaluate the effects of zinc supplementations on zinc status and disease activity in RA patients. Methods: Ninety four patients (88 females and 6 males) participated in 6-months, intervention study. Baseline zinc status and biological markers of disease activity were measured and compared to that of 94 apparently healthy control subjects. Patients were assigned to receive 50 mg elemental zinc three times a day for six months period, as a complementary to their conventional drugs. Disease activity was assessed after intervention using the DAS-28. Results: Significant change from baseline in DAS-28 was noted; high DAS-28 was seen in 25 patients (26.6%) after supplementation with zinc in contrast to 72 patients (76.6%) at the beginning of the study(p<0.01) .Eight patients on zinc supplementation showed remission of disease (8.5%). Conclusions: This study indicates that zinc supplementation play an important role in decreasing disease activity in these patients. Duhok Med J 2012;6 Suppl 3:145-154. Key words: Rheumatoid arthritis, zinc supplementation, disease activity
Rheumatoid arthritis (RA) is a chronic inflammatory, autoimmune
disease resulting in joint inflammation. Rheumatoid arthritis has a worldwide distribution with an estimated prevalence of about 2% and prevalence increases with age, most dramatically in women with a peak appearing during middle age 1,2 . However the exact etiology of RA is still not elucidated to date, but the most commonly mentioned factors are: heredity, infectious agents and sexual factors 3. Evidence suggested that the Reactive oxygen species (ROS) and oxidative stress are involved in pathogenesis of RA 4. Epidemiological studies have shown that antioxidant system for removal of ROS is impaired in RA 5. Trace elements including zinc are among contributing factors that have been considered to have a
great role in the pathogenesis of RA 6. Low levels of serum zinc have been previously reported in patients with rheumatoid arthritis in comparison to control healthy group 7 which may not be completely caused by low dietary zinc intake, Moreover low serum zinc might be caused by elevation in serum levels of some plasma cytokines in RA , such as Interleukin 1- α (IL-1-α) , Interleukin -6 (IL-6), and Tumor necrosis factor (TNF). These cytokines induce the synthesis of metallo- enzymes and thus, sequestration of Zn in the liver, pancreas and intestine, or by the use of corticosteroids and NSAIDs 8 . The role of zinc supplementation now a days is well-established and has been successfully used as a therapeutic and preventive agent for many conditions such as Wilson’s disease,
* Department of Clinical Biochemistry, School of Medicine, university of Duhok and the Duhok. **Center for Rheumatic Diseases and Medical Rehabilitation, Kurdistan Region, Iraq. Correspondence author: Prof. Dhia J. Al-Timimi. Email: [email protected]: +964 750 422 8908.
R
146
The effect of zinc supplementation on disease activity in patients …..
peptic ulcer , inflammatory acne , psoriasis, and several immune disorders 9,10,11,12,13. But, in spite of several supplementation trials which were performed in patients with inflammatory conditions specially those suffering from rheumatic diseases , were insufficiently documented as far as the assessment of zinc status is concerned, making it difficult to correctly interpret the effects of zinc administration .Apart from some studies reported the beneficial effects of zinc supplementation with respect to joint swelling, morning stiffness and walking in patients with rheumatoid arthritis. So, to determine the effectiveness of zinc therapy on decreasing the clinical signs and symptoms of RA, this preliminary intervention study was designed to examine the effects of Zinc supplement on modification of disease activity score (DAS-28) in patients with RA. METHODS This Intervention study was conducted at the Duhok Center for Rheumatic Diseases and Medical Rehabilitation, Duhok, Kurdistan Region, Iraq; from January 2011 through March 2012.During a period of three successive months, 114 patients previously diagnosed with rheumatoid arthritis were participated in the study (106 registered cases routinely attended for follow-up and management and 8 cases were newly diagnosed as having Rheumatoid Arthritis). Ninety four patients were completed the trial (88 females and 6 males). The enrolment was done according to the revised 2010 criteria of American College of Rheumatology (ACR) and European League Against Rheumatism (EULAR) classification 14 .
Ninety four apparently healthy control subjects selected from blood bank and kidney donors were included in the study. Patients were interviewed and informed about the nature of the study and then verbal consent was obtained from each subject. The study protocol was approved
by the ethical Committee of the General Directorate of Health in Duhok Governorate A pre-tested questionnaire was designed to obtain information, on age, gender, family history and duration of the disease. Other information included treatment and duration of treatment, number of tender and swelling joints, visual analog scale (VAS), and medical history of chronic diseases. Complete history and physical examination were done for all patients who were newly and previously diagnosed as RA. Baseline data and further monthly assessment were done for all participants at regular intervals, and finally complete assessment for recording of data after 6 months were done. Physical examination was performed in order to assess the severity and activity of the disease. The examination was included changes in previously affected joints or the appearance of inflammation in previously uninvolved joints. Examined joints include the wrists, elbows, shoulders, and knees, and the metacarpophalangeal and proximal interphalangeal joints of the hands. The joints were evaluated for the presence of swelling, tenderness, loss of motion and deformity. Disease activity was assessed by using the Disease Activity Score derivative for 28 joints (DAS-28) recommended by European League Against Rheumatism (EULAR): Low(DAS-28<3.2), Moderate (DAS-28 3.2to <5.1) and High activity(DAS> 5.1) A Protocol for zinc supplementation involved zinc sulphate capsule( 220 )mg three time daily which is equivalent to 50 mg elemental zinc (150 mg /day) for six months period, as a complementary to their conventional drugs(NSAIDs, Glucocorticoids, Methotrexate, Hydroxychlorquine and / or Aztioprine).Blood samples were collected after an overnight fast. After 25-30 mints, the serum was separated by centrifugation using a HITACHI centrifuge (model O5P-21) at 5000 rpm for 10 minutes at ambient temperature. The serum obtained was
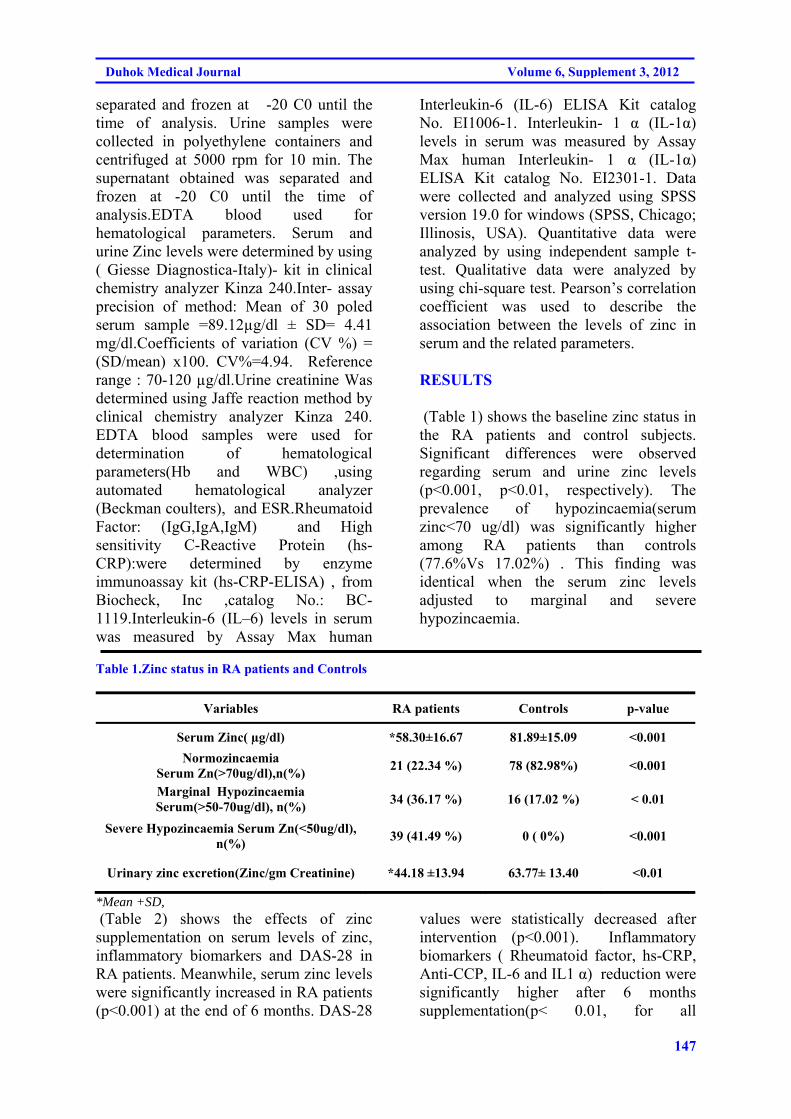
147
Duhok Medical Journal Volume 6, Supplement 3, 2012
separated and frozen at -20 C0 until the time of analysis. Urine samples were collected in polyethylene containers and centrifuged at 5000 rpm for 10 min. The supernatant obtained was separated and frozen at -20 C0 until the time of analysis.EDTA blood used for hematological parameters. Serum and urine Zinc levels were determined by using ( Giesse Diagnostica-Italy)- kit in clinical chemistry analyzer Kinza 240.Inter- assay precision of method: Mean of 30 poled serum sample =89.12µg/dl ± SD= 4.41 mg/dl.Coefficients of variation (CV %) = (SD/mean) x100. CV%=4.94. Reference range : 70-120 µg/dl.Urine creatinine Was determined using Jaffe reaction method by clinical chemistry analyzer Kinza 240. EDTA blood samples were used for determination of hematological parameters(Hb and WBC) ,using automated hematological analyzer (Beckman coulters), and ESR.Rheumatoid Factor: (IgG,IgA,IgM) and High sensitivity C-Reactive Protein (hs- CRP):were determined by enzyme immunoassay kit (hs-CRP-ELISA) , from Biocheck, Inc ,catalog No.: BC-1119.Interleukin-6 (IL–6) levels in serum was measured by Assay Max human
Interleukin-6 (IL-6) ELISA Kit catalog No. EI1006-1. Interleukin- 1 α (IL-1α) levels in serum was measured by Assay Max human Interleukin- 1 α (IL-1α) ELISA Kit catalog No. EI2301-1. Data were collected and analyzed using SPSS version 19.0 for windows (SPSS, Chicago; Illinosis, USA). Quantitative data were analyzed by using independent sample t- test. Qualitative data were analyzed by using chi-square test. Pearson’s correlation coefficient was used to describe the association between the levels of zinc in serum and the related parameters. RESULTS (Table 1) shows the baseline zinc status in the RA patients and control subjects. Significant differences were observed regarding serum and urine zinc levels (p<0.001, p<0.01, respectively). The prevalence of hypozincaemia(serum zinc<70 ug/dl) was significantly higher among RA patients than controls (77.6%Vs 17.02%) . This finding was identical when the serum zinc levels adjusted to marginal and severe hypozincaemia.
Table 1.Zinc status in RA patients and Controls
Variables RA patients Controls p-value
Serum Zinc( µg/dl) *58.30±16.67 81.89±15.09 <0.001
Normozincaemia Serum Zn(>70ug/dl),n(%)
21 (22.34 %) 78 (82.98%) <0.001
Marginal Hypozincaemia Serum(>50-70ug/dl), n(%)
34 (36.17 %) 16 (17.02 %) < 0.01
Severe Hypozincaemia Serum Zn(<50ug/dl), n(%)
39 (41.49 %) 0 ( 0%) <0.001
Urinary zinc excretion(Zinc/gm Creatinine) *44.18 ±13.94 63.77± 13.40 <0.01
*Mean +SD, (Table 2) shows the effects of zinc supplementation on serum levels of zinc, inflammatory biomarkers and DAS-28 in RA patients. Meanwhile, serum zinc levels were significantly increased in RA patients (p<0.001) at the end of 6 months. DAS-28
values were statistically decreased after intervention (p<0.001). Inflammatory biomarkers ( Rheumatoid factor, hs-CRP, Anti-CCP, IL-6 and IL1 α) reduction were significantly higher after 6 months supplementation(p< 0.01, for all
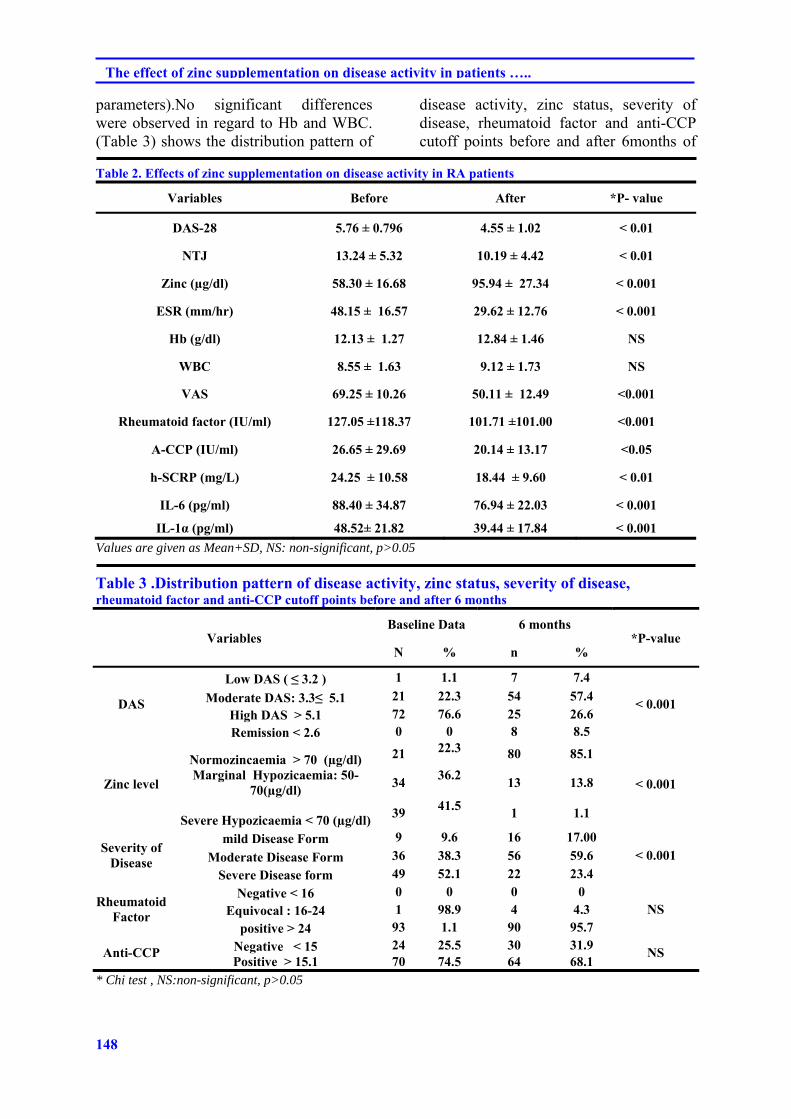
148
The effect of zinc supplementation on disease activity in patients …..
parameters).No significant differences were observed in regard to Hb and WBC. (Table 3) shows the distribution pattern of
disease activity, zinc status, severity of disease, rheumatoid factor and anti-CCP cutoff points before and after 6months of
Table 2. Effects of zinc supplementation on disease activity in RA patients
Variables Before After *P- value
DAS-28 5.76 ± 0.796 4.55 ± 1.02 < 0.01
NTJ 13.24 ± 5.32 10.19 ± 4.42 < 0.01
Zinc (µg/dl) 58.30 ± 16.68 95.94 ± 27.34 < 0.001
ESR (mm/hr) 48.15 ± 16.57 29.62 ± 12.76 < 0.001
Hb (g/dl) 12.13 ± 1.27 12.84 ± 1.46 NS
WBC 8.55 ± 1.63 9.12 ± 1.73 NS
VAS 69.25 ± 10.26 50.11 ± 12.49 <0.001
Rheumatoid factor (IU/ml) 127.05 ±118.37 101.71 ±101.00 <0.001
A-CCP (IU/ml) 26.65 ± 29.69 20.14 ± 13.17 <0.05
h-SCRP (mg/L) 24.25 ± 10.58 18.44 ± 9.60 < 0.01
IL-6 (pg/ml) 88.40 ± 34.87 76.94 ± 22.03 < 0.001
IL-1α (pg/ml) 48.52± 21.82 39.44 ± 17.84 < 0.001
Values are given as Mean+SD, NS: non-significant, p>0.05 Table 3 .Distribution pattern of disease activity, zinc status, severity of disease, rheumatoid factor and anti-CCP cutoff points before and after 6 months
Variables Baseline Data 6 months
*P-value N % n %
DAS
Low DAS ( ≤ 3.2 ) 1 1.1 7 7.4
< 0.001 Moderate DAS: 3.3≤ 5.1 21 22.3 54 57.4
High DAS > 5.1 72 76.6 25 26.6 Remission < 2.6 0 0 8 8.5
Zinc level
Normozincaemia > 70 (µg/dl) 21 22.3 80 85.1
< 0.001 Marginal Hypozicaemia: 50-
70(µg/dl) 34
36.2 13 13.8
Severe Hypozicaemia < 70 (µg/dl)39 41.5 1 1.1
Severity of Disease
mild Disease Form 9 9.6 16 17.00 < 0.001 Moderate Disease Form 36 38.3 56 59.6
Severe Disease form 49 52.1 22 23.4
Rheumatoid Factor
Negative < 16 0 0 0 0 NS Equivocal : 16-24 1 98.9 4 4.3
positive > 24 93 1.1 90 95.7
Anti-CCP Negative < 15 24 25.5 30 31.9 NS
Positive > 15.1 70 74.5 64 68.1 * Chi test , NS:non-significant, p>0.05
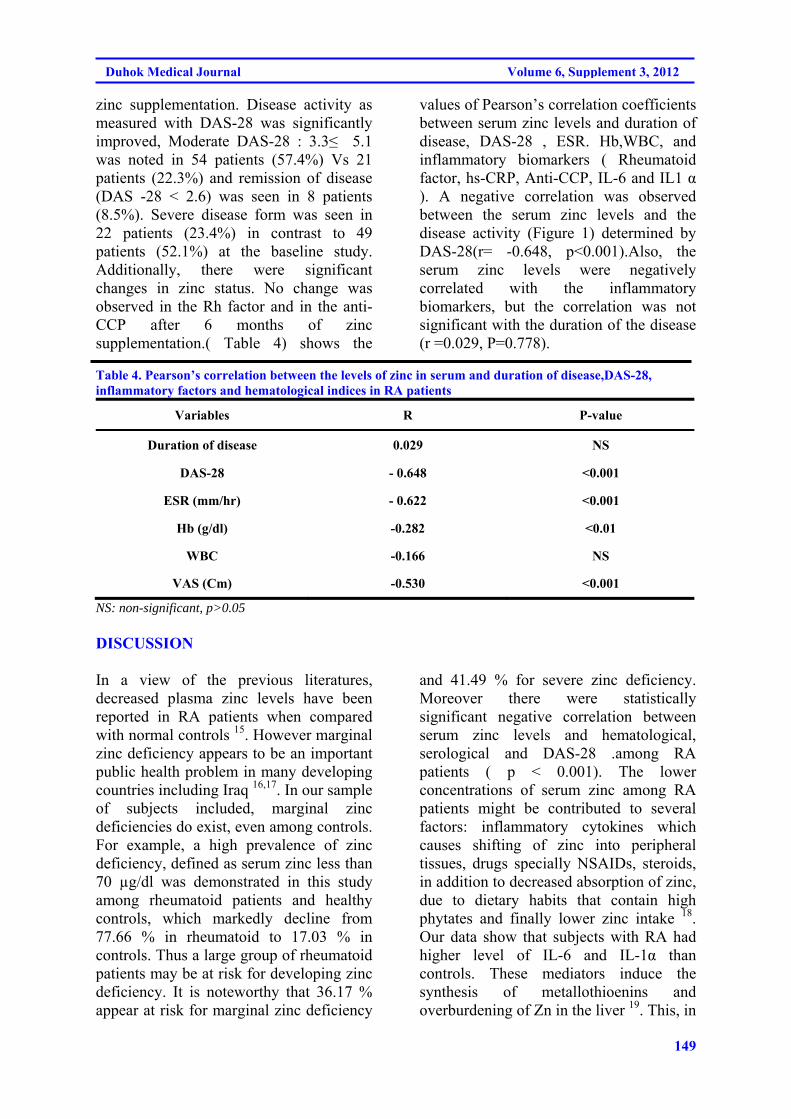
149
Duhok Medical Journal Volume 6, Supplement 3, 2012
zinc supplementation. Disease activity as measured with DAS-28 was significantly improved, Moderate DAS-28 : 3.3≤ 5.1 was noted in 54 patients (57.4%) Vs 21 patients (22.3%) and remission of disease (DAS -28 < 2.6) was seen in 8 patients (8.5%). Severe disease form was seen in 22 patients (23.4%) in contrast to 49 patients (52.1%) at the baseline study. Additionally, there were significant changes in zinc status. No change was observed in the Rh factor and in the anti-CCP after 6 months of zinc supplementation.( Table 4) shows the
values of Pearson’s correlation coefficients between serum zinc levels and duration of disease, DAS-28 , ESR. Hb,WBC, and inflammatory biomarkers ( Rheumatoid factor, hs-CRP, Anti-CCP, IL-6 and IL1 α ). A negative correlation was observed between the serum zinc levels and the disease activity (Figure 1) determined by DAS-28(r= -0.648, p<0.001).Also, the serum zinc levels were negatively correlated with the inflammatory biomarkers, but the correlation was not significant with the duration of the disease (r =0.029, P=0.778).
Table 4. Pearson’s correlation between the levels of zinc in serum and duration of disease,DAS-28, inflammatory factors and hematological indices in RA patients
Variables R P-value
Duration of disease 0.029 NS
DAS-28 - 0.648 <0.001
ESR (mm/hr) - 0.622 <0.001
Hb (g/dl) -0.282 <0.01
WBC -0.166 NS
VAS (Cm) -0.530 <0.001
NS: non-significant, p>0.05 DISCUSSION In a view of the previous literatures, decreased plasma zinc levels have been reported in RA patients when compared with normal controls 15. However marginal zinc deficiency appears to be an important public health problem in many developing countries including Iraq 16,17. In our sample of subjects included, marginal zinc deficiencies do exist, even among controls. For example, a high prevalence of zinc deficiency, defined as serum zinc less than 70 µg/dl was demonstrated in this study among rheumatoid patients and healthy controls, which markedly decline from 77.66 % in rheumatoid to 17.03 % in controls. Thus a large group of rheumatoid patients may be at risk for developing zinc deficiency. It is noteworthy that 36.17 % appear at risk for marginal zinc deficiency
and 41.49 % for severe zinc deficiency. Moreover there were statistically significant negative correlation between serum zinc levels and hematological, serological and DAS-28 .among RA patients ( p < 0.001). The lower concentrations of serum zinc among RA patients might be contributed to several factors: inflammatory cytokines which causes shifting of zinc into peripheral tissues, drugs specially NSAIDs, steroids, in addition to decreased absorption of zinc, due to dietary habits that contain high phytates and finally lower zinc intake 18. Our data show that subjects with RA had higher level of IL-6 and IL-1α than controls. These mediators induce the synthesis of metallothioenins and overburdening of Zn in the liver 19. This, in
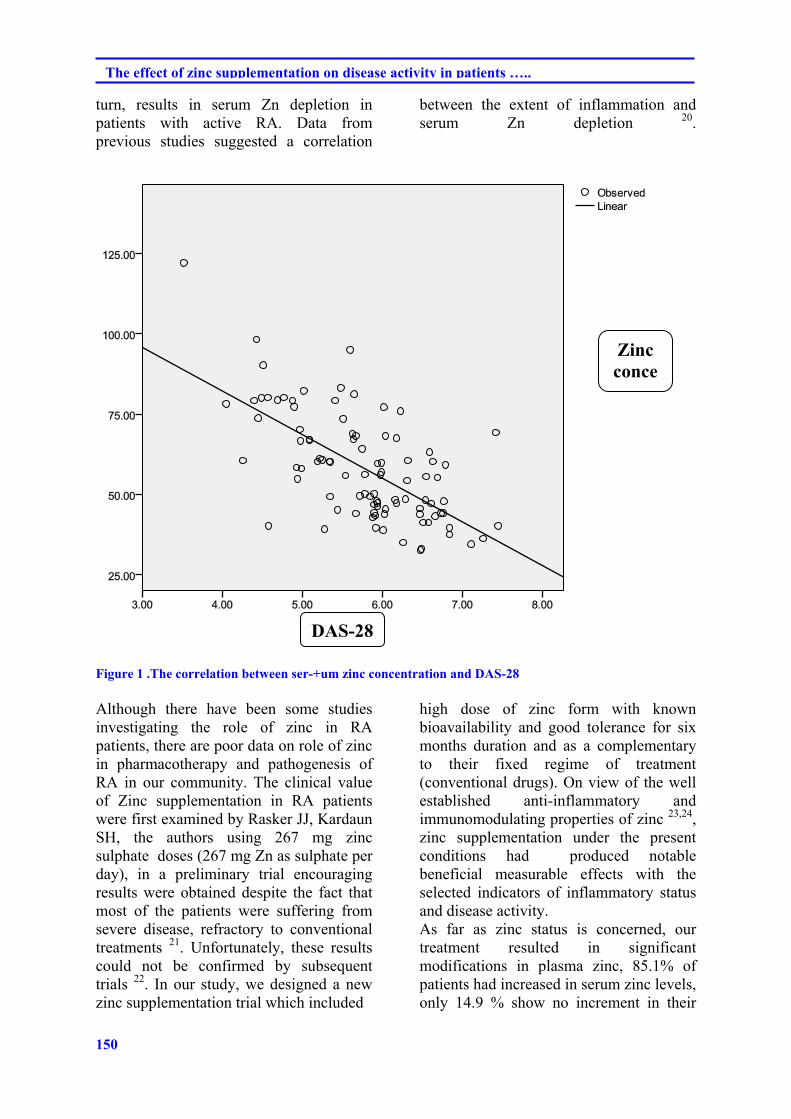
150
The effect of zinc supplementation on disease activity in patients …..
turn, results in serum Zn depletion in patients with active RA. Data from previous studies suggested a correlation
between the extent of inflammation and serum Zn depletion 20.
Figure 1 .The correlation between ser-+um zinc concentration and DAS-28 Although there have been some studies investigating the role of zinc in RA patients, there are poor data on role of zinc in pharmacotherapy and pathogenesis of RA in our community. The clinical value of Zinc supplementation in RA patients were first examined by Rasker JJ, Kardaun SH, the authors using 267 mg zinc sulphate doses (267 mg Zn as sulphate per day), in a preliminary trial encouraging results were obtained despite the fact that most of the patients were suffering from severe disease, refractory to conventional treatments 21. Unfortunately, these results could not be confirmed by subsequent trials 22. In our study, we designed a new zinc supplementation trial which included
high dose of zinc form with known bioavailability and good tolerance for six months duration and as a complementary to their fixed regime of treatment (conventional drugs). On view of the well established anti-inflammatory and immunomodulating properties of zinc 23,24, zinc supplementation under the present conditions had produced notable beneficial measurable effects with the selected indicators of inflammatory status and disease activity. As far as zinc status is concerned, our treatment resulted in significant modifications in plasma zinc, 85.1% of patients had increased in serum zinc levels, only 14.9 % show no increment in their
DAS-28
Zinc conce
151
Duhok Medical Journal Volume 6, Supplement 3, 2012
serum zinc level, which was consistent with previous reports 25. The most interesting finding of this trial was zinc treated patients shows improvements in their DAS-28 and severity of disease. Finally a highly statistically significant differences after the zinc supplementation in ESR, Hb , IL-6, IL - 1 α. Anti-CCP and hs-CRP , were noted in 6 months treated patients , which might be explain that replenished zinc in RA patients might have anti-inflammatory value as reported previously 26. CONCLUSION Our results confirm the role of zinc in RA patients and indicate that zinc supplementation play an important role in decreasing disease activity in these patients. However, these findings suggest the need for designing more randomized controlled clinical trials to evaluate the impact of zinc therapy in different stage of disease activity in RA patients. REFRENCEES
1. Lee DM, Weinblatt ME: Rheumatoid arthritis. Lancent. 2001; 358(9285): 903-11.
2. Rasch EK, Hirsch R, Paulose-Ram R, Hochberg MC. Prevalence of rheumatoid arthritis in persons 60 years of age and older in the United States: effect of different methods of case classification. Arthritis Rheum. 2003; 48(4):917–26.
3. Padyukov L, Silva C, Stolt P, Alfredsson L, Klareskog L.A gene–environment interaction between smoking and shared epitope genes in HLA–DR provides a high risk of seropositive rheumatoid arthritis. Arthritis Rheum 2004;50(10):3085–92.
4. Kamanli A, Naziroglu M, Aydilek N, and Hacievliyagil C. Plasma lipid peroxidation and antioxidant levels in patients with rheumatoid arthritis. Cell Biochem Funct. 2004; 22(1): 53-7.
5. Jaswal S, Mehta HC, Sood AK, Kaur J. Antioxidant status in rheumatoid arthritis and role of antioxidant therapy. Clin Chim Acta 2003; 338(1-2): 123-9.
6. Cerhan JR, Saag KG, Merlino
LA, Mikuls TR, Criswell LA. Antioxidant micronutrients and risk of rheumatoid arthritis in a cohort of older women. Am J Epidemiol 2003; 157(4):345–54.
7. Prasad AS .Zinc in human health:
effect of zinc on immune cells. Mol Med. 2008; 14(5-6):353-7.
8. Milanino R, Frigo A, Bambara LM, Marrella M, Moretti U, Pasqualicchio M, et al . Copper and Zinc status in Rheumatoid Arthritis: Studies of plasma erythrocytes, and urine, and their relationship to disease activity markers and pharmacological treatment. Clin Exp Rheumatol. 1993; 11(3):271-81
9. Al-Timimi DJ, Said NM, Al-Rubaii AY. Zinc deficiency in children with short stature: Effect of zinc supplementation on growth. JABHS 2005; 7(4):338-43.
10. Al-Kadi S, Al-Timimi DJ, Al-
Azzawi L. The effect of zinc in the repair of recurrent vesicovaginal fistula. A pilot study. J Fac Med Baghdad 2000;24(7): 55-7.
11. Lukacik M, Thomas RL, Aranda JV. A meta-analysis of the effects of oral zinc in the treatment of acute and persistent diarrhea. Pediatrics 2008;121(2):326–36.
152
The effect of zinc supplementation on disease activity in patients …..
12. Sharaquie KE, Nanim RA, Farjou IB,Al-Timimi DJ. Oral zinc sulfate in the treatment of acute cutanous leishmaniasis. Clin Exp Dermatol 2001;26:21-6.
13. Said NI,Al-Timimi DJ, Saleem
BJ. Current status of serum zinc level in healthy children and in children with chronic diarrhea in Baghdad city. J FAC Med Baghdad .1997;39(2):169-73.
14. Aletaha D, Neogi T, Silman AJ, Funovits J, Felson DT, Bingham CO 3rd, et al .2010 Rheumatoid arthritis classification criteria: an American College of Rheumatology/European League Against Rheumatism collaborative initiative.. Arthritis Rheum. 2010; 62( 9): 2569–81.
15. Prasad AS. Zinc in human health:
effect of zinc on immune cells. Mol Med 2008;14:353–357
16. Al-Timimi DJ, Al-Sharbatti SS,
Al-Najjar F. Zinc deficiency among a healthy population in Baghdad, Iraq. Suadi Med J 2005;26(11);1777-81.
17. Al-Timimi DJ. Marginal zinc
deficiency: a significant but unrecognized public health problem in Iraq. Duhok Med J 2009; 3(1): 1-3.
18. Artur Mierzecki,Dorota Strecker,
Krystyna Radomska A. Pilot Study on Zinc Levels in Patients with Rheumatoid Arthritis. Biol Trace Elem Res 2011; 143(2): 854–62.
19. Zoli A ,Altomonte L,Caricchio R,
Galossi A, Mirone L, Ruffini MP ,et al : Serum Zinc and Copper in Active Rheumatoid Arthritis :
Correlation with Interleukin 1β and Tumour Necrosis Factor α. Clin Rheumatol. 1998; 17(5):378-82.
20. Vallee BL,Falchuk KH. The
Biochemical basis of Zinc physiology. Physiological Reviews 1993; 73(1):79-118.
21. Rasker JJ, Kardaun SH. Lack of
beneficial effect of zinc sulphate in rheumatoid arthritis. Scand J Rheumatol. 1982; 11(3):168-70.
22. Mattingly PC, Mowat AG. Zinc
sulphate in rheumatoid arthritis. Ann Rheum Dis 1982 ; Oct;41(5):456-7.
23. Fontaine J, J Neve, Peretz A, Capel P, Famaey JP. Effects of acute and chronic prednisolone treatment on serum zinc levels in rats with adjuvant arthritis. Agents Actions, 1991;33(3-4):247-53.
24. Seiichi O , Kenji K, Sadahiro
S,Fusazo U, Toshimichi M. A Study on Effects of Replenished Zinc on Patients with Rheumatoid Arthritis. Life Science 2008;36(10):899-907.
25. Al-Timimi DJ. Al-Rubaii AY.
Current status of zinc in healthy and sick elderaly. J Fac Med Baghdad 2001;43(1)73-6.
26. Honkanen VE, Lamberg-Allardt
CH, Vesterinen MK, Lehto JH, Westermarck TW, Metsä-Ketelä TK, et al. Plasma zinc and copper concentrations in Rheumatoid Arthritis: Influence of dietary factors and disease activity. Am J Clin Nutr. 1991;54(6):1082-6.
153
Duhok Medical Journal Volume 6, Supplement 3, 2012
ón‚íq@@@@
ŽôàmbàìŠ@æŽï’í‚óä@Óò‡Ü@Žôï’í‚óä@bïØýbš@Šó@ß@ôÙäŒ@ŽônòŠóØ@bäŠb‚@bä‹ÙŽïmŠbØ@@@@
wäbàŠb÷@ì@ôØó“ŽïqZ@nïi†@aìó÷@ŽôàmbàìŠ@æŽï’í‚óä@Äò‡Ü@oïu‡ÙŽïm@ÄbuŠói@ŽôØóîòíŽï“i@ôÙäŒ@pójîbni@‹îíè@oŽïïäóàò†Šb‚@a‰ŽîŠ@ŽõŠó ó÷@ó@aìó÷@ŒŠói@bî@Žôï’í‚óä@bïØýbš@ˆ@Šíuóàóè@æŽïîóÝq@ì@ŽôåmóÙŽïÅäbîŒ@ˆ@ýbÄ@bØóäŒbi28@@l@ç‹ØŠbî†@ónŽïm@ì@oî‹ †@çbèó @( DAS-28 )@N
wåàŠb÷:@@bïØýbš@ŠóÜ@bòì@Šóè@ì@a†@Žôåîí‚@†@ôÙäŒ@a‰ŽîŠ@ŠóÜ@ôÙäi@a‡äbàŠò†@bä‹ÙŽïmŠbØ@a‡äbäbÜóè@íi@ìó÷@ŽôåïÜíØóÄ@ŽôÄ@ˆ@Žôï’í‚óäŽôàmbàìŠ@æŽï’í‚óä@Óò‡ÜN@@
õŠbØ@æŽïÙŽîŠZ@ŽôåïÜíØóÄ@ŽôÄó÷94@æm‹ @óÄí£@•í‚óäI@B88@@bïŽïà@ˆ@ì6@a‹Žïä@ˆH@@Žõìbà@íi@æî‹Ø@a†@ŽôåïÜíØóÄ@†@õŠa‡Ù“q@æŽîìó÷6@@çbèóàïq@óåmbè@ôÙŽïq@oò†@æŽïîŠóÅïq@Ûòì@a†@ Žôåî킆@ôuíÜíîbi@æŽîŠóØŠbî†@bòì@Šóè@ì@ôÙäŒ@ˆ@ÚŽîŠóè@a‰ŽîŠçbÅN@óåmbè@óóØ@Äó÷@bòì@Šóè
@ßó †@ç‹ØŠójàóè94@ãóÝ‚b†@íØ@ Šbî†@æŽïóØN50@@ ŽõˆìŠ@çbàŠò†@Ûòì@ç‹ØŠbî†@ómbè@ôÙäŒ@ ŽônòŠóØ@ ˆ@Îà3@ìó÷@õŠbiò‡ŽîŒ@çaŠbuç킆@ìó÷@oŽïäbàŠò†N@ôn“i@ç‡äbäóÜóè@óåmbè@•í‚óä@ìó÷@çb’bi6@@båïäb÷ŠbØ@bÙŽî‹i@ôÙäŒ@ŽônòŠóØ@bäŠb‚@ˆ@çbèóà(DAS-28)N@@
ãb−ó÷Za‰ŽîŠ†@´î†@óåmbè@ÄbuŠói@æŽïåî‹èí @(DAS-28)@@ôÙŽïq@oò†bî@~@Šbî†bî@Ûòì@(DAS-28)@@Óò‡Ü@‡åÝibî25@@çb’í‚óäˆ@íia†I26.6٪H@@ôn“q6@@õŠójäaŠói@ôÙäŒ@ŽônòŠóØ@bäŠb‚@ˆ@çbèóà72@@çb’í‚óäI76.6٪H@ŽôåïÜíØóÄ@bÙŽïq@oò‡ÜI(P<0.01@@Šóè@ì@bòì8@@çb’í‚óäˆ(DAS-28)@†@ŠìŒõŒóiaN@@
ãb−ó÷Šò†Z@ŽôàmbàìŠ@æŽï’í‚óä@Óò‡Ü@Žôï’í‚óä@bïØýbš@båîŒóia†@†@õóè@Žôî@Âä‹ @ŽôØóÜìŠ@ôÙäŒ@ŽônòŠóØ@bäŠb‚@íØ@‹ØŠbî†@ŽôåïÜíØóÄ@@
154
The effect of zinc supplementation on disease activity in patients …..
ó–þ©a@ @ñ‡îímbàì‹Üa@Þ–bѾa@lbénÜa@æà@çíäbÉî@æî‰Üa@ôš‹¾a@À@‹¾a@Ãb“ä@ôÝÈ@ÚäÜa@pþáÙà@qdm@@
@@óïÑÝ‚ èaìÓa‡ szjÜaZ@ó–b‚@ óÕïÔ‡Üa@ pbî‰Í¾a@pbîínà@ çc@ B@lbénÜa@ æà@ çíäbÉî@ æî‰Üa@ ôš‹¾a@õ‡Ü@ ÄízÝà@ ÞÙ“i@ ì@pŠíè‡nm@ ÚäÜa
@ðÜbÉÜa@Ãb“åÜa@ æà@ óÑÝnƒ¾a@pbuŠ‡Üa@ ì@ Š‹›Üa@æà@ óÌ‹Ñà@ óÕÝy@¶a@ bèŠì‡i@ñ†üm@Üaì@ñ‡îímbàì‹Üa@Þ–bѾa —î@ñ‰Üa@‹áÝÜk@28@þ—Ñà@@B@l@†‡±ì( DAS-28 )N
Ó‡a:@ñ‡îímbàì‹Üa@Þ–bѾa@lbénÜa@ôš‹à@õ‡Ü@‹¾a@Ãb“ä@Ú܉Ø@ì@ÚäÜa@óÜby@ôÝÈ@ÚäÜbi@xþÉÜa@Šbqe@âïïÕm@íèN@@
׋ szjÜa:@b›î‹à@çíÉm@ì@óÉiŠc@óaŠ‡Üa@oÝI@B88@ì@tbäfia@æà6@Ší؉Üa@æà@H@ò‡¾@aíØŠb’@æî‰Üa6@‹é’aNþØ@ójä@‘bïÔ@@B@æàÞ—¾a@À@óïuíÜíîbjÜa@pa‹’öí¾aì@ÚäÜa@ðÜaínÜa@ôÝÈ@‹¾a@Ãb“åÜ@@Ú܉Ø@ì@ÚäÜa@óÜb¨@ðbc@‘bïÕáØ@~@Êà@óäŠbÕ¾a@o¸94@b—ƒ’@B
öbz–a@çì‡jî@æî‰Üa@æà@N@μïÈ50@þáÙà@ôš‹áÝÜ‹é’c@ón@ò‡¾@ãíïÜa@À@pa‹à@órÜbq@ÚäÜa@‹—åÈ@æà@Îà@Bóî‡ïÝÕnÜa@âénîì†ÿ@N@âïïÕm@@ãa‡ƒnbi@@ðuþÉÜa@Þ‚‡nÜa@‡Éi@‹¾a@Ãb“ä(DAS-28)N
w÷bnåÜaZ@@kä@À@óàbè@paÍm@oÅyíÜ(DAS-28)@@óïbÿa@Bsïy@[@@ça(DAS-28)@@@@À@‡èí’@ðÜbÉÜa25@@b›î‹àI26.6٪@H@‡Éi@¶g@óäŠbÕ¾bi@ÚäÜa@pþáÙ·@xþÉÜa72@@b›î‹àI76.6٪@H@óaŠ‡Üa@óîa‡i@ÀI(P<0.01 @óïäb@çc@p‹éÄa@@Ú܉ØìI8.5٪@H@ôš‹¾a@æà
@ôÝÈ@aíäbØ@æî‰Üa@o›Ñ¯a@ÚäÜa@pþáÙà(DAS-28)@†íØ‹Üa@óïÉšì@¶aN@@
@xbånýaZçc@óaŠ‡Üa@ë‰è@pŠb’a@ôš‹¾a@öýüè@À@‹¾a@Ãb“ä@Ñ‚@À@bàbè@aŠì†@kÉÝî@ÚäÜa@pþáÙ·@@xþÉÜaN@@
155
Duhok Medical Journal Volume 6, Supplement 3, 2012
THE EFFECT OF METHANOL EXTRACTS OF SOME PLANTS AGAINST THE BACTERIA CAUSING DIARRHEA AMONG CHILDREN
SAWSAN MOHAMMED ABDULLAH AL-SORCHEE
RANA MUJAHID ABDULLAH ALSHWAIKH Submitted 14 Jul 2012; accepted 15 Sep 2012 ABSTRACT Five hundred samples of stool specimen were collected from patients with diarrhea (infants and children under ten years of age) admitted to the Pediatric and Maternity Hospital in Erbil City from March to September 2007. The samples were cultured on different culture media. The isolated bacteria were identify according to their colony morphology, biochemical reactions and by use of API 20E systems. 35(7%) E. coli. Biotype I, 8(1.6%) E. coli Biotype II, 17(3.4%) E. coli Biotype III, 22(4.4%) E. coli Biotype IV, 8(1.6%) Shigella dysenteriae, 16(3.2%) Salmonella arizonae, 12 (2.4%) Salmonella typhi and 6 (1.2%) Vibrio cholera were isolated. Sensitivity test showed high resistance to amoxicillin/ clavulanic acid, amoxicillin, ampicillin, cefixime, erythromycin, nitrofurantoin, rifampicin, streptomycin, tetracycline, trimethoprim - sulfamethoxazole and tobramycin. Most of the isolated appeared sensitive to nalidixic acid, doxycyclin, gentamycin , cefotaxime , cephalexine , chloramphenicol and amikacin. All isolates of bacteria were sensitive to ciprofloxacin. The MIC of the methanol extracts of Prunus armeniaca was ranged between 1.25000- 10.0000 mg/ ml and the MBC was 2.5000 - 20.0000 mg/ ml . While, the MIC of Prosopis farcta extract ranging 1.2500 - 20.0000 mg/ ml and the MBC was 2.5000 - 20.0000mg/ ml, the MIC of Juglans regia leave extract found to be 2.5000 - 20.0000 mg/ ml and the MBC was 5.0000 - 20.0000mg/ ml, and MIC of Juglans regia exocarpes extract was 1.2500 - 20.0000mg/ ml and the MBC was 2.5000 -20.0000 mg/ ml.
Duhok Med J 2012;6 Suppl 3: 155-169. Key words: Diarrhea, Plant extraction.
iarrhea is best defined as excessive loss of fluid and electrolytes in the
stool and should continue for a minimum of 2 weeks, before it is considered chronic. In infants, stool volume in excess of 15g/Kg/24hr. is considered diarrhea 34. Diarrhea is also usually defined by parent as a consistent increase in stool frequency. Decrease in stool consistency, or increase in stool volume and frequency. Stool volume is extremely difficult to assess in infant because of the difficulty in separating stool from urine 19 . Bacterial infections are very important causes of diarrhea in infants and young children worldwide 20. The principal microorganisms implicated are Salmonella 32, Shigella 30, Vibrio cholerae 33 and serotypes of Escherichia coli including EPEC, STEC, EAEC, EIEC and EHEC 26.
Microorganisms have developed resistance to many antibiotics and as a result, immense clinical problem in the treatment of infectious diseases has been created. The resistance of the organisms increased due to indiscriminate use of commercial antimicrobial drugs commonly used for the treatment of infectious disease 28. This situation forced the researchers to search for new antimicrobial substances from various sources including medicinal plants 3,23 . The use of alternative medical therapy has increased the interest of pharmacologists and herbalists over the past decades. There is increasing use of herbal products all over the world, in USA, it reached 38% between 1990 and 1997 7; therefore, instead of antibiotic therapy, there is a continuing search for new antimicrobials,
* Lecturer of Microbiology, College of Education (Ibn Al-Haitham) Baghdad University, Iraq ** Assistant Professor of Microbiology, College of Education (Ibn Al-Haitham) Baghdad University, Iraq. Correspondence author: Rana Mujahid Abdullah Alshwaikh. Email: [email protected] ;
D
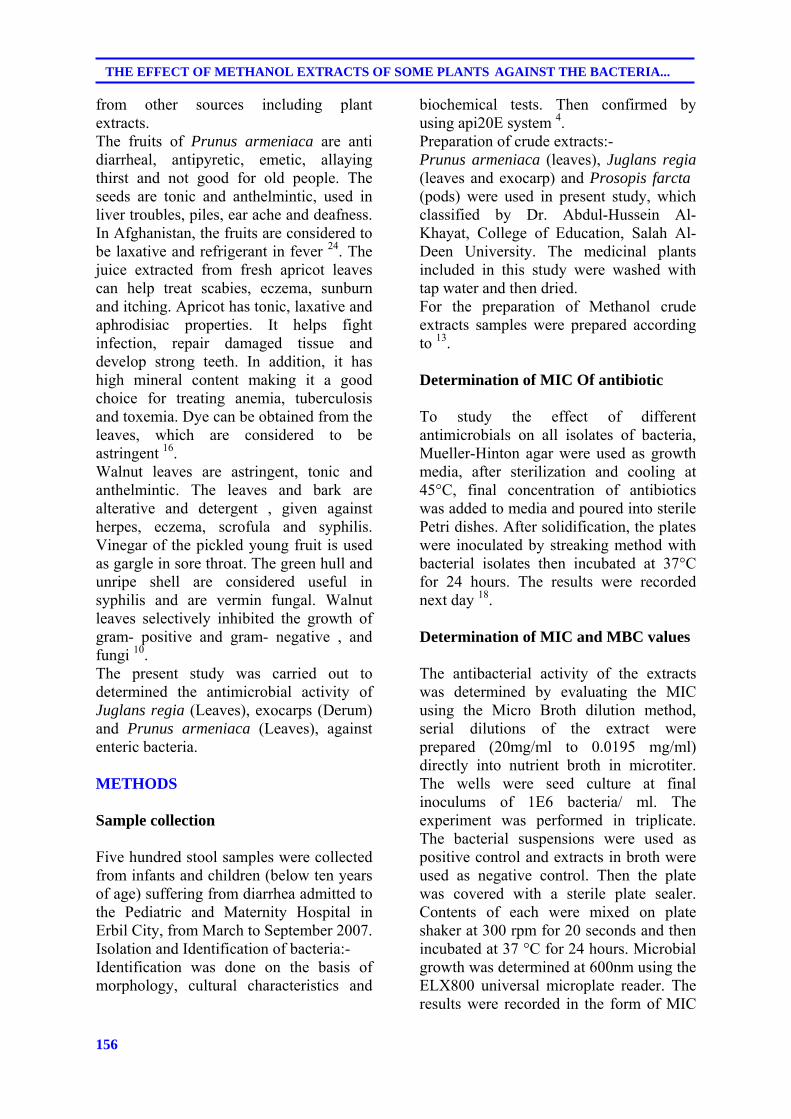
156
THE EFFECT OF METHANOL EXTRACTS OF SOME PLANTS AGAINST THE BACTERIA...
from other sources including plant extracts. The fruits of Prunus armeniaca are anti diarrheal, antipyretic, emetic, allaying thirst and not good for old people. The seeds are tonic and anthelmintic, used in liver troubles, piles, ear ache and deafness. In Afghanistan, the fruits are considered to be laxative and refrigerant in fever 24. The juice extracted from fresh apricot leaves can help treat scabies, eczema, sunburn and itching. Apricot has tonic, laxative and aphrodisiac properties. It helps fight infection, repair damaged tissue and develop strong teeth. In addition, it has high mineral content making it a good choice for treating anemia, tuberculosis and toxemia. Dye can be obtained from the leaves, which are considered to be astringent 16. Walnut leaves are astringent, tonic and anthelmintic. The leaves and bark are alterative and detergent , given against herpes, eczema, scrofula and syphilis. Vinegar of the pickled young fruit is used as gargle in sore throat. The green hull and unripe shell are considered useful in syphilis and are vermin fungal. Walnut leaves selectively inhibited the growth of gram- positive and gram- negative , and fungi 10. The present study was carried out to determined the antimicrobial activity of Juglans regia (Leaves), exocarps (Derum) and Prunus armeniaca (Leaves), against enteric bacteria. METHODS Sample collection Five hundred stool samples were collected from infants and children (below ten years of age) suffering from diarrhea admitted to the Pediatric and Maternity Hospital in Erbil City, from March to September 2007. Isolation and Identification of bacteria:- Identification was done on the basis of morphology, cultural characteristics and
biochemical tests. Then confirmed by using api20E system 4. Preparation of crude extracts:- Prunus armeniaca (leaves), Juglans regia (leaves and exocarp) and Prosopis farcta (pods) were used in present study, which classified by Dr. Abdul-Hussein Al-Khayat, College of Education, Salah Al-Deen University. The medicinal plants included in this study were washed with tap water and then dried. For the preparation of Methanol crude extracts samples were prepared according to 13. Determination of MIC Of antibiotic To study the effect of different antimicrobials on all isolates of bacteria, Mueller-Hinton agar were used as growth media, after sterilization and cooling at 45°C, final concentration of antibiotics was added to media and poured into sterile Petri dishes. After solidification, the plates were inoculated by streaking method with bacterial isolates then incubated at 37°C for 24 hours. The results were recorded next day 18. Determination of MIC and MBC values The antibacterial activity of the extracts was determined by evaluating the MIC using the Micro Broth dilution method, serial dilutions of the extract were prepared (20mg/ml to 0.0195 mg/ml) directly into nutrient broth in microtiter. The wells were seed culture at final inoculums of 1E6 bacteria/ ml. The experiment was performed in triplicate. The bacterial suspensions were used as positive control and extracts in broth were used as negative control. Then the plate was covered with a sterile plate sealer. Contents of each were mixed on plate shaker at 300 rpm for 20 seconds and then incubated at 37 °C for 24 hours. Microbial growth was determined at 600nm using the ELX800 universal microplate reader. The results were recorded in the form of MIC
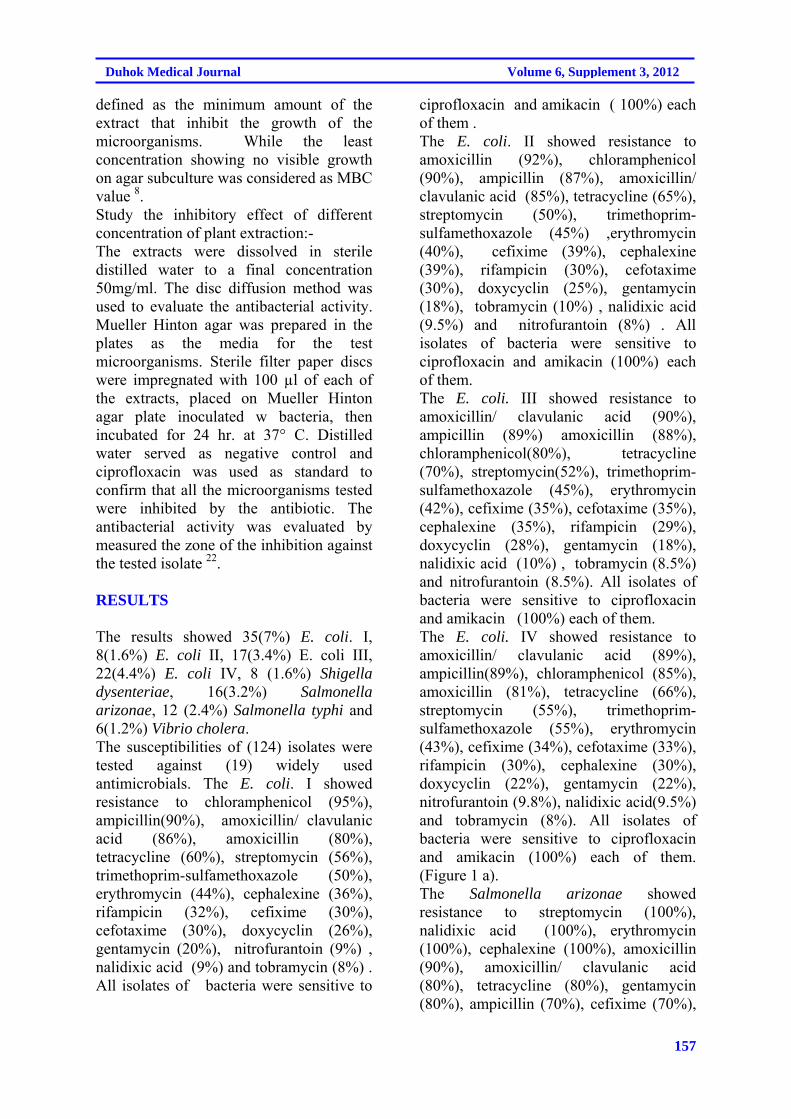
157
Duhok Medical Journal Volume 6, Supplement 3, 2012
defined as the minimum amount of the extract that inhibit the growth of the microorganisms. While the least concentration showing no visible growth on agar subculture was considered as MBC value 8. Study the inhibitory effect of different concentration of plant extraction:- The extracts were dissolved in sterile distilled water to a final concentration 50mg/ml. The disc diffusion method was used to evaluate the antibacterial activity. Mueller Hinton agar was prepared in the plates as the media for the test microorganisms. Sterile filter paper discs were impregnated with 100 µl of each of the extracts, placed on Mueller Hinton agar plate inoculated w bacteria, then incubated for 24 hr. at 37° C. Distilled water served as negative control and ciprofloxacin was used as standard to confirm that all the microorganisms tested were inhibited by the antibiotic. The antibacterial activity was evaluated by measured the zone of the inhibition against the tested isolate 22. RESULTS The results showed 35(7%) E. coli. I, 8(1.6%) E. coli II, 17(3.4%) E. coli III, 22(4.4%) E. coli IV, 8 (1.6%) Shigella dysenteriae, 16(3.2%) Salmonella arizonae, 12 (2.4%) Salmonella typhi and 6(1.2%) Vibrio cholera. The susceptibilities of (124) isolates were tested against (19) widely used antimicrobials. The E. coli. I showed resistance to chloramphenicol (95%), ampicillin(90%), amoxicillin/ clavulanic acid (86%), amoxicillin (80%), tetracycline (60%), streptomycin (56%), trimethoprim-sulfamethoxazole (50%), erythromycin (44%), cephalexine (36%), rifampicin (32%), cefixime (30%), cefotaxime (30%), doxycyclin (26%), gentamycin (20%), nitrofurantoin (9%) , nalidixic acid (9%) and tobramycin (8%) . All isolates of bacteria were sensitive to
ciprofloxacin and amikacin ( 100%) each of them . The E. coli. II showed resistance to amoxicillin (92%), chloramphenicol (90%), ampicillin (87%), amoxicillin/ clavulanic acid (85%), tetracycline (65%), streptomycin (50%), trimethoprim-sulfamethoxazole (45%) ,erythromycin (40%), cefixime (39%), cephalexine (39%), rifampicin (30%), cefotaxime (30%), doxycyclin (25%), gentamycin (18%), tobramycin (10%) , nalidixic acid (9.5%) and nitrofurantoin (8%) . All isolates of bacteria were sensitive to ciprofloxacin and amikacin (100%) each of them. The E. coli. III showed resistance to amoxicillin/ clavulanic acid (90%), ampicillin (89%) amoxicillin (88%), chloramphenicol(80%), tetracycline (70%), streptomycin(52%), trimethoprim-sulfamethoxazole (45%), erythromycin (42%), cefixime (35%), cefotaxime (35%), cephalexine (35%), rifampicin (29%), doxycyclin (28%), gentamycin (18%), nalidixic acid (10%) , tobramycin (8.5%) and nitrofurantoin (8.5%). All isolates of bacteria were sensitive to ciprofloxacin and amikacin (100%) each of them. The E. coli. IV showed resistance to amoxicillin/ clavulanic acid (89%), ampicillin(89%), chloramphenicol (85%), amoxicillin (81%), tetracycline (66%), streptomycin (55%), trimethoprim-sulfamethoxazole (55%), erythromycin (43%), cefixime (34%), cefotaxime (33%), rifampicin (30%), cephalexine (30%), doxycyclin (22%), gentamycin (22%), nitrofurantoin (9.8%), nalidixic acid(9.5%) and tobramycin (8%). All isolates of bacteria were sensitive to ciprofloxacin and amikacin (100%) each of them. (Figure 1 a). The Salmonella arizonae showed resistance to streptomycin (100%), nalidixic acid (100%), erythromycin (100%), cephalexine (100%), amoxicillin (90%), amoxicillin/ clavulanic acid (80%), tetracycline (80%), gentamycin (80%), ampicillin (70%), cefixime (70%),
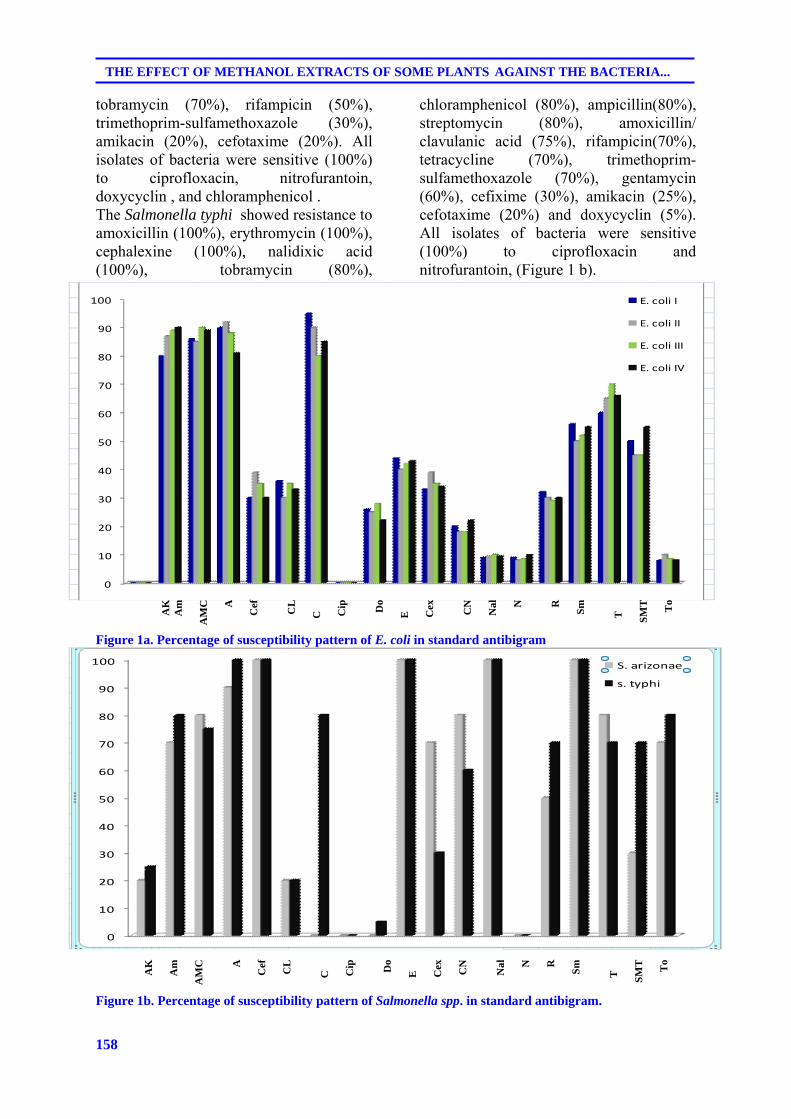
158
THE EFFECT OF METHANOL EXTRACTS OF SOME PLANTS AGAINST THE BACTERIA...
tobramycin (70%), rifampicin (50%), trimethoprim-sulfamethoxazole (30%), amikacin (20%), cefotaxime (20%). All isolates of bacteria were sensitive (100%) to ciprofloxacin, nitrofurantoin, doxycyclin , and chloramphenicol . The Salmonella typhi showed resistance to amoxicillin (100%), erythromycin (100%), cephalexine (100%), nalidixic acid (100%), tobramycin (80%),
chloramphenicol (80%), ampicillin(80%), streptomycin (80%), amoxicillin/ clavulanic acid (75%), rifampicin(70%), tetracycline (70%), trimethoprim-sulfamethoxazole (70%), gentamycin (60%), cefixime (30%), amikacin (25%), cefotaxime (20%) and doxycyclin (5%). All isolates of bacteria were sensitive (100%) to ciprofloxacin and nitrofurantoin, (Figure 1 b).
Figure 1a. Percentage of susceptibility pattern of E. coli in standard antibigram Figure 1b. Percentage of susceptibility pattern of Salmonella spp. in standard antibigram.
86 85 90 89
90 92 88 81
30 39 35 30
36 30 35 33
95 90 80 85
0 0 0 0
26 25 28 22
44 40 42 43
33 39 35 34
20 18 18 22
9 9.5 10 9.5
9 8 8.5 9.8
32 30 29 30
56 50 52 55
60 65 70 66
50 45 45 55
8 10 8.5 8
0
10
20
30
40
50
60
70
80
90
100 E. coli I
E. coli II
E. coli III
E. coli IV
AK
A
m
AM
C
A
Cef
C
L
C
C
ip
Do
E
C
ex
CN
N
al
N
R
Sm
T
S
MT
T
o
0
10
20
30
40
50
60
70
80
90
100 S. arizonae
s. typhi
AK
A
m
AM
C
A
Cef
C
L
C
C
ip
Do
E
C
ex
CN
N
al
N
R
Sm
T
S
MT
T
o
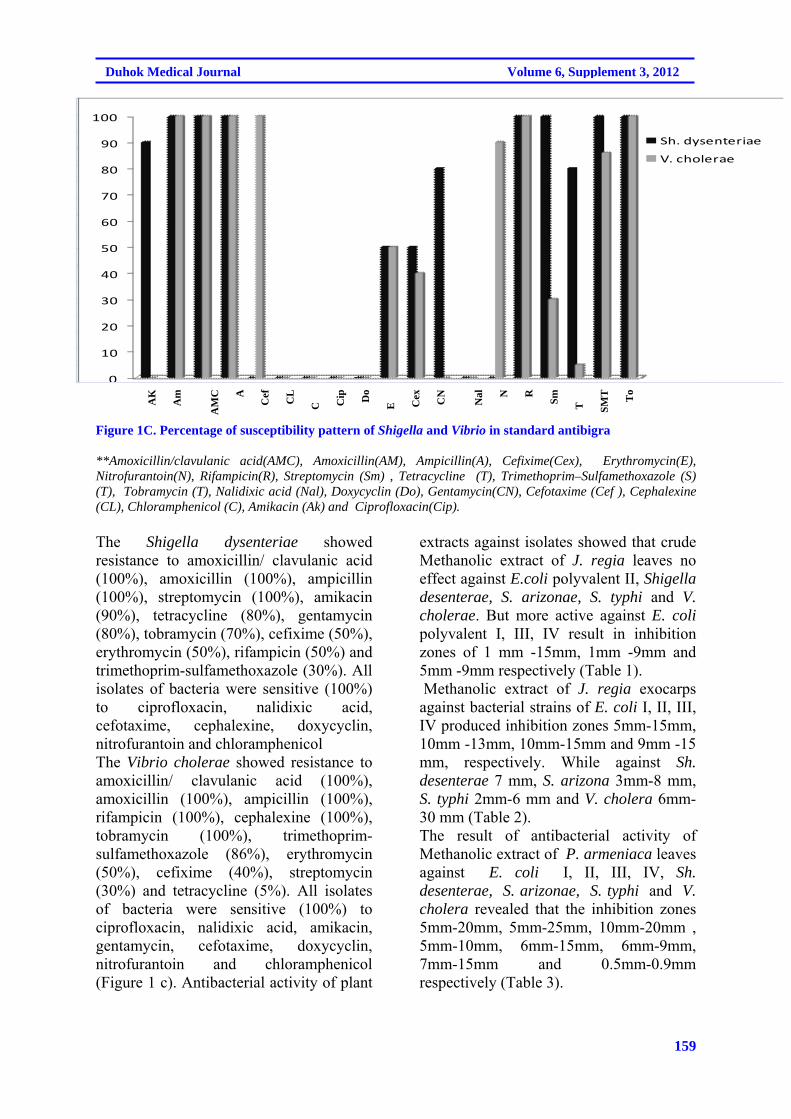
159
Duhok Medical Journal Volume 6, Supplement 3, 2012
Figure 1C. Percentage of susceptibility pattern of Shigella and Vibrio in standard antibigra **Amoxicillin/clavulanic acid(AMC), Amoxicillin(AM), Ampicillin(A), Cefixime(Cex), Erythromycin(E), Nitrofurantoin(N), Rifampicin(R), Streptomycin (Sm) , Tetracycline (T), Trimethoprim–Sulfamethoxazole (S) (T), Tobramycin (T), Nalidixic acid (Nal), Doxycyclin (Do), Gentamycin(CN), Cefotaxime (Cef ), Cephalexine (CL), Chloramphenicol (C), Amikacin (Ak) and Ciprofloxacin(Cip). The Shigella dysenteriae showed resistance to amoxicillin/ clavulanic acid (100%), amoxicillin (100%), ampicillin (100%), streptomycin (100%), amikacin (90%), tetracycline (80%), gentamycin (80%), tobramycin (70%), cefixime (50%), erythromycin (50%), rifampicin (50%) and trimethoprim-sulfamethoxazole (30%). All isolates of bacteria were sensitive (100%) to ciprofloxacin, nalidixic acid, cefotaxime, cephalexine, doxycyclin, nitrofurantoin and chloramphenicol The Vibrio cholerae showed resistance to amoxicillin/ clavulanic acid (100%), amoxicillin (100%), ampicillin (100%), rifampicin (100%), cephalexine (100%), tobramycin (100%), trimethoprim-sulfamethoxazole (86%), erythromycin (50%), cefixime (40%), streptomycin (30%) and tetracycline (5%). All isolates of bacteria were sensitive (100%) to ciprofloxacin, nalidixic acid, amikacin, gentamycin, cefotaxime, doxycyclin, nitrofurantoin and chloramphenicol (Figure 1 c). Antibacterial activity of plant
extracts against isolates showed that crude Methanolic extract of J. regia leaves no effect against E.coli polyvalent II, Shigella desenterae, S. arizonae, S. typhi and V. cholerae. But more active against E. coli polyvalent I, III, IV result in inhibition zones of 1 mm -15mm, 1mm -9mm and 5mm -9mm respectively (Table 1). Methanolic extract of J. regia exocarps against bacterial strains of E. coli I, II, III, IV produced inhibition zones 5mm-15mm, 10mm -13mm, 10mm-15mm and 9mm -15 mm, respectively. While against Sh. desenterae 7 mm, S. arizona 3mm-8 mm, S. typhi 2mm-6 mm and V. cholera 6mm-30 mm (Table 2). The result of antibacterial activity of Methanolic extract of P. armeniaca leaves against E. coli I, II, III, IV, Sh. desenterae, S. arizonae, S. typhi and V. cholera revealed that the inhibition zones 5mm-20mm, 5mm-25mm, 10mm-20mm , 5mm-10mm, 6mm-15mm, 6mm-9mm, 7mm-15mm and 0.5mm-0.9mm respectively (Table 3).
AK
A
m
AM
C
A
Cef
C
L
C
C
ip
Do
E
C
ex
CN
N
al
N
R
Sm
T
S
MT
T
o
0
100
100
100
100
0
0
0
0
50
40
0
0
90
100
30
50
10
20
30
40
50
60
70
80
90
100
Sh. dysenteriae
V. cholerae
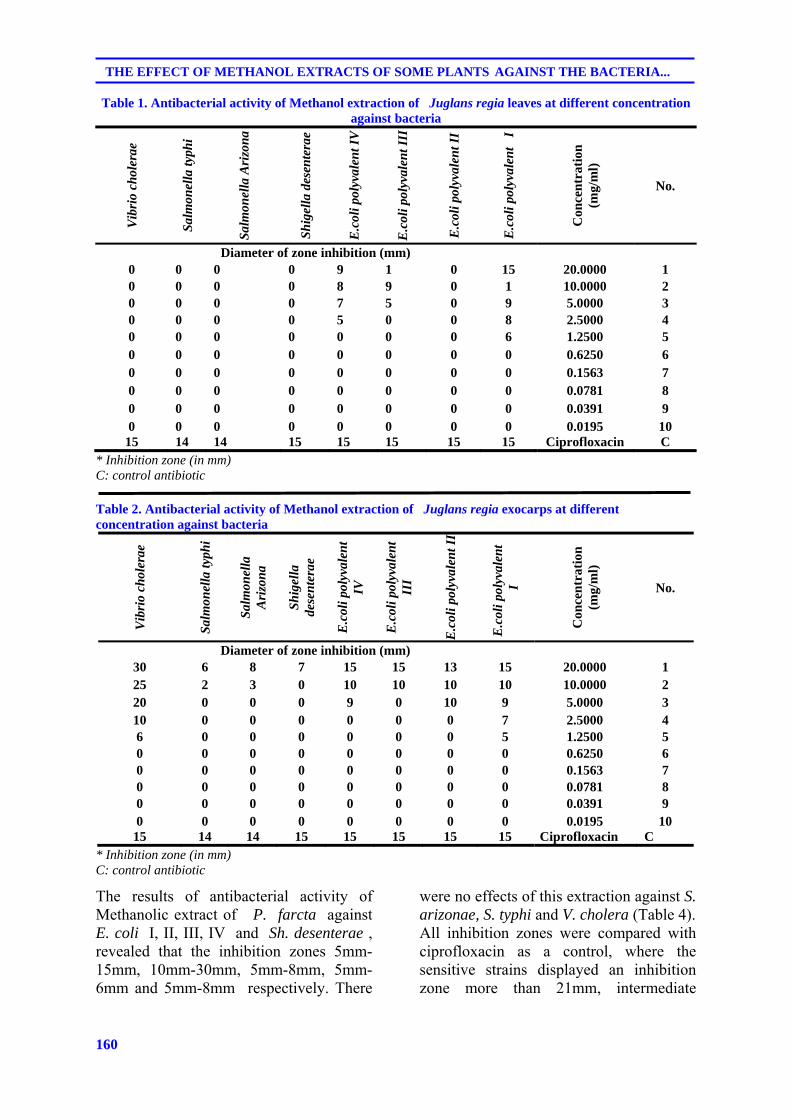
160
THE EFFECT OF METHANOL EXTRACTS OF SOME PLANTS AGAINST THE BACTERIA...
Table 1. Antibacterial activity of Methanol extraction of Juglans regia leaves at different concentration against bacteria
Vib
rio
chol
erae
Sal
mon
ella
typh
i
Sal
mon
ella
Ari
zon
a
Sh
igel
la d
esen
tera
e
E.c
oli p
olyv
alen
t IV
E.c
oli p
olyv
alen
t III
E.c
oli p
olyv
alen
t II
E.c
oli p
olyv
alen
t I
Con
cen
trat
ion
(m
g/m
l)
No.
Diameter of zone inhibition (mm) 0 0 0 0 9 1 0 15 20.0000 1 0 0 0 0 8 9 0 1 10.0000 2 0 0 0 0 7 5 0 9 5.0000 3 0 0 0 0 5 0 0 8 2.5000 4 0 0 0 0 0 0 0 6 1.2500 5 0 0 0 0 0 0 0 0 0.6250 6 0 0 0 0 0 0 0 0 0.1563 7 0 0 0 0 0 0 0 0 0.0781 8 0 0 0 0 0 0 0 0 0.0391 9 0 0 0 0 0 0 0 0 0.0195 10
15 14 14 15 15 15 15 15 Ciprofloxacin C * Inhibition zone (in mm) C: control antibiotic
Table 2. Antibacterial activity of Methanol extraction of Juglans regia exocarps at different concentration against bacteria
Vib
rio
chol
erae
Sal
mon
ella
typh
i
Sal
mon
ella
A
rizo
na
Sh
igel
la
dese
nte
rae
E.c
oli p
olyv
alen
t IV
E.c
oli p
olyv
alen
t II
I
E.c
oli p
olyv
alen
t II
E.c
oli p
olyv
alen
t
I
Con
cen
trat
ion
(m
g/m
l)
No.
Diameter of zone inhibition (mm) 30 6 8 7 15 15 13 15 20.0000 1 25 2 3 0 10 10 10 10 10.0000 2 20 0 0 0 9 0 10 9 5.0000 3 10 0 0 0 0 0 0 7 2.5000 4 6 0 0 0 0 0 0 5 1.2500 5 0 0 0 0 0 0 0 0 0.6250 6 0 0 0 0 0 0 0 0 0.1563 7 0 0 0 0 0 0 0 0 0.0781 8 0 0 0 0 0 0 0 0 0.0391 9 0 0 0 0 0 0 0 0 0.0195 10
15 14 14 15 15 15 15 15 Ciprofloxacin C * Inhibition zone (in mm) C: control antibiotic
The results of antibacterial activity of Methanolic extract of P. farcta against E. coli I, II, III, IV and Sh. desenterae , revealed that the inhibition zones 5mm-15mm, 10mm-30mm, 5mm-8mm, 5mm-6mm and 5mm-8mm respectively. There
were no effects of this extraction against S. arizonae, S. typhi and V. cholera (Table 4). All inhibition zones were compared with ciprofloxacin as a control, where the sensitive strains displayed an inhibition zone more than 21mm, intermediate
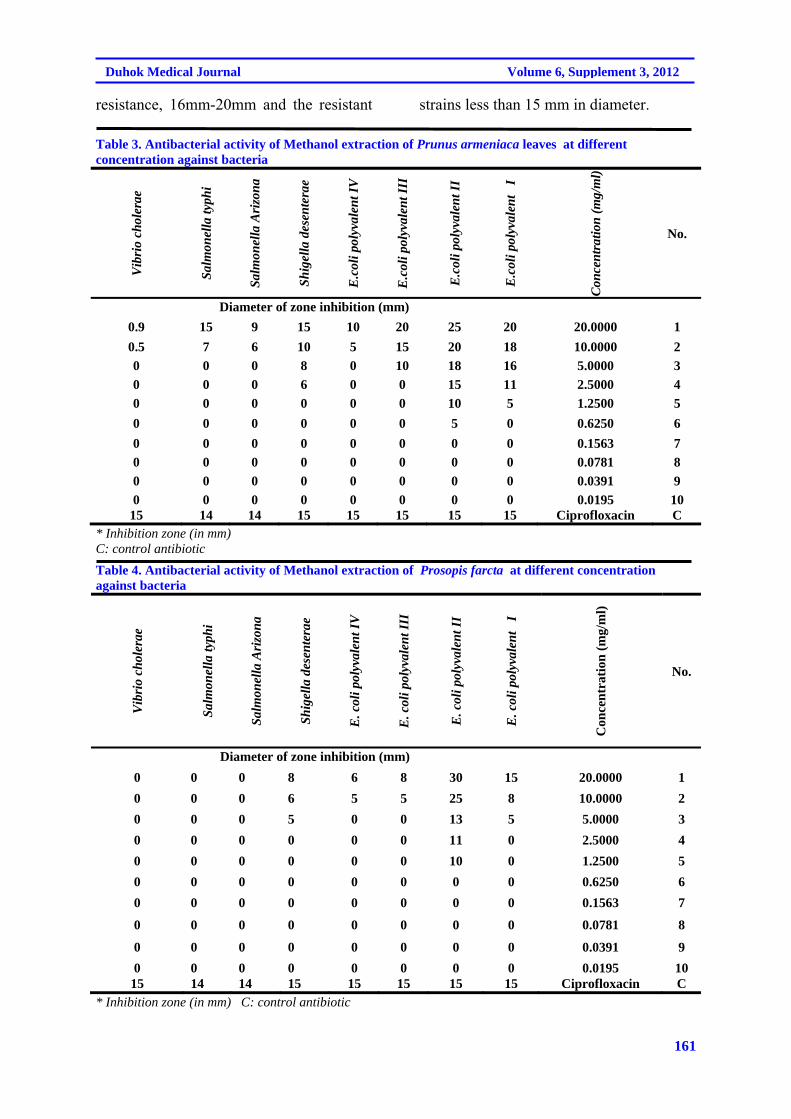
161
Duhok Medical Journal Volume 6, Supplement 3, 2012
resistance, 16mm-20mm and the resistant strains less than 15 mm in diameter.
Table 3. Antibacterial activity of Methanol extraction of Prunus armeniaca leaves at different concentration against bacteria
Vib
rio
chol
erae
Sal
mon
ella
typh
i
Sal
mon
ella
Ari
zon
a
Sh
igel
la d
esen
tera
e
E.c
oli p
olyv
alen
t IV
E.c
oli p
olyv
alen
t III
E.c
oli p
olyv
alen
t II
E.c
oli p
olyv
alen
t I
Con
cen
trat
ion
(m
g/m
l)
No.
Diameter of zone inhibition (mm)
0.9 15 9 15 10 20 25 20 20.0000 1
0.5 7 6 10 5 15 20 18 10.0000 2
0 0 0 8 0 10 18 16 5.0000 3
0 0 0 6 0 0 15 11 2.5000 4
0 0 0 0 0 0 10 5 1.2500 5
0 0 0 0 0 0 5 0 0.6250 6
0 0 0 0 0 0 0 0 0.1563 7
0 0 0 0 0 0 0 0 0.0781 8
0 0 0 0 0 0 0 0 0.0391 9
0 0 0 0 0 0 0 0 0.0195 10 15 14 14 15 15 15 15 15 Ciprofloxacin C
* Inhibition zone (in mm) C: control antibiotic
Table 4. Antibacterial activity of Methanol extraction of Prosopis farcta at different concentration against bacteria
Vib
rio
chol
erae
Sal
mon
ella
typh
i
Sal
mon
ella
Ari
zon
a
Sh
igel
la d
esen
tera
e
E. c
oli p
olyv
alen
t IV
E. c
oli p
olyv
alen
t III
E. c
oli p
olyv
alen
t II
E. c
oli p
olyv
alen
t I
Con
cen
trat
ion
(m
g/m
l)
No.
Diameter of zone inhibition (mm)
0 0 0 8 6 8 30 15 20.0000 1
0 0 0 6 5 5 25 8 10.0000 2
0 0 0 5 0 0 13 5 5.0000 3
0 0 0 0 0 0 11 0 2.5000 4
0 0 0 0 0 0 10 0 1.2500 5
0 0 0 0 0 0 0 0 0.6250 6
0 0 0 0 0 0 0 0 0.1563 7
0 0 0 0 0 0 0 0 0.0781 8
0 0 0 0 0 0 0 0 0.0391 9
0 0 0 0 0 0 0 0 0.0195 10 15 14 14 15 15 15 15 15 Ciprofloxacin C
* Inhibition zone (in mm) C: control antibiotic
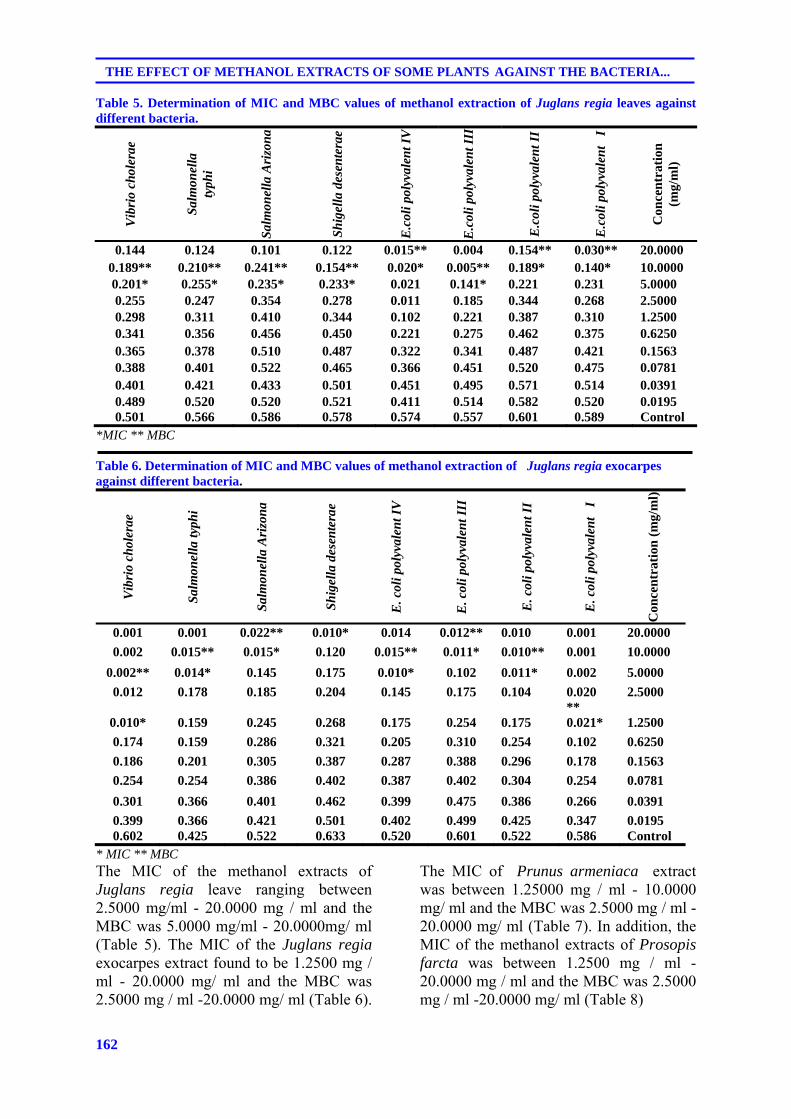
162
THE EFFECT OF METHANOL EXTRACTS OF SOME PLANTS AGAINST THE BACTERIA...
Table 5. Determination of MIC and MBC values of methanol extraction of Juglans regia leaves against different bacteria.
Vib
rio
chol
erae
Sal
mon
ella
ty
phi
Sal
mon
ella
Ari
zon
a
Sh
igel
la d
esen
tera
e
E.c
oli p
olyv
alen
t IV
E.c
oli p
olyv
alen
t II I
E.c
oli p
olyv
alen
t II
E.c
oli p
olyv
alen
t I
Con
cen
trat
ion
(m
g/m
l)
0.144 0.124 0.101 0.122 0.015** 0.004 0.154** 0.030** 20.0000 0.189** 0.210** 0.241** 0.154** 0.020* 0.005** 0.189* 0.140* 10.0000 0.201* 0.255* 0.235* 0.233* 0.021 0.141* 0.221 0.231 5.0000 0.255 0.247 0.354 0.278 0.011 0.185 0.344 0.268 2.5000 0.298 0.311 0.410 0.344 0.102 0.221 0.387 0.310 1.2500 0.341 0.356 0.456 0.450 0.221 0.275 0.462 0.375 0.6250 0.365 0.378 0.510 0.487 0.322 0.341 0.487 0.421 0.1563 0.388 0.401 0.522 0.465 0.366 0.451 0.520 0.475 0.0781 0.401 0.421 0.433 0.501 0.451 0.495 0.571 0.514 0.0391 0.489 0.520 0.520 0.521 0.411 0.514 0.582 0.520 0.0195 0.501 0.566 0.586 0.578 0.574 0.557 0.601 0.589 Control
*MIC ** MBC
Table 6. Determination of MIC and MBC values of methanol extraction of Juglans regia exocarpes against different bacteria.
Vib
rio
chol
erae
Sal
mon
ella
typh
i
Sal
mon
ella
Ari
zon
a
Sh
igel
la d
esen
tera
e
E. c
oli p
olyv
alen
t IV
E. c
oli p
olyv
alen
t III
E. c
oli p
olyv
alen
t II
E. c
oli p
olyv
alen
t I
Con
cen
trat
ion
(m
g/m
l)
0.001 0.001 0.022** 0.010* 0.014 0.012** 0.010 0.001 20.0000
0.002 0.015** 0.015* 0.120 0.015** 0.011* 0.010** 0.001 10.0000
0.002** 0.014* 0.145 0.175 0.010* 0.102 0.011* 0.002 5.0000
0.012 0.178 0.185 0.204 0.145 0.175 0.104 0.020 **
2.5000
0.010* 0.159 0.245 0.268 0.175 0.254 0.175 0.021* 1.2500
0.174 0.159 0.286 0.321 0.205 0.310 0.254 0.102 0.6250
0.186 0.201 0.305 0.387 0.287 0.388 0.296 0.178 0.1563
0.254 0.254 0.386 0.402 0.387 0.402 0.304 0.254 0.0781
0.301 0.366 0.401 0.462 0.399 0.475 0.386 0.266 0.0391
0.399 0.366 0.421 0.501 0.402 0.499 0.425 0.347 0.0195 0.602 0.425 0.522 0.633 0.520 0.601 0.522 0.586 Control
* MIC ** MBC The MIC of the methanol extracts of Juglans regia leave ranging between 2.5000 mg/ml - 20.0000 mg / ml and the MBC was 5.0000 mg/ml - 20.0000mg/ ml (Table 5). The MIC of the Juglans regia exocarpes extract found to be 1.2500 mg / ml - 20.0000 mg/ ml and the MBC was 2.5000 mg / ml -20.0000 mg/ ml (Table 6).
The MIC of Prunus armeniaca extract was between 1.25000 mg / ml - 10.0000 mg/ ml and the MBC was 2.5000 mg / ml - 20.0000 mg/ ml (Table 7). In addition, the MIC of the methanol extracts of Prosopis farcta was between 1.2500 mg / ml - 20.0000 mg / ml and the MBC was 2.5000 mg / ml -20.0000 mg/ ml (Table 8)
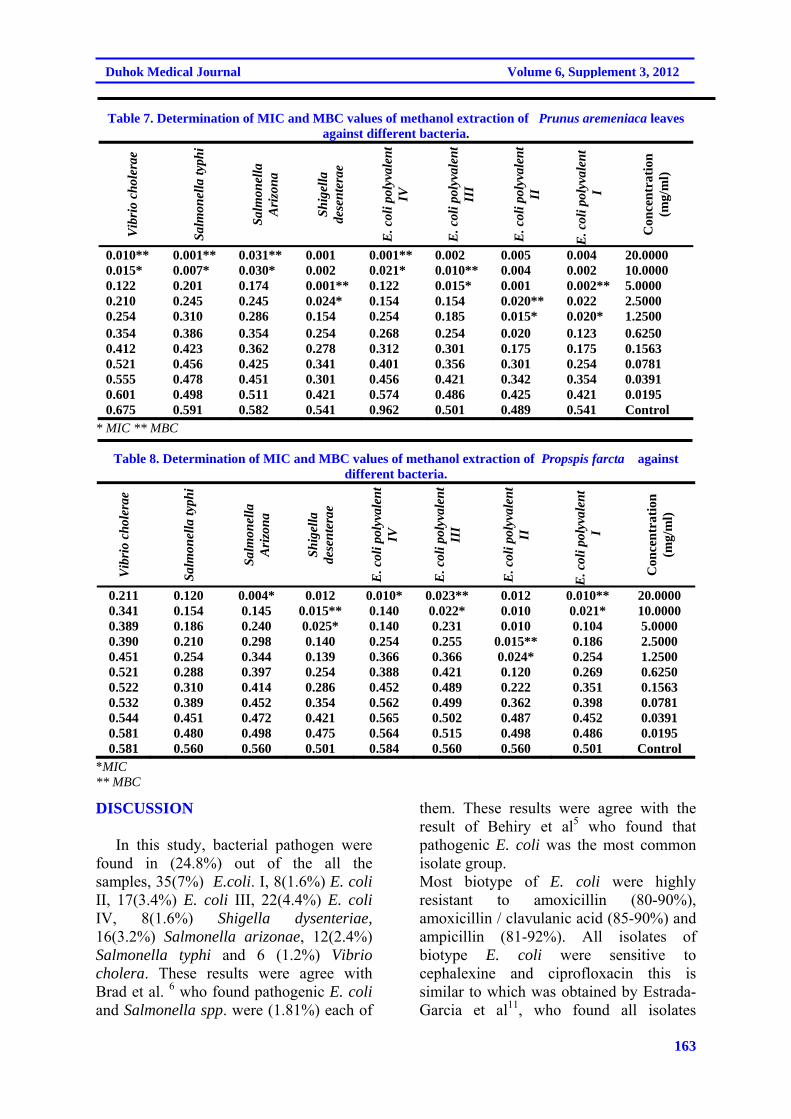
163
Duhok Medical Journal Volume 6, Supplement 3, 2012
Table 7. Determination of MIC and MBC values of methanol extraction of Prunus aremeniaca leaves
against different bacteria. V
ibri
o ch
oler
ae
Sal
mon
ella
typh
i
Sal
mon
ella
A
rizo
na
Sh
igel
la
dese
nte
rae
E. c
oli p
olyv
alen
t IV
E. c
oli p
olyv
alen
t II
I
E. c
oli p
olyv
alen
t II
E. c
oli p
olyv
alen
t I
Con
cen
trat
ion
(m
g/m
l)
0.010** 0.001** 0.031** 0.001 0.001** 0.002 0.005 0.004 20.0000 0.015* 0.007* 0.030* 0.002 0.021* 0.010** 0.004 0.002 10.0000 0.122 0.201 0.174 0.001** 0.122 0.015* 0.001 0.002** 5.0000 0.210 0.245 0.245 0.024* 0.154 0.154 0.020** 0.022 2.5000 0.254 0.310 0.286 0.154 0.254 0.185 0.015* 0.020* 1.2500 0.354 0.386 0.354 0.254 0.268 0.254 0.020 0.123 0.6250 0.412 0.423 0.362 0.278 0.312 0.301 0.175 0.175 0.1563 0.521 0.456 0.425 0.341 0.401 0.356 0.301 0.254 0.0781 0.555 0.478 0.451 0.301 0.456 0.421 0.342 0.354 0.0391 0.601 0.498 0.511 0.421 0.574 0.486 0.425 0.421 0.0195 0.675 0.591 0.582 0.541 0.962 0.501 0.489 0.541 Control
* MIC ** MBC
Table 8. Determination of MIC and MBC values of methanol extraction of Propspis farcta against different bacteria.
Vib
rio
chol
erae
Sal
mon
ella
typh
i
Sal
mon
ella
A
rizo
na
Sh
igel
la
dese
nte
rae
E. c
oli p
olyv
alen
t IV
E. c
oli p
olyv
alen
t II
I
E. c
oli p
olyv
alen
t II
E. c
oli p
olyv
alen
t I
Con
cen
trat
ion
(m
g/m
l)
0.211 0.120 0.004* 0.012 0.010* 0.023** 0.012 0.010** 20.0000 0.341 0.154 0.145 0.015** 0.140 0.022* 0.010 0.021* 10.0000 0.389 0.186 0.240 0.025* 0.140 0.231 0.010 0.104 5.0000 0.390 0.210 0.298 0.140 0.254 0.255 0.015** 0.186 2.5000 0.451 0.254 0.344 0.139 0.366 0.366 0.024* 0.254 1.2500 0.521 0.288 0.397 0.254 0.388 0.421 0.120 0.269 0.6250 0.522 0.310 0.414 0.286 0.452 0.489 0.222 0.351 0.1563 0.532 0.389 0.452 0.354 0.562 0.499 0.362 0.398 0.0781 0.544 0.451 0.472 0.421 0.565 0.502 0.487 0.452 0.0391 0.581 0.480 0.498 0.475 0.564 0.515 0.498 0.486 0.0195 0.581 0.560 0.560 0.501 0.584 0.560 0.560 0.501 Control
*MIC ** MBC
DISCUSSION In this study, bacterial pathogen were found in (24.8%) out of the all the samples, 35(7%) E.coli. I, 8(1.6%) E. coli II, 17(3.4%) E. coli III, 22(4.4%) E. coli IV, 8(1.6%) Shigella dysenteriae, 16(3.2%) Salmonella arizonae, 12(2.4%) Salmonella typhi and 6 (1.2%) Vibrio cholera. These results were agree with Brad et al. 6 who found pathogenic E. coli and Salmonella spp. were (1.81%) each of
them. These results were agree with the result of Behiry et al5 who found that pathogenic E. coli was the most common isolate group. Most biotype of E. coli were highly resistant to amoxicillin (80-90%), amoxicillin / clavulanic acid (85-90%) and ampicillin (81-92%). All isolates of biotype E. coli were sensitive to cephalexine and ciprofloxacin this is similar to which was obtained by Estrada- Garcia et al11, who found all isolates
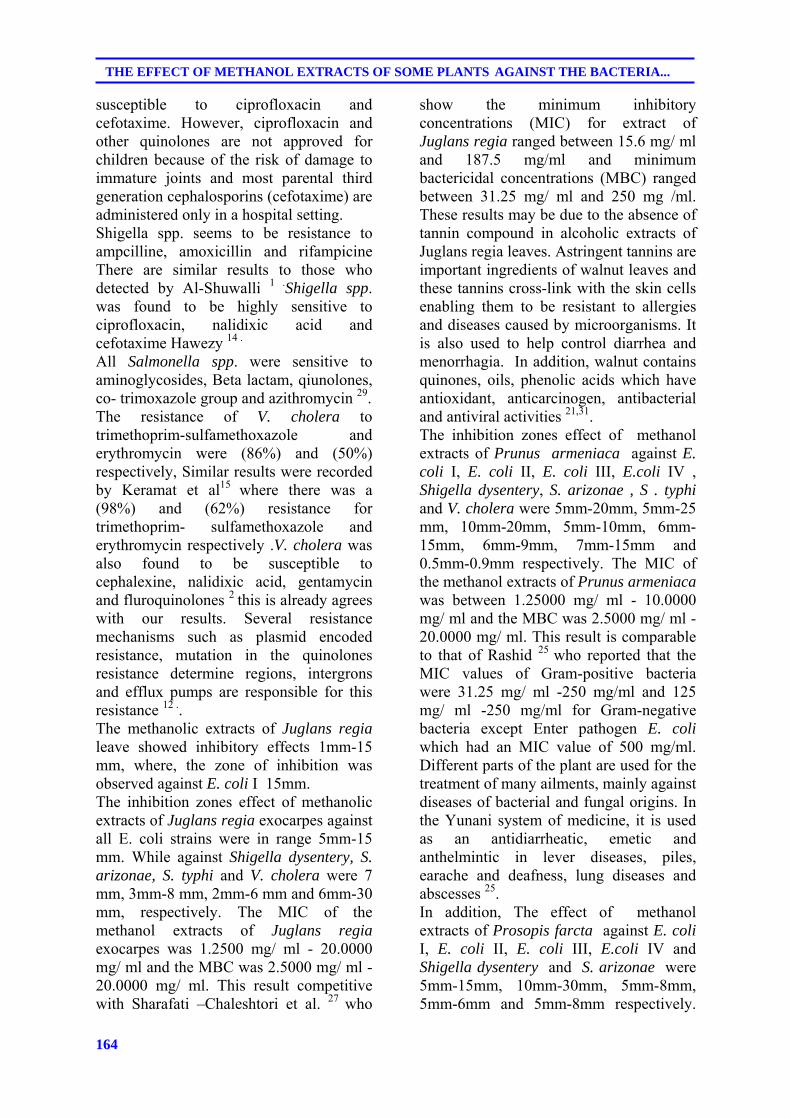
164
THE EFFECT OF METHANOL EXTRACTS OF SOME PLANTS AGAINST THE BACTERIA...
susceptible to ciprofloxacin and cefotaxime. However, ciprofloxacin and other quinolones are not approved for children because of the risk of damage to immature joints and most parental third generation cephalosporins (cefotaxime) are administered only in a hospital setting. Shigella spp. seems to be resistance to ampcilline, amoxicillin and rifampicine There are similar results to those who detected by Al-Shuwalli 1 .Shigella spp. was found to be highly sensitive to ciprofloxacin, nalidixic acid and cefotaxime Hawezy 14 . All Salmonella spp. were sensitive to aminoglycosides, Beta lactam, qiunolones, co- trimoxazole group and azithromycin 29. The resistance of V. cholera to trimethoprim-sulfamethoxazole and erythromycin were (86%) and (50%) respectively, Similar results were recorded by Keramat et al15 where there was a (98%) and (62%) resistance for trimethoprim- sulfamethoxazole and erythromycin respectively .V. cholera was also found to be susceptible to cephalexine, nalidixic acid, gentamycin and fluroquinolones 2 this is already agrees with our results. Several resistance mechanisms such as plasmid encoded resistance, mutation in the quinolones resistance determine regions, intergrons and efflux pumps are responsible for this resistance 12 .. The methanolic extracts of Juglans regia leave showed inhibitory effects 1mm-15 mm, where, the zone of inhibition was observed against E. coli I 15mm. The inhibition zones effect of methanolic extracts of Juglans regia exocarpes against all E. coli strains were in range 5mm-15 mm. While against Shigella dysentery, S. arizonae, S. typhi and V. cholera were 7 mm, 3mm-8 mm, 2mm-6 mm and 6mm-30 mm, respectively. The MIC of the methanol extracts of Juglans regia exocarpes was 1.2500 mg/ ml - 20.0000 mg/ ml and the MBC was 2.5000 mg/ ml -20.0000 mg/ ml. This result competitive with Sharafati –Chaleshtori et al. 27 who
show the minimum inhibitory concentrations (MIC) for extract of Juglans regia ranged between 15.6 mg/ ml and 187.5 mg/ml and minimum bactericidal concentrations (MBC) ranged between 31.25 mg/ ml and 250 mg /ml. These results may be due to the absence of tannin compound in alcoholic extracts of Juglans regia leaves. Astringent tannins are important ingredients of walnut leaves and these tannins cross-link with the skin cells enabling them to be resistant to allergies and diseases caused by microorganisms. It is also used to help control diarrhea and menorrhagia. In addition, walnut contains quinones, oils, phenolic acids which have antioxidant, anticarcinogen, antibacterial and antiviral activities 21,31. The inhibition zones effect of methanol extracts of Prunus armeniaca against E. coli I, E. coli II, E. coli III, E.coli IV , Shigella dysentery, S. arizonae , S . typhi and V. cholera were 5mm-20mm, 5mm-25 mm, 10mm-20mm, 5mm-10mm, 6mm-15mm, 6mm-9mm, 7mm-15mm and 0.5mm-0.9mm respectively. The MIC of the methanol extracts of Prunus armeniaca was between 1.25000 mg/ ml - 10.0000 mg/ ml and the MBC was 2.5000 mg/ ml - 20.0000 mg/ ml. This result is comparable to that of Rashid 25 who reported that the MIC values of Gram-positive bacteria were 31.25 mg/ ml -250 mg/ml and 125 mg/ ml -250 mg/ml for Gram-negative bacteria except Enter pathogen E. coli which had an MIC value of 500 mg/ml. Different parts of the plant are used for the treatment of many ailments, mainly against diseases of bacterial and fungal origins. In the Yunani system of medicine, it is used as an antidiarrheatic, emetic and anthelmintic in lever diseases, piles, earache and deafness, lung diseases and abscesses 25. In addition, The effect of methanol extracts of Prosopis farcta against E. coli I, E. coli II, E. coli III, E.coli IV and Shigella dysentery and S. arizonae were 5mm-15mm, 10mm-30mm, 5mm-8mm, 5mm-6mm and 5mm-8mm respectively.
165
Duhok Medical Journal Volume 6, Supplement 3, 2012
There are no effects of the extraction against S. arizonae, S. typhi and V. cholera. The MIC of the methanol extracts of Prosopis farcta was between 1.2500 mg/ ml - 20.0000 mg / ml and the MBC was 2.5000 mg/ ml-20.0000 mg/ ml. This result is comparable to that of Mahasneh et al. 17 who reported that the inhibition zone of E. coli was between (7-12) mm. Darwish 9 reported the MIC and MBC values of extracts of Prosopis farcta against S. flexneri was 100 mg/ml. Mahasneh et al. 17 reported petroleum , ether, methanol, Hexane, butanol and aqueous crude extracts of the whole aerial parts of Prosopis farcta and others exhibited variable degrees of antimicrobial activity against E. coli , Streptococcus spp. and Acinetobacter spp. bacterial and two fungal species compared with that exerted by antibiotics. CONCLUSIONS The isolated revealed high resistance to most widely used antibiotic, the extraction of the medical plant showed high potential an antibacterial agent. REFERENCES:
1. Al- Shawalli NAA. Study the effect of some disinfectants and antiseptics on some species of Salmonella and Shigella isolated from diarrhea states. M.Sc. Thesis, College of Science, Al-Mustansiryia University; 2004.
2. Amin V, Patwari AK, Kumar G, Anand VK, Diwan N, Peshin S.Clinical profile of cholera in young children--a hospital based report.Indian Pediatr. 1995;32(7):755-61.
3. Bansod S, Rai M. Antifungal activity of essential oils from Indian medicinal plants against human pathogenic Aspergillus fumigatus and A. niger. World J Med Sci. 2008; 3(2):81-8.
4. Baron EJ, Finegold SM, Peterson ILR.Bailey and Scott،s Diagnostic Microbiology. 9th ed. Mosby Company. Missouri;2007.
5. Behiry IK, Abada EA, Ahmed EA, Labeeb RS. Enteropathogenic Escherichia coli Associated with Diarrhea in Children in Cairo, Egypt. Scientific World Journal. 2001;11: 2613–9.
6. Brad GF, Sabau I, Simedrea I, Belei O, Marcovici T, Popoiu C. Pseudomonas areuginosa and antibiotic- associated diarrhea in children. TMJ .2011;61(1): 237-42.
7. Cowan. Plant products as antimicrobial agents. Am. Soc. Microbiol. 1999;12(4): 546-82.
8. Dar MS; Ikram M, Fakouh T. Pharmacology of Quercus infectoria. J Pharmacol Soc.1976; 65: 1791-4.
9. Darwish S H. The antibacterial effect of fruit extracts of Rhus cariaria, Prosopis faracta and Punica grantum plants on three pathogenic bacteria. M.Sc. Thesis, College of Science, University of Mosul;1993.
10. Duke JA. Green Pharmacy. Jarir Book.3rd ed. Kingdom of Saudi Arabia;2007.
11. Estrada-Garcia T, Cerbna JF, Paheco-Gil L, Velazquez RF, Ochoa TJ, Torres J, et al. Drug resistant Diarrheogenic E. coli, Mexico. Emergence infectious diseases. Centers for Disease Control and Prevention , Atlanta, USA.2005; 11 (8):1-3.
12. Faruque SM, Nair GB. Vibrio cholera: Genomics and molecular Biology book. Daka- 1212, Bangladesh and National institute of cholera and enteric disease;2008.
13. Harborne JB, Marbray TJ, Marbary H. Physiology and function of flavonoids. Academic Press, New York;1975.
166
THE EFFECT OF METHANOL EXTRACTS OF SOME PLANTS AGAINST THE BACTERIA...
14. Hawezy AA. The causes of diarrhea among chidren in Erbil district. M.Sc. Thesis, College of Medicine , University of Duhok.;2000.
15. Keramat F, Hashemi SH, Mamani M, Ranjbar M, Erfan H. Survey of antibiogram tests in cholera patients in the 2005 epidemic in Hamadan, Islamic Republic of Iran. East Mediterr HLth J.2008; 14(4):768-75.
16. Khashayar A. Alternative Medicine: Apricot. MD. Tehran© pressTV;2008.
17. Mahasneh AM, Abbas JA, El-Oqlah AA. Antimicrobial Activity of Extracts of Herbal Plants used in the Traditional Medicine of Bahrain. Phytotherapy Research.1996; 10: 251-3.
18. National Committee for Clinical Laboratory Standards. Methods for dilution antimicrobial Susceptibility tests for bacteria that grow aerobically; Approved Standard M7-A5, 5th ed. NCCLS, Pennsylvania;2000.
19. Nelson EW, Berhman ER, Kligman MR, Arvin L. Textbook of pediatrics, vol. (1) 15th. W.B. Saunders Company, USA;1996.
20. Nelson EW, Berhman ER, Kligman MR,Jenson. Nelson Textbook of Paediatrics. 15th ed. Vol.1. W.B. Saunders, USA;2004.p. 935-1123.
21. Noumi1E, Snoussi M, Trabelsi N, Hajlaoui1 H, Ksouri R, Valentin E et al. Antibacterial, anticandidal and antioxidant activities of Salvadora persica and Juglans regia L. extracts. Journal of Medicinal Plants Research .2011; 5(17): 4138-46.
22. OlaleyeMTT. Cytotoxicity and antibacterial activity of methodic extract of Hibiscus sabdariffia. Journal of Medicinal Plant.2007; 1:9-13.
23. Onyeagba RA, Ugbogu OC, Cokeke CU, Iroakasi O. Studies on the antimicrobial effects of garlic (Allium sativum Linn), ginger (Zingiber officinale Roscoe) and Lime (Citrus aurantifolia Linn).African Journal of Biotechnology. 2004;3(10):552-4.
24. Parmar C, Kaushal MK. Prunus armeniaca Linn. Wild fruits. Kalyani publishers, New Delhi, India;1982.
25. Rashid F, AhmedR, Mahmood A, Ajmed Z, Bibi N, Kazmi SU. Flavonoids glycosides from Prunus armeniaca and the antibacterial activity of a crude extract. Arch Phar Res. 2007;30(8):932-7.
26. Ruohonen P. Other strains of E.coli, E.coli outbreak. Pritzker Law Firm;2008.
27. Sharafati –Chaleshtori R, Sharafati –Chaleshtori F, Rafieian M. Biological characterization of Iranian walnut (Juglans regia) leaves. Turk J Biol .2011; 35 : 635-9
28. Sibanda T, Okoh AI. In vitro evaluation of the interactions between acetone extracts of Garcinia kola seeds and some antibiotics. African Journal of Biotechnology.2008;7 (11):1672-8.
29. Stok N,Wiedemann B. Natural antibiotic susceptibility of Salmonella enteric strains. Int J Antimicrob Agents.2000; 16 (3):211-7.
30. Sureshbabui J. Shigella infection. Honchoed principles of the health of the net foundation. Web MD;2006.
31. Taha N, Al-wadaan M A. Utility and importance of walnut, Juglans regia Linn: A review. African Journal of Microbiology Research .2011; 5(32) : 5796-805.
32. Todar K. Salmonella and Salmonellosis, University of Wisconsin-Madison, Dept.

167
Duhok Medical Journal Volume 6, Supplement 3, 2012
Bacteriol. Todar's online textbook of Bacteriology;2005.
33. Wikipedia (2008). Cholera, Wikipedia foundation, Inc. http://en.wikipedia.org/org/cholera.
34. Wyllie R. Major symptoms and signs of digestive tract disorders. In
Behrman, R. E.; Kliegman, R M. Jenson H B. Nelson text book of paediatrics, 17th ed. Saunders;2004.
168
THE EFFECT OF METHANOL EXTRACTS OF SOME PLANTS AGAINST THE BACTERIA...
ón‚íq@@@@
a†bØìŠaŒ@Äbä†@çó؆@a‡îóq@Žôäìíš@ÛŒ@íØ@oŽïî@bîØói@õˆ†@aŠbiìŠa†ì@ÛòììŠ@Ûò‡åè@bî@Ž¶íäbrïà@bîón‚íq@bÄb÷@bîŠóîŠbØN@@@@
@æîíi@Žôäìíš@ÛŒ@•ím@oŽïî@b’í‚óä@çaì@ˆ@ç‹ÙàíØ@ómbè@bÙï›i@Žôî@ômbïq@oŽïäí¹@†ó@åŽïqIa†@ŽôïÜb@ëò†@Žôîˆ@æi†@oŽïÙï›iì@ÛìŠaŒ@Hä@óåïmbè@íØ@oŽïî@aŠa†b÷@bÅîóè@ˆ@Žõ‹ŽïÜìóè@Žõ‹ŽîˆbjÜ@ Žôäìíi@Úï›iì@bØìŠaŒ@bäb‚ónó‚@ß@ç‡äbÅ2007@@bÅîóè@bmóè9@@bî2007@@oŽïäí¹@Äó÷
ŽôåïåÙ“q@íi@a†bïubïu@oŽî‡äóÄbä@Äbä†@ç‡äbš@óåmbè@ômbïqN@@@lì@ð÷bïáïØ@oŽïÙŽïÜŠbØ@Lçaì@bïuíÜíЊíà@Ší @ß@μbïä@óåmbè@ç‹ØŠò†óÄ@óåïmbè@oŽïîbîØói@ìó÷@Žôàónï@bäbåï÷ŠbØIAPI 20 E@H35@
@çaì@ˆI7@@HEE. Coli@@ŽõŠíu@ˆI@@L8@@çaì@ˆI1.6@@HEE. Coli@@ŽõŠíu@ˆII@@L17@@çaì@ˆI3@@ì4@@HEE. Coli@@ŽõŠíu@ˆIII@@L22@@ˆ@íÙäb÷@çaìI4.4@@HEE. Coli@@ ŽõŠíu@ˆIV@@L8@@çaì@ˆI1.6@@HE@íØ@çíi@Šbî†Shigell adysenteriae@@L16@@çaì@ˆI3.2@@HE
Salmonella Arizonae@@L12@@çaì@ˆI2.4@@HESalmonella Typhi@@ì6@@íÙäb÷@ôîbà@oŽïîI1.2@@HE@íØ@çìíiŠbî†Vibrio
Cholera@çìíiN@@@LμÝïïjàc@ LμÝïïØíàc@ L‡ïc@ ÚïäýíÄþØ@ L@ μÝïïØíàa@ ŠójàaŠói@ ìíióè@ ‡åÝi@ bØóî‹ Šói@ íØ@ ç‹ØŠbî†@ ŽôîŠa‡nóè@ oŽïåïåÙ“q
Lμîbàì‹rîŠc@ LμÙïÑï@@ì@ LßìŒbØírïàbÑÝ@ L@ æî‹iírﺋm@ LμÝÙîbaïm@ Lμîbàíni@ LμïjàbÑîŠ@ LμnäaŠíïÐìïäμîbàa‹iím@N@@
@Lμîbàbnåïu@LμÝÙîb@ðØì†@L‡ïc@oïÙî‡ïÜbä@çbäbàŠò†@çbÄ@íi@çŠa†@oóè@íØ@çìíiŠbî†@ç‹ØŠò†óÄ@óåïmbè@oŽïîbîØói@õq@aŠbiÝïÑàaŠíÝØ@LμÙÜbÑï@LâïØbmíÑïμîbÙïàcì@LçíÙï@NμbØíÝÐìjï@íi@çìíi@Ša†@oóè@†@ç‹ØŠò†óÄ@óåïmbè@oŽïîbîØói@ôàóè@N
@bÙÑïäŠí‚@bî@Ž¶íäbrïà@bîón‚íq@bÄb÷@bî@õ‡äbÙ’a†@bî‹š@æîàäProunus Armeniaca@@aŠójÄbä†1.25000@–@10.000@âÍÝàO@Þà@aŠójÄbä†@ÛòˆíØ@bî‹š@æîàä@ì2.5000@–@20.4000@âÍÝàOÞàN@@a‰á“à@bî@õ‡äbÙ’a†@bî‹š@æîàä@bq@ Ž¶óiProsupis Farcta@
@aŠójÄbä†1.2500@–@20.0000@âÍÝàO@aŠójÄbä†@õì@bî@ÛòˆíØ@bî‹š@æîàäì@Þà2.5000@–@20.000@âÍÝàO@æîàä@ò‡äóš@Šóè@LÞà@íØ@ìíiŠbî†@aï @oŽïÜói@bî@õ‡äbÙ’a†@bî‹š2.5000@–@20.000@@âÍÝàOíØ@bî‹š@æîàä@ì@Þà@ Žõì@bî@Ûòˆ5.0000@–@20.0000@
âÍÝàO@ Žõï @ ŽôÝÙÑïm@bÄb÷@bî@õ‡äbÙ’a†@bî‹š@æîàä@ì@LÞà1.2500@–@20.0000@âÍÝàO@båîójÄbä†@ Žõì@bî@ÛòˆíØ@bî‹š@æîàä@ì@Þà2.5000@–@20.0000@âÍÝàOÞà@N@@
169
Duhok Medical Journal Volume 6, Supplement 3, 2012
ó–þ©a@ @@@
@Ëaíäa@‡š@óïÜíäbrï¾a@óïmbjåÜa@pb—݃n¾a@ÉjÜ@@Âjr¾a@qbnÜa@óaŠ†n¬bîÙjÜa@æà@óÑÝ@@ßbéþÜ@ójj¾a@ßbÑ ýa@õ‡Ü@@
@@
@Ê»@500@@êåïÈßbÑ a@xì‹‚@@ßbéýa@æà@çíäbÉî@I@ßbÑ a‹áÉÜa@æà@ò‹’bÉÜa@æ@çì†@ßbÑ aì@ò†ýíÜa@ðrî‡y@H@ôÑ“n¾@μÉua‹¾aì@Šaˆa@òÑÝÜ@ÞïiŠa@óÅÐb«@À@ò†ýíÜaì@ßbÑ ýa2007@@ßíÝîa@¶a2007@@Ng@ì@óÑÝn¬@óïÈŠŒ@Ãbìc@ôÝÈ@xˆbáåÜa@oÈŠŒôÝÈ@a†bánÈ@@pbÑ—Üa
óïÈŠ¾a@@ßa@ãbÅä@ãa‡ƒngì@@óîíïyíáïÙÜa@pþÈbÑnÜa@ì@óïÝÙ“Üa@LAPI 20E@@˜ïƒ“m@35@@I7@HEE. coli. I@@L8@@I1.6@HEE.
coli II@@[email protected]@HEE. coli III@@[email protected]@@@HEE. coli IV@@L8@@@@@@I1.6@@HEShigella dysenteriae@@@[email protected]@@@HE Salmonella arizonae@@L12@@I2.4@@@HESalmonella typhi @@L6@@I1.2@HE Vibrio cholera @@N@@
a@Êï»@p‹éÄaμÝØíàýa@óïmbï¨a@pa†b›à@æà@ÞÙÜ@óïÜbÈ@óàìbÕà@óaŠ‡Üa@‡ïÔ@óînÙjÜa@pýÉÜO@L@μÝØíàýa@L@@@ÚäýíïÐþØ@àby@ âîrº‹m@ L@ μÝÙîbam@ Lμîbàíïi@ LμjàbÑîŠ@ L@ âïØbÑï@ L@ μîbàì‹qŠýa@ L@ μåÜíÐìåÜa@ L@ μÝjàýa–@@ßìŒbrïàíÑÝ
‹éÄa@ μy@ À@ L@ μîbàì‹iínÜaì@L@ μÝÙîbïØíî†@ L@ Ú؇ÜbåÜa@ àby@ óïmbï¨a@ pa†b›à@ æà@ ÞÙÜ@ óïÜbÈ@ óïby@ pýÉÜa@ kÝÌa@ p@†b›¾@óby@óaŠ‡Üa@‡ïÔ@óînÙjÜa@pýÉÜa@Êï»@oäbØì@L@âïÙÜbÑïÜaì@âïÙmbÑïÜa@L@ßíÙåÐbàìŠíÝÙÜa@L@μbÙïàýa@L@μïàbnå§a
μbØíÝÐìÜa@N@@
@@bïä‡Üa@ójr¾a@ïØaÜa@p†‡y(MIC)@@@bïä‡Üa@óÝmbÕÜaïØaÜaì(MBC)@@@@pbmbjä@ÊiŠý@ÂïjrnÜa@Ö båàì@I@L@Œí§a@ò‹“Ô@L@Œí§a@×aŠìa@ ”ᓾaì@ líä‹©a@ H@ @ pýÈ@ ôÝÈE.coli I@ @ LE.coli II@ LE.coli [email protected] IV@@ LShigella dysenteriae@@L
Salmonella arizonae@@ @ LSalmonella typhi@ @@ ìVibrio cholerae@ @ NØì@˜ÝƒnáÝÜ@ôä†ýa@Âjr¾aïØÜa@ óáïÔ@oäb@μi@ìaî@líä‹©a@pbjåÜ@ðÜíäbrï¾a10.00001.25000-@@âÍÝàO @μi@ìaî@çbØ@@ôä†ýa@ÞmbÕÜa@Âjr¾aïØÜa@bàa@L@Þà2.5000@@M@
20.0000 @@@âÍÝà@O@ìaî@”ᓾa@pbjåÜ@ðÜíäbrï¾a@˜ÝƒnáÝÜ@ôä†ýa@Âjr¾a@ïØÜa@@çbØ@μy@À@L@Þà@μ[email protected]@@âÍÝàO@μi@ìaî@ôä†ýa@ÞmbÕÜa@Âjr¾a@ïØÜaì@Þà[email protected]@@âÍÝà@O@˜Ýƒn¾@ðÜíäbrï¾a@˜ÝƒnáÝÜ@ójåÜbi@bàa@L@Þà
@μi@ìaî@êÜ@ôä†ýa@Âjr¾a@ïØÜa@çbØ@‡ÕÐ@Œí§a@×aŠìa2.5000M20.0000@âÍÝàO@ôä†ýa@ÞmbÕÜa@ïØÜaì@Þà[email protected]@@âÍÝà@O@æà@Œí§a@ë‹“ÕÜ@@ðÜíäbrï¾a@˜ÝƒnáÝÜ@bïä‡Üa@ójr¾a@ïØÜa@p‹éÄaì@L@@Þà1.2500@@¶a20.0000@@âÍÝà@O@ÞmbÕÜa@ïØÜaì@Þà
@μi@ìaî@êÜ@ôä†ý[email protected]@@âÍÝàO@ÞàN@@
170
A CYTOPATHOLOGICAL STUDY OF THE EFFECT OF SMOKING ON THE….
A CYTOPATHOLOGICAL STUDY OF THE EFFECT OF SMOKING ON THE ORAL EPITHELIAL CELLS IN RELATION TO ORAL HEALTH STATUS BY THE
MICRONUCLEUS ASSAY
SAEED H. SAEED, BDS, MSc
WASEN H. YOUNIS, BDS, MSc, PhD Submitted 14 Jul 2012; accepted 16 Sep 2012 ABSTRACT Background: Micronucleus is a cytoplasmic fragment of DNA reported as a biomarker of cancer. It is a cytoplasmic chromatin mass formed in the basal cells layer of the epithelium. These fragments can form their own membrane. The aims of the study was to detect the micronuclei expression in the oral epithelial cells in cytopathological smears of the non-smokers’ and the smokers’ males, correlate the micronuclei expression in the oral epithelial cells with the oral health status variables, and evaluate the efficacy of the micronuclei assay to detect the subjects at high risk of oral mutations. Methods: This study was conducted on 75 males of (35- 40) years of age divided into 25 heavy smokers, 25 light smokers, and 25 non-smokers. A cytobrush was used to obtain the smears. The oral health status was evaluated by using the plaque, gingival, calculus indices in addition to the amalgam and composite restorations. Results: There was a statistically significant difference in the micronuclei expression among the three groups. There was a strong correlation between the oral health status variables and the micronuclei expression in the non- smokers' group, for the Plaque index with (P-value =0.0005) and for the calculus index (P-value = 0.04). The smokers' group had a strong correlation with the amalgam restorations with (P-value =0.0005). Conclusion: The micronucleus assay detected by Pap stain is a useful biomarker to detect the people at high risk of oral mutations due to the harmful effect of the smoking, the calculus and plaque indices, in addition to the amalgam restorations. Duhok Med J 2012;6 Suppl 3:170-177. Key words: Cytopathology, micronucleus assay, smoking effects.
he oral epithelial cells represent the preferred target site for the early
genotoxic events induced by different types of agents entering the oral cavity 1. The smoking is a complex mixture of different type substances that are with a genotoxic and a carcinogenic effect on the oral epithelial cells. These substances lead to the DNA damage and the nuclear anomalies formation. One of these a nuclear anomaly is the micronuclei formation 2. Micronucleus is a cytoplasmic fragment of DNA reported as a biomarker of mutagenesis. It is a cytoplasmic chromatin masses that can form its own membrane. The micronuclei are formed in the basal cells layer. The micronucleus assay is used to detect the subjects at high risk of malignant transformations in their oral
epithelial cells 3. It has been extensively used to evaluate the extent of chromosomal damage in the human population exposed to the genotoxic agents in various occupational settings, in the environment, or as a consequence of the life style 4. The micronuclei test is gaining an increased attention among researchers and laboratories in the field of environmental mutagenesis, and a number of published studies based on this biomarker are increasing rapidly 5. Oral cytopathology is a simple technique that is non-aggressive, relatively painless, and readily accepted by the patient. It is used to obtain cells from the oral epithelium. It is the art and science of interpretation of the cells obtained from the oral cavity. The oral epithelial cells
* M.Sc. Student, Ministry of Heath ** Professor, Chairman of Oral Diagnosis Department, College of Dentistry, University of Baghdad. Correspondence author: Wasen H. Younis Email: [email protected]
T
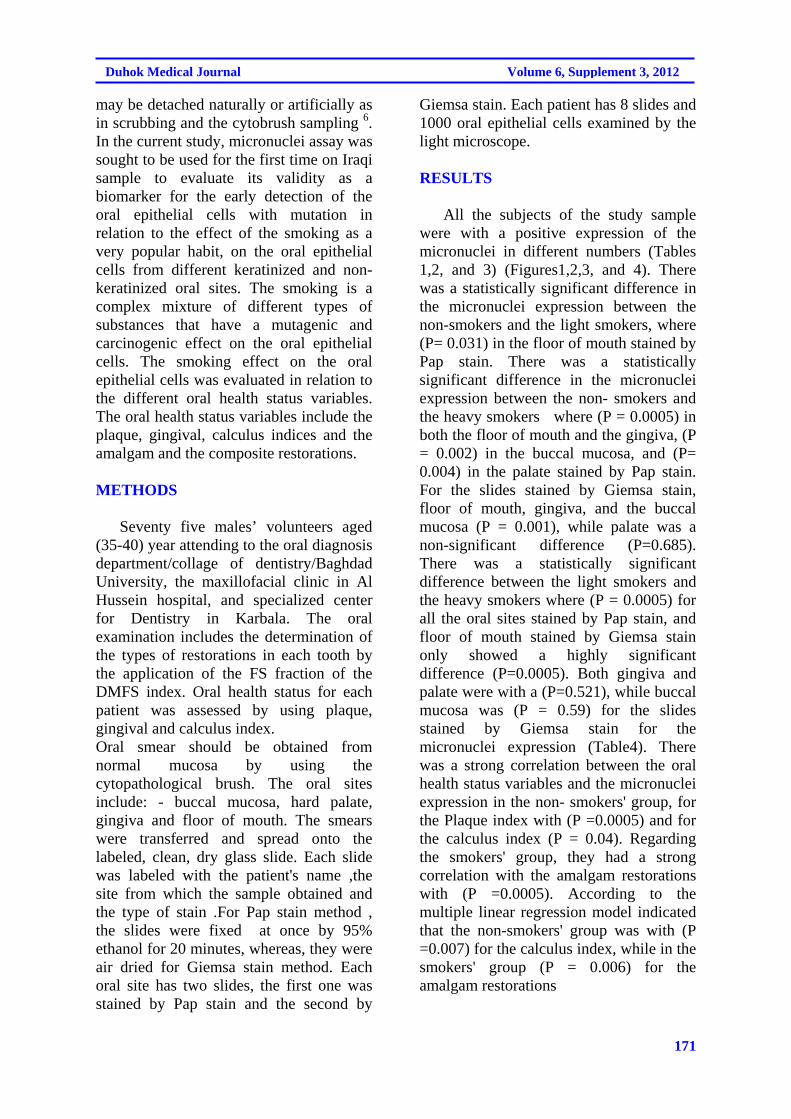
171
Duhok Medical Journal Volume 6, Supplement 3, 2012
may be detached naturally or artificially as in scrubbing and the cytobrush sampling 6. In the current study, micronuclei assay was sought to be used for the first time on Iraqi sample to evaluate its validity as a biomarker for the early detection of the oral epithelial cells with mutation in relation to the effect of the smoking as a very popular habit, on the oral epithelial cells from different keratinized and non-keratinized oral sites. The smoking is a complex mixture of different types of substances that have a mutagenic and carcinogenic effect on the oral epithelial cells. The smoking effect on the oral epithelial cells was evaluated in relation to the different oral health status variables. The oral health status variables include the plaque, gingival, calculus indices and the amalgam and the composite restorations.
METHODS Seventy five males’ volunteers aged (35-40) year attending to the oral diagnosis department/collage of dentistry/Baghdad University, the maxillofacial clinic in Al Hussein hospital, and specialized center for Dentistry in Karbala. The oral examination includes the determination of the types of restorations in each tooth by the application of the FS fraction of the DMFS index. Oral health status for each patient was assessed by using plaque, gingival and calculus index. Oral smear should be obtained from normal mucosa by using the cytopathological brush. The oral sites include: - buccal mucosa, hard palate, gingiva and floor of mouth. The smears were transferred and spread onto the labeled, clean, dry glass slide. Each slide was labeled with the patient's name ,the site from which the sample obtained and the type of stain .For Pap stain method , the slides were fixed at once by 95% ethanol for 20 minutes, whereas, they were air dried for Giemsa stain method. Each oral site has two slides, the first one was stained by Pap stain and the second by
Giemsa stain. Each patient has 8 slides and 1000 oral epithelial cells examined by the light microscope. RESULTS All the subjects of the study sample were with a positive expression of the micronuclei in different numbers (Tables 1,2, and 3) (Figures1,2,3, and 4). There was a statistically significant difference in the micronuclei expression between the non-smokers and the light smokers, where (P= 0.031) in the floor of mouth stained by Pap stain. There was a statistically significant difference in the micronuclei expression between the non- smokers and the heavy smokers where (P = 0.0005) in both the floor of mouth and the gingiva, (P = 0.002) in the buccal mucosa, and (P= 0.004) in the palate stained by Pap stain. For the slides stained by Giemsa stain, floor of mouth, gingiva, and the buccal mucosa (P = 0.001), while palate was a non-significant difference (P=0.685). There was a statistically significant difference between the light smokers and the heavy smokers where (P = 0.0005) for all the oral sites stained by Pap stain, and floor of mouth stained by Giemsa stain only showed a highly significant difference (P=0.0005). Both gingiva and palate were with a (P=0.521), while buccal mucosa was (P = 0.59) for the slides stained by Giemsa stain for the micronuclei expression (Table4). There was a strong correlation between the oral health status variables and the micronuclei expression in the non- smokers' group, for the Plaque index with (P =0.0005) and for the calculus index (P = 0.04). Regarding the smokers' group, they had a strong correlation with the amalgam restorations with (P =0.0005). According to the multiple linear regression model indicated that the non-smokers' group was with (P =0.007) for the calculus index, while in the smokers' group (P = 0.006) for the amalgam restorations
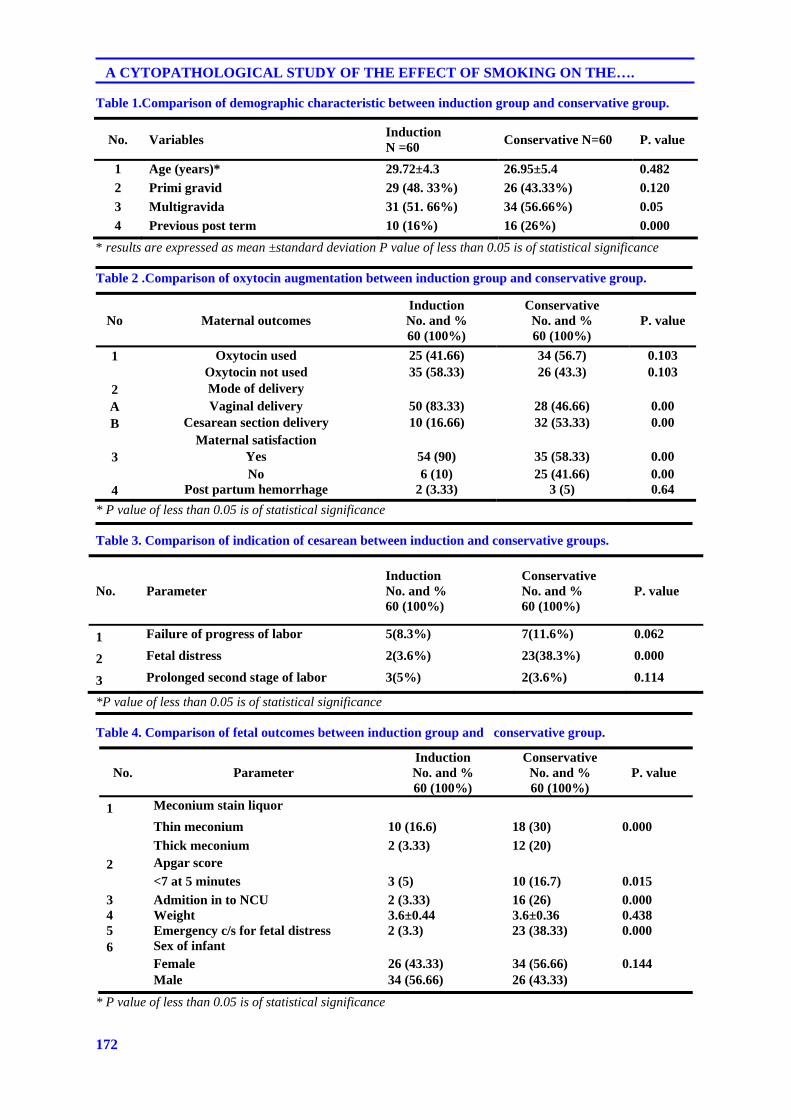
172
A CYTOPATHOLOGICAL STUDY OF THE EFFECT OF SMOKING ON THE….
Table 1.Comparison of demographic characteristic between induction group and conservative group.
No. Variables Induction N =60
Conservative N=60 P. value
1 Age (years)* 29.72±4.3 26.95±5.4 0.482
2 Primi gravid 29 (48. 33%) 26 (43.33%) 0.120
3 Multigravida 31 (51. 66%) 34 (56.66%) 0.05
4 Previous post term 10 (16%) 16 (26%) 0.000
* results are expressed as mean ±standard deviation P value of less than 0.05 is of statistical significance Table 2 .Comparison of oxytocin augmentation between induction group and conservative group.
No Maternal outcomes Induction No. and % 60 (100%)
Conservative No. and % 60 (100%)
P. value
1 Oxytocin used 25 (41.66) 34 (56.7) 0.103 Oxytocin not used 35 (58.33) 26 (43.3) 0.103 2 Mode of delivery A Vaginal delivery 50 (83.33) 28 (46.66) 0.00 B Cesarean section delivery 10 (16.66) 32 (53.33) 0.00
3 Maternal satisfaction
Yes 54 (90) 35 (58.33) 0.00 No 6 (10) 25 (41.66) 0.00
4 Post partum hemorrhage 2 (3.33) 3 (5) 0.64
* P value of less than 0.05 is of statistical significance Table 3. Comparison of indication of cesarean between induction and conservative groups.
No. Parameter Induction No. and % 60 (100%)
Conservative No. and % 60 (100%)
P. value
1 Failure of progress of labor 5(8.3%) 7(11.6%) 0.062
2 Fetal distress 2(3.6%) 23(38.3%) 0.000
3 Prolonged second stage of labor 3(5%) 2(3.6%) 0.114
*P value of less than 0.05 is of statistical significance Table 4. Comparison of fetal outcomes between induction group and conservative group.
No. Parameter Induction No. and % 60 (100%)
Conservative No. and % 60 (100%)
P. value
1 Meconium stain liquor
Thin meconium 10 (16.6) 18 (30) 0.000
Thick meconium 2 (3.33) 12 (20)
2 Apgar score
<7 at 5 minutes 3 (5) 10 (16.7) 0.015
3 Admition in to NCU 2 (3.33) 16 (26) 0.000 4 Weight 3.6±0.44 3.6±0.36 0.438 5 Emergency c/s for fetal distress 2 (3.3) 23 (38.33) 0.000 6 Sex of infant Female 26 (43.33) 34 (56.66) 0.144 Male 34 (56.66) 26 (43.33)
* P value of less than 0.05 is of statistical significance
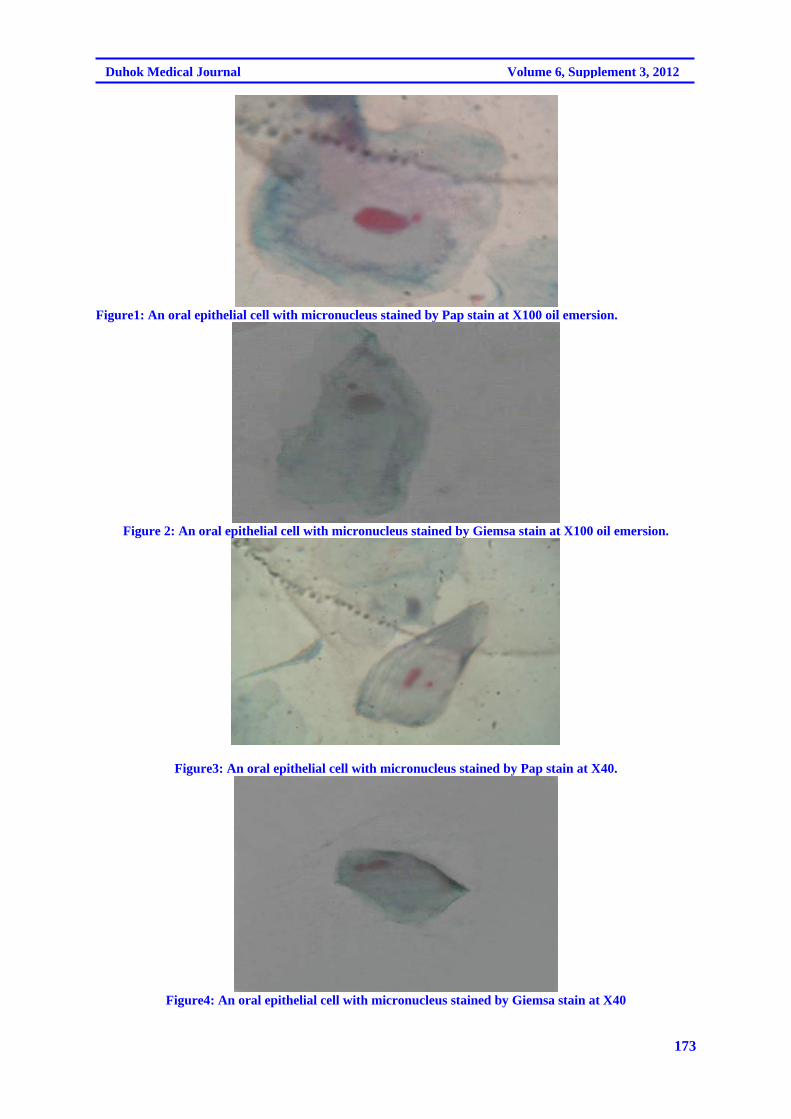
173
Duhok Medical Journal Volume 6, Supplement 3, 2012
Figure1: An oral epithelial cell with micronucleus stained by Pap stain at X100 oil emersion.
Figure 2: An oral epithelial cell with micronucleus stained by Giemsa stain at X100 oil emersion.
Figure3: An oral epithelial cell with micronucleus stained by Pap stain at X40.
Figure4: An oral epithelial cell with micronucleus stained by Giemsa stain at X40
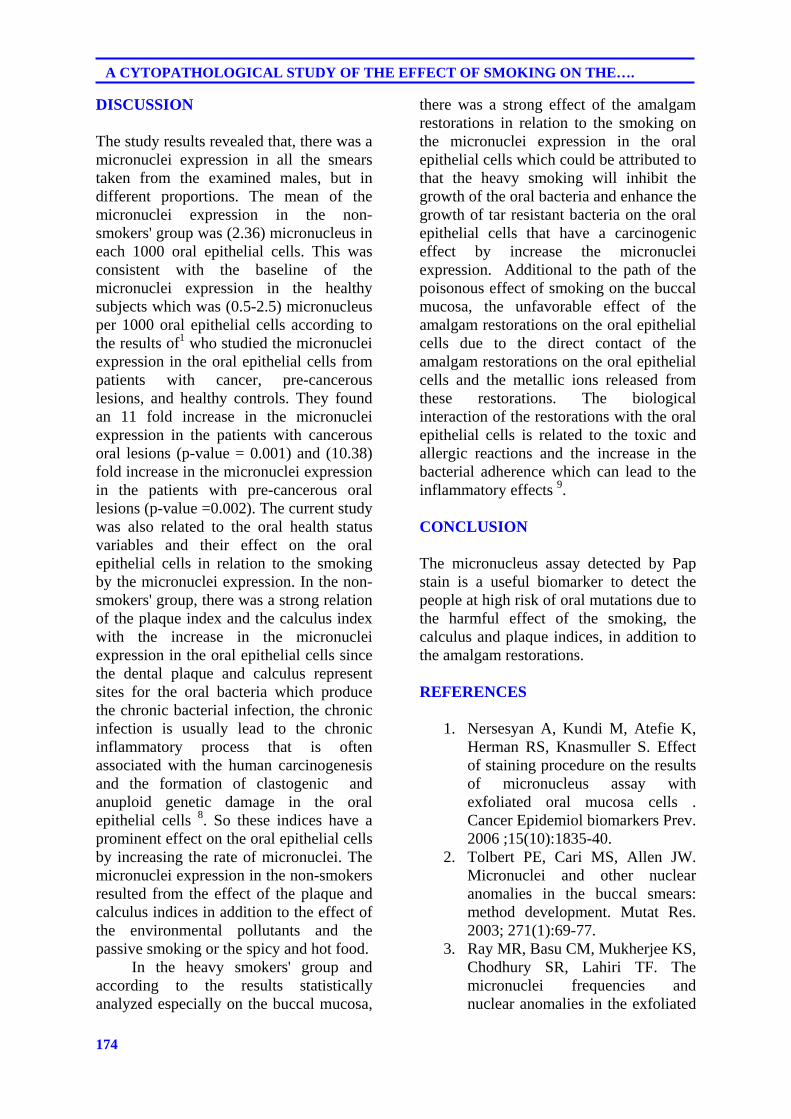
174
A CYTOPATHOLOGICAL STUDY OF THE EFFECT OF SMOKING ON THE….
DISCUSSION The study results revealed that, there was a micronuclei expression in all the smears taken from the examined males, but in different proportions. The mean of the micronuclei expression in the non-smokers' group was (2.36) micronucleus in each 1000 oral epithelial cells. This was consistent with the baseline of the micronuclei expression in the healthy subjects which was (0.5-2.5) micronucleus per 1000 oral epithelial cells according to the results of1 who studied the micronuclei expression in the oral epithelial cells from patients with cancer, pre-cancerous lesions, and healthy controls. They found an 11 fold increase in the micronuclei expression in the patients with cancerous oral lesions (p-value = 0.001) and (10.38) fold increase in the micronuclei expression in the patients with pre-cancerous oral lesions (p-value =0.002). The current study was also related to the oral health status variables and their effect on the oral epithelial cells in relation to the smoking by the micronuclei expression. In the non- smokers' group, there was a strong relation of the plaque index and the calculus index with the increase in the micronuclei expression in the oral epithelial cells since the dental plaque and calculus represent sites for the oral bacteria which produce the chronic bacterial infection, the chronic infection is usually lead to the chronic inflammatory process that is often associated with the human carcinogenesis and the formation of clastogenic and anuploid genetic damage in the oral epithelial cells 8. So these indices have a prominent effect on the oral epithelial cells by increasing the rate of micronuclei. The micronuclei expression in the non-smokers resulted from the effect of the plaque and calculus indices in addition to the effect of the environmental pollutants and the passive smoking or the spicy and hot food. In the heavy smokers' group and according to the results statistically analyzed especially on the buccal mucosa,
there was a strong effect of the amalgam restorations in relation to the smoking on the micronuclei expression in the oral epithelial cells which could be attributed to that the heavy smoking will inhibit the growth of the oral bacteria and enhance the growth of tar resistant bacteria on the oral epithelial cells that have a carcinogenic effect by increase the micronuclei expression. Additional to the path of the poisonous effect of smoking on the buccal mucosa, the unfavorable effect of the amalgam restorations on the oral epithelial cells due to the direct contact of the amalgam restorations on the oral epithelial cells and the metallic ions released from these restorations. The biological interaction of the restorations with the oral epithelial cells is related to the toxic and allergic reactions and the increase in the bacterial adherence which can lead to the inflammatory effects 9. CONCLUSION
The micronucleus assay detected by Pap stain is a useful biomarker to detect the people at high risk of oral mutations due to the harmful effect of the smoking, the calculus and plaque indices, in addition to the amalgam restorations. REFERENCES
1. Nersesyan A, Kundi M, Atefie K,
Herman RS, Knasmuller S. Effect of staining procedure on the results of micronucleus assay with exfoliated oral mucosa cells . Cancer Epidemiol biomarkers Prev. 2006 ;15(10):1835-40.
2. Tolbert PE, Cari MS, Allen JW. Micronuclei and other nuclear anomalies in the buccal smears: method development. Mutat Res. 2003; 271(1):69-77.
3. Ray MR, Basu CM, Mukherjee KS, Chodhury SR, Lahiri TF. The micronuclei frequencies and nuclear anomalies in the exfoliated
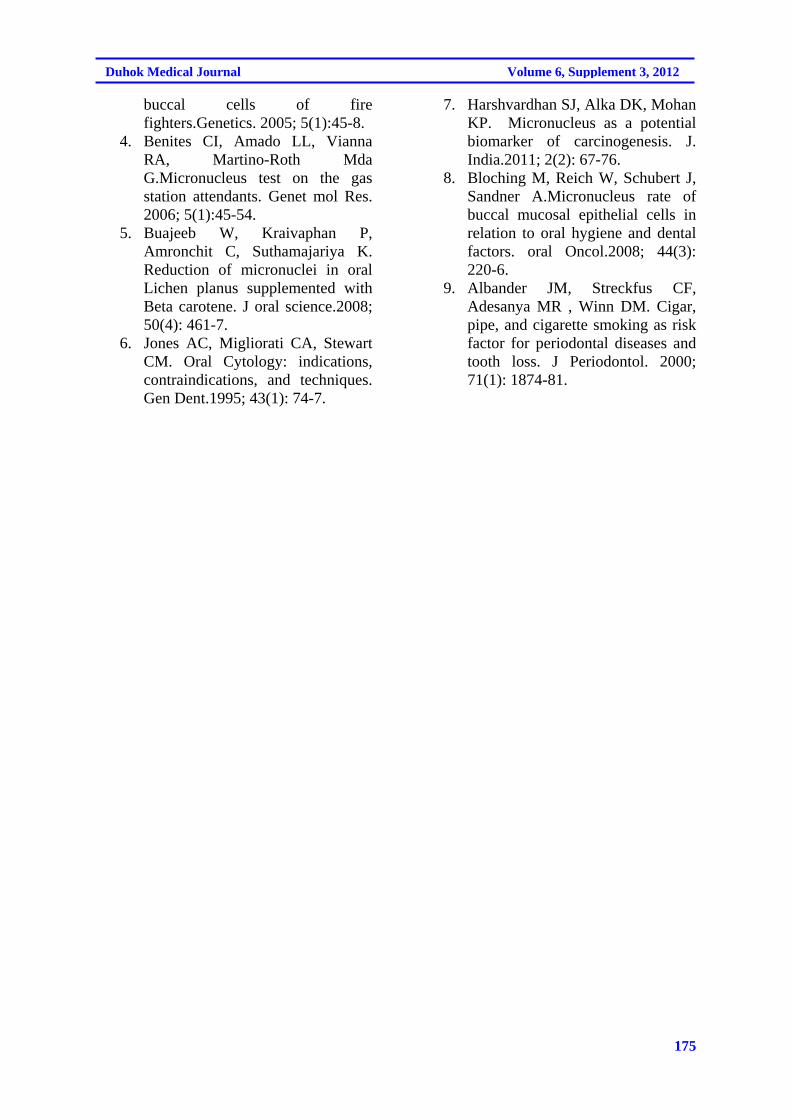
175
Duhok Medical Journal Volume 6, Supplement 3, 2012
buccal cells of fire fighters.Genetics. 2005; 5(1):45-8.
4. Benites CI, Amado LL, Vianna RA, Martino-Roth Mda G.Micronucleus test on the gas station attendants. Genet mol Res. 2006; 5(1):45-54.
5. Buajeeb W, Kraivaphan P, Amronchit C, Suthamajariya K. Reduction of micronuclei in oral Lichen planus supplemented with Beta carotene. J oral science.2008; 50(4): 461-7.
6. Jones AC, Migliorati CA, Stewart CM. Oral Cytology: indications, contraindications, and techniques. Gen Dent.1995; 43(1): 74-7.
7. Harshvardhan SJ, Alka DK, Mohan KP. Micronucleus as a potential biomarker of carcinogenesis. J. India.2011; 2(2): 67-76.
8. Bloching M, Reich W, Schubert J, Sandner A.Micronucleus rate of buccal mucosal epithelial cells in relation to oral hygiene and dental factors. oral Oncol.2008; 44(3): 220-6.
9. Albander JM, Streckfus CF, Adesanya MR , Winn DM. Cigar, pipe, and cigarette smoking as risk factor for periodontal diseases and tooth loss. J Periodontol. 2000; 71(1): 1874-81.
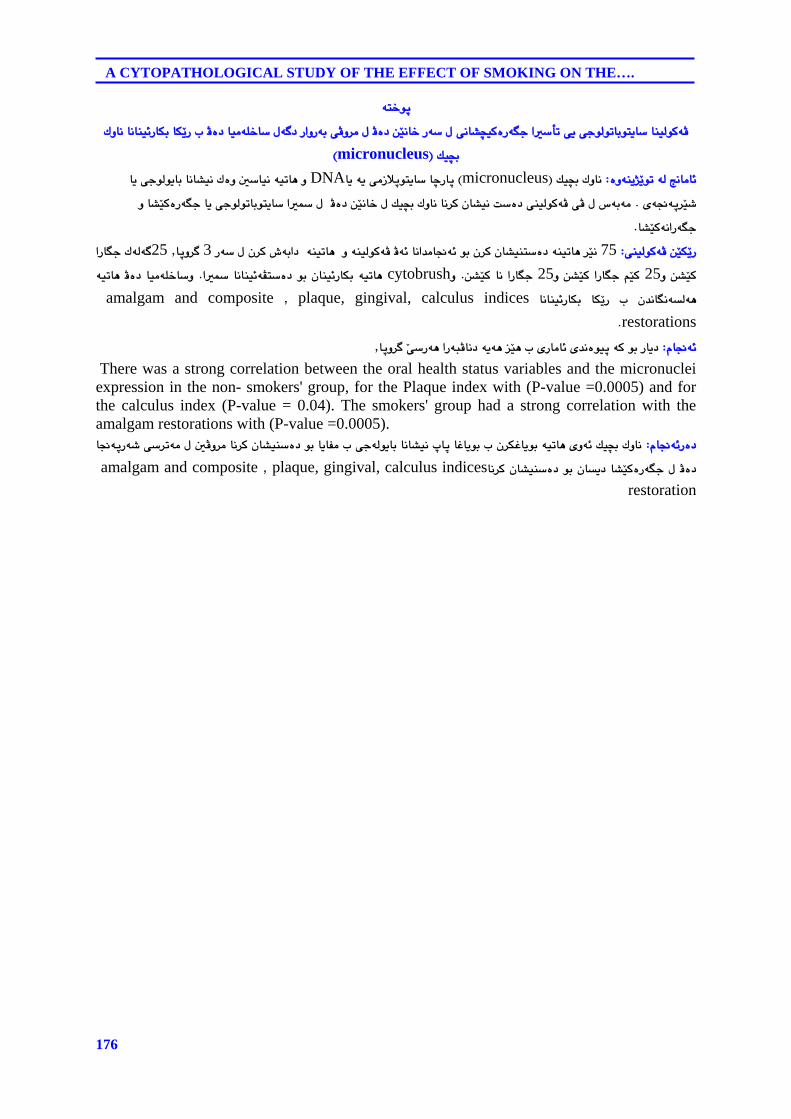
176
A CYTOPATHOLOGICAL STUDY OF THE EFFECT OF SMOKING ON THE….
ón‚íq@@@Ûìbä@bäbåï÷ŠbÙi@bÙŽîŠ@l@Äò†@bïàóÝ‚b@ßó †@ŠaìŠói@ôÄì‹à@ß@Äò†@æŽïäb‚@Šó@ß@ôäb“›ïØòŠóu@adm@ôî@ôuíÜímbiínîb@båïÜíØóÄ
@Úï›iImicronucleusH@@òìóåîím@óÜ@wäbàb÷Z@@Úï›i@ÛìbäImicronucleus@Hbî@óî@ôàŒþqínîb@bšŠbq DNAî@ôuíÜíîbi@bäb“ïä@Ûòì@μbïä@óïmbè@ì@b
@õó−óq‹Žï’@N@ì@b“ŽïØòŠóu@bî@ôuíÜímbiínîb@a@ß@@Äò†@æŽïäb‚@ß@Úï›i@Ûìbä@bä‹Ø@çb“ïä@oò†@ôåïÜíØóÄ@ôÄ@ß@‘óióàb“ŽïØóäaŠóuN@@
ôåïÜíØóÄ@æŽïÙŽîŠZ@75@@Šó@ß@ç‹Ø@•óia†@@óåïmbè@@ì@óåïÜíØóÄ@Äó÷@bäa‡àb−ó÷@íi@ç‹Ø@çb“ïånò†@óåïmbè@‹Žïä3@bqì‹ @~25@aŠbu@ÛóÜó æ“ŽïØ@ì25@ì@æ“ŽïØ@ aŠbu@âŽïØ25@æ“ŽïØ@ bä@ aŠbu@Nì cytobrusha@bäbåï÷óÅnò†@íi@çbåï÷ŠbÙi@óïmbè@N@óïmbè@Äò†@ bïàóÝ‚bì
@ bäbåï÷ŠbÙi@ bÙŽîŠ@ l@ ç‡äbäóÜóèplaque, gingival, calculus indices@~ amalgam and composite
restorationsN@@ãb−ó÷Z@Žïè@l@õŠbàb÷@õ‡äòíïq@óØ@íi@Šbî†@bqì‹ @ŽôŠóè@aŠójÄbä†@óîóè~@@
There was a strong correlation between the oral health status variables and the micronuclei expression in the non- smokers' group, for the Plaque index with (P-value =0.0005) and for the calculus index (P-value = 0.04). The smokers' group had a strong correlation with the amalgam restorations with (P-value =0.0005).
ãb−ó÷Šò†Z@@b−óqŠó’@ô‹móà@ß@μÄì‹à@bä‹Ø@çb“ïåò†@íi@bîbÑà@l@ôuóÜíîbi@bäb“ïä@tbq@bÌbîíi@l@ç‹ÙÌbîíi@óïmbè@õìó÷@Úï›i@Ûìbäbä‹Ø@çb“ïåò†@íi@çbî†@b“ŽïØòŠóu@ß@Äò† plaque, gingival, calculus indices~ amalgam and composite
restoration @@
177
Duhok Medical Journal Volume 6, Supplement 3, 2012
ó–þ©a@ @óaŠ†@ñíÝ‚@ðuíÜíqbi@æà@삇nÜa@qdm@bîþ©a@ôÝÈ@óîíáÑÜa@óîŠbéÅÜa@ÖÝÉnî@báïÐ@ðz—Üa@ÊšíÜbi@âÑÜa@Öî‹ @æÈ@óaíi@˜zÑÜa@@òaíåÜa
õ‹Í—Üa@@óïÑÝ‚Z@òÍ—Üa@òaíåÜa@öu@íè@ñìíåÜa@á¨a@æà@óîí“y@æÈ@Ïþiýa@óïuíÜíïjÜa@pbàþÉÜa@çb ‹Ü@NóÝnØ@íè@Þi@μäì@óîí“y@oÝÙ’@@ÀóÕj @bîþ©a@æà@óî‡ÈbÕÜa@ò‹“jÜa@Në‰@æÙºì@bîbÅ“Üa@ÞïÙ“m@öb“Ì@âéi@ó–b©a@NoäbØ@óaŠ‡Üa@Óa‡èc@æÈ@Ò“ÙÝÜ@jÉnÜa@pbîíåÜa@@À
bîþ©a@óîíáÑÜa@óîŠbéÅÜa@À@pbzà@ñíÝ‚@ðuíÜíqbi@æà@Ì@μ傇¾a@ì@μ傇¾aŠí؉Üa@LÂiŠ@jÉnÜa@pbîíåÜa@bîþ©a@À@óîíáÑÜa@óîŠbéÅÜa@Êà@paÍnà@ðz—Üa@ÊšíÜa@âÑÜa@Öî‹ @æÈ@LâïïÕmì@óïÜbÉÐ@óîbÕáÝÜ@pbîíåÜa@æÈ@Ò“ÙÝÜ@†aí¾a@óïÜbÈ@‹ bƒ¾@óš‹É¾a@æà@pa‹ÑÜa@@æÈ
âÑÜa@Öî‹ N@ @ì@†aí¾a׋ÜaZ@@oî‹ucôÝÈ@óaŠ‡Üa@ë‰è@75@æà@Ší؉Üa@I35@M@40@H‹áÉÜa@æà@óå@¶a@âÕåmì@25@μè‹“Üa@μ傇¾a@L25@çí傇î@L@ì
25@μ傇¾a@Ì@æà@Nãa‡ƒna@@cytobrush@ôÝÈ@ßí—¨a@pbzà@NâïïÕm@@óïz—Üa@óÜb¨a@âÑÜa@Öî‹ @æÈ@ãa‡ƒnbi@LóyíÜ@ñírÜ@L@pa‹’üàìÞàbÙnÜaì@ÞšbÑnÜa@lby@¶g@óÐbšfibi@Lwîà@kØ‹à@ìâïàÜaN@ @
w÷bnåÜaZ@@Ûbåè@çbØóï÷b—yg@óÜý†@paˆ@×ì‹Ð@jÉnÜa@À@pbîíåÜa@tþrÜa@pbÈíáa@μi@NÛbåè@çbØ@óîíÔ@óÔþÈ@†íuì@paÍn¾a@μi@óÜby@ì@âÑÜa@óz–@jÉnÜapbîíåÜa@À@óÈíáa@Ì@μ傇¾a@L‹’üáÝÜ@ÛþjÜa@Êà@IÓ@]@0.0005@óáïÕÜa@Hì@‹’üáÝÜÞàbÙnÜaì@ÞšbÑnÜa@lby@IÓ@
óáïÕÜa@]@0.04H@NçbØì@Èíáªó@æà@μ傇¾a@óîíÔ@óÔþÈ@†íuì@Êà@âïàÜa@âÍݾa@Êà@IÓ@]@0.0005@óáïÕÜaNH
ó–þ©aZ@çg@óîbÕà@õ‹Í—Üa@òaíåÜa@óaíi@béåÈ@Ò“ÙÜa@lbi@óÍj–@íè@ò‡ïÑà@óïuíÜíîbi@óàþÈ@æÈ@Ò“ÙÝÜ@‹©@μš‹É¾a@™bƒ’ÿa@æà@ßbÈ@pa‹ÑÜa@âÑÜa@Öî‹ @æÈ@kji@ÝÜ@Šb›Üa@qdnÜa@L삇npa‹’ü¾a@byÞàbÙnÜaì@ÞšbÑnÜa@l@ÛþjÜaì@L¶g@óÐbšfibi@âïàÜa@âÍݾaN
@@