Embed Size (px)
Citation preview
Dustminer: Troubleshooting Interactive Complexity Bugsin Sensor Networks
Mohammad Maifi Hasan Khan, Hieu Khac Le, Hossein Ahmadi, Tarek F. Abdelzaher,and Jiawei Han
Department of Computer ScienceUniversity of Illinois, Urbana-Champaign
[email protected], [email protected], [email protected], [email protected]@cs.uiuc.edu
ABSTRACTThis paper presents a tool for uncovering bugs due to inter-active complexity in networked sensing applications. Suchbugs are not localized to one component that is faulty, butrather result from complex and unexpected interactions be-tween multiple often individually non-faulty components.Moreover, the manifestations of these bugs are often notrepeatable, making them particularly hard to find, as theparticular sequence of events that invokes the bug may notbe easy to reconstruct. Because of the distributed natureof failure scenarios, our tool looks for sequences of eventsthat may be responsible for faulty behavior, as opposed tolocalized bugs such as a bad pointer in a module. An ex-tensible framework is developed where a front-end collectsruntime data logs of the system being debugged and an of-fline back-end uses frequent discriminative pattern miningto uncover likely causes of failure. We provide a case studyof debugging a recent multichannel MAC protocol that wasfound to exhibit corner cases of poor performance (worsethan single channel MAC). The tool helped uncover eventsequences that lead to a highly degraded mode of operation.Fixing the problem significantly improved the performanceof the protocol. We also provide a detailed analysis of tooloverhead in terms of memory requirements and impact onthe running application.
Categories and Subject DescriptorsD.2.5 [Software Engineering]: [Testing and Debugging-Distributed Debugging]
General TermsDesign, Reliability, Experimentation
KeywordsProtocol debugging, Distributed automated debugging, Wire-less sensor networks
Permission to make digital or hard copies of all or part of this work forpersonal or classroom use is granted without fee provided that copies arenot made or distributed for profit or commercial advantage and that copiesbear this notice and the full citation on the first page. To copy otherwise, torepublish, to post on servers or to redistribute to lists, requires prior specificpermission and/or a fee.SenSys’08, November 5–7, 2008, Raleigh, North Carolina, USA.Copyright 2008 ACM 978-1-59593-990-6/08/11 ...$5.00.
1. INTRODUCTIONDustMiner is a diagnostic tool that leverages an extensible
framework for uncovering root causes of failures and perfor-mance anomalies in wireless sensor network applications inan automated way. This paper presents the design and im-plementation of Dustminer along with two case studies ofreal life failure diagnosis scenarios. The goal of this work isto further contribute to automating the process of debug-ging, instead of relying only on manual efforts, and hencereduce the development time and effort significantly.
Developing wireless sensor network applications still re-mains a significant challenge and a time consuming task.To make the development of wireless sensor network applica-tions easier, much of the previous work focused on program-ming abstractions [27, 7, 25, 17, 11]. Most wireless sensornetwork application developers would agree, however, to thefact that most of the development time is spent on debug-ging and troubleshooting the current code, which greatlyreduces productivity.
Early debugging and troubleshooting support revolved aro-und testbeds [8, 36], simulation [18, 35, 34] and emula-tion environments [29, 12]. Recent source level debuggingtools [38, 37] have greatly contributed to the convenience ofthe troubleshooting process. They make it easier to zoom inon sources of errors by offering more visibility into run-timestate. Unfortunately wireless sensor network applicationsoften fail not because of a single node coding error but asa result of improper interaction between components. Suchinteraction may be due to some protocol design flaw (e.g.,missed corner cases that the protocol does not handle cor-rectly) or unexpected artifacts of component integration. In-teraction errors are often non-reproducible since repeatingthe experiment might not lead to the same corner-case again.Hence, in contrast to previous debugging tools, in this pa-per, we focus on finding (generally non-deterministically oc-curring) bugs that arise from interactions among seeminglyindividually sound components.
The main approach of Dustminer is to log many differ-ent types of events in the sensor network and then analyzethe logs in an automated fashion to extract the sequencesof events that lead to failure. These sequences shed light onwhat caused the bug to manifest making it easier to under-stand and fix the root cause of the problem.
Our work extends a somewhat sparse chain of prior at-tempts at diagnostic debugging in sensor networks. Sym-pathy [30] is one of the earliest tools in the wireless sensornetworks domain that addresses the issue of diagnosing fail-
ures in deployed systems in an automated fashion. Specif-ically, it infers the identities of failed nodes or links basedon reduced throughput at the basestation. SNTS [15] pro-vides a more general diagnostic tool that extracts conditionson current network state that are correlated with failure, inhopes that they may include the root cause. A diagnosticsimulator (an extension to TOSSIM) is described in [14]. Be-ing a simulator extension, it is not intended to troubleshootdeployed systems. It is based on frequent pattern mining(to find event patterns that occur frequently when the bugsmanifest). Unfortunately, the cause of a problem is often aninfrequent pattern; a single “bad” chain of events that leadsto many problems.
We extend the diagnostic capability of the above toolsby implementing a new automated discriminative sequenceanalysis technique that relies on two separate phases to findroot causes of problems or performance anomalies in sensornetworks; the first phase identifies frequent patterns corre-lated to failure as before. The second focuses on those pat-terns, correlating them with (infrequent) events that mayhave caused them, hence uncovering the true root of theproblem. We apply this technique to identify the sequencesof events that cause manifestations of interaction bugs. Inturn, identifying these sequences helps the developer un-derstand the nature of the bug. Our tool is based on afront-end that collects data from the run-time system and aback-end that analyses it. Both are plug-and-play modulesthat can be chosen from multiple alternatives. We identifythe architectural requirements of building such an extensi-ble framework and present a modular software architecturethat addresses these requirements.
We provide two case studies of real life debugging usingthe new tool. The first case study shows how our tool iso-lates a kernel-level bug in the radio communication stack inthe newly introduced LiteOS [6] operating system for sensornetworks that offers a UNIX-like remote filesystem abstrac-tion. The second case study shows how the tool is used todebug a performance problem in a recently published mul-tichannel Media Access Control (MAC) protocol [16]. Forboth case studies we used MicaZ motes as target hardware.
It is important to stress what our tool is not. We spe-cialize in uncovering problems that result from componentinteractions. Specifically, the proposed tool is not intendedto look for local errors (e.g., code errors that occur and man-ifest themselves on one node). Examples of the latter type oferrors include infinite loops, dereferencing invalid pointers,or running out of memory. Current debugging tools are, forthe most part, well-equipped to help find such errors. Anintegrated development environment can use previous toolsfor that purpose.
The rest of the paper is organized as follows. In Sec-tion 2, we describe recent work on debugging sensor net-work applications. In Section 3, we describe the main ideaof our tool. In Section 4, we describe the design challengeswith our proposed solution. Section 5 describes the systemarchitecture of Dustminer. Section 6 describes the imple-mentation details of the data collection front-end and dataanalysis back-end that are used in this paper along with theirsystem overhead. To show the effectiveness of our tool, inSection 7, we provided two case studies. In the first, weuncover a kernel-level bug in LiteOS. In the second, we useour tool to identify a protocol design bug in a recent multichannel MAC protocol [16]. We show that when the bug is
fixed, the throughput of the system is improved by nearly50%. Section 8 concludes the paper.
2. RELATED WORKCurrent troubleshooting support for sensor networks (i)
favors reproducible errors, and (ii) is generally geared to-wards finding local bugs such as an incorrectly written line ofcode, an erroneous pointer reference, or an infinite loop. Ex-isting tools revolve around testing, measurements, or step-ping through instruction execution. Marionette [37] andClairvoyant [38] are examples of source debugging systemsthat allow the programmer to interact with the sensor net-work using breakpoints, watches, and line-by-line tracing.Source level debugger is more suitable to identify program-ming errors which is contained in a single node. It is dif-ficult to find distributed bugs using source level debuggerdue to the fact that source level debugging interferes heav-ily with the normal operation of the code and may preventthe excitation of distributed bugs in the first place. It alsoinvolves manual checking of system states which is not scal-able. SNMS [32] presents a sensor network measurementservice that collects performance statistics such as packetloss and radio energy consumption. Testing-based systemsinclude laboratory testbeds such as Motelab [36], Kansei [8],Emstar [12] etc. These systems are good at exposing mani-festations of errors, but leave it to the programmer’s skill toguess the cause of the problem.
Simulation and emulation based systems include TOSSIM[18], DiSenS [35], S2DB [34], Atemu [29] etc. Atemu providesXATDB which is a GUI based debugger that provides inter-face to debug code at line level. S2DB is a simulation baseddebugger that provides debugging abstractions at differentlevels such as the node level and network level. It providesthe concept of parallel debugging where a developer can setbreakpoints across multiple devices to access internal systemstate. This remains a manual process, and it is very hardto debug a large system manually for design bugs. More-over the simulated environment prevents the system fromexciting bugs which arise due to peculiar characteristics ofreal hardware, and deployment scenarios such as clock skew,radio irregularities, and sensing failures, to name a few.
For offline parameter tuning and performance analysis,record and replay is a popular technique which is imple-mented by Envirolog [26] for sensor network applications.Envirolog stores module outputs (e.g., outputs of sensingmodules) locally and replays them to reproduce the originalexecution. It is good at testing performance of high-levelprotocols subjected to a given recorded set of environmentalconditions. While this can also help with debugging suchprotocols, no automated diagnosis support is offered.
In [31], the authors pointed out that sensor data, such ashumidity and temperature, may be used to predict networkand node failure, although they do not propose an auto-mated technique for correlating failures with sensor data.In contrast, we are focused on automating the trobuleshoot-ing of general protocol bugs which may not necessarily berevealed by analyzing sensor measurements.
Sympathy [30] presents an early step towards sensor net-work self-diagnosis. It specializes in attributing reducedcommunication throughput at a base-station to the failureof a node or link in the sensor network. Another exampleof automated diagnostic tools is [15] which analyzes pas-
sively logged radio communication messages using a clas-sification algorithm [10] to identify states correlated withthe occurrence of bugs. The diagnostic capability of [15] isconstrained by its inability to identify event sequences thatprecipitate an interaction-related bug. The tool also doesnot offer an interface to the debugged system that allowslogging internal events. The recently published diagnosticsimulation effort [14] comes closest to our work. The presentpaper extends the diagnostic capability of the above tools byimplementing an actual system (as opposed to using simu-lation) and presenting a better log analysis algorithm thatis able to uncover infrequent sequences that lead to failures.
Machine learning techniques have previously been appliedto failure diagnosis in other systems [5, 3, 22]. Extensivework in software bug mining and analysis studies includesa software behavior graph analysis method for back-tracingnoncrashing bugs [22], a statistical model-based bug local-ization method [19], which explores the distinction of run-time execution distribution between buggy and nonbuggyprograms, a control flow abnormality analysis method forlogic error isolation [23], a fault localization-based approachfor failure proximity [20], a Bayesian analysis approach forlocalization of bugs with a single buggy run, which is espe-cially valuable for distributed environments where the bugcan hardly be reproduced reliably [21], and a dynamic slicing-based approach for failure indexing which may cluster andindex bugs based on their speculated root cause and locality[24], as well as discriminative frequent pattern analysis [9].We extend the techniques of discriminative pattern analy-sis to a two-stage process for analyzing logs to pinpoint thecause of failure; the first stage identifies all the “symptoms”of the problem from the logs, while the second ties them topossible root causes.
Formal methods [33, 13, 4, 28] offer a different alterna-tive based on verifying component correctness or, conversely,identifying which properties are violated. The approach ischallenging to apply to large systems due to the high degreeof concurrency and non-determinism in complex wirelesssensor networks, which leads to an exponential state spaceexplosion. Unreliable wireless communication and sensingpose additional challenges. Moreover, even a verified sys-tem can suffer poor performance due to a design flaw. Ourtool automatically answers questions that help identify thecause of failure that manifests during run time.
3. DUSTMINER OVERVIEWMost previous debugging approaches for sensor networks
are geared at finding localized errors in code (with prefer-ence to those that are reproducible). In contrast, we focuson non-deterministically occurring errors that arise becauseof unexpected or adverse distributed interactions betweenmultiple seemingly individually-correct components. Thenon-localized, hard-to-reproduce nature of such errors makesthem especially hard to find.
Dustminer is based on the idea that, in a distributed wire-less sensor network, nodes interact with each other in amanner defined by their distributed protocols to performcooperative tasks. Unexpected sequences of events, subtleinteractions between modules, or unintended design flawsin protocols may occasionally lead to an undesirable or in-valid state, causing the system to fail or exhibit poor perfor-mance. Hence, in principle, if we log different types of events
in the network, we may be able to capture the unexpectedsequence that leads to failure (along with thousands of othersequences of events). The challenge for the diagnostic toolis to automatically identify this culprit sequence. Our ap-proach exploits both (i) non-determinism and (ii) interactivecomplexity to improve ability to diagnose distributed inter-action bugs. This point is elaborated below:
• Exploiting non-reproducible behavior: We adapt datamining approaches that use examples of both “good”and “bad” system behavior to be able to classify theconditions correlated with good and bad. In particu-lar, note that conditions that cause a problem to occurare correlated (by causality) with the resulting bad be-havior. Root causes of non-reproducible bugs are thusinherently suited for discovery using such data miningapproaches; the lack of reproducibility itself and theinherent system non-determinism improve the odds ofoccurrence of sufficiently diverse behavior examples totrain the troubleshooting system to understand the rel-evant correlations and identify causes of problems.
• Exploiting interactive complexity: Interactive complex-ity describes a system where scale and complexity causecomponents to interact in unexpected ways. A failurethat occurs due to such unexpected interactions is typ-ically hard to “blame” on any single component. Thisfundamentally changes the objective of a troubleshoot-ing tool from aiding in stepping through code (whichis more suitable for finding a localized error in someline, such as an incorrect pointer reference), to aid-ing with diagnosing a sequence of events (componentinteractions) that leads to a failure state.
At a high level, our tool first uses a data collection front-endto collect runtime events for post-mortem analysis. Oncethe log of runtime events is available, the tool separates thecollected sequence of events into two piles - a “good” pile,which contains the parts of the log when the system performsas expected, and a “bad” pile, which contains the parts ofthe log when the system fails or exhibits poor performance.This data separation phase is done based on a predicate thatdefines “good” versus “bad” behavior, provided by the appli-cation developer. For example the predicate, applied offlineto logged data, might state that a sequence of more than 10consecutive lost messages between a sender and receiver isbad behavior (hence return “bad” in this case). To increasediagnostic accuracy, experiments can be run multiple timesbefore data analysis.
A discriminative frequent pattern mining algorithm thenlooks for patterns (sequences of events) that exist with verydifferent frequencies in the two piles. These patterns arecalled discriminative. Later, such patterns are analyzed forcorrelations with preceding events in the logs, if any, thatoccur less frequently. Hence, it is possible to catch anomaliesthat cause problems as well as common roots of multipleerror manifestations.
A well-known algorithm for finding frequent patterns indata is the Apriori algorithm [2]. This algorithm was usedin previous work on sensor network debugging [14] to ad-dress a problem similar to ours where Apriori algorithm isused to determine the event sequences that lead to problemsin sensor networks. We show that the approach has seriouslimitations and extend this algorithm to suite purposes of
sensor network debugging. The original Apriori algorithm,used in the aforementioned work, is an iterative algorithmthat proceeds as follows. At the first iteration, it counts thenumber of occurrences (called support) of each distinct eventin the data set (i.e., in the “good” or “bad” pile). Next, itdiscards all events that are infrequent (their support is lessthan some parameter minSup). The remaining events arefrequent patterns of length 1. Assume the set of frequentpatterns of length 1 is S1. At the next iteration, the algo-rithm generates all the candidate patterns of length 2 whichis S1 × S1. Here ‘×’ represents the Cartesian product. Itthen computes the frequency of occurrence of each patternin S1×S1 and discards those with support less than minSupagain. The remaining patterns are the frequent patterns oflength 2. Let us call them set S2. Similarly, the algorithmwill generate all the candidate patterns of length 3 which isS2 × S1 and discard infrequent patterns (with support lessthan minSup) to generate S3 and so on. It continues thisprocess until it cannot generate any more frequent patterns.
We show in this paper, how the previous work is extendedfor purposes of diagnosis. The problems with the algorithmand our proposed solutions are described in section 4.
4. CHALLENGES AND SOLUTIONSPerforming discriminative frequent pattern mining based onfrequent patterns generated by Apriori algorithm poses sev-eral challenges that need to be addressed before we can applydiscriminative frequent pattern mining for debugging. Forthe purposes of the discussion below, let as define an eventto be the basic element in the log that is analyzed for failurediagnosis. The structure of an event in our log is as follows:< NodeId, EventType, attribute1, attribute2, ...attributen,
T imestamp >
NodeId is used to identify the node that records the event.EventType is used to identify the event type (e.g., messagedropped, flash write finished, etc). Based on the event type,it is possible to interpret the rest of the record (the list ofattributes). The set of distinct EventTypes is often calledthe alphabet in an analogy with strings. In other words, ifevents were letters in an alphabet, we are looking for stringsthat cause errors to occur. These strings represent eventsequences (ordered lists of events). The generated log canbe thought of as a single sequence of logged events. Forexample, S1 =(< a >, < b >, < b >, < c >, < d >, < b >, <
b >, < a >, < c >) is an event sequence. Elements < a >,< b >, ..., are events. A discriminative pattern between twodata sets is a subsequence of (not necessarily contiguous)events that occurs with a different count in the two sets. Thelarger the difference, the better the discrimination. With theabove terminology in mind, we present how the algorithm isextended to apply to debugging.
4.1 Preventing False Frequent PatternsThe Apriori algorithm generates all possible combinations
of frequent subsequences of the original sequence. As a re-sult, it generates subsequences combining events that are“too far” apart to be causally correlated with high proba-bility and thus reduces the chance of finding the “culpritsequence” that actually caused the failure. This strategycould negatively impact the ability to identify discrimina-tive patterns in two ways; (i) it could lead to the generation
of discriminative patterns that are not causally related, and(ii) it could eliminate discriminative patterns by generatingfalse patterns. Consider the following example.
Suppose we have the following two sequences:S1 = (< a >, < b >, < c >, < d >, < a >, < b >, < c >, < d >)
S2 = (< a >, < b >, < c >, < d >, < a >, < c >, < b >, < d >
Suppose the system fails when < a > is followed by < c >
before < b >. As this condition is violated in sequence S2,ideally, we would like our algorithm to be able to detect(< a >, < c >, < b >) as a discriminative pattern that distin-guishes these two sequences.
Now, if we apply the Apriori technique, it will generate(< a >, < c >, < b >) as an equally likely pattern for bothS1, and S2. As in both S1 and S2, it will combine the firstoccurrence of < a > and the first occurrence of < c > withthe second occurrence of < b >. So it will get canceled outat the differential analysis phase.
To address this issue, the key observation here is that thefirst occurrence of < a > should not be allowed to combinewith the second occurrence of < b > as there is anotherevent < a > after the first occurrence of < a > but beforethe second occurrence of < b > and the second occurrenceof < b > is correlated with second occurrence of < a > withhigher probability.
To prevent such erroneous combinations, we use a dy-namic search window scheme where the first item of any can-didate sequence is used to determine the search window. Inthis case, for any pattern starting with < a >, the search win-dow is [1, 4] and [5, 8] in S1 and S2. With this search window,the algorithm will search for pattern (< a >, < c >, < b >)
in window [1, 4] and [5, 8] and will fail to find it in S1 butwill find it in sequence S2 only. As a result, the algorithmwill be able to report pattern (< a >, < c >, < b >) as adiscriminative pattern.
This dynamic search window scheme also speeds up thesearch significantly. In this scheme, the original pattern (ofsize 8 events) was reduced to windows of size 4 making thesearch for patterns in those windows more efficient.
4.2 Suppressing Redundant SubsequencesAt the frequent pattern generation stage, if two patterns,
Si and Sj , have support ≥ minSup, the Apriori algorithmkeeps both sequences as frequent patterns even if one is asubsequence of the other and both have equal support. Thismakes perfect sense in data mining but not in debugging.For example, when mining the “good” data set, the abovestrategy assumes that any subset of a“good”pattern is also agood pattern. In real-life, this is not true. Forgetting a stepin a multi-step procedure may well cause failure. Hence,subsequences of good sequences are not necessarily good.Keeping these subsequences as examples of “good” behaviorleads to a major problem at the differential analysis stagewhen discriminative patterns are generated since they mayincorrectly cancel out similar subsequences found frequentin the other (i.e., “bad” behavior) data pile. For example,consider two sequences below:
S1 = (< a >, < b >, < c >, < d >, < a >, < b >, < c >, < d >)
S2 = (< a >, < b >, < c >, < d >, < a >, < b >, < d >, < c >)
Suppose, for correct operation of the protocol, event < a >
has to be followed by event < c > before event < d > canhappen. In sequence S2 this condition is violated. Ideally,we would like our algorithm to report sequence:
S3 = (< a >, < b >, < d >) as the “culprit” sequence. How-ever, if we apply Apriori algorithm, it will fail to catch thissequence. This is because it will generate S3 as a frequentpattern both for S1 and S2 with support 2 and will get can-celed out at the differential analysis phase. As expected, S3
will never show up as a “discriminative pattern”. Note thatwith the dynamic search window scheme alone, we cannotprevent this.
To illustrate, suppose a successful message transmissioninvolves the following sequence of events:
(<enableRadio>,<messageSent>,<ackReceived>,<disable-
Radio>)
Now although sequence:(< enableRadio >, < messageSent >, < disableRadio >)
is a subsequence of the original “good” sequence, it does notrepresent a successful scenario as it disables radio beforereceiving the “ACK” message.
To solve this problem, we need an extra step (which we callsequenceCompression) before we perform differential analy-sis to identify discriminative patterns. At this step, we re-move the sequence Si if it is a subsequence of Sj with thesame support1. This will remove all the redundant subse-quences from the frequent pattern list. Subsequences witha (sufficiently) different support, will be retained and willshow up after discriminative pattern mining.
In the above example, pattern (< a >, < b >, < c >, < d >)
has support 2 in S1 and support 1 in S2. Pattern (< a >, <
b >, < d >) has support 2 in both S1 and S2. Fortunately, atthe sequenceCompression step, pattern (< a >, < b >, < d >)
will be removed from the frequent pattern list generated forS1 because it is a subsequence of a larger frequent patternof the same support. It will therefore remain only on thefrequent pattern list generated for S2 and will show up as adiscriminative pattern.
4.3 Two Stage Mining for Infrequent EventsIn debugging, sometimes less frequent patterns could be
more indicative of the cause of failure than the most frequentpatterns. A single mistake can cause a damaging sequenceof events. For example, a single node reboot event can causea large number of message losses. In such cases, if frequentpatterns are generated that are commonly found in failurecases, the most frequent patterns may not include the realcause of the problem. For example, in case of node reboot,manifestation of the bug (message loss event) will be re-ported as the most frequent pattern and the real cause ofthe problem (the node reboot event) may be overlooked.
Fortunately, in the case of sensor network debugging, a so-lution may be inspired by the nature of the problem domain.The fundamental issue to observe is that much computationin sensor networks is recurrent . Code repeatedly visits thesame states (perhaps not strictly periodically), repeating thesame actions over time. Hence, a single problem, such as anode reboot or a race condition that pollutes a data struc-ture, often results in multiple manifestations of the sameunusual symptom (like multiple subsequent message lossesor multiple subsequent false alarms). Catching these re-current symptoms by an algorithm such as Apriori is mucheasier due to their larger frequency. With such symptomsidentified, the search space can be narrowed and it becomes
1This mechanism can be extended to remove subsequencesof a similar but not identical support.
easier to correlate them with other less frequent precedingevent occurrences. To address this challenge, we developeda two stage pattern mining scheme.
At the first stage, the Apriori algorithm generates theusual frequent discriminative patterns that have supportlarger than minSup. For the first stage, minSup is set largerthan 1. It is expected that the patterns involving mani-festations of bugs will survive at the end of this stage butinfrequent events like a node reboot will be dropped due totheir low support.
At the second stage, at first, the algorithm splits the loginto fixed width segments (default width is 50 events in ourimplementation). Next, the algorithm counts the number ofdiscriminative frequent patterns found in each segment andranks each segment of the log based on the count (the higherthe number of discriminative patterns in a segment, thehigher the rank). If discriminative patterns occurred consec-utively in multiple segments, those segments are merged intoa larger segment. Next, the algorithm generates frequentpatterns with minSup reduced to 1 on the K highest-rankedsegments separately (default K is 5 in our implementation)and extracts the patterns that are common in these regions.Note that the initial value of K is set conservatively. Theoptimum value of K depends on the application. If with theinitial value of K, the tool failed to catch the real cause,the value of K is increased iteratively. In this scheme, wehave a higher chance of reporting single events such as raceconditions that cause multiple problematic symptoms. Ob-serve that the algorithm is applied on data that is the totallogs from several experimental runs. The race condition mayhave occurred once at different points of some of these runs.
This scheme has a significant impact on the performanceof the frequent pattern mining algorithm. Scalability is oneof the biggest challenges in applying discriminative frequentpattern analysis to debugging. For example, if the totalnumber of logged events is of the order of thousands (morethan 40000 in one of our later examples), it is computation-ally impossible to generate frequent patterns of non-triviallength for this whole sequence. Using two stage mining, wecan dramatically reduce the search space and make it fea-sible to mine for longer frequent patterns which are moreindicative of the cause of failure than shorter sequences.
4.4 Other ChallengesSeveral other changes need to be made to standard data
mining techniques. For example, the amount of logged eventsand the corresponding frequency of patterns can be differentfrom run to run depending on factors such as length of exe-cution and system load. A higher sampling rate at sensors,for example, may generate more messages and cause moreevents to be logged. Many logged event patterns in this casewill appear to be more frequent. This is problematic whenit is desired to compare the frequency of patterns found in“good” and “bad”data piles for purposes of identifying thosecorrelated with bad behavior. To address this issue, we needto normalize the frequency count of events in the log. In thecase of single events (i.e., patterns of length 1), we use theratio of occurrence of the event instead of absolute counts.In other words, the support of any particular event, < e >in the event log is divided by the total number of eventslogged, yielding in essence the probability of finding thatevent in the log, P (e). For patterns of length more than
1, we extend the scheme to compute the probability of thepattern given recursively by P (e1).P (e2|e1).P (e3|e1.e2), ....The individual terms above are easy to compute. For ex-ample, P (e2|e1) is obtained by dividing the support of thepattern (< e1 >, < e2 >) by the total support of patternsstarting with < e1 >.
Finally, there are issues with handling event parameters.Logged events may have parameters (e.g., identity of the re-ceiver for a message transmission event). Since event param-eter lists may be different, calling each variation a differentevent will cause a combinatorial explosion of the alphabet.For example, an event with 10 parameters, each of 10 pos-sible values will generate a space of 1010 possible combina-tions. To address the problem, continuous or fine-grainedparameters need to be discretized into a smaller number ofranges. Multi-parameter events need to be converted into se-quences of single-parameter events each listing one parame-ter at a time. Hence, the exponential explosion is reduced tolinear growth in the alphabet, proportional to the number ofdiscrete categories a single parameter can take and the aver-age number of parameters per event. Techniques for dealingwith event parameter lists were introduced in [14] and arenot discussed further in this paper.
5. DUSTMINER ARCHITECTUREWe realize that the types of debugging algorithms needed
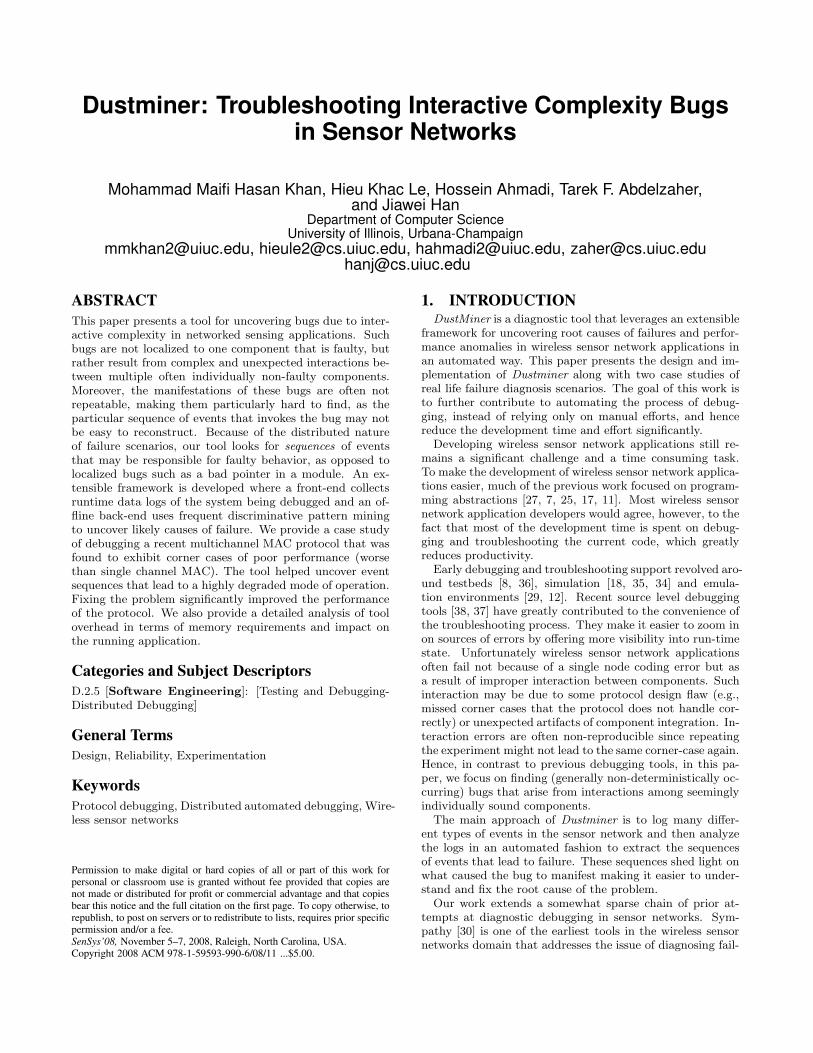
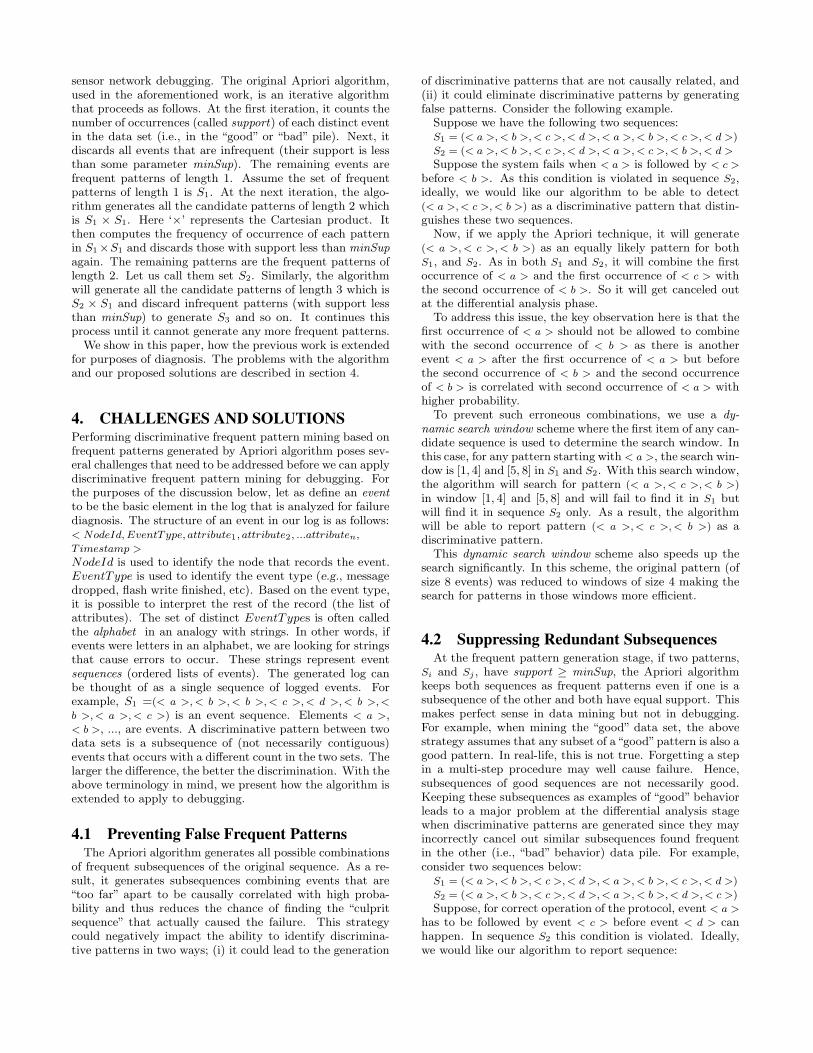
are different for different applications, and are going to evolveover time with the evolution of hardware and software plat-forms. Hence, we aim to develop a modular tool architecturethat facilitates evolution and reuse. Keeping that in mind,we developed a software architecture that provides the nec-essary functionality and flexibility for future development.The goal of our architecture is to facilitate easy use and ex-perimentation with different debugging techniques and fos-ter future development. As there are numerous differenttypes of hardware, programming abstractions, and operat-ing systems in use for wireless sensor networks, the architec-ture must be able to accommodate different combinationsof hardware and software. Different ways of data collec-tion should not affect the way the data analysis layer works.Similarly we realize that for different types of bugs, we mayneed different types of techniques to identify the bug andwe want to provide a flexible framework to experiment withdifferent data analysis algorithms. Based on the above re-quirements, we designed a layered, modular architecture asshown in Figure 1. We separate the whole system into threesubsystems; (i) a data collection front-end, (ii) data prepro-cessing middleware and (iii) a data analysis back-end.
5.1 Data Collection Front-EndThe role of data collection front-end is to provide the de-
bug information (i.e., log files) that can be analyzed for di-agnosing failures. The source of this debug log is irrelevantto the data analysis subsystem. As shown in Figure 1, thedeveloper may choose to analyze the recorded radio commu-nication messages obtained using a passive listening tool, orthe execution traces obtained from simulation runs, or therun-time sequences of events obtained by logging on actualapplication motes and so on. With this separation of con-cerns, the front-end developer could design and implementthe data collection subsystem more efficiently and indepen-
Application Specific “Bad” Behavior
Data Labeling Function
Labeled Data File
Parsed Data File
Front-EndDesigner
Front-End Specific Raw Data Storage
FormatFront-End Specific
Data Cleaning Algorithm
Data Parsing AlgorithmApplication Specific Header File Describing
Event Format
Front-End –I:Passive Listener
Front-End –III: Diagnostic Simulation
Front-End –II:Runtime Logging
Recorded Log
Data Analysis Tool -I: WEKA
Data Analysis Tool-II: Discriminative Frequent
Pattern Miner
Data Analysis Tool-III: Graphical Visualizer
Set of Data Collection Front-End
Data Analysis Tool Specific Data Converter
Set of Data Analysis Back-End
ApplicationDeveloper
Data Preprocessing Middleware
Figure 1: Debugging framework
dently. The data collection front-end developer merely needsto provide the format of the recorded data. These data areused by the data preprocessing middleware to parse the rawrecorded byte streams.
5.2 Data Preprocessing MiddlewareThis middleware that sits between the data collection front-
end and the data analysis back-end provides the necessaryfunctionality to change or modify one subsystem without af-fecting the other. The interface between the data collectionfront-end and the data analysis back-end is further dividedinto the following layers:
• Data cleaning layer: This layer is front-end specific.Each supported front-end will have one instance of it.The layer is the interface between the particular datacollection front-end and the data preprocessing mid-dleware. It ensures that the recorded events are com-pliant with format requirements.
• Data parsing layer: This layer is provided by our frame-work and is responsible for extracting meaningful recordsfrom the recorded raw byte stream. To parse therecorded byte stream, this layer requires a header filedescribing the recorded message format. This infor-mation is provided by the application developer (i.e.,the user of the data collection front-end).
• Data labeling layer: To be able to identify the proba-ble causes of failure, the data analysis subsystem needssamples of logged events representing both “good” and“bad” behavior. As “good” or “bad” behavior seman-tics are an application specific criterion, the applica-tion developer needs to implement a predicate (a smallmodule) whose interface is already provided by us inthe framework. The predicate, presented with an or-dered event log, decides whether behavior is good orbad.
• Data conversion layer: This layer provides the inter-face between the data preprocessing middleware andthe data analysis subsystem. One instance of this layerexists for each different analysis back-end. This layer isresponsible for converting the labeled data into appro-priate format for the data analysis algorithm. The in-terface of this data conversion layer is provided by theframework. As different data analysis algorithms andtechniques can be used for analysis, each may have dif-ferent input format requirements. This layer providesthe necessary functionality to accommodate supporteddata analysis techniques.
5.3 Data Analysis Back-EndAt present, we implement the data analysis algorithm and
its modifications presented earlier in Section 4. It is respon-sible for identifying the causes of failures. The approach isextensible. As newer analysis algorithms are developed thatcatch more or different types of bugs, they can be easilyincorporated into the tool as alternative back-ends. Suchalgorithms can be applied in parallel to analyze the sameset of logs to find different problems with them.
6. DUSTMINER IMPLEMENTATIONIn this section, we describe the implementation of the data
collection front-end and the data analysis back-end that areused for failure diagnosis in this paper. We used two differ-ent data collection front-ends for two different case studies.The first one is implemented by us and used for real timelogging of user defined events on flash memory in MicaZmotes, and the second front-end was a built-in logging sup-port functionality provided by LiteOS operating system forMicaZ motes. At the data analysis back-end, we used dis-criminative frequent pattern analysis for failure diagnosis.We describe the implementation of each of these next.
6.1 The Front-End: Acquiring System StateWe used two different data collection front-ends to col-
lect data: (i) event logging system implemented for MicaZplatform in TinyOS 2.0 and (ii) kernel event logger for Mi-caZ platform provided by LiteOS. The format of the eventlogged by the two subsystems are completely different. Wewere able to use our framework to easily integrate the twodifferent front-ends and use the same back-end to analyzethe cause of failures, which shows modularity. We brieflydescribe each of these front-ends below.
6.1.1 Data Collection Front-End for TinyOSImplementation:The event logger for MicaZ hardware is implemented us-
ing the TinyOS 2.0 BlockRead and BlockWrite interfacesto perform read and write operations respectively on flash.BlockRead and BlockWrite interfaces allow accessing theflash memory at a larger granularity which minimizes therecording time to flash.
To minimize the number of flash accesses we used a globalbuffer to accumulate events temporarily before writing toflash. Two identical buffers (buffer A and B) are used alter-nately to minimize the interference between event buffering
0
10
20
30
40
50
60
70
80
90
100
0 2 4 6 8 10 12 14 16 18 20Event Interval (ms)
Suc
ces
Rat
e (%
)
Two Buffers of 16 Bytes EachTwo Buffers of 32 Bytes EachTwo Buffers of 64 Bytes EachTwo Buffers of 128 Bytes EachTwo Buffers of 256 Bytes EachOne Buffer of 32 BytesOne Buffer of 64 BytesOne Buffer of 128 BytesOne Buffer of 256 BytesOne Buffer of 512 Bytes
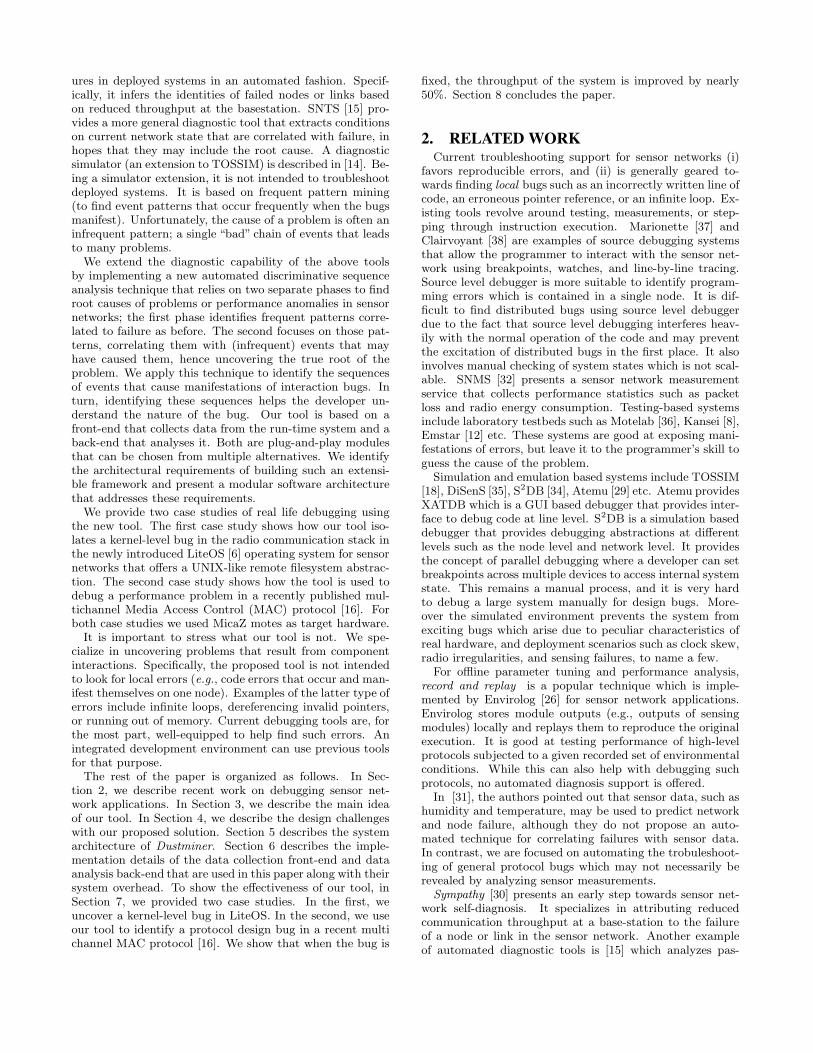
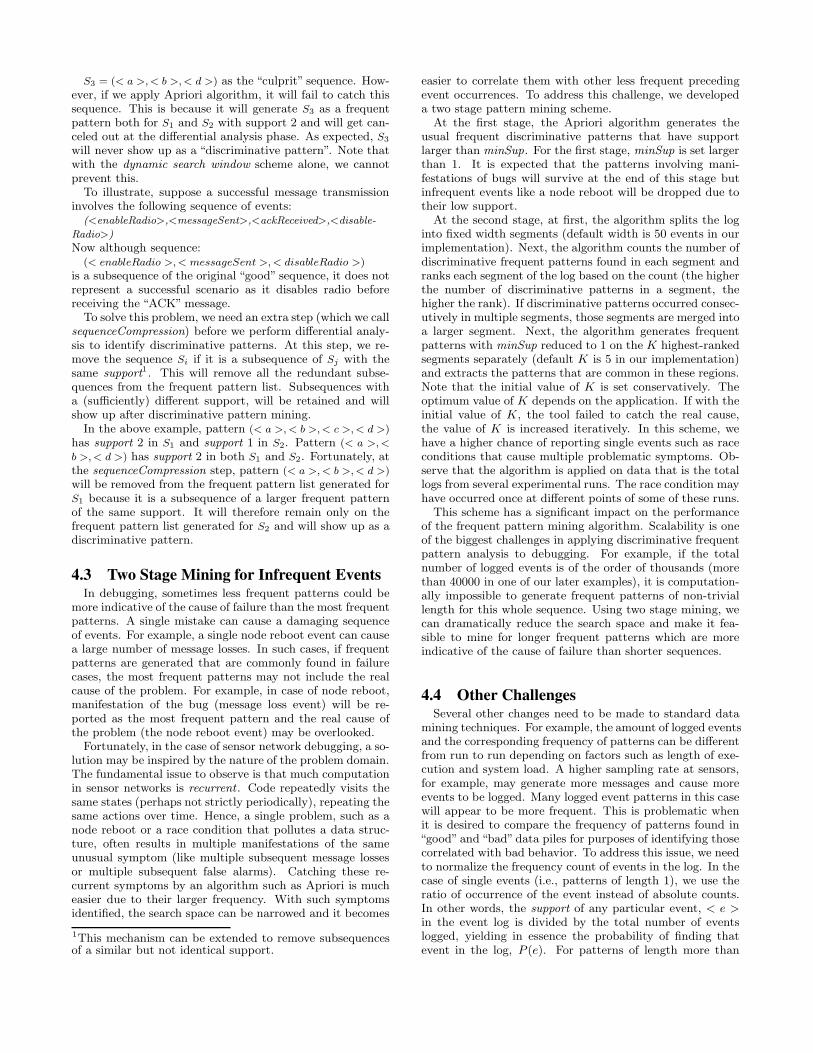
Figure 2: Impact of buffer size and event rate onlogging performance
Meta DataRecord 1 Record 2
Record 3
Flash_Head_Index
Flash_Tail_Index
Record LengthEventId
Data
Flash SpaceReserved
for Application
Flash SpaceReserved
for Logging
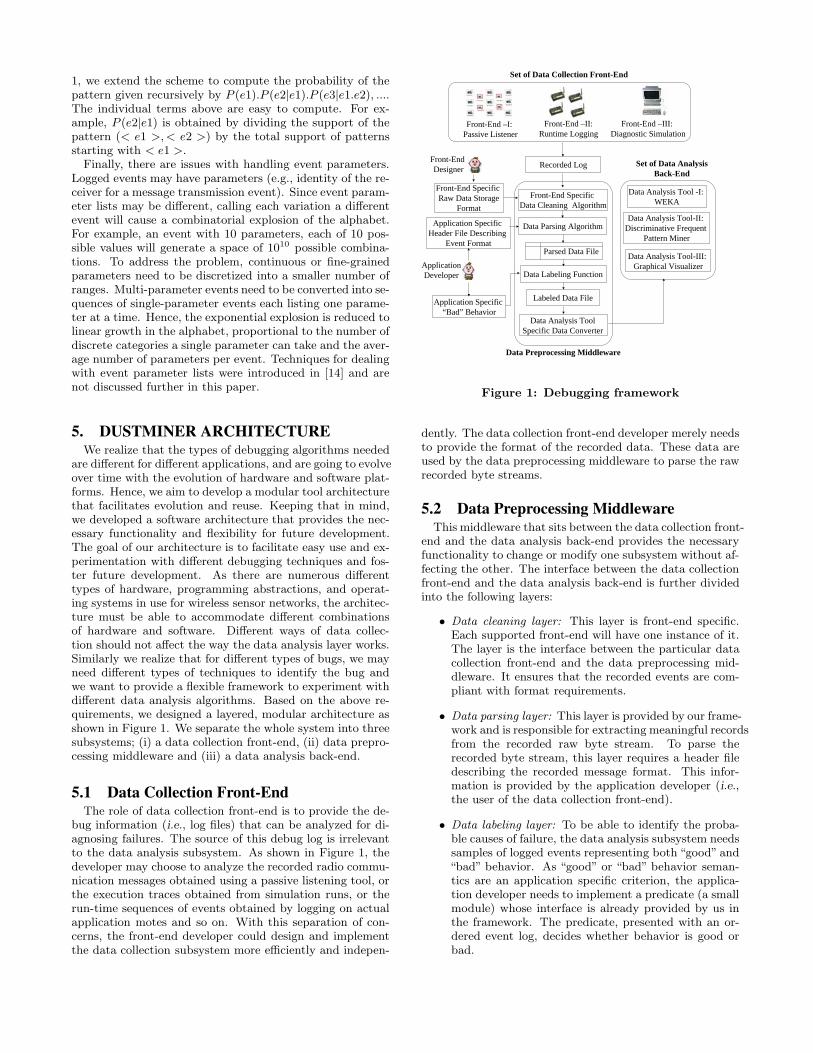
Figure 3: Flash space layout
and writing to flash. When buffer A gets filled up, buffer B isused for temporary buffering and buffer A is written to flashand vice versa. In Figure 2 we show the effect of buffer sizeon logging performance for single buffer and double bufferrespectively. Using two buffers increases the logging per-formance substantially. As shown in figure, for event rateof 1000 events/second, using one buffer of 512 bytes has asuccess ratio (measured as the ratio of successfully loggedevents to the total number of generated events) of only 60%whereas using two buffers of 256 bytes each (512 bytes intotal) can give almost 100% success ratio. For a rate of 200events/second, two buffers of 32 bytes each is enough for100% success ratio.
The sizes of these buffers are configurable as different ap-plications need different amounts of runtime memory. It isto be noted that if the system crashes while some data arestill in the RAM buffer, those events will be lost. The flashspace layout is given in Figure 3.
A separate MicaZ mote (LogManager) is used to commu-nicate with the logging subsystem to start and stop log-ging. Until the logging subsystem receives the “StartLog-ging” command, it will not log anything and after receiv-ing “StopLogging” command it will flush the remaining datathat is in the buffer to flash and stop logging. This gives theuser the flexibility to start and stop logging whenever theywant. It also lets the user to run their application withoutenabling logging, when needed, to avoid the runtime over-head of logging functionality without recompiling the code.
We realize that occasional event reordering can occur dueto preemption, interrupts, or task scheduling delays. An
occasional invalid log entry is not a problem. An occasionalincorrect logging sequence is fine too as long as the sameoccasional wrong sequence does not occur consistently. Thisis because common sequences do not have to occur everytime, but only often enough to be noticed. Hence, they canbe occasionally mis-logged without affecting the diagnosticaccuracy.
Time Synchronization:We need to timestamp the recorded events so that events
recorded on different nodes can be serialized later duringoffline analysis. To avoid the overhead of running a timesynchronization protocol on the application mote, we usedan offline time synchronization scheme. A separate node(TimeManager) is used to broadcast its local clock periodi-cally. The event logging component will receive the messageand log it in flash with a local timestamp. From this infor-mation we can calculate the clock skew on different nodesin reference to TimeManager node, adjust the timestamp ofthe logged events and serialize the logs. We realize that theserialized log may not be exact but it is good enough forpattern mining.
Interface:The only part of the data collection front-end that is ex-
posed to the user is the interface for logging user definedevents. Our design goal was to have an easy-to-use interfaceand efficient implementation to reduce the runtime overheadas much as possible. One critical issue with distributed log-ging was to timestamp the recorded events so that events ondifferent nodes can be serialized later during offline analysis.To make event logging functionality simpler, we defined theinterface to the logging component as follows:
log(EventId,(void *)buffer,unit8_t size)
log(EventId, (void∗)buffer, unit8 tsize) is the key inter-face between application developers and the logging subsys-tem. To log an event, the user has to call the log() functionwith appropriate parameters. For example, if the user wantsto log the event that a radio message was sent and also wantsto log the receiverId along with the event, he/she needs todefine the appropriate record structure in a header file (thisfile will also be used to parse the data) with these fields,initialize the record with appropriate values and call the logfunction with that record as the parameter. This simplefunction call will log the event. The rest is taken care of bythe logging system underneath. The logging system will padthe timestamp with the recorded event and log as a singleevent. Note that NodeId is not recorded during logging.This information is added when data is uploaded to PC foroffline analysis.
System Overhead:The event logging support requires 14670 bytes of pro-
gram memory (this includes the code size for BlockReadand BlockWrite interface provided by TinyOS 2.0) and 830bytes of data memory when 400 bytes are used for buffering(two buffers of 200 bytes each) data before writing to flash.User can choose to use less buffer space if the expected eventrate is low. To instrument code, the program size increaseis minimal. To log an event with no attributes, it needs asingle line of code. To log an event with n attributes, ittakes n + 1 lines of code, n lines are to initialize the recordand 1 line to call the log() function.
6.1.2 Data Collection Front-End for LiteOSLiteOS [6] provides the required functionality to log ker-
nel events on MicaZ platforms. Specifically, the kernel logsevents including system calls, radio activities, context swit-ches and so on. An event log entry is a single 8-bit codewithout attributes. In Figure 4, we present a subset ofevents logged for the LiteOS case study presented in our pa-per. We used an experimental set up of a debugging testbedwith all motes connected to a PC via serial interfaces. Inpre-deployment testing on our indoor testbed, logs can thusbe transmitted in real-time through a programming boardvia serial communication with a base-station. When a sys-tem call is invoked or a radio packet is received on a node,the corresponding code for that specific event is transmittedthrough the serial port to the base station (PC). The basestation collects event codes from the serial port and recordsit in a globally ordered file.
6.2 The Data Analysis Back-EndAt the back-end, we implement the data preprocessing
and discriminative frequent pattern mining algorithm. Tointegrate the data collection front-end with the data pre-processing middleware, we provided a simple text file de-scribing the storage format of the raw byte stream storedon flash for each of the front-ends. This file was used toparse the recorded events. The user supplied different pred-icates as a Java function. These were used to annotate datainto good and bad segments. The rest of the system is acollection of data analysis algorithms such as discriminativefrequent pattern mining, or any other tool such as Weka [1].
7. EVALUATIONTo test the effectiveness of the tool, we applied our toolto troubleshoot two real life applications. We present thecase studies where we have used our tool successfully. Thefirst was a kernel level bug in the LiteOS operating sys-tem. The second was to debug a multichannel Media AccessControl(MAC) protocol [16] implemented in TinyOS 2.0 forMicaZ platform with only one half-duplex radio interface.
7.1 Case Study - I: LiteOS BugIn this case study, we troubleshoot a simple data collection
application where several sensors monitor light and reportit to a sink node. The communication is performed in asingle-hop environment. In this scenario, sensors transmitpackets to the receiver, and the receiver records receivedpackets and sends an “ACK” back. The sending rate thatsensors use is variable and depends on the variations in theirreadings. After receiving each message, depending on itssequence number, the receiver decides to record the value ornot. If the sequence number is older than the last sequencenumber it has received, the packet is dropped.
This application is implemented using MicaZ motes onLiteOS operating system and is tested on an experimen-tal testbed. Each of the nodes is connected to a desktopcomputer via an MIB520 programming board and a serialcable. The PC acts as the base station. In this experiment,there was one receiver (the base node) and a set of 5 senders(monitoring sensors). This experiment illustrates a typicalexperimental debugging set up. Prior to deployment, pro-
grammers would typically test the protocol on target hard-ware in the lab. This is how such a test might proceed.
7.1.1 Failure ScenarioWhen this simple application was stress tested, some of
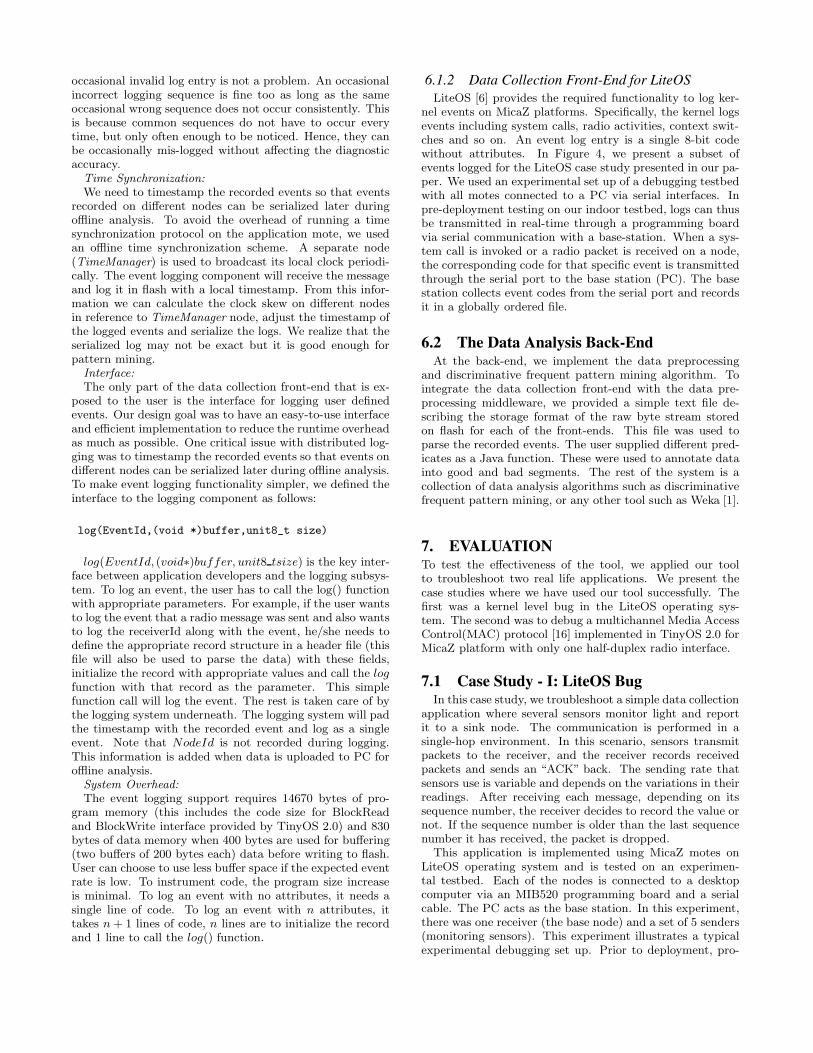
the nodes would crash occasionally and non-deterministically.Each time different nodes would crash and at different times.Perplexed by the situation, the developer (a first-year grad-uate student with no prior experience with sensor networks)decided to log different types of events using LiteOS supportand use our debugging tool. These were mostly kernel-levelevents along with a few application-level events. The built-in logging functionality provided by LiteOS was used to logthe events. A subset of the different types of logged eventsare listed in Figure 4.
Recorded Events Attribute List
Context_Switch_To_User_Thread Null
Get_Current_Thread_Index Null
Get_Current_Radio_Info_Address Null
Get_Current_Radio_Handle_Address Null
Post_Thread_Task Null
Get_Serial_Mutex Null
Get_Current_Serial_Info_Address Null
Get_Serial_Send_Function Null
Disable_Radio_State Null
Packet_Received Null
Packet_Sent Null
Yield_To_System_Thread Null
Get_Current_Thread_Address Null
Get_Radio_Mutex Null
Get_Radio_Send_Function Null
Mutex_Unlock_Function Null
Get_Current_Radio_Handle Null
Figure 4: Logged events for diagnosing LiteOS ap-plication bug
7.1.2 Failure DiagnosisAfter running the experiment, “good” logs were collected
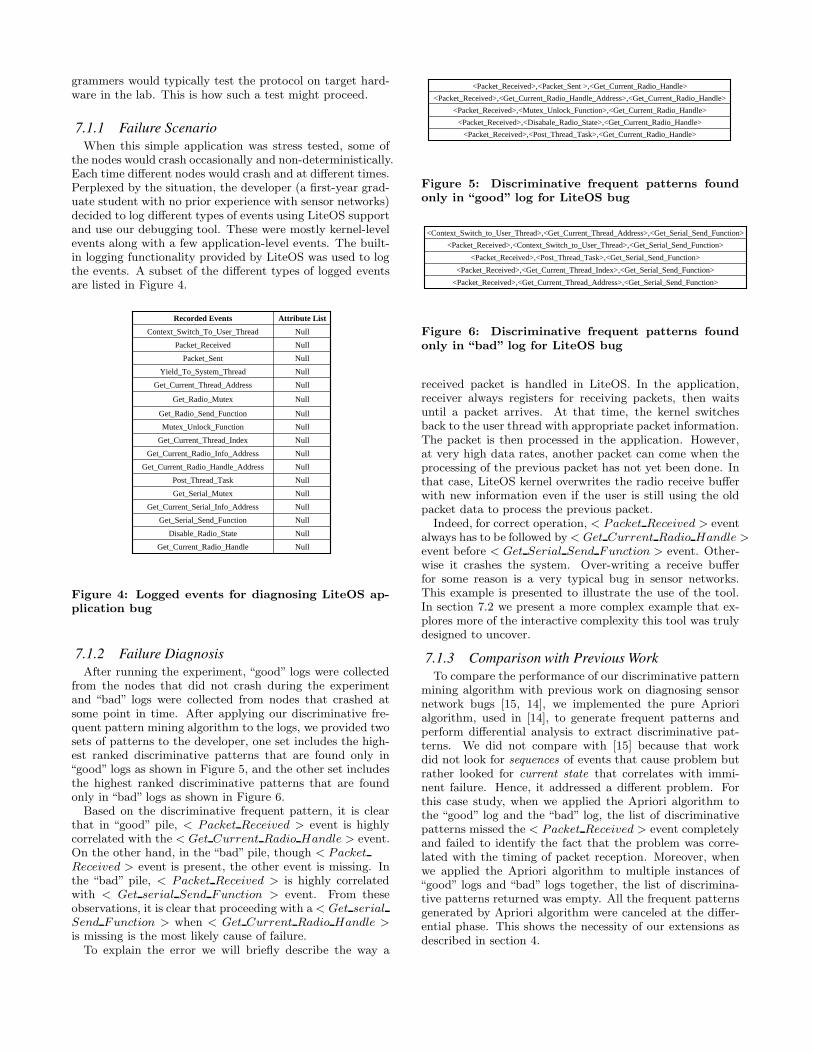
from the nodes that did not crash during the experimentand “bad” logs were collected from nodes that crashed atsome point in time. After applying our discriminative fre-quent pattern mining algorithm to the logs, we provided twosets of patterns to the developer, one set includes the high-est ranked discriminative patterns that are found only in“good” logs as shown in Figure 5, and the other set includesthe highest ranked discriminative patterns that are foundonly in “bad” logs as shown in Figure 6.
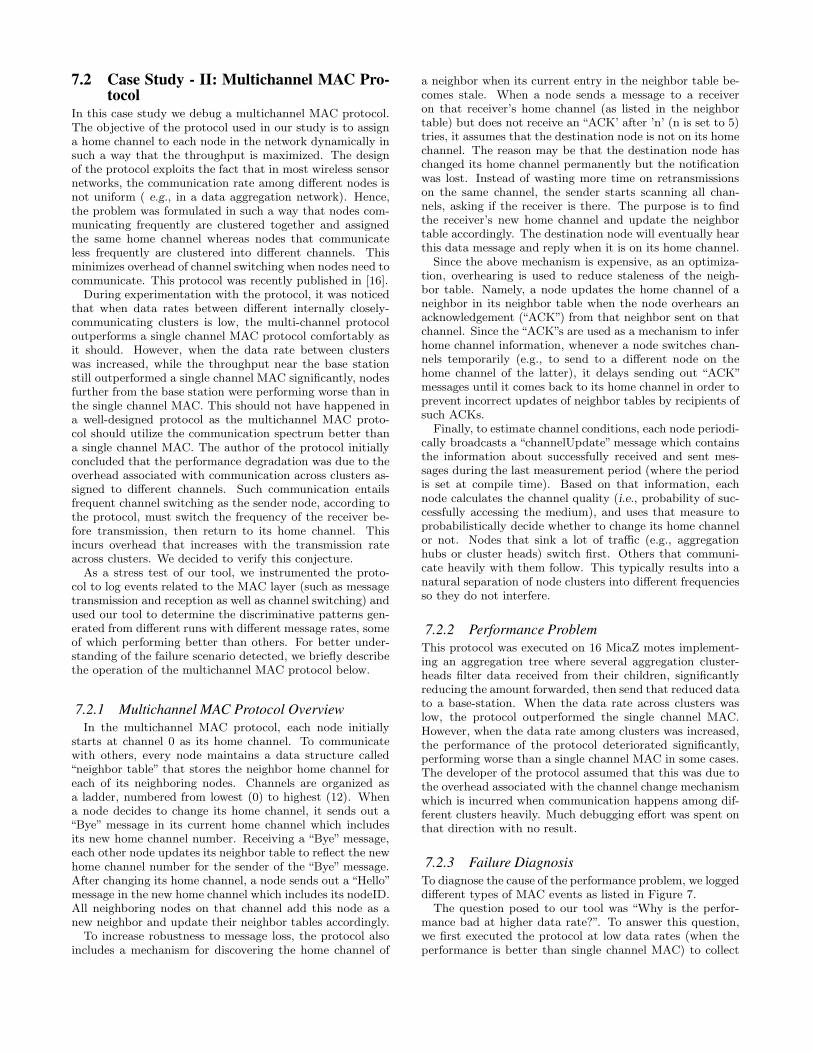
Based on the discriminative frequent pattern, it is clearthat in “good” pile, < Packet Received > event is highlycorrelated with the < Get Current Radio Handle > event.On the other hand, in the “bad” pile, though < PacketReceived > event is present, the other event is missing. Inthe “bad” pile, < Packet Received > is highly correlatedwith < Get serial Send Function > event. From theseobservations, it is clear that proceeding with a < Get serialSend Function > when < Get Current Radio Handle >is missing is the most likely cause of failure.
To explain the error we will briefly describe the way a
<Packet_Received>,<Packet_Sent >,<Get_Current_Radio_Handle><Packet_Received>,<Get_Current_Radio_Handle_Address>,<Get_Current_Radio_Handle>
<Packet_Received>,<Mutex_Unlock_Function>,<Get_Current_Radio_Handle><Packet_Received>,<Disabale_Radio_State>,<Get_Current_Radio_Handle>
<Packet_Received>,<Post_Thread_Task>,<Get_Current_Radio_Handle>
Figure 5: Discriminative frequent patterns foundonly in “good” log for LiteOS bug
<Context_Switch_to_User_Thread>,<Get_Current_Thread_Address>,<Get_Serial_Send_Function><Packet_Received>,<Context_Switch_to_User_Thread>,<Get_Serial_Send_Function>
<Packet_Received>,<Post_Thread_Task>,<Get_Serial_Send_Function><Packet_Received>,<Get_Current_Thread_Index>,<Get_Serial_Send_Function>
<Packet_Received>,<Get_Current_Thread_Address>,<Get_Serial_Send_Function>
Figure 6: Discriminative frequent patterns foundonly in “bad” log for LiteOS bug
received packet is handled in LiteOS. In the application,receiver always registers for receiving packets, then waitsuntil a packet arrives. At that time, the kernel switchesback to the user thread with appropriate packet information.The packet is then processed in the application. However,at very high data rates, another packet can come when theprocessing of the previous packet has not yet been done. Inthat case, LiteOS kernel overwrites the radio receive bufferwith new information even if the user is still using the oldpacket data to process the previous packet.
Indeed, for correct operation, < Packet Received > eventalways has to be followed by < Get Current Radio Handle >event before < Get Serial Send Function > event. Other-wise it crashes the system. Over-writing a receive bufferfor some reason is a very typical bug in sensor networks.This example is presented to illustrate the use of the tool.In section 7.2 we present a more complex example that ex-plores more of the interactive complexity this tool was trulydesigned to uncover.
7.1.3 Comparison with Previous WorkTo compare the performance of our discriminative pattern
mining algorithm with previous work on diagnosing sensornetwork bugs [15, 14], we implemented the pure Apriorialgorithm, used in [14], to generate frequent patterns andperform differential analysis to extract discriminative pat-terns. We did not compare with [15] because that workdid not look for sequences of events that cause problem butrather looked for current state that correlates with immi-nent failure. Hence, it addressed a different problem. Forthis case study, when we applied the Apriori algorithm tothe “good” log and the “bad” log, the list of discriminativepatterns missed the < Packet Received > event completelyand failed to identify the fact that the problem was corre-lated with the timing of packet reception. Moreover, whenwe applied the Apriori algorithm to multiple instances of“good” logs and “bad” logs together, the list of discrimina-tive patterns returned was empty. All the frequent patternsgenerated by Apriori algorithm were canceled at the differ-ential phase. This shows the necessity of our extensions asdescribed in section 4.
7.2 Case Study - II: Multichannel MAC Pro-tocol
In this case study we debug a multichannel MAC protocol.The objective of the protocol used in our study is to assigna home channel to each node in the network dynamically insuch a way that the throughput is maximized. The designof the protocol exploits the fact that in most wireless sensornetworks, the communication rate among different nodes isnot uniform ( e.g., in a data aggregation network). Hence,the problem was formulated in such a way that nodes com-municating frequently are clustered together and assignedthe same home channel whereas nodes that communicateless frequently are clustered into different channels. Thisminimizes overhead of channel switching when nodes need tocommunicate. This protocol was recently published in [16].
During experimentation with the protocol, it was noticedthat when data rates between different internally closely-communicating clusters is low, the multi-channel protocoloutperforms a single channel MAC protocol comfortably asit should. However, when the data rate between clusterswas increased, while the throughput near the base stationstill outperformed a single channel MAC significantly, nodesfurther from the base station were performing worse than inthe single channel MAC. This should not have happened ina well-designed protocol as the multichannel MAC proto-col should utilize the communication spectrum better thana single channel MAC. The author of the protocol initiallyconcluded that the performance degradation was due to theoverhead associated with communication across clusters as-signed to different channels. Such communication entailsfrequent channel switching as the sender node, according tothe protocol, must switch the frequency of the receiver be-fore transmission, then return to its home channel. Thisincurs overhead that increases with the transmission rateacross clusters. We decided to verify this conjecture.
As a stress test of our tool, we instrumented the proto-col to log events related to the MAC layer (such as messagetransmission and reception as well as channel switching) andused our tool to determine the discriminative patterns gen-erated from different runs with different message rates, someof which performing better than others. For better under-standing of the failure scenario detected, we briefly describethe operation of the multichannel MAC protocol below.
7.2.1 Multichannel MAC Protocol OverviewIn the multichannel MAC protocol, each node initially
starts at channel 0 as its home channel. To communicatewith others, every node maintains a data structure called“neighbor table” that stores the neighbor home channel foreach of its neighboring nodes. Channels are organized asa ladder, numbered from lowest (0) to highest (12). Whena node decides to change its home channel, it sends out a“Bye” message in its current home channel which includesits new home channel number. Receiving a “Bye” message,each other node updates its neighbor table to reflect the newhome channel number for the sender of the “Bye” message.After changing its home channel, a node sends out a “Hello”message in the new home channel which includes its nodeID.All neighboring nodes on that channel add this node as anew neighbor and update their neighbor tables accordingly.
To increase robustness to message loss, the protocol alsoincludes a mechanism for discovering the home channel of
a neighbor when its current entry in the neighbor table be-comes stale. When a node sends a message to a receiveron that receiver’s home channel (as listed in the neighbortable) but does not receive an “ACK’ after ’n’ (n is set to 5)tries, it assumes that the destination node is not on its homechannel. The reason may be that the destination node haschanged its home channel permanently but the notificationwas lost. Instead of wasting more time on retransmissionson the same channel, the sender starts scanning all chan-nels, asking if the receiver is there. The purpose is to findthe receiver’s new home channel and update the neighbortable accordingly. The destination node will eventually hearthis data message and reply when it is on its home channel.
Since the above mechanism is expensive, as an optimiza-tion, overhearing is used to reduce staleness of the neigh-bor table. Namely, a node updates the home channel of aneighbor in its neighbor table when the node overhears anacknowledgement (“ACK”) from that neighbor sent on thatchannel. Since the “ACK”s are used as a mechanism to inferhome channel information, whenever a node switches chan-nels temporarily (e.g., to send to a different node on thehome channel of the latter), it delays sending out “ACK”messages until it comes back to its home channel in order toprevent incorrect updates of neighbor tables by recipients ofsuch ACKs.
Finally, to estimate channel conditions, each node periodi-cally broadcasts a “channelUpdate” message which containsthe information about successfully received and sent mes-sages during the last measurement period (where the periodis set at compile time). Based on that information, eachnode calculates the channel quality (i.e., probability of suc-cessfully accessing the medium), and uses that measure toprobabilistically decide whether to change its home channelor not. Nodes that sink a lot of traffic (e.g., aggregationhubs or cluster heads) switch first. Others that communi-cate heavily with them follow. This typically results into anatural separation of node clusters into different frequenciesso they do not interfere.
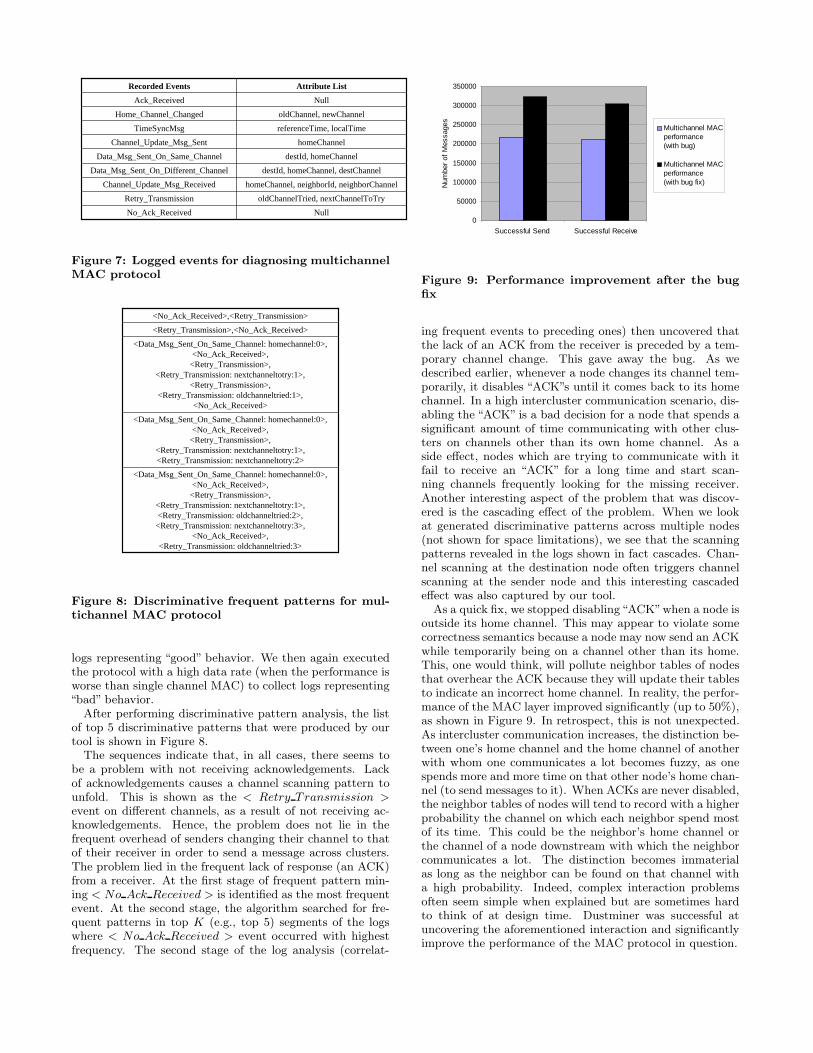
7.2.2 Performance ProblemThis protocol was executed on 16 MicaZ motes implement-ing an aggregation tree where several aggregation cluster-heads filter data received from their children, significantlyreducing the amount forwarded, then send that reduced datato a base-station. When the data rate across clusters waslow, the protocol outperformed the single channel MAC.However, when the data rate among clusters was increased,the performance of the protocol deteriorated significantly,performing worse than a single channel MAC in some cases.The developer of the protocol assumed that this was due tothe overhead associated with the channel change mechanismwhich is incurred when communication happens among dif-ferent clusters heavily. Much debugging effort was spent onthat direction with no result.
7.2.3 Failure DiagnosisTo diagnose the cause of the performance problem, we loggeddifferent types of MAC events as listed in Figure 7.
The question posed to our tool was “Why is the perfor-mance bad at higher data rate?”. To answer this question,we first executed the protocol at low data rates (when theperformance is better than single channel MAC) to collect
Recorded Events Attribute List
Ack_Received Null
Home_Channel_Changed oldChannel, newChannel
TimeSyncMsg referenceTime, localTime
Channel_Update_Msg_Sent homeChannel
Data_Msg_Sent_On_Same_Channel destId, homeChannel
Data_Msg_Sent_On_Different_Channel destId, homeChannel, destChannel
Channel_Update_Msg_Received homeChannel, neighborId, neighborChannel
Retry_Transmission oldChannelTried, nextChannelToTry
No_Ack_Received Null
Figure 7: Logged events for diagnosing multichannelMAC protocol
<No_Ack_Received>,<Retry_Transmission>
<Retry_Transmission>,<No_Ack_Received>
<Data_Msg_Sent_On_Same_Channel: homechannel:0>, <No_Ack_Received>,
<Retry_Transmission>,<Retry_Transmission: nextchanneltotry:1>,
<Retry_Transmission>,<Retry_Transmission: oldchanneltried:1>,
<No_Ack_Received>
<Data_Msg_Sent_On_Same_Channel: homechannel:0>,<No_Ack_Received>,
<Retry_Transmission>,<Retry_Transmission: nextchanneltotry:1>,<Retry_Transmission: nextchanneltotry:2>
<Data_Msg_Sent_On_Same_Channel: homechannel:0>,<No_Ack_Received>,
<Retry_Transmission>,<Retry_Transmission: nextchanneltotry:1>,<Retry_Transmission: oldchanneltried:2>,
<Retry_Transmission: nextchanneltotry:3>,<No_Ack_Received>,
<Retry_Transmission: oldchanneltried:3>
Figure 8: Discriminative frequent patterns for mul-tichannel MAC protocol
logs representing “good” behavior. We then again executedthe protocol with a high data rate (when the performance isworse than single channel MAC) to collect logs representing“bad” behavior.
After performing discriminative pattern analysis, the listof top 5 discriminative patterns that were produced by ourtool is shown in Figure 8.
The sequences indicate that, in all cases, there seems tobe a problem with not receiving acknowledgements. Lackof acknowledgements causes a channel scanning pattern tounfold. This is shown as the < Retry Transmission >event on different channels, as a result of not receiving ac-knowledgements. Hence, the problem does not lie in thefrequent overhead of senders changing their channel to thatof their receiver in order to send a message across clusters.The problem lied in the frequent lack of response (an ACK)from a receiver. At the first stage of frequent pattern min-ing < No Ack Received > is identified as the most frequentevent. At the second stage, the algorithm searched for fre-quent patterns in top K (e.g., top 5) segments of the logswhere < No Ack Received > event occurred with highestfrequency. The second stage of the log analysis (correlat-
0
50000
100000
150000
200000
250000
300000
350000
Successful Send Successful Receive
Num
ber o
f Mes
sage
s
Multichannel MACperformance(with bug)
Multichannel MACperformance(with bug fix)
Figure 9: Performance improvement after the bugfix
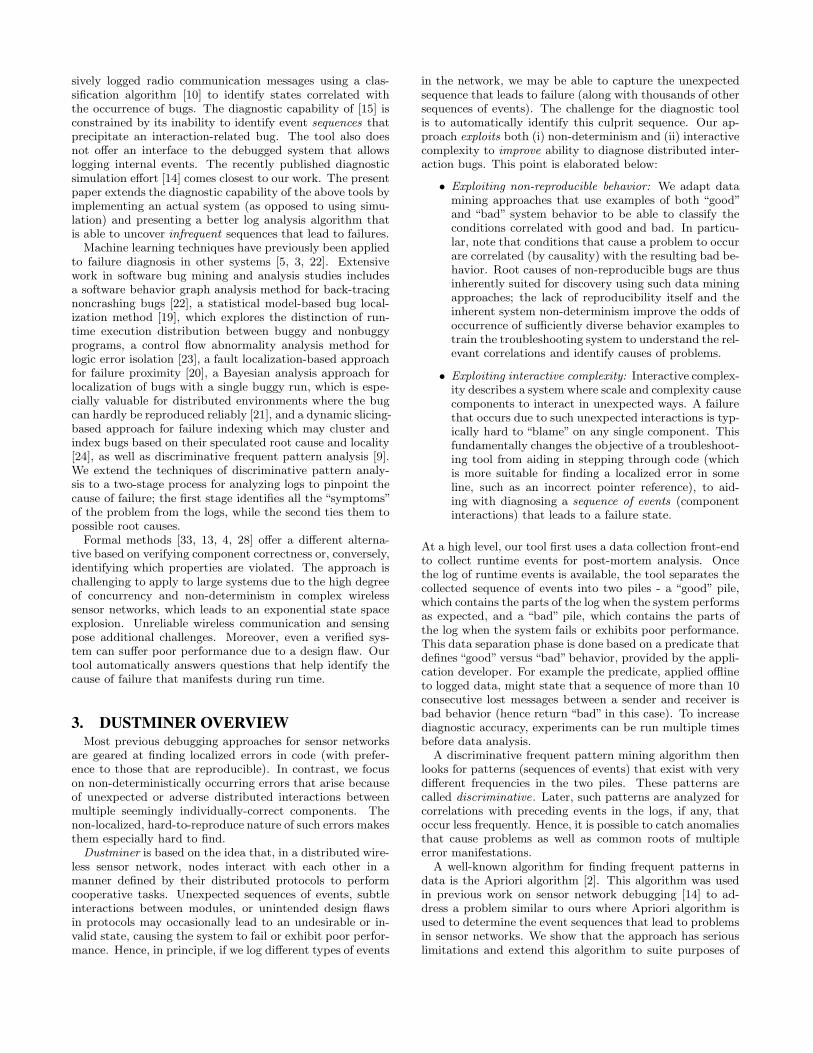
ing frequent events to preceding ones) then uncovered thatthe lack of an ACK from the receiver is preceded by a tem-porary channel change. This gave away the bug. As wedescribed earlier, whenever a node changes its channel tem-porarily, it disables “ACK”s until it comes back to its homechannel. In a high intercluster communication scenario, dis-abling the “ACK” is a bad decision for a node that spends asignificant amount of time communicating with other clus-ters on channels other than its own home channel. As aside effect, nodes which are trying to communicate with itfail to receive an “ACK” for a long time and start scan-ning channels frequently looking for the missing receiver.Another interesting aspect of the problem that was discov-ered is the cascading effect of the problem. When we lookat generated discriminative patterns across multiple nodes(not shown for space limitations), we see that the scanningpatterns revealed in the logs shown in fact cascades. Chan-nel scanning at the destination node often triggers channelscanning at the sender node and this interesting cascadedeffect was also captured by our tool.
As a quick fix, we stopped disabling“ACK”when a node isoutside its home channel. This may appear to violate somecorrectness semantics because a node may now send an ACKwhile temporarily being on a channel other than its home.This, one would think, will pollute neighbor tables of nodesthat overhear the ACK because they will update their tablesto indicate an incorrect home channel. In reality, the perfor-mance of the MAC layer improved significantly (up to 50%),as shown in Figure 9. In retrospect, this is not unexpected.As intercluster communication increases, the distinction be-tween one’s home channel and the home channel of anotherwith whom one communicates a lot becomes fuzzy, as onespends more and more time on that other node’s home chan-nel (to send messages to it). When ACKs are never disabled,the neighbor tables of nodes will tend to record with a higherprobability the channel on which each neighbor spend mostof its time. This could be the neighbor’s home channel orthe channel of a node downstream with which the neighborcommunicates a lot. The distinction becomes immaterialas long as the neighbor can be found on that channel witha high probability. Indeed, complex interaction problemsoften seem simple when explained but are sometimes hardto think of at design time. Dustminer was successful atuncovering the aforementioned interaction and significantlyimprove the performance of the MAC protocol in question.
7.2.4 Comparison with Prior WorkAs before, we compare our results with the result of the
algorithm in [14], which uses the Apriori algorithm. As wementioned earlier, one problem with the previous approachis scalability. Due to huge numbers of events logged for thiscase study (about 40000 for “good” logs and 40000 for “bad”logs), we could not generate frequent patterns of length morethan 2 using the approach in [14]. To generate frequent pat-terns of length 2 for 40000 events in the “good” log, it took1683.02 seconds (28 minutes) and to finish the whole compu-tation including differential analysis it took 4323 seconds (72minutes). With our two-stage mining scheme, it took 5.547seconds to finish the first stage and finishing the whole com-putation including differential analysis took 332.924 seconds(6 minutes). In terms of quality of the generated sequences(which is often correlated with the length of the sequence),our algorithm returned discriminative sequences of lengthupto 8, that was enough to understand the chain of eventscausing the problem as illustrated above. We tried to gen-erate frequent patterns of length 3 with the approach in [14]but terminated the process after one day of computationthat remained in progress. We used a machine of 2.53 GHzspeed and 512 MB RAM. The generated patterns of length2 were insufficient to give insight into the problem.
7.3 Debugging OverheadTo test the impact of logging on application behavior, we
ran the multichannel MAC protocol with logging enabledand without logging enabled with both moderate data rateand high data rate. The network was set as a data aggrega-tion network.
For moderate data rate experiment, the source nodes (nodethat only sends messages) were set to transmit data at a rateof 10 messages/sec, the intermediate nodes were set to trans-mit data at a rate of 2 messages/sec and one node was act-ing as the base station (which only receives messages). Wetested this on a 8 nodes network with 5 source nodes, 2 in-termediate nodes and one base station. Over multiple runs,after we take the average to get a reliable estimate, averagenumber of successfully transmitted messages was increasedby 9.57% and average number of successfully received mes-sages was increased by 2.32%. The most likely reason iswriting to flash was creating a randomization effect whichprobably helped to reduce interference at the MAC layer.
At high data rate, source nodes were set to transmit dataat a rate of 100 messages/sec and intermediate nodes wereset to transmit data at a rate of 20 messages/sec. Overmultiple runs, after we take the average to get a reliable es-timate, average number of successfully transmitted messageswas reduced by 1.09% and average number of successfullyreceived messages was dropped by 1.62%. The most likelyreason is the overhead of writing to flash kicked in at a suchhigh data rate and eventually reduced the advantage expe-rienced at a low data rate.
The performance improvement of the multichannel MACprotocol reported in this paper is obtained by running theprotocol at the high data rate to prevent over estimation.
We realize that this effect on application may change thebehavior of the original application slightly, but that effectseems to be negligible from our experience and did not af-fect the diagnostic capability of the discriminative patternmining algorithm which is inherently robust against minor
statistical variance.As multichannel MAC protocol did not use flash memory
to store any data, we were able to use the whole flash forlogging events. To test the relation between quality of gener-ated discriminative patterns and the logging space used, weused 100KB, 200KB and 400KB of flash space in three dif-ferent experiments. The generated discriminative patternswere similar. We realize that different application has dif-ferent amount of flash space requirements and the amountof logging space may affect the diagnostic capability. Tohelp in severe space constraints, we provide the radio inter-face so users can choose to log at different times instead oflogging continuously. User can also choose to log events atdifferent resolutions (e.g., instead of logging every messagetransmitted, log only every 50th message transmitted).
For LiteOS case study, we did not use flash space at all asthe events were transmitted to basestation (PC) directly us-ing serial connection and eliminate the flash space overheadcompletely which makes our tool easily usable for testbedswhich often provides serial connections.
8. CONCLUSIONIn this paper, we presented a sensor network troubleshoot-
ing tool that helps the developer diagnose root causes of er-rors. The tool is geared towards finding interaction bugs.Very successful examples of debugging tools that hunt forlocalized errors in code have been produced in previous lit-erature. The point of departure in this paper lies in focus-ing on errors that are not localized (such as a bad pointeror an incorrect assignment statement) but rather arise be-cause of adverse interactions among multiple componentseach of which appears to be correctly designed. The cascad-ing channel-scanning example that occurred due to disablingacknowledgements in the MAC Protocol illustrates the sub-tlety of interaction problems in sensor networks. With in-creased distribution and resource constraints, the interac-tive complexity of sensor networks applications will remainhigh, motivating tools such as the one we described. Futuredevelopment of Dustminer will focus on scalability and userinterface to reduce the time and effort needed to understandand use the new tool.
AcknowledgmentsThe authors thank the shepherd, Kay Romer, and the anony-mous reviewers for providing valuable feedback and improv-ing the paper. This work was supported in part by NSFgrants DNS 05−54759, CNS 06−26342, and CNS 06−13665.
9. REFERENCES[1] http://www.cs.waikato.ac.nz/ml/weka/.
[2] R. Agrawal and R. Srikant. Fast algorithms for miningassociation rules. In Proceedings of the TwentiethInternational Conference on Very Large Data Bases(VLDB’94), pages 487–499, 1994.
[3] M. K. Aguilera, J. C. Mogul, J. L. Wiener,P. Reynolds, and A. Muthitacharoen. Performancedebugging for distributed systems of black boxes. InProceedings of the nineteenth ACM symposium onOperating systems principles (SOSP’03), pages 74–89,2003. Bolton Landing, NY, USA.
[4] P. Ballarini and A. Miller. Model checking mediumaccess control for sensor networks. In Proceedings of
the 2nd International Symposium On LeveragingApplications of Formal Methods, Verification andValidation (ISOLA’06), pages 255–262, Paphos,Cyprus, November 2006.
[5] P. Bodık, G. Friedman, L. Biewald, H. Levine,G. Candea, K. Patel, G. Tolle, J. Hui, A. Fox, M. I.Jordan, and D. Patterson. Combining visualizationand statistical analysis to improve operator confidenceand efficiency for failure detection and localization. InProceedings of the 2nd International Conference onAutonomic Computing(ICAC’05), 2005.
[6] Q. Cao, T. Abdelzaher, J. Stankovic, and T. He. Theliteos operating system: Towards unix-likeabstractions for wireless sensor networks. InProceedings of the Seventh International Conferenceon Information Processing in Sensor Networks(IPSN’08), April 2008.
[7] E. Cheong, J. Liebman, J. Liu, and F. Zhao. Tinygals:a programming model for event-driven embeddedsystems. In Proceedings of the 2003 ACM symposiumon Applied computing (SAC’03), pages 698–704, 2003.Melbourne, Florida.
[8] E. Ertin, A. Arora, R. Ramnath, and M. Nesterenko.Kansei: A testbed for sensing at scale. In Proceedingsof the 4th Symposium on Information Processing inSensor Networks (IPSN/SPOTS track), 2006.
[9] G. D. Fatta, S. Leue, and E. Stegantova.Discriminative pattern mining in software faultdetection. In Proceedings of the 3rd internationalworkshop on Software quality assurance (SOQUA ’06),pages 62–69, 2006.
[10] E. Frank and I. H. Witten. Generating accurate rulesets without global optimization. In Proceedings of theFifteenth International Conference on MachineLearning (ICML’98), pages 144–151, 1998.
[11] D. Gay, P. Levis, R. von Behren, M. Welsh,E. Brewer, and D. Culler. The nesc language: Aholistic approach to networked embedded systems. InProceedings of Programming Language Design andImplementation (PLDI’03), pages 1–11, June 2003.
[12] L. Girod, J. Elson, A. Cerpa, T. Stathopoulos,N. Ramanathan, and D. Estrin. Emstar: a softwareenvironment for developing and deploying wirelesssensor networks. In Proceedings of the annualconference on USENIX Annual Technical Conference(ATEC’04), pages 24–24, Boston, MA, 2004.
[13] Y. Hanna, H. Rajan, and W. Zhang. Slede:Lightweight specification and formal verification ofsensor networks protocols. In Proceedings of the FirstACM Conference on Wireless Network Security(WiSec), Alexandria, VA, March-April 2008.
[14] M. M. H. Khan, T. Abdelzaher, and K. K. Gupta.Towards diagnostic simulation in sensor networks. InProceedings of International Conference on DistributedComputing in Sensor Systems (DCOSS), 2008. Greece.
[15] M. M. H. Khan, L. Luo, C. Huang, andT. Abdelzaher. Snts: Sensor network troubleshootingsuite. In Proceedings of International Conference onDistributed Computing in Sensor Systems (DCOSS),2007. Santa Fe, New Mexico, USA.
[16] H. K. Lee, D. Henriksson, and T. Abdelzaher. Apractical multi-channel medium access control
protocol for wireless sensor networks. In Proceedings ofInternational Conference on Information Processing inSensor Networks (IPSN’08), St. Louis, Missouri, April2008.
[17] P. Levis and D. Culler. Mate: a tiny virtual machinefor sensor networks. In Proceedings of the 10thinternational conference on Architectural support forprogramming languages and operating systems, SanJose, California, October 2002.
[18] P. Levis, N. Lee, M. Welsh, and D. Culler. Tossim:accurate and scalable simulation of entire tinyosapplications. In Proceedings of the 1st internationalconference on Embedded networked sensor systems(SenSys’03), pages 126–137, Los Angeles, California,USA, 2003.
[19] C. Liu, L. Fei, X. Yan, J. Han, and S. P. Midkiff.Statistical debugging: A hypothesis testing-basedapproach. IEEE Transactions on SoftwareEngineering, 32:831–848, 2006.
[20] C. Liu and J. Han. Failure proximity: a faultlocalization-based approach. In Proceedings of the 14thACM SIGSOFT international symposium onFoundations of software engineering (SIGSOFT’06/FSE-14), pages 46–56, 2006.
[21] C. Liu, Z. Lian, and J. Han. How bayesians debug. InProceedings of the Sixth International Conference onData Mining (ICDM’06), pages 382–393, December2006.
[22] C. Liu, X. Yan, L. Fei, J. Han, and S. P. Midkiff.Sober: statistical model-based bug localization. InProceedings of the 13th ACM SIGSOFT internationalsymposium on Foundations of software engineering(FSE-13), 2005. Lisbon, Portugal.
[23] C. Liu, X. Yan, and J. Han. Mining control flowabnormality for logic error isolation. In Proceedings of2006 SIAM International Conference on Data Mining(SDM’06), Bethesda, MD, April 2006.
[24] C. Liu, X. Zhang, J. Han, Y. Zhang, and B. K.Bhargava. Failure indexing: A dynamic slicing basedapproach. In Proceedings of the 2007 IEEEInternational Conference on Software Maintenance(ICSM’07), Paris, France, October 2007.
[25] L. Luo, T. F. Abdelzaher, T. He, and J. A. Stankovic.Envirosuite: An environmentally immersiveprogramming framework for sensor networks. ACMTransactions on Embedded Computing Systems,5(3):543–576, 2006.
[26] L. Luo, T. He, G. Zhou, L. Gu, T. Abdelzaher, andJ. Stankovic. Achieving Repeatability ofAsynchronous Events in Wireless Sensor Networkswith EnviroLog. In Proceedings of the 25th IEEEInternational Conference on ComputerCommunications (INFOCOM’06), pages 1–14, 2006.
[27] S. R. Madden, M. J. Franklin, J. M. Hellerstein, andW. Hong. Tinydb: an acquisitional query processingsystem for sensor networks. ACM Transactions onDatabase Systems, 30(1):122–173, 2005.
[28] P. Olveczky and S. Thorvaldsen. Formal modeling andanalysis of wireless sensor network algorithms inreal-time maude. In Proceedings of the InternationalParallel and Distributed Processing Symposium(IPDPS), Rhodes Island, Greece, April 2006.
[29] J. Polley, D. Blazakis, J. McGee, D. Rusk, and J. S.Baras. Atemu: A fine-grained sensor networksimulator. In Proceedings of the First InternationalConference on Sensor and Ad Hoc Communicationsand Networks (SECON’04), pages 145–152, SantaClara, CA, October 2004.
[30] N. Ramanathan, K. Chang, R. Kapur, L. Girod,E. Kohler, and D. Estrin. Sympathy for the sensornetwork debugger. In Proceedings of the 3rdinternational conference on Embedded networkedsensor systems (SenSys’05), pages 255–267, 2005.
[31] R. Szewczyk, J. Polastre, A. Mainwaring, andD. Culler. Lessons from a sensor network expedition.In Proceedings of the First European Workshop onSensor Networks (EWSN), 2004.
[32] G. Tolle and D. Culler. Design of anapplication-cooperative management system forwireless sensor networks. In Proceedings of the SecondEuropean Workshop on Wireless Sensor Networks(EWSN’05), pages 121–132, Istanbul, Turkey,February 2005.
[33] P. Volgyesi, M. Maroti, S. Dora, E. Osses, andA. Ledeczi. Software composition and verification forsensor networks. Science of Computer Programming,56(1-2):191–210, 2005.
[34] Y. Wen and R. Wolski. s2db: A novel simulation-baseddebugger for sensor network applications. UCSB 2006,2006-01.
[35] Y. Wen, R. Wolski, and G. Moore. Disens: scalabledistributed sensor network simulation. In Proceedingsof the 12th ACM SIGPLAN symposium on Principlesand practice of parallel programming (PPoPP’07),pages 24–34, 2007. San Jose, California, USA.
[36] G. Werner-Allen, P. Swieskowski, and M. Welsh.Motelab: A wireless sensor network testbed. InProceedings of the Fourth International Conference onInformation Processing in Sensor Networks(IPSN’05), Special Track on Platform Tools andDesign Methods for Network Embedded Sensors(SPOTS), pages 483–488, April 2005.
[37] K. Whitehouse, G. Tolle, J. Taneja, C. Sharp, S. Kim,J. Jeong, J. Hui, P. Dutta, and D. Culler. Marionette:Using rpc for interactive development and debuggingof wireless embedded networks. In Proceedings of theFifth International Conference on InformationProcessing in Sensor Networks: Special Track onSensor Platform, Tools, and Design Methods forNetwork Embedded Systems (IPSN/SPOTS), pages416–423, Nashville, TN, April 2006.
[38] J. Yang, M. L. Soffa, L. Selavo, and K. Whitehouse.Clairvoyant: a comprehensive source-level debuggerfor wireless sensor networks. In Proceedings of the 5thinternational conference on Embedded networkedsensor systems (SenSys’07), pages 189–203, 2007.