Embed Size (px)
Citation preview

1
Metagenomic assembly reveals dynamic viral populations in hypersaline systems 1 2 Joanne B. Emerson1#, Brian C. Thomas1, Karen Andrade2, Eric E. Allen3,4, Karla B. 3 Heidelberg5, Jillian F. Banfield1,2 4 5 1Department of Earth and Planetary Science, University of California, Berkeley/307 6 McCone Hall/Berkeley, CA 94720-4767 7 2Department of Environmental Science, Policy, and Management, University of 8 California, Berkeley/54 Mulford Hall/Berkeley, CA 94720 9 3Marine Biology Research Division, Scripps Institution of Oceanography, La Jolla, CA, 10 USA 11 4Division of Biological Sciences, University of California, San Diego/La Jolla, CA 12 92093-0202 13 5Department of Biological Sciences, University of Southern California, Los Angeles, CA 14 90089 15 #E-mail: [email protected] 16 17 18 19 20 Running Title: Dynamic Haloviral Populations 21 22 23
Copyright © 2012, American Society for Microbiology. All Rights Reserved.Appl. Environ. Microbiol. doi:10.1128/AEM.01212-12 AEM Accepts, published online ahead of print on 6 July 2012

2
Abstract: 24 Viruses of Bacteria and Archaea play important roles in microbial evolution and 25 ecology, yet viral dynamics in natural systems remain poorly understood. Here, we 26 created de novo assemblies from 6.4 Gbp of metagenomic sequence from eight 27 community viral concentrate samples, collected from 12 hours to three years apart from 28 hypersaline Lake Tyrrell (LT), Victoria, Australia. Through extensive manual assembly 29 curation, we reconstructed seven complete and 28 partial, novel genomes of viruses and 30 virus-like entities (VLEs, which could be viruses or plasmids). We tracked these 35 31 populations across the eight samples and found that they are generally stable on the 32 timescale of days and transient on the timescale of years, with some exceptions. Cross-33 detection of the 35 LT populations in three previously described haloviral metagenomes 34 was limited to a few genes, and most previously sequenced haloviruses were not detected 35 in our samples, though three were detected upon reducing our detection threshold from 36 90% to 75% nucleotide identity. Similar results were obtained when we applied our 37 methods to haloviral metagenomic data previously reported from San Diego, CA: 10 38 contigs that we assembled from that system exhibited a variety of detection patterns on a 39 weeks-to-one-month scale but were generally not detected in LT. Our results suggest that 40 most haloviral populations have a limited, or possibly a temporally variable, global 41 distribution. This study provides high-resolution insight into viral biogeography and 42 dynamics, and it places “snapshot” viral metagenomes, collected at a single time and 43 location, in context. 44 45 46
3
Introduction: 47 48 As the most abundant and least well characterized biological entities on Earth, 49 viruses have been described as the most significant, untapped reservoir of biodiversity 50 (66). Viruses contribute directly to biogeochemical cycles through cell lysis, and they 51 have the potential to bring about catastrophic shifts in community structure over short 52 timescales. In addition to their role as predators, some viruses can provide an auxiliary 53 gene pool that may increase the fitness of their hosts (29, 64, 77). Despite a growing 54 appreciation for the ecological role of viruses and an increase in viral genomic 55 information in public databases, little is known about viral population dynamics in 56 natural systems. 57
While a number of previous studies have investigated viral stability and 58 persistence (11, 54, 60, 63, 71, 72, 78, 80), few metagenomic studies have evaluated viral 59 population stability. In part, this is because low sampling depth has prevented tracking of 60 genes or genomes, and also because many metagenomic studies are “snapshots” of the 61 community at a single time and location (52). In a metagenomic study from a San Diego 62 halovirome, the use of tBLASTx similarity to known viruses suggested that the most 63 abundant haloviral taxa were conserved across space and time, while modeling suggested 64 that haloviral genotypic variants changed on the timescale of days (49). However, 65 because most viral sequences do not have representatives in public databases, most viral 66 populations cannot be identified in metagenomic data, nor can they be amplified in 67 survey studies. In addition, well-documented high rates of horizontal gene transfer in 68 viral populations (21) mean that tracking individual viral genes (that could be present in 69

4
multiple, unrelated populations) could be misleading. For these reasons, genome-level 70 resolution is important for a comprehensive understanding of viral population dynamics 71 in natural systems. 72
Consistent with Santos et al. (58), we use the term “halovirus” to describe viruses 73 found in hypersaline systems, including bacterial, archaeal, and (potentially) eukaryotic 74 viruses. Haloviral isolates and communities have been the subject of a number of 75 previous studies, which have been extensively reviewed (15, 30, 45, 46, 58). 76 Outnumbering cells 10- to 100-fold (46), virus counts in hypersaline waters report at least 77 107 viruses per ml (15) and up to 2 × 10⁹ per ml in crystallizer ponds (20). Several 78 haloviral morphologies have been observed through TEM analysis, including spindle-79 shaped (the most abundant form), spherical, icosahedral, filamentous, and head-tail (41, 80 61). Recently, metagenomic techniques have been applied to the study of viral 81 communities (17, 27), and in hypersaline systems, such studies have suggested that viral 82 communities are relatively diverse (14, 49, 57, 61) and show some global conservation 83 (57, 61). However, given the poor representation of viruses in public databases (52) and 84 the lack of a universal marker gene for viruses, it is difficult to track viral populations 85 across samples. 86 As in many previously studied hypersaline systems (12, 34, 39, 57), our study 87 site, Lake Tyrrell (LT), Victoria, Australia, is dominated by halophilic Archaea, including 88 Haloquadratum walsbyi (40 and S. Podell et al., unpublished). Ultra-small Archaea 89 (Nanohaloarchaea) represent 10-25% of the archaeal community, and halophilic Bacteria 90 such as Salinibacter ruber represent approximately 20% of the total community (40). A 91 small number of microbial eukaryotes are present, with populations dominated by the 92

5
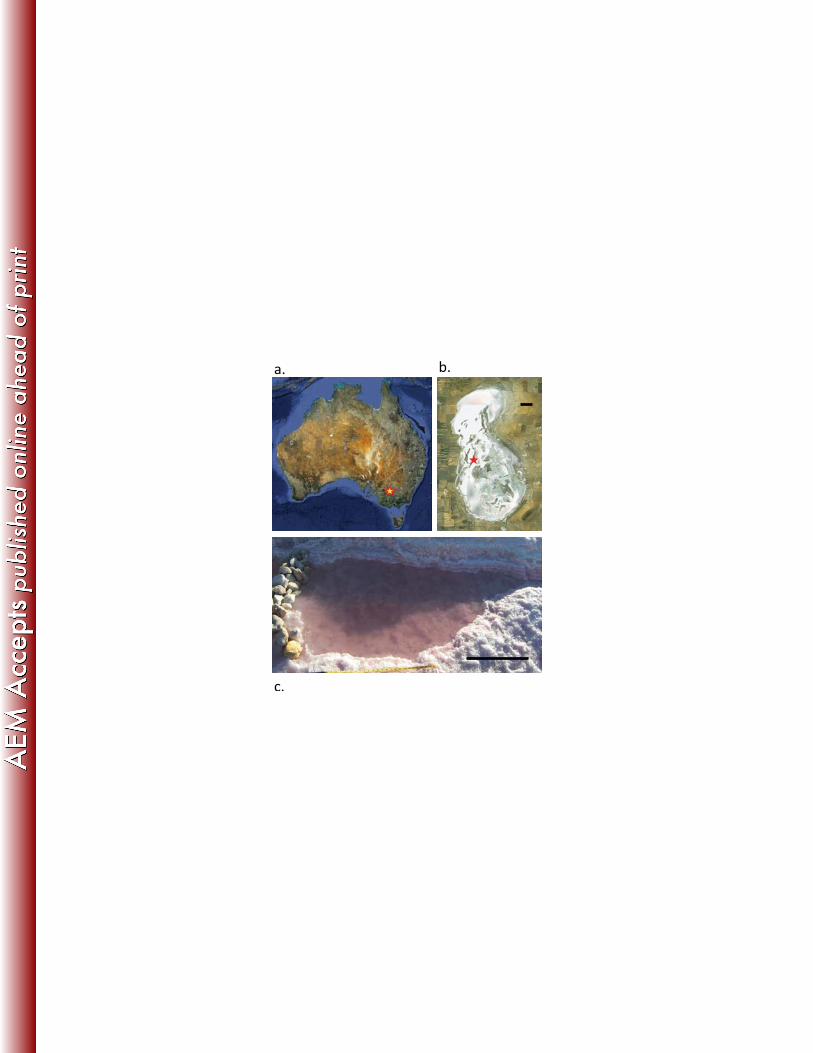
predatory flagellate, Colpodella edax, and the green alga, Dunaliella salina (J. Holm et 93 al., unpublished). Here, we sought to characterize viral populations in the Lake Tyrrell 94 system and place them in the context of other hypersaline systems. We tested the 95 postulate that deep metagenomic sequencing would allow for extensive genomic 96 reconstruction of the dominant viral populations in this moderately complex ecosystem, 97 and we sought to determine whether tracking complete and near-complete genomes could 98 provide insight into haloviral biogeography and population dynamics. 99 100 Materials and Methods: 101 102 Sample site: 103 Samples were collected from Lake Tyrrell (LT), a hypersaline, thalassohaline lake 104 in northwestern Victoria, Australia (Figure 1), located 380 km east of Adelaide (35.309oS 105 142.795oE). It has a surface area of ~160 km2 and is the largest saline groundwater 106 discharge lake in the Murray Basin. The system is hydrologically, geologically, and 107 biogeochemically well-characterized (31, 76). In winter, the lake contains ~50 cm water 108 with an average salt content >250 g.L-1. In summer months (when sampling occurred for 109 this study), the water evaporates, leaving a ~7 cm thick halite crust and residual brines 110 with salt concentrations generally >330 g.L-1. 111 112 Sample collection: 113 Between 2007 and 2010, eight 10 L surface water samples (0.3 m depth) were 114 collected during the Austral summer from two pools, A and B, ~300 m apart in Lake 115
6
Tyrrell (Table 1). Pool A is ~6 m in diameter and ~2 m deep, but during the collection of 116 sample 2007At1, pool A was connected to and surrounded by a shallow (~10 cm) but 117 expansive (~100 m) body of water due to recent rainfall, which evaporated and/or was 118 removed by wind prior to the collection of sample 2007At2. In 2009 and 2010, small 119 pools at site B were isolated through artificial damming (see Figure 1c). In 2009 the site 120 B sampling pool was ~1.5 m in length and ~20 cm deep; in 2010 the site B pool was ~6 121 m in diameter and ~0.5 m deep. Sites A and B are isolated in the summer, but the lake 122 fills in the winter, resulting in annual mixing between the sites. Sample names include 123 the year and site and, when part of a days-scale time series, the time point (e.g., t1, t2, 124 etc.). 125 Water samples were passed through a 20 µm Nytex prefilter and then sequentially 126 filtered through polyethersulfone, 142 mm diameter membrane filters (Pall Corporation, 127 NY, USA) of decreasing porosities (3 µm, 0.8 µm, 0.1 µm), using a peristaltic pump. We 128 acknowledge that some viruses could be removed through 0.1 µm filtration, though to the 129 best of our knowledge, all known haloviruses have capsids smaller than 0.1 µm (15). 130 Post-0.1 µm filtrates were concentrated to 200 ml with a Pellicon II tangential flow 131 filtration (TFF) device (Millipore, MA, USA) fitted with a 30 kDa membrane. Molecular 132 biology grade glycerol was added to a final concentration of 10% by volume. Samples 133 were stored on dry ice for a maximum of six days, followed by -80°C freezer storage for 134 up to three years. 135 136 Epifluorescence Microscopy: 137

7
Prior to DNA extraction, we confirmed successful removal of cells from viral 138 concentrates through epifluorescence microscopy (65) on two samples (2007At1 and 139 2007At2), but unfortunately, the Anodisc 0.02 µm, 25 mm Al2O3 filters (Whatman Inc., 140 NJ, USA) required for this analysis were not being produced when the remaining six 141 samples were processed. 142 143 DNA Extraction: 144 A detailed DNA extraction protocol is presented in the Supplemental Material. 145 Briefly, each post-0.1 µm filtered TFF concentrate was refiltered through 0.2 µm and 146 ultracentrifuged for 3 hours at 12°C and 32,000 rpm. Pellets were resuspended in 250 µl 147 1 x TE (Tris-EDTA), followed by phenol:chloroform extraction and ethanol precipitation. 148 The MoBio UltraClean 15 DNA Purification Kit (Carlsbad, CA, USA) was used to purify 149 the DNA according to the manufacturer’s instructions. DNA amplification was not 150 necessary. 16S rRNA genes were PCR amplified with universal primers for Bacteria 151 (27F, 1492R) and Archaea (522F, 1354R) for all samples as a contamination check. 152 Samples with high quality DNA and no 16S rRNA gene amplification were sent to the J. 153 Craig Venter Institute (JCVI, Rockville, MD, USA) for library construction and 154 sequencing. These methods should allow for sequencing of both ssDNA and dsDNA 155 viruses, though without multiple-displacement amplification, ssDNA viruses are not 156 likely to be enriched, as reported in some previous studies (e.g., 25). 157 158 Library Construction and Sequencing: 159

8
For the two 454-Titanium (454-Ti), single-read pyrosequenced samples (2010Bt1 160 and 2010Bt3), library construction, emulsion PCR (emPCR), enrichment, and 454 161 sequencing were performed by the JCVI, according to the standard operating procedures 162 of 454 Life Sciences (Bradford, CT, USA), with a few modifications. Specifically, 163 quantitative PCR (qPCR) was used to determine the number of molecules needed for 164 emPCR. In addition, automation (BioMek FX, Beckman Coulter, Brea, CA, USA) was 165 used to break the emulsions after emPCR, and butanol was added to enable easier sample 166 handling during the breaking process. The REM (Robotic Enrichment Module) from 167 Roche (Basel, Switzerland) was used to automate the bead enrichment process. 168 The six Illumina paired-end (PE) samples (2007At1, 2007At2, 2009B, 2010Bt2, 169 2010Bt4, and 2010A) underwent library construction and sequencing at the JCVI, 170 according to Illumina’s (San Diego, CA, USA) standard operating procedures with a few 171 modifications. Specifically, DNA was sheared using the Covaris (Woburn, MA, USA) 172 S2 or E210 systems, and all clean-up steps incorporated Agencourt AMPure XP beads 173 (Beckman Coulter). The libraries were quantitated and quality controlled using the 174 Agilent High Sensitivity DNA kit (Santa Clara, CA, USA). Cluster generation and 175 paired-end sequencing were completed according to Illumina’s standard protocol. 100 176 cycles were performed, resulting in 100 bp reads. 177 Sequencing reads from each of the eight samples and assembled nucleotide 178 sequences for the seven composite genomes and 28 genome fragments (see below) have 179 been submitted to GenBank (BioProject ID: PRJNA81851). 180 181 Assembly: 182

9
Each LT sample was independently assembled. First, reads were trimmed for 183 quality, either with an in-house script that removes low-quality bases from Illumina 184 reads, or with sff_extract (454 Life Sciences) for 454 reads. Each of the two LT 454-Ti 185 samples was assembled via Newbler with default parameters (33), and the same 186 parameters were used to coassemble reads from four hypersaline virome samples from 187 previous studies of a saltern near San Diego, CA, reported by another group (14, 49). For 188 the six LT Illumina samples, a variety of assembly algorithms and parameters were 189 attempted and optimized, either to generate the best assembly for a given sample (i.e., the 190 most large contigs with relatively uniform within-contig coverage; all Illumina samples, 191 except for 2009B) or to generate the best assembly for a given genome (i.e., the greatest 192 number of large contigs at the expected coverage depth for a given population; applied to 193 sample 2009B, in order to improve recovery of LTV2; coincidentally, this was also the 194 best assembly for sample 2009B). The ABySS algorithm (62) with kmer size 45 and a 195 minimum of 10 read pairs required to join contigs was used for samples 2007At1, 196 2007At2, 2010Bt2, 2010Bt4, and 2010A. The Velvet algorithm (81) with kmer size 95 197 was used for sample 2009B. Autoassembly correctness was evaluated manually, using 198 Consed (19) and Tablet (35). 199 We applied previously described manual metagenomic assembly curation methods 200 (e.g., 1, 2, 6, 38, 74) to our Illumina data. Details of manual assembly curation are in the 201 Supplemental Material, but briefly, we took advantage of paired read information and 202 sequencing overlaps not utilized by the assembly algorithm, and we ensured that there 203 was relatively uniform coverage throughout each genome or genome fragment. 204 Varying degrees of manual curation were attempted for each sample, so the number 205
10
of genomes or genome fragments that assembled from a given sample is not necessarily 206 indicative of sample complexity. We used BLASTn to screen all 33 non-circularized 207 contigs > 10 kb for similarity to each other and to the seven complete genomes, resulting 208 in 28 unique genome fragments (10,148 - 40,896 bp). The genome fragments share 209 regions up to 595 bp in length (78% nucleic acid identity), and a few are technically 210 scaffolds, connected by N’s generated by the assembly algorithm. 211 212 Annotation: 213 Genes were predicted from the seven composite genome sequences, using 214 Prodigal (22). Annotation of genes was performed using a series of sequence similarity 215 searches to known sequence databases. We used BLASTp to compare predicted protein 216 sequences to the KEGG and UniRef90 databases, giving priority to reciprocal best-217 BLAST hits, and then we investigated protein motifs using InterProScan (48). The 28 218 genome fragments were not annotated, but we did conduct BLAST searches to ensure 219 that their sequences are consistent with viruses or virus-like entities (data not shown). 220 221 Fragment recruitment: 222 Accounting for different biases in the two sequencing technologies was beyond 223 the scope of this study, but we did make read lengths comparable. To approximate 224 Illumina-sized reads, 454 reads were cut in silico with an in-house script, which generates 225 consecutive 100 bp fragments from the start of each 454 read. The last sequence 226 increment was retained if it was ≥ 72 bp. For simplicity, these read fragments are called 227 reads throughout the text. Using gsMapper (Newbler, 33) with a minimum overlap 228

11
length of 40 and a minimum overlap identity of 90%, unique reads from each of the eight 229 samples were used as queries against the seven genomes or the 28 genome fragments as 230 references (duplicate reads were removed, though nearly identical mapping counts were 231 obtained when duplicate reads were included). Similarly, reads from three previously 232 described haloviral metagenomes (14, 49, 57, 61) were used as queries against the 35 LT 233 genomes and genome fragments, and 10 previously described haloviral genome 234 sequences [His1, His2 (10); HF1 (67); HF2 (68); HRPV-1 (44); HHPV- 1 (51); SH1 (8); 235 BJ1 (42); ΦCh1 (26); EHP-1 (55)] were used as references for mapping reads from each 236 of our eight samples. The same fragment recruitment parameters were applied to data 237 from the previously published San Diego halovirome (14, 49), using two sets of 238 references (first, the 10 largest contigs assembled directly from the San Diego samples, 239 and second, the 10 previously sequenced haloviruses described above). Ace files were 240 analyzed in Consed (19) to determine the number of reads that mapped to each genome 241 or genome fragment by sample. 242 Time series analysis was applied to the 35 complete and near-complete genomes 243 from LT and to the 10 contigs from San Diego (SD). We counted the number of reads 244 that mapped to each genome or genome fragment in each sample (the mapping count, 245 Tables S1 and S2) and then normalized by genome size or contig length and the total 246 number of reads in the sample (normalization details are in the Supplemental Material). 247 For the seven complete LT genomes and 10 contigs from SD, at least 1x coverage across 248 at least 30% of the genome was required for detection. Manual determination of percent 249 coverage was not practical for the 28 LT genome fragments, so we set their detection 250 limit as equal to or greater than the smallest normalized mapping count for any genome 251

12
fragment in the sample from which it assembled (a proxy for the smallest number of 252 reads that could generate a genome fragment). This could lead to underestimates of 253 detection of low abundance populations. 254 255 Bioinformatic assessments of library contents: 256 After assembly, Prodigal-predicted genes (22) from all contigs larger than 500 bp 257 from all viral concentrate libraries (30,525 non-redundant genes, clustered at 95% 258 nucleotide identity) were run through InterProScan (48) to identify domains and HMMs, 259 through BLASTp against NCBI’s non-redundant protein database to identify best BLAST 260 hits, and through BLASTn against the SILVA 16S rRNA gene database (47) to identify 261 potential cellular contamination. We also used fragment recruitment with the same 262 detection cutoffs as described above (at least 1x coverage across at least 30% of the 263 genome) to search the LT unassembled reads for 19 previously sequenced halophilic 264 plasmids available from the ACLAME database (28). We compared their presence in the 265 eight LT viral concentrates to their presence in libraries from three LT 0.8 µm filters 266 sequenced from the same samples (unpublished data collected prior to TFF concentration 267 from samples 2007At1, 2009B, and 2010Bt3). 268 269 270 Results: 271 272 Through extensive manual curation of the LT Illumina assemblies, we 273 reconstructed complete, composite genomes from six LT viruses (LTV1, LTV2, and 274

13
LTV4-7) and one virus-like entity (LTVLE3). By virus-like entity (VLE), we mean virus 275 or plasmid (see below). Because in silico circularization is an added assurance of 276 assembly correctness, each genome was considered closed when it circularized. 277 However, from our dataset, only circular or circularly permuted viruses or plasmids 278 should circularize. In order to observe trends for a larger number of populations and 279 genome types, we considered all unique contigs > 10 kb (the seven circular genomes and 280 28 additional genome fragments) to be population representatives. Because these 281 genomes and genome fragments were generated from metagenomic data, they are 282 composite sequences that represent heterogeneous, non-clonal populations. 283 It should be noted that our DNA extraction protocol could result in the inclusion 284 of extracellular plasmids and other free DNA in our metagenomic libraries because we 285 did not include a DNase treatment prior to virion lysis (a DNase treatment was attempted 286 but resulted in complete degradation of all DNA, see Supplemental Material). Not 287 surprisingly, only ~15% of the 30,525 viral concentrate genes from all samples had 288 functional predictions, and of those, nearly all would be consistent with, but not 289 necessarily exclusive to, viruses. We searched the InterProScan annotations for genes 290 that could be linked relatively (though not entirely) unambiguously to plasmids (i.e., 291 conjugative transfer genes) or viruses (i.e., structural proteins, terminases, and cell 292 surface recognition/degradation proteins). We found one conjugative transfer gene and 293 566 virus-specific genes. Of 49 ParB domain-containing proteins, which are known to be 294 present in both viruses and plasmids, 25 had best BLASTp hits to predicted proteins from 295 a Spanish halovirome (57). One gene of the 30,525 had significant BLASTn similarity to 296 a 16S rRNA gene from a halophilic archaeon. Of the 19 plasmids from the ACLAME 297

14
database, 12 were detected in LT. All 12 were detected on the 0.8 µm filters. Two were 298 also detected in the viral concentrates (one in all eight samples and a second only in 299 sample 2010Bt4). The plasmid detected in all eight viral concentrate samples was 10-115 300 times (average 55 times) more abundant on the 0.8 µm filters, and several ~5-10 kb 301 regions of the plasmid were not detected in the viral concentrates, though nearly the 302 entire sequence was present on the 0.8 µm filters. The plasmid detected in sample 303 2010Bt4 was nine times more abundant on the 0.8 µm filter from the same time series 304 (sample 2010Bt3; no 0.8 um filter was sequenced from exactly the same sample). It is 305 certainly possible that some of the detected regions within these plasmids could be 306 contained on unknown viruses, but conservatively, we assume that they are indicative of 307 a small amount of plasmid contamination. 308 We found viral structural genes in LTV1, 2, and 4-7, so we call them viruses. 309 LTVLE3 contained annotation that would be consistent with both viruses and plasmids, 310 so we categorize it a VLE. The 28 genome fragments often did not represent genome 311 portions large enough to contain genes specific to viruses or plasmids, but given that the 312 libraries appear to be mostly viral, we suspect that they are mostly or exclusively viral as 313 well. Still, to ensure correctness, we refer to all LT populations together as viruses and 314 VLEs. Because the general trends that we observed across the 35 LT populations were 315 also observed for populations that we can confidently identify as viral (Figure 2a-b and d-316 g), and because similar trends were also observed in a viral metagenomic dataset from 317 San Diego, CA (see below), we are confident that our findings accurately represent 318 haloviral population dynamics, regardless of any potential contamination in our libraries. 319

15
Features of each of the seven composite genomes are in Table 2, annotations are 320 in Table 3, and genome representations are in Figure 3. In the following sections, 321 abundance descriptions are based on relative representation in our libraries. For example, 322 low abundance indicates presence above the detection limit but representation by a 323 relatively small number of recruited reads. 324 325 Characteristics and time series analysis of the seven LT genomes: 326 LTV1 was observed in a single sample, 2007At2 (Figure 2a), which was collected 327 after the sampling pool at site A had returned to its normal size, following a rainfall event 328 prior to the start of the two-sample time series. Despite the change in pool size, no 329 obvious geochemical differences were observed between the two samples (Table 1 and 330 Table S3). LTV2 was present in all eight samples and especially abundant in the 2010 331 site B four-day time series, in which it represented 2.2 – 2.7% of the reads (Figure S1), 332 though it was assembled from sample 2009B, in which it accounts for only 0.3% of the 333 reads. Nearly the entire LTV2 genome was detected in all samples (Figure 2b). The 334 remaining five complete genomes were detected in more than one sample but not in all 335 samples in the three-year study period (Figure 2). 336 LTVLE3 has functional annotation that would be consistent with plasmids or 337 viruses (Table 3). Of its predicted proteins, the one perhaps most often associated with 338 plasmids is a ParA domain-containing protein, which, notably, has a significant BLASTp 339 hit to a protein in halovirus ΦCh1 (E value 8e-43, 83% coverage). In addition, two of 340 LTVLE3’s best BLAST hits are to haloviruses. Interestingly, LTVLE3 contains a 341 rhodopsin with high similarity to the Nanohaloarchaeal “xenorhodopsins” (75). 342

16
LTV4 was assembled from the smallest fraction of a sample, representing only 343 0.068% of the reads from sample 2010Bt4. BLAST hits from LTV4 were to a variety of 344 bacteriophage and bacteria, including two conserved hypothetical proteins with hits to 345 Salinibacter ruber (37). LTV4 was present at relatively low abundance in all six samples 346 from 2009-2010 but was not detected in the 2007 samples (Figure 2d), a pattern shared 347 with LTV5 (Figure 2e). The vast majority of the LTV5 genome is novel, but three 348 consecutive predicted genes had best hits to Natrialba magadii, a haloalkaliphilic 349 archaeon (24). 350 LTV6 was the only one of the seven genomes to show dynamic presence in the 351 2010 four-day time series, in which it was not detected in 2010Bt1-3 but was present at 352 low abundance in sample 2010Bt4. Though below the 30% coverage cutoff required for 353 detection, it may be significant that we observed 12.7 - 25.5% coverage of LTV6 in 354 2010Bt1-3. LTV6 was also relatively abundant in sample 2010A, from which it was 355 assembled (Figure 2f). LTV7 was detected in at least some samples from each sampling 356 trip (2007, 2009, and 2010), but not all samples in the study (Figure 2g), a pattern not 357 observed for any of the other LT populations. 358 359 Time series analysis of the 28 LT genome fragments: 360 The 28 LT genome fragments displayed 16 different presence/absence patterns 361 across the eight time points (Table 4). While we describe the LT genomes and genome 362 fragments as 35 populations for simplicity, it is important to consider that multiple 363 genome fragments could represent different regions of the same genome. Nine of the 14 364 genome fragments assembled from sample 2010A (Table S2) were from populations 365

17
detected only in that sample, and detection only in 2010A is the most common pattern 366 reported in Table 4. The second most common pattern is presence only in sample 367 2007At2, exhibited by three of the four genome fragments generated from that sample. 368 Only two genome fragments were detected in all eight samples, while 16 were either 369 present in a single sample or present exclusively in a days-scale time series. Within each 370 of the days-scale time series, the 28 genome fragments were typically consistently 371 detected (4 in the 2007 two-day time series and 9 in the 2010 four-day time series) or not 372 detected (17 in 2007 and 17 in 2010), for a total of 21 and 26 contigs, respectively. 373 However, of the 11 genome fragments detected in the 2007 series, seven were detected in 374 only one of the two samples. 375 376 Detection of previously sequenced haloviruses in LT samples: 377 Based on fragment recruitment at 90% nucleotide identity, none of 10 previously 378 sequenced haloviruses achieved the 30% coverage cutoff required for detection in any LT 379 sample. However, up to 18% of the Archaeal BJ1 virus genome (42) was present at low 380 abundance (up to 0.03% of the reads) in all LT samples, and a small number of reads 381 mapped to localized regions within EHP-1 (55) and ΦCh1 (26) (Table S4). The vast 382 majority of EHP-1 hits were to two ribonucleotide reductase genes that are highly similar 383 at the nucleotide level to the LTV2 ribonucleotide reductases, but interestingly, when 384 reads from sample 2009B were competitively mapped to LTV2 and EHP-1, many reads 385 still mapped to the EHP-1 ribonucleotide reductase genes. We observed essentially no 386 detection of the remaining seven previously sequenced haloviruses in our samples, 387

18
though mapping of a very small number of reads was observed for some viruses in some 388 samples (data not shown). 389 390 Detection of the 35 LT populations in other haloviral metagenomes: 391 None of the 35 LT virus and virus-like populations was detected through fragment 392 recruitment at 90% nucleotide identity in any of three previously sequenced haloviromes, 393 even when the virome sequences were cut to 72-100 bp fragments in silico. In a haloviral 394 metagenomic dataset from a saltern near San Diego, CA (14, 49), consisting of 509,673 395 ~100 bp 454 reads from purified viral fractions from high salinity ponds (28-30% salt), 396 up to 51 reads mapped to isolated regions within a small number of LT genomes and 397 genome fragments, but less than 5% of any LT genome or genome fragment was covered. 398 For the remaining viromes—a haloviral metagenomic dataset from hypersaline Lake 399 Retba, Senegal (993 Sanger reads, (61)) and 380 kb of haloviral metagenomic sequence 400 from Santa Pola, SE Spain (57)—the most reads to map to any of the 35 LT populations 401 was three. 402 403 Corroboration of our results in a previously reported halovirome: 404 We acknowledge that the sequencing throughput in previously reported 405 haloviromes is significantly lower than the 6.4 Gb that we report from Lake Tyrrell viral 406 concentrates, which could affect our comparisons with other datasets. However, of the 407 four samples collected from the hypersaline virome near San Diego, CA described above 408 (48.5 Mb, (14, 49)), two report an amount of sequencing within one order of magnitude 409 of our samples, so we expect that trends for the most abundant populations should be 410
19
observable. Using the same fragment recruitment detection limits as above (at least 1x 411 coverage at 90% nucleotide identity across at least 30% of the genome), we found that 412 none of the 10 previously sequenced haloviruses was detected in any of the San Diego 413 (SD) samples. The percent genome coverage was even lower than the very small amount 414 of coverage detected in LT. 415 We also assembled the SD reads, using the default Newbler parameters described 416 in the Materials and Methods. To the best of our knowledge, assembly was not attempted 417 in the published work, apart from the assemblies generated through the PHACCS and 418 MaxiΦ programs for modeling alpha- and beta-diversity, respectively (49). While only 419 one of the resulting contigs achieved our 10 kb cutoff required to represent a population, 420 we characterized detection patterns for the 10 largest contigs (3-13 kb) across three of the 421 four SD samples (a fourth SD sample had a very small number of reads, see below), and 422 we also searched for the SD contigs in the LT data through fragment recruitment. The 423 SD contigs were not detected in any of the LT samples, though as many as 1319 LT reads 424 did map to SD contigs in isolated regions, covering up to 20% of one contig. Across 425 three of the SD samples, collected on Nov. 16, 2005 (sample L), Dec. 7, 2005 (sample 426 N), and Dec. 20, 2005 (sample O), the 10 SD contigs displayed a variety of detection 427 patterns. Six contigs were detected in a single sample (2, 1, and 3 contigs in samples L, 428 N, and O, respectively), two were detected in both L and N, and two were detected in 429 both N and O. No contigs were detected in all three SD samples. In a fourth SD sample, 430 collected on Nov. 28, 2005 (between samples L and N), no SD contigs were detected, but 431 that is most likely due to sampling bias, as that sample contained only 4,645 reads. 432 433

20
Haloviral population dynamics, based on a less stringent detection threshold: 434 Because no viral or VLE populations were detected in multiple systems in this 435 study, in contrast to results from another study (18), we sought to determine whether 436 different fragment recruitment thresholds would affect our results. We repeated our 437 fragment recruitment at 75% nt identity, keeping all other parameters the same, using 438 three sets of references (the seven complete LT genomes, the 10 previously sequenced 439 haloviruses, and the 10 largest contigs from SD) and reads from all LT and SD samples 440 separately as queries. No significant differences in detection patterns were observed for 441 any within-system analyses, although slight increases in percent genome coverage (from 442 ~20% to just above 30%) technically pushed a small number of populations above the 443 detection threshold in a few cases. Still, none of the LT genomes or 10 previously 444 sequenced haloviruses was detected in SD. However, interestingly, two SD contigs were 445 detected in LT, but only in one sample (2009B). Similarly, three of the 10 previously 446 sequenced haloviruses were detected in LT, but only in some samples, as follows: BJ1 447 (both 2007 samples, 2009B, 2010Bt4, and 2010A; nearly 30% coverage of BJ1 was also 448 observed in the remaining samples), ΦCh1 (2007At2, 2009B, 2010Bt4, and 2010A), and 449 SH1 (2007At2, 2009B, 2010Bt4, and 2010A). 450 451 Discussion: 452 453 Most prior viral metagenomic studies from short-read sequencing data have relied 454 upon unassembled read or short contig analysis because significant assembly was 455 precluded by high viral diversity and relatively low sequencing throughput. In this study, 456
21
we have leveraged deep metagenomic sequencing (6.4 Gb), in combination with careful 457 manual assembly curation, to reconstruct 28 near-complete and seven complete, 458 composite genomes from viruses and virus-like entities (VLEs) in hypersaline Lake 459 Tyrrell, Victoria, Australia. This has allowed us to uncover previously unrecognized 460 patterns of viral population dynamics on relatively short timescales. We have nearly 461 doubled the number of haloviruses and VLEs with sequenced representatives (15, 18, 462 55), and the assembly of genomes from as little as 0.068% of the reads in a sample 463 suggests that comprehensive viral genomic reconstruction may be possible in more 464 complex systems through deep metagenomic sequencing. Importantly, we were able to 465 obtain enough DNA for metagenomic sequencing without amplification, avoiding 466 potential biases associated with multiple-displacement amplification (MDA) and 467 presumably achieving more accurate relative abundance estimates. The 35 LT virus and 468 VLE populations showed a range of stabilities across eight LT viral metagenomic 469 samples collected from 2007-2010, from detection at one time in one location (14 470 populations) to presence at all times and locations studied (3 populations). The results 471 indicate a diverse and dynamic viral consortium within Lake Tyrrell, and the time series 472 results have been corroborated in a halovirome from San Diego, CA, suggesting that viral 473 populations may be highly dynamic on relatively short timescales in hypersaline systems 474 worldwide. 475 Many of our results are based on the assembly of short-read metagenomic 476 sequencing data. While we have taken extensive precautions to ensure assembly 477 correctness through manual assembly curation (see Supplemental Material), particularly 478 for the seven genomes, we acknowledge that some misassemblies are still possible. It is 479

22
encouraging that the seven genomes circularized, that they have a relatively uniform 480 depth of coverage in the samples from which they assembled, and that many genes were 481 predicted from these assemblies with database matches that are consistent with viruses, 482 VLEs, and halophiles. The results of our temporal and biogeographical analyses 483 demonstrate a shift in coverage depth from ~20-50x for a given population in the sample 484 from which it was assembled (Table 2) to essentially zero coverage in samples in which 485 that population was not detected (Figure 2). This means that the observed temporal and 486 biogeographical trends are significant, even if the assemblies are not 100% correct. 487 488 Features of the seven complete, composite genomes: 489 Within the six complete viral genomes and a seventh VLE genome, database 490 matches to phage, archaeal viruses, Bacteria, and Archaea suggest that both phage and 491 archaeal viral genomes were reconstructed. Host range is difficult to determine without 492 isolates, but some inferences can be made. For example, a significant hit to lysozyme, 493 which is used to break down peptidoglycan in bacterial cell walls, along with BLAST hits 494 to bacteria suggest that LTV1 is a bacteriophage (Table 3). As no bacteriophage have 495 been isolated from hypersaline systems, it is not surprising that the bacterial BLAST hits 496 are to a variety of organisms. A preponderance of hits to bacteriophage and bacteria 497 suggest that LTV4 is also likely to be a bacteriophage, possibly infecting Salinibacter 498 ruber, on account of two best BLAST hits to S. ruber. The abundance of archaea in the 499 system (~80% or more) suggests that some of the LT viruses target archaea. In 500 particular, LTV2 is likely to be an archaeal virus and LTVLE3 is likely to be an archaeal 501 virus or plasmid, based on a number of top hits to archaea. 502

23
In addition to host range, gene content from the seven viral and VLE genomes 503 may provide information about lifestyle and function. Annotations that could be 504 associated with lysogeny include a putative phage integrase in LTVLE3 and a putative 505 excisionase in LTV6. LTV2 encodes ribonucleotide reductases, which are more often 506 associated with lytic than temperate viruses (55). Of the functions that could be 507 identified, the most prevalent is methyltransferase or DNA methylase, found in LTV1, 2, 508 and 5 and LTVLE3. The abundance of methyltransferases suggests that evasion of host 509 restriction modification systems is (or has been) important in the Lake Tyrrell system, 510 though methyltransferases have also been shown to contribute to DNA mismatch repair, 511 gene expression regulation, and replication initiation (9). 512 Interestingly, LTVLE3 contains a rhodopsin with high similarity to the 513 Nanohaloarchaeal “xenorhodopsins,” which cluster with rhodopsins of bacteria from 514 diverse environments and are phylogenetically distinct from bacteriorhodpsins of the 515 class Halobacteria (75). The function of the xenorhodopsins is unknown, as they cluster 516 separately from rhodopsins with known functions (i.e., proton pumps, chloride pumps, 517 and sensory rhodopsins), though it has been suggested that they may be sensory 518 rhodopsins, based on conserved amino acid motifs (23, 75). As with the other 519 xenorhodopsins, the LTVLE3 rhodopsin contains all of the conserved amino acid motifs 520 predicted to be required for binding the retinal chromophore for light absorption (J. 521 Ugalde, personal communication). Bacterio-opsins have been reported on plasmids of 522 halophilic archaea (e.g., 7), but not on any viruses, though auxiliary metabolic genes, 523 including photosynthesis genes (e.g., 32), are commonly found in viral genomes (52). If 524 LTVLE3 is a virus, this rhodopsin would extend the presence of host photosensory and/or 525

24
energy-harvesting genes, well-documented in cyanophage (29, 64, 70), to viruses 526 (putatively) of the Archaea. 527 528 Diversity of viruses and VLEs in hypersaline systems: 529 While LTV2 and LTVLE3 represent up to 2.7 and 2.5% of the reads in any 530 sample, respectively, it is noteworthy that most of the seven LT genomes were assembled 531 from approximately 0.1% of the reads from a sample (Table 2). We infer that LTV2 and 532 LTVLE3 were among the dominant populations in Lake Tyrrell at the times and locations 533 sampled by this study, whereas populations detected at the 0.1% level were sub-dominant 534 (of course, potential contamination in unassembled reads could affect these abundance 535 estimates). These findings highlight the high diversity of the LT viral community. 536 Although it is possible that more abundant populations were present but missed, for 537 example due to genome fragmentation as a result of within-population variation, these 538 results suggest that approximately 1,000 sub-dominant-to-dominant viral and VLE 539 populations may be present in the LT system at any given time. This is orders of 540 magnitude more than the number of haloviral groups observed in previous studies 541 through other methods (e.g., 1-8 groups, based on PFGE bands from a haloviral 542 community, (13), and five groups, based on dinucleotide frequencies from a halovirome, 543 (57)). To be clear, the previously cited work did not suggest that these groupings 544 represented individual viral populations, but our results would suggest that each of the 545 groups could contain hundreds of populations. The number of populations predicted 546 from LT is similar to the number of viral types estimated through modeling in other 547 aqueous systems, including hot springs, from which ~1300-1400 viral types were 548

25
predicted (59). Modeling estimates have also predicted that the most abundant viral 549 genotypes in marine systems comprise ~2.3 – 13.3% of the viral community (4), so 550 abundances of ~2.5 – 2.7% in LT suggest similar levels of dominance in hypersaline and 551 marine viral assemblages. Of course, methodological differences in the calculation of 552 these estimates should be considered when interpreting these data. 553 554 Temporal dynamics of viral and VLE populations in hypersaline systems: 555 In general, on the timescale of days, LT viral and VLE populations were 556 relatively stable. This result is consistent with a PFGE-based study in a Spanish solar 557 saltern, in which no significant differences were observed in viral DNA band patterns 558 from samples collected six days apart (53). In the 2010 LT four-day time series, six of 559 the seven complete genomes and 26 of the 28 genome fragments exhibited the same 560 detection pattern (i.e., uniform presence or absence) in all four samples in the series 561 (Figure 2 and Table 4). 562 However, LTV1 and seven genome fragments were present in only one sample of 563 the 2007 two-day time series. We suspect that the viral community changed as a result of 564 hosts’ responses to significant lake evaporation between samplings, perhaps including 565 generational timescale changes in host immunity (73) and/or the induction of lysogens. 566 The results of a laboratory experiment by Santos and colleagues (56), in which the active 567 viral community from a hypersaline lake changed following dilution with distilled water, 568 suggest that differences in the LT lake level before and during our time series could have 569 affected the viral community. However, no change in salinity or significant change in 570 geochemistry was observed between the two 2007 LT samples (Table 1, Table S3), so the 571

26
significance of the dilution and/or subsequent evaporation is unclear. The pool area for 572 sample 2007At1 was much larger than it was for any other LT sample, including 573 2007At2 (see Materials and Methods), so spatial heterogeneity at the sampling site may 574 equally well explain the differences observed. 575
On timescales of less than three years, LT viral and VLE populations tended to be 576 highly dynamic. Six of the seven complete genomes and 26 of the 28 genome fragments 577 were present in some but not all eight samples, indicating transience from 2007-2010. 578 However, the detection of two genome fragments and 91-100% of the LTV2 genome in 579 all eight samples (Figure 2b) suggests that some viral populations may be stable and 580 maintain infectivity in the LT system for three years. 581
In a previously reported study from a saltern near San Diego (SD), CA (14, 49), a 582 weeks-scale time series was sampled. Of the 10 largest contigs from that system, based 583 on assemblies that we generated in this study, four were present in samples collected 2-3 584 weeks apart, six were present in single samples, and none were present in all three 585 samples collected over approximately one month. As such, we propose a slightly 586 modified interpretation of the original study, which suggested that haloviral taxa were 587 stable while genotypes varied on short timescales (49). Because the most common 588 haloviral taxa in that system (i.e., the 10 SD contigs that we assembled) appear not to 589 have been represented in public databases, and because the viral taxa reported to be most 590 abundant in the original study, based on tBLASTx comparisons to previously sequenced 591 viral genomes, were actually not detected in that system through fragment recruitment in 592 this study, we suggest that trends for the dominant haloviral taxa were actually not 593 observed. A similar possible interpretation was presented as a caveat in the published 594

27
work. We suggest that the variation observed at the genotype (“strain”) level through 595 modeling was actually an observation of the population-level shifts that we see in this 596 study. 597 Ecological models of virus-host dynamics (e.g., Lotka-Volterra-like “kill-the-598 winner,” (69), and constant-diversity dynamics, (50)) have predicted shifts in the 599 presence and abundance of viral groups, as demonstrated in this study, but the timescales 600 on which these dynamics were predicted to occur have not been well constrained. In 601 addition, viral dynamics have been presumed to occur at the genotype (subpopulation or 602 “strain”) level. While viral genotypes could also exhibit interesting dynamics, this study 603 demonstrates dramatic shifts in the presence and relative abundance of viral populations. 604 We also provide potential timescale constraints for ecological models. Assuming that 605 viral population dynamics occur on similar timescales within each of the two systems 606 studied (LT and SD), our results would suggest that haloviral populations are generally 607 stable on the timescale of days, dynamic or stable in relatively equal proportions on 608 timescales of 2-3 weeks, and generally dynamic on timescales of one month to three 609 years. Other temporal patterns, such as seasonal shifts (43, 78), could occur in 610 hypersaline systems, but may have been missed due to the frequency of sampling. 611 Indeed, the most likely explanation for the presence of some populations in single 612 samples is that they cycle within a given system on timescales not captured by these 613 studies. While we assume that the populations that we characterized are among the more 614 dominant populations because they assembled, we recognize that their dynamics may not 615 reflect the behavior of less abundant and/or less genomically cohesive populations. 616 617

28
Spatial heterogeneity of haloviral and VLE populations: 618 Within LT, spatial heterogeneity was observed between sites A and B (isolated 619 pools ~300 m apart) during the same week in 2010, in which 15 genome fragments and 620 LTV7 exhibited different detection patterns. For our cross-system comparisons, while we 621 cannot discount the possibility that our results could be influenced by differences in 622 methodology (for example, different sample collection and virus isolation techniques, 623 potential biases associated with whole-genome amplification in other studies, and 624 differences in sequencing technology and throughput), given the temporal and spatial 625 heterogeneity of viral populations within individual systems, it is not surprising that we 626 did not detect most viral populations across geographically diverse hypersaline systems. 627 However, this result is surprising in the context of some previous studies, which have 628 supported conservation across hypersaline systems in both host and viral communities. 629 For example, one of the most dominant LT microbial species, Haloquadratum walsbyi, is 630 suggested to be abundant and highly conserved in hypersaline systems worldwide, based 631 on comparative genomics of isolates (16). Also, a recent study shows that many haloviral 632 isolates can infect hosts from diverse geographic locations (5), and read- and small 633 contig-based comparisons show some sequence similarity among globally distributed 634 haloviral communities (57, 61). Another recent study suggests some conservation of 635 nearly complete haloviral genomes across systems (18). While the aforementioned 636 methodological differences may have precluded the detection of some LT populations in 637 other systems, and while most previously sequenced haloviruses are isolates that may not 638 represent the dominant members of their communities, it is interesting that the 35 LT 639 viral and VLE populations were not detected in other hypersaline systems sampled by 640

29
metagenomics, nor were previously sequenced haloviruses detected in LT, based on the 641 90% nucleotide identity detection limit set by this study. Similarly, the largest contigs in 642 the SD system were not detected in LT, nor were previously sequenced haloviruses 643 detected in the SD metagenomic data. 644 Some genome-level conservation across systems was observed when we reduced 645 the fragment recruitment detection threshold from 90% to 75% nucleotide identity. 646 Namely, three previously sequenced haloviruses and two SD contigs were detected in 647 some LT samples. This most likely suggests that similar populations with divergent 648 nucleotide sequences were detected across systems, but it could mean that reducing the 649 detection threshold allows for similar genes from different populations to yield false-650 positive identification. While some viral genomes reconstructed from Spain were also 651 detected in San Diego in a study based on similar detection thresholds (75% nucleotide 652 identity across at least 50% of each read), most populations were not detected in both 653 systems (18). Together, these studies show that, while there is clearly some conservation 654 of haloviruses at the nucleotide level in geographically diverse locations, most haloviral 655 populations are not globally conserved, at least on the temporal and spatial scales 656 sampled thus far. While these results would seem to imply a limited distribution of most 657 haloviral populations, they would also be consistent with a temporally variable global 658 distribution. The latter would be supported by the detection of haloviruses from other 659 systems in only some LT samples, as observed at 75% nucleotide identity, and by the fact 660 that haloviruses maintain infectivity against hosts from geographically diverse locations 661 (4). 662 663

30
Implications for future viral metagenomic analyses: 664 Many previous viral metagenomic studies have relied upon representative 665 sequences in public databases to predict viral function (e.g., 14) and/or taxonomy (e.g., 666 49), and/or have been limited to indirect analyses, like modeling (e.g., 3), to characterize 667 viral communities. One of the most exciting results of this study is that, with deep 668 metagenomic sequencing and assembly, it is now possible to study natural viral 669 populations directly, based on genomic information generated from a given system. 670 While extensive manual assembly curation was required to close the seven genomes in 671 this study from 6.4 Gb of metagenomic data, this may not always be necessary. For 672 example, a recent study reported autoassembly of 78 circularized genomes from a 48 Gb 673 virome from the human gut (36), suggesting that assembly may be more facile in some 674 systems and/or with increased sequencing throughput. 675 It is well appreciated that viruses are woefully underrepresented in public 676 databases (52, 79), and in this study, we confirmed that the identification of viral taxa 677 based on BLAST hits to previously sequenced viruses may not be reliable. Specifically, 678 we showed that three viruses (BJ1, ΦCh1, and HF2) reported to be among the five most 679 dominant viral taxa in each of the samples from the San Diego system, based on 680 tBLASTx searches (E value 0.001) against complete viral genomes (49), were actually 681 not present in the metagenomic libraries from that system. We suggest that BLAST 682 searches are an appropriate means of identifying candidate viral populations that may be 683 present in a given system, but that if the detection of a given virus is relevant to the 684 results of a study, its presence should be confirmed by mapping to the reference genome, 685 or through BLAST searches along the full length of the reference genome, as in (18). 686

31
This study represents the first genome-based characterization of natural viral 687 population dynamics on a variety of timescales. The observation of highly dynamic viral 688 populations in individual systems on timescales ranging from weeks to years exposes a 689 need for cautious interpretation of “snapshot” viral metagenomes collected at a single 690 time and location. This de novo assembly and genomic reconstruction-based tracking of 691 viral (and virus-like) populations provides a foundation for future, high-resolution 692 metagenomic efforts to characterize viral biogeography and to constrain ecological 693 models of virus-host population dynamics in a variety of environments. It will be 694 interesting to see what impact viral population dynamics may have on ecosystem-scale 695 processes, including viral production, infectivity rates, and host community structure, and 696 we recommend that future efforts consider characterizing these processes across time and 697 space. 698 699 Acknowledgements: 700 701 Funding for this work was provided by National Science Foundation award 702 0626526 and DE-FG02-07ER64505 from the Department of Energy. 703 We thank Cheetham Salt Works (Victoria, Australia) for permission to collect 704 samples; John Moreau, Jochen Brocks, and Mike Dyall-Smith for assistance in the field 705 and generous access to reagents and laboratory equipment; Matt Lewis and the J. Craig 706 Venter Institute (JCVI) for library construction and sequencing; and Shannon Williamson 707 and Doug Fadrosh (JCVI) for training JBE in virus-related laboratory techniques. 708 709

32
References: 710 711 1. Allen, E. E., G. W. Tyson, R. J. Whitaker, J. C. Detter, P. M. Richardson, 712
and J. F. Banfield. 2007. Genome dynamics in a natural archaeal population. 713 Proc. Natl. Acad. Sci. U.S.A. 104:1883-1888. 714
2. Andersson, A. F., and J. F. Banfield. 2008. Virus Population Dynamics and 715 Acquired Virus Resistance in Natural Microbial Communities. Science 320:1047-716 1050. 717
3. Angly, F., B. Rodriguez-Brito, D. Bangor, P. McNairnie, M. Breitbart, P. 718 Salamon, B. Felts, J. Nulton, J. Mahaffy, and F. Rohwer. 2005. PHACCS, an 719 online tool for estimating the structure and diversity of uncultured viral 720 communities using metagenomic information. BMC Bioinformatics 6:41. 721
4. Angly, F. E., B. Felts, M. Breitbart, P. Salamon, R. A. Edwards, C. Carlson, 722 A. M. Chan, M. Haynes, S. Kelley, H. Liu, J. M. Mahaffy, J. E. Mueller, J. 723 Nulton, R. Olson, R. Parsons, S. Rayhawk, C. A. Suttle, and F. Rohwer. 2006. 724 The Marine Viromes of Four Oceanic Regions. PLoS Biol. 4:e368. 725
5. Atanasova, N. S., E. Roine, A. Oren, D. H. Bamford, and H. M. Oksanen. 726 2011. Global network of specific virus–host interactions in hypersaline 727 environments. Environ. Microbiol. 2:426-440. 728
6. Baker, B. J., G. W. Tyson, R. I. Webb, J. Flanagan, P. Hugenholtz, E. E. 729 Allen, and J. F. Banfield. 2006. Lineages of Acidophilic Archaea Revealed by 730 Community Genomic Analysis. Science 314:1933-1935. 731

33
7. Baliga, N. S., R. Bonneau, M. T. Facciotti, M. Pan, G. Glusman, E. W. 732 Deutsch, P. Shannon, Y. Chiu, R. S. Weng, R. R. Gan, P. Hung, S. V. Date, E. 733 Marcotte, L. Hood, and W. V. Ng. 2004. Genome sequence of Haloarcula 734 marismortui: A halophilic archaeon from the Dead Sea. Genome Res. 14:2221-735 2234. 736
8. Bamford, D. H., J. J. Ravantti, G. Ronnholm, S. Laurinavicius, P. Kukkaro, 737 M. Dyall-Smith, P. Somerharju, N. Kalkkinen, and J. K. H. Bamford. 2005. 738 Constituents of SH1, a Novel Lipid-Containing Virus Infecting the Halophilic 739 Euryarchaeon Haloarcula hispanica. J. Virol. 79:9097-9107. 740
9. Baranyi, U., R. Klein, W. Lubitz, D. H. Krüger, and A. Witte. 2000. The 741 archaeal halophilic virus-encoded Dam-like methyltransferase M.φCh1-I 742 methylates adenine residues and complements dam mutants in the low salt 743 environment of Escherichia coli. Mol. Microbiol. 35:1168-1179. 744
10. Bath, C., T. Cukalac, K. Porter, and M. L. Dyall-Smith. 2006. His1 and His2 745 are distantly related, spindle-shaped haloviruses belonging to the novel virus 746 group, Salterprovirus. Virology 350:228-239. 747
11. Bratbak, G., M. Heldal, S. Norland, and T. F. Thingstad. 1990. Viruses as 748 Partners in Spring Bloom Microbial Trophodynamics. Appl. Environ. Microbiol. 749 56:1400-1405. 750
12. Burns, D. G., H. M. Camakaris, P. H. Janssen, and M. L. Dyall-Smith. 2004. 751 Combined Use of Cultivation-Dependent and Cultivation-Independent Methods 752 Indicates that Members of Most Haloarchaeal Groups in an Australian 753 Crystallizer Pond Are Cultivable. Appl. Environ. Microbiol. 70:5258-5265. 754

34
13. Diez, B., J. Anton, N. Guixa-Boixereu, C. Pedros-Alio, and F. Rodriguez-755 Valera. 2000. Pulse-field gel electrophoresis analysis of virus assemblages 756 present in a hypersaline environment. Int. Microbiol. 3:159-164. 757
14. Dinsdale, E. A., R. A. Edwards, D. Hall, F. Angly, M. Breitbart, J. M. Brulc, 758 M. Furlan, C. Desnues, M. Haynes, L. Li, L. McDaniel, M. A. Moran, K. E. 759 Nelson, C. Nilsson, R. Olson, J. Paul, B. R. Brito, Y. Ruan, B. K. Swan, R. 760 Stevens, D. L. Valentine, R. V. Thurber, L. Wegley, B. A. White, and F. 761 Rohwer. 2008. Functional metagenomic profiling of nine biomes. Nature 762 452:629-632. 763
15. Dyall-Smith, M., S.-L. Tang, and C. Bath. 2003. Haloarchaeal viruses: how 764 diverse are they? Res. Microbiol. 154:309-313. 765
16. Dyall-Smith, M. L., F. Pfeiffer, K. Klee, P. Palm, K. Gross, S. C. Schuster, M. 766 Rampp, and D. Oesterhelt. 2011. Haloquadratum walsbyi: Limited Diversity in 767 a Global Pond. PLoS ONE 6:e20968. 768
17. Edwards, R. A., and F. Rohwer. 2005. Viral metagenomics. Nat. Rev. 769 Microbiol. 3:504-510. 770
18. Garcia-Heredia, I., A.-B. Martin-Cuadrado, F. J. M. Mojica, F. Santos, A. 771 Mira, J. Anton, and F. Rodriguez-Valera. 2012. Reconstructing Viral Genomes 772 from the Environment Using Fosmid Clones: The Case of Haloviruses. PLoS 773 ONE 7:e33802. 774
19. Gordon, D., C. Abajian, and P. Green. 1998. Consed: A Graphical Tool for 775 Sequence Finishing. Genome Res. 8:195-202. 776

35
20. Guixa-Boixareu, N., Calderon-Paz, J.I., Heldal, M., Bratbak, G., and Pedros-777 Alio, C. 1996. Viral lysis and bacterivory as prokaryotic loss factors along a 778 salinity gradient. Aquat. Microb. Ecol. 11:215-227. 779
21. Hatfull, G. F. 2008. Bacteriophage genomics. Curr. Opin. Microbiol. 11:447-780 453. 781
22. Hyatt, D., G.-L. Chen, P. LoCascio, M. Land, F. Larimer, and L. Hauser. 782 2010. Prodigal: prokaryotic gene recognition and translation initiation site 783 identification. BMC Bioinformatics 11:119. 784
23. Jung, K.-H., V. D. Trivedi, and J. L. Spudich. 2003. Demonstration of a 785 sensory rhodopsin in eubacteria. Mol. Microbiol. 47:1513-1522. 786
24. Kamekura, M., M. L. Dyall-Smith, V. Upasani, A. Ventosa, and M. Kates. 787 1997. Diversity of Alkaliphilic Halobacteria: Proposals for Transfer of 788 Natronobacterium vacuolatum, Natronobacterium magadii, and Natronbacterium 789 pharaonis to Halorubrum, Natrialba, and Natronomonas gen. nov., Respectively, 790 as Halorubrum vacuolatum comb. nov., Natrialba magadii comb. nov., and 791 Natronomonas pharaonis comb. nov., Respectively. Int. J. Syst. Bacteriol. 47:853-792 857. 793
25. Kim, K.-H., H.-W. Chang, Y.-D. Nam, S. W. Roh, M.-S. Kim, Y. Sung, C. O. 794 Jeon, H.-M. Oh, and J.-W. Bae. 2008. Amplification of Uncultured Single-795 Stranded DNA Viruses from Rice Paddy Soil. Appl. Environ. Microb. 74:5975-796 5985. 797
26. Klein, R., U. Baranyi, N. Rössler, B. Greineder, H. Scholz, and A. Witte. 798 2002. Natrialba magadii virus φCh1: first complete nucleotide sequence and 799

36
functional organization of a virus infecting a haloalkaliphilic archaeon. Mol. 800 Microbiol. 45:851-863. 801
27. Kristensen, D. M., A. R. Mushegian, V. V. Dolja, and E. V. Koonin. 2010. 802 New dimensions of the virus world discovered through metagenomics. Trends 803 Microbiol. 18:11-19. 804
28. Leplae, R. l., G. Lima-Mendez, and A. Toussaint. 2010. ACLAME: A 805 CLAssification of Mobile genetic Elements, update 2010. Nucleic Acids Res. 806 38:D57-D61. 807
29. Lindell, D., J. D. Jaffe, Z. I. Johnson, G. M. Church, and S. W. Chisholm. 808 2005. Photosynthesis genes in marine viruses yield proteins during host infection. 809 Nature 438:86-89. 810
30. Ma, Y., E. A. Galinski, W. D. Grant, A. Oren, and A. Ventosa. 2010. 811 Halophiles 2010: Life in Saline Environments. Appl. Environ. Microb. 76:6971-812 6981. 813
31. Macumber, P. G. 1992. Hydrological processes in the Tyrrell Basin, 814 southeastern Australia. Chem. Geol. 96:1-18. 815
32. Mann, N. H., A. Cook, A. Millard, S. Bailey, and M. Clokie. 2003. Marine 816 ecosystems: Bacterial photosynthesis genes in a virus. Nature 424:741-741. 817
33. Margulies, M., M. Egholm, W. E. Altman, S. Attiya, J. S. Bader, L. A. 818 Bemben, J. Berka, M. S. Braverman, Y.-J. Chen, Z. Chen, S. B. Dewell, L. 819 Du, J. M. Fierro, X. V. Gomes, B. C. Godwin, W. He, S. Helgesen, C. H. Ho, 820 G. P. Irzyk, S. C. Jando, M. L. I. Alenquer, T. P. Jarvie, K. B. Jirage, J.-B. 821 Kim, J. R. Knight, J. R. Lanza, J. H. Leamon, S. M. Lefkowitz, M. Lei, J. Li, 822

37
K. L. Lohman, H. Lu, V. B. Makhijani, K. E. McDade, M. P. McKenna, E. 823 W. Myers, E. Nickerson, J. R. Nobile, R. Plant, B. P. Puc, M. T. Ronan, G. T. 824 Roth, G. J. Sarkis, J. F. Simons, J. W. Simpson, M. Srinivasan, K. R. 825 Tartaro, A. Tomasz, K. A. Vogt, G. A. Volkmer, S. H. Wang, Y. Wang, M. P. 826 Weiner, P. Yu, R. F. Begley, and J. M. Rothberg. 2005. Genome sequencing in 827 microfabricated high-density picolitre reactors. Nature 437:376-380. 828
34. Maturrano, L., F. Santos, R. Rossello-Mora, and J. Anton. 2006. Microbial 829 Diversity in Maras Salterns, a Hypersaline Environment in the Peruvian Andes. 830 Appl. Environ. Microbiol. 72:3887-3895. 831
35. Milne, I., M. Bayer, L. Cardle, P. Shaw, G. Stephen, F. Wright, and D. 832 Marshall. 2010. Tablet: next generation sequence assembly visualization. 833 Bioinformatics 26:401-402. 834
36. Minot, S., S. Grunberg, G. D. Wu, J. D. Lewis, and F. D. Bushman. 2012. 835 Hypervariable loci in the human gut virome. Proc. Natl. Acad. Sci. U.S.A. 836 109:3962-3966. 837
37. Mongodin, E. F., K. E. Nelson, S. Daugherty, R. T. DeBoy, J. Wister, H. 838 Khouri, J. Weidman, D. A. Walsh, R. T. Papke, G. Sanchez Perez, A. K. 839 Sharma, C. L. Nesbo, D. MacLeod, E. Bapteste, W. F. Doolittle, R. L. 840 Charlebois, B. Legault, and F. Rodriguez-Valera. 2005. The genome of 841 Salinibacter ruber: Convergence and gene exchange among hyperhalophilic 842 bacteria and archaea. Proc. Natl. Acad. Sci. U.S.A. 102:18147-18152. 843
38. Morowitz, M. J., V. J. Denef, E. K. Costello, B. C. Thomas, V. Poroyko, D. A. 844 Relman, and J. F. Banfield. 2011. Strain-resolved community genomic analysis 845

38
of gut microbial colonization in a premature infant. Proc. Natl. Acad. Sci. U.S.A. 846 108:1128-1133. 847
39. Mutlu, M. B., M. Martínez-García, F. Santos, A. Peña, K. Guven, and J. 848 Antón. 2008. Prokaryotic diversity in Tuz Lake, a hypersaline environment in 849 Inland Turkey. FEMS Microbiol. Ecol. 65:474-483. 850
40. Narasingarao, P., S. Podell, J. A. Ugalde, C. Brochier-Armanet, J. B. 851 Emerson, J. J. Brocks, K. B. Heidelberg, J. F. Banfield, and E. E. Allen. 2012. 852 De novo metagenomic assembly reveals abundant novel major lineage of Archaea 853 in hypersaline microbial communities. ISME J 6:81-93. 854
41. Oren, A., Bratbak, G., and Heldal, M. 1997. Occurrence of virus-like particles 855 in the Dead Sea. Extremophiles 1:143-149. 856
42. Pagaling, E., R. Haigh, W. Grant, D. Cowan, B. Jones, Y. Ma, A. Ventosa, 857 and S. Heaphy. 2007. Sequence analysis of an Archaeal virus isolated from a 858 hypersaline lake in Inner Mongolia, China. BMC Genomics 8:410. 859
43. Parsons, R. J., M. Breitbart, M. W. Lomas, and C. A. Carlson. 2011. Ocean 860 time-series reveals recurring seasonal patterns of virioplankton dynamics in the 861 northwestern Sargasso Sea. ISME J. 2:273-284. 862
44. Pietilä, M. K., E. Roine, L. Paulin, N. Kalkkinen, and D. H. Bamford. 2009. 863 An ssDNA virus infecting archaea: a new lineage of viruses with a membrane 864 envelope. Mol. Microbiol. 72:307-319. 865
45. Pina, M., A. Bize, P. Forterre, and D. Prangishvili. 2011. The archeoviruses. 866 FEMS Microbiol. Rev. 6:1035-1054. 867

39
46. Porter, K., B. E. Russ, and M. L. Dyall-Smith. 2007. Virus-host interactions in 868 salt lakes. Curr. Opin. Microbiol. 10:418-424. 869
47. Pruesse, E., C. Quast, K. Knittel, B. M. Fuchs, W. Ludwig, J. R. Peplies, and 870 F. O. Glokner. 2007. SILVA: a comprehensive online resource for quality 871 checked and aligned ribosomal RNA sequence data compatible with ARB. 872 Nucleic Acids Res. 35:7188-7196. 873
48. Quevillon, E., V. Silventoinen, S. Pillai, N. Harte, N. Mulder, R. Apweiler, 874 and R. Lopez. 2005. InterProScan: protein domains identifier. Nucleic Acids 875 Res. 33:W116-W120. 876
49. Rodriguez-Brito, B., L. Li, L. Wegley, M. Furlan, F. Angly, M. Breitbart, J. 877 Buchanan, C. Desnues, E. Dinsdale, R. Edwards, B. Felts, M. Haynes, H. Liu, 878 D. Lipson, J. Mahaffy, A. B. Martin-Cuadrado, A. Mira, J. Nulton, L. Pasic, 879 S. Rayhawk, J. Rodriguez-Mueller, F. Rodriguez-Valera, P. Salamon, S. 880 Srinagesh, T. F. Thingstad, T. Tran, R. V. Thurber, D. Willner, M. Youle, 881 and F. Rohwer. 2010. Viral and microbial community dynamics in four aquatic 882 environments. ISME J. 4:739-751. 883
50. Rodriguez-Valera, F., A.-B. Martin-Cuadrado, B. Rodriguez-Brito, L. Pasic, 884 T. F. Thingstad, F. Rohwer, and A. Mira. 2009. Explaining microbial 885 population genomics through phage predation. Nat. Rev. Microbiol. 7:828-836. 886
51. Roine, E., P. Kukkaro, L. Paulin, S. Laurinavicius, A. Domanska, P. 887 Somerharju, and D. H. Bamford. 2010. New, Closely Related Haloarchaeal 888 Viral Elements with Different Nucleic Acid Types. J. Virol. 84:3682-3689. 889

40
52. Rosario, K., and M. Breitbart. 2011. Exploring the viral world through 890 metagenomics. Curr. Opin. Virol. 1:289-297. 891
53. Sandaa, R.-A., E. Foss Skjoldal, and G. Bratbak. 2003. Virioplankton 892 community structure along a salinity gradient in a solar saltern. Extremophiles 893 7:347-351. 894
54. Sandaa, R.-A., and A. Larsen. 2006. Seasonal Variations in Virus-Host 895 Populations in Norwegian Coastal Waters: Focusing on the Cyanophage 896 Community Infecting Marine Synechococcus spp. Appl. Environ. Microbiol. 897 72:4610-4618. 898
55. Santos, F., A. Meyerdierks, A. Peña, R. Rosselló-Mora, R. Amann, and J. 899 Antón. 2007. Metagenomic approach to the study of halophages: the 900 environmental halophage 1. Environ. Microbiol. 9:1711-1723. 901
56. Santos, F., M. Moreno-Paz, I. Meseguer, C. Lopez, R. Rossello-Mora, V. 902 Parro, and J. Antón. 2011. Metatranscriptomic analysis of extremely halophilic 903 viral communities. ISME J. 5:1621-1633. 904
57. Santos, F., P. Yarza, V. Parro, C. Briones, and J. Antón. 2010. The 905 metavirome of a hypersaline environment. Environ. Microbiol. 12:2965-2976. 906
58. Santos, F., P. Yarza, V. Parro, I. Meseguer, R. Rossello-Mora, and J. Antón. 907 2012. Viruses from hypersaline environments: a culture-independent approach. 908 Appl. Environ. Microbiol. 6:1635-1643. 909
59. Schoenfeld, T., M. Patterson, P. M. Richardson, K. E. Wommack, M. Young, 910 and D. Mead. 2008. Assembly of Viral Metagenomes from Yellowstone Hot 911 Springs. Appl. Environ. Microbiol. 74:4164-4174. 912

41
60. Short, S. M., and C. A. Suttle. 2003. Temporal dynamics of natural communities 913 of marine algal viruses and eukaryotes. Aquat. Microb. Ecol. 32:107-119. 914
61. Sime-Ngando, T., S. Lucas, A. Robin, K. P. Tucker, J. Colombet, Y. Bettarel, 915 E. Desmond, S. Gribaldo, P. Forterre, M. Breitbart, and D. Prangishvili. 916 2010. Diversity of virus–host systems in hypersaline Lake Retba, Senegal. 917 Environ. Microbiol. 8:1956-1972. 918
62. Simpson, J. T., K. Wong, S. D. Jackman, J. E. Schein, S. J. M. Jones, and I. 919 Birol. 2009. ABySS: A parallel assembler for short read sequence data. Genome 920 Res. 19:1117-1123. 921
63. Snyder, J. C., B. Wiedenheft, M. Lavin, F. F. Roberto, J. Spuhler, A. C. 922 Ortmann, T. Douglas, and M. Young. 2007. Virus movement maintains local 923 virus population diversity. Proc. Natl. Acad. Sci. U.S.A. 104:19102-19107. 924
64. Sullivan, M. B., K. H. Huang, J. C. Ignacio-Espinoza, A. M. Berlin, L. Kelly, 925 P. R. Weigele, A. S. DeFrancesco, S. E. Kern, L. R. Thompson, S. Young, C. 926 Yandava, R. Fu, B. Krastins, M. Chase, D. Sarracino, M. S. Osburne, M. R. 927 Henn, and S. W. Chisholm. 2010. Genomic analysis of oceanic cyanobacterial 928 myoviruses compared with T4-like myoviruses from diverse hosts and 929 environments. Environ. Microbiol. 12:3035-3056. 930
65. Suttle, C., and J. Fuhrman. 2010. Enumeration of virus particles in aquatic or 931 sediment samples by epifluorescence microscopy, p. 145-153. In S. Wilhelm, M. 932 Weinbauer, and C. Suttle (ed.), Manual of Aquatic Viral Ecology. ASLO. 933
66. Suttle, C. A. 2007. Marine viruses - major players in the global ecosystem. Nat. 934 Rev. Microbiol. 5:801-812. 935

42
67. Tang, S.-L., S. Nuttall, and M. Dyall-Smith. 2004. Haloviruses HF1 and HF2: 936 Evidence for a Recent and Large Recombination Event. J. Bacteriol. 186:2810-937 2817. 938
68. Tang, S.-L., S. Nuttall, K. Ngui, C. Fisher, P. Lopez, and M. Dyall-Smith. 939 2002. HF2: a double-stranded DNA tailed haloarchaeal virus with a mosaic 940 genome. Mol. Microbiol. 44:283-296. 941
69. Thingstad, T. F. 2000. Elements of a theory for the mechanisms controlling 942 abundance, diversity, and biogeochemical role of lytic bacterial viruses in aquatic 943 systems. Limnol. Oceanogr. 45:1320-1328. 944
70. Thompson, L. R., Q. Zeng, L. Kelly, K. H. Huang, A. U. Singer, J. Stubbe, 945 and S. W. Chisholm. 2011. Phage auxiliary metabolic genes and the redirection 946 of cyanobacterial host carbon metabolism. Proc. Natl. Acad. Sci. U.S.A. 947 108:E757-E764. 948
71. Thurber, R. V. 2009. Current insights into phage biodiversity and biogeography. 949 Curr. Opin. Microbiol. 12:582-587. 950
72. Tucker, K. P., R. Parsons, E. M. Symonds, and M. Breitbart. 2011. Diversity 951 and distribution of single-stranded DNA phages in the North Atlantic Ocean. 952 ISME J. 5:822-830. 953
73. Tyson, G. W., and J. F. Banfield. 2008. Rapidly evolving CRISPRs implicated 954 in acquired resistance of microorganisms to viruses. Environ. Microbiol. 10:200-955 207. 956
74. Tyson, G. W., J. Chapman, P. Hugenholtz, E. E. Allen, R. J. Ram, P. M. 957 Richardson, V. V. Solovyev, E. M. Rubin, D. S. Rokhsar, and J. F. Banfield. 958

43
2004. Community structure and metabolism through reconstruction of microbial 959 genomes from the environment. Nature 428:37-43. 960
75. Ugalde, J., S. Podell, P. Narasingarao, and E. Allen. 2011. Xenorhodopsins, an 961 enigmatic new class of microbial rhodopsins horizontally transferred between 962 archaea and bacteria. Biol. Direct 6:52. 963
76. Williams, W. D. 2001. Anthropogenic salinisation of inland waters. 964 Hydrobiology 466:329-337. 965
77. Williamson, S. J., D. B. Rusch, S. Yooseph, A. L. Halpern, K. B. Heidelberg, 966 J. I. Glass, C. Andrews-Pfannkoch, D. Fadrosh, C. S. Miller, G. Sutton, M. 967 Frazier, and J. C. Venter. 2008. The Sorcerer II Global Ocean Sampling 968 Expedition: Metagenomic Characterization of Viruses within Aquatic Microbial 969 Samples. PLoS ONE 3:e1456. 970
78. Winget, D. M., R. R. Helton, K. E. Williamson, S. R. Bench, S. J. Williamson, 971 and K. E. Wommack. 2011. Repeating patterns of virioplankton production 972 within an estuarine ecosystem. Proc. Natl. Acad. Sci. U.S.A.. 973
79. Wommack, K. E., J. Bhavsar, and J. Ravel. 2008. Metagenomics: Read Length 974 Matters. Appl. Environ. Microbiol. 74:1453-1463. 975
80. Wommack, K. E., J. Ravel, R. T. Hill, J. Chun, and R. R. Colwell. 1999. 976 Population Dynamics of Chesapeake Bay Virioplankton: Total-Community 977 Analysis by Pulsed-Field Gel Electrophoresis. Appl. Environ. Microbiol. 65:231-978 240. 979
81. Zerbino, D. R., and E. Birney. 2008. Velvet: Algorithms for de novo short read 980 assembly using de Bruijn graphs. Genome Res. 18:821-829. 981

44
982
983
Figure Legends: 984
985
Figure 1: Field Site 986
a. Star indicates location of Lake Tyrrell in Victoria, Australia (image reproduced from 987
Google Earth [copyright 2010], copyright 2011 Cnes/Spot Image.); b. Satellite image of 988
Lake Tyrrell, star indicates sampling location within the lake, scale bar 0.5 km (image 989
reproduced from Google Earth [copyright 2010], copyright 2012 Cnes/Spot Image); c. 990
Photograph of sampling site B in 2009, scale bar 0.5 m. 991
992
Figure 2: Presence and Abundance of Seven LT Viruses and VLEs through Time 993
a. LTV1; b. LTV2; c. LTVLE3; d. LTV4; e. LTV5; f. LTV6; g. LTV7. Samples are 994
along the x-axis. The y-axis on the right is the percentage of the genome to which at least 995
one read maps, and it corresponds to the light grey bar graphs. The y-axis on the left 996
corresponds to the black data points and is the normalized number of mapped reads, 997
calculated as follows (for more detail, see Supplemental Material): the number of reads or 998
454 read fragments recruited to a given genome from a given sample was multiplied by 999
normalization factors for (i) the number of reads in the sample, (ii) the genome size, and 1000
(iii) scale, with the largest data point equal to 100. Note that there are two left y-axis 1001
maxima: 15 for LTV1 & LTV4-7 and 100 for LTV2 and LTVLE3. Black data points 1002
connected by a line are from sequential, days-scale time series samples. Open black 1003
circles correspond to the sample from which a given genome was assembled. 1004

45
1005
Figure 3: Genome Figures 1006
Circular representations of the seven composite genomes, to scale within but not among 1007
genomes. Numbers inside each circle indicate positions within the linear contig (origins 1008
of replication were not determined). Arrows indicate the positions of genes. 1009

020406080100
0
5
10
15
!)*+#,'"
!)*+#,#"
!-+"
'!+,'"
'!+,#"
'!+,."
'!+,$"
'!*+#"
0
20
40
60
80
100
0
20
40
60
80
100
!)*+#,'"
!)*+#,#"
!-+"
'!+,'"
'!+,#"
'!+,."
'!+,$"
'!*+#"
0
20
40
60
80
100
0
20
40
60
80
100!)*+#,'"
!-+"
'!+,'"
'!+,#"
'!+,."
'!+,$"
'!*+#"
0
20
60
80
100
0
5
10
15
!)*+#,'"
!)*+#,#"
!-+"
'!+,'"
'!+,#"
'!+,."
'!+,$"
'!*+#"
0
20
40
60
80
100
0
5
10
15
!)*+#,'"
!-+"
'!+,'"
'!+,#"
'!+,."
'!+,$"
'!*+#"
0
20
40
60
80
100
0
5
10
15
!)*+#,'"
!)*+#,#"
!-+"
'!+,'"
'!+,#"
'!+,."
'!+,$"
'!*+#"
0
20
40
60
80
100
0
5
10
15
2007At1
2010Bt1
2010Bt2
2010Bt3
2010Bt4
2010A
Figure 2 a.
b.
c.
d.
e.
f.
g.
Mapped Reads, Normalized ( )
Percent of Genome with ≥ 1x Coverage ( )
Sample
40
2007At2
2009B

63000
49000
14000
28000
LTV214000
28000
49000
63000
LTVLE3
24000
18000
4000
10000
LTV5
LTV6
hypothe cal proteinconserved hypothe cal
structure-related
DNA modifica on
DNA repair/recombina on
DNA-binding/DNA metabolism
terminase
LTV1 LTV4
LTV7
6000
1200024000
30000 6000
1200024000
30000
Figure 3
8000
16000
26000
360006000
1500024000
33000
other
domain-containing

Table 1 Description of Samples
Sample ID
Date Time SiteTDS
(wt%)a T (°C) pH Seq. Type Seq. (Mb) Readsb
> 10 kbc
2007At1 Jan. 23, 2007 15:00 A 31 22 7.23 Illumina PE 356 2,436,330 0 2007At2 Jan. 25, 2007 15:00 A 31 28 7.09 Illumina PE 845 7,330,099 4 2009B* Jan. 5, 2009 7:21 B 24 18 6.86 Illumina PE 2162 19,567,468 6 12:37 26 30 7.13 18:00 27 36 7.02 2010Bt1 Jan. 7, 2010 7:45 B 32 20 7.23 454-Ti 248 2,373,021 2 2010Bt2 Jan. 7, 2010 20:00 B 36 32 7.25 Illumina PE 425 3,312,787 0 2010Bt3 Jan. 8, 2010 8:00 B 34 21 7.2 454-Ti 239 2,243,916 0 2010Bt4 Jan. 10, 2010 0:36 B 32 33 7.16 Illumina PE 1039 9,610,233 2 2010A Jan. 10, 2010 12:50 A 35 37 7.05 Illumina PE 1103 9,268,384 14 *Sample 2009B is a pool of three samples, collected throughout a single day, pooled after DNA extraction aTotal Dissolved Solids, weight percent bNumber of trimmed reads or 454 fragments included in the fragment recruitment analysis cNumber of genome fragments > 10 kb

Table 2 LT Viral and VLE Genome Summaries
Genome Length (bp) % GC
% Coding Predicted
CHP*Assembly
Coverageb Assembly
Genes Samplea Reads (%)c
LTV1 34489 42.4 97 66 11 2007At2 26.3 0.12 LTV2 76716 46.7 92 131 4 2009B 66.8 0.26
LTVLE3 71341 40.3 87 107 2 2010Bt2 46.7 1 LTV4 35497 57.6 92 47 2 2010Bt4 18.4 0.068 LTV5 26538 45.2 94 44 2 2010Bt4 26.9 0.074 LTV6 39362 34.5 97 66 7 2010A 23.2 0.099 LTV7 38139 43.4 91 60 1 2010A 46.8 0.19
*Conserved Hypothetical Proteins aSample from which the genome was assembled bAverage depth of coverage in the sample from which the genome was assembled cPercentage of reads from the assembly sample used to assemble the genome

Table 3 Genes with Predicted Functions from Complete LT Genomes
Genome Annotation* Organism (best BLAST hit) E value % Cov. a Startb Stopb
LTV1 ERF superfamily protein 2E-14 5934 6635 single-stranded DNA-binding protein Bartonella rochalimae 3E-33 98.5 7117 7533 NinB recombinase superfamily protein 8E-9 7832 8212 DNA-binding protein Nitratiruptor sp. 2E-14 96 9009 9305 lysozyme Phaeospirillum molischianum 5E-25 76.2 11138 11629 minor tail protein Vibrio mimicus 8E-21 44 18099 20117 phage major tail protein Sphingomonas sp. 2E-26 94 20664 21095 putative phage head-tail adaptor Aggregatibacter aphrophilus 2E-10 74 21909 22277 HK97 family major capsid protein Xanthobacter autotrophicus 9E-68 74.2 24885 26081 prohead protease Gemmata obscuriglobus 1E-35 73.4 26044 26766 putative head morphogenesis protein Gemmata obscuriglobus 4E-10 54 26798 27547 HK97 family phage portal protein Wolbachia sp. 8E-56 70.9 28977 30566 phage terminase, large subunit Burkholderia sp. 3E-97 98 30563 31762 DNA methylase Hydrogenophaga sp. 1E-88 95.5 32314 33522
LTV2 RuvA domain 2-like superfamily protein 1E-5 1226 1513 nucleotide-diphosphosugar-transferase family protein 4E-8 3607 4296 Concanavalin A-like lectins/glucanases family protein 5E-21 5174 7078 A2M_N family protein 1E-7 10981 11301 AlbA-like superfamily protein 6E-8 24852 25115 DNA methyltransferase Environmental Halophage eHP-11 5E-71 91 25875 26288 repair endonuclease XPF Aeropyrum pernix 2E-17 83.3 26785 27396 DNA repair and recombination protein RadA Acidilobus saccharovorans 1E-49 95.5 30696 31688 ribonucleotide reductase, alpha subunit Candidatus Nanosalina 0 98.8 34023 35708 ribonucleotide reductase, beta chain Candidatus Nanosalina 2E-153 99.4 35708 36706 site-specific DNA methyltransferase Haloquadratum walsbyi 2E-100 94.6 38607 39443 DNA modification protein Paenibacillus larvae 2E-11 75.9 39467 39952 YonJ-like protein (putative DNA polymerase) Halovirus HF2 4E-58 92.2 63887 65083 phosphodiesterase/nucleotide pyrophosphatase Halothermothrix orenii 1E-14 78.9 65595 66563 pyrophosphatase Mycobacterium phage Bongo 2E-28 100 68303 68617 phage portal domain-containing protein 1E-7 70635 71861 DNA ligase superfamily protein 6E-8 73231 73719
LTVLE3 rhodopsin Candidatus Nanosalina 3E-17 96 3806 4426 phage integrase domain-containing protein 9E-11 12797 13804 DNA methylase Halovirus phiCh1 6E-75 89 15034 16338 putative methyltransferase Environmental Halophage eHP-35 4E-68 57 18945 21176

nucleoside triphosphate hydrolase superfamily protein 4E-19 25637 26908 transglutaminase-like family protein 1E-5 32396 32980 ATP-binding protein Haloferax volcanii 2E-99 92.4 38028 39371 archaeal cell division control protein 6 Haloarcula marismortui 3E-126 96.6 42727 43971 ParA domain-containing protein Haloarcula marismortui 2E-78 91.9 44539 45390 SpoVT/AbrB family protein 2E-7 45500 45799 nucleic acid-binding superfamily protein 6E-12 51642 52139 DNA primase catalytic core domain-containing protein 3E-23 53315 56917
LTV4 MurNAc-LAA superfamily (putative endolysin) 3E-14 14762 15325 exonuclease family protein Marinobacter adhaerens 2E-18 87.6 19892 20494 phage terminase, large subunit Clostridium botulinum 1E-23 88 20615 22066 HK97 family phage portal protein Ahrensia sp. 2E-23 74.9 22183 23607 HK97 family major capsid protein Pseudomonas putida 2E-47 80.3 26203 27615 putative N-acetylglycosaminyltransferase Rhodopirellula baltica 3E-14 47.9 28333 29454
LTV5 DNA methylase Paenibacillus elgii 1E-69 88.6 1560 2825 peptidase U35 phage prohead HK97 Natrialba magadii 3E-13 28 19156 20850
LTV6 RecT family protein Ruminococcus sp. 3E-39 76.1 13164 14180 DNA-binding domain protein, excisionase family 1E-9 15951 16121 phage portal protein Bacillus sp. 3E-79 91 24995 26422 phage-related GP7 minor head protein Deep Sea thermophilic phage D6E 2E-25 71.6 26419 27474 phage virion morphogenesis Roseburia intestinalis 1E-14 90 31494 31895 phage tail tape measure domain-containing protein 2E-36 34232 37249
LTV7 phage portal domain-containing protein 4E-16 732 2261 major capsid protein, gp5 superfamily 7E-6 6216 7139 YonJ-like protein (putative DNA polymerase) Halovirus HF2 8E-39 78.6 25874 27067 repair endonuclease XPF Archaeglobus veneficus 2E-13 90.8 36078 36731
*Some domain-containing proteins (e.g., PKD and winged-helix DNA-binding domain proteins) are not included in this list aPercent of the predicted protein covered by the BLAST hit bStart and stop locations (not indicative of gene direction) correspond to locations on the genome in Figure 3

Table 4 Detection Patterns for the 28 Genome Fragments
Detection Pattern* Number of
Fragmentsa
2010A only 9 2007At2 only 3 All samples 2
All 2010 four-day only 2 Both 2007 only 1
2009B only 1 All 2009-2010 only 1
All 2010 only 1 2007At1 and 2009B 1
2007At1 and all 2010 four-day 1
2007At1 and all 2010 1 2007At2 and 2010A 1
All except 2009B 1 2009B and 2010Bt4 1 2009B and 2010A 1
2010A and 2010Bt1-3 1 *Sample(s) in which a given genome fragment was detected (some fragments share the same detection pattern) aNumber of genome fragments that exhibited the detection pattern


