Embed Size (px)
Citation preview
Functional Biogeography as Evidence of Gene Transfer inHypersaline Microbial CommunitiesJ. Jacob Parnell1*, Giovanni Rompato1, Leigh C. Latta, IV2, Michael E. Pfrender2,4¤a, Joy D. Van
Nostrand5, Zhili He5, Jizhong Zhou5, Gary Andersen6, Patti Champine1, Balasubramanian Ganesan1,3,
Bart C. Weimer1,2,3¤b
1 Center for Integrated BioSystems, Utah State University, Logan, Utah, United States of America, 2 Department of Biology, Utah State University, Logan, Utah, United
States of America, 3 Department of Nutrition & Food Sciences, Utah State University, Logan, Utah, United States of America, 4 Ecology Center, Utah State University,
Logan, Utah, United States of America, 5 Institute for Environmental Genomics, Department of Botany and Microbiology, University of Oklahoma, Norman, Oklahoma,
United States of America, 6 Lawrence Berkeley National Laboratory, University of California, Berkeley, California, United States of America
Abstract
Background: Horizontal gene transfer (HGT) plays a major role in speciation and evolution of bacteria and archaea bycontrolling gene distribution within an environment. However, information that links HGT to a natural community usingrelevant population-genetics parameters and spatial considerations is scarce. The Great Salt Lake (Utah, USA) provides anexcellent model for studying HGT in the context of biogeography because it is a contiguous system with dispersallimitations due to a strong selective salinity gradient. We hypothesize that in spite of the barrier to phylogenetic dispersal,functional characteristics—in the form of HGT—expand beyond phylogenetic limitations due to selective pressure.
Methodology and Results: To assay the functional genes and microorganisms throughout the GSL, we used a 16S rRNAoligonucleotide microarray (Phylochip) and a functional gene array (GeoChip) to measure biogeographic patterns of ninemicrobial communities. We found a significant difference in biogeography based on microarray analyses when comparingSørensen similarity values for presence/absence of function and phylogeny (Student’s t-test; p = 0.005).
Conclusion and Significance: Biogeographic patterns exhibit behavior associated with horizontal gene transfer in thatinformational genes (16S rRNA) have a lower similarity than functional genes, and functional similarity is positivelycorrelated with lake-wide selective pressure. Specifically, high concentrations of chromium throughout GSL correspond toan average similarity of chromium resistance genes that is 22% higher than taxonomic similarity. This suggests active HGTmay be measured at the population level in microbial communities and these biogeographic patterns may serve as a modelto study bacteria adaptation and speciation.
Citation: Parnell JJ, Rompato G, Latta LC IV, Pfrender ME, Van Nostrand JD, et al. (2010) Functional Biogeography as Evidence of Gene Transfer in HypersalineMicrobial Communities. PLoS ONE 5(9): e12919. doi:10.1371/journal.pone.0012919
Editor: Ramy K. Aziz, Cairo University, Egypt
Received May 10, 2010; Accepted August 27, 2010; Published September 23, 2010
Copyright: � 2010 Parnell et al. This is an open-access article distributed under the terms of the Creative Commons Attribution License, which permitsunrestricted use, distribution, and reproduction in any medium, provided the original author and source are credited.
Funding: Funding for this project was provided by National Science Foundation grant DEB-021212487 to MEP, and a grant from the United States Department ofAgriculture CSREES 2006-34526-17001. This project was supported by the Utah Agricultural Experiment Station at Utah State University as journal paper number8091. The funders had no role in study design, data collection and analysis, decision to publish, or preparation of the manuscript.
Competing Interests: The authors have declared that no competing interests exist.
* E-mail: [email protected]
¤a Current address: Department of Biological Sciences, University of Notre Dame, Notre Dame, Indiana, United States of America¤b Current address: School of Veterinary Medicine, Department of Population Health and Reproduction, University of California Davis, Davis, California, UnitedStates of America
Introduction
Change in community composition with distance, time, and
along environmental gradients (b-diversity) provides information
about the mechanisms that generate and regulate microbial
biodiversity [1–7] and provide insight into evolutionary history [8]
and ecosystem function [9]. Although community structure,
evolution [10] and functional diversity [11] are all influenced by
horizontal gene transfer (HGT), HGT is rarely linked to relevant
population-genetics parameters and temporospatial considerations
[12]. Genome sequence analyses indicate that preferential transfer
of genes is strongly correlated with gene function and is a frequent
process in microbial evolution [13] accounting for much of the
biodiversity among isolates [14–15]. Genome sequence compar-
isons (nucleotide and dinucleotide frequency; [16], codon usage
bias; [17–19], or Markov analyses; [20–21]) demonstrate hori-
zontal gene transfer of individual organisms, however our current
view of HGT is incomplete as it lacks blending population
genetics, microbial ecology, and biogeography.
Measuring the transfer of functional genes within ecosystems
and relating these events to environmental conditions is a
substantial challenge [22–23]. Spatial distribution models have
been applied successfully in microbial ecology [3–5,9,15,24], in
some cases shifting the focus of biogeography from the taxonomic
level to functional characteristics that enable survival [4,9]. This
shift provides a foundation for detailed molecular-level analyses
within the context of a sound ecological and evolutionary
framework that is required for spatially determining the rate and
PLoS ONE | www.plosone.org 1 September 2010 | Volume 5 | Issue 9 | e12919
extent of real world physical gene transfer [25–26]. To our
knowledge, linking the spatial distribution of functional genes with
environmental conditions in a contiguous system has never been
addressed.
In this study we examined taxonomic and functional biogeog-
raphy in the context of the selective pressures in the Great Salt
Lake, Utah (GSL). GSL is a hypersaline environment where NaCl
concentration ranges from near seawater to saturation, with
exceptionally high concentrations of sulfate [27] and heavy metals
[28] throughout the lake. We analyzed the microbial biodiversity
and functional potential across nine sites, chosen for extremes in
salt concentration, throughout GSL. Because the majority of
environmental microbes cannot be cultured with current labora-
tory techniques, we utilized recent advances in environmental
microarray technology to profile the community structure (using
the PhyloChip microarray capable of identifying over 8,000 taxa;
[29]) and functional gene characteristics (using the GeoChip
microarray capable of identifying over 10,000 genes in 150
different functional groups; [30]).
Materials and Methods
Sampling strategy and environmental measurementsIn the summer of 2007, 9 water samples were collected from
different sites throughout GSL (Figure S1): Rozel Point (RP, salt
saturated; 41u25956.130N 112u39948.310W), Antelope Island (AI,
high salt; 41u02922.370N 112u16942.330W), Farmington Bay (FB
moderate salt; 41u03931.300N 112u14904.980W), USGS site 3510
(35 40u51911.070N 112u20933.110W cords) in the South Arm at 3
depths (surface, 3510S; 15.3%, 7m, 3510I; 18%, and 9m, 3510DB;
20% salt concentration) and USGS site 2565 (25, 41u06958.790N
112u40948.330W) in the South Arm at 3 depths (surface 2565S;
15.4%, 7m; 2565I, 23.1%, and 9m, 2565DB; 23.2% salt concentra-
tion). Water from the lake sites was collected at various depths either
directly (surface samples) or using a peristaltic pump with flexible
tubing that was weighted to minimize horizontal drifting. Samples
were collected in sterile NalgeneH 4L plastic bottles. Within 6 h of
collection, samples were refrigerated at 4uC until processing. This
sampling strategy provided points of data for community analysis
ranging from near freshwater to salt-saturated brine.
In order to determine prevailing environmental conditions in
which microbial communities reside, we measured dissolved
oxygen, pH, salinity via electrical conductivity, and temperature.
Water chemistry parameters were measured at lake sites during
time of sampling using an In-Situ Troll 9500 multiparameter
water-quality monitor. The high range specific conductance and
standard pH probes were calibrated and verified prior to taking
measurements. Additional measurements involving long-term
environmental variation are available through USGS records for
sites 3510 and 2565.
Extraction of GSL Community DNAWe optimized protocols for the extraction of community DNA
from the hypersaline waters of GSL using a modification of a
protocol published by Griffiths et al. [31]. Due to the near-
saturated salt concentration, bacteria cannot be isolated from the
samples by filtration as salt precipitates clog the filter. As an
alternative, one gallon of water collected from GSL was
centrifuged (10,0006g, 40 min, 4uC) in a Sorval high speed
centrifuge and resuspended in 500ml of modified CTAB
(hexadecyltrimethylammonium bromide) extraction buffer (equal
volumes of 10% CTAB in 0.7 M NaCl and 240 mM potassium
phosphate buffer (pH 8) [32]. Commonly used bead-beating and
chloroform procedures were employed to extract DNA [31]. The
extracted community DNA was purified by passing it through a
SephacrylH S-300 column. Briefly, the column was constructed by
plugging a 5 ml syringe with sterile glass wool, pouring 5 ml of
resin suspended in 24% ethanol into the syringe and centrifuging
10 minutes at 10006g at room temperature. The column was
washed twice with sterile ddH20. Samples were added to the
column and purified by centrifugation for 10 minutes at 1,0006g
at room temperature. We found that use of this column is critical
for good resolution of community DNA and for the elimination of
PCR inhibitors present in the water collected from GSL. With this
protocol, we have successfully extracted archaeal and bacterial
DNA from hypersaline environments, including GSL, and used
this DNA to amplify 16S rRNA genes by PCR.
Taxonomic diversityTo assess microbial diversity and to overcome obstacles of non-
cultivability we used a newly developed 16S Phylogenetic Array
(Phylochip) containing probes for 8,741 bacterial and archaeal
taxa [29]. Hybridization of the PhyloChip is achieved using
slightly modified Affymetrix (Santa Clara, CA) protocols (see ref.
[29]). Briefly, the ribosomal 16S gene was amplified by PCR
utilizing Bacteria (F: 59-AGAGTTTGATCCTGGCTCAG-39, R:
59-ACGGCT ACCTTGTTAGCACTT-39) or Archaea (F: 59-
GACGGGCGGTGTGTCA-39, R: 59-GCGGATCCGCGGCC-
GCTGCAGAYC-39) specific primers. To minimize the primer
bias, PCR amplification was performed with a temperature
gradient from 48uC to 58uC for the annealing temperature. The
PCR products from the different amplification reactions were
collected, purified, and quantified. Two hundred ng of 16S
amplicon were fragmented by DNaseI digestion for 20 minutes at
25uC. The DNaseI was then inactivated and the fragmented DNA
was biotin labeled for 60 minutes at 37uC following the Affymetrix
protocol. The labeled DNA was added to Affymetrix hybridization
solution and hybridized to a PhyloChip for 16 hours at 48uCrotating at 60 rpm. The chip was washed and stained following the
Affymetrix protocol and scanned utilizing an Affymetrix ChiS-
canner 3000. Intensity values were normalized using Robust
Multi-Array normalization [33].
Functional diversityTo determine the functional genomics capabilities of the
microbial communities within GSL, we used the GeoChip
functional gene array [30]. Extracted community DNA (no
amplification step) was labeled with cyanine-5 (Cy-5) dye. Briefly,
approximately 2 mg of genomic DNA was denatured for 5 min at
99.9uC in solution with random octamer mix (Invitrogen,
Carlsbad, CA, USA) and snap chilled on ice. Following denatura-
tion, 2.5mM dithiothreitol (DTT), 0.25mM dATP, dCTP and
dGTP, 0.125mM dTTP, 0.125mM Cy5-dUTP, and 80U Klenow
fragment (Invitrogen, Carlsbad, CA, USA) were added. Reaction
mixtures were incubated at 37uC for 3 h. Labeled target DNA was
purified with a QIAquick PCR kit (Qiagen, Valencia, CA, USA)
according to the manufacturer’s instructions. Labeled DNA was
measured on a ND-1000 spectrophotometer (NanoDrop Tech-
nologies, Wilminton, DE) and dried using a speed-vac at 45uC for
45 min. Dried, labeled DNA was resuspended in a solution of 50%
formamide, 56sodium saline citrate, 0.1% sodium dodecyl sulfate,
0.1 mg ml21 herring sperm DNA and 0.85 mM dithiothreitol and
incubated at 95uC for 5 min. Labeled reactions were kept at 60uCuntil hybridization. Two technical replicates of community DNA
hybridizations were performed using a HS4800 Hybridization
Station (TECAN US, Durham, NC) and hybridization conditions
were followed as indicated elsewhere [34] with hybridization
temperature of 42uC. GeoChip microarrays were scanned using a
Biogeography of Gene Transfer
PLoS ONE | www.plosone.org 2 September 2010 | Volume 5 | Issue 9 | e12919
ProScanArray microarray scanner (PerkinElmer, Boston, MA) as
mentioned by Yergeau et al., [34]. Scanned images were analyzed
using ImaGene 6.0 software (BioDiscovery, El Segundo, CA,
USA) with signals processed as signal to noise ratio .2.0. The
phylogenetic and functional microarray data used in this study
comply with journal standards and will be made freely available.
Selective pressureSelective pressure was determined by taking the intensity for
different groups of functional genes considered relative to the
number of gene variants detected in each group [34]. The
microarray design contains multiple probes for each gene
sequence or each group of homologous sequences. The richness
of gene variants (different gene sequences with the same function)
detected for each functional group provided evidence of functional
redundancy within each spatially distinct community. Similarly,
comparison of the Log2 normalized probe intensity for each
functional category indicated the relative abundance of each gene.
The relative number of gene variants was determined by dividing
the number of genes belonging to each functional category by the
total number of genes detected [34]. Relative intensity values for
each hybridization signal were calculated and ranked according to
intensity to allow comparison of relative abundance of genes in
each functional category across experimental samples as per
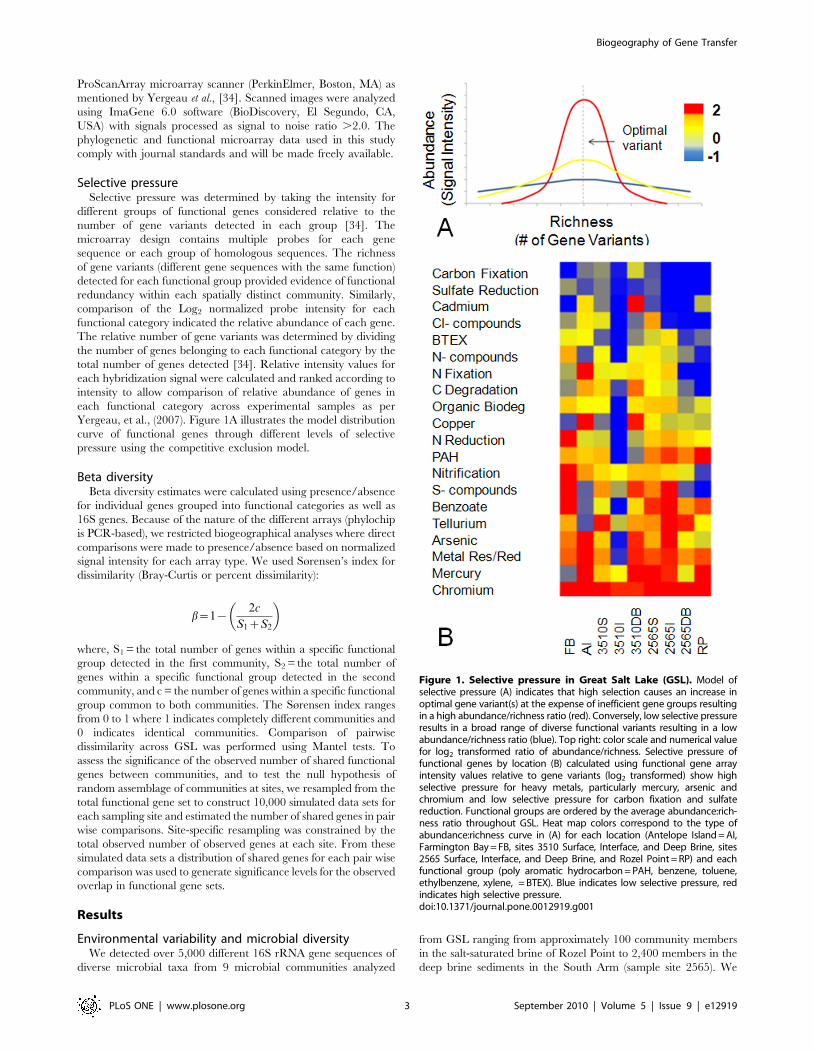
Yergeau, et al., (2007). Figure 1A illustrates the model distribution
curve of functional genes through different levels of selective
pressure using the competitive exclusion model.
Beta diversityBeta diversity estimates were calculated using presence/absence
for individual genes grouped into functional categories as well as
16S genes. Because of the nature of the different arrays (phylochip
is PCR-based), we restricted biogeographical analyses where direct
comparisons were made to presence/absence based on normalized
signal intensity for each array type. We used Sørensen’s index for
dissimilarity (Bray-Curtis or percent dissimilarity):
b~1{2c
S1zS2
� �
where, S1 = the total number of genes within a specific functional
group detected in the first community, S2 = the total number of
genes within a specific functional group detected in the second
community, and c = the number of genes within a specific functional
group common to both communities. The Sørensen index ranges
from 0 to 1 where 1 indicates completely different communities and
0 indicates identical communities. Comparison of pairwise
dissimilarity across GSL was performed using Mantel tests. To
assess the significance of the observed number of shared functional
genes between communities, and to test the null hypothesis of
random assemblage of communities at sites, we resampled from the
total functional gene set to construct 10,000 simulated data sets for
each sampling site and estimated the number of shared genes in pair
wise comparisons. Site-specific resampling was constrained by the
total observed number of observed genes at each site. From these
simulated data sets a distribution of shared genes for each pair wise
comparison was used to generate significance levels for the observed
overlap in functional gene sets.
Results
Environmental variability and microbial diversityWe detected over 5,000 different 16S rRNA gene sequences of
diverse microbial taxa from 9 microbial communities analyzed
from GSL ranging from approximately 100 community members
in the salt-saturated brine of Rozel Point to 2,400 members in the
deep brine sediments in the South Arm (sample site 2565). We
Figure 1. Selective pressure in Great Salt Lake (GSL). Model ofselective pressure (A) indicates that high selection causes an increase inoptimal gene variant(s) at the expense of inefficient gene groups resultingin a high abundance/richness ratio (red). Conversely, low selective pressureresults in a broad range of diverse functional variants resulting in a lowabundance/richness ratio (blue). Top right: color scale and numerical valuefor log2 transformed ratio of abundance/richness. Selective pressure offunctional genes by location (B) calculated using functional gene arrayintensity values relative to gene variants (log2 transformed) show highselective pressure for heavy metals, particularly mercury, arsenic andchromium and low selective pressure for carbon fixation and sulfatereduction. Functional groups are ordered by the average abundance:rich-ness ratio throughout GSL. Heat map colors correspond to the type ofabundance:richness curve in (A) for each location (Antelope Island = AI,Farmington Bay = FB, sites 3510 Surface, Interface, and Deep Brine, sites2565 Surface, Interface, and Deep Brine, and Rozel Point = RP) and eachfunctional group (poly aromatic hydrocarbon = PAH, benzene, toluene,ethylbenzene, xylene, = BTEX). Blue indicates low selective pressure, redindicates high selective pressure.doi:10.1371/journal.pone.0012919.g001
Biogeography of Gene Transfer
PLoS ONE | www.plosone.org 3 September 2010 | Volume 5 | Issue 9 | e12919
detected over 4,500 different functional genes in GSL ranging
from 227 different functional genes in the salt-saturated RP
community to over 3,000 in the interface between the deep brine
layer and surface waters (sample site 3510). The total number of
functional genes did not correlate with taxonomic richness across
all pooled samples (Pearson correlation, n = 9, r = 0.28), however
the fluctuation in dissolved oxygen among South Arm sites (3510
and 2565) is positively correlated with the ratio of functional genes
(GeoChip) to taxa (Phylochip) (Pearson correlation, p = 0.046,
r = 0.82) (Table 1).
Selective pressureUsing an approach based on the competitive exclusion principle
(see methods), we estimated the selective pressure for each
functional category by analyzing the distribution of genes within
each sample location. Figure 1B indicates the ratio of the relative
intensity to relative richness for each functional group in each
location examined throughout GSL. Although the ratio for most
functions varies lake-wide, carbon fixation and sulfate reduction
ratios are low in all locations, and chromium resistance ratios are
high in all locations. Examples of curves for 3510 interface site
chromium resistance and sulfate reduction genes are demonstrated
in Figure S2.
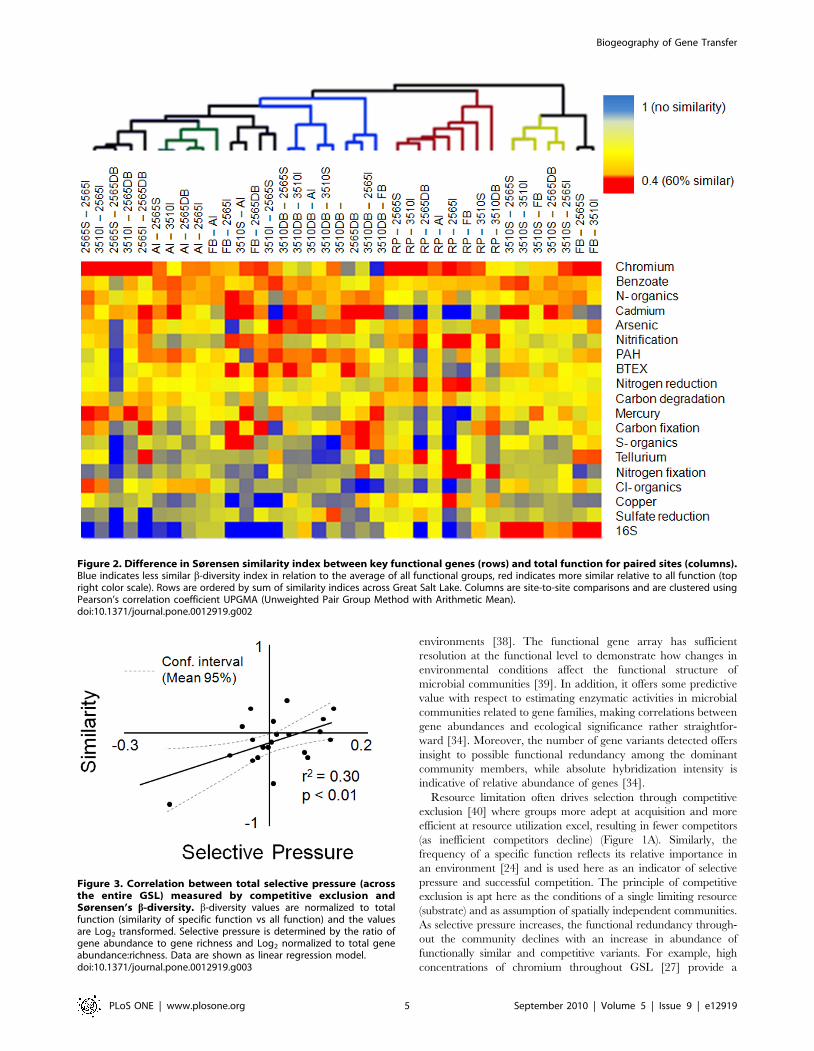
Taxonomic and functional biogeography throughoutGSL
We used Sørensen’s b-diversity to delineate regions or
transitions of functional genes (GeoChip) throughout GSL and
compared these with taxonomic delineations determined using the
PhyloChip. Figure 2 shows the pairwise comparison of the
similarity matrix of sample locations for 16S rRNA genes as well
as individual functional groups such as metal resistance genes
(further divided by specific metals), organic biodegradation genes,
and chromosomally encoded functions (sulfate reduction, carbon
fixation, etc.) relative to all functional genes detected on the
functional gene array. Based on randomized simulated data sets
the observed similarity of functional genes between sites is
significantly greater than expected by chance for all comparisons
except those involving the Antelope Island site and the 3510S site
(Table S1). Analysis of chromosomally encoded functions
(including sulfate reduction genes) show low (not significant)
similarity between sites (Mantel, r = 0.47, p = 0.11) while we found
significant biogeographic patterning for metal resistance (Mantel,
r = 0.53, p = 0.04). Comparison of the b-diversity indices for 16S
and functional genes indicates that the change in taxonomic
diversity and function is significantly different throughout GSL
(pairwise Student’s t-test, n = 36, p = 0.005; see Table S2).
Sørensen’s diversity in relation to geographic distance shows a
very weak correlation in both taxonomic and functional genes
(Figure S3).
Similarity values for each functional group were normalized to
the similarity value for all functional genes and Log2 transformed.
This provides information on which functional groups are more
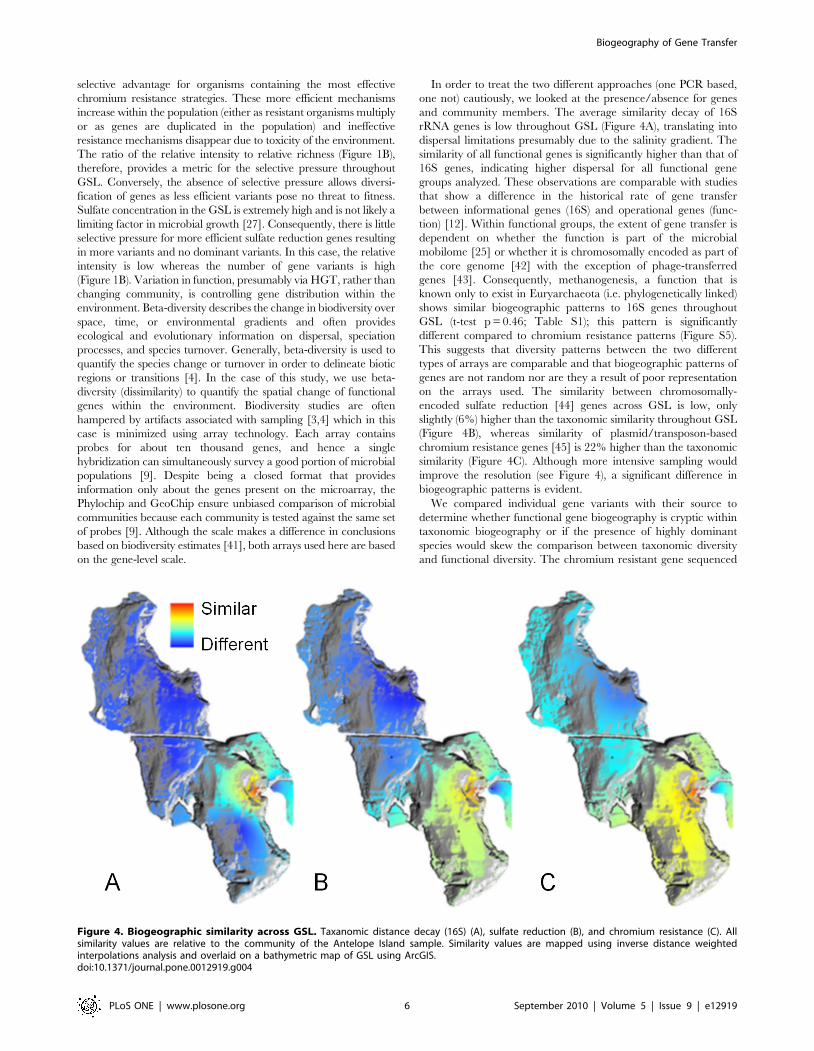
similar than others throughout the lake. Figure 3 demonstrates a
weak, yet significant correlation between the relative intensity/
richness value calculated above and similarity. Spatial variability
of selective pressure across different sites (Figure 1B) breaks the
premise of competitive exclusion and, as expected, lessens the
correlation near the mean of similarity and selective pressure.
Discussion
In general, higher salt conditions are restrictive to Cyanobac-
teria, b-proteobacteria, and Bacteroides, and favor Archaea and
Thermotoga (Figure S4). We suggest that the variation in
functional diversity within these communities may reflect the
environmental dynamics associated with each location. Because of
its direct link with the functional repertoire, the diversity of
function in relation to the diversity of organisms is believed to be
closely coupled to the functional complexity and environmental
niche of an organism [35,36]. Unvarying environmental condi-
tions favor organisms with a narrow functional repertoire of genes
(specialists) while variable environmental conditions favor versatile
organisms (generalists) with a wide range of functional potential
[23]. Ratios of gene richness to phylogenetic richness in two long-
term sites (six samples) when compared with USGS abiotic
measurements suggest that more versatile organisms (larger
relative functional diversity) are found in areas that vary greatly
in oxygen concentration (Table 1). Although variations in oxygen
are not responsible for driving all genetic diversity, these data
suggest that environmental pressures drive functional diversity in
GSL and are consistent with metagenome analyses of HGT [37].
Consequently, the distribution and frequency of functional genes
throughout different communities provide insight to environmen-
tal pressures experienced by these microbial consortia.
The functional gene array provides a powerful tool for studying
microbial biogeography [9] and ecosystem dynamics in various
Table 1. General environmental parameters and a-diversity associated with sample sites.
Annual Variation a-Diversity
Sample location Salinity (%) dO (mg/L) Temp Cu Phylogenetic Functional Ratio
Farmington Bay 5 nd nd 592 637 1.08
Antelope Island 15 nd nd 317 1,994 6.29
Rozel Point 30 nd nd 100 227 2.41
3510 Surface 15.3 3.47 7.67 1,724 1,167 0.68
3510 Interface 18 3.77 8.11 1,305 3,053 2.34
3510 Deep Brine 20 0.6 3.9 1,079 411 0.38
2565 Surface 15.4 3.77 7.8 914 2,383 2.61
2565 Interface 23.1 0.95 5.85 1,423 487 0.34
2565 Deep Brine 23.2 0.8 4.38 2,400 896 0.37
nd not determined.doi:10.1371/journal.pone.0012919.t001
Biogeography of Gene Transfer
PLoS ONE | www.plosone.org 4 September 2010 | Volume 5 | Issue 9 | e12919
environments [38]. The functional gene array has sufficient
resolution at the functional level to demonstrate how changes in
environmental conditions affect the functional structure of
microbial communities [39]. In addition, it offers some predictive
value with respect to estimating enzymatic activities in microbial
communities related to gene families, making correlations between
gene abundances and ecological significance rather straightfor-
ward [34]. Moreover, the number of gene variants detected offers
insight to possible functional redundancy among the dominant
community members, while absolute hybridization intensity is
indicative of relative abundance of genes [34].
Resource limitation often drives selection through competitive
exclusion [40] where groups more adept at acquisition and more
efficient at resource utilization excel, resulting in fewer competitors
(as inefficient competitors decline) (Figure 1A). Similarly, the
frequency of a specific function reflects its relative importance in
an environment [24] and is used here as an indicator of selective
pressure and successful competition. The principle of competitive
exclusion is apt here as the conditions of a single limiting resource
(substrate) and as assumption of spatially independent communities.
As selective pressure increases, the functional redundancy through-
out the community declines with an increase in abundance of
functionally similar and competitive variants. For example, high
concentrations of chromium throughout GSL [27] provide a
Figure 2. Difference in Sørensen similarity index between key functional genes (rows) and total function for paired sites (columns).Blue indicates less similar b-diversity index in relation to the average of all functional groups, red indicates more similar relative to all function (topright color scale). Rows are ordered by sum of similarity indices across Great Salt Lake. Columns are site-to-site comparisons and are clustered usingPearson’s correlation coefficient UPGMA (Unweighted Pair Group Method with Arithmetic Mean).doi:10.1371/journal.pone.0012919.g002
Figure 3. Correlation between total selective pressure (acrossthe entire GSL) measured by competitive exclusion andSørensen’s b-diversity. b-diversity values are normalized to totalfunction (similarity of specific function vs all function) and the valuesare Log2 transformed. Selective pressure is determined by the ratio ofgene abundance to gene richness and Log2 normalized to total geneabundance:richness. Data are shown as linear regression model.doi:10.1371/journal.pone.0012919.g003
Biogeography of Gene Transfer
PLoS ONE | www.plosone.org 5 September 2010 | Volume 5 | Issue 9 | e12919
selective advantage for organisms containing the most effective
chromium resistance strategies. These more efficient mechanisms
increase within the population (either as resistant organisms multiply
or as genes are duplicated in the population) and ineffective
resistance mechanisms disappear due to toxicity of the environment.
The ratio of the relative intensity to relative richness (Figure 1B),
therefore, provides a metric for the selective pressure throughout
GSL. Conversely, the absence of selective pressure allows diversi-
fication of genes as less efficient variants pose no threat to fitness.
Sulfate concentration in the GSL is extremely high and is not likely a
limiting factor in microbial growth [27]. Consequently, there is little
selective pressure for more efficient sulfate reduction genes resulting
in more variants and no dominant variants. In this case, the relative
intensity is low whereas the number of gene variants is high
(Figure 1B). Variation in function, presumably via HGT, rather than
changing community, is controlling gene distribution within the
environment. Beta-diversity describes the change in biodiversity over
space, time, or environmental gradients and often provides
ecological and evolutionary information on dispersal, speciation
processes, and species turnover. Generally, beta-diversity is used to
quantify the species change or turnover in order to delineate biotic
regions or transitions [4]. In the case of this study, we use beta-
diversity (dissimilarity) to quantify the spatial change of functional
genes within the environment. Biodiversity studies are often
hampered by artifacts associated with sampling [3,4] which in this
case is minimized using array technology. Each array contains
probes for about ten thousand genes, and hence a single
hybridization can simultaneously survey a good portion of microbial
populations [9]. Despite being a closed format that provides
information only about the genes present on the microarray, the
Phylochip and GeoChip ensure unbiased comparison of microbial
communities because each community is tested against the same set
of probes [9]. Although the scale makes a difference in conclusions
based on biodiversity estimates [41], both arrays used here are based
on the gene-level scale.
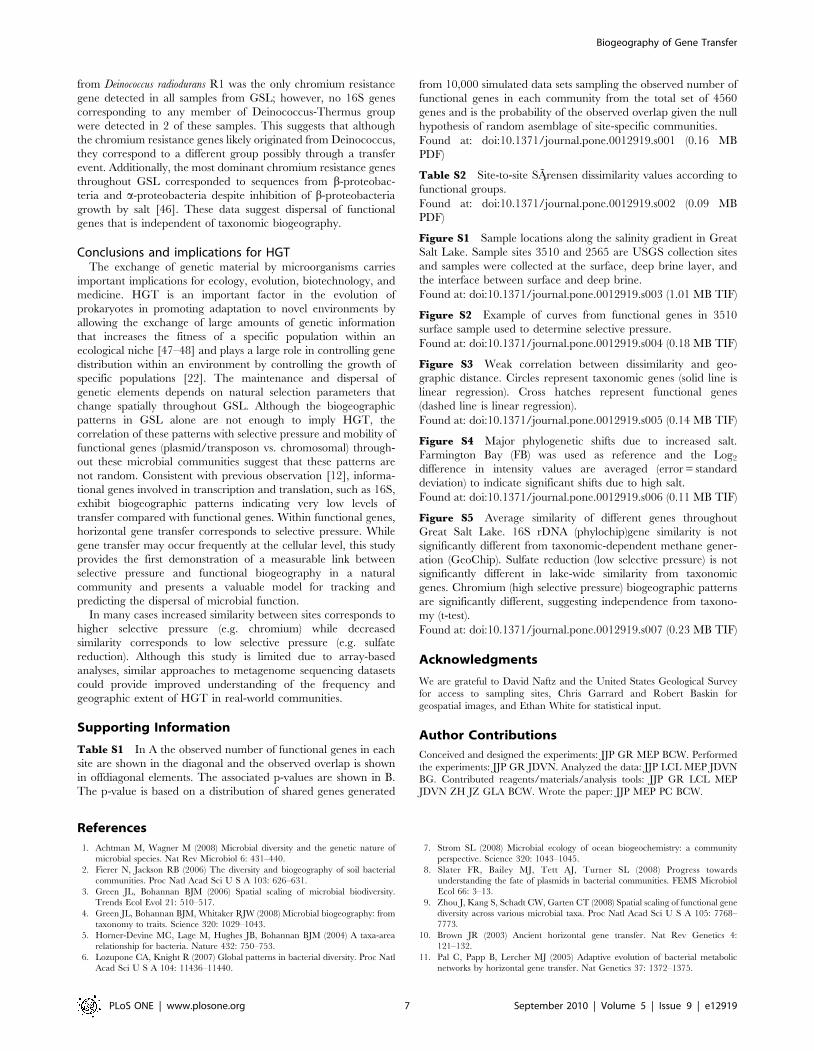
In order to treat the two different approaches (one PCR based,
one not) cautiously, we looked at the presence/absence for genes
and community members. The average similarity decay of 16S
rRNA genes is low throughout GSL (Figure 4A), translating into
dispersal limitations presumably due to the salinity gradient. The
similarity of all functional genes is significantly higher than that of
16S genes, indicating higher dispersal for all functional gene
groups analyzed. These observations are comparable with studies
that show a difference in the historical rate of gene transfer
between informational genes (16S) and operational genes (func-
tion) [12]. Within functional groups, the extent of gene transfer is
dependent on whether the function is part of the microbial
mobilome [25] or whether it is chromosomally encoded as part of
the core genome [42] with the exception of phage-transferred
genes [43]. Consequently, methanogenesis, a function that is
known only to exist in Euryarchaeota (i.e. phylogenetically linked)
shows similar biogeographic patterns to 16S genes throughout
GSL (t-test p = 0.46; Table S1); this pattern is significantly
different compared to chromium resistance patterns (Figure S5).
This suggests that diversity patterns between the two different
types of arrays are comparable and that biogeographic patterns of
genes are not random nor are they a result of poor representation
on the arrays used. The similarity between chromosomally-
encoded sulfate reduction [44] genes across GSL is low, only
slightly (6%) higher than the taxonomic similarity throughout GSL
(Figure 4B), whereas similarity of plasmid/transposon-based
chromium resistance genes [45] is 22% higher than the taxonomic
similarity (Figure 4C). Although more intensive sampling would
improve the resolution (see Figure 4), a significant difference in
biogeographic patterns is evident.
We compared individual gene variants with their source to
determine whether functional gene biogeography is cryptic within
taxonomic biogeography or if the presence of highly dominant
species would skew the comparison between taxonomic diversity
and functional diversity. The chromium resistant gene sequenced
Figure 4. Biogeographic similarity across GSL. Taxanomic distance decay (16S) (A), sulfate reduction (B), and chromium resistance (C). Allsimilarity values are relative to the community of the Antelope Island sample. Similarity values are mapped using inverse distance weightedinterpolations analysis and overlaid on a bathymetric map of GSL using ArcGIS.doi:10.1371/journal.pone.0012919.g004
Biogeography of Gene Transfer
PLoS ONE | www.plosone.org 6 September 2010 | Volume 5 | Issue 9 | e12919
from Deinococcus radiodurans R1 was the only chromium resistance
gene detected in all samples from GSL; however, no 16S genes
corresponding to any member of Deinococcus-Thermus group
were detected in 2 of these samples. This suggests that although
the chromium resistance genes likely originated from Deinococcus,
they correspond to a different group possibly through a transfer
event. Additionally, the most dominant chromium resistance genes
throughout GSL corresponded to sequences from b-proteobac-
teria and a-proteobacteria despite inhibition of b-proteobacteria
growth by salt [46]. These data suggest dispersal of functional
genes that is independent of taxonomic biogeography.
Conclusions and implications for HGTThe exchange of genetic material by microorganisms carries
important implications for ecology, evolution, biotechnology, and
medicine. HGT is an important factor in the evolution of
prokaryotes in promoting adaptation to novel environments by
allowing the exchange of large amounts of genetic information
that increases the fitness of a specific population within an
ecological niche [47–48] and plays a large role in controlling gene
distribution within an environment by controlling the growth of
specific populations [22]. The maintenance and dispersal of
genetic elements depends on natural selection parameters that
change spatially throughout GSL. Although the biogeographic
patterns in GSL alone are not enough to imply HGT, the
correlation of these patterns with selective pressure and mobility of
functional genes (plasmid/transposon vs. chromosomal) through-
out these microbial communities suggest that these patterns are
not random. Consistent with previous observation [12], informa-
tional genes involved in transcription and translation, such as 16S,
exhibit biogeographic patterns indicating very low levels of
transfer compared with functional genes. Within functional genes,
horizontal gene transfer corresponds to selective pressure. While
gene transfer may occur frequently at the cellular level, this study
provides the first demonstration of a measurable link between
selective pressure and functional biogeography in a natural
community and presents a valuable model for tracking and
predicting the dispersal of microbial function.
In many cases increased similarity between sites corresponds to
higher selective pressure (e.g. chromium) while decreased
similarity corresponds to low selective pressure (e.g. sulfate
reduction). Although this study is limited due to array-based
analyses, similar approaches to metagenome sequencing datasets
could provide improved understanding of the frequency and
geographic extent of HGT in real-world communities.
Supporting Information
Table S1 In A the observed number of functional genes in each
site are shown in the diagonal and the observed overlap is shown
in offdiagonal elements. The associated p-values are shown in B.
The p-value is based on a distribution of shared genes generated
from 10,000 simulated data sets sampling the observed number of
functional genes in each community from the total set of 4560
genes and is the probability of the observed overlap given the null
hypothesis of random asemblage of site-specific communities.
Found at: doi:10.1371/journal.pone.0012919.s001 (0.16 MB
PDF)
Table S2 Site-to-site SArensen dissimilarity values according to
functional groups.
Found at: doi:10.1371/journal.pone.0012919.s002 (0.09 MB
PDF)
Figure S1 Sample locations along the salinity gradient in Great
Salt Lake. Sample sites 3510 and 2565 are USGS collection sites
and samples were collected at the surface, deep brine layer, and
the interface between surface and deep brine.
Found at: doi:10.1371/journal.pone.0012919.s003 (1.01 MB TIF)
Figure S2 Example of curves from functional genes in 3510
surface sample used to determine selective pressure.
Found at: doi:10.1371/journal.pone.0012919.s004 (0.18 MB TIF)
Figure S3 Weak correlation between dissimilarity and geo-
graphic distance. Circles represent taxonomic genes (solid line is
linear regression). Cross hatches represent functional genes
(dashed line is linear regression).
Found at: doi:10.1371/journal.pone.0012919.s005 (0.14 MB TIF)
Figure S4 Major phylogenetic shifts due to increased salt.
Farmington Bay (FB) was used as reference and the Log2
difference in intensity values are averaged (error = standard
deviation) to indicate significant shifts due to high salt.
Found at: doi:10.1371/journal.pone.0012919.s006 (0.11 MB TIF)
Figure S5 Average similarity of different genes throughout
Great Salt Lake. 16S rDNA (phylochip)gene similarity is not
significantly different from taxonomic-dependent methane gener-
ation (GeoChip). Sulfate reduction (low selective pressure) is not
significantly different in lake-wide similarity from taxonomic
genes. Chromium (high selective pressure) biogeographic patterns
are significantly different, suggesting independence from taxono-
my (t-test).
Found at: doi:10.1371/journal.pone.0012919.s007 (0.23 MB TIF)
Acknowledgments
We are grateful to David Naftz and the United States Geological Survey
for access to sampling sites, Chris Garrard and Robert Baskin for
geospatial images, and Ethan White for statistical input.
Author Contributions
Conceived and designed the experiments: JJP GR MEP BCW. Performed
the experiments: JJP GR JDVN. Analyzed the data: JJP LCL MEP JDVN
BG. Contributed reagents/materials/analysis tools: JJP GR LCL MEP
JDVN ZH JZ GLA BCW. Wrote the paper: JJP MEP PC BCW.
References
1. Achtman M, Wagner M (2008) Microbial diversity and the genetic nature of
microbial species. Nat Rev Microbiol 6: 431–440.
2. Fierer N, Jackson RB (2006) The diversity and biogeography of soil bacterial
communities. Proc Natl Acad Sci U S A 103: 626–631.
3. Green JL, Bohannan BJM (2006) Spatial scaling of microbial biodiversity.
Trends Ecol Evol 21: 510–517.
4. Green JL, Bohannan BJM, Whitaker RJW (2008) Microbial biogeography: from
taxonomy to traits. Science 320: 1029–1043.
5. Horner-Devine MC, Lage M, Hughes JB, Bohannan BJM (2004) A taxa-area
relationship for bacteria. Nature 432: 750–753.
6. Lozupone CA, Knight R (2007) Global patterns in bacterial diversity. Proc Natl
Acad Sci U S A 104: 11436–11440.
7. Strom SL (2008) Microbial ecology of ocean biogeochemistry: a community
perspective. Science 320: 1043–1045.
8. Slater FR, Bailey MJ, Tett AJ, Turner SL (2008) Progress towards
understanding the fate of plasmids in bacterial communities. FEMS Microbiol
Ecol 66: 3–13.
9. Zhou J, Kang S, Schadt CW, Garten CT (2008) Spatial scaling of functional gene
diversity across various microbial taxa. Proc Natl Acad Sci U S A 105: 7768–
7773.
10. Brown JR (2003) Ancient horizontal gene transfer. Nat Rev Genetics 4:
121–132.
11. Pal C, Papp B, Lercher MJ (2005) Adaptive evolution of bacterial metabolic
networks by horizontal gene transfer. Nat Genetics 37: 1372–1375.
Biogeography of Gene Transfer
PLoS ONE | www.plosone.org 7 September 2010 | Volume 5 | Issue 9 | e12919
12. Thomas CM, Nielsen KM (2005) Mechanisms of, and barriers to, horizontal
gene transfer between bacteria. Nat Rev Microbiol 3: 711–721.
13. Gogarten JP, Doolittle WF, Lawrence JG (2002) Prokaryotic evolution in light of
gene transfer. Mol Bio Evol 19: 2226–2238.
14. Feil EJ, Holmes EC, Bessen DE, Chan MS, Day NP, et al. (2001)
Recombination within natural populations of pathogenic bacteria: short-term
empirical estimates and long-term phylogenetic consequences. Proc Natl Acad
Sci U S A 98: 182–187.
15. Lo I, Denef VJ, Verberkmoes NC, Shah MB, Goltsman D, et al. (2007) Strain-
resolved community proteomics reveals recombining genomes of acidophilic
bacteria. Nature 446: 537–541.
16. Xia X, Wei T, Xie Z, Danchin A (2002) Genomic changes in nucleotide and
dinucleotide frequencies in Pasteurella multocida cultured under high temperature.
Genetics 161: 1385–1394.
17. Klosterand M, Tang C (2008) SCUMBLE: a method for systematic and
accurate detection of codon usage bias by maximum likelihood estimation.
Nucleic Acids Res 36: 3819–3827.
18. Puigbo P, Guzman E, Romeu A, Garcie-Vallve S (2007) OPTIMIZER: a web
server for opotimizing the codon usage of DNA sequences. Nucleic Acids Res
35: W126–131.
19. Putoni C, Luo Y, Katili C, Chumakov S, Fox GE, et al. (2006) A computational
tool for the genomic identification of regions of unusual compositional properties
and its utilization in the detection of horizontally transferred sequences. Mol Biol
Evol 23: 1863–1868.
20. Azadand RK, Lawrence JG (2007) Detecting laterally transferred genes: use of
entropic clustering methods and genome position. Nucleic Acids Res 35:
4629–4639.
21. Tsirigos A, Rigoutsos I (2005) A new computational method for the detection of
horizontal gene transfer events. Nucleic Acids Res 33: 922–933.
22. Smets BF, Barkay T (2005) Horizontal gene transfer: perspectives at a crossroads
of scientific disciplines. Nat Rev Microbiol 3: 675–678.
23. Thomas CM, Nielsen KM (2005) Mechanisms of, and barriers to, horizontal
gene transfer between bacteria. Nat Rev Microbiol 3: 711–721.
24. Dinsdale EA, Edwares RA, Hall D, Angly F, Briebart M, et al. (2008) Functional
metagenomic profiling of nine biomes. Nature 452: 629–632.
25. Frost LS, Leplae R, Summers AO, Toussaint A (2005) Mobile genetic elements:
the agents of open source evolution. Nat Rev Microbiol 3: 722–732.
26. Kassen R, Rainey PB (2004) The ecology and genetics of microbial diversity.
Annu Rev Microbiol 58: 207–231.
27. Brandt KK, Vester F, Jensen AN, Ingvorsen K (2001) Sulfate reduction
dynamics and enumeration of sulfate-reducing bacteria in hypersaline sediments
of the Great Salt Lake (Utah, USA). Microb Ecol 41: 1–11.
28. Naftz D, Angeroth C, Kenney T, Waddell B, Darnall N, et al. (2008)
Anthropogenic influences on the input and biogeochemical cycling of nutrients
and mercury in Great Salt Lake, Utah, USA. Appl Geochem 23: 1731–1744.
29. Brodie EL, DeSantis TZ, Moeberg Parker JJ, Zubietta IX, Piceno YM, et al.
(2007) Urban aerosols harbor diverse and dynamic bacterial populations. Proc
Natl Acad Sci U S A 104: 299–304.
30. He Z, Gentry TJ, Schadt CW, Wu L, Leibich J, et al. (2007) GeoChip: A
comprehensive microarray for investigating biogeochemical, ecological, andenvironmental processes. ISME J 1: 67–77.
31. Griffiths RI, Whiteley AS, O’Donnell AG, Bailey MJ (2000) Rapid method for
coextraction of DNA and RNA from natural environments for analysis ofribosomal DNA- and rRNA-based microbial community composition. Appl
Environ Microbiol 66: 5488–5491.32. Zhou J, Bruns MA, Tiedje JM (1996) DNA recovery from soils of diverse
composition. Appl Environ Microbiol 62: 316–322.
33. Irizarry RA, Bolstad BM, Collin F, Cope LM, Hobbs B, et al. (2003) Summariesof Affymetrix GeneChip probe level data. Nucleic Acids Res 31: e15.
34. Yergeau E, Kang S, He Z, Zhou J, Kowalchuk GA (2007) Functionalmicroarray analysis of nitrogen and carbon cycling genes across an Antarctic
latitudinal transect. ISME J 1: 163–179.35. Raes J, O Korbel J, Lercher MJ, von Mering C, Bork P (2007) Prediction of
effective genome size in metagenomic samples. Genome Biol 8: r10.
36. Bentley SD, Parkhill J (2004) Comparative genomic structure of prokaryotes.Annu Rev Genet 38: 771–792.
37. Tamames J, Moya A (2008) Estimating the extent of horizontal gene transfer inmetagenomic sequences. BMC Genomics 9: 136.
38. Wang F, Zhou H, Meng J, Peng Z, Jiang L, et al. (2009) GeoChip-based analysis
of metabolic diversity of microbial communities at the Juan de Fuca Ridgehydrothermal vent. Proc Natl Acad Sci U S A 109: 4840–4845.
39. Van Nostrand JD, Wu WM, Wu L, Deng Y, Carley J, et al. (2009) GeoChip-based analysis of functional microbial communities during the reoxidation of a
bioreduced uranium-contaminated aquifer. Environ Microbiol 11: 2611–2626.40. Hardin G (1960) The competitive exclusion principle. Science 131: 1292–1297.
41. Parnell JJ, Crowl TA, Weimer BC, Pfrender ME (2009) Biodiversity in microbial
communities: system scale patterns and mechanisms. Mol Ecol 18: 1455–1462.42. Lefebure T, Stanhope MJ (2007) Evolution of the core and pan-genome of
Streptococcus: positive selection, recombination, and genome composition.Genome Biol 8: R71.
43. Sullivan MB, Lindell DL, Lee JA, Thompson L, Bielawski JP, et al. (2006)
Prevalence and evolution of core photosystem II genes in marine cyanobacterialviruses and their hosts. PLoS Biology 4: e234.
44. Lonegran DJ, Jenter HL, Coates JD, Phillips EJP, Schmidt TM, et al. (1996)Phylogenetic analysis of dissimilatory Fe(III)-reducing bacteria. Appl Environ
Microbiol 178: 2402–2408.45. Branco R, Chung AP, Johnston T, Gurel V, Morais P, et al. (2008) The
chromate-inducible chrBACF operon from the transposable element TnOtChr
confers resistance to chromium(VI) and superoxide. J Bacteriol 190: 6996–7003.46. Wu QL, Zwart G, Schauer M, Kamst-van Agterveld MP, Hahn MW (2006)
Bacterioplankton community composition along a salinity gradient of sixteenhigh-mountain lakes located on the Tibetan Plateua, China. Appl Environ
Microbiol 72: 5478–5485.
47. Kurland CG, Canback B, Berg OG (2003) Horizontal gene transfer: A criticalview. Proc Natl Acad Sci U S A 100: 9658–9662.
48. Ochman H, Lawrence JG, Groisman EA (2000) Lateral gene transfer and thenature of bacterial innovation. Nature 405: 299–304.
Biogeography of Gene Transfer
PLoS ONE | www.plosone.org 8 September 2010 | Volume 5 | Issue 9 | e12919


