Embed Size (px)
Citation preview

PHYSICAL REVIEW B 91, 094415 (2015)
Dynamics and efficiency of magnetic vortex circulation reversal
Michal Urbanek,1,2,* Vojtech Uhlır,1,3,† Charles-Henri Lambert,3,4 Jimmy J. Kan,3 Nasim Eibagi,3 Marek Vanatka,2
Lukas Flajsman,2 Radek Kalousek,1,2 Mi-Young Im,5,6 Peter Fischer,5,7 Tomas Sikola,1,2 and Eric E. Fullerton3
1CEITEC BUT, Brno University of Technology, Technicka 10, 616 00 Brno, Czech Republic2Institute of Physical Engineering, Brno University of Technology, Technicka 2, 616 69 Brno, Czech Republic
3Center for Magnetic Recording Research, University of California, San Diego, 9500 Gilman Drive, La Jolla, California 92093-0401, USA4Institut Jean Lamour, UMR CNRS 7198 – Universite de Lorraine – boulevard des aiguillettes, BP 70239, Vandoeuvre Cedex F-54506, France
5Center for X-Ray Optics, Lawrence Berkeley National Laboratory, 1 Cyclotron Road, Berkeley, California 94720, USA6Department of Emerging Materials Science, Daegu Gyeongbuk Institute of Science and Technology, Daegu 711-873, Korea
7Physics Department, University of California, 1156 High Street, Santa Cruz, California 94056, USA(Received 14 December 2014; revised manuscript received 15 February 2015; published 16 March 2015)
Dynamic switching of the vortex circulation in magnetic nanodisks by fast-rising magnetic field pulse requiresannihilation of the vortex core at the disk boundary and reforming a new vortex with the opposite sense ofcirculation. Here we study the influence of pulse parameters on the dynamics and efficiency of the vortexcore annihilation in permalloy (Ni80Fe20) nanodisks. We use magnetic transmission soft x-ray microscopy toexperimentally determine a pulse rise time–pulse amplitude phase diagram for vortex circulation switchingand investigate the time-resolved evolution of magnetization in different regions of the phase diagram. Theexperimental phase diagram is compared with an analytical model based on Thiele’s equation describing high-amplitude vortex core motion in a parabolic potential. We find that the analytical model is in good agreementwith experimental data for a wide range of disk geometries. From the analytical model and in accordance withour experimental finding we determine the geometrical condition for dynamic vortex core annihilation and pulseparameters needed for the most efficient and fastest circulation switching. The comparison of our experimentalresults with micromagnetic simulations shows that the micromagnetic simulations of “ideal” disks with diameterslarger than ∼250 nm overestimate nonlinearities in susceptibility and eigenfrequency. This overestimation leadsto the core polarity switching near the disk boundary, which then in disagreement with experimental findingsprevents the core annihilation and circulation switching. We modify the micromagnetic simulations by introducingthe “boundary region” of reduced magnetization to simulate the experimentally determined susceptibility and inthese modified micromagnetic simulations we are able to reproduce the experimentally observed dynamic vortexcore annihilation and circulation switching.
DOI: 10.1103/PhysRevB.91.094415 PACS number(s): 75.75.Jn, 75.70.Kw, 85.75.−d, 68.37.Yz
I. INTRODUCTION
Magnetic vortices are curling magnetization structuresformed in micro- and nanosized magnetic disks and poly-gons [1–5]. They are known for having four distinct magne-tization configurations (vortex states) that can be used for amultibit memory cell [6,7]. The vortex states are defined bythe polarity of the vortex core, pointing either up (p = +1) ordown (p = −1) and by the circulation of the magnetization inthe plane of the disk, curling either counterclockwise (c = +1)or clockwise (c = −1). The combination of the polarity andcirculation defines the chirality (handedness) of the vortex. Thevortex state can be controlled by applying a static out-of-plane(polarity control [8]) or in-plane (circulation control [9])magnetic field, although the amplitude of these fields can bequite large. However, both the polarity and the circulation canbe switched more effectively by using fast-rising magneticfields [10,11].
Selective switching of the circulation with applied magneticfield requires expelling the vortex core out of the disk andthen reforming a new vortex with the opposite sense of spincirculation. We have recently demonstrated [11] that this can
*[email protected]†[email protected]
be achieved by using a fast-rising in-plane magnetic field pulsethat drives the vortex core into far-from-equilibrium gyrotropicprecession and annihilates the vortex during the first half-period of the precessional motion at the disk boundary. Theresulting circulation of a new vortex is controlled by a diskasymmetry in the form of a thickness gradient and by thedirection of the magnetic field pulse. This approach allows fora fast switching with the field amplitudes reduced by morethan 50% when compared to the switching using static fields.
The dynamics of a magnetic vortex confined in softferromagnetic nanodisks excited resonantly by an in-planealternating magnetic field or by a fast-rising magnetic fieldpulse can be described as a forced harmonic oscillator usingThiele’s equation of motion [12,13]. The resulting magneticresponse depends on the profile of the confining magne-tostatic potential. The potential can be described either byparabolic terms [14,15] or more precisely by including higherorder terms in the energy expansion [16–18]. Micromagneticsimulations predict significant contribution of higher orderenergy terms [16,17] leading to a nonlinear increase of theeigenfrequency as a function of the vortex core position.However, the experimental results obtained from eigenfre-quency measurements at high-amplitude rf-field excitationsor low-amplitude rf-field excitations in a biasing field areoften inconsistent with the simulations, showing a decreaseof the eigenfrequency with an increasing amplitude [19] or a
1098-0121/2015/91(9)/094415(11) 094415-1 ©2015 American Physical Society

MICHAL URBANEK et al. PHYSICAL REVIEW B 91, 094415 (2015)
pinning-dominated dependence on the eigenfrequency[20,21]. Only recently, an experimental measurement of anhar-monicity of a potential well in a FeV single-crystal disk showeda ∼10% increase of the eigenfrequency for vortex core dis-placements up to 0.4R, where R is the radius of the disk [18].
In this paper, we present an experimental and modelingstudy of the process of dynamic annihilation of the magneticvortices in micro- and nanosized magnetic disks. We investi-gate the range of disk diameters and thicknesses, in which themagnetic vortices can be dynamically annihilated, as well aspossible extension of this range by an appropriate selectionof the pulse rise time and amplitude. The experimental resultsare presented in Sec. II. In Sec. III we describe an analyticalmodel based on Thiele’s equation of motion assuming aparabolic potential. In Sec. IV we compare the experimentaldata and the analytical model with micromagnetic simulations.The discrepancy between the prediction of micromagneticsimulations and experimental data is discussed, and a modifiedmicromagnetic simulation fitted to the experimental observa-tions is presented.
II. EXPERIMENTS
The dynamic annihilation of magnetic vortices was studiedon a series of samples consisting of permalloy (Ni80Fe20)disks with diameters ranging from 250 nm to 2500 nmand thicknesses from 20 nm to 50 nm. The disks wereplaced on gold coplanar waveguides which were used togenerate in-plane magnetic field pulses up to 60 mT. Toprovide a circulation control, the disks were fabricated with awedgelike thickness asymmetry using the shadowing effect ofa 500-nm-thick polymethyl methacrylate (PMMA) mask and adirectional ion beam sputtering of Ni80Fe20 with the sputteredparticles incident at 15◦ from the film normal [11]. The entirestructure was fabricated on a 200-nm-thick, 2×2-mm2 Si3N4
membrane to allow for sufficient x-ray transmission in themagnetic transmission soft x-ray microscopy (MTXM) [22]experiments [Fig. 1(b)].
Magnetic field pulses were generated by launching currentpulses into the waveguide using a pulse generator (Agilent81150A) allowing a precise setting of the rise time in therange of 2.5–8.0 ns and the amplitude of the pulses in therange of 1.0–50.0 mT. The pulse shapes were recorded on a4-GHz real-time oscilloscope (LeCroy WaveMaster 804Zi-A).Alternatively, for smaller disks where a faster rise timewas needed, a fast pulse generator (Picosecond Pulse Labs10,050A) with a fixed rise time of 250 ps was used.
The magnetization in the disks and its temporal behaviorwere imaged with full-field transmission soft x-ray microscopeat beamline 6.1.2 at the Advanced Light Source (ALS) inBerkeley, California. Images with a spatial resolution of25 nm were recorded using x-ray magnetic circular dichroism(XMCD) as magnetic contrast for a fixed circular polarizationof the x-ray beam at the Fe L3 edge (707 eV). The samplenormal was tilted at an angle of 30◦ with respect to the x-raybeam to measure the in-plane magnetization component. Thedisks were imaged before, during, and after application ofthe magnetic field pulses. The time-resolved experiments,which recorded snapshots of magnetization in the disks atdefined times during the magnetic pulse, were based on
FIG. 1. (Color online) (a) Experimental setup of time-resolvedexperiments. Photon flashes from the ALS were synchronized withcurrent pulses from a pulse generator. Time-resolved images of themagnetization were recorded by varying the delay between the fieldpulses and the photon flashes. (b) Atomic force microscopy image ofthe sample consisting of 1600-nm-wide, 20-nm-thick nanodisk on topof a 2500-nm-wide, 60-nm-thick waveguide. A wedgelike thicknessasymmetry is on the right side of the disk. (c) Magnetic contrastin the images of the nanodisk with counterclockwise (c = +1) andclockwise (c = −1) spin circulations.
a pump-probe technique enabling stroboscopic imaging ofreproducible events [23]. The temporal resolution is givenby the length of the photon flashes (70 ps), which arrive inthe two-bunch operational mode of the ALS at 3.05 MHzrepetition frequency [Fig. 1(a)]. The total acquisition time foreach image is about 120 s; i.e., approximately 3.7 × 10⁸ eventsare averaged to obtain a single image [Fig. 1(c)].
Prior to the application of magnetic field pulses we setthe spin circulation in a disk into one state (e.g., clockwise)by applying an external static magnetic field in a defineddirection exploiting the asymmetry in the disk thickness [11].The pulsed magnetic field was then applied in the oppositedirection and in the case of a successful annihilation of a vortexthe spin circulation in the disk switched (i.e., from clockwise tocounterclockwise and vice versa). In the case of unsuccessfulannihilation, the circulation stayed the same. These dataallowed for construction of a pulse rise time–pulse amplitudephase diagram of successful vortex annihilation (see Fig. 2). Itis possible to distinguish three distinct regions: (1) a region oflow pulse amplitude and long rise time [Figs. 2(a), 2(b); redtriangles], where a circulation switching was not observed, (2)a region of intermediate pulse amplitude and intermediate riserime [Fig. 2(a); blue stars], where the circulation switching wasdetected, and finally (3) a region of short rise time and highamplitude [Fig. 2(a); red dots], where again the circulationswitching was not successful.
094415-2

DYNAMICS AND EFFICIENCY OF MAGNETIC VORTEX . . . PHYSICAL REVIEW B 91, 094415 (2015)
FIG. 2. (Color online) (a) Pulse rise time–pulse amplitude phasediagram experimentally determined for a 1600-nm-wide, 20-nm-thick permalloy disk with an estimated eigenperiod 2π/ω = 7.9 nsand experimentally determined static annihilation field Ban−stat =19 mT. The pulse rise times and pulse amplitudes are given inunits of the gyrotropic oscillation period (2π/ω) and vortex staticannihilation field (Ban−stat), respectively. Red triangles represent acase of unsuccessful switching. Blue stars represent a case wheresuccessful core annihilation led to a circulation switching. Red dotsrepresent a case where the circulation switching was not achieved inspite of using shorter rise time and larger pulse amplitudes. (b) Phasediagram for a 1600-nm-wide, 30-nm-thick permalloy disk. The regionof successful circulation switching moved towards top right of thenormalized phase diagram. The gray areas in the phase diagramsdefine boundary of the region of successful circulation switchingpredicted by the analytical model (see Sec. III).
Time resolved experiments revealed the dynamics in eachregion. In region (1) the vortex core was not expelled out of thedisk and gyrated freely in the disk with an unchanged polarity(data not shown). In region (2) the pulse parameters weresufficient to expel the vortex core out of the disk [see Fig. 3(a)].After an intermediate state where the disk was fully saturateda new vortex with a defined circulation and a random polarityis formed [11]. The symmetric magnetic contrast apparentin these images corresponds to two vortex core trajectoriesfor two opposite polarities of the vortex core [24], whichwere averaged together during a multitude of cycles of thepump-probe technique. When applying pulses with a shorterrise time the dynamics significantly changes [see Fig. 3(b)]. Weobserve the same symmetric contrast revealing core polarityswitching, but the disk did not reach a full saturation incontrast to the situation in Fig. 3(a). Hence, the symmetriccontrast cannot originate from random nucleation of the corepolarity. This suggests that the core polarity flipping duringthe core motion prevented vortex annihilation and consequentcirculation reversal, even when a stronger pulse than in region(2) was applied. Profiles of the two magnetic pulses areindicated in Fig. 3(c).
The described behavior was consistent over all disk geome-tries. The character and boundaries of the normalized diagramstayed the same for disks with the same thickness, even whenthe radius was changed. With increasing disk thickness theregion (2) shrank towards the top right of the normalized phase
FIG. 3. (Color online) (a) and (b) Temporal evolution of magne-tization in a 1900-nm-wide and 20-nm-thick disk during magneticfield pulses captured by series of time-resolved MTXM images.(a) Temporal evolution of magnetization showing full saturation at8 ns which is followed by nucleation of a new vortex at 14 ns.(b) represents a case where the vortex annihilation was not achieved inspite of using larger pulse amplitudes than in (a). Here, the maximumdisplacement of the vortex core was reached at 3 ns. At 4 ns the vortexcore(s) return towards the disk center, indicating a continuous motionof the core without vortex annihilation and re-nucleation. Symmetriccontrast in the MTXM images is a combination of two symmetriccore trajectories and thus indicates the core polarity reversal (eitherat vortex nucleation after its annihilation or directly during the coremotion). (c) Profiles of the pulses used in (a) and (b). The rise timesof the pulse are 4 ns and 2.4 ns, respectively (measured between 10%and 90% of the pulse amplitude).
diagram [Fig. 2(b)]. In Sec. III we present an analytical modeldescribing the underlying processes in the phase diagram.
III. ANALYTICAL MODELING
A vortex core trajectory in a magnetic disk during dynamicannihilation can be described by an analytical model based onThiele’s equation of motion [12,25]. When using a fast-risingmagnetic pulse B = [0,B] with a rise time shorter or equalto the period of the vortex eigenoscillation, the vortex coreC = [x,y] gyrates about a point S = [s,0], following a circulartrajectory. The distance of the gyration center from the diskcenter is s = RχB/(μ0Ms), where R is the disk radius, χ
is the static susceptibility of the vortex, B is the appliedmagnetic field, and Ms is the spontaneous magnetization ofthe disk material [26]. As the coordinates of the gyrationcenter depend on the magnitude of the magnetic field B,during the rise time of the magnetic pulse the point S ismoving perpendicularly to the direction of the magnetic fieldwith a velocity vs = RχBmax/(μ0Mstrise), where Bmax is themaximum amplitude of the pulse and trise is the rise time ofthe pulse. Hence, assuming a linear rise time, the resultingtrajectory of the vortex core is cycloidal with coordinatesx(t) = vs[t − (1/ω) sin ωt], y(t) = (vs/ω)(1 − cos ωt), where
094415-3
MICHAL URBANEK et al. PHYSICAL REVIEW B 91, 094415 (2015)
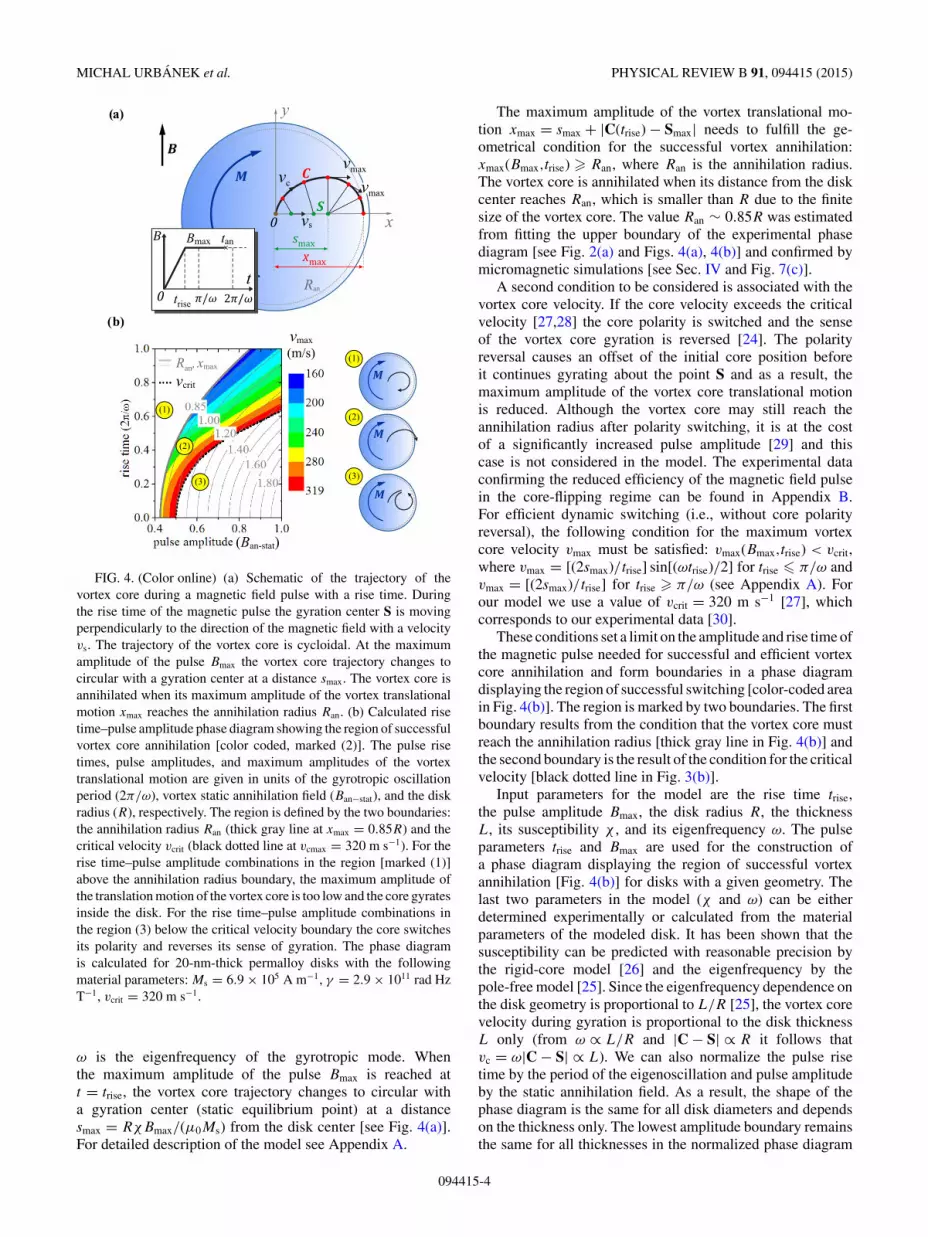
FIG. 4. (Color online) (a) Schematic of the trajectory of thevortex core during a magnetic field pulse with a rise time. Duringthe rise time of the magnetic pulse the gyration center S is movingperpendicularly to the direction of the magnetic field with a velocityvs. The trajectory of the vortex core is cycloidal. At the maximumamplitude of the pulse Bmax the vortex core trajectory changes tocircular with a gyration center at a distance smax. The vortex core isannihilated when its maximum amplitude of the vortex translationalmotion xmax reaches the annihilation radius Ran. (b) Calculated risetime–pulse amplitude phase diagram showing the region of successfulvortex core annihilation [color coded, marked (2)]. The pulse risetimes, pulse amplitudes, and maximum amplitudes of the vortextranslational motion are given in units of the gyrotropic oscillationperiod (2π/ω), vortex static annihilation field (Ban−stat), and the diskradius (R), respectively. The region is defined by the two boundaries:the annihilation radius Ran (thick gray line at xmax = 0.85R) and thecritical velocity vcrit (black dotted line at vcmax = 320 m s−1). For therise time–pulse amplitude combinations in the region [marked (1)]above the annihilation radius boundary, the maximum amplitude ofthe translation motion of the vortex core is too low and the core gyratesinside the disk. For the rise time–pulse amplitude combinations inthe region (3) below the critical velocity boundary the core switchesits polarity and reverses its sense of gyration. The phase diagramis calculated for 20-nm-thick permalloy disks with the followingmaterial parameters: Ms = 6.9 × 10⁵ A m−1, γ = 2.9 × 10¹¹ rad HzT−1, vcrit = 320 m s−1.
ω is the eigenfrequency of the gyrotropic mode. Whenthe maximum amplitude of the pulse Bmax is reached att = trise, the vortex core trajectory changes to circular witha gyration center (static equilibrium point) at a distancesmax = RχBmax/(μ0Ms) from the disk center [see Fig. 4(a)].For detailed description of the model see Appendix A.
The maximum amplitude of the vortex translational mo-tion xmax = smax + |C(trise) − Smax| needs to fulfill the ge-ometrical condition for the successful vortex annihilation:xmax(Bmax,trise) � Ran, where Ran is the annihilation radius.The vortex core is annihilated when its distance from the diskcenter reaches Ran, which is smaller than R due to the finitesize of the vortex core. The value Ran ∼ 0.85R was estimatedfrom fitting the upper boundary of the experimental phasediagram [see Fig. 2(a) and Figs. 4(a), 4(b)] and confirmed bymicromagnetic simulations [see Sec. IV and Fig. 7(c)].
A second condition to be considered is associated with thevortex core velocity. If the core velocity exceeds the criticalvelocity [27,28] the core polarity is switched and the senseof the vortex core gyration is reversed [24]. The polarityreversal causes an offset of the initial core position beforeit continues gyrating about the point S and as a result, themaximum amplitude of the vortex core translational motionis reduced. Although the vortex core may still reach theannihilation radius after polarity switching, it is at the costof a significantly increased pulse amplitude [29] and thiscase is not considered in the model. The experimental dataconfirming the reduced efficiency of the magnetic field pulsein the core-flipping regime can be found in Appendix B.For efficient dynamic switching (i.e., without core polarityreversal), the following condition for the maximum vortexcore velocity vmax must be satisfied: vmax(Bmax,trise) < vcrit,where vmax = [(2smax)/trise] sin[(ωtrise)/2] for trise � π/ω andvmax = [(2smax)/trise] for trise � π/ω (see Appendix A). Forour model we use a value of vcrit = 320 m s−1 [27], whichcorresponds to our experimental data [30].
These conditions set a limit on the amplitude and rise time ofthe magnetic pulse needed for successful and efficient vortexcore annihilation and form boundaries in a phase diagramdisplaying the region of successful switching [color-coded areain Fig. 4(b)]. The region is marked by two boundaries. The firstboundary results from the condition that the vortex core mustreach the annihilation radius [thick gray line in Fig. 4(b)] andthe second boundary is the result of the condition for the criticalvelocity [black dotted line in Fig. 3(b)].
Input parameters for the model are the rise time trise,the pulse amplitude Bmax, the disk radius R, the thicknessL, its susceptibility χ , and its eigenfrequency ω. The pulseparameters trise and Bmax are used for the construction ofa phase diagram displaying the region of successful vortexannihilation [Fig. 4(b)] for disks with a given geometry. Thelast two parameters in the model (χ and ω) can be eitherdetermined experimentally or calculated from the materialparameters of the modeled disk. It has been shown that thesusceptibility can be predicted with reasonable precision bythe rigid-core model [26] and the eigenfrequency by thepole-free model [25]. Since the eigenfrequency dependence onthe disk geometry is proportional to L/R [25], the vortex corevelocity during gyration is proportional to the disk thicknessL only (from ω ∝ L/R and |C − S| ∝ R it follows thatvc = ω|C − S| ∝ L). We can also normalize the pulse risetime by the period of the eigenoscillation and pulse amplitudeby the static annihilation field. As a result, the shape of thephase diagram is the same for all disk diameters and dependson the thickness only. The lowest amplitude boundary remainsthe same for all thicknesses in the normalized phase diagram
094415-4

DYNAMICS AND EFFICIENCY OF MAGNETIC VORTEX . . . PHYSICAL REVIEW B 91, 094415 (2015)
FIG. 5. (Color online) (a) Phase diagram showing the regions ofsuccessful vortex core annihilation in permalloy disks with differentthicknesses. The pulse rise times and pulse amplitudes are givenin units of the gyrotropic oscillation period (2π/ω) and vortexstatic annihilation field (Ban−stat), respectively. The lowest amplitudeboundary on the left remains the same for all thicknesses. Thecritical velocity boundary is moving to the top left with increasingdisk thickness; i.e., the region of successful core annihilation isprogressively shrinking. (b) Thickness dependence of the minimumpulse amplitude (red line) and the corresponding minimum pulserise time (black line) needed for successful vortex core annihilation.For the disks with a thickness of 23 nm or less, the minimum pulseamplitude is 0.43Ban−stat. For disks with thicknesses above 36.9 nmthe model does not predict the possibility of dynamic annihilation ofthe core with a pulse amplitude lower than Ban−stat [the thickness limitis calculated assuming the same material parameters as in Fig. 4(b)].
[see Fig. 4(a)]. The intersection of the lowest amplitudeboundary with the pulse amplitude axis at zero rise timeindicates the minimum pulse amplitude which is sufficientto annihilate the vortex [∼0.43 of the static annihilation fieldfor our permalloy disks; see Figs. 5(a), 5(b)]. The boundary forthe critical velocity is moving to the top left with increasingthickness [see Fig. 5(a)] and at a certain threshold [∼23 nmfor our permalloy disks; see Fig. 5(b)] it is no longer possibleto annihilate the vortex with a pulse with a zero rise time.By increasing the rise time, it is still possible to dynamicallyannihilate the vortex in thicker disks at the cost of an increasedpulse amplitude. Finally, for disks thicker than 36.9 nm theminimum pulse amplitude equals the static annihilation fieldBan−stat [Fig. 5(b)].
The pulse parameters, the rise time trise, the pulse amplitudeBmax, and the minimum pulse duration tan (i.e., the predictedtime at which the core reaches the annihilation radius Ran)can be used to calculate the energy cost associated with thevortex annihilation (resp. the circulation switching). Mappingthe energy cost for each point in the region (2) of the phasediagram allows us to find the specific pulse parameters forwhich the vortex annihilation is most efficient. Since the exactpulse energy E = ∫ tan
0 RI 2dt (R is the electrical resistance ofthe waveguide and I is the electric current) depends on theresistance of the waveguide used to generate the magneticfield pulse, we calculate the reduced energy ε from themagnetic field pulse: ε = ∫ tan
0 B2dt . Assuming a linear rise
time, we get ε = B2max(tan − 2
3 trise) for the case where tan � trise
and ε = 13 tan(Bmaxtan/trise)2 when tan � trise; i.e., the core is
annihilated before the (theoretical) maximum pulse amplitudeis reached. In Figs. 6(a)–6(c) the reduced energy is plotted inthe pulse rise time–pulse amplitude phase diagrams for thedisks with thicknesses L of 15, 20, and 30 nm. For diskswith thicknesses below ∼20 nm, the most effective switchingoccurs when the pulse amplitude is slightly above the minimumvalue (Bmax = 0.47Ban−stat) and the rise time is short, butnonzero [trise = 0.17(2π/ω)]. The region is marked by hashesin Figs. 6(a) and 6(b). For thicker disks the phase diagrambecomes restricted by the critical core velocity and successfulvortex annihilation cannot be achieved with short rise times.Then, the region of the most effective switching is locatedalong the bottom-right boundary of the phase diagram andstarts already at the minimum pulse amplitude [Fig. 6(c)].
The regions of fastest switching [Figs. 6(d)–6(f), markedby hashes] are located around the minimum rise time andmaximum pulse amplitude, i.e., the right boundary of thephase diagram. By comparing the absolute values of ε inFigs. 6(a)–6(c) and tan in Figs. 6(d)–6(f), we can see thatthe switching becomes more efficient with decreasing diskthickness and also the time to annihilation can be shortestin thinnest disks. However, for thinner disks the position ofthe region of the fastest switching does not correspond tothe region of minimum ε [compare Fig. 6(d) and Fig. 6(a),respectively] and there is a trade-off between fast and efficientswitching.
Note that the positions of the energy and pulse durationminima are independent of the disk radius and depend on thedisk thickness only.
IV. MICROMAGNETIC SIMULATIONS
The predictions of the analytical model agreed withmicromagnetic simulations [31] only for disks with radii R
up to ∼125 nm. For larger disks and independent of thickness,the vortex core velocity exceeded the critical velocity withina few picoseconds after the beginning of the pulse whichlead to core polarity switching. Micromagnetic simulationspredict large nonlinearity in the dimensionless displacementsusceptibility χd = (ds/dB)(Ban−stat/R) [Fig. 7(a), orangeline with circles]. Due to this nonlinearity, at the beginningof the pulse where the displacement susceptibility is higher,the gyration center in micromagnetic simulation is locatedfarther out than the linear model predicts. For instance, a pulseamplitude B = 0.5Ban−stat corresponds to a gyration centerS at s = 0.5R according to the linear model [Fig. 7(a), grayline], whereas according to micromagnetic simulations theinitial position of S is at s = 0.85R [Fig. 7(a), orange linewith circles]. This increase in the gyration radius leads to anincrease of the core velocity above the critical velocity. We canovercome the unwanted polarity switching at the beginning ofthe pulse by using a pulse with a nonzero rise time.
However, when the core approaches the disk boundary,its velocity again exceeds the critical velocity, which leadsto polarity reversal and a consequent change in the sense ofgyration [see Fig. 7(b)]. This reversal at the disk boundary,which is always present in simulations of disks with radii
094415-5

MICHAL URBANEK et al. PHYSICAL REVIEW B 91, 094415 (2015)
FIG. 6. (Color online) Pulse rise time–pulse amplitude phase diagrams showing the reduced energy ε needed for the vortex circulationswitching [(a)–(c)] and shortest annihilation times tan [(d)–(e)]. The pulse rise times and pulse amplitudes are given in units of the gyrotropicoscillation period (2π/ω) and vortex static annihilation field (Ban−stat), respectively. The regions of the most efficient switching (least energycost) and shortest annihilation times are marked by hashes. The phase diagrams were calculated for permalloy disks with a radius R = 500 nmand thicknesses L = 15, 20, and 30 nm. Material parameters used for calculation of the phase diagrams were the same as in Fig. 4.
larger than ∼500 nm, is caused by an anharmonicity in thepotential energy well, which for large vortex core displace-ments leads to an increase in eigenfrequency [16,17,32,33].From the dimensionless displacement susceptibility χd(s),we can obtain the local eigenfrequency ω(s) = μ0
8πγMs
ξ 2
χd(s) ,
where we assume ξ = 2/3 (pole-free model magnetizationdistribution [25]). Note that this approach is more suited forthe calculation of the eigenfrequency of small amplitude vortexcore gyration about a gyration center position S shifted fromthe disk center by a static biasing field [20]. In our case of a
FIG. 7. (Color online) (a) Comparison of simulated displacement susceptibility of the 1600-nm-wide, 20-nm-thick disk with uniform Ms
(sim1; orange line with circles), simulated displacement susceptibility of the same disk, where the spontaneous magnetization of the diskmaterial was gradually decreased from 690 kA m−1 to 310 kA m−1 in the 80-nm-wide region around the disk perimeter (sim2; green line withtriangles), and the displacement susceptibility determined directly from the experimental measurements of the shift of the vortex core in anincreasing applied magnetic field by MTXM (exp; blue line with squares). Linear susceptibility, used in analytical models is plotted as a grayline. (b) Simulated vortex core trajectories in the disk with uniform magnetization (nonlinear susceptibility). A magnetic field pulse of 10 mT isnot enough to reach the annihilation radius (gray trajectory). A slight increase of the magnetic field amplitude to 11 mT drives the vortex coreinto the nonlinear region, where the eigenfrequency of the translational motion and thus also the vortex core velocity are increased, which leadsto unwanted polarity switching. The switched core then continues with inverted sense of gyration towards the disk center (orange trajectory). (c)Simulated vortex core trajectory in the disk with magnetization decreasing towards the edge (linearized susceptibility). A magnetic pulse of 9mT is sufficient to drive the vortex core into the annihilation region and the vortex is successfully annihilated (green trajectory). (d) Comparisonof local eigenfrequencies ω(s) calculated from displacement susceptibilities in (a).
094415-6

DYNAMICS AND EFFICIENCY OF MAGNETIC VORTEX . . . PHYSICAL REVIEW B 91, 094415 (2015)
large gyration amplitude, the eigenfrequency at the positionC of the vortex core is lower [32]. The local eigenfrequencyω(s) rapidly increases for the core displacements larger than0.6R [see Fig. 7(d), orange line with circles]. The increasein eigenfrequency drives the core velocity above the criticalvalue and the core polarity close to the disk boundary switches[Fig. 7(b)].
This result of micromagnetic simulation is in contradictionto our experimental observations, where we were able toannihilate the vortex core in disks with radii up to 1.25 μm.To quantify the nonlinearity in displacement susceptibilitywe tracked the vortex core position as a function of staticmagnetic field. The spatial resolution of MTXM allowed usto directly measure a shift of the vortex core in an appliedmagnetic field with sub-100-nm precision. Comparison ofthe experimentally measured displacement susceptibility for1600-nm-wide, 20-nm-thick disk [Fig. 7(a), blue line withsquares] with micromagnetic simulation [Fig. 7(a), orange linewith circles] reveals clearly the overestimation of the non-linearity in displacement susceptibility by the micromagneticsimulation.
We were able to reproduce the experimental displace-ment susceptibility curve in micromagnetic simulations [seeFig. 7(a), blue line with squares and green line with triangles,respectively] by gradual decrease of the spontaneous mag-netization of the disk material near the edge [from 690 kAm−1 to 310 kA m−1 in the 80-nm-wide “boundary zone”; seeinsets in Figs. 7(b) and 7(c)]. By including this modification,it is possible to annihilate the vortex also in micromagneticsimulations [see Fig. 7(c)]. The eigenfrequency calculatedfrom corrected simulation and from experimentally measureddisplacement susceptibility stays close to the eigenfrequencyused in the linear model [see Fig. 7(d)] and the vortex core canreach the annihilation radius without exceeding the criticalvelocity.
The linear behavior of the displacement susceptibilityin real disks may be caused by shape imperfections, edgeroughness, and other deteriorations of the magnetic propertiesof the disk material close to the disk edge, e.g., by oxidation.It cannot be explained by the edge roughness only, becausethe roughness at the edges of our disks was approximately20 nm (estimated from SEM images), whereas the widthof the boundary region necessary for reproducing the ex-perimental data is 4× larger. Also, it cannot be explainedby the thickness gradient at one side of the disk as thesusceptibility curve was measured on the side without thethickness asymmetry. We observed an additional increaseof the nonlinearity in displacement susceptibility for largerdisks; however the experimentally determined nonlinearity indisplacement susceptibility was still significantly smaller thanthe predictions of micromagnetic simulations (2.5-μm-widedisks; data not shown). Similarly, weaker than expectednonlinearity in displacement susceptibility was reported for3-μm-wide permalloy disks measured by Lorentz transmissionelectron microscopy by Uhlig et al. [34]. The existence of ahigher-order term (beyond the parabolic approximation) in thepotential energy well resulting in a parabolic dependence ofeigenfrequency on the core displacement and 10% increase at∼0.3R was recently reported in FeV single-crystal disks [18].In our case, a similar dependence in experimentally determined
eigenfrequency can be seen for static core displacementsup to 0.4R [Fig. 7(d)]. Beyond this point the experimentaldata do not follow a clear trend (i.e., parabolic dependence)and stay in the vicinity of ωlinear. This comparison showsthat for large-amplitude vortex core gyrations the assumptionof linear susceptibility provides a good approximation andthat the micromagnetic simulations of “ideal” disks grosslyoverestimate the nonlinearity in displacement susceptibility(anharmonicity of the vortex potential well) for large coredisplacements.
V. CONCLUSIONS
We have studied the influence of the pulse parameters onthe dynamics and efficiency of the vortex core annihilation inpermalloy nanodisks. The experimentally determined pulserise time–pulse amplitude phase diagram was successfullyreproduced with an analytical model based on Thiele’sequation describing vortex core motion in a parabolic potential.We found that the analytical model is in good agreementwith experimental data for a wide range of disk geometries.From both the analytical model and the experimental findingswe have determined the geometrical condition for dynamicvortex core annihilation and the pulse parameters giving themost efficient and fastest circulation switching. However,micromagnetic simulations of the vortex core annihilationin “ideal” disks did not fully reproduce the experimentalbehavior. This is due to the fact that the nonlinearities indisplacement susceptibility and eigenfrequency of simulated“ideal” disks with diameters larger than ∼250 nm are overes-timated with respect to the experimentally determined values.This overestimation leads to a core polarity switching near thedisk boundary which prevents the core annihilation and subse-quent circulation switching. We modified the micromagneticsimulation by introducing a “boundary region” of reducedmagnetization to simulate the experimentally determineddisplacement susceptibility. This results in linearization of thedisplacement susceptibility and the modified micromagneticsimulation shows a good agreement of the dynamic vortex coreannihilation with the experimental observations. Assumptionof a nonparabolic potential with higher order energy terms,which may be more precise for the description of vortexcore motion within 0.4R from the disk center [18], does notprovide a significant correction to the parameters inferred fromthe linear susceptibility model. We conclude that the linearsusceptibility model (i.e., a parabolic potential) is appropriatefor the description of the first period of the high-amplitudevortex core gyration in our disks.
ACKNOWLEDGMENTS
The research at BUT was supported by theEuropean Regional Development Fund (CEITEC;CZ.1.05/1.1.00/02.0068), by the Grant Agency of the CzechRepublic (Project No. P102/12/P443), and by the EU SeventhFramework Programme (Contracts No. 286154-SYLICA and280566-UnivSEM). The research at UCSD was supportedby the research programs of the US Department of Energy(DOE), Office of Basic Energy Sciences (Award No.DE-SC0003678). The operation of the x-ray microscope
094415-7

MICHAL URBANEK et al. PHYSICAL REVIEW B 91, 094415 (2015)
was supported by the Director, Office of Science, Office ofBasic Energy Sciences, Materials Sciences and EngineeringDivision, of the US Department of Energy under Contract No.DE-AC02-05-CH11231. P.F. and M.Y.I. acknowledge supportby the Leading Foreign Research Institute RecruitmentProgram (Grant No. 2012K1A4A3053565) through theNational Research Foundation of Korea (NRF) funded by theMinistry of Education, Science, and Technology (MEST).
APPENDIX A: DESCRIPTION OFTHE ANALYTICAL MODEL
The relation between the position of the vortex core and theexternal static in-plane magnetic field in the disk made fromsoft-magnetic material can be described by the rigid vortexmodel [26]:
s = RχB
μ0Ms, (A1)
where s is the displacement of the vortex core from the diskcenter, R is the disk radius, χ is the vortex susceptibilitydepending on the geometrical parameters of the disk, B
is the external magnetic field, and Ms is the spontaneousmagnetization of the disk material. In the following calcu-lations, the susceptibility χ is assumed to be independentof the core displacement. The equation of motion of thevortex core in time-varying external magnetic field can bedescribed by Thiele’s equation [12], which is derived from theLandau-Lifshitz-Gilbert equation of magnetization dynamicsassuming the vortex core moves as a rigid object. Thiele’sequation is as follows:
G × C − ∂W
∂C= F(t), (A2)
where G = −2πpLMs/γ z is the gyrovector, C is the positionof the vortex core, W is potential energy associated withthe force restoring the vortex core back to the disk center,and F(t) = − 2
3πcLRMs[B(t) × z] is the time-dependent ex-citation force associated with the applied in-plane magneticfield [35]. The parameter p is the vortex core polarity, c is thecirculation, L is the disk thickness, R is radius, and γ is thegyromagnetic ratio. The potential energy W is mainly definedby the magnetic dipolar energy [17] and can be approximatedby a parabolic term
W = 12κC2, (A3)
where κ can be understood as a stiffness constant. Accordingto our experimental results higher order terms in the expressionof potential energy need not be taken into account as discussedin the main text.
In the following calculations we choose the coordinatesystem in the following way: the origin coincides with the diskcenter and the z axis is parallel to the disk axis of symmetry.The gyrovector points in the direction of z: G = (0,0,G) andC = (x,y,0); see Fig. 8.
If the applied magnetic field is zero, i.e., F = 0, weobtain from (A2) the following homogeneous set of first-orderordinary differential equations:
y + κ
Gx = 0, x − κ
Gy = 0, (A4)
FIG. 8. Magnetic disk with a vortex magnetization (p = −1,c = −1). Position of the vortex core (open circle) is represented byvector C = (x,y,0), the gyrovector by G = (0,0,G) ∝ −pz. Externalforce due to the applied in-plane magnetic field B = (0,B,0) isdescribed by vector F = (F,0,0) ∝ −c(B × z).
which leads to a set of two separated second-order differentialequations:
x +(
κ
G
)2
x = 0, y +(
κ
G
)2
y = 0. (A5)
Solutions of both equations represent harmonic oscillationsof both components with equal translational eigenfrequencyω ≡ κ/|G|. According to the discussion on our experimentalresults, besides χ also ω can be considered as independentfrom the position of the vortex core. Therefore, the trajectoryof the vortex core is a circle with a center located at the diskcenter and an arbitrary radius lower than R.
The solution of Thiele’s equation (A2) with general timedependence of the external force F(t) needs to be calculatednumerically. However, assuming a magnetic field pulse with alinear rise time (see Fig. 9), the motion of the vortex core canbe treated analytically, as described below.
1. Analytical solution of Thiele’s equation
We consider the initial state as follows: At the beginning thevortex core is located at the disk center having zero velocity;i.e.,
x(0) = y(0) = x(0) = y(0) = 0. (A6)
Furthermore, without loss of generality, we will consider thatthe external force acts only in the direction of the x axis;i.e., F(t) = [F (t),0,0] (see Fig. 8). Then the set of first-orderordinary differential equations is according to (A2) as follows:
y + ωx = F (t)/G, x − ωy = 0. (A7)
FIG. 9. Left: Assumed shape of a magnetic-field pulse consistingof a linear increase up to Bmax during a time interval 〈0,trise〉and a constant pulse amplitude Bmax at instants t > trise. Right:Corresponding vortex core trajectory: part of a cycloid during theinterval 〈0,trise〉; a circle at instants t > trise. The core reachesthe maximum distance xmax = smax + |C(trise) − Smax| from the diskcenter at the point where the trajectory crosses the x axis.
094415-8

DYNAMICS AND EFFICIENCY OF MAGNETIC VORTEX . . . PHYSICAL REVIEW B 91, 094415 (2015)
By solving these equations for a constant external force F0
we obtain a circular vortex core trajectory with a center atS = (s,0,0) and a radius s, where F0 = κs.
If we consider a linear rise of the magnetic field from zeroto a maximum value Bmax during a time interval 〈0; trise〉 wheretrise � 2π/ω, the instantaneous position S is moving along thex axis with a velocity
vs = smax
trise, (A8)
where
smax = RχBmax
μ0Ms(A9)
is the x position of S at the instant trise. The vortex core velocitycan be obtained by solving the set of two equations (A7) withF (t) = κvst ; i.e.,
x + ω2x = ω2vst, y + ω2y = ωvs. (A10)
The solutions with respect to the initial conditions (A6) read
x(t) = vs
(t − 1
ωsin ωt
), y(t) = vs
ω(1 − cos ωt) . (A11)
Thus, in this case the trajectory of the vortex core is representedby part of a cycloid. The components of the vortex core velocityare the following:
x(t) = vs(1 − cos ωt), y(t) = vs sin ωt. (A12)
Therefore, using (A8) and (A9) the magnitude of the corevelocity is given by
v(t) = 2vs sin
(ωt
2
)= 2Rχ
μ0Ms
Bmax
trisesin
(ωt
2
). (A13)
It can be seen that the point of the trajectory, where the vortexcore moves at the fastest speed, is at the apex of the cycloidwith a velocity of
vmax = 2vs = 2Rχ
μ0Ms
Bmax
trise. (A14)
At instants t > trise we consider the external magnetic fieldconstant and equal to the pulse amplitude Bmax. Thus, thevortex core continues to move on a circle with a center Smax =(smax,0,0) and a radius |C(trise) − Smax|; see Fig. 9. Hereafter,the core velocity has a constant magnitude
v(trise) = 2smax
trisesin
(ωtrise
2
). (A15)
The maximum distance of the core from the disk is located atthe x axis, see Fig. 9, and reads
xmax = smax + |C(trise) − Smax|
= smax + 2smax
ωtrisesin
(ωtrise
2
). (A16)
2. Conditions for dynamic annihilation
In this paragraph we show how the rise time and ampli-tude of the magnetic-field pulse influences the vortex-coretrajectory. The goal is to find appropriate pulse parameters forannihilation of the vortex (the instant when the core leaves the
disk area). Therefore, the first condition for annihilation comesfrom geometry: the core moving on its trajectory has to reachsome minimum distance from the disk center. According toour experimental data the minimum distance Ran, called theannihilation radius Ran, is about 15% smaller than the diskradius R. Therefore, the first condition has the general form
xmax � Ran. (A17)
To avoid vortex polarity switching during the core motion, asecond condition must also be fulfilled: the maximum of thecore velocity vmax must not exceed the critical core velocityvcrit; i.e.,
vmax < vcrit. (A18)
In the following we focus on discussion at which circum-stances both conditions are fulfilled.
a. Simple dynamic annihilation: trise → 0
In this case the vortex-core trajectory is circular almostfrom the beginning. Annihilation of the vortex requiresthe displacement xmax of the core equal or greater thanthe annihilation radius Ran. Therefore, using the limit caseof (A16) the first condition (A17) reads
xmax = limtrise→0
{RχBmax
μ0Ms
[1 + 2
ωtrisesin
(ωtrise
2
)]}
= 2RχBmax
μ0Ms� Ran. (A19)
Using the limit case of (A15) the second condition (A18) is
vmax = limtrise→0
[2Rχ
μ0Ms
Bmax
trisesin
(ωtrise
2
)]
= ωRχBmax
μ0Ms< vcrit. (A20)
b. Approaching the static limit: trise → 2π/ω
The pulse amplitude required in this case approaches thevalue of the static annihilation field and the vortex-coretrajectory completes one arc of the cycloid. The radius ofthe following circle trajectory tends to zero; i.e., the corestays in the vicinity of the point Smax. Using (A16) the firstcondition (A17) determines
xmax = RχBmax
μ0Ms� Ran. (A21)
The magnitude of the core velocity changes accordingto (A13). Therefore, using (A14) the second condition (A17)reads
vmax = 2ωRχBmax
πμ0Ms< vcrit. (A22)
c. Short rise time: trise ∈ (0,π/ω〉The maximum amplitude Bmax is reached before t = π/ω;
i.e., the core switches from the cycloidal to circular trajectorybefore it gets to the apex of the cycloid. Using (A16) the firstcondition (A17) has the following form:
xmax = RχBmax
μ0Ms
[1 + 2
ωtrisesin
(ωtrise
2
)]� Ran. (A23)
094415-9

MICHAL URBANEK et al. PHYSICAL REVIEW B 91, 094415 (2015)
Using (A9) and (A15) the second condition (A18) is given by
vmax = 2Rχ
μ0Ms
Bmax
trisesin
(ωtrise
2
)< vcrit. (A24)
d. Long rise time: trise ∈ (π/ω,2π/ω)
The maximum amplitude Bmax is reached after t = π/ω;i.e., the core switches from the cycloidal to circular trajectoryhaving passed the apex of the cycloid. Using (A16) the firstcondition (A17) has the same form as in the previous case:
xmax = RχBmax
μ0Ms
[1 + 2
ωtrisesin
(ωtrise
2
)]� Ran. (A25)
However, as the core velocity reaches its maximum at t = π/ω
the maximum core velocity changes to the value accordingto (A14). Therefore, the second condition (A18) determines
vmax = 2Rχ
μ0Ms
Bmax
trise< vcrit. (A26)
3. Phase diagram
Pairs of corresponding values of Bmax and trise fulfilling bothinequalities, i.e., xmax(Bmax,trise) � Ran and vmax(Bmax,trise) <
vcrit, define the pulse parameters needed for successful vortexannihilation. They are displayed as the region of successfulcore annihilation in Figs. 2, 4, and 5. Note that vmax(Bmax,trise)is given by (A24) when trise < π/ω and by (A26) whentrise > π/ω.
APPENDIX B: DYNAMICS IN THECORE-FLIPPING REGIME
In case of high pulse amplitudes and/or short rise times thecore velocity exceeds the critical velocity, the core polarityis switched, and the sense of the vortex core gyration isreversed. This significantly reduces the efficiency of themagnetic field pulse on the vortex core displacement (themaximum amplitude of the vortex core gyration). Figure 10
FIG. 10. (Color online) Demonstration of the reduced effectivityof the magnetic field pulse on the maximum displacement of thevortex core in the core-flipping regime. The disk is 2500 nm wideand 20 nm thick. Each image is a snapshot of the maximum coredisplacement during a particular pulse. Increasing the amplitude leadsto a progressive increase in the maximum displacement (the blackdomain shrinking due to a negative pulse). However, a decrease ofthe rise time of the pulse with the highest amplitude leads to an overalldecrease of the maximum displacement of about 100 nm despite theincreased amplitude. The red line is a guide to the eye.
shows how changes in the pulse amplitude and rise time affectthe maximum core displacement from the disk center in thecore-flipping regime [region (3) of the pulse rise time–pulseamplitude phase diagram]. The pulse amplitude is higher thanthe threshold dynamic annihilation field for all three pulses.Increasing a pulse amplitude from −8.5 mT to −10.8 mTwhile keeping the rise time constant leads to an increase in themaximum displacement of about 100 nm. However, a furtherincrease of the amplitude to −11.4 mT and shortening the risetime to 2.5 ns at the same time leads to an overall decrease inthe maximum displacement to the value induced by the firstpulse.
[1] A. Hubert and R. Schafer, Magnetic Domains—The Analysis ofMagnetic Microstructures (Springer, Berlin, 1998).
[2] T. Shinjo, T. Okuno, R. Hassdorf, K. Shigeto, and T. Ono,Science 289, 930 (2000).
[3] A. Wachowiak, J. Wiebe, M. Bode, O. Pietzsch, M. Morgenstern,and R. Wiesendanger, Science 298, 577 (2002).
[4] K. Y. Guslienko, J. Nanosci. Nanotechnol. 8, 2745 (2008).[5] M.-Y. Im, P. Fischer, K. Yamada, T. Sato, S. Kasai, Y. Nakatani,
and T. Ono, Nat. Commun. 3, 983 (2012).[6] S. Bohlens, B. Kruger, A. Drews, M. Bolte, G. Meier, and D.
Pfannkuche, Appl. Phys. Lett. 93, 142508 (2008).[7] S.-K. Kim, K.-S. Lee, Y.-S. Yu, and Y.-S. Choi, Appl. Phys. Lett.
92, 022509 (2008).[8] N. Kikuchi, S. Okamoto, O. Kitakami, Y. Shimada, S. G.
Kim, Y. Otani, and K. Fukamichi, J. Appl. Phys. 90, 6548(2001).
[9] M. Schneider, H. Hoffmann, and J. Zweck, Appl. Phys. Lett. 79,3113 (2001).
[10] B. Van Waeyenberge, A. Puzic, H. Stoll, K. W. Chou, T.Tyliszczak, R. Hertel, M. Fahnle, H. Bruckl, K. Rott, G. Reisset al., Nature (London) 444, 461 (2006).
[11] V. Uhlır, M. Urbanek, L. Hladık, J. Spousta, M.-Y. Im, P.Fischer, N. Eibagi, J. J. Kan, E. E. Fullerton, and T. Sikola,Nat. Nanotechnol. 8, 341 (2013).
[12] A. A. Thiele, Phys. Rev. Lett. 30, 230 (1973).[13] D. L. Huber, Phys. Rev. B 26, 3758 (1982).[14] V. Novosad, F. Y. Fradin, P. E. Roy, K. Buchanan, K. Y.
Guslienko, and S. D. Bader, Phys. Rev. B 72, 024455 (2005).[15] K. S. Buchanan, P. E. Roy, F. Y. Fradin, K. Y. Guslienko, M.
Grimsditch, S. D. Bader, and V. Novosad, J. Appl. Phys. 99,08C707 (2006).
[16] K.-S. Lee and S.-K. Kim, Appl. Phys. Lett. 91, 132511 (2007).
094415-10

DYNAMICS AND EFFICIENCY OF MAGNETIC VORTEX . . . PHYSICAL REVIEW B 91, 094415 (2015)
[17] K. Y. Guslienko, R. H. Heredero, and O. Chubykalo-Fesenko,Phys. Rev. B 82, 014402 (2010).
[18] O. V. Sukhostavets, B. Pigeau, S. Sangiao, G. de Loubens, V. V.Naletov, O. Klein, K. Mitsuzuka, S. Andrieu, F. Montaigne, andK. Y. Guslienko, Phys. Rev. Lett. 111, 247601 (2013).
[19] B. Pigeau, G. de Loubens, O. Klein, A. Riegler, F. Lochner, G.Schmidt, and L. W. Molenkamp, Nat. Phys. 7, 26 (2011).
[20] R. L. Compton, T. Y. Chen, and P. A. Crowell, Phys. Rev. B 81,144412 (2010).
[21] T. Y. Chen, M. J. Erickson, P. A. Crowell, and C. Leighton,Phys. Rev. Lett. 109, 097202 (2012).
[22] P. Fischer, Mater. Today 13(9), 14 (2010).[23] S. Kasai, P. Fischer, M.-Y. Im, K. Yamada, Y. Nakatani, K.
Kobayashi, H. Kohno, and T. Ono, Phys. Rev. Lett. 101, 237203(2008).
[24] S.-B. Choe, Y. Acremann, A. Scholl, A. Bauer, A. Doran, J.Stohr, and H. A. Padmore, Science 304, 420 (2004).
[25] K. Y. Guslienko, B. A. Ivanov, V. Novosad, Y. Otani, H. Shima,and K. Fukamichi, J. Appl. Phys. 91, 8037 (2002).
[26] K. Y. Guslienko, V. Novosad, Y. Otani, H. Shima, and K.Fukamichi, Appl. Phys. Lett. 78, 3848 (2001).
[27] K. Y. Guslienko, K.-S. Lee, and S.-K. Kim, Phys. Rev. Lett. 100,027203 (2008).
[28] K.-S. Lee, S.-K. Kim, Y.-S. Yu, Y.-S. Choi, K. Y. Guslienko, H.Jung, and P. Fischer, Phys. Rev. Lett. 101, 267206 (2008).
[29] Pulses with an amplitude approaching or exceeding Ban−stat anda sufficient duration will annihilate the vortex no matter whatthe exact dynamic behavior is. Recently we became aware ofa work [36] which demonstrates the annihilation of the vortexcore in 2×2-μm2, 30-nm-thick permalloy squares by a high-amplitude (∼4×Ban−stat), subnanosecond Gaussian pulse.
[30] The values of vcrit estimated from fitting the boundaries of thephase diagram to our experimental data were 323 ± 15 m s−1
and 307 ± 10 m s−1 for the 1600-nm-wide, 20-nm-thickdisk and the 1600-nm-wide, 30-nm-thick disk, respectively[see Figs. 2(a), 2(b)].
[31] The micromagnetic simulations were carried out usingOOMMF [37]. The nanodisks were discretized into cubeswith dimensions of 4×4×4 nm3. Zero magnetocrystallineanisotropy and an exchange constant of Aex = 10 pJ m−1
(typical for permalloy) were used. The spontaneous magneti-zation Ms, gyromagnetic ratio γ , and damping parameter α
were determined experimentally using ferromagnetic resonanceon blanket film samples, with values Ms = 690 kA/m, γ =2.09×10¹¹ rad Hz/T, and α = 0.0072. The Ms value was verifiedby vibrating sample magnetometry.
[32] K. S. Buchanan, P. E. Roy, M. Grimsditch, F. Y. Fradin, K. Y.Guslienko, S. D. Bader, and V. Novosad, Phys. Rev. B 74,064404 (2006).
[33] X. M. Cheng, K. S. Buchanan, R. Divan, K. Y. Guslienko, andD. J. Keavney, Phys. Rev. B 79, 172411 (2009).
[34] T. Uhlig, M. Rahm, C. Dietrich, R. Hollinger, M. Heumann,D. Weiss, and J. Zweck, Phys. Rev. Lett. 95, 237205(2005).
[35] T. Y. Chen, A. T. Galkiewicz, and P. A. Crowell, Phys. Rev. B85, 180406 (2012).
[36] P. Wessels, J. Ewald, M. Wieland, T. Nisius, A. Vogel, J.Viefhaus, G. Meier, T. Wilhein, and M. Drescher, Phys. Rev.B 90, 184417 (2014).
[37] M. J. Donahue and D. G. Porter, OOMMF User’s Guide, Ver. 1.0,Interagency Rep. NISTIR 6376 (National Institute of Standardsand Technology, Gaithersburg, MD, 1999).
094415-11


