Embed Size (px)
Citation preview
Dynamics of Carbon Monoxide Binding to CooA*
Received for publication, January 20, 2004, and in revised form, February 25, 2004Published, JBC Papers in Press, February 27, 2004, DOI 10.1074/jbc.M400613200
Mrinalini Puranik,a,b Steen Brøndsted Nielsen,a,b,c Hwan Youn,d Angela N. Hvitved,e,f
James L. Bourassa,a Martin A. Case,a,g Charbel Tengroth,a Gurusamy Balakrishnan,a
Marc V. Thorsteinsson,d,h John T. Groves,a George L. McLendon,a Gary P. Roberts,d
John S. Olson,e,i and Thomas G. Spiroa, j
From the aDepartment of Chemistry, Princeton University, Princeton, New Jersey 08544, the dDepartment of Bacteriology,University of Wisconsin at Madison, Madison, Wisconsin 53706, and the eDepartment of Biochemistry and Cell Biology,Rice University, Houston, Texas 77025
CooA is a dimeric CO-sensing heme protein from Rho-dospirillum rubrum. The heme iron in reduced CooA issix-coordinate; the axial ligands are His-77 and Pro-2.CO displaces Pro-2 and induces a conformation changethat allows CooA to bind DNA and activate transcriptionof coo genes. Equilibrium CO binding is cooperative,with a Hill coefficient of n � 1.4, P50 � 2.2 �M, andestimated Adair constants K1 � 0.16 and K2 � 1.3 �M�1.The rates of CO binding and release are both stronglybiphasic, with roughly equal amplitudes for the fast andslow phases. The association rates show a hyperbolicdependence on [CO], consistent with Pro-2 dissociationbeing rate-limiting. The kinetic characteristics of thetransiently formed five-coordinate heme are probed viaflash photolysis. These observations are integrated intoa kinetic model, in which CO binding to one subunitdecreases the rate of Pro-2 rebinding in the second,leading to a net increase in affinity for the second CO.The CO adduct exists in slowly interconverting “open”and “closed” forms. This interconversion probably in-volves the large-scale motions required to bring theDNA-binding domains into proper orientation. The com-bination of low CO affinity, slow CO binding, and slowconformational transitions ensures that activation ofCooA only occurs at high (micromolar) and sustained(>1 min) levels of CO. When micromolar levels do occur,positive cooperativity allows efficient activation over anarrow range of CO concentrations.
CooA is a CO-sensing heme protein from the bacterium Rho-dospirillum rubrum, which can grow anaerobically using CO asa sole energy source (1–3). CooA regulates the expression ofproteins encoded by the coo genes, which are associated withCO-oxidative growth (4, 5). It is a homodimer comprised of twoidentical, 222-amino acid subunits, each containing a b-typeheme that reversibly binds CO (4, 6). CooA can also bind NO,but only CO binding enables the protein to initiate the tran-scription of the coo genes (7). Although no crystal structure ofCooA-CO is available, the structure of the CO-free form isknown (6). CooA has a DNA-binding domain analogous to thatfound in the catabolic activator protein (CAP)1 family (see Fig.1) (6, 8). The heme group of one subunit is coordinated to theN� atom of the N-terminal Pro-2 residue from the adjacentsubunit in the symmetric dimer. Upon reduction of the ferricform of the protein, the proximal Cys-75 ligand, is replaced byHis-77, (4, 9), but coordination by Pro-2 is retained (6). CObinding to the ferrous form displaces Pro-2 (10) and initiatesDNA binding.
The active, DNA-binding structure of the closely related CAPprotein has been known for some time (8), but the inactivestructure (i.e. lacking the cAMP effector) has not been deter-mined. The conformational change that occurs upon effectorbinding is poorly understood. However, active CooA almostcertainly assumes a conformation approximately similar tothat of the CAP protein (Fig. 1), given its amino acid sequencehomology and specificity for similar DNA sequences. Compar-ison of the active form of CAP to the inactive form of CooAsuggests that CO binding to the heme is communicated to theDNA-binding regions by repositioning of the C-helices (6, 11).The C-helices run the length of each dimer subunit, passingclose to the heme and ending at the DNA-binding domain.Helix repositioning appears to be initiated by displacement ofPro-2 when CO binds to the heme iron.
The CO-binding pocket of CooA-CO appears to be tightlypacked. Geminate recombination of CO is remarkably rapid,� � �70 and �300 ps, indicating sequestering of the photodis-sociated CO in the immediate vicinity of the iron atom (12–14).Details regarding CO-binding pocket interactions and axialcoordination geometry are emerging from spectroscopic studies
* This work was supported in part by National Institutes of Health(NIH) Grants GM33576 (to T. G. S.), GM53228 (to G. P. R.), GM36928(to J. T. G.), GM 35649 (to J. S. O.), HL 47020 (to J. S. O.), by NationalScience Foundation Grant CHE 99-09502 (to M. A. C. and G. L. M.),and by Grant C-612 (to J. S. O.) from the Robert A. Welch Foundation.The costs of publication of this article were defrayed in part by thepayment of page charges. This article must therefore be hereby marked“advertisement” in accordance with 18 U.S.C. Section 1734 solely toindicate this fact.
b Both authors contributed equally to this work.c Supported by a postdoctoral fellowship from the Danish Natural
Science Research Council (Grant 21-01-0142). Current address: Dept. ofPhysics and Astronomy, University of Aarhus, Ny Munkegade, DK-8000 Aarhus C, Denmark.
f Recipient of a traineeship from the NIH Training Grant GM08280.g Supported by Grant CHE-0106342 from the National Science Foun-
dation Division of Chemistry.h Current address: Bioprocess Research and Development, Merck
Research Laboratories, West Point, PA 19486.i To whom correspondence may be addressed: Dept. of Biochemistry
and Cell Biology, Rice University, MS 140, 6100 Main St., Houston, TX77025-1892. Tel.: 713-348-4762; Fax: 713-348-5154; E-mail: [email protected].
j To whom correspondence may be addressed: Dept. of Chemistry, Prin-ceton University, Frick Laboratory, Washington Rd., Princeton, NJ 08544.Tel.: 609-258-3907; Fax: 609-258-0348; E-mail: [email protected].
1 The abbreviations used are: CAP, catabolic activator protein; Tris,Tris-(hydroxymethyl)aminomethane; Mb, myoglobin; MOPS, 4-morpho-linepropanesulfonic acid; CooA, Fe(II) form (unless otherwise indicated)of the CO-sensing transcriptional regulator from Rhodospirillumrubrum; CooA-CO, the CO adduct of CooA; CooA(5c), transient inter-mediate form, with five-coordinate heme (when the coordination state(i.e., proline-bound, CO-bound or five-coordinate heme) of each subunitis relevant, the species are written CooA2(Pro)2, CooA2(5c)(Pro),CooA2(CO)(Pro), CooA2(CO)(5c), and CooA2(CO)2).
THE JOURNAL OF BIOLOGICAL CHEMISTRY Vol. 279, No. 20, Issue of May 14, pp. 21096–21108, 2004© 2004 by The American Society for Biochemistry and Molecular Biology, Inc. Printed in U.S.A.
This paper is available on line at http://www.jbc.org21096
by guest on June 24, 2016http://w
ww
.jbc.org/D
ownloaded from
of CooA variants, and a model for the protein conformationalchange was recently proposed (15).
In the present work the equilibria and kinetics of CO bindingto CooA have been measured and used to develop a kineticmodel that can explain cooperative CO binding in terms of twosuccessive Pro-2 displacement reactions. Rates of CO bindingto and release from CooA were measured in stopped-flow, rapidmixing experiments. Studies were performed with both wild-type protein and a truncated CooA variant, �P3R4, in whichthe N terminus of each subunit is shortened by about 6 Å,causing strain on the Pro-2–Fe(II) bond and facilitating itsdissociation. Direct determination of the rate constants forPro-2 coordination and CO binding to five-coordinate hemeintermediates was achieved by analyzing nanosecond and mi-crosecond laser photolysis experiments and monitoring rebind-ing by absorbance and resonance Raman changes. Our resultsindicate that Pro-2 coordination serves to inhibit CO binding toprevent transcriptional activation unless the bacteria are ex-posed to moderately high and sustained levels of CO.
EXPERIMENTAL PROCEDURES
Sample Preparation—CooA was purified as previously described(16), stored in 25 mM MOPS/0.1 M NaCl (pH 7.4), and then diluted intoan appropriate buffer solution to give concentrations of �2–5 �M for theequilibrium binding titrations, �5–25 �M for the rapid mixing experi-ments, and �50 �M for time-resolved resonance Raman and microsec-ond laser photolysis experiments. CooA concentrations are expressed interms of heme. CooA and its CO adduct were prepared by adding theprotein to a syringe or cuvette that contained buffer equilibrated with 1atm of N2 or CO/N2 mixtures, respectively. If not stated otherwise, solidsodium dithionite (�100 �M) was added to the buffer prior to proteinaddition to reduce CooA[Fe(III)] to CooA[Fe(II)] and scavenge any re-sidual O2. The oxidation state, extent of CO binding, and heme concen-trations were confirmed by recording UV-visible absorption spectra(Hewlett-Packard 8452A diode array spectrophotometer). A Shinden-gen pH meter was used to measure the pH values of the solutions.
Determination of Equilibrium Constants for CO Binding—CO bind-ing to CooA was monitored by spectral changes in the 400- to 600-nmregion of the visible spectrum (Shimadzu UV-2401 spectrophotometer),and absorbance changes (�A) in the Soret wavelength region were usedto determine fractional saturation, Y. Each cuvette was filled with 1.5ml of 3.8 �M wild-type CooA in 25 mM MOPS, 0.1 M NaCl, pH 7.4. Twostock solutions were prepared, both containing 150 mM sodium dithio-nite. One was purged with argon, and the other with CO, both at 1 atm;
the concentration of dissolved CO was assumed to be 1000 �M. TheCooA sample was titrated by making mixtures of the two stock solutionsin a Hamilton syringe and then adding 20 �l of the appropriate mixtureto each cuvette to obtain the concentration of CO needed. A separateCO/CooA mixture was prepared for each spectrum shown below in Fig.2A. The cuvette headspace was minimized to �30 �l, approximatelyequal to the volume of the added solution, to avoid degassing of CO.Complete saturation of CooA was achieved by addition of 1 atm of COgas.
The concentration of CO was corrected for the bound fraction: [CO] �[CO]total � Y � [CooA]total, because CO binds tightly to CooA. Thefractional saturation, Y, was determined experimentally by the frac-tional change between the absorbance of the CooA/CO mixture and thatof the unliganded protein normalized to the maximum change, at 1 atmCO: Y � �A/�Amax. The data were initially fitted to the Hill equation,
Y �[CO]n
KH � [CO]n (Eq. 1)
where KH is defined as the Hill equilibrium constant for the dissociationof n ligand molecules from the protein. [CO] was initially set to [CO]total
and then iteratively readjusted by the calculated value of Y until con-vergence occurred. The final parameters obtained by the above proce-dure were applied to Reaction 1 and Equation 2 to extract Adairconstants,
(CooA)2 � CO L|;
K1 � k1/k�1
k1
k�1
(CooA)2(CO)
� COL|;
K2 � k2/k�2
k2
k�2
(CooA)2(CO)2
REACTION 1
Y �k1[CO] � 2k1k2[CO]2
2�1 � K1[CO] � K1K2[CO]2�(Eq. 2)
where K1 and K2 are the association equilibrium constants for thebinding of the first and second CO molecules to the CooA dimer.
Determination of CO Association Rate Constants by Rapid Mixing—Reduced CooA was mixed with CO at various concentrations, andbinding was followed by measuring absorbance changes in the visible orSoret wavelength regions. In one set of experiments, �25 �M CooA wasmixed with CO and visible spectra from 335 to 650 nm were recorded
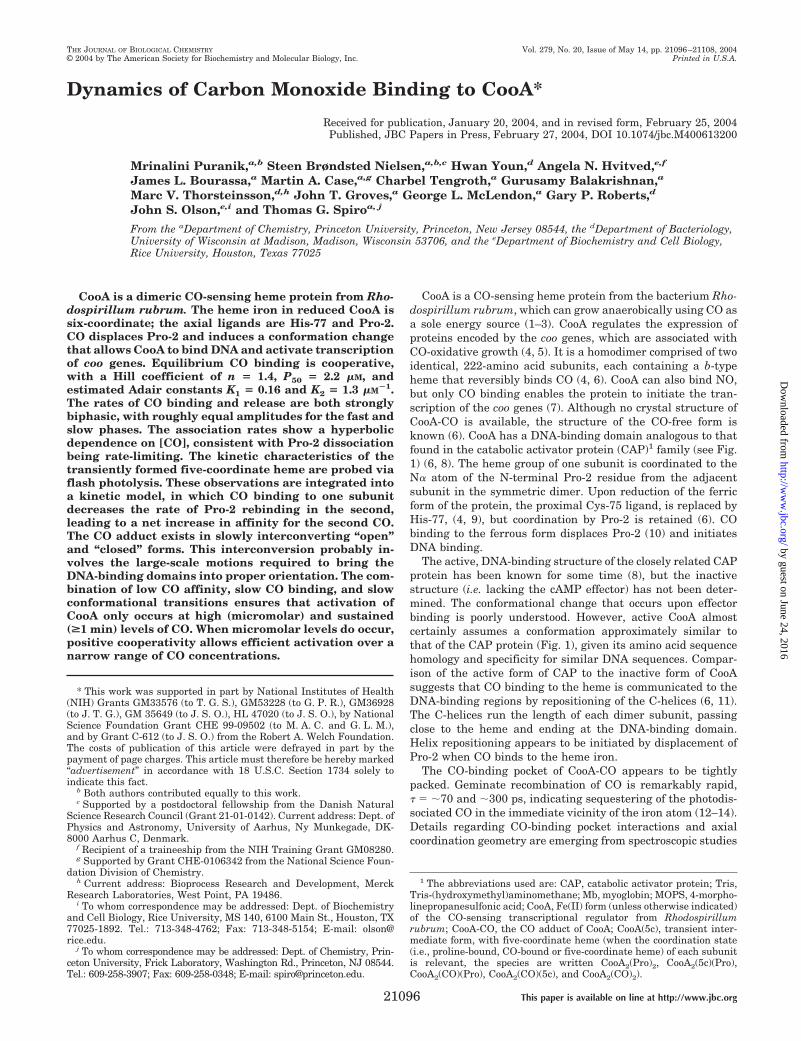
FIG. 1. Ribbon diagram of the structure of CooA in its inactive Fe[II] state (a) and of CAP in its active, cAMP-bound state (b). Theblack structures in the center of each effector domain represent the heme (for CooA) and cAMP (for CAP). The homology of the two structuressuggests that CO binding to CooA induces a conformational change of the protein that brings the DNA-binding domains (�F, colored yellow) intopositions similar to that of active CAP. The figure also indicates the B and C �-helices. (Adapted from Ref. 11.)
Dynamics of Carbon Monoxide Binding to CooA 21097
by guest on June 24, 2016http://w
ww
.jbc.org/D
ownloaded from
using a HI-TECH Scientific SF-61 DX2 Double Mixing Stopped-FlowSystem in diode array mode. In other experiments (Fig. 5), a Gibson-Dionex stopped-flow apparatus equipped with an OLIS data collectionsystem was used to mix 5 �M CooA with various concentrations of COwhile monitoring the absorbance at wavelengths in the Soret bandregion. Detection in the Soret wavelength region permitted use of diluteCooA and a wider range of CO concentrations.
Determination of CO Dissociation Rate Constants—Two types of ex-periments were used to examine CO dissociation from CooA-CO. In thefirst, a solution of the CO adduct (5 �M) was rapidly mixed with 1 mM
NO, and the displacement of CO was measured by the absorbancechange at 422 nm. In the second experiment, the CO adduct was rapidlymixed with H64L mesoheme deoxyMb, which acts as an efficient scav-enger of CO (kCO
30 �M�1 s�1, KCO 11,000 �M�1) and has a Soretpeak for MbCO at �416 nm. The decrease in absorbance due to the lossof CO from CooA-CO was again monitored at 422 nm. In both cases thesolution contained little or no free CO, and conditions were adjusted sothat the rate-limiting step was CO dissociation.
Flash Photolysis of CooA-CO; Absorbance Measurements—Two typesof experiments were conducted. In the first, time-resolved UV-visiblespectra were recorded to identify and characterize the intermediates inCO rebinding after short, �7-ns, YAG laser excitation pulses (SpectraPhysics Quanta Ray GCR-170 Nd:YAG laser/MOPO-710 operated at 10Hz with 20-mJ pump pulses). The configuration of photolysis laser andUV-visible probe laser has been described (17). A solution of the COadduct was transferred to an airtight 2-mm path length quartz cuvettethat had been flushed with 1 atm of CO. The protein was excited at 535nm, in the � absorption band of the heme group. UV-visible absorptionspectra before and after the pump pulse were acquired at different timeintervals (10 ns to 10 ms after photolysis). Difference spectra werecalculated by subtracting the spectrum of the unphotolyzed complexfrom the pumped spectra. Each time point was averaged over 16 shots,and a background difference spectrum, acquired without the pumppulse, was subtracted from the difference spectra. Data analysis wasperformed with MATLAB (Mathworks Inc.). Rate constants and basisspectra for the absorbance changes were extracted by singular valuedecomposition of time/wavelength/intensity matrices as described byHofrichter et al. (18).
In the second set of experiments, CO rebinding was measured afterexcitation with an intense �0.3-�s pulse from a Phaser-2100B dye laserusing rhodamine 577 in ethanol. In these experiments, 30–50 �M
CooA-CO was placed in a 1-mm path length cuvette containing a smallamount of sodium dithionite and an appropriate concentration of CO.Because complete photolysis could be achieved, the dye laser systemwas used to determine the kinetic parameters that define the competi-tion between CO rebinding and Pro-2 coordination to five-coordinateintermediates. Time courses were recorded at multiple [CO], fitted toexponential expressions, and analyzed in terms of the dependences of
the fast and slow phase rates and amplitudes on CO concentration asdescribed by Hargrove (19) for similar six-coordinate plant HbCO sys-tems. The rapid phase was followed at 420 nm, the Soret peak forCooA-CO, and represents CO recombination to five-coordinate heme on50- to 500-�s time scales. The slow phase was followed at �429 nm,close to the Soret absorbance maximum of reduced hexacoordinateCooA, and represents CO displacement of recombined Pro-2 on 0.1- to10-s time scales. The dye laser was also used to determine the overallquantum yield for complete photolysis of CooA-CO, using MbCO as areference (20). The value obtained, qoverall �0.02 for CooA-CO, is inagreement with the more direct picosecond rebinding studies of Aonoand coworkers (12–14).
Time-resolved Resonance Raman Spectroscopy—The experimentalsetup for the time-resolved resonance Raman measurements has beendescribed elsewhere (21, 22). The second harmonic of a Q-switchedNd:YLF laser (Photonics International GM-30-527) was used to pump aTi:sapphire laser (Photonics International TU-UV), which gave a nar-rowed laser frequency output (�0.1 cm�1) tunable between 810 and 920nm. The Ti:S laser output (�25 ns at 1 kHz) was frequency doubledusing a non-linear lithium triborate crystal to get a 419-nm pulse. A
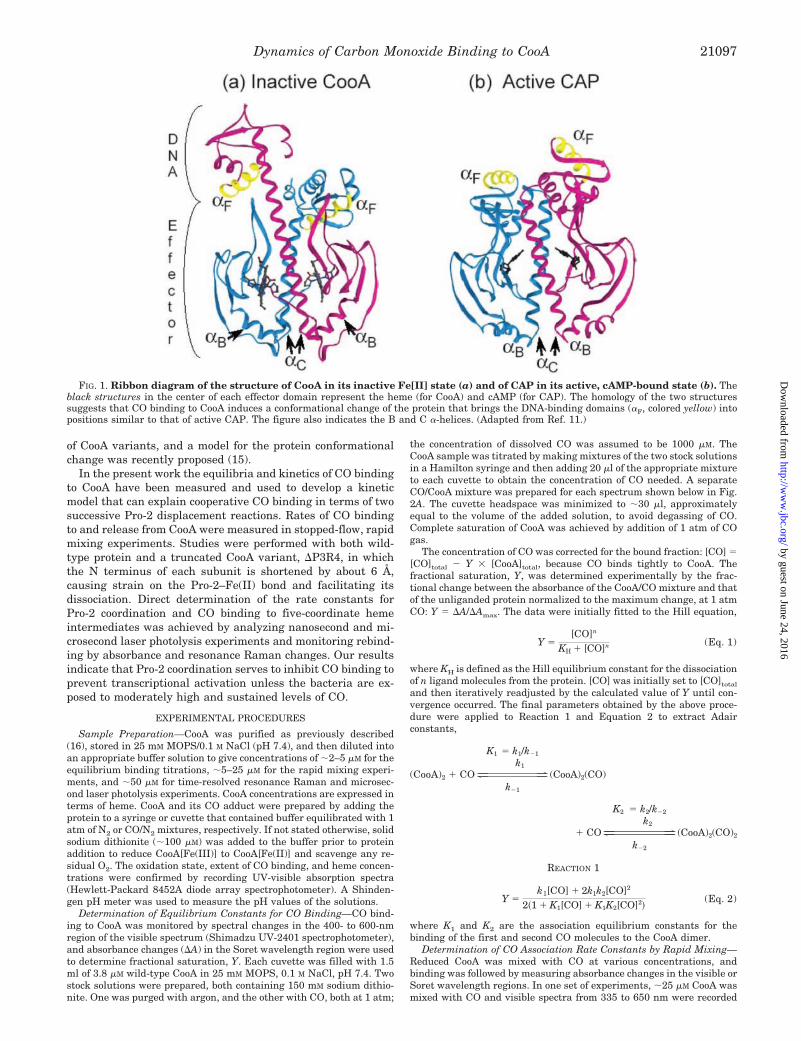
FIG. 2. A, equilibrium spectral changes of CooA upon successive addition of different amounts of CO. Inset shows the CooA-CO/CooA differencespectra. B, fit of the absorbance data to the Hill equation, with n � 1.4 and KD � 2.2 �M. Curves corresponding to n � 1 (no cooperativity) and n �2 (maximum cooperativity) (thinner lines) are shown for comparison.
FIG. 3. Stopped-flow time courses for CO binding to wild-typeCooA and the �P3R4 variant (25 �M, pH 7.4, 0.1 M Tris-HCl)monitored at 560 nm (see inset for spectra), showing biphasickinetics. The CO concentration after mixing was 500 �M. Fitted pa-rameters for the two traces were: �P3R4 CooA, kf � 100 s�1 and ks �0.11 s�1; WT CooA, kf � 0.37 s�1 and ks � 0.07 s�1.
Dynamics of Carbon Monoxide Binding to CooA21098
by guest on June 24, 2016http://w
ww
.jbc.org/D
ownloaded from
parallel laser system was used to obtain 426-nm probe pulses. Theoptimum pump laser power to achieve maximum photolysis was 140milliwatts. Photolysis due to the probe laser itself was minimized bykeeping the power at �1 milliwatt. A DG535 delay generator controlledthe time delay between the two laser pulses (200 ns to 300 �s). Thebeams were overlapped and then focused with a pair of cylindricallenses onto the sample. The sample solution was contained in a NMRtube and spun around a stationary stirring wire for vertical mixing ofthe sample. Above the sample surface a continuous stream of CO wasdelivered through a stainless-steel tube to maintain the CO concentra-tion at 1 mM. The scattered light was collected and focused onto a singlespectrograph (SPEX 1269, 3600 grooves/mm) equipped with a gatedintensified photo diode array detector. Six 30-s acquisition scans wereaveraged. Spectra were calibrated with acetone, cyclohexane, andmethylcyclohexane.
The spectra were deconvoluted using the GRAMS/32 version 5.10software. Parameters for the curve fitting included use of a mixedGaussian/Lorentzian band shape and the incorporation of fixed band-widths. The fractional composition after photolysis was calculated fromthe corrected intensities, e.g. f[CooA(5c)] � I[CooA(5c)]/(I[CooA(5c)] �I[CooA] � I[CooA-CO]). Multiplying f[CooA(5c)], f[CooA], and f[CooA-CO] by the total protein concentration provides the concentration ofeach of the species. The concentrations measured from probe-only spec-tra were subtracted to calculate the change in the concentration. Therelative change was then obtained by dividing these numbers by thetotal protein concentration.
RESULTS
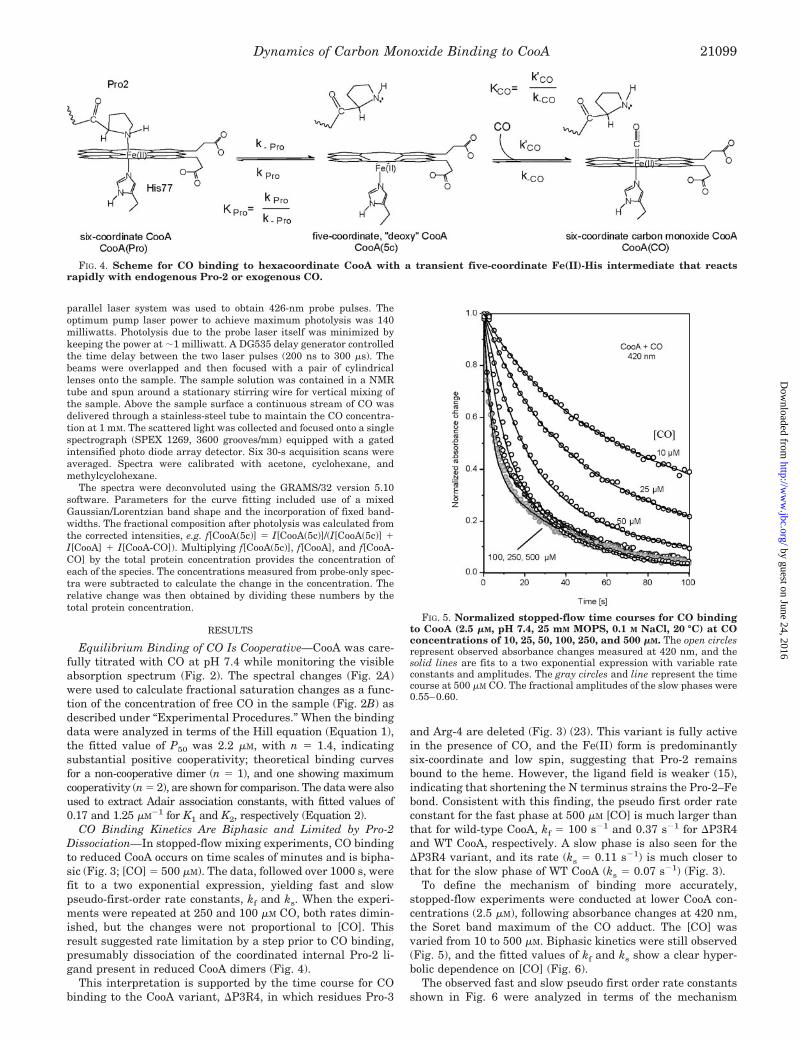
Equilibrium Binding of CO Is Cooperative—CooA was care-fully titrated with CO at pH 7.4 while monitoring the visibleabsorption spectrum (Fig. 2). The spectral changes (Fig. 2A)were used to calculate fractional saturation changes as a func-tion of the concentration of free CO in the sample (Fig. 2B) asdescribed under “Experimental Procedures.” When the bindingdata were analyzed in terms of the Hill equation (Equation 1),the fitted value of P50 was 2.2 �M, with n � 1.4, indicatingsubstantial positive cooperativity; theoretical binding curvesfor a non-cooperative dimer (n � 1), and one showing maximumcooperativity (n � 2), are shown for comparison. The data were alsoused to extract Adair association constants, with fitted values of0.17 and 1.25 �M�1 for K1 and K2, respectively (Equation 2).
CO Binding Kinetics Are Biphasic and Limited by Pro-2Dissociation—In stopped-flow mixing experiments, CO bindingto reduced CooA occurs on time scales of minutes and is bipha-sic (Fig. 3; [CO] � 500 �M). The data, followed over 1000 s, werefit to a two exponential expression, yielding fast and slowpseudo-first-order rate constants, kf and ks. When the experi-ments were repeated at 250 and 100 �M CO, both rates dimin-ished, but the changes were not proportional to [CO]. Thisresult suggested rate limitation by a step prior to CO binding,presumably dissociation of the coordinated internal Pro-2 li-gand present in reduced CooA dimers (Fig. 4).
This interpretation is supported by the time course for CObinding to the CooA variant, �P3R4, in which residues Pro-3
and Arg-4 are deleted (Fig. 3) (23). This variant is fully activein the presence of CO, and the Fe(II) form is predominantlysix-coordinate and low spin, suggesting that Pro-2 remainsbound to the heme. However, the ligand field is weaker (15),indicating that shortening the N terminus strains the Pro-2–Febond. Consistent with this finding, the pseudo first order rateconstant for the fast phase at 500 �M [CO] is much larger thanthat for wild-type CooA, kf � 100 s�1 and 0.37 s�1 for �P3R4and WT CooA, respectively. A slow phase is also seen for the�P3R4 variant, and its rate (ks � 0.11 s�1) is much closer tothat for the slow phase of WT CooA (ks � 0.07 s�1) (Fig. 3).
To define the mechanism of binding more accurately,stopped-flow experiments were conducted at lower CooA con-centrations (2.5 �M), following absorbance changes at 420 nm,the Soret band maximum of the CO adduct. The [CO] wasvaried from 10 to 500 �M. Biphasic kinetics were still observed(Fig. 5), and the fitted values of kf and ks show a clear hyper-bolic dependence on [CO] (Fig. 6).
The observed fast and slow pseudo first order rate constantsshown in Fig. 6 were analyzed in terms of the mechanism
FIG. 5. Normalized stopped-flow time courses for CO bindingto CooA (2.5 �M, pH 7.4, 25 mM MOPS, 0.1 M NaCl, 20 °C) at COconcentrations of 10, 25, 50, 100, 250, and 500 �M. The open circlesrepresent observed absorbance changes measured at 420 nm, and thesolid lines are fits to a two exponential expression with variable rateconstants and amplitudes. The gray circles and line represent the timecourse at 500 �M CO. The fractional amplitudes of the slow phases were0.55–0.60.
FIG. 4. Scheme for CO binding to hexacoordinate CooA with a transient five-coordinate Fe(II)-His intermediate that reactsrapidly with endogenous Pro-2 or exogenous CO.
Dynamics of Carbon Monoxide Binding to CooA 21099
by guest on June 24, 2016http://w
ww
.jbc.org/D
ownloaded from
shown in Fig. 4, which involves the pre-dissociation of Pro-2followed by CO binding to a transient pentacoordinate (5c)intermediate. This intermediate is spectrally undetectable inthe stopped-flow experiments, because, as will be shown in thenext section, the rates of bimolecular CO binding, kCO
[CO], andPro rebinding, kPro, to the 5c intermediate are very rapid com-pared with the rate constant for Pro-2 dissociation, k�Pro. Thelatter rate constant limits the overall rate of CO binding in therapid mixing experiments. Consequently, a steady-state as-sumption can be made for the rate of change of [CooA(5c)], andthe observed pseudo first order rate constant for overall CObinding to CooA containing bound Pro-2 (19, 24, 25) is given byEquation 3.
kobs �k�prokco
[CO] � kProk�CO � k�Prok�CO
k�Pro � kPro � kco [CO]
(Eq. 3)
Equation 3 reduces to a simple hyperbolic expression when therates of proline and CO dissociation are very small (i.e. k�Pro
�� kPro � kCO [CO] and k�CO �� kCO
[CO]).
kobs k�Prokco
[CO]kPro � kco
[CO]�
k�Pro[CO]kPro/kco
�[CO](Eq. 4)
Equation 4 applies to both the fast and slow observed rateconstants, kobs,f and kobs,s, and holds rigorously at CO concen-trations where complete binding occurs. The limiting rates forboth phases are the rate constants for Pro-2 dissociation, k�Pro,f
and k�Pro,s. The solid lines in Fig. 6 represent fits to Equation4, with k�Pro,f � 0.4 s�1, kPro/kCO
(fast phase) � 50 �M andk�Pro,s � 0.07 s�1, kPro/kCO
(slow phase) � 60 �M.CO Rebinding to the 5-Coordinate Intermediate—The kinet-
ics of CO rebinding to the five-coordinate intermediate,CooA(5c), were determined via flash-photolysis techniques. Ini-tial experiments employed short (7–25 ns) flashes and detec-tion of early transients, using absorption or resonance Ramanspectroscopy. The experiments in the next section employedlonger (300 ns) flashes to achieve complete photolysis andmonitor more directly the competition between CO and Prorebinding on longer time scales.
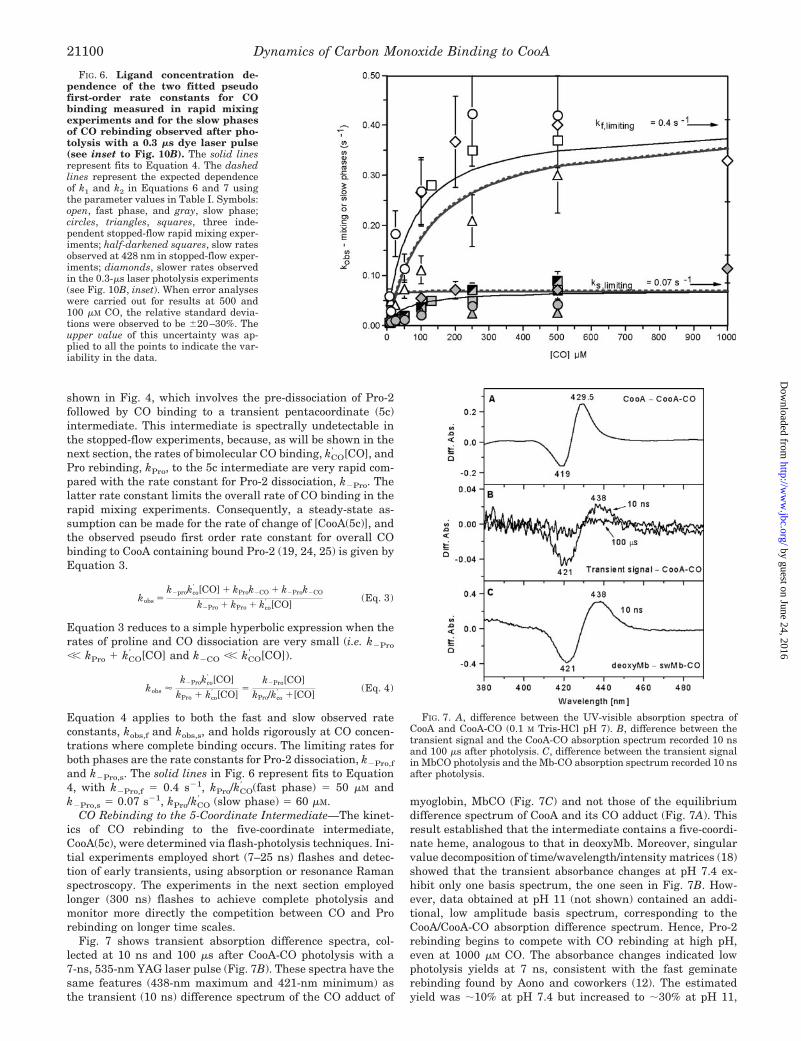
Fig. 7 shows transient absorption difference spectra, col-lected at 10 ns and 100 �s after CooA-CO photolysis with a7-ns, 535-nm YAG laser pulse (Fig. 7B). These spectra have thesame features (438-nm maximum and 421-nm minimum) asthe transient (10 ns) difference spectrum of the CO adduct of
myoglobin, MbCO (Fig. 7C) and not those of the equilibriumdifference spectrum of CooA and its CO adduct (Fig. 7A). Thisresult established that the intermediate contains a five-coordi-nate heme, analogous to that in deoxyMb. Moreover, singularvalue decomposition of time/wavelength/intensity matrices (18)showed that the transient absorbance changes at pH 7.4 ex-hibit only one basis spectrum, the one seen in Fig. 7B. How-ever, data obtained at pH 11 (not shown) contained an addi-tional, low amplitude basis spectrum, corresponding to theCooA/CooA-CO absorption difference spectrum. Hence, Pro-2rebinding begins to compete with CO rebinding at high pH,even at 1000 �M CO. The absorbance changes indicated lowphotolysis yields at 7 ns, consistent with the fast geminaterebinding found by Aono and coworkers (12). The estimatedyield was �10% at pH 7.4 but increased to �30% at pH 11,
FIG. 7. A, difference between the UV-visible absorption spectra ofCooA and CooA-CO (0.1 M Tris-HCl pH 7). B, difference between thetransient signal and the CooA-CO absorption spectrum recorded 10 nsand 100 �s after photolysis. C, difference between the transient signalin MbCO photolysis and the Mb-CO absorption spectrum recorded 10 nsafter photolysis.
FIG. 6. Ligand concentration de-pendence of the two fitted pseudofirst-order rate constants for CObinding measured in rapid mixingexperiments and for the slow phasesof CO rebinding observed after pho-tolysis with a 0.3 �s dye laser pulse(see inset to Fig. 10B). The solid linesrepresent fits to Equation 4. The dashedlines represent the expected dependenceof k1 and k2 in Equations 6 and 7 usingthe parameter values in Table I. Symbols:open, fast phase, and gray, slow phase;circles, triangles, squares, three inde-pendent stopped-flow rapid mixing exper-iments; half-darkened squares, slow ratesobserved at 428 nm in stopped-flow exper-iments; diamonds, slower rates observedin the 0.3-�s laser photolysis experiments(see Fig. 10B, inset). When error analyseswere carried out for results at 500 and100 �M CO, the relative standard devia-tions were observed to be �20–30%. Theupper value of this uncertainty was ap-plied to all the points to indicate the var-iability in the data.
Dynamics of Carbon Monoxide Binding to CooA21100
by guest on June 24, 2016http://w
ww
.jbc.org/D
ownloaded from
suggesting that more of the photogenerated CO escapes intosolution at high pH.
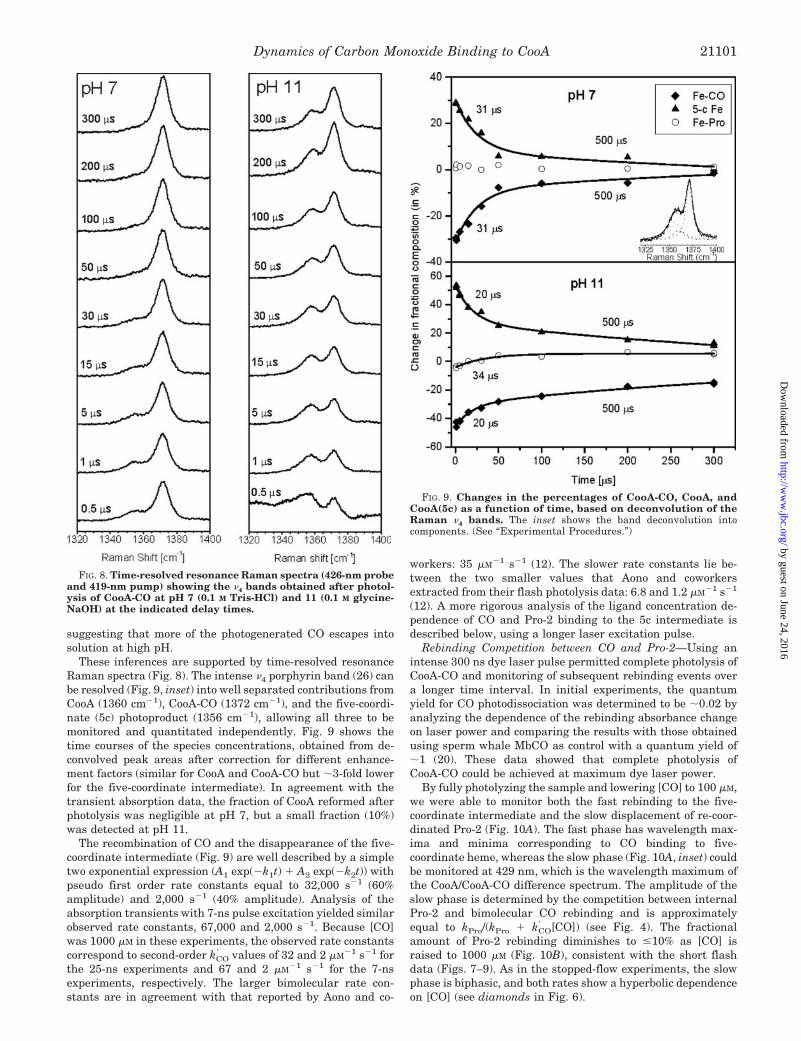
These inferences are supported by time-resolved resonanceRaman spectra (Fig. 8). The intense �4 porphyrin band (26) canbe resolved (Fig. 9, inset) into well separated contributions fromCooA (1360 cm�1), CooA-CO (1372 cm�1), and the five-coordi-nate (5c) photoproduct (1356 cm�1), allowing all three to bemonitored and quantitated independently. Fig. 9 shows thetime courses of the species concentrations, obtained from de-convolved peak areas after correction for different enhance-ment factors (similar for CooA and CooA-CO but �3-fold lowerfor the five-coordinate intermediate). In agreement with thetransient absorption data, the fraction of CooA reformed afterphotolysis was negligible at pH 7, but a small fraction (10%)was detected at pH 11.
The recombination of CO and the disappearance of the five-coordinate intermediate (Fig. 9) are well described by a simpletwo exponential expression (A1 exp(�k1t) � A2 exp(�k2t)) withpseudo first order rate constants equal to 32,000 s�1 (60%amplitude) and 2,000 s�1 (40% amplitude). Analysis of theabsorption transients with 7-ns pulse excitation yielded similarobserved rate constants, 67,000 and 2,000 s�1. Because [CO]was 1000 �M in these experiments, the observed rate constantscorrespond to second-order kCO
values of 32 and 2 �M�1 s�1 forthe 25-ns experiments and 67 and 2 �M�1 s�1 for the 7-nsexperiments, respectively. The larger bimolecular rate con-stants are in agreement with that reported by Aono and co-
workers: 35 �M�1 s�1 (12). The slower rate constants lie be-tween the two smaller values that Aono and coworkersextracted from their flash photolysis data: 6.8 and 1.2 �M�1 s�1
(12). A more rigorous analysis of the ligand concentration de-pendence of CO and Pro-2 binding to the 5c intermediate isdescribed below, using a longer laser excitation pulse.
Rebinding Competition between CO and Pro-2—Using anintense 300 ns dye laser pulse permitted complete photolysis ofCooA-CO and monitoring of subsequent rebinding events overa longer time interval. In initial experiments, the quantumyield for CO photodissociation was determined to be �0.02 byanalyzing the dependence of the rebinding absorbance changeon laser power and comparing the results with those obtainedusing sperm whale MbCO as control with a quantum yield of�1 (20). These data showed that complete photolysis ofCooA-CO could be achieved at maximum dye laser power.
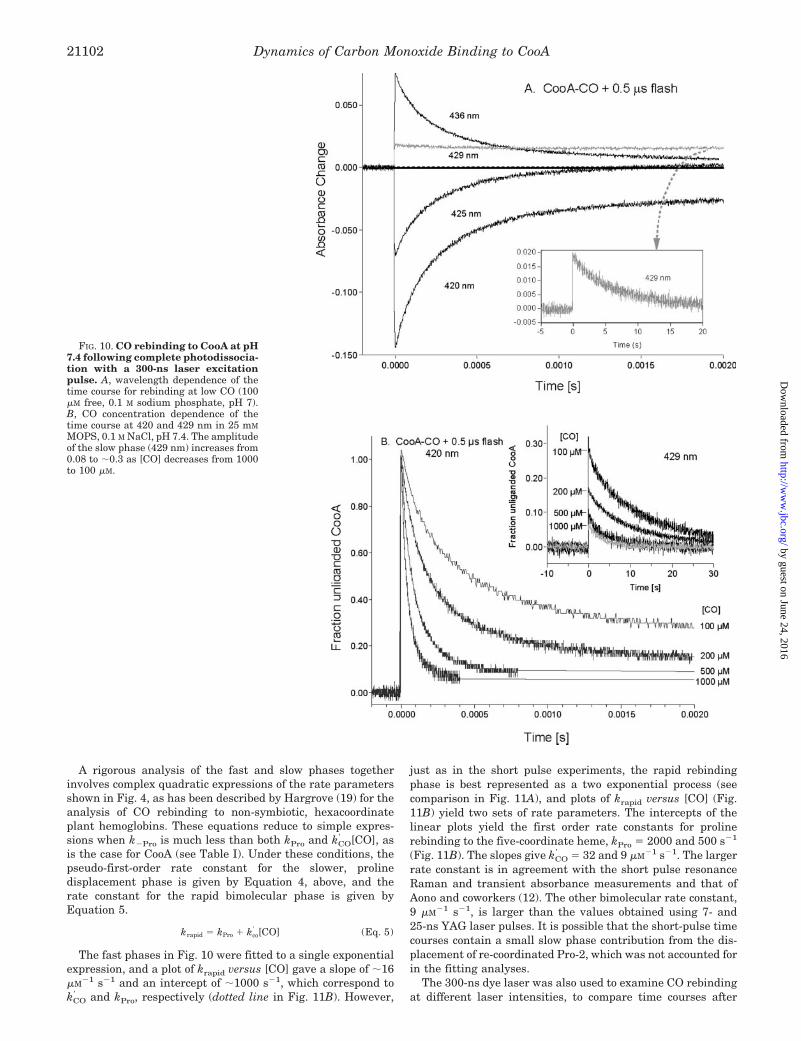
By fully photolyzing the sample and lowering [CO] to 100 �M,we were able to monitor both the fast rebinding to the five-coordinate intermediate and the slow displacement of re-coor-dinated Pro-2 (Fig. 10A). The fast phase has wavelength max-ima and minima corresponding to CO binding to five-coordinate heme, whereas the slow phase (Fig. 10A, inset) couldbe monitored at 429 nm, which is the wavelength maximum ofthe CooA/CooA-CO difference spectrum. The amplitude of theslow phase is determined by the competition between internalPro-2 and bimolecular CO rebinding and is approximatelyequal to kPro/(kPro � kCO
[CO]) (see Fig. 4). The fractionalamount of Pro-2 rebinding diminishes to �10% as [CO] israised to 1000 �M (Fig. 10B), consistent with the short flashdata (Figs. 7–9). As in the stopped-flow experiments, the slowphase is biphasic, and both rates show a hyperbolic dependenceon [CO] (see diamonds in Fig. 6).
FIG. 8. Time-resolved resonance Raman spectra (426-nm probeand 419-nm pump) showing the �4 bands obtained after photol-ysis of CooA-CO at pH 7 (0.1 M Tris-HCl) and 11 (0.1 M glycine-NaOH) at the indicated delay times.
FIG. 9. Changes in the percentages of CooA-CO, CooA, andCooA(5c) as a function of time, based on deconvolution of theRaman �4 bands. The inset shows the band deconvolution intocomponents. (See “Experimental Procedures.”)
Dynamics of Carbon Monoxide Binding to CooA 21101
by guest on June 24, 2016http://w
ww
.jbc.org/D
ownloaded from
A rigorous analysis of the fast and slow phases togetherinvolves complex quadratic expressions of the rate parametersshown in Fig. 4, as has been described by Hargrove (19) for theanalysis of CO rebinding to non-symbiotic, hexacoordinateplant hemoglobins. These equations reduce to simple expres-sions when k�Pro is much less than both kPro and kCO
[CO], asis the case for CooA (see Table I). Under these conditions, thepseudo-first-order rate constant for the slower, prolinedisplacement phase is given by Equation 4, above, and therate constant for the rapid bimolecular phase is given byEquation 5.
krapid � kPro � kco [CO] (Eq. 5)
The fast phases in Fig. 10 were fitted to a single exponentialexpression, and a plot of krapid versus [CO] gave a slope of �16�M�1 s�1 and an intercept of �1000 s�1, which correspond tokCO
and kPro, respectively (dotted line in Fig. 11B). However,
just as in the short pulse experiments, the rapid rebindingphase is best represented as a two exponential process (seecomparison in Fig. 11A), and plots of krapid versus [CO] (Fig.11B) yield two sets of rate parameters. The intercepts of thelinear plots yield the first order rate constants for prolinerebinding to the five-coordinate heme, kPro � 2000 and 500 s�1
(Fig. 11B). The slopes give kCO � 32 and 9 �M�1 s�1. The larger
rate constant is in agreement with the short pulse resonanceRaman and transient absorbance measurements and that ofAono and coworkers (12). The other bimolecular rate constant,9 �M�1 s�1, is larger than the values obtained using 7- and25-ns YAG laser pulses. It is possible that the short-pulse timecourses contain a small slow phase contribution from the dis-placement of re-coordinated Pro-2, which was not accounted forin the fitting analyses.
The 300-ns dye laser was also used to examine CO rebindingat different laser intensities, to compare time courses after
FIG. 10. CO rebinding to CooA at pH7.4 following complete photodissocia-tion with a 300-ns laser excitationpulse. A, wavelength dependence of thetime course for rebinding at low CO (100�M free, 0.1 M sodium phosphate, pH 7).B, CO concentration dependence of thetime course at 420 and 429 nm in 25 mM
MOPS, 0.1 M NaCl, pH 7.4. The amplitudeof the slow phase (429 nm) increases from0.08 to �0.3 as [CO] decreases from 1000to 100 �M.
Dynamics of Carbon Monoxide Binding to CooA21102
by guest on June 24, 2016http://w
ww
.jbc.org/D
ownloaded from
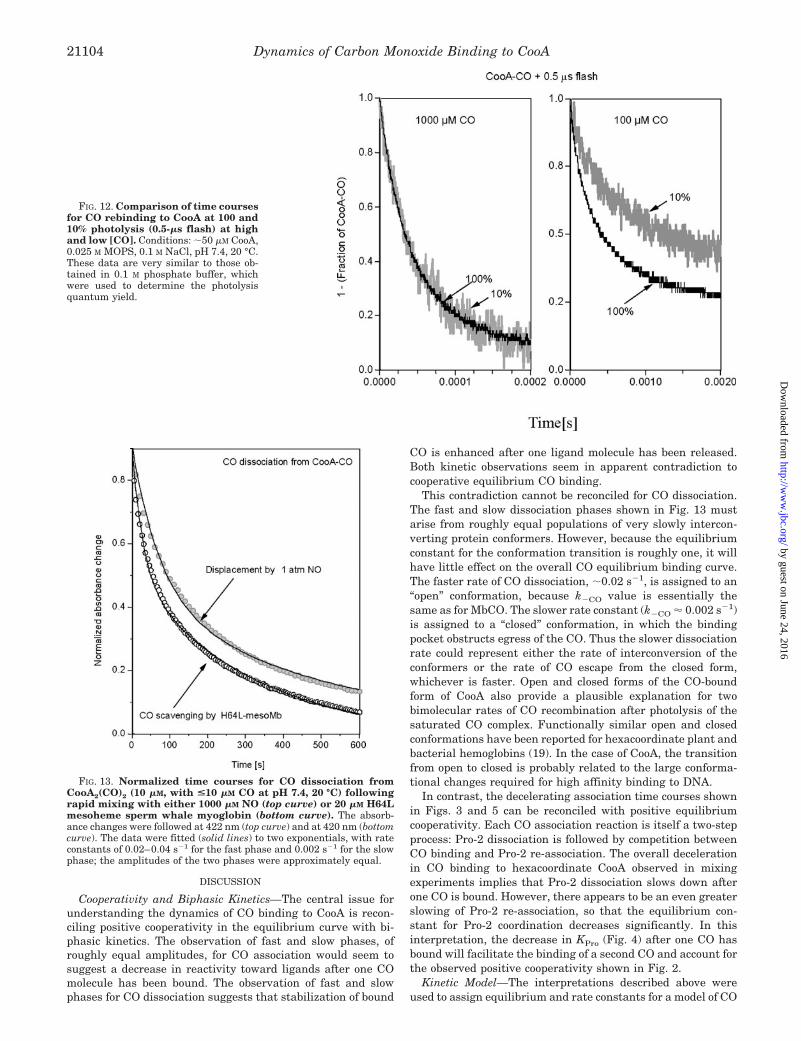
100% photolysis, when the photoproduct is CooA2(5c)2, andafter 10% photolysis when the photoproduct contains only onebound ligand, i.e. CooA2(CO)(5c). At 1000 �M CO, the timecourses for rebinding are the same (Fig. 12), showing thatbimolecular CO binding to a pentacoordinate CooA subunit isnot affected by the presence or absence of CO bound to theother subunit. However, at 100 �M CO, the rate of the rapidphase is smaller at 10% than at 100% photolysis. Under theseconditions, the rate of Pro-2 binding is affecting the observedrate (Equation 5), and the smaller rate constant observed at10% photolysis implies that Pro-2 rebinding is slowed when oneCO is bound to a CooA dimer.
Kinetics of CO Dissociation from CooA-CO—Time courses forCO dissociation from CooA-CO are shown in Fig. 13. Twoindependent techniques were used to monitor CO release. Inthe first, solutions with high concentrations of NO were mixedwith the CO complex of CooA at moderately low [CO]. Underthese conditions the rate-limiting step for NO displacement isthe dissociation of CO. Immediately after CO dissociates, NOrapidly and tightly binds to the heme, preventing CO rebind-ing. However, NO binding is known to release the proximal
histidine ligand in CooA (27), and thus some of the observedspectral changes could be due to the proximal histidine dis-placement reaction.
In the second type of experiment, H64L deoxyMb containingmesoheme was mixed with the CO complex of CooA, and thetime course for the transfer of CO from CooA-CO to the scav-enging reagent was followed at 420 nm. The distal histidine inthe Mb mutant is replaced by leucine, which dramaticallyincreases both the rate (kCO
30 �M�1s�1) and affinity (KCO 1,100 �M�1) of CO binding (28). Protoheme was replaced bymesoheme to shift the Soret peak of the MbCO complex to �416nm, which facilitates absorbance measurements at 420 nm, theCooA-CO Soret peak. Disappearance of the CooA-CO peak in-dicates the dissociation of the bound ligand, which is rapidlyand almost irreversibly bound by the reagent.
Both the NO displacement and H64L deoxyMb scavengingtime courses are biphasic (Fig. 13). Fits to two exponentialexpressions give rate constants of 0.02–0.04 s�1 and 0.002 s�1
for the fast and slow phases, which have roughly equalamplitudes.
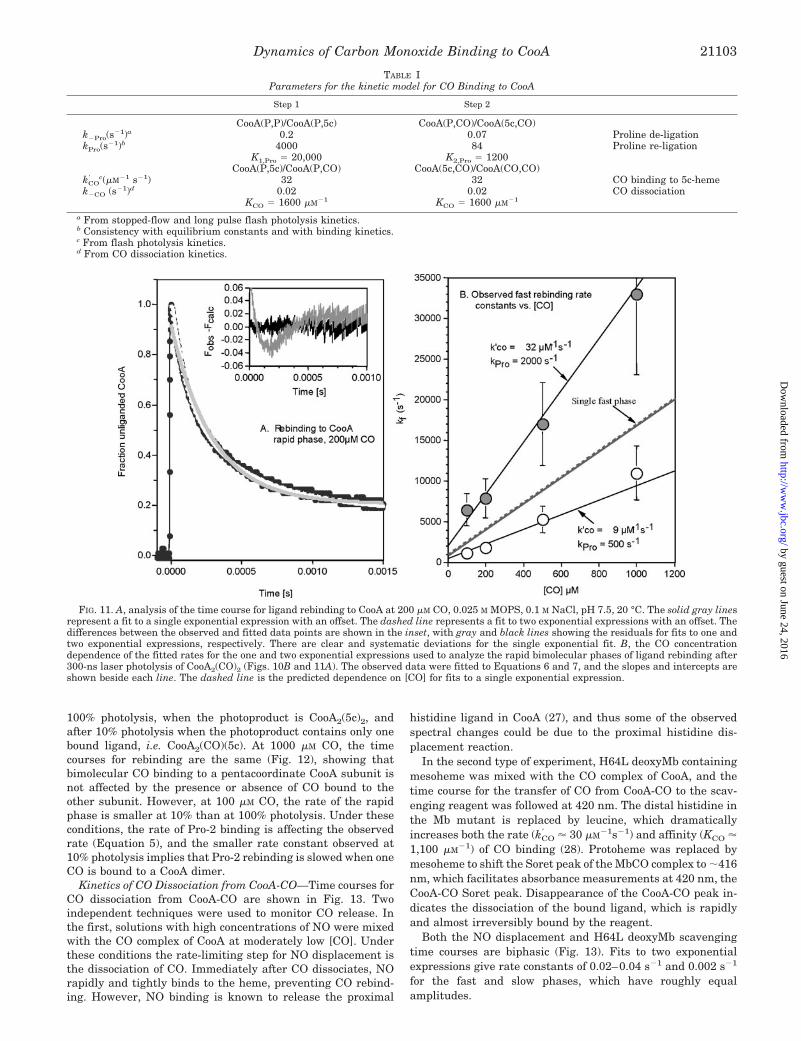
TABLE IParameters for the kinetic model for CO Binding to CooA
Step 1 Step 2
CooA(P,P)/CooA(P,5c) CooA(P,CO)/CooA(5c,CO)k�Pro(s
�1)a 0.2 0.07 Proline de-ligationkPro(s
�1)b 4000 84 Proline re-ligationK1,Pro � 20,000 K2,Pro � 1200
CooA(P,5c)/CooA(P,CO) CooA(5c,CO)/CooA(CO,CO)kCO
c(�M�1 s�1) 32 32 CO binding to 5c-hemek�CO (s�1)d 0.02 0.02 CO dissociation
KCO � 1600 �M�1 KCO � 1600 �M�1
a From stopped-flow and long pulse flash photolysis kinetics.b Consistency with equilibrium constants and with binding kinetics.c From flash photolysis kinetics.d From CO dissociation kinetics.
FIG. 11. A, analysis of the time course for ligand rebinding to CooA at 200 �M CO, 0.025 M MOPS, 0.1 M NaCl, pH 7.5, 20 °C. The solid gray linesrepresent a fit to a single exponential expression with an offset. The dashed line represents a fit to two exponential expressions with an offset. Thedifferences between the observed and fitted data points are shown in the inset, with gray and black lines showing the residuals for fits to one andtwo exponential expressions, respectively. There are clear and systematic deviations for the single exponential fit. B, the CO concentrationdependence of the fitted rates for the one and two exponential expressions used to analyze the rapid bimolecular phases of ligand rebinding after300-ns laser photolysis of CooA2(CO)2 (Figs. 10B and 11A). The observed data were fitted to Equations 6 and 7, and the slopes and intercepts areshown beside each line. The dashed line is the predicted dependence on [CO] for fits to a single exponential expression.
Dynamics of Carbon Monoxide Binding to CooA 21103
by guest on June 24, 2016http://w
ww
.jbc.org/D
ownloaded from
DISCUSSION
Cooperativity and Biphasic Kinetics—The central issue forunderstanding the dynamics of CO binding to CooA is recon-ciling positive cooperativity in the equilibrium curve with bi-phasic kinetics. The observation of fast and slow phases, ofroughly equal amplitudes, for CO association would seem tosuggest a decrease in reactivity toward ligands after one COmolecule has been bound. The observation of fast and slowphases for CO dissociation suggests that stabilization of bound
CO is enhanced after one ligand molecule has been released.Both kinetic observations seem in apparent contradiction tocooperative equilibrium CO binding.
This contradiction cannot be reconciled for CO dissociation.The fast and slow dissociation phases shown in Fig. 13 mustarise from roughly equal populations of very slowly intercon-verting protein conformers. However, because the equilibriumconstant for the conformation transition is roughly one, it willhave little effect on the overall CO equilibrium binding curve.The faster rate of CO dissociation, �0.02 s�1, is assigned to an“open” conformation, because k�CO value is essentially thesame as for MbCO. The slower rate constant (k�CO 0.002 s�1)is assigned to a “closed” conformation, in which the bindingpocket obstructs egress of the CO. Thus the slower dissociationrate could represent either the rate of interconversion of theconformers or the rate of CO escape from the closed form,whichever is faster. Open and closed forms of the CO-boundform of CooA also provide a plausible explanation for twobimolecular rates of CO recombination after photolysis of thesaturated CO complex. Functionally similar open and closedconformations have been reported for hexacoordinate plant andbacterial hemoglobins (19). In the case of CooA, the transitionfrom open to closed is probably related to the large conforma-tional changes required for high affinity binding to DNA.
In contrast, the decelerating association time courses shownin Figs. 3 and 5 can be reconciled with positive equilibriumcooperativity. Each CO association reaction is itself a two-stepprocess: Pro-2 dissociation is followed by competition betweenCO binding and Pro-2 re-association. The overall decelerationin CO binding to hexacoordinate CooA observed in mixingexperiments implies that Pro-2 dissociation slows down afterone CO is bound. However, there appears to be an even greaterslowing of Pro-2 re-association, so that the equilibrium con-stant for Pro-2 coordination decreases significantly. In thisinterpretation, the decrease in KPro (Fig. 4) after one CO hasbound will facilitate the binding of a second CO and account forthe observed positive cooperativity shown in Fig. 2.
Kinetic Model—The interpretations described above wereused to assign equilibrium and rate constants for a model of CO
FIG. 12. Comparison of time coursesfor CO rebinding to CooA at 100 and10% photolysis (0.5-�s flash) at highand low [CO]. Conditions: �50 �M CooA,0.025 M MOPS, 0.1 M NaCl, pH 7.4, 20 °C.These data are very similar to those ob-tained in 0.1 M phosphate buffer, whichwere used to determine the photolysisquantum yield.
FIG. 13. Normalized time courses for CO dissociation fromCooA2(CO)2 (10 �M, with <10 �M CO at pH 7.4, 20 °C) followingrapid mixing with either 1000 �M NO (top curve) or 20 �M H64Lmesoheme sperm whale myoglobin (bottom curve). The absorb-ance changes were followed at 422 nm (top curve) and at 420 nm (bottomcurve). The data were fitted (solid lines) to two exponentials, with rateconstants of 0.02–0.04 s�1 for the fast phase and 0.002 s�1 for the slowphase; the amplitudes of the two phases were approximately equal.
Dynamics of Carbon Monoxide Binding to CooA21104
by guest on June 24, 2016http://w
ww
.jbc.org/D
ownloaded from
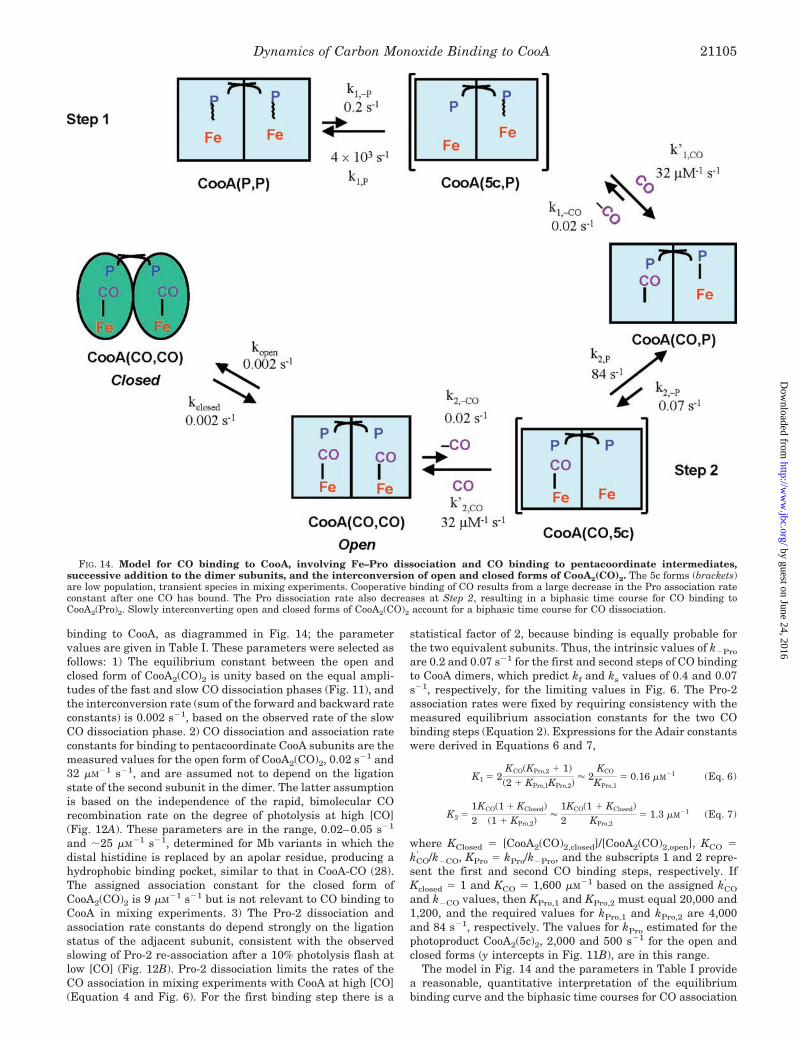
binding to CooA, as diagrammed in Fig. 14; the parametervalues are given in Table I. These parameters were selected asfollows: 1) The equilibrium constant between the open andclosed form of CooA2(CO)2 is unity based on the equal ampli-tudes of the fast and slow CO dissociation phases (Fig. 11), andthe interconversion rate (sum of the forward and backward rateconstants) is 0.002 s�1, based on the observed rate of the slowCO dissociation phase. 2) CO dissociation and association rateconstants for binding to pentacoordinate CooA subunits are themeasured values for the open form of CooA2(CO)2, 0.02 s�1 and32 �M�1 s�1, and are assumed not to depend on the ligationstate of the second subunit in the dimer. The latter assumptionis based on the independence of the rapid, bimolecular COrecombination rate on the degree of photolysis at high [CO](Fig. 12A). These parameters are in the range, 0.02–0.05 s�1
and �25 �M�1 s�1, determined for Mb variants in which thedistal histidine is replaced by an apolar residue, producing ahydrophobic binding pocket, similar to that in CooA-CO (28).The assigned association constant for the closed form ofCooA2(CO)2 is 9 �M�1 s�1 but is not relevant to CO binding toCooA in mixing experiments. 3) The Pro-2 dissociation andassociation rate constants do depend strongly on the ligationstatus of the adjacent subunit, consistent with the observedslowing of Pro-2 re-association after a 10% photolysis flash atlow [CO] (Fig. 12B). Pro-2 dissociation limits the rates of theCO association in mixing experiments with CooA at high [CO](Equation 4 and Fig. 6). For the first binding step there is a
statistical factor of 2, because binding is equally probable forthe two equivalent subunits. Thus, the intrinsic values of k�Pro
are 0.2 and 0.07 s�1 for the first and second steps of CO bindingto CooA dimers, which predict kf and ks values of 0.4 and 0.07s�1, respectively, for the limiting values in Fig. 6. The Pro-2association rates were fixed by requiring consistency with themeasured equilibrium association constants for the two CObinding steps (Equation 2). Expressions for the Adair constantswere derived in Equations 6 and 7,
K1 � 2KCO(KPro,2 � 1)(2 � KPro,1KPro,2)
2KCO
KPro,1� 0.16 �M�1 (Eq. 6)
K2 �12
KCO(1 � KClosed)(1 � KPro,2)
12
KCO(1 � KClosed)KPro,2
� 1.3 �M�1 (Eq. 7)
where KClosed � [CooA2(CO)2,closed]/[CooA2(CO)2,open], KCO �kCO
/k�CO, KPro � kPro/k�Pro, and the subscripts 1 and 2 repre-sent the first and second CO binding steps, respectively. IfKclosed � 1 and KCO � 1,600 �M�1 based on the assigned kCO
and k�CO values, then KPro,1 and KPro,2 must equal 20,000 and1,200, and the required values for kPro,1 and kPro,2 are 4,000and 84 s�1, respectively. The values for kPro estimated for thephotoproduct CooA2(5c)2, 2,000 and 500 s�1 for the open andclosed forms (y intercepts in Fig. 11B), are in this range.
The model in Fig. 14 and the parameters in Table I providea reasonable, quantitative interpretation of the equilibriumbinding curve and the biphasic time courses for CO association
FIG. 14. Model for CO binding to CooA, involving Fe–Pro dissociation and CO binding to pentacoordinate intermediates,successive addition to the dimer subunits, and the interconversion of open and closed forms of CooA2(CO)2. The 5c forms (brackets)are low population, transient species in mixing experiments. Cooperative binding of CO results from a large decrease in the Pro association rateconstant after one CO has bound. The Pro dissociation rate also decreases at Step 2, resulting in a biphasic time course for CO binding toCooA2(Pro)2. Slowly interconverting open and closed forms of CooA2(CO)2 account for a biphasic time course for CO dissociation.
Dynamics of Carbon Monoxide Binding to CooA 21105
by guest on June 24, 2016http://w
ww
.jbc.org/D
ownloaded from
to and dissociation from CooA dimers. They also can describemicrosecond time courses for rebinding to the transient five-coordinate intermediates generated by laser photolysis. Thekey feature of the model is that the increase in CO affinity,which occurs after one ligand is bound, is caused by a decreasein the affinity and rate constants for Pro coordination to theremaining unliganded subunit.
The biphasic association kinetics could alternatively be ex-plained by two populations of slowly interconverting CooA con-formers, one with large CO and Pro binding rate constants, andone with significantly smaller parameters. Consecutive bindingand conformational heterogeneity cannot readily be distin-guished via kinetics alone. The equation to describe consecu-tive binding under pseudo first order conditions is,
�1 Y�t �2k2 k1
2�k2 k1�exp� k1t� �
k1
2�k1 k2�exp� k2t� (Eq. 8)
where (1 � Y)t is the fraction of unreacted CooA remaining attime, t, and k1 and k2 are the rate constants for the twosuccessive CO binding steps. If the absorption change is as-sumed to be the same for each binding step, Equation 8 predictsthat the amplitudes of the fast and slow phases should be �40and �60%, respectively, which is consistent with what is ob-served by simple two-exponential analysis (55–60% slowphase, Fig. 5). The dependences of k1 and k2 on [CO] are still
hyperbolic and represented by Equation 4, because each CObinding step requires the initial dissociation of Pro-2, regard-less of mechanism. The dashed lines in Fig. 6 calculated usingthe model parameters in Table I provide satisfactory fits to theobserved data, except at the lowest [CO] values for the slowerphase, where the fitted rate parameters are the least reliable.
Thus, the two-step, consecutive binding and conformationalheterogeneity models are both consistent with the observedkinetic data. However, an interpretation based entirely on con-formational heterogeneity cannot explain the cooperativity ob-served for equilibrium CO binding. Thus we feel that the modelpresented in Fig. 14 and Table I provides the best description ofthe functional behavior of CooA dimers.
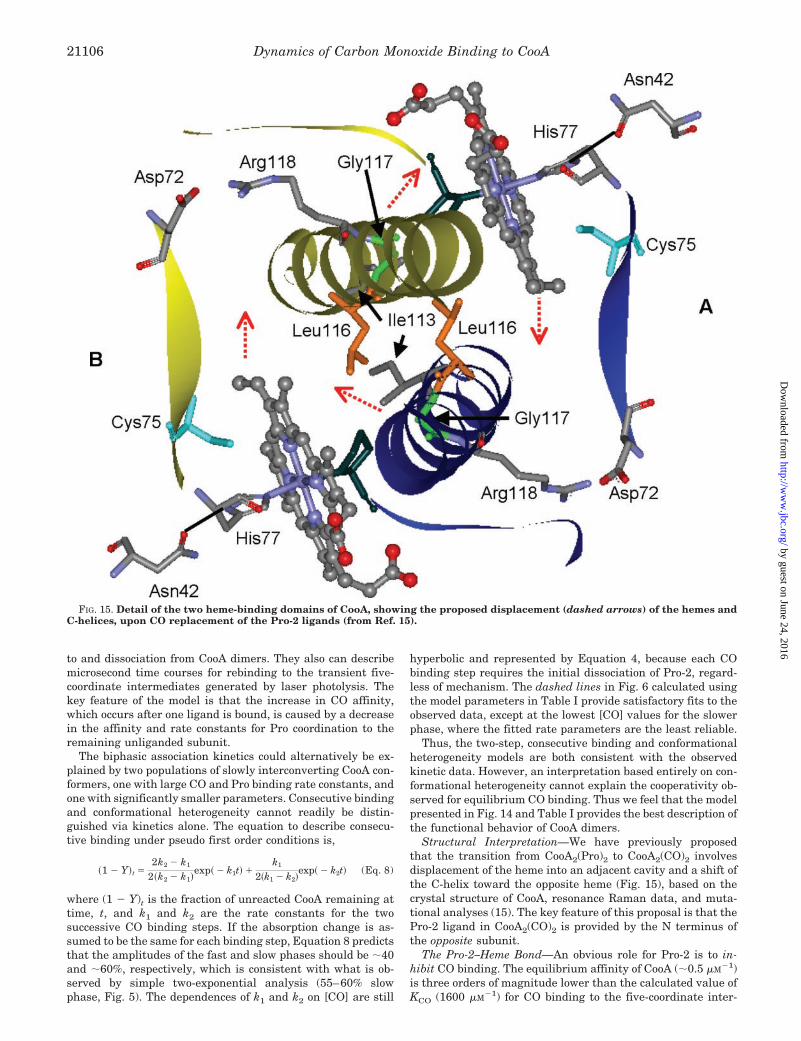
Structural Interpretation—We have previously proposedthat the transition from CooA2(Pro)2 to CooA2(CO)2 involvesdisplacement of the heme into an adjacent cavity and a shift ofthe C-helix toward the opposite heme (Fig. 15), based on thecrystal structure of CooA, resonance Raman data, and muta-tional analyses (15). The key feature of this proposal is that thePro-2 ligand in CooA2(CO)2 is provided by the N terminus ofthe opposite subunit.
The Pro-2–Heme Bond—An obvious role for Pro-2 is to in-hibit CO binding. The equilibrium affinity of CooA (�0.5 �M�1)is three orders of magnitude lower than the calculated value ofKCO (1600 �M�1) for CO binding to the five-coordinate inter-
FIG. 15. Detail of the two heme-binding domains of CooA, showing the proposed displacement (dashed arrows) of the hemes andC-helices, upon CO replacement of the Pro-2 ligands (from Ref. 15).
Dynamics of Carbon Monoxide Binding to CooA21106
by guest on June 24, 2016http://w
ww
.jbc.org/D
ownloaded from
mediate, reflecting the energetic cost of displacing the endoge-nous Pro-2 ligand.
In addition, the interlocking arrangement of the two Pro-2ligands provides a natural explanation of cooperativity, whichresults from a lowering of the Pro-2 binding affinity after oneCO molecule is bound. The equilibrium constant for Pro-2binding drops from 20,000 in CooA2(Pro)2 to 1,200 inCooA2(Pro)(CO). It is reasonable to assume that the heme andC-helix displacement that is initiated by dissociation of the firstPro-2 ligand makes it easier to dissociate the second one, be-cause the second Pro-2 is attached to the subunit containingthe displaced, heme-bound CO (Figs. 1 and 15). The loweredPro-2 affinity in CooA2(Pro)(CO) results from a large reductionin the Pro-2 association rate constant, from 4,000 to 84 s�1,which overcomes a smaller decrease in the Pro-2 dissociationrate constant, from 0.2 to 0.07 s�1. This lowering of kPro sug-gests that CO binding to the first subunit causes the Pro-2 Nterminus to move farther from its heme target in the secondunliganded subunit, thereby slowing its reassociation. Thisdisplacement would be a natural result of protein rearrange-ment induced by the inward movement of the first heme group(Fig. 15).
The rate of Pro-2 dissociation is a measure of the strength ofits coordination to the heme iron. Therefore, a decrease in k�Pro
implies strengthening of the Fe–Pro bond after the first CO isbound, despite the lowered affinity, which results from thegreater reduction in kPro. The Fe–Pro bond in CooA2(Pro)2 maybe strained because of the interlocking subunits, and thisstrain would be released when the first Pro-2 is displaced. Thisinterpretation is supported by the kinetic data for the �P3R4CooA mutant. Although the first CO binding step is acceleratedby shortening the N-terminal tail of the protein, the secondstep is nearly as slow as in the wild-type protein. This resultindicates that the truncated N terminus can form a strongFe–Pro bond in the CooA2(Pro)(CO) intermediate, after thefirst Pro-2 ligand is displaced.
Open and Closed Forms—The heme and C-helix displace-ments that occur upon CO binding must initiate the reposition-ing of the DNA-binding domains (Fig. 1). The presence of openand closed forms of CooA2(CO)2, defined by the kinetics of COdissociation, implies the presence of slowly interconverting con-formations when both subunits are fully bound by CO. Theopen form may represent protein molecules in which the con-formational changes required for DNA binding are not com-plete, despite the proper CO-induced heme displacement. Al-though resonance Raman spectroscopy reveals a minoritypopulation of CooA2(CO)2 with characteristics suggesting un-displaced hemes, this population appears to be quite small (15).In addition preliminary experiments with mutational variantsof CooA reveal no correlation between the undisplacedheme-CO population and the kinetically determined open/closed fraction.2 Thus closed and open populations cannot bedistinguished by the resonance Raman spectrum of the hemegroup or by its absorption spectrum.
We propose that the activation of CooA by CO occurs in twostages: 1) concerted heme displacements as diagrammed in Fig.15 and 2) longer range movements of the C-helices that bringthe DNA-binding domains into proper alignment for transcrip-tional regulation. The second stage is suggested to correspondto the open-closed conversion. The protein motions in the sec-ond stage are far enough from the CO binding site so that theyare not sensed by changes in heme spectral properties. How-
ever, this conformational change is proposed to decrease therate of CO dissociation, presumably by causing tighter packingaround the distal heme pocket.
This interpretation implies that only the closed form ofCooA2(CO)2 can bind its target DNA. Because the closed andopen populations appear to be equal, it would appear that onlyhalf the CooA2(CO)2 molecules are competent to bind to DNArapidly and activate the coo genes, but would still be sufficientto saturate the two coo promoters.
Physiological Implications—Because the sensitivity of CooAto CO is lowered �1000-fold by Pro-2 ligation, CooA activationwill not occur until the CO concentration reaches micromolarlevels. This desensitization may be physiologically important,because CooA activation induces synthesis of a suite of CO-metabolizing proteins, at significant energy cost to the orga-nism. Responding to trace levels of CO in the environmentwould be wasteful. At the same time, positive equilibriumcooperativity ensures an efficient response over a narrow rangeof CO concentrations once micromolar levels have beenreached.
The slow rate of CO binding and the slow interconversionbetween the open and closed forms of CooA2(CO)2 may also bebeneficial for dampening the effects of transient fluctuations inCO levels. Premature CooA activation is prevented by the slowrate of Pro dissociation, and, at the same time, deactivation ofDNA-bound CooA2(CO)2 also occurs slowly, on the time scale ofminutes (t1⁄2 500 s), due to the low rate of CO dissociationfrom the closed form. Thus, the slow rates of Pro dissociation,and of the closed-to-open interconversion, act as noise filters toavoid wasteful biochemical responses to rapid fluctuations inthe ambient CO levels.
Acknowledgments—We thank Dr. Alex Pevsner for carrying out aprincipal component analysis on the stopped-flow data and Jose Seratefor excellent technical assistance.
REFERENCES
1. Kerby, R. L., Hong, S. S., Ensign, S. A., Coppoc, L. J., Ludden, P. W., andRoberts, G. P. (1992) J. Bacteriol. 174, 5284–5294
2. Kerby, R. L., Ludden, P. W., and Roberts, G. P. (1995) J. Bacteriol. 177,2241–2244
3. Aono, S. (2003) Acc. Chem. Res. 36, 825–8314. Shelver, D., Kerby, R. L., He, Y. P., and Roberts, G. P. (1997) Proc. Natl. Acad.
Sci. U. S. A. 94, 11216–112205. He, Y. P., Shelver, D., Kerby, R. L., and Roberts, G. P. (1996) J. Biol. Chem.
271, 120–1236. Lanzilotta, W. N., Schuller, D. J., Thorsteinsson, M. V., Kerby, R. L., Roberts,
G. P., and Poulos, T. L. (2000) Nat. Struct. Biol. 7, 876–8807. Reynolds, M. F., Parks, R. B., Burstyn, J. N., Shelver, D., Thorsteinsson, M. V.,
Kerby, R. L., Roberts, G. P., Vogel, K. M., and Spiro, T. G. (2000) Biochem-istry 39, 388–396
8. Schultz, S. C., Shields, G. C., and Steitz, T. A. (1991) Science 253, 1001–10079. Aono, S., Ohkubo, K., Matsuo, T., and Nakajima, H. (1998) J. Biol. Chem. 273,
25757–2576410. Yamamoto, K., Ishikawa, H., Takahashi, S., Ishimori, K., Morishima, I.,
Nakajima, H., and Aono, S. (2001) J. Biol. Chem. 276, 11473–1147611. Kerby, R. L., Youn, H., Thorsteinsson, M. V., and Roberts, G. P. (2003) J. Mol.
Biol. 325, 809–82312. Uchida, T., Ishikawa, H., Ishimori, K., Morishima, I., Nakajima, H., Aono, S.,
Mizutani, Y., and Kitagawa, T. (2000) Biochemistry 39, 12747–1275213. Rubtsov, I. V., Zhang, T. Q., Nakajima, H., Aono, S., Rubtsov, G. I., Kumazaki,
S., and Yoshihara, K. (2001) J. Am. Chem. Soc. 123, 10056–1006214. Kumazaki, S., Nakajima, H., Sakaguchi, T., Nakagawa, E., Shinohara, H.,
Yoshihara, K., and Aono, S. (2000) J. Biol. Chem. 275, 38378–3838315. Coyle, C. M., Puranik, M., Youn, H., Nielsen, S. B., Williams, R. D., Roberts,
G. P., and Spiro, T. G. (2003) J. Biol. Chem. 278, 35384–3539316. Shelver, D., Thorsteinsson, M. V., Kerby, R. L., Chung, S. Y., Roberts, G. P.,
Reynolds, M. F., Parks, R. B., and Burstyn, J. N. (1999) Biochemistry 38,2669–2678
17. Moffet, D. A., Case, M. A., House, J. C., Vogel, K., Williams, R. D., Spiro, T. G.,McLendon, G. L., and Hecht, M. H. (2001) J. Am. Chem. Soc. 123,2109–2115
18. Hofrichter, J., Ansari, A., Jones, C. M., Duetsch, R. M., Sommer, J. H., andHenry, E. R. (1994) Hemoglobins 232, 387–415
19. Hargrove, M. S. (2000) Biophys. J. 79, 2733–273820. Gibson, Q. H., Olson, J. S., Mckinnie, R. E., and Rohlfs, R. J. (1986) J. Biol.
Chem. 261, 228–23921. Zhao, X. J., Chen, R. P., Tengroth, C., and Spiro, T. G. (1999) Appl. Spectrosc.
53, 1200–120522. Zhao, X. J., Balakrishnan, G., Moore, E. G., and Spiro, T. G. (2000) J. Raman
2 M. Puranik, S. B. Nielsen, H. Youn, A. N. Hvitved, J. L. Bourassa,M. A. Case, C. Tengroth, G. Balakrishnan, M. V. Thorsteinsson, J. T.Groves, G. L. McLendon, G. P. Roberts, J. S. Olson, and T. G. Spiro,unpublished results.
Dynamics of Carbon Monoxide Binding to CooA 21107
by guest on June 24, 2016http://w
ww
.jbc.org/D
ownloaded from
Spectrosc. 31, 349–35223. Youn, H., Kerby, R. L., and Roberts, G. P. (2003) J. Biol. Chem. 278, 2333–234024. Hargrove, M. S., Brucker, E. A., Stec, B., Sarath, G., Arrendondo-Peter, R.,
Klucas, R. V., Olson, J. S., and Phillips, G. N., Jr. (2000) Structure 8, 25–2725. Arrendondo-Peter, R., Hargrove, M. S., Sarath, G., Moran, J. F., Lohrman, J.,
Olson, J. S., and Klucas, R. V. (1997) Plant Physiol. 115, 1259–1266
26. Spiro, T. G., and Li, X. Y. (1988) in Biological Applications of Raman Spec-troscopy (Spiro, T. G., ed) Vol. 3, pp. 1–38, John Wiley and Sons, New York
27. Vogel, K. M., Spiro, T. G., Shelver, D., Thorsteinsson, M. V., and Roberts, G. P.(1999) Biochemistry 38, 2679–2687
28. Springer, B. A., Sligar, S. G., Olson, J. S., and Phillips, G. N. (1994) Chem. Rev.94, 699–714
Dynamics of Carbon Monoxide Binding to CooA21108
by guest on June 24, 2016http://w
ww
.jbc.org/D
ownloaded from
Thomas G. SpiroThorsteinsson, John T. Groves, George L. McLendon, Gary P. Roberts, John S. Olson and
Bourassa, Martin A. Case, Charbel Tengroth, Gurusamy Balakrishnan, Marc V. Mrinalini Puranik, Steen Brøndsted Nielsen, Hwan Youn, Angela N. Hvitved, James L.
Dynamics of Carbon Monoxide Binding to CooA
doi: 10.1074/jbc.M400613200 originally published online February 27, 20042004, 279:21096-21108.J. Biol. Chem.
10.1074/jbc.M400613200Access the most updated version of this article at doi:
Alerts:
When a correction for this article is posted•
When this article is cited•
to choose from all of JBC's e-mail alertsClick here
http://www.jbc.org/content/279/20/21096.full.html#ref-list-1
This article cites 27 references, 11 of which can be accessed free at
by guest on June 24, 2016http://w
ww
.jbc.org/D
ownloaded from