Embed Size (px)
Citation preview
Published OnlineFirst October 11, 2013.Cancer Res Barbara Wegiel, David Gallo, Eva Csizmadia, et al. Tumor GrowthCarbon Monoxide Expedites Metabolic Exhaustion to Inhibit
Updated version
10.1158/0008-5472.CAN-13-1075doi:
Access the most recent version of this article at:
Material
Supplementary
http://cancerres.aacrjournals.org/content/suppl/2013/10/11/0008-5472.CAN-13-1075.DC1.html
Access the most recent supplemental material at:
Manuscript
Authoredited. Author manuscripts have been peer reviewed and accepted for publication but have not yet been
E-mail alerts related to this article or journal.Sign up to receive free email-alerts
Subscriptions
Reprints and
To order reprints of this article or to subscribe to the journal, contact the AACR Publications
Permissions
To request permission to re-use all or part of this article, contact the AACR Publications
Research. on October 17, 2013. © 2013 American Association for Cancercancerres.aacrjournals.org Downloaded from
Author manuscripts have been peer reviewed and accepted for publication but have not yet been edited. Author Manuscript Published OnlineFirst on October 11, 2013; DOI: 10.1158/0008-5472.CAN-13-1075

1
Carbon Monoxide Expedites Metabolic Exhaustion to Inhibit Tumor Growth
Barbara Wegiel1*, David Gallo1, Eva Csizmadia1, Clair Harris1, John Belcher6,
Gregory M. Vercellotti6, Nuno Penacho7, Pankaj Seth2,
Vikas Sukhatme2, Asif Ahmed4, Pier Paolo Pandolfi2, Leszek Helczynski3,
Anders Bjartell3, Jenny Liao Persson3, Leo E Otterbein1*
1Department of Surgery, Transplant Institute and 2Department of Medicine Beth Israel
Deaconess Medical Center, Harvard Medical School, Boston, MA 02215, 3Department of
Clinical Sciences, Section of Urological Cancers, 4School of Life and Health Sciences,
Aston University, Aston Triangle, Birmingham, UK and 5Department of Laboratory
Medicine, University Hospital Malmö, Lund University, Malmo, Sweden; 6Department
of Medicine and Vascular Biology Center, University of Minnesota, Minneapolis,
Alfama Inc, Oeiras, Portugal
All authors declare no conflict of interest. *To Whom Correspondence Should be Sent:
Leo E. Otterbein, PhD Associate Professor Harvard Medical School Beth Israel Deaconess Medical Center Transplant Institute 3 Blackfan Circle, EC/CLS 603 Boston, MA 02215 Phone: 617-735-2851 Email: [email protected] Or Barbara Wegiel, PhD Assistant Professor Beth Israel Deaconess Medical Center Department of Surgery Harvard Medical School 3 Blackfan Circle EC/CLS 601 02215 MA, Boston phone: 617-735-2846 email: [email protected]

2
Abstract
One classical feature of cancer cells is their metabolic acquisition of a highly glycolytic
phenotype. Carbon monoxide (CO), one of the products of the cytoprotective molecule heme
oxygenase-1 (HO-1) in cancer cells, has been implicated in carcinogenesis and therapeutic
resistance. However, the functional contributions of CO and HO-1 to these processes are poorly
defined. In human prostate cancers, we found that HO-1 was nuclear localized in malignant
cells, with low enzymatic activity in moderately differentiated tumors correlating with relatively
worse clinical outcomes. Exposure to CO sensitized prostate cancer cells but not normal cells to
chemotherapy, with growth arrest and apoptosis induced in vivo in part through mitotic
catastrophe. CO targeted mitochondria activity in cancer cells as evidenced by higher oxygen
consumption, free radical generation and mitochondrial collapse. Collectively, our findings
indicated that CO transiently induces an anti-Warburg effect by rapidly fueling cancer cell
bioenergetics, ultimately resulting in metabolic exhaustion.

3
Introduction
Epithelial cancers, including prostate, breast and lung cancer are still leading causes of
deaths in the US and treatment for advanced disease is limited(1). A standard of first-line care
for advanced and metastatic cancers remains chemotherapy such as taxols, doxorubicin and
cisplatin (2). Rapid proliferation of primary tumor and cancer cell survival during spread to
distant organs as well as resistance to treatment are possible in part due to the remarkable
metabolic adaptation known as the Warburg effect(3). The Warburg effect is characterized by
increased glucose uptake and elevated glycolysis with a limited oxygen consumption rate
(OCR) resulting in lactic acid fermentation(4). High rates of energy consuming processes
including protein, DNA and fatty acid synthesis in cancer cells is often accompanied by an
increased oxidative state of dysfunctional mitochondria(5). The promotion of tumor growth
requires in part, a selection of cancer cells with repressed mitochondrial activity and
biogenesis(6). Defects in mitochondrial ROS metabolism from electron transport chains in
cancer cells have been linked directly to increased cancer cell glucose metabolism. The free
radical theory of cancer implicates ROS as a principal cause of early mutations as well as being
involved in the response to treatment(7-11).
Heme oxygenases (HO) which degrade heme to biliverdin, carbon monoxide (CO) and
iron are critical modulators of metabolism and mitochondrial activity. ,, Expression of HO-1,
the stress inducible isoform, is strictly regulated while HO-2 is ubiquitously expressed primarily
in brain and testes. Their functional role in cancer has not been clearly elucidated and remains
controversial. HO-1 can impart potent anti-proliferative and proapoptotic effects via antioxidant
mechanisms as demonstrated in breast and lung cancer cell lines.(12, 13) Better survival rates
were observed in colorectal cancer patients where HO-1 expression correlated with lower rates

4
of lymphatic tumor invasion. In contrast, overexpression of HO-1 has been shown to accelerate
pancreatic cancer aggressiveness by increasing tumor growth, angiogenesis and metastasis(14).
Similar effects were observed in melanoma(15), gastric(16) and renal cancers(17). In prostate
cancer patients, HO-1 is localized in the nucleus and correlated with cancer progression(18).
Nuclear HO-1 was also detected in head and neck squamous carcinomas and associated with
tumor progression(19). Recently, nuclear HO-1 has been linked to resistance to Imatinib in
chronic myeloid leukemia(20). Further evidence for HO-1 in cancer incidence presides in the
identification of a GT length polymorphism of the HO-1 promoter that is highly correlative with
cancer severity(21). Individuals with long GT repeats in the HO-1 promoter and associated low
expression of HO-1 showed a higher frequency of gastric or lung adenocarcinoma and oral
squamous cancer versus those with short GT repeats and higher HO-1 expression(22). CO,
biliverdin, bilirubin as well as iron and ferritin serve as potential modulators of tumorigenesis
however all have been minimally studied in cancer(23),.
In the present studies, we first performed a detailed analysis of a large cohort of prostate
cancer patients and confirmed HO-1 nuclear localization in moderately advanced tumors where
it is enzymatically inactive and therefore may be a critical regulator of cancer progression. We
tested the hypothesis that HO-1, through its ability to generate CO, modulates cancer cell
growth in vitro and in vivo using human and murine prostate and lung cancer models.
Paradoxically, CO rapidly enhanced mitochondria activity of cancer cells that results in
metabolic exhaustion and cellular collapse causing tumor regression. Further, CO increased
cancer cell sensitivity to chemotherapeutics one thousand fold while simultaneously protecting
normal cell growth and viability.

5
Materials and Methods
PCa samples & Tissue microarray
Benign and malignant samples of 482 patients undergoing radical prostatectomy for localized
PCa were subjected in duplicate to tissue microarray (TMA) constructs of 1.0 mm in diameter
and scored for immunohistochemical staining intensity as previously described (24). The
majority of samples were successfully prepared (~95%) and Gleason grades were evaluated by a
national board-certified pathologist (L. Helczynski) in the prostate cancer specimens from 351
before preparation of TMA. The group of samples consisted of 246 samples with Gleason grade
3 and 105 samples with Gleason grade 4-5. The study was approved by the Ethics committee,
Lund University and the Helsinki Declaration of Human Rights was strictly observed.
Immunohistochemistry
Immunohistochemical staining of paraffin embedded sections from human TMA blocks was
performed as previously described(25). Mouse antibody against HO-1 (Stressgen, #OSA-110)
was used at 1:200 dilution. Secondary antibody was used as a negative control.
Immunohistochemistry, immunofluorescence and immunostaining on the cell lines and mouse
tumor samples were performed as previously described37. Briefly, formalin-fixed or Zn-fixed
paraffin embedded tumor tissues were processed for antigen retrieval with high pressure-
cooking in citrate buffer for 1 hour. Tissues sections were then blocked with 7% horse serum for
30 min, followed by incubation with primary antibody overnight. Biotin-labeled secondary
antibody (Vector Laboratories) was applied for 1h at RT followed by Vectastain Elite ABC Kit
and detection with ImmPact DAB (Vector Laboratories). Immunofluorescence staining was
performed on frozen tumor sections or cultured cells on glass cover slips. Tissues or cells were
fixed with 2% paraformaldehyde for 10 min followed by permeabilization with 0.05% Triton X-

6
100. After blocking with 7% horse serum, sections were probed with primary antibody and
secondary fluorescently labeled antibody (Molecular Probes). Hoechst-33258 (Molecular
Probes, Invitrogen) was used to stain the nuclei.
The following antibodies were applied: polyclonal rabbit anti-HO-1 (Stressgen) was
used at 1:1000. Prohibitin antibody was purchased from Epitomics Inc. (Burlingame, CA).
Cytochrome C antibody was obtained from Cell Signaling (Beverly, MA). mtTFA and vimentin
antibodies were purchased from Santa Cruz Biotechnology. Anti-mouse Ki67 antibody was
from Dako. Anti-mouse Thy-1, CD31, antibody was from BD Biosciences, Pharmingen and
anti-P (Ser10)-Histone H3 were from Cell Signaling. TUNEL staining was performed using
ApopTag Peroxidase in situ apoptosis detection Kit (Chemicon, Millipore, Billerica, MA)
following manufacturer’s protocol.
Animal tumor models
The tumor models were approved by the BIDMC IACUC. Nu/nu mice were purchased from
Taconic (Hudson, NY) at 7 weeks of age. Mice were provided food and water ad libitum as
needed. After 1-week acclimatization, 1x10⁶ PC3 cells were injected into the right flank of
mice. Tumors were established for 2 weeks at which point treatment with CO±doxorubicin was
begun. Mice were exposed to CO (250ppm, 1 hr/day) as previously described (26). Doxorubicin
(8 mg/kg) was given i.v. twice per week just prior to CO/Air exposure. Tumor volume (0.52 x
width x length) was measured and calculated every day for 14 days. After 14 days, mice were
sacrificed and tumors were harvested. In the orthotopic model of PC3 xenografts, 1x10⁶ PC3
cells were injected to the right lobe of prostate under anesthesia. Tumors (n=4 per group) were
established for 2 weeks followed by CO /Air treatment for 4 weeks. CO was administrated

7
every day for 1h at 250ppm. TRAMP mice (Jackson Laboratories) were treated with CO (250
ppm/day, 5 days/week) starting at 5 weeks of age. Treatment was continued for 20 weeks.
Tumors were harvested and process for immunohistochemical analysis thereafter. Kras4bG12D
transgenic mice were kindly provided by Dr. Varmus and were on doxycycline chow at 5 weeks
of age and CO was started after 8 weeks of doxycyline treatment. CO (250 ppm, 5 days/week)
was continued for 5 weeks and the lung were harvested for histology.
Cell culture and treatment
The human prostatic cell line, PC3, human breast cancer cells (MDA-468 and T47D),
hepatocarcinoma (HepG2), cervical cancer cells (HeLA), skin fibroblasts (NIH3T3) and lung
adenocarcinoma cell line (A549) were purchased from American Type Culture Collection
(ATCC, Manassas VA) or provided by Dr. Balk and Dr. Chen (BIDMC) and were cultured in
RPMI or DMEM medium supplemented with 10% FBS and antibiotics. Human bronchial
epithelial cells were purchased from AATC and cultured following manufacturer’s protocol.
PNT1A were kindly gifted by Dr. Nishtman Dizeyi (Lund University, Malmo, Sweden) and
were cultured in RPMI medium supplemented with 10% FBS and antibiotics. A549 rho(o) cells
that are deprived of mitochondria were generated after 3 weeks of culture in medium containing
ethidium bromide (20 μg/ml). Mouse embryonic fibroblasts from p53+/+ and p53-/- mice were
kindly gifted by Dr. Tyler Jacks (MIT, Boston) and were cultured in DMEM medium with 10%
FBS and antibiotics. Cells were treated with camptothecin (0.001μg/ml-10 μg /ml, Sigma) or
doxorubicin (10 μg/ml, Sigma) and vehicle control (DMSO) for 1-24 hours. Co-treatment with
CO (250 ppm) was performed as previously described (26). Pegylated catalase (3000 U/ml) and
SOD (10 U/ml) were from Sigma and were used 1h prior to CO treatment.

8
Transient transfection
PC3 cells were transfected using Amaxa nucleofection or Lipofectamine 2000 as
previously described (24). pCMV control vector or human HO-1 cDNA encoding vector were
used for transfection. Transfection efficiency was between 40-50% as estimated with
overexpression of GFP by fluorescence microscopy.
Comet assay
PC3 cells were treated with CO or Air for 24h and harvested for COMET SCGE Assay
(Assay Designs). The manufacturer’s protocol was followed. Cells were viewed by Zeiss
Axiovert Apotome Fluorescent microscope at 40x. At least 100 cells were counted and the
amount of comets was calculated and expressed per 100 cells.
Immunoblotting
Cells were lysed by brief sonication in ice-cold lysis buffer (150mM NaCl, 50mM Tris-
HCl pH 7.5, 1% NP-40, 10 mM NaF, 1% SDS, 1 mM EDTA pH 8.0, 10 mM
phenylmethylsulfonyl fluoride (PMSF) and the protease inhibitor cocktail Complete Mini
(Roche). Samples were centrifuged for 20 min 14000xg at 4 °C and clear supernatants were
collected. Protein concentrations were measured using a BCA Protein Assay Kit (Pierce,
Rockford, IL). 20-30 μg of each protein sample were electrophoresed on a NuPAGE 4-12% Bis-
Tris Gel (Invitrogen) in NuPAGE MES SDS Running Buffer (Invitrogen) followed by transfer
to PVDF membrane (Ready Gel Blotting Sandwiches; BioRad). The membranes were blocked
with 5% non-fat dry milk, probed with appropriate primary antibodies at concentration of
1:1000 followed by horseradish peroxidase (HRP)-conjugated secondary antibodies at a dilution
of 1:5000 and visualized using Super Signal West Pico chemiluminescent substrate (Pierce) or
Femto Maximum Sensitivity substrate (Pierce), followed by exposure to the autoradiography
9
film (ISC BioExpress). The following antibodies were applied: rabbit anti-Caspase-3, rabbit
anti-cleaved caspase-3 (Cell Signaling Technologies), goat anti-Gadd45 (Santa Cruz
Biotechnology), rabbit anti-heme oxygenase-1 (RDI-Fitzgerald Industries Int), mouse anti-β-
actin (Sigma-Aldrich), mouse anti-GAPDH (Calbiochem), rabbit anti-cyclin A2 (Santa Cruz
Biotechnology).
HO-1 activity and CO levels in the tissues
PC3 cells were treated with 10 μg/ml doxorubicin or camptothecin for 4 hours and
nuclear/cytoplasmic fractions were isolated. HO-1 activity was measured as previously
described (27). We assume that only HO-1 was contributing to the changes in HO activity assay
as HO-2 remained unchanged in response to doxorubicin and camptothecin treatment for 4
hours (data not shown). Measurements of CO concentrations were performed on tissue sections
as described by Verma et al.(28). Tumor and normal tissues were harvested immediately after
the last exposure of mice to CO and tissues were processed for gas chromatography as
described. Briefly, CO was liberated as a gas in a sealed glass vial by adding 25�l of water and
5 �l of sulfosalicylic acid (SSA; 30% [wt/vol]) to 30 �l of diluted tissue homogenate. The vials
were incubated on ice for 10 min before being analyzed. The gas in the headspace of the vials
was then analyzed quantitatively with a gas chromatograph (GC) equipped with a reducing-
compound photometry (RCP) detector (Peak Laboratories, Mountain View, CA), which allowed
the CO in gas to be quantified to concentrations as low as 1 to 2 parts per billion (ppb). The
amount of CO was then calculated using a calibration curve prepared from CO standards.

10
RNA isolation and real time PCR
Total RNA was isolated from PC3 cells after treatment with 10 μg/ml camptothecin with
or without CO for 6 or 24 hours using RNeasy Kit (Qiagen, Inc). 2 μg of RNA was used for
cDNA synthesis (Invitrogen, Carlsbad, CA). The region of Gadd45α was amplified with
specific primers: F-5’ TGCTCAGCAAAGCCCTGAGT3’; R-
5’GCAGGCACAACACCACGTTA3’. The following primers to β-actin were used: F-
5’CGCGAGAGAAGATGACCCAGATC3’; R-5’TCACCGGAGTCCATCACGA3’. Real time
PCR reactions were performed using 1xSYBR Green PCR Master Mix (BioRad). Primers for
MMP2, urokinase plasminogen activator (uPA), VEGF were previously described (24).
Apoptosis, viability and clonogenic assays
PC3 cells were seeded at 1x10⁵ concentration in 6 well plates 24 hours before
experiment. Cells were treated with camptothecin (0.001-10 μg/ml) or doxorubicin (10 μg/ml)
with CO/Air for 24 hours. Cells were harvested and apoptosis rate was measured using Annexin
V-FITC staining according to the manufacturer’s protocol (BD Biosciences, San Jose, CA). To
test cell viability, PC3 cells were stained with Crystal Violet solution (Sigma-Aldrich) for 10
minutes, followed by extensive wash with double-distilled water. Cells were dried and dissolved
in 10% acetic acid, followed by measurement of absorbance at 560 nm on the ELISA reader.
Clonogenic assay: cells were treated in the presence or absence of CO ± chemotherapeutics as
above for 24h. After 24h cells were trypsinized and seeded as a subculture with dilution of 1:10-
1:100. Colony counts were performed 2 weeks after seeding.
Cell Fractionation
Nuclear and cytoplasmic fraction of PC3 cells were performed using the subcellular
fractionation Kit following the manufacturer’s protocol (Pierce, Rockford, IL) or BioVision

11
Nuclear/Cytoplasmic Kit extraction (BioVision). Briefly, cells were treated as described above,
washed twice with PBS and trypsinized. Pellets were collected and resuspended in ice-cold
Cytoplasmic Extraction Reagent (CERI) buffer and vortexed. Lysates were incubated on ice for
10 min and Cytoplasmic Extraction Reagent II (CERII) buffer was added and lysates were
incubated for additional 1min on ice. After vortexing, lysates were centrifuge at 16,000 x g and
supernatants were collected for the cytoplasmic fraction. Pellets were resuspended in ice-cold
Nuclear Extraction Reagent (NER) buffer and incubated on ice for 30 min. Nuclear and
cytoplasmic fractions were analyzed by immunoblotting as described above.
Mitochondrial activity and metabolic profiling
SPECT: We used technetium-99m methoxyisobutyl isonitrile (99mTc-sestamibi) single
photon emission computed tomography (SPECT) in PC3 cells treated with CO (250 ppm) or
CORM-A1 (20 or 100 μM) for 24 h in vitro. Technetium labeling was performed at BIDM
Imaging Facility and the radiation intensity was evaluated that corresponded to the
mitochondrial activity.
Seahorse Experiments
Cells were seeded in 24 well plate (3x10⁴) 24 h prior experiment and treated with CO
(250 ppm) or Air for 30 minutes or CO was bubbled into the medium and transferred to the
reader immediately prior measurment. Oxygen consumption rate (OCR) and extracellular
acidification rate (ECAR) were measured over time.
LDH and glucose measurments
PC3 cells were treated for 6 hours with CO (250 ppm) and harvested in the
manufacturer’s lysis buffers to measure glucose or lactate (Biovision, Glucose or Lactate Kits)
and process for colorimetric analysis of metabolites.

12
MitoTracker Red
CMCRos was purchased from Invitrogen, Molecular Probes and was used at 0.2 μM
concentration. Cells were treated for 3.5 hours with Doxorubicin (10 ng/ml) ± CO and
MitroTracker Red CMCRos was added for the last 30 min of treatment. Cells were washed and
fixed with 2% PFA followed by staining with Hoechst.
Statistical analyses
Statistical analyses were performed using SPSS version 13.0 (SPSS Inc., Chicago, IL).
The differences in the expression of different markers between benign and cancer specimens
were evaluated by paired Wilcoxon’s rank sum test or Kruskal-Wallis test. Distributions of
overall survival and disease-free survival were estimated by the method of Kaplan-Meier, with
95% confidence intervals. Differences between survival curves were calculated using the log-
rank test. Data are presented as the mean ±SD and are representative for at least three
independent experiments. Student T, ANOVA, Wilcoxon tests were used for estimation of
statistical significance for the experiments (p<0.05).

13
Results
Nuclear HO-1 with low activity in prostate cancer correlates with poorer prognosis.
HO-1 has been shown to be expressed and function in the nucleus as a regulator of
oxidative stress response transcription factor at the expense, however, of losing enzymatic
activity(29). Based on these data, we hypothesized that nuclear translocation of HO-1 influences
the response of cancer cells to therapy. We evaluated 482 tumor specimens from patients with
prostate cancer with corresponding benign tissues by tissue microarray to assess the correlation
between nuclear HO-1 expression and clinical tumor characteristics. The majority of benign
samples showed low overall expression of HO-1 (Fig 1A-B and Supplementary Fig1A). In
contrast, Gleason grade 3 specimens showed significantly higher expression of HO-1 in the
nucleus than that of corresponding benign tissue (Fig 1C-D, p=0.047*). The intensity of nuclear
HO-1 staining declined in Gleason grade 4-5 specimens as compare to Gleason grade 3, but did
not achieve statistical significance (Fig 1A-H). Finally, there was no significant difference in
cytoplasmic staining of HO-1 in prostate cancer versus adjacent benign samples (data not
shown). We reasoned that high nuclear HO-1 expression in moderately differentiated tumors
may correspond to the level of oxidative stress or hypoxia that drives progression of
differentiated tumors to more advanced disease.
We next evaluated the clinical significance of nuclear HO-1 expression by correlating
HO-1 staining with biochemical recurrence (BCR) of PCa as measured by prostate-specific
antigen in the circulation(30) as well as overall patient survival (Fig 1H). High nuclear HO-1
(arbitrary intensity= 3) expression in the cancer biopsies in comparison to low (arbitrary
intensity =1) nuclear HO-1 predicts a shorter time to BCR (Fig 1F, p=0.007*). After a 20-30
month follow-up period, a 20% greater number of patients with high nuclear HO-1 relapsed in

14
comparison to patients with low nuclear HO-1 (p=0.046) indicating a shorter time to recurrent
disease in PCa patients with a lack of enzymatically active nuclear HO-1.
HO-1 Activity and CO Influence the Cancer Cell Response to Genotoxins
Nuclear localized HO-1 is a hallmark of cancer progression in PCa(18). Comparing the
HO-1 localization profiles and activity of non-cancerous cells (epithelial cells and fibroblasts) to
cancerous cells (PC3, A549, HepG2, T47D, MDA-468, HeLa) we found that cancer cell lines
showed high nuclear expression and low cytoplasmic expression while non-cancerous cells
showed high cytosolic expression and low nuclear expression (Fig 2A-B). We show that when
HO-1 is localized to the nucleus it loses its activity in response to common chemotherapeutics
(Fig 2C and Lin, 2007). Based on nuclear localization of HO-1 with low activity(29), we next
asked whether HO-1 is important in mediating the effectiveness of chemotherapeutic treatment
in vitro. DNA damage causes mutations and carcinogenesis as well as induces cancer cell death.
HO-1 expression in normal cells is required for appropriate DNA repair in response to
chemotherapy or irradiation(31). Using camptothecin and doxorubicin to induce DNA damage,
we tested the role of HO-1 and CO on cancer and normal cell death. We observed significant
cell death with camptothecin or doxorubicin in vector control-treated PC3 cells as expected.
Overexpression of HO-1 induced further death of PC3 cells in response to camptothecin or
doxorubicin (Fig 2D). A similar effect was observed in cells after exposure to a low
concentration of CO (Fig 2 and Supplementary Fig 1B-C).(32) Dose escalation experiments to
induce cell death with camptothecin showed that in the presence of CO, the sensitivity of cells
to camptothecin increased synergistically to approximately 1000 fold over chemotherapy-alone-
treated cells (Fig 2E and Supplementary Figure 1B-C). The effect was specific to DNA

15
damage inducing agents as apoptotic responses induced by TNF and cyclohexamide were not
altered after CO treatment (data not shown). Further evidence of the effects of CO on PC3 cells
in the presence of camptothecin showed that compared to air controls, CO induced significantly
stronger cleavage of caspase 3, augmented DNA damage as measured by comet assay, and
induced Gadd45α expression, an important regulator of apoptosis and DNA repair that is
induced in response to chemotherapy (Supplementary Fig 1 D-F and Supplementary Fig 2).
Many reports detail the protective effects afforded by CO and HO-1 in response to
oxidative stress in primary cells (33-35), which is in contrast to the above effects in prostate
cancer cells. Treatment of normal prostate epithelial cells (PNT1A) with doxorubicin showed
that unlike prostate cancer cells, CO prevented doxorubicin-induced death of normal prostate
cells (Fig 2F and Supplementary Fig 1G) supporting the remarkable selectivity of HO-1 and
CO to enhance killing of tumor cells while protecting primary cells. We confirmed these
findings using primary mouse embryonic fibroblasts (MEF) treated with camptothecin or
doxorubicin at the highest doses used in cancer cells and evaluated the effects of CO. As
expected we observed 75-90% cell death in response to both chemotherapeutics in air-treated
cells. Similar to PNT1A, CO protected primary mouse embryonic fibroblasts (MEF) against
doxorubicin-induced cell death versus air-treated cells (Supplementary Fig 1H). The protection
of primary cells afforded by CO is independent of p53, a well-characterized modulator of cell
death in response to DNA damage. CO was also able to protect p53-/- MEF (Supplementary
Fig 1H).
Carbon monoxide inhibits growth of human prostate cancer xenografts.

16
We next evaluated the role of CO alone and CO in combination with doxorubicin on the
growth of tumors in vivo, employing PC3 human prostate cancer xenografts implanted
subcutaneously in nude mice. Mice with established tumors were exposed to a regimen of CO
(250 ppm for one hr once/day at the same time of day) ± doxorubicin (doxorubicin was injected
immediately after CO treatment) and growth was monitored over 2 weeks at which point
volumes of tumors were measured and harvested for histological analyses. Mice treated with
CO or doxorubicin alone showed significant tumor growth arrest versus controls as measured by
tumor volume and Ki67 expression and had no effect on body weight (Fig 3A and
Supplementary Fig 3A-B). Combination treatment with doxorubicin plus CO showed further
additive effects with regard to tumor size, proliferative index and neovascularization (Fig 3B-
F). We did, however, observe a significant effect of CO alone or in combination with
doxorubicin on cell death that was not observed with doxorubicin alone suggesting a distinct
cellular target for CO (Fig 3G-H). Mitotic catastrophe as assessed by occurrence of aberrant
nuclei after cell division was present among the P-Histone H3 positive cells in tumors treated
with CO or doxorubicin (insets in Fig 3E). Validation of the effects of CO with
immunostaining showed that CO inhibited the cell cycle marker cyclin A2 (densitometric
analyses: Air+Dox: 1.15±0.28, CO+Dox: 0.68±0.09, p<0.05; Supplementary Fig 4A-B). The
number of Thy positive fibroblasts was markedly decreased in animals receiving CO versus Air
treatment. It was not determined whether this was due to less infiltration or increased cell death
(Supplementary Fig 4C). Depletion of Thy-1 positive stromal cells may be an additional early
molecular target of CO leading to accelerated cell death and inhibition of angiogenesis. The
contribution of endothelial cell proliferation and recruitment of stroma cells in addition to tumor
cell growth needs to be further evaluated.
17
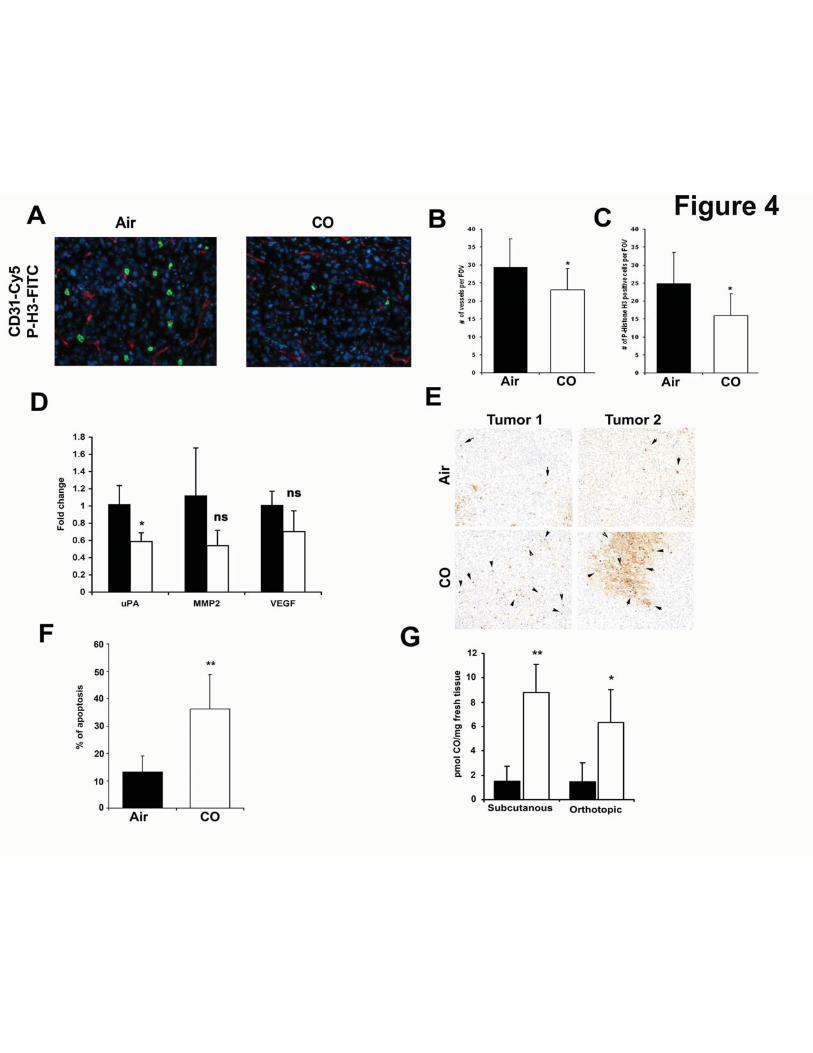
Carbon monoxide induces apoptosis and blocks mitosis and angiogenesis in a model of
orthotopic prostate cancer in mice.
In a more clinically relevant model of orthotopic PC3 prostate cancer tumors, CO
suppressed the mitotic index as measured by P-Histone H3 and CD31 staining in established
tumors (8% and 6% respectively, Fig 4A-C). Importantly, CO significantly suppressed a key
marker of invasion and early metastasis known as urokinase type plasminogen activator (uPA)
(Fig 4D). Further, CO showed the trend towards decreased expression of the tumor markers
MMP2 and VEGF, however it did not reach significance (Fig 4D). Similar to the subcutaneous
tumor xenograft model, CO induced greater cell death in orthotopic tumors as compared to
tumors from air-treated mice (Fig 4E-F; 35% in CO versus 15% in Air) suggesting that in
addition to arresting growth, CO reduced the invasive and aggressive phenotype with a
signature of mitochondrial collapse and tissue necrosis. This was different then that observed in
vitro where CO alone did not affect cancer cell death yet inhibited cell cycle. In both tumor
models, we observed a significant increase in the amount of CO present within the tumor tissue
as well as in the liver and lung of CO-exposed mice (Fig 4G and data not shown).
Carbon monoxide prevents development of PIN/carcinoma lesions in TRAMP mice and
inhibits lung carcinoma growth in Kras4bG12D transgenic mice
CO was tested in two additional models of spontaneously developed tumors using the
prostate tumor TRAMP and the lung tumor Kras mouse models(36, 37). We started CO
treatment in mice 8-20 weeks of age, which is after tumors are established(36, 37). Untreated
mice showed a high proliferative index as measured by Ki-67 staining in the tumors showing

18
multiple PIN foci and adenocarcinoma (Fig 5A-B). In contrast, CO-treated mice had fewer PIN
foci and significantly less Ki-67 positive cells and some of the CO-treated TRAMP mice were
completely lesion-free (Fig 5A-B). Importantly, during the progression of the disease and in
contrast to the normal prostate where HO-1 is localized to the cytoplasm, HO-1 was expressed
in the nucleus in the PIN lesions (Fig 5C). Staining for the mitochondrial stress response marker
mtTFA showed a significant increase in the number of mitochondria in the lesions of CO-
treated TRAMP mice as compared to the neoplastic lesions in Air-treated TRAMP mice at the
same age (Fig 5D).
A similar effect on tumor growth was observed in the Kras lung tumor model where we
observed a significant inhibition in both the frequency (average, n=24 in Air vs n=15 in CO) as
well as the size of the tumor nodules in the lung in animals treated with CO versus Air (Fig 5E).
Proliferation of tumors was also significantly inhibited as evidenced by decreased Ki67 staining
(Figure 5F). Longer treatment with CO resulted in further inhibition of tumor growth and size
of the nodules (data not shown).
Carbon monoxide targets mitochondria to induce death of cancer cells
We next explored potential molecular mechanisms by which CO exerted its effects using
prostate cancer cells as our model. Of note, HO-1 and CO have been shown to induce growth
arrest of human cancer cells(38) as well as murine AC29 mesothelioma cells (55% less cells at
day 2 and 80% at day 5 vs air controls) which support a more global effect of CO in different
type of cancer cells. Given that CO is known to target mitochondria, and the data presented in
Fig 3, we next assessed the activity and number of mitochondria in cancer cells in the presence
and absence of CO. CO increased oxygen consumption rate (OCR) within minutes after

19
exposure which was accompanied by reactive oxygen species (ROS) generation in PC3 cells
that correlated with decreased extracellular acidification rates (ECAR) and lactate levels (Fig
6A-E). Use of the mitochondrial complex I poison rotenone to compare CO to another
mitochondrial targeting compound and whether it would have similar effects in these cells as
CO, showed complete blockage of the OCR as was expected with rotenone and this effect
occurred in both cancer and non-cancer cells (Fig 6B). We also tested mitochondrial potential
using the JC-1 dye. As previously reported in other cell types(39) CO increased mitochondria
membrane potential in PC3 cells (Supplementary Fig 5). CO did inhibit OCR in normal cells,
again suggesting a selective difference in the response of cancer cells and normal PNT1A cells
to CO (Fig 6B). The activation of mitochondrial activity by CO is likely contributes to a less
cancerous phenotype. As the treatment time with CO was extended, PC3 cells showed clear G1
arrest (Fig 6F), which corresponded to significant inhibition of metabolic activity of cancer cells
as measured by SPECT (Fig 6G). Further, exposure to CO induced mitochondrial stress as
evidenced by increased mtTFA, cytochrome C positive staining and an inhibition in the
oxidized state of mitochondria (Fig 6H-K). Metabolic screening showed that exposure of PC3
cells to CO for 6h resulted in a decrease in glucose metabolism and influenced synthetic
pathways involved in nucleotide and amino acid synthesis all of which corroborate the effects of
CO on cancer cell growth (Table 1, Supplementary Table S1 and Supplementary Fig 6).
In efforts to further investigate the role of mitochondria in the effects observed with CO,
we depleted mitochondria from cancer cells (Rhoo cells), which resulted in epithelial to
mesenchymal transition as evident by the emergence of fibroblast-like shaped cells and
enhanced expression of vimentin in the Rhoo cells compared to control which was unaffected by
CO further suggestive of mitochondrial targeting by CO (Fig 6L). Rhoo cells are more prone to

20
doxorubicin-induced cell death then normal cells however CO did not amplify the effects of
doxorubicin in these cells in contrast to normal cells (% of surviving colonies: A549-
Air+Doxorubiicn: 29.8±1.2 %, CO+Doxorubicin: 13.4±0.7%, A549Rhoo. Air+Doxorubicin:
17.1±1%, CO+Doxorubicin: 17.6±0.39%). Based on changes in mitochondrial function
described above and the specifically the increase in ROS generation, we next depleted ROS
using a cocktail of pegylated catalase and superoxide dismutase. Addition of the antioxidant
cocktail prior to treatment with CO resulted in reversal of the effects of CO on doxorubicin-
induced apoptosis further supporting ROS and the mitochondria as the cellular target for CO
(Supplementary Figure 7).
Discussion
In the present study, we elucidate a role for carbon monoxide in modulation of prostate
and lung tumor growth and survival. CO not only mimics the effects of chemotherapy alone by
blocking proliferation, but also amplifies tumor cell death when treated in combination with
either doxorubicin or camptothecin. Further, we provide evidence that CO reduces the tumor
burden in xenograft and transgenic mouse models of prostate and lung cancers and effectively
blocks progression of neoplasia and adenocarcinoma. We deduce that CO effectively switches
the metabolic state of the cancer cell to fuel oxidative metabolism and decreases in nucleotide
and amino acid synthetic pathways. Collectively this causes cell cycle arrest and collapse under
intense mitochondrial-dependent oxidative stress. In vitro, this elicits a 1000 fold increase in
sensitivity to genotoxins fostered in part by a mitochondria-dependent increase in reactive
oxygen species (ROS) generation. In vivo, the role of CO and ROS on tumor growth is less clear
and likely involves other cellular mechanisms including hypoxia and perhaps a heightened

21
immune response. Importantly, CO protects normal cells from DNA damage by cytotoxic
agents in part by reducing oxygen consumption and eliciting a hibernation-like state that has
been observed in other cell types such as T cells and smooth muscle cells with the induction of
DNA repair complexes(40).
HO-1 is an accepted cytoprotective gene in most stress-related pathologies acting to
reestablish homeostasis(41, 42). Others and we have shown that nuclear localized HO-1 no
longer possesses enzymatic activity and as such becomes highly associated with cancer and
tumor growth(29, 43). We demonstrate that CO can mimic the effects of enzymatically active
HO-1 and that exposure to CO or reinstating HO-1 activity results in enhanced sensitization and
acceleration of apoptosis of cancer cells and tumors while protecting normal cells against
chemotherapeutic toxicity. This is consistent with prior observations that HO-1-derived CO is
important in DNA repair in normal cells(31). We posit that the subsequent decrease in
endogenous CO generation when HO-1 is in the nucleus results in accelerated DNA stress and
damage and thus serves as a hallmark of early carcinogenesis.
In our cohort of patients, nuclear HO-1 is increased in a subset of PCa patients with a
shorter time to BCR. We did not observe a significant association of HO-1 expression with
Gleason grades due to the relatively low number of cohort cases with the most advanced disease
(Gleason grade 5). We would anticipate however statistically significant correlations in a larger
cohort of patients as reported by Sacca et al. who showed a clear association between HO-1 and
prostate cancer incidence. Inhibition of HO-1 pharmacologically using zinc-protoporphyrin
(Zn-PP) induced apoptosis and suppressed growth of sarcomas in rats(44), but Zn-PP treatment
failed to potentiate the anti-tumor effects of 5-fluorouracil, cisplatin and doxorubicin in three
different tumor models(45). HO-1 overexpression or CO exposure reduced TPA-induced

22
invasion of breast cancer cells(13) as well as lung adenocarcinoma cells(38). The effects of HO-
1 on tumor growth and progression is complex and likely depends on cancer types, the cell cycle
status, the model system, as well as the methods of pharmacologic or genetic manipulation of
HO-1 activity.
In our model of human tumor xenografts in vivo, we observed strong inhibition of
angiogenic markers, mitosis and accelerated apoptosis in tumors treated with CO. Further, CO
sensitized cancer cells and solid tumors to apoptosis with apparent mitotic catastrophe likely
influenced by cellular exhaustion as evidenced by our biochemical data (Figure 6). The effects
of CO on mitochondria have been well described and we speculate that the high metabolic
requirements of cancer cells lends itself to greater effects of CO on survival given that CO is
known to target mitochondrial respiratory complexes(32). This is supported by the effects of CO
on mitochondrial membrane potential(46), biogenesis(35), and decreased prohibitin (data not
shown), which regulate cancer cell survival and growth. PC-3 xenografts are partially resistant
to doxorubicin induced apoptosis which delays tumor growth through mitotic blockade(47).
This effect was amplified by the presence of CO in vitro and in vivo. The increase in ROS by
CO in cancer cells, likely augments protein and mitochondrial DNA.(48). Indeed, inhibition of
HO-1 activity in prostate cancer cells correlated with a reduction in protein carbonylation and
reactive oxygen species formation(49).
The finding that CO protects normal cells from genotoxin toxicity offers an added
benefit and may permit chemosparing therapy thus decreasing negative side effects. We have
not tested the response to irradiation, however considering that CO protects normal cells against
cell death via amplification of DNA repair(31), we expect that CO may have similar sparing
effects on normal cells in response to irradiation while amplifying cancer cell death in response
23
to irradiation. CO-elicited protection of normal cells suggests that normal cells tolerate
alterations in metabolic demands more efficiently and are more capable of repairing damaged
DNA. The effect of CO to enhance killing is not specific to prostate cancer cells, as we observed
accelerated cell death of breast, lung and other prostate cancer cell lines treated with
doxorubicin and CO as well as dysregulated smooth muscle cells that lead to vascular stenosis
in models of angioplasty, transplantation and pulmonary hypertension. CO at these doses has
no untoward effects on the animals and in fact also protects against doxorubicin induced
cardiomyopathy(35).
In summary, we demonstrate that HO-1 expression in cancer specimens is targeted to the
nucleus in moderately differentiated tumor cells for reasons that remain to be elucidated.
Collectively, CO influences cellular bioenergetics that we find differs between cancer cells and
normal cells. CO accelerates oxidative metabolism and ROS generation, unlike in non-cancer
cells where CO inhibits respiration and protects against cell death. Insufficient respiration due
to dysfunctional mitochondria drives what is known as the Warburg effect. Exposure to CO
employs Warburg physiology as an advantage; compelling the cancer cell to consume more
oxygen that in turn drives metabolic demand leading to growth inhibition, cellular exhaustion
and death. These data provide the first evidence demonstrating the potential for safe, low
amounts of CO to be used as an adjuvant therapeutic option for the treatment of cancer. One
might envision a specific inhalational therapy regimen being implemented such as that used here
to treat cancer patients with inhaled CO using a specific metered dosing delivery device or a CO
releasing molecule (CO-RM) (50).

24
Acknowledgments
This work was supported by NIH grant HL-071797 & HL-076167 (LEO). BW is a recipient of
AHA (10SDG2640091) grant. We thank the Julie Henry Fund at the Transplant Center of the
BIDMC for their support and we declare that there is no conflict of interest in the work
presented. This study was partially funded by grants from the British Heart Foundation
(PG/06/114) and Medical Research Council (G0601295 and G0700288). We thank Dr. Nardella
for helpful discussions and for providing KRas and TRAMP mice. We thank Drs. Balk and
Chen for the PC3 cells, Dr. Dizeyi for PNT1A cells and Dr. Jacks for MEF cells. We also thank
the Swedish Cancer Society, The Swedish National Research Council, MAS Cancer
Foundation, Swedish Royal Physiographic Society in Lund, Gunnar Nilsson Cancer Foundation,
Crafoord Foundation and MAS Foundation (JLB and AB); The Foundation for Urology
Research in Malmö (AB). We are grateful to Elise Nilsson for the excellent technical skills.

25
References:
1. Jemal A, Siegel R, Ward E, Hao Y, Xu J, Thun MJ. Cancer statistics, 2009. CA Cancer J Clin. 2009;59:225-49. 2. Winquist E, Waldron T, Berry S, Ernst DS, Hotte S, Lukka H. Non-hormonal systemic therapy in men with hormone-refractory prostate cancer and metastases: a systematic review from the Cancer Care Ontario Program in Evidence-based Care's Genitourinary Cancer Disease Site Group. BMC Cancer. 2006;6:112. 3. Levine AJ, Puzio-Kuter AM. The control of the metabolic switch in cancers by oncogenes and tumor suppressor genes. Science. 2010;330:1340-4. 4. Warburg O. Iron, the Oxygen-Carrier of Respiration-Ferment. Science. 1925;61:575-82. 5. He Y, Wu J, Dressman DC, Iacobuzio-Donahue C, Markowitz SD, Velculescu VE, et al. Heteroplasmic mitochondrial DNA mutations in normal and tumour cells. Nature. 2010;464:610-4. 6. Sanchez-Arago M, Chamorro M, Cuezva JM. Selection of cancer cells with repressed mitochondria triggers colon cancer progression. Carcinogenesis. 2010;31:567-76. 7. Oberley LW, Buettner GR. Role of superoxide dismutase in cancer: a review. Cancer Res. 1979;39:1141-9. 8. Bize IB, Oberley LW, Morris HP. Superoxide dismutase and superoxide radical in Morris hepatomas. Cancer Res. 1980;40:3686-93. 9. Spitz DR, Sim JE, Ridnour LA, Galoforo SS, Lee YJ. Glucose deprivation-induced oxidative stress in human tumor cells. A fundamental defect in metabolism? Annals of the New York Academy of Sciences. 2000;899:349-62. 10. Ahmad IM, Aykin-Burns N, Sim JE, Walsh SA, Higashikubo R, Buettner GR, et al. Mitochondrial O2*- and H2O2 mediate glucose deprivation-induced stress in human cancer cells. J Biol Chem. 2005;280:4254-63. 11. Aykin-Burns N, Ahmad IM, Zhu Y, Oberley LW, Spitz DR. Increased levels of superoxide and H2O2 mediate the differential susceptibility of cancer cells versus normal cells to glucose deprivation. The Biochemical journal. 2009;418:29-37. 12. Hill M, Pereira V, Chauveau C, Zagani R, Remy S, Tesson L, et al. Heme oxygenase-1 inhibits rat and human breast cancer cell proliferation: mutual cross inhibition with indoleamine 2,3-dioxygenase. Faseb J. 2005;19:1957-68. 13. Lin CW, Shen SC, Hou WC, Yang LY, Chen YC. Heme oxygenase-1 inhibits breast cancer invasion via suppressing the expression of matrix metalloproteinase-9. Molecular cancer therapeutics. 2008;7:1195-206. 14. Sunamura M, Duda DG, Ghattas MH, Lozonschi L, Motoi F, Yamauchi J, et al. Heme oxygenase-1 accelerates tumor angiogenesis of human pancreatic cancer. Angiogenesis. 2003;6:15-24. 15. Was H, Cichon T, Smolarczyk R, Rudnicka D, Stopa M, Chevalier C, et al. Overexpression of heme oxygenase-1 in murine melanoma: increased proliferation and viability of tumor cells, decreased survival of mice. Am J Pathol. 2006;169:2181-98. 16. Yin Y, Liu Q, Wang B, Chen G, Xu L, Zhou H. Expression and function of heme oxygenase-1 in human gastric cancer. Exp Biol Med (Maywood). 2012;237:362-71. 17. Banerjee P, Basu A, Wegiel B, Otterbein LE, Mizumura K, Gasser M, et al. Heme Oxygenase-1 Promotes Survival of Renal Cancer Cells through Modulation of Apoptosis- and Autophagy-regulating Molecules. J Biol Chem. 2012;287:32113-23.

26
18. Sacca P, Meiss R, Casas G, Mazza O, Calvo JC, Navone N, et al. Nuclear translocation of haeme oxygenase-1 is associated to prostate cancer. British journal of cancer. 2007;97:1683-9. 19. Gandini NA, Fermento ME, Salomon DG, Blasco J, Patel V, Gutkind JS, et al. Nuclear localization of heme oxygenase-1 is associated with tumor progression of head and neck squamous cell carcinomas. Experimental and molecular pathology. 2012;93:237-45. 20. Tibullo D, Barbagallo I, Giallongo C, La Cava P, Parrinello N, Vanella L, et al. Nuclear translocation of heme oxygenase-1 confers resistance to Imatinib in chronic myeloid leukemia cells. Curr Pharm Des. 2012. 21. Kikuchi A, Yamaya M, Suzuki S, Yasuda H, Kubo H, Nakayama K, et al. Association of susceptibility to the development of lung adenocarcinoma with the heme oxygenase-1 gene promoter polymorphism. Human genetics. 2005;116:354-60. 22. Lo SS, Lin SC, Wu CW, Chen JH, Yeh WI, Chung MY, et al. Heme Oxygenase-1 Gene Promoter Polymorphism is Associated with Risk of Gastric Adenocarcinoma and Lymphovascular Tumor Invasion. Annals of surgical oncology. 2007;14:2250-6. 23. Ollinger R, Kogler P, Troppmair J, Hermann M, Wurm M, Drasche A, et al. Bilirubin inhibits tumor cell growth via activation of ERK. Cell Cycle. 2007;6:3078-85. 24. Wegiel B, Bjartell A, Tuomela J, Dizeyi N, Tinzl M, Helczynski L, et al. Multiple cellular mechanisms related to cyclin A1 in prostate cancer invasion and metastasis. J Natl Cancer Inst. 2008;100:1022-36. 25. Wegiel B, Bjartell A, Ekberg J, Gadaleanu V, Brunhoff C, Persson JL. A role for cyclin A1 in mediating the autocrine expression of vascular endothelial growth factor in prostate cancer. Oncogene. 2005;24:6385-93. 26. Otterbein LE, Zuckerbraun BS, Haga M, Liu F, Song R, Usheva A, et al. Carbon monoxide suppresses arteriosclerotic lesions associated with chronic graft rejection and with balloon injury. Nature medicine. 2003;9:183-90. 27. Maines MD, Trakshel GM, Kutty RK. Characterization of two constitutive forms of rat liver microsomal heme oxygenase. Only one molecular species of the enzyme is inducible. The Journal of biological chemistry. 1986;261:411-9. 28. Verma K, Penney DG, Helfman CC, Sutariya BB. Carboxyhemoglobin in the rat: improvements in the spectrophotometric measurement and comparison to other studies. Journal of applied toxicology : JAT. 1989;9:323-30. 29. Lin Q, Weis S, Yang G, Weng YH, Helston R, Rish K, et al. Heme oxygenase-1 protein localizes to the nucleus and activates transcription factors important in oxidative stress. J Biol Chem. 2007;282:20621-33. 30. Bjartell AS, Al-Ahmadie H, Serio AM, Eastham JA, Eggener SE, Fine SW, et al. Association of cysteine-rich secretory protein 3 and beta-microseminoprotein with outcome after radical prostatectomy. Clinical cancer research : an official journal of the American Association for Cancer Research. 2007;13:4130-8. 31. Otterbein LE, Hedblom A, Harris C, Csizmadia E, Gallo D, Wegiel B. Heme oxygenase-1 and carbon monoxide modulate DNA repair through ataxia-telangiectasia mutated (ATM) protein. Proc Natl Acad Sci U S A.108:14491-6. 32. D'Amico G, Lam F, Hagen T, Moncada S. Inhibition of cellular respiration by endogenously produced carbon monoxide. Journal of cell science. 2006;119:2291-8.

27
33. Brouard S, Otterbein LE, Anrather J, Tobiasch E, Bach FH, Choi AM, et al. Carbon monoxide generated by heme oxygenase 1 suppresses endothelial cell apoptosis. The Journal of experimental medicine. 2000;192:1015-26. 34. Gèunther L, Berberat PO, Haga M, Brouard S, Smith RN, Soares MP, et al. Carbon monoxide protects pancreatic beta-cells from apoptosis and improves islet function/survival after transplantation. Diabetes. 2002;51:994-9. 35. Suliman HB, Carraway MS, Ali AS, Reynolds CM, Welty-Wolf KE, Piantadosi CA. The CO/HO system reverses inhibition of mitochondrial biogenesis and prevents murine doxorubicin cardiomyopathy. The Journal of clinical investigation. 2007;117:3730-41. 36. Foster BA, Gingrich JR, Kwon ED, Madias C, Greenberg NM. Characterization of prostatic epithelial cell lines derived from transgenic adenocarcinoma of the mouse prostate (TRAMP) model. Cancer Res. 1997;57:3325-30. 37. Fisher GH, Wellen SL, Klimstra D, Lenczowski JM, Tichelaar JW, Lizak MJ, et al. Induction and apoptotic regression of lung adenocarcinomas by regulation of a K-Ras transgene in the presence and absence of tumor suppressor genes. Genes & development. 2001;15:3249-62. 38. Lee PJ, Alam J, Wiegand GW, Choi AM. Overexpression of heme oxygenase-1 in human pulmonary epithelial cells results in cell growth arrest and increased resistance to hyperoxia. Proc Natl Acad Sci U S A. 1996;93:10393-8. 39. Zuckerbraun BS, Chin BY, Bilban M, d'Avila JC, Rao J, Billiar TR, et al. Carbon monoxide signals via inhibition of cytochrome c oxidase and generation of mitochondrial reactive oxygen species. Faseb J. 2007;21:1099-106. 40. Song R, Mahidhara RS, Zhou Z, Hoffman RA, Seol DW, Flavell RA, et al. Carbon monoxide inhibits T lymphocyte proliferation via caspase-dependent pathway. Journal of immunology (Baltimore, Md : 1950). 2004;172:1220-6. 41. Otterbein LE, Soares MP, Yamashita K, Bach FH. Heme oxygenase-1: unleashing the protective properties of heme. Trends in immunology. 2003;24:449-55. 42. Was H, Dulak J, Jozkowicz A. Heme oxygenase-1 in tumor biology and therapy. Curr Drug Targets. 2010;11:1551-70. 43. Ferrando M, Gueron G, Elguero B, Giudice J, Salles A, Leskow FC, et al. Heme oxygenase 1 (HO-1) challenges the angiogenic switch in prostate cancer. Angiogenesis.14:467-79. 44. Fang J, Sawa T, Akaike T, Akuta T, Sahoo SK, Khaled G, et al. In vivo antitumor activity of pegylated zinc protoporphyrin: targeted inhibition of heme oxygenase in solid tumor. Cancer Res. 2003;63:3567-74. 45. Nowis D, Bugajski M, Winiarska M, Bil J, Szokalska A, Salwa P, et al. Zinc protoporphyrin IX, a heme oxygenase-1 inhibitor, demonstrates potent antitumor effects but is unable to potentiate antitumor effects of chemotherapeutics in mice. BMC cancer. 2008;8:197. 46. Piantadosi CA, Carraway MS, Suliman HB. Carbon monoxide, oxidative stress, and mitochondrial permeability pore transition. Free Radic Biol Med. 2006;40:1332-9. 47. Grunwald V, DeGraffenried L, Russel D, Friedrichs WE, Ray RB, Hidalgo M. Inhibitors of mTOR reverse doxorubicin resistance conferred by PTEN status in prostate cancer cells. Cancer Res. 2002;62:6141-5. 48. Song W, Su H, Song S, Paudel HK, Schipper HM. Over-expression of heme oxygenase-1 promotes oxidative mitochondrial damage in rat astroglia. Journal of cellular physiology. 2006;206:655-63.

28
49. Alaoui-Jamali MA, Bismar TA, Gupta A, Szarek WA, Su J, Song W, et al. A novel experimental heme oxygenase-1-targeted therapy for hormone-refractory prostate cancer. Cancer Res. 2009;69:8017-24. 50. Motterlini R, Otterbein LE. The therapeutic potential of carbon monoxide. Nature reviews Drug discovery. 2010;9:728-43.

29
Table 1 Metabolic analysis was performed using MetaboAnalyst 2.0. Top 13 metabolites out of 290 metabolites were inhibited by CO (250ppm, 6h) treatment of PC3 cells by more then 5-fold. N=3 in duplicates. Univariate ���������� ����analysis was performed by MetaboAnalyst 2.0
Peaks(mz/rt) Fold Change S-adenosyl-L-homoCysteine-positive
7.9552
S-adenosyl-L-homocysteine-negative
7.8218
1-Methyladenosine 6.7669 NADH-nega 6.2849 2-deoxyglucose-6-phosphate 6.0176 Pyridoxine 5.4215 Pyridoxamine 5.4073 NG-dimethyl-L-arginine 5.3147 Pyrophosphate 5.1344 Ribose-phosphate 5.0937 NADH 5.0912 Thymine 5.0494 3-phospho-serine 5.0256

30
Figure Legends
Figure 1. Nuclear expression of HO-1 in 482 biopsy samples of human PCa. A-B.
Representative pictures of HO-1 staining in specimens from benign tissues adjacent to prostate
cancer cells of Gleason grade 3 (C-D) and Gleason grade 4-5 (E-F). 40x magnification (insets at
100x). G. Statistical analysis of nuclear HO-1 expression in different stages of PCa (Gleason 3
and 4-5) vs adjacent benign tissues (BPH). *p<0.05 PCa versus BPH. H. Survival curves of time
to relapse against low or high nuclear HO-1 expression in samples from all biopsies. Low
nuclear staining intensity corresponds to a score of 1 and high nuclear staining intensity
corresponds to a score of 3. *p=0.046. Images are representative of all biopsies. Scale bar, 50
μm.
Figure 2. Nuclear HO-1 is enzymatically inactive. A-B. Immunoblot of HO-1 in the nuclear
(A) and cytoplasmic (B) fractions of various normal (NIH3T3 fibroblasts- NIH, primary human
bronchial epithelial cells-E, primary lung fibroblasts-F) as well as cancer cells lines (PC3-PC,
A549-A5, HepG2-Hep, HeLa-Hel, T47D-T47, MDA-468-MD). Data are representative of 3
independent experiments. C. HO-1 activity in the nuclear (white bars) and cytoplasmic (black
bars) fractions of PC3 cells treated with camptothecin (1 μg/ml) or doxorubicin (10 μg/ml) for 4
hours *p<0.05. D. Crystal violet staining of PC3 cells overexpressing HO-1 (black bars) or
control vector (white bars) treated for 24h with camptothecin (1-10 μg/ml) or doxorubicin (1-10
μg/ml). #p<0.05 doxorubicin/camptothecin treated versus untreated; ** p<0.01 HO-1 versus
Control vector. E. Dose-dependent treatment of PC3 cells with camptothecin (0.001-10 μg/ml)
± CO for 24h. **p<0.01, *p<0.05 CO±camptothecin (black bars) vs Air±camptothecin (white
bars). F. Cell viability was measured by crystal violet staining of PNT1A normal primary

31
prostate epithelial cells treated with doxorubicin (10 mg/ml) ± CO (black bars) or Air (white
bars) for 48 hours. *CO+Doxorubicin vs Air+Doxorubicin, p<0.05.
Figure 3. CO blocks tumor growth of established PC3 xenografts and sensitizes tumor
cells to doxorubicin treatment A-B. Growth curves (% of original tumor volume) of PC3 cells
inoculated into nude mice for 2 weeks prior to initiation of treatment with air or CO (250 ppm,
1h day) ± Doxorubicin, which was continued for an additional two weeks before harvest.
Results are mean ± SD of n=4-5 per group. C-F. Immunostaining of CD31 (C) and P-Histone
H3 (E) in PC3 tumors. Quantitation of CD31 (D) or PH3-positive (F) cells was counted as the
percentage of positive cells/field of view (20x magnification). Results represent mean±SD of 8-
10 sections from each harvested tumor. E-F. TUNEL staining quantitated as % of positive cells
per field of view (20x magnification). Results represent mean±SD of 8-10 sections from each
harvested tumor. **p<0.01vs Air; *p<0.05 vs Air.
Figure 4. CO induces apoptosis in an orthotopic prostate cancer model in mice. A-C. Co-
immunostaining of P-Histone H3 (green) and CD31 (red) of orthotopic tumors in mice treated
for 4 weeks with CO or Air. Representative pictures are shown in A, and quantification of
staining is shown in B-C (n=4 per group). Scale bar, 50 μm. D. Real time PCR with primers for
MMP2, VEGF and urokinase plasminogen activator (uPA) in mice treated with CO or Air.
Results represent mean±SD of n=4 tumors/group. * p<0.05 vs control. E-F. TUNEL staining for
apoptosis and the % of positive cells per field of view (20x magnification) quantitated as above.
Images are representative of 8-10 sections from each harvested tumor. Results represent mean ±
SD of 8-10 fields of view from each tumor. **p<0.01 vs air. G. CO levels in the tumors from

32
mice with subcutaneously or orthotopically inoculated tumors. n=3-6 per group. Scale bar, 100
μm.
Figure 5. CO arrests growth of established prostate and lung cancer A-B.
Immunohistochemistry analysis with antibody against Ki67 and histological analysis (H&E)
was performed on the tissues from wild type (wt) or TRAMP mice that were treated with CO
(250 ppm/daily/5 days per week) or untreated (Air). Quantitation of Ki67 staining is shown in A
(n=6-7 mice per group). C. Immunohistochemistry with antibodies to HO-1 was applied in the
normal (wt) and PIN lesion containing prostates (TRAMP) as well as in the lung tumors of
FVB/N-Tg(teto-Kras2)12Hev (provided by Dr. Varmus). Scale bar, 200 μm. D.
Immunostaining of prostates from TRAMP treated as above with antibodies to mitochondrial
transcription factor A. Two representative pictures from Air and CO treated mice are shown.
Scale bar, 200 μm. E-F. H&E staining in the lungs of FVB/N-Tg(teto-Kras2)12Hev mice that
were treated with doxycycline for 8 weeks and continued with CO treatment for the following 5
weeks. The number of nodules in the lung cross-sections was evaluated in at least n=5-6 per
animal. The representative sections and immunohistochemistry with antibody against Ki-67 are
shown in F. Data are representative for Air n=8, CO n=9 animals. P<0.0002. Scale bar, 200 μm.
Figure 6. Effects of CO on Mitochondria in PCa cells A. OCR and ECAR were measured in
PC3 cells treated with medium bubbled with 250 ppm CO. Relative mitochondria activity was
measured over time and the levels are shown at 30 min. B. OCR was measured in PC3 or
PNT1A ± Rotenone (20 nM) for 10 min followed by 30 min ± CO (250 ppm). Data are
representative for 2 independent experiments in duplicates. C. The levels of glucose and lactate

33
were measured in the lysates of PC3 cells ± CO (250ppm) for 6 hours. D-E. Mitochondrial
superoxide production was measured by Flow Cytometry using MitoSox. Data are
representative for 3 independent experiments in triplicates. **p<0.01. F. Cell cycle analysis was
performed in PC3 and PNT1A cells by PI staining. Cells were synchronized for 48 h via serum-
starvation and then treated for 48h with FBS-containing medium ± CO. Data are representative
of 3 independent experiments in triplicates. **p<0.01. G. SPECT analysis in PC3 cells ± CO
(250 ppm) or CORM-A1 (20 or 100 μM) for 24h. Intensity of radiation is presented as a mean ±
SD of 2 independent experiments performed in triplicate. *p<0.05 vs control, **p<0.01 vs
control. H. Immunohistochemical staining for cytochrome C in subcutaneous prostate cancer
xenografts as an indicator of cell death. Representative sections from n=3-4 animals are shown.
Scale bar, 150 μm. I-J. MitoTracker Red CMXRos staining of PC3 cells treated with
Doxorubicin (Dox) ± CO for 4h. Hoechst was used to stain nuclei. Representative pictures are
shown in C and densitometric intensity analyses of 3 fields is shown in D. Results represent
mean ± SD of 3 independent experiments. *p<0.001 vs control. Scale bar, 10 μm. K.
Immunoblotting with antibodies against mtTFA in the lysates of CO treated PC3 and A549 cells
(4h, 250 ppm). L. Immunofluorescence staining with antibody against vimentin in lung
adenocarcinoma cell line A549, control and Rhoo (EtBr) ± CO (250 ppm, 48h). Data are
representative of 2 independent experiments in duplicate. Scale bar, 30 μm.