Embed Size (px)
Citation preview

Dynamics of Microtubules Bundled by Microtubule Associated Protein 2C (MAP2C) Takashige U m e y a m a , Shigeo Okabe, Yoshimitsu Kanai , and Nobu taka Hi rokawa
Department of Anatomy and Cell Biology, School of Medicine, University of Tokyo, 7-3-1 Hongo, Bunkyo-ku, Tokyo 113, Japan
Abstract. MAP2C is a microtubule-associated protein abundant in immature nerve cells. We isolated a cDNA clone encoding whole mouse MAP2C of 467 amino acid residues. In fibroblasts transiently trans- fected with cDNA of MAP2C, interphase microtubule networks were reorganized into microtubule bundles. To reveal the dynamic properties of microtubule bun- dles, we analyzed the incorporation sites of exog- enously introduced tubulin by microinjection of biotin- labeled tubulin and the turnover rate of microtubule bundles by photoactivation of caged fluorescein-labeled tubulin. The injected biotin-labeled tubulin was rap- idly incorporated into distal ends of preexisting micro- tubule bundles, suggesting a concentration of the avail- able ends of microtubules at this region. Although homogenous staining of microtubule bundles with an- tibiotin antibody was observed 2 h after injection,
the photoactivation study indicated that turnover of microtubule bundles was extremely suppressed and <10% of tubulin molecules would be exchanged within 1 h. Multiple photoactivation experiments provided evidence that neither catastrophic disassembly at the distal ends of bundles nor concerted disassembly due to treadmilling at the proximal ends could explain the observed rapid incorporation of exogenously introduced tubulin molecules. We conclude that microtubules bundled by MAP2C molecules are very stable while the abrupt increase of free tubulin molecules by micro- injection results in rapid assembly from the distal ends within the bundles as well as free nucleation of small microtubules which are progressively associated lat- erally with preexisting microtubule bundles. This is the first detailed study of the function of MAPs on the dynamics of microtubules in vivo.
M ICROTUBULES are thought to play an important role in cellular morphogenesis, maintenance and function. During differentiation, each type of cell
develops its specific microtubule organization. Moreover, the modulation of microtubule dynamic properties such as selective stabilization can be expected to be involved in these processes (Kirschner and Mitchison, 1986). In nerve cell processes, microtubules and their associated filamentous structures, mainly composed of microtubule-associated pro- teins (MAPs) ~ are among the main cytoskeletal components (Hirokawa, 1982, 1991) and are organized into parallel ar- rays with increasing stability during development. Recently, the microtubule dynamics of nerve cells were investigated by microinjection of chemically-labeled tubulin coupled with photobleaching or photoactivation technique. Microtubules in neurites were shown to incorporate tubulin subunits lo- cally at their distal ends (Okabe and Hirokawa, 1988), and turn over slowly compared with undifferentiated fibroblasts (Lim et al., 1989, 1990; Okabe and Hirokawa, 1990).
Address correspondence to N. Hirokawa at Department of Anatomy and Cell Biology, School of Medicine, University of Tokyo, 7-3-1 Hongo, Bunkyo-ku, Tokyo 113, Japan.
1. Abbreviation used in this paper: MAPs, microtubule associated proteins.
It has been revealed that neuronal MAPs play an important role in neuronal morphogenesis. Neuronal MAPs are copurified with tubulin through temperature dependent as- sembly and disassembly. Because these molecules promote the assembly and stability of microtubules in vitro (Olmsted, 1986) and form cross-bridge structures between microtu- bules or between microtubules and other cytoskeletal com- ponents (Hirokawa, 1982, 1991; Hirokawa et al., 1988a,b), the possible role of neuronal MAPs on the formation of sta- ble microtubule bundles in nerve cell processes has been conceptualized. It has recently been shown that the overex- pression of tau or MAP2A in fibroblasts reorganizes inter- phase microtubules into microtubule bundles (Kanai et al., 1989; Lewis et al., 1989; Knops et al., 1991), and that the specific suppression oftau or MAP2 expression results in the inhibition of axon or neurite elongation, respectively (Ca- ceres and Kosik, 1990; Dinsmore and Soloman, 1991). Hence, it is quite conceivable that neuronal MAPs are deeply involved in the characteristic features of organization and dy- namics of neuronal microtubules. Although extensive stud- ies have been carried out concerning functions of MAPs in vitro, there have been few studies to elucidate their function on the dynamics of microtubules in cells.
MAP2C is a 70-kD MAP identified by its cross-reactivity with anti-MAP2 antibody (Couchie and Nunez, 1985; Gar-
�9 The Rockefeller University Press, 0021-9525/93/01/451115 $2.00 The Journal of Cell Biology, Volume 120, Number 2, January 1993 45 I--465 451
on Decem
ber 4, 2015jcb.rupress.org
Dow
nloaded from
Published January 15, 1993

ner et al., 1988). Although high molecular weight MAP2 is specifically localized in dendrites and enriched in adult brain, MAP2C also exists in axons and is abundant in imma- ture nerve cells (Tucker et al., 1988). MAP2C appears as a rodlike molecule, forming cross-bridge structures between microtubules in vitro (Takeuchi et al., 1992). Both high mo- lecular weight MAP2 and MAP2C were shown to be tran- scribed from a single gene (Lewis et al., 1986; Neve et al., 1986; Garner and Matus, 1988). Full length cDNA clones encoding mouse MAP2A, rat MAP2B and 2C were recently isolated (Lewis et al., 1988; Papandrikopoulou et al., 1989; Kindler et al., 1990).
In this study, we isolated a cDNA clone of mouse MAP2C and investigated the effects of MAP2C expression on micro- tubule organization and dynamics in fibroblasts. We ob- served the reorganization of the interphase microtubule net- work into microtubule bundles, which were extremely stabilized in cells transfected with MAP2C cDNA. Further- more, studies, using the introduction of biotin-labeled tubu- lin and subsequent immunodetection with antibiotin anti- body revealed the concentration of microtubule ends at the distal ends of bundles. Such characteristic organization and dynamics of microtubules are the same as those of micro- tubules in nerve cells, indicating that MAP2C plays an im- portant role in the morphogenesis and establishment of the microtubule structure of immature nerve cells. This is the first detailed report concerning the function of MAPs on the dynamics of microtubules in cells.
Materials and Methods
cDNA Cloning poly(A+)RNA was extracted from brain of newborn mice by the guanidinium isothiocyanate/cesium chloride method (Maniatis et al., 1989), and oligo (dT)-cellulose column chromatography. Double strand eDNA was synthesized from poly(A+)RNA primed with antisense syn- thetic oligonucleotides (primer 1: CCAAGAC-CTCATGCCTAAA) corre- sponding to the sequence just downstream of the stop codon of MAP2A (Lewis et al., 1988). The eDNA was linked to EcoRI adapter, inserted in EcoRI digested hgtl0 arms, and packaged in vitro using the packaging ex- tract Giga Pack Gold (Stratagene Inc., La Jolla, CA). For generation of a probe, polymerase chain reaction (PCR) was carried out on the eDNA above, using primer 1 and sense synthetic oligonucleotides (primer 2: CCACCAGCCGTTTGAGAATACAACA) corresponding to the sequence just upstream of the initiation codon of MAP2A. The amplification condi- tions were 1 rain at 94~ 2 min at 55~ 3 rain at 72~ for 25 cycles. 1.4 Kb fragment was amplified and purified from agarose gel. Because high mo- lecular weight MAP2 and 2C are products from alternative mRNA splicing (Lewis et al., 1986; Neve et al., 1986; Garner and Matus, 1988), this frag- ment of 1.4 Kb would be a eDNA of MAP2C. However, because of the rela- tively high misincorporation rate of Taq polymerase used in PCR (Saiki et al., 1989), we screened the eDNA library with this probe for the reliability of nucleic acid sequence. The probe was labeled with 32p by a multiprime DNA labeling system (Amersham Corp., Arlington Heights, IL). The iso- lated clone was subcloned into bluescript M13 SK(+) (pbs2C) and se- quenced by the dideoxy chain termination method.
Construction of Expression Vector and Deletion Mutants pbs2C was digested with XbaI, made blunt ended with Klenow fragment and cleaved at the HindIII site. We constructed p/3act2C by replacing the CAT gene of p/~actCA'I9 (HindIII - HpaI fragment) with the HindIII-blunt ended insert of pbs2C (Kost et al., 1983; Fregien and Davidson, 1986). De- letion mutants were constructed from pbs2C by PCR (Maniatis et al., 1989), and subeloned into p/3actCAT9 by replacing the CAT gene with deleted inserts. From p/3act2C, 26-259 and 394-463 amino acid residues were removed to prepare p/3actR1, and 26-307 and 394-463 amino acid
residues were removed to prepare p/3actR2. The PCR amplified fragments and ligated sites were sequenced to confirm the integrity of the deletion mutants.
pCDM-L3T4, which had the eDNA of L3T4 inserted into pCDM8 (Litt- man and Gettner, 1987), was a generous gift from Dr. Seiki-Furutani (University of Tokyo, Tokyo, Japan).
Transfection COS cells were maintained in RPMI 1640 medium supplemented with 10 % FBS (Gibco Laboratories, Grand Island, NY). For transfection experiments with pi3act2C, p/~actR1 or p/~actR2, COS cells in a 3.5-cm dish with •30% confluence were transfected with a plasmid (10 #g for each dish), using the calcium phosphate technique (Xie, 1984). 10 #g of p/3act2C together with 1 /zg of pCDM-L3T4 were used in cotransfection experiments. 4 h after transfection, the culture was fed fresh medium and cells were incubated for an additional 44 h for further experiments.
SDS-PAGE and Western Blotting Transfected or control ceils were resuspended in PEM buffer (100 mM PIPES, 1 mM EDTA, 1 mM MgC12, pH 6.8) containing 2 mM PMSF, 20 #g/ml leupeptin, 1% Triton X-100, then homogenized and centrifuged at 15,000 g for 30 rain at 4~ The supernatants were separated on SDS- polyacrylamide gel and transferred electrophoretically to nitrocellulose filters. Blotted nitrocellulose sheets were blocked with 5 % (wt/vol) BSA and stained with mouse monoclonal anti-MAP2 antibody (Takeuchi et al., 1992) and peroxidase-coupled second antibody.
Immunofluorescence Cells were permeabilized with 1% Triton X-100 in stabilizing buffer (100 mM PIPES, 1 mM MgC12, 1 mM EGTA, 30% glycerol, 1 mM GTP, pH 6.6) for 2 rain at 37~ fixed with 2% paraformaldehyde and 0.1% glutaraldeh~le in stabilizing buffer for 15 rain, and then treated with NaBI-h in PBS for 10 rain to quench the glutaraldehyde. For double im- munofluorescence against tubulin and MAF2C, the cells were incubated successively with the following antibodies: mouse monoclonal anti-MAP2, rhodamine-conjugated goat anti-mouse IgG, polyclonal rabbit antitubulin and fluorescein-conjugated goat antirabbit IgG. For double immunnfiuo- rescence against tubulin and biotin after microinjection of biotin-labeled tubulin, the cells were incubated successively with the following antibodies: rabbit antibiotin (Enzo Biochemicals, Inc., New York, NY), rhodamine- conjugated goat antirabbit IgG, mouse monoclonal antitubulin (Amersham Corp.) and fluorescein-conjugated goat antimouse IgG.
For double immunnfiuorescence against L3T4 and tubulin, living ceils were stained with GK1.5 hybridoma supernatant (anti-L3T4 antibody) (Di- alynas et al., 1983), followed by fluorescein-conjugated antirat IgG as de- scribed below, subsequently fixed with 2% paraformaldehyda and 0.1% glntaraldehyde in PEM buffer for 15 rain, extracted with methanol and stained with polyclonal rabbit antitubulin and rhodamine-conjugnted goat antirabbit IgG successively. All second antibodies were purchased from Cappel Laboratories Inc. (Maivern, PA). The cells were examined under a fluorescence microscope (Axiophoto, Carl Zeiss, Inc., Oberkochen, Germany).
lmmunostaining of the Plasma Membrane of Living Cells Cells transfected with pCDM-L3T4 were incubated with GK1.5 hybridoma supernatant supplemented with 10% FBS for 20 rain, followed by second antibodies diluted 1:100 in RPMI 1640 with 10% FBS (fluorescein- conjugated antirat IgG for micminjection of biotin-labeled tubulin, and rhodamine-conjugated antirat IgG for microinjection of caged fluorescein- labeled tubulin).
Preparation of Labeled Tubulin and Microinjection Three kinds of labeled tubulin were prepared for the microinjection experi- ments. Namely, (a) N-hydroxysuccinimidyl biotin; (b) bis-caged car- boxyfluorescein-N-hydroxy-sulfosuccinimide ester (Biscaged-Fluorescein SUlfo Osu, Dojindo Laboratories, Kumamoto, Japan), or (c) N-hydmxy suceinimidyl 5-carboxytetramctyl rhodamine was reacted with phospho- cellulose-purified porcine tubulin, respectively (Kristofferson et al., 1986; Schulze and Kirschner, 1986; Mitchison, 1989; Kellogg et al., 1988). For microinjection, biotin-labeled tubulin, caged-fluorescein labeled tubulin
The Journal of Cell Biology, Volume 120, 1993 452
on Decem
ber 4, 2015jcb.rupress.org
Dow
nloaded from
Published January 15, 1993

and rhodamineqabeled tubulin were diluted with an injection buffer (50 mM potassium glutamate, 1 mM MgCI2, pH 6.8) to 10, 8, and 2 mg/ml, respec- tively. Cells were transferred into MEM (Gibco Laboratories) containing 15 mM Na-Hepes and 10% FBS for microinjection. The injected volume was estimated to be <10% of cell body volume.
Photoactivation The photoactivation apparatus was assembled as described previously (Mitchison, 1989; Okabe and Hirokawa, 1992). A 365-nm slit microbeam generated by a mercury arc lamp through a hand-made slit and a band pass filter was introduced into the light path of an inverted microscope (Axiovert; Cart Zeiss, Inc.) via a dichroic mirror (390-nm long pass). The 365-nm microbeam was applied for 0.25-0.5 s and activated fluorescence images were collected with a cooled CCD camera with a 1,024 x 1,024 pixel chip (C3640, Hamamatsu Photonics, Hamamatsu Corp., Bridgewater, NJ) and stored with an optical disk recorder (RS-92000, RICOH, Tokyo, Japan). By inserting an electronic shutter interfaced with the imag~processor, the ex- posure time was controlled to 0.5-1.0 s.
Time Schedule of Experimental Procedures for Microinjection For the microinjection of biotin tubulin, COS cells cotransfected with p/3act.2C and pCDM-L3T4 were stained with anti-L3T4 antibody (GK1.5) and fluorescein-conjugated second antibody 48 h after transfection. Cells showing anti-L3T4 staining were detected by fluorescein channel of epi- illumination, and were microinjected with biotin-labeled tubulin. The microinjection procedure was carded out for 4 rain into the cells in a single dish, and the cells in the dish were incubated for an additional 2 min 30 s before permeabilization and fixation. We called these cells "cells fixed 5 min after microinjection" hereafter. Similarly, "cells fixed 15 min after microinjection" and "cells fixed 2 h after microinjection" represent cells in dishes which were microinjected for 10 min and incubated for an additional 10 min and 2 h, respectively, before permeabilization and fixation.
For the microinjection of caged fluorescein-labeled tubulin, COS cells cotransfected with p/3act2C and pCDM-L3T4 were stained with anti-L3T4 antibody and rhodamine-conjngated second antibody 48 h after transfec- tion. Cells showing anti-L3T4 staining were injected with caged fluores- cein-labeled tubulin together with rhodamine-labeled tubulin. The incuba- tion periods from microinjection until photoactivation varied from 2.5 to 7 h, but photoactivation runs were usually started 2-4 h after injection. Sub- sequent observation of the activated bars of fluorescence was carried out for 80-120 rain.
Image Quantification To measure the fluorescence decay in the photoactivated region, we set a rectangle on the photoactivated microtubule bundle and the summation of pixel intensities in the rectangle was calculated for each time point. Because the photoactivated regions tended to become broader with time, the position and size of rectangles were determined from the last frame of sequential fluorescence images. This method inevitably leads to setting of rather large counting area but we think the contribution of background fluorescence would be minimal because the background fluorescence of photoactivated cells was very low and background intensities were subtracted from each rectangle before measurement. The stationary nature of photoactivated zone relative to the whole structure of bundles was confirmed for each se- quence by the comparison of fluorescein images with the images of bundles in rhodamine channel.
For the digitized images of microtubule bundles photoactivated at two sites, two rectangles were set adjacent to each other and their boundary was set at the midpoint to two photoactivated bars. The other setting of position and size of rectangles were identical to the one-site activation experiments. It is possible that microtubule movements from one rectangle to another affect the measurement of total fluorescence intensity in rectangles. How- ever, we observed no vectorial movement of microtubutes in bundles and the movement in both directions v~uld cancel this effect. Furthermore, the almost identical pattern of fluorescence decay in two photoactivated zones reinforced this statement.
Results
Isolation of a eDNA Clone of MAP2C Because MAP2C is abundantly expressed in immature nerve
1 151 1513 1828
M A P 2 A L . . . . .
1 313 393 467
M A P 2 C ~ : : ~ ~ - ~ Figure 1. Comparison of amino acid sequence of MAP2C to that of MAP2A. Mouse MAP2C consists of 467 amino acid residues, and lacks the bridging sequences (152-1512) of MAP2A. Boxed areas represent three imperfect repeats of 18 amino acid residues in the carboxyl-terminal region.
cells (Garner et al., 1988), we constructed a eDNA library from brain of newborn mice. From the library we isolated a clone (pbs2C) containing 1687 bp insert, pbs2C included a complete open reading frame of 1,401 nucleotides encod- ing 467 amino acid residues. The deduced amino acid se- quence was revealed to encode the amino-terminal domain (1-151) and carboxyl-terminal domain (1,513-1,828) of MAP2A, and lack the bridging sequences of 1,361 amino acid residues (Lewis et al., 1988) (Fig. 1). Accordingly, this alternatively spliced clone was revealed to encode a low mo- lecular weight form of MAP2, namely MAP2C. The amino- terminal region of the splicing site was rich in acidic residues, and the carboxyl-terminal region of the splicing site, including three imperfect repeat sequences of 18 amino acids, was rich in basic residues. The region between the splicing site and the three imperfect repeats was rich in pro- line content (16%) (proline-rich domain).
MAP2C Reorganizes lnterphase Microtubules into Bundles Through Its Microtubule Binding Domain To analyze the function of MAP2C in vivo, we observed the effect of MAP2C expression on microtubule organization in nonneural cells by transient transfection of pflact2C into fibroblasts (COS cells). Crude supernatant proteins from the transfected ceils were immunoblotted and stained with monoclonal anti-MAP2 antibody. Anti-MAP2 antibody reacted with the band of 70 kD (Fig. 2). The molecular weight was consistent with the reported molecular weights of rat and porcine MAP2C, 70 and 72 kD, respectively, on SDS-PAGE (Garner et al., 1988; Takeuchi et al., 1992).
Figure 2. SDS-PAGE and immunoblot analysis. Crude supernatant proteins from native COS cells and transfected COS ceils were separated on SDS-polyacrylamide gel (7 %) and either stained with Coomassie brilliant blue (lanes I and 2) or transferred to nitrocellu- lose filters and stained with anti-MAP2 antibody (lanes 3 and 4). Molecular size standards in kilodaltons are shown on the left (Mr). Arrow indicates the band of 70 kD which reacted with anti-MAP2 antibody.
Umeyama et al, Microtubules Bundled by MAP2C 453
on Decem
ber 4, 2015jcb.rupress.org
Dow
nloaded from
Published January 15, 1993

Figure 3. Immunofluorescence of COS cells transfected with p#act2C and its deletion mutants. Antitubulin staining of a native COS cell as a control (A), showing filamentous network of microtubules radiating from a micrombule organizing center (arrow). Double-label im- munofluorescence of a p/~act2C transfected cell; stained with antitubulin (B) and anti-MAP2 (C) antibodies. Thick micrombule bundles were formed (arrowhead). Filamentous micmtubules not associated with micmtubule bundles were largely decreased. Antitubulin staining of cells transfected with p~actR1 (D) and p~actR2 (E); microtubule bundles were induced in p/~actRl transfected ceils (D), but were not observed in a p#actR2 transfected cell (E). Antitubulin staining of a taxol stabilized cell (5~M, 24 h) (F); microtubule bundles were formed without depletion of filamentous micmtubules. Bar, 10 #m.
Crude supernatant proteins from untransfected cells were stained with anti-MAP2 antibody but no reactive product was observed, indicating the absence of MAP2C in native COS cells.
Interphase microtubules of untransfected COS cells devel- oped fine filamentous networks which radiated from micro- tubule organizing centers (Fig. 3 A). In the transiently trans- fected COS cells, thick microtubule bundles were formed and extended toward the cell periphery (Fig. 3 B). Im- munofluorescence microscopy revealed that MAP2C co-
localized with these bundles (Fig. 3 C). Most microtubule bundles were not connected to microtubule organizing centers. The density of the filamentous microtubules which were not associated with micrombule bundles was largely decreased compared with that of the interphase microtubule arrays in untransfected cells. To determine the relation be- tween the expression level of MAP2C and the formation of bundles, we carried out an immunofluorescence study of p~3act2C transfected cells fixed before detergent treatment. Microtubule bundles were formed only in cells which were
The Journal of Cell Biology, Volume 120, 1993 454
on Decem
ber 4, 2015jcb.rupress.org
Dow
nloaded from
Published January 15, 1993

1 25 2 6 0 393 464 467
Figure 4. Nocodazole treatment of a cell cotransfected with p/~actR2 and pCDM-L3T4; stained with antitubulin (A) and anti- L3T4 (B) antibodies. In a cotransfected cell showing L3T4 staining (arrows), microtubules were still observed after nocodazole treat- ment (5#m, 15 min). Untransfected cells were totally depolymer- ized (arrowhead). Bar, 10/xm.
strongly stained with anti-MAP2 antibody (data not shown). Accordingly, microtubule bundling appeared to need the ex- pression of MAP2C over the threshold level.
To reveal the essential domain for microtubule bundling, we transfected deleted MAP2C constructs into COS cells. First, we constructed pflactR1 which encodes the carboxyl- half of the proline rich domain and three imperfect repeats by removing 26-259 and 394-463 amino acid residues from pflact2C (Fig. 5). In some pBactR1 transfected cells, micro- tubule bundles were formed and filamentous microtubules were greatly depleted (Fig. 3 D). Although the proportion of cells containing microtubule bundles was much smaller in pBactR1 transfected cells, a similar reorganization of micro- tubules, that is, microtubule bundling and the depletion of filamentous microtubules observed in cells expressing whole MAP2C was evident. Because our monoclonal anti-MAP2 antibody reacted with the deleted amino-terminal region, transfected cells were identified by the coexpression of L3T4 as described below.
Secondly, we constructed p~actR2, which encodes only three imperfect repeats, by removing 26-307 and 394-463 amino acid residues from p~act2C (Fig. 5). In cells cotrans- fected with pflactR2 and pCDM-L3T4, we could not find cells containing significant microtubule bundles (Fig. 3 E). However, in considerable proportion of L3T4 positive cells (arrows), microtubules were still observed after nocodazole treatment in the condition that microtubules in native COS cells were totally depolymerized (5 #M, 15 min) (Fig. 4). These results indicate that three imperfect repeats are not enough for microtubule bundling and only partially stabilize microtubules. The carboxyl-half of the proline rich domain together with three imperfect repeats were necessary to in- duce microtubule bundling in COS cells. To confirm this, we also examined the bundling activity of two other constructs, one lacking 26-259 and the other 394-463 amino acids. Al- though the proportion of ceils containing microtubule bun- dles was much smaller, these two constructs showed a bun- dling activity indistinguishable from that containing the full sequence of MAP2C, further supporting our conclusion. The proline-rich domain and the three imperfect repeats have been shown to be a microtubule binding region (Lewis et al., 1988, 1989; Aizawa et al., 1991). Accordingly, these results indicate that the microtubule binding domain is also respon- sible for microtubule bundling.
1 2 5 308 393 464 467
R2 D - - ~ ~ Figure 5. Schematic representation of deletion mutants from p/~act2C. 26-259 and 394-463 amino acid residues in p/3act2C were removed to prepare p/3actRl, and 26-307 and 394--463 amino acid residues in p/~act2C were removed to prepare p/3actR2.
Furthermore, we examined the effect of microtubule stabilization in COS cells by taxol treatment. In cells treated with 5/zM taxol for 24 h, microtubule bundles were formed, and most of them were not associated with microtubule or- ganizing centers (Fig. 3 F). However, the depletion of fila- mentous microtubules observed in MAP2C transfected cells (Fig. 3 B) was not observed in taxol-stabilized cells. There were always considerable number of microtubules which were not associated with microtubule bundles.
Detection of MAP2C Expressing Cells
To detect MAP2C expressing cells and make the subsequent microinjection of chemically-labeled tubulin possible, we cotransfected the cDNA of murine T-cell surface glycopro- tein CD4 (pCDM-L3T4) with p/3act2C, and stained the liv- ing cotransfected cells with anti-L3T4 antibody. Murine helper T-cell surface glycoprotein L3T4 has been shown to bind to class II MHC molecule and to be involved in cell to cell interactions. To determine whether L3T4 is appropriate as a surface marker, i.e., that L3T4 will not affect the proper- ties of COS cells, we first examined cells transfected with only pCDM-L3T4. The transfected cells expressing L3T4 showed patchy staining on the cell surface by anti-L3T4 anti- body, probably due to cross-linking of L3T4 antigen by the first and second antibodies (Fig. 6 A). Anti-tubulin staining of the same cell revealed a normal interphase microtubule organization indistinguishable from control ceils (Fig. 6 B). Furthermore, light microscopic analysis of the cells trans- fected with pCDM-L3T4 revealed no difference in cell shape, motility and growth (data not shown). These results indicate that the expression of L3T4 in COS cells has no de- tectable effect on the overall cellular properties, and espe- cially on microtubule organization.
Second, we cotransfected p/~act2C and pCDM-L3T4 into COS cells. The coexpression of both MAP2C and L3T4 in a single cell was confirmed by patchy staining on the cell sur- face and by the marked bundling of microtubules revealed by anti-L3T4 and anti-tubulin staining (Fig. 6, C and D). We calculated the efficiency of this cotransfection method for de- tecting cells expressing MAP2C. In 342 cells selected at ran- dom from the population of cotransfected ceils, 25 cells con- tained microtubule bundles (25/342 = 7.3 %). On the other hand, in 187 L3T4 positive staining cells, 146 cells con- tained microtubule bundles (146/187 = 78%). This result in- dicates that L3T4 positive cells coexpress MAP2C with quite high probability and we can obtain about tenfold concentra- tion of cells containing microtubule bundles. Accordingly, this cotransfection method enabled us to carry out microin-
Umeyama et al. Microtubules Bundled by MAP2C 455
on Decem
ber 4, 2015jcb.rupress.org
Dow
nloaded from
Published January 15, 1993
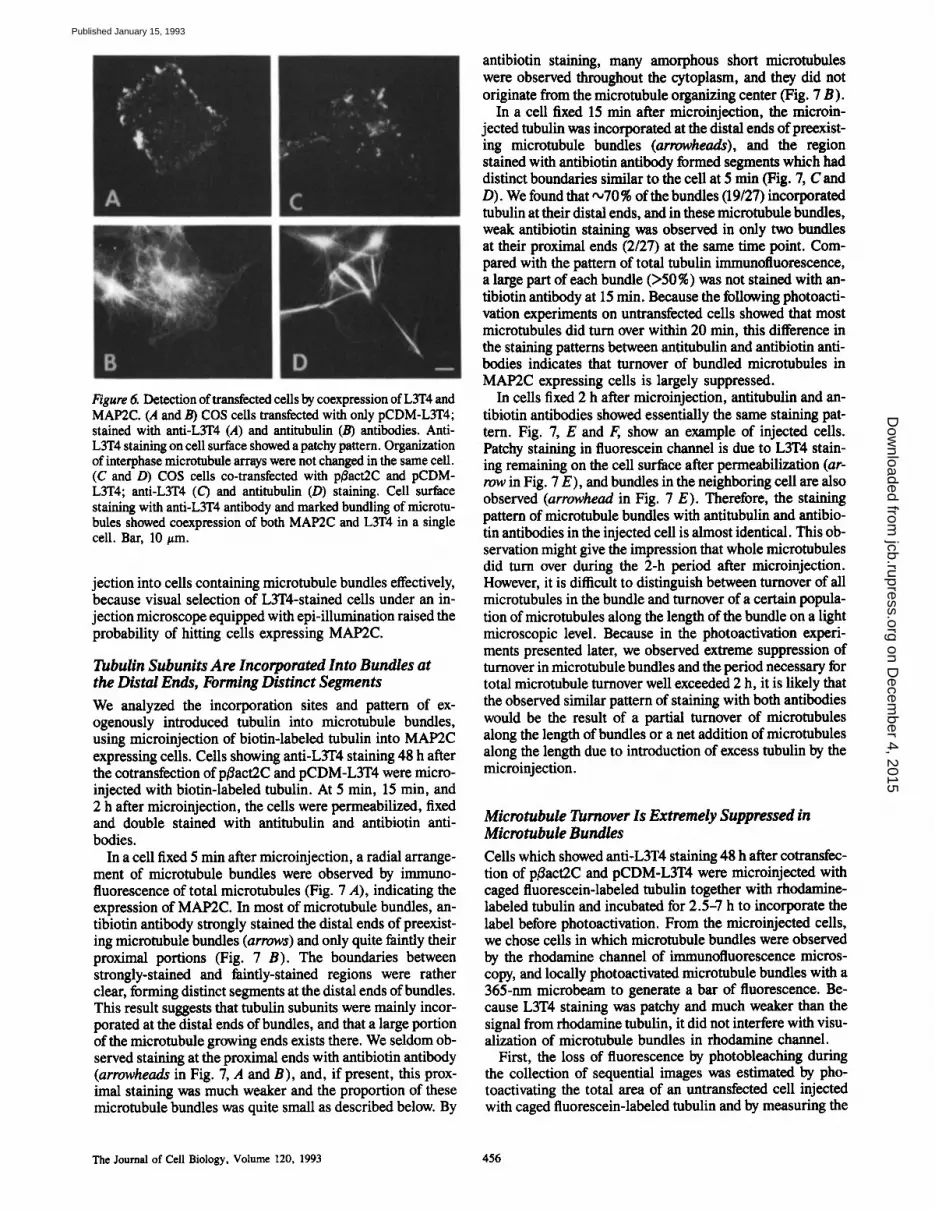
Figure 6. Detection of transfected cells by coexpression of L3T4 and MAP2C. (A and B) COS ceils transfected with only pCDM-L3T4; stained with anti-L3T4 (A) and antitubulin (B) antibodies. Anti- L3T4 staining on cell surface showed a patchy pattern. Organization of interphase microtubule arrays were not changed in the same cell. (C and D) COS cells co-transfected with pBact2C and pCDM- L3T4; anti-L3T4 (C) and antitubulin (D) staining. Cell surface staining with anti-L3T4 antibody and marked bundling of microtu- bules showed coexpression of both MAP2C and L3T4 in a single cell. Bar, 10 #m.
jection into cells containing microtubule bundles effectively, because visual selection of L3T4-stained cells under an in- jection microscope equipped with epi-illumination raised the probability of hitting ceils expressing MAP2C.
Tubulin Subunits Are Incorporated Into Bundles at the Distal Ends, Forming Distinct Segments
We analyzed the incorporation sites and pattern of ex- ogenously introduced tubulin into microtubule bundles, using microinjection of biotin-labeled tubulin into MAP2C expressing cells. Cells showing anti-L3T4 staining 48 h after the cotransfection of p/3act2C and pCDM-L3T4 were micro- injected with biotin-labeled tubulin. At 5 rain, 15 min, and 2 h after microinjection, the cells were permeabilized, fixed and double stained with antitubulin and antibiotin anti- bodies.
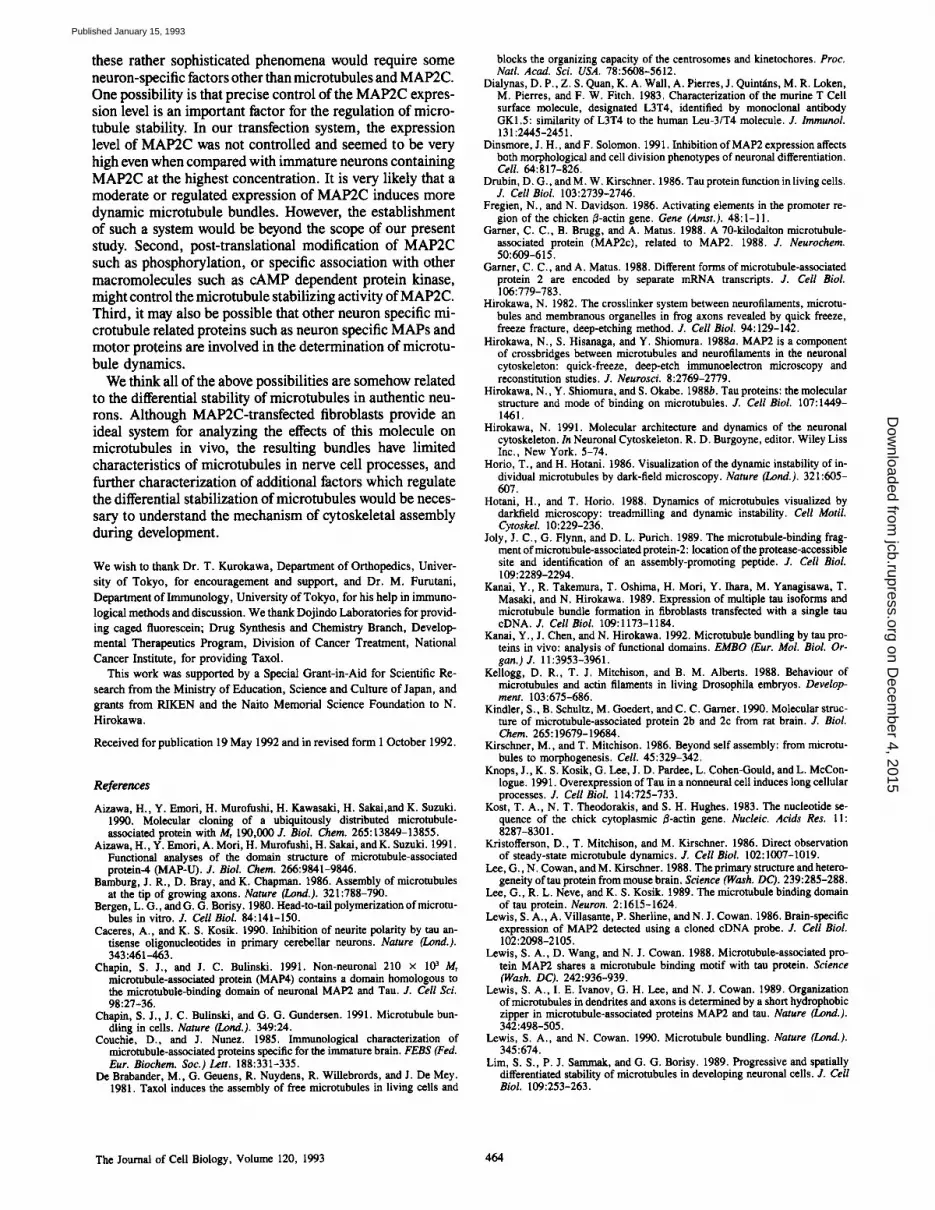
In a cell fixed 5 min after microinjection, a radial arrange- ment of microtubule bundles were observed by immuno- fluorescence of total microtubules (Fig. 7 A), indicating the expression of MAP2C. In most of microtubule bundles, an- tibiotin antibody strongly stained the distal ends of preexist- ing microtubule bundles (arrows) and only quite faintly their proximal portions (Fig. 7 B). The boundaries between strongly-stained and faintly-stained regions were rather clear, forming distinct segments at the distal ends of bundles. This result suggests that tubulin subunits were mainly incor- porated at the distal ends of bundles, and that a large portion of the microtubule growing ends exists there. We seldom ob- served staining at the proximal ends with antibiotin antibody (arrowheads in Fig. 7, A and B), and, if present, this prox- imai staining was much weaker and the proportion of these microtubule bundles was quite small as described below. By
antibiotin staining, many amorphous short microtubules were observed throughout the cytoplasm, and they did not originate from the microtubule organizing center (Fig. 7 B).
In a cell fixed 15 rain after microinjection, the microin- jected tubulin was incorporated at the distal ends of preexist- ing microtubule bundles (arrowheads), and the region stained with antibiotin antibody formed segments which had distinct boundaries similar to the cell at 5 min (Fig. 7, C and D). We found that '~70 % of the bundles (19/27) incorporated tubulin at their distal ends, and in these microtubule bundles, weak antibiotin staining was observed in only two bundles at their proximal ends (2/27) at the same time point. Com- pared with the pattern of total tubulin immunofluorescence, a large part of each bundle (>50%) was not stained with an- tibiotin antibody at 15 min. Because the fotlowing photoacti- ration experiments on untransfected cells showed that most microtubules did turn over within 20 min, this difference in the staining patterns between antitubulin and antibiotin anti- bodies indicates that turnover of bundled microtubules in MAP2C expressing cells is largely suppressed.
In cells fixed 2 h after microinjection, antitubulin and an- tibiotin antibodies showed essentially the same staining pat- tern. Fig. 7, E and F,, show an example of injected cells. Patchy staining in fluorescein channel is due to L3T4 stain- ing remaining on the cell surface after permeabilization (ar- row in Fig. 7 E), and bundles in the neighboring cell are also observed (arrowhead in Fig. 7 E). Therefore, the staining pattern of microtubule bundles with antitubulin and antibio- tin antibodies in the injected cell is almost identical. This ob- servation might give the impression that whole microtubules did turn over during the 2-h period after microinjection. However, it is difficult to distinguish between turnover of all microtubules in the bundle and turnover of a certain popula- tion of microtubules along the length of the bundle on a light microscopic level. Because in the photoactivation experi- ments presented later, we observed extreme suppression of turnover in microtubule bundles and the period necessary for total microtubule turnover well exceeded 2 h, it is likely that the observed similar pattern of staining with both antibodies would be the result of a partial turnover of microtubules along the length of bundles or a net addition of microtubules along the length due to introduction of excess tubulin by the microinjection.
Microtubule Turnover Is Extremely Suppressed in Microtubule Bundles Cells which showed anti-L3T4 staining 48 h after cotransfec- tion of p/~act2C and pCDM-L3T4 were microinjected with caged fluorescein-labeled tubulin together with rhodamine- labeled tubulin and incubated for 2.5-7 h to incorporate the label before photoactivation. From the microinjected cells, we chose cells in which microtubule bundles were observed by the rhodamine channel of immunofluorescence micros- copy, and locally photoactivated microtubule bundles with a 365-nm microbeam to generate a bar of fluorescence. Be- cause L3T4 staining was patchy and much weaker than the signal from rhodamine tubulin, it did not interfere with visu- alization of microtubule bundles in rhodamine channel.
First, the loss of fluorescence by photobleaching during the collection of sequential images was estimated by pho- toactivating the total area of an untransfected cell injected with caged fluorescein-labeled tubulin and by measuring the
The Journal of Cell Biology, Volume 120, 1993 456
on Decem
ber 4, 2015jcb.rupress.org
Dow
nloaded from
Published January 15, 1993

Figure 7. Double-label immunofluorescence of transfected cells after microinjection of biotin-labeled tubulin. (A and B) A cell fixed 5 min after microinjection; antitubulin (A) and antibiotin (B) staining. Biotin-tubulin was incorporated at the distal ends of preexisting microtubule bundles (arrows in A and B). Antibiotin antibody stained quite faintly the proximal portion of a small proportion of microtubule bundles (arrowheads in A and B). Many filamentous microtubules were formed throughout the cytoplasm. (C and D) A cell fixed 15 rain after microinjection; anti-tubulin (6") and antibiotin (D) staining. Distally incorporated biotin-tubulin formed bundled microtubule segments with distinct boundaries (arrowheads in C and D). (E and b') A cell fixed 2 h after microinjection. Antitubulin (E) and antibiotin (F) staining showed the same immunofluorescence pattern. Patchy staining on the cell surface by anti-L3T4 antibody remained after permeabilization (arrow in E). Microtubule bundles in the neighboring cell were also observed (arrowhead in E). Bar, 10 t~m.
Umeyama et al. Microtubules Bundled by MAP2C 457
on Decem
ber 4, 2015jcb.rupress.org
Dow
nloaded from
Published January 15, 1993

Figure 8. Photoactivation of an un- transfected cell after microinjection of caged fluorescein-labeled tubulin. Fluorescence images before activa- tion (pre), and at 0, 6, and 20 min after activation. Activated bar of flu- orescence (arrow) reduced its inten- sity rapidly. Bar, 10 txm.
total fluorescence intensity just after activation and after illu- mination with blue light for 3 s. This irradiation condition was the same as that in the following observations. We found that the amount of photobleaching after 3 s of illumination was only 4 %. Furthermore, because free tubulin across the photoactivated region would diffuse away in a few seconds, the fluorescence decay observed after photoactivation indi- cates the turnover of microtubules.
In untransfected cells, the activated bar of fluorescence re- duced its intensity rapidly (Fig. 8), and 73 % of the fluores- cent signal was lost 20 min after activation (Fig. 12 A). This result indicates that microtubules in untransfected COS cells turn over very rapidly.
In MAP2C expressing cells, the photoactivated bar of fluorescence within microtubule bundles showed little decay
(Fig. 9). The mean signal intensities were 95% and 86% at 40 and 80 min, respectively, relative to fluorescence inten- sity at 0 min (n = 9), and even 120 min after photoactivation 82% of mean fluorescence was observed (n = 7) (Fig. 12 A). The turnover of microtubules in the microtubule bundles would be affected by the expression level of MAP2C which should be considerably different from cell to cell. However, compared with untransfected cells, the above result indicates that the turnover of microtubules in microtubule bundles is extremely suppressed.
The fluorescent bar that exhibited sharp margins just after photoactivation gradually became digitated at the margins and wider along the bundles, indicating that microtubules slid relative to each other in the microtubule bundles. The overall position of the activated region occasionally changed with time, but this movement was largely due to transloca- tion of the whole bundle structure, which was observed with rhodamine fluorescence signals (arrows and arrowheads in Fig. 9). Comparing the images of bundles before activation with those ~2 h after activation in the rhodamine channel, we sometimes observed the disappearance of bundles (aster- isk in Fig. 10) or the appearance of new bundles (data not shown). Our preliminary experiments with sequential obser- vations of microtubule bundles revealed that lateral associa- tion or dissociation of preexisting bundles took place to de- crease or increase the total number of bundles (data not shown).
Although microtubule turnover was extremely suppressed in the microtubule bundles, stochastic disassembly of micro- tubules at their plus ends (Mitchison and Kirschner, 1984) or very slow coordinate disassembly at their minus ends pro- moted by so-called "treadmilling" (Margolis and Wilson, 1978; Bergen and Borisy, 1980; Rothwell et al., 1985; Ho- tani and Horio, 1988) might occur. For sensitive detection of such phenomena, we photoactivated the proximal or distal ends of microtubule bundles, where microtubule ends are likely to be concentrated. First, activated bars of fluores- cence were placed at both the middle portion and distal end, and subsequently the fluorescence intensities were compared at the time points of 40, 80, and 120 min (Fig. 10). Fluores- cence decay was highly suppressed and any difference in its rate was not evident between these two sites (Fig. 12 B). Sec- ond, we analyzed the fluorescence decay after photoactiva- tion at the middle position and proximal end of microtubule bundles (Fig. 11). Similarly, both sites exhibited extreme suppression of fluorescence decay with no apparent differ- ence in their rates (Fig. 12 C). These results indicated that microtubule turnover was evenly suppressed along the length of microtubule bundles, and the exchange of tubulin subunits was not prominent even at the region where microtubule ends are supposed to be concentrated. Accordingly, end- mediated microtubule turnover was not prominent in cells transfected with pBact2C.
If the turnover rate of endogenous tubulin is similar to the observed rate of photoactivated tubulin, only *20 % of tubu-
Figure 9. Photoactivation of microtubule bundles in a transfected cell after microinjection of caged fluorescein-labeled tubulin and rhodamine-labeled tubulin. Whole microtubule bundle images by rhodamine fluorescence signals before activation (F) and 120 min after activation (G). Fluorescence images in fluorescein channel before photoactivation (E) and at 0, 40, 80, and 120 min after activation (A-D). Arrows and arrowheads indicate the position of activated regions. Fluorescence decay in activated bars was largely suppressed. Bar, 10/zm.
The Journal of Cell Biology, Volume 120, 1993 458
on Decem
ber 4, 2015jcb.rupress.org
Dow
nloaded from
Published January 15, 1993

Umeyama et al. Microtubules Bundled by MAP2C 459
on Decem
ber 4, 2015jcb.rupress.org
Dow
nloaded from
Published January 15, 1993

lin in bundles would have turned over at the time of photoac- tivation, namely 2-4 h after microinjection. This experimen- tal condition raises the possibility that photoactivation experiments report dynamics of specific subsets of microtu- bules in the bundles. However, we think that the extreme sup- pression of microtubule turnover is not an artifact for the fol- lowing reasons. First, we detected no difference in the decay of fluorescence when injected cells were incubated >7 h after injection. Second, quantitative analysis of microtubule de- polymerization induced by nocodazole treatment has shown a similar rate of microtubule turnover (Takemura et al., manuscript submitted for publication). Although care should be taken when interpreting subtle differences in the turnover rate, a profound increase of microtubule stability due to MAP2C expression seems to be evident.
Discussion
Molecular Structure of MAP2C
At the carboxyl-terminal side of the splicing site, mouse MAP2C retained a proline-rich domain and the following se- quences including three imperfect repeats of MAP2A. It was reported that the fragment expressed in F~cherichia coli con- taining the three imperfect repeats could bind to microtu- bules (Lewis et al., 1988), and that octadecapeptides corre- sponding to the second repeat could nucleate and elongate microtubules (Joly et al., 1989). Furthermore, this repeated sequence is highly conserved among MAP2A, 2C, tau and MAP4 (MAP-U) (Lewis et al., 1988; Lee et al., 1988; Aizawa et al., 1990; Chapin and Bulinski, 1991), indicating its important role in the interaction with microtubules. It is also possible that the proline-rich domain adjacent to the repeated sequence has some role in microtubule binding. It has been revealed that the proline-rich domain in MAP4 (MAP-U) can promote microtubule assembly in spite of the fact that the formed microtubules have abnormal morphol- ogy (Aizawa et al., 1991). From the present data, the do- mains that effectively bind to microtubules and promote microtubule assembly are the repeated sequence and adja- cent proline-rich region, and are conserved in the carboxyl- terminal region of MAP2C. Our transfection study using deleted tan cDNA also supports this conclusion (Kanai et al., 1992).
The amino-terminal side of the splicing site was shown to be a characteristic domain of binding to cAMP dependent protein kinase via regulatory subunit II (Obar et al., 1989; Rubino et al., 1989). Consequently, mouse MAP2C retains the two well-known functional domains of high molecular weight MAP2 in the amino- and carboxyl-terminals of the splicing site, respectively.
Figure la Photoactivation of the middle part and distal end of a microtubule bundle. Whole bundle images before (A) and 120 min after activation (G) by rhodamine signals. Fluorescein signals be- fore activation and at 0, 40, 80, and 120 rain after activation (B-F). Arrows and arrowheads indicate the activated positions at the mid- dle and distal end of a bundle, respectively. A short microtubule bundle (asterisk in A) became associated with a neighboring bundle in 120 rain (G). Bar, 10 ~tm.
The Journal of Cell Biology, Volume 120, 1993 460
on Decem
ber 4, 2015jcb.rupress.org
Dow
nloaded from
Published January 15, 1993

Figure I1. Photoactivation of the middle part and proximal end of a microtubule bundle. Whole bundle images before (A) and 80 rain after activation (F) by rhodamine signals. Fluorescein signals be- fore activation and at 0, 40, and 80 rnin after activation (B-E). Ar- rows and arrowheads indicate the activated positions at the middle and proximal end of a bundle, respectively. Bar, 10/~m.
Mechanism of Microtubule Bundling by MAP2C
It is apparent that the mere stabilization of microtubules in- duces reorganization of microtubule arrays into parallel alignment independent of centrosomes, because drugs which stabilize microtubules, such as taxol, can induce this altered organization in fibroblasts (Schiff and Horwitz, 1980; De Brabander et al., 1981). However, it is still possible that
MAP2 and tan molecules have some additional role in microtubule bundling. When we compared microtubule or- ganization in MAP2A, 2C and tan eDNA transfected cells with that in taxol stabilized cells, some differences were ob- served. In other words, bundling of almost all interphase splayed microtubules and complete depletion of filamentous microtubules, which are observed in MAP2A, 2C or tan ex- pressing cells, are not prominent in taxol-stabilized cells. These observations suggest that MAP2 and tau have the abil- ity to associate adjacent microtubules more actively.
It has been reported that 1,758-1,780 amino acids of MAP2A (corresponding to 397-419 amino acids of MAP2C) are the responsible domain for microtubule bundling (Lewis et al., 1989; Lewis and Cowan, 1990). This conclusion was mainly derived from the observation that the minimal con- struct capable of bundling microtubules contains amino acids of 1-227 and 1,622-1,791 of MAP2A, and constructs lacking some amino acids within the region of 1,758-1,790 failed to bundle microtubules. In this study, we succeeded in further narrowing down the domain involved in microtu- bule bundling, because the construct containing only 1-25, 260-393 and 464-467 of MAP2C (1-25, 1,621-1,754, 1,825- 1,828 of MAP2A) induced closely packed microtubule bun- dies and the depletion of dispersed cytoplasmic micro- tubules, in a way indistinguishable from the construct con- taining the full sequences. This indicates that repeated region plus proline rich region are essential for microtubule bundling.
It is known that the microtubule binding domains of MAP2A, 2C and tau, which are rich in positively charged residues, interact with the negatively charged earboxyl- terminal regions of tubulin molecules exposed on the wall of the microtubule structure (Maccioni et al., 1988). It is possi- ble that the neutralization of the negative charge along the microtubule wall inhibits the repulsion between adjacent microtubules and has some effect on the formation of tightly packed bundles observed in transfected cells. It should be mentioned, however, that our study does not rule out the pos- sibility that, in addition, some intrinsic proteinous compo- nents in fibroblasts might work as active cross-linkers as sug- gested by Chapin et al. (1991).
Concerning the role of projection domains at the amino- and carboxyl-terminals of the MAP2C molecule, it is possi- ble that these domains have some active roles in microtubule bundling, because constructs containing these domains have a higher efficiency of microtubule bundling. Our recent quan- titative study on the efficiency of microtubule bundling using transfection of systematic deletion mutants of tau eDNA showed a marked reduction of microtubule bundling efficiency in the case of NH2-terminal neutral region deleted tau eDNA, and the COOH-terminal 60 amino acids deleted tan eDNA (full "o39%, NH2-terminal deletion "o8%, COOH- terminal deletion ,o5 %) also supports this possibility (Kanal et al., 1992).
Behavior of Exogenously Introduced Tubulin Molecules in MAP2C Transfected Cells
When we injected biotin tubulin into MAP2C transfected cells, numerous short microtubules oriented randomly to the microtubule organizing center were observed shortly after injection. Recently, we showed that MAP2C reduces the crit- ical concentration for microtubule polymerization in vitro
Umeyama et al. Microtubules Bundled by MAP2C 461
on Decem
ber 4, 2015jcb.rupress.org
Dow
nloaded from
Published January 15, 1993

%
1 0 0
. -
4.- 8 O ID
r -
6 0 0 v c - O N 40 @
0 : ~ 2 0
u .
0 L . _ ~ �9 �9 410 I I I _ I I i I J
A 0 8 0 1 2 0
Time rain
% 1oo
>., 90 ....,,
~ 8o
~ 70
~ 60
_~= 5o
I I I I ] J I I I l I I I
0 4 0 8 0 ~ 2 0 min B Time
%
90
8O
7O
~, 6O c=
5O
I I I I I I I i
C 0 40 8o rain Time
Figure 12. Time course of fluorescence intensity after photoactiva- tion. (A) Percent of fluorescence intensity after activation in a bar of fluorescence in an untransfected cell (0, 6, and 20 min)(,.), and that in bars of fluorescence in transfected ceils (n = 9 in 0, 40, and 80 min; n = 7 in 120 min; mean + SD) (o). Fluorescence decay was extremely suppressed in transfected cells compared with that in the untransfected cell. Fluorescence intensities were not cor- rected for the amount of photobleaching during image acquisition, which was estimated to be '~4 % after collection of three frames. (B) Percent of fluorescence intensity after activation in bars of fluorescence at the middle (o) and distal end (u) of the microtu- bule bundle shown in Fig. 10, at 0, 40, 80, and 120 min. The fluores- cence decay does not show any apparent difference between these two sites. (C) Percent of fluorescence intensity after activation in
(Takeuchi et al., 1992). Therefore, in cells expressing MAP2C, MAP2C is expected to promote microtubule poly- merization and deplete unassembled tubulin molecules. Ac- cordingly, abrupt increase in the free tubulin concentration after microinjection would easily exceed the critical concen- tration and induce spontaneous nucleation in transfected cells. Similar events were observed in fibroblasts which had been injected with tan protein and were recovered from nocodazole treatment (Drubin and Kirschner, 1986). In that case, spontaneous nucleation was driven by the presence of tau protein and the rapid release of free tubulin molecules after the washout of nocodazole.
Besides free nucleation of microtubules, incorporation of biotin tubulin at the distal part of microtubule bundles was consistently observed. Because this incorporation was evi- dent immediately after injection (Fig. 7, A and B), this phenomenon is likely not to be due to association of preformed microtubule segments to the distal parts of bun- dies, but rather to direct assembly of free tubulin molecules at the ends of individual microtubules. This observation indi- cates concentrated distribution of available microtubule ends at the distal parts of bundles.
We could hardly detect the incorporation of biotin tubulin at the proximal ends of microtubule bundles. We think that this is due to capping of microtubule ends at that region, be- cause we observed the assembly of exogenously applied bio- tin tubulin both at the distal and proximal ends of microtu- bule bundles in permeabilized cells, where substances which capped microtubule ends would be extracted (Umeyama et al., unpublished results). Interestingly, we previously re- ported the incorporation of free tubulin mainly at the distal ends of microtubules in neurites of PC12 cells (Okabe and Hirokawa, 1988). Although the underlying mechanism of microtubule capping is not clear, it is possible that both sys- tems share a common mechanism.
As the incubation time after microinjection lengthened, we observed the disappearance of free microtubules in the cytoplasm and the progressive increase of staining of bun- dles with anti-biotin antibody along their length. The ob- served increase of staining within bundles would be driven by two mechanisms. First, as we demonstrated by photoacti- vation experiments, very slow turnover of endogenous tubu- lin would result in the replacement of unlabeled microtu- bules with microtubules containing biotin. Second, free microtubule segments formed shortly after injection would gradually change their position and associate with preexist- ing bundles. Our preliminary experiments of sequential ob- servations of microtubule bundles in living cells revealed a gradual rearrangement of microtubule bundles by lateral as- sociation or splitting of bundles (Umeyama et al., unpub- lished results), suggesting the possibility of the lateral as- sociation of free microtubule segments or short bundles with thick bundles.
Suppression of Microtubule Turnover by MAP2C
We presented here direct evidence that the over-expression
bars of fluorescence at the middle (o) and proximal end (m) of the microtubule bundle shown in Fig. 11, at 0, 40, and 80 min. The fluorescence decay does not show any difference between these two sites.
The Journal of Cell Biology, Volume 120, 1993 462
on Decem
ber 4, 2015jcb.rupress.org
Dow
nloaded from
Published January 15, 1993

of a single MAP species results in marked suppression of microtubule turnover in vivo by the method of photoactiva- tion. This result is consistent with the report of Lewis et al. (1989), which showed increased stability of microtubules to microtubule depolymerizing drugs in cells transfected with MAP2A cDNA. It is widely accepted that microtubules in nerve cells, where neuronal MAPs including MAP2 are ex- pressed, are more stable than those in undifferentiated cells, and a possible role of neuronal MAPs in microtubule stabili- zation in vivo has been postulated. However, there have been some discrepancies between previous reports using the tech- nique of microinjection of biochemically purified MAP mol- ecules. Studies using microinjection of fluorescently-labeled MAP2 showed no effect of injected MAP2 on microtubule stability (Vandenbunder and Borisy, 1986; Olmsted et al., 1989). On the other hand, Drubin and Kirschner (1986) reported partial stabilization of microtubules by tau protein injected into fibroblasts. The variable effects of injected MAPs would be explained by the difference in MAP concen- tration, because the amount of introduced molecules would be rather small in the case of microinjection. Transfection of MAP2 or tau cDNA would result in extensive and prolonged expression of these molecules, and would also induce promi- nent stabilization of microtubules. This explanation would be reinforced by the fact that microtubule bundles, induced by transfection of MAP2 or tau cDNA, were not formed in cells injected with MAP2 or tau proteins, because microtu- bule bundling correlates well with the expression level of MAP molecules in transfected cells. So far, our experiments indicate that MAP2C has the ability to stabilize microtu- bules in vivo, and the increased stability of microtubules in nerve cells can partly be explained by the expression of MAP2 or some other related molecules.
Our photoactivation experiments indicate that, even at a very slow rate, microtubules within bundles do exchange subunits. Two possible mechanisms of the microtubule turn- over can be considered. One is stochastic assembly-dis- assembly of microtubules at their ends, namely dynamic in- stability (Mitchison and Kirschner, 1984). We think the dynamic phase transition of microtubule growth is highly suppressed in bundles, because distal ends of microtubule bundles where available microtubule ends were concen- trated, did not show a faster exchange of tubulin subunits. This is in agreement with previous in vitro studies which showed that MAPs suppress the phase transition of microtu- bule growth/shrinkage (Horio and Hotani, 1986). Another model of microtubule turnover is treadmilling, which pre- dicts the net addition and loss of tubulin subunits at the oppo- site ends. This process is also an end-mediated one, and therefore would generate an enhanced turnover rate at the ends of microtubule bundles. However, multiple photoacti- vation experiments on individual bundles could not detect any difference in turnover rate along the length of microtu- bule bundles. As for the possibility of treadmilling, it should be noted that its reported flux rate of treadmilling was very slow, ranging from 0.69 to 3.4 ttm/h (Margolis et al., 1978; Bergen and Borisy, 1980; Rothwell et al., 1985; Hotani and Horio, 1988). Because these values would be beyond our ex- perimental resolution, whether treadmilling did occur or not could not be conclusively determined.
The fact that photoactivated bars of fluorescence changed their shape into a digitated pattern indicates that microtu-
bules in bundles slid with each other. This microtubule slid- ing would be explained by the two possible mechanisms. First, microtubule-activated motor proteins, such as kinesin or cytoplasmic dynein or kinesin family protein, might drive microtubule sliding. By the real time imaging of microtubule bundles we observed that bundled microtubule segments in the cytoplasm, which were not connected to microtubule or- ganizing centers, were gradually ordered radially and trans- ported toward the periphery of the cells (Takemura and co- workers, unpublished results). These results suggest that motor activity is present on the microtubules in transfected cells and stabilized microtubules are transported toward the periphery of the cells.
Second, some microtubules in microtubule bundles are anchored to cell membrane and translocated passively by the motility of cells. Our preliminary observation revealed that microtubule bundles in the region where cells changed their shape actively tended to change their appearance in their width and length (data not shown). This observation sup- ports the idea of passive pulling of microtubules by cell mo- tility, possibly related to actin-based movements. Which mechanism really acts in transfected cells is an interesting is- sue, but more detailed study would be needed to elucidate this problem.
Possible Role of MAP2C on Neuronal Microtubule Organization
Because MAP2C is expressed in immature neurons, this molecule is likely to play a role in the terminal differentiation or formation of the characteristic shape of nerve cells, namely process elongation. Recently, Dinsmore and Solo- mon (1991) showed that suppression of MAP2C expression results in the failure of embryonal cartinoma cells to stop cell duplication. It is possible that MAP2C inhibits cell division of neuronal precursor cells through stabilization of microtu- bule networks and induces neuronal differentiation. It is also likely that MAP2C plays some role in the sprouting and growth of neuronal processes, because microtubules in the shafts of neurons are more stable compared with those in cell body and growth cones (Bamburg et al., 1986; Lim et al., 1989), and the equilibrium shift of the microtubule monomer-polymer exchange toward a polymerized state would facilitate a net microtubule increase in neurites.
We found extreme and homogenous suppression of tubulin turnover along the entire length of microtubule bundles in fibroblasts overexpressing MAP2C. In authentic developing neurons, where MAP2C is specifically expressed, microtu- bules are partially stabilized but include a certain proportion which continue to turn over. Especially at the growth cone where the parallel alignment of microtubules in neurites ter- minates, active growth and shrinkage of individual microtu- bules were evident (Tanaka and Kirschner, 1991). These ob- servations indicate that microtubules in neurons are not simply stabilized but continue to turn over actively in a pat- tern specific for each neuronal subdomain. Such controlled microtubule stabilization would be important for the essen- tial functions of immature neurons, such as a net increase of axonal components, steering activity of growth cones, and remodeling of the neuronal form.
Because differential stability and controlled growth of mi- crotubules were not evident in MAP2C transfected cells,
Umeyama et al. Microtubules Bundled by MAP2C 463
on Decem
ber 4, 2015jcb.rupress.org
Dow
nloaded from
Published January 15, 1993
these rather sophisticated phenomena would require some neuron-specific factors other than microtubules and MAP2C. One possibility is that precise control of the MAP2C expres- sion level is an important factor for the regulation of micro- tubule stability. In our transfection system, the expression level of MAP2C was not controlled and seemed to be very high even when compared with immature neurons containing MAP2C at the highest concentration. It is very likely that a moderate or regulated expression of MAP2C induces more dynamic microtubule bundles. However, the establishment of such a system would be beyond the scope of our present study. Second, post-translational modification of MAP2C such as phosphorylation, or specific association with other macromolecules such as cAMP dependent protein kinase, might control the microtubule stabilizing activity of MAP2C. Third, it may also be possible that other neuron specific mi- crotubule related proteins such as neuron specific MAPs and motor proteins are involved in the determination of microtu- bule dynamics.
We think all of the above possibilities are somehow related to the differential stability of microtubules in authentic neu- rons. Although MAP2C-transfected fibroblasts provide an ideal system for analyzing the effects of this molecule on microtubules in vivo, the resulting bundles have limited characteristics of microtubules in nerve cell processes, and further characterization of additional factors which regulate the differential stabilization of microtubules would be neces- sary to understand the mechanism of cytoskeletal assembly during development.
We wish to thank Dr. T. Kurokawa, Department of Orthopedics, Univer- sity of Tokyo, for encouragement and support, and Dr. M. Furutani, Department of Immunology, University of Tokyo, for his help in immuno- logical methods and discussion. We thank Dojindo Laboratories for provid- ing caged fluorescein; Drug Synthesis and Chemistry Branch, Develop- mental Therapeutics Program, Division of Cancer Treatment, National Cancer Institute, for providing Taxol.
This work was supported by a Special Grant-in-Aid for Scientific Re- search from the Ministry of Education, Science and Culture of Japan, and grants from RIKEN and the Naito Memorial Science Foundation to N. Hirokawa.
Received for publication 19 May 1992 and in revised form 1 October 1992.
References
Aizawa, H., Y. Emori, H. Murofushi, H. Kawasaki, H. Sakai,and K. Suzuki. 1990. Molecular cloning of a ubiquitously distributed microtubule- associated protein with Mr 190,000 J. Biol. Chem. 265:13849-13855.
Aizawa, H., Y. Emori, A. Mori, H. Murofushi, H. Sakai, andK. Suzuki. 1991. Functional analyses of the domain structure of microtubule-associated protein-4 (MAP-U). J. Biol. Chem. 266:9841-9846.
Bamburg, J. R., D. Bray, and K. Chapman. 1986. Assembly of microtubules at the tip of growing axons. Nature (Loud.). 321:788-790.
Bergen, L. G., and G. G. Borisy. 1980. Head-to-tail polymerization of microtu- bules in vitro. J. Cell Biol. 84:141-150.
Caceres, A., and K. S. Kosik. 1990. Inhibition of neurite polarity by tau an- tisense oligonucleotides in primary cerebellar neurons. Nature (Loud.). 343:461--463.
Chapin, S. J., and J. C. Bulinski. 1991. Non-neuronal 210 x 103 Mr microtubule-associated protein (MAP4) contains a domain homologous to the microtubule-binding domain of neuronal MAP2 and Tau. J. Cell Sci. 98:27-36.
Chapin, S. J., J. C. Bulinski, and G. G. Gundersen. 1991. Microtubule bun- dling in cells. Nature (Lond.). 349:24.
Couchie, D., and J. Nunez. 1985. Immunological characterization of microtubule-associated proteins specific for the immature brain. FEBS (Fed. Eur. Biochem. Soc.) Lett. 188:331-335.
De Brabander, M., G. Geuens, R. Nuydens, R. Willebrords, and J. De Mey. 1981. Taxol induces the assembly of free microtubules in living cells and
blocks the organizing capacity of the centrosomes and kinetochores. Proc. Natl. Acad. Sci. USA. 78:5608-5612.
Dialynas, D. P., Z. S. Quan, K. A. Wall, A. Pierres, J. Quint~ns, M. R. Loken, M. Pierres, and F. W. Fitch. 1983. Characterization of the murine T Cell surface molecule, designated L3T4, identified by monoclonal antibody GK1.5: similarity of L3T4 to the human Leu-3/T4 molecule. J. Immunol. 131:2445-2451.
Dinsmore, J. H., and F. Solomon. 1991. Inhibition of MAP2 expression affects both morphological and cell division phenotypes of neuronal differentiation. Cell. 64:817-826.
Drubin, D. G., and M. W. Kirschner. 1986. Tau protein function in living cells. J. Cell Biol. 103:2739-2746.
Fregien, N., and N. Davidson. 1986. Activating elements in the promoter re- gion of the chicken/3-actin gene. Gene (Amst.). 48:1-11.
Garner, C. C., B. Brugg, and A. Matus. 1988. A 70-kilodalton microtubule- associated protein (MAP2c), related to MAP2. 1988. J. Neurochem. 50:609-615.
Garner, C. C., and A. Matus. 1988. Different forms of microtubule-associated protein 2 are encoded by separate mRNA transcripts. J. Cell Biol. 106:779-783.
Hirokawa, N. 1982. The crosslinker system between neurofilaments, microtu- boles and membranous organelles in frog axons revealed by quick freeze, freeze fracture, deep-etching method. J. Cell Biol. 94:129-142.
Hirokawa, N., S. Hisanaga, and Y. Shiomura. 1988a. MAP2 is a component of crossbridges between microtubules and neurofilarnents in the neuronal cytoskeleton: quick-freeze, deep-etch immunoelectron microscopy and reconstitution studies. J. Neurosci. 8:2769-2779.
Hirokawa, N., Y. Shiomura, and S. Okabe. 1988b. Tau proteins: the molecular structure and mode of binding on microtubules. J. Cell Biol. 107:1449- 1461.
Hirokawa, N. 1991. Molecular architecture and dynamics of the neuronal cytoskeleton. In Neuronal Cytoskeleton. R. D. Burgoyne, editor. Wiley Liss Inc., New York. 5-74.
Horio, T., and H. Hotani. 1986. Visualization of the dynamic instability of in- dividual microtubules by dark-field microscopy. Nature (Lond.). 321:605- 607.
Hotani, H., and T. Horio. 1988. Dynamics of microtubules visualized by darkfleld microscopy: treadmilling and dynamic instability. Cell Motil. Cytoskel. 10:229-236.
Joly, J. C., G. Flynn, and D. L. Purich. 1989. The microtubule-binding frag- ment of microtubule-associated protein-2: location of the protease-accessible site and identification of an assembly-promoting peptide. J. Cell Biol. 109:2289-2294.
Kanai, Y., R. Takemura, T. Oshima, H. Mori, Y. Ihara, M. Yanagisawa, T. Masaki, and N. Hirokawa. 1989. Expression of multiple tan isoforms and microtubule bundle formation in fibroblasts transfected with a single tau eDNA. J. Cell Biol. 109:1173-1184.
Kanal, Y., J. Chen, and N. Hirnkawa. 1992. Microtubule bundling by tau pro- teins in vivo: analysis of functional domains. EMBO (Eur. Mol. Biol. Or- gan.) J. 11:3953-3961.
Kellogg, D. R., T. J. Mitchison, and B. M. Alberts. 1988. Behaviour of microtubules and actin filaments in living Drosophila embryos. Develop- ment. 103:675-686.
Kindler, S., B. Schultz, M. Goedert, and C. C. Garner. 1990. Molecular struc- ture of microtubule-associated protein 2b and 2c from rat brain. J. Biol. Chem. 265:19679-19684.
Kirschner, M., and T. Mitchison. 1986. Beyond self assembly: from microtu- bules to morphogenesis. Cell. 45:329-342.
Knops, J., K. S. Kosik, G. Lee, J. D. Pardee, L. Cohen-Gould, and L. McCon- logue. 1991. Overexpression of Tan in a nonneural cell induces long cellular processes. J. Cell Biol. 114:725-733.
Kost, T. A., N. T. Theodoralds, and S. H. Hughes. 1983. The nucleetide se- quence of the chick cytoplasmic /5-actin gene. Nucleic. Acids Res. 11: 8287-8301.
Kristofferson, D., T. Mitchison, and M. Kirschner. 1986. Direct observation of steady-state microtubule dynamics. J. Cell Biol. 102:1007-1019.
Lee, G., N. Cowan, and M. Kirschner. 1988. The primary structure and hetero- geneity oftau protein from mouse brain. Science (Wash. DC). 239:285-288.
Lee, G., R. L. Neve, and K. S. Kosik. 1989. The microtubule binding domain of tau protein. Neuron. 2:1615-1624.
Lewis, S. A., A. Viilasante, P. Sherline, and N. J. Cowan. 1986. Brain-specific expression of MAP2 detected using a cloned eDNA probe. J. Cell Biol. 102:2098-2105.
Lewis, S. A., D. Wang, and N. J. Cowan. 1988. Microtubule-associated pro- tein MAP2 shares a microtubule binding motif with tau protein. Science (Wash. DC). 242:936-939.
Lewis, S. A., I. E. Ivanov, G. H. Lee, and N. J. Cowan. 1989. Organization of microtubules in dendrites and axons is determined by a short hydrophobic zipper in microtubule-associated proteins MAP2 and tau. Nature (Lond.). 342:498-505.
Lewis, S. A., and N. Cowan. 1990. Microtubule bundling. Nature (Lond.). 345:674.
Lira, S. S., P. J. Sammak, and G. G. Borisy. 1989. Progressive and spatially differentiated stability of microtubules in developing neuronal cells. J. Cell Biol. 109:253-263.
The Journal of Cell Biology, Volume 120, 1993 464
on Decem
ber 4, 2015jcb.rupress.org
Dow
nloaded from
Published January 15, 1993

Lim, S. S., K..L Edson, P. C. Letourneau, and G. G. Borisy. 1990. A test of microtubule translocation during neurite elongation. J. Cell Biol. I I l: 123-130.
Littman, D. R., and S, N, C-cttuer. 1987, Unusual intron in the immunoglobulin domain of the newly isolated routine CD4 (L3T4) gene. Nature (Lond.). 325:453-455.
Maccioni, R. B., C. I. Rivas, and J. C. Vera. 1988. Differential interaction of synthetic peptides from the carboxyi-terminal regulatory domain of tubulin with microtubule-associated proteins. EMBO (Eur. Mol. BioL Organ.) J. 7:1957-1963.
Margolis, R. L., and L. Wilson. 1978. Opposite end assembly and disassembly of microtubules at steady state in vitro. Cell. 13:1-8.
Maniatis, T., E. F. Fritsch, and I. Sambrook. 1989. Molecular cloning: A Lab- oratory Manual. Cold Spring Harbor Laboratory, Cold Spring Harbor, NY.
Mitchison, T., and M. Kirschner. 1984. Dynamic instability of microtubule growth. Nature (Lond.). 312:237-242.
Mitchison, T. J. 1989. Polewards microtubule flux in the mitotic spindle: evi- dence from photoactivation of fluorescence. J. Cell Biol. 109:637-652.
Neve, R. L., P. Harris, K. S. Kosik, D. M. Kuroit, and T. A. Donlon. 1986. Identification of eDNA clones for the human microtubule-associated protein tan and chromosomal localization of the genes for tau and microtubule- associated protein 2. Mol. Brain Res. 1:271-280.
Obar, R. A., J. Dingus, H. Bayley, and R. B. Vallee. 1989. The RII subunit of cAMP-dependent protein kinase binds to a common amino-terminal do- main in microtubule associated proteins 2A, 2B, and 2C. Neuron. 3: 639-645.
Okabe, S., and N. Hirokawa. 1988. Microtubule dynamics in nerve ceils: anal- ysis using microinjection of biotinylated tubulin into PC 12 cells. J. Cell Biol. 107:651-664.
Ok, abe, S., and N. Hirokawa. 1990. Turnover of fluorescemly labelled tubulin and actin in the axon. Nature (Lond.). 343:479-482.
Okabe, S., and N. Hirokawa. 1992. Differential behavior of photoactivated microtubules in growing axons of mouse and frog neurons. J. Cell Biol. 117:105-120.
Olmsted, J. B. 1986. Microtubule-associated proteins. Annu. Rev. Cell Biol. 2:421-457.
OImsted, J. B., D. L. Stemple, W. M. Saxton, B. W. Neighbors, and J. R.
McIntosh. 1989. Cell cycle-dependent changes in the dynamics of MAP2 and MAP4 in cultured cells. J. Cell Biol. 109:211-223.
Papandrikopoulou, A., T. Doll, R. P. Tucker, C. C. Garner, and A. Matus. 1989, Embryonic MAP2 lacks the cross-linking sidearm sequences and den- dritic targeting signal of adult MAP2. Nature (Lond.). 340:650-652.
Rothwell, S. W., W. A. Grasser, and D. B. Murphy. 1985. Direct observation of microtubule treadmilling by electron microscopy. J, Cell Biol. 101: 1637-1642.
Rubino, H. M., M. Dammerman, B. Shafit-Zagardo, and J. Erlichman. 1989. Localization and characterization of the binding site for the regulatory subunit of type II cAMP-dependent protein kinase on MAP2: Neuron. 3:631-638.
Saiki, R. K., D. H. Gelfand, S. Stoffel, S. J. Scharf, R. Higuchi, G. T. Horn, K. B. Mullis, and H. A. Erlich. 1988, Primer-directed enzymatic amplifica- tion of DNA with a thermostable DNA polymerase. Science (Wash. DC). 239:487--491.
Schiff, P. B., and S. B. Horwitz. 1980. Taxol stabilizes microtubules in mouse fibroblast cells. Proc. Nail. Acad. Sci. USA. 77:1561-1565.
Schulzr E., and M. Kitschner. 1986. Microtubule dynamics in interphase cells. J. Cell Biol. 102:1020-1031.
Takeuchi, M., S. Hisanaga, T. Umeyama, and N. Hirokawa. 1992. The 72 kD microtubule associated protein from porcine brain. J. Neurochem. 58:1510-1516.
Tanaka, E. M., and M. W. Kirschner. 1991. Microtubule behavior in the growth cones of living neurons during axonal elongation. J. Cell Biol. 115:345-363.
Tucker, R. P., L. I. Binder, C, Viereck, B. A. Hemmings, and A. I. Matus. 1988. The sequential appearance of low- and high-molecular-weight forms of MAP2 in the developing cerebellum. J. Neurosci. 8:4503--4512.
Vandenbunder, B., and G. G. Borisy. 1986. Decoration of microtubules by fluorescentty labeled microtubule-associated protein 2 (MAP2) does not in- terfere with their spatial organization and progress through mitosis in living fibroblasts. Cell Motil. Cytoskeleton. 6:570-579.
Xie, H. 1984. Differences in the efficiency and stability of gene expression after transfection and nuclear injection: a study with a chick 6-crystalline gene. Cell Struct. Funct. 8:315-325.
Umeyama et al. Microtubules Bundled by MAP2C 465
on Decem
ber 4, 2015jcb.rupress.org
Dow
nloaded from
Published January 15, 1993


