Embed Size (px)
Citation preview
EASTSPRING INVESTMENTSSOCIÉTÉ D’INVESTISSEMENT À CAPITAL VARIABLELUXEMBOURG
AUDITED ANNUAL REPORTAS AT DECEMBER 31, 2014
26, boulevard RoyalL-2449 LuxembourgGrand Duchy of Luxembourg
R.C.S. Luxembourg B 81.110
No subscription can be received on the basis of this report. Subscriptions can be accepted only on the basis of the current Prospectus of the SICAV.

1
EASTSPRING INVESTMENTS
TABLE OF CONTENTS
Directory, Administration and Management 2General Information 3Report of the Board of Directors 4Report of the Investment Manager 5Report of the Réviseur d’Entreprises agréé 7Combined Statement of Net Assets 8Combined Statement of Operations and Changes in Net Assets 19Statement of Changes in Shares Outstanding 30Statistics 38Statement of Investments
Eastspring Investments – Asia Pacific Equity Fund(*) (“Asia Pacific Equity Fund”)Eastspring Investments – Asian Bond Fund (“Asian Bond Fund”)Eastspring Investments – Asian Dynamic Fund(*) (“Asian Dynamic Fund”)Eastspring Investments – Asian Equity Fund (“Asian Equity Fund”)Eastspring Investments – Asian Equity Income Fund (“Asian Equity Income Fund”)Eastspring Investments – Asian High Yield Bond Fund (“Asian High Yield Bond Fund”)Eastspring Investments – Asian Infrastructure Equity Fund (“Asian Infrastructure Equity Fund”)Eastspring Investments – Asian Local Bond Fund (“Asian Local Bond Fund”)Eastspring Investments – Asian Property Securities Fund(1) (“Asian Property Securities Fund”)Eastspring Investments – China Equity Fund (“China Equity Fund”)Eastspring Investments – Developed Asia Equity Fund(*) (“Developed Asia Equity Fund”)Eastspring Investments – Dragon Peacock Fund (“Dragon Peacock Fund”)Eastspring Investments – Emerging Asia Equity Fund(*) (“Emerging Asia Equity Fund”)Eastspring Investments – Emerging Europe, Middle East and Africa Dynamic Fund (“Emerging Europe, Middle East and Africa Dynamic Fund”)Eastspring Investments – European Investment Grade Bond Fund (“European Investment Grade Bond Fund”)Eastspring Investments – Global Bond Navigator Fund(*) (“Global Bond Navigator Fund”)Eastspring Investments – Global Emerging Markets Bond Fund(*) (“Global Emerging Markets Bond Fund”)Eastspring Investments – Global Emerging Markets Dynamic Fund (“Global Emerging Markets Dynamic Fund”)Eastspring Investments – Global Equity Navigator Fund(*) (“Global Equity Navigator Fund”)Eastspring Investments – Global Market Navigator Fund (“Global Market Navigator Fund”)Eastspring Investments – Global Technology Fund(*) (“Global Technology Fund”)Eastspring Investments – Greater China Equity Fund (“Greater China Equity Fund”)Eastspring Investments – Hong Kong Equity Fund (“Hong Kong Equity Fund”)Eastspring Investments – India Equity Fund (“India Equity Fund”)Eastspring Investments – Indonesia Equity Fund (“Indonesia Equity Fund”)Eastspring Investments – Japan Dynamic Fund (“Japan Dynamic Fund”)Eastspring Investments – Japan Equity Fund(*) (“Japan Equity Fund”)Eastspring Investments – Japan Fundamental Value Fund(*) (“Japan Fundamental Value Fund”)Eastspring Investments – Japan Smaller Companies Fund(*) (“Japan Smaller Companies Fund”) Eastspring Investments – Latin American Equity Fund (“Latin American Equity Fund”) Eastspring Investments – Malaysia Equity Fund(*) (“Malaysia Equity Fund”)Eastspring Investments – North America Fund(*) (“North America Fund”)Eastspring Investments – North American Value Fund (“North American Value Fund”)Eastspring Investments – Pan European Fund(*) (“Pan European Fund”)Eastspring Investments – Philippines Equity Fund(*) (“Philippines Equity Fund”)Eastspring Investments – Thailand Equity Fund (“Thailand Equity Fund”)Eastspring Investments – US Bond Fund(*) (“US Bond Fund”) Eastspring Investments – US Corporate Bond Fund (“US Corporate Bond Fund”)Eastspring Investments – US High Investment Grade Bond Fund (“US High Investment Grade Bond Fund”)Eastspring Investments – US High Yield Bond Fund (“US High Yield Bond Fund”)Eastspring Investments – US Investment Grade Bond Fund (“US Investment Grade Bond Fund”)Eastspring Investments – Vietnam Equity Fund(*) (“Vietnam Equity Fund”)Eastspring Investments – World Value Equity Fund (“World Value Equity Fund”)
Notes to the Financial Statements 191Appendices 207
(*) Not authorized in Hong Kong and not available to Hong Kong residents. (1) This Sub-Fund is not authorized by the Hong Kong Securities and Futures Commission under the Code on REITs, but is authorized under the Code on Unit Trusts and Mutual Funds. Such authorization is not a recommendation or endorsement of the Sub-Fund nor does it guarantee the commercial merits of the Sub-Fund or its performance. It does not mean the Sub-Fund is suitable for all investors nor is it an endorsement of its suitability for any particular investor or class of investors. Furthermore, the dividend/payout policy of this Sub-Fund is not a representative of the dividend/payout policy of the underlying REITs.
48506163666973758183858789
9193
102104113116117118121123125126128129131132133135136138140142143145148160166177184185
2
EASTSPRING INVESTMENTS
Board of Directors
ChairmanMr Graham David MASONExecutive Vice-ChairmanEastspring Investments
DirectorsMr Peter Martin LLOYDSenior AdviserPrudential Services Limited
Mrs Francine KEISERIndependent DirectorGrand Duchy of Luxembourg
Mr Manuel HAUSERIndependent DirectorGrand Duchy of Luxembourg
Administration and Management
Registered office26, boulevard RoyalL-2449 LuxembourgGrand Duchy of Luxembourg
Management CompanyEastspring Investments (Luxembourg) S.A.26, boulevard RoyalL-2449 LuxembourgGrand Duchy of Luxembourg
Board of Directors of the Management CompanyMr Graham David MASONExecutive Vice-ChairmanEastspring Investments
Mr Guy Robert STRAPPChief Executive OfficerEastspring Investments
Mr Hendrik Gerrit RUITENBERGExecutive OfficerEastspring Investments (Luxembourg) S.A.
Conducting Officers of the Management CompanyMr Hendrik Gerrit RUITENBERGExecutive OfficerEastspring Investments (Luxembourg) S.A.
Mr Christophe BÉCUECompliance OfficerEastspring Investments (Luxembourg) S.A.
Auditor of the Management CompanyKPMG Luxembourg, Société coopérative39 Avenue John F. KennedyL-1855 LuxembourgGrand Duchy of Luxembourg
Administration and Management (continued)
Investment ManagerEastspring Investments (Singapore) Limited10 Marina Boulevard #32-01Marina Bay Financial Centre Tower 2Singapore 018983
Investment Sub-ManagersFor European Investment Grade Bond Fund,Pan European Fund and World Value Equity Fund(for investments in Europe):M&G Investment Management LimitedLaurence Pountney Hill, London EC4R OHHUnited Kingdom
For Global Technology Fund:Henderson Global Investors Limited4 Broadgate, London EC2M 2DAUnited Kingdom
For China Equity Fund, Dragon Peacock Fund(for investments in the PRC), Greater China Equity Fundand Hong Kong Equity Fund:Eastspring Investments (Hong Kong) Limited13/F, One International Financial Centre1 Harbour View StreetCentral, Hong Kong
For North America Fund, North American Value Fund,US Bond Fund, US Corporate Bond Fund, US HighInvestment Grade Bond Fund, US High Yield Bond Fund,US Investment Grade Bond Fund and World Value EquityFund (for investments in the US):PPM America, Inc.225 West Wacker Drive, Suite 1200Chicago, Illinois 60606United States of America
Global DistributorEastspring Investments (Singapore) Limited10 Marina Boulevard #32-01Marina Bay Financial Centre Tower 2Singapore 018983
Custodian, Central Administration, Registrar and Transfer AgentThe Bank of New York Mellon (Luxembourg) S.A.Vertigo Building – Polaris2-4, rue Eugène RuppertL-2453 LuxembourgGrand Duchy of Luxembourg
Auditor of the SICAVKPMG Luxembourg, Société coopérative39 Avenue John F. KennedyL-1855 LuxembourgGrand Duchy of Luxembourg
Legal AdvisorClifford Chance10 boulevard G-D CharlotteL-1011 LuxembourgGrand Duchy of Luxembourg
DIRECTORY, ADMINISTRATION AND MANAGEMENT
3
EASTSPRING INVESTMENTS
Current ProspectusCopies of Eastspring Investments’ (the “SICAV”) Articles of Association and Prospectus dated November 2014 may be obtained, free of charge, from the Registered Office of the SICAV.
Please refer to the Prospectus dated November 2014 to have the current applicable terms and conditions.
The SICAV is governed by the Luxembourg Law dated December 17, 2010, as amended (the “2010 Law”). The SICAV complies with the provisions of Directive 2009/65/EC of the European Parliament and of the Council of July 13, 2009 on the coordination of laws, regulations and administrative provisions relating to undertakings for collective investment in transferable securities (UCITS).
Annual General MeetingThe annual general meeting of Shareholders of the SICAV will be held at the Registered Office of the SICAV or at such other place in Luxembourg on the second Friday of April in each year at 11 a.m., or if any such day is not a business day in Luxembourg, on the next following business day in Luxembourg.
Notices of all general meetings will be sent to the holders of registered Shares by post prior to the meeting at their addresses in the register of Shareholders.
The notices of all general meetings of Shareholders may be published in any newspapers as the Board of Directors may decide.
Report and AccountsThe financial year-end of the SICAV will be the last day of December of each year.
Audited annual reports will be published within 4 months after the financial year-end and unaudited semi-annual reports will be published within 2 months after the end of the relevant period. Such reports will be made available at the registered office of the SICAV during normal business hours.
Publication of PricesPrices are available on request at the registered office of the SICAV and on a daily basis on the website operated by the Management Company www.eastspring.lu. Prices are also available daily on Bloomberg and Reuters’ Lipper Hindsight. The SICAV will further arrange for regular publication of the prices in the Financial Times, or in such other newspapers as the Board of Directors may decide on.
Purchases and SalesA detailed list of investments purchased and sold for any Sub-Fund during the year is available upon request, free of charge, from the Registered Office of the SICAV.
GENERAL INFORMATION
4
EASTSPRING INVESTMENTS
REPORT OF THE BOARD OF DIRECTORSAs at December 31, 2014
Dear Shareholders,
I. Financial StatementsThe Directors would like to submit to you their report and the audited financial statements for the year ended December 31, 2014.
The audited financial statements are set out on pages 8 to 47 of this Annual Report, with results for the year appearing in the Combined Statement of Net Assets on pages 8 to 18 and the Combined Statement of Operations and Changes in Net Assets on pages 19 to 29.
II. Activities during the yearDuring the past year, the SICAV launched sixty one additional Classes of Shares and two new Sub-Funds. One Sub-Fund closed. As at December 31, 2014, assets equalled USD 23.986 billion for a total of 43 Sub-Funds and 326 Classes of Shares.
The performance of each Sub-Fund is provided in the Report of the Investment Manager.
III. Board of DirectorsThe Directors of the SICAV are listed on page 2. Two of the four Directors, serving as at December 31, 2014, are independent directors and free from any business or other relationship which could materially interfere with the exercise of their independent judgment.
The Board of Directors has delegated the management and operation of the SICAV to Eastspring Investments (Luxembourg) S.A., (the “Management Company”). The Management Company is entrusted with the day-to-day management of the SICAV, with responsibility for performing directly or by way of delegation all operational functions relating to the SICAV’s investment management, administration, risk management and marketing of the Sub-Funds.
The Directors are formally responsible for the Annual Report and the financial statements for each financial year, which are required under general principles to give a true and fair view of the state of affairs of the SICAV.
The Board of Directors would like to take this opportunity to thank the Shareholders for their on-going support.
Luxembourg,March 2015
5
EASTSPRING INVESTMENTS
REPORT OF THE INVESTMENT MANAGERAs at December 31, 2014
Dear ShareholdersDear Directors,
2014 began on a sombre note. The scaling back of the quantitative easing programme by the US Federal Reserve and renewed growth concerns in China undermined confidence in emerging markets. The sell down in emerging market assets sparked a global contagion. Subsequently, a reaffirmation from central banks of continuing easy monetary policies and signs of stabilisation in emerging markets lifted sentiment across the globe.
Nonetheless the year was marked by bouts of volatility. Rising geopolitical tensions, namely Russia’s intervention in Ukraine and the deepening unrest in Middle East coupled with disappointing growth and profits in Europe, China and Japan triggered intermittent sell-offs. As the year drew to a close, political tensions in Greece, the economic crisis in Russia and plunging oil prices sent global markets lower.
The intermittent sell-offs exposed value in a number of stocks; across regional Asia, there were strong valuation signals. Names linked to the global cycle were sold initially due to shorter term concerns for global growth. The valuation gap between defensive and cyclical stocks continued to remain wide.
Against this environment, global equities, as reflected by MSCI World, only rose by 5% in USD terms. US equities were 2014’s top performers led by indications of a nascent economic recovery and expectations that interest rates will remain low for longer. Over in Asia, star performers Indonesia, Philippines and India led the region higher. Positive election outcomes in India and Indonesia and improving macro conditions underpinned equities in these markets. Rating agency, Standard & Poor raised the Philippines sovereign rating by one-notch to BBB in recognition of the country’s strong fiscal and balance of payment metrics.
Meanwhile Japan equities had a challenging year, underpinned by lacklustre economic growth. Bank of Japan’s surprise move in October to expand its quantitative easing programme fuelled a rally in domestic equities. As a result, Japan had a good year in Yen terms but posted losses in USD terms. European equities too posted losses, plagued by the region’s high unemployment and growth woes. Speculation over whether the European Central Bank will implement additional stimulus was another factor driving market volatility in Europe during the second half of the year.
One of 2014’s biggest surprises was the decline in global bond yields. Instead of the anticipated rise in US interest rates, 10-year Treasuries rallied. Shrinking flows of government debt instruments may have also helped lower yields against a backdrop of growing liquidity. Asian local rates experienced declines (generally in tandem with US bond yields). In some Asian markets, domestic factors aided the rallies. On the whole the Asian USD bond market delivered a strong gain underpinned by coupon income while unexpected declines in longer term US interest rates also helped lift performance. Most Asian currencies too slid against the US dollar in 2014. While the US dollar was a beneficiary of the optimism surrounding the US economy, various unique reasons caused the Asian currencies to depreciate throughout the year.
With the US quantitative easing over and the US Federal Reserve closer to its first rate hike, 2015 looks set to be another interesting year. While the Fed’s move has been well anticipated, it could prove challenging should the Fed raise rates more rapidly than anticipated. Such a move would likely be disruptive for bonds, select currencies and expensive sectors of the global equity markets that have benefited from the existing zero interest rate regime.
That said, falling oil and robust US growth will likely support corporate profits and enhance the attractiveness of global equities in 2015. Bonds on the other hand may experience heightened volatility as US rate hike fears wax and wane. Nonetheless the shape and pace of rate increases do matter. In this “soft” cycle, bond carry should provide a decent source of return, while opportunities in select Asian bonds should provide “alpha” return enhancements.
6
EASTSPRING INVESTMENTS
REPORT OF THE INVESTMENT MANAGERAs at December 31, 2014 (continued)
Sub-Fund Benchmark* Inception Date
1Y Fund
1Y Bench-
mark3Y
Fund
3Y Bench-
mark5Y
Fund
5Y Bench-
mark
Since Incep-
tion Fund
Since Incep-
tion Bench-
mark
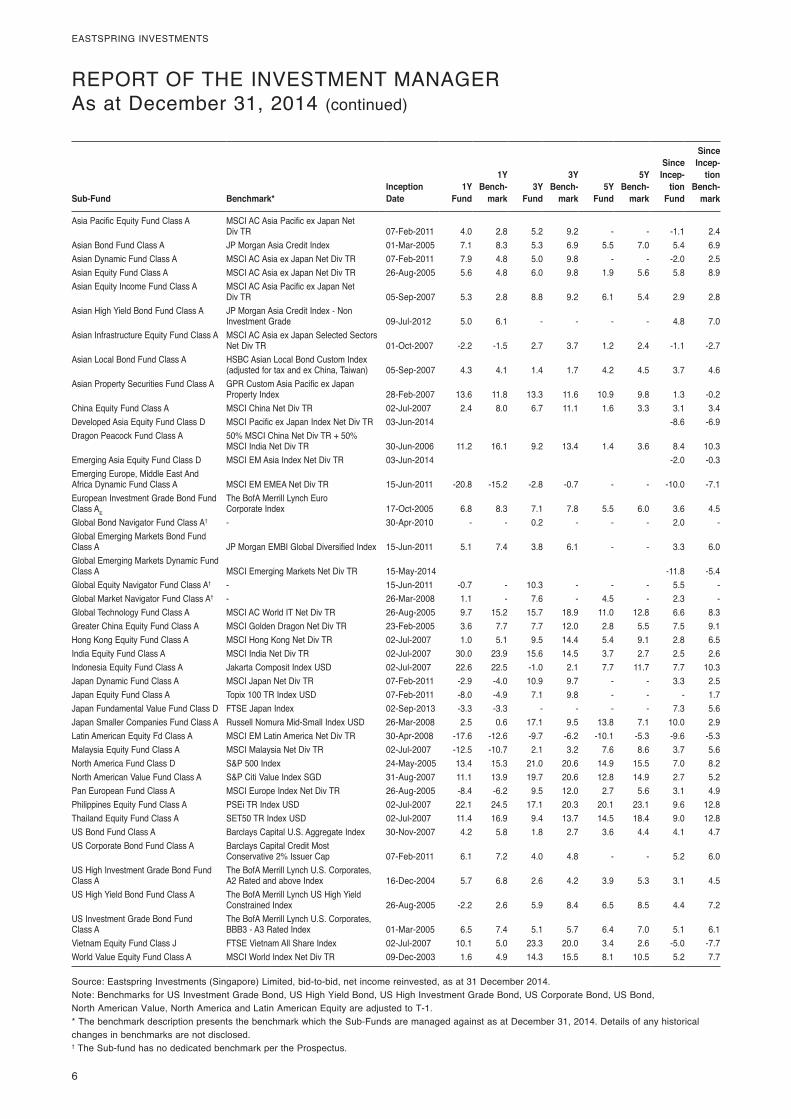
Asia Pacific Equity Fund Class A MSCI AC Asia Pacific ex Japan Net Div TR 07-Feb-2011 4.0 2.8 5.2 9.2 - - -1.1 2.4
Asian Bond Fund Class A JP Morgan Asia Credit Index 01-Mar-2005 7.1 8.3 5.3 6.9 5.5 7.0 5.4 6.9 Asian Dynamic Fund Class A MSCI AC Asia ex Japan Net Div TR 07-Feb-2011 7.9 4.8 5.0 9.8 - - -2.0 2.5 Asian Equity Fund Class A MSCI AC Asia ex Japan Net Div TR 26-Aug-2005 5.6 4.8 6.0 9.8 1.9 5.6 5.8 8.9 Asian Equity Income Fund Class A MSCI AC Asia Pacific ex Japan Net
Div TR 05-Sep-2007 5.3 2.8 8.8 9.2 6.1 5.4 2.9 2.8 Asian High Yield Bond Fund Class A JP Morgan Asia Credit Index - Non
Investment Grade 09-Jul-2012 5.0 6.1 - - - - 4.8 7.0 Asian Infrastructure Equity Fund Class A MSCI AC Asia ex Japan Selected Sectors
Net Div TR 01-Oct-2007 -2.2 -1.5 2.7 3.7 1.2 2.4 -1.1 -2.7 Asian Local Bond Fund Class A HSBC Asian Local Bond Custom Index
(adjusted for tax and ex China, Taiwan) 05-Sep-2007 4.3 4.1 1.4 1.7 4.2 4.5 3.7 4.6 Asian Property Securities Fund Class A GPR Custom Asia Pacific ex Japan
Property Index 28-Feb-2007 13.6 11.8 13.3 11.6 10.9 9.8 1.3 -0.2 China Equity Fund Class A MSCI China Net Div TR 02-Jul-2007 2.4 8.0 6.7 11.1 1.6 3.3 3.1 3.4 Developed Asia Equity Fund Class D MSCI Pacific ex Japan Index Net Div TR 03-Jun-2014 -8.6 -6.9 Dragon Peacock Fund Class A 50% MSCI China Net Div TR + 50%
MSCI India Net Div TR 30-Jun-2006 11.2 16.1 9.2 13.4 1.4 3.6 8.4 10.3 Emerging Asia Equity Fund Class D MSCI EM Asia Index Net Div TR 03-Jun-2014 -2.0 -0.3 Emerging Europe, Middle East And Africa Dynamic Fund Class A MSCI EM EMEA Net Div TR 15-Jun-2011 -20.8 -15.2 -2.8 -0.7 - - -10.0 -7.1 European Investment Grade Bond Fund Class AE
The BofA Merrill Lynch Euro Corporate Index 17-Oct-2005 6.8 8.3 7.1 7.8 5.5 6.0 3.6 4.5
Global Bond Navigator Fund Class A† - 30-Apr-2010 - - 0.2 - - - 2.0 -Global Emerging Markets Bond Fund Class A JP Morgan EMBI Global Diversified Index 15-Jun-2011 5.1 7.4 3.8 6.1 - - 3.3 6.0 Global Emerging Markets Dynamic Fund Class A MSCI Emerging Markets Net Div TR 15-May-2014 -11.8 -5.4 Global Equity Navigator Fund Class A† - 15-Jun-2011 -0.7 - 10.3 - - - 5.5 - Global Market Navigator Fund Class A† - 26-Mar-2008 1.1 - 7.6 - 4.5 - 2.3 - Global Technology Fund Class A MSCI AC World IT Net Div TR 26-Aug-2005 9.7 15.2 15.7 18.9 11.0 12.8 6.6 8.3 Greater China Equity Fund Class A MSCI Golden Dragon Net Div TR 23-Feb-2005 3.6 7.7 7.7 12.0 2.8 5.5 7.5 9.1 Hong Kong Equity Fund Class A MSCI Hong Kong Net Div TR 02-Jul-2007 1.0 5.1 9.5 14.4 5.4 9.1 2.8 6.5 India Equity Fund Class A MSCI India Net Div TR 02-Jul-2007 30.0 23.9 15.6 14.5 3.7 2.7 2.5 2.6 Indonesia Equity Fund Class A Jakarta Composit Index USD 02-Jul-2007 22.6 22.5 -1.0 2.1 7.7 11.7 7.7 10.3 Japan Dynamic Fund Class A MSCI Japan Net Div TR 07-Feb-2011 -2.9 -4.0 10.9 9.7 - - 3.3 2.5 Japan Equity Fund Class A Topix 100 TR Index USD 07-Feb-2011 -8.0 -4.9 7.1 9.8 - - - 1.7 Japan Fundamental Value Fund Class D FTSE Japan Index 02-Sep-2013 -3.3 -3.3 - - - - 7.3 5.6 Japan Smaller Companies Fund Class A Russell Nomura Mid-Small Index USD 26-Mar-2008 2.5 0.6 17.1 9.5 13.8 7.1 10.0 2.9 Latin American Equity Fd Class A MSCI EM Latin America Net Div TR 30-Apr-2008 -17.6 -12.6 -9.7 -6.2 -10.1 -5.3 -9.6 -5.3 Malaysia Equity Fund Class A MSCI Malaysia Net Div TR 02-Jul-2007 -12.5 -10.7 2.1 3.2 7.6 8.6 3.7 5.6 North America Fund Class D S&P 500 Index 24-May-2005 13.4 15.3 21.0 20.6 14.9 15.5 7.0 8.2 North American Value Fund Class A S&P Citi Value Index SGD 31-Aug-2007 11.1 13.9 19.7 20.6 12.8 14.9 2.7 5.2 Pan European Fund Class A MSCI Europe Index Net Div TR 26-Aug-2005 -8.4 -6.2 9.5 12.0 2.7 5.6 3.1 4.9 Philippines Equity Fund Class A PSEi TR Index USD 02-Jul-2007 22.1 24.5 17.1 20.3 20.1 23.1 9.6 12.8 Thailand Equity Fund Class A SET50 TR Index USD 02-Jul-2007 11.4 16.9 9.4 13.7 14.5 18.4 9.0 12.8 US Bond Fund Class A Barclays Capital U.S. Aggregate Index 30-Nov-2007 4.2 5.8 1.8 2.7 3.6 4.4 4.1 4.7 US Corporate Bond Fund Class A Barclays Capital Credit Most
Conservative 2% Issuer Cap 07-Feb-2011 6.1 7.2 4.0 4.8 - - 5.2 6.0 US High Investment Grade Bond Fund Class A
The BofA Merrill Lynch U.S. Corporates, A2 Rated and above Index 16-Dec-2004 5.7 6.8 2.6 4.2 3.9 5.3 3.1 4.5
US High Yield Bond Fund Class A The BofA Merrill Lynch US High Yield Constrained Index 26-Aug-2005 -2.2 2.6 5.9 8.4 6.5 8.5 4.4 7.2
US Investment Grade Bond Fund Class A
The BofA Merrill Lynch U.S. Corporates, BBB3 - A3 Rated Index 01-Mar-2005 6.5 7.4 5.1 5.7 6.4 7.0 5.1 6.1
Vietnam Equity Fund Class J FTSE Vietnam All Share Index 02-Jul-2007 10.1 5.0 23.3 20.0 3.4 2.6 -5.0 -7.7 World Value Equity Fund Class A MSCI World Index Net Div TR 09-Dec-2003 1.6 4.9 14.3 15.5 8.1 10.5 5.2 7.7
Source: Eastspring Investments (Singapore) Limited, bid-to-bid, net income reinvested, as at 31 December 2014.Note: Benchmarks for US Investment Grade Bond, US High Yield Bond, US High Investment Grade Bond, US Corporate Bond, US Bond, North American Value, North America and Latin American Equity are adjusted to T-1.* The benchmark description presents the benchmark which the Sub-Funds are managed against as at December 31, 2014. Details of any historical changes in benchmarks are not disclosed.† The Sub-fund has no dedicated benchmark per the Prospectus.
EASTSPRING INVESTMENTS
REPORT OF THE REVISEUR D'ENTREPRISES AGREE
To the Shareholders of Eastspring Investments 26, boulevard Royal L-2449 Luxembourg Grand Duchy of Luxembourg
Following our appointment by the annual general meeting of the Shareholders of April 11 , 2014, we have audited the accompanying financial statements of Eastspring Investments and each of its sub-funds, which comprise the combined statement of net assets and the statement of investments as at December 31, 2014, and the combined statement of operations and changes in net assets for the year then ended, and a summary of significant accounting policies and other explanatory information.
Board of Directors of the SICAV responsibility for the flnanclal statements The Board of Directors of the SICAV is responsible for the preparation and fair presentation of these financial statements in accordance with Luxembourg legal and regulatory requirements relating to the preparation of the financial statements. and for such internal control as the Board of Directors of the SICAV determines is necessary to enable the preparation of financial statements that are free from material misstatement, whether due to fraud or error.
Responsibility of the Revlseur d 'Entreprises agree Our responsibility is to express an opinion on these financial statements based on our audit. We conducted our audit in accordance with International Standards on Auditing as adopted for Luxembourg by the Commission de Surveillance du Secteur Financier. Those standards require that we comply with ethical requirements and plan and perform the audit to obtain reasonable assurance about whether the financial statements are free from material misstatement.
An audit involves performing procedures to obtain audit evidence about the amounts and disclosures in the financial statements. The procedures selected depend on the judgement of the Reviseur d'Entreprises agree, including the assessment of the risks of material misstatement of the financial statements, whether due to fraud or error. In making those risk assessments, the Reviseur d'Entreprises agree considers internal control relevant to the entity's preparation and fair presentation of the financial statements in order to design audit procedures that are appropriate in the circumstances, but not for the purpose of expressing an opinion on the effectiveness of the entity's internal control.
An audit also includes evaluating the appropriateness of accounting policies used and the reasonableness of accounting estimates made by the Board of Directors of the SICAV, as well as evaluating the overall presentation of the financial statements.
We believe that the audit evidence we have obtained is sufficient and appropriate to provide a basis for our audit opinion.
Opinion In our opinion, the financial statements give a true and fair view of the financial position of Eastspring Investments and each of its sub-funds as of December 31 , 2014, and of the results of their operations and changes in their net assets for the year then ended in accordance with Luxembourg legal and regulatory requirements relating to the preparation of the financial statements.
Other matter Supplementary information included in the annual report has been reviewed in the context of our mandate but has not been subject to specific audit procedures carried out in accordance with the standards described above. Consequently, we express no opinion on such information. However, we have no observation to make concerning such information in the context of the financial statements taken as a whole.
Luxembourg, April 1, 2015
7
8 The accompanying notes form an integral part of these financial statements.
EASTSPRING INVESTMENTS
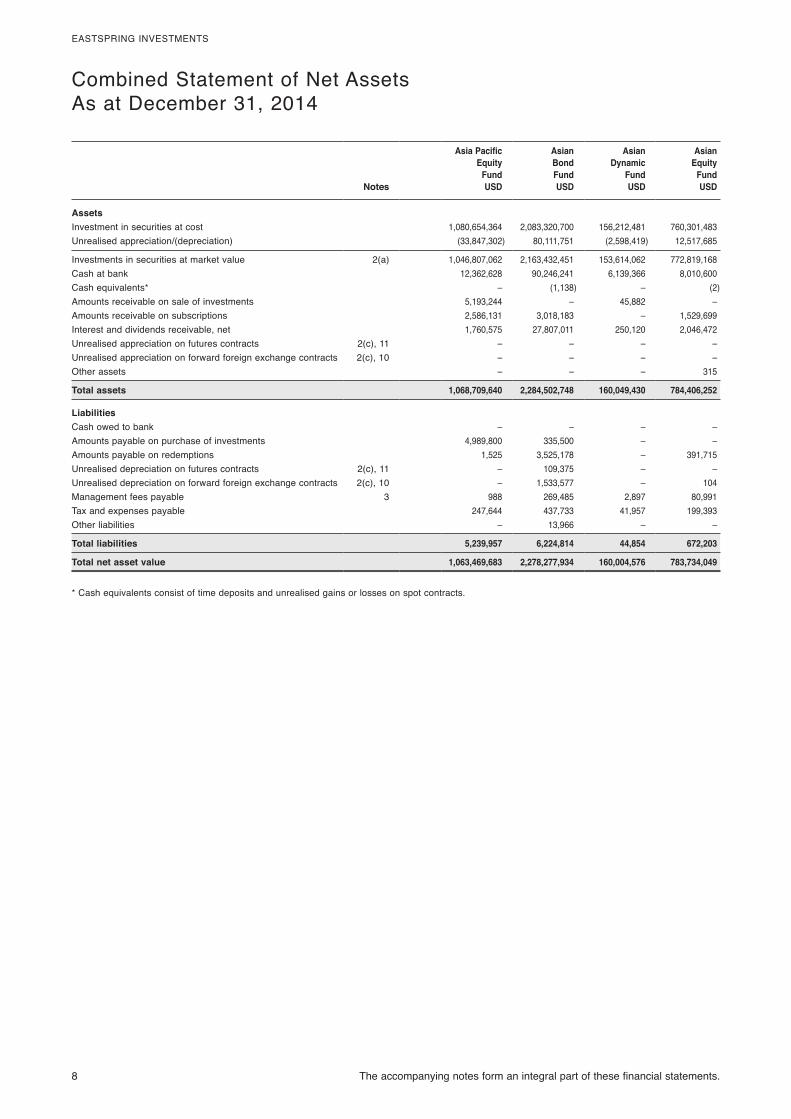
Combined Statement of Net AssetsAs at December 31, 2014
Asia PacificEquity
Fund
AsianBondFund
AsianDynamic
Fund
AsianEquity
FundNotes USD USD USD USD
AssetsInvestment in securities at cost 1,080,654,364 2,083,320,700 156,212,481 760,301,483Unrealised appreciation/(depreciation) (33,847,302) 80,111,751 (2,598,419) 12,517,685
Investments in securities at market value 2(a) 1,046,807,062 2,163,432,451 153,614,062 772,819,168Cash at bank 12,362,628 90,246,241 6,139,366 8,010,600Cash equivalents* – (1,138) – (2)Amounts receivable on sale of investments 5,193,244 – 45,882 –Amounts receivable on subscriptions 2,586,131 3,018,183 – 1,529,699Interest and dividends receivable, net 1,760,575 27,807,011 250,120 2,046,472Unrealised appreciation on futures contracts 2(c), 11 – – – –Unrealised appreciation on forward foreign exchange contracts 2(c), 10 – – – –Other assets – – – 315
Total assets 1,068,709,640 2,284,502,748 160,049,430 784,406,252
LiabilitiesCash owed to bank – – – –Amounts payable on purchase of investments 4,989,800 335,500 – –Amounts payable on redemptions 1,525 3,525,178 – 391,715Unrealised depreciation on futures contracts 2(c), 11 – 109,375 – –Unrealised depreciation on forward foreign exchange contracts 2(c), 10 – 1,533,577 – 104Management fees payable 3 988 269,485 2,897 80,991Tax and expenses payable 247,644 437,733 41,957 199,393Other liabilities – 13,966 – –
Total liabilities 5,239,957 6,224,814 44,854 672,203
Total net asset value 1,063,469,683 2,278,277,934 160,004,576 783,734,049
* Cash equivalents consist of time deposits and unrealised gains or losses on spot contracts.
The accompanying notes form an integral part of these financial statements. 9
EASTSPRING INVESTMENTS
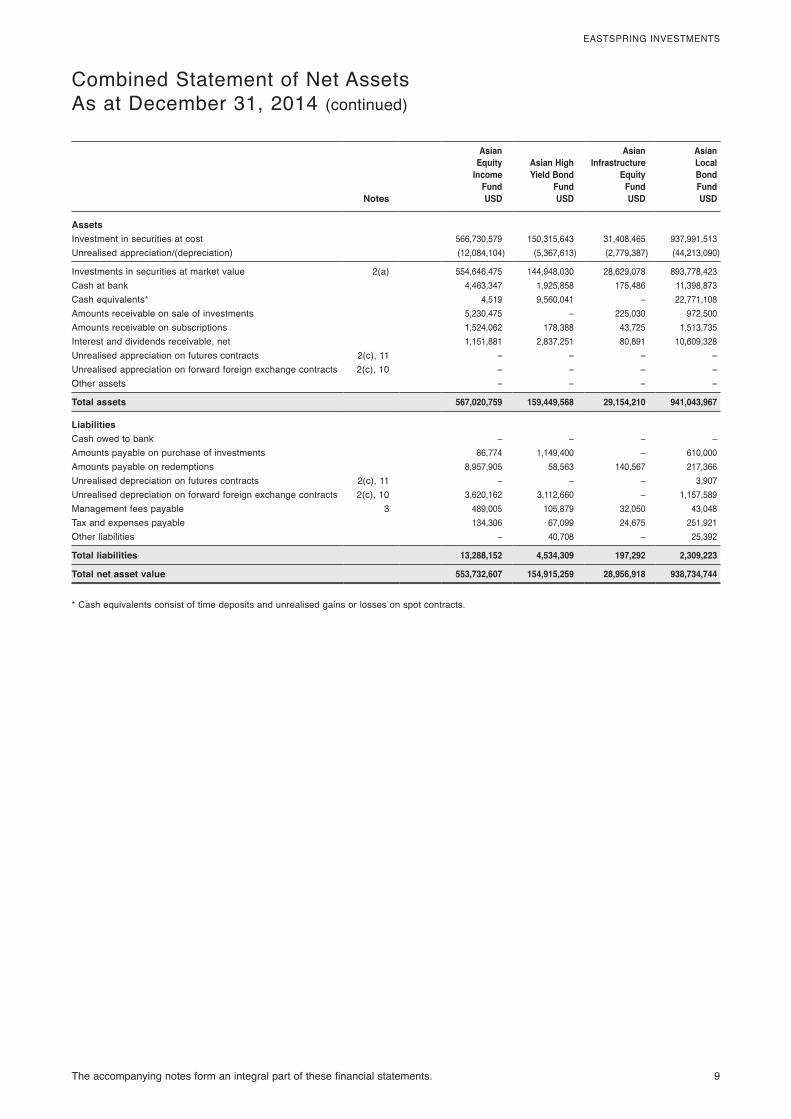
Combined Statement of Net AssetsAs at December 31, 2014 (continued)
Asian Equity
Income Fund
Asian HighYield Bond
Fund
Asian Infrastructure
EquityFund
Asian Local Bond Fund
Notes USD USD USD USD
AssetsInvestment in securities at cost 566,730,579 150,315,643 31,408,465 937,991,513Unrealised appreciation/(depreciation) (12,084,104) (5,367,613) (2,779,387) (44,213,090)
Investments in securities at market value 2(a) 554,646,475 144,948,030 28,629,078 893,778,423Cash at bank 4,463,347 1,925,858 175,486 11,398,873Cash equivalents* 4,519 9,560,041 – 22,771,108Amounts receivable on sale of investments 5,230,475 – 225,030 972,500Amounts receivable on subscriptions 1,524,062 178,388 43,725 1,513,735Interest and dividends receivable, net 1,151,881 2,837,251 80,891 10,609,328Unrealised appreciation on futures contracts 2(c), 11 – – – –Unrealised appreciation on forward foreign exchange contracts 2(c), 10 – – – –Other assets – – – –
Total assets 567,020,759 159,449,568 29,154,210 941,043,967
LiabilitiesCash owed to bank – – – –Amounts payable on purchase of investments 86,774 1,149,400 – 610,000Amounts payable on redemptions 8,957,905 58,563 140,567 217,366Unrealised depreciation on futures contracts 2(c), 11 – – – 3,907Unrealised depreciation on forward foreign exchange contracts 2(c), 10 3,620,162 3,112,660 – 1,157,589Management fees payable 3 489,005 105,879 32,050 43,048Tax and expenses payable 134,306 67,099 24,675 251,921Other liabilities – 40,708 – 25,392
Total liabilities 13,288,152 4,534,309 197,292 2,309,223
Total net asset value 553,732,607 154,915,259 28,956,918 938,734,744
* Cash equivalents consist of time deposits and unrealised gains or losses on spot contracts.
10 The accompanying notes form an integral part of these financial statements.
EASTSPRING INVESTMENTS
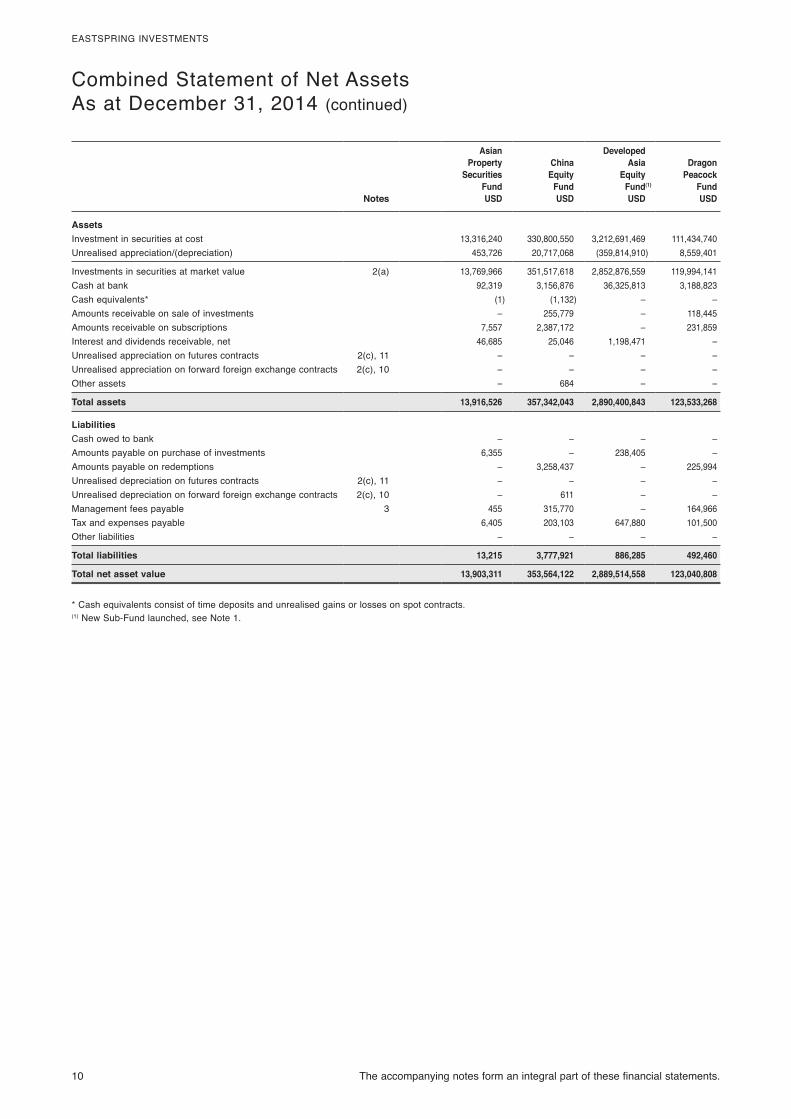
Combined Statement of Net AssetsAs at December 31, 2014 (continued)
Asian Property
Securities Fund
China Equity
Fund
Developed Asia
Equity Fund(1)
DragonPeacock
FundNotes USD USD USD USD
AssetsInvestment in securities at cost 13,316,240 330,800,550 3,212,691,469 111,434,740Unrealised appreciation/(depreciation) 453,726 20,717,068 (359,814,910) 8,559,401
Investments in securities at market value 2(a) 13,769,966 351,517,618 2,852,876,559 119,994,141Cash at bank 92,319 3,156,876 36,325,813 3,188,823Cash equivalents* (1) (1,132) – –Amounts receivable on sale of investments – 255,779 – 118,445Amounts receivable on subscriptions 7,557 2,387,172 – 231,859Interest and dividends receivable, net 46,685 25,046 1,198,471 –Unrealised appreciation on futures contracts 2(c), 11 – – – –Unrealised appreciation on forward foreign exchange contracts 2(c), 10 – – – –Other assets – 684 – –
Total assets 13,916,526 357,342,043 2,890,400,843 123,533,268
LiabilitiesCash owed to bank – – – –Amounts payable on purchase of investments 6,355 – 238,405 –Amounts payable on redemptions – 3,258,437 – 225,994Unrealised depreciation on futures contracts 2(c), 11 – – – –Unrealised depreciation on forward foreign exchange contracts 2(c), 10 – 611 – –Management fees payable 3 455 315,770 – 164,966Tax and expenses payable 6,405 203,103 647,880 101,500Other liabilities – – – –
Total liabilities 13,215 3,777,921 886,285 492,460
Total net asset value 13,903,311 353,564,122 2,889,514,558 123,040,808
* Cash equivalents consist of time deposits and unrealised gains or losses on spot contracts.(1) New Sub-Fund launched, see Note 1.
The accompanying notes form an integral part of these financial statements. 11
EASTSPRING INVESTMENTS
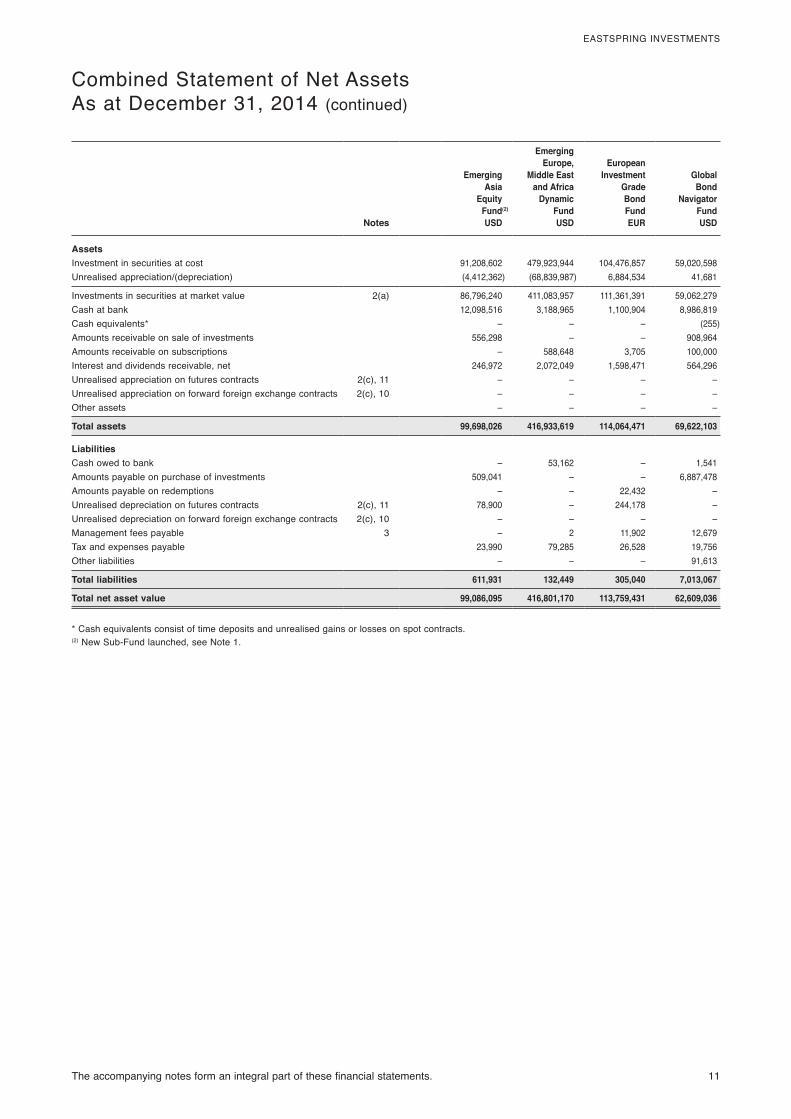
Combined Statement of Net AssetsAs at December 31, 2014 (continued)
Emerging Asia
Equity Fund(2)
Emerging Europe,
Middle East and Africa
Dynamic Fund
European Investment
Grade Bond Fund
Global Bond
Navigator Fund
Notes USD USD EUR USD
AssetsInvestment in securities at cost 91,208,602 479,923,944 104,476,857 59,020,598Unrealised appreciation/(depreciation) (4,412,362) (68,839,987) 6,884,534 41,681
Investments in securities at market value 2(a) 86,796,240 411,083,957 111,361,391 59,062,279Cash at bank 12,098,516 3,188,965 1,100,904 8,986,819Cash equivalents* – – – (255)Amounts receivable on sale of investments 556,298 – – 908,964Amounts receivable on subscriptions – 588,648 3,705 100,000Interest and dividends receivable, net 246,972 2,072,049 1,598,471 564,296Unrealised appreciation on futures contracts 2(c), 11 – – – –Unrealised appreciation on forward foreign exchange contracts 2(c), 10 – – – –Other assets – – – –
Total assets 99,698,026 416,933,619 114,064,471 69,622,103
LiabilitiesCash owed to bank – 53,162 – 1,541Amounts payable on purchase of investments 509,041 – – 6,887,478Amounts payable on redemptions – – 22,432 –Unrealised depreciation on futures contracts 2(c), 11 78,900 – 244,178 –Unrealised depreciation on forward foreign exchange contracts 2(c), 10 – – – –Management fees payable 3 – 2 11,902 12,679Tax and expenses payable 23,990 79,285 26,528 19,756Other liabilities – – – 91,613
Total liabilities 611,931 132,449 305,040 7,013,067
Total net asset value 99,086,095 416,801,170 113,759,431 62,609,036
* Cash equivalents consist of time deposits and unrealised gains or losses on spot contracts.(2) New Sub-Fund launched, see Note 1.
12 The accompanying notes form an integral part of these financial statements.
EASTSPRING INVESTMENTS
Combined Statement of Net AssetsAs at December 31, 2014 (continued)
Global Emerging
Markets Bond Fund
Global Emerging
Markets Dynamic
Fund
Global Equity
Navigator Fund
Global Market
Navigator Fund
Notes USD USD USD USD
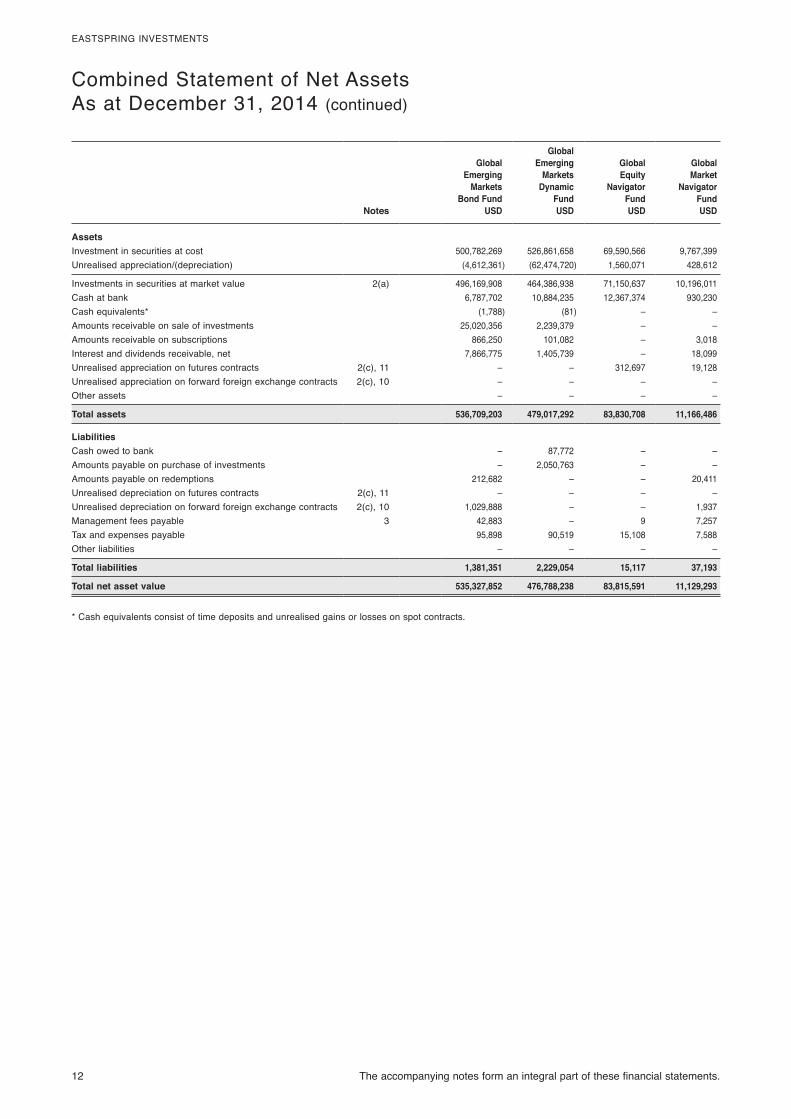
AssetsInvestment in securities at cost 500,782,269 526,861,658 69,590,566 9,767,399Unrealised appreciation/(depreciation) (4,612,361) (62,474,720) 1,560,071 428,612
Investments in securities at market value 2(a) 496,169,908 464,386,938 71,150,637 10,196,011Cash at bank 6,787,702 10,884,235 12,367,374 930,230Cash equivalents* (1,788) (81) – –Amounts receivable on sale of investments 25,020,356 2,239,379 – –Amounts receivable on subscriptions 866,250 101,082 – 3,018Interest and dividends receivable, net 7,866,775 1,405,739 – 18,099Unrealised appreciation on futures contracts 2(c), 11 – – 312,697 19,128Unrealised appreciation on forward foreign exchange contracts 2(c), 10 – – – –Other assets – – – –
Total assets 536,709,203 479,017,292 83,830,708 11,166,486
LiabilitiesCash owed to bank – 87,772 – –Amounts payable on purchase of investments – 2,050,763 – –Amounts payable on redemptions 212,682 – – 20,411Unrealised depreciation on futures contracts 2(c), 11 – – – –Unrealised depreciation on forward foreign exchange contracts 2(c), 10 1,029,888 – – 1,937Management fees payable 3 42,883 – 9 7,257Tax and expenses payable 95,898 90,519 15,108 7,588Other liabilities – – – –
Total liabilities 1,381,351 2,229,054 15,117 37,193
Total net asset value 535,327,852 476,788,238 83,815,591 11,129,293
* Cash equivalents consist of time deposits and unrealised gains or losses on spot contracts.
The accompanying notes form an integral part of these financial statements. 13
EASTSPRING INVESTMENTS
Combined Statement of Net AssetsAs at December 31, 2014 (continued)
Global Technology
Fund
Greater China
Equity Fund
Hong Kong Equity
Fund
India Equity
FundNotes USD USD USD USD
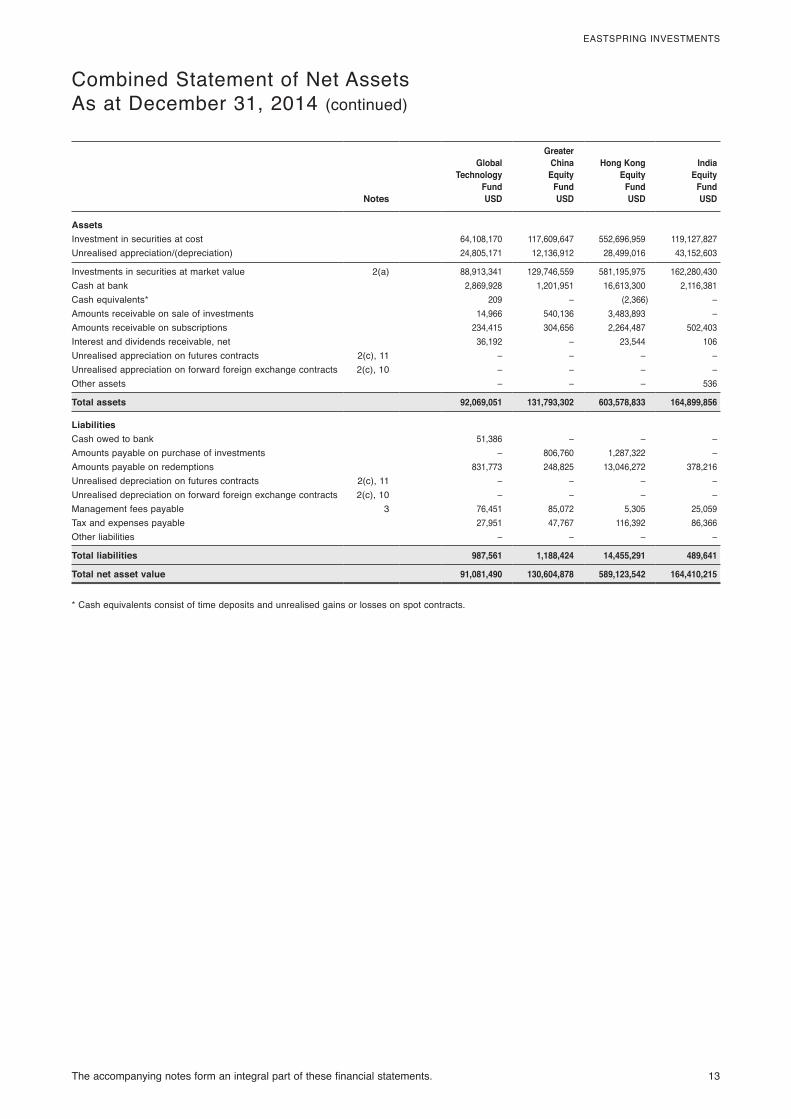
AssetsInvestment in securities at cost 64,108,170 117,609,647 552,696,959 119,127,827Unrealised appreciation/(depreciation) 24,805,171 12,136,912 28,499,016 43,152,603
Investments in securities at market value 2(a) 88,913,341 129,746,559 581,195,975 162,280,430Cash at bank 2,869,928 1,201,951 16,613,300 2,116,381Cash equivalents* 209 – (2,366) –Amounts receivable on sale of investments 14,966 540,136 3,483,893 –Amounts receivable on subscriptions 234,415 304,656 2,264,487 502,403Interest and dividends receivable, net 36,192 – 23,544 106Unrealised appreciation on futures contracts 2(c), 11 – – – –Unrealised appreciation on forward foreign exchange contracts 2(c), 10 – – – –Other assets – – – 536
Total assets 92,069,051 131,793,302 603,578,833 164,899,856
LiabilitiesCash owed to bank 51,386 – – –Amounts payable on purchase of investments – 806,760 1,287,322 –Amounts payable on redemptions 831,773 248,825 13,046,272 378,216Unrealised depreciation on futures contracts 2(c), 11 – – – –Unrealised depreciation on forward foreign exchange contracts 2(c), 10 – – – –Management fees payable 3 76,451 85,072 5,305 25,059Tax and expenses payable 27,951 47,767 116,392 86,366Other liabilities – – – –
Total liabilities 987,561 1,188,424 14,455,291 489,641
Total net asset value 91,081,490 130,604,878 589,123,542 164,410,215
* Cash equivalents consist of time deposits and unrealised gains or losses on spot contracts.
14 The accompanying notes form an integral part of these financial statements.
EASTSPRING INVESTMENTS
Combined Statement of Net AssetsAs at December 31, 2014 (continued)
Indonesia Equity
Fund
Japan Dynamic
Fund
Japan Equity
Fund
Japan Fundamental
Value Fund
Notes USD JPY JPY JPY
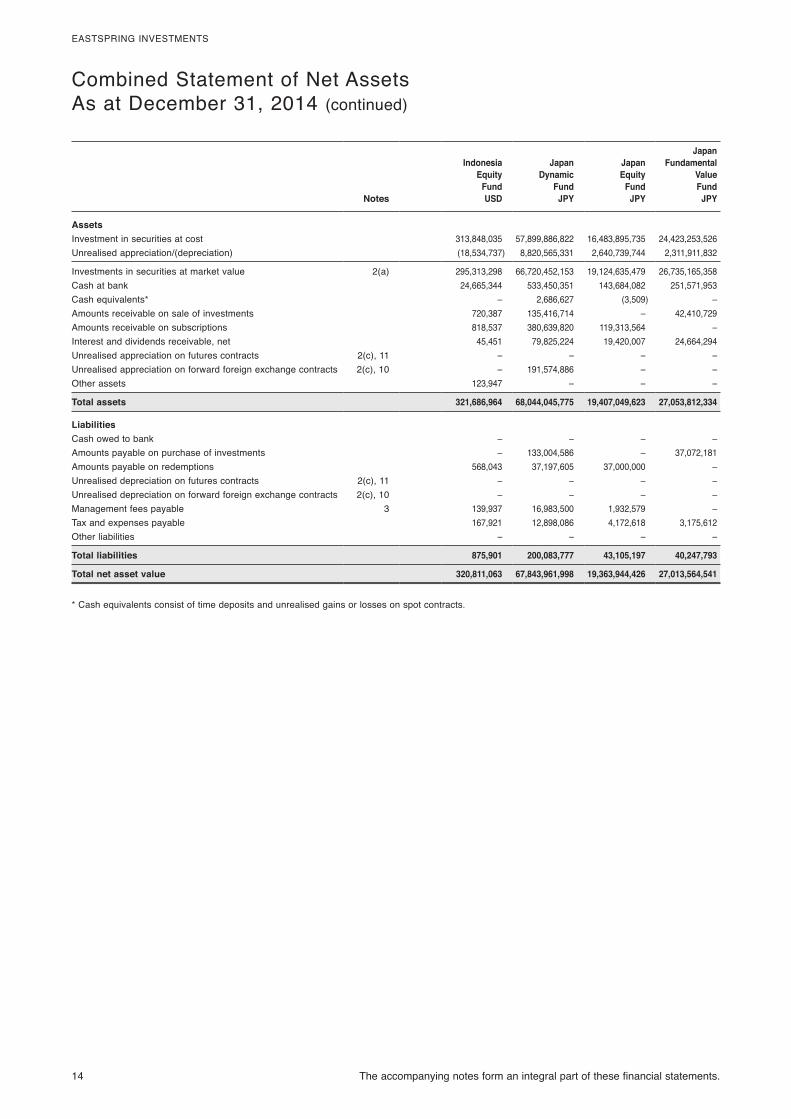
AssetsInvestment in securities at cost 313,848,035 57,899,886,822 16,483,895,735 24,423,253,526Unrealised appreciation/(depreciation) (18,534,737) 8,820,565,331 2,640,739,744 2,311,911,832
Investments in securities at market value 2(a) 295,313,298 66,720,452,153 19,124,635,479 26,735,165,358Cash at bank 24,665,344 533,450,351 143,684,082 251,571,953Cash equivalents* – 2,686,627 (3,509) –Amounts receivable on sale of investments 720,387 135,416,714 – 42,410,729Amounts receivable on subscriptions 818,537 380,639,820 119,313,564 –Interest and dividends receivable, net 45,451 79,825,224 19,420,007 24,664,294Unrealised appreciation on futures contracts 2(c), 11 – – – –Unrealised appreciation on forward foreign exchange contracts 2(c), 10 – 191,574,886 – –Other assets 123,947 – – –
Total assets 321,686,964 68,044,045,775 19,407,049,623 27,053,812,334
LiabilitiesCash owed to bank – – – –Amounts payable on purchase of investments – 133,004,586 – 37,072,181Amounts payable on redemptions 568,043 37,197,605 37,000,000 –Unrealised depreciation on futures contracts 2(c), 11 – – – –Unrealised depreciation on forward foreign exchange contracts 2(c), 10 – – – –Management fees payable 3 139,937 16,983,500 1,932,579 –Tax and expenses payable 167,921 12,898,086 4,172,618 3,175,612Other liabilities – – – –
Total liabilities 875,901 200,083,777 43,105,197 40,247,793
Total net asset value 320,811,063 67,843,961,998 19,363,944,426 27,013,564,541
* Cash equivalents consist of time deposits and unrealised gains or losses on spot contracts.
The accompanying notes form an integral part of these financial statements. 15
EASTSPRING INVESTMENTS
Combined Statement of Net AssetsAs at December 31, 2014 (continued)
Japan Smaller
Companies Fund
Latin American
Equity Fund
Malaysia Equity
Fund
North America
FundNotes JPY USD USD USD
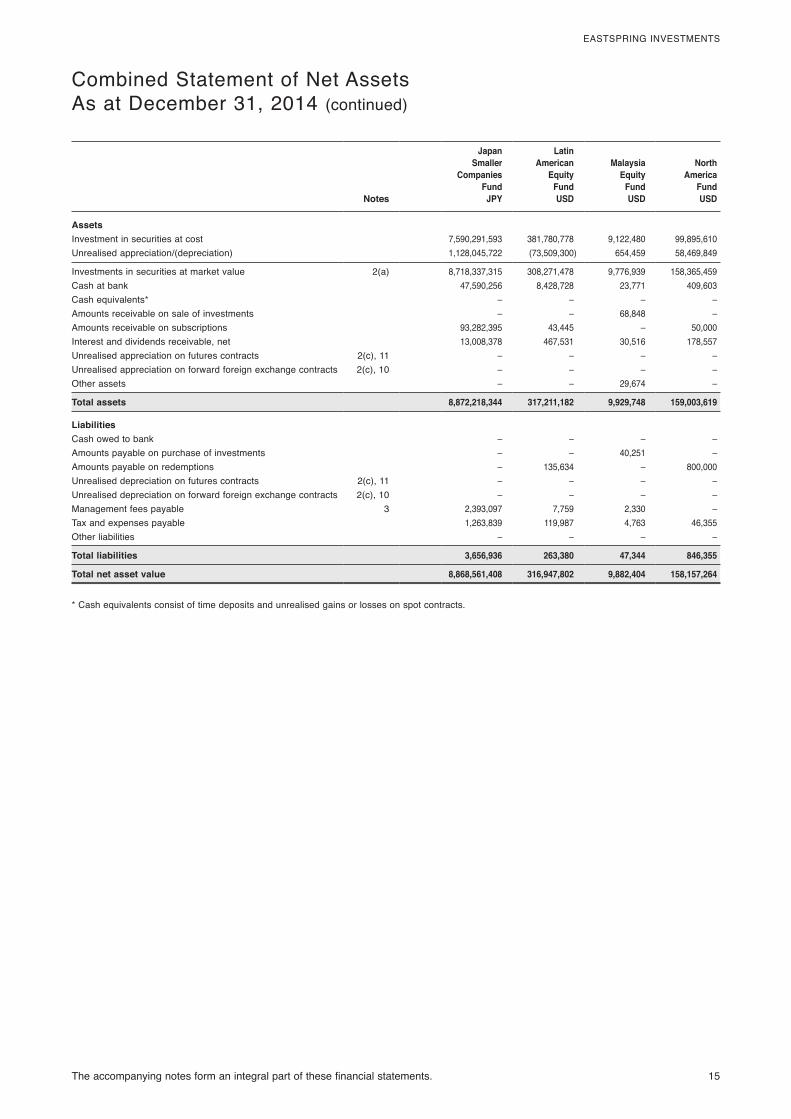
AssetsInvestment in securities at cost 7,590,291,593 381,780,778 9,122,480 99,895,610Unrealised appreciation/(depreciation) 1,128,045,722 (73,509,300) 654,459 58,469,849
Investments in securities at market value 2(a) 8,718,337,315 308,271,478 9,776,939 158,365,459Cash at bank 47,590,256 8,428,728 23,771 409,603Cash equivalents* – – – –Amounts receivable on sale of investments – – 68,848 –Amounts receivable on subscriptions 93,282,395 43,445 – 50,000Interest and dividends receivable, net 13,008,378 467,531 30,516 178,557Unrealised appreciation on futures contracts 2(c), 11 – – – –Unrealised appreciation on forward foreign exchange contracts 2(c), 10 – – – –Other assets – – 29,674 –
Total assets 8,872,218,344 317,211,182 9,929,748 159,003,619
LiabilitiesCash owed to bank – – – –Amounts payable on purchase of investments – – 40,251 –Amounts payable on redemptions – 135,634 – 800,000Unrealised depreciation on futures contracts 2(c), 11 – – – –Unrealised depreciation on forward foreign exchange contracts 2(c), 10 – – – –Management fees payable 3 2,393,097 7,759 2,330 –Tax and expenses payable 1,263,839 119,987 4,763 46,355Other liabilities – – – –
Total liabilities 3,656,936 263,380 47,344 846,355
Total net asset value 8,868,561,408 316,947,802 9,882,404 158,157,264
* Cash equivalents consist of time deposits and unrealised gains or losses on spot contracts.
16 The accompanying notes form an integral part of these financial statements.
EASTSPRING INVESTMENTS
Combined Statement of Net AssetsAs at December 31, 2014 (continued)
North American
Value Fund
Pan European
Fund
Philippines Equity
Fund
Thailand Equity
FundNotes USD USD USD USD
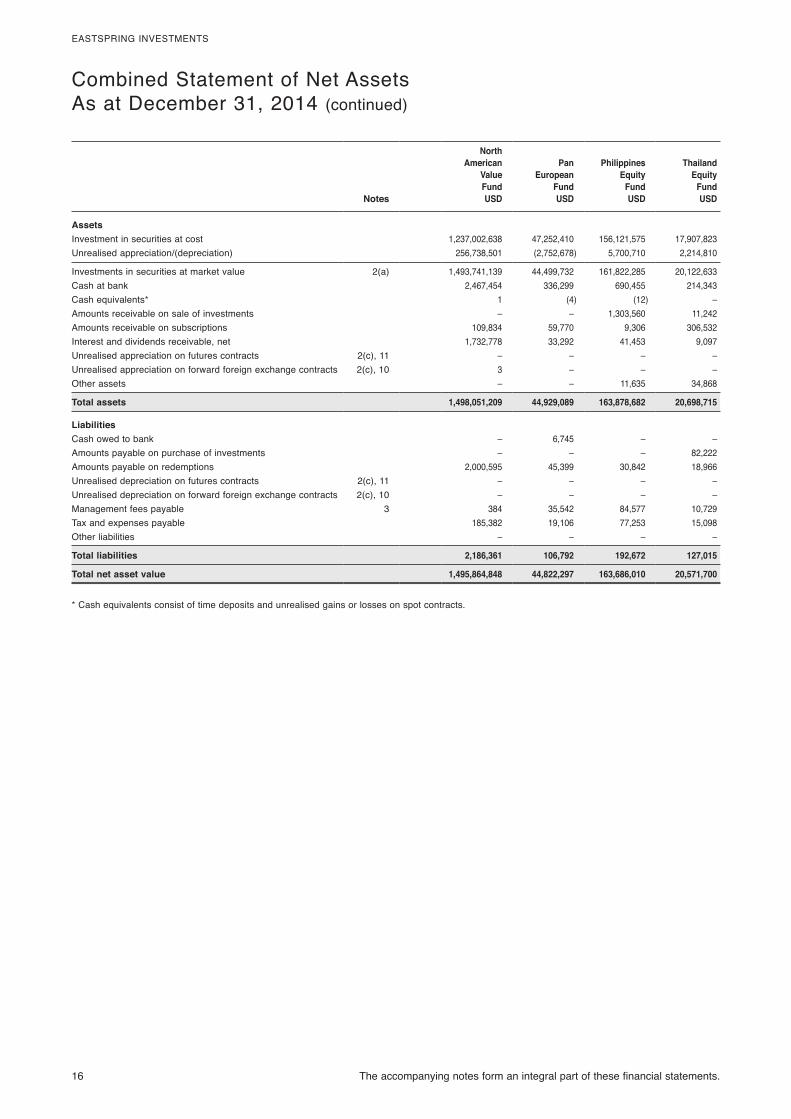
AssetsInvestment in securities at cost 1,237,002,638 47,252,410 156,121,575 17,907,823Unrealised appreciation/(depreciation) 256,738,501 (2,752,678) 5,700,710 2,214,810
Investments in securities at market value 2(a) 1,493,741,139 44,499,732 161,822,285 20,122,633Cash at bank 2,467,454 336,299 690,455 214,343Cash equivalents* 1 (4) (12) –Amounts receivable on sale of investments – – 1,303,560 11,242Amounts receivable on subscriptions 109,834 59,770 9,306 306,532Interest and dividends receivable, net 1,732,778 33,292 41,453 9,097Unrealised appreciation on futures contracts 2(c), 11 – – – –Unrealised appreciation on forward foreign exchange contracts 2(c), 10 3 – – –Other assets – – 11,635 34,868
Total assets 1,498,051,209 44,929,089 163,878,682 20,698,715
LiabilitiesCash owed to bank – 6,745 – –Amounts payable on purchase of investments – – – 82,222Amounts payable on redemptions 2,000,595 45,399 30,842 18,966Unrealised depreciation on futures contracts 2(c), 11 – – – –Unrealised depreciation on forward foreign exchange contracts 2(c), 10 – – – –Management fees payable 3 384 35,542 84,577 10,729Tax and expenses payable 185,382 19,106 77,253 15,098Other liabilities – – – –
Total liabilities 2,186,361 106,792 192,672 127,015
Total net asset value 1,495,864,848 44,822,297 163,686,010 20,571,700
* Cash equivalents consist of time deposits and unrealised gains or losses on spot contracts.
The accompanying notes form an integral part of these financial statements. 17
EASTSPRING INVESTMENTS
Combined Statement of Net AssetsAs at December 31, 2014 (continued)
US Bond Fund
US Corporate Bond Fund
US High Investment
Grade Bond Fund
US High Yield Bond Fund
Notes USD USD USD USD
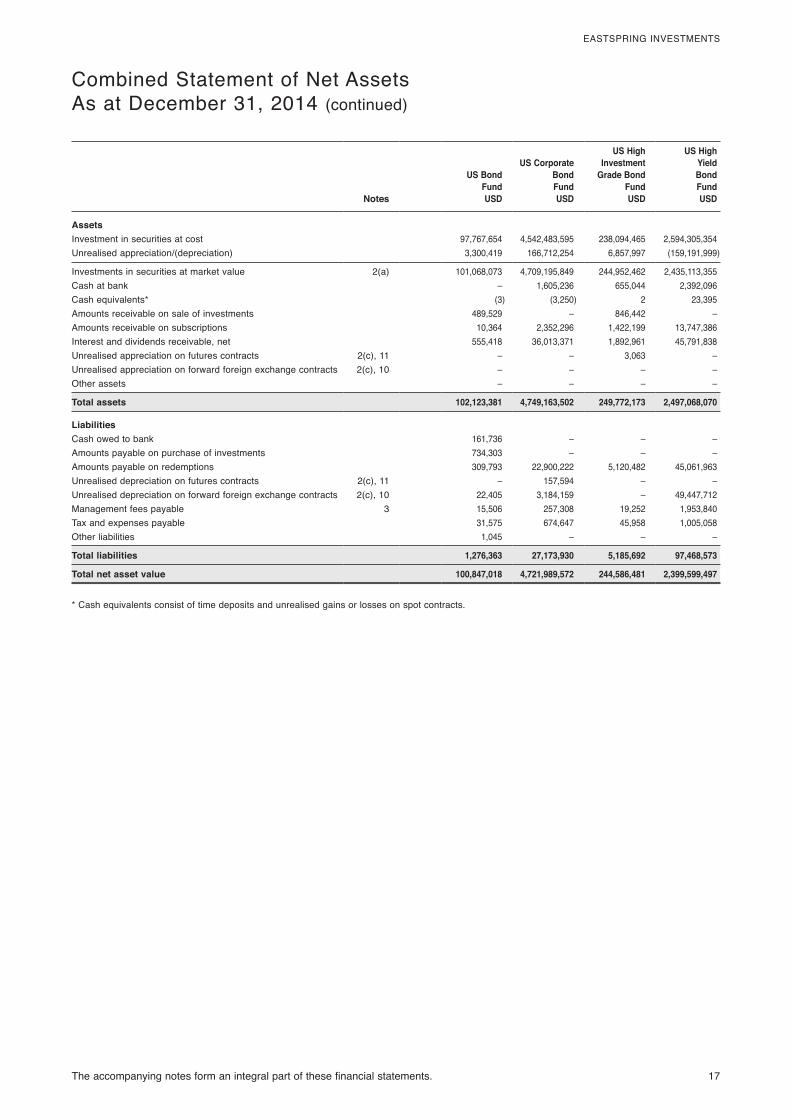
AssetsInvestment in securities at cost 97,767,654 4,542,483,595 238,094,465 2,594,305,354Unrealised appreciation/(depreciation) 3,300,419 166,712,254 6,857,997 (159,191,999)
Investments in securities at market value 2(a) 101,068,073 4,709,195,849 244,952,462 2,435,113,355Cash at bank – 1,605,236 655,044 2,392,096Cash equivalents* (3) (3,250) 2 23,395Amounts receivable on sale of investments 489,529 – 846,442 –Amounts receivable on subscriptions 10,364 2,352,296 1,422,199 13,747,386Interest and dividends receivable, net 555,418 36,013,371 1,892,961 45,791,838Unrealised appreciation on futures contracts 2(c), 11 – – 3,063 –Unrealised appreciation on forward foreign exchange contracts 2(c), 10 – – – –Other assets – – – –
Total assets 102,123,381 4,749,163,502 249,772,173 2,497,068,070
LiabilitiesCash owed to bank 161,736 – – –Amounts payable on purchase of investments 734,303 – – –Amounts payable on redemptions 309,793 22,900,222 5,120,482 45,061,963Unrealised depreciation on futures contracts 2(c), 11 – 157,594 – –Unrealised depreciation on forward foreign exchange contracts 2(c), 10 22,405 3,184,159 – 49,447,712Management fees payable 3 15,506 257,308 19,252 1,953,840Tax and expenses payable 31,575 674,647 45,958 1,005,058Other liabilities 1,045 – – –
Total liabilities 1,276,363 27,173,930 5,185,692 97,468,573
Total net asset value 100,847,018 4,721,989,572 244,586,481 2,399,599,497
* Cash equivalents consist of time deposits and unrealised gains or losses on spot contracts.
18 The accompanying notes form an integral part of these financial statements.
EASTSPRING INVESTMENTS
Combined Statement of Net AssetsAs at December 31, 2014 (continued)
US Investment Grade Bond Fund
Vietnam Equity
Fund
World Value
Equity Fund Combined
Notes USD USD USD USD
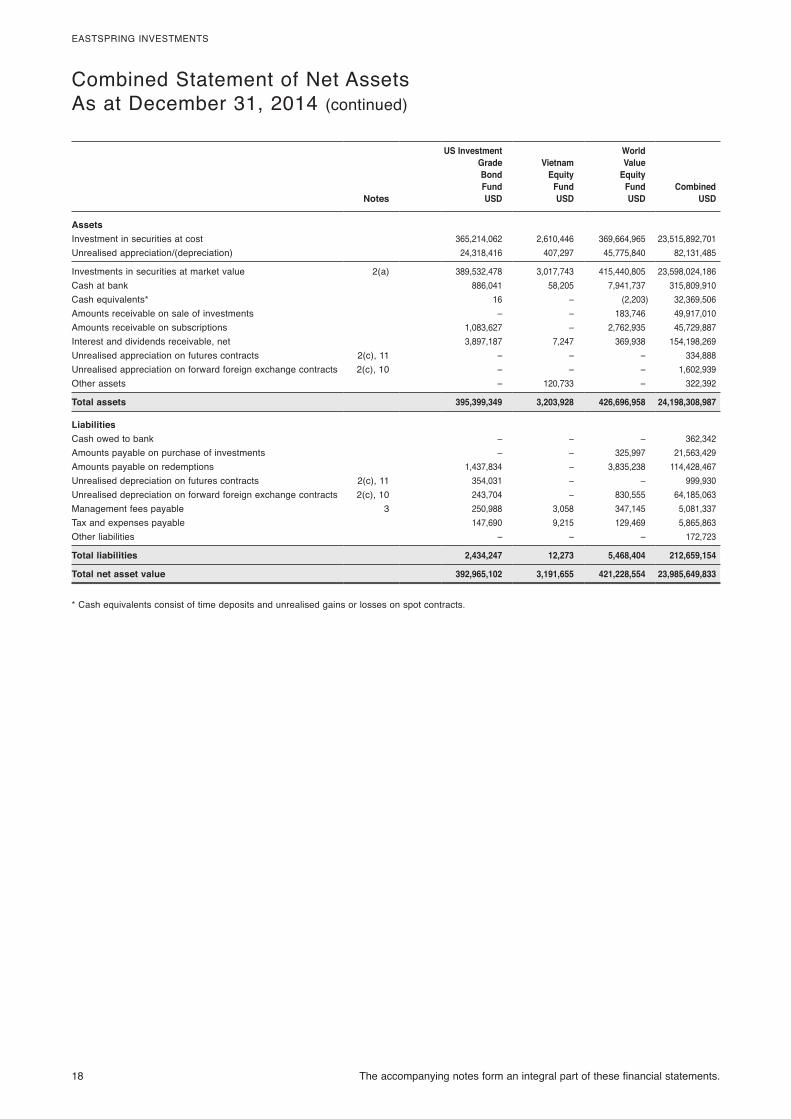
AssetsInvestment in securities at cost 365,214,062 2,610,446 369,664,965 23,515,892,701Unrealised appreciation/(depreciation) 24,318,416 407,297 45,775,840 82,131,485
Investments in securities at market value 2(a) 389,532,478 3,017,743 415,440,805 23,598,024,186Cash at bank 886,041 58,205 7,941,737 315,809,910Cash equivalents* 16 – (2,203) 32,369,506Amounts receivable on sale of investments – – 183,746 49,917,010Amounts receivable on subscriptions 1,083,627 – 2,762,935 45,729,887Interest and dividends receivable, net 3,897,187 7,247 369,938 154,198,269Unrealised appreciation on futures contracts 2(c), 11 – – – 334,888Unrealised appreciation on forward foreign exchange contracts 2(c), 10 – – – 1,602,939Other assets – 120,733 – 322,392
Total assets 395,399,349 3,203,928 426,696,958 24,198,308,987
LiabilitiesCash owed to bank – – – 362,342Amounts payable on purchase of investments – – 325,997 21,563,429Amounts payable on redemptions 1,437,834 – 3,835,238 114,428,467Unrealised depreciation on futures contracts 2(c), 11 354,031 – – 999,930Unrealised depreciation on forward foreign exchange contracts 2(c), 10 243,704 – 830,555 64,185,063Management fees payable 3 250,988 3,058 347,145 5,081,337Tax and expenses payable 147,690 9,215 129,469 5,865,863Other liabilities – – – 172,723
Total liabilities 2,434,247 12,273 5,468,404 212,659,154
Total net asset value 392,965,102 3,191,655 421,228,554 23,985,649,833
* Cash equivalents consist of time deposits and unrealised gains or losses on spot contracts.
The accompanying notes form an integral part of these financial statements. 19
EASTSPRING INVESTMENTS
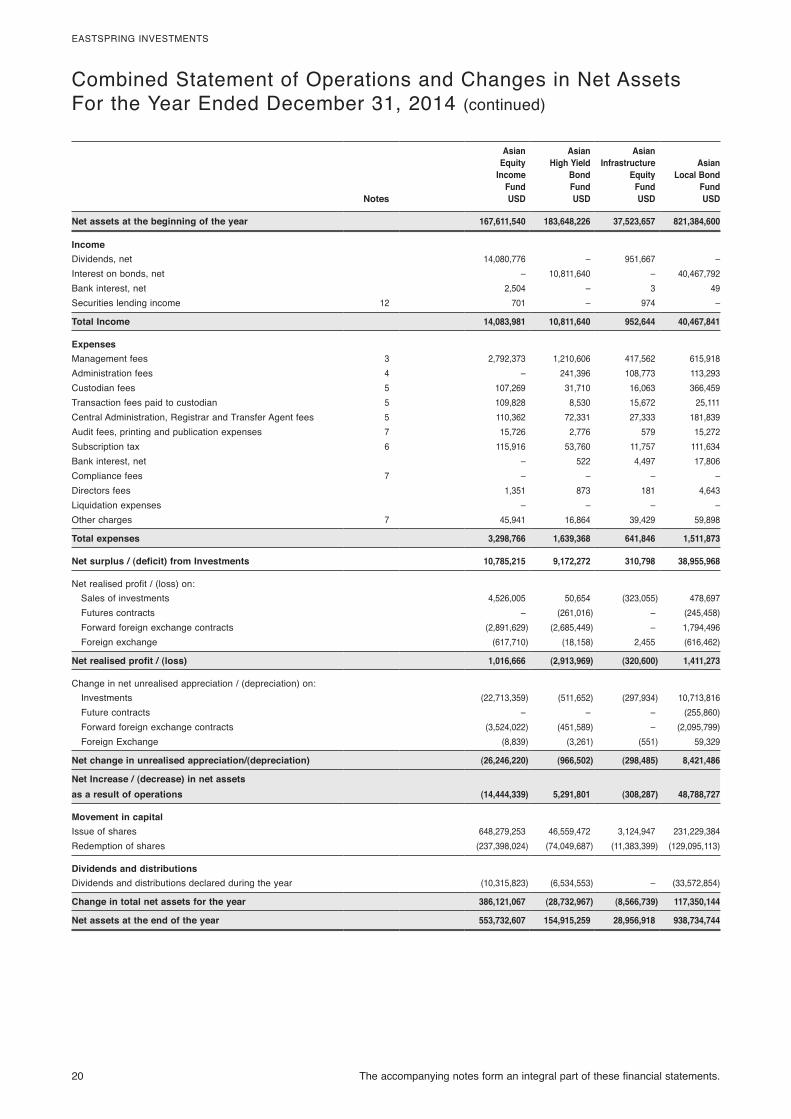
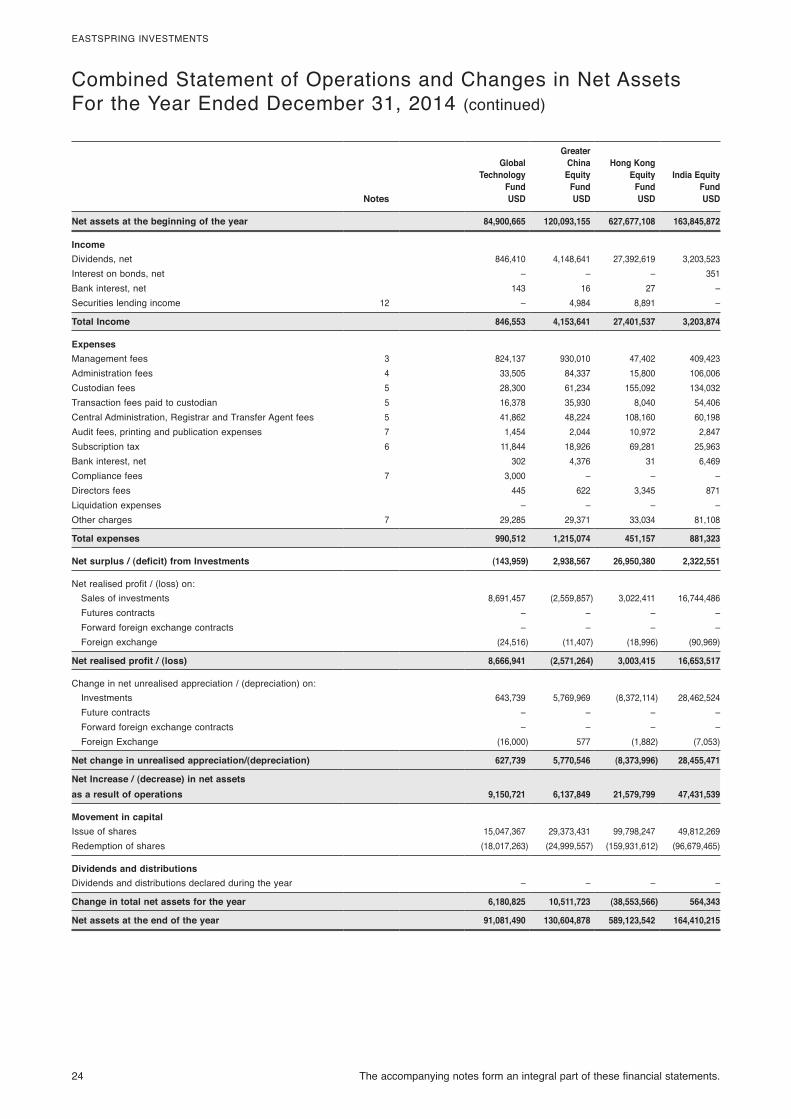
Combined Statement of Operations and Changes in Net AssetsFor the Year Ended December 31, 2014
AsiaPacificEquity
Fund
AsianBondFund
AsianDynamic
Fund
AsianEquity
FundNotes USD USD USD USD
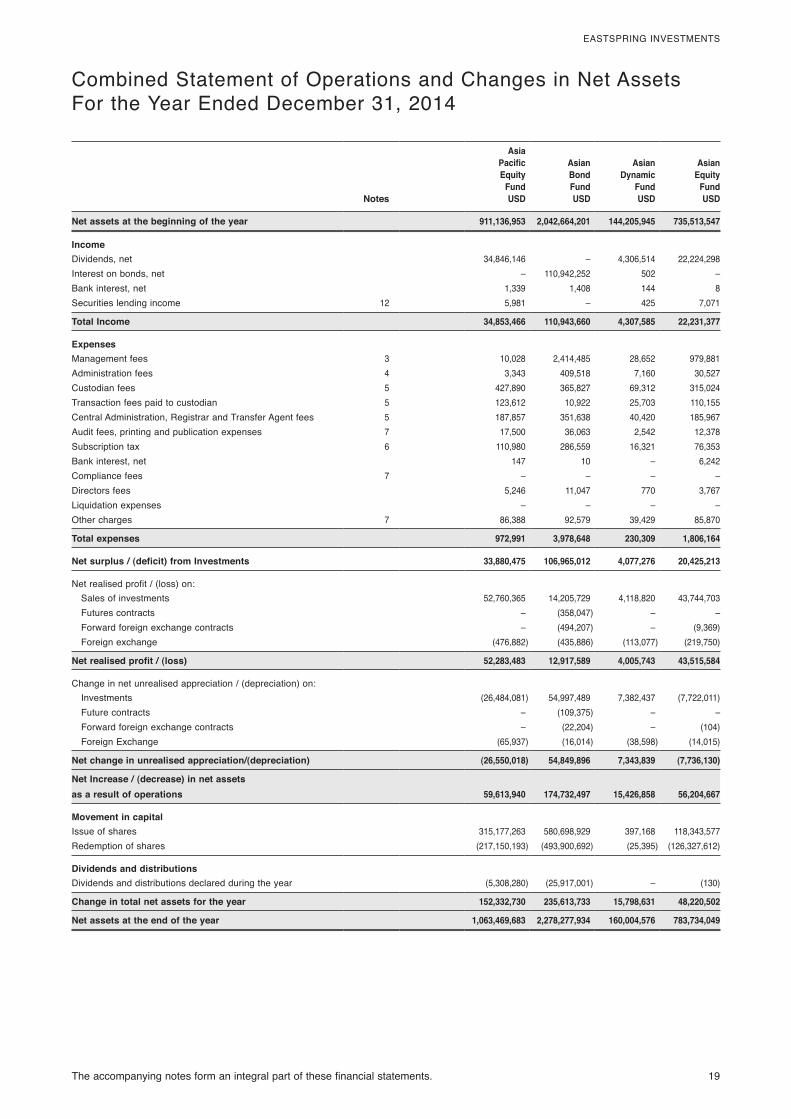
Net assets at the beginning of the year 911,136,953 2,042,664,201 144,205,945 735,513,547
IncomeDividends, net 34,846,146 – 4,306,514 22,224,298Interest on bonds, net – 110,942,252 502 –Bank interest, net 1,339 1,408 144 8Securities lending income 12 5,981 – 425 7,071
Total Income 34,853,466 110,943,660 4,307,585 22,231,377
ExpensesManagement fees 3 10,028 2,414,485 28,652 979,881Administration fees 4 3,343 409,518 7,160 30,527Custodian fees 5 427,890 365,827 69,312 315,024Transaction fees paid to custodian 5 123,612 10,922 25,703 110,155Central Administration, Registrar and Transfer Agent fees 5 187,857 351,638 40,420 185,967Audit fees, printing and publication expenses 7 17,500 36,063 2,542 12,378Subscription tax 6 110,980 286,559 16,321 76,353Bank interest, net 147 10 – 6,242Compliance fees 7 – – – –Directors fees 5,246 11,047 770 3,767Liquidation expenses – – – –Other charges 7 86,388 92,579 39,429 85,870
Total expenses 972,991 3,978,648 230,309 1,806,164
Net surplus / (deficit) from Investments 33,880,475 106,965,012 4,077,276 20,425,213
Net realised profit / (loss) on:Sales of investments 52,760,365 14,205,729 4,118,820 43,744,703Futures contracts – (358,047) – –Forward foreign exchange contracts – (494,207) – (9,369)Foreign exchange (476,882) (435,886) (113,077) (219,750)
Net realised profit / (loss) 52,283,483 12,917,589 4,005,743 43,515,584
Change in net unrealised appreciation / (depreciation) on:Investments (26,484,081) 54,997,489 7,382,437 (7,722,011)Future contracts – (109,375) – –Forward foreign exchange contracts – (22,204) – (104)Foreign Exchange (65,937) (16,014) (38,598) (14,015)
Net change in unrealised appreciation/(depreciation) (26,550,018) 54,849,896 7,343,839 (7,736,130)
Net Increase / (decrease) in net assets as a result of operations 59,613,940 174,732,497 15,426,858 56,204,667
Movement in capitalIssue of shares 315,177,263 580,698,929 397,168 118,343,577Redemption of shares (217,150,193) (493,900,692) (25,395) (126,327,612)
Dividends and distributionsDividends and distributions declared during the year (5,308,280) (25,917,001) – (130)
Change in total net assets for the year 152,332,730 235,613,733 15,798,631 48,220,502
Net assets at the end of the year 1,063,469,683 2,278,277,934 160,004,576 783,734,049
20 The accompanying notes form an integral part of these financial statements.
EASTSPRING INVESTMENTS
Combined Statement of Operations and Changes in Net AssetsFor the Year Ended December 31, 2014 (continued)
Asian Equity
Income Fund
Asian High Yield
Bond Fund
Asian Infrastructure
Equity Fund
Asian Local Bond
FundNotes USD USD USD USD
Net assets at the beginning of the year 167,611,540 183,648,226 37,523,657 821,384,600
IncomeDividends, net 14,080,776 – 951,667 –Interest on bonds, net – 10,811,640 – 40,467,792Bank interest, net 2,504 – 3 49Securities lending income 12 701 – 974 –
Total Income 14,083,981 10,811,640 952,644 40,467,841
ExpensesManagement fees 3 2,792,373 1,210,606 417,562 615,918Administration fees 4 – 241,396 108,773 113,293Custodian fees 5 107,269 31,710 16,063 366,459Transaction fees paid to custodian 5 109,828 8,530 15,672 25,111Central Administration, Registrar and Transfer Agent fees 5 110,362 72,331 27,333 181,839Audit fees, printing and publication expenses 7 15,726 2,776 579 15,272Subscription tax 6 115,916 53,760 11,757 111,634Bank interest, net – 522 4,497 17,806Compliance fees 7 – – – –Directors fees 1,351 873 181 4,643Liquidation expenses – – – –Other charges 7 45,941 16,864 39,429 59,898
Total expenses 3,298,766 1,639,368 641,846 1,511,873
Net surplus / (deficit) from Investments 10,785,215 9,172,272 310,798 38,955,968
Net realised profit / (loss) on:Sales of investments 4,526,005 50,654 (323,055) 478,697Futures contracts – (261,016) – (245,458)Forward foreign exchange contracts (2,891,629) (2,685,449) – 1,794,496Foreign exchange (617,710) (18,158) 2,455 (616,462)
Net realised profit / (loss) 1,016,666 (2,913,969) (320,600) 1,411,273
Change in net unrealised appreciation / (depreciation) on:Investments (22,713,359) (511,652) (297,934) 10,713,816Future contracts – – – (255,860)Forward foreign exchange contracts (3,524,022) (451,589) – (2,095,799)Foreign Exchange (8,839) (3,261) (551) 59,329
Net change in unrealised appreciation/(depreciation) (26,246,220) (966,502) (298,485) 8,421,486
Net Increase / (decrease) in net assets as a result of operations (14,444,339) 5,291,801 (308,287) 48,788,727
Movement in capitalIssue of shares 648,279,253 46,559,472 3,124,947 231,229,384Redemption of shares (237,398,024) (74,049,687) (11,383,399) (129,095,113)
Dividends and distributionsDividends and distributions declared during the year (10,315,823) (6,534,553) – (33,572,854)
Change in total net assets for the year 386,121,067 (28,732,967) (8,566,739) 117,350,144
Net assets at the end of the year 553,732,607 154,915,259 28,956,918 938,734,744
The accompanying notes form an integral part of these financial statements. 21
EASTSPRING INVESTMENTS
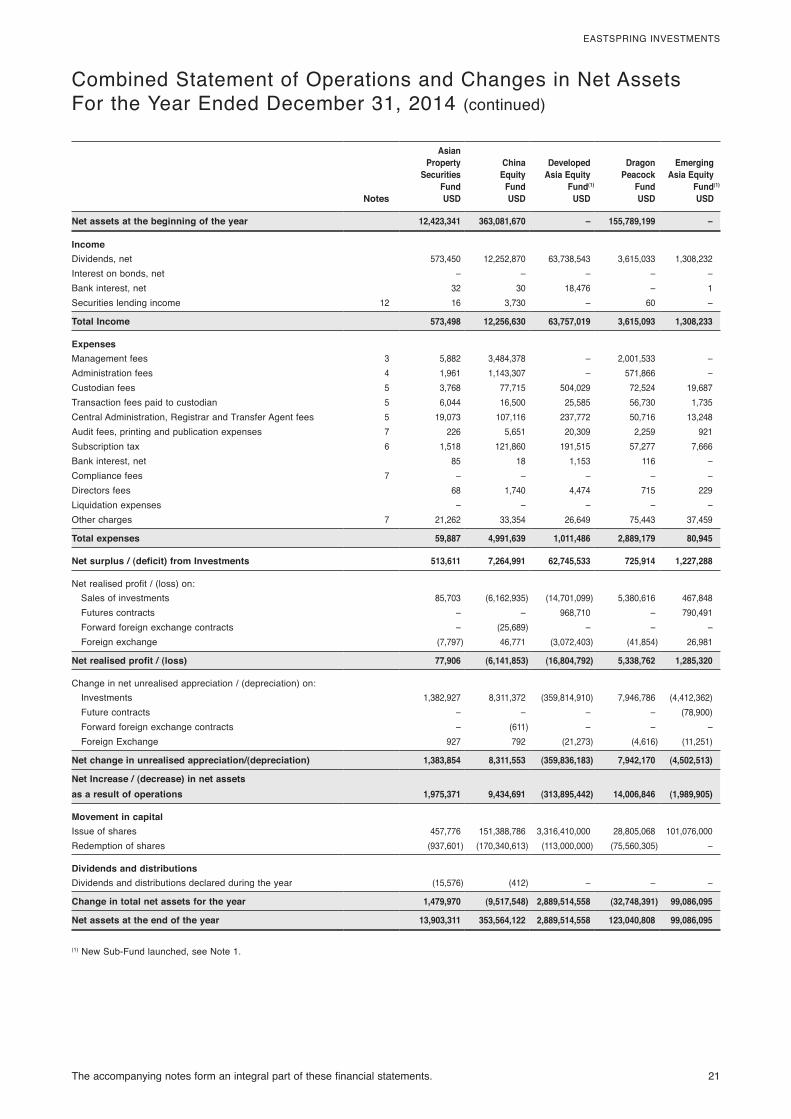
Combined Statement of Operations and Changes in Net AssetsFor the Year Ended December 31, 2014 (continued)
Asian Property
Securities Fund
China Equity
Fund
Developed Asia Equity
Fund(1)
Dragon Peacock
Fund
Emerging Asia Equity
Fund(1)
Notes USD USD USD USD USD
Net assets at the beginning of the year 12,423,341 363,081,670 – 155,789,199 –
IncomeDividends, net 573,450 12,252,870 63,738,543 3,615,033 1,308,232Interest on bonds, net – – – – –Bank interest, net 32 30 18,476 – 1Securities lending income 12 16 3,730 – 60 –
Total Income 573,498 12,256,630 63,757,019 3,615,093 1,308,233
ExpensesManagement fees 3 5,882 3,484,378 – 2,001,533 –Administration fees 4 1,961 1,143,307 – 571,866 –Custodian fees 5 3,768 77,715 504,029 72,524 19,687Transaction fees paid to custodian 5 6,044 16,500 25,585 56,730 1,735Central Administration, Registrar and Transfer Agent fees 5 19,073 107,116 237,772 50,716 13,248Audit fees, printing and publication expenses 7 226 5,651 20,309 2,259 921Subscription tax 6 1,518 121,860 191,515 57,277 7,666Bank interest, net 85 18 1,153 116 –Compliance fees 7 – – – – –Directors fees 68 1,740 4,474 715 229Liquidation expenses – – – – –Other charges 7 21,262 33,354 26,649 75,443 37,459
Total expenses 59,887 4,991,639 1,011,486 2,889,179 80,945
Net surplus / (deficit) from Investments 513,611 7,264,991 62,745,533 725,914 1,227,288
Net realised profit / (loss) on:Sales of investments 85,703 (6,162,935) (14,701,099) 5,380,616 467,848Futures contracts – – 968,710 – 790,491Forward foreign exchange contracts – (25,689) – – –Foreign exchange (7,797) 46,771 (3,072,403) (41,854) 26,981
Net realised profit / (loss) 77,906 (6,141,853) (16,804,792) 5,338,762 1,285,320
Change in net unrealised appreciation / (depreciation) on:Investments 1,382,927 8,311,372 (359,814,910) 7,946,786 (4,412,362)Future contracts – – – – (78,900)Forward foreign exchange contracts – (611) – – –Foreign Exchange 927 792 (21,273) (4,616) (11,251)
Net change in unrealised appreciation/(depreciation) 1,383,854 8,311,553 (359,836,183) 7,942,170 (4,502,513)
Net Increase / (decrease) in net assets as a result of operations 1,975,371 9,434,691 (313,895,442) 14,006,846 (1,989,905)
Movement in capitalIssue of shares 457,776 151,388,786 3,316,410,000 28,805,068 101,076,000Redemption of shares (937,601) (170,340,613) (113,000,000) (75,560,305) –
Dividends and distributionsDividends and distributions declared during the year (15,576) (412) – – –
Change in total net assets for the year 1,479,970 (9,517,548) 2,889,514,558 (32,748,391) 99,086,095
Net assets at the end of the year 13,903,311 353,564,122 2,889,514,558 123,040,808 99,086,095
(1) New Sub-Fund launched, see Note 1.
22 The accompanying notes form an integral part of these financial statements.
EASTSPRING INVESTMENTS
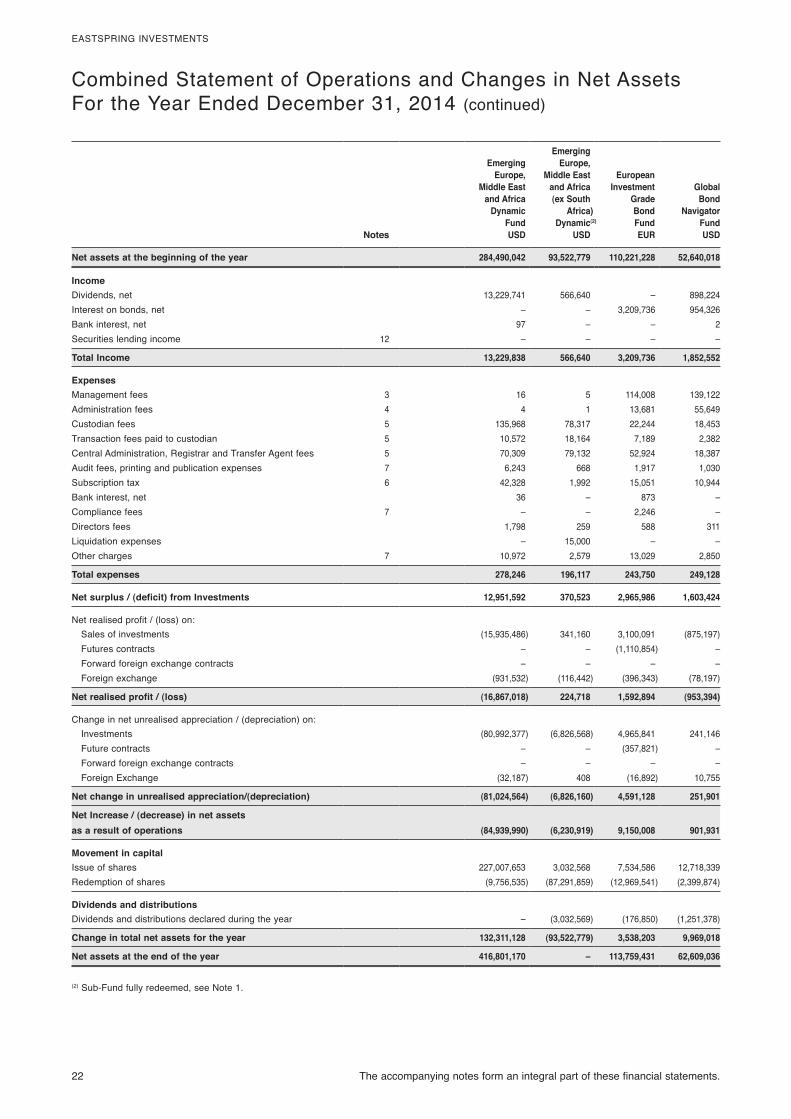
Combined Statement of Operations and Changes in Net AssetsFor the Year Ended December 31, 2014 (continued)
Emerging Europe,
Middle East and Africa
Dynamic Fund
Emerging Europe,
Middle East and Africa (ex South
Africa) Dynamic(2)
European Investment
Grade Bond Fund
Global Bond
Navigator Fund
Notes USD USD EUR USD
Net assets at the beginning of the year 284,490,042 93,522,779 110,221,228 52,640,018
IncomeDividends, net 13,229,741 566,640 – 898,224Interest on bonds, net – – 3,209,736 954,326Bank interest, net 97 – – 2Securities lending income 12 – – – –
Total Income 13,229,838 566,640 3,209,736 1,852,552
ExpensesManagement fees 3 16 5 114,008 139,122Administration fees 4 4 1 13,681 55,649Custodian fees 5 135,968 78,317 22,244 18,453Transaction fees paid to custodian 5 10,572 18,164 7,189 2,382Central Administration, Registrar and Transfer Agent fees 5 70,309 79,132 52,924 18,387Audit fees, printing and publication expenses 7 6,243 668 1,917 1,030Subscription tax 6 42,328 1,992 15,051 10,944Bank interest, net 36 – 873 –Compliance fees 7 – – 2,246 –Directors fees 1,798 259 588 311Liquidation expenses – 15,000 – –Other charges 7 10,972 2,579 13,029 2,850
Total expenses 278,246 196,117 243,750 249,128
Net surplus / (deficit) from Investments 12,951,592 370,523 2,965,986 1,603,424
Net realised profit / (loss) on:Sales of investments (15,935,486) 341,160 3,100,091 (875,197)Futures contracts – – (1,110,854) –Forward foreign exchange contracts – – – –Foreign exchange (931,532) (116,442) (396,343) (78,197)
Net realised profit / (loss) (16,867,018) 224,718 1,592,894 (953,394)
Change in net unrealised appreciation / (depreciation) on:Investments (80,992,377) (6,826,568) 4,965,841 241,146Future contracts – – (357,821) –Forward foreign exchange contracts – – – –Foreign Exchange (32,187) 408 (16,892) 10,755
Net change in unrealised appreciation/(depreciation) (81,024,564) (6,826,160) 4,591,128 251,901
Net Increase / (decrease) in net assets as a result of operations (84,939,990) (6,230,919) 9,150,008 901,931
Movement in capitalIssue of shares 227,007,653 3,032,568 7,534,586 12,718,339Redemption of shares (9,756,535) (87,291,859) (12,969,541) (2,399,874)
Dividends and distributions Dividends and distributions declared during the year – (3,032,569) (176,850) (1,251,378)
Change in total net assets for the year 132,311,128 (93,522,779) 3,538,203 9,969,018
Net assets at the end of the year 416,801,170 – 113,759,431 62,609,036
(2) Sub-Fund fully redeemed, see Note 1.
The accompanying notes form an integral part of these financial statements. 23
EASTSPRING INVESTMENTS
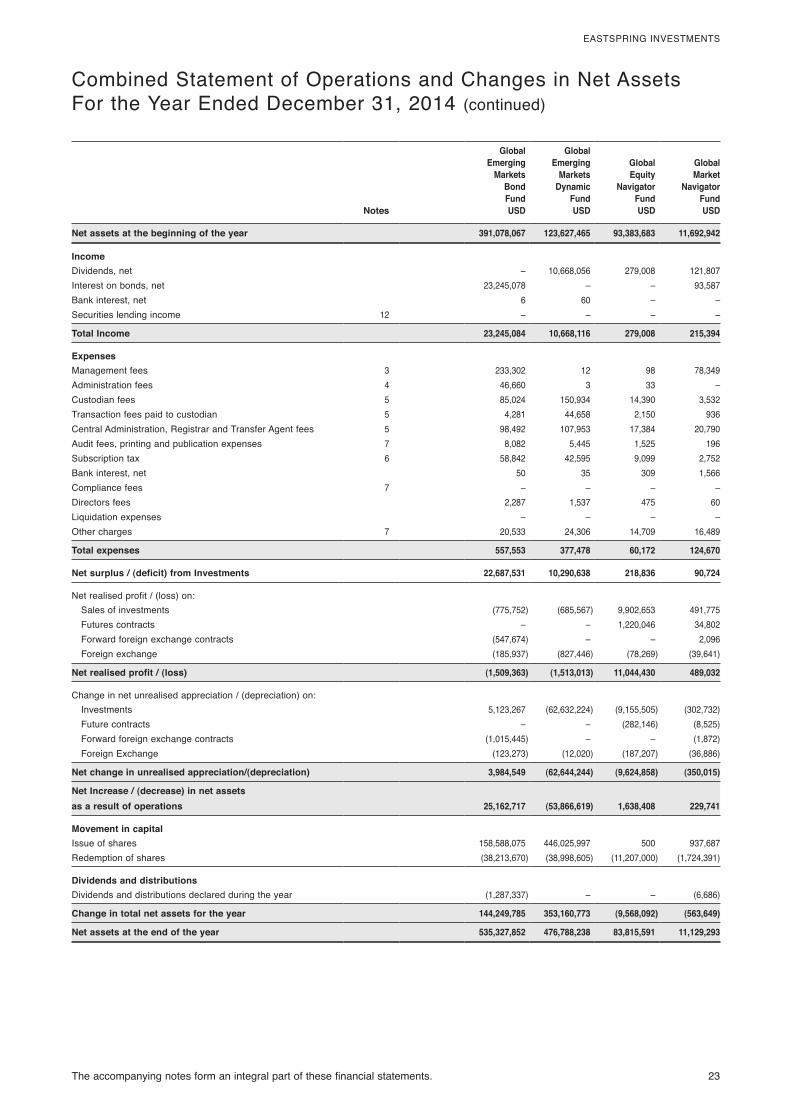
Combined Statement of Operations and Changes in Net AssetsFor the Year Ended December 31, 2014 (continued)
Global Emerging
Markets Bond Fund
Global Emerging
Markets Dynamic
Fund
Global Equity
Navigator Fund
Global Market
Navigator Fund
Notes USD USD USD USD
Net assets at the beginning of the year 391,078,067 123,627,465 93,383,683 11,692,942
IncomeDividends, net – 10,668,056 279,008 121,807Interest on bonds, net 23,245,078 – – 93,587Bank interest, net 6 60 – –Securities lending income 12 – – – –
Total Income 23,245,084 10,668,116 279,008 215,394
ExpensesManagement fees 3 233,302 12 98 78,349Administration fees 4 46,660 3 33 –Custodian fees 5 85,024 150,934 14,390 3,532Transaction fees paid to custodian 5 4,281 44,658 2,150 936Central Administration, Registrar and Transfer Agent fees 5 98,492 107,953 17,384 20,790Audit fees, printing and publication expenses 7 8,082 5,445 1,525 196Subscription tax 6 58,842 42,595 9,099 2,752Bank interest, net 50 35 309 1,566Compliance fees 7 – – – –Directors fees 2,287 1,537 475 60Liquidation expenses – – – –Other charges 7 20,533 24,306 14,709 16,489
Total expenses 557,553 377,478 60,172 124,670
Net surplus / (deficit) from Investments 22,687,531 10,290,638 218,836 90,724
Net realised profit / (loss) on:Sales of investments (775,752) (685,567) 9,902,653 491,775Futures contracts – – 1,220,046 34,802Forward foreign exchange contracts (547,674) – – 2,096Foreign exchange (185,937) (827,446) (78,269) (39,641)
Net realised profit / (loss) (1,509,363) (1,513,013) 11,044,430 489,032
Change in net unrealised appreciation / (depreciation) on:Investments 5,123,267 (62,632,224) (9,155,505) (302,732)Future contracts – – (282,146) (8,525)Forward foreign exchange contracts (1,015,445) – – (1,872)Foreign Exchange (123,273) (12,020) (187,207) (36,886)
Net change in unrealised appreciation/(depreciation) 3,984,549 (62,644,244) (9,624,858) (350,015)
Net Increase / (decrease) in net assets as a result of operations 25,162,717 (53,866,619) 1,638,408 229,741
Movement in capitalIssue of shares 158,588,075 446,025,997 500 937,687Redemption of shares (38,213,670) (38,998,605) (11,207,000) (1,724,391)
Dividends and distributionsDividends and distributions declared during the year (1,287,337) – – (6,686)
Change in total net assets for the year 144,249,785 353,160,773 (9,568,092) (563,649)
Net assets at the end of the year 535,327,852 476,788,238 83,815,591 11,129,293
24 The accompanying notes form an integral part of these financial statements.
EASTSPRING INVESTMENTS
Combined Statement of Operations and Changes in Net AssetsFor the Year Ended December 31, 2014 (continued)
Global Technology
Fund
Greater China
Equity Fund
Hong Kong Equity
FundIndia Equity
FundNotes USD USD USD USD
Net assets at the beginning of the year 84,900,665 120,093,155 627,677,108 163,845,872
IncomeDividends, net 846,410 4,148,641 27,392,619 3,203,523Interest on bonds, net – – – 351Bank interest, net 143 16 27 –Securities lending income 12 – 4,984 8,891 –
Total Income 846,553 4,153,641 27,401,537 3,203,874
ExpensesManagement fees 3 824,137 930,010 47,402 409,423Administration fees 4 33,505 84,337 15,800 106,006Custodian fees 5 28,300 61,234 155,092 134,032Transaction fees paid to custodian 5 16,378 35,930 8,040 54,406Central Administration, Registrar and Transfer Agent fees 5 41,862 48,224 108,160 60,198Audit fees, printing and publication expenses 7 1,454 2,044 10,972 2,847Subscription tax 6 11,844 18,926 69,281 25,963Bank interest, net 302 4,376 31 6,469Compliance fees 7 3,000 – – –Directors fees 445 622 3,345 871Liquidation expenses – – – –Other charges 7 29,285 29,371 33,034 81,108
Total expenses 990,512 1,215,074 451,157 881,323
Net surplus / (deficit) from Investments (143,959) 2,938,567 26,950,380 2,322,551
Net realised profit / (loss) on:Sales of investments 8,691,457 (2,559,857) 3,022,411 16,744,486Futures contracts – – – –Forward foreign exchange contracts – – – –Foreign exchange (24,516) (11,407) (18,996) (90,969)
Net realised profit / (loss) 8,666,941 (2,571,264) 3,003,415 16,653,517
Change in net unrealised appreciation / (depreciation) on:Investments 643,739 5,769,969 (8,372,114) 28,462,524Future contracts – – – –Forward foreign exchange contracts – – – –Foreign Exchange (16,000) 577 (1,882) (7,053)
Net change in unrealised appreciation/(depreciation) 627,739 5,770,546 (8,373,996) 28,455,471
Net Increase / (decrease) in net assets as a result of operations 9,150,721 6,137,849 21,579,799 47,431,539
Movement in capitalIssue of shares 15,047,367 29,373,431 99,798,247 49,812,269Redemption of shares (18,017,263) (24,999,557) (159,931,612) (96,679,465)
Dividends and distributionsDividends and distributions declared during the year – – – –
Change in total net assets for the year 6,180,825 10,511,723 (38,553,566) 564,343
Net assets at the end of the year 91,081,490 130,604,878 589,123,542 164,410,215
The accompanying notes form an integral part of these financial statements. 25
EASTSPRING INVESTMENTS
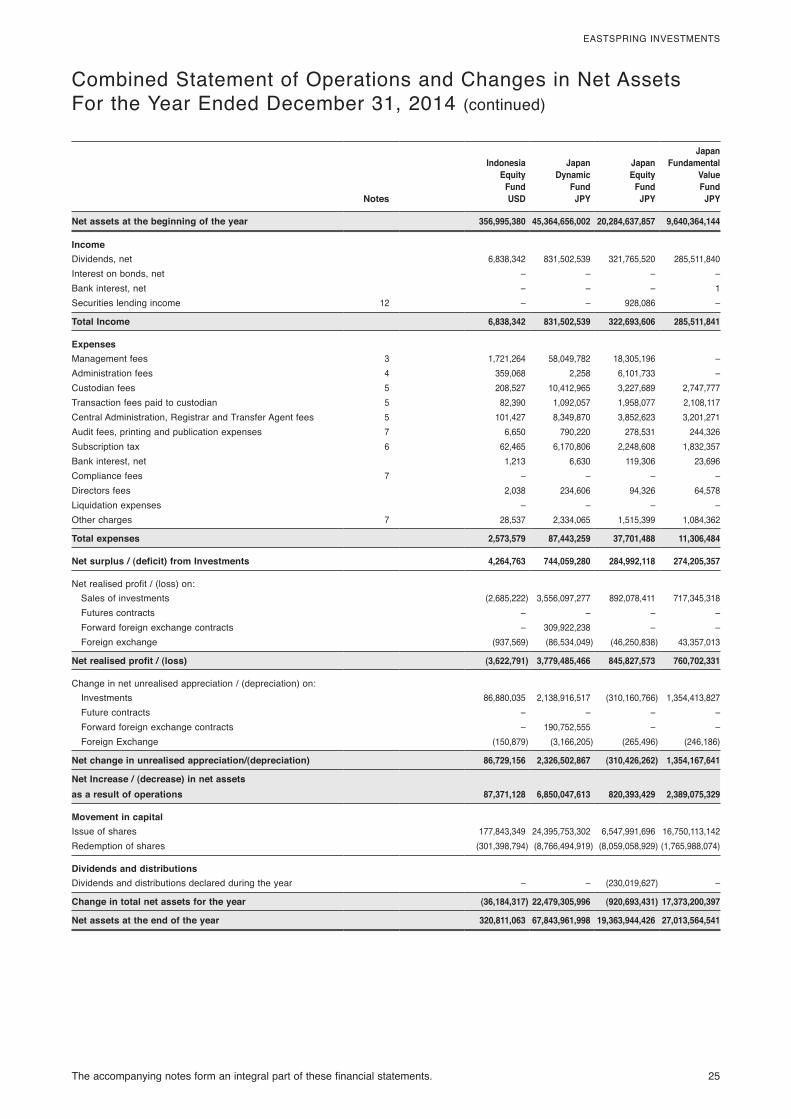
Combined Statement of Operations and Changes in Net AssetsFor the Year Ended December 31, 2014 (continued)
Indonesia Equity
Fund
Japan Dynamic
Fund
Japan Equity
Fund
Japan Fundamental
Value Fund
Notes USD JPY JPY JPY
Net assets at the beginning of the year 356,995,380 45,364,656,002 20,284,637,857 9,640,364,144
IncomeDividends, net 6,838,342 831,502,539 321,765,520 285,511,840Interest on bonds, net – – – –Bank interest, net – – – 1Securities lending income 12 – – 928,086 –
Total Income 6,838,342 831,502,539 322,693,606 285,511,841
ExpensesManagement fees 3 1,721,264 58,049,782 18,305,196 –Administration fees 4 359,068 2,258 6,101,733 –Custodian fees 5 208,527 10,412,965 3,227,689 2,747,777Transaction fees paid to custodian 5 82,390 1,092,057 1,958,077 2,108,117Central Administration, Registrar and Transfer Agent fees 5 101,427 8,349,870 3,852,623 3,201,271Audit fees, printing and publication expenses 7 6,650 790,220 278,531 244,326Subscription tax 6 62,465 6,170,806 2,248,608 1,832,357Bank interest, net 1,213 6,630 119,306 23,696Compliance fees 7 – – – –Directors fees 2,038 234,606 94,326 64,578Liquidation expenses – – – –Other charges 7 28,537 2,334,065 1,515,399 1,084,362
Total expenses 2,573,579 87,443,259 37,701,488 11,306,484
Net surplus / (deficit) from Investments 4,264,763 744,059,280 284,992,118 274,205,357
Net realised profit / (loss) on:Sales of investments (2,685,222) 3,556,097,277 892,078,411 717,345,318Futures contracts – – – –Forward foreign exchange contracts – 309,922,238 – –Foreign exchange (937,569) (86,534,049) (46,250,838) 43,357,013
Net realised profit / (loss) (3,622,791) 3,779,485,466 845,827,573 760,702,331
Change in net unrealised appreciation / (depreciation) on:Investments 86,880,035 2,138,916,517 (310,160,766) 1,354,413,827Future contracts – – – –Forward foreign exchange contracts – 190,752,555 – –Foreign Exchange (150,879) (3,166,205) (265,496) (246,186)
Net change in unrealised appreciation/(depreciation) 86,729,156 2,326,502,867 (310,426,262) 1,354,167,641
Net Increase / (decrease) in net assets as a result of operations 87,371,128 6,850,047,613 820,393,429 2,389,075,329
Movement in capitalIssue of shares 177,843,349 24,395,753,302 6,547,991,696 16,750,113,142Redemption of shares (301,398,794) (8,766,494,919) (8,059,058,929) (1,765,988,074)
Dividends and distributionsDividends and distributions declared during the year – – (230,019,627) –
Change in total net assets for the year (36,184,317) 22,479,305,996 (920,693,431) 17,373,200,397
Net assets at the end of the year 320,811,063 67,843,961,998 19,363,944,426 27,013,564,541
26 The accompanying notes form an integral part of these financial statements.
EASTSPRING INVESTMENTS
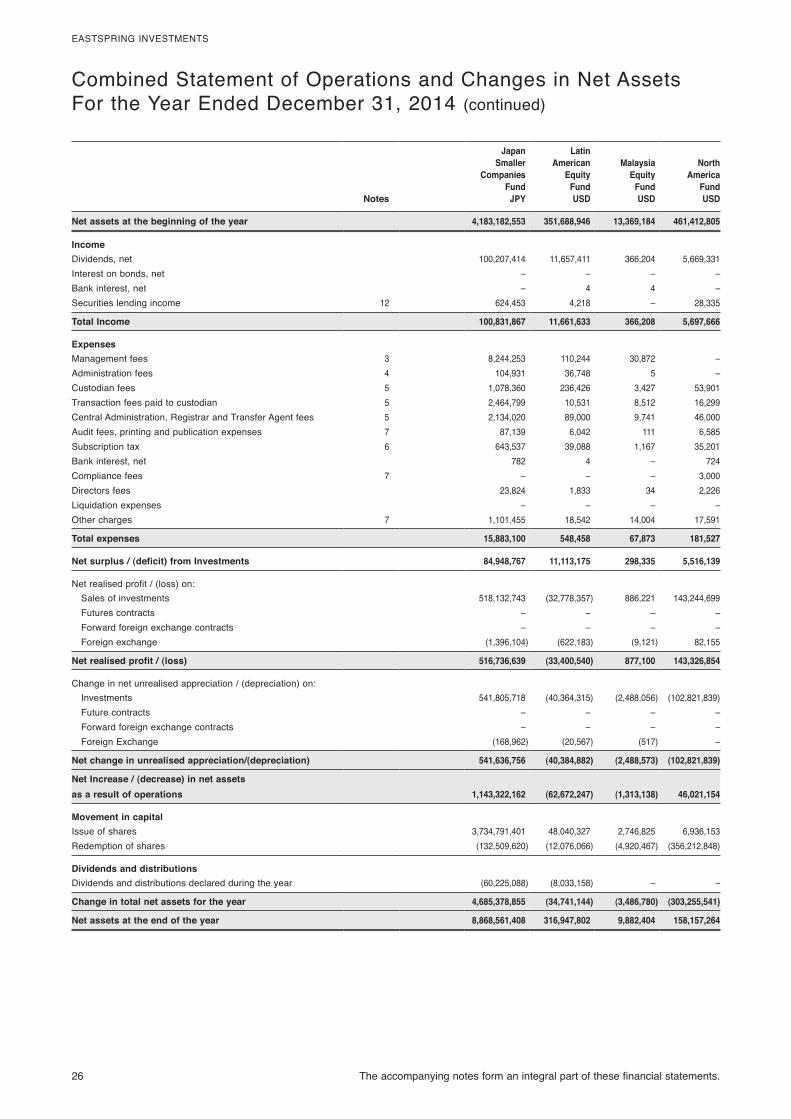
Combined Statement of Operations and Changes in Net AssetsFor the Year Ended December 31, 2014 (continued)
Japan Smaller
Companies Fund
Latin American
Equity Fund
Malaysia Equity
Fund
North America
FundNotes JPY USD USD USD
Net assets at the beginning of the year 4,183,182,553 351,688,946 13,369,184 461,412,805
IncomeDividends, net 100,207,414 11,657,411 366,204 5,669,331Interest on bonds, net – – – –Bank interest, net – 4 4 –Securities lending income 12 624,453 4,218 – 28,335
Total Income 100,831,867 11,661,633 366,208 5,697,666
ExpensesManagement fees 3 8,244,253 110,244 30,872 –Administration fees 4 104,931 36,748 5 –Custodian fees 5 1,078,360 236,426 3,427 53,901Transaction fees paid to custodian 5 2,464,799 10,531 8,512 16,299Central Administration, Registrar and Transfer Agent fees 5 2,134,020 89,000 9,741 46,000Audit fees, printing and publication expenses 7 87,139 6,042 111 6,585Subscription tax 6 643,537 39,088 1,167 35,201Bank interest, net 782 4 – 724Compliance fees 7 – – – 3,000Directors fees 23,824 1,833 34 2,226Liquidation expenses – – – –Other charges 7 1,101,455 18,542 14,004 17,591
Total expenses 15,883,100 548,458 67,873 181,527
Net surplus / (deficit) from Investments 84,948,767 11,113,175 298,335 5,516,139
Net realised profit / (loss) on:Sales of investments 518,132,743 (32,778,357) 886,221 143,244,699Futures contracts – – – –Forward foreign exchange contracts – – – –Foreign exchange (1,396,104) (622,183) (9,121) 82,155
Net realised profit / (loss) 516,736,639 (33,400,540) 877,100 143,326,854
Change in net unrealised appreciation / (depreciation) on:Investments 541,805,718 (40,364,315) (2,488,056) (102,821,839)Future contracts – – – –Forward foreign exchange contracts – – – –Foreign Exchange (168,962) (20,567) (517) –
Net change in unrealised appreciation/(depreciation) 541,636,756 (40,384,882) (2,488,573) (102,821,839)
Net Increase / (decrease) in net assets as a result of operations 1,143,322,162 (62,672,247) (1,313,138) 46,021,154
Movement in capitalIssue of shares 3,734,791,401 48,040,327 2,746,825 6,936,153Redemption of shares (132,509,620) (12,076,066) (4,920,467) (356,212,848)
Dividends and distributionsDividends and distributions declared during the year (60,225,088) (8,033,158) – –
Change in total net assets for the year 4,685,378,855 (34,741,144) (3,486,780) (303,255,541)
Net assets at the end of the year 8,868,561,408 316,947,802 9,882,404 158,157,264
The accompanying notes form an integral part of these financial statements. 27
EASTSPRING INVESTMENTS
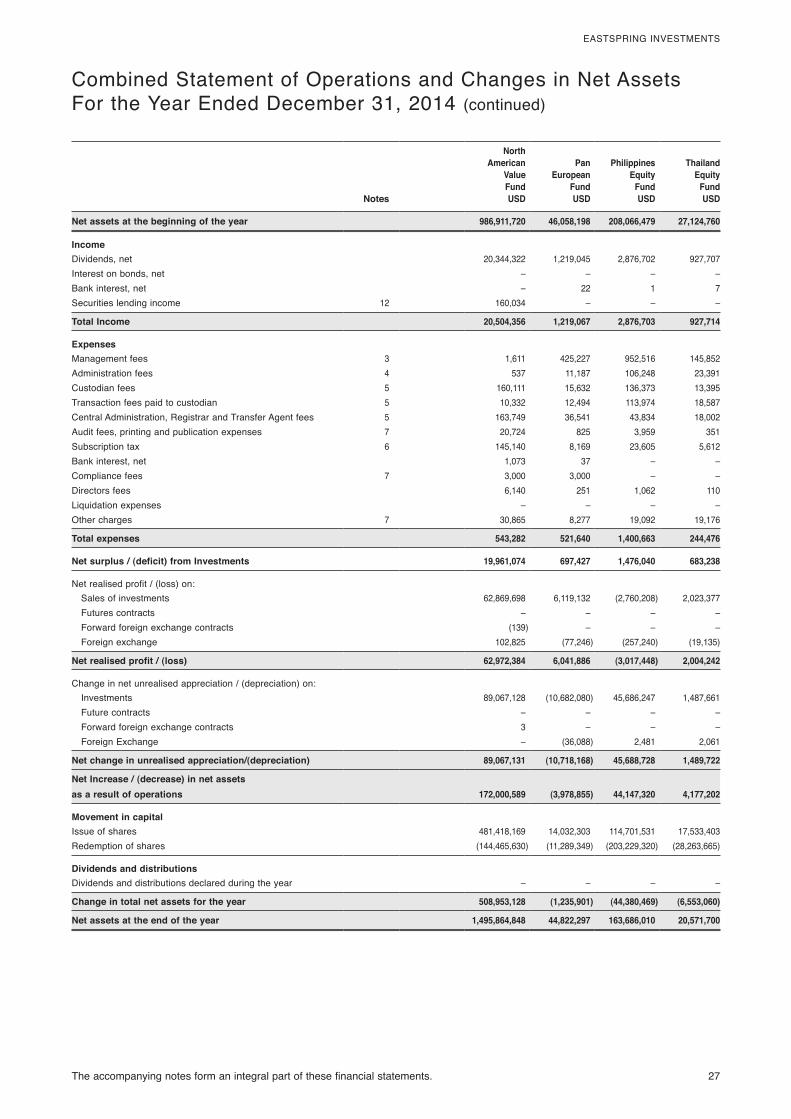
Combined Statement of Operations and Changes in Net AssetsFor the Year Ended December 31, 2014 (continued)
North American
Value Fund
Pan European
Fund
Philippines Equity
Fund
Thailand Equity
FundNotes USD USD USD USD
Net assets at the beginning of the year 986,911,720 46,058,198 208,066,479 27,124,760
IncomeDividends, net 20,344,322 1,219,045 2,876,702 927,707Interest on bonds, net – – – –Bank interest, net – 22 1 7Securities lending income 12 160,034 – – –
Total Income 20,504,356 1,219,067 2,876,703 927,714
ExpensesManagement fees 3 1,611 425,227 952,516 145,852Administration fees 4 537 11,187 106,248 23,391Custodian fees 5 160,111 15,632 136,373 13,395Transaction fees paid to custodian 5 10,332 12,494 113,974 18,587Central Administration, Registrar and Transfer Agent fees 5 163,749 36,541 43,834 18,002Audit fees, printing and publication expenses 7 20,724 825 3,959 351Subscription tax 6 145,140 8,169 23,605 5,612Bank interest, net 1,073 37 – –Compliance fees 7 3,000 3,000 – –Directors fees 6,140 251 1,062 110Liquidation expenses – – – –Other charges 7 30,865 8,277 19,092 19,176
Total expenses 543,282 521,640 1,400,663 244,476
Net surplus / (deficit) from Investments 19,961,074 697,427 1,476,040 683,238
Net realised profit / (loss) on:Sales of investments 62,869,698 6,119,132 (2,760,208) 2,023,377Futures contracts – – – –Forward foreign exchange contracts (139) – – –Foreign exchange 102,825 (77,246) (257,240) (19,135)
Net realised profit / (loss) 62,972,384 6,041,886 (3,017,448) 2,004,242
Change in net unrealised appreciation / (depreciation) on:Investments 89,067,128 (10,682,080) 45,686,247 1,487,661Future contracts – – – –Forward foreign exchange contracts 3 – – –Foreign Exchange – (36,088) 2,481 2,061
Net change in unrealised appreciation/(depreciation) 89,067,131 (10,718,168) 45,688,728 1,489,722
Net Increase / (decrease) in net assets as a result of operations 172,000,589 (3,978,855) 44,147,320 4,177,202
Movement in capitalIssue of shares 481,418,169 14,032,303 114,701,531 17,533,403Redemption of shares (144,465,630) (11,289,349) (203,229,320) (28,263,665)
Dividends and distributionsDividends and distributions declared during the year – – – –
Change in total net assets for the year 508,953,128 (1,235,901) (44,380,469) (6,553,060)
Net assets at the end of the year 1,495,864,848 44,822,297 163,686,010 20,571,700

28 The accompanying notes form an integral part of these financial statements.
EASTSPRING INVESTMENTS
Combined Statement of Operations and Changes in Net AssetsFor the Year Ended December 31, 2014 (continued)
US Bond Fund
US Corporate Bond Fund
US HighInvestment
Grade Bond Fund
US High Yield Bond Fund
Notes USD USD USD USD
Net assets at the beginning of the year 162,902,328 3,907,627,108 253,981,570 2,468,935,851
IncomeDividends, net 6,144 709,190 – 2,586,600Interest on bonds, net 4,212,270 138,880,485 7,480,792 175,729,806Bank interest, net – – – 5,758Securities lending income 12 – – – –
Total Income 4,218,414 139,589,675 7,480,792 178,322,164
ExpensesManagement fees 3 210,594 2,015,994 176,229 24,275,324Administration fees 4 24,834 100,019 15,724 4,364,142Custodian fees 5 23,609 525,743 37,973 375,148Transaction fees paid to custodian 5 5,328 11,304 4,530 11,514Central Administration, Registrar and Transfer Agent fees 5 55,388 517,246 68,701 459,815Audit fees, printing and publication expenses 7 2,634 70,810 4,276 74,327Subscription tax 6 18,832 459,406 27,988 968,367Bank interest, net 1,816 1,266 2,577 –Compliance fees 7 3,000 3,000 3,000 3,000Directors fees 853 21,379 1,326 14,413Liquidation expenses – – – –Other charges 7 6,055 169,867 23,197 95,912
Total expenses 352,943 3,896,034 365,521 30,641,962
Net surplus / (deficit) from Investments 3,865,471 135,693,641 7,115,271 147,680,202
Net realised profit / (loss) on:Sales of investments 3,208,924 64,586,800 3,747,065 2,074,953Futures contracts 1,844 (3,430,821) (421,688) –Forward foreign exchange contracts 84,503 650,711 – (37,832,036)Foreign exchange 37,509 (1,066,840) 178 (625,243)
Net realised profit / (loss) 3,332,780 60,739,850 3,325,555 (36,382,326)
Change in net unrealised appreciation / (depreciation) on:Investments 1,453,792 121,402,087 7,756,731 (208,045,449)Future contracts – (4,347,798) (394,711) –Forward foreign exchange contracts 422,873 (2,822,835) – (13,478,878)Foreign Exchange – (1,376) (198) –
Net change in unrealised appreciation/(depreciation) 1,876,665 114,230,078 7,361,822 (221,524,327)
Net Increase / (decrease) in net assets as a result of operations 9,074,916 310,663,569 17,802,648 (110,226,451)
Movement in capitalIssue of shares 31,910,944 954,005,308 38,542,220 1,904,096,564Redemption of shares (102,350,730) (438,184,554) (65,614,554) (1,715,094,343)
Dividends and distributionsDividends and distributions declared during the year (690,440) (12,121,859) (125,403) (148,112,124)
Change in total net assets for the year (62,055,310) 814,362,464 (9,395,089) (69,336,354)
Net assets at the end of the year 100,847,018 4,721,989,572 244,586,481 2,399,599,497
The accompanying notes form an integral part of these financial statements. 29
EASTSPRING INVESTMENTS
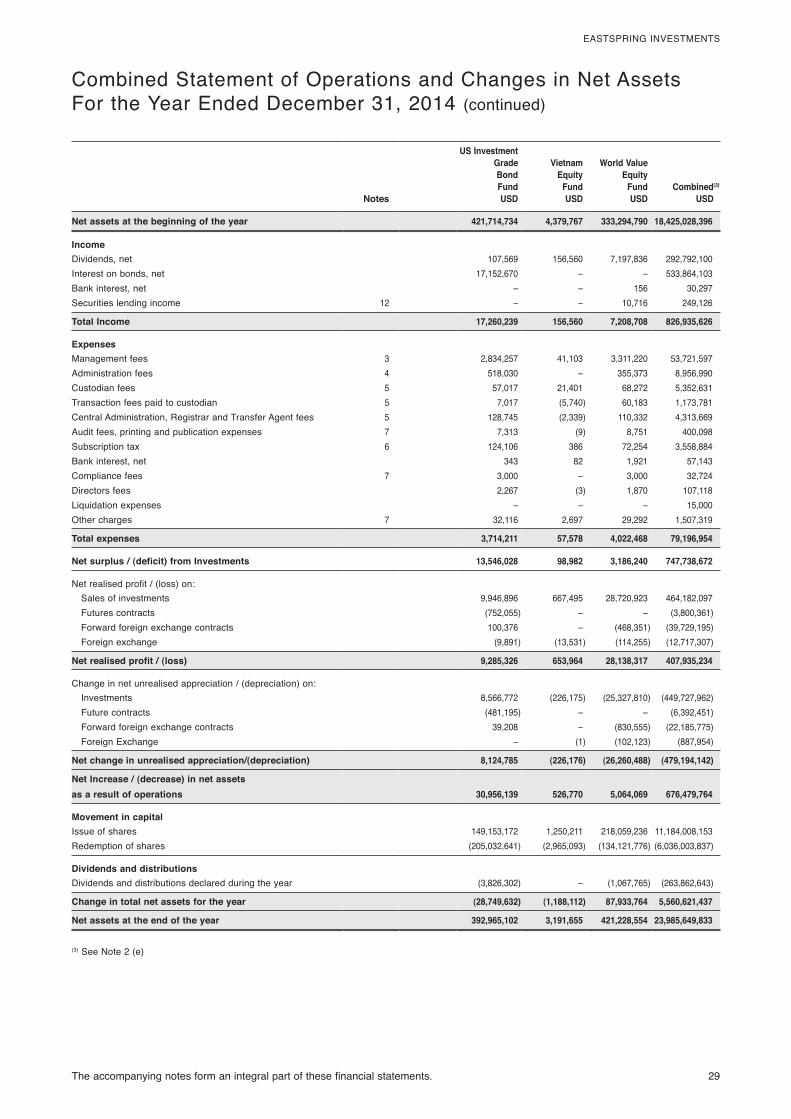
Combined Statement of Operations and Changes in Net AssetsFor the Year Ended December 31, 2014 (continued)
US Investment Grade Bond Fund
Vietnam Equity
Fund
World Value Equity
Fund Combined(3)
Notes USD USD USD USD
Net assets at the beginning of the year 421,714,734 4,379,767 333,294,790 18,425,028,396
IncomeDividends, net 107,569 156,560 7,197,836 292,792,100Interest on bonds, net 17,152,670 – – 533,864,103Bank interest, net – – 156 30,297Securities lending income 12 – – 10,716 249,126
Total Income 17,260,239 156,560 7,208,708 826,935,626
ExpensesManagement fees 3 2,834,257 41,103 3,311,220 53,721,597Administration fees 4 518,030 – 355,373 8,956,990Custodian fees 5 57,017 21,401 68,272 5,352,631Transaction fees paid to custodian 5 7,017 (5,740) 60,183 1,173,781Central Administration, Registrar and Transfer Agent fees 5 128,745 (2,339) 110,332 4,313,669Audit fees, printing and publication expenses 7 7,313 (9) 8,751 400,098Subscription tax 6 124,106 386 72,254 3,558,884Bank interest, net 343 82 1,921 57,143Compliance fees 7 3,000 – 3,000 32,724Directors fees 2,267 (3) 1,870 107,118Liquidation expenses – – – 15,000Other charges 7 32,116 2,697 29,292 1,507,319
Total expenses 3,714,211 57,578 4,022,468 79,196,954
Net surplus / (deficit) from Investments 13,546,028 98,982 3,186,240 747,738,672
Net realised profit / (loss) on:Sales of investments 9,946,896 667,495 28,720,923 464,182,097Futures contracts (752,055) – – (3,800,361)Forward foreign exchange contracts 100,376 – (468,351) (39,729,195)Foreign exchange (9,891) (13,531) (114,255) (12,717,307)
Net realised profit / (loss) 9,285,326 653,964 28,138,317 407,935,234
Change in net unrealised appreciation / (depreciation) on:Investments 8,566,772 (226,175) (25,327,810) (449,727,962)Future contracts (481,195) – – (6,392,451)Forward foreign exchange contracts 39,208 – (830,555) (22,185,775)Foreign Exchange – (1) (102,123) (887,954)
Net change in unrealised appreciation/(depreciation) 8,124,785 (226,176) (26,260,488) (479,194,142)
Net Increase / (decrease) in net assets as a result of operations 30,956,139 526,770 5,064,069 676,479,764
Movement in capitalIssue of shares 149,153,172 1,250,211 218,059,236 11,184,008,153Redemption of shares (205,032,641) (2,965,093) (134,121,776) (6,036,003,837)
Dividends and distributionsDividends and distributions declared during the year (3,826,302) – (1,067,765) (263,862,643)
Change in total net assets for the year (28,749,632) (1,188,112) 87,933,764 5,560,621,437
Net assets at the end of the year 392,965,102 3,191,655 421,228,554 23,985,649,833
(3) See Note 2 (e)
30
EASTSPRING INVESTMENTS
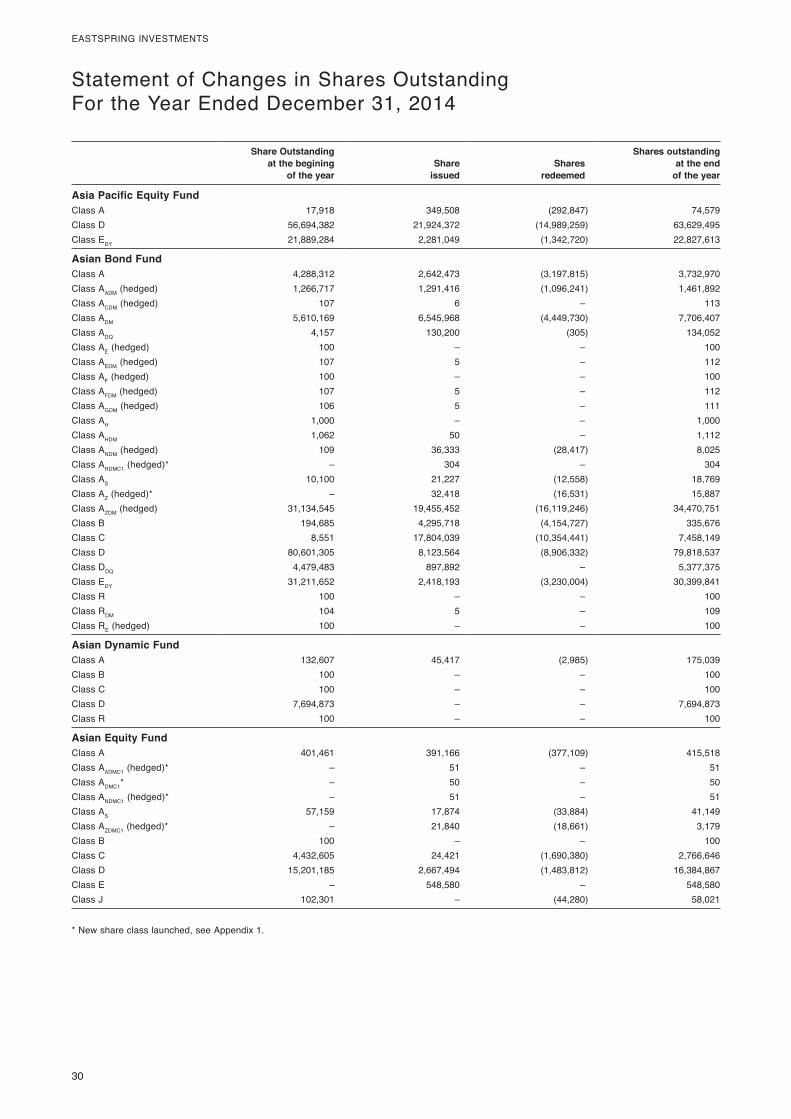
Statement of Changes in Shares OutstandingFor the Year Ended December 31, 2014
Share Outstanding at the begining
of the yearShare
issuedShares
redeemed
Shares outstanding at the end
of the year
Asia Pacific Equity FundClass A 17,918 349,508 (292,847) 74,579Class D 56,694,382 21,924,372 (14,989,259) 63,629,495Class EDY 21,889,284 2,281,049 (1,342,720) 22,827,613
Asian Bond FundClass A 4,288,312 2,642,473 (3,197,815) 3,732,970Class AADM (hedged) 1,266,717 1,291,416 (1,096,241) 1,461,892Class ACDM (hedged) 107 6 – 113Class ADM 5,610,169 6,545,968 (4,449,730) 7,706,407Class ADQ 4,157 130,200 (305) 134,052Class AE (hedged) 100 – – 100Class AEDM (hedged) 107 5 – 112Class AF (hedged) 100 – – 100Class AFDM (hedged) 107 5 – 112Class AGDM (hedged) 106 5 – 111Class AH 1,000 – – 1,000Class AHDM 1,062 50 – 1,112Class ANDM (hedged) 109 36,333 (28,417) 8,025Class ARDMC1 (hedged)* – 304 – 304Class AS 10,100 21,227 (12,558) 18,769Class AZ (hedged)* – 32,418 (16,531) 15,887Class AZDM (hedged) 31,134,545 19,455,452 (16,119,246) 34,470,751Class B 194,685 4,295,718 (4,154,727) 335,676Class C 8,551 17,804,039 (10,354,441) 7,458,149Class D 80,601,305 8,123,564 (8,906,332) 79,818,537Class DDQ 4,479,483 897,892 – 5,377,375Class EDY 31,211,652 2,418,193 (3,230,004) 30,399,841Class R 100 – – 100Class RDM 104 5 – 109Class RE (hedged) 100 – – 100
Asian Dynamic FundClass A 132,607 45,417 (2,985) 175,039Class B 100 – – 100Class C 100 – – 100Class D 7,694,873 – – 7,694,873Class R 100 – – 100
Asian Equity FundClass A 401,461 391,166 (377,109) 415,518Class AADMC1 (hedged)* – 51 – 51Class ADMC1* – 50 – 50Class ANDMC1 (hedged)* – 51 – 51Class AS 57,159 17,874 (33,884) 41,149Class AZDMC1 (hedged)* – 21,840 (18,661) 3,179Class B 100 – – 100Class C 4,432,605 24,421 (1,690,380) 2,766,646Class D 15,201,185 2,667,494 (1,483,812) 16,384,867Class E – 548,580 – 548,580Class J 102,301 – (44,280) 58,021
* New share class launched, see Appendix 1.
31
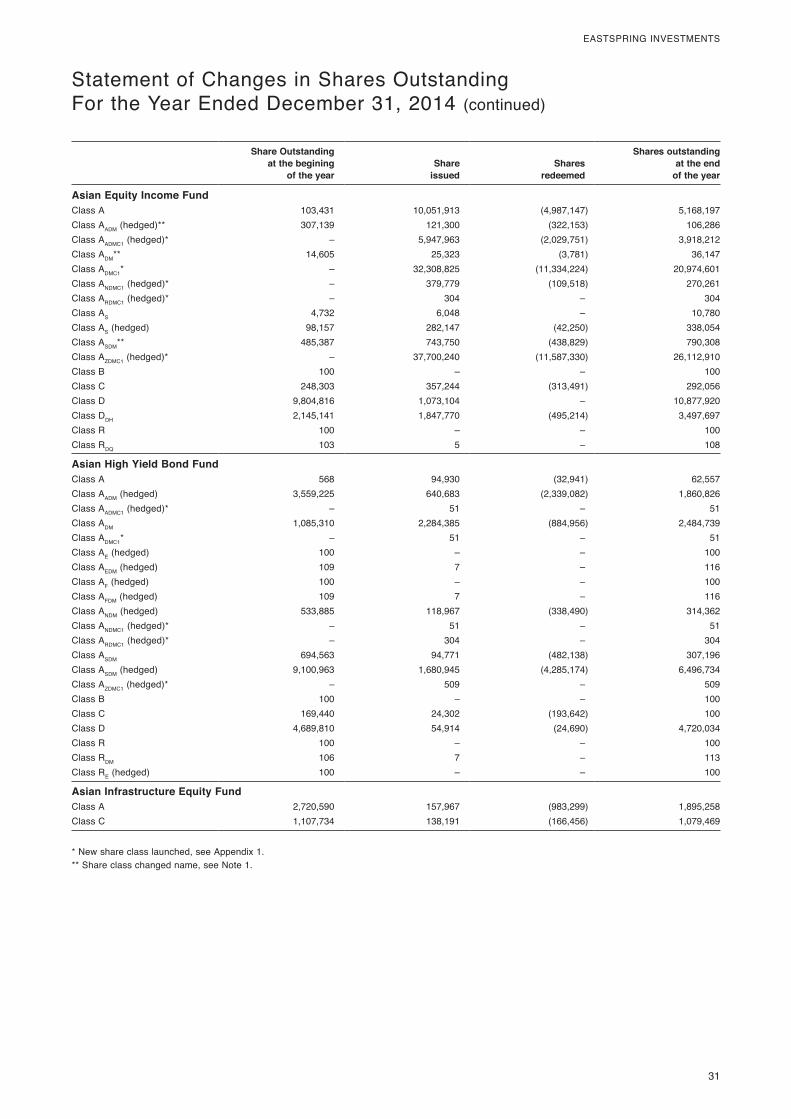
EASTSPRING INVESTMENTS
Statement of Changes in Shares OutstandingFor the Year Ended December 31, 2014 (continued)
Share Outstanding at the begining
of the yearShare
issuedShares
redeemed
Shares outstanding at the end
of the year
Asian Equity Income FundClass A 103,431 10,051,913 (4,987,147) 5,168,197Class AADM (hedged)** 307,139 121,300 (322,153) 106,286Class AADMC1 (hedged)* – 5,947,963 (2,029,751) 3,918,212Class ADM** 14,605 25,323 (3,781) 36,147Class ADMC1* – 32,308,825 (11,334,224) 20,974,601Class ANDMC1 (hedged)* – 379,779 (109,518) 270,261Class ARDMC1 (hedged)* – 304 – 304Class AS 4,732 6,048 – 10,780Class AS (hedged) 98,157 282,147 (42,250) 338,054Class ASDM** 485,387 743,750 (438,829) 790,308Class AZDMC1 (hedged)* – 37,700,240 (11,587,330) 26,112,910Class B 100 – – 100Class C 248,303 357,244 (313,491) 292,056Class D 9,804,816 1,073,104 – 10,877,920Class DDH 2,145,141 1,847,770 (495,214) 3,497,697Class R 100 – – 100Class RDQ 103 5 – 108
Asian High Yield Bond FundClass A 568 94,930 (32,941) 62,557Class AADM (hedged) 3,559,225 640,683 (2,339,082) 1,860,826Class AADMC1 (hedged)* – 51 – 51Class ADM 1,085,310 2,284,385 (884,956) 2,484,739Class ADMC1* – 51 – 51Class AE (hedged) 100 – – 100Class AEDM (hedged) 109 7 – 116Class AF (hedged) 100 – – 100Class AFDM (hedged) 109 7 – 116Class ANDM (hedged) 533,885 118,967 (338,490) 314,362Class ANDMC1 (hedged)* – 51 – 51Class ARDMC1 (hedged)* – 304 – 304Class ASDM 694,563 94,771 (482,138) 307,196Class ASDM (hedged) 9,100,963 1,680,945 (4,285,174) 6,496,734Class AZDMC1 (hedged)* – 509 – 509Class B 100 – – 100Class C 169,440 24,302 (193,642) 100Class D 4,689,810 54,914 (24,690) 4,720,034Class R 100 – – 100Class RDM 106 7 – 113Class RE (hedged) 100 – – 100
Asian Infrastructure Equity FundClass A 2,720,590 157,967 (983,299) 1,895,258Class C 1,107,734 138,191 (166,456) 1,079,469
* New share class launched, see Appendix 1.** Share class changed name, see Note 1.
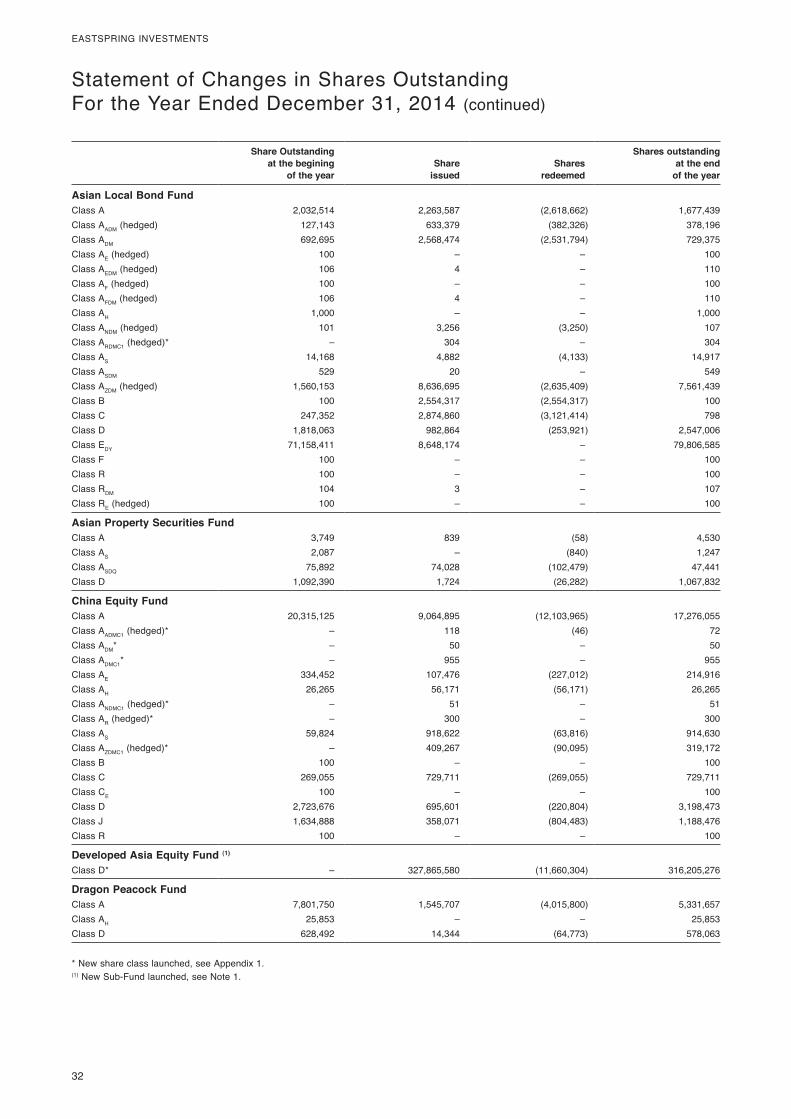
32
EASTSPRING INVESTMENTS
Statement of Changes in Shares OutstandingFor the Year Ended December 31, 2014 (continued)
Share Outstanding at the begining
of the yearShare
issuedShares
redeemed
Shares outstanding at the end
of the year
Asian Local Bond FundClass A 2,032,514 2,263,587 (2,618,662) 1,677,439Class AADM (hedged) 127,143 633,379 (382,326) 378,196Class ADM 692,695 2,568,474 (2,531,794) 729,375Class AE (hedged) 100 – – 100Class AEDM (hedged) 106 4 – 110Class AF (hedged) 100 – – 100Class AFDM (hedged) 106 4 – 110Class AH 1,000 – – 1,000Class ANDM (hedged) 101 3,256 (3,250) 107Class ARDMC1 (hedged)* – 304 – 304Class AS 14,168 4,882 (4,133) 14,917Class ASDM 529 20 – 549Class AZDM (hedged) 1,560,153 8,636,695 (2,635,409) 7,561,439Class B 100 2,554,317 (2,554,317) 100Class C 247,352 2,874,860 (3,121,414) 798Class D 1,818,063 982,864 (253,921) 2,547,006Class EDY 71,158,411 8,648,174 – 79,806,585Class F 100 – – 100Class R 100 – – 100Class RDM 104 3 – 107Class RE (hedged) 100 – – 100
Asian Property Securities FundClass A 3,749 839 (58) 4,530Class AS 2,087 – (840) 1,247Class ASDQ 75,892 74,028 (102,479) 47,441Class D 1,092,390 1,724 (26,282) 1,067,832
China Equity FundClass A 20,315,125 9,064,895 (12,103,965) 17,276,055Class AADMC1 (hedged)* – 118 (46) 72Class ADM* – 50 – 50Class ADMC1* – 955 – 955Class AE 334,452 107,476 (227,012) 214,916Class AH 26,265 56,171 (56,171) 26,265Class ANDMC1 (hedged)* – 51 – 51Class AR (hedged)* – 300 – 300Class AS 59,824 918,622 (63,816) 914,630Class AZDMC1 (hedged)* – 409,267 (90,095) 319,172Class B 100 – – 100Class C 269,055 729,711 (269,055) 729,711Class CE 100 – – 100Class D 2,723,676 695,601 (220,804) 3,198,473Class J 1,634,888 358,071 (804,483) 1,188,476Class R 100 – – 100
Developed Asia Equity Fund (1)
Class D* – 327,865,580 (11,660,304) 316,205,276
Dragon Peacock FundClass A 7,801,750 1,545,707 (4,015,800) 5,331,657Class AH 25,853 – – 25,853Class D 628,492 14,344 (64,773) 578,063
* New share class launched, see Appendix 1.(1) New Sub-Fund launched, see Note 1.
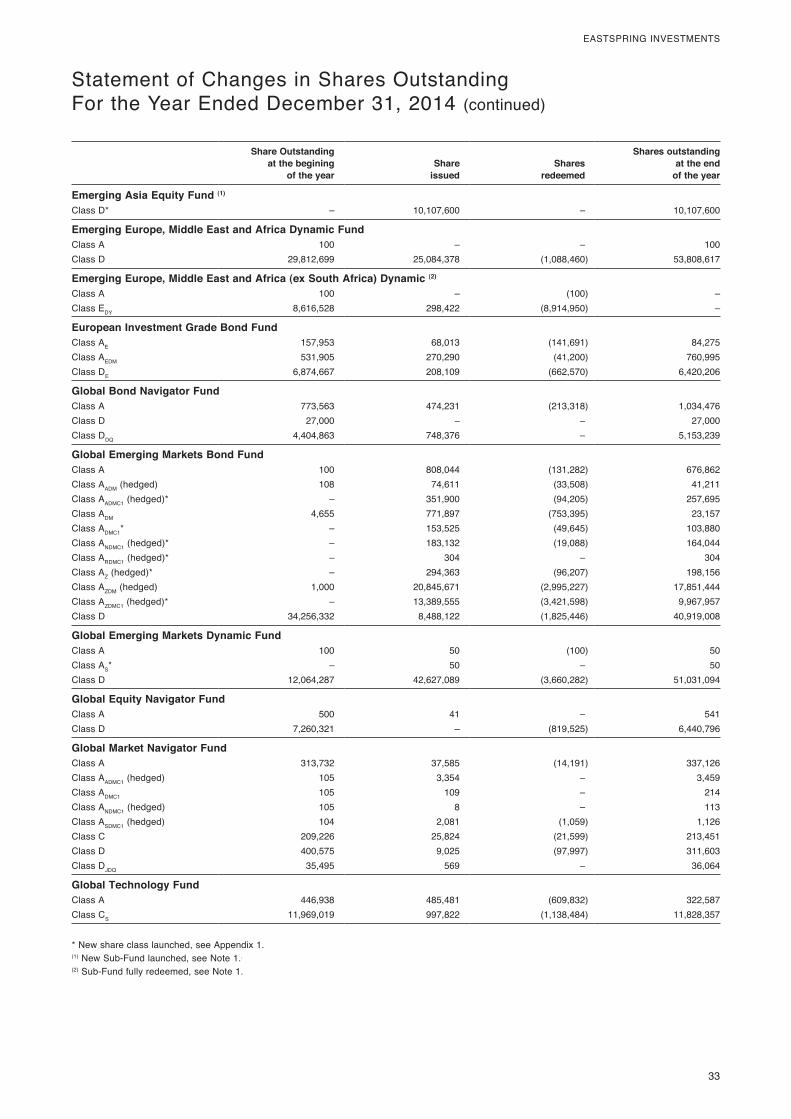
33
EASTSPRING INVESTMENTS
Statement of Changes in Shares OutstandingFor the Year Ended December 31, 2014 (continued)
Share Outstanding at the begining
of the yearShare
issuedShares
redeemed
Shares outstanding at the end
of the year
Emerging Asia Equity Fund (1)
Class D* – 10,107,600 – 10,107,600
Emerging Europe, Middle East and Africa Dynamic FundClass A 100 – – 100Class D 29,812,699 25,084,378 (1,088,460) 53,808,617
Emerging Europe, Middle East and Africa (ex South Africa) Dynamic (2)
Class A 100 – (100) –Class EDY 8,616,528 298,422 (8,914,950) –
European Investment Grade Bond FundClass AE 157,953 68,013 (141,691) 84,275Class AEDM 531,905 270,290 (41,200) 760,995Class DE 6,874,667 208,109 (662,570) 6,420,206
Global Bond Navigator FundClass A 773,563 474,231 (213,318) 1,034,476Class D 27,000 – – 27,000Class DDQ 4,404,863 748,376 – 5,153,239
Global Emerging Markets Bond FundClass A 100 808,044 (131,282) 676,862Class AADM (hedged) 108 74,611 (33,508) 41,211Class AADMC1 (hedged)* – 351,900 (94,205) 257,695Class ADM 4,655 771,897 (753,395) 23,157Class ADMC1* – 153,525 (49,645) 103,880Class ANDMC1 (hedged)* – 183,132 (19,088) 164,044Class ARDMC1 (hedged)* – 304 – 304Class AZ (hedged)* – 294,363 (96,207) 198,156Class AZDM (hedged) 1,000 20,845,671 (2,995,227) 17,851,444Class AZDMC1 (hedged)* – 13,389,555 (3,421,598) 9,967,957Class D 34,256,332 8,488,122 (1,825,446) 40,919,008
Global Emerging Markets Dynamic FundClass A 100 50 (100) 50Class AS* – 50 – 50Class D 12,064,287 42,627,089 (3,660,282) 51,031,094
Global Equity Navigator FundClass A 500 41 – 541Class D 7,260,321 – (819,525) 6,440,796
Global Market Navigator FundClass A 313,732 37,585 (14,191) 337,126Class AADMC1 (hedged) 105 3,354 – 3,459Class ADMC1 105 109 – 214Class ANDMC1 (hedged) 105 8 – 113Class ASDMC1 (hedged) 104 2,081 (1,059) 1,126Class C 209,226 25,824 (21,599) 213,451Class D 400,575 9,025 (97,997) 311,603Class DJDQ 35,495 569 – 36,064
Global Technology FundClass A 446,938 485,481 (609,832) 322,587Class CS 11,969,019 997,822 (1,138,484) 11,828,357
* New share class launched, see Appendix 1.(1) New Sub-Fund launched, see Note 1..
(2) Sub-Fund fully redeemed, see Note 1.
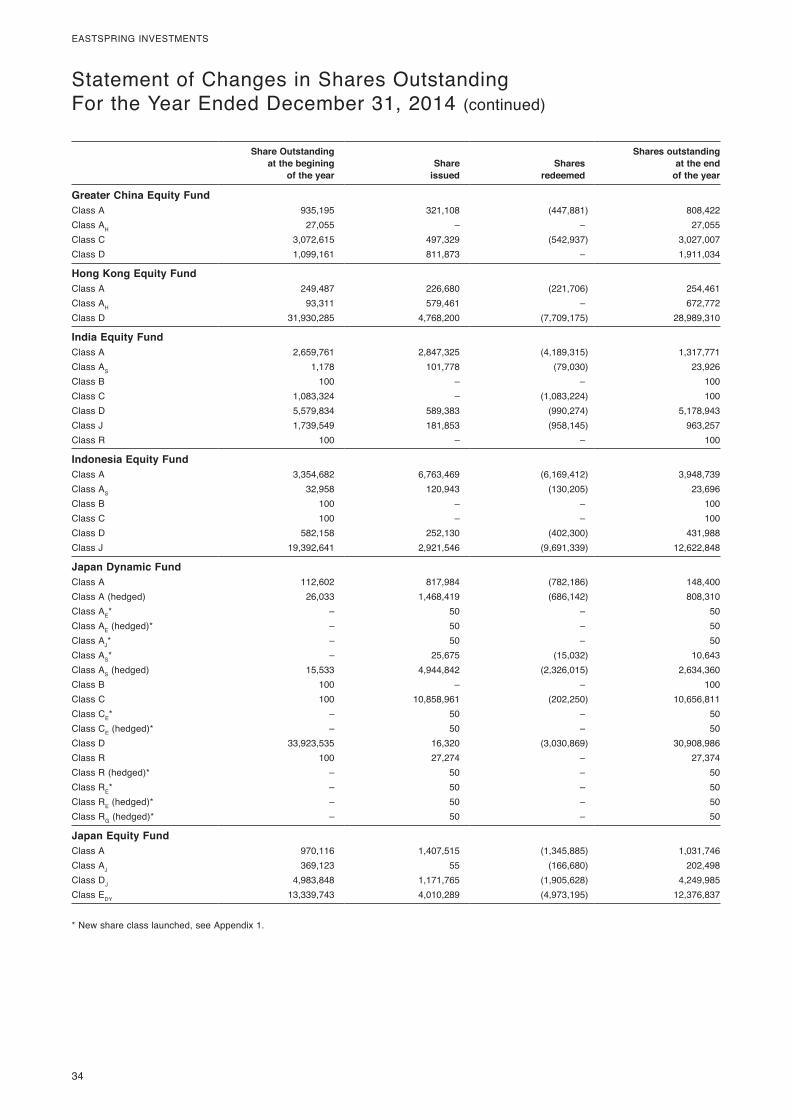
34
EASTSPRING INVESTMENTS
Statement of Changes in Shares OutstandingFor the Year Ended December 31, 2014 (continued)
Share Outstanding at the begining
of the yearShare
issuedShares
redeemed
Shares outstanding at the end
of the year
Greater China Equity FundClass A 935,195 321,108 (447,881) 808,422Class AH 27,055 – – 27,055Class C 3,072,615 497,329 (542,937) 3,027,007Class D 1,099,161 811,873 – 1,911,034
Hong Kong Equity FundClass A 249,487 226,680 (221,706) 254,461Class AH 93,311 579,461 – 672,772Class D 31,930,285 4,768,200 (7,709,175) 28,989,310
India Equity FundClass A 2,659,761 2,847,325 (4,189,315) 1,317,771Class AS 1,178 101,778 (79,030) 23,926Class B 100 – – 100Class C 1,083,324 – (1,083,224) 100Class D 5,579,834 589,383 (990,274) 5,178,943Class J 1,739,549 181,853 (958,145) 963,257Class R 100 – – 100
Indonesia Equity FundClass A 3,354,682 6,763,469 (6,169,412) 3,948,739Class AS 32,958 120,943 (130,205) 23,696Class B 100 – – 100Class C 100 – – 100Class D 582,158 252,130 (402,300) 431,988Class J 19,392,641 2,921,546 (9,691,339) 12,622,848
Japan Dynamic FundClass A 112,602 817,984 (782,186) 148,400Class A (hedged) 26,033 1,468,419 (686,142) 808,310Class AE* – 50 – 50Class AE (hedged)* – 50 – 50Class AJ* – 50 – 50Class AS* – 25,675 (15,032) 10,643Class AS (hedged) 15,533 4,944,842 (2,326,015) 2,634,360Class B 100 – – 100Class C 100 10,858,961 (202,250) 10,656,811Class CE* – 50 – 50Class CE (hedged)* – 50 – 50Class D 33,923,535 16,320 (3,030,869) 30,908,986Class R 100 27,274 – 27,374Class R (hedged)* – 50 – 50Class RE* – 50 – 50Class RE (hedged)* – 50 – 50Class RG (hedged)* – 50 – 50
Japan Equity FundClass A 970,116 1,407,515 (1,345,885) 1,031,746Class AJ 369,123 55 (166,680) 202,498Class DJ 4,983,848 1,171,765 (1,905,628) 4,249,985Class EDY 13,339,743 4,010,289 (4,973,195) 12,376,837
* New share class launched, see Appendix 1.
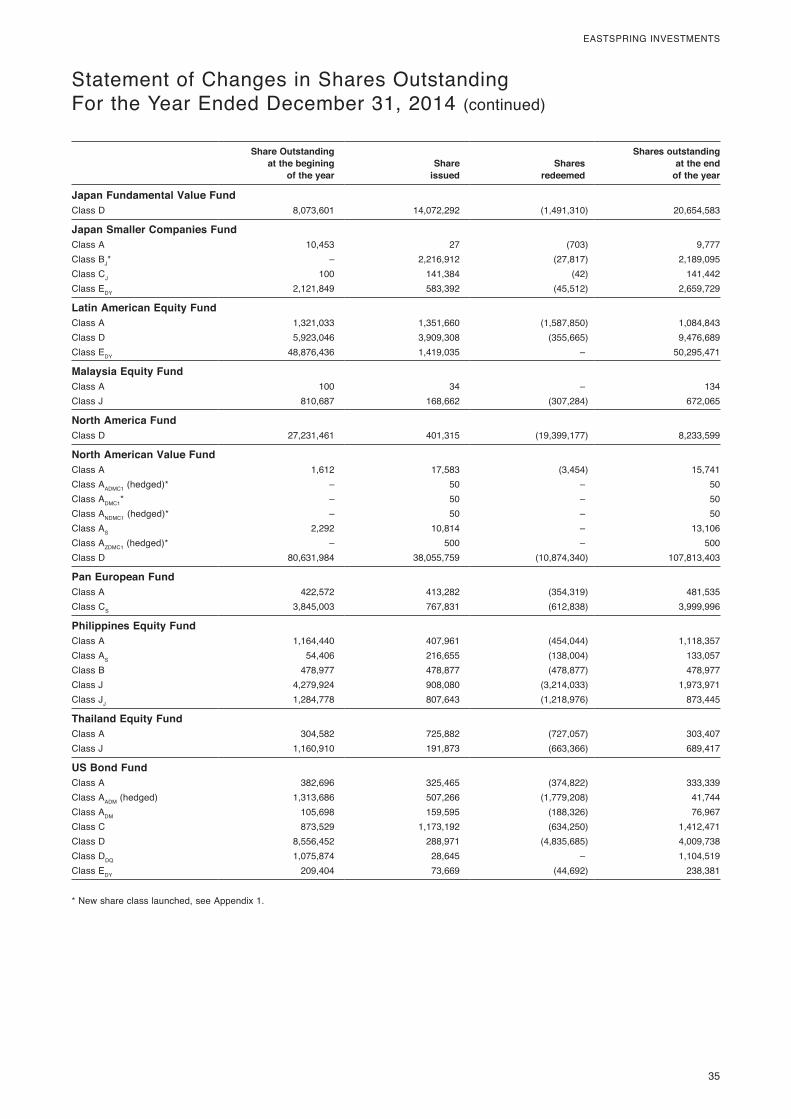
35
EASTSPRING INVESTMENTS
Statement of Changes in Shares OutstandingFor the Year Ended December 31, 2014 (continued)
Share Outstanding at the begining
of the yearShare
issuedShares
redeemed
Shares outstanding at the end
of the year
Japan Fundamental Value FundClass D 8,073,601 14,072,292 (1,491,310) 20,654,583
Japan Smaller Companies FundClass A 10,453 27 (703) 9,777Class BJ* – 2,216,912 (27,817) 2,189,095Class CJ 100 141,384 (42) 141,442Class EDY 2,121,849 583,392 (45,512) 2,659,729
Latin American Equity FundClass A 1,321,033 1,351,660 (1,587,850) 1,084,843Class D 5,923,046 3,909,308 (355,665) 9,476,689Class EDY 48,876,436 1,419,035 – 50,295,471
Malaysia Equity FundClass A 100 34 – 134Class J 810,687 168,662 (307,284) 672,065
North America FundClass D 27,231,461 401,315 (19,399,177) 8,233,599
North American Value FundClass A 1,612 17,583 (3,454) 15,741Class AADMC1 (hedged)* – 50 – 50Class ADMC1* – 50 – 50Class ANDMC1 (hedged)* – 50 – 50Class AS 2,292 10,814 – 13,106Class AZDMC1 (hedged)* – 500 – 500Class D 80,631,984 38,055,759 (10,874,340) 107,813,403
Pan European FundClass A 422,572 413,282 (354,319) 481,535Class CS 3,845,003 767,831 (612,838) 3,999,996
Philippines Equity FundClass A 1,164,440 407,961 (454,044) 1,118,357Class AS 54,406 216,655 (138,004) 133,057Class B 478,977 478,877 (478,877) 478,977Class J 4,279,924 908,080 (3,214,033) 1,973,971Class JJ 1,284,778 807,643 (1,218,976) 873,445
Thailand Equity FundClass A 304,582 725,882 (727,057) 303,407Class J 1,160,910 191,873 (663,366) 689,417
US Bond FundClass A 382,696 325,465 (374,822) 333,339Class AADM (hedged) 1,313,686 507,266 (1,779,208) 41,744Class ADM 105,698 159,595 (188,326) 76,967Class C 873,529 1,173,192 (634,250) 1,412,471Class D 8,556,452 288,971 (4,835,685) 4,009,738Class DDQ 1,075,874 28,645 – 1,104,519Class EDY 209,404 73,669 (44,692) 238,381
* New share class launched, see Appendix 1.
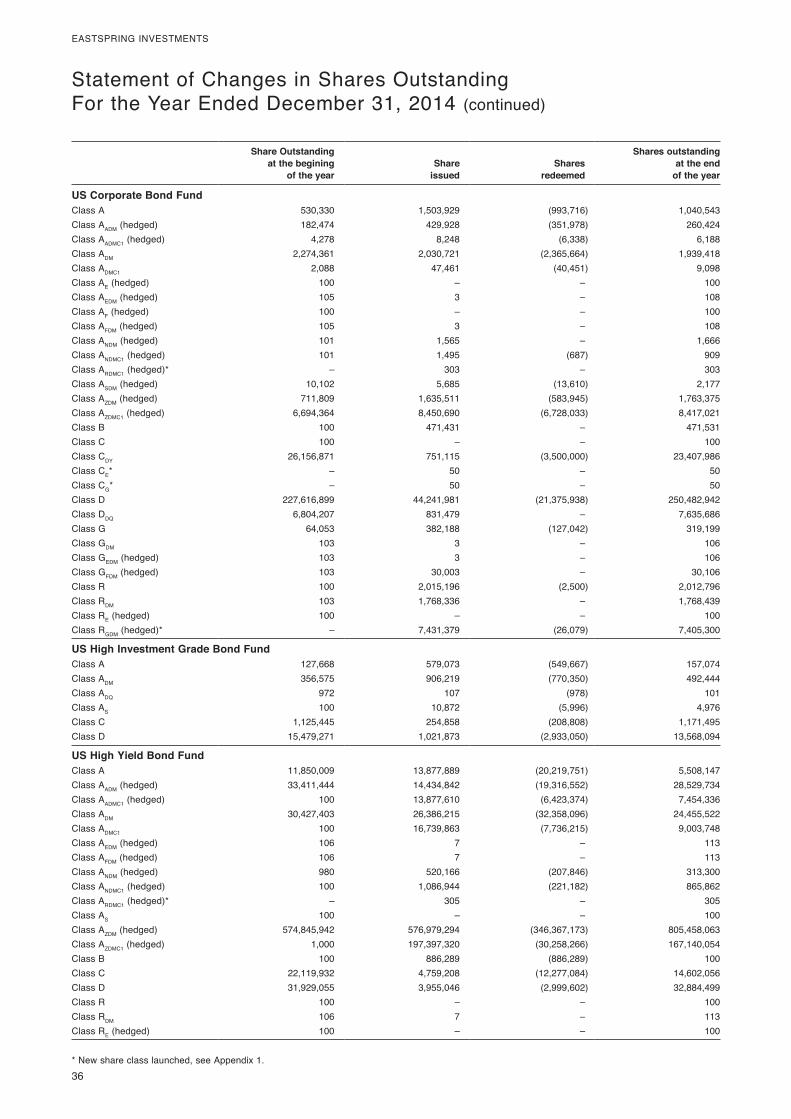
36
EASTSPRING INVESTMENTS
Statement of Changes in Shares OutstandingFor the Year Ended December 31, 2014 (continued)
Share Outstanding at the begining
of the yearShare
issuedShares
redeemed
Shares outstanding at the end
of the year
US Corporate Bond FundClass A 530,330 1,503,929 (993,716) 1,040,543Class AADM (hedged) 182,474 429,928 (351,978) 260,424Class AADMC1 (hedged) 4,278 8,248 (6,338) 6,188Class ADM 2,274,361 2,030,721 (2,365,664) 1,939,418Class ADMC1 2,088 47,461 (40,451) 9,098Class AE (hedged) 100 – – 100Class AEDM (hedged) 105 3 – 108Class AF (hedged) 100 – – 100Class AFDM (hedged) 105 3 – 108Class ANDM (hedged) 101 1,565 – 1,666Class ANDMC1 (hedged) 101 1,495 (687) 909Class ARDMC1 (hedged)* – 303 – 303Class ASDM (hedged) 10,102 5,685 (13,610) 2,177Class AZDM (hedged) 711,809 1,635,511 (583,945) 1,763,375Class AZDMC1 (hedged) 6,694,364 8,450,690 (6,728,033) 8,417,021Class B 100 471,431 – 471,531Class C 100 – – 100Class CDY 26,156,871 751,115 (3,500,000) 23,407,986Class CE* – 50 – 50Class CG* – 50 – 50Class D 227,616,899 44,241,981 (21,375,938) 250,482,942Class DDQ 6,804,207 831,479 – 7,635,686Class G 64,053 382,188 (127,042) 319,199Class GDM 103 3 – 106Class GEDM (hedged) 103 3 – 106Class GFDM (hedged) 103 30,003 – 30,106Class R 100 2,015,196 (2,500) 2,012,796Class RDM 103 1,768,336 – 1,768,439Class RE (hedged) 100 – – 100Class RGDM (hedged)* – 7,431,379 (26,079) 7,405,300
US High Investment Grade Bond FundClass A 127,668 579,073 (549,667) 157,074Class ADM 356,575 906,219 (770,350) 492,444Class ADQ 972 107 (978) 101Class AS 100 10,872 (5,996) 4,976Class C 1,125,445 254,858 (208,808) 1,171,495Class D 15,479,271 1,021,873 (2,933,050) 13,568,094
US High Yield Bond FundClass A 11,850,009 13,877,889 (20,219,751) 5,508,147Class AADM (hedged) 33,411,444 14,434,842 (19,316,552) 28,529,734Class AADMC1 (hedged) 100 13,877,610 (6,423,374) 7,454,336Class ADM 30,427,403 26,386,215 (32,358,096) 24,455,522Class ADMC1 100 16,739,863 (7,736,215) 9,003,748Class AEDM (hedged) 106 7 – 113Class AFDM (hedged) 106 7 – 113Class ANDM (hedged) 980 520,166 (207,846) 313,300Class ANDMC1 (hedged) 100 1,086,944 (221,182) 865,862Class ARDMC1 (hedged)* – 305 – 305Class AS 100 – – 100Class AZDM (hedged) 574,845,942 576,979,294 (346,367,173) 805,458,063Class AZDMC1 (hedged) 1,000 197,397,320 (30,258,266) 167,140,054Class B 100 886,289 (886,289) 100Class C 22,119,932 4,759,208 (12,277,084) 14,602,056Class D 31,929,055 3,955,046 (2,999,602) 32,884,499Class R 100 – – 100Class RDM 106 7 – 113Class RE (hedged) 100 – – 100
* New share class launched, see Appendix 1.
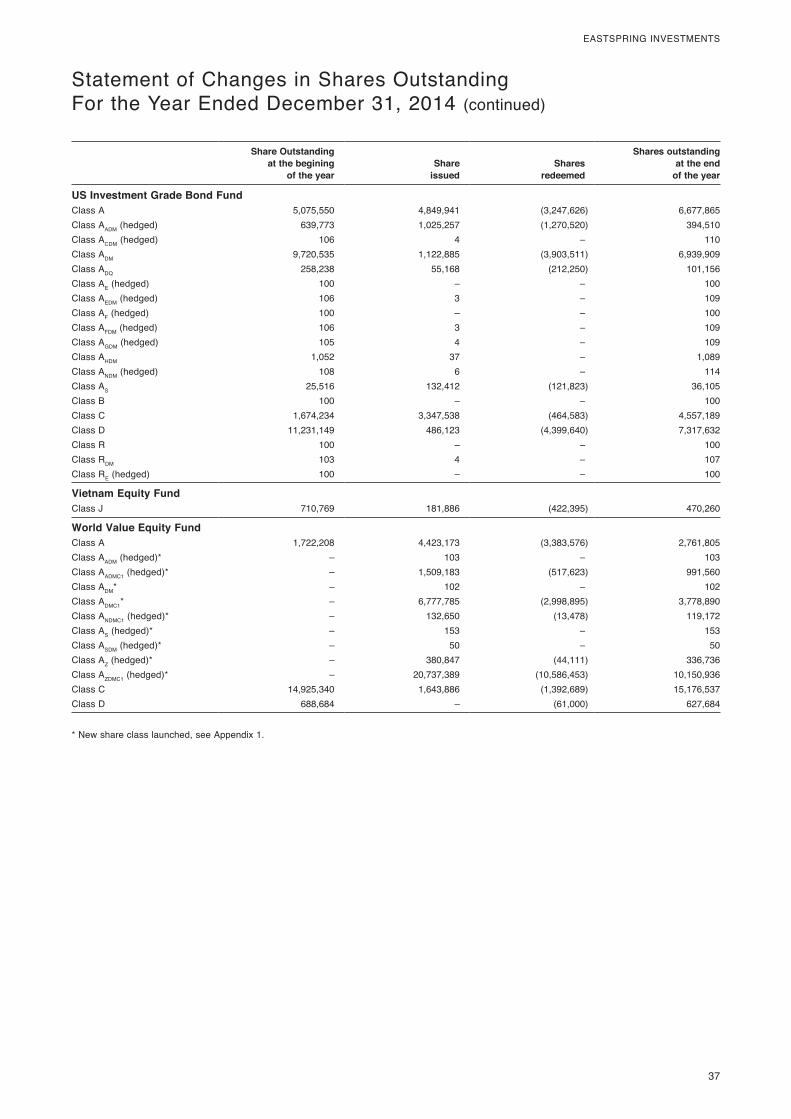
37
EASTSPRING INVESTMENTS
Statement of Changes in Shares OutstandingFor the Year Ended December 31, 2014 (continued)
Share Outstanding at the begining
of the yearShare
issuedShares
redeemed
Shares outstanding at the end
of the year
US Investment Grade Bond FundClass A 5,075,550 4,849,941 (3,247,626) 6,677,865Class AADM (hedged) 639,773 1,025,257 (1,270,520) 394,510Class ACDM (hedged) 106 4 – 110Class ADM 9,720,535 1,122,885 (3,903,511) 6,939,909Class ADQ 258,238 55,168 (212,250) 101,156Class AE (hedged) 100 – – 100Class AEDM (hedged) 106 3 – 109Class AF (hedged) 100 – – 100Class AFDM (hedged) 106 3 – 109Class AGDM (hedged) 105 4 – 109Class AHDM 1,052 37 – 1,089Class ANDM (hedged) 108 6 – 114Class AS 25,516 132,412 (121,823) 36,105Class B 100 – – 100Class C 1,674,234 3,347,538 (464,583) 4,557,189Class D 11,231,149 486,123 (4,399,640) 7,317,632Class R 100 – – 100Class RDM 103 4 – 107Class RE (hedged) 100 – – 100
Vietnam Equity FundClass J 710,769 181,886 (422,395) 470,260
World Value Equity FundClass A 1,722,208 4,423,173 (3,383,576) 2,761,805Class AADM (hedged)* – 103 – 103Class AADMC1 (hedged)* – 1,509,183 (517,623) 991,560Class ADM* – 102 – 102Class ADMC1* – 6,777,785 (2,998,895) 3,778,890Class ANDMC1 (hedged)* – 132,650 (13,478) 119,172Class AS (hedged)* – 153 – 153Class ASDM (hedged)* – 50 – 50Class AZ (hedged)* – 380,847 (44,111) 336,736Class AZDMC1 (hedged)* – 20,737,389 (10,586,453) 10,150,936Class C 14,925,340 1,643,886 (1,392,689) 15,176,537Class D 688,684 – (61,000) 627,684
* New share class launched, see Appendix 1.
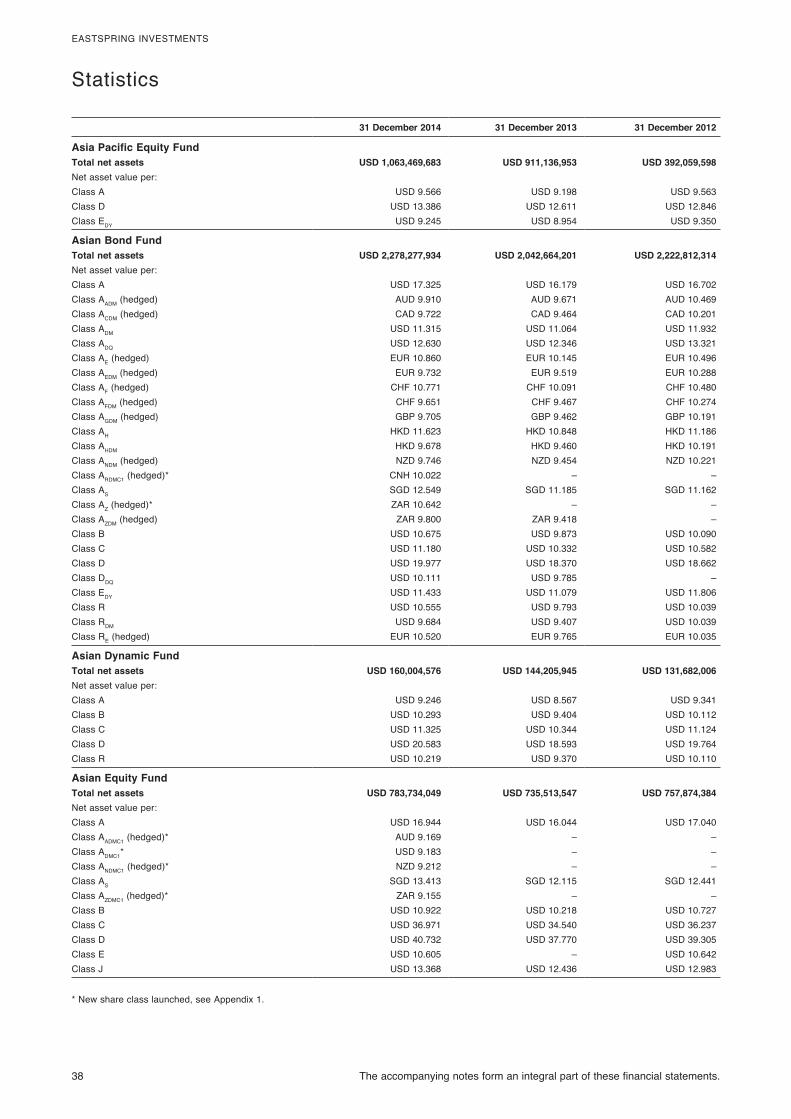
38 The accompanying notes form an integral part of these financial statements.
EASTSPRING INVESTMENTS
Statistics
31 December 2014 31 December 2013 31 December 2012
Asia Pacific Equity FundTotal net assets USD 1,063,469,683 USD 911,136,953 USD 392,059,598Net asset value per:Class A USD 9.566 USD 9.198 USD 9.563Class D USD 13.386 USD 12.611 USD 12.846Class EDY USD 9.245 USD 8.954 USD 9.350
Asian Bond FundTotal net assets USD 2,278,277,934 USD 2,042,664,201 USD 2,222,812,314Net asset value per:Class A USD 17.325 USD 16.179 USD 16.702Class AADM (hedged) AUD 9.910 AUD 9.671 AUD 10.469Class ACDM (hedged) CAD 9.722 CAD 9.464 CAD 10.201Class ADM USD 11.315 USD 11.064 USD 11.932Class ADQ USD 12.630 USD 12.346 USD 13.321Class AE (hedged) EUR 10.860 EUR 10.145 EUR 10.496Class AEDM (hedged) EUR 9.732 EUR 9.519 EUR 10.288Class AF (hedged) CHF 10.771 CHF 10.091 CHF 10.480Class AFDM (hedged) CHF 9.651 CHF 9.467 CHF 10.274Class AGDM (hedged) GBP 9.705 GBP 9.462 GBP 10.191Class AH HKD 11.623 HKD 10.848 HKD 11.186Class AHDM HKD 9.678 HKD 9.460 HKD 10.191Class ANDM (hedged) NZD 9.746 NZD 9.454 NZD 10.221Class ARDMC1 (hedged)* CNH 10.022 – –Class AS SGD 12.549 SGD 11.185 SGD 11.162Class AZ (hedged)* ZAR 10.642 – –Class AZDM (hedged) ZAR 9.800 ZAR 9.418 –Class B USD 10.675 USD 9.873 USD 10.090Class C USD 11.180 USD 10.332 USD 10.582Class D USD 19.977 USD 18.370 USD 18.662Class DDQ USD 10.111 USD 9.785 –Class EDY USD 11.433 USD 11.079 USD 11.806Class R USD 10.555 USD 9.793 USD 10.039Class RDM USD 9.684 USD 9.407 USD 10.039Class RE (hedged) EUR 10.520 EUR 9.765 EUR 10.035
Asian Dynamic FundTotal net assets USD 160,004,576 USD 144,205,945 USD 131,682,006Net asset value per:Class A USD 9.246 USD 8.567 USD 9.341Class B USD 10.293 USD 9.404 USD 10.112Class C USD 11.325 USD 10.344 USD 11.124Class D USD 20.583 USD 18.593 USD 19.764Class R USD 10.219 USD 9.370 USD 10.110
Asian Equity FundTotal net assets USD 783,734,049 USD 735,513,547 USD 757,874,384Net asset value per:Class A USD 16.944 USD 16.044 USD 17.040Class AADMC1 (hedged)* AUD 9.169 – –Class ADMC1* USD 9.183 – –Class ANDMC1 (hedged)* NZD 9.212 – –Class AS SGD 13.413 SGD 12.115 SGD 12.441Class AZDMC1 (hedged)* ZAR 9.155 – –Class B USD 10.922 USD 10.218 USD 10.727Class C USD 36.971 USD 34.540 USD 36.237Class D USD 40.732 USD 37.770 USD 39.305Class E USD 10.605 – USD 10.642Class J USD 13.368 USD 12.436 USD 12.983
* New share class launched, see Appendix 1.
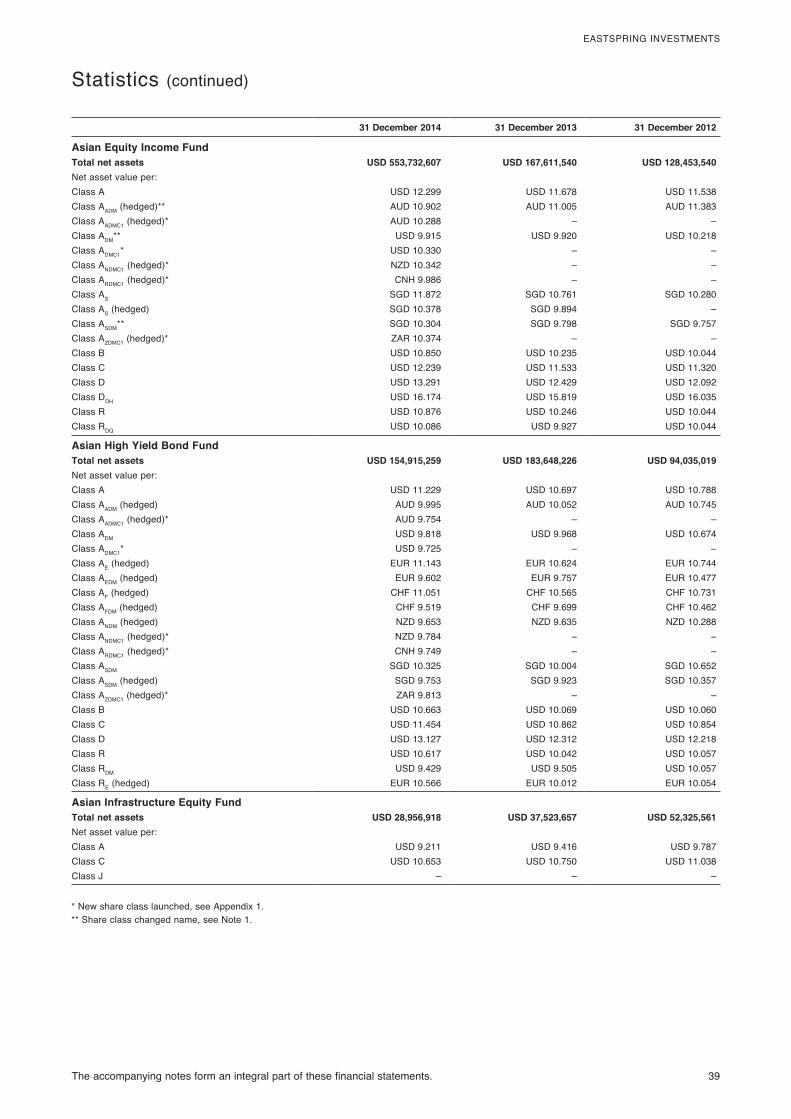
The accompanying notes form an integral part of these financial statements. 39
EASTSPRING INVESTMENTS
Statistics (continued)
31 December 2014 31 December 2013 31 December 2012
Asian Equity Income FundTotal net assets USD 553,732,607 USD 167,611,540 USD 128,453,540Net asset value per:Class A USD 12.299 USD 11.678 USD 11.538Class AADM (hedged)** AUD 10.902 AUD 11.005 AUD 11.383Class AADMC1 (hedged)* AUD 10.288 – –Class ADM** USD 9.915 USD 9.920 USD 10.218Class ADMC1* USD 10.330 – –Class ANDMC1 (hedged)* NZD 10.342 – –Class ARDMC1 (hedged)* CNH 9.986 – –Class AS SGD 11.872 SGD 10.761 SGD 10.280Class AS (hedged) SGD 10.378 SGD 9.894 –Class ASDM** SGD 10.304 SGD 9.798 SGD 9.757Class AZDMC1 (hedged)* ZAR 10.374 – –Class B USD 10.850 USD 10.235 USD 10.044Class C USD 12.239 USD 11.533 USD 11.320Class D USD 13.291 USD 12.429 USD 12.092Class DDH USD 16.174 USD 15.819 USD 16.035Class R USD 10.876 USD 10.246 USD 10.044Class RDQ USD 10.086 USD 9.927 USD 10.044
Asian High Yield Bond FundTotal net assets USD 154,915,259 USD 183,648,226 USD 94,035,019Net asset value per:Class A USD 11.229 USD 10.697 USD 10.788Class AADM (hedged) AUD 9.995 AUD 10.052 AUD 10.745Class AADMC1 (hedged)* AUD 9.754 – –Class ADM USD 9.818 USD 9.968 USD 10.674Class ADMC1* USD 9.725 – –Class AE (hedged) EUR 11.143 EUR 10.624 EUR 10.744Class AEDM (hedged) EUR 9.602 EUR 9.757 EUR 10.477Class AF (hedged) CHF 11.051 CHF 10.565 CHF 10.731Class AFDM (hedged) CHF 9.519 CHF 9.699 CHF 10.462Class ANDM (hedged) NZD 9.653 NZD 9.635 NZD 10.288Class ANDMC1 (hedged)* NZD 9.784 – –Class ARDMC1 (hedged)* CNH 9.749 – –Class ASDM SGD 10.325 SGD 10.004 SGD 10.652Class ASDM (hedged) SGD 9.753 SGD 9.923 SGD 10.357Class AZDMC1 (hedged)* ZAR 9.813 – –Class B USD 10.663 USD 10.069 USD 10.060Class C USD 11.454 USD 10.862 USD 10.854Class D USD 13.127 USD 12.312 USD 12.218Class R USD 10.617 USD 10.042 USD 10.057Class RDM USD 9.429 USD 9.505 USD 10.057Class RE (hedged) EUR 10.566 EUR 10.012 EUR 10.054
Asian Infrastructure Equity FundTotal net assets USD 28,956,918 USD 37,523,657 USD 52,325,561Net asset value per:Class A USD 9.211 USD 9.416 USD 9.787Class C USD 10.653 USD 10.750 USD 11.038Class J – – –
* New share class launched, see Appendix 1.** Share class changed name, see Note 1.
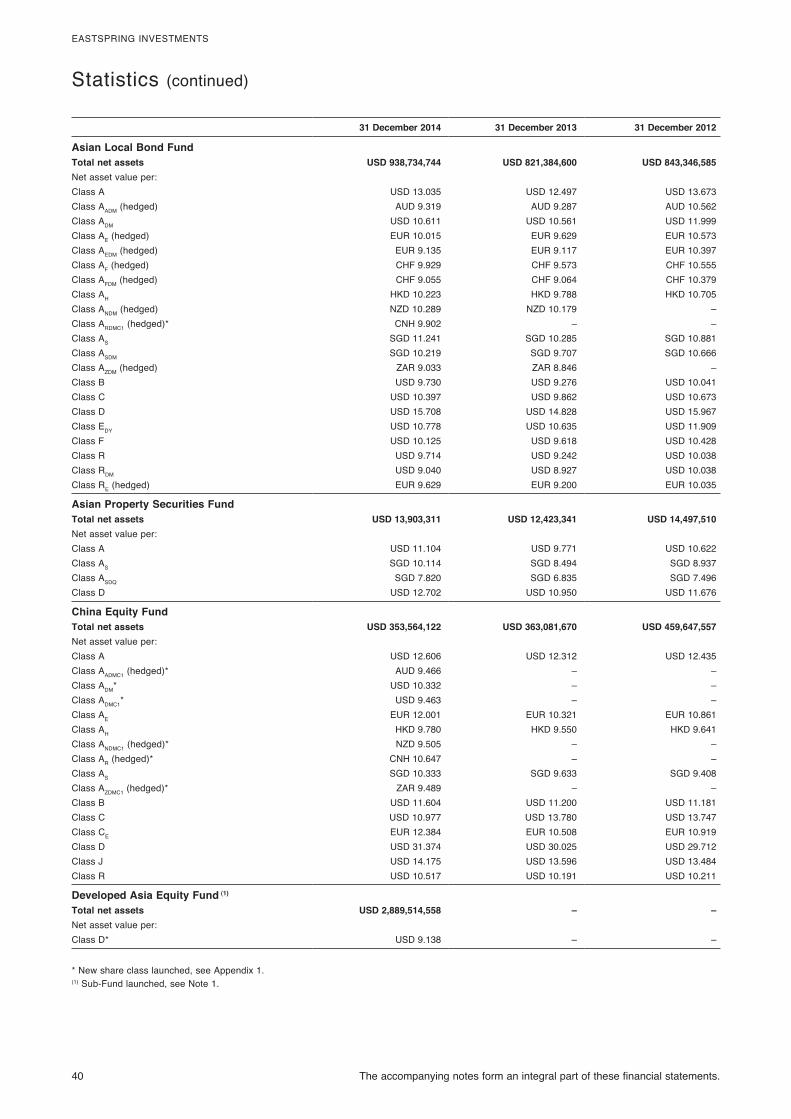
40 The accompanying notes form an integral part of these financial statements.
EASTSPRING INVESTMENTS
Statistics (continued)
31 December 2014 31 December 2013 31 December 2012
Asian Local Bond FundTotal net assets USD 938,734,744 USD 821,384,600 USD 843,346,585Net asset value per:Class A USD 13.035 USD 12.497 USD 13.673Class AADM (hedged) AUD 9.319 AUD 9.287 AUD 10.562Class ADM USD 10.611 USD 10.561 USD 11.999Class AE (hedged) EUR 10.015 EUR 9.629 EUR 10.573Class AEDM (hedged) EUR 9.135 EUR 9.117 EUR 10.397Class AF (hedged) CHF 9.929 CHF 9.573 CHF 10.555Class AFDM (hedged) CHF 9.055 CHF 9.064 CHF 10.379Class AH HKD 10.223 HKD 9.788 HKD 10.705Class ANDM (hedged) NZD 10.289 NZD 10.179 –Class ARDMC1 (hedged)* CNH 9.902 – –Class AS SGD 11.241 SGD 10.285 SGD 10.881Class ASDM SGD 10.219 SGD 9.707 SGD 10.666Class AZDM (hedged) ZAR 9.033 ZAR 8.846 –Class B USD 9.730 USD 9.276 USD 10.041Class C USD 10.397 USD 9.862 USD 10.673Class D USD 15.708 USD 14.828 USD 15.967Class EDY USD 10.778 USD 10.635 USD 11.909Class F USD 10.125 USD 9.618 USD 10.428Class R USD 9.714 USD 9.242 USD 10.038Class RDM USD 9.040 USD 8.927 USD 10.038Class RE (hedged) EUR 9.629 EUR 9.200 EUR 10.035
Asian Property Securities FundTotal net assets USD 13,903,311 USD 12,423,341 USD 14,497,510Net asset value per:Class A USD 11.104 USD 9.771 USD 10.622Class AS SGD 10.114 SGD 8.494 SGD 8.937Class ASDQ SGD 7.820 SGD 6.835 SGD 7.496Class D USD 12.702 USD 10.950 USD 11.676
China Equity FundTotal net assets USD 353,564,122 USD 363,081,670 USD 459,647,557Net asset value per:Class A USD 12.606 USD 12.312 USD 12.435Class AADMC1 (hedged)* AUD 9.466 – –Class ADM* USD 10.332 – –Class ADMC1* USD 9.463 – –Class AE EUR 12.001 EUR 10.321 EUR 10.861Class AH HKD 9.780 HKD 9.550 HKD 9.641Class ANDMC1 (hedged)* NZD 9.505 – –Class AR (hedged)* CNH 10.647 – –Class AS SGD 10.333 SGD 9.633 SGD 9.408Class AZDMC1 (hedged)* ZAR 9.489 – –Class B USD 11.604 USD 11.200 USD 11.181Class C USD 10.977 USD 13.780 USD 13.747Class CE EUR 12.384 EUR 10.508 EUR 10.919Class D USD 31.374 USD 30.025 USD 29.712Class J USD 14.175 USD 13.596 USD 13.484Class R USD 10.517 USD 10.191 USD 10.211
Developed Asia Equity Fund (1)
Total net assets USD 2,889,514,558 – –Net asset value per:Class D* USD 9.138 – –
* New share class launched, see Appendix 1.(1) Sub-Fund launched, see Note 1.
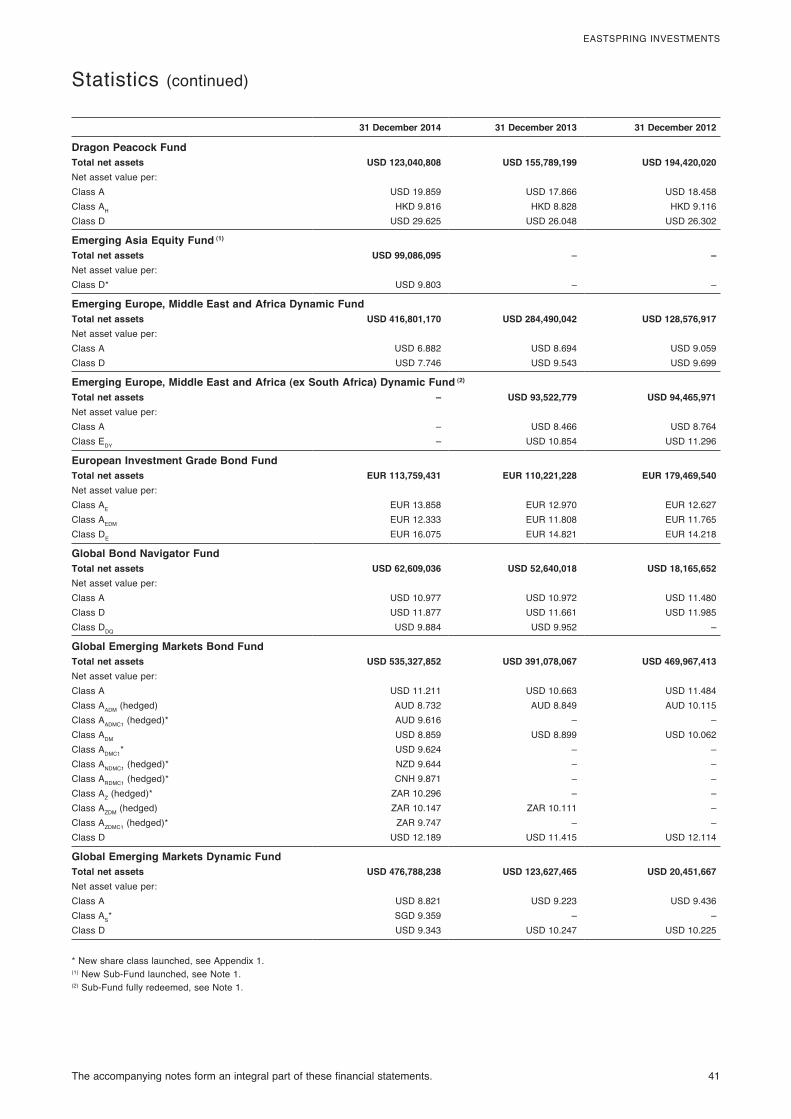
The accompanying notes form an integral part of these financial statements. 41
EASTSPRING INVESTMENTS
Statistics (continued)
31 December 2014 31 December 2013 31 December 2012
Dragon Peacock FundTotal net assets USD 123,040,808 USD 155,789,199 USD 194,420,020Net asset value per:Class A USD 19.859 USD 17.866 USD 18.458Class AH HKD 9.816 HKD 8.828 HKD 9.116Class D USD 29.625 USD 26.048 USD 26.302
Emerging Asia Equity Fund (1)
Total net assets USD 99,086,095 – –Net asset value per:Class D* USD 9.803 – –
Emerging Europe, Middle East and Africa Dynamic FundTotal net assets USD 416,801,170 USD 284,490,042 USD 128,576,917Net asset value per:Class A USD 6.882 USD 8.694 USD 9.059Class D USD 7.746 USD 9.543 USD 9.699
Emerging Europe, Middle East and Africa (ex South Africa) Dynamic Fund (2)
Total net assets – USD 93,522,779 USD 94,465,971Net asset value per:Class A – USD 8.466 USD 8.764Class EDY – USD 10.854 USD 11.296
European Investment Grade Bond FundTotal net assets EUR 113,759,431 EUR 110,221,228 EUR 179,469,540Net asset value per:Class AE EUR 13.858 EUR 12.970 EUR 12.627Class AEDM EUR 12.333 EUR 11.808 EUR 11.765Class DE EUR 16.075 EUR 14.821 EUR 14.218
Global Bond Navigator FundTotal net assets USD 62,609,036 USD 52,640,018 USD 18,165,652Net asset value per:Class A USD 10.977 USD 10.972 USD 11.480Class D USD 11.877 USD 11.661 USD 11.985Class DDQ USD 9.884 USD 9.952 –
Global Emerging Markets Bond FundTotal net assets USD 535,327,852 USD 391,078,067 USD 469,967,413Net asset value per:Class A USD 11.211 USD 10.663 USD 11.484Class AADM (hedged) AUD 8.732 AUD 8.849 AUD 10.115Class AADMC1 (hedged)* AUD 9.616 – –Class ADM USD 8.859 USD 8.899 USD 10.062Class ADMC1* USD 9.624 – –Class ANDMC1 (hedged)* NZD 9.644 – –Class ARDMC1 (hedged)* CNH 9.871 – –Class AZ (hedged)* ZAR 10.296 – –Class AZDM (hedged) ZAR 10.147 ZAR 10.111 –Class AZDMC1 (hedged)* ZAR 9.747 – –Class D USD 12.189 USD 11.415 USD 12.114
Global Emerging Markets Dynamic FundTotal net assets USD 476,788,238 USD 123,627,465 USD 20,451,667Net asset value per:Class A USD 8.821 USD 9.223 USD 9.436Class AS* SGD 9.359 – –Class D USD 9.343 USD 10.247 USD 10.225
* New share class launched, see Appendix 1.(1) New Sub-Fund launched, see Note 1.(2) Sub-Fund fully redeemed, see Note 1.
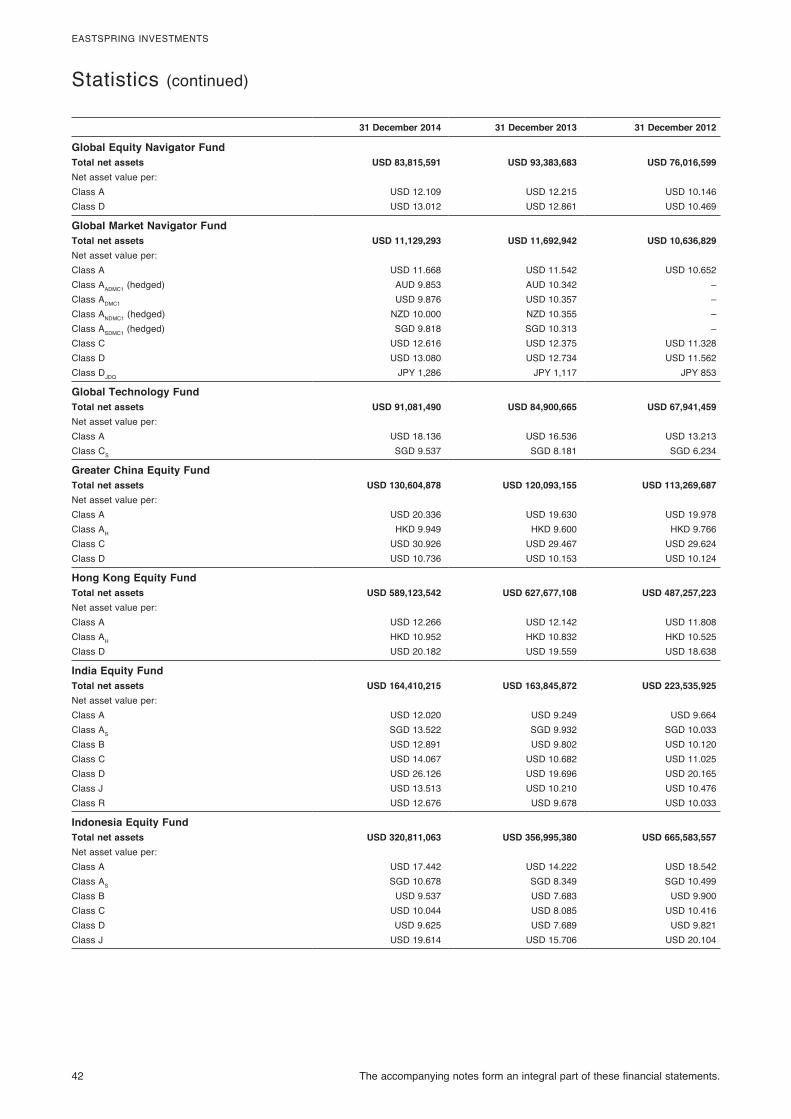
42 The accompanying notes form an integral part of these financial statements.
EASTSPRING INVESTMENTS
Statistics (continued)
31 December 2014 31 December 2013 31 December 2012
Global Equity Navigator FundTotal net assets USD 83,815,591 USD 93,383,683 USD 76,016,599Net asset value per:Class A USD 12.109 USD 12.215 USD 10.146Class D USD 13.012 USD 12.861 USD 10.469
Global Market Navigator FundTotal net assets USD 11,129,293 USD 11,692,942 USD 10,636,829Net asset value per:Class A USD 11.668 USD 11.542 USD 10.652Class AADMC1 (hedged) AUD 9.853 AUD 10.342 –Class ADMC1 USD 9.876 USD 10.357 –Class ANDMC1 (hedged) NZD 10.000 NZD 10.355 –Class ASDMC1 (hedged) SGD 9.818 SGD 10.313 –Class C USD 12.616 USD 12.375 USD 11.328Class D USD 13.080 USD 12.734 USD 11.562Class DJDQ JPY 1,286 JPY 1,117 JPY 853
Global Technology FundTotal net assets USD 91,081,490 USD 84,900,665 USD 67,941,459Net asset value per:Class A USD 18.136 USD 16.536 USD 13.213Class CS SGD 9.537 SGD 8.181 SGD 6.234
Greater China Equity FundTotal net assets USD 130,604,878 USD 120,093,155 USD 113,269,687Net asset value per:Class A USD 20.336 USD 19.630 USD 19.978Class AH HKD 9.949 HKD 9.600 HKD 9.766Class C USD 30.926 USD 29.467 USD 29.624Class D USD 10.736 USD 10.153 USD 10.124
Hong Kong Equity FundTotal net assets USD 589,123,542 USD 627,677,108 USD 487,257,223Net asset value per:Class A USD 12.266 USD 12.142 USD 11.808Class AH HKD 10.952 HKD 10.832 HKD 10.525Class D USD 20.182 USD 19.559 USD 18.638
India Equity FundTotal net assets USD 164,410,215 USD 163,845,872 USD 223,535,925Net asset value per:Class A USD 12.020 USD 9.249 USD 9.664Class AS SGD 13.522 SGD 9.932 SGD 10.033Class B USD 12.891 USD 9.802 USD 10.120Class C USD 14.067 USD 10.682 USD 11.025Class D USD 26.126 USD 19.696 USD 20.165Class J USD 13.513 USD 10.210 USD 10.476Class R USD 12.676 USD 9.678 USD 10.033
Indonesia Equity FundTotal net assets USD 320,811,063 USD 356,995,380 USD 665,583,557Net asset value per:Class A USD 17.442 USD 14.222 USD 18.542Class AS SGD 10.678 SGD 8.349 SGD 10.499Class B USD 9.537 USD 7.683 USD 9.900Class C USD 10.044 USD 8.085 USD 10.416Class D USD 9.625 USD 7.689 USD 9.821Class J USD 19.614 USD 15.706 USD 20.104
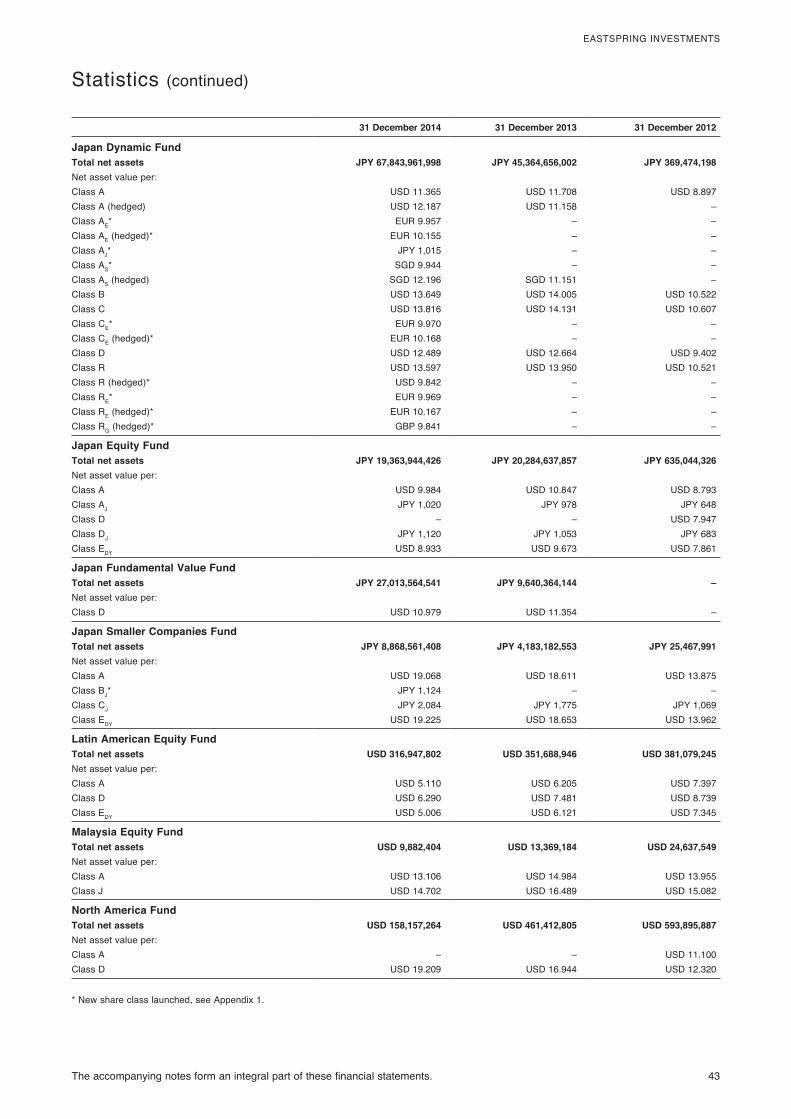
The accompanying notes form an integral part of these financial statements. 43
EASTSPRING INVESTMENTS
Statistics (continued)
31 December 2014 31 December 2013 31 December 2012
Japan Dynamic FundTotal net assets JPY 67,843,961,998 JPY 45,364,656,002 JPY 369,474,198Net asset value per:Class A USD 11.365 USD 11.708 USD 8.897Class A (hedged) USD 12.187 USD 11.158 –Class AE* EUR 9.957 – –Class AE (hedged)* EUR 10.155 – –Class AJ* JPY 1,015 – –Class AS* SGD 9.944 – –Class AS (hedged) SGD 12.196 SGD 11.151 –Class B USD 13.649 USD 14.005 USD 10.522Class C USD 13.816 USD 14.131 USD 10.607Class CE* EUR 9.970 – –Class CE (hedged)* EUR 10.168 – –Class D USD 12.489 USD 12.664 USD 9.402Class R USD 13.597 USD 13.950 USD 10.521Class R (hedged)* USD 9.842 – –Class RE* EUR 9.969 – –Class RE (hedged)* EUR 10.167 – –Class RG (hedged)* GBP 9.841 – –
Japan Equity FundTotal net assets JPY 19,363,944,426 JPY 20,284,637,857 JPY 635,044,326Net asset value per:Class A USD 9.984 USD 10.847 USD 8.793Class AJ JPY 1,020 JPY 978 JPY 648Class D – – USD 7.947Class DJ JPY 1,120 JPY 1,053 JPY 683Class EDY USD 8.933 USD 9.673 USD 7.861
Japan Fundamental Value FundTotal net assets JPY 27,013,564,541 JPY 9,640,364,144 –Net asset value per:Class D USD 10.979 USD 11.354 –
Japan Smaller Companies FundTotal net assets JPY 8,868,561,408 JPY 4,183,182,553 JPY 25,467,991Net asset value per:Class A USD 19.068 USD 18.611 USD 13.875Class BJ* JPY 1,124 – –Class CJ JPY 2,084 JPY 1,775 JPY 1,069Class EDY USD 19.225 USD 18.653 USD 13.962
Latin American Equity FundTotal net assets USD 316,947,802 USD 351,688,946 USD 381,079,245Net asset value per:Class A USD 5.110 USD 6.205 USD 7.397Class D USD 6.290 USD 7.481 USD 8.739Class EDY USD 5.006 USD 6.121 USD 7.345
Malaysia Equity FundTotal net assets USD 9,882,404 USD 13,369,184 USD 24,637,549Net asset value per:Class A USD 13.106 USD 14.984 USD 13.955Class J USD 14.702 USD 16.489 USD 15.082
North America FundTotal net assets USD 158,157,264 USD 461,412,805 USD 593,895,887Net asset value per:Class A – – USD 11.100Class D USD 19.209 USD 16.944 USD 12.320
* New share class launched, see Appendix 1.
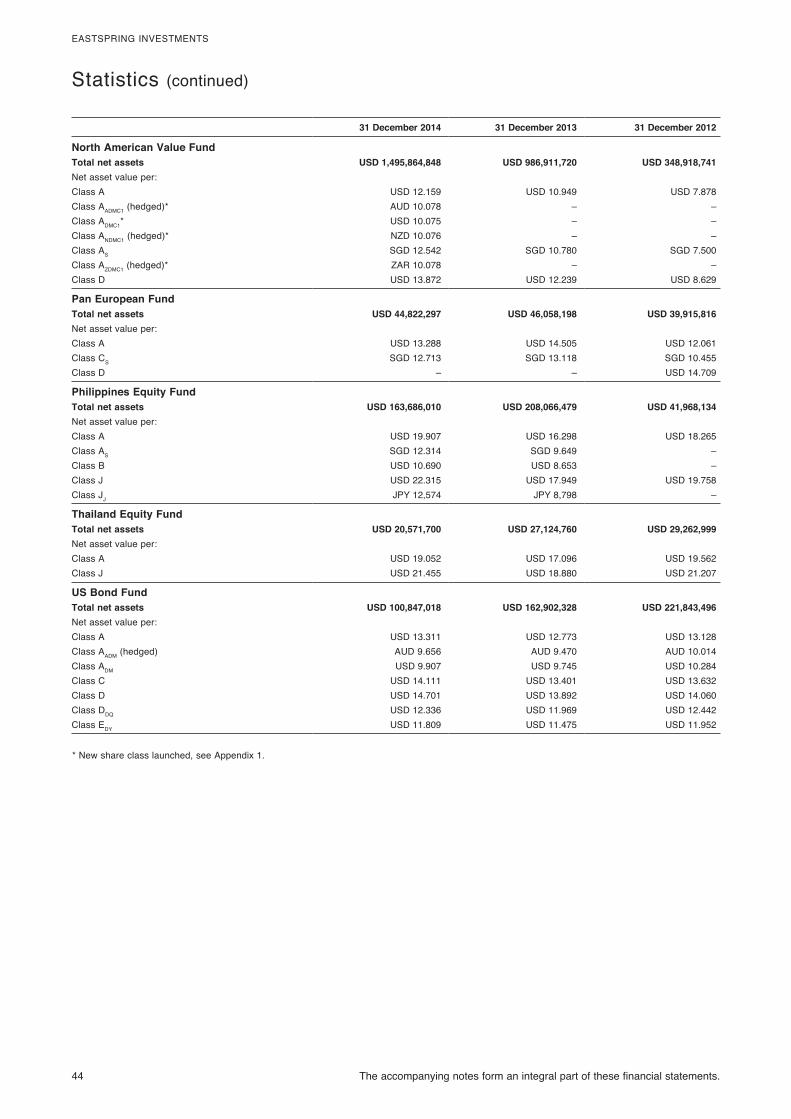
44 The accompanying notes form an integral part of these financial statements.
EASTSPRING INVESTMENTS
Statistics (continued)
31 December 2014 31 December 2013 31 December 2012
North American Value FundTotal net assets USD 1,495,864,848 USD 986,911,720 USD 348,918,741Net asset value per:Class A USD 12.159 USD 10.949 USD 7.878Class AADMC1 (hedged)* AUD 10.078 – –Class ADMC1* USD 10.075 – –Class ANDMC1 (hedged)* NZD 10.076 – –Class AS SGD 12.542 SGD 10.780 SGD 7.500Class AZDMC1 (hedged)* ZAR 10.078 – –Class D USD 13.872 USD 12.239 USD 8.629
Pan European FundTotal net assets USD 44,822,297 USD 46,058,198 USD 39,915,816Net asset value per:Class A USD 13.288 USD 14.505 USD 12.061Class CS SGD 12.713 SGD 13.118 SGD 10.455Class D – – USD 14.709
Philippines Equity FundTotal net assets USD 163,686,010 USD 208,066,479 USD 41,968,134Net asset value per:Class A USD 19.907 USD 16.298 USD 18.265Class AS SGD 12.314 SGD 9.649 –Class B USD 10.690 USD 8.653 –Class J USD 22.315 USD 17.949 USD 19.758Class JJ JPY 12,574 JPY 8,798 –
Thailand Equity FundTotal net assets USD 20,571,700 USD 27,124,760 USD 29,262,999Net asset value per:Class A USD 19.052 USD 17.096 USD 19.562Class J USD 21.455 USD 18.880 USD 21.207
US Bond FundTotal net assets USD 100,847,018 USD 162,902,328 USD 221,843,496Net asset value per:Class A USD 13.311 USD 12.773 USD 13.128Class AADM (hedged) AUD 9.656 AUD 9.470 AUD 10.014Class ADM USD 9.907 USD 9.745 USD 10.284Class C USD 14.111 USD 13.401 USD 13.632Class D USD 14.701 USD 13.892 USD 14.060Class DDQ USD 12.336 USD 11.969 USD 12.442Class EDY USD 11.809 USD 11.475 USD 11.952
* New share class launched, see Appendix 1.
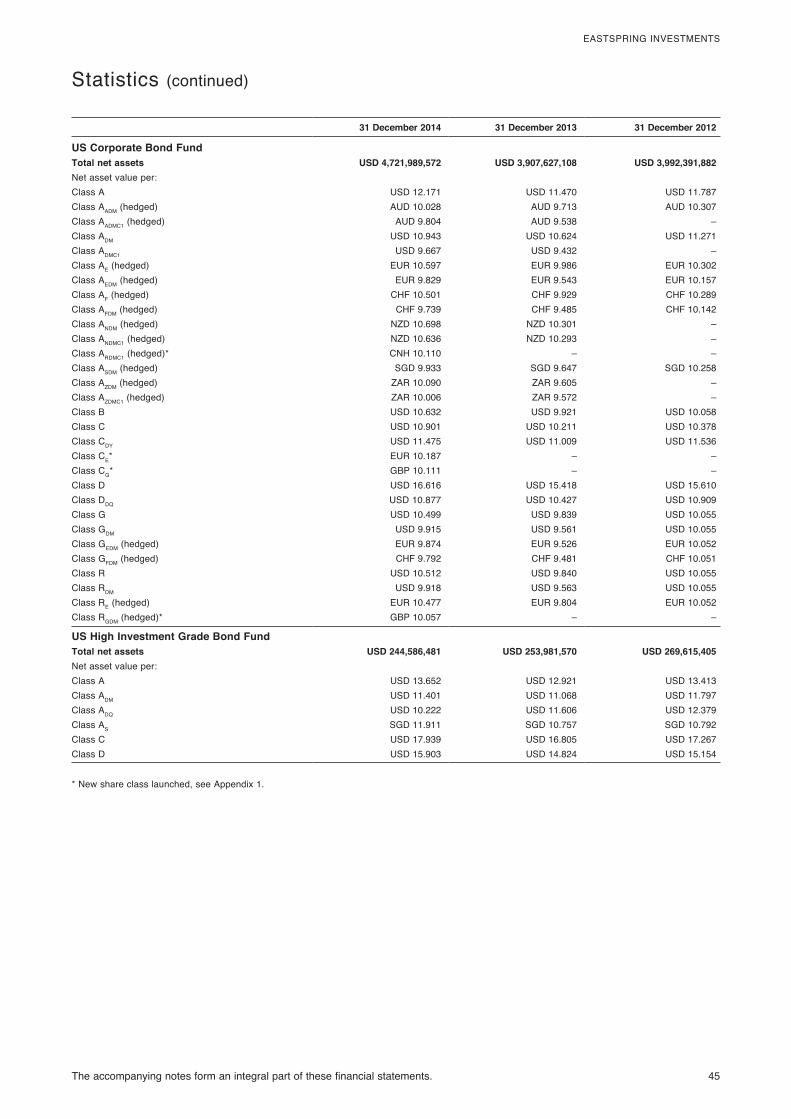
The accompanying notes form an integral part of these financial statements. 45
EASTSPRING INVESTMENTS
Statistics (continued)
31 December 2014 31 December 2013 31 December 2012
US Corporate Bond FundTotal net assets USD 4,721,989,572 USD 3,907,627,108 USD 3,992,391,882Net asset value per:Class A USD 12.171 USD 11.470 USD 11.787Class AADM (hedged) AUD 10.028 AUD 9.713 AUD 10.307Class AADMC1 (hedged) AUD 9.804 AUD 9.538 –Class ADM USD 10.943 USD 10.624 USD 11.271Class ADMC1 USD 9.667 USD 9.432 –Class AE (hedged) EUR 10.597 EUR 9.986 EUR 10.302Class AEDM (hedged) EUR 9.829 EUR 9.543 EUR 10.157Class AF (hedged) CHF 10.501 CHF 9.929 CHF 10.289Class AFDM (hedged) CHF 9.739 CHF 9.485 CHF 10.142Class ANDM (hedged) NZD 10.698 NZD 10.301 –Class ANDMC1 (hedged) NZD 10.636 NZD 10.293 –Class ARDMC1 (hedged)* CNH 10.110 – –Class ASDM (hedged) SGD 9.933 SGD 9.647 SGD 10.258Class AZDM (hedged) ZAR 10.090 ZAR 9.605 –Class AZDMC1 (hedged) ZAR 10.006 ZAR 9.572 –Class B USD 10.632 USD 9.921 USD 10.058Class C USD 10.901 USD 10.211 USD 10.378Class CDY USD 11.475 USD 11.009 USD 11.536Class CE* EUR 10.187 – –Class CG* GBP 10.111 – –Class D USD 16.616 USD 15.418 USD 15.610Class DDQ USD 10.877 USD 10.427 USD 10.909Class G USD 10.499 USD 9.839 USD 10.055Class GDM USD 9.915 USD 9.561 USD 10.055Class GEDM (hedged) EUR 9.874 EUR 9.526 EUR 10.052Class GFDM (hedged) CHF 9.792 CHF 9.481 CHF 10.051Class R USD 10.512 USD 9.840 USD 10.055Class RDM USD 9.918 USD 9.563 USD 10.055Class RE (hedged) EUR 10.477 EUR 9.804 EUR 10.052Class RGDM (hedged)* GBP 10.057 – –
US High Investment Grade Bond FundTotal net assets USD 244,586,481 USD 253,981,570 USD 269,615,405Net asset value per:Class A USD 13.652 USD 12.921 USD 13.413Class ADM USD 11.401 USD 11.068 USD 11.797Class ADQ USD 10.222 USD 11.606 USD 12.379Class AS SGD 11.911 SGD 10.757 SGD 10.792Class C USD 17.939 USD 16.805 USD 17.267Class D USD 15.903 USD 14.824 USD 15.154
* New share class launched, see Appendix 1.
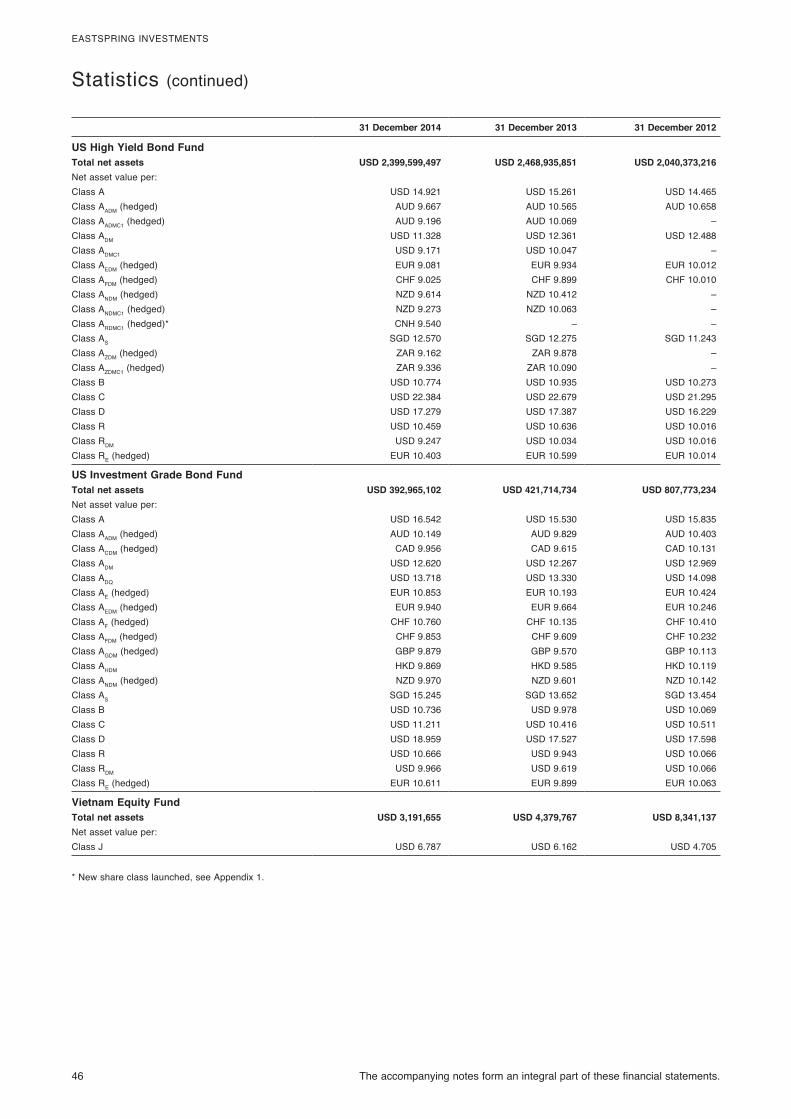
46 The accompanying notes form an integral part of these financial statements.
EASTSPRING INVESTMENTS
Statistics (continued)
31 December 2014 31 December 2013 31 December 2012
US High Yield Bond FundTotal net assets USD 2,399,599,497 USD 2,468,935,851 USD 2,040,373,216Net asset value per:Class A USD 14.921 USD 15.261 USD 14.465Class AADM (hedged) AUD 9.667 AUD 10.565 AUD 10.658Class AADMC1 (hedged) AUD 9.196 AUD 10.069 –Class ADM USD 11.328 USD 12.361 USD 12.488Class ADMC1 USD 9.171 USD 10.047 –Class AEDM (hedged) EUR 9.081 EUR 9.934 EUR 10.012Class AFDM (hedged) CHF 9.025 CHF 9.899 CHF 10.010Class ANDM (hedged) NZD 9.614 NZD 10.412 –Class ANDMC1 (hedged) NZD 9.273 NZD 10.063 –Class ARDMC1 (hedged)* CNH 9.540 – –Class AS SGD 12.570 SGD 12.275 SGD 11.243Class AZDM (hedged) ZAR 9.162 ZAR 9.878 –Class AZDMC1 (hedged) ZAR 9.336 ZAR 10.090 –Class B USD 10.774 USD 10.935 USD 10.273Class C USD 22.384 USD 22.679 USD 21.295Class D USD 17.279 USD 17.387 USD 16.229Class R USD 10.459 USD 10.636 USD 10.016Class RDM USD 9.247 USD 10.034 USD 10.016Class RE (hedged) EUR 10.403 EUR 10.599 EUR 10.014
US Investment Grade Bond FundTotal net assets USD 392,965,102 USD 421,714,734 USD 807,773,234Net asset value per:Class A USD 16.542 USD 15.530 USD 15.835Class AADM (hedged) AUD 10.149 AUD 9.829 AUD 10.403Class ACDM (hedged) CAD 9.956 CAD 9.615 CAD 10.131Class ADM USD 12.620 USD 12.267 USD 12.969Class ADQ USD 13.718 USD 13.330 USD 14.098Class AE (hedged) EUR 10.853 EUR 10.193 EUR 10.424Class AEDM (hedged) EUR 9.940 EUR 9.664 EUR 10.246Class AF (hedged) CHF 10.760 CHF 10.135 CHF 10.410Class AFDM (hedged) CHF 9.853 CHF 9.609 CHF 10.232Class AGDM (hedged) GBP 9.879 GBP 9.570 GBP 10.113Class AHDM HKD 9.869 HKD 9.585 HKD 10.119Class ANDM (hedged) NZD 9.970 NZD 9.601 NZD 10.142Class AS SGD 15.245 SGD 13.652 SGD 13.454Class B USD 10.736 USD 9.978 USD 10.069Class C USD 11.211 USD 10.416 USD 10.511Class D USD 18.959 USD 17.527 USD 17.598Class R USD 10.666 USD 9.943 USD 10.066Class RDM USD 9.966 USD 9.619 USD 10.066Class RE (hedged) EUR 10.611 EUR 9.899 EUR 10.063
Vietnam Equity FundTotal net assets USD 3,191,655 USD 4,379,767 USD 8,341,137Net asset value per:Class J USD 6.787 USD 6.162 USD 4.705
* New share class launched, see Appendix 1.
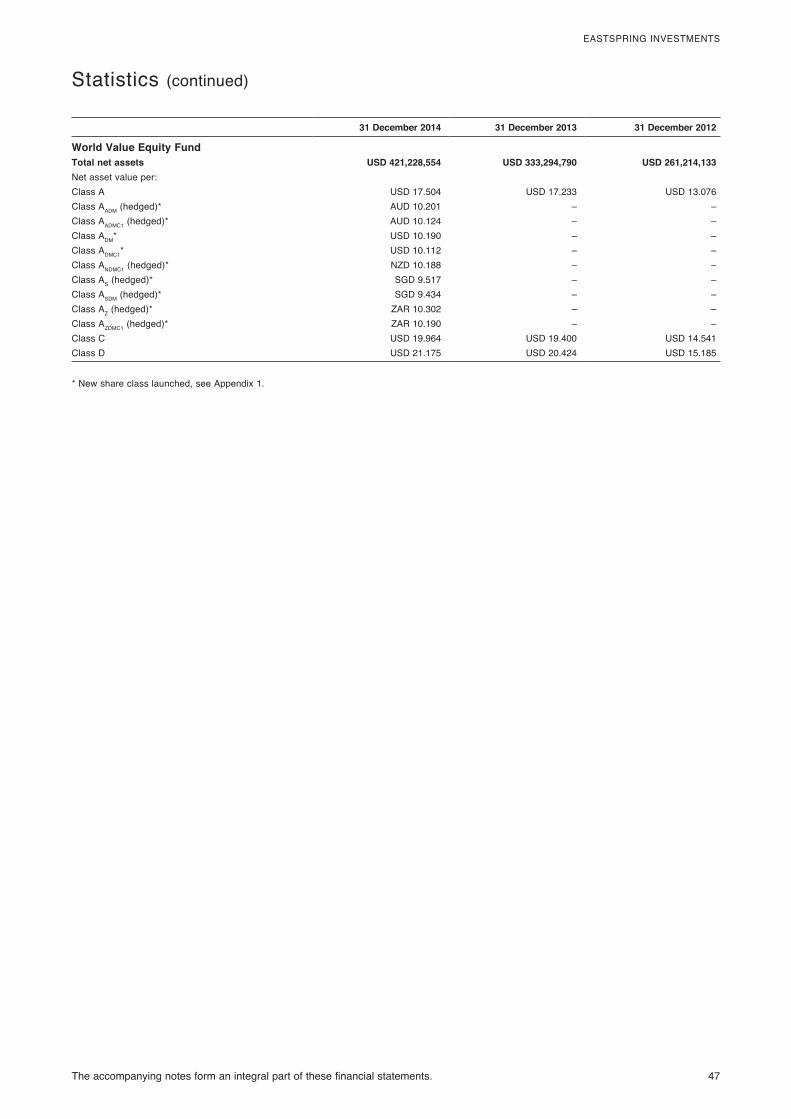
The accompanying notes form an integral part of these financial statements. 47
EASTSPRING INVESTMENTS
Statistics (continued)
31 December 2014 31 December 2013 31 December 2012
World Value Equity FundTotal net assets USD 421,228,554 USD 333,294,790 USD 261,214,133Net asset value per:Class A USD 17.504 USD 17.233 USD 13.076Class AADM (hedged)* AUD 10.201 – –Class AADMC1 (hedged)* AUD 10.124 – –Class ADM* USD 10.190 – –Class ADMC1* USD 10.112 – –Class ANDMC1 (hedged)* NZD 10.188 – –Class AS (hedged)* SGD 9.517 – –Class ASDM (hedged)* SGD 9.434 – –Class AZ (hedged)* ZAR 10.302 – –Class AZDMC1 (hedged)* ZAR 10.190 – –Class C USD 19.964 USD 19.400 USD 14.541Class D USD 21.175 USD 20.424 USD 15.185
* New share class launched, see Appendix 1.
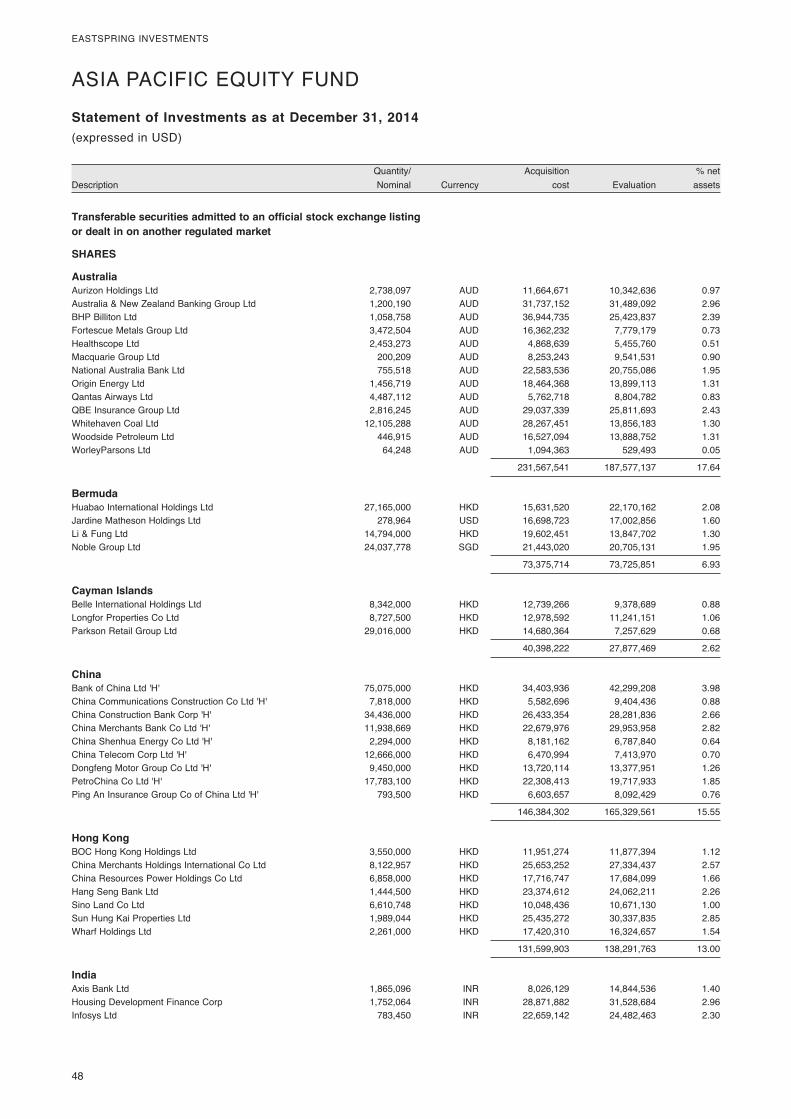
48�
EASTSPRING�INVESTMENTS
� Quantity/�� � Acquisition�� � %�net�Description� Nominal�� Currency�� cost�� Evaluation�� assets�
Statement of Investments as at December 31, 2014(expressed�in�USD)
ASIA�PACIFIC�EQUITY�FUND
Transferable securities admitted to an official stock exchange listing or dealt in on another regulated market
SHARES
Australia Aurizon�Holdings�Ltd� 2,738,097� AUD� 11,664,671� 10,342,636� 0.97Australia�&�New�Zealand�Banking�Group�Ltd� 1,200,190� AUD� 31,737,152� 31,489,092� 2.96BHP�Billiton�Ltd� 1,058,758� AUD� 36,944,735� 25,423,837� 2.39Fortescue�Metals�Group�Ltd� 3,472,504� AUD� 16,362,232� 7,779,179� 0.73Healthscope�Ltd� 2,453,273� AUD� 4,868,639� 5,455,760� 0.51Macquarie�Group�Ltd� 200,209� AUD� 8,253,243� 9,541,531� 0.90National�Australia�Bank�Ltd� 755,518� AUD� 22,583,536� 20,755,086� 1.95Origin�Energy�Ltd� 1,456,719� AUD� 18,464,368� 13,899,113� 1.31Qantas�Airways�Ltd� 4,487,112� AUD� 5,762,718� 8,804,782� 0.83QBE�Insurance�Group�Ltd� 2,816,245� AUD� 29,037,339� 25,811,693� 2.43Whitehaven�Coal�Ltd� 12,105,288� AUD� 28,267,451� 13,856,183� 1.30Woodside�Petroleum�Ltd� 446,915� AUD� 16,527,094� 13,888,752� 1.31WorleyParsons�Ltd�� 64,248� AUD� 1,094,363� 529,493� 0.05
� � � 231,567,541� 187,577,137� 17.64
Bermuda Huabao�International�Holdings�Ltd� 27,165,000� HKD� 15,631,520� 22,170,162� 2.08Jardine�Matheson�Holdings�Ltd� 278,964� USD� 16,698,723� 17,002,856� 1.60Li�&�Fung�Ltd� 14,794,000� HKD� 19,602,451� 13,847,702� 1.30Noble�Group�Ltd�� 24,037,778� SGD� 21,443,020� 20,705,131� 1.95
� � � 73,375,714� 73,725,851� 6.93
Cayman Islands Belle�International�Holdings�Ltd� 8,342,000� HKD� 12,739,266� 9,378,689� 0.88Longfor�Properties�Co�Ltd� 8,727,500� HKD� 12,978,592� 11,241,151� 1.06Parkson�Retail�Group�Ltd�� 29,016,000� HKD� 14,680,364� 7,257,629� 0.68
� � � 40,398,222� 27,877,469� 2.62
China Bank�of�China�Ltd�'H'� 75,075,000� HKD� 34,403,936� 42,299,208� 3.98China�Communications�Construction�Co�Ltd�'H'� 7,818,000� HKD� 5,582,696� 9,404,436� 0.88China�Construction�Bank�Corp�'H'� 34,436,000� HKD� 26,433,354� 28,281,836� 2.66China�Merchants�Bank�Co�Ltd�'H'� 11,938,669� HKD� 22,679,976� 29,953,958� 2.82China�Shenhua�Energy�Co�Ltd�'H'� 2,294,000� HKD� 8,181,162� 6,787,840� 0.64China�Telecom�Corp�Ltd�'H'� 12,666,000� HKD� 6,470,994� 7,413,970� 0.70Dongfeng�Motor�Group�Co�Ltd�'H'� 9,450,000� HKD� 13,720,114� 13,377,951� 1.26PetroChina�Co�Ltd�'H'� 17,783,100� HKD� 22,308,413� 19,717,933� 1.85Ping�An�Insurance�Group�Co�of�China�Ltd�'H'�� 793,500� HKD� 6,603,657� 8,092,429� 0.76
� � � 146,384,302� 165,329,561� 15.55
Hong Kong BOC�Hong�Kong�Holdings�Ltd� 3,550,000� HKD� 11,951,274� 11,877,394� 1.12China�Merchants�Holdings�International�Co�Ltd� 8,122,957� HKD� 25,653,252� 27,334,437� 2.57China�Resources�Power�Holdings�Co�Ltd� 6,858,000� HKD� 17,716,747� 17,684,099� 1.66Hang�Seng�Bank�Ltd� 1,444,500� HKD� 23,374,612� 24,062,211� 2.26Sino�Land�Co�Ltd� 6,610,748� HKD� 10,048,436� 10,671,130� 1.00Sun�Hung�Kai�Properties�Ltd� 1,989,044� HKD� 25,435,272� 30,337,835� 2.85Wharf�Holdings�Ltd�� 2,261,000� HKD� 17,420,310� 16,324,657� 1.54
� � � 131,599,903� 138,291,763� 13.00
India Axis�Bank�Ltd� 1,865,096� INR� 8,026,129� 14,844,536� 1.40Housing�Development�Finance�Corp� 1,752,064� INR� 28,871,882� 31,528,684� 2.96Infosys�Ltd� 783,450� INR� 22,659,142� 24,482,463� 2.30
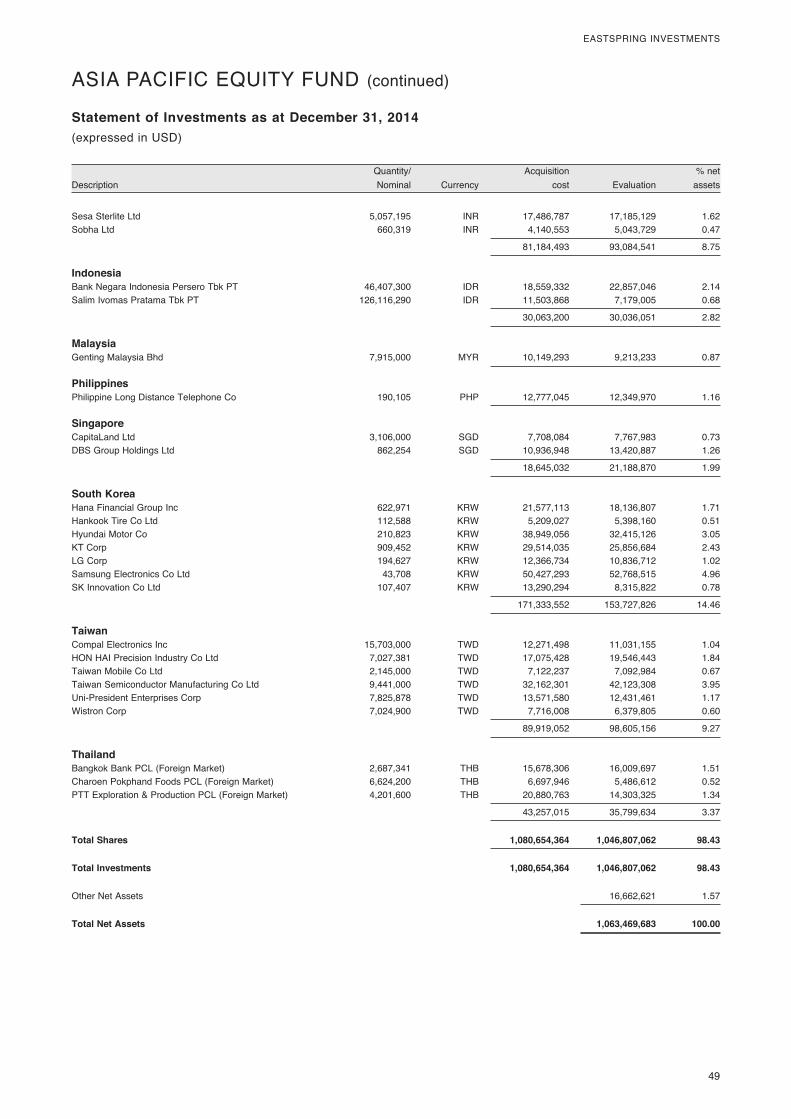
� 49
EASTSPRING�INVESTMENTS
� Quantity/�� � Acquisition�� � %�net�Description� Nominal�� Currency�� cost�� Evaluation�� assets�
Statement of Investments as at December 31, 2014(expressed�in�USD)
ASIA�PACIFIC�EQUITY�FUND�(continued)
Sesa�Sterlite�Ltd� 5,057,195� INR� 17,486,787� 17,185,129� 1.62Sobha�Ltd�� 660,319� INR� 4,140,553� 5,043,729� 0.47
� � � 81,184,493� 93,084,541� 8.75
Indonesia Bank�Negara�Indonesia�Persero�Tbk�PT� 46,407,300� IDR� 18,559,332� 22,857,046� 2.14Salim�Ivomas�Pratama�Tbk�PT�� 126,116,290� IDR� 11,503,868� 7,179,005� 0.68
� � � 30,063,200� 30,036,051� 2.82
Malaysia Genting�Malaysia�Bhd�� 7,915,000� MYR� 10,149,293� 9,213,233� 0.87
Philippines Philippine�Long�Distance�Telephone�Co�� 190,105� PHP� 12,777,045� 12,349,970� 1.16
Singapore CapitaLand�Ltd� 3,106,000� SGD� 7,708,084� 7,767,983� 0.73DBS�Group�Holdings�Ltd�� 862,254� SGD� 10,936,948� 13,420,887� 1.26
� � � 18,645,032� 21,188,870� 1.99
South Korea Hana�Financial�Group�Inc� 622,971� KRW� 21,577,113� 18,136,807� 1.71Hankook�Tire�Co�Ltd� 112,588� KRW� 5,209,027� 5,398,160� 0.51Hyundai�Motor�Co� 210,823� KRW� 38,949,056� 32,415,126� 3.05KT�Corp� 909,452� KRW� 29,514,035� 25,856,684� 2.43LG�Corp� 194,627� KRW� 12,366,734� 10,836,712� 1.02Samsung�Electronics�Co�Ltd� 43,708� KRW� 50,427,293� 52,768,515� 4.96SK�Innovation�Co�Ltd�� 107,407� KRW� 13,290,294� 8,315,822� 0.78
� � � 171,333,552� 153,727,826� 14.46
Taiwan Compal�Electronics�Inc� 15,703,000� TWD� 12,271,498� 11,031,155� 1.04HON�HAI�Precision�Industry�Co�Ltd� 7,027,381� TWD� 17,075,428� 19,546,443� 1.84Taiwan�Mobile�Co�Ltd� 2,145,000� TWD� 7,122,237� 7,092,984� 0.67Taiwan�Semiconductor�Manufacturing�Co�Ltd� 9,441,000� TWD� 32,162,301� 42,123,308� 3.95Uni-President�Enterprises�Corp� 7,825,878� TWD� 13,571,580� 12,431,461� 1.17Wistron�Corp�� 7,024,900� TWD� 7,716,008� 6,379,805� 0.60
� � � 89,919,052� 98,605,156� 9.27
Thailand Bangkok�Bank�PCL�(Foreign�Market)� 2,687,341� THB� 15,678,306� 16,009,697� 1.51Charoen�Pokphand�Foods�PCL�(Foreign�Market)� 6,624,200� THB� 6,697,946� 5,486,612� 0.52PTT�Exploration�&�Production�PCL�(Foreign�Market)� 4,201,600� THB� 20,880,763� 14,303,325� 1.34
� � � 43,257,015� 35,799,634� 3.37
Total Shares 1,080,654,364 1,046,807,062 98.43
Total Investments 1,080,654,364 1,046,807,062 98.43
Other�Net�Assets� � � � 16,662,621� 1.57
Total Net Assets 1,063,469,683 100.00
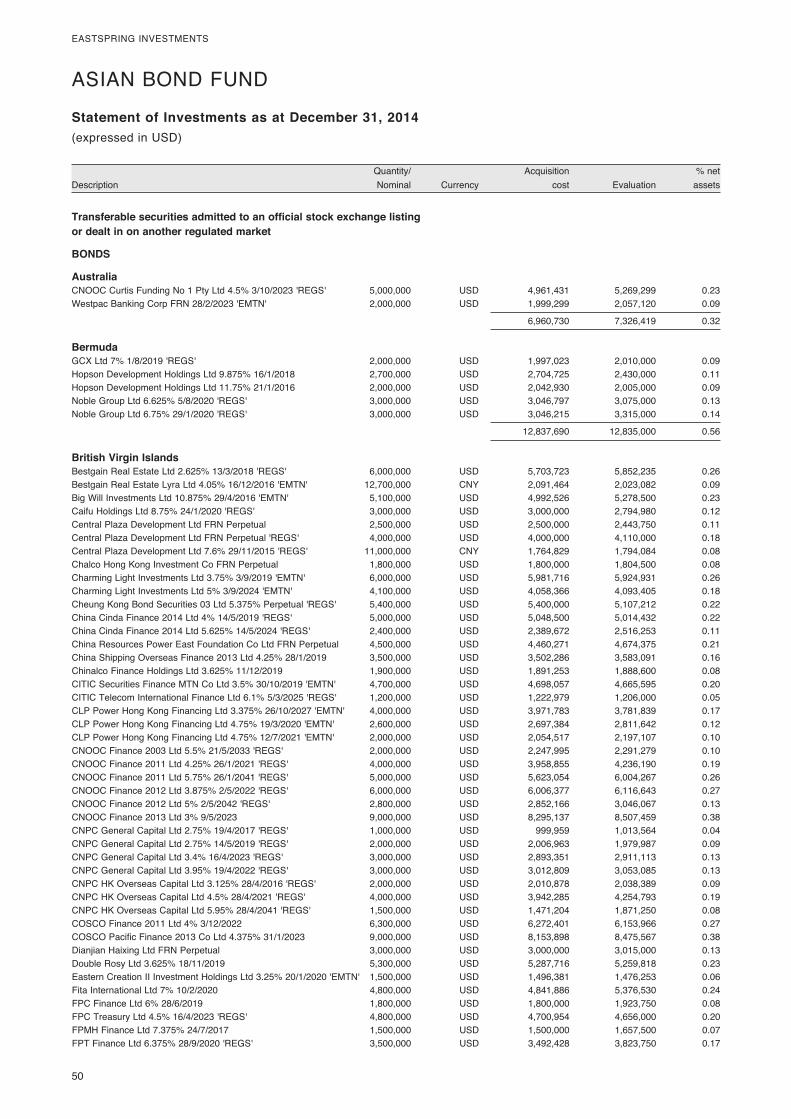
50�
EASTSPRING�INVESTMENTS
� Quantity/�� � Acquisition�� � %�net�Description� Nominal�� Currency�� cost�� Evaluation�� assets�
Statement of Investments as at December 31, 2014(expressed�in�USD)
ASIAN�BOND�FUND
Transferable securities admitted to an official stock exchange listing or dealt in on another regulated market
BONDS
Australia CNOOC�Curtis�Funding�No�1�Pty�Ltd�4.5%�3/10/2023�'REGS'� 5,000,000� USD� 4,961,431� 5,269,299� 0.23Westpac�Banking�Corp�FRN�28/2/2023�'EMTN'� 2,000,000� USD� 1,999,299� 2,057,120� 0.09
� � � 6,960,730� 7,326,419� 0.32
Bermuda GCX�Ltd�7%�1/8/2019�'REGS'� 2,000,000� USD� 1,997,023� 2,010,000� 0.09Hopson�Development�Holdings�Ltd�9.875%�16/1/2018�� 2,700,000� USD� 2,704,725� 2,430,000� 0.11Hopson�Development�Holdings�Ltd�11.75%�21/1/2016�� 2,000,000� USD� 2,042,930� 2,005,000� 0.09Noble�Group�Ltd�6.625%�5/8/2020�'REGS'� 3,000,000� USD� 3,046,797� 3,075,000� 0.13Noble�Group�Ltd�6.75%�29/1/2020�'REGS'� 3,000,000� USD� 3,046,215� 3,315,000� 0.14
� � � 12,837,690� 12,835,000� 0.56
British Virgin Islands Bestgain�Real�Estate�Ltd�2.625%�13/3/2018�'REGS'� 6,000,000� USD� 5,703,723� 5,852,235� 0.26Bestgain�Real�Estate�Lyra�Ltd�4.05%�16/12/2016�'EMTN'� 12,700,000� CNY� 2,091,464� 2,023,082� 0.09Big�Will�Investments�Ltd�10.875%�29/4/2016�'EMTN'� 5,100,000� USD� 4,992,526� 5,278,500� 0.23Caifu�Holdings�Ltd�8.75%�24/1/2020�'REGS'� 3,000,000� USD� 3,000,000� 2,794,980� 0.12Central�Plaza�Development�Ltd�FRN�Perpetual�� 2,500,000� USD� 2,500,000� 2,443,750� 0.11Central�Plaza�Development�Ltd�FRN�Perpetual�'REGS'� 4,000,000� USD� 4,000,000� 4,110,000� 0.18Central�Plaza�Development�Ltd�7.6%�29/11/2015�'REGS'� 11,000,000� CNY� 1,764,829� 1,794,084� 0.08Chalco�Hong�Kong�Investment�Co�FRN�Perpetual�� 1,800,000� USD� 1,800,000� 1,804,500� 0.08Charming�Light�Investments�Ltd�3.75%�3/9/2019�'EMTN'� 6,000,000� USD� 5,981,716� 5,924,931� 0.26Charming�Light�Investments�Ltd�5%�3/9/2024�'EMTN'� 4,100,000� USD� 4,058,366� 4,093,405� 0.18Cheung�Kong�Bond�Securities�03�Ltd�5.375%�Perpetual�'REGS'� 5,400,000� USD� 5,400,000� 5,107,212� 0.22China�Cinda�Finance�2014�Ltd�4%�14/5/2019�'REGS'� 5,000,000� USD� 5,048,500� 5,014,432� 0.22China�Cinda�Finance�2014�Ltd�5.625%�14/5/2024�'REGS'� 2,400,000� USD� 2,389,672� 2,516,253� 0.11China�Resources�Power�East�Foundation�Co�Ltd�FRN�Perpetual�� 4,500,000� USD� 4,460,271� 4,674,375� 0.21China�Shipping�Overseas�Finance�2013�Ltd�4.25%�28/1/2019�� 3,500,000� USD� 3,502,286� 3,583,091� 0.16Chinalco�Finance�Holdings�Ltd�3.625%�11/12/2019�� 1,900,000� USD� 1,891,253� 1,888,600� 0.08CITIC�Securities�Finance�MTN�Co�Ltd�3.5%�30/10/2019�'EMTN'� 4,700,000� USD� 4,698,057� 4,665,595� 0.20CITIC�Telecom�International�Finance�Ltd�6.1%�5/3/2025�'REGS'� 1,200,000� USD� 1,222,979� 1,206,000� 0.05CLP�Power�Hong�Kong�Financing�Ltd�3.375%�26/10/2027�'EMTN'� 4,000,000� USD� 3,971,783� 3,781,839� 0.17CLP�Power�Hong�Kong�Financing�Ltd�4.75%�19/3/2020�'EMTN'� 2,600,000� USD� 2,697,384� 2,811,642� 0.12CLP�Power�Hong�Kong�Financing�Ltd�4.75%�12/7/2021�'EMTN'� 2,000,000� USD� 2,054,517� 2,197,107� 0.10CNOOC�Finance�2003�Ltd�5.5%�21/5/2033�'REGS'� 2,000,000� USD� 2,247,995� 2,291,279� 0.10CNOOC�Finance�2011�Ltd�4.25%�26/1/2021�'REGS'� 4,000,000� USD� 3,958,855� 4,236,190� 0.19CNOOC�Finance�2011�Ltd�5.75%�26/1/2041�'REGS'� 5,000,000� USD� 5,623,054� 6,004,267� 0.26CNOOC�Finance�2012�Ltd�3.875%�2/5/2022�'REGS'� 6,000,000� USD� 6,006,377� 6,116,643� 0.27CNOOC�Finance�2012�Ltd�5%�2/5/2042�'REGS'� 2,800,000� USD� 2,852,166� 3,046,067� 0.13CNOOC�Finance�2013�Ltd�3%�9/5/2023�� 9,000,000� USD� 8,295,137� 8,507,459� 0.38CNPC�General�Capital�Ltd�2.75%�19/4/2017�'REGS'� 1,000,000� USD� 999,959� 1,013,564� 0.04CNPC�General�Capital�Ltd�2.75%�14/5/2019�'REGS'� 2,000,000� USD� 2,006,963� 1,979,987� 0.09CNPC�General�Capital�Ltd�3.4%�16/4/2023�'REGS'� 3,000,000� USD� 2,893,351� 2,911,113� 0.13CNPC�General�Capital�Ltd�3.95%�19/4/2022�'REGS'� 3,000,000� USD� 3,012,809� 3,053,085� 0.13CNPC�HK�Overseas�Capital�Ltd�3.125%�28/4/2016�'REGS'� 2,000,000� USD� 2,010,878� 2,038,389� 0.09CNPC�HK�Overseas�Capital�Ltd�4.5%�28/4/2021�'REGS'� 4,000,000� USD� 3,942,285� 4,254,793� 0.19CNPC�HK�Overseas�Capital�Ltd�5.95%�28/4/2041�'REGS'� 1,500,000� USD� 1,471,204� 1,871,250� 0.08COSCO�Finance�2011�Ltd�4%�3/12/2022�� 6,300,000� USD� 6,272,401� 6,153,966� 0.27COSCO�Pacific�Finance�2013�Co�Ltd�4.375%�31/1/2023�� 9,000,000� USD� 8,153,898� 8,475,567� 0.38Dianjian�Haixing�Ltd�FRN�Perpetual�� 3,000,000� USD� 3,000,000� 3,015,000� 0.13Double�Rosy�Ltd�3.625%�18/11/2019�� 5,300,000� USD� 5,287,716� 5,259,818� 0.23Eastern�Creation�II�Investment�Holdings�Ltd�3.25%�20/1/2020�'EMTN'� 1,500,000� USD� 1,496,381� 1,476,253� 0.06Fita�International�Ltd�7%�10/2/2020�� 4,800,000� USD� 4,841,886� 5,376,530� 0.24FPC�Finance�Ltd�6%�28/6/2019�� 1,800,000� USD� 1,800,000� 1,923,750� 0.08FPC�Treasury�Ltd�4.5%�16/4/2023�'REGS'� 4,800,000� USD� 4,700,954� 4,656,000� 0.20FPMH�Finance�Ltd�7.375%�24/7/2017�� 1,500,000� USD� 1,500,000� 1,657,500� 0.07FPT�Finance�Ltd�6.375%�28/9/2020�'REGS'� 3,500,000� USD� 3,492,428� 3,823,750� 0.17
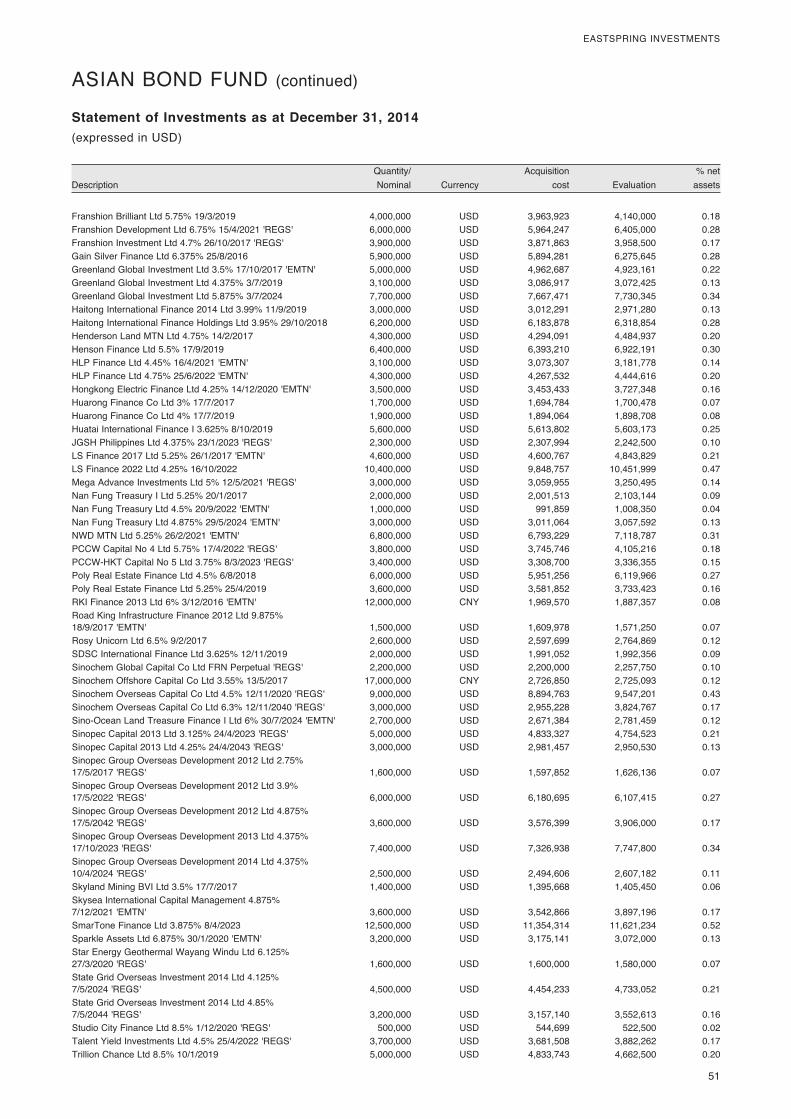
� 51
EASTSPRING�INVESTMENTS
� Quantity/�� � Acquisition�� � %�net�Description� Nominal�� Currency�� cost�� Evaluation�� assets�
Statement of Investments as at December 31, 2014(expressed�in�USD)
ASIAN�BOND�FUND�(continued)
Franshion�Brilliant�Ltd�5.75%�19/3/2019�� 4,000,000� USD� 3,963,923� 4,140,000� 0.18Franshion�Development�Ltd�6.75%�15/4/2021�'REGS'� 6,000,000� USD� 5,964,247� 6,405,000� 0.28Franshion�Investment�Ltd�4.7%�26/10/2017�'REGS'� 3,900,000� USD� 3,871,863� 3,958,500� 0.17Gain�Silver�Finance�Ltd�6.375%�25/8/2016�� 5,900,000� USD� 5,894,281� 6,275,645� 0.28Greenland�Global�Investment�Ltd�3.5%�17/10/2017�'EMTN'� 5,000,000� USD� 4,962,687� 4,923,161� 0.22Greenland�Global�Investment�Ltd�4.375%�3/7/2019�� 3,100,000� USD� 3,086,917� 3,072,425� 0.13Greenland�Global�Investment�Ltd�5.875%�3/7/2024�� 7,700,000� USD� 7,667,471� 7,730,345� 0.34Haitong�International�Finance�2014�Ltd�3.99%�11/9/2019�� 3,000,000� USD� 3,012,291� 2,971,280� 0.13Haitong�International�Finance�Holdings�Ltd�3.95%�29/10/2018�� 6,200,000� USD� 6,183,878� 6,318,854� 0.28Henderson�Land�MTN�Ltd�4.75%�14/2/2017�� 4,300,000� USD� 4,294,091� 4,484,937� 0.20Henson�Finance�Ltd�5.5%�17/9/2019�� 6,400,000� USD� 6,393,210� 6,922,191� 0.30HLP�Finance�Ltd�4.45%�16/4/2021�'EMTN'� 3,100,000� USD� 3,073,307� 3,181,778� 0.14HLP�Finance�Ltd�4.75%�25/6/2022�'EMTN'� 4,300,000� USD� 4,267,532� 4,444,616� 0.20Hongkong�Electric�Finance�Ltd�4.25%�14/12/2020�'EMTN'� 3,500,000� USD� 3,453,433� 3,727,348� 0.16Huarong�Finance�Co�Ltd�3%�17/7/2017�� 1,700,000� USD� 1,694,784� 1,700,478� 0.07Huarong�Finance�Co�Ltd�4%�17/7/2019�� 1,900,000� USD� 1,894,064� 1,898,708� 0.08Huatai�International�Finance�I�3.625%�8/10/2019�� 5,600,000� USD� 5,613,802� 5,603,173� 0.25JGSH�Philippines�Ltd�4.375%�23/1/2023�'REGS'� 2,300,000� USD� 2,307,994� 2,242,500� 0.10LS�Finance�2017�Ltd�5.25%�26/1/2017�'EMTN'� 4,600,000� USD� 4,600,767� 4,843,829� 0.21LS�Finance�2022�Ltd�4.25%�16/10/2022�� 10,400,000� USD� 9,848,757� 10,451,999� 0.47Mega�Advance�Investments�Ltd�5%�12/5/2021�'REGS'� 3,000,000� USD� 3,059,955� 3,250,495� 0.14Nan�Fung�Treasury�I�Ltd�5.25%�20/1/2017�� 2,000,000� USD� 2,001,513� 2,103,144� 0.09Nan�Fung�Treasury�Ltd�4.5%�20/9/2022�'EMTN'� 1,000,000� USD� 991,859� 1,008,350� 0.04Nan�Fung�Treasury�Ltd�4.875%�29/5/2024�'EMTN'� 3,000,000� USD� 3,011,064� 3,057,592� 0.13NWD�MTN�Ltd�5.25%�26/2/2021�'EMTN'� 6,800,000� USD� 6,793,229� 7,118,787� 0.31PCCW�Capital�No�4�Ltd�5.75%�17/4/2022�'REGS'� 3,800,000� USD� 3,745,746� 4,105,216� 0.18PCCW-HKT�Capital�No�5�Ltd�3.75%�8/3/2023�'REGS'� 3,400,000� USD� 3,308,700� 3,336,355� 0.15Poly�Real�Estate�Finance�Ltd�4.5%�6/8/2018�� 6,000,000� USD� 5,951,256� 6,119,966� 0.27Poly�Real�Estate�Finance�Ltd�5.25%�25/4/2019�� 3,600,000� USD� 3,581,852� 3,733,423� 0.16RKI�Finance�2013�Ltd�6%�3/12/2016�'EMTN'� 12,000,000� CNY� 1,969,570� 1,887,357� 0.08Road�King�Infrastructure�Finance�2012�Ltd�9.875%��18/9/2017�'EMTN'� 1,500,000� USD� 1,609,978� 1,571,250� 0.07Rosy�Unicorn�Ltd�6.5%�9/2/2017�� 2,600,000� USD� 2,597,699� 2,764,869� 0.12SDSC�International�Finance�Ltd�3.625%�12/11/2019�� 2,000,000� USD� 1,991,052� 1,992,356� 0.09Sinochem�Global�Capital�Co�Ltd�FRN�Perpetual�'REGS'� 2,200,000� USD� 2,200,000� 2,257,750� 0.10Sinochem�Offshore�Capital�Co�Ltd�3.55%�13/5/2017�� 17,000,000� CNY� 2,726,850� 2,725,093� 0.12Sinochem�Overseas�Capital�Co�Ltd�4.5%�12/11/2020�'REGS'� 9,000,000� USD� 8,894,763� 9,547,201� 0.43Sinochem�Overseas�Capital�Co�Ltd�6.3%�12/11/2040�'REGS'� 3,000,000� USD� 2,955,228� 3,824,767� 0.17Sino-Ocean�Land�Treasure�Finance�I�Ltd�6%�30/7/2024�'EMTN'� 2,700,000� USD� 2,671,384� 2,781,459� 0.12Sinopec�Capital�2013�Ltd�3.125%�24/4/2023�'REGS'� 5,000,000� USD� 4,833,327� 4,754,523� 0.21Sinopec�Capital�2013�Ltd�4.25%�24/4/2043�'REGS'� 3,000,000� USD� 2,981,457� 2,950,530� 0.13Sinopec�Group�Overseas�Development�2012�Ltd�2.75%��17/5/2017�'REGS'� 1,600,000� USD� 1,597,852� 1,626,136� 0.07Sinopec�Group�Overseas�Development�2012�Ltd�3.9%��17/5/2022�'REGS'� 6,000,000� USD� 6,180,695� 6,107,415� 0.27Sinopec�Group�Overseas�Development�2012�Ltd�4.875%��17/5/2042�'REGS'� 3,600,000� USD� 3,576,399� 3,906,000� 0.17Sinopec�Group�Overseas�Development�2013�Ltd�4.375%��17/10/2023�'REGS'� 7,400,000� USD� 7,326,938� 7,747,800� 0.34Sinopec�Group�Overseas�Development�2014�Ltd�4.375%��10/4/2024�'REGS'� 2,500,000� USD� 2,494,606� 2,607,182� 0.11Skyland�Mining�BVI�Ltd�3.5%�17/7/2017�� 1,400,000� USD� 1,395,668� 1,405,450� 0.06Skysea�International�Capital�Management�4.875%��7/12/2021�'EMTN'� 3,600,000� USD� 3,542,866� 3,897,196� 0.17SmarTone�Finance�Ltd�3.875%�8/4/2023�� 12,500,000� USD� 11,354,314� 11,621,234� 0.52Sparkle�Assets�Ltd�6.875%�30/1/2020�'EMTN'� 3,200,000� USD� 3,175,141� 3,072,000� 0.13Star�Energy�Geothermal�Wayang�Windu�Ltd�6.125%��27/3/2020�'REGS'� 1,600,000� USD� 1,600,000� 1,580,000� 0.07State�Grid�Overseas�Investment�2014�Ltd�4.125%��7/5/2024�'REGS'� 4,500,000� USD� 4,454,233� 4,733,052� 0.21State�Grid�Overseas�Investment�2014�Ltd�4.85%��7/5/2044�'REGS'� 3,200,000� USD� 3,157,140� 3,552,613� 0.16Studio�City�Finance�Ltd�8.5%�1/12/2020�'REGS'� 500,000� USD� 544,699� 522,500� 0.02Talent�Yield�Investments�Ltd�4.5%�25/4/2022�'REGS'� 3,700,000� USD� 3,681,508� 3,882,262� 0.17Trillion�Chance�Ltd�8.5%�10/1/2019�� 5,000,000� USD� 4,833,743� 4,662,500� 0.20
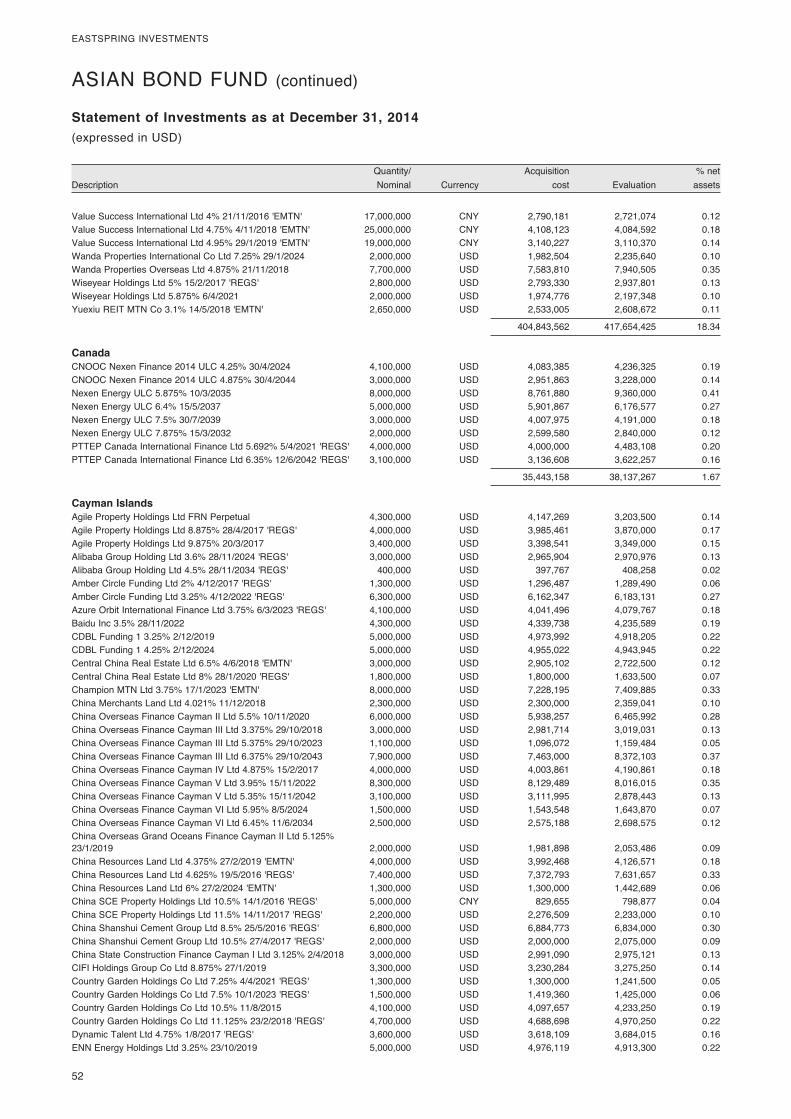
52�
EASTSPRING�INVESTMENTS
� Quantity/�� � Acquisition�� � %�net�Description� Nominal�� Currency�� cost�� Evaluation�� assets�
Statement of Investments as at December 31, 2014(expressed�in�USD)
ASIAN�BOND�FUND�(continued)
Value�Success�International�Ltd�4%�21/11/2016�'EMTN'� 17,000,000� CNY� 2,790,181� 2,721,074� 0.12Value�Success�International�Ltd�4.75%�4/11/2018�'EMTN'� 25,000,000� CNY� 4,108,123� 4,084,592� 0.18Value�Success�International�Ltd�4.95%�29/1/2019�'EMTN'� 19,000,000� CNY� 3,140,227� 3,110,370� 0.14Wanda�Properties�International�Co�Ltd�7.25%�29/1/2024�� 2,000,000� USD� 1,982,504� 2,235,640� 0.10Wanda�Properties�Overseas�Ltd�4.875%�21/11/2018�� 7,700,000� USD� 7,583,810� 7,940,505� 0.35Wiseyear�Holdings�Ltd�5%�15/2/2017�'REGS'� 2,800,000� USD� 2,793,330� 2,937,801� 0.13Wiseyear�Holdings�Ltd�5.875%�6/4/2021�� 2,000,000� USD� 1,974,776� 2,197,348� 0.10Yuexiu�REIT�MTN�Co�3.1%�14/5/2018�'EMTN'� 2,650,000� USD� 2,533,005� 2,608,672� 0.11
� � � 404,843,562� 417,654,425� 18.34
Canada CNOOC�Nexen�Finance�2014�ULC�4.25%�30/4/2024�� 4,100,000� USD� 4,083,385� 4,236,325� 0.19CNOOC�Nexen�Finance�2014�ULC�4.875%�30/4/2044�� 3,000,000� USD� 2,951,863� 3,228,000� 0.14Nexen�Energy�ULC�5.875%�10/3/2035�� 8,000,000� USD� 8,761,880� 9,360,000� 0.41Nexen�Energy�ULC�6.4%�15/5/2037�� 5,000,000� USD� 5,901,867� 6,176,577� 0.27Nexen�Energy�ULC�7.5%�30/7/2039�� 3,000,000� USD� 4,007,975� 4,191,000� 0.18Nexen�Energy�ULC�7.875%�15/3/2032�� 2,000,000� USD� 2,599,580� 2,840,000� 0.12PTTEP�Canada�International�Finance�Ltd�5.692%�5/4/2021�'REGS'� 4,000,000� USD� 4,000,000� 4,483,108� 0.20PTTEP�Canada�International�Finance�Ltd�6.35%�12/6/2042�'REGS'� 3,100,000� USD� 3,136,608� 3,622,257� 0.16
� � � 35,443,158� 38,137,267� 1.67
Cayman Islands Agile�Property�Holdings�Ltd�FRN�Perpetual�� 4,300,000� USD� 4,147,269� 3,203,500� 0.14Agile�Property�Holdings�Ltd�8.875%�28/4/2017�'REGS'� 4,000,000� USD� 3,985,461� 3,870,000� 0.17Agile�Property�Holdings�Ltd�9.875%�20/3/2017�� 3,400,000� USD� 3,398,541� 3,349,000� 0.15Alibaba�Group�Holding�Ltd�3.6%�28/11/2024�'REGS'� 3,000,000� USD� 2,965,904� 2,970,976� 0.13Alibaba�Group�Holding�Ltd�4.5%�28/11/2034�'REGS'� 400,000� USD� 397,767� 408,258� 0.02Amber�Circle�Funding�Ltd�2%�4/12/2017�'REGS'� 1,300,000� USD� 1,296,487� 1,289,490� 0.06Amber�Circle�Funding�Ltd�3.25%�4/12/2022�'REGS'� 6,300,000� USD� 6,162,347� 6,183,131� 0.27Azure�Orbit�International�Finance�Ltd�3.75%�6/3/2023�'REGS'� 4,100,000� USD� 4,041,496� 4,079,767� 0.18Baidu�Inc�3.5%�28/11/2022�� 4,300,000� USD� 4,339,738� 4,235,589� 0.19CDBL�Funding�1�3.25%�2/12/2019�� 5,000,000� USD� 4,973,992� 4,918,205� 0.22CDBL�Funding�1�4.25%�2/12/2024�� 5,000,000� USD� 4,955,022� 4,943,945� 0.22Central�China�Real�Estate�Ltd�6.5%�4/6/2018�'EMTN'� 3,000,000� USD� 2,905,102� 2,722,500� 0.12Central�China�Real�Estate�Ltd�8%�28/1/2020�'REGS'� 1,800,000� USD� 1,800,000� 1,633,500� 0.07Champion�MTN�Ltd�3.75%�17/1/2023�'EMTN'� 8,000,000� USD� 7,228,195� 7,409,885� 0.33China�Merchants�Land�Ltd�4.021%�11/12/2018�� 2,300,000� USD� 2,300,000� 2,359,041� 0.10China�Overseas�Finance�Cayman�II�Ltd�5.5%�10/11/2020�� 6,000,000� USD� 5,938,257� 6,465,992� 0.28China�Overseas�Finance�Cayman�III�Ltd�3.375%�29/10/2018�� 3,000,000� USD� 2,981,714� 3,019,031� 0.13China�Overseas�Finance�Cayman�III�Ltd�5.375%�29/10/2023�� 1,100,000� USD� 1,096,072� 1,159,484� 0.05China�Overseas�Finance�Cayman�III�Ltd�6.375%�29/10/2043�� 7,900,000� USD� 7,463,000� 8,372,103� 0.37China�Overseas�Finance�Cayman�IV�Ltd�4.875%�15/2/2017�� 4,000,000� USD� 4,003,861� 4,190,861� 0.18China�Overseas�Finance�Cayman�V�Ltd�3.95%�15/11/2022�� 8,300,000� USD� 8,129,489� 8,016,015� 0.35China�Overseas�Finance�Cayman�V�Ltd�5.35%�15/11/2042�� 3,100,000� USD� 3,111,995� 2,878,443� 0.13China�Overseas�Finance�Cayman�VI�Ltd�5.95%�8/5/2024�� 1,500,000� USD� 1,543,548� 1,643,870� 0.07China�Overseas�Finance�Cayman�VI�Ltd�6.45%�11/6/2034�� 2,500,000� USD� 2,575,188� 2,698,575� 0.12China�Overseas�Grand�Oceans�Finance�Cayman�II�Ltd�5.125%��23/1/2019�� 2,000,000� USD� 1,981,898� 2,053,486� 0.09China�Resources�Land�Ltd�4.375%�27/2/2019�'EMTN'� 4,000,000� USD� 3,992,468� 4,126,571� 0.18China�Resources�Land�Ltd�4.625%�19/5/2016�'REGS'� 7,400,000� USD� 7,372,793� 7,631,657� 0.33China�Resources�Land�Ltd�6%�27/2/2024�'EMTN'� 1,300,000� USD� 1,300,000� 1,442,689� 0.06China�SCE�Property�Holdings�Ltd�10.5%�14/1/2016�'REGS'� 5,000,000� CNY� 829,655� 798,877� 0.04China�SCE�Property�Holdings�Ltd�11.5%�14/11/2017�'REGS'� 2,200,000� USD� 2,276,509� 2,233,000� 0.10China�Shanshui�Cement�Group�Ltd�8.5%�25/5/2016�'REGS'� 6,800,000� USD� 6,884,773� 6,834,000� 0.30China�Shanshui�Cement�Group�Ltd�10.5%�27/4/2017�'REGS'� 2,000,000� USD� 2,000,000� 2,075,000� 0.09China�State�Construction�Finance�Cayman�I�Ltd�3.125%�2/4/2018�� 3,000,000� USD� 2,991,090� 2,975,121� 0.13CIFI�Holdings�Group�Co�Ltd�8.875%�27/1/2019�� 3,300,000� USD� 3,230,284� 3,275,250� 0.14Country�Garden�Holdings�Co�Ltd�7.25%�4/4/2021�'REGS'� 1,300,000� USD� 1,300,000� 1,241,500� 0.05Country�Garden�Holdings�Co�Ltd�7.5%�10/1/2023�'REGS'� 1,500,000� USD� 1,419,360� 1,425,000� 0.06Country�Garden�Holdings�Co�Ltd�10.5%�11/8/2015�� 4,100,000� USD� 4,097,657� 4,233,250� 0.19Country�Garden�Holdings�Co�Ltd�11.125%�23/2/2018�'REGS'� 4,700,000� USD� 4,688,698� 4,970,250� 0.22Dynamic�Talent�Ltd�4.75%�1/8/2017�'REGS'� 3,600,000� USD� 3,618,109� 3,684,015� 0.16ENN�Energy�Holdings�Ltd�3.25%�23/10/2019�� 5,000,000� USD� 4,976,119� 4,913,300� 0.22
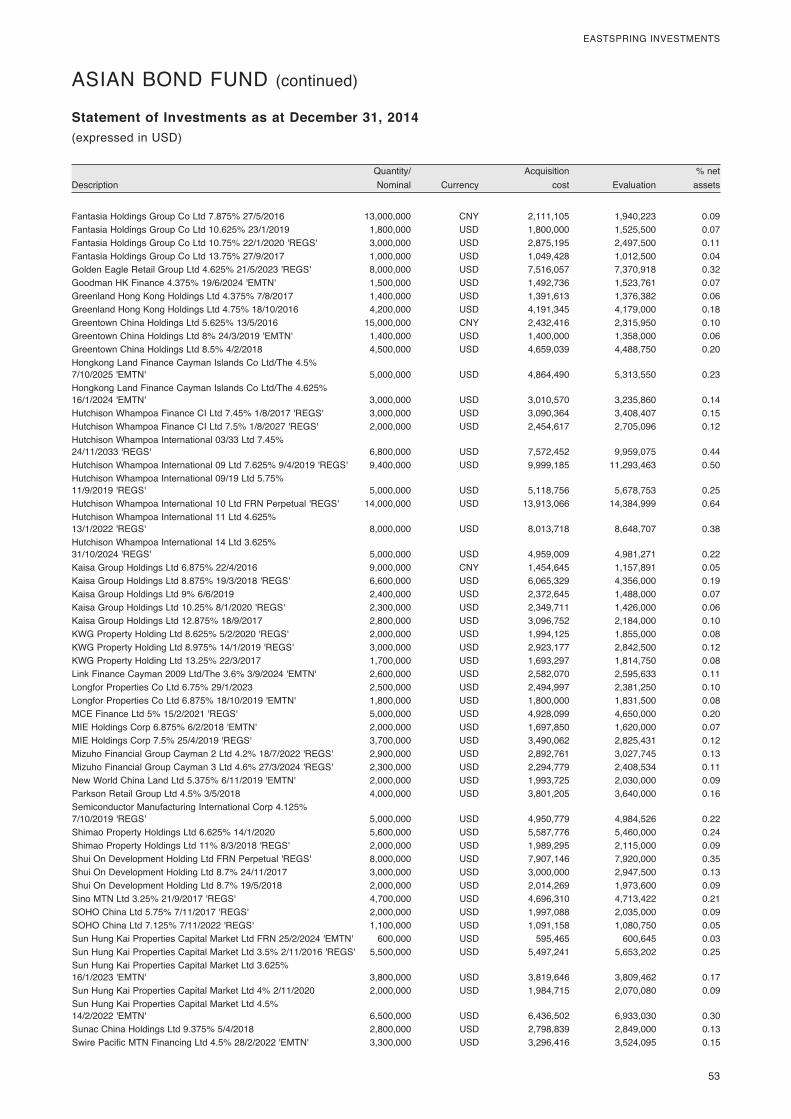
� 53
EASTSPRING�INVESTMENTS
� Quantity/�� � Acquisition�� � %�net�Description� Nominal�� Currency�� cost�� Evaluation�� assets�
Statement of Investments as at December 31, 2014(expressed�in�USD)
ASIAN�BOND�FUND�(continued)
Fantasia�Holdings�Group�Co�Ltd�7.875%�27/5/2016�� 13,000,000� CNY� 2,111,105� 1,940,223� 0.09Fantasia�Holdings�Group�Co�Ltd�10.625%�23/1/2019�� 1,800,000� USD� 1,800,000� 1,525,500� 0.07Fantasia�Holdings�Group�Co�Ltd�10.75%�22/1/2020�'REGS'� 3,000,000� USD� 2,875,195� 2,497,500� 0.11Fantasia�Holdings�Group�Co�Ltd�13.75%�27/9/2017�� 1,000,000� USD� 1,049,428� 1,012,500� 0.04Golden�Eagle�Retail�Group�Ltd�4.625%�21/5/2023�'REGS'� 8,000,000� USD� 7,516,057� 7,370,918� 0.32Goodman�HK�Finance�4.375%�19/6/2024�'EMTN'� 1,500,000� USD� 1,492,736� 1,523,761� 0.07Greenland�Hong�Kong�Holdings�Ltd�4.375%�7/8/2017�� 1,400,000� USD� 1,391,613� 1,376,382� 0.06Greenland�Hong�Kong�Holdings�Ltd�4.75%�18/10/2016�� 4,200,000� USD� 4,191,345� 4,179,000� 0.18Greentown�China�Holdings�Ltd�5.625%�13/5/2016�� 15,000,000� CNY� 2,432,416� 2,315,950� 0.10Greentown�China�Holdings�Ltd�8%�24/3/2019�'EMTN'� 1,400,000� USD� 1,400,000� 1,358,000� 0.06Greentown�China�Holdings�Ltd�8.5%�4/2/2018�� 4,500,000� USD� 4,659,039� 4,488,750� 0.20Hongkong�Land�Finance�Cayman�Islands�Co�Ltd/The�4.5%��7/10/2025�'EMTN'� 5,000,000� USD� 4,864,490� 5,313,550� 0.23Hongkong�Land�Finance�Cayman�Islands�Co�Ltd/The�4.625%��16/1/2024�'EMTN'� 3,000,000� USD� 3,010,570� 3,235,860� 0.14Hutchison�Whampoa�Finance�CI�Ltd�7.45%�1/8/2017�'REGS'� 3,000,000� USD� 3,090,364� 3,408,407� 0.15Hutchison�Whampoa�Finance�CI�Ltd�7.5%�1/8/2027�'REGS'� 2,000,000� USD� 2,454,617� 2,705,096� 0.12Hutchison�Whampoa�International�03/33�Ltd�7.45%��24/11/2033�'REGS'� 6,800,000� USD� 7,572,452� 9,959,075� 0.44Hutchison�Whampoa�International�09�Ltd�7.625%�9/4/2019�'REGS'� 9,400,000� USD� 9,999,185� 11,293,463� 0.50Hutchison�Whampoa�International�09/19�Ltd�5.75%��11/9/2019�'REGS'� 5,000,000� USD� 5,118,756� 5,678,753� 0.25Hutchison�Whampoa�International�10�Ltd�FRN�Perpetual�'REGS'� 14,000,000� USD� 13,913,066� 14,384,999� 0.64Hutchison�Whampoa�International�11�Ltd�4.625%��13/1/2022�'REGS'� 8,000,000� USD� 8,013,718� 8,648,707� 0.38Hutchison�Whampoa�International�14�Ltd�3.625%��31/10/2024�'REGS'� 5,000,000� USD� 4,959,009� 4,981,271� 0.22Kaisa�Group�Holdings�Ltd�6.875%�22/4/2016�� 9,000,000� CNY� 1,454,645� 1,157,891� 0.05Kaisa�Group�Holdings�Ltd�8.875%�19/3/2018�'REGS'� 6,600,000� USD� 6,065,329� 4,356,000� 0.19Kaisa�Group�Holdings�Ltd�9%�6/6/2019�� 2,400,000� USD� 2,372,645� 1,488,000� 0.07Kaisa�Group�Holdings�Ltd�10.25%�8/1/2020�'REGS'� 2,300,000� USD� 2,349,711� 1,426,000� 0.06Kaisa�Group�Holdings�Ltd�12.875%�18/9/2017�� 2,800,000� USD� 3,096,752� 2,184,000� 0.10KWG�Property�Holding�Ltd�8.625%�5/2/2020�'REGS'� 2,000,000� USD� 1,994,125� 1,855,000� 0.08KWG�Property�Holding�Ltd�8.975%�14/1/2019�'REGS'� 3,000,000� USD� 2,923,177� 2,842,500� 0.12KWG�Property�Holding�Ltd�13.25%�22/3/2017�� 1,700,000� USD� 1,693,297� 1,814,750� 0.08Link�Finance�Cayman�2009�Ltd/The�3.6%�3/9/2024�'EMTN'� 2,600,000� USD� 2,582,070� 2,595,633� 0.11Longfor�Properties�Co�Ltd�6.75%�29/1/2023�� 2,500,000� USD� 2,494,997� 2,381,250� 0.10Longfor�Properties�Co�Ltd�6.875%�18/10/2019�'EMTN'� 1,800,000� USD� 1,800,000� 1,831,500� 0.08MCE�Finance�Ltd�5%�15/2/2021�'REGS'� 5,000,000� USD� 4,928,099� 4,650,000� 0.20MIE�Holdings�Corp�6.875%�6/2/2018�'EMTN'� 2,000,000� USD� 1,697,850� 1,620,000� 0.07MIE�Holdings�Corp�7.5%�25/4/2019�'REGS'� 3,700,000� USD� 3,490,062� 2,825,431� 0.12Mizuho�Financial�Group�Cayman�2�Ltd�4.2%�18/7/2022�'REGS'� 2,900,000� USD� 2,892,761� 3,027,745� 0.13Mizuho�Financial�Group�Cayman�3�Ltd�4.6%�27/3/2024�'REGS'� 2,300,000� USD� 2,294,779� 2,408,534� 0.11New�World�China�Land�Ltd�5.375%�6/11/2019�'EMTN'� 2,000,000� USD� 1,993,725� 2,030,000� 0.09Parkson�Retail�Group�Ltd�4.5%�3/5/2018�� 4,000,000� USD� 3,801,205� 3,640,000� 0.16Semiconductor�Manufacturing�International�Corp�4.125%��7/10/2019�'REGS'� 5,000,000� USD� 4,950,779� 4,984,526� 0.22Shimao�Property�Holdings�Ltd�6.625%�14/1/2020�� 5,600,000� USD� 5,587,776� 5,460,000� 0.24Shimao�Property�Holdings�Ltd�11%�8/3/2018�'REGS'� 2,000,000� USD� 1,989,295� 2,115,000� 0.09Shui�On�Development�Holding�Ltd�FRN�Perpetual�'REGS'� 8,000,000� USD� 7,907,146� 7,920,000� 0.35Shui�On�Development�Holding�Ltd�8.7%�24/11/2017�� 3,000,000� USD� 3,000,000� 2,947,500� 0.13Shui�On�Development�Holding�Ltd�8.7%�19/5/2018�� 2,000,000� USD� 2,014,269� 1,973,600� 0.09Sino�MTN�Ltd�3.25%�21/9/2017�'REGS'� 4,700,000� USD� 4,696,310� 4,713,422� 0.21SOHO�China�Ltd�5.75%�7/11/2017�'REGS'� 2,000,000� USD� 1,997,088� 2,035,000� 0.09SOHO�China�Ltd�7.125%�7/11/2022�'REGS'� 1,100,000� USD� 1,091,158� 1,080,750� 0.05Sun�Hung�Kai�Properties�Capital�Market�Ltd�FRN�25/2/2024�'EMTN'� 600,000� USD� 595,465� 600,645� 0.03Sun�Hung�Kai�Properties�Capital�Market�Ltd�3.5%�2/11/2016�'REGS'� 5,500,000� USD� 5,497,241� 5,653,202� 0.25Sun�Hung�Kai�Properties�Capital�Market�Ltd�3.625%��16/1/2023�'EMTN'� 3,800,000� USD� 3,819,646� 3,809,462� 0.17Sun�Hung�Kai�Properties�Capital�Market�Ltd�4%�2/11/2020�� 2,000,000� USD� 1,984,715� 2,070,080� 0.09Sun�Hung�Kai�Properties�Capital�Market�Ltd�4.5%��14/2/2022�'EMTN'� 6,500,000� USD� 6,436,502� 6,933,030� 0.30Sunac�China�Holdings�Ltd�9.375%�5/4/2018�� 2,800,000� USD� 2,798,839� 2,849,000� 0.13Swire�Pacific�MTN�Financing�Ltd�4.5%�28/2/2022�'EMTN'� 3,300,000� USD� 3,296,416� 3,524,095� 0.15
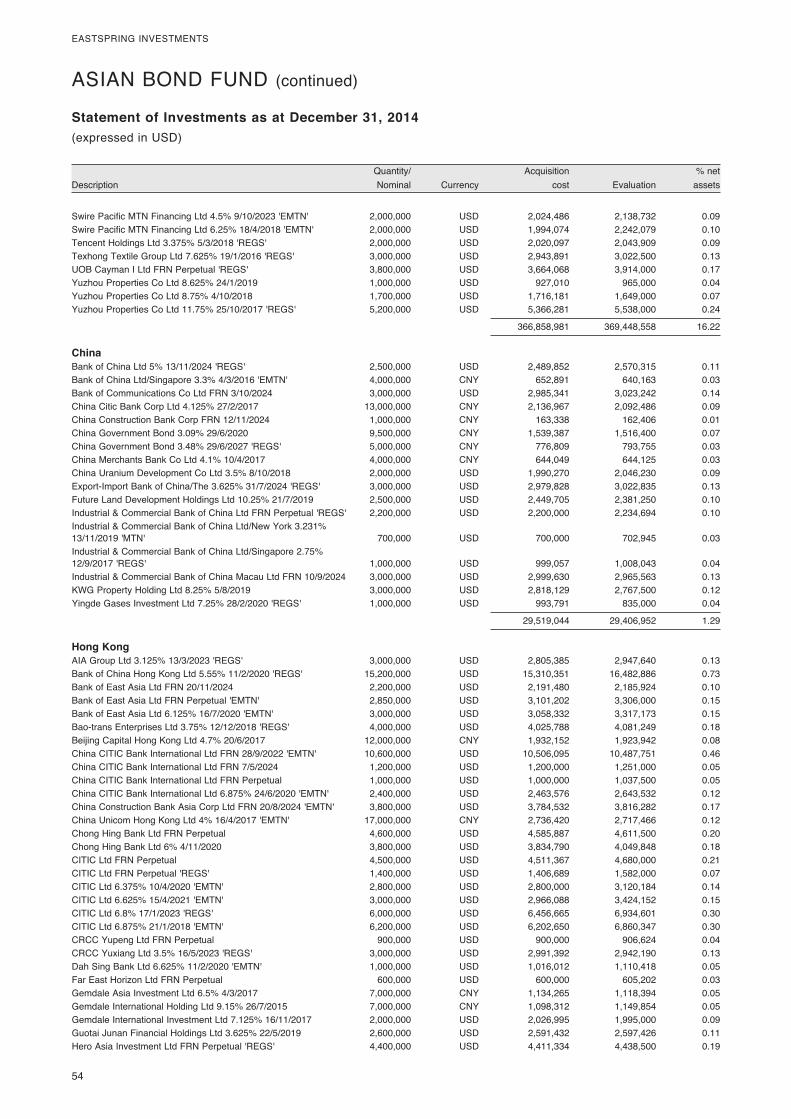
54�
EASTSPRING�INVESTMENTS
� Quantity/�� � Acquisition�� � %�net�Description� Nominal�� Currency�� cost�� Evaluation�� assets�
Statement of Investments as at December 31, 2014(expressed�in�USD)
ASIAN�BOND�FUND�(continued)
Swire�Pacific�MTN�Financing�Ltd�4.5%�9/10/2023�'EMTN'� 2,000,000� USD� 2,024,486� 2,138,732� 0.09Swire�Pacific�MTN�Financing�Ltd�6.25%�18/4/2018�'EMTN'� 2,000,000� USD� 1,994,074� 2,242,079� 0.10Tencent�Holdings�Ltd�3.375%�5/3/2018�'REGS'� 2,000,000� USD� 2,020,097� 2,043,909� 0.09Texhong�Textile�Group�Ltd�7.625%�19/1/2016�'REGS'� 3,000,000� USD� 2,943,891� 3,022,500� 0.13UOB�Cayman�I�Ltd�FRN�Perpetual�'REGS'� 3,800,000� USD� 3,664,068� 3,914,000� 0.17Yuzhou�Properties�Co�Ltd�8.625%�24/1/2019�� 1,000,000� USD� 927,010� 965,000� 0.04Yuzhou�Properties�Co�Ltd�8.75%�4/10/2018�� 1,700,000� USD� 1,716,181� 1,649,000� 0.07Yuzhou�Properties�Co�Ltd�11.75%�25/10/2017�'REGS'� 5,200,000� USD� 5,366,281� 5,538,000� 0.24
� � � 366,858,981� 369,448,558� 16.22
China Bank�of�China�Ltd�5%�13/11/2024�'REGS'� 2,500,000� USD� 2,489,852� 2,570,315� 0.11Bank�of�China�Ltd/Singapore�3.3%�4/3/2016�'EMTN'� 4,000,000� CNY� 652,891� 640,163� 0.03Bank�of�Communications�Co�Ltd�FRN�3/10/2024�� 3,000,000� USD� 2,985,341� 3,023,242� 0.14China�Citic�Bank�Corp�Ltd�4.125%�27/2/2017�� 13,000,000� CNY� 2,136,967� 2,092,486� 0.09China�Construction�Bank�Corp�FRN�12/11/2024�� 1,000,000� CNY� 163,338� 162,406� 0.01China�Government�Bond�3.09%�29/6/2020�� 9,500,000� CNY� 1,539,387� 1,516,400� 0.07China�Government�Bond�3.48%�29/6/2027�'REGS'� 5,000,000� CNY� 776,809� 793,755� 0.03China�Merchants�Bank�Co�Ltd�4.1%�10/4/2017�� 4,000,000� CNY� 644,049� 644,125� 0.03China�Uranium�Development�Co�Ltd�3.5%�8/10/2018�� 2,000,000� USD� 1,990,270� 2,046,230� 0.09Export-Import�Bank�of�China/The�3.625%�31/7/2024�'REGS'� 3,000,000� USD� 2,979,828� 3,022,835� 0.13Future�Land�Development�Holdings�Ltd�10.25%�21/7/2019�� 2,500,000� USD� 2,449,705� 2,381,250� 0.10Industrial�&�Commercial�Bank�of�China�Ltd�FRN�Perpetual�'REGS'� 2,200,000� USD� 2,200,000� 2,234,694� 0.10Industrial�&�Commercial�Bank�of�China�Ltd/New�York�3.231%��13/11/2019�'MTN'� 700,000� USD� 700,000� 702,945� 0.03Industrial�&�Commercial�Bank�of�China�Ltd/Singapore�2.75%��12/9/2017�'REGS'� 1,000,000� USD� 999,057� 1,008,043� 0.04Industrial�&�Commercial�Bank�of�China�Macau�Ltd�FRN�10/9/2024�� 3,000,000� USD� 2,999,630� 2,965,563� 0.13KWG�Property�Holding�Ltd�8.25%�5/8/2019�� 3,000,000� USD� 2,818,129� 2,767,500� 0.12Yingde�Gases�Investment�Ltd�7.25%�28/2/2020�'REGS'� 1,000,000� USD� 993,791� 835,000� 0.04
� � � 29,519,044� 29,406,952� 1.29
Hong Kong AIA�Group�Ltd�3.125%�13/3/2023�'REGS'� 3,000,000� USD� 2,805,385� 2,947,640� 0.13Bank�of�China�Hong�Kong�Ltd�5.55%�11/2/2020�'REGS'� 15,200,000� USD� 15,310,351� 16,482,886� 0.73Bank�of�East�Asia�Ltd�FRN�20/11/2024�� 2,200,000� USD� 2,191,480� 2,185,924� 0.10Bank�of�East�Asia�Ltd�FRN�Perpetual�'EMTN'� 2,850,000� USD� 3,101,202� 3,306,000� 0.15Bank�of�East�Asia�Ltd�6.125%�16/7/2020�'EMTN'� 3,000,000� USD� 3,058,332� 3,317,173� 0.15Bao-trans�Enterprises�Ltd�3.75%�12/12/2018�'REGS'� 4,000,000� USD� 4,025,788� 4,081,249� 0.18Beijing�Capital�Hong�Kong�Ltd�4.7%�20/6/2017�� 12,000,000� CNY� 1,932,152� 1,923,942� 0.08China�CITIC�Bank�International�Ltd�FRN�28/9/2022�'EMTN'� 10,600,000� USD� 10,506,095� 10,487,751� 0.46China�CITIC�Bank�International�Ltd�FRN�7/5/2024�� 1,200,000� USD� 1,200,000� 1,251,000� 0.05China�CITIC�Bank�International�Ltd�FRN�Perpetual�� 1,000,000� USD� 1,000,000� 1,037,500� 0.05China�CITIC�Bank�International�Ltd�6.875%�24/6/2020�'EMTN'� 2,400,000� USD� 2,463,576� 2,643,532� 0.12China�Construction�Bank�Asia�Corp�Ltd�FRN�20/8/2024�'EMTN'� 3,800,000� USD� 3,784,532� 3,816,282� 0.17China�Unicom�Hong�Kong�Ltd�4%�16/4/2017�'EMTN'� 17,000,000� CNY� 2,736,420� 2,717,466� 0.12Chong�Hing�Bank�Ltd�FRN�Perpetual�� 4,600,000� USD� 4,585,887� 4,611,500� 0.20Chong�Hing�Bank�Ltd�6%�4/11/2020�� 3,800,000� USD� 3,834,790� 4,049,848� 0.18CITIC�Ltd�FRN�Perpetual�� 4,500,000� USD� 4,511,367� 4,680,000� 0.21CITIC�Ltd�FRN�Perpetual�'REGS'� 1,400,000� USD� 1,406,689� 1,582,000� 0.07CITIC�Ltd�6.375%�10/4/2020�'EMTN'� 2,800,000� USD� 2,800,000� 3,120,184� 0.14CITIC�Ltd�6.625%�15/4/2021�'EMTN'� 3,000,000� USD� 2,966,088� 3,424,152� 0.15CITIC�Ltd�6.8%�17/1/2023�'REGS'� 6,000,000� USD� 6,456,665� 6,934,601� 0.30CITIC�Ltd�6.875%�21/1/2018�'EMTN'� 6,200,000� USD� 6,202,650� 6,860,347� 0.30CRCC�Yupeng�Ltd�FRN�Perpetual�� 900,000� USD� 900,000� 906,624� 0.04CRCC�Yuxiang�Ltd�3.5%�16/5/2023�'REGS'� 3,000,000� USD� 2,991,392� 2,942,190� 0.13Dah�Sing�Bank�Ltd�6.625%�11/2/2020�'EMTN'� 1,000,000� USD� 1,016,012� 1,110,418� 0.05Far�East�Horizon�Ltd�FRN�Perpetual�� 600,000� USD� 600,000� 605,202� 0.03Gemdale�Asia�Investment�Ltd�6.5%�4/3/2017�� 7,000,000� CNY� 1,134,265� 1,118,394� 0.05Gemdale�International�Holding�Ltd�9.15%�26/7/2015�� 7,000,000� CNY� 1,098,312� 1,149,854� 0.05Gemdale�International�Investment�Ltd�7.125%�16/11/2017�� 2,000,000� USD� 2,026,995� 1,995,000� 0.09Guotai�Junan�Financial�Holdings�Ltd�3.625%�22/5/2019�� 2,600,000� USD� 2,591,432� 2,597,426� 0.11Hero�Asia�Investment�Ltd�FRN�Perpetual�'REGS'� 4,400,000� USD� 4,411,334� 4,438,500� 0.19
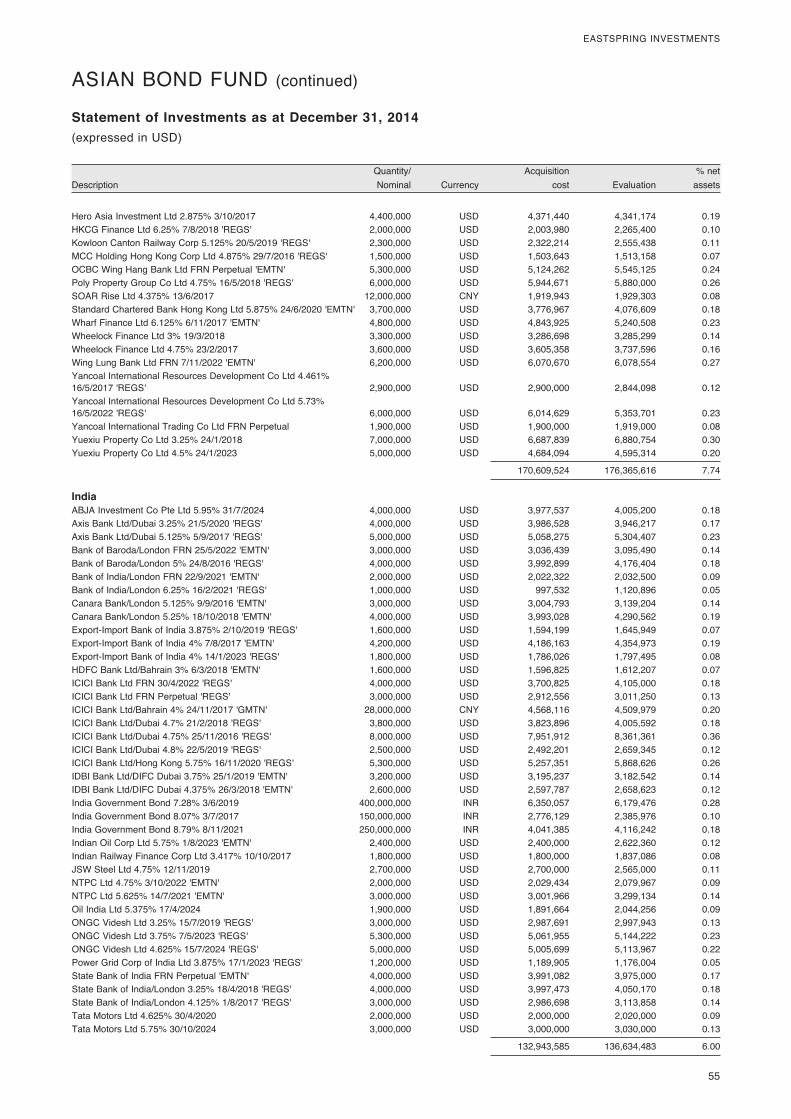
� 55
EASTSPRING�INVESTMENTS
� Quantity/�� � Acquisition�� � %�net�Description� Nominal�� Currency�� cost�� Evaluation�� assets�
Statement of Investments as at December 31, 2014(expressed�in�USD)
Hero�Asia�Investment�Ltd�2.875%�3/10/2017�� 4,400,000� USD� 4,371,440� 4,341,174� 0.19HKCG�Finance�Ltd�6.25%�7/8/2018�'REGS'� 2,000,000� USD� 2,003,980� 2,265,400� 0.10Kowloon�Canton�Railway�Corp�5.125%�20/5/2019�'REGS'� 2,300,000� USD� 2,322,214� 2,555,438� 0.11MCC�Holding�Hong�Kong�Corp�Ltd�4.875%�29/7/2016�'REGS'� 1,500,000� USD� 1,503,643� 1,513,158� 0.07OCBC�Wing�Hang�Bank�Ltd�FRN�Perpetual�'EMTN'� 5,300,000� USD� 5,124,262� 5,545,125� 0.24Poly�Property�Group�Co�Ltd�4.75%�16/5/2018�'REGS'� 6,000,000� USD� 5,944,671� 5,880,000� 0.26SOAR�Rise�Ltd�4.375%�13/6/2017�� 12,000,000� CNY� 1,919,943� 1,929,303� 0.08Standard�Chartered�Bank�Hong�Kong�Ltd�5.875%�24/6/2020�'EMTN'� 3,700,000� USD� 3,776,967� 4,076,609� 0.18Wharf�Finance�Ltd�6.125%�6/11/2017�'EMTN'� 4,800,000� USD� 4,843,925� 5,240,508� 0.23Wheelock�Finance�Ltd�3%�19/3/2018�� 3,300,000� USD� 3,286,698� 3,285,299� 0.14Wheelock�Finance�Ltd�4.75%�23/2/2017�� 3,600,000� USD� 3,605,358� 3,737,596� 0.16Wing�Lung�Bank�Ltd�FRN�7/11/2022�'EMTN'� 6,200,000� USD� 6,070,670� 6,078,554� 0.27Yancoal�International�Resources�Development�Co�Ltd�4.461%��16/5/2017�'REGS'� 2,900,000� USD� 2,900,000� 2,844,098� 0.12Yancoal�International�Resources�Development�Co�Ltd�5.73%��16/5/2022�'REGS'� 6,000,000� USD� 6,014,629� 5,353,701� 0.23Yancoal�International�Trading�Co�Ltd�FRN�Perpetual�� 1,900,000� USD� 1,900,000� 1,919,000� 0.08Yuexiu�Property�Co�Ltd�3.25%�24/1/2018�� 7,000,000� USD� 6,687,839� 6,880,754� 0.30Yuexiu�Property�Co�Ltd�4.5%�24/1/2023�� 5,000,000� USD� 4,684,094� 4,595,314� 0.20
� � � 170,609,524� 176,365,616� 7.74
India ABJA�Investment�Co�Pte�Ltd�5.95%�31/7/2024�� 4,000,000� USD� 3,977,537� 4,005,200� 0.18Axis�Bank�Ltd/Dubai�3.25%�21/5/2020�'REGS'� 4,000,000� USD� 3,986,528� 3,946,217� 0.17Axis�Bank�Ltd/Dubai�5.125%�5/9/2017�'REGS'� 5,000,000� USD� 5,058,275� 5,304,407� 0.23Bank�of�Baroda/London�FRN�25/5/2022�'EMTN'� 3,000,000� USD� 3,036,439� 3,095,490� 0.14Bank�of�Baroda/London�5%�24/8/2016�'REGS'� 4,000,000� USD� 3,992,899� 4,176,404� 0.18Bank�of�India/London�FRN�22/9/2021�'EMTN'� 2,000,000� USD� 2,022,322� 2,032,500� 0.09Bank�of�India/London�6.25%�16/2/2021�'REGS'� 1,000,000� USD� 997,532� 1,120,896� 0.05Canara�Bank/London�5.125%�9/9/2016�'EMTN'� 3,000,000� USD� 3,004,793� 3,139,204� 0.14Canara�Bank/London�5.25%�18/10/2018�'EMTN'� 4,000,000� USD� 3,993,028� 4,290,562� 0.19Export-Import�Bank�of�India�3.875%�2/10/2019�'REGS'� 1,600,000� USD� 1,594,199� 1,645,949� 0.07Export-Import�Bank�of�India�4%�7/8/2017�'EMTN'� 4,200,000� USD� 4,186,163� 4,354,973� 0.19Export-Import�Bank�of�India�4%�14/1/2023�'REGS'� 1,800,000� USD� 1,786,026� 1,797,495� 0.08HDFC�Bank�Ltd/Bahrain�3%�6/3/2018�'EMTN'� 1,600,000� USD� 1,596,825� 1,612,207� 0.07ICICI�Bank�Ltd�FRN�30/4/2022�'REGS'� 4,000,000� USD� 3,700,825� 4,105,000� 0.18ICICI�Bank�Ltd�FRN�Perpetual�'REGS'� 3,000,000� USD� 2,912,556� 3,011,250� 0.13ICICI�Bank�Ltd/Bahrain�4%�24/11/2017�'GMTN'� 28,000,000� CNY� 4,568,116� 4,509,979� 0.20ICICI�Bank�Ltd/Dubai�4.7%�21/2/2018�'REGS'� 3,800,000� USD� 3,823,896� 4,005,592� 0.18ICICI�Bank�Ltd/Dubai�4.75%�25/11/2016�'REGS'� 8,000,000� USD� 7,951,912� 8,361,361� 0.36ICICI�Bank�Ltd/Dubai�4.8%�22/5/2019�'REGS'� 2,500,000� USD� 2,492,201� 2,659,345� 0.12ICICI�Bank�Ltd/Hong�Kong�5.75%�16/11/2020�'REGS'� 5,300,000� USD� 5,257,351� 5,868,626� 0.26IDBI�Bank�Ltd/DIFC�Dubai�3.75%�25/1/2019�'EMTN'� 3,200,000� USD� 3,195,237� 3,182,542� 0.14IDBI�Bank�Ltd/DIFC�Dubai�4.375%�26/3/2018�'EMTN'� 2,600,000� USD� 2,597,787� 2,658,623� 0.12India�Government�Bond�7.28%�3/6/2019�� 400,000,000� INR� 6,350,057� 6,179,476� 0.28India�Government�Bond�8.07%�3/7/2017�� 150,000,000� INR� 2,776,129� 2,385,976� 0.10India�Government�Bond�8.79%�8/11/2021�� 250,000,000� INR� 4,041,385� 4,116,242� 0.18Indian�Oil�Corp�Ltd�5.75%�1/8/2023�'EMTN'� 2,400,000� USD� 2,400,000� 2,622,360� 0.12Indian�Railway�Finance�Corp�Ltd�3.417%�10/10/2017�� 1,800,000� USD� 1,800,000� 1,837,086� 0.08JSW�Steel�Ltd�4.75%�12/11/2019�� 2,700,000� USD� 2,700,000� 2,565,000� 0.11NTPC�Ltd�4.75%�3/10/2022�'EMTN'� 2,000,000� USD� 2,029,434� 2,079,967� 0.09NTPC�Ltd�5.625%�14/7/2021�'EMTN'� 3,000,000� USD� 3,001,966� 3,299,134� 0.14Oil�India�Ltd�5.375%�17/4/2024�� 1,900,000� USD� 1,891,664� 2,044,256� 0.09ONGC�Videsh�Ltd�3.25%�15/7/2019�'REGS'� 3,000,000� USD� 2,987,691� 2,997,943� 0.13ONGC�Videsh�Ltd�3.75%�7/5/2023�'REGS'� 5,300,000� USD� 5,061,955� 5,144,222� 0.23ONGC�Videsh�Ltd�4.625%�15/7/2024�'REGS'� 5,000,000� USD� 5,005,699� 5,113,967� 0.22Power�Grid�Corp�of�India�Ltd�3.875%�17/1/2023�'REGS'� 1,200,000� USD� 1,189,905� 1,176,004� 0.05State�Bank�of�India�FRN�Perpetual�'EMTN'� 4,000,000� USD� 3,991,082� 3,975,000� 0.17State�Bank�of�India/London�3.25%�18/4/2018�'REGS'� 4,000,000� USD� 3,997,473� 4,050,170� 0.18State�Bank�of�India/London�4.125%�1/8/2017�'REGS'� 3,000,000� USD� 2,986,698� 3,113,858� 0.14Tata�Motors�Ltd�4.625%�30/4/2020�� 2,000,000� USD� 2,000,000� 2,020,000� 0.09Tata�Motors�Ltd�5.75%�30/10/2024�� 3,000,000� USD� 3,000,000� 3,030,000� 0.13
� � � 132,943,585� 136,634,483� 6.00
ASIAN�BOND�FUND�(continued)
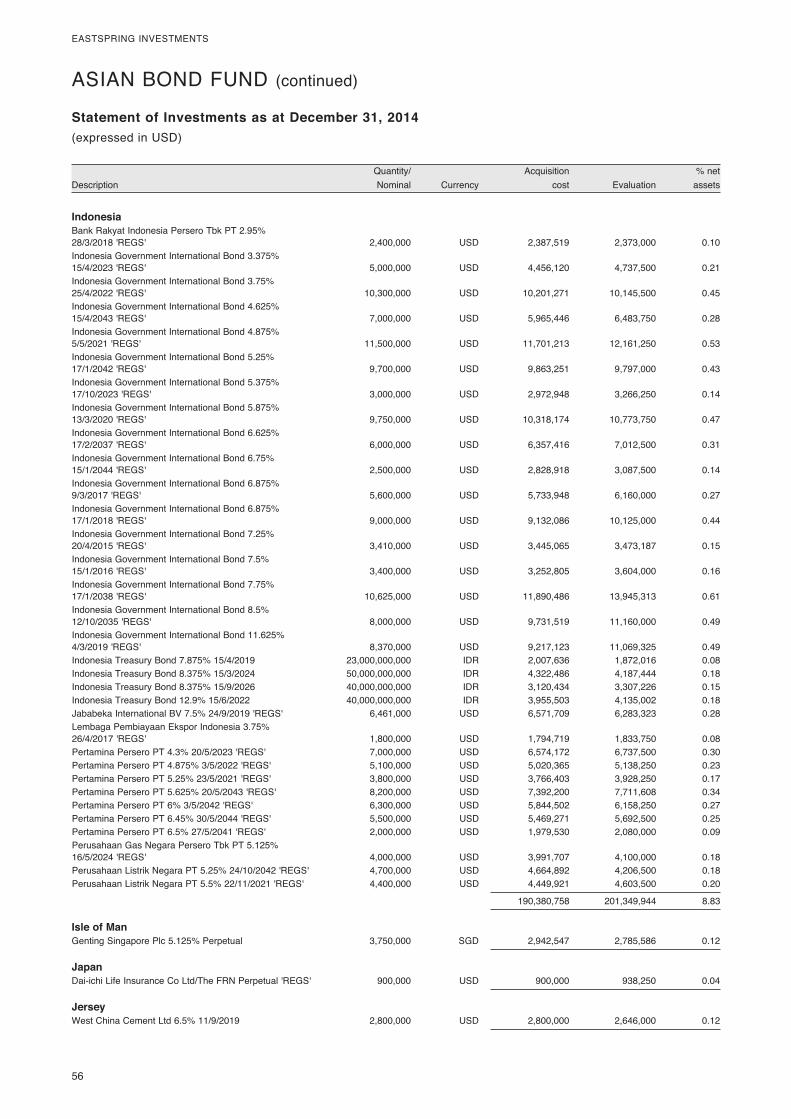
56�
EASTSPRING�INVESTMENTS
� Quantity/�� � Acquisition�� � %�net�Description� Nominal�� Currency�� cost�� Evaluation�� assets�
Statement of Investments as at December 31, 2014(expressed�in�USD)
Indonesia Bank�Rakyat�Indonesia�Persero�Tbk�PT�2.95%��28/3/2018�'REGS'� 2,400,000� USD� 2,387,519� 2,373,000� 0.10Indonesia�Government�International�Bond�3.375%��15/4/2023�'REGS'� 5,000,000� USD� 4,456,120� 4,737,500� 0.21Indonesia�Government�International�Bond�3.75%��25/4/2022�'REGS'� 10,300,000� USD� 10,201,271� 10,145,500� 0.45Indonesia�Government�International�Bond�4.625%��15/4/2043�'REGS'� 7,000,000� USD� 5,965,446� 6,483,750� 0.28Indonesia�Government�International�Bond�4.875%��5/5/2021�'REGS'� 11,500,000� USD� 11,701,213� 12,161,250� 0.53Indonesia�Government�International�Bond�5.25%��17/1/2042�'REGS'� 9,700,000� USD� 9,863,251� 9,797,000� 0.43Indonesia�Government�International�Bond�5.375%��17/10/2023�'REGS'� 3,000,000� USD� 2,972,948� 3,266,250� 0.14Indonesia�Government�International�Bond�5.875%��13/3/2020�'REGS'� 9,750,000� USD� 10,318,174� 10,773,750� 0.47Indonesia�Government�International�Bond�6.625%��17/2/2037�'REGS'� 6,000,000� USD� 6,357,416� 7,012,500� 0.31Indonesia�Government�International�Bond�6.75%��15/1/2044�'REGS'� 2,500,000� USD� 2,828,918� 3,087,500� 0.14Indonesia�Government�International�Bond�6.875%��9/3/2017�'REGS'� 5,600,000� USD� 5,733,948� 6,160,000� 0.27Indonesia�Government�International�Bond�6.875%��17/1/2018�'REGS'� 9,000,000� USD� 9,132,086� 10,125,000� 0.44Indonesia�Government�International�Bond�7.25%��20/4/2015�'REGS'� 3,410,000� USD� 3,445,065� 3,473,187� 0.15Indonesia�Government�International�Bond�7.5%��15/1/2016�'REGS'� 3,400,000� USD� 3,252,805� 3,604,000� 0.16Indonesia�Government�International�Bond�7.75%��17/1/2038�'REGS'� 10,625,000� USD� 11,890,486� 13,945,313� 0.61Indonesia�Government�International�Bond�8.5%��12/10/2035�'REGS'� 8,000,000� USD� 9,731,519� 11,160,000� 0.49Indonesia�Government�International�Bond�11.625%��4/3/2019�'REGS'� 8,370,000� USD� 9,217,123� 11,069,325� 0.49Indonesia�Treasury�Bond�7.875%�15/4/2019�� 23,000,000,000� IDR� 2,007,636� 1,872,016� 0.08Indonesia�Treasury�Bond�8.375%�15/3/2024�� 50,000,000,000� IDR� 4,322,486� 4,187,444� 0.18Indonesia�Treasury�Bond�8.375%�15/9/2026�� 40,000,000,000� IDR� 3,120,434� 3,307,226� 0.15Indonesia�Treasury�Bond�12.9%�15/6/2022�� 40,000,000,000� IDR� 3,955,503� 4,135,002� 0.18Jababeka�International�BV�7.5%�24/9/2019�'REGS'� 6,461,000� USD� 6,571,709� 6,283,323� 0.28Lembaga�Pembiayaan�Ekspor�Indonesia�3.75%��26/4/2017�'REGS'� 1,800,000� USD� 1,794,719� 1,833,750� 0.08Pertamina�Persero�PT�4.3%�20/5/2023�'REGS'� 7,000,000� USD� 6,574,172� 6,737,500� 0.30Pertamina�Persero�PT�4.875%�3/5/2022�'REGS'� 5,100,000� USD� 5,020,365� 5,138,250� 0.23Pertamina�Persero�PT�5.25%�23/5/2021�'REGS'� 3,800,000� USD� 3,766,403� 3,928,250� 0.17Pertamina�Persero�PT�5.625%�20/5/2043�'REGS'� 8,200,000� USD� 7,392,200� 7,711,608� 0.34Pertamina�Persero�PT�6%�3/5/2042�'REGS'� 6,300,000� USD� 5,844,502� 6,158,250� 0.27Pertamina�Persero�PT�6.45%�30/5/2044�'REGS'� 5,500,000� USD� 5,469,271� 5,692,500� 0.25Pertamina�Persero�PT�6.5%�27/5/2041�'REGS'� 2,000,000� USD� 1,979,530� 2,080,000� 0.09Perusahaan�Gas�Negara�Persero�Tbk�PT�5.125%��16/5/2024�'REGS'� 4,000,000� USD� 3,991,707� 4,100,000� 0.18Perusahaan�Listrik�Negara�PT�5.25%�24/10/2042�'REGS'� 4,700,000� USD� 4,664,892� 4,206,500� 0.18Perusahaan�Listrik�Negara�PT�5.5%�22/11/2021�'REGS'� 4,400,000� USD� 4,449,921� 4,603,500� 0.20
� � � 190,380,758� 201,349,944� 8.83
Isle of Man Genting�Singapore�Plc�5.125%�Perpetual�� 3,750,000� SGD� 2,942,547� 2,785,586� 0.12
Japan Dai-ichi�Life�Insurance�Co�Ltd/The�FRN�Perpetual�'REGS'� 900,000� USD� 900,000� 938,250� 0.04
Jersey West�China�Cement�Ltd�6.5%�11/9/2019�� 2,800,000� USD� 2,800,000� 2,646,000� 0.12
ASIAN�BOND�FUND�(continued)
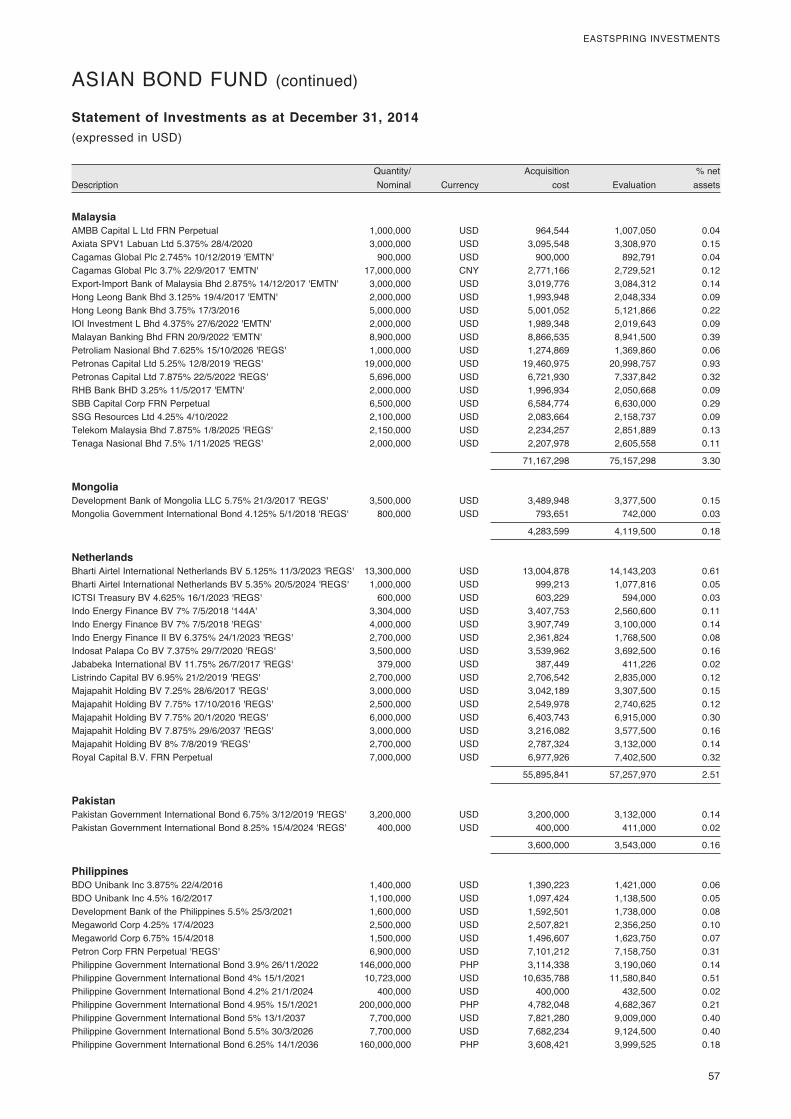
� 57
EASTSPRING�INVESTMENTS
� Quantity/�� � Acquisition�� � %�net�Description� Nominal�� Currency�� cost�� Evaluation�� assets�
Statement of Investments as at December 31, 2014(expressed�in�USD)
Malaysia AMBB�Capital�L�Ltd�FRN�Perpetual�� 1,000,000� USD� 964,544� 1,007,050� 0.04Axiata�SPV1�Labuan�Ltd�5.375%�28/4/2020�� 3,000,000� USD� 3,095,548� 3,308,970� 0.15Cagamas�Global�Plc�2.745%�10/12/2019�'EMTN'� 900,000� USD� 900,000� 892,791� 0.04Cagamas�Global�Plc�3.7%�22/9/2017�'EMTN'� 17,000,000� CNY� 2,771,166� 2,729,521� 0.12Export-Import�Bank�of�Malaysia�Bhd�2.875%�14/12/2017�'EMTN'� 3,000,000� USD� 3,019,776� 3,084,312� 0.14Hong�Leong�Bank�Bhd�3.125%�19/4/2017�'EMTN'� 2,000,000� USD� 1,993,948� 2,048,334� 0.09Hong�Leong�Bank�Bhd�3.75%�17/3/2016�� 5,000,000� USD� 5,001,052� 5,121,866� 0.22IOI�Investment�L�Bhd�4.375%�27/6/2022�'EMTN'� 2,000,000� USD� 1,989,348� 2,019,643� 0.09Malayan�Banking�Bhd�FRN�20/9/2022�'EMTN'� 8,900,000� USD� 8,866,535� 8,941,500� 0.39Petroliam�Nasional�Bhd�7.625%�15/10/2026�'REGS'� 1,000,000� USD� 1,274,869� 1,369,860� 0.06Petronas�Capital�Ltd�5.25%�12/8/2019�'REGS'� 19,000,000� USD� 19,460,975� 20,998,757� 0.93Petronas�Capital�Ltd�7.875%�22/5/2022�'REGS'� 5,696,000� USD� 6,721,930� 7,337,842� 0.32RHB�Bank�BHD�3.25%�11/5/2017�'EMTN'� 2,000,000� USD� 1,996,934� 2,050,668� 0.09SBB�Capital�Corp�FRN�Perpetual�� 6,500,000� USD� 6,584,774� 6,630,000� 0.29SSG�Resources�Ltd�4.25%�4/10/2022�� 2,100,000� USD� 2,083,664� 2,158,737� 0.09Telekom�Malaysia�Bhd�7.875%�1/8/2025�'REGS'� 2,150,000� USD� 2,234,257� 2,851,889� 0.13Tenaga�Nasional�Bhd�7.5%�1/11/2025�'REGS'� 2,000,000� USD� 2,207,978� 2,605,558� 0.11
� � � 71,167,298� 75,157,298� 3.30
Mongolia Development�Bank�of�Mongolia�LLC�5.75%�21/3/2017�'REGS'� 3,500,000� USD� 3,489,948� 3,377,500� 0.15Mongolia�Government�International�Bond�4.125%�5/1/2018�'REGS'� 800,000� USD� 793,651� 742,000� 0.03
� � � 4,283,599� 4,119,500� 0.18
Netherlands Bharti�Airtel�International�Netherlands�BV�5.125%�11/3/2023�'REGS'� 13,300,000� USD� 13,004,878� 14,143,203� 0.61Bharti�Airtel�International�Netherlands�BV�5.35%�20/5/2024�'REGS'� 1,000,000� USD� 999,213� 1,077,816� 0.05ICTSI�Treasury�BV�4.625%�16/1/2023�'REGS'� 600,000� USD� 603,229� 594,000� 0.03Indo�Energy�Finance�BV�7%�7/5/2018�'144A'� 3,304,000� USD� 3,407,753� 2,560,600� 0.11Indo�Energy�Finance�BV�7%�7/5/2018�'REGS'� 4,000,000� USD� 3,907,749� 3,100,000� 0.14Indo�Energy�Finance�II�BV�6.375%�24/1/2023�'REGS'� 2,700,000� USD� 2,361,824� 1,768,500� 0.08Indosat�Palapa�Co�BV�7.375%�29/7/2020�'REGS'� 3,500,000� USD� 3,539,962� 3,692,500� 0.16Jababeka�International�BV�11.75%�26/7/2017�'REGS'� 379,000� USD� 387,449� 411,226� 0.02Listrindo�Capital�BV�6.95%�21/2/2019�'REGS'� 2,700,000� USD� 2,706,542� 2,835,000� 0.12Majapahit�Holding�BV�7.25%�28/6/2017�'REGS'� 3,000,000� USD� 3,042,189� 3,307,500� 0.15Majapahit�Holding�BV�7.75%�17/10/2016�'REGS'� 2,500,000� USD� 2,549,978� 2,740,625� 0.12Majapahit�Holding�BV�7.75%�20/1/2020�'REGS'� 6,000,000� USD� 6,403,743� 6,915,000� 0.30Majapahit�Holding�BV�7.875%�29/6/2037�'REGS'� 3,000,000� USD� 3,216,082� 3,577,500� 0.16Majapahit�Holding�BV�8%�7/8/2019�'REGS'� 2,700,000� USD� 2,787,324� 3,132,000� 0.14Royal�Capital�B.V.�FRN�Perpetual�� 7,000,000� USD� 6,977,926� 7,402,500� 0.32
� � � 55,895,841� 57,257,970� 2.51
Pakistan Pakistan�Government�International�Bond�6.75%�3/12/2019�'REGS'� 3,200,000� USD� 3,200,000� 3,132,000� 0.14Pakistan�Government�International�Bond�8.25%�15/4/2024�'REGS'� 400,000� USD� 400,000� 411,000� 0.02
� � � 3,600,000� 3,543,000� 0.16
Philippines BDO�Unibank�Inc�3.875%�22/4/2016�� 1,400,000� USD� 1,390,223� 1,421,000� 0.06BDO�Unibank�Inc�4.5%�16/2/2017�� 1,100,000� USD� 1,097,424� 1,138,500� 0.05Development�Bank�of�the�Philippines�5.5%�25/3/2021�� 1,600,000� USD� 1,592,501� 1,738,000� 0.08Megaworld�Corp�4.25%�17/4/2023�� 2,500,000� USD� 2,507,821� 2,356,250� 0.10Megaworld�Corp�6.75%�15/4/2018�� 1,500,000� USD� 1,496,607� 1,623,750� 0.07Petron�Corp�FRN�Perpetual�'REGS'� 6,900,000� USD� 7,101,212� 7,158,750� 0.31Philippine�Government�International�Bond�3.9%�26/11/2022�� 146,000,000� PHP� 3,114,338� 3,190,060� 0.14Philippine�Government�International�Bond�4%�15/1/2021�� 10,723,000� USD� 10,635,788� 11,580,840� 0.51Philippine�Government�International�Bond�4.2%�21/1/2024�� 400,000� USD� 400,000� 432,500� 0.02Philippine�Government�International�Bond�4.95%�15/1/2021�� 200,000,000� PHP� 4,782,048� 4,682,367� 0.21Philippine�Government�International�Bond�5%�13/1/2037�� 7,700,000� USD� 7,821,280� 9,009,000� 0.40Philippine�Government�International�Bond�5.5%�30/3/2026�� 7,700,000� USD� 7,682,234� 9,124,500� 0.40Philippine�Government�International�Bond�6.25%�14/1/2036�� 160,000,000� PHP� 3,608,421� 3,999,525� 0.18
ASIAN�BOND�FUND�(continued)
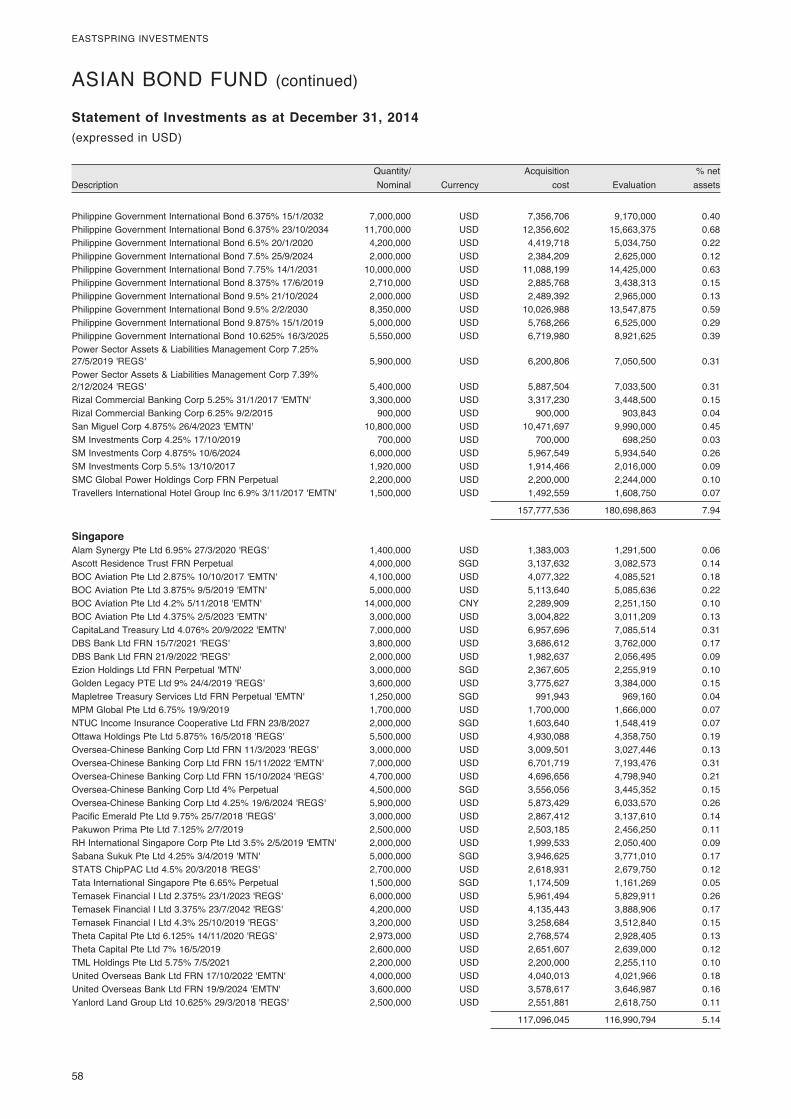
58�
EASTSPRING�INVESTMENTS
� Quantity/�� � Acquisition�� � %�net�Description� Nominal�� Currency�� cost�� Evaluation�� assets�
Statement of Investments as at December 31, 2014(expressed�in�USD)
Philippine�Government�International�Bond�6.375%�15/1/2032�� 7,000,000� USD� 7,356,706� 9,170,000� 0.40Philippine�Government�International�Bond�6.375%�23/10/2034�� 11,700,000� USD� 12,356,602� 15,663,375� 0.68Philippine�Government�International�Bond�6.5%�20/1/2020�� 4,200,000� USD� 4,419,718� 5,034,750� 0.22Philippine�Government�International�Bond�7.5%�25/9/2024�� 2,000,000� USD� 2,384,209� 2,625,000� 0.12Philippine�Government�International�Bond�7.75%�14/1/2031�� 10,000,000� USD� 11,088,199� 14,425,000� 0.63Philippine�Government�International�Bond�8.375%�17/6/2019�� 2,710,000� USD� 2,885,768� 3,438,313� 0.15Philippine�Government�International�Bond�9.5%�21/10/2024�� 2,000,000� USD� 2,489,392� 2,965,000� 0.13Philippine�Government�International�Bond�9.5%�2/2/2030�� 8,350,000� USD� 10,026,988� 13,547,875� 0.59Philippine�Government�International�Bond�9.875%�15/1/2019�� 5,000,000� USD� 5,768,266� 6,525,000� 0.29Philippine�Government�International�Bond�10.625%�16/3/2025�� 5,550,000� USD� 6,719,980� 8,921,625� 0.39Power�Sector�Assets�&�Liabilities�Management�Corp�7.25%��27/5/2019�'REGS'� 5,900,000� USD� 6,200,806� 7,050,500� 0.31Power�Sector�Assets�&�Liabilities�Management�Corp�7.39%��2/12/2024�'REGS'� 5,400,000� USD� 5,887,504� 7,033,500� 0.31Rizal�Commercial�Banking�Corp�5.25%�31/1/2017�'EMTN'� 3,300,000� USD� 3,317,230� 3,448,500� 0.15Rizal�Commercial�Banking�Corp�6.25%�9/2/2015�� 900,000� USD� 900,000� 903,843� 0.04San�Miguel�Corp�4.875%�26/4/2023�'EMTN'� 10,800,000� USD� 10,471,697� 9,990,000� 0.45SM�Investments�Corp�4.25%�17/10/2019�� 700,000� USD� 700,000� 698,250� 0.03SM�Investments�Corp�4.875%�10/6/2024�� 6,000,000� USD� 5,967,549� 5,934,540� 0.26SM�Investments�Corp�5.5%�13/10/2017�� 1,920,000� USD� 1,914,466� 2,016,000� 0.09SMC�Global�Power�Holdings�Corp�FRN�Perpetual�� 2,200,000� USD� 2,200,000� 2,244,000� 0.10Travellers�International�Hotel�Group�Inc�6.9%�3/11/2017�'EMTN'� 1,500,000� USD� 1,492,559� 1,608,750� 0.07
� � � 157,777,536� 180,698,863� 7.94
Singapore Alam�Synergy�Pte�Ltd�6.95%�27/3/2020�'REGS'� 1,400,000� USD� 1,383,003� 1,291,500� 0.06Ascott�Residence�Trust�FRN�Perpetual�� 4,000,000� SGD� 3,137,632� 3,082,573� 0.14BOC�Aviation�Pte�Ltd�2.875%�10/10/2017�'EMTN'� 4,100,000� USD� 4,077,322� 4,085,521� 0.18BOC�Aviation�Pte�Ltd�3.875%�9/5/2019�'EMTN'� 5,000,000� USD� 5,113,640� 5,085,636� 0.22BOC�Aviation�Pte�Ltd�4.2%�5/11/2018�'EMTN'� 14,000,000� CNY� 2,289,909� 2,251,150� 0.10BOC�Aviation�Pte�Ltd�4.375%�2/5/2023�'EMTN'� 3,000,000� USD� 3,004,822� 3,011,209� 0.13CapitaLand�Treasury�Ltd�4.076%�20/9/2022�'EMTN'� 7,000,000� USD� 6,957,696� 7,085,514� 0.31DBS�Bank�Ltd�FRN�15/7/2021�'REGS'� 3,800,000� USD� 3,686,612� 3,762,000� 0.17DBS�Bank�Ltd�FRN�21/9/2022�'REGS'� 2,000,000� USD� 1,982,637� 2,056,495� 0.09Ezion�Holdings�Ltd�FRN�Perpetual�'MTN'� 3,000,000� SGD� 2,367,605� 2,255,919� 0.10Golden�Legacy�PTE�Ltd�9%�24/4/2019�'REGS'� 3,600,000� USD� 3,775,627� 3,384,000� 0.15Mapletree�Treasury�Services�Ltd�FRN�Perpetual�'EMTN'� 1,250,000� SGD� 991,943� 969,160� 0.04MPM�Global�Pte�Ltd�6.75%�19/9/2019�� 1,700,000� USD� 1,700,000� 1,666,000� 0.07NTUC�Income�Insurance�Cooperative�Ltd�FRN�23/8/2027�� 2,000,000� SGD� 1,603,640� 1,548,419� 0.07Ottawa�Holdings�Pte�Ltd�5.875%�16/5/2018�'REGS'� 5,500,000� USD� 4,930,088� 4,358,750� 0.19Oversea-Chinese�Banking�Corp�Ltd�FRN�11/3/2023�'REGS'� 3,000,000� USD� 3,009,501� 3,027,446� 0.13Oversea-Chinese�Banking�Corp�Ltd�FRN�15/11/2022�'EMTN'� 7,000,000� USD� 6,701,719� 7,193,476� 0.31Oversea-Chinese�Banking�Corp�Ltd�FRN�15/10/2024�'REGS'� 4,700,000� USD� 4,696,656� 4,798,940� 0.21Oversea-Chinese�Banking�Corp�Ltd�4%�Perpetual�� 4,500,000� SGD� 3,556,056� 3,445,352� 0.15Oversea-Chinese�Banking�Corp�Ltd�4.25%�19/6/2024�'REGS'� 5,900,000� USD� 5,873,429� 6,033,570� 0.26Pacific�Emerald�Pte�Ltd�9.75%�25/7/2018�'REGS'� 3,000,000� USD� 2,867,412� 3,137,610� 0.14Pakuwon�Prima�Pte�Ltd�7.125%�2/7/2019�� 2,500,000� USD� 2,503,185� 2,456,250� 0.11RH�International�Singapore�Corp�Pte�Ltd�3.5%�2/5/2019�'EMTN'� 2,000,000� USD� 1,999,533� 2,050,400� 0.09Sabana�Sukuk�Pte�Ltd�4.25%�3/4/2019�'MTN'� 5,000,000� SGD� 3,946,625� 3,771,010� 0.17STATS�ChipPAC�Ltd�4.5%�20/3/2018�'REGS'� 2,700,000� USD� 2,618,931� 2,679,750� 0.12Tata�International�Singapore�Pte�6.65%�Perpetual�� 1,500,000� SGD� 1,174,509� 1,161,269� 0.05Temasek�Financial�I�Ltd�2.375%�23/1/2023�'REGS'� 6,000,000� USD� 5,961,494� 5,829,911� 0.26Temasek�Financial�I�Ltd�3.375%�23/7/2042�'REGS'� 4,200,000� USD� 4,135,443� 3,888,906� 0.17Temasek�Financial�I�Ltd�4.3%�25/10/2019�'REGS'� 3,200,000� USD� 3,258,684� 3,512,840� 0.15Theta�Capital�Pte�Ltd�6.125%�14/11/2020�'REGS'� 2,973,000� USD� 2,768,574� 2,928,405� 0.13Theta�Capital�Pte�Ltd�7%�16/5/2019�� 2,600,000� USD� 2,651,607� 2,639,000� 0.12TML�Holdings�Pte�Ltd�5.75%�7/5/2021�� 2,200,000� USD� 2,200,000� 2,255,110� 0.10United�Overseas�Bank�Ltd�FRN�17/10/2022�'EMTN'� 4,000,000� USD� 4,040,013� 4,021,966� 0.18United�Overseas�Bank�Ltd�FRN�19/9/2024�'EMTN'� 3,600,000� USD� 3,578,617� 3,646,987� 0.16Yanlord�Land�Group�Ltd�10.625%�29/3/2018�'REGS'� 2,500,000� USD� 2,551,881� 2,618,750� 0.11
� � � 117,096,045� 116,990,794� 5.14
ASIAN�BOND�FUND�(continued)
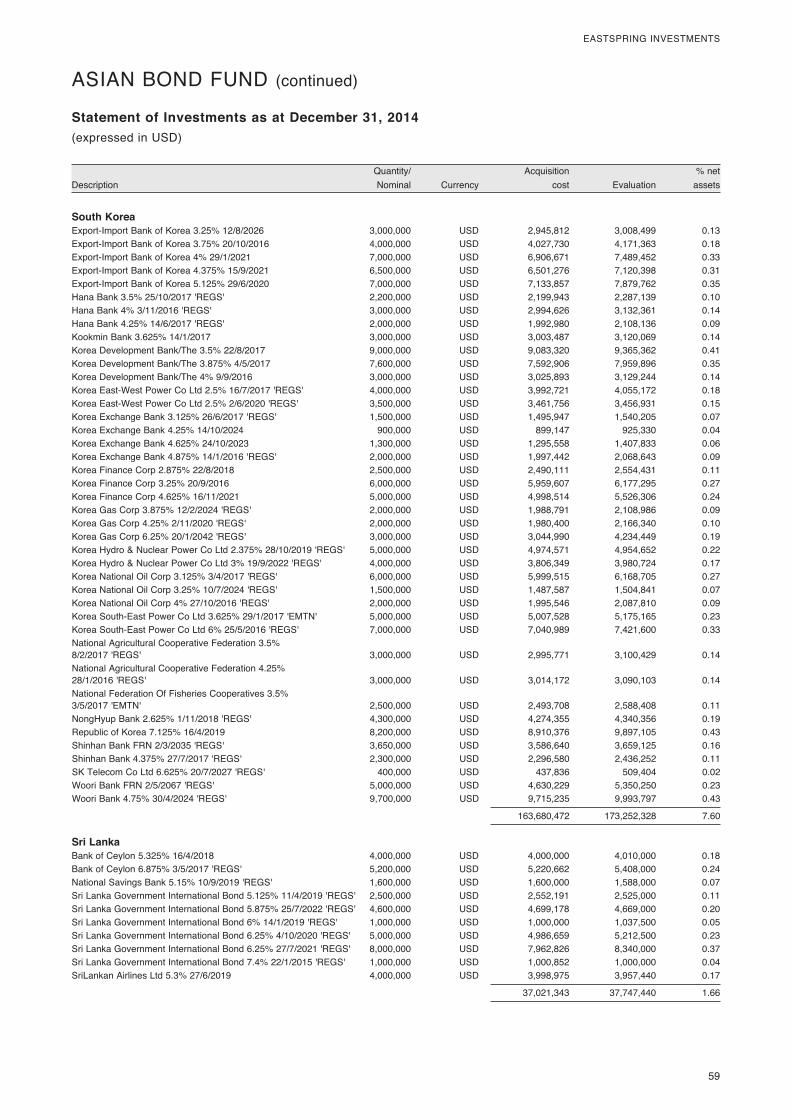
� 59
EASTSPRING�INVESTMENTS
� Quantity/�� � Acquisition�� � %�net�Description� Nominal�� Currency�� cost�� Evaluation�� assets�
Statement of Investments as at December 31, 2014(expressed�in�USD)
South Korea Export-Import�Bank�of�Korea�3.25%�12/8/2026�� 3,000,000� USD� 2,945,812� 3,008,499� 0.13Export-Import�Bank�of�Korea�3.75%�20/10/2016�� 4,000,000� USD� 4,027,730� 4,171,363� 0.18Export-Import�Bank�of�Korea�4%�29/1/2021�� 7,000,000� USD� 6,906,671� 7,489,452� 0.33Export-Import�Bank�of�Korea�4.375%�15/9/2021�� 6,500,000� USD� 6,501,276� 7,120,398� 0.31Export-Import�Bank�of�Korea�5.125%�29/6/2020�� 7,000,000� USD� 7,133,857� 7,879,762� 0.35Hana�Bank�3.5%�25/10/2017�'REGS'� 2,200,000� USD� 2,199,943� 2,287,139� 0.10Hana�Bank�4%�3/11/2016�'REGS'� 3,000,000� USD� 2,994,626� 3,132,361� 0.14Hana�Bank�4.25%�14/6/2017�'REGS'� 2,000,000� USD� 1,992,980� 2,108,136� 0.09Kookmin�Bank�3.625%�14/1/2017�� 3,000,000� USD� 3,003,487� 3,120,069� 0.14Korea�Development�Bank/The�3.5%�22/8/2017�� 9,000,000� USD� 9,083,320� 9,365,362� 0.41Korea�Development�Bank/The�3.875%�4/5/2017�� 7,600,000� USD� 7,592,906� 7,959,896� 0.35Korea�Development�Bank/The�4%�9/9/2016�� 3,000,000� USD� 3,025,893� 3,129,244� 0.14Korea�East-West�Power�Co�Ltd�2.5%�16/7/2017�'REGS'� 4,000,000� USD� 3,992,721� 4,055,172� 0.18Korea�East-West�Power�Co�Ltd�2.5%�2/6/2020�'REGS'� 3,500,000� USD� 3,461,756� 3,456,931� 0.15Korea�Exchange�Bank�3.125%�26/6/2017�'REGS'� 1,500,000� USD� 1,495,947� 1,540,205� 0.07Korea�Exchange�Bank�4.25%�14/10/2024�� 900,000� USD� 899,147� 925,330� 0.04Korea�Exchange�Bank�4.625%�24/10/2023�� 1,300,000� USD� 1,295,558� 1,407,833� 0.06Korea�Exchange�Bank�4.875%�14/1/2016�'REGS'� 2,000,000� USD� 1,997,442� 2,068,643� 0.09Korea�Finance�Corp�2.875%�22/8/2018�� 2,500,000� USD� 2,490,111� 2,554,431� 0.11Korea�Finance�Corp�3.25%�20/9/2016�� 6,000,000� USD� 5,959,607� 6,177,295� 0.27Korea�Finance�Corp�4.625%�16/11/2021�� 5,000,000� USD� 4,998,514� 5,526,306� 0.24Korea�Gas�Corp�3.875%�12/2/2024�'REGS'� 2,000,000� USD� 1,988,791� 2,108,986� 0.09Korea�Gas�Corp�4.25%�2/11/2020�'REGS'� 2,000,000� USD� 1,980,400� 2,166,340� 0.10Korea�Gas�Corp�6.25%�20/1/2042�'REGS'� 3,000,000� USD� 3,044,990� 4,234,449� 0.19Korea�Hydro�&�Nuclear�Power�Co�Ltd�2.375%�28/10/2019�'REGS'� 5,000,000� USD� 4,974,571� 4,954,652� 0.22Korea�Hydro�&�Nuclear�Power�Co�Ltd�3%�19/9/2022�'REGS'� 4,000,000� USD� 3,806,349� 3,980,724� 0.17Korea�National�Oil�Corp�3.125%�3/4/2017�'REGS'� 6,000,000� USD� 5,999,515� 6,168,705� 0.27Korea�National�Oil�Corp�3.25%�10/7/2024�'REGS'� 1,500,000� USD� 1,487,587� 1,504,841� 0.07Korea�National�Oil�Corp�4%�27/10/2016�'REGS'� 2,000,000� USD� 1,995,546� 2,087,810� 0.09Korea�South-East�Power�Co�Ltd�3.625%�29/1/2017�'EMTN'� 5,000,000� USD� 5,007,528� 5,175,165� 0.23Korea�South-East�Power�Co�Ltd�6%�25/5/2016�'REGS'� 7,000,000� USD� 7,040,989� 7,421,600� 0.33National�Agricultural�Cooperative�Federation�3.5%��8/2/2017�'REGS'� 3,000,000� USD� 2,995,771� 3,100,429� 0.14National�Agricultural�Cooperative�Federation�4.25%��28/1/2016�'REGS'� 3,000,000� USD� 3,014,172� 3,090,103� 0.14National�Federation�Of�Fisheries�Cooperatives�3.5%��3/5/2017�'EMTN'� 2,500,000� USD� 2,493,708� 2,588,408� 0.11NongHyup�Bank�2.625%�1/11/2018�'REGS'� 4,300,000� USD� 4,274,355� 4,340,356� 0.19Republic�of�Korea�7.125%�16/4/2019�� 8,200,000� USD� 8,910,376� 9,897,105� 0.43Shinhan�Bank�FRN�2/3/2035�'REGS'� 3,650,000� USD� 3,586,640� 3,659,125� 0.16Shinhan�Bank�4.375%�27/7/2017�'REGS'� 2,300,000� USD� 2,296,580� 2,436,252� 0.11SK�Telecom�Co�Ltd�6.625%�20/7/2027�'REGS'� 400,000� USD� 437,836� 509,404� 0.02Woori�Bank�FRN�2/5/2067�'REGS'� 5,000,000� USD� 4,630,229� 5,350,250� 0.23Woori�Bank�4.75%�30/4/2024�'REGS'� 9,700,000� USD� 9,715,235� 9,993,797� 0.43
� � � 163,680,472� 173,252,328� 7.60
Sri Lanka Bank�of�Ceylon�5.325%�16/4/2018�� 4,000,000� USD� 4,000,000� 4,010,000� 0.18Bank�of�Ceylon�6.875%�3/5/2017�'REGS'� 5,200,000� USD� 5,220,662� 5,408,000� 0.24National�Savings�Bank�5.15%�10/9/2019�'REGS'� 1,600,000� USD� 1,600,000� 1,588,000� 0.07Sri�Lanka�Government�International�Bond�5.125%�11/4/2019�'REGS'� 2,500,000� USD� 2,552,191� 2,525,000� 0.11Sri�Lanka�Government�International�Bond�5.875%�25/7/2022�'REGS'� 4,600,000� USD� 4,699,178� 4,669,000� 0.20Sri�Lanka�Government�International�Bond�6%�14/1/2019�'REGS'� 1,000,000� USD� 1,000,000� 1,037,500� 0.05Sri�Lanka�Government�International�Bond�6.25%�4/10/2020�'REGS'� 5,000,000� USD� 4,986,659� 5,212,500� 0.23Sri�Lanka�Government�International�Bond�6.25%�27/7/2021�'REGS'� 8,000,000� USD� 7,962,826� 8,340,000� 0.37Sri�Lanka�Government�International�Bond�7.4%�22/1/2015�'REGS'� 1,000,000� USD� 1,000,852� 1,000,000� 0.04SriLankan�Airlines�Ltd�5.3%�27/6/2019�� 4,000,000� USD� 3,998,975� 3,957,440� 0.17
� � � 37,021,343� 37,747,440� 1.66
ASIAN�BOND�FUND�(continued)
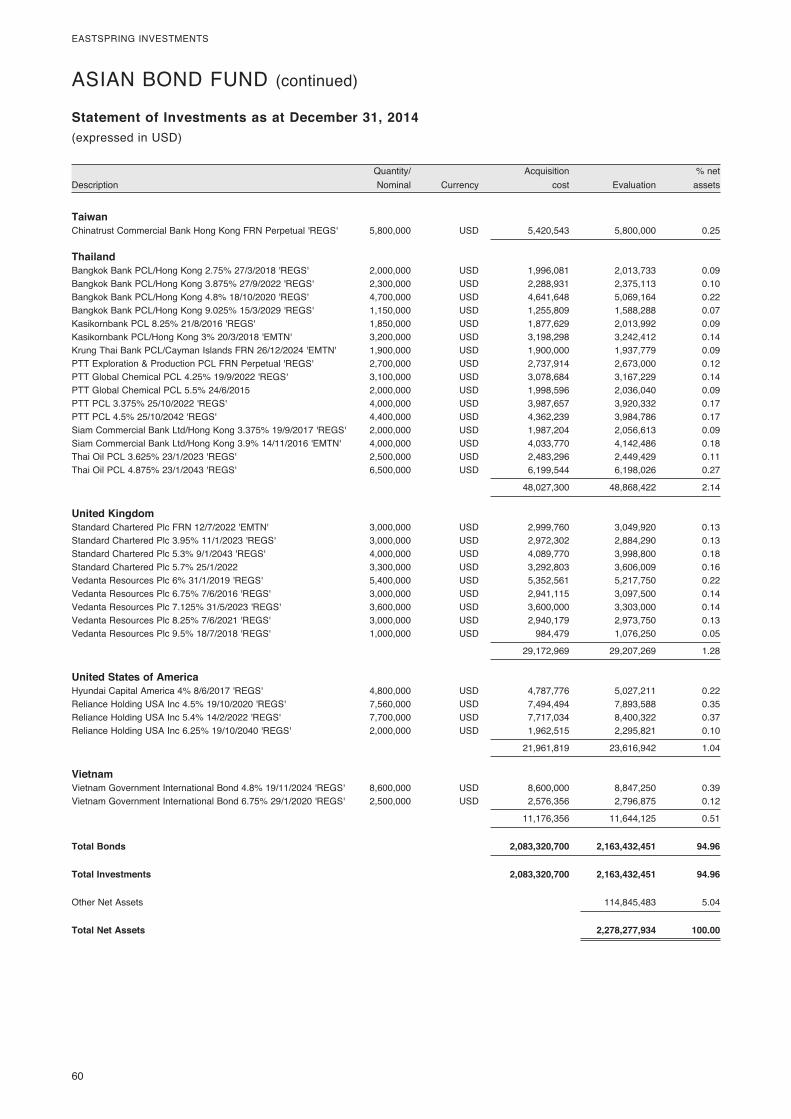
60�
EASTSPRING�INVESTMENTS
� Quantity/�� � Acquisition�� � %�net�Description� Nominal�� Currency�� cost�� Evaluation�� assets�
Statement of Investments as at December 31, 2014(expressed�in�USD)
Taiwan Chinatrust�Commercial�Bank�Hong�Kong�FRN�Perpetual�'REGS'� 5,800,000� USD� 5,420,543� 5,800,000� 0.25
Thailand Bangkok�Bank�PCL/Hong�Kong�2.75%�27/3/2018�'REGS'� 2,000,000� USD� 1,996,081� 2,013,733� 0.09Bangkok�Bank�PCL/Hong�Kong�3.875%�27/9/2022�'REGS'� 2,300,000� USD� 2,288,931� 2,375,113� 0.10Bangkok�Bank�PCL/Hong�Kong�4.8%�18/10/2020�'REGS'� 4,700,000� USD� 4,641,648� 5,069,164� 0.22Bangkok�Bank�PCL/Hong�Kong�9.025%�15/3/2029�'REGS'� 1,150,000� USD� 1,255,809� 1,588,288� 0.07Kasikornbank�PCL�8.25%�21/8/2016�'REGS'� 1,850,000� USD� 1,877,629� 2,013,992� 0.09Kasikornbank�PCL/Hong�Kong�3%�20/3/2018�'EMTN'� 3,200,000� USD� 3,198,298� 3,242,412� 0.14Krung�Thai�Bank�PCL/Cayman�Islands�FRN�26/12/2024�'EMTN'� 1,900,000� USD� 1,900,000� 1,937,779� 0.09PTT�Exploration�&�Production�PCL�FRN�Perpetual�'REGS'� 2,700,000� USD� 2,737,914� 2,673,000� 0.12PTT�Global�Chemical�PCL�4.25%�19/9/2022�'REGS'� 3,100,000� USD� 3,078,684� 3,167,229� 0.14PTT�Global�Chemical�PCL�5.5%�24/6/2015�� 2,000,000� USD� 1,998,596� 2,036,040� 0.09PTT�PCL�3.375%�25/10/2022�'REGS'� 4,000,000� USD� 3,987,657� 3,920,332� 0.17PTT�PCL�4.5%�25/10/2042�'REGS'� 4,400,000� USD� 4,362,239� 3,984,786� 0.17Siam�Commercial�Bank�Ltd/Hong�Kong�3.375%�19/9/2017�'REGS'� 2,000,000� USD� 1,987,204� 2,056,613� 0.09Siam�Commercial�Bank�Ltd/Hong�Kong�3.9%�14/11/2016�'EMTN'� 4,000,000� USD� 4,033,770� 4,142,486� 0.18Thai�Oil�PCL�3.625%�23/1/2023�'REGS'� 2,500,000� USD� 2,483,296� 2,449,429� 0.11Thai�Oil�PCL�4.875%�23/1/2043�'REGS'� 6,500,000� USD� 6,199,544� 6,198,026� 0.27
� � � 48,027,300� 48,868,422� 2.14
United Kingdom Standard�Chartered�Plc�FRN�12/7/2022�'EMTN'� 3,000,000� USD� 2,999,760� 3,049,920� 0.13Standard�Chartered�Plc�3.95%�11/1/2023�'REGS'� 3,000,000� USD� 2,972,302� 2,884,290� 0.13Standard�Chartered�Plc�5.3%�9/1/2043�'REGS'� 4,000,000� USD� 4,089,770� 3,998,800� 0.18Standard�Chartered�Plc�5.7%�25/1/2022�� 3,300,000� USD� 3,292,803� 3,606,009� 0.16Vedanta�Resources�Plc�6%�31/1/2019�'REGS'� 5,400,000� USD� 5,352,561� 5,217,750� 0.22Vedanta�Resources�Plc�6.75%�7/6/2016�'REGS'� 3,000,000� USD� 2,941,115� 3,097,500� 0.14Vedanta�Resources�Plc�7.125%�31/5/2023�'REGS'� 3,600,000� USD� 3,600,000� 3,303,000� 0.14Vedanta�Resources�Plc�8.25%�7/6/2021�'REGS'� 3,000,000� USD� 2,940,179� 2,973,750� 0.13Vedanta�Resources�Plc�9.5%�18/7/2018�'REGS'� 1,000,000� USD� 984,479� 1,076,250� 0.05
� � � 29,172,969� 29,207,269� 1.28
United States of America Hyundai�Capital�America�4%�8/6/2017�'REGS'� 4,800,000� USD� 4,787,776� 5,027,211� 0.22Reliance�Holding�USA�Inc�4.5%�19/10/2020�'REGS'� 7,560,000� USD� 7,494,494� 7,893,588� 0.35Reliance�Holding�USA�Inc�5.4%�14/2/2022�'REGS'� 7,700,000� USD� 7,717,034� 8,400,322� 0.37Reliance�Holding�USA�Inc�6.25%�19/10/2040�'REGS'� 2,000,000� USD� 1,962,515� 2,295,821� 0.10
� � � 21,961,819� 23,616,942� 1.04
Vietnam Vietnam�Government�International�Bond�4.8%�19/11/2024�'REGS'� 8,600,000� USD� 8,600,000� 8,847,250� 0.39Vietnam�Government�International�Bond�6.75%�29/1/2020�'REGS'� 2,500,000� USD� 2,576,356� 2,796,875� 0.12
� � � 11,176,356� 11,644,125� 0.51
Total Bonds 2,083,320,700 2,163,432,451 94.96
Total Investments 2,083,320,700 2,163,432,451 94.96
Other�Net�Assets� � � � 114,845,483� 5.04
Total Net Assets 2,278,277,934 100.00
ASIAN�BOND�FUND�(continued)
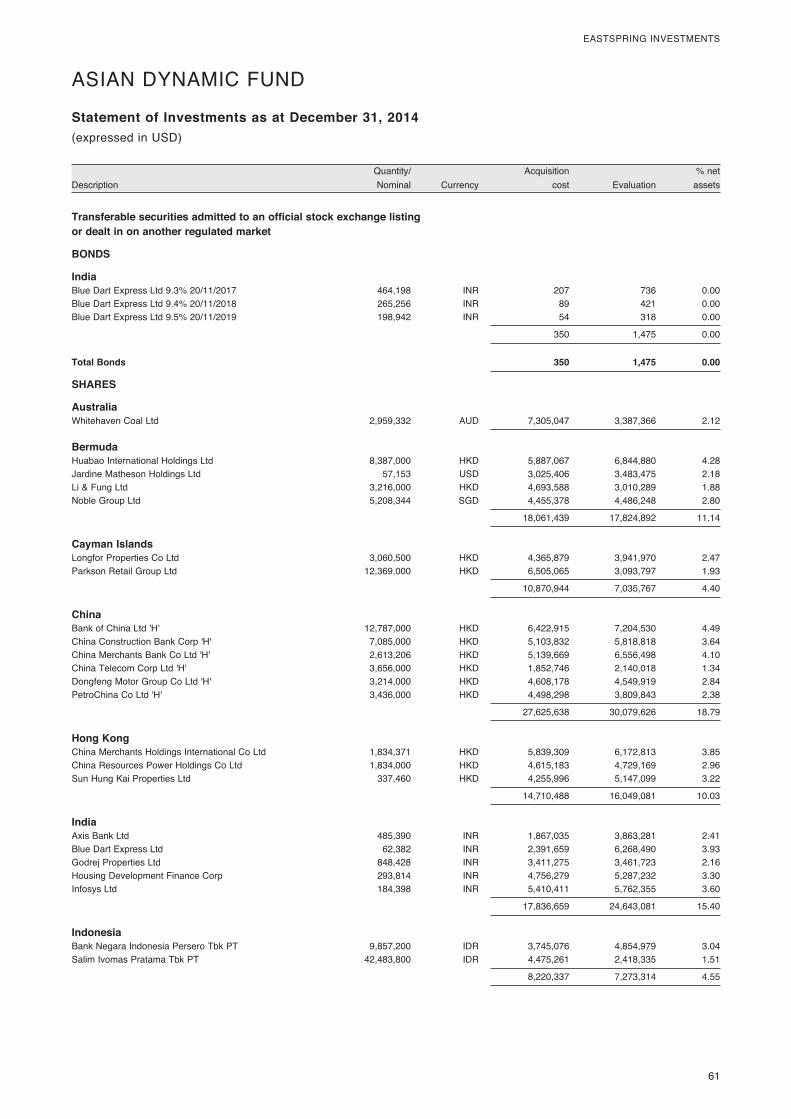
� 61
EASTSPRING�INVESTMENTS
� Quantity/�� � Acquisition�� � %�net�Description� Nominal�� Currency�� cost�� Evaluation�� assets�
Statement of Investments as at December 31, 2014(expressed�in�USD)
Transferable securities admitted to an official stock exchange listing or dealt in on another regulated market
BONDS
India Blue�Dart�Express�Ltd�9.3%�20/11/2017�� 464,198� INR� 207� 736� 0.00Blue�Dart�Express�Ltd�9.4%�20/11/2018�� 265,256� INR� 89� 421� 0.00Blue�Dart�Express�Ltd�9.5%�20/11/2019�� 198,942� INR� 54� 318� 0.00
� � � 350� 1,475� 0.00
Total Bonds 350 1,475 0.00
SHARES
Australia Whitehaven�Coal�Ltd�� 2,959,332� AUD� 7,305,047� 3,387,366� 2.12
Bermuda Huabao�International�Holdings�Ltd� 8,387,000� HKD� 5,887,067� 6,844,880� 4.28Jardine�Matheson�Holdings�Ltd� 57,153� USD� 3,025,406� 3,483,475� 2.18Li�&�Fung�Ltd� 3,216,000� HKD� 4,693,588� 3,010,289� 1.88Noble�Group�Ltd�� 5,208,344� SGD� 4,455,378� 4,486,248� 2.80
� � � 18,061,439� 17,824,892� 11.14
Cayman Islands Longfor�Properties�Co�Ltd� 3,060,500� HKD� 4,365,879� 3,941,970� 2.47Parkson�Retail�Group�Ltd�� 12,369,000� HKD� 6,505,065� 3,093,797� 1.93
� � � 10,870,944� 7,035,767� 4.40
China Bank�of�China�Ltd�'H'� 12,787,000� HKD� 6,422,915� 7,204,530� 4.49China�Construction�Bank�Corp�'H'� 7,085,000� HKD� 5,103,832� 5,818,818� 3.64China�Merchants�Bank�Co�Ltd�'H'� 2,613,206� HKD� 5,139,669� 6,556,498� 4.10China�Telecom�Corp�Ltd�'H'� 3,656,000� HKD� 1,852,746� 2,140,018� 1.34Dongfeng�Motor�Group�Co�Ltd�'H'� 3,214,000� HKD� 4,608,178� 4,549,919� 2.84PetroChina�Co�Ltd�'H'�� 3,436,000� HKD� 4,498,298� 3,809,843� 2.38
� � � 27,625,638� 30,079,626� 18.79
Hong Kong China�Merchants�Holdings�International�Co�Ltd� 1,834,371� HKD� 5,839,309� 6,172,813� 3.85China�Resources�Power�Holdings�Co�Ltd� 1,834,000� HKD� 4,615,183� 4,729,169� 2.96Sun�Hung�Kai�Properties�Ltd�� 337,460� HKD� 4,255,996� 5,147,099� 3.22
� � � 14,710,488� 16,049,081� 10.03
India Axis�Bank�Ltd� 485,390� INR� 1,867,035� 3,863,281� 2.41Blue�Dart�Express�Ltd� 62,382� INR� 2,391,659� 6,268,490� 3.93Godrej�Properties�Ltd� 848,428� INR� 3,411,275� 3,461,723� 2.16Housing�Development�Finance�Corp� 293,814� INR� 4,756,279� 5,287,232� 3.30Infosys�Ltd�� 184,398� INR� 5,410,411� 5,762,355� 3.60
� � � 17,836,659� 24,643,081� 15.40
Indonesia Bank�Negara�Indonesia�Persero�Tbk�PT� 9,857,200� IDR� 3,745,076� 4,854,979� 3.04Salim�Ivomas�Pratama�Tbk�PT�� 42,483,800� IDR� 4,475,261� 2,418,335� 1.51
� � � 8,220,337� 7,273,314� 4.55
ASIAN�DYNAMIC�FUND
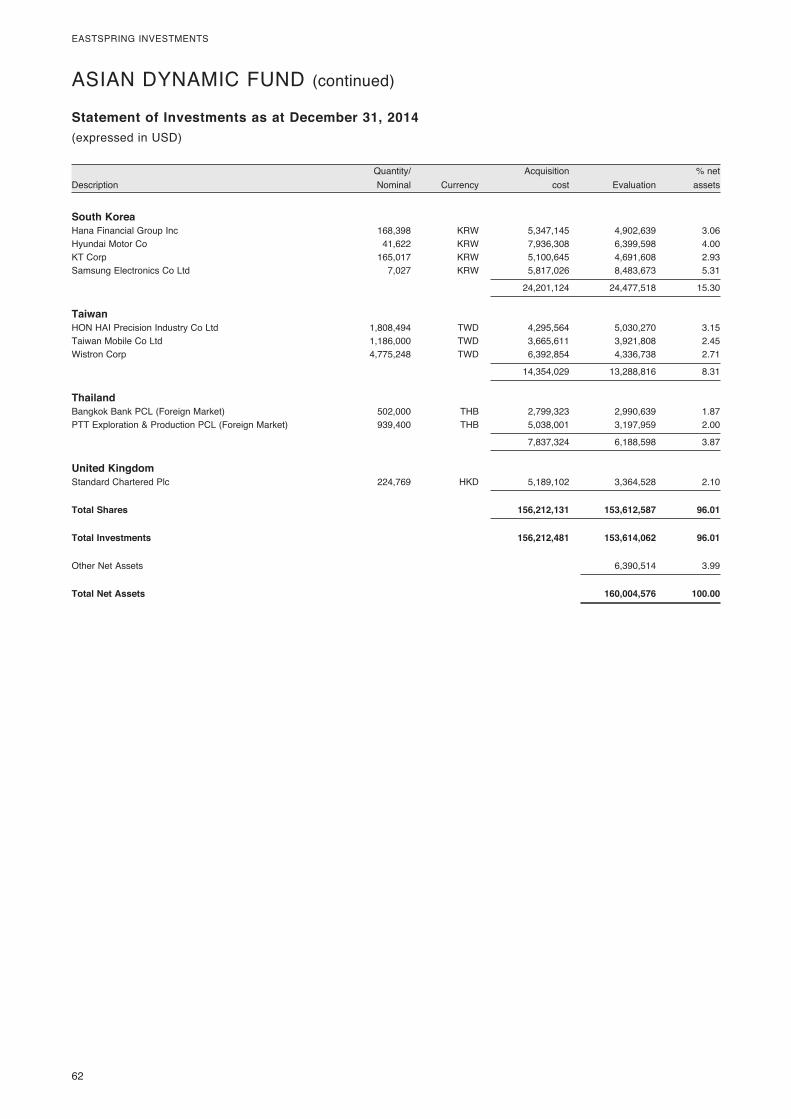
62�
EASTSPRING�INVESTMENTS
� Quantity/�� � Acquisition�� � %�net�Description� Nominal�� Currency�� cost�� Evaluation�� assets�
Statement of Investments as at December 31, 2014(expressed�in�USD)
ASIAN�DYNAMIC�FUND�(continued)
South Korea Hana�Financial�Group�Inc� 168,398� KRW� 5,347,145� 4,902,639� 3.06Hyundai�Motor�Co� 41,622� KRW� 7,936,308� 6,399,598� 4.00KT�Corp� 165,017� KRW� 5,100,645� 4,691,608� 2.93Samsung�Electronics�Co�Ltd�� 7,027� KRW� 5,817,026� 8,483,673� 5.31
� � � 24,201,124� 24,477,518� 15.30
Taiwan HON�HAI�Precision�Industry�Co�Ltd� 1,808,494� TWD� 4,295,564� 5,030,270� 3.15Taiwan�Mobile�Co�Ltd� 1,186,000� TWD� 3,665,611� 3,921,808� 2.45Wistron�Corp�� 4,775,248� TWD� 6,392,854� 4,336,738� 2.71
� � � 14,354,029� 13,288,816� 8.31
Thailand Bangkok�Bank�PCL�(Foreign�Market)� 502,000� THB� 2,799,323� 2,990,639� 1.87PTT�Exploration�&�Production�PCL�(Foreign�Market)�� 939,400� THB� 5,038,001� 3,197,959� 2.00
� � � 7,837,324� 6,188,598� 3.87
United Kingdom Standard�Chartered�Plc�� 224,769� HKD� 5,189,102� 3,364,528� 2.10
Total Shares 156,212,131 153,612,587 96.01
Total Investments 156,212,481 153,614,062 96.01
Other�Net�Assets� � � � 6,390,514� 3.99
Total Net Assets 160,004,576 100.00
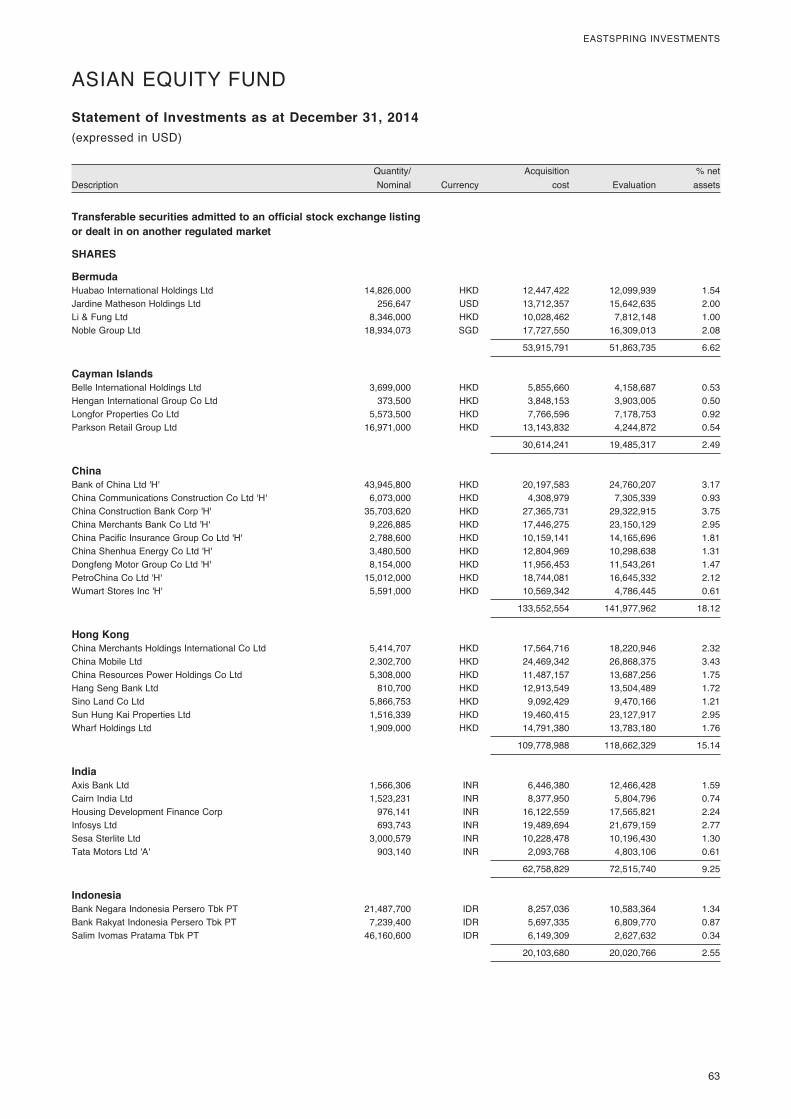
� 63
EASTSPRING�INVESTMENTS
� Quantity/�� � Acquisition�� � %�net�Description� Nominal�� Currency�� cost�� Evaluation�� assets�
Statement of Investments as at December 31, 2014(expressed�in�USD)
ASIAN�EQUITY�FUND
Transferable securities admitted to an official stock exchange listing or dealt in on another regulated market
SHARES
Bermuda Huabao�International�Holdings�Ltd� 14,826,000� HKD� 12,447,422� 12,099,939� 1.54Jardine�Matheson�Holdings�Ltd� 256,647� USD� 13,712,357� 15,642,635� 2.00Li�&�Fung�Ltd� 8,346,000� HKD� 10,028,462� 7,812,148� 1.00Noble�Group�Ltd�� 18,934,073� SGD� 17,727,550� 16,309,013� 2.08
� � � 53,915,791� 51,863,735� 6.62
Cayman Islands Belle�International�Holdings�Ltd� 3,699,000� HKD� 5,855,660� 4,158,687� 0.53Hengan�International�Group�Co�Ltd� 373,500� HKD� 3,848,153� 3,903,005� 0.50Longfor�Properties�Co�Ltd� 5,573,500� HKD� 7,766,596� 7,178,753� 0.92Parkson�Retail�Group�Ltd�� 16,971,000� HKD� 13,143,832� 4,244,872� 0.54
� � � 30,614,241� 19,485,317� 2.49
China Bank�of�China�Ltd�'H'� 43,945,800� HKD� 20,197,583� 24,760,207� 3.17China�Communications�Construction�Co�Ltd�'H'� 6,073,000� HKD� 4,308,979� 7,305,339� 0.93China�Construction�Bank�Corp�'H'� 35,703,620� HKD� 27,365,731� 29,322,915� 3.75China�Merchants�Bank�Co�Ltd�'H'� 9,226,885� HKD� 17,446,275� 23,150,129� 2.95China�Pacific�Insurance�Group�Co�Ltd�'H'� 2,788,600� HKD� 10,159,141� 14,165,696� 1.81China�Shenhua�Energy�Co�Ltd�'H'� 3,480,500� HKD� 12,804,969� 10,298,638� 1.31Dongfeng�Motor�Group�Co�Ltd�'H'� 8,154,000� HKD� 11,956,453� 11,543,261� 1.47PetroChina�Co�Ltd�'H'� 15,012,000� HKD� 18,744,081� 16,645,332� 2.12Wumart�Stores�Inc�'H'�� 5,591,000� HKD� 10,569,342� 4,786,445� 0.61
� � � 133,552,554� 141,977,962� 18.12
Hong Kong China�Merchants�Holdings�International�Co�Ltd� 5,414,707� HKD� 17,564,716� 18,220,946� 2.32China�Mobile�Ltd� 2,302,700� HKD� 24,469,342� 26,868,375� 3.43China�Resources�Power�Holdings�Co�Ltd� 5,308,000� HKD� 11,487,157� 13,687,256� 1.75Hang�Seng�Bank�Ltd� 810,700� HKD� 12,913,549� 13,504,489� 1.72Sino�Land�Co�Ltd� 5,866,753� HKD� 9,092,429� 9,470,166� 1.21Sun�Hung�Kai�Properties�Ltd� 1,516,339� HKD� 19,460,415� 23,127,917� 2.95Wharf�Holdings�Ltd�� 1,909,000� HKD� 14,791,380� 13,783,180� 1.76
� � � 109,778,988� 118,662,329� 15.14
India Axis�Bank�Ltd� 1,566,306� INR� 6,446,380� 12,466,428� 1.59Cairn�India�Ltd� 1,523,231� INR� 8,377,950� 5,804,796� 0.74Housing�Development�Finance�Corp� 976,141� INR� 16,122,559� 17,565,821� 2.24Infosys�Ltd� 693,743� INR� 19,489,694� 21,679,159� 2.77Sesa�Sterlite�Ltd� 3,000,579� INR� 10,228,478� 10,196,430� 1.30Tata�Motors�Ltd�'A'�� 903,140� INR� 2,093,768� 4,803,106� 0.61
� � � 62,758,829� 72,515,740� 9.25
Indonesia Bank�Negara�Indonesia�Persero�Tbk�PT� 21,487,700� IDR� 8,257,036� 10,583,364� 1.34Bank�Rakyat�Indonesia�Persero�Tbk�PT� 7,239,400� IDR� 5,697,335� 6,809,770� 0.87Salim�Ivomas�Pratama�Tbk�PT�� 46,160,600� IDR� 6,149,309� 2,627,632� 0.34
� � � 20,103,680� 20,020,766� 2.55
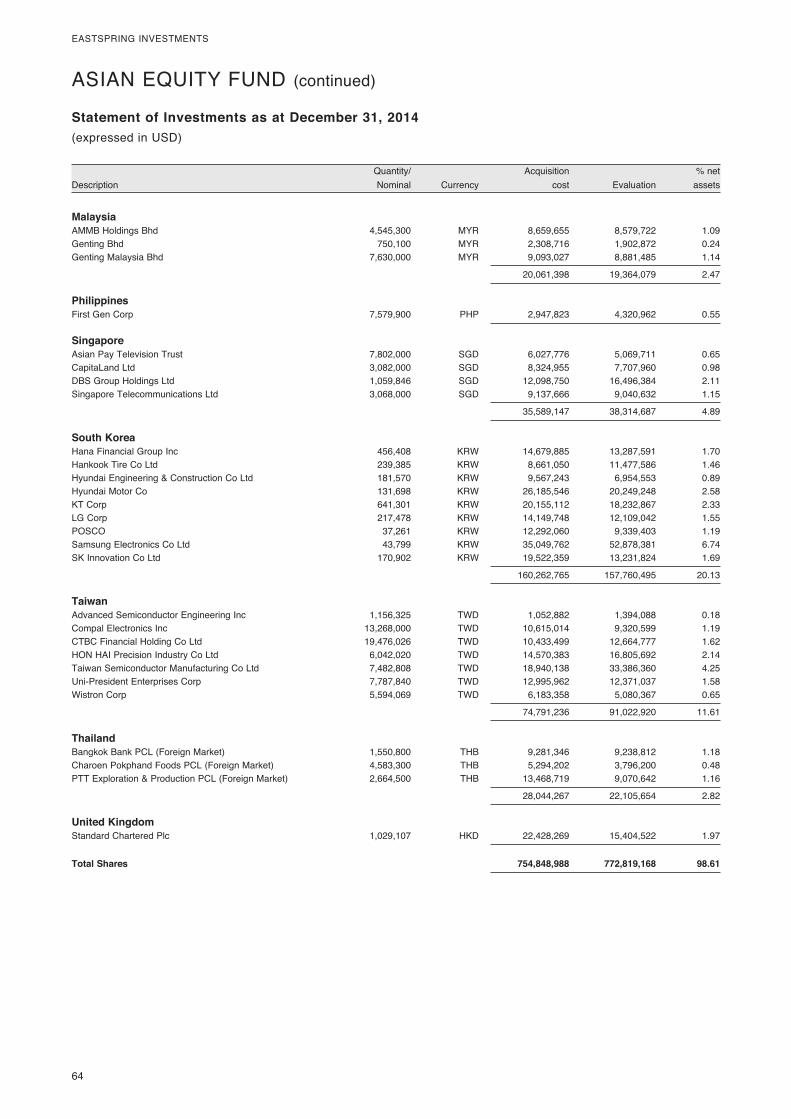
64�
EASTSPRING�INVESTMENTS
� Quantity/�� � Acquisition�� � %�net�Description� Nominal�� Currency�� cost�� Evaluation�� assets�
Statement of Investments as at December 31, 2014(expressed�in�USD)
ASIAN�EQUITY�FUND�(continued)
Malaysia AMMB�Holdings�Bhd� 4,545,300� MYR� 8,659,655� 8,579,722� 1.09Genting�Bhd� 750,100� MYR� 2,308,716� 1,902,872� 0.24Genting�Malaysia�Bhd�� 7,630,000� MYR� 9,093,027� 8,881,485� 1.14
� � � 20,061,398� 19,364,079� 2.47
Philippines First�Gen�Corp�� 7,579,900� PHP� 2,947,823� 4,320,962� 0.55
Singapore Asian�Pay�Television�Trust� 7,802,000� SGD� 6,027,776� 5,069,711� 0.65CapitaLand�Ltd� 3,082,000� SGD� 8,324,955� 7,707,960� 0.98DBS�Group�Holdings�Ltd� 1,059,846� SGD� 12,098,750� 16,496,384� 2.11Singapore�Telecommunications�Ltd�� 3,068,000� SGD� 9,137,666� 9,040,632� 1.15
� � � 35,589,147� 38,314,687� 4.89
South Korea Hana�Financial�Group�Inc� 456,408� KRW� 14,679,885� 13,287,591� 1.70Hankook�Tire�Co�Ltd� 239,385� KRW� 8,661,050� 11,477,586� 1.46Hyundai�Engineering�&�Construction�Co�Ltd� 181,570� KRW� 9,567,243� 6,954,553� 0.89Hyundai�Motor�Co� 131,698� KRW� 26,185,546� 20,249,248� 2.58KT�Corp� 641,301� KRW� 20,155,112� 18,232,867� 2.33LG�Corp� 217,478� KRW� 14,149,748� 12,109,042� 1.55POSCO� 37,261� KRW� 12,292,060� 9,339,403� 1.19Samsung�Electronics�Co�Ltd� 43,799� KRW� 35,049,762� 52,878,381� 6.74SK�Innovation�Co�Ltd�� 170,902� KRW� 19,522,359� 13,231,824� 1.69
� � � 160,262,765� 157,760,495� 20.13
Taiwan Advanced�Semiconductor�Engineering�Inc� 1,156,325� TWD� 1,052,882� 1,394,088� 0.18Compal�Electronics�Inc� 13,268,000� TWD� 10,615,014� 9,320,599� 1.19CTBC�Financial�Holding�Co�Ltd� 19,476,026� TWD� 10,433,499� 12,664,777� 1.62HON�HAI�Precision�Industry�Co�Ltd� 6,042,020� TWD� 14,570,383� 16,805,692� 2.14Taiwan�Semiconductor�Manufacturing�Co�Ltd� 7,482,808� TWD� 18,940,138� 33,386,360� 4.25Uni-President�Enterprises�Corp� 7,787,840� TWD� 12,995,962� 12,371,037� 1.58Wistron�Corp�� 5,594,069� TWD� 6,183,358� 5,080,367� 0.65
� � � 74,791,236� 91,022,920� 11.61
Thailand Bangkok�Bank�PCL�(Foreign�Market)� 1,550,800� THB� 9,281,346� 9,238,812� 1.18Charoen�Pokphand�Foods�PCL�(Foreign�Market)� 4,583,300� THB� 5,294,202� 3,796,200� 0.48PTT�Exploration�&�Production�PCL�(Foreign�Market)�� 2,664,500� THB� 13,468,719� 9,070,642� 1.16
� � � 28,044,267� 22,105,654� 2.82
United Kingdom Standard�Chartered�Plc�� 1,029,107� HKD� 22,428,269� 15,404,522� 1.97
Total Shares 754,848,988 772,819,168 98.61
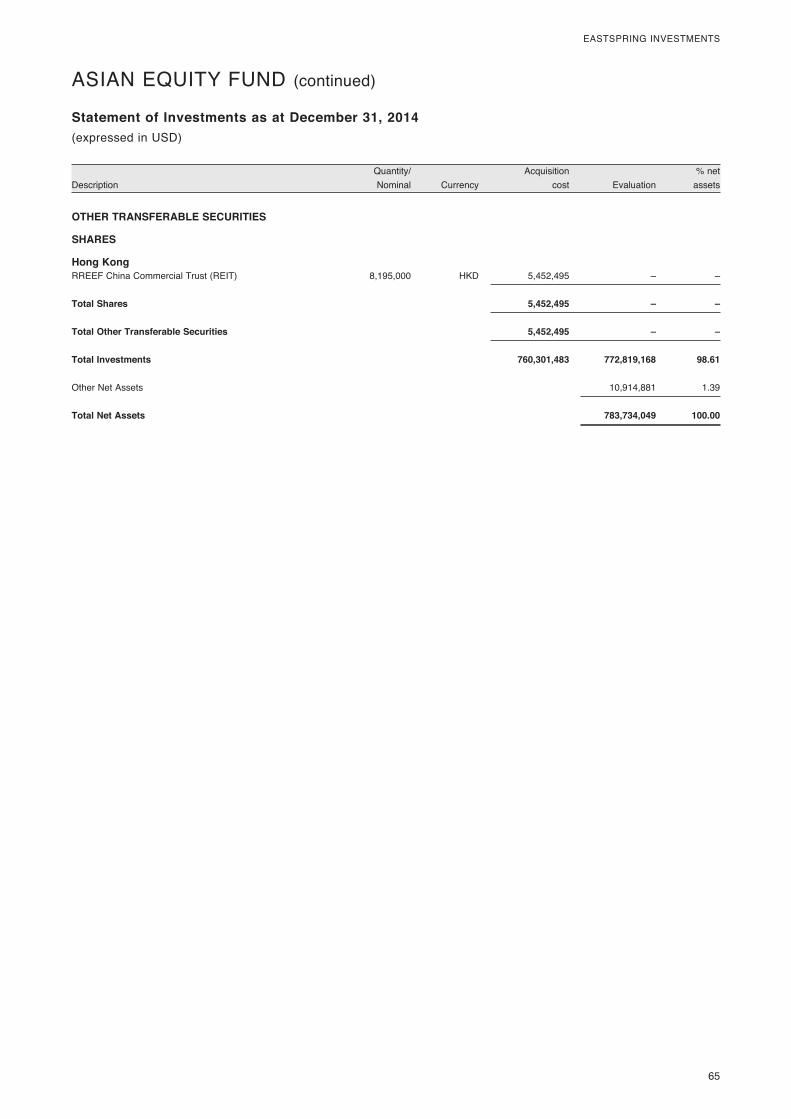
� 65
EASTSPRING�INVESTMENTS
� Quantity/�� � Acquisition�� � %�net�Description� Nominal�� Currency�� cost�� Evaluation�� assets�
Statement of Investments as at December 31, 2014(expressed�in�USD)
OTHER TRANSFERABLE SECURITIES
SHARES
Hong Kong RREEF�China�Commercial�Trust�(REIT)�� 8,195,000� HKD� 5,452,495� –� –
Total Shares 5,452,495 – –
Total Other Transferable Securities 5,452,495 – –
Total Investments 760,301,483 772,819,168 98.61
Other�Net�Assets� � � � 10,914,881� 1.39
Total Net Assets 783,734,049 100.00
ASIAN�EQUITY�FUND�(continued)
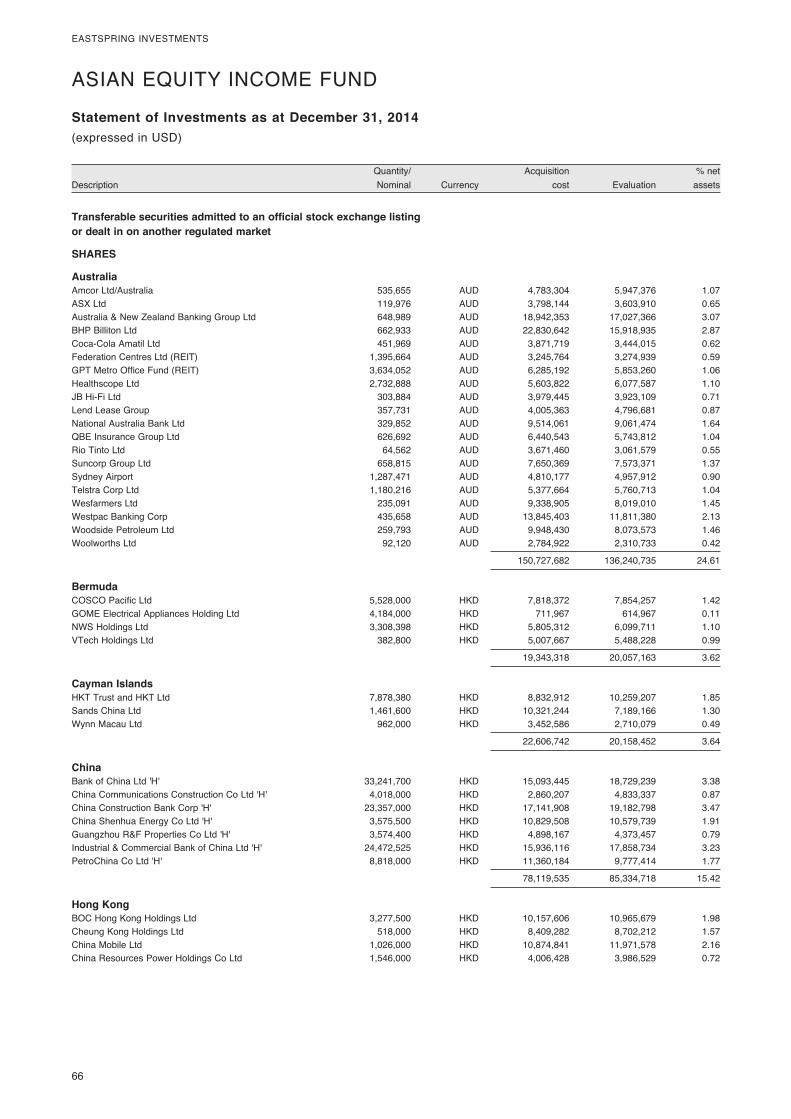
66�
EASTSPRING�INVESTMENTS
� Quantity/�� � Acquisition�� � %�net�Description� Nominal�� Currency�� cost�� Evaluation�� assets�
Statement of Investments as at December 31, 2014(expressed�in�USD)
ASIAN�EQUITY�INCOME�FUND�
Transferable securities admitted to an official stock exchange listing or dealt in on another regulated market
SHARES
Australia Amcor�Ltd/Australia� 535,655� AUD� 4,783,304� 5,947,376� 1.07ASX�Ltd� 119,976� AUD� 3,798,144� 3,603,910� 0.65Australia�&�New�Zealand�Banking�Group�Ltd� 648,989� AUD� 18,942,353� 17,027,366� 3.07BHP�Billiton�Ltd� 662,933� AUD� 22,830,642� 15,918,935� 2.87Coca-Cola�Amatil�Ltd� 451,969� AUD� 3,871,719� 3,444,015� 0.62Federation�Centres�Ltd�(REIT)� 1,395,664� AUD� 3,245,764� 3,274,939� 0.59GPT�Metro�Office�Fund�(REIT)� 3,634,052� AUD� 6,285,192� 5,853,260� 1.06Healthscope�Ltd� 2,732,888� AUD� 5,603,822� 6,077,587� 1.10JB�Hi-Fi�Ltd� 303,884� AUD� 3,979,445� 3,923,109� 0.71Lend�Lease�Group� 357,731� AUD� 4,005,363� 4,796,681� 0.87National�Australia�Bank�Ltd� 329,852� AUD� 9,514,061� 9,061,474� 1.64QBE�Insurance�Group�Ltd� 626,692� AUD� 6,440,543� 5,743,812� 1.04Rio�Tinto�Ltd� 64,562� AUD� 3,671,460� 3,061,579� 0.55Suncorp�Group�Ltd� 658,815� AUD� 7,650,369� 7,573,371� 1.37Sydney�Airport� 1,287,471� AUD� 4,810,177� 4,957,912� 0.90Telstra�Corp�Ltd� 1,180,216� AUD� 5,377,664� 5,760,713� 1.04Wesfarmers�Ltd� 235,091� AUD� 9,338,905� 8,019,010� 1.45Westpac�Banking�Corp� 435,658� AUD� 13,845,403� 11,811,380� 2.13Woodside�Petroleum�Ltd� 259,793� AUD� 9,948,430� 8,073,573� 1.46Woolworths�Ltd�� 92,120� AUD� 2,784,922� 2,310,733� 0.42
� � � 150,727,682� 136,240,735� 24.61
Bermuda COSCO�Pacific�Ltd� 5,528,000� HKD� 7,818,372� 7,854,257� 1.42GOME�Electrical�Appliances�Holding�Ltd� 4,184,000� HKD� 711,967� 614,967� 0.11NWS�Holdings�Ltd� 3,308,398� HKD� 5,805,312� 6,099,711� 1.10VTech�Holdings�Ltd�� 382,800� HKD� 5,007,667� 5,488,228� 0.99
� � � 19,343,318� 20,057,163� 3.62
Cayman Islands HKT�Trust�and�HKT�Ltd� 7,878,380� HKD� 8,832,912� 10,259,207� 1.85Sands�China�Ltd� 1,461,600� HKD� 10,321,244� 7,189,166� 1.30Wynn�Macau�Ltd�� 962,000� HKD� 3,452,586� 2,710,079� 0.49
� � � 22,606,742� 20,158,452� 3.64
China Bank�of�China�Ltd�'H'� 33,241,700� HKD� 15,093,445� 18,729,239� 3.38China�Communications�Construction�Co�Ltd�'H'� 4,018,000� HKD� 2,860,207� 4,833,337� 0.87China�Construction�Bank�Corp�'H'� 23,357,000� HKD� 17,141,908� 19,182,798� 3.47China�Shenhua�Energy�Co�Ltd�'H'� 3,575,500� HKD� 10,829,508� 10,579,739� 1.91Guangzhou�R&F�Properties�Co�Ltd�'H'� 3,574,400� HKD� 4,898,167� 4,373,457� 0.79Industrial�&�Commercial�Bank�of�China�Ltd�'H'� 24,472,525� HKD� 15,936,116� 17,858,734� 3.23PetroChina�Co�Ltd�'H'�� 8,818,000� HKD� 11,360,184� 9,777,414� 1.77
� � � 78,119,535� 85,334,718� 15.42
Hong Kong BOC�Hong�Kong�Holdings�Ltd� 3,277,500� HKD� 10,157,606� 10,965,679� 1.98Cheung�Kong�Holdings�Ltd� 518,000� HKD� 8,409,282� 8,702,212� 1.57China�Mobile�Ltd� 1,026,000� HKD� 10,874,841� 11,971,578� 2.16China�Resources�Power�Holdings�Co�Ltd� 1,546,000� HKD� 4,006,428� 3,986,529� 0.72
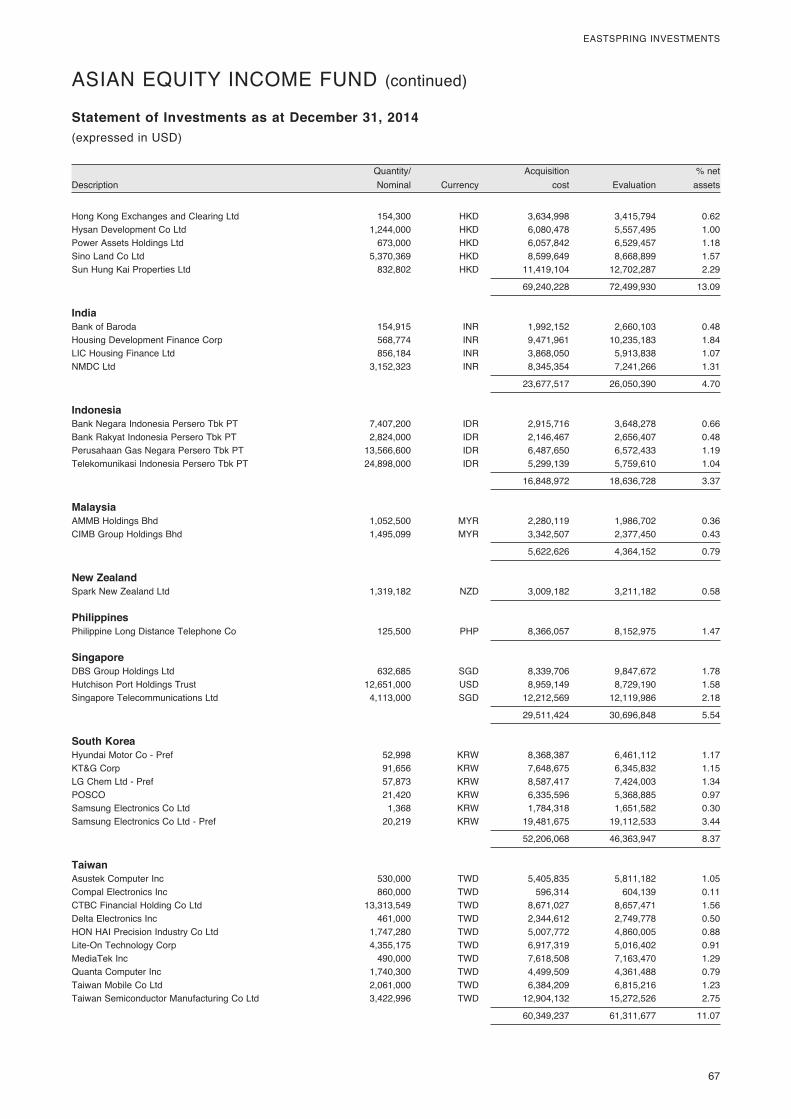
� 67
EASTSPRING�INVESTMENTS
� Quantity/�� � Acquisition�� � %�net�Description� Nominal�� Currency�� cost�� Evaluation�� assets�
Statement of Investments as at December 31, 2014(expressed�in�USD)
Hong�Kong�Exchanges�and�Clearing�Ltd� 154,300� HKD� 3,634,998� 3,415,794� 0.62Hysan�Development�Co�Ltd� 1,244,000� HKD� 6,080,478� 5,557,495� 1.00Power�Assets�Holdings�Ltd� 673,000� HKD� 6,057,842� 6,529,457� 1.18Sino�Land�Co�Ltd� 5,370,369� HKD� 8,599,649� 8,668,899� 1.57Sun�Hung�Kai�Properties�Ltd�� 832,802� HKD� 11,419,104� 12,702,287� 2.29
� � � 69,240,228� 72,499,930� 13.09
India Bank�of�Baroda� 154,915� INR� 1,992,152� 2,660,103� 0.48Housing�Development�Finance�Corp� 568,774� INR� 9,471,961� 10,235,183� 1.84LIC�Housing�Finance�Ltd� 856,184� INR� 3,868,050� 5,913,838� 1.07NMDC�Ltd�� 3,152,323� INR� 8,345,354� 7,241,266� 1.31
� � � 23,677,517� 26,050,390� 4.70
Indonesia Bank�Negara�Indonesia�Persero�Tbk�PT� 7,407,200� IDR� 2,915,716� 3,648,278� 0.66Bank�Rakyat�Indonesia�Persero�Tbk�PT� 2,824,000� IDR� 2,146,467� 2,656,407� 0.48Perusahaan�Gas�Negara�Persero�Tbk�PT� 13,566,600� IDR� 6,487,650� 6,572,433� 1.19Telekomunikasi�Indonesia�Persero�Tbk�PT�� 24,898,000� IDR� 5,299,139� 5,759,610� 1.04
� � � 16,848,972� 18,636,728� 3.37
Malaysia AMMB�Holdings�Bhd� 1,052,500� MYR� 2,280,119� 1,986,702� 0.36CIMB�Group�Holdings�Bhd�� 1,495,099� MYR� 3,342,507� 2,377,450� 0.43
� � � 5,622,626� 4,364,152� 0.79
New Zealand Spark�New�Zealand�Ltd� 1,319,182� NZD� 3,009,182� 3,211,182� 0.58
Philippines Philippine�Long�Distance�Telephone�Co�� 125,500� PHP� 8,366,057� 8,152,975� 1.47
Singapore DBS�Group�Holdings�Ltd� 632,685� SGD� 8,339,706� 9,847,672� 1.78Hutchison�Port�Holdings�Trust� 12,651,000� USD� 8,959,149� 8,729,190� 1.58Singapore�Telecommunications�Ltd�� 4,113,000� SGD� 12,212,569� 12,119,986� 2.18
� � � 29,511,424� 30,696,848� 5.54
South Korea Hyundai�Motor�Co�-�Pref� 52,998� KRW� 8,368,387� 6,461,112� 1.17KT&G�Corp� 91,656� KRW� 7,648,675� 6,345,832� 1.15LG�Chem�Ltd�-�Pref� 57,873� KRW� 8,587,417� 7,424,003� 1.34POSCO� 21,420� KRW� 6,335,596� 5,368,885� 0.97Samsung�Electronics�Co�Ltd� 1,368� KRW� 1,784,318� 1,651,582� 0.30Samsung�Electronics�Co�Ltd�-�Pref�� 20,219� KRW� 19,481,675� 19,112,533� 3.44
� � � 52,206,068� 46,363,947� 8.37
Taiwan Asustek�Computer�Inc� 530,000� TWD� 5,405,835� 5,811,182� 1.05Compal�Electronics�Inc� 860,000� TWD� 596,314� 604,139� 0.11CTBC�Financial�Holding�Co�Ltd� 13,313,549� TWD� 8,671,027� 8,657,471� 1.56Delta�Electronics�Inc� 461,000� TWD� 2,344,612� 2,749,778� 0.50HON�HAI�Precision�Industry�Co�Ltd� 1,747,280� TWD� 5,007,772� 4,860,005� 0.88Lite-On�Technology�Corp� 4,355,175� TWD� 6,917,319� 5,016,402� 0.91MediaTek�Inc� 490,000� TWD� 7,618,508� 7,163,470� 1.29Quanta�Computer�Inc� 1,740,300� TWD� 4,499,509� 4,361,488� 0.79Taiwan�Mobile�Co�Ltd� 2,061,000� TWD� 6,384,209� 6,815,216� 1.23Taiwan�Semiconductor�Manufacturing�Co�Ltd�� 3,422,996� TWD� 12,904,132� 15,272,526� 2.75
� � � 60,349,237� 61,311,677� 11.07
ASIAN�EQUITY�INCOME�FUND�(continued)
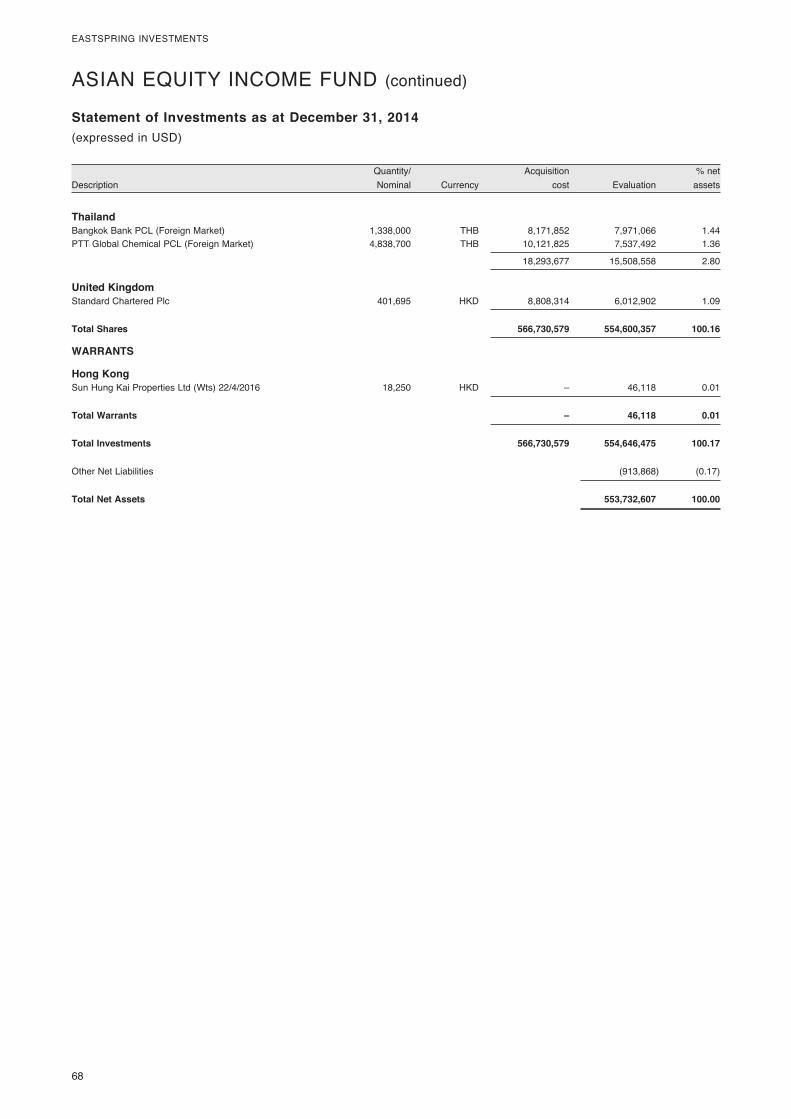
68�
EASTSPRING�INVESTMENTS
� Quantity/�� � Acquisition�� � %�net�Description� Nominal�� Currency�� cost�� Evaluation�� assets�
Statement of Investments as at December 31, 2014(expressed�in�USD)
ASIAN�EQUITY�INCOME�FUND�(continued)
Thailand Bangkok�Bank�PCL�(Foreign�Market)� 1,338,000� THB� 8,171,852� 7,971,066� 1.44PTT�Global�Chemical�PCL�(Foreign�Market)�� 4,838,700� THB� 10,121,825� 7,537,492� 1.36
� � � 18,293,677� 15,508,558� 2.80
United Kingdom Standard�Chartered�Plc�� 401,695� HKD� 8,808,314� 6,012,902� 1.09
Total Shares 566,730,579 554,600,357 100.16
WARRANTS
Hong Kong Sun�Hung�Kai�Properties�Ltd�(Wts)�22/4/2016�� 18,250� HKD� –� 46,118� 0.01
Total Warrants – 46,118 0.01
Total Investments 566,730,579 554,646,475 100.17
Other�Net�Liabilities� � � � (913,868)� (0.17)
Total Net Assets 553,732,607 100.00
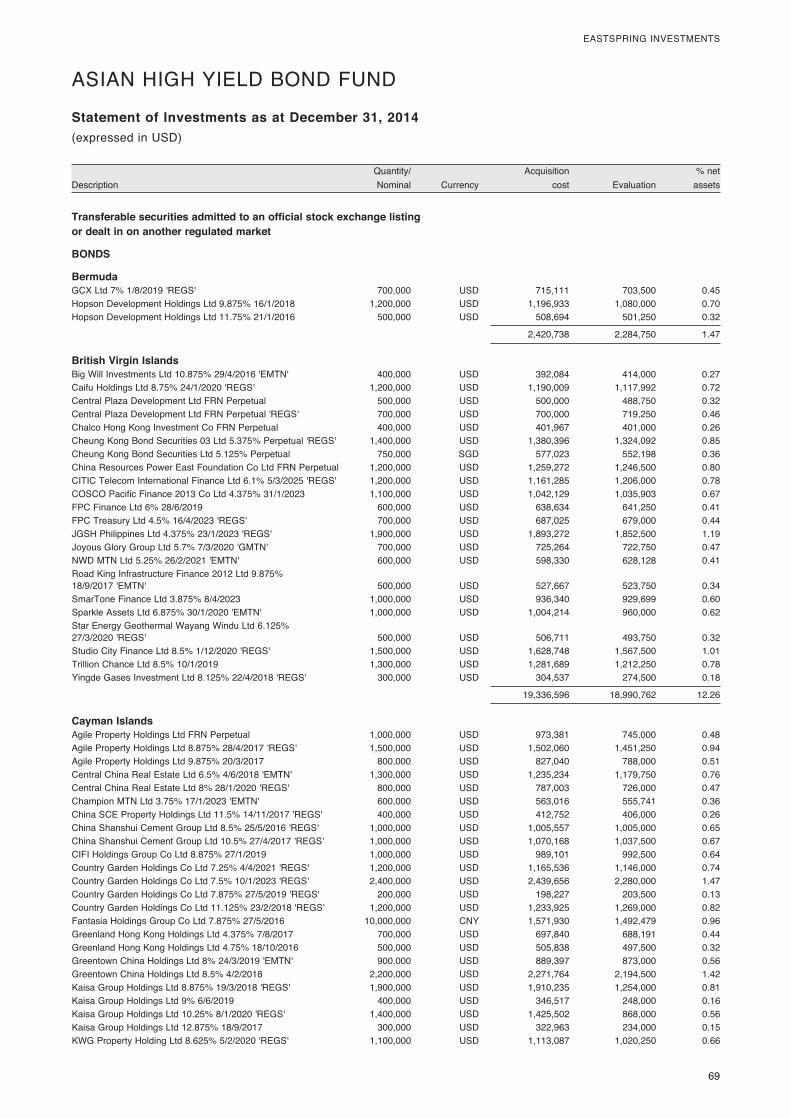
� 69
EASTSPRING�INVESTMENTS
� Quantity/�� � Acquisition�� � %�net�Description� Nominal�� Currency�� cost�� Evaluation�� assets�
Statement of Investments as at December 31, 2014(expressed�in�USD)
ASIAN�HIGH�YIELD�BOND�FUND
Transferable securities admitted to an official stock exchange listing or dealt in on another regulated market
BONDS
Bermuda GCX�Ltd�7%�1/8/2019�'REGS'� 700,000� USD� 715,111� 703,500� 0.45Hopson�Development�Holdings�Ltd�9.875%�16/1/2018�� 1,200,000� USD� 1,196,933� 1,080,000� 0.70Hopson�Development�Holdings�Ltd�11.75%�21/1/2016�� 500,000� USD� 508,694� 501,250� 0.32
� � � 2,420,738� 2,284,750� 1.47
British Virgin Islands Big�Will�Investments�Ltd�10.875%�29/4/2016�'EMTN'� 400,000� USD� 392,084� 414,000� 0.27Caifu�Holdings�Ltd�8.75%�24/1/2020�'REGS'� 1,200,000� USD� 1,190,009� 1,117,992� 0.72Central�Plaza�Development�Ltd�FRN�Perpetual�� 500,000� USD� 500,000� 488,750� 0.32Central�Plaza�Development�Ltd�FRN�Perpetual�'REGS'� 700,000� USD� 700,000� 719,250� 0.46Chalco�Hong�Kong�Investment�Co�FRN�Perpetual�� 400,000� USD� 401,967� 401,000� 0.26Cheung�Kong�Bond�Securities�03�Ltd�5.375%�Perpetual�'REGS'� 1,400,000� USD� 1,380,396� 1,324,092� 0.85Cheung�Kong�Bond�Securities�Ltd�5.125%�Perpetual�� 750,000� SGD� 577,023� 552,198� 0.36China�Resources�Power�East�Foundation�Co�Ltd�FRN�Perpetual�� 1,200,000� USD� 1,259,272� 1,246,500� 0.80CITIC�Telecom�International�Finance�Ltd�6.1%�5/3/2025�'REGS'� 1,200,000� USD� 1,161,285� 1,206,000� 0.78COSCO�Pacific�Finance�2013�Co�Ltd�4.375%�31/1/2023�� 1,100,000� USD� 1,042,129� 1,035,903� 0.67FPC�Finance�Ltd�6%�28/6/2019�� 600,000� USD� 638,634� 641,250� 0.41FPC�Treasury�Ltd�4.5%�16/4/2023�'REGS'� 700,000� USD� 687,025� 679,000� 0.44JGSH�Philippines�Ltd�4.375%�23/1/2023�'REGS'� 1,900,000� USD� 1,893,272� 1,852,500� 1.19Joyous�Glory�Group�Ltd�5.7%�7/3/2020�'GMTN'� 700,000� USD� 725,264� 722,750� 0.47NWD�MTN�Ltd�5.25%�26/2/2021�'EMTN'� 600,000� USD� 598,330� 628,128� 0.41Road�King�Infrastructure�Finance�2012�Ltd�9.875%��18/9/2017�'EMTN'� 500,000� USD� 527,667� 523,750� 0.34SmarTone�Finance�Ltd�3.875%�8/4/2023�� 1,000,000� USD� 936,340� 929,699� 0.60Sparkle�Assets�Ltd�6.875%�30/1/2020�'EMTN'� 1,000,000� USD� 1,004,214� 960,000� 0.62Star�Energy�Geothermal�Wayang�Windu�Ltd�6.125%��27/3/2020�'REGS'� 500,000� USD� 506,711� 493,750� 0.32Studio�City�Finance�Ltd�8.5%�1/12/2020�'REGS'� 1,500,000� USD� 1,628,748� 1,567,500� 1.01Trillion�Chance�Ltd�8.5%�10/1/2019�� 1,300,000� USD� 1,281,689� 1,212,250� 0.78Yingde�Gases�Investment�Ltd�8.125%�22/4/2018�'REGS'� 300,000� USD� 304,537� 274,500� 0.18
� � � 19,336,596� 18,990,762� 12.26
Cayman Islands Agile�Property�Holdings�Ltd�FRN�Perpetual�� 1,000,000� USD� 973,381� 745,000� 0.48Agile�Property�Holdings�Ltd�8.875%�28/4/2017�'REGS'� 1,500,000� USD� 1,502,060� 1,451,250� 0.94Agile�Property�Holdings�Ltd�9.875%�20/3/2017�� 800,000� USD� 827,040� 788,000� 0.51Central�China�Real�Estate�Ltd�6.5%�4/6/2018�'EMTN'� 1,300,000� USD� 1,235,234� 1,179,750� 0.76Central�China�Real�Estate�Ltd�8%�28/1/2020�'REGS'� 800,000� USD� 787,003� 726,000� 0.47Champion�MTN�Ltd�3.75%�17/1/2023�'EMTN'� 600,000� USD� 563,016� 555,741� 0.36China�SCE�Property�Holdings�Ltd�11.5%�14/11/2017�'REGS'� 400,000� USD� 412,752� 406,000� 0.26China�Shanshui�Cement�Group�Ltd�8.5%�25/5/2016�'REGS'� 1,000,000� USD� 1,005,557� 1,005,000� 0.65China�Shanshui�Cement�Group�Ltd�10.5%�27/4/2017�'REGS'� 1,000,000� USD� 1,070,168� 1,037,500� 0.67CIFI�Holdings�Group�Co�Ltd�8.875%�27/1/2019�� 1,000,000� USD� 989,101� 992,500� 0.64Country�Garden�Holdings�Co�Ltd�7.25%�4/4/2021�'REGS'� 1,200,000� USD� 1,165,536� 1,146,000� 0.74Country�Garden�Holdings�Co�Ltd�7.5%�10/1/2023�'REGS'� 2,400,000� USD� 2,439,656� 2,280,000� 1.47Country�Garden�Holdings�Co�Ltd�7.875%�27/5/2019�'REGS'� 200,000� USD� 198,227� 203,500� 0.13Country�Garden�Holdings�Co�Ltd�11.125%�23/2/2018�'REGS'� 1,200,000� USD� 1,233,925� 1,269,000� 0.82Fantasia�Holdings�Group�Co�Ltd�7.875%�27/5/2016�� 10,000,000� CNY� 1,571,930� 1,492,479� 0.96Greenland�Hong�Kong�Holdings�Ltd�4.375%�7/8/2017�� 700,000� USD� 697,840� 688,191� 0.44Greenland�Hong�Kong�Holdings�Ltd�4.75%�18/10/2016�� 500,000� USD� 505,838� 497,500� 0.32Greentown�China�Holdings�Ltd�8%�24/3/2019�'EMTN'� 900,000� USD� 889,397� 873,000� 0.56Greentown�China�Holdings�Ltd�8.5%�4/2/2018�� 2,200,000� USD� 2,271,764� 2,194,500� 1.42Kaisa�Group�Holdings�Ltd�8.875%�19/3/2018�'REGS'� 1,900,000� USD� 1,910,235� 1,254,000� 0.81Kaisa�Group�Holdings�Ltd�9%�6/6/2019�� 400,000� USD� 346,517� 248,000� 0.16Kaisa�Group�Holdings�Ltd�10.25%�8/1/2020�'REGS'� 1,400,000� USD� 1,425,502� 868,000� 0.56Kaisa�Group�Holdings�Ltd�12.875%�18/9/2017�� 300,000� USD� 322,963� 234,000� 0.15KWG�Property�Holding�Ltd�8.625%�5/2/2020�'REGS'� 1,100,000� USD� 1,113,087� 1,020,250� 0.66
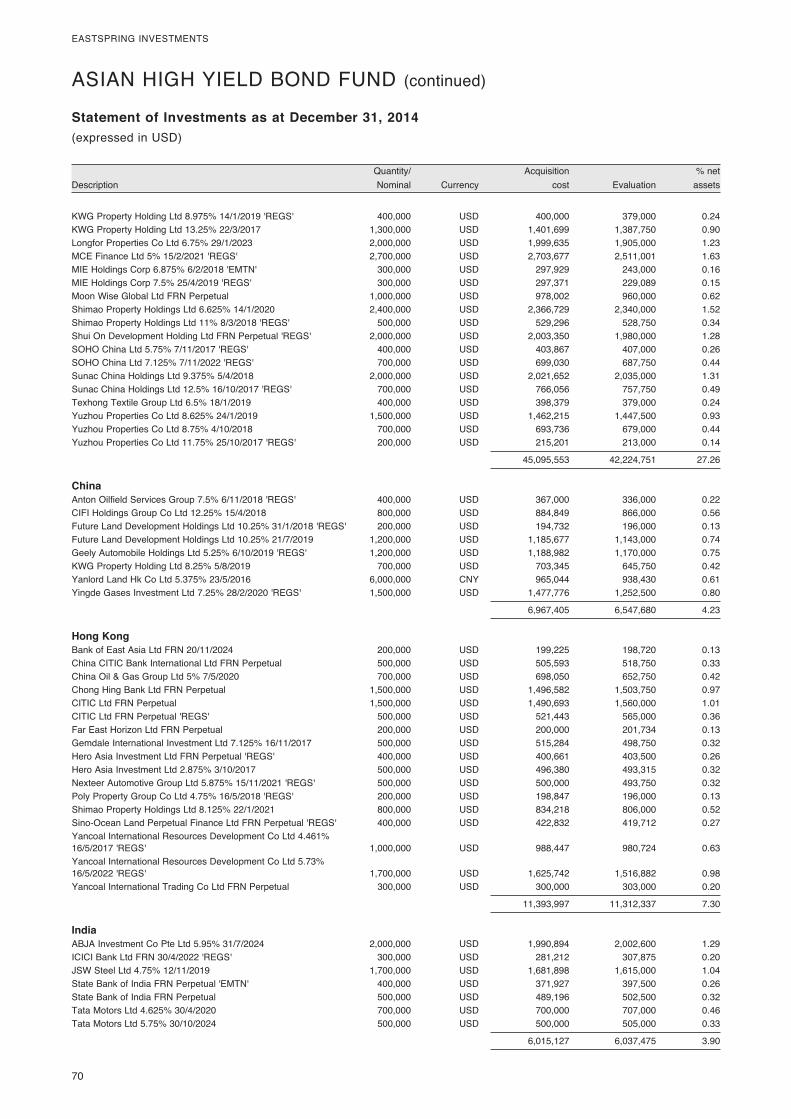
70�
EASTSPRING�INVESTMENTS
� Quantity/�� � Acquisition�� � %�net�Description� Nominal�� Currency�� cost�� Evaluation�� assets�
Statement of Investments as at December 31, 2014(expressed�in�USD)
ASIAN�HIGH�YIELD�BOND�FUND�(continued)
KWG�Property�Holding�Ltd�8.975%�14/1/2019�'REGS'� 400,000� USD� 400,000� 379,000� 0.24KWG�Property�Holding�Ltd�13.25%�22/3/2017�� 1,300,000� USD� 1,401,699� 1,387,750� 0.90Longfor�Properties�Co�Ltd�6.75%�29/1/2023�� 2,000,000� USD� 1,999,635� 1,905,000� 1.23MCE�Finance�Ltd�5%�15/2/2021�'REGS'� 2,700,000� USD� 2,703,677� 2,511,001� 1.63MIE�Holdings�Corp�6.875%�6/2/2018�'EMTN'� 300,000� USD� 297,929� 243,000� 0.16MIE�Holdings�Corp�7.5%�25/4/2019�'REGS'� 300,000� USD� 297,371� 229,089� 0.15Moon�Wise�Global�Ltd�FRN�Perpetual�� 1,000,000� USD� 978,002� 960,000� 0.62Shimao�Property�Holdings�Ltd�6.625%�14/1/2020�� 2,400,000� USD� 2,366,729� 2,340,000� 1.52Shimao�Property�Holdings�Ltd�11%�8/3/2018�'REGS'� 500,000� USD� 529,296� 528,750� 0.34Shui�On�Development�Holding�Ltd�FRN�Perpetual�'REGS'� 2,000,000� USD� 2,003,350� 1,980,000� 1.28SOHO�China�Ltd�5.75%�7/11/2017�'REGS'� 400,000� USD� 403,867� 407,000� 0.26SOHO�China�Ltd�7.125%�7/11/2022�'REGS'� 700,000� USD� 699,030� 687,750� 0.44Sunac�China�Holdings�Ltd�9.375%�5/4/2018�� 2,000,000� USD� 2,021,652� 2,035,000� 1.31Sunac�China�Holdings�Ltd�12.5%�16/10/2017�'REGS'� 700,000� USD� 766,056� 757,750� 0.49Texhong�Textile�Group�Ltd�6.5%�18/1/2019�� 400,000� USD� 398,379� 379,000� 0.24Yuzhou�Properties�Co�Ltd�8.625%�24/1/2019�� 1,500,000� USD� 1,462,215� 1,447,500� 0.93Yuzhou�Properties�Co�Ltd�8.75%�4/10/2018�� 700,000� USD� 693,736� 679,000� 0.44Yuzhou�Properties�Co�Ltd�11.75%�25/10/2017�'REGS'� 200,000� USD� 215,201� 213,000� 0.14
� � � 45,095,553� 42,224,751� 27.26
China Anton�Oilfield�Services�Group�7.5%�6/11/2018�'REGS'� 400,000� USD� 367,000� 336,000� 0.22CIFI�Holdings�Group�Co�Ltd�12.25%�15/4/2018�� 800,000� USD� 884,849� 866,000� 0.56Future�Land�Development�Holdings�Ltd�10.25%�31/1/2018�'REGS'� 200,000� USD� 194,732� 196,000� 0.13Future�Land�Development�Holdings�Ltd�10.25%�21/7/2019�� 1,200,000� USD� 1,185,677� 1,143,000� 0.74Geely�Automobile�Holdings�Ltd�5.25%�6/10/2019�'REGS'� 1,200,000� USD� 1,188,982� 1,170,000� 0.75KWG�Property�Holding�Ltd�8.25%�5/8/2019�� 700,000� USD� 703,345� 645,750� 0.42Yanlord�Land�Hk�Co�Ltd�5.375%�23/5/2016�� 6,000,000� CNY� 965,044� 938,430� 0.61Yingde�Gases�Investment�Ltd�7.25%�28/2/2020�'REGS'� 1,500,000� USD� 1,477,776� 1,252,500� 0.80
� � � 6,967,405� 6,547,680� 4.23
Hong Kong Bank�of�East�Asia�Ltd�FRN�20/11/2024�� 200,000� USD� 199,225� 198,720� 0.13China�CITIC�Bank�International�Ltd�FRN�Perpetual�� 500,000� USD� 505,593� 518,750� 0.33China�Oil�&�Gas�Group�Ltd�5%�7/5/2020�� 700,000� USD� 698,050� 652,750� 0.42Chong�Hing�Bank�Ltd�FRN�Perpetual�� 1,500,000� USD� 1,496,582� 1,503,750� 0.97CITIC�Ltd�FRN�Perpetual�� 1,500,000� USD� 1,490,693� 1,560,000� 1.01CITIC�Ltd�FRN�Perpetual�'REGS'� 500,000� USD� 521,443� 565,000� 0.36Far�East�Horizon�Ltd�FRN�Perpetual�� 200,000� USD� 200,000� 201,734� 0.13Gemdale�International�Investment�Ltd�7.125%�16/11/2017�� 500,000� USD� 515,284� 498,750� 0.32Hero�Asia�Investment�Ltd�FRN�Perpetual�'REGS'� 400,000� USD� 400,661� 403,500� 0.26Hero�Asia�Investment�Ltd�2.875%�3/10/2017�� 500,000� USD� 496,380� 493,315� 0.32Nexteer�Automotive�Group�Ltd�5.875%�15/11/2021�'REGS'� 500,000� USD� 500,000� 493,750� 0.32Poly�Property�Group�Co�Ltd�4.75%�16/5/2018�'REGS'� 200,000� USD� 198,847� 196,000� 0.13Shimao�Property�Holdings�Ltd�8.125%�22/1/2021�� 800,000� USD� 834,218� 806,000� 0.52Sino-Ocean�Land�Perpetual�Finance�Ltd�FRN�Perpetual�'REGS'� 400,000� USD� 422,832� 419,712� 0.27Yancoal�International�Resources�Development�Co�Ltd�4.461%��16/5/2017�'REGS'� 1,000,000� USD� 988,447� 980,724� 0.63Yancoal�International�Resources�Development�Co�Ltd�5.73%��16/5/2022�'REGS'� 1,700,000� USD� 1,625,742� 1,516,882� 0.98Yancoal�International�Trading�Co�Ltd�FRN�Perpetual�� 300,000� USD� 300,000� 303,000� 0.20
� � � 11,393,997� 11,312,337� 7.30
India ABJA�Investment�Co�Pte�Ltd�5.95%�31/7/2024�� 2,000,000� USD� 1,990,894� 2,002,600� 1.29ICICI�Bank�Ltd�FRN�30/4/2022�'REGS'� 300,000� USD� 281,212� 307,875� 0.20JSW�Steel�Ltd�4.75%�12/11/2019�� 1,700,000� USD� 1,681,898� 1,615,000� 1.04State�Bank�of�India�FRN�Perpetual�'EMTN'� 400,000� USD� 371,927� 397,500� 0.26State�Bank�of�India�FRN�Perpetual�� 500,000� USD� 489,196� 502,500� 0.32Tata�Motors�Ltd�4.625%�30/4/2020�� 700,000� USD� 700,000� 707,000� 0.46Tata�Motors�Ltd�5.75%�30/10/2024�� 500,000� USD� 500,000� 505,000� 0.33
� � � 6,015,127� 6,037,475� 3.90
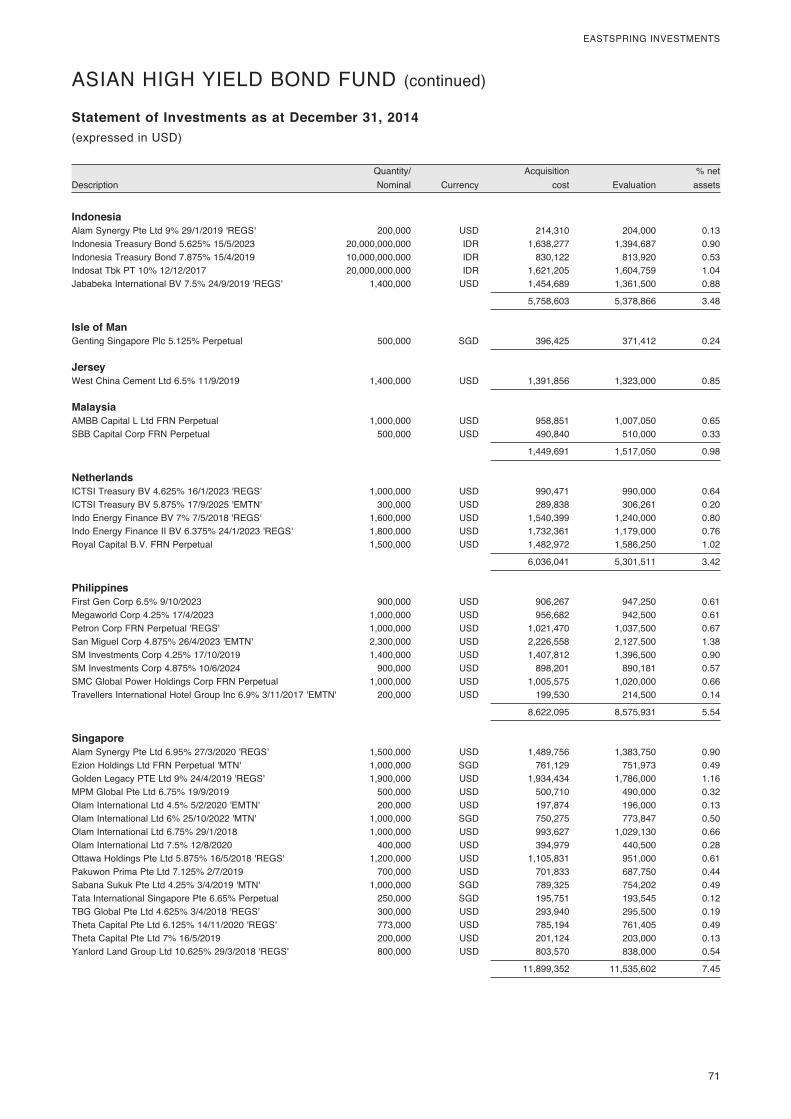
� 71
EASTSPRING�INVESTMENTS
� Quantity/�� � Acquisition�� � %�net�Description� Nominal�� Currency�� cost�� Evaluation�� assets�
Statement of Investments as at December 31, 2014(expressed�in�USD)
ASIAN�HIGH�YIELD�BOND�FUND�(continued)
Indonesia Alam�Synergy�Pte�Ltd�9%�29/1/2019�'REGS'� 200,000� USD� 214,310� 204,000� 0.13Indonesia�Treasury�Bond�5.625%�15/5/2023�� 20,000,000,000� IDR� 1,638,277� 1,394,687� 0.90Indonesia�Treasury�Bond�7.875%�15/4/2019�� 10,000,000,000� IDR� 830,122� 813,920� 0.53Indosat�Tbk�PT�10%�12/12/2017�� 20,000,000,000� IDR� 1,621,205� 1,604,759� 1.04Jababeka�International�BV�7.5%�24/9/2019�'REGS'� 1,400,000� USD� 1,454,689� 1,361,500� 0.88
� � � 5,758,603� 5,378,866� 3.48
Isle of Man Genting�Singapore�Plc�5.125%�Perpetual�� 500,000� SGD� 396,425� 371,412� 0.24
Jersey West�China�Cement�Ltd�6.5%�11/9/2019�� 1,400,000� USD� 1,391,856� 1,323,000� 0.85
Malaysia AMBB�Capital�L�Ltd�FRN�Perpetual�� 1,000,000� USD� 958,851� 1,007,050� 0.65SBB�Capital�Corp�FRN�Perpetual�� 500,000� USD� 490,840� 510,000� 0.33
� � � 1,449,691� 1,517,050� 0.98
Netherlands ICTSI�Treasury�BV�4.625%�16/1/2023�'REGS'� 1,000,000� USD� 990,471� 990,000� 0.64ICTSI�Treasury�BV�5.875%�17/9/2025�'EMTN'� 300,000� USD� 289,838� 306,261� 0.20Indo�Energy�Finance�BV�7%�7/5/2018�'REGS'� 1,600,000� USD� 1,540,399� 1,240,000� 0.80Indo�Energy�Finance�II�BV�6.375%�24/1/2023�'REGS'� 1,800,000� USD� 1,732,361� 1,179,000� 0.76Royal�Capital�B.V.�FRN�Perpetual�� 1,500,000� USD� 1,482,972� 1,586,250� 1.02
� � � 6,036,041� 5,301,511� 3.42
Philippines First�Gen�Corp�6.5%�9/10/2023�� 900,000� USD� 906,267� 947,250� 0.61Megaworld�Corp�4.25%�17/4/2023�� 1,000,000� USD� 956,682� 942,500� 0.61Petron�Corp�FRN�Perpetual�'REGS'� 1,000,000� USD� 1,021,470� 1,037,500� 0.67San�Miguel�Corp�4.875%�26/4/2023�'EMTN'� 2,300,000� USD� 2,226,558� 2,127,500� 1.38SM�Investments�Corp�4.25%�17/10/2019�� 1,400,000� USD� 1,407,812� 1,396,500� 0.90SM�Investments�Corp�4.875%�10/6/2024�� 900,000� USD� 898,201� 890,181� 0.57SMC�Global�Power�Holdings�Corp�FRN�Perpetual�� 1,000,000� USD� 1,005,575� 1,020,000� 0.66Travellers�International�Hotel�Group�Inc�6.9%�3/11/2017�'EMTN'� 200,000� USD� 199,530� 214,500� 0.14
� � � 8,622,095� 8,575,931� 5.54
Singapore Alam�Synergy�Pte�Ltd�6.95%�27/3/2020�'REGS'� 1,500,000� USD� 1,489,756� 1,383,750� 0.90Ezion�Holdings�Ltd�FRN�Perpetual�'MTN'� 1,000,000� SGD� 761,129� 751,973� 0.49Golden�Legacy�PTE�Ltd�9%�24/4/2019�'REGS'� 1,900,000� USD� 1,934,434� 1,786,000� 1.16MPM�Global�Pte�Ltd�6.75%�19/9/2019�� 500,000� USD� 500,710� 490,000� 0.32Olam�International�Ltd�4.5%�5/2/2020�'EMTN'� 200,000� USD� 197,874� 196,000� 0.13Olam�International�Ltd�6%�25/10/2022�'MTN'� 1,000,000� SGD� 750,275� 773,847� 0.50Olam�International�Ltd�6.75%�29/1/2018�� 1,000,000� USD� 993,627� 1,029,130� 0.66Olam�International�Ltd�7.5%�12/8/2020�� 400,000� USD� 394,979� 440,500� 0.28Ottawa�Holdings�Pte�Ltd�5.875%�16/5/2018�'REGS'� 1,200,000� USD� 1,105,831� 951,000� 0.61Pakuwon�Prima�Pte�Ltd�7.125%�2/7/2019�� 700,000� USD� 701,833� 687,750� 0.44Sabana�Sukuk�Pte�Ltd�4.25%�3/4/2019�'MTN'� 1,000,000� SGD� 789,325� 754,202� 0.49Tata�International�Singapore�Pte�6.65%�Perpetual�� 250,000� SGD� 195,751� 193,545� 0.12TBG�Global�Pte�Ltd�4.625%�3/4/2018�'REGS'� 300,000� USD� 293,940� 295,500� 0.19Theta�Capital�Pte�Ltd�6.125%�14/11/2020�'REGS'� 773,000� USD� 785,194� 761,405� 0.49Theta�Capital�Pte�Ltd�7%�16/5/2019�� 200,000� USD� 201,124� 203,000� 0.13Yanlord�Land�Group�Ltd�10.625%�29/3/2018�'REGS'� 800,000� USD� 803,570� 838,000� 0.54
� � � 11,899,352� 11,535,602� 7.45
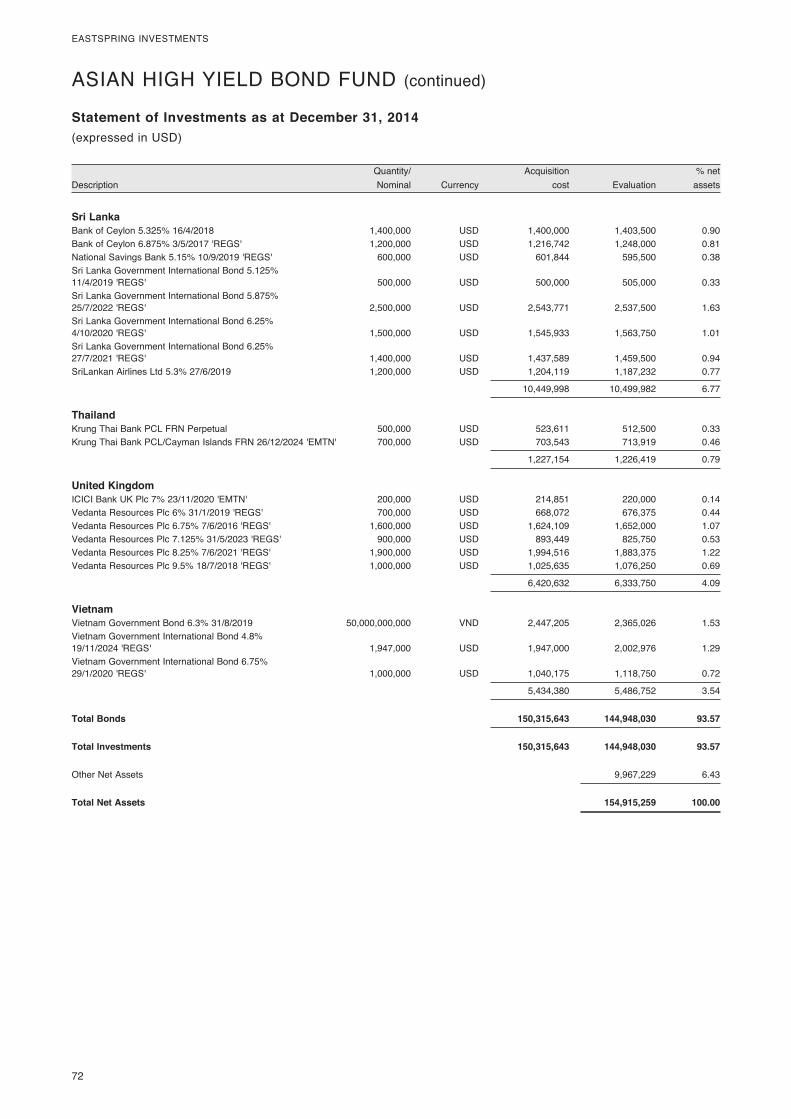
72�
EASTSPRING�INVESTMENTS
� Quantity/�� � Acquisition�� � %�net�Description� Nominal�� Currency�� cost�� Evaluation�� assets�
Statement of Investments as at December 31, 2014(expressed�in�USD)
Sri Lanka Bank�of�Ceylon�5.325%�16/4/2018�� 1,400,000� USD� 1,400,000� 1,403,500� 0.90Bank�of�Ceylon�6.875%�3/5/2017�'REGS'� 1,200,000� USD� 1,216,742� 1,248,000� 0.81National�Savings�Bank�5.15%�10/9/2019�'REGS'� 600,000� USD� 601,844� 595,500� 0.38Sri�Lanka�Government�International�Bond�5.125%��11/4/2019�'REGS'� 500,000� USD� 500,000� 505,000� 0.33Sri�Lanka�Government�International�Bond�5.875%��25/7/2022�'REGS'� 2,500,000� USD� 2,543,771� 2,537,500� 1.63Sri�Lanka�Government�International�Bond�6.25%��4/10/2020�'REGS'� 1,500,000� USD� 1,545,933� 1,563,750� 1.01Sri�Lanka�Government�International�Bond�6.25%��27/7/2021�'REGS'� 1,400,000� USD� 1,437,589� 1,459,500� 0.94SriLankan�Airlines�Ltd�5.3%�27/6/2019�� 1,200,000� USD� 1,204,119� 1,187,232� 0.77
� � � 10,449,998� 10,499,982� 6.77
Thailand Krung�Thai�Bank�PCL�FRN�Perpetual�� 500,000� USD� 523,611� 512,500� 0.33Krung�Thai�Bank�PCL/Cayman�Islands�FRN�26/12/2024�'EMTN'� 700,000� USD� 703,543� 713,919� 0.46
� � � 1,227,154� 1,226,419� 0.79
United Kingdom ICICI�Bank�UK�Plc�7%�23/11/2020�'EMTN'� 200,000� USD� 214,851� 220,000� 0.14Vedanta�Resources�Plc�6%�31/1/2019�'REGS'� 700,000� USD� 668,072� 676,375� 0.44Vedanta�Resources�Plc�6.75%�7/6/2016�'REGS'� 1,600,000� USD� 1,624,109� 1,652,000� 1.07Vedanta�Resources�Plc�7.125%�31/5/2023�'REGS'� 900,000� USD� 893,449� 825,750� 0.53Vedanta�Resources�Plc�8.25%�7/6/2021�'REGS'� 1,900,000� USD� 1,994,516� 1,883,375� 1.22Vedanta�Resources�Plc�9.5%�18/7/2018�'REGS'� 1,000,000� USD� 1,025,635� 1,076,250� 0.69
� � � 6,420,632� 6,333,750� 4.09
Vietnam Vietnam�Government�Bond�6.3%�31/8/2019�� 50,000,000,000� VND� 2,447,205� 2,365,026� 1.53Vietnam�Government�International�Bond�4.8%��19/11/2024�'REGS'� 1,947,000� USD� 1,947,000� 2,002,976� 1.29Vietnam�Government�International�Bond�6.75%��29/1/2020�'REGS'� 1,000,000� USD� 1,040,175� 1,118,750� 0.72
� � � 5,434,380� 5,486,752� 3.54
Total Bonds 150,315,643 144,948,030 93.57
Total Investments 150,315,643 144,948,030 93.57
Other�Net�Assets� � � � 9,967,229� 6.43
Total Net Assets 154,915,259 100.00
ASIAN�HIGH�YIELD�BOND�FUND�(continued)
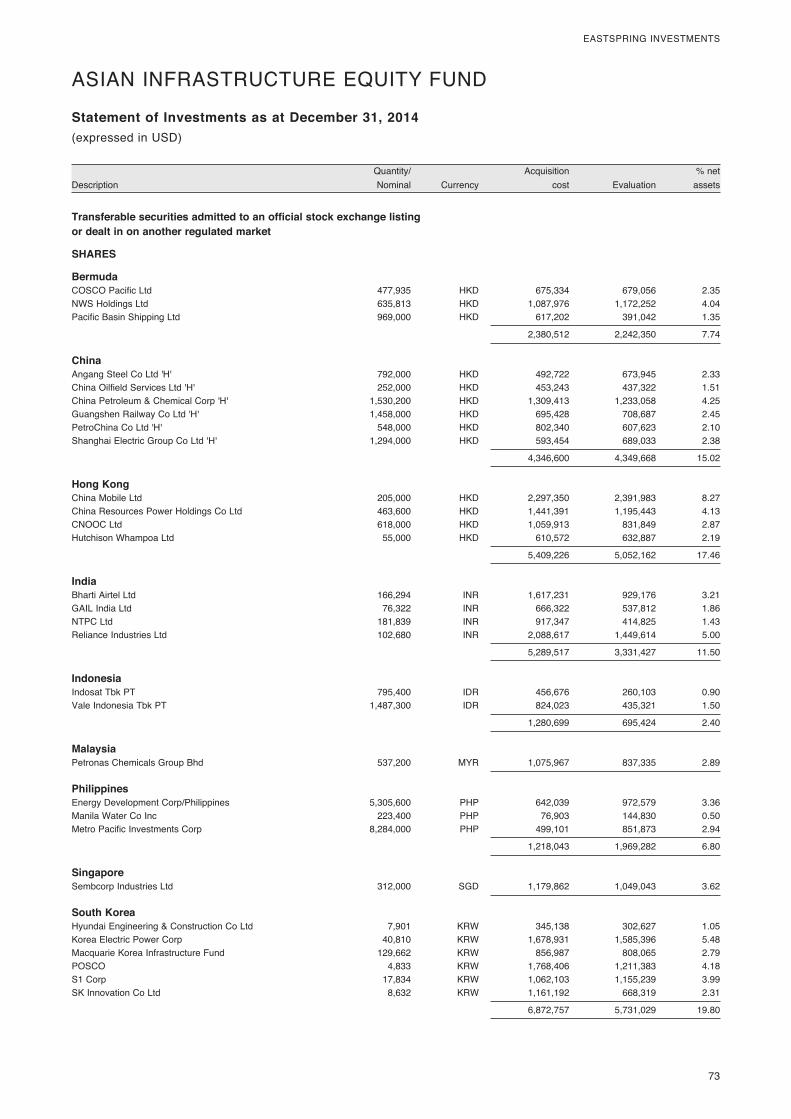
� 73
EASTSPRING�INVESTMENTS
� Quantity/�� � Acquisition�� � %�net�Description� Nominal�� Currency�� cost�� Evaluation�� assets�
Statement of Investments as at December 31, 2014(expressed�in�USD)
ASIAN�INFRASTRUCTURE�EQUITY�FUND�
Transferable securities admitted to an official stock exchange listing or dealt in on another regulated market
SHARES
Bermuda COSCO�Pacific�Ltd� 477,935� HKD� 675,334� 679,056� 2.35NWS�Holdings�Ltd� 635,813� HKD� 1,087,976� 1,172,252� 4.04Pacific�Basin�Shipping�Ltd�� 969,000� HKD� 617,202� 391,042� 1.35
� � � 2,380,512� 2,242,350� 7.74
China Angang�Steel�Co�Ltd�'H'� 792,000� HKD� 492,722� 673,945� 2.33China�Oilfield�Services�Ltd�'H'� 252,000� HKD� 453,243� 437,322� 1.51China�Petroleum�&�Chemical�Corp�'H'� 1,530,200� HKD� 1,309,413� 1,233,058� 4.25Guangshen�Railway�Co�Ltd�'H'� 1,458,000� HKD� 695,428� 708,687� 2.45PetroChina�Co�Ltd�'H'� 548,000� HKD� 802,340� 607,623� 2.10Shanghai�Electric�Group�Co�Ltd�'H'�� 1,294,000� HKD� 593,454� 689,033� 2.38
� � � 4,346,600� 4,349,668� 15.02
Hong Kong China�Mobile�Ltd� 205,000� HKD� 2,297,350� 2,391,983� 8.27China�Resources�Power�Holdings�Co�Ltd� 463,600� HKD� 1,441,391� 1,195,443� 4.13CNOOC�Ltd� 618,000� HKD� 1,059,913� 831,849� 2.87Hutchison�Whampoa�Ltd�� 55,000� HKD� 610,572� 632,887� 2.19
� � � 5,409,226� 5,052,162� 17.46
India Bharti�Airtel�Ltd� 166,294� INR� 1,617,231� 929,176� 3.21GAIL�India�Ltd� 76,322� INR� 666,322� 537,812� 1.86NTPC�Ltd� 181,839� INR� 917,347� 414,825� 1.43Reliance�Industries�Ltd�� 102,680� INR� 2,088,617� 1,449,614� 5.00
� � � 5,289,517� 3,331,427� 11.50
Indonesia Indosat�Tbk�PT� 795,400� IDR� 456,676� 260,103� 0.90Vale�Indonesia�Tbk�PT�� 1,487,300� IDR� 824,023� 435,321� 1.50
� � � 1,280,699� 695,424� 2.40
Malaysia Petronas�Chemicals�Group�Bhd�� 537,200� MYR� 1,075,967� 837,335� 2.89
Philippines Energy�Development�Corp/Philippines� 5,305,600� PHP� 642,039� 972,579� 3.36Manila�Water�Co�Inc� 223,400� PHP� 76,903� 144,830� 0.50Metro�Pacific�Investments�Corp�� 8,284,000� PHP� 499,101� 851,873� 2.94
� � � 1,218,043� 1,969,282� 6.80
Singapore Sembcorp�Industries�Ltd�� 312,000� SGD� 1,179,862� 1,049,043� 3.62
South Korea Hyundai�Engineering�&�Construction�Co�Ltd� 7,901� KRW� 345,138� 302,627� 1.05Korea�Electric�Power�Corp� 40,810� KRW� 1,678,931� 1,585,396� 5.48Macquarie�Korea�Infrastructure�Fund� 129,662� KRW� 856,987� 808,065� 2.79POSCO� 4,833� KRW� 1,768,406� 1,211,383� 4.18S1�Corp� 17,834� KRW� 1,062,103� 1,155,239� 3.99SK�Innovation�Co�Ltd�� 8,632� KRW� 1,161,192� 668,319� 2.31
� � � 6,872,757� 5,731,029� 19.80
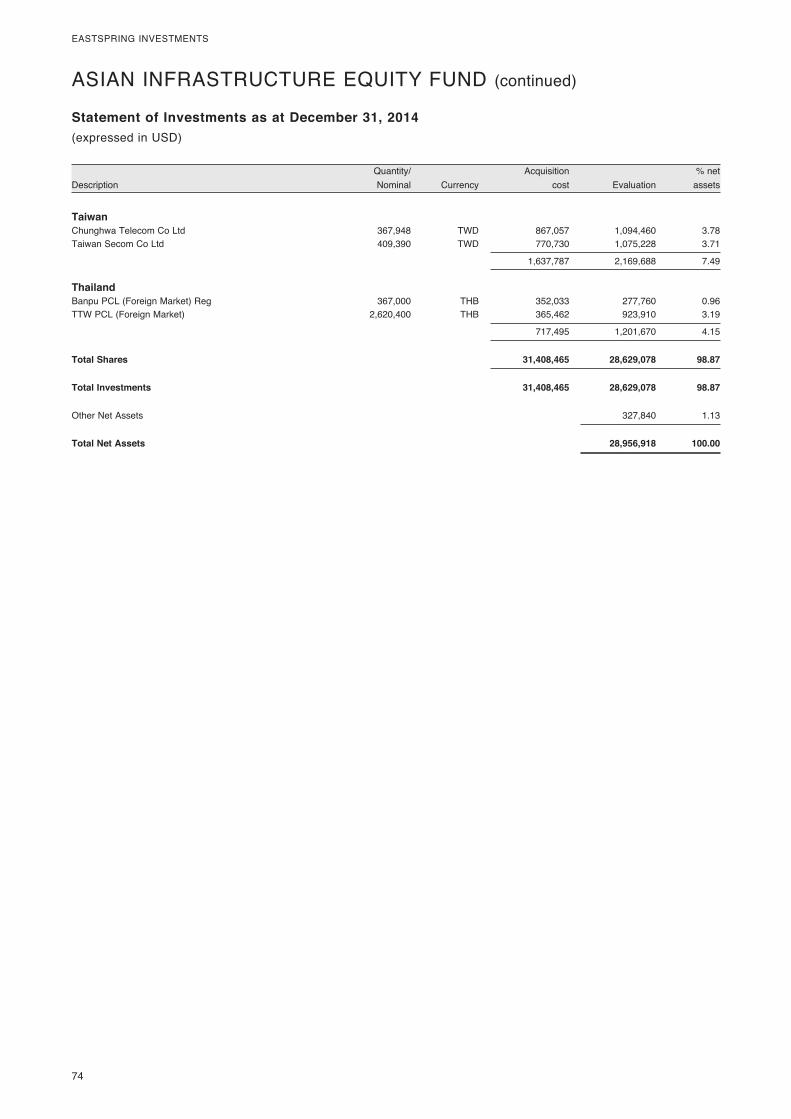
74�
EASTSPRING�INVESTMENTS
� Quantity/�� � Acquisition�� � %�net�Description� Nominal�� Currency�� cost�� Evaluation�� assets�
Statement of Investments as at December 31, 2014(expressed�in�USD)
ASIAN�INFRASTRUCTURE�EQUITY�FUND�(continued)
Taiwan Chunghwa�Telecom�Co�Ltd� 367,948� TWD� 867,057� 1,094,460� 3.78Taiwan�Secom�Co�Ltd�� 409,390� TWD� 770,730� 1,075,228� 3.71
� � � 1,637,787� 2,169,688� 7.49
Thailand Banpu�PCL�(Foreign�Market)�Reg� 367,000� THB� 352,033� 277,760� 0.96TTW�PCL�(Foreign�Market)�� 2,620,400� THB� 365,462� 923,910� 3.19
� � � 717,495� 1,201,670� 4.15
Total Shares 31,408,465 28,629,078 98.87
Total Investments 31,408,465 28,629,078 98.87
Other�Net�Assets� � � � 327,840� 1.13
Total Net Assets 28,956,918 100.00
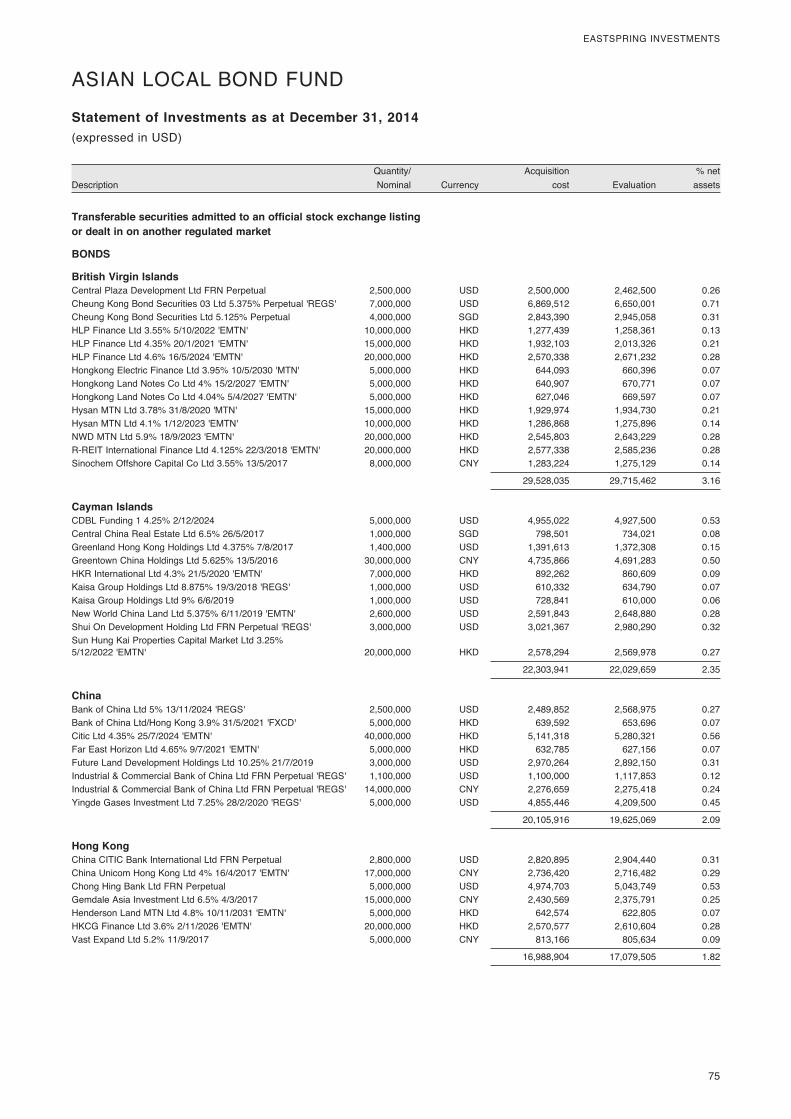
� 75
EASTSPRING�INVESTMENTS
� Quantity/�� � Acquisition�� � %�net�Description� Nominal�� Currency�� cost�� Evaluation�� assets�
Statement of Investments as at December 31, 2014(expressed�in�USD)
ASIAN�LOCAL�BOND�FUND
Transferable securities admitted to an official stock exchange listing or dealt in on another regulated market
BONDS
British Virgin Islands Central�Plaza�Development�Ltd�FRN�Perpetual�� 2,500,000� USD� 2,500,000� 2,462,500� 0.26Cheung�Kong�Bond�Securities�03�Ltd�5.375%�Perpetual�'REGS'� 7,000,000� USD� 6,869,512� 6,650,001� 0.71Cheung�Kong�Bond�Securities�Ltd�5.125%�Perpetual�� 4,000,000� SGD� 2,843,390� 2,945,058� 0.31HLP�Finance�Ltd�3.55%�5/10/2022�'EMTN'� 10,000,000� HKD� 1,277,439� 1,258,361� 0.13HLP�Finance�Ltd�4.35%�20/1/2021�'EMTN'� 15,000,000� HKD� 1,932,103� 2,013,326� 0.21HLP�Finance�Ltd�4.6%�16/5/2024�'EMTN'� 20,000,000� HKD� 2,570,338� 2,671,232� 0.28Hongkong�Electric�Finance�Ltd�3.95%�10/5/2030�'MTN'� 5,000,000� HKD� 644,093� 660,396� 0.07Hongkong�Land�Notes�Co�Ltd�4%�15/2/2027�'EMTN'� 5,000,000� HKD� 640,907� 670,771� 0.07Hongkong�Land�Notes�Co�Ltd�4.04%�5/4/2027�'EMTN'� 5,000,000� HKD� 627,046� 669,597� 0.07Hysan�MTN�Ltd�3.78%�31/8/2020�'MTN'� 15,000,000� HKD� 1,929,974� 1,934,730� 0.21Hysan�MTN�Ltd�4.1%�1/12/2023�'EMTN'� 10,000,000� HKD� 1,286,868� 1,275,896� 0.14NWD�MTN�Ltd�5.9%�18/9/2023�'EMTN'� 20,000,000� HKD� 2,545,803� 2,643,229� 0.28R-REIT�International�Finance�Ltd�4.125%�22/3/2018�'EMTN'� 20,000,000� HKD� 2,577,338� 2,585,236� 0.28Sinochem�Offshore�Capital�Co�Ltd�3.55%�13/5/2017�� 8,000,000� CNY� 1,283,224� 1,275,129� 0.14
� � � 29,528,035� 29,715,462� 3.16
Cayman Islands CDBL�Funding�1�4.25%�2/12/2024�� 5,000,000� USD� 4,955,022� 4,927,500� 0.53Central�China�Real�Estate�Ltd�6.5%�26/5/2017�� 1,000,000� SGD� 798,501� 734,021� 0.08Greenland�Hong�Kong�Holdings�Ltd�4.375%�7/8/2017�� 1,400,000� USD� 1,391,613� 1,372,308� 0.15Greentown�China�Holdings�Ltd�5.625%�13/5/2016�� 30,000,000� CNY� 4,735,866� 4,691,283� 0.50HKR�International�Ltd�4.3%�21/5/2020�'EMTN'� 7,000,000� HKD� 892,262� 860,609� 0.09Kaisa�Group�Holdings�Ltd�8.875%�19/3/2018�'REGS'� 1,000,000� USD� 610,332� 634,790� 0.07Kaisa�Group�Holdings�Ltd�9%�6/6/2019�� 1,000,000� USD� 728,841� 610,000� 0.06New�World�China�Land�Ltd�5.375%�6/11/2019�'EMTN'� 2,600,000� USD� 2,591,843� 2,648,880� 0.28Shui�On�Development�Holding�Ltd�FRN�Perpetual�'REGS'� 3,000,000� USD� 3,021,367� 2,980,290� 0.32Sun�Hung�Kai�Properties�Capital�Market�Ltd�3.25%��5/12/2022�'EMTN'� 20,000,000� HKD� 2,578,294� 2,569,978� 0.27
� � � 22,303,941� 22,029,659� 2.35
China Bank�of�China�Ltd�5%�13/11/2024�'REGS'� 2,500,000� USD� 2,489,852� 2,568,975� 0.27Bank�of�China�Ltd/Hong�Kong�3.9%�31/5/2021�'FXCD'� 5,000,000� HKD� 639,592� 653,696� 0.07Citic�Ltd�4.35%�25/7/2024�'EMTN'� 40,000,000� HKD� 5,141,318� 5,280,321� 0.56Far�East�Horizon�Ltd�4.65%�9/7/2021�'EMTN'� 5,000,000� HKD� 632,785� 627,156� 0.07Future�Land�Development�Holdings�Ltd�10.25%�21/7/2019�� 3,000,000� USD� 2,970,264� 2,892,150� 0.31Industrial�&�Commercial�Bank�of�China�Ltd�FRN�Perpetual�'REGS'� 1,100,000� USD� 1,100,000� 1,117,853� 0.12Industrial�&�Commercial�Bank�of�China�Ltd�FRN�Perpetual�'REGS'� 14,000,000� CNY� 2,276,659� 2,275,418� 0.24Yingde�Gases�Investment�Ltd�7.25%�28/2/2020�'REGS'� 5,000,000� USD� 4,855,446� 4,209,500� 0.45
� � � 20,105,916� 19,625,069� 2.09
Hong Kong China�CITIC�Bank�International�Ltd�FRN�Perpetual�� 2,800,000� USD� 2,820,895� 2,904,440� 0.31China�Unicom�Hong�Kong�Ltd�4%�16/4/2017�'EMTN'� 17,000,000� CNY� 2,736,420� 2,716,482� 0.29Chong�Hing�Bank�Ltd�FRN�Perpetual�� 5,000,000� USD� 4,974,703� 5,043,749� 0.53Gemdale�Asia�Investment�Ltd�6.5%�4/3/2017�� 15,000,000� CNY� 2,430,569� 2,375,791� 0.25Henderson�Land�MTN�Ltd�4.8%�10/11/2031�'EMTN'� 5,000,000� HKD� 642,574� 622,805� 0.07HKCG�Finance�Ltd�3.6%�2/11/2026�'EMTN'� 20,000,000� HKD� 2,570,577� 2,610,604� 0.28Vast�Expand�Ltd�5.2%�11/9/2017�� 5,000,000� CNY� 813,166� 805,634� 0.09
� � � 16,988,904� 17,079,505� 1.82
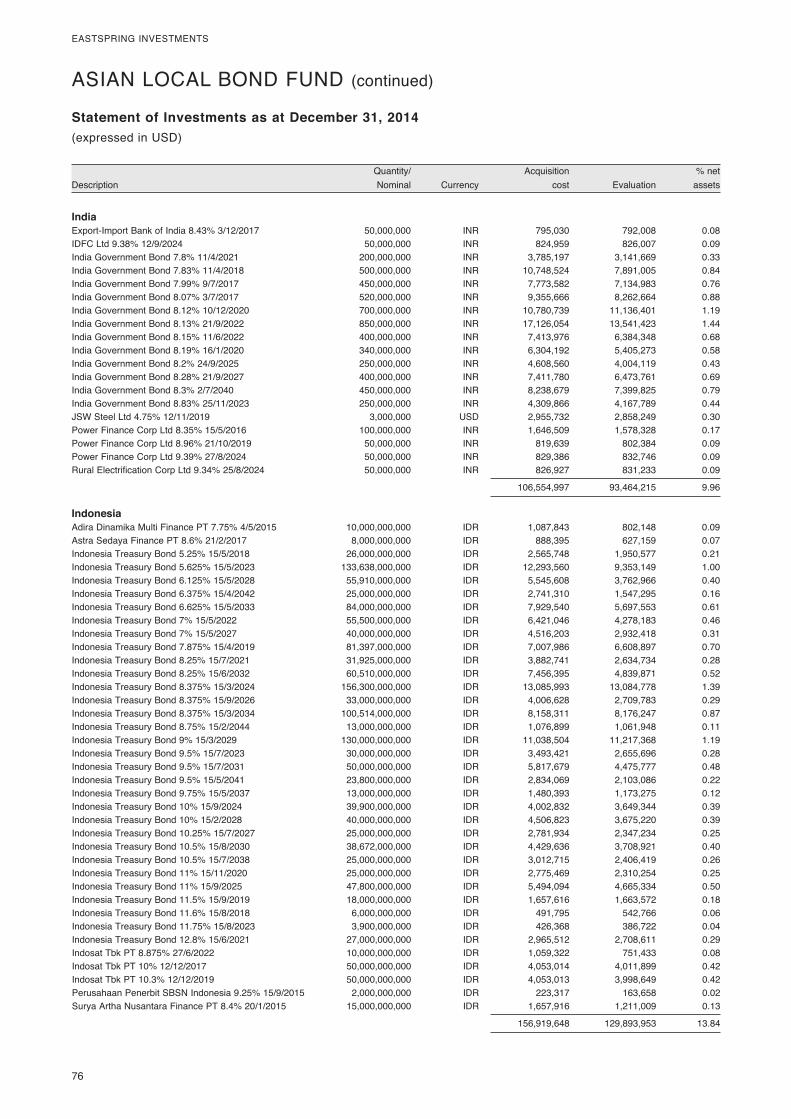
76�
EASTSPRING�INVESTMENTS
� Quantity/�� � Acquisition�� � %�net�Description� Nominal�� Currency�� cost�� Evaluation�� assets�
Statement of Investments as at December 31, 2014(expressed�in�USD)
ASIAN�LOCAL�BOND�FUND�(continued)
India Export-Import�Bank�of�India�8.43%�3/12/2017�� 50,000,000� INR� 795,030� 792,008� 0.08IDFC�Ltd�9.38%�12/9/2024�� 50,000,000� INR� 824,959� 826,007� 0.09India�Government�Bond�7.8%�11/4/2021�� 200,000,000� INR� 3,785,197� 3,141,669� 0.33India�Government�Bond�7.83%�11/4/2018�� 500,000,000� INR� 10,748,524� 7,891,005� 0.84India�Government�Bond�7.99%�9/7/2017�� 450,000,000� INR� 7,773,582� 7,134,983� 0.76India�Government�Bond�8.07%�3/7/2017�� 520,000,000� INR� 9,355,666� 8,262,664� 0.88India�Government�Bond�8.12%�10/12/2020�� 700,000,000� INR� 10,780,739� 11,136,401� 1.19India�Government�Bond�8.13%�21/9/2022�� 850,000,000� INR� 17,126,054� 13,541,423� 1.44India�Government�Bond�8.15%�11/6/2022�� 400,000,000� INR� 7,413,976� 6,384,348� 0.68India�Government�Bond�8.19%�16/1/2020�� 340,000,000� INR� 6,304,192� 5,405,273� 0.58India�Government�Bond�8.2%�24/9/2025�� 250,000,000� INR� 4,608,560� 4,004,119� 0.43India�Government�Bond�8.28%�21/9/2027�� 400,000,000� INR� 7,411,780� 6,473,761� 0.69India�Government�Bond�8.3%�2/7/2040�� 450,000,000� INR� 8,238,679� 7,399,825� 0.79India�Government�Bond�8.83%�25/11/2023�� 250,000,000� INR� 4,309,866� 4,167,789� 0.44JSW�Steel�Ltd�4.75%�12/11/2019�� 3,000,000� USD� 2,955,732� 2,858,249� 0.30Power�Finance�Corp�Ltd�8.35%�15/5/2016�� 100,000,000� INR� 1,646,509� 1,578,328� 0.17Power�Finance�Corp�Ltd�8.96%�21/10/2019�� 50,000,000� INR� 819,639� 802,384� 0.09Power�Finance�Corp�Ltd�9.39%�27/8/2024�� 50,000,000� INR� 829,386� 832,746� 0.09Rural�Electrification�Corp�Ltd�9.34%�25/8/2024�� 50,000,000� INR� 826,927� 831,233� 0.09
� � � 106,554,997� 93,464,215� 9.96
Indonesia Adira�Dinamika�Multi�Finance�PT�7.75%�4/5/2015�� 10,000,000,000� IDR� 1,087,843� 802,148� 0.09Astra�Sedaya�Finance�PT�8.6%�21/2/2017�� 8,000,000,000� IDR� 888,395� 627,159� 0.07Indonesia�Treasury�Bond�5.25%�15/5/2018�� 26,000,000,000� IDR� 2,565,748� 1,950,577� 0.21Indonesia�Treasury�Bond�5.625%�15/5/2023�� 133,638,000,000� IDR� 12,293,560� 9,353,149� 1.00Indonesia�Treasury�Bond�6.125%�15/5/2028�� 55,910,000,000� IDR� 5,545,608� 3,762,966� 0.40Indonesia�Treasury�Bond�6.375%�15/4/2042�� 25,000,000,000� IDR� 2,741,310� 1,547,295� 0.16Indonesia�Treasury�Bond�6.625%�15/5/2033�� 84,000,000,000� IDR� 7,929,540� 5,697,553� 0.61Indonesia�Treasury�Bond�7%�15/5/2022�� 55,500,000,000� IDR� 6,421,046� 4,278,183� 0.46Indonesia�Treasury�Bond�7%�15/5/2027�� 40,000,000,000� IDR� 4,516,203� 2,932,418� 0.31Indonesia�Treasury�Bond�7.875%�15/4/2019�� 81,397,000,000� IDR� 7,007,986� 6,608,897� 0.70Indonesia�Treasury�Bond�8.25%�15/7/2021�� 31,925,000,000� IDR� 3,882,741� 2,634,734� 0.28Indonesia�Treasury�Bond�8.25%�15/6/2032�� 60,510,000,000� IDR� 7,456,395� 4,839,871� 0.52Indonesia�Treasury�Bond�8.375%�15/3/2024�� 156,300,000,000� IDR� 13,085,993� 13,084,778� 1.39Indonesia�Treasury�Bond�8.375%�15/9/2026�� 33,000,000,000� IDR� 4,006,628� 2,709,783� 0.29Indonesia�Treasury�Bond�8.375%�15/3/2034�� 100,514,000,000� IDR� 8,158,311� 8,176,247� 0.87Indonesia�Treasury�Bond�8.75%�15/2/2044�� 13,000,000,000� IDR� 1,076,899� 1,061,948� 0.11Indonesia�Treasury�Bond�9%�15/3/2029�� 130,000,000,000� IDR� 11,038,504� 11,217,368� 1.19Indonesia�Treasury�Bond�9.5%�15/7/2023�� 30,000,000,000� IDR� 3,493,421� 2,655,696� 0.28Indonesia�Treasury�Bond�9.5%�15/7/2031�� 50,000,000,000� IDR� 5,817,679� 4,475,777� 0.48Indonesia�Treasury�Bond�9.5%�15/5/2041�� 23,800,000,000� IDR� 2,834,069� 2,103,086� 0.22Indonesia�Treasury�Bond�9.75%�15/5/2037�� 13,000,000,000� IDR� 1,480,393� 1,173,275� 0.12Indonesia�Treasury�Bond�10%�15/9/2024�� 39,900,000,000� IDR� 4,002,832� 3,649,344� 0.39Indonesia�Treasury�Bond�10%�15/2/2028�� 40,000,000,000� IDR� 4,506,823� 3,675,220� 0.39Indonesia�Treasury�Bond�10.25%�15/7/2027�� 25,000,000,000� IDR� 2,781,934� 2,347,234� 0.25Indonesia�Treasury�Bond�10.5%�15/8/2030�� 38,672,000,000� IDR� 4,429,636� 3,708,921� 0.40Indonesia�Treasury�Bond�10.5%�15/7/2038�� 25,000,000,000� IDR� 3,012,715� 2,406,419� 0.26Indonesia�Treasury�Bond�11%�15/11/2020�� 25,000,000,000� IDR� 2,775,469� 2,310,254� 0.25Indonesia�Treasury�Bond�11%�15/9/2025�� 47,800,000,000� IDR� 5,494,094� 4,665,334� 0.50Indonesia�Treasury�Bond�11.5%�15/9/2019�� 18,000,000,000� IDR� 1,657,616� 1,663,572� 0.18Indonesia�Treasury�Bond�11.6%�15/8/2018�� 6,000,000,000� IDR� 491,795� 542,766� 0.06Indonesia�Treasury�Bond�11.75%�15/8/2023�� 3,900,000,000� IDR� 426,368� 386,722� 0.04Indonesia�Treasury�Bond�12.8%�15/6/2021�� 27,000,000,000� IDR� 2,965,512� 2,708,611� 0.29Indosat�Tbk�PT�8.875%�27/6/2022�� 10,000,000,000� IDR� 1,059,322� 751,433� 0.08Indosat�Tbk�PT�10%�12/12/2017�� 50,000,000,000� IDR� 4,053,014� 4,011,899� 0.42Indosat�Tbk�PT�10.3%�12/12/2019�� 50,000,000,000� IDR� 4,053,013� 3,998,649� 0.42Perusahaan�Penerbit�SBSN�Indonesia�9.25%�15/9/2015�� 2,000,000,000� IDR� 223,317� 163,658� 0.02Surya�Artha�Nusantara�Finance�PT�8.4%�20/1/2015�� 15,000,000,000� IDR� 1,657,916� 1,211,009� 0.13
� � � 156,919,648� 129,893,953� 13.84
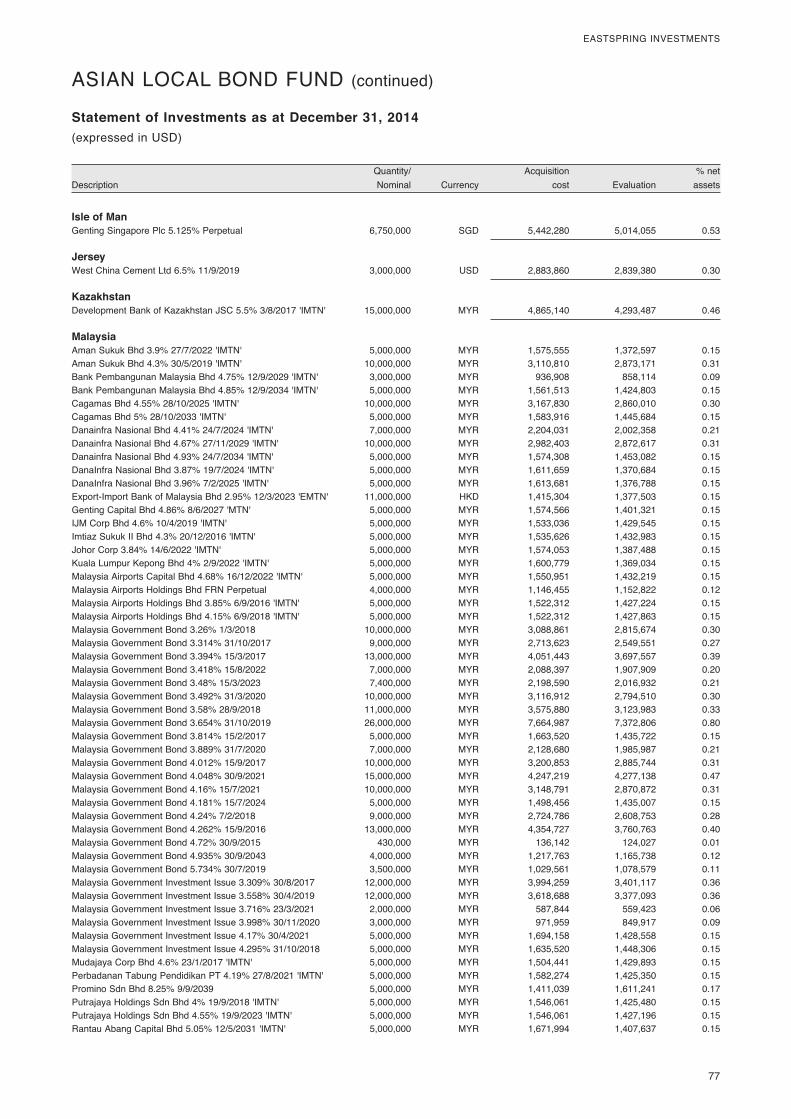
� 77
EASTSPRING�INVESTMENTS
� Quantity/�� � Acquisition�� � %�net�Description� Nominal�� Currency�� cost�� Evaluation�� assets�
Statement of Investments as at December 31, 2014(expressed�in�USD)
ASIAN�LOCAL�BOND�FUND�(continued)
Isle of Man Genting�Singapore�Plc�5.125%�Perpetual�� 6,750,000� SGD� 5,442,280� 5,014,055� 0.53
Jersey West�China�Cement�Ltd�6.5%�11/9/2019�� 3,000,000� USD� 2,883,860� 2,839,380� 0.30
Kazakhstan Development�Bank�of�Kazakhstan�JSC�5.5%�3/8/2017�'IMTN'� 15,000,000� MYR� 4,865,140� 4,293,487� 0.46
Malaysia Aman�Sukuk�Bhd�3.9%�27/7/2022�'IMTN'� 5,000,000� MYR� 1,575,555� 1,372,597� 0.15Aman�Sukuk�Bhd�4.3%�30/5/2019�'IMTN'� 10,000,000� MYR� 3,110,810� 2,873,171� 0.31Bank�Pembangunan�Malaysia�Bhd�4.75%�12/9/2029�'IMTN'� 3,000,000� MYR� 936,908� 858,114� 0.09Bank�Pembangunan�Malaysia�Bhd�4.85%�12/9/2034�'IMTN'� 5,000,000� MYR� 1,561,513� 1,424,803� 0.15Cagamas�Bhd�4.55%�28/10/2025�'IMTN'� 10,000,000� MYR� 3,167,830� 2,860,010� 0.30Cagamas�Bhd�5%�28/10/2033�'IMTN'� 5,000,000� MYR� 1,583,916� 1,445,684� 0.15Danainfra�Nasional�Bhd�4.41%�24/7/2024�'IMTN'� 7,000,000� MYR� 2,204,031� 2,002,358� 0.21Danainfra�Nasional�Bhd�4.67%�27/11/2029�'IMTN'� 10,000,000� MYR� 2,982,403� 2,872,617� 0.31Danainfra�Nasional�Bhd�4.93%�24/7/2034�'IMTN'� 5,000,000� MYR� 1,574,308� 1,453,082� 0.15DanaInfra�Nasional�Bhd�3.87%�19/7/2024�'IMTN'� 5,000,000� MYR� 1,611,659� 1,370,684� 0.15DanaInfra�Nasional�Bhd�3.96%�7/2/2025�'IMTN'� 5,000,000� MYR� 1,613,681� 1,376,788� 0.15Export-Import�Bank�of�Malaysia�Bhd�2.95%�12/3/2023�'EMTN'� 11,000,000� HKD� 1,415,304� 1,377,503� 0.15Genting�Capital�Bhd�4.86%�8/6/2027�'MTN'� 5,000,000� MYR� 1,574,566� 1,401,321� 0.15IJM�Corp�Bhd�4.6%�10/4/2019�'IMTN'� 5,000,000� MYR� 1,533,036� 1,429,545� 0.15Imtiaz�Sukuk�II�Bhd�4.3%�20/12/2016�'IMTN'� 5,000,000� MYR� 1,535,626� 1,432,983� 0.15Johor�Corp�3.84%�14/6/2022�'IMTN'� 5,000,000� MYR� 1,574,053� 1,387,488� 0.15Kuala�Lumpur�Kepong�Bhd�4%�2/9/2022�'IMTN'� 5,000,000� MYR� 1,600,779� 1,369,034� 0.15Malaysia�Airports�Capital�Bhd�4.68%�16/12/2022�'IMTN'� 5,000,000� MYR� 1,550,951� 1,432,219� 0.15Malaysia�Airports�Holdings�Bhd�FRN�Perpetual�� 4,000,000� MYR� 1,146,455� 1,152,822� 0.12Malaysia�Airports�Holdings�Bhd�3.85%�6/9/2016�'IMTN'� 5,000,000� MYR� 1,522,312� 1,427,224� 0.15Malaysia�Airports�Holdings�Bhd�4.15%�6/9/2018�'IMTN'� 5,000,000� MYR� 1,522,312� 1,427,863� 0.15Malaysia�Government�Bond�3.26%�1/3/2018�� 10,000,000� MYR� 3,088,861� 2,815,674� 0.30Malaysia�Government�Bond�3.314%�31/10/2017�� 9,000,000� MYR� 2,713,623� 2,549,551� 0.27Malaysia�Government�Bond�3.394%�15/3/2017�� 13,000,000� MYR� 4,051,443� 3,697,557� 0.39Malaysia�Government�Bond�3.418%�15/8/2022�� 7,000,000� MYR� 2,088,397� 1,907,909� 0.20Malaysia�Government�Bond�3.48%�15/3/2023�� 7,400,000� MYR� 2,198,590� 2,016,932� 0.21Malaysia�Government�Bond�3.492%�31/3/2020�� 10,000,000� MYR� 3,116,912� 2,794,510� 0.30Malaysia�Government�Bond�3.58%�28/9/2018�� 11,000,000� MYR� 3,575,880� 3,123,983� 0.33Malaysia�Government�Bond�3.654%�31/10/2019�� 26,000,000� MYR� 7,664,987� 7,372,806� 0.80Malaysia�Government�Bond�3.814%�15/2/2017�� 5,000,000� MYR� 1,663,520� 1,435,722� 0.15Malaysia�Government�Bond�3.889%�31/7/2020�� 7,000,000� MYR� 2,128,680� 1,985,987� 0.21Malaysia�Government�Bond�4.012%�15/9/2017�� 10,000,000� MYR� 3,200,853� 2,885,744� 0.31Malaysia�Government�Bond�4.048%�30/9/2021�� 15,000,000� MYR� 4,247,219� 4,277,138� 0.47Malaysia�Government�Bond�4.16%�15/7/2021�� 10,000,000� MYR� 3,148,791� 2,870,872� 0.31Malaysia�Government�Bond�4.181%�15/7/2024�� 5,000,000� MYR� 1,498,456� 1,435,007� 0.15Malaysia�Government�Bond�4.24%�7/2/2018�� 9,000,000� MYR� 2,724,786� 2,608,753� 0.28Malaysia�Government�Bond�4.262%�15/9/2016�� 13,000,000� MYR� 4,354,727� 3,760,763� 0.40Malaysia�Government�Bond�4.72%�30/9/2015�� 430,000� MYR� 136,142� 124,027� 0.01Malaysia�Government�Bond�4.935%�30/9/2043�� 4,000,000� MYR� 1,217,763� 1,165,738� 0.12Malaysia�Government�Bond�5.734%�30/7/2019�� 3,500,000� MYR� 1,029,561� 1,078,579� 0.11Malaysia�Government�Investment�Issue�3.309%�30/8/2017�� 12,000,000� MYR� 3,994,259� 3,401,117� 0.36Malaysia�Government�Investment�Issue�3.558%�30/4/2019�� 12,000,000� MYR� 3,618,688� 3,377,093� 0.36Malaysia�Government�Investment�Issue�3.716%�23/3/2021�� 2,000,000� MYR� 587,844� 559,423� 0.06Malaysia�Government�Investment�Issue�3.998%�30/11/2020�� 3,000,000� MYR� 971,959� 849,917� 0.09Malaysia�Government�Investment�Issue�4.17%�30/4/2021�� 5,000,000� MYR� 1,694,158� 1,428,558� 0.15Malaysia�Government�Investment�Issue�4.295%�31/10/2018�� 5,000,000� MYR� 1,635,520� 1,448,306� 0.15Mudajaya�Corp�Bhd�4.6%�23/1/2017�'IMTN'� 5,000,000� MYR� 1,504,441� 1,429,893� 0.15Perbadanan�Tabung�Pendidikan�PT�4.19%�27/8/2021�'IMTN'� 5,000,000� MYR� 1,582,274� 1,425,350� 0.15Promino�Sdn�Bhd�8.25%�9/9/2039�� 5,000,000� MYR� 1,411,039� 1,611,241� 0.17Putrajaya�Holdings�Sdn�Bhd�4%�19/9/2018�'IMTN'� 5,000,000� MYR� 1,546,061� 1,425,480� 0.15Putrajaya�Holdings�Sdn�Bhd�4.55%�19/9/2023�'IMTN'� 5,000,000� MYR� 1,546,061� 1,427,196� 0.15Rantau�Abang�Capital�Bhd�5.05%�12/5/2031�'IMTN'� 5,000,000� MYR� 1,671,994� 1,407,637� 0.15
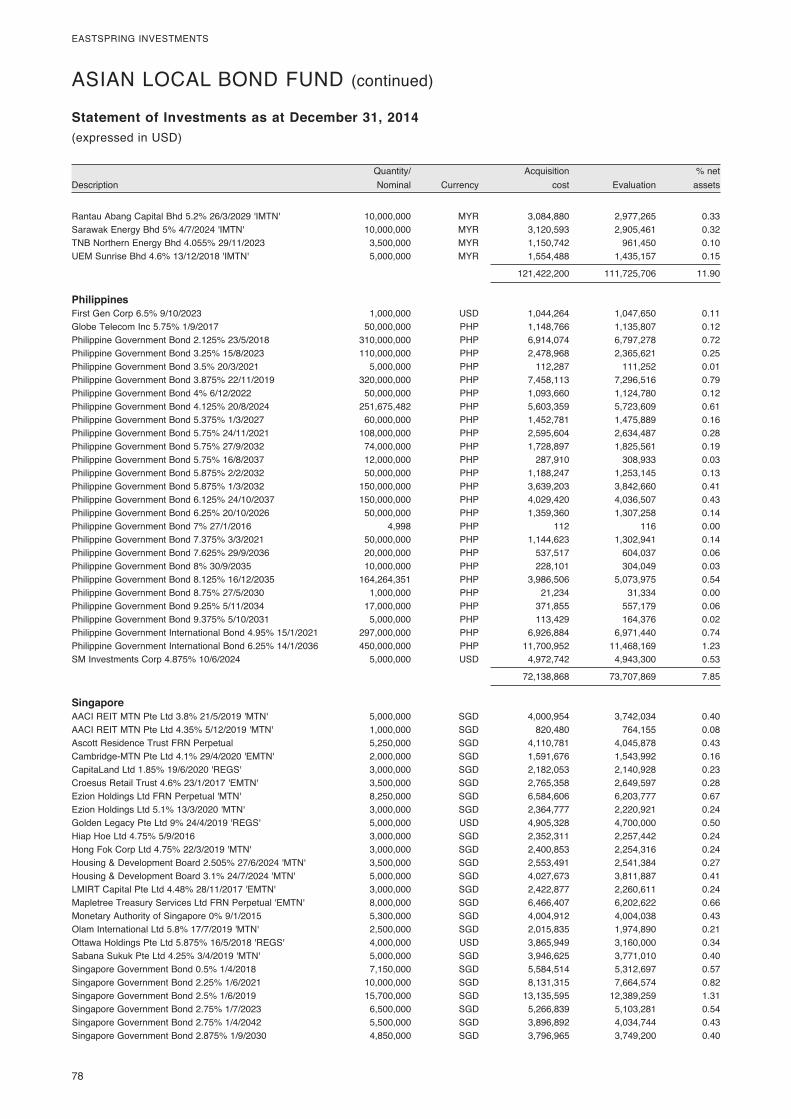
78�
EASTSPRING�INVESTMENTS
� Quantity/�� � Acquisition�� � %�net�Description� Nominal�� Currency�� cost�� Evaluation�� assets�
Statement of Investments as at December 31, 2014(expressed�in�USD)
ASIAN�LOCAL�BOND�FUND�(continued)
Rantau�Abang�Capital�Bhd�5.2%�26/3/2029�'IMTN'� 10,000,000� MYR� 3,084,880� 2,977,265� 0.33Sarawak�Energy�Bhd�5%�4/7/2024�'IMTN'� 10,000,000� MYR� 3,120,593� 2,905,461� 0.32TNB�Northern�Energy�Bhd�4.055%�29/11/2023�� 3,500,000� MYR� 1,150,742� 961,450� 0.10UEM�Sunrise�Bhd�4.6%�13/12/2018�'IMTN'� 5,000,000� MYR� 1,554,488� 1,435,157� 0.15
� � � 121,422,200� 111,725,706� 11.90
Philippines First�Gen�Corp�6.5%�9/10/2023�� 1,000,000� USD� 1,044,264� 1,047,650� 0.11Globe�Telecom�Inc�5.75%�1/9/2017�� 50,000,000� PHP� 1,148,766� 1,135,807� 0.12Philippine�Government�Bond�2.125%�23/5/2018�� 310,000,000� PHP� 6,914,074� 6,797,278� 0.72Philippine�Government�Bond�3.25%�15/8/2023�� 110,000,000� PHP� 2,478,968� 2,365,621� 0.25Philippine�Government�Bond�3.5%�20/3/2021�� 5,000,000� PHP� 112,287� 111,252� 0.01Philippine�Government�Bond�3.875%�22/11/2019�� 320,000,000� PHP� 7,458,113� 7,296,516� 0.79Philippine�Government�Bond�4%�6/12/2022�� 50,000,000� PHP� 1,093,660� 1,124,780� 0.12Philippine�Government�Bond�4.125%�20/8/2024�� 251,675,482� PHP� 5,603,359� 5,723,609� 0.61Philippine�Government�Bond�5.375%�1/3/2027�� 60,000,000� PHP� 1,452,781� 1,475,889� 0.16Philippine�Government�Bond�5.75%�24/11/2021�� 108,000,000� PHP� 2,595,604� 2,634,487� 0.28Philippine�Government�Bond�5.75%�27/9/2032�� 74,000,000� PHP� 1,728,897� 1,825,561� 0.19Philippine�Government�Bond�5.75%�16/8/2037�� 12,000,000� PHP� 287,910� 308,933� 0.03Philippine�Government�Bond�5.875%�2/2/2032�� 50,000,000� PHP� 1,188,247� 1,253,145� 0.13Philippine�Government�Bond�5.875%�1/3/2032�� 150,000,000� PHP� 3,639,203� 3,842,660� 0.41Philippine�Government�Bond�6.125%�24/10/2037�� 150,000,000� PHP� 4,029,420� 4,036,507� 0.43Philippine�Government�Bond�6.25%�20/10/2026�� 50,000,000� PHP� 1,359,360� 1,307,258� 0.14Philippine�Government�Bond�7%�27/1/2016�� 4,998� PHP� 112� 116� 0.00Philippine�Government�Bond�7.375%�3/3/2021�� 50,000,000� PHP� 1,144,623� 1,302,941� 0.14Philippine�Government�Bond�7.625%�29/9/2036�� 20,000,000� PHP� 537,517� 604,037� 0.06Philippine�Government�Bond�8%�30/9/2035�� 10,000,000� PHP� 228,101� 304,049� 0.03Philippine�Government�Bond�8.125%�16/12/2035�� 164,264,351� PHP� 3,986,506� 5,073,975� 0.54Philippine�Government�Bond�8.75%�27/5/2030�� 1,000,000� PHP� 21,234� 31,334� 0.00Philippine�Government�Bond�9.25%�5/11/2034�� 17,000,000� PHP� 371,855� 557,179� 0.06Philippine�Government�Bond�9.375%�5/10/2031�� 5,000,000� PHP� 113,429� 164,376� 0.02Philippine�Government�International�Bond�4.95%�15/1/2021�� 297,000,000� PHP� 6,926,884� 6,971,440� 0.74Philippine�Government�International�Bond�6.25%�14/1/2036�� 450,000,000� PHP� 11,700,952� 11,468,169� 1.23SM�Investments�Corp�4.875%�10/6/2024�� 5,000,000� USD� 4,972,742� 4,943,300� 0.53
� � � 72,138,868� 73,707,869� 7.85
Singapore AACI�REIT�MTN�Pte�Ltd�3.8%�21/5/2019�'MTN'� 5,000,000� SGD� 4,000,954� 3,742,034� 0.40AACI�REIT�MTN�Pte�Ltd�4.35%�5/12/2019�'MTN'� 1,000,000� SGD� 820,480� 764,155� 0.08Ascott�Residence�Trust�FRN�Perpetual�� 5,250,000� SGD� 4,110,781� 4,045,878� 0.43Cambridge-MTN�Pte�Ltd�4.1%�29/4/2020�'EMTN'� 2,000,000� SGD� 1,591,676� 1,543,992� 0.16CapitaLand�Ltd�1.85%�19/6/2020�'REGS'� 3,000,000� SGD� 2,182,053� 2,140,928� 0.23Croesus�Retail�Trust�4.6%�23/1/2017�'EMTN'� 3,500,000� SGD� 2,765,358� 2,649,597� 0.28Ezion�Holdings�Ltd�FRN�Perpetual�'MTN'� 8,250,000� SGD� 6,584,606� 6,203,777� 0.67Ezion�Holdings�Ltd�5.1%�13/3/2020�'MTN'� 3,000,000� SGD� 2,364,777� 2,220,921� 0.24Golden�Legacy�Pte�Ltd�9%�24/4/2019�'REGS'� 5,000,000� USD� 4,905,328� 4,700,000� 0.50Hiap�Hoe�Ltd�4.75%�5/9/2016�� 3,000,000� SGD� 2,352,311� 2,257,442� 0.24Hong�Fok�Corp�Ltd�4.75%�22/3/2019�'MTN'� 3,000,000� SGD� 2,400,853� 2,254,316� 0.24Housing�&�Development�Board�2.505%�27/6/2024�'MTN'� 3,500,000� SGD� 2,553,491� 2,541,384� 0.27Housing�&�Development�Board�3.1%�24/7/2024�'MTN'� 5,000,000� SGD� 4,027,673� 3,811,887� 0.41LMIRT�Capital�Pte�Ltd�4.48%�28/11/2017�'EMTN'� 3,000,000� SGD� 2,422,877� 2,260,611� 0.24Mapletree�Treasury�Services�Ltd�FRN�Perpetual�'EMTN'� 8,000,000� SGD� 6,466,407� 6,202,622� 0.66Monetary�Authority�of�Singapore�0%�9/1/2015�� 5,300,000� SGD� 4,004,912� 4,004,038� 0.43Olam�International�Ltd�5.8%�17/7/2019�'MTN'� 2,500,000� SGD� 2,015,835� 1,974,890� 0.21Ottawa�Holdings�Pte�Ltd�5.875%�16/5/2018�'REGS'� 4,000,000� USD� 3,865,949� 3,160,000� 0.34Sabana�Sukuk�Pte�Ltd�4.25%�3/4/2019�'MTN'� 5,000,000� SGD� 3,946,625� 3,771,010� 0.40Singapore�Government�Bond�0.5%�1/4/2018�� 7,150,000� SGD� 5,584,514� 5,312,697� 0.57Singapore�Government�Bond�2.25%�1/6/2021�� 10,000,000� SGD� 8,131,315� 7,664,574� 0.82Singapore�Government�Bond�2.5%�1/6/2019�� 15,700,000� SGD� 13,135,595� 12,389,259� 1.31Singapore�Government�Bond�2.75%�1/7/2023�� 6,500,000� SGD� 5,266,839� 5,103,281� 0.54Singapore�Government�Bond�2.75%�1/4/2042�� 5,500,000� SGD� 3,896,892� 4,034,744� 0.43Singapore�Government�Bond�2.875%�1/9/2030�� 4,850,000� SGD� 3,796,965� 3,749,200� 0.40
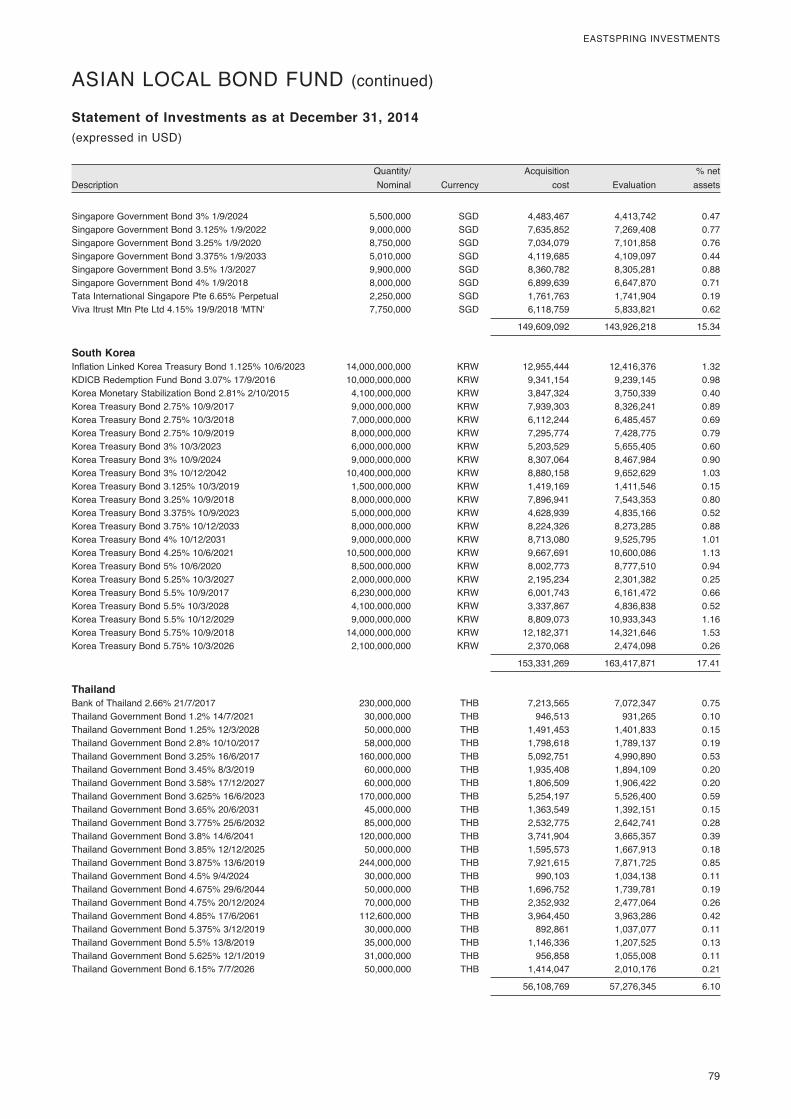
� 79
EASTSPRING�INVESTMENTS
� Quantity/�� � Acquisition�� � %�net�Description� Nominal�� Currency�� cost�� Evaluation�� assets�
Statement of Investments as at December 31, 2014(expressed�in�USD)
ASIAN�LOCAL�BOND�FUND�(continued)
Singapore�Government�Bond�3%�1/9/2024�� 5,500,000� SGD� 4,483,467� 4,413,742� 0.47Singapore�Government�Bond�3.125%�1/9/2022�� 9,000,000� SGD� 7,635,852� 7,269,408� 0.77Singapore�Government�Bond�3.25%�1/9/2020�� 8,750,000� SGD� 7,034,079� 7,101,858� 0.76Singapore�Government�Bond�3.375%�1/9/2033�� 5,010,000� SGD� 4,119,685� 4,109,097� 0.44Singapore�Government�Bond�3.5%�1/3/2027�� 9,900,000� SGD� 8,360,782� 8,305,281� 0.88Singapore�Government�Bond�4%�1/9/2018�� 8,000,000� SGD� 6,899,639� 6,647,870� 0.71Tata�International�Singapore�Pte�6.65%�Perpetual�� 2,250,000� SGD� 1,761,763� 1,741,904� 0.19Viva�Itrust�Mtn�Pte�Ltd�4.15%�19/9/2018�'MTN'� 7,750,000� SGD� 6,118,759� 5,833,821� 0.62
� � � 149,609,092� 143,926,218� 15.34
South Korea Inflation�Linked�Korea�Treasury�Bond�1.125%�10/6/2023�� 14,000,000,000� KRW� 12,955,444� 12,416,376� 1.32KDICB�Redemption�Fund�Bond�3.07%�17/9/2016�� 10,000,000,000� KRW� 9,341,154� 9,239,145� 0.98Korea�Monetary�Stabilization�Bond�2.81%�2/10/2015�� 4,100,000,000� KRW� 3,847,324� 3,750,339� 0.40Korea�Treasury�Bond�2.75%�10/9/2017�� 9,000,000,000� KRW� 7,939,303� 8,326,241� 0.89Korea�Treasury�Bond�2.75%�10/3/2018�� 7,000,000,000� KRW� 6,112,244� 6,485,457� 0.69Korea�Treasury�Bond�2.75%�10/9/2019�� 8,000,000,000� KRW� 7,295,774� 7,428,775� 0.79Korea�Treasury�Bond�3%�10/3/2023�� 6,000,000,000� KRW� 5,203,529� 5,655,405� 0.60Korea�Treasury�Bond�3%�10/9/2024�� 9,000,000,000� KRW� 8,307,064� 8,467,984� 0.90Korea�Treasury�Bond�3%�10/12/2042�� 10,400,000,000� KRW� 8,880,158� 9,652,629� 1.03Korea�Treasury�Bond�3.125%�10/3/2019�� 1,500,000,000� KRW� 1,419,169� 1,411,546� 0.15Korea�Treasury�Bond�3.25%�10/9/2018�� 8,000,000,000� KRW� 7,896,941� 7,543,353� 0.80Korea�Treasury�Bond�3.375%�10/9/2023�� 5,000,000,000� KRW� 4,628,939� 4,835,166� 0.52Korea�Treasury�Bond�3.75%�10/12/2033�� 8,000,000,000� KRW� 8,224,326� 8,273,285� 0.88Korea�Treasury�Bond�4%�10/12/2031�� 9,000,000,000� KRW� 8,713,080� 9,525,795� 1.01Korea�Treasury�Bond�4.25%�10/6/2021�� 10,500,000,000� KRW� 9,667,691� 10,600,086� 1.13Korea�Treasury�Bond�5%�10/6/2020�� 8,500,000,000� KRW� 8,002,773� 8,777,510� 0.94Korea�Treasury�Bond�5.25%�10/3/2027�� 2,000,000,000� KRW� 2,195,234� 2,301,382� 0.25Korea�Treasury�Bond�5.5%�10/9/2017�� 6,230,000,000� KRW� 6,001,743� 6,161,472� 0.66Korea�Treasury�Bond�5.5%�10/3/2028�� 4,100,000,000� KRW� 3,337,867� 4,836,838� 0.52Korea�Treasury�Bond�5.5%�10/12/2029�� 9,000,000,000� KRW� 8,809,073� 10,933,343� 1.16Korea�Treasury�Bond�5.75%�10/9/2018�� 14,000,000,000� KRW� 12,182,371� 14,321,646� 1.53Korea�Treasury�Bond�5.75%�10/3/2026�� 2,100,000,000� KRW� 2,370,068� 2,474,098� 0.26
� � � 153,331,269� 163,417,871� 17.41
Thailand Bank�of�Thailand�2.66%�21/7/2017�� 230,000,000� THB� 7,213,565� 7,072,347� 0.75Thailand�Government�Bond�1.2%�14/7/2021�� 30,000,000� THB� 946,513� 931,265� 0.10Thailand�Government�Bond�1.25%�12/3/2028�� 50,000,000� THB� 1,491,453� 1,401,833� 0.15Thailand�Government�Bond�2.8%�10/10/2017�� 58,000,000� THB� 1,798,618� 1,789,137� 0.19Thailand�Government�Bond�3.25%�16/6/2017�� 160,000,000� THB� 5,092,751� 4,990,890� 0.53Thailand�Government�Bond�3.45%�8/3/2019�� 60,000,000� THB� 1,935,408� 1,894,109� 0.20Thailand�Government�Bond�3.58%�17/12/2027�� 60,000,000� THB� 1,806,509� 1,906,422� 0.20Thailand�Government�Bond�3.625%�16/6/2023�� 170,000,000� THB� 5,254,197� 5,526,400� 0.59Thailand�Government�Bond�3.65%�20/6/2031�� 45,000,000� THB� 1,363,549� 1,392,151� 0.15Thailand�Government�Bond�3.775%�25/6/2032�� 85,000,000� THB� 2,532,775� 2,642,741� 0.28Thailand�Government�Bond�3.8%�14/6/2041�� 120,000,000� THB� 3,741,904� 3,665,357� 0.39Thailand�Government�Bond�3.85%�12/12/2025�� 50,000,000� THB� 1,595,573� 1,667,913� 0.18Thailand�Government�Bond�3.875%�13/6/2019�� 244,000,000� THB� 7,921,615� 7,871,725� 0.85Thailand�Government�Bond�4.5%�9/4/2024�� 30,000,000� THB� 990,103� 1,034,138� 0.11Thailand�Government�Bond�4.675%�29/6/2044�� 50,000,000� THB� 1,696,752� 1,739,781� 0.19Thailand�Government�Bond�4.75%�20/12/2024�� 70,000,000� THB� 2,352,932� 2,477,064� 0.26Thailand�Government�Bond�4.85%�17/6/2061�� 112,600,000� THB� 3,964,450� 3,963,286� 0.42Thailand�Government�Bond�5.375%�3/12/2019�� 30,000,000� THB� 892,861� 1,037,077� 0.11Thailand�Government�Bond�5.5%�13/8/2019�� 35,000,000� THB� 1,146,336� 1,207,525� 0.13Thailand�Government�Bond�5.625%�12/1/2019�� 31,000,000� THB� 956,858� 1,055,008� 0.11Thailand�Government�Bond�6.15%�7/7/2026�� 50,000,000� THB� 1,414,047� 2,010,176� 0.21
� � � 56,108,769� 57,276,345� 6.10
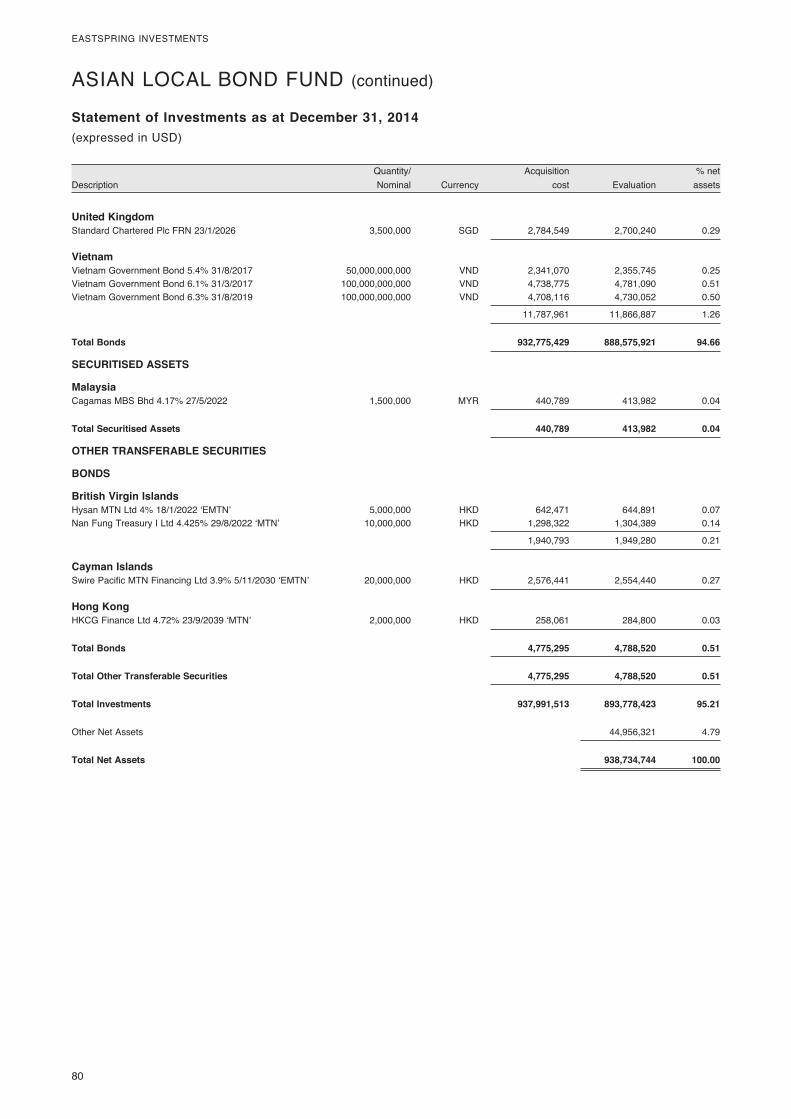
80�
EASTSPRING�INVESTMENTS
� Quantity/�� � Acquisition�� � %�net�Description� Nominal�� Currency�� cost�� Evaluation�� assets�
Statement of Investments as at December 31, 2014(expressed�in�USD)
United Kingdom Standard�Chartered�Plc�FRN�23/1/2026�� 3,500,000� SGD� 2,784,549� 2,700,240� 0.29
Vietnam Vietnam�Government�Bond�5.4%�31/8/2017�� 50,000,000,000� VND� 2,341,070� 2,355,745� 0.25Vietnam�Government�Bond�6.1%�31/3/2017�� 100,000,000,000� VND� 4,738,775� 4,781,090� 0.51Vietnam�Government�Bond�6.3%�31/8/2019�� 100,000,000,000� VND� 4,708,116� 4,730,052� 0.50
� � � 11,787,961� 11,866,887� 1.26
Total Bonds 932,775,429 888,575,921 94.66
SECURITISED ASSETS
Malaysia Cagamas�MBS�Bhd�4.17%�27/5/2022�� 1,500,000� MYR� 440,789� 413,982� 0.04
Total Securitised Assets 440,789 413,982 0.04
OTHER TRANSFERABLE SECURITIES
BONDS
British Virgin IslandsHysan�MTN�Ltd�4%�18/1/2022�‘EMTN’� 5,000,000� HKD� 642,471� 644,891� 0.07Nan�Fung�Treasury�I�Ltd�4.425%�29/8/2022�‘MTN’� 10,000,000� HKD� 1,298,322� 1,304,389� 0.14
� � � 1,940,793� 1,949,280� 0.21
Cayman Islands Swire�Pacific�MTN�Financing�Ltd�3.9%�5/11/2030�‘EMTN’� 20,000,000� HKD� 2,576,441� 2,554,440� 0.27
Hong Kong HKCG�Finance�Ltd�4.72%�23/9/2039�‘MTN’� 2,000,000� HKD� 258,061� 284,800� 0.03
Total Bonds 4,775,295 4,788,520 0.51
Total Other Transferable Securities 4,775,295 4,788,520 0.51
Total Investments 937,991,513 893,778,423 95.21
Other�Net�Assets� � � � 44,956,321� 4.79
Total Net Assets 938,734,744 100.00
ASIAN�LOCAL�BOND�FUND�(continued)
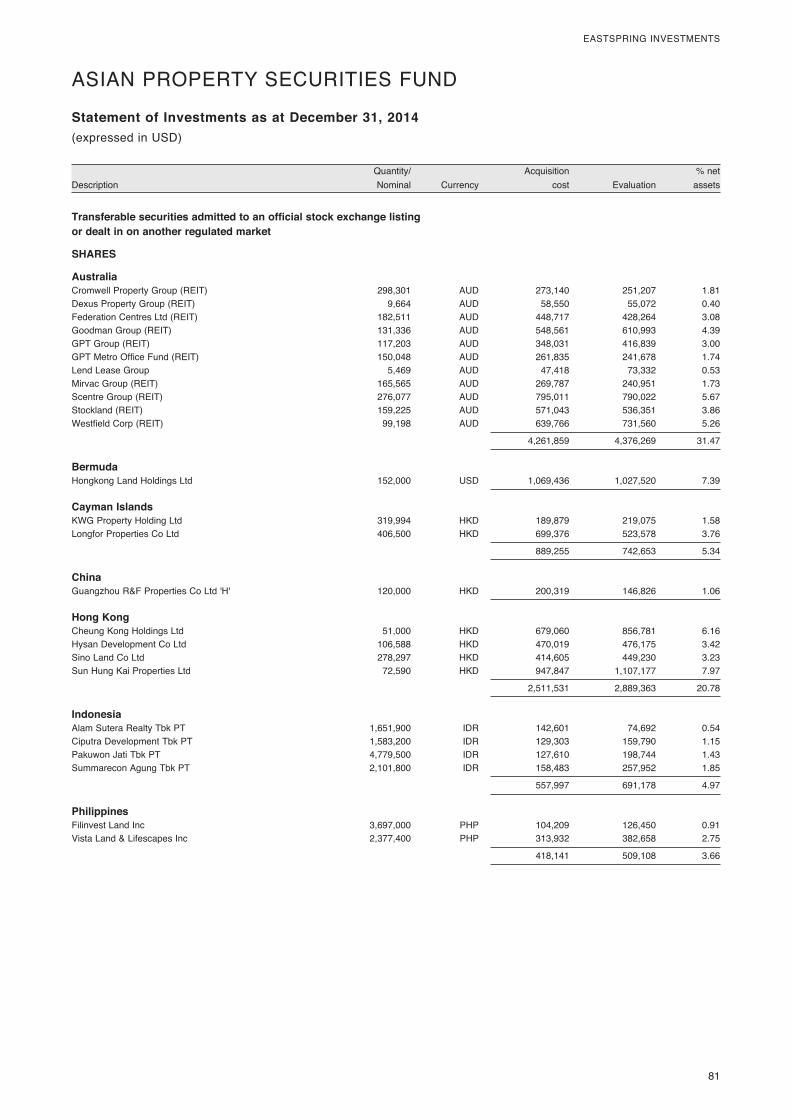
� 81
EASTSPRING�INVESTMENTS
� Quantity/�� � Acquisition�� � %�net�Description� Nominal�� Currency�� cost�� Evaluation�� assets�
Statement of Investments as at December 31, 2014(expressed�in�USD)
ASIAN�PROPERTY�SECURITIES�FUND�
Transferable securities admitted to an official stock exchange listing or dealt in on another regulated market
SHARES
Australia Cromwell�Property�Group�(REIT)� 298,301� AUD� 273,140� 251,207� 1.81Dexus�Property�Group�(REIT)� 9,664� AUD� 58,550� 55,072� 0.40Federation�Centres�Ltd�(REIT)� 182,511� AUD� 448,717� 428,264� 3.08Goodman�Group�(REIT)� 131,336� AUD� 548,561� 610,993� 4.39GPT�Group�(REIT)� 117,203� AUD� 348,031� 416,839� 3.00GPT�Metro�Office�Fund�(REIT)� 150,048� AUD� 261,835� 241,678� 1.74Lend�Lease�Group� 5,469� AUD� 47,418� 73,332� 0.53Mirvac�Group�(REIT)� 165,565� AUD� 269,787� 240,951� 1.73Scentre�Group�(REIT)� 276,077� AUD� 795,011� 790,022� 5.67Stockland�(REIT)� 159,225� AUD� 571,043� 536,351� 3.86Westfield�Corp�(REIT)�� 99,198� AUD� 639,766� 731,560� 5.26
� � � 4,261,859� 4,376,269� 31.47
Bermuda Hongkong�Land�Holdings�Ltd�� 152,000� USD� 1,069,436� 1,027,520� 7.39
Cayman Islands KWG�Property�Holding�Ltd� 319,994� HKD� 189,879� 219,075� 1.58Longfor�Properties�Co�Ltd�� 406,500� HKD� 699,376� 523,578� 3.76
� � � 889,255� 742,653� 5.34
China Guangzhou�R&F�Properties�Co�Ltd�'H'�� 120,000� HKD� 200,319� 146,826� 1.06
Hong Kong Cheung�Kong�Holdings�Ltd� 51,000� HKD� 679,060� 856,781� 6.16Hysan�Development�Co�Ltd� 106,588� HKD� 470,019� 476,175� 3.42Sino�Land�Co�Ltd� 278,297� HKD� 414,605� 449,230� 3.23Sun�Hung�Kai�Properties�Ltd�� 72,590� HKD� 947,847� 1,107,177� 7.97
� � � 2,511,531� 2,889,363� 20.78
Indonesia Alam�Sutera�Realty�Tbk�PT� 1,651,900� IDR� 142,601� 74,692� 0.54Ciputra�Development�Tbk�PT� 1,583,200� IDR� 129,303� 159,790� 1.15Pakuwon�Jati�Tbk�PT� 4,779,500� IDR� 127,610� 198,744� 1.43Summarecon�Agung�Tbk�PT�� 2,101,800� IDR� 158,483� 257,952� 1.85
� � � 557,997� 691,178� 4.97
Philippines Filinvest�Land�Inc� 3,697,000� PHP� 104,209� 126,450� 0.91Vista�Land�&�Lifescapes�Inc�� 2,377,400� PHP� 313,932� 382,658� 2.75
� � � 418,141� 509,108� 3.66
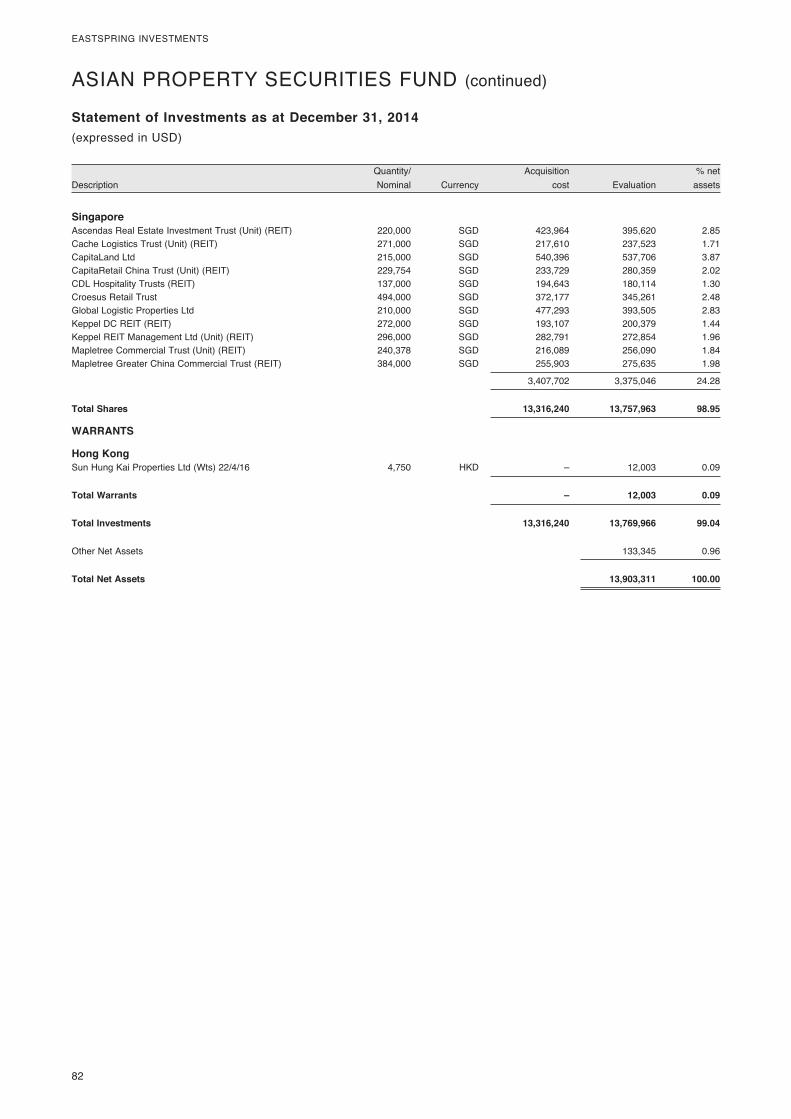
82�
EASTSPRING�INVESTMENTS
� Quantity/�� � Acquisition�� � %�net�Description� Nominal�� Currency�� cost�� Evaluation�� assets�
Statement of Investments as at December 31, 2014(expressed�in�USD)
ASIAN�PROPERTY�SECURITIES�FUND�(continued)
Singapore Ascendas�Real�Estate�Investment�Trust�(Unit)�(REIT)� 220,000� SGD� 423,964� 395,620� 2.85Cache�Logistics�Trust�(Unit)�(REIT)� 271,000� SGD� 217,610� 237,523� 1.71CapitaLand�Ltd� 215,000� SGD� 540,396� 537,706� 3.87CapitaRetail�China�Trust�(Unit)�(REIT)� 229,754� SGD� 233,729� 280,359� 2.02CDL�Hospitality�Trusts�(REIT)� 137,000� SGD� 194,643� 180,114� 1.30Croesus�Retail�Trust� 494,000� SGD� 372,177� 345,261� 2.48Global�Logistic�Properties�Ltd� 210,000� SGD� 477,293� 393,505� 2.83Keppel�DC�REIT�(REIT)� 272,000� SGD� 193,107� 200,379� 1.44Keppel�REIT�Management�Ltd�(Unit)�(REIT)� 296,000� SGD� 282,791� 272,854� 1.96Mapletree�Commercial�Trust�(Unit)�(REIT)� 240,378� SGD� 216,089� 256,090� 1.84Mapletree�Greater�China�Commercial�Trust�(REIT)�� 384,000� SGD� 255,903� 275,635� 1.98
� � � 3,407,702� 3,375,046� 24.28
Total Shares 13,316,240 13,757,963 98.95
WARRANTS
Hong Kong Sun�Hung�Kai�Properties�Ltd�(Wts)�22/4/16�� 4,750� HKD� –� 12,003� 0.09
Total Warrants – 12,003 0.09
Total Investments 13,316,240 13,769,966 99.04
Other�Net�Assets� � � � 133,345� 0.96
Total Net Assets 13,903,311 100.00
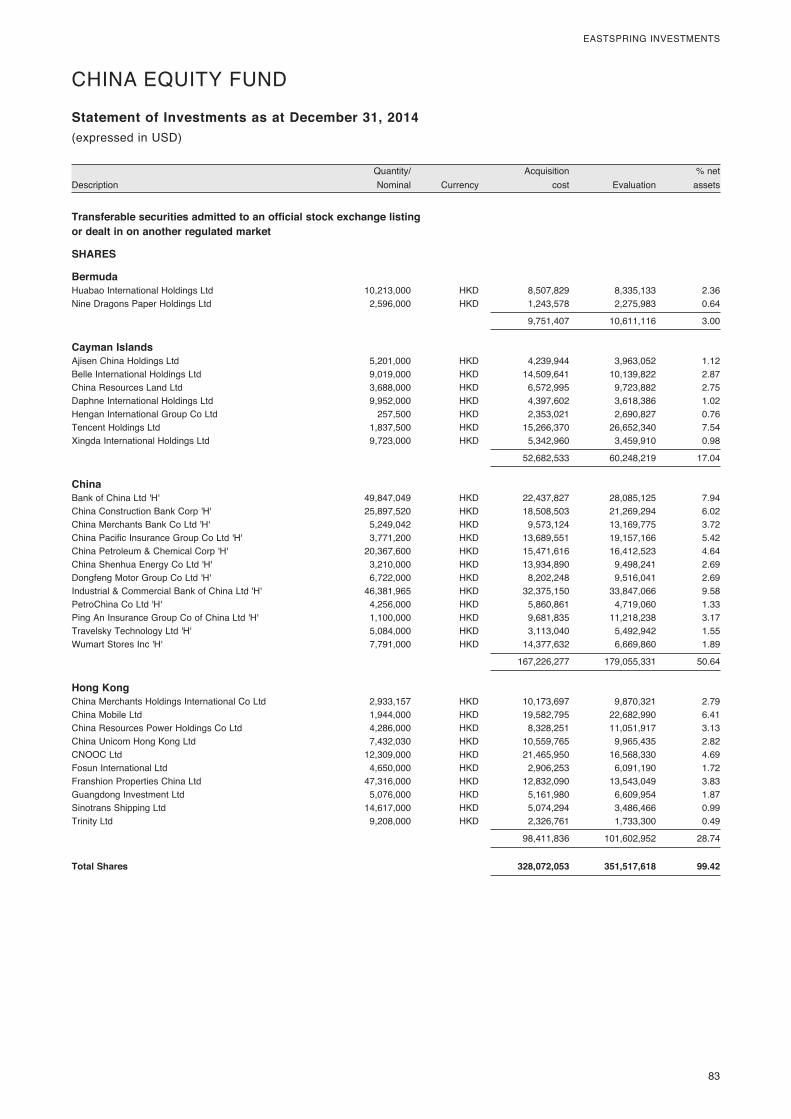
� 83
EASTSPRING�INVESTMENTS
� Quantity/�� � Acquisition�� � %�net�Description� Nominal�� Currency�� cost�� Evaluation�� assets�
Statement of Investments as at December 31, 2014(expressed�in�USD)
CHINA�EQUITY�FUND�
Transferable securities admitted to an official stock exchange listing or dealt in on another regulated market
SHARES
Bermuda Huabao�International�Holdings�Ltd� 10,213,000� HKD� 8,507,829� 8,335,133� 2.36Nine�Dragons�Paper�Holdings�Ltd�� 2,596,000� HKD� 1,243,578� 2,275,983� 0.64
� � � 9,751,407� 10,611,116� 3.00
Cayman Islands Ajisen�China�Holdings�Ltd� 5,201,000� HKD� 4,239,944� 3,963,052� 1.12Belle�International�Holdings�Ltd� 9,019,000� HKD� 14,509,641� 10,139,822� 2.87China�Resources�Land�Ltd� 3,688,000� HKD� 6,572,995� 9,723,882� 2.75Daphne�International�Holdings�Ltd� 9,952,000� HKD� 4,397,602� 3,618,386� 1.02Hengan�International�Group�Co�Ltd� 257,500� HKD� 2,353,021� 2,690,827� 0.76Tencent�Holdings�Ltd� 1,837,500� HKD� 15,266,370� 26,652,340� 7.54Xingda�International�Holdings�Ltd�� 9,723,000� HKD� 5,342,960� 3,459,910� 0.98
� � � 52,682,533� 60,248,219� 17.04
China Bank�of�China�Ltd�'H'� 49,847,049� HKD� 22,437,827� 28,085,125� 7.94China�Construction�Bank�Corp�'H'� 25,897,520� HKD� 18,508,503� 21,269,294� 6.02China�Merchants�Bank�Co�Ltd�'H'� 5,249,042� HKD� 9,573,124� 13,169,775� 3.72China�Pacific�Insurance�Group�Co�Ltd�'H'� 3,771,200� HKD� 13,689,551� 19,157,166� 5.42China�Petroleum�&�Chemical�Corp�'H'� 20,367,600� HKD� 15,471,616� 16,412,523� 4.64China�Shenhua�Energy�Co�Ltd�'H'� 3,210,000� HKD� 13,934,890� 9,498,241� 2.69Dongfeng�Motor�Group�Co�Ltd�'H'� 6,722,000� HKD� 8,202,248� 9,516,041� 2.69Industrial�&�Commercial�Bank�of�China�Ltd�'H'� 46,381,965� HKD� 32,375,150� 33,847,066� 9.58PetroChina�Co�Ltd�'H'� 4,256,000� HKD� 5,860,861� 4,719,060� 1.33Ping�An�Insurance�Group�Co�of�China�Ltd�'H'� 1,100,000� HKD� 9,681,835� 11,218,238� 3.17Travelsky�Technology�Ltd�'H'� 5,084,000� HKD� 3,113,040� 5,492,942� 1.55Wumart�Stores�Inc�'H'�� 7,791,000� HKD� 14,377,632� 6,669,860� 1.89
� � � 167,226,277� 179,055,331� 50.64
Hong Kong China�Merchants�Holdings�International�Co�Ltd� 2,933,157� HKD� 10,173,697� 9,870,321� 2.79China�Mobile�Ltd� 1,944,000� HKD� 19,582,795� 22,682,990� 6.41China�Resources�Power�Holdings�Co�Ltd� 4,286,000� HKD� 8,328,251� 11,051,917� 3.13China�Unicom�Hong�Kong�Ltd� 7,432,030� HKD� 10,559,765� 9,965,435� 2.82CNOOC�Ltd� 12,309,000� HKD� 21,465,950� 16,568,330� 4.69Fosun�International�Ltd� 4,650,000� HKD� 2,906,253� 6,091,190� 1.72Franshion�Properties�China�Ltd� 47,316,000� HKD� 12,832,090� 13,543,049� 3.83Guangdong�Investment�Ltd� 5,076,000� HKD� 5,161,980� 6,609,954� 1.87Sinotrans�Shipping�Ltd� 14,617,000� HKD� 5,074,294� 3,486,466� 0.99Trinity�Ltd�� 9,208,000� HKD� 2,326,761� 1,733,300� 0.49
� � � 98,411,836� 101,602,952� 28.74
Total Shares 328,072,053 351,517,618 99.42
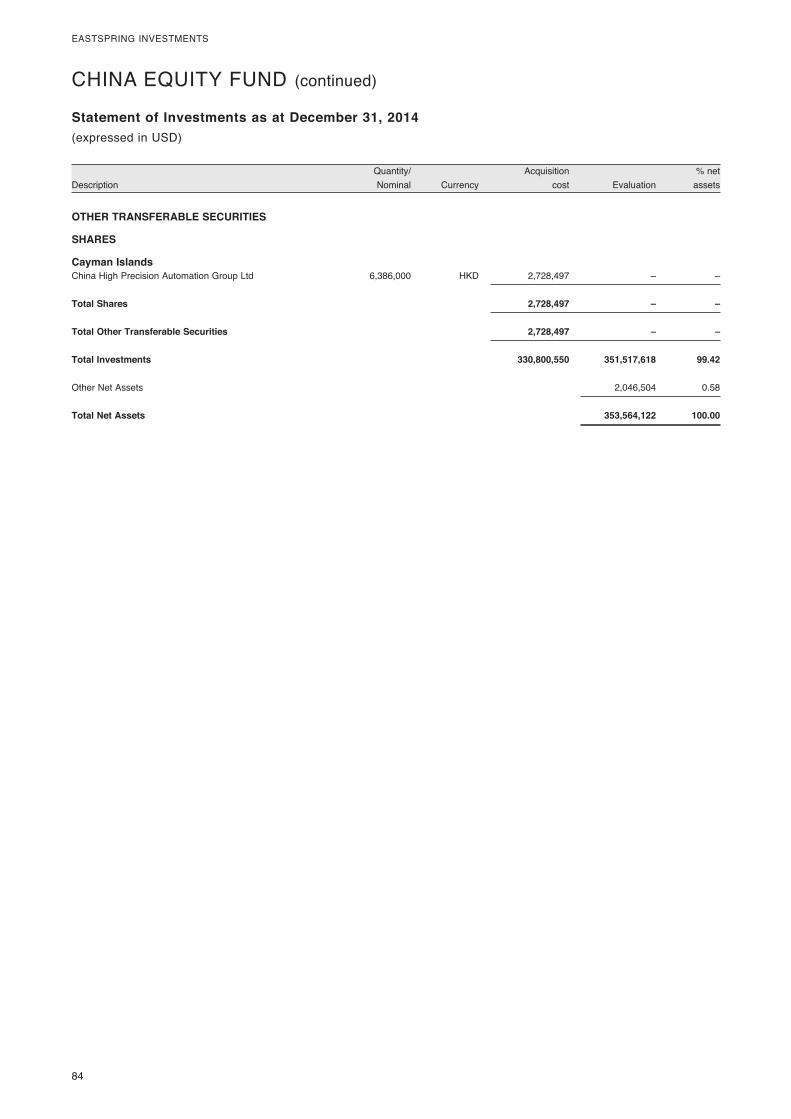
84�
EASTSPRING�INVESTMENTS
� Quantity/�� � Acquisition�� � %�net�Description� Nominal�� Currency�� cost�� Evaluation�� assets�
Statement of Investments as at December 31, 2014(expressed�in�USD)
OTHER TRANSFERABLE SECURITIES
SHARES
Cayman Islands China�High�Precision�Automation�Group�Ltd�� 6,386,000� HKD� 2,728,497� –� –
Total Shares 2,728,497 – –
Total Other Transferable Securities 2,728,497 – –
Total Investments 330,800,550 351,517,618 99.42
Other�Net�Assets� � � � 2,046,504� 0.58
Total Net Assets 353,564,122 100.00
CHINA�EQUITY�FUND�(continued)
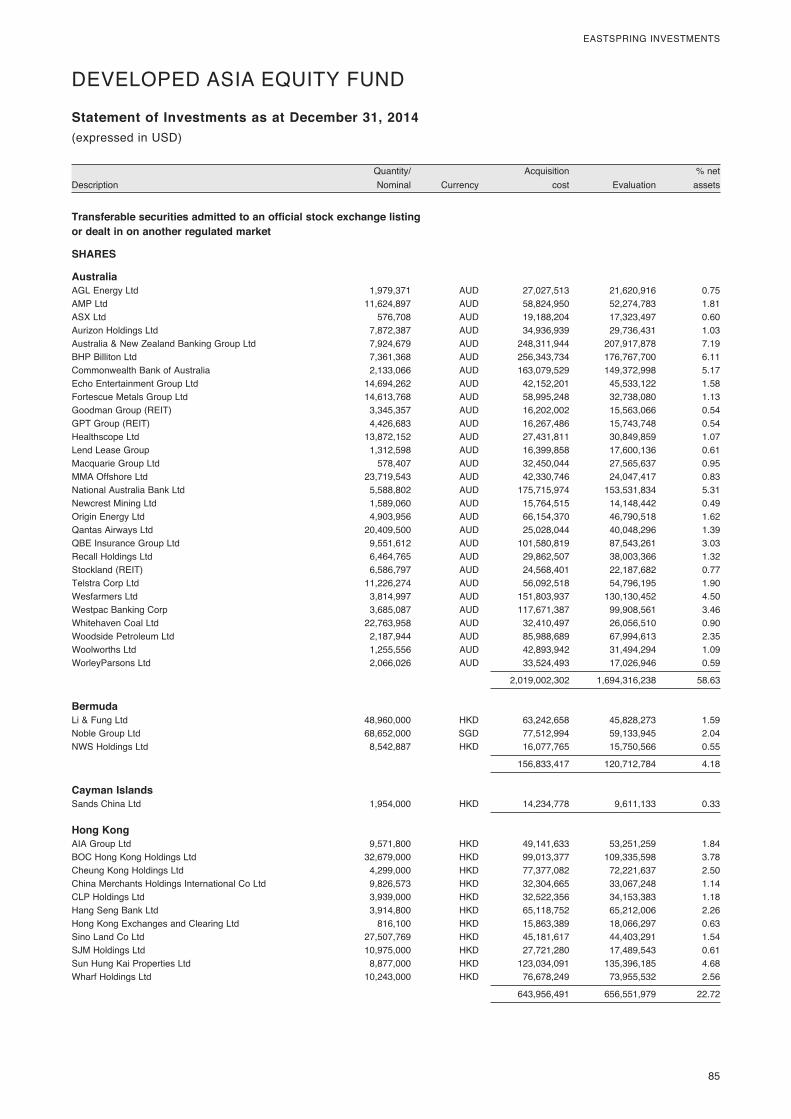
� 85
EASTSPRING�INVESTMENTS
� Quantity/�� � Acquisition�� � %�net�Description� Nominal�� Currency�� cost�� Evaluation�� assets�
Statement of Investments as at December 31, 2014(expressed�in�USD)
Transferable securities admitted to an official stock exchange listing or dealt in on another regulated market
SHARES
Australia AGL�Energy�Ltd� 1,979,371� AUD� 27,027,513� 21,620,916� 0.75AMP�Ltd� 11,624,897� AUD� 58,824,950� 52,274,783� 1.81ASX�Ltd� 576,708� AUD� 19,188,204� 17,323,497� 0.60Aurizon�Holdings�Ltd� 7,872,387� AUD� 34,936,939� 29,736,431� 1.03Australia�&�New�Zealand�Banking�Group�Ltd� 7,924,679� AUD� 248,311,944� 207,917,878� 7.19BHP�Billiton�Ltd� 7,361,368� AUD� 256,343,734� 176,767,700� 6.11Commonwealth�Bank�of�Australia� 2,133,066� AUD� 163,079,529� 149,372,998� 5.17Echo�Entertainment�Group�Ltd� 14,694,262� AUD� 42,152,201� 45,533,122� 1.58Fortescue�Metals�Group�Ltd� 14,613,768� AUD� 58,995,248� 32,738,080� 1.13Goodman�Group�(REIT)� 3,345,357� AUD� 16,202,002� 15,563,066� 0.54GPT�Group�(REIT)� 4,426,683� AUD� 16,267,486� 15,743,748� 0.54Healthscope�Ltd� 13,872,152� AUD� 27,431,811� 30,849,859� 1.07Lend�Lease�Group� 1,312,598� AUD� 16,399,858� 17,600,136� 0.61Macquarie�Group�Ltd� 578,407� AUD� 32,450,044� 27,565,637� 0.95MMA�Offshore�Ltd� 23,719,543� AUD� 42,330,746� 24,047,417� 0.83National�Australia�Bank�Ltd� 5,588,802� AUD� 175,715,974� 153,531,834� 5.31Newcrest�Mining�Ltd� 1,589,060� AUD� 15,764,515� 14,148,442� 0.49Origin�Energy�Ltd� 4,903,956� AUD� 66,154,370� 46,790,518� 1.62Qantas�Airways�Ltd� 20,409,500� AUD� 25,028,044� 40,048,296� 1.39QBE�Insurance�Group�Ltd� 9,551,612� AUD� 101,580,819� 87,543,261� 3.03Recall�Holdings�Ltd� 6,464,765� AUD� 29,862,507� 38,003,366� 1.32Stockland�(REIT)� 6,586,797� AUD� 24,568,401� 22,187,682� 0.77Telstra�Corp�Ltd� 11,226,274� AUD� 56,092,518� 54,796,195� 1.90Wesfarmers�Ltd� 3,814,997� AUD� 151,803,937� 130,130,452� 4.50Westpac�Banking�Corp� 3,685,087� AUD� 117,671,387� 99,908,561� 3.46Whitehaven�Coal�Ltd� 22,763,958� AUD� 32,410,497� 26,056,510� 0.90Woodside�Petroleum�Ltd� 2,187,944� AUD� 85,988,689� 67,994,613� 2.35Woolworths�Ltd� 1,255,556� AUD� 42,893,942� 31,494,294� 1.09WorleyParsons�Ltd�� 2,066,026� AUD� 33,524,493� 17,026,946� 0.59
� � � 2,019,002,302� 1,694,316,238� 58.63
Bermuda Li�&�Fung�Ltd� 48,960,000� HKD� 63,242,658� 45,828,273� 1.59Noble�Group�Ltd� 68,652,000� SGD� 77,512,994� 59,133,945� 2.04NWS�Holdings�Ltd�� 8,542,887� HKD� 16,077,765� 15,750,566� 0.55
� � � 156,833,417� 120,712,784� 4.18
Cayman Islands Sands�China�Ltd�� 1,954,000� HKD� 14,234,778� 9,611,133� 0.33
Hong Kong AIA�Group�Ltd� 9,571,800� HKD� 49,141,633� 53,251,259� 1.84BOC�Hong�Kong�Holdings�Ltd� 32,679,000� HKD� 99,013,377� 109,335,598� 3.78Cheung�Kong�Holdings�Ltd� 4,299,000� HKD� 77,377,082� 72,221,637� 2.50China�Merchants�Holdings�International�Co�Ltd� 9,826,573� HKD� 32,304,665� 33,067,248� 1.14CLP�Holdings�Ltd� 3,939,000� HKD� 32,522,356� 34,153,383� 1.18Hang�Seng�Bank�Ltd� 3,914,800� HKD� 65,118,752� 65,212,006� 2.26Hong�Kong�Exchanges�and�Clearing�Ltd� 816,100� HKD� 15,863,389� 18,066,297� 0.63Sino�Land�Co�Ltd� 27,507,769� HKD� 45,181,617� 44,403,291� 1.54SJM�Holdings�Ltd� 10,975,000� HKD� 27,721,280� 17,489,543� 0.61Sun�Hung�Kai�Properties�Ltd� 8,877,000� HKD� 123,034,091� 135,396,185� 4.68Wharf�Holdings�Ltd�� 10,243,000� HKD� 76,678,249� 73,955,532� 2.56
� � � 643,956,491� 656,551,979� 22.72
DEVELOPED�ASIA�EQUITY�FUND
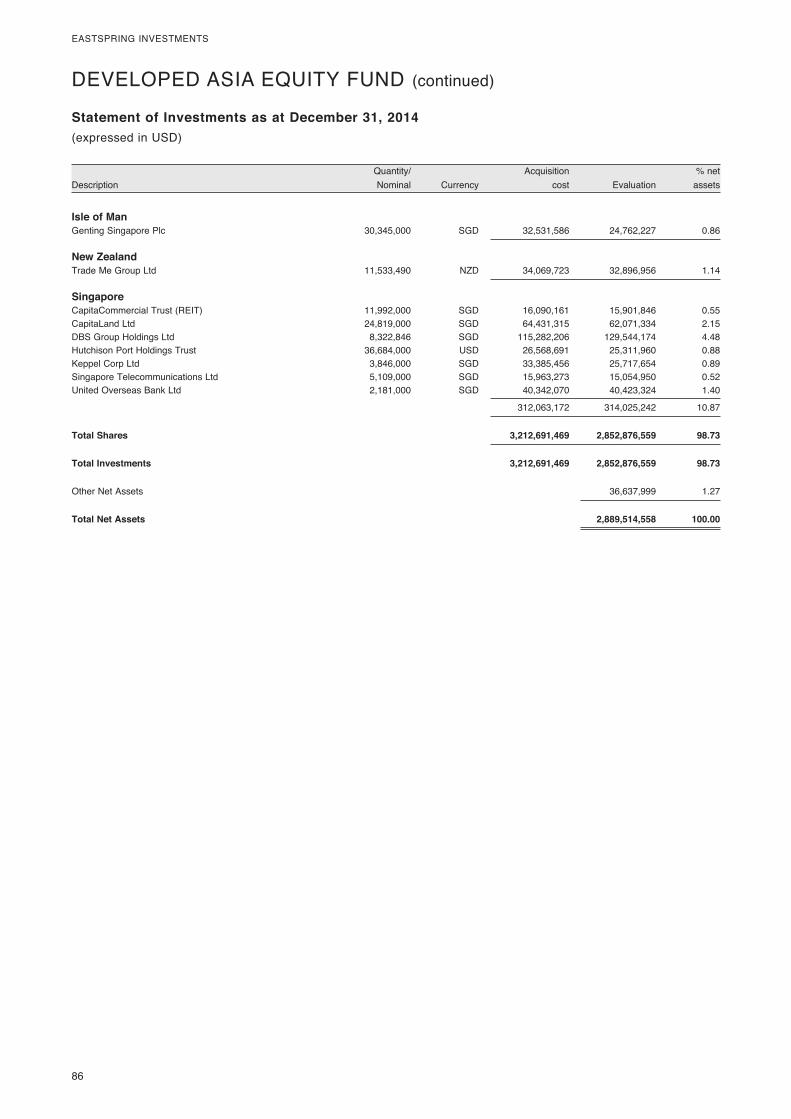
86�
EASTSPRING�INVESTMENTS
� Quantity/�� � Acquisition�� � %�net�Description� Nominal�� Currency�� cost�� Evaluation�� assets�
Statement of Investments as at December 31, 2014(expressed�in�USD)
Isle of Man Genting�Singapore�Plc�� 30,345,000� SGD� 32,531,586� 24,762,227� 0.86
New Zealand Trade�Me�Group�Ltd�� 11,533,490� NZD� 34,069,723� 32,896,956� 1.14
Singapore CapitaCommercial�Trust�(REIT)� 11,992,000� SGD� 16,090,161� 15,901,846� 0.55CapitaLand�Ltd� 24,819,000� SGD� 64,431,315� 62,071,334� 2.15DBS�Group�Holdings�Ltd� 8,322,846� SGD� 115,282,206� 129,544,174� 4.48Hutchison�Port�Holdings�Trust� 36,684,000� USD� 26,568,691� 25,311,960� 0.88Keppel�Corp�Ltd� 3,846,000� SGD� 33,385,456� 25,717,654� 0.89Singapore�Telecommunications�Ltd� 5,109,000� SGD� 15,963,273� 15,054,950� 0.52United�Overseas�Bank�Ltd�� 2,181,000� SGD� 40,342,070� 40,423,324� 1.40
� � � 312,063,172� 314,025,242� 10.87
Total Shares 3,212,691,469 2,852,876,559 98.73
Total Investments 3,212,691,469 2,852,876,559 98.73
Other�Net�Assets� � � � 36,637,999� 1.27
Total Net Assets 2,889,514,558 100.00
DEVELOPED�ASIA�EQUITY�FUND�(continued)
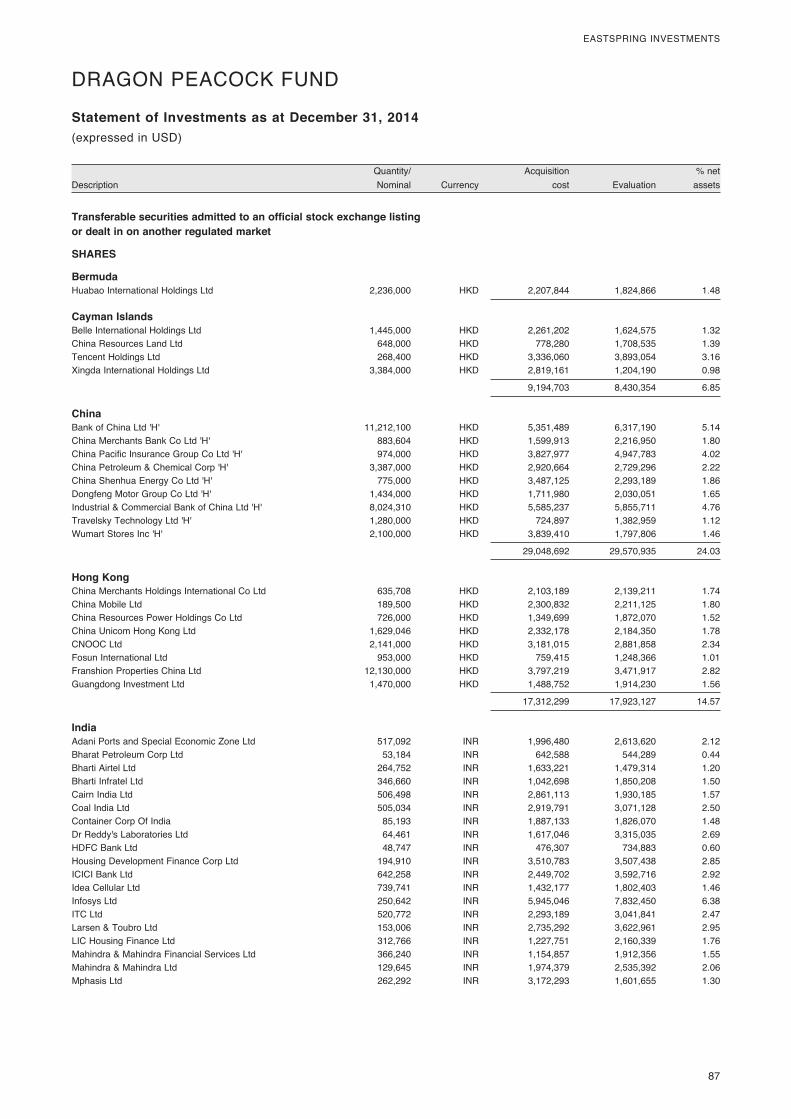
� 87
EASTSPRING�INVESTMENTS
� Quantity/�� � Acquisition�� � %�net�Description� Nominal�� Currency�� cost�� Evaluation�� assets�
Statement of Investments as at December 31, 2014(expressed�in�USD)
DRAGON�PEACOCK�FUND
Transferable securities admitted to an official stock exchange listing or dealt in on another regulated market
SHARES
Bermuda Huabao�International�Holdings�Ltd�� 2,236,000� HKD� 2,207,844� 1,824,866� 1.48
Cayman Islands Belle�International�Holdings�Ltd� 1,445,000� HKD� 2,261,202� 1,624,575� 1.32China�Resources�Land�Ltd� 648,000� HKD� 778,280� 1,708,535� 1.39Tencent�Holdings�Ltd� 268,400� HKD� 3,336,060� 3,893,054� 3.16Xingda�International�Holdings�Ltd�� 3,384,000� HKD� 2,819,161� 1,204,190� 0.98
� � � 9,194,703� 8,430,354� 6.85
China Bank�of�China�Ltd�'H'� 11,212,100� HKD� 5,351,489� 6,317,190� 5.14China�Merchants�Bank�Co�Ltd�'H'� 883,604� HKD� 1,599,913� 2,216,950� 1.80China�Pacific�Insurance�Group�Co�Ltd�'H'� 974,000� HKD� 3,827,977� 4,947,783� 4.02China�Petroleum�&�Chemical�Corp�'H'� 3,387,000� HKD� 2,920,664� 2,729,296� 2.22China�Shenhua�Energy�Co�Ltd�'H'� 775,000� HKD� 3,487,125� 2,293,189� 1.86Dongfeng�Motor�Group�Co�Ltd�'H'� 1,434,000� HKD� 1,711,980� 2,030,051� 1.65Industrial�&�Commercial�Bank�of�China�Ltd�'H'� 8,024,310� HKD� 5,585,237� 5,855,711� 4.76Travelsky�Technology�Ltd�'H'� 1,280,000� HKD� 724,897� 1,382,959� 1.12Wumart�Stores�Inc�'H'�� 2,100,000� HKD� 3,839,410� 1,797,806� 1.46
� � � 29,048,692� 29,570,935� 24.03
Hong Kong China�Merchants�Holdings�International�Co�Ltd� 635,708� HKD� 2,103,189� 2,139,211� 1.74China�Mobile�Ltd� 189,500� HKD� 2,300,832� 2,211,125� 1.80China�Resources�Power�Holdings�Co�Ltd� 726,000� HKD� 1,349,699� 1,872,070� 1.52China�Unicom�Hong�Kong�Ltd� 1,629,046� HKD� 2,332,178� 2,184,350� 1.78CNOOC�Ltd� 2,141,000� HKD� 3,181,015� 2,881,858� 2.34Fosun�International�Ltd� 953,000� HKD� 759,415� 1,248,366� 1.01Franshion�Properties�China�Ltd� 12,130,000� HKD� 3,797,219� 3,471,917� 2.82Guangdong�Investment�Ltd�� 1,470,000� HKD� 1,488,752� 1,914,230� 1.56
� � � 17,312,299� 17,923,127� 14.57
India Adani�Ports�and�Special�Economic�Zone�Ltd� 517,092� INR� 1,996,480� 2,613,620� 2.12Bharat�Petroleum�Corp�Ltd� 53,184� INR� 642,588� 544,289� 0.44Bharti�Airtel�Ltd� 264,752� INR� 1,633,221� 1,479,314� 1.20Bharti�Infratel�Ltd� 346,660� INR� 1,042,698� 1,850,208� 1.50Cairn�India�Ltd� 506,498� INR� 2,861,113� 1,930,185� 1.57Coal�India�Ltd� 505,034� INR� 2,919,791� 3,071,128� 2.50Container�Corp�Of�India� 85,193� INR� 1,887,133� 1,826,070� 1.48Dr�Reddy's�Laboratories�Ltd� 64,461� INR� 1,617,046� 3,315,035� 2.69HDFC�Bank�Ltd� 48,747� INR� 476,307� 734,883� 0.60Housing�Development�Finance�Corp�Ltd� 194,910� INR� 3,510,783� 3,507,438� 2.85ICICI�Bank�Ltd� 642,258� INR� 2,449,702� 3,592,716� 2.92Idea�Cellular�Ltd� 739,741� INR� 1,432,177� 1,802,403� 1.46Infosys�Ltd� 250,642� INR� 5,945,046� 7,832,450� 6.38ITC�Ltd� 520,772� INR� 2,293,189� 3,041,841� 2.47Larsen�&�Toubro�Ltd� 153,006� INR� 2,735,292� 3,622,961� 2.95LIC�Housing�Finance�Ltd� 312,766� INR� 1,227,751� 2,160,339� 1.76Mahindra�&�Mahindra�Financial�Services�Ltd� 366,240� INR� 1,154,857� 1,912,356� 1.55Mahindra�&�Mahindra�Ltd� 129,645� INR� 1,974,379� 2,535,392� 2.06Mphasis�Ltd� 262,292� INR� 3,172,293� 1,601,655� 1.30
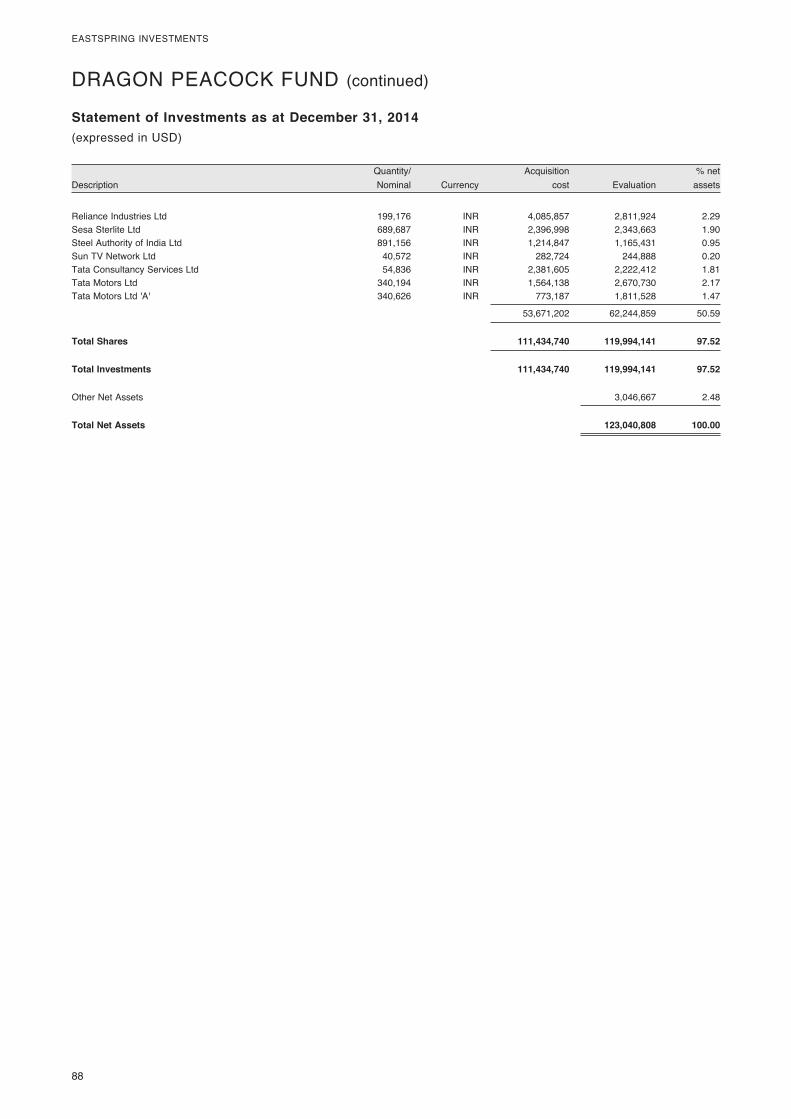
88�
EASTSPRING�INVESTMENTS
� Quantity/�� � Acquisition�� � %�net�Description� Nominal�� Currency�� cost�� Evaluation�� assets�
Statement of Investments as at December 31, 2014(expressed�in�USD)
DRAGON�PEACOCK�FUND�(continued)
Reliance�Industries�Ltd� 199,176� INR� 4,085,857� 2,811,924� 2.29Sesa�Sterlite�Ltd� 689,687� INR� 2,396,998� 2,343,663� 1.90Steel�Authority�of�India�Ltd� 891,156� INR� 1,214,847� 1,165,431� 0.95Sun�TV�Network�Ltd� 40,572� INR� 282,724� 244,888� 0.20Tata�Consultancy�Services�Ltd� 54,836� INR� 2,381,605� 2,222,412� 1.81Tata�Motors�Ltd� 340,194� INR� 1,564,138� 2,670,730� 2.17Tata�Motors�Ltd�'A'�� 340,626� INR� 773,187� 1,811,528� 1.47
� � � 53,671,202� 62,244,859� 50.59
Total Shares 111,434,740 119,994,141 97.52
Total Investments 111,434,740 119,994,141 97.52
Other�Net�Assets� � � � 3,046,667� 2.48
Total Net Assets 123,040,808 100.00
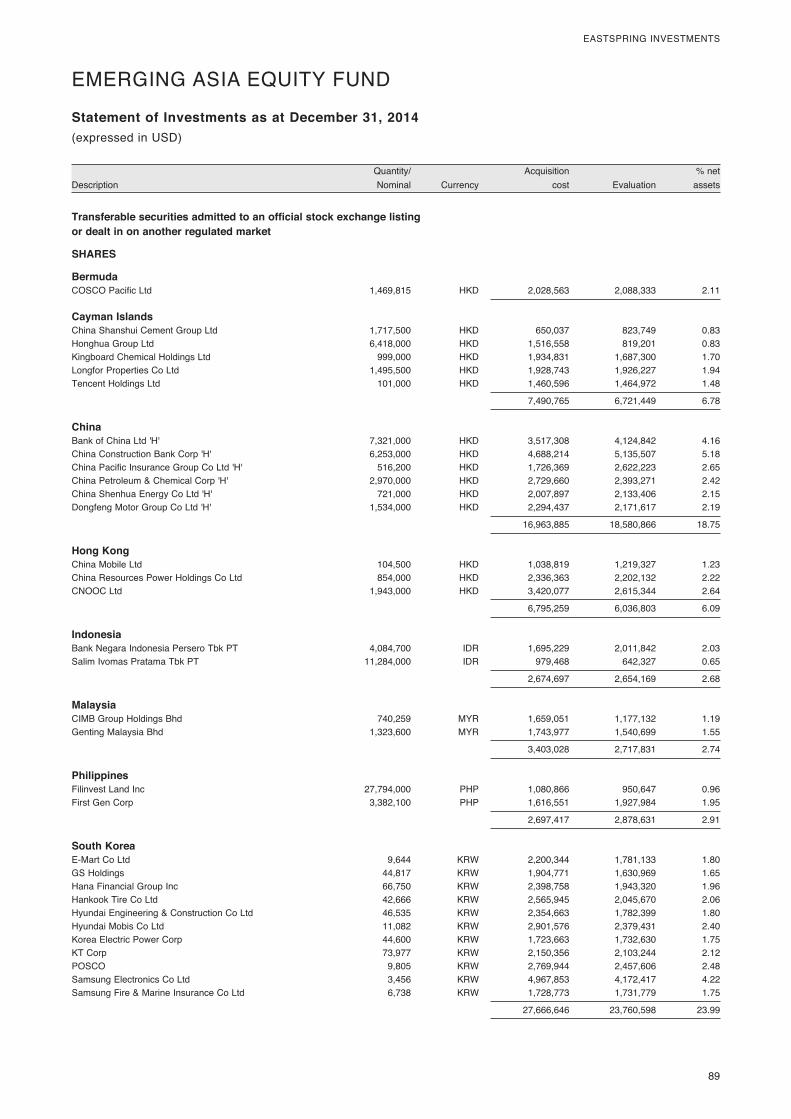
� 89
EASTSPRING�INVESTMENTS
� Quantity/�� � Acquisition�� � %�net�Description� Nominal�� Currency�� cost�� Evaluation�� assets�
Statement of Investments as at December 31, 2014(expressed�in�USD)
Transferable securities admitted to an official stock exchange listing or dealt in on another regulated market
SHARES
Bermuda COSCO�Pacific�Ltd�� 1,469,815� HKD� 2,028,563� 2,088,333� 2.11
Cayman Islands China�Shanshui�Cement�Group�Ltd� 1,717,500� HKD� 650,037� 823,749� 0.83Honghua�Group�Ltd� 6,418,000� HKD� 1,516,558� 819,201� 0.83Kingboard�Chemical�Holdings�Ltd� 999,000� HKD� 1,934,831� 1,687,300� 1.70Longfor�Properties�Co�Ltd� 1,495,500� HKD� 1,928,743� 1,926,227� 1.94Tencent�Holdings�Ltd�� 101,000� HKD� 1,460,596� 1,464,972� 1.48
� � � 7,490,765� 6,721,449� 6.78
China Bank�of�China�Ltd�'H'� 7,321,000� HKD� 3,517,308� 4,124,842� 4.16China�Construction�Bank�Corp�'H'� 6,253,000� HKD� 4,688,214� 5,135,507� 5.18China�Pacific�Insurance�Group�Co�Ltd�'H'� 516,200� HKD� 1,726,369� 2,622,223� 2.65China�Petroleum�&�Chemical�Corp�'H'� 2,970,000� HKD� 2,729,660� 2,393,271� 2.42China�Shenhua�Energy�Co�Ltd�'H'� 721,000� HKD� 2,007,897� 2,133,406� 2.15Dongfeng�Motor�Group�Co�Ltd�'H'�� 1,534,000� HKD� 2,294,437� 2,171,617� 2.19
� � � 16,963,885� 18,580,866� 18.75
Hong Kong China�Mobile�Ltd� 104,500� HKD� 1,038,819� 1,219,327� 1.23China�Resources�Power�Holdings�Co�Ltd� 854,000� HKD� 2,336,363� 2,202,132� 2.22CNOOC�Ltd�� 1,943,000� HKD� 3,420,077� 2,615,344� 2.64
� � � 6,795,259� 6,036,803� 6.09
Indonesia Bank�Negara�Indonesia�Persero�Tbk�PT� 4,084,700� IDR� 1,695,229� 2,011,842� 2.03Salim�Ivomas�Pratama�Tbk�PT�� 11,284,000� IDR� 979,468� 642,327� 0.65
� � � 2,674,697� 2,654,169� 2.68
Malaysia CIMB�Group�Holdings�Bhd� 740,259� MYR� 1,659,051� 1,177,132� 1.19Genting�Malaysia�Bhd�� 1,323,600� MYR� 1,743,977� 1,540,699� 1.55
� � � 3,403,028� 2,717,831� 2.74
Philippines Filinvest�Land�Inc� 27,794,000� PHP� 1,080,866� 950,647� 0.96First�Gen�Corp�� 3,382,100� PHP� 1,616,551� 1,927,984� 1.95
� � � 2,697,417� 2,878,631� 2.91
South Korea E-Mart�Co�Ltd� 9,644� KRW� 2,200,344� 1,781,133� 1.80GS�Holdings� 44,817� KRW� 1,904,771� 1,630,969� 1.65Hana�Financial�Group�Inc� 66,750� KRW� 2,398,758� 1,943,320� 1.96Hankook�Tire�Co�Ltd� 42,666� KRW� 2,565,945� 2,045,670� 2.06Hyundai�Engineering�&�Construction�Co�Ltd� 46,535� KRW� 2,354,663� 1,782,399� 1.80Hyundai�Mobis�Co�Ltd� 11,082� KRW� 2,901,576� 2,379,431� 2.40Korea�Electric�Power�Corp� 44,600� KRW� 1,723,663� 1,732,630� 1.75KT�Corp� 73,977� KRW� 2,150,356� 2,103,244� 2.12POSCO� 9,805� KRW� 2,769,944� 2,457,606� 2.48Samsung�Electronics�Co�Ltd� 3,456� KRW� 4,967,853� 4,172,417� 4.22Samsung�Fire�&�Marine�Insurance�Co�Ltd�� 6,738� KRW� 1,728,773� 1,731,779� 1.75
� � � 27,666,646� 23,760,598� 23.99
EMERGING�ASIA�EQUITY�FUND
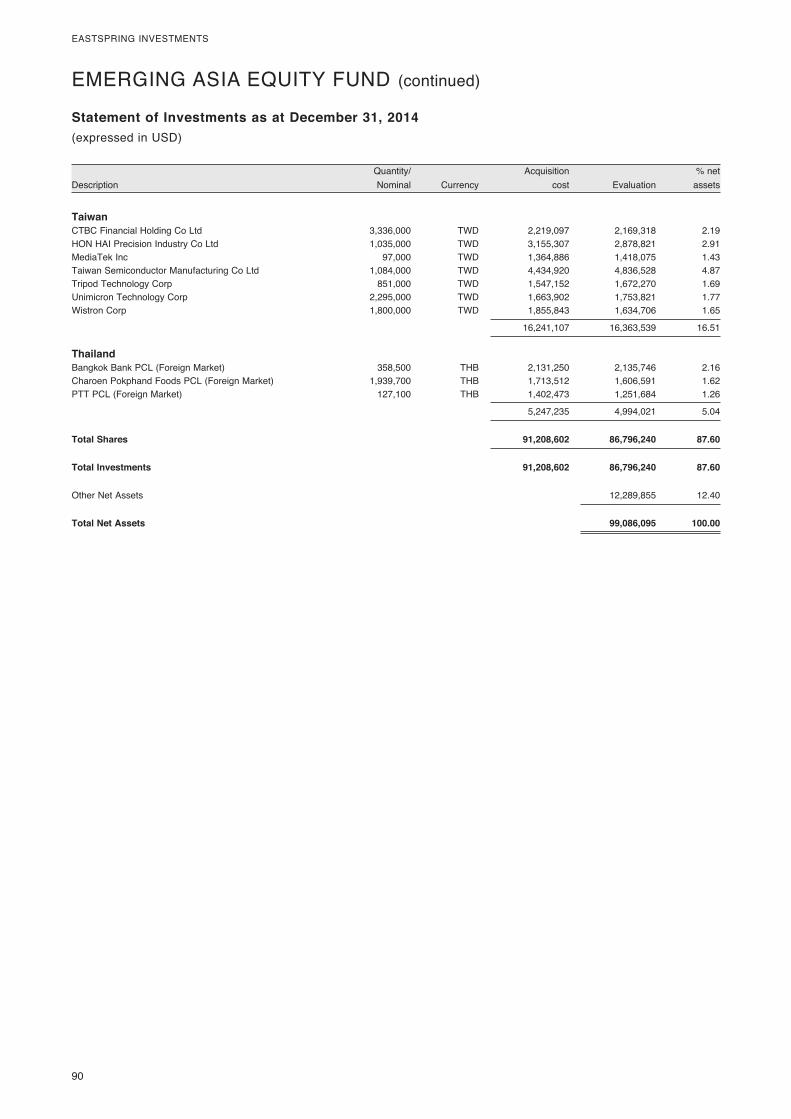
90�
EASTSPRING�INVESTMENTS
� Quantity/�� � Acquisition�� � %�net�Description� Nominal�� Currency�� cost�� Evaluation�� assets�
Statement of Investments as at December 31, 2014(expressed�in�USD)
Taiwan CTBC�Financial�Holding�Co�Ltd� 3,336,000� TWD� 2,219,097� 2,169,318� 2.19HON�HAI�Precision�Industry�Co�Ltd� 1,035,000� TWD� 3,155,307� 2,878,821� 2.91MediaTek�Inc� 97,000� TWD� 1,364,886� 1,418,075� 1.43Taiwan�Semiconductor�Manufacturing�Co�Ltd� 1,084,000� TWD� 4,434,920� 4,836,528� 4.87Tripod�Technology�Corp� 851,000� TWD� 1,547,152� 1,672,270� 1.69Unimicron�Technology�Corp� 2,295,000� TWD� 1,663,902� 1,753,821� 1.77Wistron�Corp�� 1,800,000� TWD� 1,855,843� 1,634,706� 1.65
� � � 16,241,107� 16,363,539� 16.51
Thailand Bangkok�Bank�PCL�(Foreign�Market)� 358,500� THB� 2,131,250� 2,135,746� 2.16Charoen�Pokphand�Foods�PCL�(Foreign�Market)� 1,939,700� THB� 1,713,512� 1,606,591� 1.62PTT�PCL�(Foreign�Market)�� 127,100� THB� 1,402,473� 1,251,684� 1.26
� � � 5,247,235� 4,994,021� 5.04
Total Shares 91,208,602 86,796,240 87.60
Total Investments 91,208,602 86,796,240 87.60
Other�Net�Assets� � � � 12,289,855� 12.40
Total Net Assets 99,086,095 100.00
EMERGING�ASIA�EQUITY�FUND�(continued)
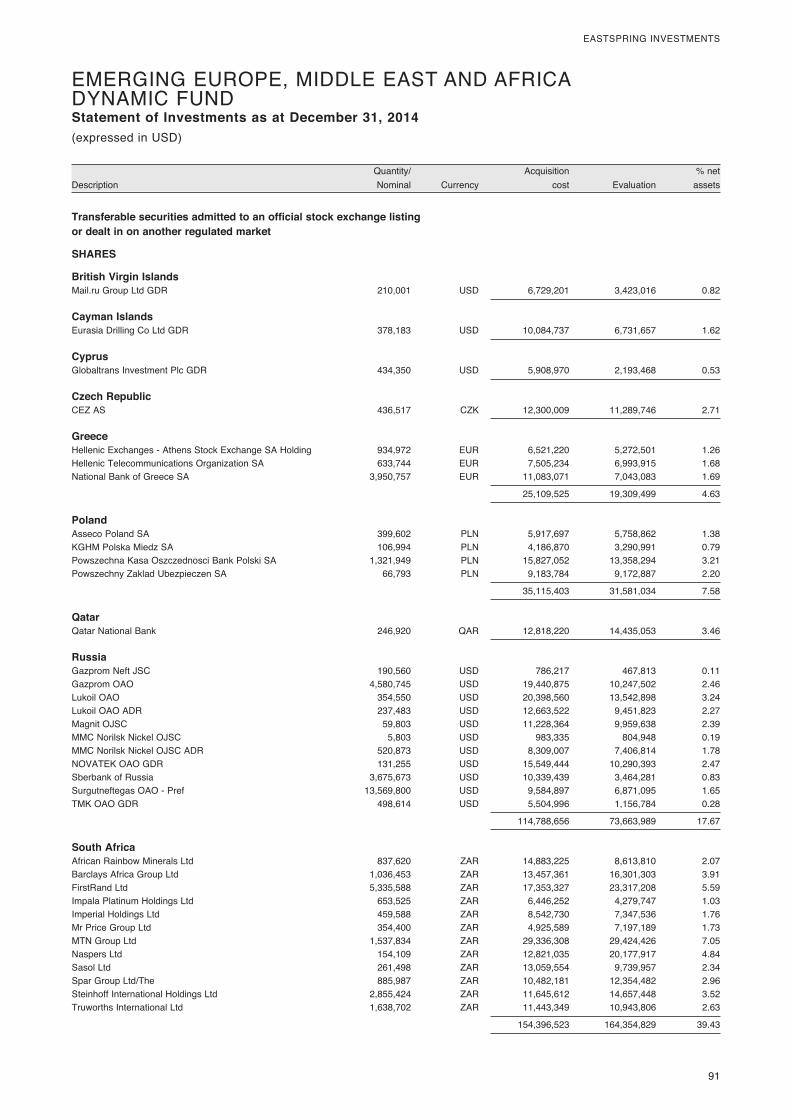
� 91
EASTSPRING�INVESTMENTS
� Quantity/�� � Acquisition�� � %�net�Description� Nominal�� Currency�� cost�� Evaluation�� assets�
Statement of Investments as at December 31, 2014(expressed�in�USD)
EMERGING�EUROPE,�MIDDLE�EAST�AND�AFRICA��DYNAMIC�FUND
Transferable securities admitted to an official stock exchange listing or dealt in on another regulated market
SHARES
British Virgin Islands Mail.ru�Group�Ltd�GDR�� 210,001� USD� 6,729,201� 3,423,016� 0.82
Cayman Islands Eurasia�Drilling�Co�Ltd�GDR�� 378,183� USD� 10,084,737� 6,731,657� 1.62
Cyprus Globaltrans�Investment�Plc�GDR�� 434,350� USD� 5,908,970� 2,193,468� 0.53
Czech Republic CEZ�AS�� 436,517� CZK� 12,300,009� 11,289,746� 2.71
Greece Hellenic�Exchanges�-�Athens�Stock�Exchange�SA�Holding� 934,972� EUR� 6,521,220� 5,272,501� 1.26Hellenic�Telecommunications�Organization�SA� 633,744� EUR� 7,505,234� 6,993,915� 1.68National�Bank�of�Greece�SA�� 3,950,757� EUR� 11,083,071� 7,043,083� 1.69
� � � 25,109,525� 19,309,499� 4.63
Poland Asseco�Poland�SA� 399,602� PLN� 5,917,697� 5,758,862� 1.38KGHM�Polska�Miedz�SA� 106,994� PLN� 4,186,870� 3,290,991� 0.79Powszechna�Kasa�Oszczednosci�Bank�Polski�SA� 1,321,949� PLN� 15,827,052� 13,358,294� 3.21Powszechny�Zaklad�Ubezpieczen�SA�� 66,793� PLN� 9,183,784� 9,172,887� 2.20
� � � 35,115,403� 31,581,034� 7.58
Qatar Qatar�National�Bank�� 246,920� QAR� 12,818,220� 14,435,053� 3.46
Russia Gazprom�Neft�JSC� 190,560� USD� 786,217� 467,813� 0.11Gazprom�OAO� 4,580,745� USD� 19,440,875� 10,247,502� 2.46Lukoil�OAO� 354,550� USD� 20,398,560� 13,542,898� 3.24Lukoil�OAO�ADR� 237,483� USD� 12,663,522� 9,451,823� 2.27Magnit�OJSC� 59,803� USD� 11,228,364� 9,959,638� 2.39MMC�Norilsk�Nickel�OJSC� 5,803� USD� 983,335� 804,948� 0.19MMC�Norilsk�Nickel�OJSC�ADR� 520,873� USD� 8,309,007� 7,406,814� 1.78NOVATEK�OAO�GDR� 131,255� USD� 15,549,444� 10,290,393� 2.47Sberbank�of�Russia� 3,675,673� USD� 10,339,439� 3,464,281� 0.83Surgutneftegas�OAO�-�Pref� 13,569,800� USD� 9,584,897� 6,871,095� 1.65TMK�OAO�GDR�� 498,614� USD� 5,504,996� 1,156,784� 0.28
� � � 114,788,656� 73,663,989� 17.67
South Africa African�Rainbow�Minerals�Ltd� 837,620� ZAR� 14,883,225� 8,613,810� 2.07Barclays�Africa�Group�Ltd� 1,036,453� ZAR� 13,457,361� 16,301,303� 3.91FirstRand�Ltd� 5,335,588� ZAR� 17,353,327� 23,317,208� 5.59Impala�Platinum�Holdings�Ltd� 653,525� ZAR� 6,446,252� 4,279,747� 1.03Imperial�Holdings�Ltd� 459,588� ZAR� 8,542,730� 7,347,536� 1.76Mr�Price�Group�Ltd� 354,400� ZAR� 4,925,589� 7,197,189� 1.73MTN�Group�Ltd� 1,537,834� ZAR� 29,336,308� 29,424,426� 7.05Naspers�Ltd� 154,109� ZAR� 12,821,035� 20,177,917� 4.84Sasol�Ltd� 261,498� ZAR� 13,059,554� 9,739,957� 2.34Spar�Group�Ltd/The� 885,987� ZAR� 10,482,181� 12,354,482� 2.96Steinhoff�International�Holdings�Ltd� 2,855,424� ZAR� 11,645,612� 14,657,448� 3.52Truworths�International�Ltd�� 1,638,702� ZAR� 11,443,349� 10,943,806� 2.63
� � � 154,396,523� 164,354,829� 39.43
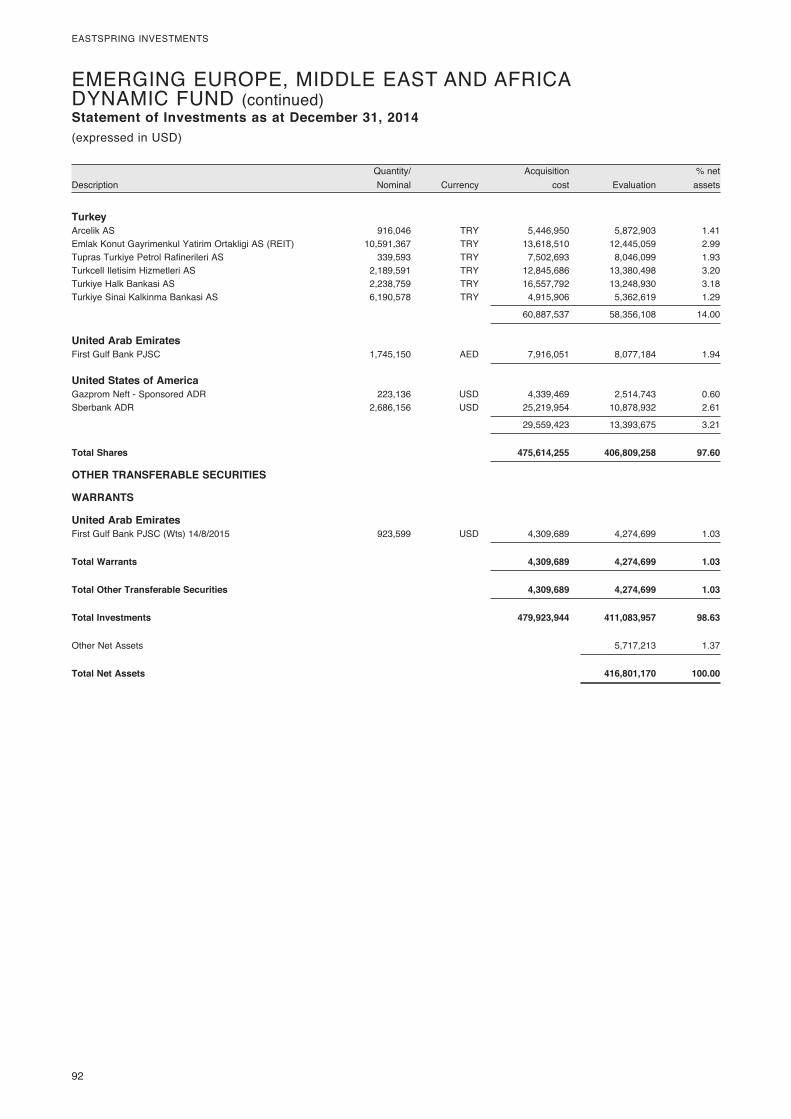
92�
EASTSPRING�INVESTMENTS
� Quantity/�� � Acquisition�� � %�net�Description� Nominal�� Currency�� cost�� Evaluation�� assets�
Statement of Investments as at December 31, 2014(expressed�in�USD)
EMERGING�EUROPE,�MIDDLE�EAST�AND�AFRICA��DYNAMIC�FUND�(continued)
Turkey Arcelik�AS� 916,046� TRY� 5,446,950� 5,872,903� 1.41Emlak�Konut�Gayrimenkul�Yatirim�Ortakligi�AS�(REIT)� 10,591,367� TRY� 13,618,510� 12,445,059� 2.99Tupras�Turkiye�Petrol�Rafinerileri�AS� 339,593� TRY� 7,502,693� 8,046,099� 1.93Turkcell�Iletisim�Hizmetleri�AS� 2,189,591� TRY� 12,845,686� 13,380,498� 3.20Turkiye�Halk�Bankasi�AS� 2,238,759� TRY� 16,557,792� 13,248,930� 3.18Turkiye�Sinai�Kalkinma�Bankasi�AS�� 6,190,578� TRY� 4,915,906� 5,362,619� 1.29
� � � 60,887,537� 58,356,108� 14.00
United Arab Emirates First�Gulf�Bank�PJSC�� 1,745,150� AED� 7,916,051� 8,077,184� 1.94
United States of America Gazprom�Neft�-�Sponsored�ADR� 223,136� USD� 4,339,469� 2,514,743� 0.60Sberbank�ADR�� 2,686,156� USD� 25,219,954� 10,878,932� 2.61
� � � 29,559,423� 13,393,675� 3.21
Total Shares 475,614,255 406,809,258 97.60
OTHER TRANSFERABLE SECURITIES
WARRANTS
United Arab Emirates First�Gulf�Bank�PJSC�(Wts)�14/8/2015�� 923,599� USD� 4,309,689� 4,274,699� 1.03
Total Warrants 4,309,689 4,274,699 1.03
Total Other Transferable Securities 4,309,689 4,274,699 1.03
Total Investments 479,923,944 411,083,957 98.63
Other�Net�Assets� � � � 5,717,213� 1.37
Total Net Assets 416,801,170 100.00
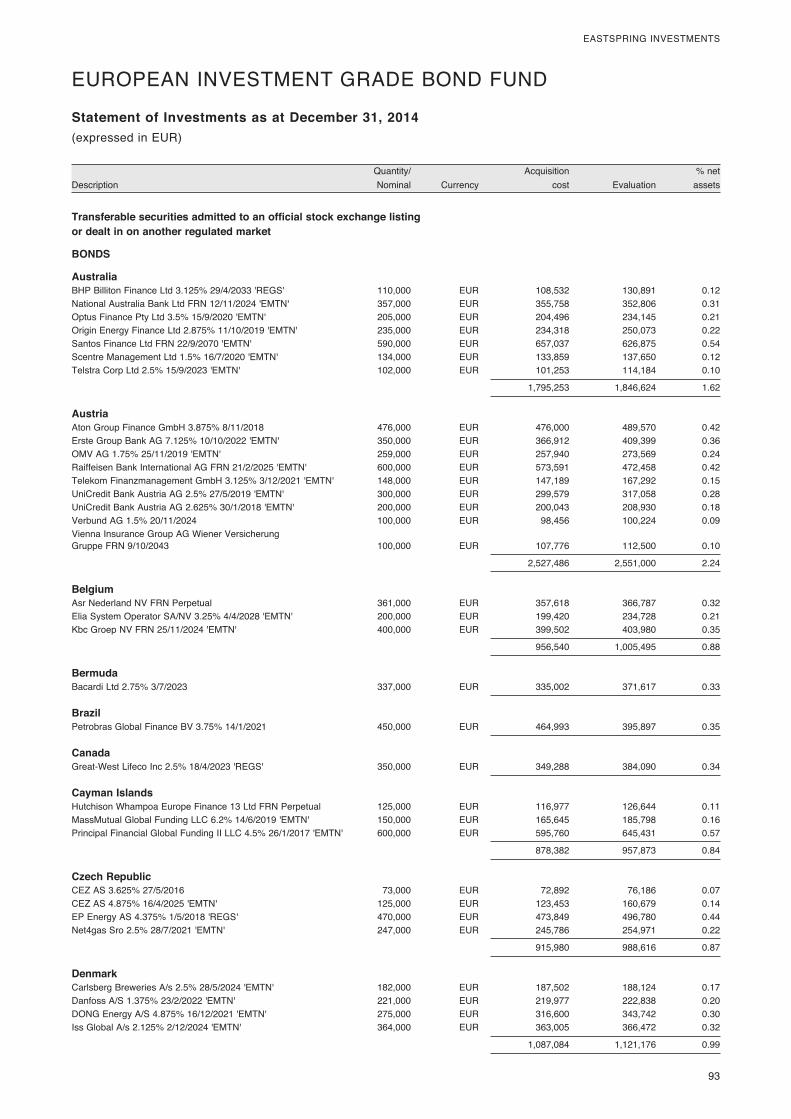
� 93
EASTSPRING�INVESTMENTS
� Quantity/�� � Acquisition�� � %�net�Description� Nominal�� Currency�� cost�� Evaluation�� assets�
Statement of Investments as at December 31, 2014(expressed�in�USD)(expressed�in�EUR)
EUROPEAN�INVESTMENT�GRADE�BOND�FUND�
Transferable securities admitted to an official stock exchange listing or dealt in on another regulated market
BONDS
Australia BHP�Billiton�Finance�Ltd�3.125%�29/4/2033�'REGS'� 110,000� EUR� 108,532� 130,891� 0.12National�Australia�Bank�Ltd�FRN�12/11/2024�'EMTN'� 357,000� EUR� 355,758� 352,806� 0.31Optus�Finance�Pty�Ltd�3.5%�15/9/2020�'EMTN'� 205,000� EUR� 204,496� 234,145� 0.21Origin�Energy�Finance�Ltd�2.875%�11/10/2019�'EMTN'� 235,000� EUR� 234,318� 250,073� 0.22Santos�Finance�Ltd�FRN�22/9/2070�'EMTN'� 590,000� EUR� 657,037� 626,875� 0.54Scentre�Management�Ltd�1.5%�16/7/2020�'EMTN'� 134,000� EUR� 133,859� 137,650� 0.12Telstra�Corp�Ltd�2.5%�15/9/2023�'EMTN'� 102,000� EUR� 101,253� 114,184� 0.10
� � � 1,795,253� 1,846,624� 1.62
Austria Aton�Group�Finance�GmbH�3.875%�8/11/2018�� 476,000� EUR� 476,000� 489,570� 0.42Erste�Group�Bank�AG�7.125%�10/10/2022�'EMTN'� 350,000� EUR� 366,912� 409,399� 0.36OMV�AG�1.75%�25/11/2019�'EMTN'� 259,000� EUR� 257,940� 273,569� 0.24Raiffeisen�Bank�International�AG�FRN�21/2/2025�'EMTN'� 600,000� EUR� 573,591� 472,458� 0.42Telekom�Finanzmanagement�GmbH�3.125%�3/12/2021�'EMTN'� 148,000� EUR� 147,189� 167,292� 0.15UniCredit�Bank�Austria�AG�2.5%�27/5/2019�'EMTN'� 300,000� EUR� 299,579� 317,058� 0.28UniCredit�Bank�Austria�AG�2.625%�30/1/2018�'EMTN'� 200,000� EUR� 200,043� 208,930� 0.18Verbund�AG�1.5%�20/11/2024�� 100,000� EUR� 98,456� 100,224� 0.09Vienna�Insurance�Group�AG�Wiener�Versicherung��Gruppe�FRN�9/10/2043�� 100,000� EUR� 107,776� 112,500� 0.10
� � � 2,527,486� 2,551,000� 2.24
Belgium Asr�Nederland�NV�FRN�Perpetual�� 361,000� EUR� 357,618� 366,787� 0.32Elia�System�Operator�SA/NV�3.25%�4/4/2028�'EMTN'� 200,000� EUR� 199,420� 234,728� 0.21Kbc�Groep�NV�FRN�25/11/2024�'EMTN'� 400,000� EUR� 399,502� 403,980� 0.35
� � � 956,540� 1,005,495� 0.88
Bermuda Bacardi�Ltd�2.75%�3/7/2023�� 337,000� EUR� 335,002� 371,617� 0.33
Brazil Petrobras�Global�Finance�BV�3.75%�14/1/2021�� 450,000� EUR� 464,993� 395,897� 0.35
Canada Great-West�Lifeco�Inc�2.5%�18/4/2023�'REGS'� 350,000� EUR� 349,288� 384,090� 0.34
Cayman Islands Hutchison�Whampoa�Europe�Finance�13�Ltd�FRN�Perpetual�� 125,000� EUR� 116,977� 126,644� 0.11MassMutual�Global�Funding�LLC�6.2%�14/6/2019�'EMTN'� 150,000� EUR� 165,645� 185,798� 0.16Principal�Financial�Global�Funding�II�LLC�4.5%�26/1/2017�'EMTN'� 600,000� EUR� 595,760� 645,431� 0.57
� � � 878,382� 957,873� 0.84
Czech Republic CEZ�AS�3.625%�27/5/2016�� 73,000� EUR� 72,892� 76,186� 0.07CEZ�AS�4.875%�16/4/2025�'EMTN'� 125,000� EUR� 123,453� 160,679� 0.14EP�Energy�AS�4.375%�1/5/2018�'REGS'� 470,000� EUR� 473,849� 496,780� 0.44Net4gas�Sro�2.5%�28/7/2021�'EMTN'� 247,000� EUR� 245,786� 254,971� 0.22
� � � 915,980� 988,616� 0.87
Denmark Carlsberg�Breweries�A/s�2.5%�28/5/2024�'EMTN'� 182,000� EUR� 187,502� 188,124� 0.17Danfoss�A/S�1.375%�23/2/2022�'EMTN'� 221,000� EUR� 219,977� 222,838� 0.20DONG�Energy�A/S�4.875%�16/12/2021�'EMTN'� 275,000� EUR� 316,600� 343,742� 0.30Iss�Global�A/s�2.125%�2/12/2024�'EMTN'� 364,000� EUR� 363,005� 366,472� 0.32
� � � 1,087,084� 1,121,176� 0.99
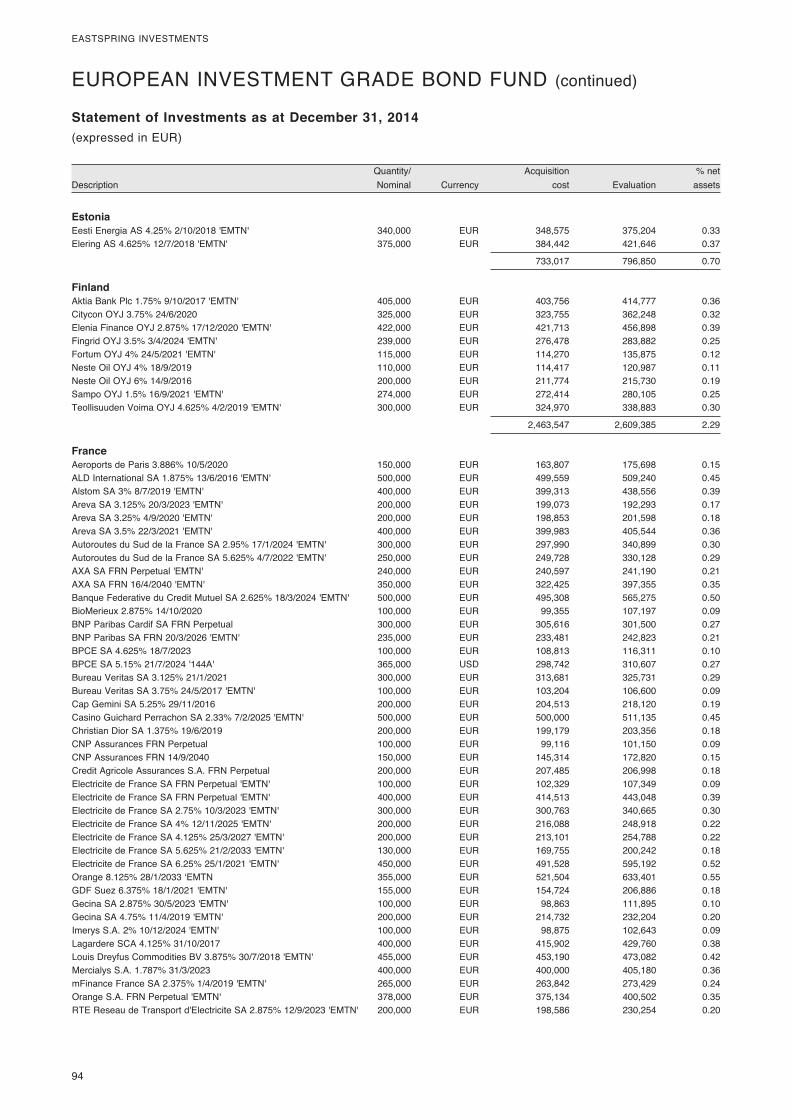
94�
EASTSPRING�INVESTMENTS
� Quantity/�� � Acquisition�� � %�net�Description� Nominal�� Currency�� cost�� Evaluation�� assets�
Statement of Investments as at December 31, 2014(expressed�in�USD)(expressed�in�EUR)
EUROPEAN�INVESTMENT�GRADE�BOND�FUND�(continued)
Estonia Eesti�Energia�AS�4.25%�2/10/2018�'EMTN'� 340,000� EUR� 348,575� 375,204� 0.33Elering�AS�4.625%�12/7/2018�'EMTN'� 375,000� EUR� 384,442� 421,646� 0.37
� � � 733,017� 796,850� 0.70
Finland Aktia�Bank�Plc�1.75%�9/10/2017�'EMTN'� 405,000� EUR� 403,756� 414,777� 0.36Citycon�OYJ�3.75%�24/6/2020�� 325,000� EUR� 323,755� 362,248� 0.32Elenia�Finance�OYJ�2.875%�17/12/2020�'EMTN'� 422,000� EUR� 421,713� 456,898� 0.39Fingrid�OYJ�3.5%�3/4/2024�'EMTN'� 239,000� EUR� 276,478� 283,882� 0.25Fortum�OYJ�4%�24/5/2021�'EMTN'� 115,000� EUR� 114,270� 135,875� 0.12Neste�Oil�OYJ�4%�18/9/2019�� 110,000� EUR� 114,417� 120,987� 0.11Neste�Oil�OYJ�6%�14/9/2016�� 200,000� EUR� 211,774� 215,730� 0.19Sampo�OYJ�1.5%�16/9/2021�'EMTN'� 274,000� EUR� 272,414� 280,105� 0.25Teollisuuden�Voima�OYJ�4.625%�4/2/2019�'EMTN'� 300,000� EUR� 324,970� 338,883� 0.30
� � � 2,463,547� 2,609,385� 2.29
France Aeroports�de�Paris�3.886%�10/5/2020�� 150,000� EUR� 163,807� 175,698� 0.15ALD�International�SA�1.875%�13/6/2016�'EMTN'� 500,000� EUR� 499,559� 509,240� 0.45Alstom�SA�3%�8/7/2019�'EMTN'� 400,000� EUR� 399,313� 438,556� 0.39Areva�SA�3.125%�20/3/2023�'EMTN'� 200,000� EUR� 199,073� 192,293� 0.17Areva�SA�3.25%�4/9/2020�'EMTN'� 200,000� EUR� 198,853� 201,598� 0.18Areva�SA�3.5%�22/3/2021�'EMTN'� 400,000� EUR� 399,983� 405,544� 0.36Autoroutes�du�Sud�de�la�France�SA�2.95%�17/1/2024�'EMTN'� 300,000� EUR� 297,990� 340,899� 0.30Autoroutes�du�Sud�de�la�France�SA�5.625%�4/7/2022�'EMTN'� 250,000� EUR� 249,728� 330,128� 0.29AXA�SA�FRN�Perpetual�'EMTN'� 240,000� EUR� 240,597� 241,190� 0.21AXA�SA�FRN�16/4/2040�'EMTN'� 350,000� EUR� 322,425� 397,355� 0.35Banque�Federative�du�Credit�Mutuel�SA�2.625%�18/3/2024�'EMTN'� 500,000� EUR� 495,308� 565,275� 0.50BioMerieux�2.875%�14/10/2020�� 100,000� EUR� 99,355� 107,197� 0.09BNP�Paribas�Cardif�SA�FRN�Perpetual�� 300,000� EUR� 305,616� 301,500� 0.27BNP�Paribas�SA�FRN�20/3/2026�'EMTN'� 235,000� EUR� 233,481� 242,823� 0.21BPCE�SA�4.625%�18/7/2023�� 100,000� EUR� 108,813� 116,311� 0.10BPCE�SA�5.15%�21/7/2024�'144A'� 365,000� USD� 298,742� 310,607� 0.27Bureau�Veritas�SA�3.125%�21/1/2021�� 300,000� EUR� 313,681� 325,731� 0.29Bureau�Veritas�SA�3.75%�24/5/2017�'EMTN'� 100,000� EUR� 103,204� 106,600� 0.09Cap�Gemini�SA�5.25%�29/11/2016�� 200,000� EUR� 204,513� 218,120� 0.19Casino�Guichard�Perrachon�SA�2.33%�7/2/2025�'EMTN'� 500,000� EUR� 500,000� 511,135� 0.45Christian�Dior�SA�1.375%�19/6/2019�� 200,000� EUR� 199,179� 203,356� 0.18CNP�Assurances�FRN�Perpetual�� 100,000� EUR� 99,116� 101,150� 0.09CNP�Assurances�FRN�14/9/2040�� 150,000� EUR� 145,314� 172,820� 0.15Credit�Agricole�Assurances�S.A.�FRN�Perpetual�� 200,000� EUR� 207,485� 206,998� 0.18Electricite�de�France�SA�FRN�Perpetual�'EMTN'� 100,000� EUR� 102,329� 107,349� 0.09Electricite�de�France�SA�FRN�Perpetual�'EMTN'� 400,000� EUR� 414,513� 443,048� 0.39Electricite�de�France�SA�2.75%�10/3/2023�'EMTN'� 300,000� EUR� 300,763� 340,665� 0.30Electricite�de�France�SA�4%�12/11/2025�'EMTN'� 200,000� EUR� 216,088� 248,918� 0.22Electricite�de�France�SA�4.125%�25/3/2027�'EMTN'� 200,000� EUR� 213,101� 254,788� 0.22Electricite�de�France�SA�5.625%�21/2/2033�'EMTN'� 130,000� EUR� 169,755� 200,242� 0.18Electricite�de�France�SA�6.25%�25/1/2021�'EMTN'� 450,000� EUR� 491,528� 595,192� 0.52Orange�8.125%�28/1/2033�‘EMTN� 355,000� EUR� 521,504� 633,401� 0.55GDF�Suez�6.375%�18/1/2021�'EMTN'� 155,000� EUR� 154,724� 206,886� 0.18Gecina�SA�2.875%�30/5/2023�'EMTN'� 100,000� EUR� 98,863� 111,895� 0.10Gecina�SA�4.75%�11/4/2019�'EMTN'� 200,000� EUR� 214,732� 232,204� 0.20Imerys�S.A.�2%�10/12/2024�'EMTN'� 100,000� EUR� 98,875� 102,643� 0.09Lagardere�SCA�4.125%�31/10/2017�� 400,000� EUR� 415,902� 429,760� 0.38Louis�Dreyfus�Commodities�BV�3.875%�30/7/2018�'EMTN'� 455,000� EUR� 453,190� 473,082� 0.42Mercialys�S.A.�1.787%�31/3/2023�� 400,000� EUR� 400,000� 405,180� 0.36mFinance�France�SA�2.375%�1/4/2019�'EMTN'� 265,000� EUR� 263,842� 273,429� 0.24Orange�S.A.�FRN�Perpetual�'EMTN'� 378,000� EUR� 375,134� 400,502� 0.35RTE�Reseau�de�Transport�d'Electricite�SA�2.875%�12/9/2023�'EMTN'� 200,000� EUR� 198,586� 230,254� 0.20
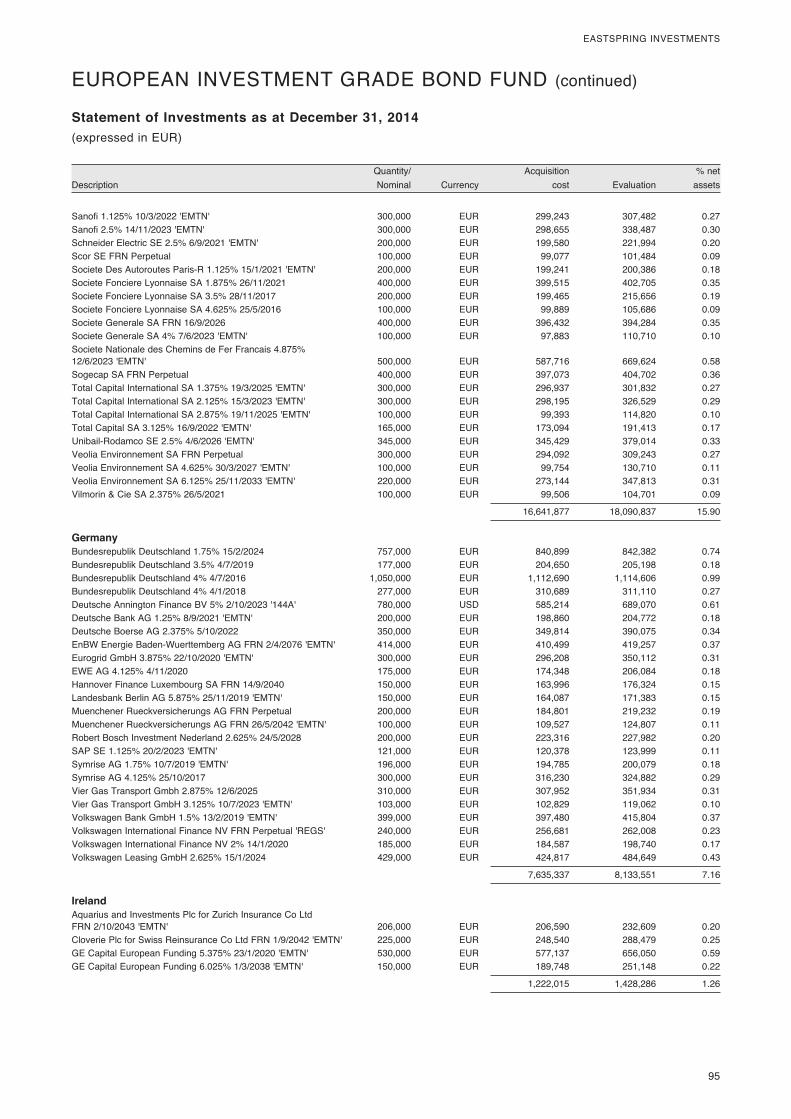
� 95
EASTSPRING�INVESTMENTS
� Quantity/�� � Acquisition�� � %�net�Description� Nominal�� Currency�� cost�� Evaluation�� assets�
Statement of Investments as at December 31, 2014(expressed�in�USD)
EUROPEAN�INVESTMENT�GRADE�BOND�FUND�(continued)
Sanofi�1.125%�10/3/2022�'EMTN'� 300,000� EUR� 299,243� 307,482� 0.27Sanofi�2.5%�14/11/2023�'EMTN'� 300,000� EUR� 298,655� 338,487� 0.30Schneider�Electric�SE�2.5%�6/9/2021�'EMTN'� 200,000� EUR� 199,580� 221,994� 0.20Scor�SE�FRN�Perpetual�� 100,000� EUR� 99,077� 101,484� 0.09Societe�Des�Autoroutes�Paris-R�1.125%�15/1/2021�'EMTN'� 200,000� EUR� 199,241� 200,386� 0.18Societe�Fonciere�Lyonnaise�SA�1.875%�26/11/2021�� 400,000� EUR� 399,515� 402,705� 0.35Societe�Fonciere�Lyonnaise�SA�3.5%�28/11/2017�� 200,000� EUR� 199,465� 215,656� 0.19Societe�Fonciere�Lyonnaise�SA�4.625%�25/5/2016�� 100,000� EUR� 99,889� 105,686� 0.09Societe�Generale�SA�FRN�16/9/2026�� 400,000� EUR� 396,432� 394,284� 0.35Societe�Generale�SA�4%�7/6/2023�'EMTN'� 100,000� EUR� 97,883� 110,710� 0.10Societe�Nationale�des�Chemins�de�Fer�Francais�4.875%��12/6/2023�'EMTN'� 500,000� EUR� 587,716� 669,624� 0.58Sogecap�SA�FRN�Perpetual�� 400,000� EUR� 397,073� 404,702� 0.36Total�Capital�International�SA�1.375%�19/3/2025�'EMTN'� 300,000� EUR� 296,937� 301,832� 0.27Total�Capital�International�SA�2.125%�15/3/2023�'EMTN'� 300,000� EUR� 298,195� 326,529� 0.29Total�Capital�International�SA�2.875%�19/11/2025�'EMTN'� 100,000� EUR� 99,393� 114,820� 0.10Total�Capital�SA�3.125%�16/9/2022�'EMTN'� 165,000� EUR� 173,094� 191,413� 0.17Unibail-Rodamco�SE�2.5%�4/6/2026�'EMTN'� 345,000� EUR� 345,429� 379,014� 0.33Veolia�Environnement�SA�FRN�Perpetual�� 300,000� EUR� 294,092� 309,243� 0.27Veolia�Environnement�SA�4.625%�30/3/2027�'EMTN'� 100,000� EUR� 99,754� 130,710� 0.11Veolia�Environnement�SA�6.125%�25/11/2033�'EMTN'� 220,000� EUR� 273,144� 347,813� 0.31Vilmorin�&�Cie�SA�2.375%�26/5/2021�� 100,000� EUR� 99,506� 104,701� 0.09
� � � 16,641,877� 18,090,837� 15.90
Germany Bundesrepublik�Deutschland�1.75%�15/2/2024�� 757,000� EUR� 840,899� 842,382� 0.74Bundesrepublik�Deutschland�3.5%�4/7/2019�� 177,000� EUR� 204,650� 205,198� 0.18Bundesrepublik�Deutschland�4%�4/7/2016�� 1,050,000� EUR� 1,112,690� 1,114,606� 0.99Bundesrepublik�Deutschland�4%�4/1/2018�� 277,000� EUR� 310,689� 311,110� 0.27Deutsche�Annington�Finance�BV�5%�2/10/2023�'144A'� 780,000� USD� 585,214� 689,070� 0.61Deutsche�Bank�AG�1.25%�8/9/2021�'EMTN'� 200,000� EUR� 198,860� 204,772� 0.18Deutsche�Boerse�AG�2.375%�5/10/2022�� 350,000� EUR� 349,814� 390,075� 0.34EnBW�Energie�Baden-Wuerttemberg�AG�FRN�2/4/2076�'EMTN'� 414,000� EUR� 410,499� 419,257� 0.37Eurogrid�GmbH�3.875%�22/10/2020�'EMTN'� 300,000� EUR� 296,208� 350,112� 0.31EWE�AG�4.125%�4/11/2020�� 175,000� EUR� 174,348� 206,084� 0.18Hannover�Finance�Luxembourg�SA�FRN�14/9/2040�� 150,000� EUR� 163,996� 176,324� 0.15Landesbank�Berlin�AG�5.875%�25/11/2019�'EMTN'� 150,000� EUR� 164,087� 171,383� 0.15Muenchener�Rueckversicherungs�AG�FRN�Perpetual�� 200,000� EUR� 184,801� 219,232� 0.19Muenchener�Rueckversicherungs�AG�FRN�26/5/2042�'EMTN'� 100,000� EUR� 109,527� 124,807� 0.11Robert�Bosch�Investment�Nederland�2.625%�24/5/2028�� 200,000� EUR� 223,316� 227,982� 0.20SAP�SE�1.125%�20/2/2023�'EMTN'� 121,000� EUR� 120,378� 123,999� 0.11Symrise�AG�1.75%�10/7/2019�'EMTN'� 196,000� EUR� 194,785� 200,079� 0.18Symrise�AG�4.125%�25/10/2017�� 300,000� EUR� 316,230� 324,882� 0.29Vier�Gas�Transport�Gmbh�2.875%�12/6/2025�� 310,000� EUR� 307,952� 351,934� 0.31Vier�Gas�Transport�GmbH�3.125%�10/7/2023�'EMTN'� 103,000� EUR� 102,829� 119,062� 0.10Volkswagen�Bank�GmbH�1.5%�13/2/2019�'EMTN'� 399,000� EUR� 397,480� 415,804� 0.37Volkswagen�International�Finance�NV�FRN�Perpetual�'REGS'� 240,000� EUR� 256,681� 262,008� 0.23Volkswagen�International�Finance�NV�2%�14/1/2020�� 185,000� EUR� 184,587� 198,740� 0.17Volkswagen�Leasing�GmbH�2.625%�15/1/2024�� 429,000� EUR� 424,817� 484,649� 0.43
� � � 7,635,337� 8,133,551� 7.16
Ireland Aquarius�and�Investments�Plc�for�Zurich�Insurance�Co�Ltd��FRN�2/10/2043�'EMTN'� 206,000� EUR� 206,590� 232,609� 0.20Cloverie�Plc�for�Swiss�Reinsurance�Co�Ltd�FRN�1/9/2042�'EMTN'� 225,000� EUR� 248,540� 288,479� 0.25GE�Capital�European�Funding�5.375%�23/1/2020�'EMTN'� 530,000� EUR� 577,137� 656,050� 0.59GE�Capital�European�Funding�6.025%�1/3/2038�'EMTN'� 150,000� EUR� 189,748� 251,148� 0.22
� � � 1,222,015� 1,428,286� 1.26
(expressed�in�EUR)
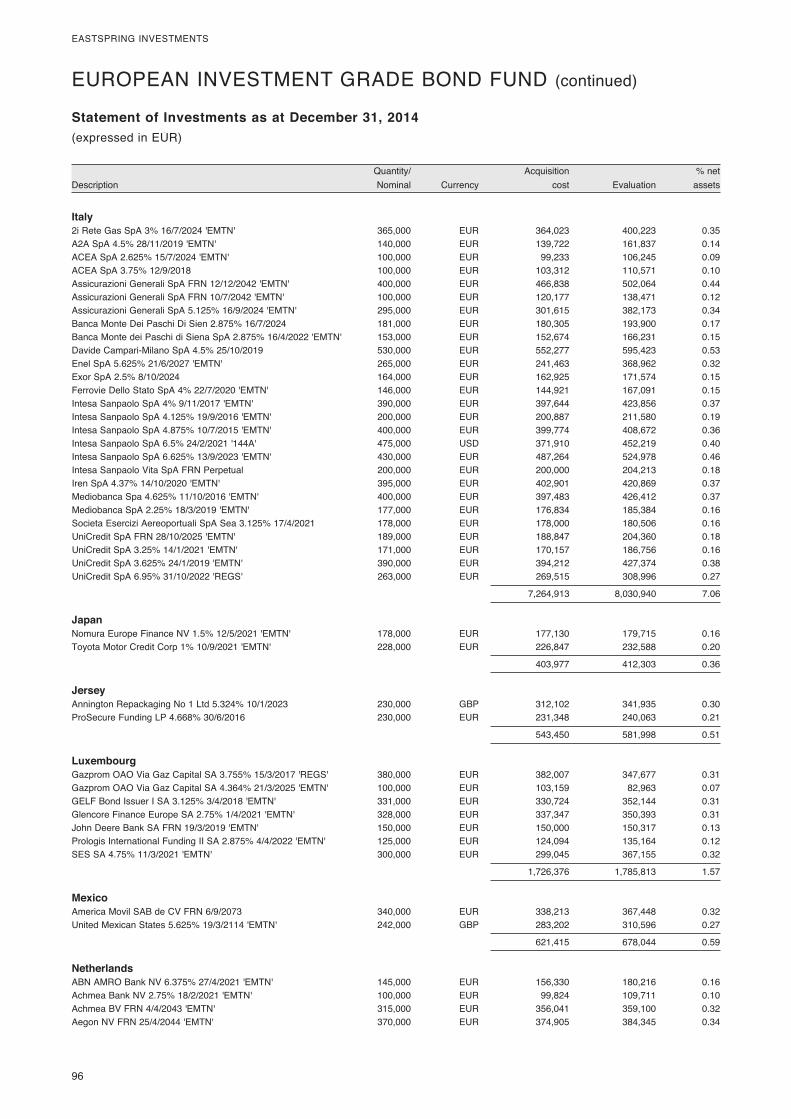
96�
EASTSPRING�INVESTMENTS
� Quantity/�� � Acquisition�� � %�net�Description� Nominal�� Currency�� cost�� Evaluation�� assets�
Statement of Investments as at December 31, 2014(expressed�in�USD)(expressed�in�EUR)
EUROPEAN�INVESTMENT�GRADE�BOND�FUND�(continued)
Italy 2i�Rete�Gas�SpA�3%�16/7/2024�'EMTN'� 365,000� EUR� 364,023� 400,223� 0.35A2A�SpA�4.5%�28/11/2019�'EMTN'� 140,000� EUR� 139,722� 161,837� 0.14ACEA�SpA�2.625%�15/7/2024�'EMTN'� 100,000� EUR� 99,233� 106,245� 0.09ACEA�SpA�3.75%�12/9/2018�� 100,000� EUR� 103,312� 110,571� 0.10Assicurazioni�Generali�SpA�FRN�12/12/2042�'EMTN'� 400,000� EUR� 466,838� 502,064� 0.44Assicurazioni�Generali�SpA�FRN�10/7/2042�'EMTN'� 100,000� EUR� 120,177� 138,471� 0.12Assicurazioni�Generali�SpA�5.125%�16/9/2024�'EMTN'� 295,000� EUR� 301,615� 382,173� 0.34Banca�Monte�Dei�Paschi�Di�Sien�2.875%�16/7/2024�� 181,000� EUR� 180,305� 193,900� 0.17Banca�Monte�dei�Paschi�di�Siena�SpA�2.875%�16/4/2022�'EMTN'� 153,000� EUR� 152,674� 166,231� 0.15Davide�Campari-Milano�SpA�4.5%�25/10/2019�� 530,000� EUR� 552,277� 595,423� 0.53Enel�SpA�5.625%�21/6/2027�'EMTN'� 265,000� EUR� 241,463� 368,962� 0.32Exor�SpA�2.5%�8/10/2024�� 164,000� EUR� 162,925� 171,574� 0.15Ferrovie�Dello�Stato�SpA�4%�22/7/2020�'EMTN'� 146,000� EUR� 144,921� 167,091� 0.15Intesa�Sanpaolo�SpA�4%�9/11/2017�'EMTN'� 390,000� EUR� 397,644� 423,856� 0.37Intesa�Sanpaolo�SpA�4.125%�19/9/2016�'EMTN'� 200,000� EUR� 200,887� 211,580� 0.19Intesa�Sanpaolo�SpA�4.875%�10/7/2015�'EMTN'� 400,000� EUR� 399,774� 408,672� 0.36Intesa�Sanpaolo�SpA�6.5%�24/2/2021�'144A'� 475,000� USD� 371,910� 452,219� 0.40Intesa�Sanpaolo�SpA�6.625%�13/9/2023�'EMTN'� 430,000� EUR� 487,264� 524,978� 0.46Intesa�Sanpaolo�Vita�SpA�FRN�Perpetual�� 200,000� EUR� 200,000� 204,213� 0.18Iren�SpA�4.37%�14/10/2020�'EMTN'� 395,000� EUR� 402,901� 420,869� 0.37Mediobanca�Spa�4.625%�11/10/2016�'EMTN'� 400,000� EUR� 397,483� 426,412� 0.37Mediobanca�SpA�2.25%�18/3/2019�'EMTN'� 177,000� EUR� 176,834� 185,384� 0.16Societa�Esercizi�Aereoportuali�SpA�Sea�3.125%�17/4/2021�� 178,000� EUR� 178,000� 180,506� 0.16UniCredit�SpA�FRN�28/10/2025�'EMTN'� 189,000� EUR� 188,847� 204,360� 0.18UniCredit�SpA�3.25%�14/1/2021�'EMTN'� 171,000� EUR� 170,157� 186,756� 0.16UniCredit�SpA�3.625%�24/1/2019�'EMTN'� 390,000� EUR� 394,212� 427,374� 0.38UniCredit�SpA�6.95%�31/10/2022�'REGS'� 263,000� EUR� 269,515� 308,996� 0.27
� � � 7,264,913� 8,030,940� 7.06
Japan Nomura�Europe�Finance�NV�1.5%�12/5/2021�'EMTN'� 178,000� EUR� 177,130� 179,715� 0.16Toyota�Motor�Credit�Corp�1%�10/9/2021�'EMTN'� 228,000� EUR� 226,847� 232,588� 0.20
� � � 403,977� 412,303� 0.36
Jersey Annington�Repackaging�No�1�Ltd�5.324%�10/1/2023�� 230,000� GBP� 312,102� 341,935� 0.30ProSecure�Funding�LP�4.668%�30/6/2016�� 230,000� EUR� 231,348� 240,063� 0.21
� � � 543,450� 581,998� 0.51
Luxembourg Gazprom�OAO�Via�Gaz�Capital�SA�3.755%�15/3/2017�'REGS'� 380,000� EUR� 382,007� 347,677� 0.31Gazprom�OAO�Via�Gaz�Capital�SA�4.364%�21/3/2025�'EMTN'� 100,000� EUR� 103,159� 82,963� 0.07GELF�Bond�Issuer�I�SA�3.125%�3/4/2018�'EMTN'� 331,000� EUR� 330,724� 352,144� 0.31Glencore�Finance�Europe�SA�2.75%�1/4/2021�'EMTN'� 328,000� EUR� 337,347� 350,393� 0.31John�Deere�Bank�SA�FRN�19/3/2019�'EMTN'� 150,000� EUR� 150,000� 150,317� 0.13Prologis�International�Funding�II�SA�2.875%�4/4/2022�'EMTN'� 125,000� EUR� 124,094� 135,164� 0.12SES�SA�4.75%�11/3/2021�'EMTN'� 300,000� EUR� 299,045� 367,155� 0.32
� � � 1,726,376� 1,785,813� 1.57
Mexico America�Movil�SAB�de�CV�FRN�6/9/2073�� 340,000� EUR� 338,213� 367,448� 0.32United�Mexican�States�5.625%�19/3/2114�'EMTN'� 242,000� GBP� 283,202� 310,596� 0.27
� � � 621,415� 678,044� 0.59
Netherlands ABN�AMRO�Bank�NV�6.375%�27/4/2021�'EMTN'� 145,000� EUR� 156,330� 180,216� 0.16Achmea�Bank�NV�2.75%�18/2/2021�'EMTN'� 100,000� EUR� 99,824� 109,711� 0.10Achmea�BV�FRN�4/4/2043�'EMTN'� 315,000� EUR� 356,041� 359,100� 0.32Aegon�NV�FRN�25/4/2044�'EMTN'� 370,000� EUR� 374,905� 384,345� 0.34
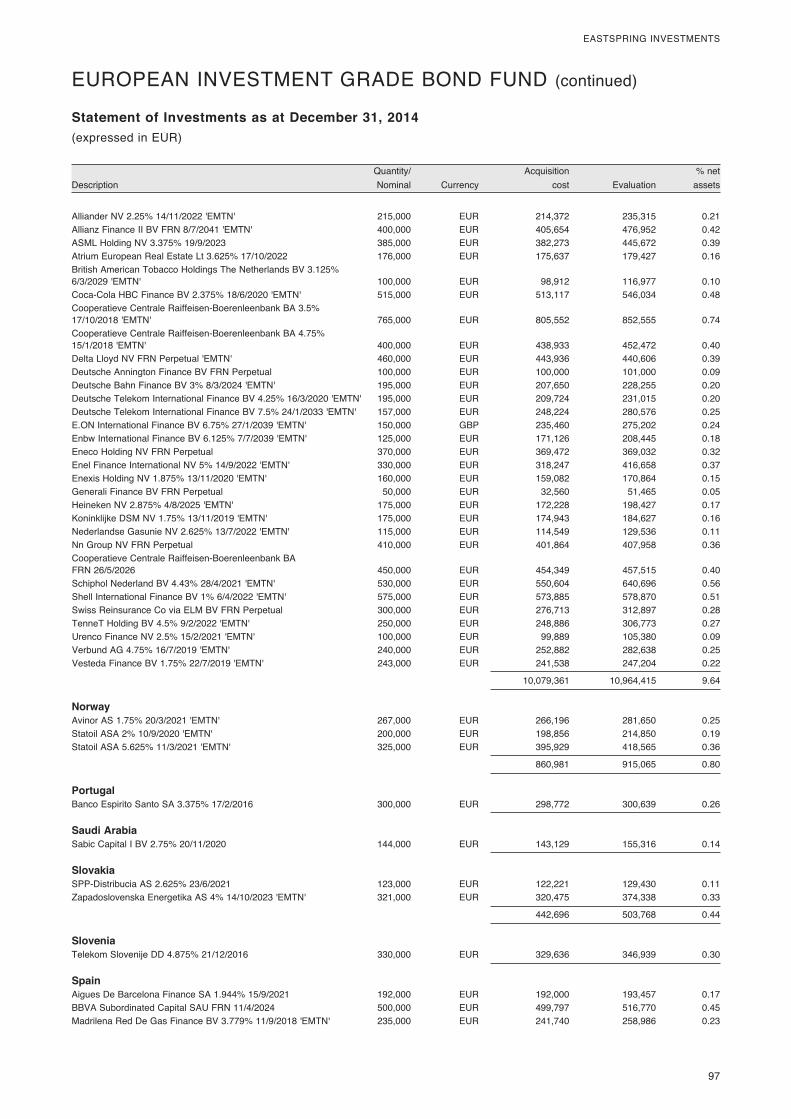
� 97
EASTSPRING�INVESTMENTS
� Quantity/�� � Acquisition�� � %�net�Description� Nominal�� Currency�� cost�� Evaluation�� assets�
Statement of Investments as at December 31, 2014(expressed�in�USD)(expressed�in�EUR)
EUROPEAN�INVESTMENT�GRADE�BOND�FUND�(continued)
Alliander�NV�2.25%�14/11/2022�'EMTN'� 215,000� EUR� 214,372� 235,315� 0.21Allianz�Finance�II�BV�FRN�8/7/2041�'EMTN'� 400,000� EUR� 405,654� 476,952� 0.42ASML�Holding�NV�3.375%�19/9/2023�� 385,000� EUR� 382,273� 445,672� 0.39Atrium�European�Real�Estate�Lt�3.625%�17/10/2022�� 176,000� EUR� 175,637� 179,427� 0.16British�American�Tobacco�Holdings�The�Netherlands�BV�3.125%��6/3/2029�'EMTN'� 100,000� EUR� 98,912� 116,977� 0.10Coca-Cola�HBC�Finance�BV�2.375%�18/6/2020�'EMTN'� 515,000� EUR� 513,117� 546,034� 0.48Cooperatieve�Centrale�Raiffeisen-Boerenleenbank�BA�3.5%��17/10/2018�'EMTN'� 765,000� EUR� 805,552� 852,555� 0.74Cooperatieve�Centrale�Raiffeisen-Boerenleenbank�BA�4.75%��15/1/2018�'EMTN'� 400,000� EUR� 438,933� 452,472� 0.40Delta�Lloyd�NV�FRN�Perpetual�'EMTN'� 460,000� EUR� 443,936� 440,606� 0.39Deutsche�Annington�Finance�BV�FRN�Perpetual�� 100,000� EUR� 100,000� 101,000� 0.09Deutsche�Bahn�Finance�BV�3%�8/3/2024�'EMTN'� 195,000� EUR� 207,650� 228,255� 0.20Deutsche�Telekom�International�Finance�BV�4.25%�16/3/2020�'EMTN'� 195,000� EUR� 209,724� 231,015� 0.20Deutsche�Telekom�International�Finance�BV�7.5%�24/1/2033�'EMTN'� 157,000� EUR� 248,224� 280,576� 0.25E.ON�International�Finance�BV�6.75%�27/1/2039�'EMTN'� 150,000� GBP� 235,460� 275,202� 0.24Enbw�International�Finance�BV�6.125%�7/7/2039�'EMTN'� 125,000� EUR� 171,126� 208,445� 0.18Eneco�Holding�NV�FRN�Perpetual�� 370,000� EUR� 369,472� 369,032� 0.32Enel�Finance�International�NV�5%�14/9/2022�'EMTN'� 330,000� EUR� 318,247� 416,658� 0.37Enexis�Holding�NV�1.875%�13/11/2020�'EMTN'� 160,000� EUR� 159,082� 170,864� 0.15Generali�Finance�BV�FRN�Perpetual�� 50,000� EUR� 32,560� 51,465� 0.05Heineken�NV�2.875%�4/8/2025�'EMTN'� 175,000� EUR� 172,228� 198,427� 0.17Koninklijke�DSM�NV�1.75%�13/11/2019�'EMTN'� 175,000� EUR� 174,943� 184,627� 0.16Nederlandse�Gasunie�NV�2.625%�13/7/2022�'EMTN'� 115,000� EUR� 114,549� 129,536� 0.11Nn�Group�NV�FRN�Perpetual�� 410,000� EUR� 401,864� 407,958� 0.36Cooperatieve�Centrale�Raiffeisen-Boerenleenbank�BA��FRN�26/5/2026�� 450,000� EUR� 454,349� 457,515� 0.40Schiphol�Nederland�BV�4.43%�28/4/2021�'EMTN'� 530,000� EUR� 550,604� 640,696� 0.56Shell�International�Finance�BV�1%�6/4/2022�'EMTN'� 575,000� EUR� 573,885� 578,870� 0.51Swiss�Reinsurance�Co�via�ELM�BV�FRN�Perpetual�� 300,000� EUR� 276,713� 312,897� 0.28TenneT�Holding�BV�4.5%�9/2/2022�'EMTN'� 250,000� EUR� 248,886� 306,773� 0.27Urenco�Finance�NV�2.5%�15/2/2021�'EMTN'� 100,000� EUR� 99,889� 105,380� 0.09Verbund�AG�4.75%�16/7/2019�'EMTN'� 240,000� EUR� 252,882� 282,638� 0.25Vesteda�Finance�BV�1.75%�22/7/2019�'EMTN'� 243,000� EUR� 241,538� 247,204� 0.22
� � � 10,079,361� 10,964,415� 9.64
Norway Avinor�AS�1.75%�20/3/2021�'EMTN'� 267,000� EUR� 266,196� 281,650� 0.25Statoil�ASA�2%�10/9/2020�'EMTN'� 200,000� EUR� 198,856� 214,850� 0.19Statoil�ASA�5.625%�11/3/2021�'EMTN'� 325,000� EUR� 395,929� 418,565� 0.36
� � � 860,981� 915,065� 0.80
Portugal Banco�Espirito�Santo�SA�3.375%�17/2/2016�� 300,000� EUR� 298,772� 300,639� 0.26
Saudi Arabia Sabic�Capital�I�BV�2.75%�20/11/2020�� 144,000� EUR� 143,129� 155,316� 0.14
Slovakia SPP-Distribucia�AS�2.625%�23/6/2021�� 123,000� EUR� 122,221� 129,430� 0.11Zapadoslovenska�Energetika�AS�4%�14/10/2023�'EMTN'� 321,000� EUR� 320,475� 374,338� 0.33
� � � 442,696� 503,768� 0.44
Slovenia Telekom�Slovenije�DD�4.875%�21/12/2016�� 330,000� EUR� 329,636� 346,939� 0.30
Spain Aigues�De�Barcelona�Finance�SA�1.944%�15/9/2021�� 192,000� EUR� 192,000� 193,457� 0.17BBVA�Subordinated�Capital�SAU�FRN�11/4/2024�� 500,000� EUR� 499,797� 516,770� 0.45Madrilena�Red�De�Gas�Finance�BV�3.779%�11/9/2018�'EMTN'� 235,000� EUR� 241,740� 258,986� 0.23
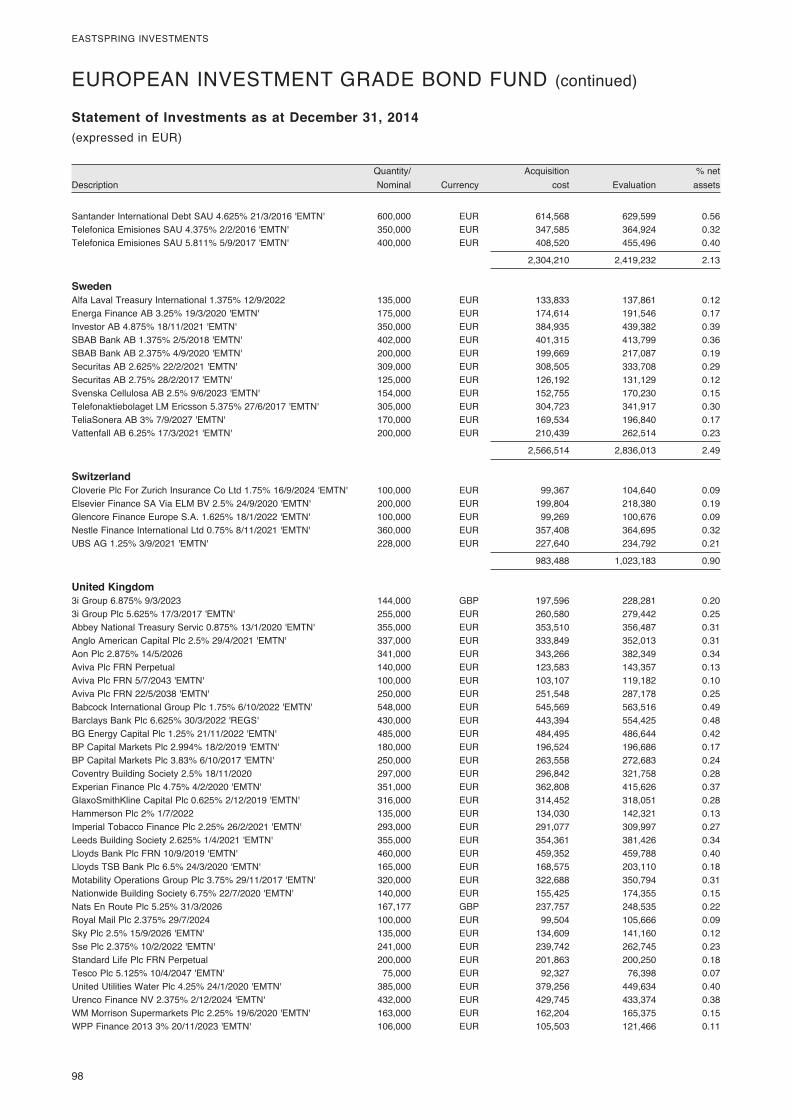
98�
EASTSPRING�INVESTMENTS
� Quantity/�� � Acquisition�� � %�net�Description� Nominal�� Currency�� cost�� Evaluation�� assets�
Statement of Investments as at December 31, 2014(expressed�in�USD)(expressed�in�EUR)
EUROPEAN�INVESTMENT�GRADE�BOND�FUND�(continued)
Santander�International�Debt�SAU�4.625%�21/3/2016�'EMTN'� 600,000� EUR� 614,568� 629,599� 0.56Telefonica�Emisiones�SAU�4.375%�2/2/2016�'EMTN'� 350,000� EUR� 347,585� 364,924� 0.32Telefonica�Emisiones�SAU�5.811%�5/9/2017�'EMTN'� 400,000� EUR� 408,520� 455,496� 0.40
� � � 2,304,210� 2,419,232� 2.13
Sweden Alfa�Laval�Treasury�International�1.375%�12/9/2022�� 135,000� EUR� 133,833� 137,861� 0.12Energa�Finance�AB�3.25%�19/3/2020�'EMTN'� 175,000� EUR� 174,614� 191,546� 0.17Investor�AB�4.875%�18/11/2021�'EMTN'� 350,000� EUR� 384,935� 439,382� 0.39SBAB�Bank�AB�1.375%�2/5/2018�'EMTN'� 402,000� EUR� 401,315� 413,799� 0.36SBAB�Bank�AB�2.375%�4/9/2020�'EMTN'� 200,000� EUR� 199,669� 217,087� 0.19Securitas�AB�2.625%�22/2/2021�'EMTN'� 309,000� EUR� 308,505� 333,708� 0.29Securitas�AB�2.75%�28/2/2017�'EMTN'� 125,000� EUR� 126,192� 131,129� 0.12Svenska�Cellulosa�AB�2.5%�9/6/2023�'EMTN'� 154,000� EUR� 152,755� 170,230� 0.15Telefonaktiebolaget�LM�Ericsson�5.375%�27/6/2017�'EMTN'� 305,000� EUR� 304,723� 341,917� 0.30TeliaSonera�AB�3%�7/9/2027�'EMTN'� 170,000� EUR� 169,534� 196,840� 0.17Vattenfall�AB�6.25%�17/3/2021�'EMTN'� 200,000� EUR� 210,439� 262,514� 0.23
� � � 2,566,514� 2,836,013� 2.49
Switzerland Cloverie�Plc�For�Zurich�Insurance�Co�Ltd�1.75%�16/9/2024�'EMTN'� 100,000� EUR� 99,367� 104,640� 0.09Elsevier�Finance�SA�Via�ELM�BV�2.5%�24/9/2020�'EMTN'� 200,000� EUR� 199,804� 218,380� 0.19Glencore�Finance�Europe�S.A.�1.625%�18/1/2022�'EMTN'� 100,000� EUR� 99,269� 100,676� 0.09Nestle�Finance�International�Ltd�0.75%�8/11/2021�'EMTN'� 360,000� EUR� 357,408� 364,695� 0.32UBS�AG�1.25%�3/9/2021�'EMTN'� 228,000� EUR� 227,640� 234,792� 0.21
� � � 983,488� 1,023,183� 0.90
United Kingdom 3i�Group�6.875%�9/3/2023�� 144,000� GBP� 197,596� 228,281� 0.203i�Group�Plc�5.625%�17/3/2017�'EMTN'� 255,000� EUR� 260,580� 279,442� 0.25Abbey�National�Treasury�Servic�0.875%�13/1/2020�'EMTN'� 355,000� EUR� 353,510� 356,487� 0.31Anglo�American�Capital�Plc�2.5%�29/4/2021�'EMTN'� 337,000� EUR� 333,849� 352,013� 0.31Aon�Plc�2.875%�14/5/2026�� 341,000� EUR� 343,266� 382,349� 0.34Aviva�Plc�FRN�Perpetual�� 140,000� EUR� 123,583� 143,357� 0.13Aviva�Plc�FRN�5/7/2043�'EMTN'� 100,000� EUR� 103,107� 119,182� 0.10Aviva�Plc�FRN�22/5/2038�'EMTN'� 250,000� EUR� 251,548� 287,178� 0.25Babcock�International�Group�Plc�1.75%�6/10/2022�'EMTN'� 548,000� EUR� 545,569� 563,516� 0.49Barclays�Bank�Plc�6.625%�30/3/2022�'REGS'� 430,000� EUR� 443,394� 554,425� 0.48BG�Energy�Capital�Plc�1.25%�21/11/2022�'EMTN'� 485,000� EUR� 484,495� 486,644� 0.42BP�Capital�Markets�Plc�2.994%�18/2/2019�'EMTN'� 180,000� EUR� 196,524� 196,686� 0.17BP�Capital�Markets�Plc�3.83%�6/10/2017�'EMTN'� 250,000� EUR� 263,558� 272,683� 0.24Coventry�Building�Society�2.5%�18/11/2020�� 297,000� EUR� 296,842� 321,758� 0.28Experian�Finance�Plc�4.75%�4/2/2020�'EMTN'� 351,000� EUR� 362,808� 415,626� 0.37GlaxoSmithKline�Capital�Plc�0.625%�2/12/2019�'EMTN'� 316,000� EUR� 314,452� 318,051� 0.28Hammerson�Plc�2%�1/7/2022�� 135,000� EUR� 134,030� 142,321� 0.13Imperial�Tobacco�Finance�Plc�2.25%�26/2/2021�'EMTN'� 293,000� EUR� 291,077� 309,997� 0.27Leeds�Building�Society�2.625%�1/4/2021�'EMTN'� 355,000� EUR� 354,361� 381,426� 0.34Lloyds�Bank�Plc�FRN�10/9/2019�'EMTN'� 460,000� EUR� 459,352� 459,788� 0.40Lloyds�TSB�Bank�Plc�6.5%�24/3/2020�'EMTN'� 165,000� EUR� 168,575� 203,110� 0.18Motability�Operations�Group�Plc�3.75%�29/11/2017�'EMTN'� 320,000� EUR� 322,688� 350,794� 0.31Nationwide�Building�Society�6.75%�22/7/2020�'EMTN'� 140,000� EUR� 155,425� 174,355� 0.15Nats�En�Route�Plc�5.25%�31/3/2026�� 167,177� GBP� 237,757� 248,535� 0.22Royal�Mail�Plc�2.375%�29/7/2024�� 100,000� EUR� 99,504� 105,666� 0.09Sky�Plc�2.5%�15/9/2026�'EMTN'� 135,000� EUR� 134,609� 141,160� 0.12Sse�Plc�2.375%�10/2/2022�'EMTN'� 241,000� EUR� 239,742� 262,745� 0.23Standard�Life�Plc�FRN�Perpetual�� 200,000� EUR� 201,863� 200,250� 0.18Tesco�Plc�5.125%�10/4/2047�'EMTN'� 75,000� EUR� 92,327� 76,398� 0.07United�Utilities�Water�Plc�4.25%�24/1/2020�'EMTN'� 385,000� EUR� 379,256� 449,634� 0.40Urenco�Finance�NV�2.375%�2/12/2024�'EMTN'� 432,000� EUR� 429,745� 433,374� 0.38WM�Morrison�Supermarkets�Plc�2.25%�19/6/2020�'EMTN'� 163,000� EUR� 162,204� 165,375� 0.15WPP�Finance�2013�3%�20/11/2023�'EMTN'� 106,000� EUR� 105,503� 121,466� 0.11
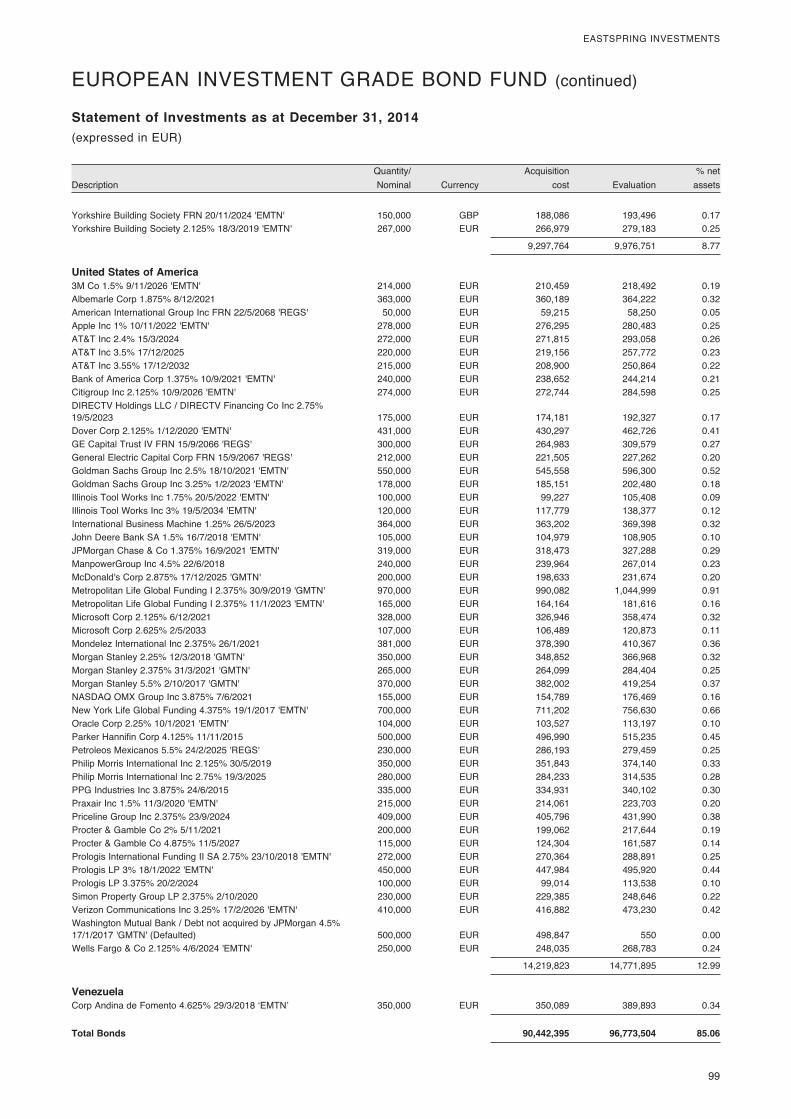
� 99
EASTSPRING�INVESTMENTS
� Quantity/�� � Acquisition�� � %�net�Description� Nominal�� Currency�� cost�� Evaluation�� assets�
Statement of Investments as at December 31, 2014(expressed�in�USD)(expressed�in�EUR)
EUROPEAN�INVESTMENT�GRADE�BOND�FUND�(continued)
Yorkshire�Building�Society�FRN�20/11/2024�'EMTN'� 150,000� GBP� 188,086� 193,496� 0.17Yorkshire�Building�Society�2.125%�18/3/2019�'EMTN'� 267,000� EUR� 266,979� 279,183� 0.25
� � � 9,297,764� 9,976,751� 8.77
United States of America 3M�Co�1.5%�9/11/2026�'EMTN'� 214,000� EUR� 210,459� 218,492� 0.19Albemarle�Corp�1.875%�8/12/2021�� 363,000� EUR� 360,189� 364,222� 0.32American�International�Group�Inc�FRN�22/5/2068�'REGS'� 50,000� EUR� 59,215� 58,250� 0.05Apple�Inc�1%�10/11/2022�'EMTN'� 278,000� EUR� 276,295� 280,483� 0.25AT&T�Inc�2.4%�15/3/2024�� 272,000� EUR� 271,815� 293,058� 0.26AT&T�Inc�3.5%�17/12/2025�� 220,000� EUR� 219,156� 257,772� 0.23AT&T�Inc�3.55%�17/12/2032�� 215,000� EUR� 208,900� 250,864� 0.22Bank�of�America�Corp�1.375%�10/9/2021�'EMTN'� 240,000� EUR� 238,652� 244,214� 0.21Citigroup�Inc�2.125%�10/9/2026�'EMTN'� 274,000� EUR� 272,744� 284,598� 0.25DIRECTV�Holdings�LLC�/�DIRECTV�Financing�Co�Inc�2.75%��19/5/2023�� 175,000� EUR� 174,181� 192,327� 0.17Dover�Corp�2.125%�1/12/2020�'EMTN'� 431,000� EUR� 430,297� 462,726� 0.41GE�Capital�Trust�IV�FRN�15/9/2066�'REGS'� 300,000� EUR� 264,983� 309,579� 0.27General�Electric�Capital�Corp�FRN�15/9/2067�'REGS'� 212,000� EUR� 221,505� 227,262� 0.20Goldman�Sachs�Group�Inc�2.5%�18/10/2021�'EMTN'� 550,000� EUR� 545,558� 596,300� 0.52Goldman�Sachs�Group�Inc�3.25%�1/2/2023�'EMTN'� 178,000� EUR� 185,151� 202,480� 0.18Illinois�Tool�Works�Inc�1.75%�20/5/2022�'EMTN'� 100,000� EUR� 99,227� 105,408� 0.09Illinois�Tool�Works�Inc�3%�19/5/2034�'EMTN'� 120,000� EUR� 117,779� 138,377� 0.12International�Business�Machine�1.25%�26/5/2023�� 364,000� EUR� 363,202� 369,398� 0.32John�Deere�Bank�SA�1.5%�16/7/2018�'EMTN'� 105,000� EUR� 104,979� 108,905� 0.10JPMorgan�Chase�&�Co�1.375%�16/9/2021�'EMTN'� 319,000� EUR� 318,473� 327,288� 0.29ManpowerGroup�Inc�4.5%�22/6/2018�� 240,000� EUR� 239,964� 267,014� 0.23McDonald's�Corp�2.875%�17/12/2025�'GMTN'� 200,000� EUR� 198,633� 231,674� 0.20Metropolitan�Life�Global�Funding�I�2.375%�30/9/2019�'GMTN'� 970,000� EUR� 990,082� 1,044,999� 0.91Metropolitan�Life�Global�Funding�I�2.375%�11/1/2023�'EMTN'� 165,000� EUR� 164,164� 181,616� 0.16Microsoft�Corp�2.125%�6/12/2021�� 328,000� EUR� 326,946� 358,474� 0.32Microsoft�Corp�2.625%�2/5/2033�� 107,000� EUR� 106,489� 120,873� 0.11Mondelez�International�Inc�2.375%�26/1/2021�� 381,000� EUR� 378,390� 410,367� 0.36Morgan�Stanley�2.25%�12/3/2018�'GMTN'� 350,000� EUR� 348,852� 366,968� 0.32Morgan�Stanley�2.375%�31/3/2021�'GMTN'� 265,000� EUR� 264,099� 284,404� 0.25Morgan�Stanley�5.5%�2/10/2017�'GMTN'� 370,000� EUR� 382,002� 419,254� 0.37NASDAQ�OMX�Group�Inc�3.875%�7/6/2021�� 155,000� EUR� 154,789� 176,469� 0.16New�York�Life�Global�Funding�4.375%�19/1/2017�'EMTN'� 700,000� EUR� 711,202� 756,630� 0.66Oracle�Corp�2.25%�10/1/2021�'EMTN'� 104,000� EUR� 103,527� 113,197� 0.10Parker�Hannifin�Corp�4.125%�11/11/2015�� 500,000� EUR� 496,990� 515,235� 0.45Petroleos�Mexicanos�5.5%�24/2/2025�'REGS'� 230,000� EUR� 286,193� 279,459� 0.25Philip�Morris�International�Inc�2.125%�30/5/2019�� 350,000� EUR� 351,843� 374,140� 0.33Philip�Morris�International�Inc�2.75%�19/3/2025�� 280,000� EUR� 284,233� 314,535� 0.28PPG�Industries�Inc�3.875%�24/6/2015�� 335,000� EUR� 334,931� 340,102� 0.30Praxair�Inc�1.5%�11/3/2020�'EMTN'� 215,000� EUR� 214,061� 223,703� 0.20Priceline�Group�Inc�2.375%�23/9/2024�� 409,000� EUR� 405,796� 431,990� 0.38Procter�&�Gamble�Co�2%�5/11/2021�� 200,000� EUR� 199,062� 217,644� 0.19Procter�&�Gamble�Co�4.875%�11/5/2027�� 115,000� EUR� 124,304� 161,587� 0.14Prologis�International�Funding�II�SA�2.75%�23/10/2018�'EMTN'� 272,000� EUR� 270,364� 288,891� 0.25Prologis�LP�3%�18/1/2022�'EMTN'� 450,000� EUR� 447,984� 495,920� 0.44Prologis�LP�3.375%�20/2/2024�� 100,000� EUR� 99,014� 113,538� 0.10Simon�Property�Group�LP�2.375%�2/10/2020�� 230,000� EUR� 229,385� 248,646� 0.22Verizon�Communications�Inc�3.25%�17/2/2026�'EMTN'� 410,000� EUR� 416,882� 473,230� 0.42Washington�Mutual�Bank�/�Debt�not�acquired�by�JPMorgan�4.5%��17/1/2017�'GMTN'�(Defaulted)� 500,000� EUR� 498,847� 550� 0.00Wells�Fargo�&�Co�2.125%�4/6/2024�'EMTN'� 250,000� EUR� 248,035� 268,783� 0.24
� � � 14,219,823� 14,771,895� 12.99
Venezuela Corp�Andina�de�Fomento�4.625%�29/3/2018�‘EMTN’� 350,000� EUR� 350,089� 389,893� 0.34�
Total Bonds 90,442,395 96,773,504 85.06
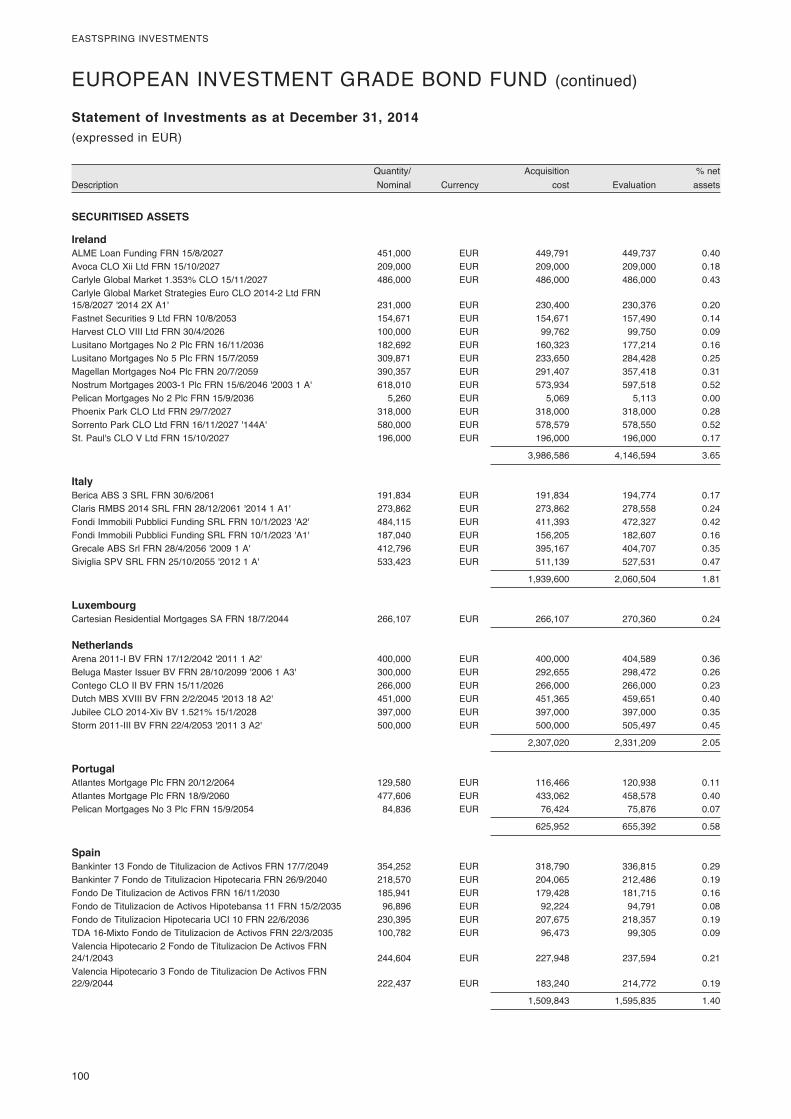
100�
EASTSPRING�INVESTMENTS
� Quantity/�� � Acquisition�� � %�net�Description� Nominal�� Currency�� cost�� Evaluation�� assets�
Statement of Investments as at December 31, 2014(expressed�in�USD)(expressed�in�EUR)
SECURITISED ASSETS
Ireland ALME�Loan�Funding�FRN�15/8/2027�� 451,000� EUR� 449,791� 449,737� 0.40Avoca�CLO�Xii�Ltd�FRN�15/10/2027�� 209,000� EUR� 209,000� 209,000� 0.18Carlyle�Global�Market�1.353%�CLO�15/11/2027�� 486,000� EUR� 486,000� 486,000� 0.43Carlyle�Global�Market�Strategies�Euro�CLO�2014-2�Ltd�FRN��15/8/2027�'2014�2X�A1'� 231,000� EUR� 230,400� 230,376� 0.20Fastnet�Securities�9�Ltd�FRN�10/8/2053�� 154,671� EUR� 154,671� 157,490� 0.14Harvest�CLO�VIII�Ltd�FRN�30/4/2026�� 100,000� EUR� 99,762� 99,750� 0.09Lusitano�Mortgages�No�2�Plc�FRN�16/11/2036�� 182,692� EUR� 160,323� 177,214� 0.16Lusitano�Mortgages�No�5�Plc�FRN�15/7/2059�� 309,871� EUR� 233,650� 284,428� 0.25Magellan�Mortgages�No4�Plc�FRN�20/7/2059�� 390,357� EUR� 291,407� 357,418� 0.31Nostrum�Mortgages�2003-1�Plc�FRN�15/6/2046�'2003�1�A'� 618,010� EUR� 573,934� 597,518� 0.52Pelican�Mortgages�No�2�Plc�FRN�15/9/2036�� 5,260� EUR� 5,069� 5,113� 0.00Phoenix�Park�CLO�Ltd�FRN�29/7/2027�� 318,000� EUR� 318,000� 318,000� 0.28Sorrento�Park�CLO�Ltd�FRN�16/11/2027�'144A'� 580,000� EUR� 578,579� 578,550� 0.52St.�Paul's�CLO�V�Ltd�FRN�15/10/2027�� 196,000� EUR� 196,000� 196,000� 0.17
� � � 3,986,586� 4,146,594� 3.65
Italy Berica�ABS�3�SRL�FRN�30/6/2061�� 191,834� EUR� 191,834� 194,774� 0.17Claris�RMBS�2014�SRL�FRN�28/12/2061�'2014�1�A1'� 273,862� EUR� 273,862� 278,558� 0.24Fondi�Immobili�Pubblici�Funding�SRL�FRN�10/1/2023�'A2'� 484,115� EUR� 411,393� 472,327� 0.42Fondi�Immobili�Pubblici�Funding�SRL�FRN�10/1/2023�'A1'� 187,040� EUR� 156,205� 182,607� 0.16Grecale�ABS�Srl�FRN�28/4/2056�'2009�1�A'� 412,796� EUR� 395,167� 404,707� 0.35Siviglia�SPV�SRL�FRN�25/10/2055�'2012�1�A'� 533,423� EUR� 511,139� 527,531� 0.47
� � � 1,939,600� 2,060,504� 1.81
Luxembourg Cartesian�Residential�Mortgages�SA�FRN�18/7/2044�� 266,107� EUR� 266,107� 270,360� 0.24
Netherlands Arena�2011-I�BV�FRN�17/12/2042�'2011�1�A2'� 400,000� EUR� 400,000� 404,589� 0.36Beluga�Master�Issuer�BV�FRN�28/10/2099�'2006�1�A3'� 300,000� EUR� 292,655� 298,472� 0.26Contego�CLO�II�BV�FRN�15/11/2026�� 266,000� EUR� 266,000� 266,000� 0.23Dutch�MBS�XVIII�BV�FRN�2/2/2045�'2013�18�A2'� 451,000� EUR� 451,365� 459,651� 0.40Jubilee�CLO�2014-Xiv�BV�1.521%�15/1/2028�� 397,000� EUR� 397,000� 397,000� 0.35Storm�2011-III�BV�FRN�22/4/2053�'2011�3�A2'� 500,000� EUR� 500,000� 505,497� 0.45
� � � 2,307,020� 2,331,209� 2.05
Portugal Atlantes�Mortgage�Plc�FRN�20/12/2064�� 129,580� EUR� 116,466� 120,938� 0.11Atlantes�Mortgage�Plc�FRN�18/9/2060�� 477,606� EUR� 433,062� 458,578� 0.40Pelican�Mortgages�No�3�Plc�FRN�15/9/2054�� 84,836� EUR� 76,424� 75,876� 0.07
� � � 625,952� 655,392� 0.58
Spain Bankinter�13�Fondo�de�Titulizacion�de�Activos�FRN�17/7/2049�� 354,252� EUR� 318,790� 336,815� 0.29Bankinter�7�Fondo�de�Titulizacion�Hipotecaria�FRN�26/9/2040�� 218,570� EUR� 204,065� 212,486� 0.19Fondo�De�Titulizacion�de�Activos�FRN�16/11/2030�� 185,941� EUR� 179,428� 181,715� 0.16Fondo�de�Titulizacion�de�Activos�Hipotebansa�11�FRN�15/2/2035�� 96,896� EUR� 92,224� 94,791� 0.08Fondo�de�Titulizacion�Hipotecaria�UCI�10�FRN�22/6/2036�� 230,395� EUR� 207,675� 218,357� 0.19TDA�16-Mixto�Fondo�de�Titulizacion�de�Activos�FRN�22/3/2035�� 100,782� EUR� 96,473� 99,305� 0.09Valencia�Hipotecario�2�Fondo�de�Titulizacion�De�Activos�FRN��24/1/2043�� 244,604� EUR� 227,948� 237,594� 0.21Valencia�Hipotecario�3�Fondo�de�Titulizacion�De�Activos�FRN��22/9/2044�� 222,437� EUR� 183,240� 214,772� 0.19
� � � 1,509,843� 1,595,835� 1.40
EUROPEAN�INVESTMENT�GRADE�BOND�FUND�(continued)
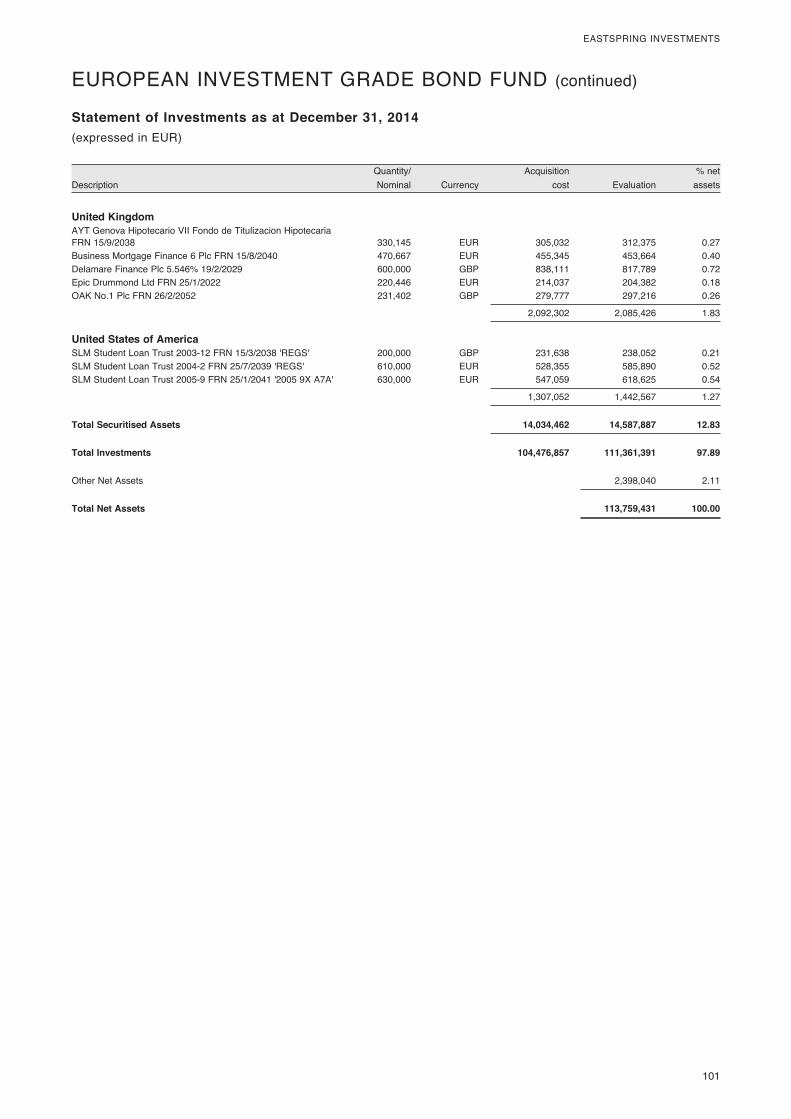
� 101
EASTSPRING�INVESTMENTS
� Quantity/�� � Acquisition�� � %�net�Description� Nominal�� Currency�� cost�� Evaluation�� assets�
Statement of Investments as at December 31, 2014(expressed�in�USD)
United Kingdom AYT�Genova�Hipotecario�VII�Fondo�de�Titulizacion�Hipotecaria��FRN�15/9/2038�� 330,145� EUR� 305,032� 312,375� 0.27Business�Mortgage�Finance�6�Plc�FRN�15/8/2040�� 470,667� EUR� 455,345� 453,664� 0.40Delamare�Finance�Plc�5.546%�19/2/2029�� 600,000� GBP� 838,111� 817,789� 0.72Epic�Drummond�Ltd�FRN�25/1/2022�� 220,446� EUR� 214,037� 204,382� 0.18OAK�No.1�Plc�FRN�26/2/2052�� 231,402� GBP� 279,777� 297,216� 0.26
� � � 2,092,302� 2,085,426� 1.83
United States of America SLM�Student�Loan�Trust�2003-12�FRN�15/3/2038�'REGS'� 200,000� GBP� 231,638� 238,052� 0.21SLM�Student�Loan�Trust�2004-2�FRN�25/7/2039�'REGS'� 610,000� EUR� 528,355� 585,890� 0.52SLM�Student�Loan�Trust�2005-9�FRN�25/1/2041�'2005�9X�A7A'� 630,000� EUR� 547,059� 618,625� 0.54
� � � 1,307,052� 1,442,567� 1.27
Total Securitised Assets 14,034,462 14,587,887 12.83
Total Investments 104,476,857 111,361,391 97.89
Other�Net�Assets� � � � 2,398,040� 2.11
Total Net Assets 113,759,431 100.00
(expressed�in�EUR)
EUROPEAN�INVESTMENT�GRADE�BOND�FUND�(continued)
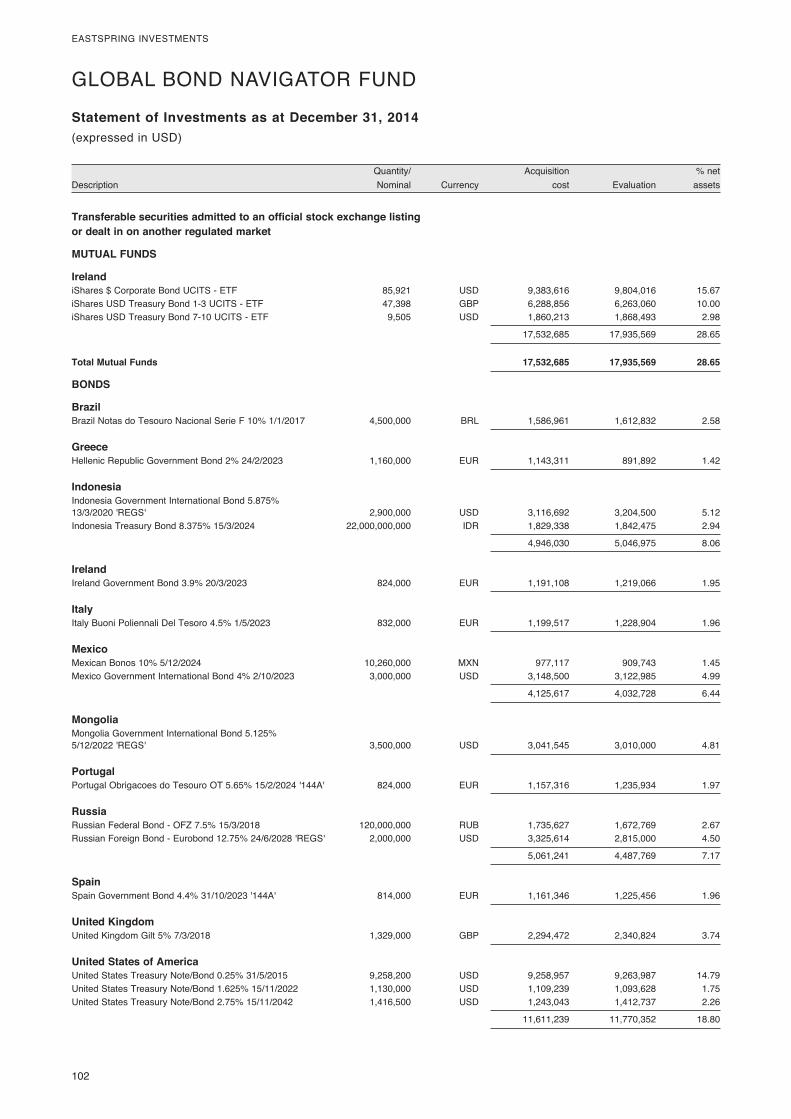
102�
EASTSPRING�INVESTMENTS
� Quantity/�� � Acquisition�� � %�net�Description� Nominal�� Currency�� cost�� Evaluation�� assets�
Statement of Investments as at December 31, 2014(expressed�in�USD)
Transferable securities admitted to an official stock exchange listing or dealt in on another regulated market
MUTUAL FUNDS
Ireland iShares�$�Corporate�Bond�UCITS�-�ETF�� 85,921� USD� 9,383,616� 9,804,016� 15.67iShares�USD�Treasury�Bond�1-3�UCITS�-�ETF�� 47,398� GBP� 6,288,856� 6,263,060� 10.00iShares�USD�Treasury�Bond�7-10�UCITS�-�ETF�� 9,505� USD� 1,860,213� 1,868,493� 2.98
� � � 17,532,685� 17,935,569� 28.65
Total Mutual Funds 17,532,685 17,935,569 28.65
BONDS
Brazil Brazil�Notas�do�Tesouro�Nacional�Serie�F�10%�1/1/2017�� 4,500,000� BRL� 1,586,961� 1,612,832� 2.58
Greece Hellenic�Republic�Government�Bond�2%�24/2/2023�� 1,160,000� EUR� 1,143,311� 891,892� 1.42
Indonesia Indonesia�Government�International�Bond�5.875%��13/3/2020�'REGS'� 2,900,000� USD� 3,116,692� 3,204,500� 5.12Indonesia�Treasury�Bond�8.375%�15/3/2024�� 22,000,000,000� IDR� 1,829,338� 1,842,475� 2.94
� � � 4,946,030� 5,046,975� 8.06
Ireland Ireland�Government�Bond�3.9%�20/3/2023�� 824,000� EUR� 1,191,108� 1,219,066� 1.95
Italy Italy�Buoni�Poliennali�Del�Tesoro�4.5%�1/5/2023�� 832,000� EUR� 1,199,517� 1,228,904� 1.96
Mexico Mexican�Bonos�10%�5/12/2024�� 10,260,000� MXN� 977,117� 909,743� 1.45Mexico�Government�International�Bond�4%�2/10/2023�� 3,000,000� USD� 3,148,500� 3,122,985� 4.99
� � � 4,125,617� 4,032,728� 6.44
Mongolia Mongolia�Government�International�Bond�5.125%��5/12/2022�'REGS'� 3,500,000� USD� 3,041,545� 3,010,000� 4.81
Portugal Portugal�Obrigacoes�do�Tesouro�OT�5.65%�15/2/2024�'144A'� 824,000� EUR� 1,157,316� 1,235,934� 1.97
Russia Russian�Federal�Bond�-�OFZ�7.5%�15/3/2018�� 120,000,000� RUB� 1,735,627� 1,672,769� 2.67Russian�Foreign�Bond�-�Eurobond�12.75%�24/6/2028�'REGS'� 2,000,000� USD� 3,325,614� 2,815,000� 4.50
� � � 5,061,241� 4,487,769� 7.17
Spain Spain�Government�Bond�4.4%�31/10/2023�'144A'� 814,000� EUR� 1,161,346� 1,225,456� 1.96
United Kingdom United�Kingdom�Gilt�5%�7/3/2018�� 1,329,000� GBP� 2,294,472� 2,340,824� 3.74
United States of America United�States�Treasury�Note/Bond�0.25%�31/5/2015�� 9,258,200� USD� 9,258,957� 9,263,987� 14.79United�States�Treasury�Note/Bond�1.625%�15/11/2022�� 1,130,000� USD� 1,109,239� 1,093,628� 1.75United�States�Treasury�Note/Bond�2.75%�15/11/2042�� 1,416,500� USD� 1,243,043� 1,412,737� 2.26
� � � 11,611,239� 11,770,352� 18.80
GLOBAL�BOND�NAVIGATOR�FUND
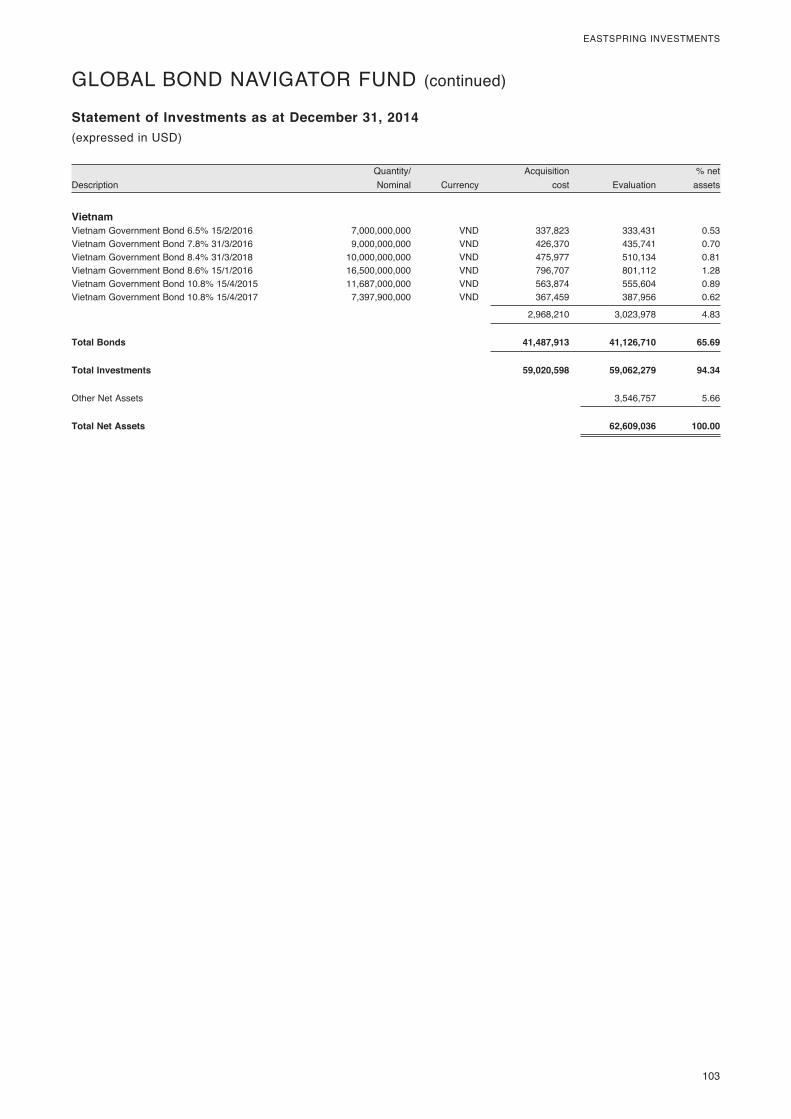
� 103
EASTSPRING�INVESTMENTS
� Quantity/�� � Acquisition�� � %�net�Description� Nominal�� Currency�� cost�� Evaluation�� assets�
Statement of Investments as at December 31, 2014(expressed�in�USD)
Vietnam Vietnam�Government�Bond�6.5%�15/2/2016�� 7,000,000,000� VND� 337,823� 333,431� 0.53Vietnam�Government�Bond�7.8%�31/3/2016�� 9,000,000,000� VND� 426,370� 435,741� 0.70Vietnam�Government�Bond�8.4%�31/3/2018�� 10,000,000,000� VND� 475,977� 510,134� 0.81Vietnam�Government�Bond�8.6%�15/1/2016�� 16,500,000,000� VND� 796,707� 801,112� 1.28Vietnam�Government�Bond�10.8%�15/4/2015�� 11,687,000,000� VND� 563,874� 555,604� 0.89Vietnam�Government�Bond�10.8%�15/4/2017�� 7,397,900,000� VND� 367,459� 387,956� 0.62
� � � 2,968,210� 3,023,978� 4.83
Total Bonds 41,487,913 41,126,710 65.69
Total Investments 59,020,598 59,062,279 94.34
Other�Net�Assets� � � � 3,546,757� 5.66
Total Net Assets 62,609,036 100.00
GLOBAL�BOND�NAVIGATOR�FUND�(continued)
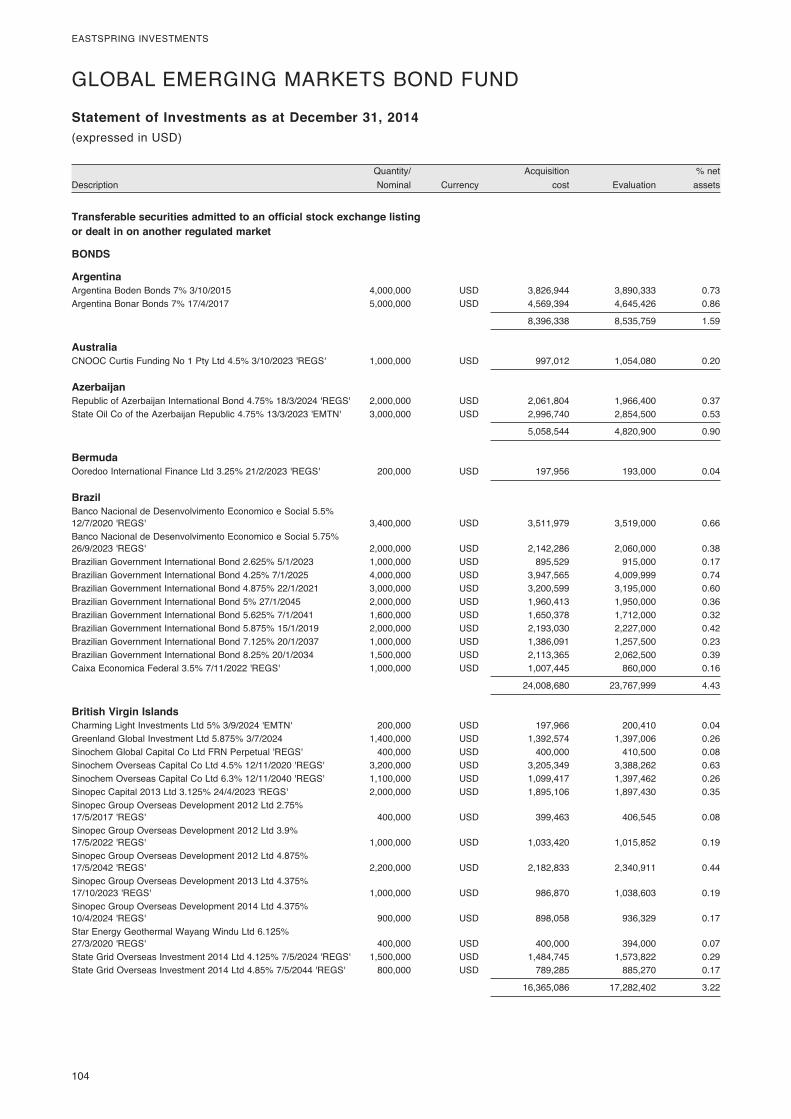
104�
EASTSPRING�INVESTMENTS
� Quantity/�� � Acquisition�� � %�net�Description� Nominal�� Currency�� cost�� Evaluation�� assets�
Statement of Investments as at December 31, 2014(expressed�in�USD)
Transferable securities admitted to an official stock exchange listing or dealt in on another regulated market
BONDS
Argentina Argentina�Boden�Bonds�7%�3/10/2015�� 4,000,000� USD� 3,826,944� 3,890,333� 0.73Argentina�Bonar�Bonds�7%�17/4/2017�� 5,000,000� USD� 4,569,394� 4,645,426� 0.86
� � � 8,396,338� 8,535,759� 1.59
Australia CNOOC�Curtis�Funding�No�1�Pty�Ltd�4.5%�3/10/2023�'REGS'� 1,000,000� USD� 997,012� 1,054,080� 0.20
Azerbaijan Republic�of�Azerbaijan�International�Bond�4.75%�18/3/2024�'REGS'� 2,000,000� USD� 2,061,804� 1,966,400� 0.37State�Oil�Co�of�the�Azerbaijan�Republic�4.75%�13/3/2023�'EMTN'� 3,000,000� USD� 2,996,740� 2,854,500� 0.53
� � � 5,058,544� 4,820,900� 0.90
Bermuda Ooredoo�International�Finance�Ltd�3.25%�21/2/2023�'REGS'� 200,000� USD� 197,956� 193,000� 0.04
Brazil Banco�Nacional�de�Desenvolvimento�Economico�e�Social�5.5%��12/7/2020�'REGS'� 3,400,000� USD� 3,511,979� 3,519,000� 0.66Banco�Nacional�de�Desenvolvimento�Economico�e�Social�5.75%��26/9/2023�'REGS'� 2,000,000� USD� 2,142,286� 2,060,000� 0.38Brazilian�Government�International�Bond�2.625%�5/1/2023�� 1,000,000� USD� 895,529� 915,000� 0.17Brazilian�Government�International�Bond�4.25%�7/1/2025�� 4,000,000� USD� 3,947,565� 4,009,999� 0.74Brazilian�Government�International�Bond�4.875%�22/1/2021�� 3,000,000� USD� 3,200,599� 3,195,000� 0.60Brazilian�Government�International�Bond�5%�27/1/2045�� 2,000,000� USD� 1,960,413� 1,950,000� 0.36Brazilian�Government�International�Bond�5.625%�7/1/2041�� 1,600,000� USD� 1,650,378� 1,712,000� 0.32Brazilian�Government�International�Bond�5.875%�15/1/2019�� 2,000,000� USD� 2,193,030� 2,227,000� 0.42Brazilian�Government�International�Bond�7.125%�20/1/2037�� 1,000,000� USD� 1,386,091� 1,257,500� 0.23Brazilian�Government�International�Bond�8.25%�20/1/2034�� 1,500,000� USD� 2,113,365� 2,062,500� 0.39Caixa�Economica�Federal�3.5%�7/11/2022�'REGS'� 1,000,000� USD� 1,007,445� 860,000� 0.16
� � � 24,008,680� 23,767,999� 4.43
British Virgin Islands Charming�Light�Investments�Ltd�5%�3/9/2024�'EMTN'� 200,000� USD� 197,966� 200,410� 0.04Greenland�Global�Investment�Ltd�5.875%�3/7/2024�� 1,400,000� USD� 1,392,574� 1,397,006� 0.26Sinochem�Global�Capital�Co�Ltd�FRN�Perpetual�'REGS'� 400,000� USD� 400,000� 410,500� 0.08Sinochem�Overseas�Capital�Co�Ltd�4.5%�12/11/2020�'REGS'� 3,200,000� USD� 3,205,349� 3,388,262� 0.63Sinochem�Overseas�Capital�Co�Ltd�6.3%�12/11/2040�'REGS'� 1,100,000� USD� 1,099,417� 1,397,462� 0.26Sinopec�Capital�2013�Ltd�3.125%�24/4/2023�'REGS'� 2,000,000� USD� 1,895,106� 1,897,430� 0.35Sinopec�Group�Overseas�Development�2012�Ltd�2.75%��17/5/2017�'REGS'� 400,000� USD� 399,463� 406,545� 0.08Sinopec�Group�Overseas�Development�2012�Ltd�3.9%��17/5/2022�'REGS'� 1,000,000� USD� 1,033,420� 1,015,852� 0.19Sinopec�Group�Overseas�Development�2012�Ltd�4.875%��17/5/2042�'REGS'� 2,200,000� USD� 2,182,833� 2,340,911� 0.44Sinopec�Group�Overseas�Development�2013�Ltd�4.375%��17/10/2023�'REGS'� 1,000,000� USD� 986,870� 1,038,603� 0.19Sinopec�Group�Overseas�Development�2014�Ltd�4.375%��10/4/2024�'REGS'� 900,000� USD� 898,058� 936,329� 0.17Star�Energy�Geothermal�Wayang�Windu�Ltd�6.125%��27/3/2020�'REGS'� 400,000� USD� 400,000� 394,000� 0.07State�Grid�Overseas�Investment�2014�Ltd�4.125%�7/5/2024�'REGS'� 1,500,000� USD� 1,484,745� 1,573,822� 0.29State�Grid�Overseas�Investment�2014�Ltd�4.85%�7/5/2044�'REGS'� 800,000� USD� 789,285� 885,270� 0.17
� � � 16,365,086� 17,282,402� 3.22
GLOBAL�EMERGING�MARKETS�BOND�FUND
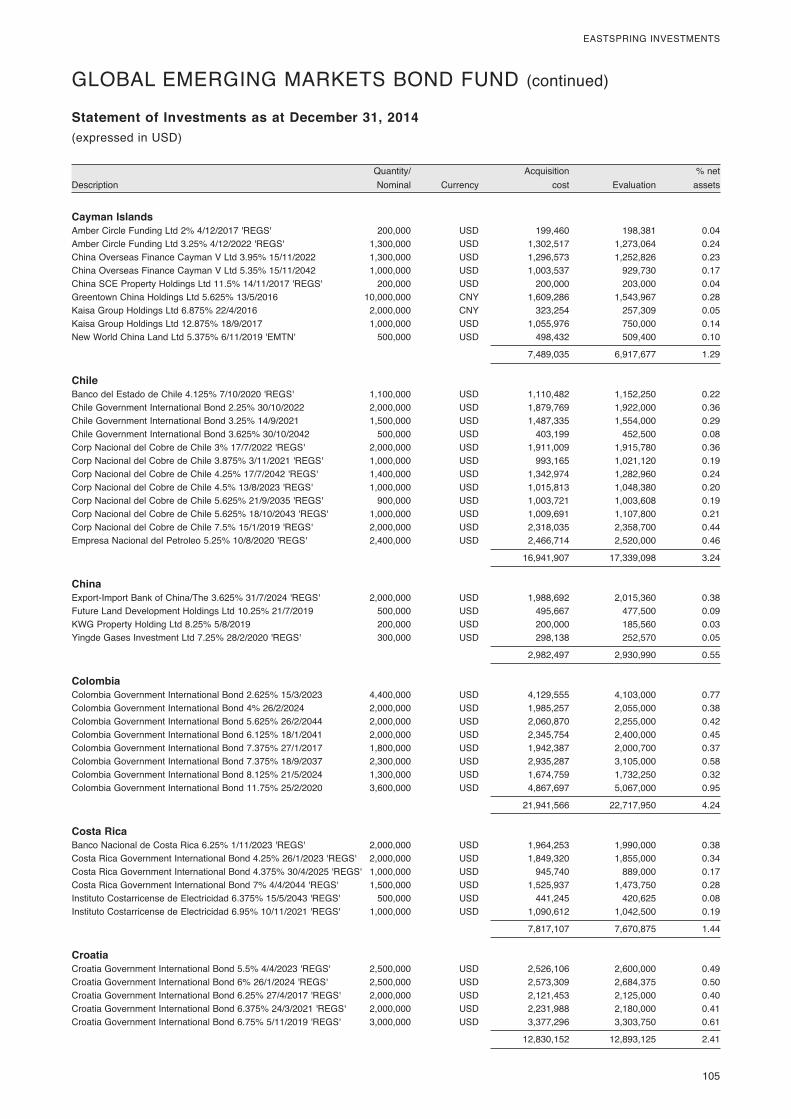
� 105
EASTSPRING�INVESTMENTS
� Quantity/�� � Acquisition�� � %�net�Description� Nominal�� Currency�� cost�� Evaluation�� assets�
Statement of Investments as at December 31, 2014(expressed�in�USD)
Cayman Islands Amber�Circle�Funding�Ltd�2%�4/12/2017�'REGS'� 200,000� USD� 199,460� 198,381� 0.04Amber�Circle�Funding�Ltd�3.25%�4/12/2022�'REGS'� 1,300,000� USD� 1,302,517� 1,273,064� 0.24China�Overseas�Finance�Cayman�V�Ltd�3.95%�15/11/2022�� 1,300,000� USD� 1,296,573� 1,252,826� 0.23China�Overseas�Finance�Cayman�V�Ltd�5.35%�15/11/2042�� 1,000,000� USD� 1,003,537� 929,730� 0.17China�SCE�Property�Holdings�Ltd�11.5%�14/11/2017�'REGS'� 200,000� USD� 200,000� 203,000� 0.04Greentown�China�Holdings�Ltd�5.625%�13/5/2016�� 10,000,000� CNY� 1,609,286� 1,543,967� 0.28Kaisa�Group�Holdings�Ltd�6.875%�22/4/2016�� 2,000,000� CNY� 323,254� 257,309� 0.05Kaisa�Group�Holdings�Ltd�12.875%�18/9/2017�� 1,000,000� USD� 1,055,976� 750,000� 0.14New�World�China�Land�Ltd�5.375%�6/11/2019�'EMTN'� 500,000� USD� 498,432� 509,400� 0.10
� � � 7,489,035� 6,917,677� 1.29
Chile Banco�del�Estado�de�Chile�4.125%�7/10/2020�'REGS'� 1,100,000� USD� 1,110,482� 1,152,250� 0.22Chile�Government�International�Bond�2.25%�30/10/2022�� 2,000,000� USD� 1,879,769� 1,922,000� 0.36Chile�Government�International�Bond�3.25%�14/9/2021�� 1,500,000� USD� 1,487,335� 1,554,000� 0.29Chile�Government�International�Bond�3.625%�30/10/2042�� 500,000� USD� 403,199� 452,500� 0.08Corp�Nacional�del�Cobre�de�Chile�3%�17/7/2022�'REGS'� 2,000,000� USD� 1,911,009� 1,915,780� 0.36Corp�Nacional�del�Cobre�de�Chile�3.875%�3/11/2021�'REGS'� 1,000,000� USD� 993,165� 1,021,120� 0.19Corp�Nacional�del�Cobre�de�Chile�4.25%�17/7/2042�'REGS'� 1,400,000� USD� 1,342,974� 1,282,960� 0.24Corp�Nacional�del�Cobre�de�Chile�4.5%�13/8/2023�'REGS'� 1,000,000� USD� 1,015,813� 1,048,380� 0.20Corp�Nacional�del�Cobre�de�Chile�5.625%�21/9/2035�'REGS'� 900,000� USD� 1,003,721� 1,003,608� 0.19Corp�Nacional�del�Cobre�de�Chile�5.625%�18/10/2043�'REGS'� 1,000,000� USD� 1,009,691� 1,107,800� 0.21Corp�Nacional�del�Cobre�de�Chile�7.5%�15/1/2019�'REGS'� 2,000,000� USD� 2,318,035� 2,358,700� 0.44Empresa�Nacional�del�Petroleo�5.25%�10/8/2020�'REGS'� 2,400,000� USD� 2,466,714� 2,520,000� 0.46
� � � 16,941,907� 17,339,098� 3.24
China Export-Import�Bank�of�China/The�3.625%�31/7/2024�'REGS'� 2,000,000� USD� 1,988,692� 2,015,360� 0.38Future�Land�Development�Holdings�Ltd�10.25%�21/7/2019�� 500,000� USD� 495,667� 477,500� 0.09KWG�Property�Holding�Ltd�8.25%�5/8/2019�� 200,000� USD� 200,000� 185,560� 0.03Yingde�Gases�Investment�Ltd�7.25%�28/2/2020�'REGS'� 300,000� USD� 298,138� 252,570� 0.05
� � � 2,982,497� 2,930,990� 0.55
Colombia Colombia�Government�International�Bond�2.625%�15/3/2023�� 4,400,000� USD� 4,129,555� 4,103,000� 0.77Colombia�Government�International�Bond�4%�26/2/2024�� 2,000,000� USD� 1,985,257� 2,055,000� 0.38Colombia�Government�International�Bond�5.625%�26/2/2044�� 2,000,000� USD� 2,060,870� 2,255,000� 0.42Colombia�Government�International�Bond�6.125%�18/1/2041�� 2,000,000� USD� 2,345,754� 2,400,000� 0.45Colombia�Government�International�Bond�7.375%�27/1/2017�� 1,800,000� USD� 1,942,387� 2,000,700� 0.37Colombia�Government�International�Bond�7.375%�18/9/2037�� 2,300,000� USD� 2,935,287� 3,105,000� 0.58Colombia�Government�International�Bond�8.125%�21/5/2024�� 1,300,000� USD� 1,674,759� 1,732,250� 0.32Colombia�Government�International�Bond�11.75%�25/2/2020�� 3,600,000� USD� 4,867,697� 5,067,000� 0.95
� � � 21,941,566� 22,717,950� 4.24
Costa Rica Banco�Nacional�de�Costa�Rica�6.25%�1/11/2023�'REGS'� 2,000,000� USD� 1,964,253� 1,990,000� 0.38Costa�Rica�Government�International�Bond�4.25%�26/1/2023�'REGS'� 2,000,000� USD� 1,849,320� 1,855,000� 0.34Costa�Rica�Government�International�Bond�4.375%�30/4/2025�'REGS'� 1,000,000� USD� 945,740� 889,000� 0.17Costa�Rica�Government�International�Bond�7%�4/4/2044�'REGS'� 1,500,000� USD� 1,525,937� 1,473,750� 0.28Instituto�Costarricense�de�Electricidad�6.375%�15/5/2043�'REGS'� 500,000� USD� 441,245� 420,625� 0.08Instituto�Costarricense�de�Electricidad�6.95%�10/11/2021�'REGS'� 1,000,000� USD� 1,090,612� 1,042,500� 0.19
� � � 7,817,107� 7,670,875� 1.44
Croatia Croatia�Government�International�Bond�5.5%�4/4/2023�'REGS'� 2,500,000� USD� 2,526,106� 2,600,000� 0.49Croatia�Government�International�Bond�6%�26/1/2024�'REGS'� 2,500,000� USD� 2,573,309� 2,684,375� 0.50Croatia�Government�International�Bond�6.25%�27/4/2017�'REGS'� 2,000,000� USD� 2,121,453� 2,125,000� 0.40Croatia�Government�International�Bond�6.375%�24/3/2021�'REGS'� 2,000,000� USD� 2,231,988� 2,180,000� 0.41Croatia�Government�International�Bond�6.75%�5/11/2019�'REGS'� 3,000,000� USD� 3,377,296� 3,303,750� 0.61
� � � 12,830,152� 12,893,125� 2.41
GLOBAL�EMERGING�MARKETS�BOND�FUND�(continued)
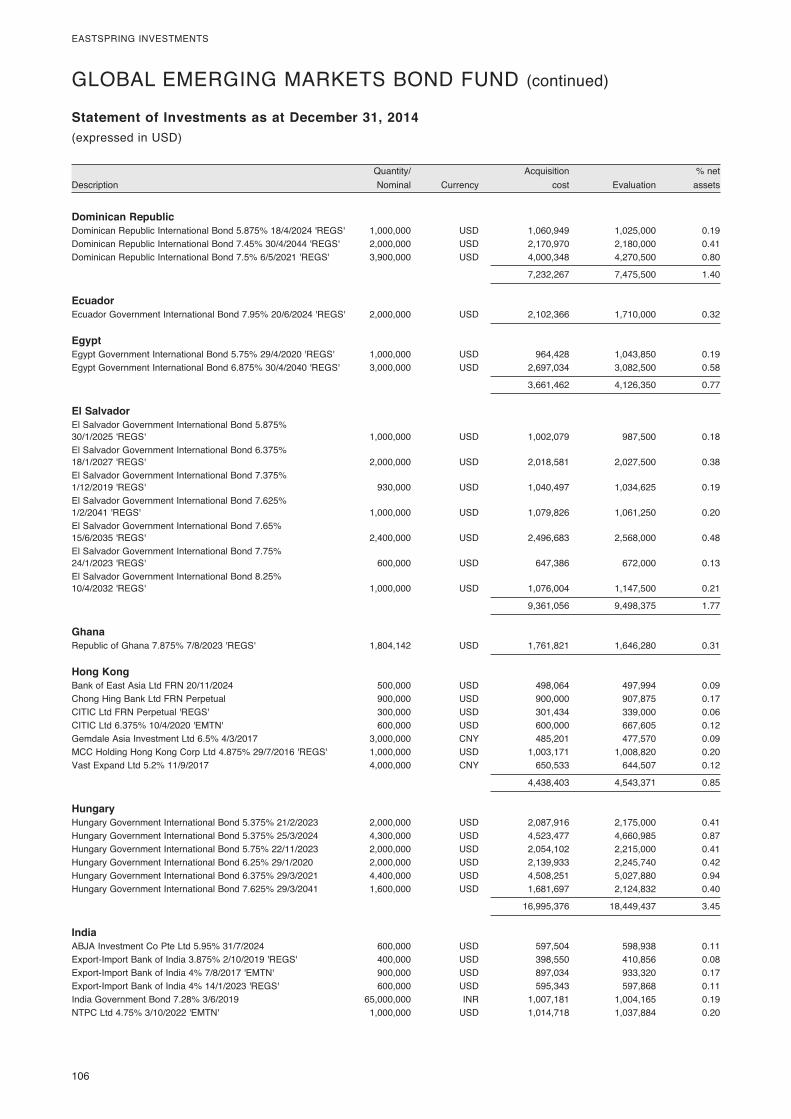
106�
EASTSPRING�INVESTMENTS
� Quantity/�� � Acquisition�� � %�net�Description� Nominal�� Currency�� cost�� Evaluation�� assets�
Statement of Investments as at December 31, 2014(expressed�in�USD)
Dominican Republic Dominican�Republic�International�Bond�5.875%�18/4/2024�'REGS'� 1,000,000� USD� 1,060,949� 1,025,000� 0.19Dominican�Republic�International�Bond�7.45%�30/4/2044�'REGS'� 2,000,000� USD� 2,170,970� 2,180,000� 0.41Dominican�Republic�International�Bond�7.5%�6/5/2021�'REGS'� 3,900,000� USD� 4,000,348� 4,270,500� 0.80
� � � 7,232,267� 7,475,500� 1.40
Ecuador Ecuador�Government�International�Bond�7.95%�20/6/2024�'REGS'� 2,000,000� USD� 2,102,366� 1,710,000� 0.32
Egypt Egypt�Government�International�Bond�5.75%�29/4/2020�'REGS'� 1,000,000� USD� 964,428� 1,043,850� 0.19Egypt�Government�International�Bond�6.875%�30/4/2040�'REGS'� 3,000,000� USD� 2,697,034� 3,082,500� 0.58
� � � 3,661,462� 4,126,350� 0.77
El Salvador El�Salvador�Government�International�Bond�5.875%��30/1/2025�'REGS'� 1,000,000� USD� 1,002,079� 987,500� 0.18El�Salvador�Government�International�Bond�6.375%��18/1/2027�'REGS'� 2,000,000� USD� 2,018,581� 2,027,500� 0.38El�Salvador�Government�International�Bond�7.375%��1/12/2019�'REGS'� 930,000� USD� 1,040,497� 1,034,625� 0.19El�Salvador�Government�International�Bond�7.625%��1/2/2041�'REGS'� 1,000,000� USD� 1,079,826� 1,061,250� 0.20El�Salvador�Government�International�Bond�7.65%��15/6/2035�'REGS'� 2,400,000� USD� 2,496,683� 2,568,000� 0.48El�Salvador�Government�International�Bond�7.75%��24/1/2023�'REGS'� 600,000� USD� 647,386� 672,000� 0.13El�Salvador�Government�International�Bond�8.25%��10/4/2032�'REGS'� 1,000,000� USD� 1,076,004� 1,147,500� 0.21
� � � 9,361,056� 9,498,375� 1.77
Ghana Republic�of�Ghana�7.875%�7/8/2023�'REGS'� 1,804,142� USD� 1,761,821� 1,646,280� 0.31
Hong Kong Bank�of�East�Asia�Ltd�FRN�20/11/2024�� 500,000� USD� 498,064� 497,994� 0.09Chong�Hing�Bank�Ltd�FRN�Perpetual�� 900,000� USD� 900,000� 907,875� 0.17CITIC�Ltd�FRN�Perpetual�'REGS'� 300,000� USD� 301,434� 339,000� 0.06CITIC�Ltd�6.375%�10/4/2020�'EMTN'� 600,000� USD� 600,000� 667,605� 0.12Gemdale�Asia�Investment�Ltd�6.5%�4/3/2017�� 3,000,000� CNY� 485,201� 477,570� 0.09MCC�Holding�Hong�Kong�Corp�Ltd�4.875%�29/7/2016�'REGS'� 1,000,000� USD� 1,003,171� 1,008,820� 0.20Vast�Expand�Ltd�5.2%�11/9/2017�� 4,000,000� CNY� 650,533� 644,507� 0.12
� � � 4,438,403� 4,543,371� 0.85
Hungary Hungary�Government�International�Bond�5.375%�21/2/2023�� 2,000,000� USD� 2,087,916� 2,175,000� 0.41Hungary�Government�International�Bond�5.375%�25/3/2024�� 4,300,000� USD� 4,523,477� 4,660,985� 0.87Hungary�Government�International�Bond�5.75%�22/11/2023�� 2,000,000� USD� 2,054,102� 2,215,000� 0.41Hungary�Government�International�Bond�6.25%�29/1/2020�� 2,000,000� USD� 2,139,933� 2,245,740� 0.42Hungary�Government�International�Bond�6.375%�29/3/2021�� 4,400,000� USD� 4,508,251� 5,027,880� 0.94Hungary�Government�International�Bond�7.625%�29/3/2041�� 1,600,000� USD� 1,681,697� 2,124,832� 0.40
� � � 16,995,376� 18,449,437� 3.45
India ABJA�Investment�Co�Pte�Ltd�5.95%�31/7/2024�� 600,000� USD� 597,504� 598,938� 0.11Export-Import�Bank�of�India�3.875%�2/10/2019�'REGS'� 400,000� USD� 398,550� 410,856� 0.08Export-Import�Bank�of�India�4%�7/8/2017�'EMTN'� 900,000� USD� 897,034� 933,320� 0.17Export-Import�Bank�of�India�4%�14/1/2023�'REGS'� 600,000� USD� 595,343� 597,868� 0.11India�Government�Bond�7.28%�3/6/2019�� 65,000,000� INR� 1,007,181� 1,004,165� 0.19NTPC�Ltd�4.75%�3/10/2022�'EMTN'� 1,000,000� USD� 1,014,718� 1,037,884� 0.20
GLOBAL�EMERGING�MARKETS�BOND�FUND�(continued)
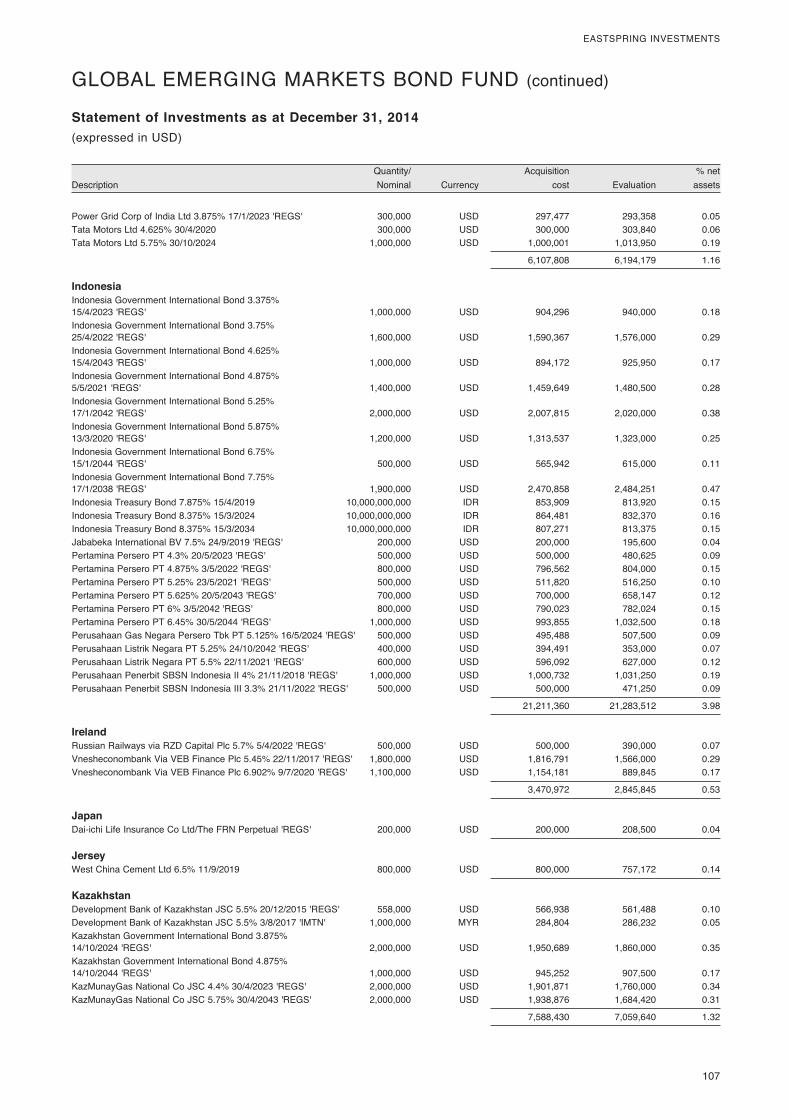
� 107
EASTSPRING�INVESTMENTS
� Quantity/�� � Acquisition�� � %�net�Description� Nominal�� Currency�� cost�� Evaluation�� assets�
Statement of Investments as at December 31, 2014(expressed�in�USD)
Power�Grid�Corp�of�India�Ltd�3.875%�17/1/2023�'REGS'� 300,000� USD� 297,477� 293,358� 0.05Tata�Motors�Ltd�4.625%�30/4/2020�� 300,000� USD� 300,000� 303,840� 0.06Tata�Motors�Ltd�5.75%�30/10/2024�� 1,000,000� USD� 1,000,001� 1,013,950� 0.19
� � � 6,107,808� 6,194,179� 1.16
Indonesia Indonesia�Government�International�Bond�3.375%��15/4/2023�'REGS'� 1,000,000� USD� 904,296� 940,000� 0.18Indonesia�Government�International�Bond�3.75%��25/4/2022�'REGS'� 1,600,000� USD� 1,590,367� 1,576,000� 0.29Indonesia�Government�International�Bond�4.625%��15/4/2043�'REGS'� 1,000,000� USD� 894,172� 925,950� 0.17Indonesia�Government�International�Bond�4.875%��5/5/2021�'REGS'� 1,400,000� USD� 1,459,649� 1,480,500� 0.28Indonesia�Government�International�Bond�5.25%��17/1/2042�'REGS'� 2,000,000� USD� 2,007,815� 2,020,000� 0.38Indonesia�Government�International�Bond�5.875%��13/3/2020�'REGS'� 1,200,000� USD� 1,313,537� 1,323,000� 0.25Indonesia�Government�International�Bond�6.75%��15/1/2044�'REGS'� 500,000� USD� 565,942� 615,000� 0.11Indonesia�Government�International�Bond�7.75%��17/1/2038�'REGS'� 1,900,000� USD� 2,470,858� 2,484,251� 0.47Indonesia�Treasury�Bond�7.875%�15/4/2019�� 10,000,000,000� IDR� 853,909� 813,920� 0.15Indonesia�Treasury�Bond�8.375%�15/3/2024�� 10,000,000,000� IDR� 864,481� 832,370� 0.16Indonesia�Treasury�Bond�8.375%�15/3/2034�� 10,000,000,000� IDR� 807,271� 813,375� 0.15Jababeka�International�BV�7.5%�24/9/2019�'REGS'� 200,000� USD� 200,000� 195,600� 0.04Pertamina�Persero�PT�4.3%�20/5/2023�'REGS'� 500,000� USD� 500,000� 480,625� 0.09Pertamina�Persero�PT�4.875%�3/5/2022�'REGS'� 800,000� USD� 796,562� 804,000� 0.15Pertamina�Persero�PT�5.25%�23/5/2021�'REGS'� 500,000� USD� 511,820� 516,250� 0.10Pertamina�Persero�PT�5.625%�20/5/2043�'REGS'� 700,000� USD� 700,000� 658,147� 0.12Pertamina�Persero�PT�6%�3/5/2042�'REGS'� 800,000� USD� 790,023� 782,024� 0.15Pertamina�Persero�PT�6.45%�30/5/2044�'REGS'� 1,000,000� USD� 993,855� 1,032,500� 0.18Perusahaan�Gas�Negara�Persero�Tbk�PT�5.125%�16/5/2024�'REGS'� 500,000� USD� 495,488� 507,500� 0.09Perusahaan�Listrik�Negara�PT�5.25%�24/10/2042�'REGS'� 400,000� USD� 394,491� 353,000� 0.07Perusahaan�Listrik�Negara�PT�5.5%�22/11/2021�'REGS'� 600,000� USD� 596,092� 627,000� 0.12Perusahaan�Penerbit�SBSN�Indonesia�II�4%�21/11/2018�'REGS'� 1,000,000� USD� 1,000,732� 1,031,250� 0.19Perusahaan�Penerbit�SBSN�Indonesia�III�3.3%�21/11/2022�'REGS'� 500,000� USD� 500,000� 471,250� 0.09
� � � 21,211,360� 21,283,512� 3.98
Ireland Russian�Railways�via�RZD�Capital�Plc�5.7%�5/4/2022�'REGS'� 500,000� USD� 500,000� 390,000� 0.07Vnesheconombank�Via�VEB�Finance�Plc�5.45%�22/11/2017�'REGS'� 1,800,000� USD� 1,816,791� 1,566,000� 0.29Vnesheconombank�Via�VEB�Finance�Plc�6.902%�9/7/2020�'REGS'� 1,100,000� USD� 1,154,181� 889,845� 0.17
� � � 3,470,972� 2,845,845� 0.53
Japan Dai-ichi�Life�Insurance�Co�Ltd/The�FRN�Perpetual�'REGS'� 200,000� USD� 200,000� 208,500� 0.04
Jersey West�China�Cement�Ltd�6.5%�11/9/2019�� 800,000� USD� 800,000� 757,172� 0.14
Kazakhstan Development�Bank�of�Kazakhstan�JSC�5.5%�20/12/2015�'REGS'� 558,000� USD� 566,938� 561,488� 0.10Development�Bank�of�Kazakhstan�JSC�5.5%�3/8/2017�'IMTN'� 1,000,000� MYR� 284,804� 286,232� 0.05Kazakhstan�Government�International�Bond�3.875%��14/10/2024�'REGS'� 2,000,000� USD� 1,950,689� 1,860,000� 0.35Kazakhstan�Government�International�Bond�4.875%��14/10/2044�'REGS'� 1,000,000� USD� 945,252� 907,500� 0.17KazMunayGas�National�Co�JSC�4.4%�30/4/2023�'REGS'� 2,000,000� USD� 1,901,871� 1,760,000� 0.34KazMunayGas�National�Co�JSC�5.75%�30/4/2043�'REGS'� 2,000,000� USD� 1,938,876� 1,684,420� 0.31
� � � 7,588,430� 7,059,640� 1.32
GLOBAL�EMERGING�MARKETS�BOND�FUND�(continued)
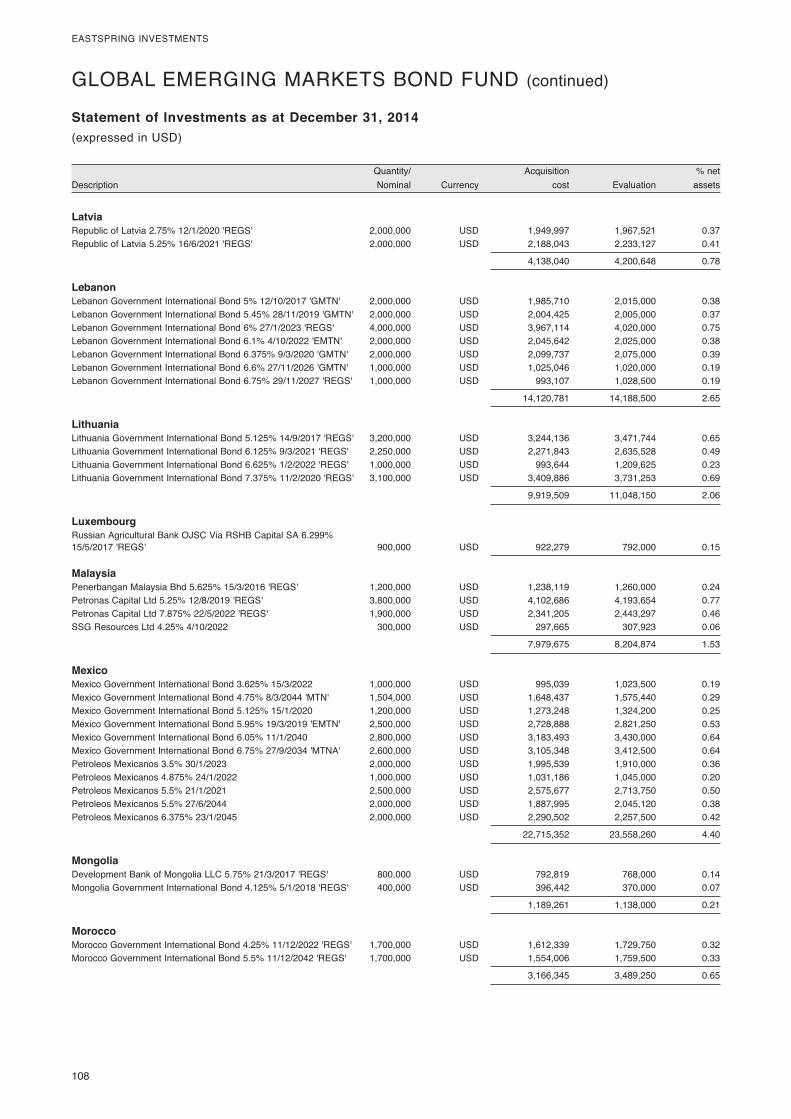
108�
EASTSPRING�INVESTMENTS
� Quantity/�� � Acquisition�� � %�net�Description� Nominal�� Currency�� cost�� Evaluation�� assets�
Statement of Investments as at December 31, 2014(expressed�in�USD)
Latvia Republic�of�Latvia�2.75%�12/1/2020�'REGS'� 2,000,000� USD� 1,949,997� 1,967,521� 0.37Republic�of�Latvia�5.25%�16/6/2021�'REGS'� 2,000,000� USD� 2,188,043� 2,233,127� 0.41
� � � 4,138,040� 4,200,648� 0.78
Lebanon Lebanon�Government�International�Bond�5%�12/10/2017�'GMTN'� 2,000,000� USD� 1,985,710� 2,015,000� 0.38Lebanon�Government�International�Bond�5.45%�28/11/2019�'GMTN'� 2,000,000� USD� 2,004,425� 2,005,000� 0.37Lebanon�Government�International�Bond�6%�27/1/2023�'REGS'� 4,000,000� USD� 3,967,114� 4,020,000� 0.75Lebanon�Government�International�Bond�6.1%�4/10/2022�'EMTN'� 2,000,000� USD� 2,045,642� 2,025,000� 0.38Lebanon�Government�International�Bond�6.375%�9/3/2020�'GMTN'� 2,000,000� USD� 2,099,737� 2,075,000� 0.39Lebanon�Government�International�Bond�6.6%�27/11/2026�'GMTN'� 1,000,000� USD� 1,025,046� 1,020,000� 0.19Lebanon�Government�International�Bond�6.75%�29/11/2027�'REGS'� 1,000,000� USD� 993,107� 1,028,500� 0.19
� � � 14,120,781� 14,188,500� 2.65
Lithuania Lithuania�Government�International�Bond�5.125%�14/9/2017�'REGS'� 3,200,000� USD� 3,244,136� 3,471,744� 0.65Lithuania�Government�International�Bond�6.125%�9/3/2021�'REGS'� 2,250,000� USD� 2,271,843� 2,635,528� 0.49Lithuania�Government�International�Bond�6.625%�1/2/2022�'REGS'� 1,000,000� USD� 993,644� 1,209,625� 0.23Lithuania�Government�International�Bond�7.375%�11/2/2020�'REGS'� 3,100,000� USD� 3,409,886� 3,731,253� 0.69
� � � 9,919,509� 11,048,150� 2.06
Luxembourg Russian�Agricultural�Bank�OJSC�Via�RSHB�Capital�SA�6.299%��15/5/2017�'REGS'� 900,000� USD� 922,279� 792,000� 0.15
Malaysia Penerbangan�Malaysia�Bhd�5.625%�15/3/2016�'REGS'� 1,200,000� USD� 1,238,119� 1,260,000� 0.24Petronas�Capital�Ltd�5.25%�12/8/2019�'REGS'� 3,800,000� USD� 4,102,686� 4,193,654� 0.77Petronas�Capital�Ltd�7.875%�22/5/2022�'REGS'� 1,900,000� USD� 2,341,205� 2,443,297� 0.46SSG�Resources�Ltd�4.25%�4/10/2022�� 300,000� USD� 297,665� 307,923� 0.06
� � � 7,979,675� 8,204,874� 1.53
Mexico Mexico�Government�International�Bond�3.625%�15/3/2022�� 1,000,000� USD� 995,039� 1,023,500� 0.19Mexico�Government�International�Bond�4.75%�8/3/2044�'MTN'� 1,504,000� USD� 1,648,437� 1,575,440� 0.29Mexico�Government�International�Bond�5.125%�15/1/2020�� 1,200,000� USD� 1,273,248� 1,324,200� 0.25Mexico�Government�International�Bond�5.95%�19/3/2019�'EMTN'� 2,500,000� USD� 2,728,888� 2,821,250� 0.53Mexico�Government�International�Bond�6.05%�11/1/2040�� 2,800,000� USD� 3,183,493� 3,430,000� 0.64Mexico�Government�International�Bond�6.75%�27/9/2034�'MTNA'� 2,600,000� USD� 3,105,348� 3,412,500� 0.64Petroleos�Mexicanos�3.5%�30/1/2023�� 2,000,000� USD� 1,995,539� 1,910,000� 0.36Petroleos�Mexicanos�4.875%�24/1/2022�� 1,000,000� USD� 1,031,186� 1,045,000� 0.20Petroleos�Mexicanos�5.5%�21/1/2021�� 2,500,000� USD� 2,575,677� 2,713,750� 0.50Petroleos�Mexicanos�5.5%�27/6/2044�� 2,000,000� USD� 1,887,995� 2,045,120� 0.38Petroleos�Mexicanos�6.375%�23/1/2045�� 2,000,000� USD� 2,290,502� 2,257,500� 0.42
� � � 22,715,352� 23,558,260� 4.40
Mongolia Development�Bank�of�Mongolia�LLC�5.75%�21/3/2017�'REGS'� 800,000� USD� 792,819� 768,000� 0.14Mongolia�Government�International�Bond�4.125%�5/1/2018�'REGS'� 400,000� USD� 396,442� 370,000� 0.07
� � � 1,189,261� 1,138,000� 0.21
Morocco Morocco�Government�International�Bond�4.25%�11/12/2022�'REGS'� 1,700,000� USD� 1,612,339� 1,729,750� 0.32Morocco�Government�International�Bond�5.5%�11/12/2042�'REGS'� 1,700,000� USD� 1,554,006� 1,759,500� 0.33
� � � 3,166,345� 3,489,250� 0.65
GLOBAL�EMERGING�MARKETS�BOND�FUND�(continued)
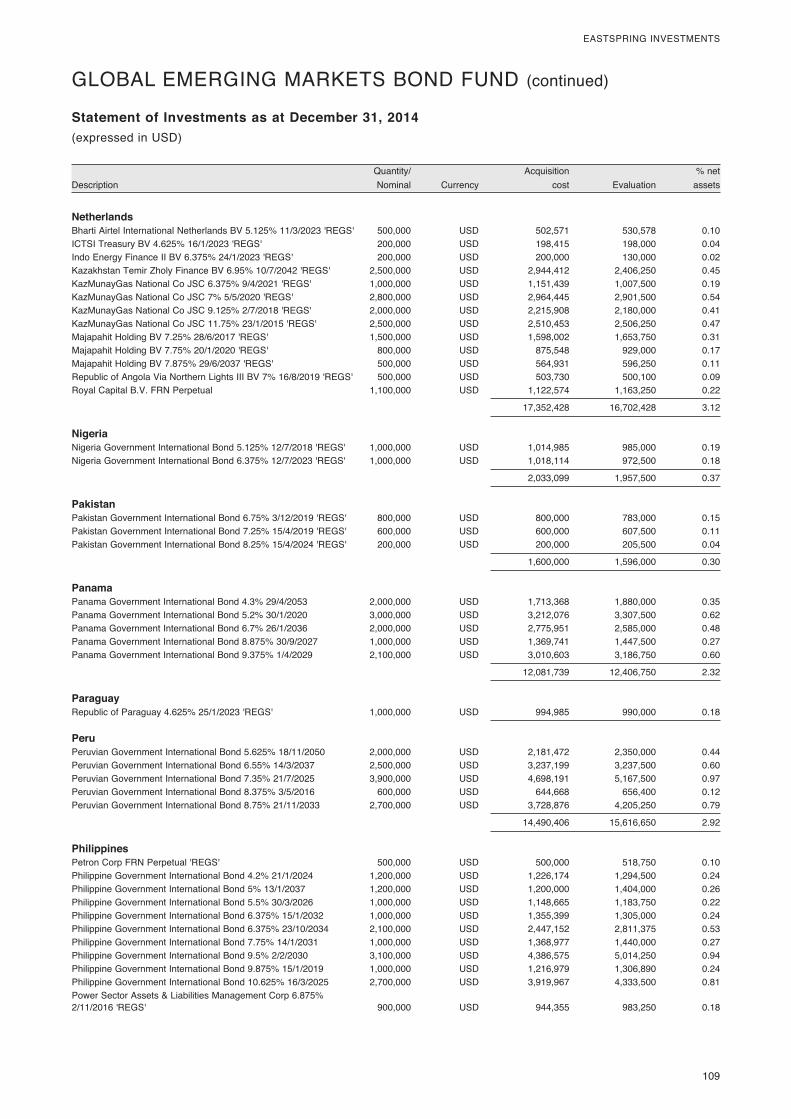
� 109
EASTSPRING�INVESTMENTS
� Quantity/�� � Acquisition�� � %�net�Description� Nominal�� Currency�� cost�� Evaluation�� assets�
Statement of Investments as at December 31, 2014(expressed�in�USD)
Netherlands Bharti�Airtel�International�Netherlands�BV�5.125%�11/3/2023�'REGS'� 500,000� USD� 502,571� 530,578� 0.10ICTSI�Treasury�BV�4.625%�16/1/2023�'REGS'� 200,000� USD� 198,415� 198,000� 0.04Indo�Energy�Finance�II�BV�6.375%�24/1/2023�'REGS'� 200,000� USD� 200,000� 130,000� 0.02Kazakhstan�Temir�Zholy�Finance�BV�6.95%�10/7/2042�'REGS'� 2,500,000� USD� 2,944,412� 2,406,250� 0.45KazMunayGas�National�Co�JSC�6.375%�9/4/2021�'REGS'� 1,000,000� USD� 1,151,439� 1,007,500� 0.19KazMunayGas�National�Co�JSC�7%�5/5/2020�'REGS'� 2,800,000� USD� 2,964,445� 2,901,500� 0.54KazMunayGas�National�Co�JSC�9.125%�2/7/2018�'REGS'� 2,000,000� USD� 2,215,908� 2,180,000� 0.41KazMunayGas�National�Co�JSC�11.75%�23/1/2015�'REGS'� 2,500,000� USD� 2,510,453� 2,506,250� 0.47Majapahit�Holding�BV�7.25%�28/6/2017�'REGS'� 1,500,000� USD� 1,598,002� 1,653,750� 0.31Majapahit�Holding�BV�7.75%�20/1/2020�'REGS'� 800,000� USD� 875,548� 929,000� 0.17Majapahit�Holding�BV�7.875%�29/6/2037�'REGS'� 500,000� USD� 564,931� 596,250� 0.11Republic�of�Angola�Via�Northern�Lights�III�BV�7%�16/8/2019�'REGS'� 500,000� USD� 503,730� 500,100� 0.09Royal�Capital�B.V.�FRN�Perpetual�� 1,100,000� USD� 1,122,574� 1,163,250� 0.22
� � � 17,352,428� 16,702,428� 3.12
Nigeria Nigeria�Government�International�Bond�5.125%�12/7/2018�'REGS'� 1,000,000� USD� 1,014,985� 985,000� 0.19Nigeria�Government�International�Bond�6.375%�12/7/2023�'REGS'� 1,000,000� USD� 1,018,114� 972,500� 0.18
� � � 2,033,099� 1,957,500� 0.37
Pakistan Pakistan�Government�International�Bond�6.75%�3/12/2019�'REGS'� 800,000� USD� 800,000� 783,000� 0.15Pakistan�Government�International�Bond�7.25%�15/4/2019�'REGS'� 600,000� USD� 600,000� 607,500� 0.11Pakistan�Government�International�Bond�8.25%�15/4/2024�'REGS'� 200,000� USD� 200,000� 205,500� 0.04
� � � 1,600,000� 1,596,000� 0.30
Panama Panama�Government�International�Bond�4.3%�29/4/2053�� 2,000,000� USD� 1,713,368� 1,880,000� 0.35Panama�Government�International�Bond�5.2%�30/1/2020�� 3,000,000� USD� 3,212,076� 3,307,500� 0.62Panama�Government�International�Bond�6.7%�26/1/2036�� 2,000,000� USD� 2,775,951� 2,585,000� 0.48Panama�Government�International�Bond�8.875%�30/9/2027�� 1,000,000� USD� 1,369,741� 1,447,500� 0.27Panama�Government�International�Bond�9.375%�1/4/2029�� 2,100,000� USD� 3,010,603� 3,186,750� 0.60
� � � 12,081,739� 12,406,750� 2.32
Paraguay Republic�of�Paraguay�4.625%�25/1/2023�'REGS'� 1,000,000� USD� 994,985� 990,000� 0.18
Peru Peruvian�Government�International�Bond�5.625%�18/11/2050�� 2,000,000� USD� 2,181,472� 2,350,000� 0.44Peruvian�Government�International�Bond�6.55%�14/3/2037�� 2,500,000� USD� 3,237,199� 3,237,500� 0.60Peruvian�Government�International�Bond�7.35%�21/7/2025�� 3,900,000� USD� 4,698,191� 5,167,500� 0.97Peruvian�Government�International�Bond�8.375%�3/5/2016�� 600,000� USD� 644,668� 656,400� 0.12Peruvian�Government�International�Bond�8.75%�21/11/2033�� 2,700,000� USD� 3,728,876� 4,205,250� 0.79
� � � 14,490,406� 15,616,650� 2.92
Philippines Petron�Corp�FRN�Perpetual�'REGS'� 500,000� USD� 500,000� 518,750� 0.10Philippine�Government�International�Bond�4.2%�21/1/2024�� 1,200,000� USD� 1,226,174� 1,294,500� 0.24Philippine�Government�International�Bond�5%�13/1/2037�� 1,200,000� USD� 1,200,000� 1,404,000� 0.26Philippine�Government�International�Bond�5.5%�30/3/2026�� 1,000,000� USD� 1,148,665� 1,183,750� 0.22Philippine�Government�International�Bond�6.375%�15/1/2032�� 1,000,000� USD� 1,355,399� 1,305,000� 0.24Philippine�Government�International�Bond�6.375%�23/10/2034�� 2,100,000� USD� 2,447,152� 2,811,375� 0.53Philippine�Government�International�Bond�7.75%�14/1/2031�� 1,000,000� USD� 1,368,977� 1,440,000� 0.27Philippine�Government�International�Bond�9.5%�2/2/2030�� 3,100,000� USD� 4,386,575� 5,014,250� 0.94Philippine�Government�International�Bond�9.875%�15/1/2019�� 1,000,000� USD� 1,216,979� 1,306,890� 0.24Philippine�Government�International�Bond�10.625%�16/3/2025�� 2,700,000� USD� 3,919,967� 4,333,500� 0.81Power�Sector�Assets�&�Liabilities�Management�Corp�6.875%��2/11/2016�'REGS'� 900,000� USD� 944,355� 983,250� 0.18
GLOBAL�EMERGING�MARKETS�BOND�FUND�(continued)
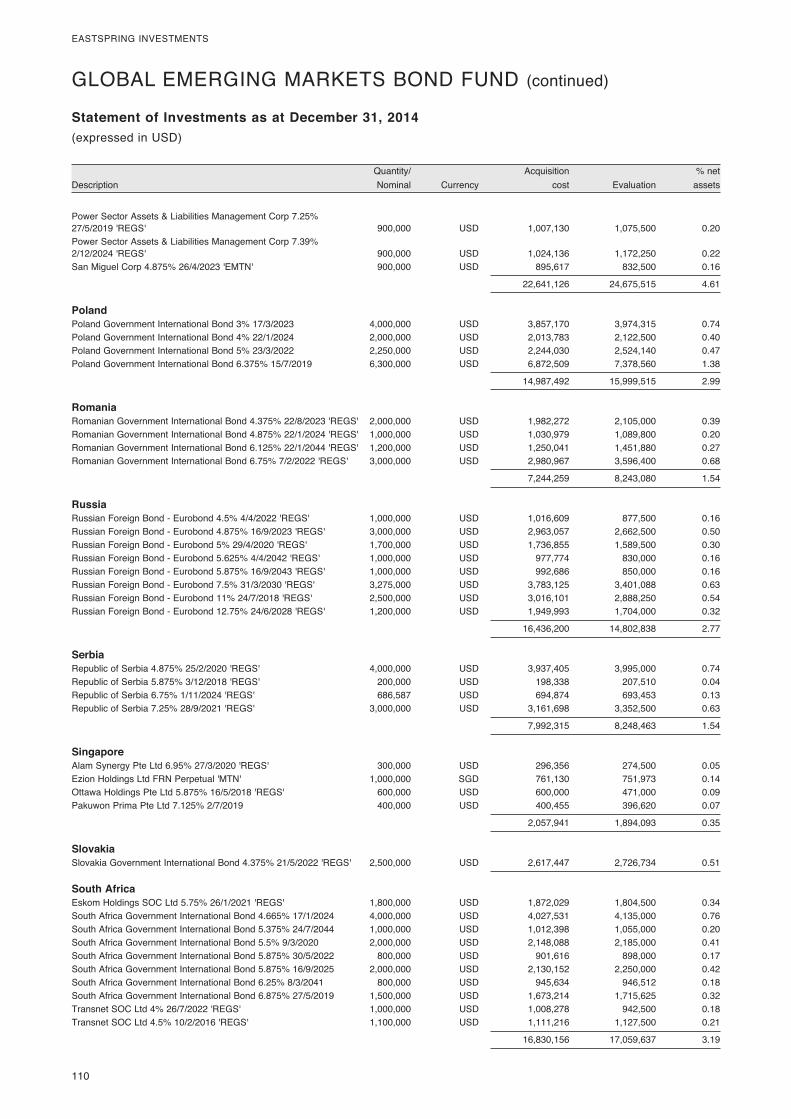
110�
EASTSPRING�INVESTMENTS
� Quantity/�� � Acquisition�� � %�net�Description� Nominal�� Currency�� cost�� Evaluation�� assets�
Statement of Investments as at December 31, 2014(expressed�in�USD)
Power�Sector�Assets�&�Liabilities�Management�Corp�7.25%��27/5/2019�'REGS'� 900,000� USD� 1,007,130� 1,075,500� 0.20Power�Sector�Assets�&�Liabilities�Management�Corp�7.39%��2/12/2024�'REGS'� 900,000� USD� 1,024,136� 1,172,250� 0.22San�Miguel�Corp�4.875%�26/4/2023�'EMTN'� 900,000� USD� 895,617� 832,500� 0.16
� � � 22,641,126� 24,675,515� 4.61
Poland Poland�Government�International�Bond�3%�17/3/2023�� 4,000,000� USD� 3,857,170� 3,974,315� 0.74Poland�Government�International�Bond�4%�22/1/2024�� 2,000,000� USD� 2,013,783� 2,122,500� 0.40Poland�Government�International�Bond�5%�23/3/2022�� 2,250,000� USD� 2,244,030� 2,524,140� 0.47Poland�Government�International�Bond�6.375%�15/7/2019�� 6,300,000� USD� 6,872,509� 7,378,560� 1.38
� � � 14,987,492� 15,999,515� 2.99
Romania Romanian�Government�International�Bond�4.375%�22/8/2023�'REGS'� 2,000,000� USD� 1,982,272� 2,105,000� 0.39Romanian�Government�International�Bond�4.875%�22/1/2024�'REGS'� 1,000,000� USD� 1,030,979� 1,089,800� 0.20Romanian�Government�International�Bond�6.125%�22/1/2044�'REGS'� 1,200,000� USD� 1,250,041� 1,451,880� 0.27Romanian�Government�International�Bond�6.75%�7/2/2022�'REGS'� 3,000,000� USD� 2,980,967� 3,596,400� 0.68
� � � 7,244,259� 8,243,080� 1.54
Russia Russian�Foreign�Bond�-�Eurobond�4.5%�4/4/2022�'REGS'� 1,000,000� USD� 1,016,609� 877,500� 0.16Russian�Foreign�Bond�-�Eurobond�4.875%�16/9/2023�'REGS'� 3,000,000� USD� 2,963,057� 2,662,500� 0.50Russian�Foreign�Bond�-�Eurobond�5%�29/4/2020�'REGS'� 1,700,000� USD� 1,736,855� 1,589,500� 0.30Russian�Foreign�Bond�-�Eurobond�5.625%�4/4/2042�'REGS'� 1,000,000� USD� 977,774� 830,000� 0.16Russian�Foreign�Bond�-�Eurobond�5.875%�16/9/2043�'REGS'� 1,000,000� USD� 992,686� 850,000� 0.16Russian�Foreign�Bond�-�Eurobond�7.5%�31/3/2030�'REGS'� 3,275,000� USD� 3,783,125� 3,401,088� 0.63Russian�Foreign�Bond�-�Eurobond�11%�24/7/2018�'REGS'� 2,500,000� USD� 3,016,101� 2,888,250� 0.54Russian�Foreign�Bond�-�Eurobond�12.75%�24/6/2028�'REGS'� 1,200,000� USD� 1,949,993� 1,704,000� 0.32
� � � 16,436,200� 14,802,838� 2.77
Serbia Republic�of�Serbia�4.875%�25/2/2020�'REGS'� 4,000,000� USD� 3,937,405� 3,995,000� 0.74Republic�of�Serbia�5.875%�3/12/2018�'REGS'� 200,000� USD� 198,338� 207,510� 0.04Republic�of�Serbia�6.75%�1/11/2024�'REGS'� 686,587� USD� 694,874� 693,453� 0.13Republic�of�Serbia�7.25%�28/9/2021�'REGS'� 3,000,000� USD� 3,161,698� 3,352,500� 0.63
� � � 7,992,315� 8,248,463� 1.54
Singapore Alam�Synergy�Pte�Ltd�6.95%�27/3/2020�'REGS'� 300,000� USD� 296,356� 274,500� 0.05Ezion�Holdings�Ltd�FRN�Perpetual�'MTN'� 1,000,000� SGD� 761,130� 751,973� 0.14Ottawa�Holdings�Pte�Ltd�5.875%�16/5/2018�'REGS'� 600,000� USD� 600,000� 471,000� 0.09Pakuwon�Prima�Pte�Ltd�7.125%�2/7/2019�� 400,000� USD� 400,455� 396,620� 0.07
� � � 2,057,941� 1,894,093� 0.35
Slovakia Slovakia�Government�International�Bond�4.375%�21/5/2022�'REGS'� 2,500,000� USD� 2,617,447� 2,726,734� 0.51
South Africa Eskom�Holdings�SOC�Ltd�5.75%�26/1/2021�'REGS'� 1,800,000� USD� 1,872,029� 1,804,500� 0.34South�Africa�Government�International�Bond�4.665%�17/1/2024�� 4,000,000� USD� 4,027,531� 4,135,000� 0.76South�Africa�Government�International�Bond�5.375%�24/7/2044�� 1,000,000� USD� 1,012,398� 1,055,000� 0.20South�Africa�Government�International�Bond�5.5%�9/3/2020�� 2,000,000� USD� 2,148,088� 2,185,000� 0.41South�Africa�Government�International�Bond�5.875%�30/5/2022�� 800,000� USD� 901,616� 898,000� 0.17South�Africa�Government�International�Bond�5.875%�16/9/2025�� 2,000,000� USD� 2,130,152� 2,250,000� 0.42South�Africa�Government�International�Bond�6.25%�8/3/2041�� 800,000� USD� 945,634� 946,512� 0.18South�Africa�Government�International�Bond�6.875%�27/5/2019�� 1,500,000� USD� 1,673,214� 1,715,625� 0.32Transnet�SOC�Ltd�4%�26/7/2022�'REGS'� 1,000,000� USD� 1,008,278� 942,500� 0.18Transnet�SOC�Ltd�4.5%�10/2/2016�'REGS'� 1,100,000� USD� 1,111,216� 1,127,500� 0.21
� � � 16,830,156� 17,059,637� 3.19
GLOBAL�EMERGING�MARKETS�BOND�FUND�(continued)
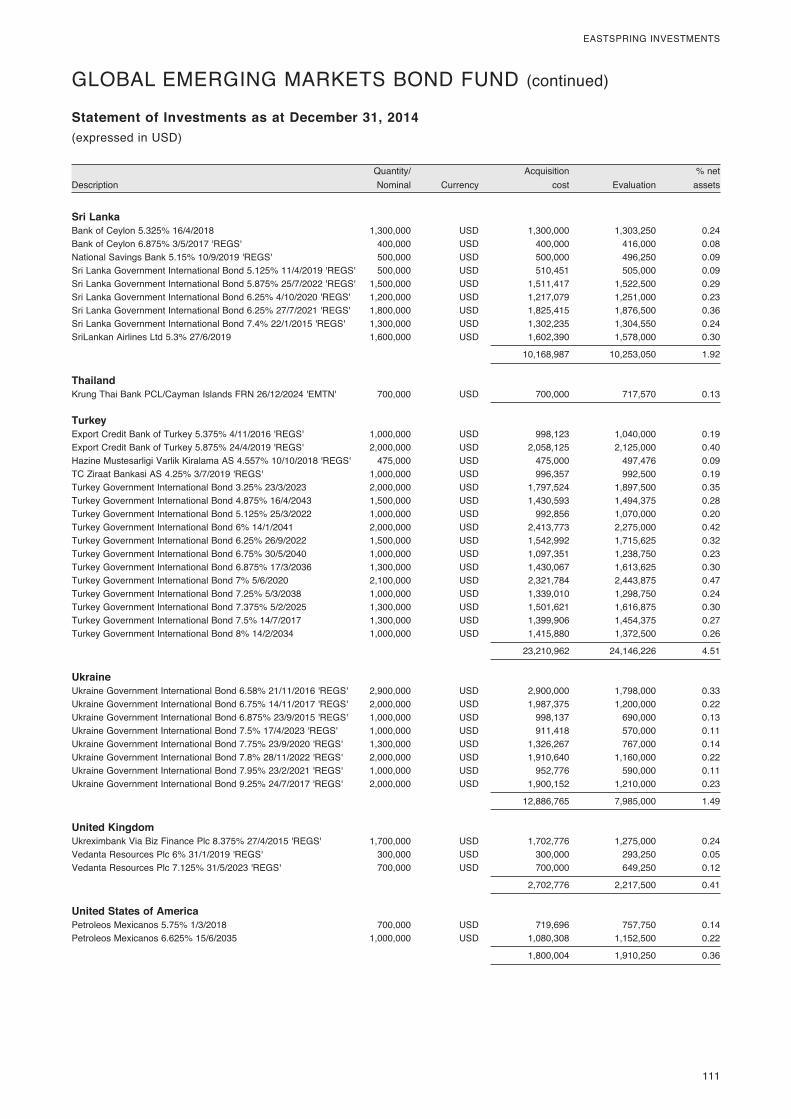
� 111
EASTSPRING�INVESTMENTS
� Quantity/�� � Acquisition�� � %�net�Description� Nominal�� Currency�� cost�� Evaluation�� assets�
Statement of Investments as at December 31, 2014(expressed�in�USD)
Sri Lanka Bank�of�Ceylon�5.325%�16/4/2018�� 1,300,000� USD� 1,300,000� 1,303,250� 0.24Bank�of�Ceylon�6.875%�3/5/2017�'REGS'� 400,000� USD� 400,000� 416,000� 0.08National�Savings�Bank�5.15%�10/9/2019�'REGS'� 500,000� USD� 500,000� 496,250� 0.09Sri�Lanka�Government�International�Bond�5.125%�11/4/2019�'REGS'� 500,000� USD� 510,451� 505,000� 0.09Sri�Lanka�Government�International�Bond�5.875%�25/7/2022�'REGS'� 1,500,000� USD� 1,511,417� 1,522,500� 0.29Sri�Lanka�Government�International�Bond�6.25%�4/10/2020�'REGS'� 1,200,000� USD� 1,217,079� 1,251,000� 0.23Sri�Lanka�Government�International�Bond�6.25%�27/7/2021�'REGS'� 1,800,000� USD� 1,825,415� 1,876,500� 0.36Sri�Lanka�Government�International�Bond�7.4%�22/1/2015�'REGS'� 1,300,000� USD� 1,302,235� 1,304,550� 0.24SriLankan�Airlines�Ltd�5.3%�27/6/2019�� 1,600,000� USD� 1,602,390� 1,578,000� 0.30
� � � 10,168,987� 10,253,050� 1.92
Thailand Krung�Thai�Bank�PCL/Cayman�Islands�FRN�26/12/2024�'EMTN'� 700,000� USD� 700,000� 717,570� 0.13
Turkey Export�Credit�Bank�of�Turkey�5.375%�4/11/2016�'REGS'� 1,000,000� USD� 998,123� 1,040,000� 0.19Export�Credit�Bank�of�Turkey�5.875%�24/4/2019�'REGS'� 2,000,000� USD� 2,058,125� 2,125,000� 0.40Hazine�Mustesarligi�Varlik�Kiralama�AS�4.557%�10/10/2018�'REGS'� 475,000� USD� 475,000� 497,476� 0.09TC�Ziraat�Bankasi�AS�4.25%�3/7/2019�'REGS'� 1,000,000� USD� 996,357� 992,500� 0.19Turkey�Government�International�Bond�3.25%�23/3/2023�� 2,000,000� USD� 1,797,524� 1,897,500� 0.35Turkey�Government�International�Bond�4.875%�16/4/2043�� 1,500,000� USD� 1,430,593� 1,494,375� 0.28Turkey�Government�International�Bond�5.125%�25/3/2022�� 1,000,000� USD� 992,856� 1,070,000� 0.20Turkey�Government�International�Bond�6%�14/1/2041�� 2,000,000� USD� 2,413,773� 2,275,000� 0.42Turkey�Government�International�Bond�6.25%�26/9/2022�� 1,500,000� USD� 1,542,992� 1,715,625� 0.32Turkey�Government�International�Bond�6.75%�30/5/2040�� 1,000,000� USD� 1,097,351� 1,238,750� 0.23Turkey�Government�International�Bond�6.875%�17/3/2036�� 1,300,000� USD� 1,430,067� 1,613,625� 0.30Turkey�Government�International�Bond�7%�5/6/2020�� 2,100,000� USD� 2,321,784� 2,443,875� 0.47Turkey�Government�International�Bond�7.25%�5/3/2038�� 1,000,000� USD� 1,339,010� 1,298,750� 0.24Turkey�Government�International�Bond�7.375%�5/2/2025�� 1,300,000� USD� 1,501,621� 1,616,875� 0.30Turkey�Government�International�Bond�7.5%�14/7/2017�� 1,300,000� USD� 1,399,906� 1,454,375� 0.27Turkey�Government�International�Bond�8%�14/2/2034�� 1,000,000� USD� 1,415,880� 1,372,500� 0.26
� � � 23,210,962� 24,146,226� 4.51
Ukraine Ukraine�Government�International�Bond�6.58%�21/11/2016�'REGS'� 2,900,000� USD� 2,900,000� 1,798,000� 0.33Ukraine�Government�International�Bond�6.75%�14/11/2017�'REGS'� 2,000,000� USD� 1,987,375� 1,200,000� 0.22Ukraine�Government�International�Bond�6.875%�23/9/2015�'REGS'� 1,000,000� USD� 998,137� 690,000� 0.13Ukraine�Government�International�Bond�7.5%�17/4/2023�'REGS'� 1,000,000� USD� 911,418� 570,000� 0.11Ukraine�Government�International�Bond�7.75%�23/9/2020�'REGS'� 1,300,000� USD� 1,326,267� 767,000� 0.14Ukraine�Government�International�Bond�7.8%�28/11/2022�'REGS'� 2,000,000� USD� 1,910,640� 1,160,000� 0.22Ukraine�Government�International�Bond�7.95%�23/2/2021�'REGS'� 1,000,000� USD� 952,776� 590,000� 0.11Ukraine�Government�International�Bond�9.25%�24/7/2017�'REGS'� 2,000,000� USD� 1,900,152� 1,210,000� 0.23
� � � 12,886,765� 7,985,000� 1.49
United Kingdom Ukreximbank�Via�Biz�Finance�Plc�8.375%�27/4/2015�'REGS'� 1,700,000� USD� 1,702,776� 1,275,000� 0.24Vedanta�Resources�Plc�6%�31/1/2019�'REGS'� 300,000� USD� 300,000� 293,250� 0.05Vedanta�Resources�Plc�7.125%�31/5/2023�'REGS'� 700,000� USD� 700,000� 649,250� 0.12
� � � 2,702,776� 2,217,500� 0.41
United States of America Petroleos�Mexicanos�5.75%�1/3/2018�� 700,000� USD� 719,696� 757,750� 0.14Petroleos�Mexicanos�6.625%�15/6/2035�� 1,000,000� USD� 1,080,308� 1,152,500� 0.22
� � � 1,800,004� 1,910,250� 0.36
GLOBAL�EMERGING�MARKETS�BOND�FUND�(continued)
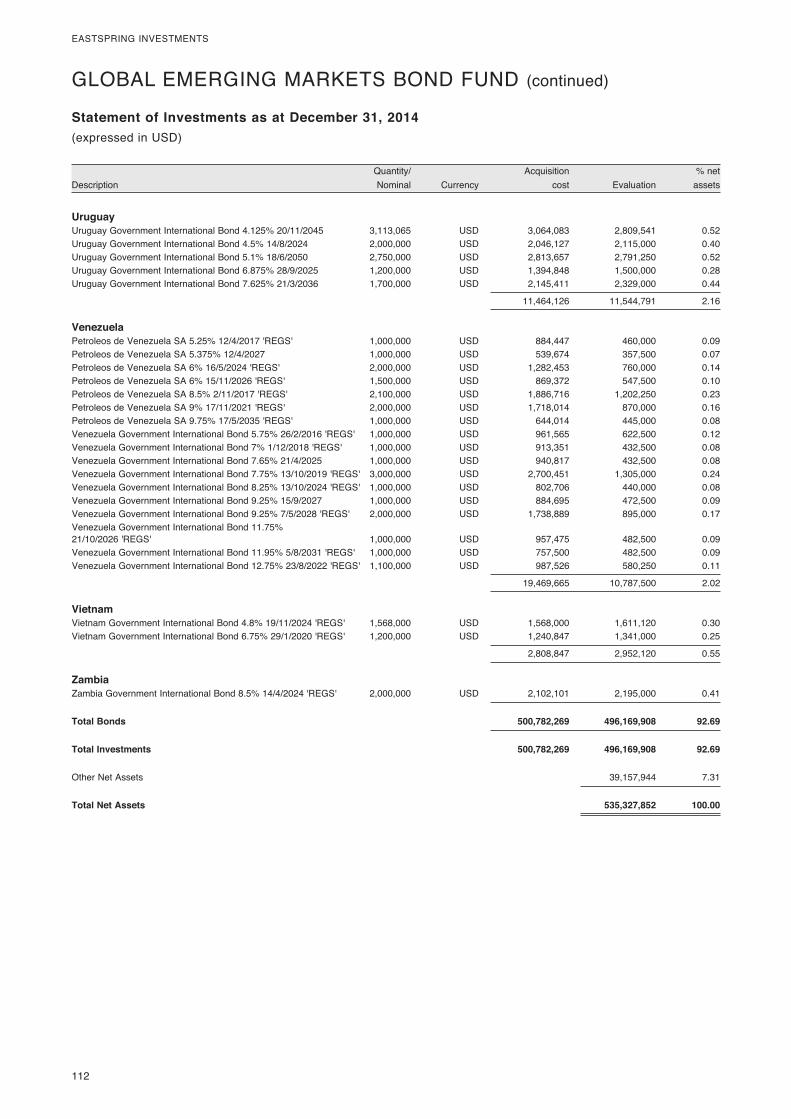
112�
EASTSPRING�INVESTMENTS
� Quantity/�� � Acquisition�� � %�net�Description� Nominal�� Currency�� cost�� Evaluation�� assets�
Statement of Investments as at December 31, 2014(expressed�in�USD)
Uruguay Uruguay�Government�International�Bond�4.125%�20/11/2045�� 3,113,065� USD� 3,064,083� 2,809,541� 0.52Uruguay�Government�International�Bond�4.5%�14/8/2024�� 2,000,000� USD� 2,046,127� 2,115,000� 0.40Uruguay�Government�International�Bond�5.1%�18/6/2050�� 2,750,000� USD� 2,813,657� 2,791,250� 0.52Uruguay�Government�International�Bond�6.875%�28/9/2025�� 1,200,000� USD� 1,394,848� 1,500,000� 0.28Uruguay�Government�International�Bond�7.625%�21/3/2036�� 1,700,000� USD� 2,145,411� 2,329,000� 0.44
� � � 11,464,126� 11,544,791� 2.16
Venezuela Petroleos�de�Venezuela�SA�5.25%�12/4/2017�'REGS'� 1,000,000� USD� 884,447� 460,000� 0.09Petroleos�de�Venezuela�SA�5.375%�12/4/2027�� 1,000,000� USD� 539,674� 357,500� 0.07Petroleos�de�Venezuela�SA�6%�16/5/2024�'REGS'� 2,000,000� USD� 1,282,453� 760,000� 0.14Petroleos�de�Venezuela�SA�6%�15/11/2026�'REGS'� 1,500,000� USD� 869,372� 547,500� 0.10Petroleos�de�Venezuela�SA�8.5%�2/11/2017�'REGS'� 2,100,000� USD� 1,886,716� 1,202,250� 0.23Petroleos�de�Venezuela�SA�9%�17/11/2021�'REGS'� 2,000,000� USD� 1,718,014� 870,000� 0.16Petroleos�de�Venezuela�SA�9.75%�17/5/2035�'REGS'� 1,000,000� USD� 644,014� 445,000� 0.08Venezuela�Government�International�Bond�5.75%�26/2/2016�'REGS'� 1,000,000� USD� 961,565� 622,500� 0.12Venezuela�Government�International�Bond�7%�1/12/2018�'REGS'� 1,000,000� USD� 913,351� 432,500� 0.08Venezuela�Government�International�Bond�7.65%�21/4/2025�� 1,000,000� USD� 940,817� 432,500� 0.08Venezuela�Government�International�Bond�7.75%�13/10/2019�'REGS'� 3,000,000� USD� 2,700,451� 1,305,000� 0.24Venezuela�Government�International�Bond�8.25%�13/10/2024�'REGS'� 1,000,000� USD� 802,706� 440,000� 0.08Venezuela�Government�International�Bond�9.25%�15/9/2027�� 1,000,000� USD� 884,695� 472,500� 0.09Venezuela�Government�International�Bond�9.25%�7/5/2028�'REGS'� 2,000,000� USD� 1,738,889� 895,000� 0.17Venezuela�Government�International�Bond�11.75%��21/10/2026�'REGS'� 1,000,000� USD� 957,475� 482,500� 0.09Venezuela�Government�International�Bond�11.95%�5/8/2031�'REGS'� 1,000,000� USD� 757,500� 482,500� 0.09Venezuela�Government�International�Bond�12.75%�23/8/2022�'REGS'� 1,100,000� USD� 987,526� 580,250� 0.11
� � � 19,469,665� 10,787,500� 2.02
Vietnam Vietnam�Government�International�Bond�4.8%�19/11/2024�'REGS'� 1,568,000� USD� 1,568,000� 1,611,120� 0.30Vietnam�Government�International�Bond�6.75%�29/1/2020�'REGS'� 1,200,000� USD� 1,240,847� 1,341,000� 0.25
� � � 2,808,847� 2,952,120� 0.55
Zambia Zambia�Government�International�Bond�8.5%�14/4/2024�'REGS'� 2,000,000� USD� 2,102,101� 2,195,000� 0.41
Total Bonds 500,782,269 496,169,908 92.69
Total Investments 500,782,269 496,169,908 92.69
Other�Net�Assets� � � � 39,157,944� 7.31
Total Net Assets 535,327,852 100.00
GLOBAL�EMERGING�MARKETS�BOND�FUND�(continued)
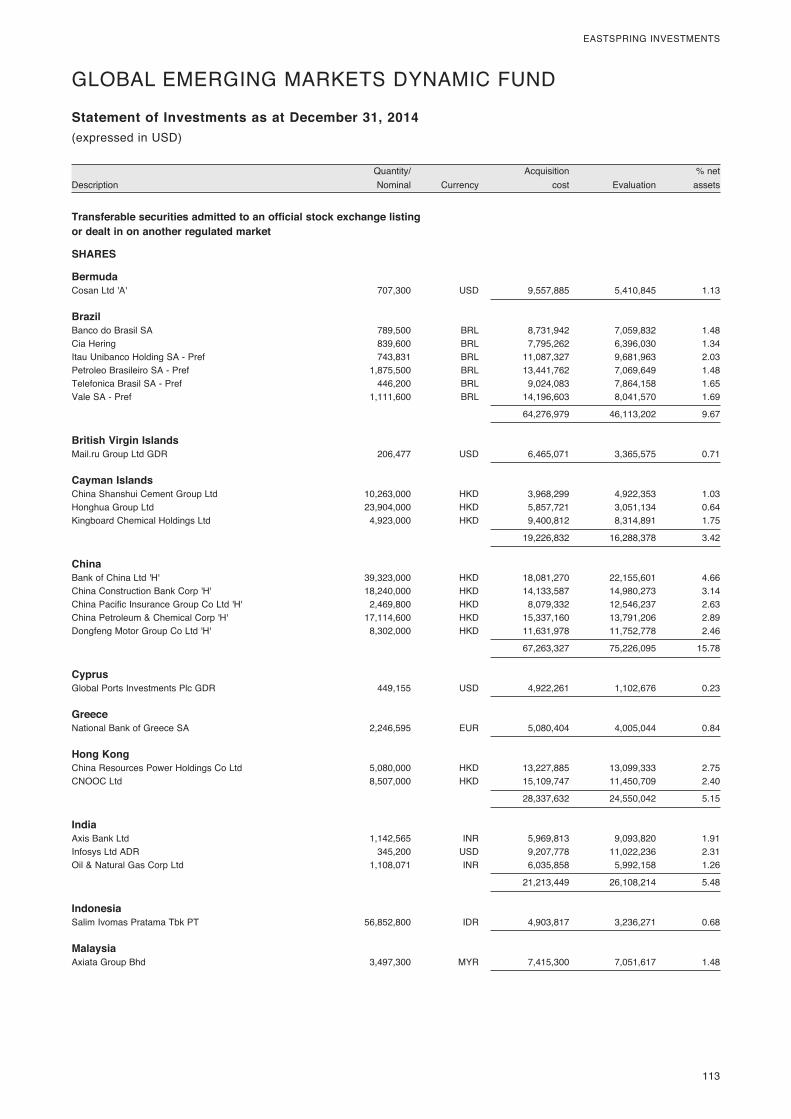
� 113
EASTSPRING�INVESTMENTS
� Quantity/�� � Acquisition�� � %�net�Description� Nominal�� Currency�� cost�� Evaluation�� assets�
Statement of Investments as at December 31, 2014(expressed�in�USD)
Transferable securities admitted to an official stock exchange listing or dealt in on another regulated market
SHARES
Bermuda Cosan�Ltd�'A'�� 707,300� USD� 9,557,885� 5,410,845� 1.13
Brazil Banco�do�Brasil�SA� 789,500� BRL� 8,731,942� 7,059,832� 1.48Cia�Hering� 839,600� BRL� 7,795,262� 6,396,030� 1.34Itau�Unibanco�Holding�SA�-�Pref� 743,831� BRL� 11,087,327� 9,681,963� 2.03Petroleo�Brasileiro�SA�-�Pref� 1,875,500� BRL� 13,441,762� 7,069,649� 1.48Telefonica�Brasil�SA�-�Pref� 446,200� BRL� 9,024,083� 7,864,158� 1.65Vale�SA�-�Pref�� 1,111,600� BRL� 14,196,603� 8,041,570� 1.69
� � � 64,276,979� 46,113,202� 9.67
British Virgin Islands Mail.ru�Group�Ltd�GDR�� 206,477� USD� 6,465,071� 3,365,575� 0.71
Cayman Islands China�Shanshui�Cement�Group�Ltd� 10,263,000� HKD� 3,968,299� 4,922,353� 1.03Honghua�Group�Ltd� 23,904,000� HKD� 5,857,721� 3,051,134� 0.64Kingboard�Chemical�Holdings�Ltd�� 4,923,000� HKD� 9,400,812� 8,314,891� 1.75
� � � 19,226,832� 16,288,378� 3.42
China Bank�of�China�Ltd�'H'� 39,323,000� HKD� 18,081,270� 22,155,601� 4.66China�Construction�Bank�Corp�'H'� 18,240,000� HKD� 14,133,587� 14,980,273� 3.14China�Pacific�Insurance�Group�Co�Ltd�'H'� 2,469,800� HKD� 8,079,332� 12,546,237� 2.63China�Petroleum�&�Chemical�Corp�'H'� 17,114,600� HKD� 15,337,160� 13,791,206� 2.89Dongfeng�Motor�Group�Co�Ltd�'H'�� 8,302,000� HKD� 11,631,978� 11,752,778� 2.46
� � � 67,263,327� 75,226,095� 15.78
Cyprus Global�Ports�Investments�Plc�GDR�� 449,155� USD� 4,922,261� 1,102,676� 0.23
Greece National�Bank�of�Greece�SA�� 2,246,595� EUR� 5,080,404� 4,005,044� 0.84
Hong Kong China�Resources�Power�Holdings�Co�Ltd� 5,080,000� HKD� 13,227,885� 13,099,333� 2.75CNOOC�Ltd�� 8,507,000� HKD� 15,109,747� 11,450,709� 2.40
� � � 28,337,632� 24,550,042� 5.15
India Axis�Bank�Ltd� 1,142,565� INR� 5,969,813� 9,093,820� 1.91Infosys�Ltd�ADR� 345,200� USD� 9,207,778� 11,022,236� 2.31Oil�&�Natural�Gas�Corp�Ltd�� 1,108,071� INR� 6,035,858� 5,992,158� 1.26
� � � 21,213,449� 26,108,214� 5.48
Indonesia Salim�Ivomas�Pratama�Tbk�PT�� 56,852,800� IDR� 4,903,817� 3,236,271� 0.68
Malaysia Axiata�Group�Bhd�� 3,497,300� MYR� 7,415,300� 7,051,617� 1.48
GLOBAL�EMERGING�MARKETS�DYNAMIC�FUND
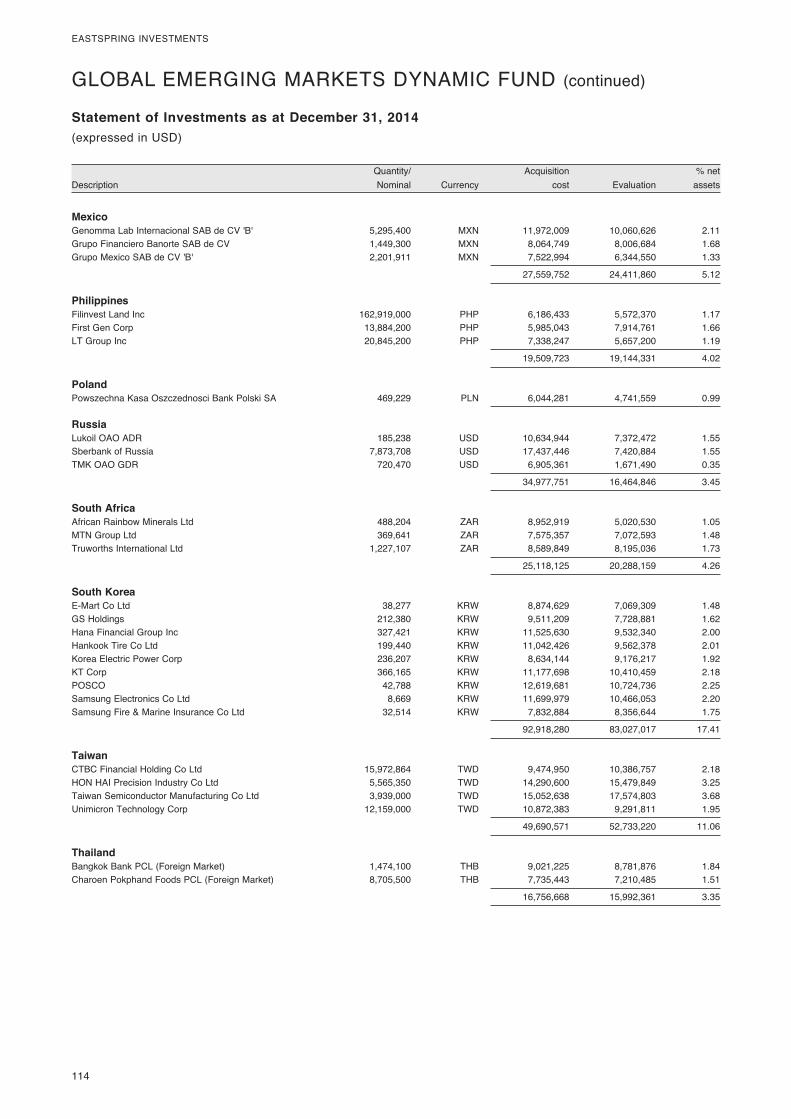
114�
EASTSPRING�INVESTMENTS
� Quantity/�� � Acquisition�� � %�net�Description� Nominal�� Currency�� cost�� Evaluation�� assets�
Statement of Investments as at December 31, 2014(expressed�in�USD)
Mexico Genomma�Lab�Internacional�SAB�de�CV�'B'� 5,295,400� MXN� 11,972,009� 10,060,626� 2.11Grupo�Financiero�Banorte�SAB�de�CV� 1,449,300� MXN� 8,064,749� 8,006,684� 1.68Grupo�Mexico�SAB�de�CV�'B'�� 2,201,911� MXN� 7,522,994� 6,344,550� 1.33
� � � 27,559,752� 24,411,860� 5.12
Philippines Filinvest�Land�Inc� 162,919,000� PHP� 6,186,433� 5,572,370� 1.17First�Gen�Corp� 13,884,200� PHP� 5,985,043� 7,914,761� 1.66LT�Group�Inc�� 20,845,200� PHP� 7,338,247� 5,657,200� 1.19
� � � 19,509,723� 19,144,331� 4.02
Poland Powszechna�Kasa�Oszczednosci�Bank�Polski�SA�� 469,229� PLN� 6,044,281� 4,741,559� 0.99
Russia Lukoil�OAO�ADR� 185,238� USD� 10,634,944� 7,372,472� 1.55Sberbank�of�Russia� 7,873,708� USD� 17,437,446� 7,420,884� 1.55TMK�OAO�GDR�� 720,470� USD� 6,905,361� 1,671,490� 0.35
� � � 34,977,751� 16,464,846� 3.45
South Africa African�Rainbow�Minerals�Ltd� 488,204� ZAR� 8,952,919� 5,020,530� 1.05MTN�Group�Ltd� 369,641� ZAR� 7,575,357� 7,072,593� 1.48Truworths�International�Ltd�� 1,227,107� ZAR� 8,589,849� 8,195,036� 1.73
� � � 25,118,125� 20,288,159� 4.26
South Korea E-Mart�Co�Ltd� 38,277� KRW� 8,874,629� 7,069,309� 1.48GS�Holdings� 212,380� KRW� 9,511,209� 7,728,881� 1.62Hana�Financial�Group�Inc� 327,421� KRW� 11,525,630� 9,532,340� 2.00Hankook�Tire�Co�Ltd� 199,440� KRW� 11,042,426� 9,562,378� 2.01Korea�Electric�Power�Corp� 236,207� KRW� 8,634,144� 9,176,217� 1.92KT�Corp� 366,165� KRW� 11,177,698� 10,410,459� 2.18POSCO� 42,788� KRW� 12,619,681� 10,724,736� 2.25Samsung�Electronics�Co�Ltd� 8,669� KRW� 11,699,979� 10,466,053� 2.20Samsung�Fire�&�Marine�Insurance�Co�Ltd�� 32,514� KRW� 7,832,884� 8,356,644� 1.75
� � � 92,918,280� 83,027,017� 17.41
Taiwan CTBC�Financial�Holding�Co�Ltd� 15,972,864� TWD� 9,474,950� 10,386,757� 2.18HON�HAI�Precision�Industry�Co�Ltd� 5,565,350� TWD� 14,290,600� 15,479,849� 3.25Taiwan�Semiconductor�Manufacturing�Co�Ltd� 3,939,000� TWD� 15,052,638� 17,574,803� 3.68Unimicron�Technology�Corp�� 12,159,000� TWD� 10,872,383� 9,291,811� 1.95
� � � 49,690,571� 52,733,220� 11.06
Thailand Bangkok�Bank�PCL�(Foreign�Market)� 1,474,100� THB� 9,021,225� 8,781,876� 1.84Charoen�Pokphand�Foods�PCL�(Foreign�Market)�� 8,705,500� THB� 7,735,443� 7,210,485� 1.51
� � � 16,756,668� 15,992,361� 3.35
GLOBAL�EMERGING�MARKETS�DYNAMIC�FUND�(continued)
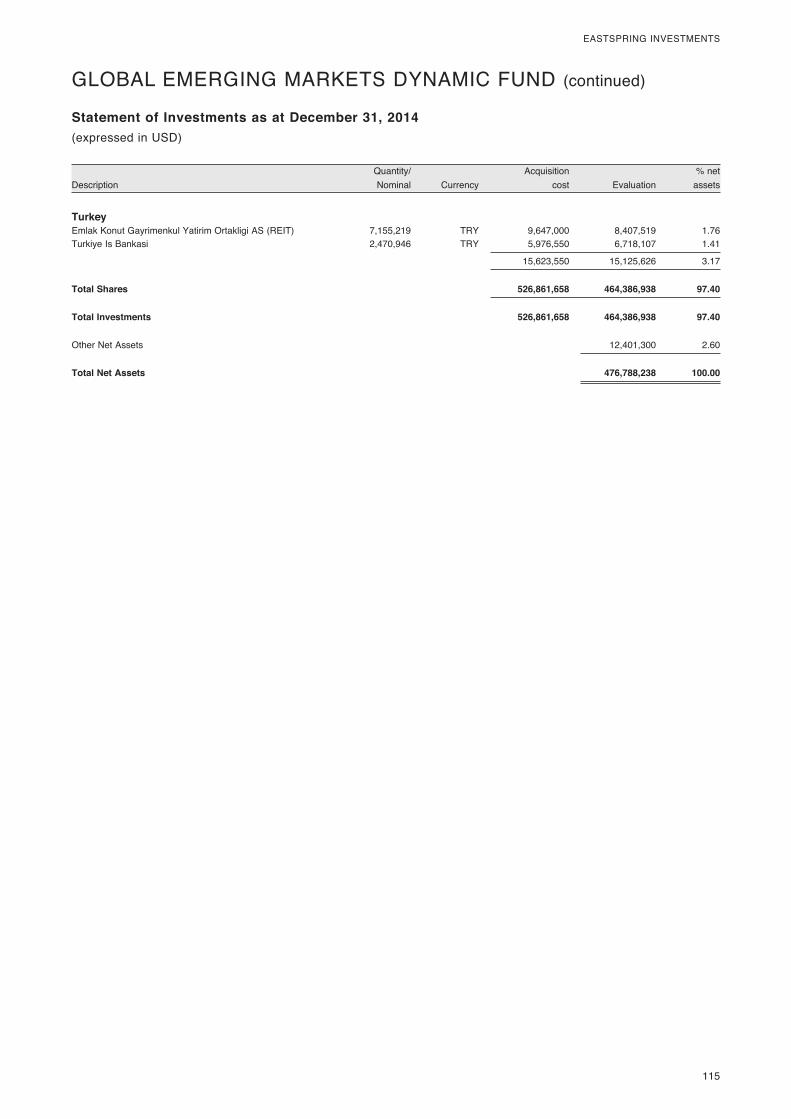
� 115
EASTSPRING�INVESTMENTS
� Quantity/�� � Acquisition�� � %�net�Description� Nominal�� Currency�� cost�� Evaluation�� assets�
Statement of Investments as at December 31, 2014(expressed�in�USD)
Turkey Emlak�Konut�Gayrimenkul�Yatirim�Ortakligi�AS�(REIT)� 7,155,219� TRY� 9,647,000� 8,407,519� 1.76Turkiye�Is�Bankasi�� 2,470,946� TRY� 5,976,550� 6,718,107� 1.41
� � � 15,623,550� 15,125,626� 3.17
Total Shares 526,861,658 464,386,938 97.40
Total Investments 526,861,658 464,386,938 97.40
Other�Net�Assets� � � � 12,401,300� 2.60
Total Net Assets 476,788,238 100.00
GLOBAL�EMERGING�MARKETS�DYNAMIC�FUND�(continued)
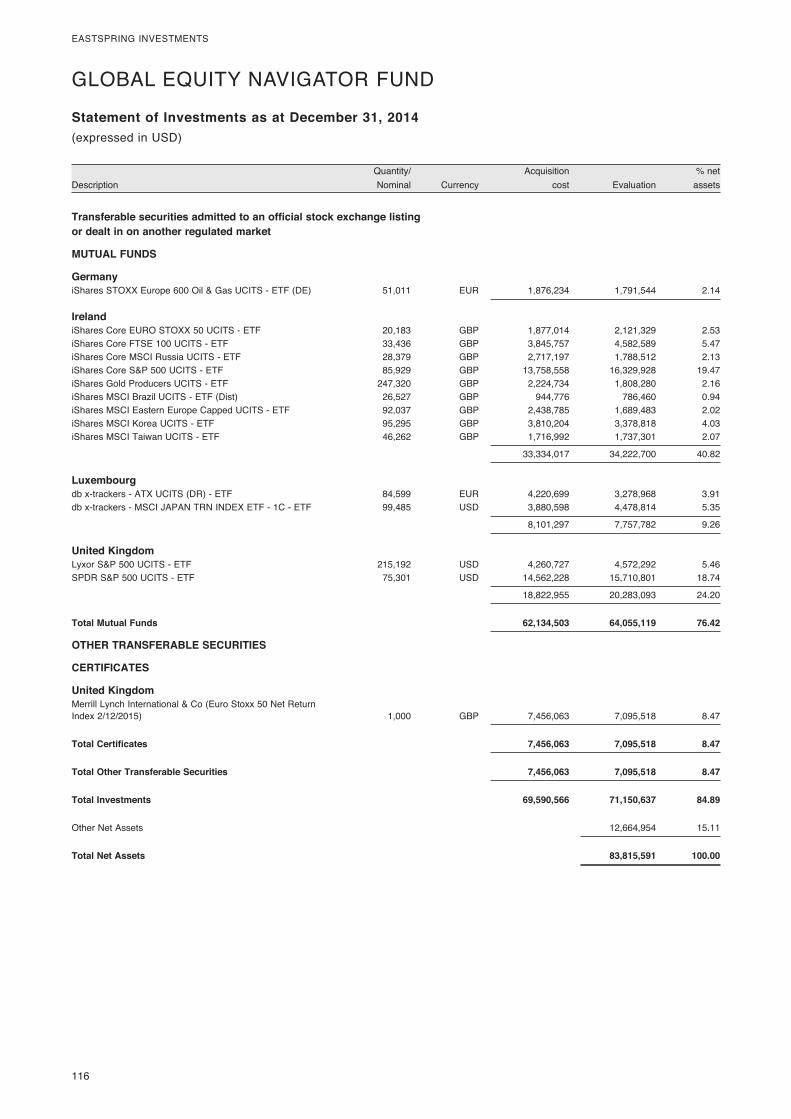
116�
EASTSPRING�INVESTMENTS
� Quantity/�� � Acquisition�� � %�net�Description� Nominal�� Currency�� cost�� Evaluation�� assets�
Statement of Investments as at December 31, 2014(expressed�in�USD)
Transferable securities admitted to an official stock exchange listing or dealt in on another regulated market
MUTUAL FUNDS
Germany iShares�STOXX�Europe�600�Oil�&�Gas�UCITS�-�ETF�(DE)�� 51,011� EUR� 1,876,234� 1,791,544� 2.14
Ireland iShares�Core�EURO�STOXX�50�UCITS�-�ETF�� 20,183� GBP� 1,877,014� 2,121,329� 2.53iShares�Core�FTSE�100�UCITS�-�ETF�� 33,436� GBP� 3,845,757� 4,582,589� 5.47iShares�Core�MSCI�Russia�UCITS�-�ETF�� 28,379� GBP� 2,717,197� 1,788,512� 2.13iShares�Core�S&P�500�UCITS�-�ETF�� 85,929� GBP� 13,758,558� 16,329,928� 19.47iShares�Gold�Producers�UCITS�-�ETF�� 247,320� GBP� 2,224,734� 1,808,280� 2.16iShares�MSCI�Brazil�UCITS�-�ETF�(Dist)�� 26,527� GBP� 944,776� 786,460� 0.94iShares�MSCI�Eastern�Europe�Capped�UCITS�-�ETF�� 92,037� GBP� 2,438,785� 1,689,483� 2.02iShares�MSCI�Korea�UCITS�-�ETF�� 95,295� GBP� 3,810,204� 3,378,818� 4.03iShares�MSCI�Taiwan�UCITS�-�ETF�� 46,262� GBP� 1,716,992� 1,737,301� 2.07
� � � 33,334,017� 34,222,700� 40.82
Luxembourg db�x-trackers�-�ATX�UCITS�(DR)�-�ETF�� 84,599� EUR� 4,220,699� 3,278,968� 3.91db�x-trackers�-�MSCI�JAPAN�TRN�INDEX�ETF�-�1C�-�ETF�� 99,485� USD� 3,880,598� 4,478,814� 5.35
� � � 8,101,297� 7,757,782� 9.26
United Kingdom Lyxor�S&P�500�UCITS�-�ETF�� 215,192� USD� 4,260,727� 4,572,292� 5.46SPDR�S&P�500�UCITS�-�ETF�� 75,301� USD� 14,562,228� 15,710,801� 18.74
� � � 18,822,955� 20,283,093� 24.20
Total Mutual Funds 62,134,503 64,055,119 76.42
OTHER TRANSFERABLE SECURITIES
CERTIFICATES
United Kingdom Merrill�Lynch�International�&�Co�(Euro�Stoxx�50�Net�Return��Index�2/12/2015)�� 1,000� GBP� 7,456,063� 7,095,518� 8.47
Total Certificates 7,456,063 7,095,518 8.47
Total Other Transferable Securities 7,456,063 7,095,518 8.47
Total Investments 69,590,566 71,150,637 84.89
Other�Net�Assets� � � � 12,664,954� 15.11
Total Net Assets 83,815,591 100.00
GLOBAL�EQUITY�NAVIGATOR�FUND
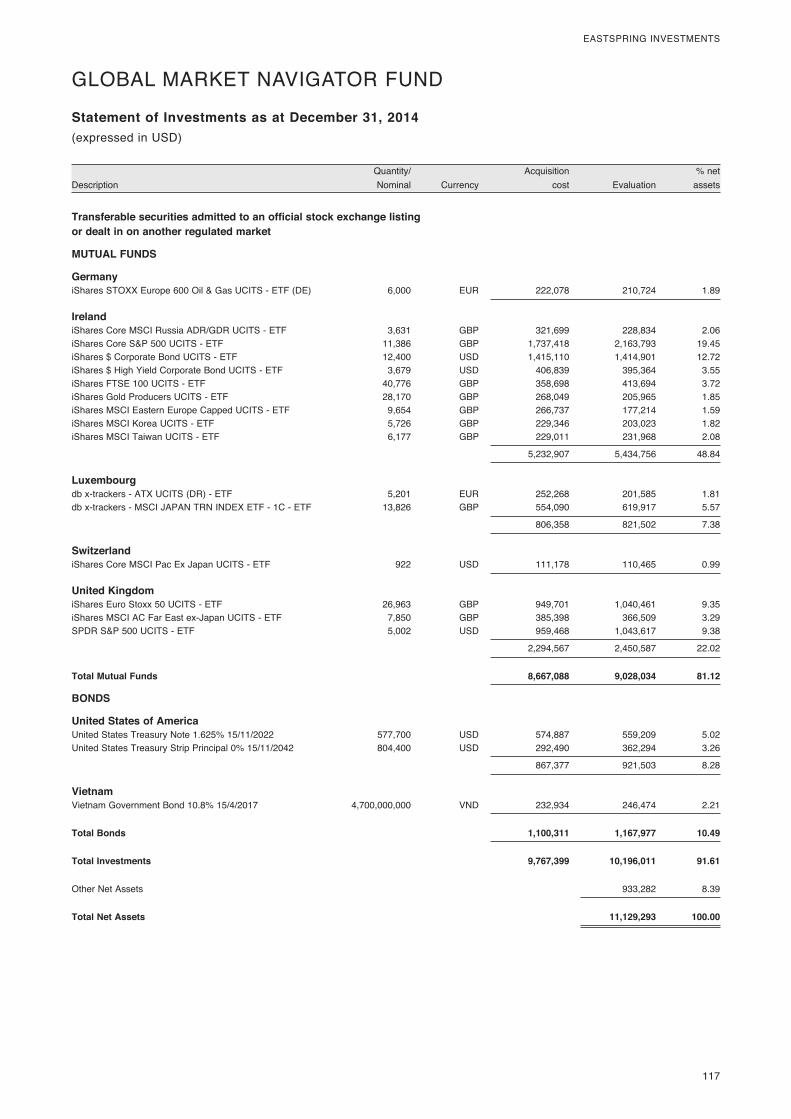
� 117
EASTSPRING�INVESTMENTS
� Quantity/�� � Acquisition�� � %�net�Description� Nominal�� Currency�� cost�� Evaluation�� assets�
Statement of Investments as at December 31, 2014(expressed�in�USD)
GLOBAL�MARKET�NAVIGATOR�FUND�
Transferable securities admitted to an official stock exchange listing or dealt in on another regulated market
MUTUAL FUNDS
Germany iShares�STOXX�Europe�600�Oil�&�Gas�UCITS�-�ETF�(DE)�� 6,000� EUR� 222,078� 210,724� 1.89
Ireland iShares�Core�MSCI�Russia�ADR/GDR�UCITS�-�ETF�� 3,631� GBP� 321,699� 228,834� 2.06iShares�Core�S&P�500�UCITS�-�ETF�� 11,386� GBP� 1,737,418� 2,163,793� 19.45iShares�$�Corporate�Bond�UCITS�-�ETF�� 12,400� USD� 1,415,110� 1,414,901� 12.72iShares�$�High�Yield�Corporate�Bond�UCITS�-�ETF�� 3,679� USD� 406,839� 395,364� 3.55iShares�FTSE�100�UCITS�-�ETF�� 40,776� GBP� 358,698� 413,694� 3.72iShares�Gold�Producers�UCITS�-�ETF�� 28,170� GBP� 268,049� 205,965� 1.85iShares�MSCI�Eastern�Europe�Capped�UCITS�-�ETF�� 9,654� GBP� 266,737� 177,214� 1.59iShares�MSCI�Korea�UCITS�-�ETF�� 5,726� GBP� 229,346� 203,023� 1.82iShares�MSCI�Taiwan�UCITS�-�ETF�� 6,177� GBP� 229,011� 231,968� 2.08
� � � 5,232,907� 5,434,756� 48.84
Luxembourg db�x-trackers�-�ATX�UCITS�(DR)�-�ETF�� 5,201� EUR� 252,268� 201,585� 1.81db�x-trackers�-�MSCI�JAPAN�TRN�INDEX�ETF�-�1C�-�ETF�� 13,826� GBP� 554,090� 619,917� 5.57
� � � 806,358� 821,502� 7.38
Switzerland iShares�Core�MSCI�Pac�Ex�Japan�UCITS�-�ETF�� 922� USD� 111,178� 110,465� 0.99
United Kingdom iShares�Euro�Stoxx�50�UCITS�-�ETF�� 26,963� GBP� 949,701� 1,040,461� 9.35iShares�MSCI�AC�Far�East�ex-Japan�UCITS�-�ETF�� 7,850� GBP� 385,398� 366,509� 3.29SPDR�S&P�500�UCITS�-�ETF�� 5,002� USD� 959,468� 1,043,617� 9.38
� � � 2,294,567� 2,450,587� 22.02
Total Mutual Funds 8,667,088 9,028,034 81.12
BONDS
United States of America United�States�Treasury�Note�1.625%�15/11/2022�� 577,700� USD� 574,887� 559,209� 5.02United�States�Treasury�Strip�Principal�0%�15/11/2042�� 804,400� USD� 292,490� 362,294� 3.26
� � � 867,377� 921,503� 8.28
Vietnam Vietnam�Government�Bond�10.8%�15/4/2017�� 4,700,000,000� VND� 232,934� 246,474� 2.21
Total Bonds 1,100,311 1,167,977 10.49
Total Investments 9,767,399 10,196,011 91.61
Other�Net�Assets� � � � 933,282� 8.39
Total Net Assets 11,129,293 100.00
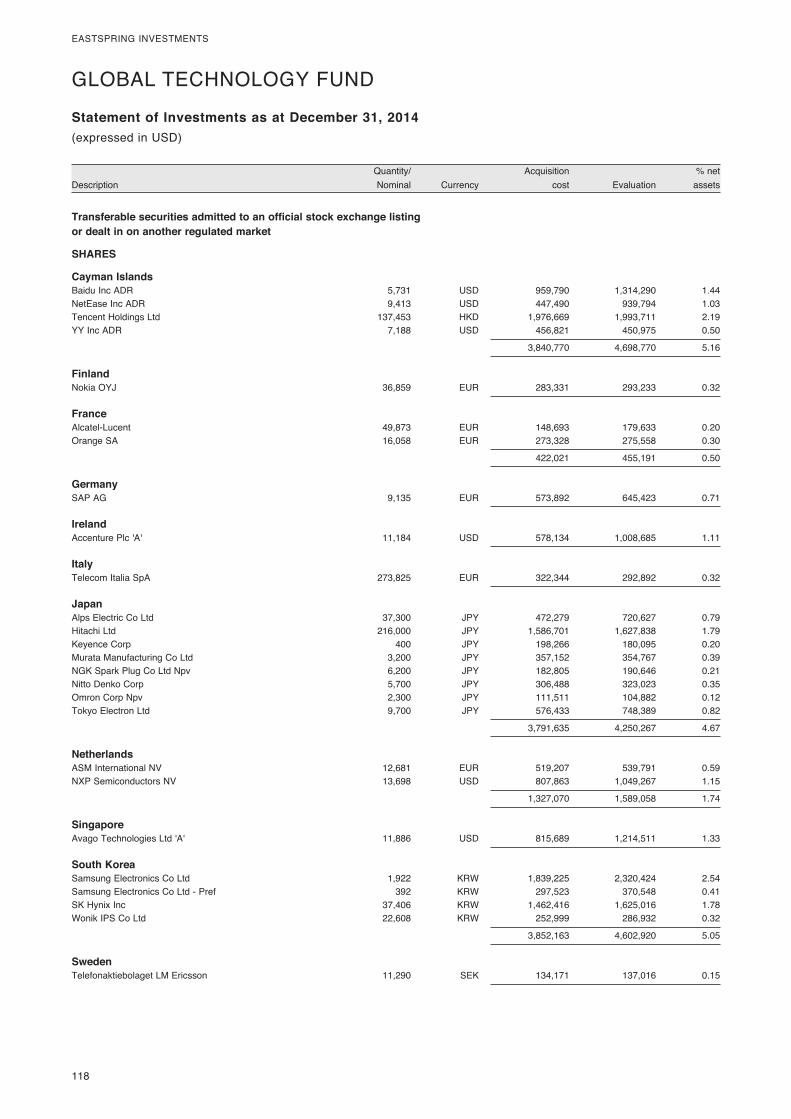
118�
EASTSPRING�INVESTMENTS
� Quantity/�� � Acquisition�� � %�net�Description� Nominal�� Currency�� cost�� Evaluation�� assets�
Statement of Investments as at December 31, 2014(expressed�in�USD)
GLOBAL�TECHNOLOGY�FUND�
Transferable securities admitted to an official stock exchange listing or dealt in on another regulated market
SHARES
Cayman Islands Baidu�Inc�ADR� 5,731� USD� 959,790� 1,314,290� 1.44NetEase�Inc�ADR� 9,413� USD� 447,490� 939,794� 1.03Tencent�Holdings�Ltd� 137,453� HKD� 1,976,669� 1,993,711� 2.19YY�Inc�ADR�� 7,188� USD� 456,821� 450,975� 0.50
� � � 3,840,770� 4,698,770� 5.16
Finland Nokia�OYJ�� 36,859� EUR� 283,331� 293,233� 0.32
France Alcatel-Lucent� 49,873� EUR� 148,693� 179,633� 0.20Orange�SA�� 16,058� EUR� 273,328� 275,558� 0.30
� � � 422,021� 455,191� 0.50
Germany SAP�AG�� 9,135� EUR� 573,892� 645,423� 0.71
Ireland Accenture�Plc�'A'�� 11,184� USD� 578,134� 1,008,685� 1.11
Italy Telecom�Italia�SpA�� 273,825� EUR� 322,344� 292,892� 0.32
Japan Alps�Electric�Co�Ltd� 37,300� JPY� 472,279� 720,627� 0.79Hitachi�Ltd� 216,000� JPY� 1,586,701� 1,627,838� 1.79Keyence�Corp� 400� JPY� 198,266� 180,095� 0.20Murata�Manufacturing�Co�Ltd� 3,200� JPY� 357,152� 354,767� 0.39NGK�Spark�Plug�Co�Ltd�Npv� 6,200� JPY� 182,805� 190,646� 0.21Nitto�Denko�Corp� 5,700� JPY� 306,488� 323,023� 0.35Omron�Corp�Npv� 2,300� JPY� 111,511� 104,882� 0.12Tokyo�Electron�Ltd�� 9,700� JPY� 576,433� 748,389� 0.82
� � � 3,791,635� 4,250,267� 4.67
Netherlands ASM�International�NV� 12,681� EUR� 519,207� 539,791� 0.59NXP�Semiconductors�NV�� 13,698� USD� 807,863� 1,049,267� 1.15
� � � 1,327,070� 1,589,058� 1.74
Singapore Avago�Technologies�Ltd�'A'�� 11,886� USD� 815,689� 1,214,511� 1.33
South Korea Samsung�Electronics�Co�Ltd� 1,922� KRW� 1,839,225� 2,320,424� 2.54Samsung�Electronics�Co�Ltd�-�Pref� 392� KRW� 297,523� 370,548� 0.41SK�Hynix�Inc� 37,406� KRW� 1,462,416� 1,625,016� 1.78Wonik�IPS�Co�Ltd�� 22,608� KRW� 252,999� 286,932� 0.32
� � � 3,852,163� 4,602,920� 5.05
Sweden Telefonaktiebolaget�LM�Ericsson�� 11,290� SEK� 134,171� 137,016� 0.15
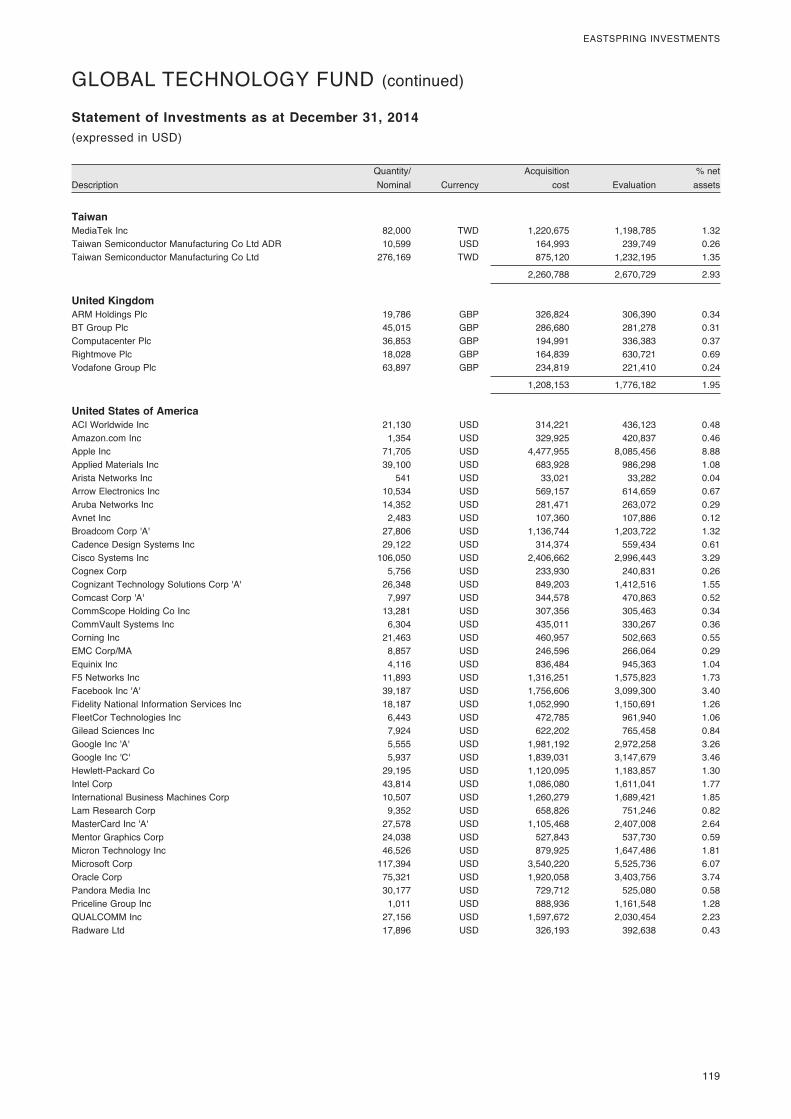
� 119
EASTSPRING�INVESTMENTS
� Quantity/�� � Acquisition�� � %�net�Description� Nominal�� Currency�� cost�� Evaluation�� assets�
Statement of Investments as at December 31, 2014(expressed�in�USD)
GLOBAL�TECHNOLOGY�FUND�(continued)
Taiwan MediaTek�Inc� 82,000� TWD� 1,220,675� 1,198,785� 1.32Taiwan�Semiconductor�Manufacturing�Co�Ltd�ADR� 10,599� USD� 164,993� 239,749� 0.26Taiwan�Semiconductor�Manufacturing�Co�Ltd�� 276,169� TWD� 875,120� 1,232,195� 1.35
� � � 2,260,788� 2,670,729� 2.93
United Kingdom ARM�Holdings�Plc� 19,786� GBP� 326,824� 306,390� 0.34BT�Group�Plc� 45,015� GBP� 286,680� 281,278� 0.31Computacenter�Plc� 36,853� GBP� 194,991� 336,383� 0.37Rightmove�Plc� 18,028� GBP� 164,839� 630,721� 0.69Vodafone�Group�Plc�� 63,897� GBP� 234,819� 221,410� 0.24
� � � 1,208,153� 1,776,182� 1.95
United States of America ACI�Worldwide�Inc� 21,130� USD� 314,221� 436,123� 0.48Amazon.com�Inc� 1,354� USD� 329,925� 420,837� 0.46Apple�Inc� 71,705� USD� 4,477,955� 8,085,456� 8.88Applied�Materials�Inc� 39,100� USD� 683,928� 986,298� 1.08Arista�Networks�Inc� 541� USD� 33,021� 33,282� 0.04Arrow�Electronics�Inc� 10,534� USD� 569,157� 614,659� 0.67Aruba�Networks�Inc� 14,352� USD� 281,471� 263,072� 0.29Avnet�Inc� 2,483� USD� 107,360� 107,886� 0.12Broadcom�Corp�'A'� 27,806� USD� 1,136,744� 1,203,722� 1.32Cadence�Design�Systems�Inc� 29,122� USD� 314,374� 559,434� 0.61Cisco�Systems�Inc� 106,050� USD� 2,406,662� 2,996,443� 3.29Cognex�Corp� 5,756� USD� 233,930� 240,831� 0.26Cognizant�Technology�Solutions�Corp�'A'� 26,348� USD� 849,203� 1,412,516� 1.55Comcast�Corp�'A'� 7,997� USD� 344,578� 470,863� 0.52CommScope�Holding�Co�Inc� 13,281� USD� 307,356� 305,463� 0.34CommVault�Systems�Inc� 6,304� USD� 435,011� 330,267� 0.36Corning�Inc� 21,463� USD� 460,957� 502,663� 0.55EMC�Corp/MA� 8,857� USD� 246,596� 266,064� 0.29Equinix�Inc� 4,116� USD� 836,484� 945,363� 1.04F5�Networks�Inc� 11,893� USD� 1,316,251� 1,575,823� 1.73Facebook�Inc�'A'� 39,187� USD� 1,756,606� 3,099,300� 3.40Fidelity�National�Information�Services�Inc� 18,187� USD� 1,052,990� 1,150,691� 1.26FleetCor�Technologies�Inc� 6,443� USD� 472,785� 961,940� 1.06Gilead�Sciences�Inc� 7,924� USD� 622,202� 765,458� 0.84Google�Inc�'A'� 5,555� USD� 1,981,192� 2,972,258� 3.26Google�Inc�'C'� 5,937� USD� 1,839,031� 3,147,679� 3.46Hewlett-Packard�Co� 29,195� USD� 1,120,095� 1,183,857� 1.30Intel�Corp� 43,814� USD� 1,086,080� 1,611,041� 1.77International�Business�Machines�Corp� 10,507� USD� 1,260,279� 1,689,421� 1.85Lam�Research�Corp� 9,352� USD� 658,826� 751,246� 0.82MasterCard�Inc�'A'� 27,578� USD� 1,105,468� 2,407,008� 2.64Mentor�Graphics�Corp� 24,038� USD� 527,843� 537,730� 0.59Micron�Technology�Inc� 46,526� USD� 879,925� 1,647,486� 1.81Microsoft�Corp� 117,394� USD� 3,540,220� 5,525,736� 6.07Oracle�Corp� 75,321� USD� 1,920,058� 3,403,756� 3.74Pandora�Media�Inc� 30,177� USD� 729,712� 525,080� 0.58Priceline�Group�Inc� 1,011� USD� 888,936� 1,161,548� 1.28QUALCOMM�Inc� 27,156� USD� 1,597,672� 2,030,454� 2.23Radware�Ltd� 17,896� USD� 326,193� 392,638� 0.43
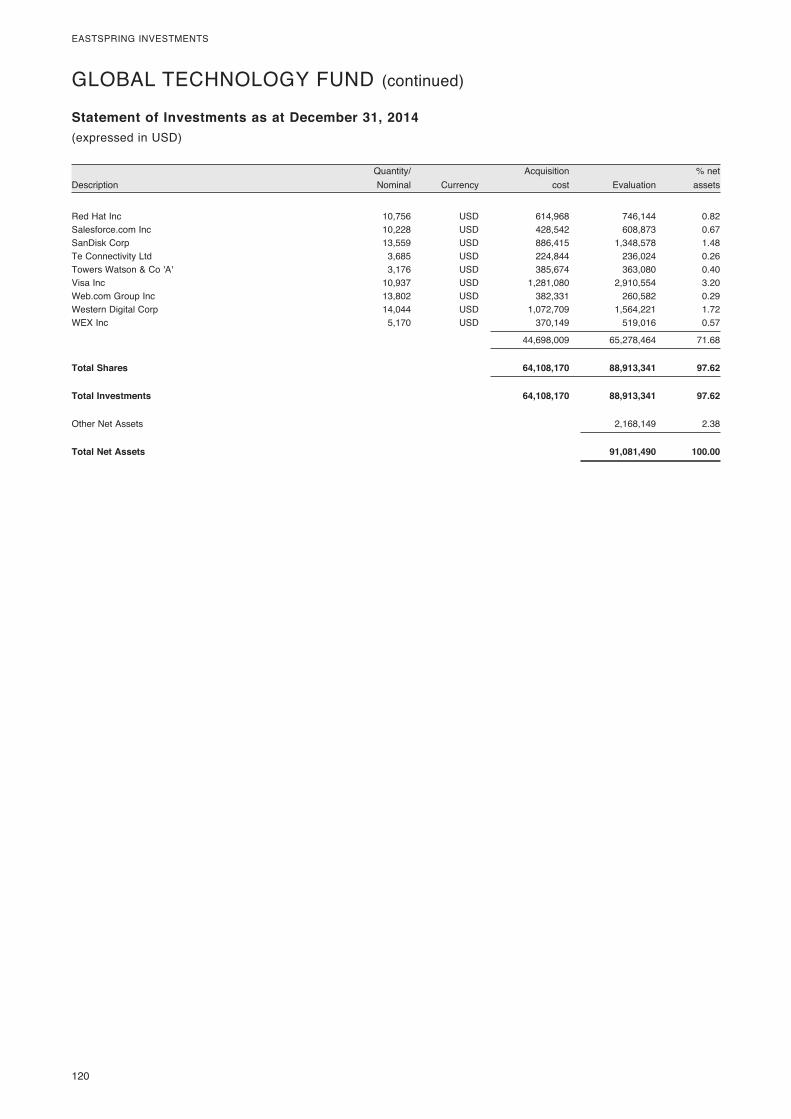
120�
EASTSPRING�INVESTMENTS
� Quantity/�� � Acquisition�� � %�net�Description� Nominal�� Currency�� cost�� Evaluation�� assets�
Statement of Investments as at December 31, 2014(expressed�in�USD)
Red�Hat�Inc� 10,756� USD� 614,968� 746,144� 0.82Salesforce.com�Inc� 10,228� USD� 428,542� 608,873� 0.67SanDisk�Corp� 13,559� USD� 886,415� 1,348,578� 1.48Te�Connectivity�Ltd� 3,685� USD� 224,844� 236,024� 0.26Towers�Watson�&�Co�'A'� 3,176� USD� 385,674� 363,080� 0.40Visa�Inc� 10,937� USD� 1,281,080� 2,910,554� 3.20Web.com�Group�Inc� 13,802� USD� 382,331� 260,582� 0.29Western�Digital�Corp� 14,044� USD� 1,072,709� 1,564,221� 1.72WEX�Inc�� 5,170� USD� 370,149� 519,016� 0.57
� � � 44,698,009� 65,278,464� 71.68
Total Shares 64,108,170 88,913,341 97.62
Total Investments 64,108,170 88,913,341 97.62
Other�Net�Assets� � � � 2,168,149� 2.38
Total Net Assets 91,081,490 100.00
GLOBAL�TECHNOLOGY�FUND�(continued)
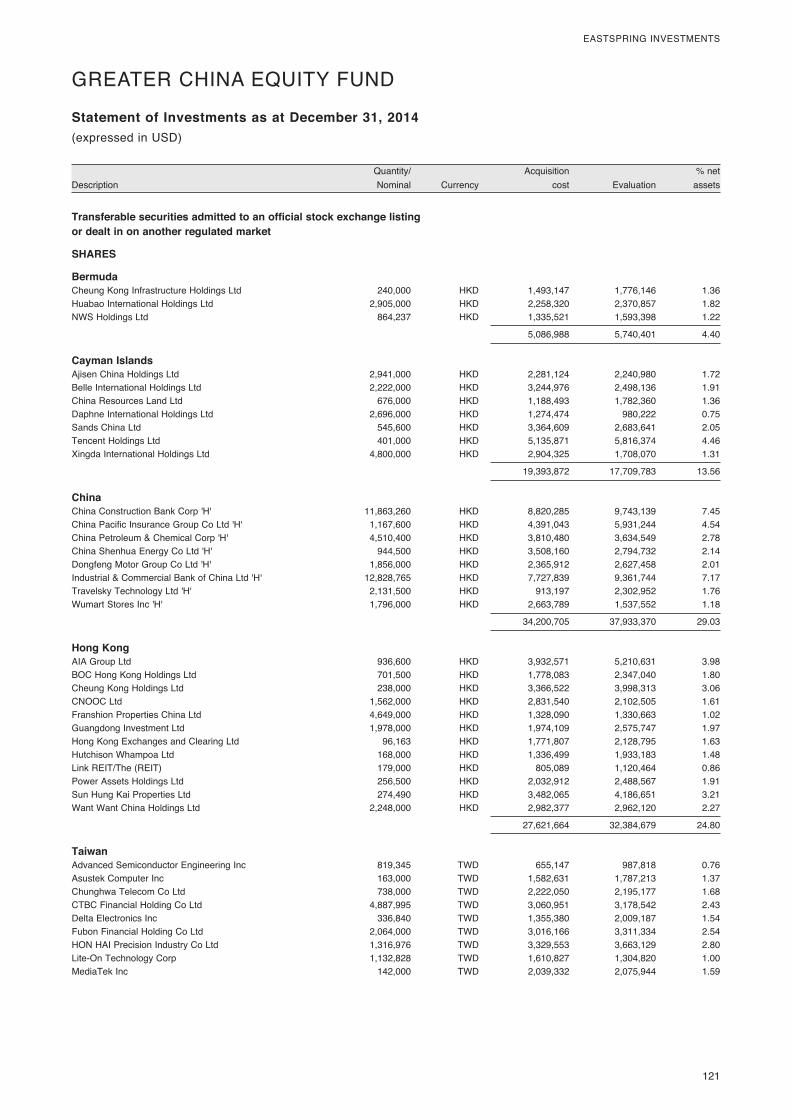
� 121
EASTSPRING�INVESTMENTS
� Quantity/�� � Acquisition�� � %�net�Description� Nominal�� Currency�� cost�� Evaluation�� assets�
Statement of Investments as at December 31, 2014(expressed�in�USD)
GREATER�CHINA�EQUITY�FUND�
Transferable securities admitted to an official stock exchange listing or dealt in on another regulated market
SHARES
Bermuda Cheung�Kong�Infrastructure�Holdings�Ltd� 240,000� HKD� 1,493,147� 1,776,146� 1.36Huabao�International�Holdings�Ltd� 2,905,000� HKD� 2,258,320� 2,370,857� 1.82NWS�Holdings�Ltd�� 864,237� HKD� 1,335,521� 1,593,398� 1.22
� � � 5,086,988� 5,740,401� 4.40
Cayman Islands Ajisen�China�Holdings�Ltd� 2,941,000� HKD� 2,281,124� 2,240,980� 1.72Belle�International�Holdings�Ltd� 2,222,000� HKD� 3,244,976� 2,498,136� 1.91China�Resources�Land�Ltd� 676,000� HKD� 1,188,493� 1,782,360� 1.36Daphne�International�Holdings�Ltd� 2,696,000� HKD� 1,274,474� 980,222� 0.75Sands�China�Ltd� 545,600� HKD� 3,364,609� 2,683,641� 2.05Tencent�Holdings�Ltd� 401,000� HKD� 5,135,871� 5,816,374� 4.46Xingda�International�Holdings�Ltd�� 4,800,000� HKD� 2,904,325� 1,708,070� 1.31
� � � 19,393,872� 17,709,783� 13.56
China China�Construction�Bank�Corp�'H'� 11,863,260� HKD� 8,820,285� 9,743,139� 7.45China�Pacific�Insurance�Group�Co�Ltd�'H'� 1,167,600� HKD� 4,391,043� 5,931,244� 4.54China�Petroleum�&�Chemical�Corp�'H'� 4,510,400� HKD� 3,810,480� 3,634,549� 2.78China�Shenhua�Energy�Co�Ltd�'H'� 944,500� HKD� 3,508,160� 2,794,732� 2.14Dongfeng�Motor�Group�Co�Ltd�'H'� 1,856,000� HKD� 2,365,912� 2,627,458� 2.01Industrial�&�Commercial�Bank�of�China�Ltd�'H'� 12,828,765� HKD� 7,727,839� 9,361,744� 7.17Travelsky�Technology�Ltd�'H'� 2,131,500� HKD� 913,197� 2,302,952� 1.76Wumart�Stores�Inc�'H'�� 1,796,000� HKD� 2,663,789� 1,537,552� 1.18
� � � 34,200,705� 37,933,370� 29.03
Hong Kong AIA�Group�Ltd� 936,600� HKD� 3,932,571� 5,210,631� 3.98BOC�Hong�Kong�Holdings�Ltd� 701,500� HKD� 1,778,083� 2,347,040� 1.80Cheung�Kong�Holdings�Ltd� 238,000� HKD� 3,366,522� 3,998,313� 3.06CNOOC�Ltd� 1,562,000� HKD� 2,831,540� 2,102,505� 1.61Franshion�Properties�China�Ltd� 4,649,000� HKD� 1,328,090� 1,330,663� 1.02Guangdong�Investment�Ltd� 1,978,000� HKD� 1,974,109� 2,575,747� 1.97Hong�Kong�Exchanges�and�Clearing�Ltd� 96,163� HKD� 1,771,807� 2,128,795� 1.63Hutchison�Whampoa�Ltd� 168,000� HKD� 1,336,499� 1,933,183� 1.48Link�REIT/The�(REIT)� 179,000� HKD� 805,089� 1,120,464� 0.86Power�Assets�Holdings�Ltd� 256,500� HKD� 2,032,912� 2,488,567� 1.91Sun�Hung�Kai�Properties�Ltd� 274,490� HKD� 3,482,065� 4,186,651� 3.21Want�Want�China�Holdings�Ltd�� 2,248,000� HKD� 2,982,377� 2,962,120� 2.27
� � � 27,621,664� 32,384,679� 24.80
Taiwan Advanced�Semiconductor�Engineering�Inc� 819,345� TWD� 655,147� 987,818� 0.76Asustek�Computer�Inc� 163,000� TWD� 1,582,631� 1,787,213� 1.37Chunghwa�Telecom�Co�Ltd� 738,000� TWD� 2,222,050� 2,195,177� 1.68CTBC�Financial�Holding�Co�Ltd� 4,887,995� TWD� 3,060,951� 3,178,542� 2.43Delta�Electronics�Inc� 336,840� TWD� 1,355,380� 2,009,187� 1.54Fubon�Financial�Holding�Co�Ltd� 2,064,000� TWD� 3,016,166� 3,311,334� 2.54HON�HAI�Precision�Industry�Co�Ltd� 1,316,976� TWD� 3,329,553� 3,663,129� 2.80Lite-On�Technology�Corp� 1,132,828� TWD� 1,610,827� 1,304,820� 1.00MediaTek�Inc� 142,000� TWD� 2,039,332� 2,075,944� 1.59
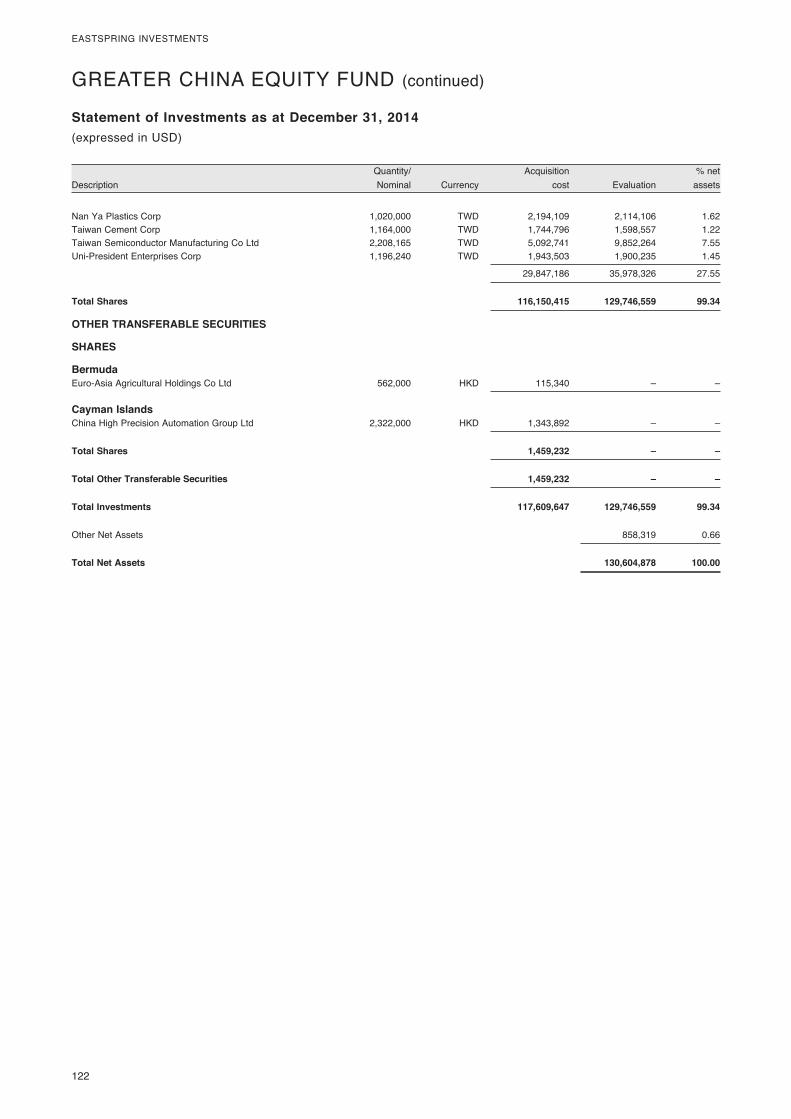
122�
EASTSPRING�INVESTMENTS
� Quantity/�� � Acquisition�� � %�net�Description� Nominal�� Currency�� cost�� Evaluation�� assets�
Statement of Investments as at December 31, 2014(expressed�in�USD)
GREATER�CHINA�EQUITY�FUND�(continued)
Nan�Ya�Plastics�Corp� 1,020,000� TWD� 2,194,109� 2,114,106� 1.62Taiwan�Cement�Corp� 1,164,000� TWD� 1,744,796� 1,598,557� 1.22Taiwan�Semiconductor�Manufacturing�Co�Ltd� 2,208,165� TWD� 5,092,741� 9,852,264� 7.55Uni-President�Enterprises�Corp�� 1,196,240� TWD� 1,943,503� 1,900,235� 1.45
� � � 29,847,186� 35,978,326� 27.55
Total Shares 116,150,415 129,746,559 99.34
OTHER TRANSFERABLE SECURITIES
SHARES
Bermuda Euro-Asia�Agricultural�Holdings�Co�Ltd�� 562,000� HKD� 115,340� –� –
Cayman Islands China�High�Precision�Automation�Group�Ltd�� 2,322,000� HKD� 1,343,892� –� –
Total Shares 1,459,232 – –
Total Other Transferable Securities 1,459,232 – –
Total Investments 117,609,647 129,746,559 99.34
Other�Net�Assets� � � � 858,319� 0.66
Total Net Assets 130,604,878 100.00
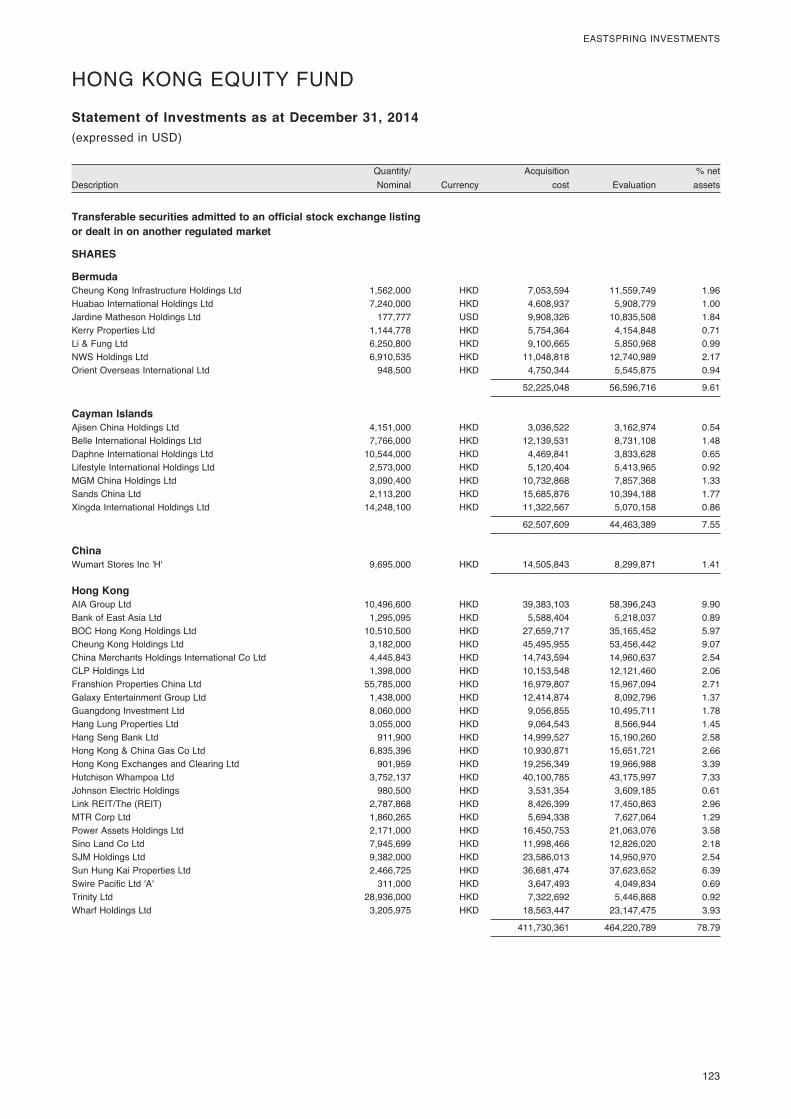
� 123
EASTSPRING�INVESTMENTS
� Quantity/�� � Acquisition�� � %�net�Description� Nominal�� Currency�� cost�� Evaluation�� assets�
Statement of Investments as at December 31, 2014(expressed�in�USD)
HONG�KONG�EQUITY�FUND
Transferable securities admitted to an official stock exchange listing or dealt in on another regulated market
SHARES
Bermuda Cheung�Kong�Infrastructure�Holdings�Ltd� 1,562,000� HKD� 7,053,594� 11,559,749� 1.96Huabao�International�Holdings�Ltd� 7,240,000� HKD� 4,608,937� 5,908,779� 1.00Jardine�Matheson�Holdings�Ltd� 177,777� USD� 9,908,326� 10,835,508� 1.84Kerry�Properties�Ltd� 1,144,778� HKD� 5,754,364� 4,154,848� 0.71Li�&�Fung�Ltd� 6,250,800� HKD� 9,100,665� 5,850,968� 0.99NWS�Holdings�Ltd� 6,910,535� HKD� 11,048,818� 12,740,989� 2.17Orient�Overseas�International�Ltd�� 948,500� HKD� 4,750,344� 5,545,875� 0.94
� � � 52,225,048� 56,596,716� 9.61
Cayman Islands Ajisen�China�Holdings�Ltd� 4,151,000� HKD� 3,036,522� 3,162,974� 0.54Belle�International�Holdings�Ltd� 7,766,000� HKD� 12,139,531� 8,731,108� 1.48Daphne�International�Holdings�Ltd� 10,544,000� HKD� 4,469,841� 3,833,628� 0.65Lifestyle�International�Holdings�Ltd� 2,573,000� HKD� 5,120,404� 5,413,965� 0.92MGM�China�Holdings�Ltd� 3,090,400� HKD� 10,732,868� 7,857,368� 1.33Sands�China�Ltd� 2,113,200� HKD� 15,685,876� 10,394,188� 1.77Xingda�International�Holdings�Ltd�� 14,248,100� HKD� 11,322,567� 5,070,158� 0.86
� � � 62,507,609� 44,463,389� 7.55
China Wumart�Stores�Inc�'H'�� 9,695,000� HKD� 14,505,843� 8,299,871� 1.41
Hong Kong AIA�Group�Ltd� 10,496,600� HKD� 39,383,103� 58,396,243� 9.90Bank�of�East�Asia�Ltd� 1,295,095� HKD� 5,588,404� 5,218,037� 0.89BOC�Hong�Kong�Holdings�Ltd� 10,510,500� HKD� 27,659,717� 35,165,452� 5.97Cheung�Kong�Holdings�Ltd� 3,182,000� HKD� 45,495,955� 53,456,442� 9.07China�Merchants�Holdings�International�Co�Ltd� 4,445,843� HKD� 14,743,594� 14,960,637� 2.54CLP�Holdings�Ltd� 1,398,000� HKD� 10,153,548� 12,121,460� 2.06Franshion�Properties�China�Ltd� 55,785,000� HKD� 16,979,807� 15,967,094� 2.71Galaxy�Entertainment�Group�Ltd� 1,438,000� HKD� 12,414,874� 8,092,796� 1.37Guangdong�Investment�Ltd� 8,060,000� HKD� 9,056,855� 10,495,711� 1.78Hang�Lung�Properties�Ltd� 3,055,000� HKD� 9,064,543� 8,566,944� 1.45Hang�Seng�Bank�Ltd� 911,900� HKD� 14,999,527� 15,190,260� 2.58Hong�Kong�&�China�Gas�Co�Ltd� 6,835,396� HKD� 10,930,871� 15,651,721� 2.66Hong�Kong�Exchanges�and�Clearing�Ltd� 901,959� HKD� 19,256,349� 19,966,988� 3.39Hutchison�Whampoa�Ltd� 3,752,137� HKD� 40,100,785� 43,175,997� 7.33Johnson�Electric�Holdings� 980,500� HKD� 3,531,354� 3,609,185� 0.61Link�REIT/The�(REIT)� 2,787,868� HKD� 8,426,399� 17,450,863� 2.96MTR�Corp�Ltd� 1,860,265� HKD� 5,694,338� 7,627,064� 1.29Power�Assets�Holdings�Ltd� 2,171,000� HKD� 16,450,753� 21,063,076� 3.58Sino�Land�Co�Ltd� 7,945,699� HKD� 11,998,466� 12,826,020� 2.18SJM�Holdings�Ltd� 9,382,000� HKD� 23,586,013� 14,950,970� 2.54Sun�Hung�Kai�Properties�Ltd� 2,466,725� HKD� 36,681,474� 37,623,652� 6.39Swire�Pacific�Ltd�'A'� 311,000� HKD� 3,647,493� 4,049,834� 0.69Trinity�Ltd� 28,936,000� HKD� 7,322,692� 5,446,868� 0.92Wharf�Holdings�Ltd�� 3,205,975� HKD� 18,563,447� 23,147,475� 3.93
� � � 411,730,361� 464,220,789� 78.79
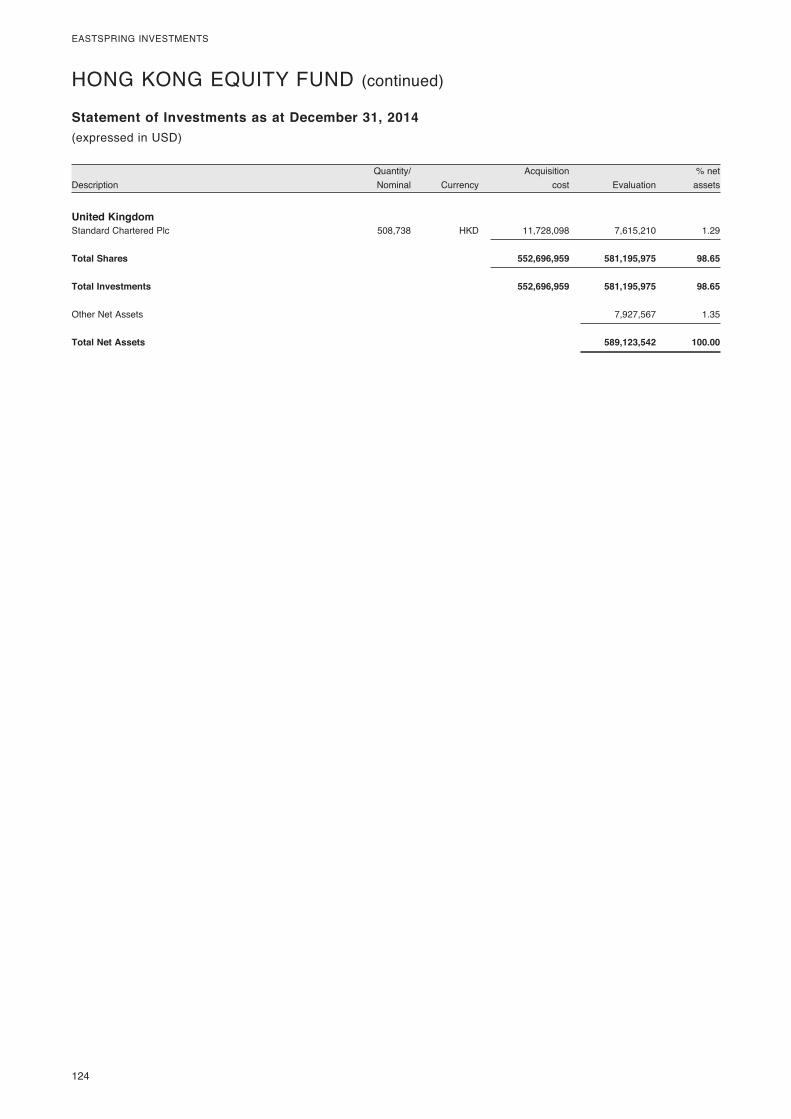
124�
EASTSPRING�INVESTMENTS
� Quantity/�� � Acquisition�� � %�net�Description� Nominal�� Currency�� cost�� Evaluation�� assets�
Statement of Investments as at December 31, 2014(expressed�in�USD)
United Kingdom Standard�Chartered�Plc�� 508,738� HKD� 11,728,098� 7,615,210� 1.29
Total Shares 552,696,959 581,195,975 98.65
Total Investments 552,696,959 581,195,975 98.65
Other�Net�Assets� � � � 7,927,567� 1.35
Total Net Assets 589,123,542 100.00
HONG�KONG�EQUITY�FUND�(continued)
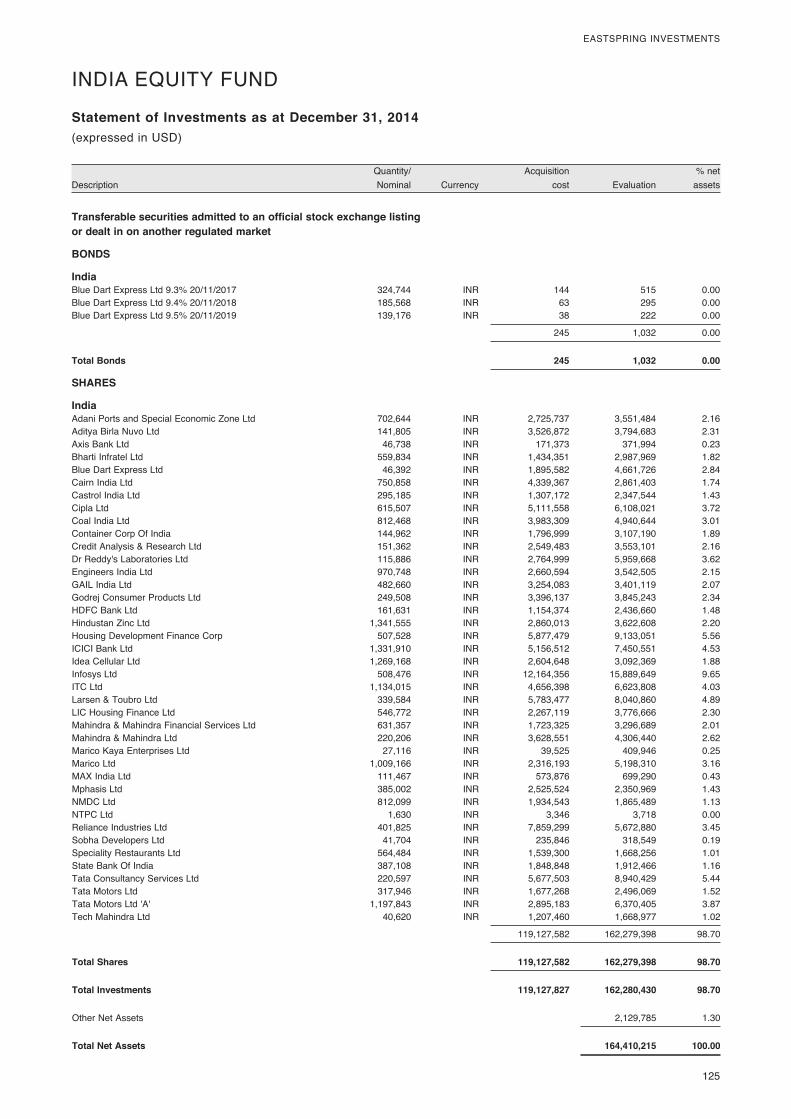
� 125
EASTSPRING�INVESTMENTS
� Quantity/�� � Acquisition�� � %�net�Description� Nominal�� Currency�� cost�� Evaluation�� assets�
Statement of Investments as at December 31, 2014(expressed�in�USD)
INDIA�EQUITY�FUND�
Transferable securities admitted to an official stock exchange listing or dealt in on another regulated market
BONDS
India Blue�Dart�Express�Ltd�9.3%�20/11/2017�� 324,744� INR� 144� 515� 0.00Blue�Dart�Express�Ltd�9.4%�20/11/2018�� 185,568� INR� 63� 295� 0.00Blue�Dart�Express�Ltd�9.5%�20/11/2019�� 139,176� INR� 38� 222� 0.00
� � � 245� 1,032� 0.00
Total Bonds 245 1,032 0.00
SHARES
India Adani�Ports�and�Special�Economic�Zone�Ltd� 702,644� INR� 2,725,737� 3,551,484� 2.16Aditya�Birla�Nuvo�Ltd� 141,805� INR� 3,526,872� 3,794,683� 2.31Axis�Bank�Ltd� 46,738� INR� 171,373� 371,994� 0.23Bharti�Infratel�Ltd� 559,834� INR� 1,434,351� 2,987,969� 1.82Blue�Dart�Express�Ltd� 46,392� INR� 1,895,582� 4,661,726� 2.84Cairn�India�Ltd� 750,858� INR� 4,339,367� 2,861,403� 1.74Castrol�India�Ltd� 295,185� INR� 1,307,172� 2,347,544� 1.43Cipla�Ltd� 615,507� INR� 5,111,558� 6,108,021� 3.72Coal�India�Ltd� 812,468� INR� 3,983,309� 4,940,644� 3.01Container�Corp�Of�India� 144,962� INR� 1,796,999� 3,107,190� 1.89Credit�Analysis�&�Research�Ltd� 151,362� INR� 2,549,483� 3,553,101� 2.16Dr�Reddy's�Laboratories�Ltd� 115,886� INR� 2,764,999� 5,959,668� 3.62Engineers�India�Ltd� 970,748� INR� 2,660,594� 3,542,505� 2.15GAIL�India�Ltd� 482,660� INR� 3,254,083� 3,401,119� 2.07Godrej�Consumer�Products�Ltd� 249,508� INR� 3,396,137� 3,845,243� 2.34HDFC�Bank�Ltd� 161,631� INR� 1,154,374� 2,436,660� 1.48Hindustan�Zinc�Ltd� 1,341,555� INR� 2,860,013� 3,622,608� 2.20Housing�Development�Finance�Corp� 507,528� INR� 5,877,479� 9,133,051� 5.56ICICI�Bank�Ltd� 1,331,910� INR� 5,156,512� 7,450,551� 4.53Idea�Cellular�Ltd� 1,269,168� INR� 2,604,648� 3,092,369� 1.88Infosys�Ltd� 508,476� INR� 12,164,356� 15,889,649� 9.65ITC�Ltd� 1,134,015� INR� 4,656,398� 6,623,808� 4.03Larsen�&�Toubro�Ltd� 339,584� INR� 5,783,477� 8,040,860� 4.89LIC�Housing�Finance�Ltd� 546,772� INR� 2,267,119� 3,776,666� 2.30Mahindra�&�Mahindra�Financial�Services�Ltd� 631,357� INR� 1,723,325� 3,296,689� 2.01Mahindra�&�Mahindra�Ltd� 220,206� INR� 3,628,551� 4,306,440� 2.62Marico�Kaya�Enterprises�Ltd� 27,116� INR� 39,525� 409,946� 0.25Marico�Ltd� 1,009,166� INR� 2,316,193� 5,198,310� 3.16MAX�India�Ltd� 111,467� INR� 573,876� 699,290� 0.43Mphasis�Ltd� 385,002� INR� 2,525,524� 2,350,969� 1.43NMDC�Ltd� 812,099� INR� 1,934,543� 1,865,489� 1.13NTPC�Ltd� 1,630� INR� 3,346� 3,718� 0.00Reliance�Industries�Ltd� 401,825� INR� 7,859,299� 5,672,880� 3.45Sobha�Developers�Ltd� 41,704� INR� 235,846� 318,549� 0.19Speciality�Restaurants�Ltd� 564,484� INR� 1,539,300� 1,668,256� 1.01State�Bank�Of�India� 387,108� INR� 1,848,848� 1,912,466� 1.16Tata�Consultancy�Services�Ltd� 220,597� INR� 5,677,503� 8,940,429� 5.44Tata�Motors�Ltd� 317,946� INR� 1,677,268� 2,496,069� 1.52Tata�Motors�Ltd�'A'� 1,197,843� INR� 2,895,183� 6,370,405� 3.87Tech�Mahindra�Ltd�� 40,620� INR� 1,207,460� 1,668,977� 1.02
� � � 119,127,582� 162,279,398� 98.70
Total Shares 119,127,582 162,279,398 98.70
Total Investments 119,127,827 162,280,430 98.70
Other�Net�Assets� � � � 2,129,785� 1.30
Total Net Assets 164,410,215 100.00
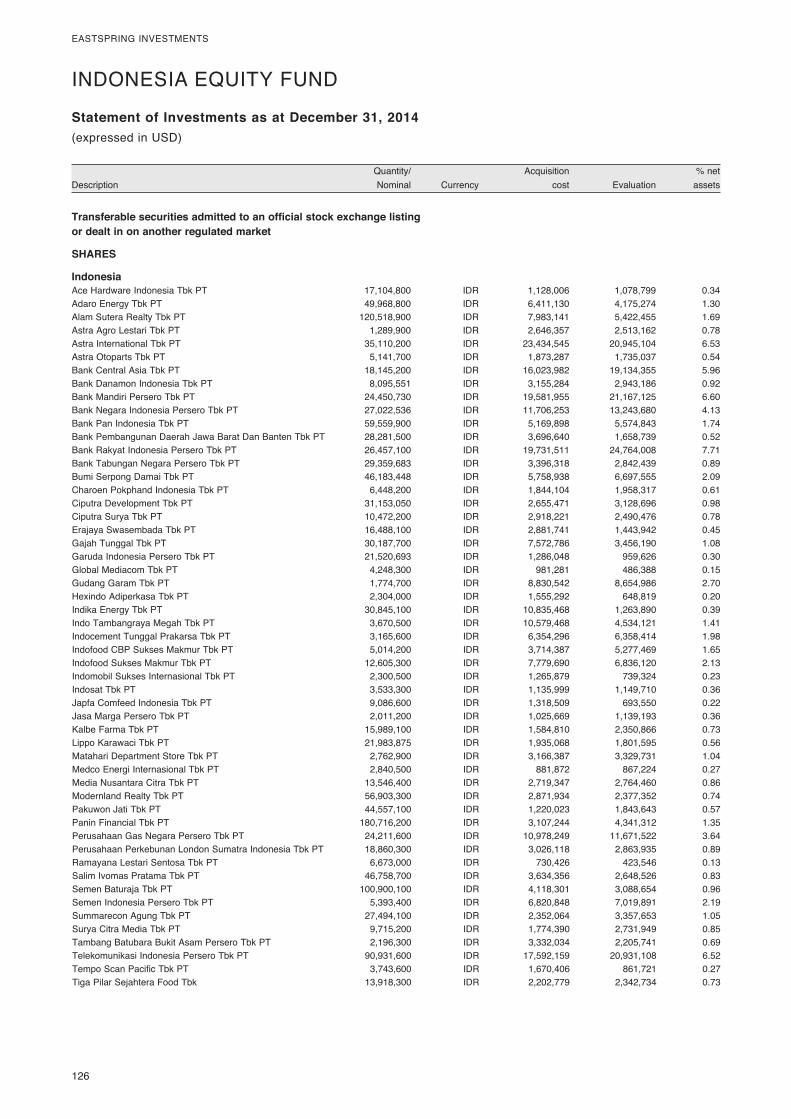
126�
EASTSPRING�INVESTMENTS
� Quantity/�� � Acquisition�� � %�net�Description� Nominal�� Currency�� cost�� Evaluation�� assets�
Statement of Investments as at December 31, 2014(expressed�in�USD)
INDONESIA�EQUITY�FUND�
Transferable securities admitted to an official stock exchange listing or dealt in on another regulated market
SHARES
Indonesia Ace�Hardware�Indonesia�Tbk�PT� 17,104,800� IDR� 1,128,006� 1,078,799� 0.34Adaro�Energy�Tbk�PT� 49,968,800� IDR� 6,411,130� 4,175,274� 1.30Alam�Sutera�Realty�Tbk�PT� 120,518,900� IDR� 7,983,141� 5,422,455� 1.69Astra�Agro�Lestari�Tbk�PT� 1,289,900� IDR� 2,646,357� 2,513,162� 0.78Astra�International�Tbk�PT� 35,110,200� IDR� 23,434,545� 20,945,104� 6.53Astra�Otoparts�Tbk�PT� 5,141,700� IDR� 1,873,287� 1,735,037� 0.54Bank�Central�Asia�Tbk�PT� 18,145,200� IDR� 16,023,982� 19,134,355� 5.96Bank�Danamon�Indonesia�Tbk�PT� 8,095,551� IDR� 3,155,284� 2,943,186� 0.92Bank�Mandiri�Persero�Tbk�PT� 24,450,730� IDR� 19,581,955� 21,167,125� 6.60Bank�Negara�Indonesia�Persero�Tbk�PT� 27,022,536� IDR� 11,706,253� 13,243,680� 4.13Bank�Pan�Indonesia�Tbk�PT� 59,559,900� IDR� 5,169,898� 5,574,843� 1.74Bank�Pembangunan�Daerah�Jawa�Barat�Dan�Banten�Tbk�PT� 28,281,500� IDR� 3,696,640� 1,658,739� 0.52Bank�Rakyat�Indonesia�Persero�Tbk�PT� 26,457,100� IDR� 19,731,511� 24,764,008� 7.71Bank�Tabungan�Negara�Persero�Tbk�PT� 29,359,683� IDR� 3,396,318� 2,842,439� 0.89Bumi�Serpong�Damai�Tbk�PT� 46,183,448� IDR� 5,758,938� 6,697,555� 2.09Charoen�Pokphand�Indonesia�Tbk�PT� 6,448,200� IDR� 1,844,104� 1,958,317� 0.61Ciputra�Development�Tbk�PT� 31,153,050� IDR� 2,655,471� 3,128,696� 0.98Ciputra�Surya�Tbk�PT� 10,472,200� IDR� 2,918,221� 2,490,476� 0.78Erajaya�Swasembada�Tbk�PT� 16,488,100� IDR� 2,881,741� 1,443,942� 0.45Gajah�Tunggal�Tbk�PT� 30,187,700� IDR� 7,572,786� 3,456,190� 1.08Garuda�Indonesia�Persero�Tbk�PT� 21,520,693� IDR� 1,286,048� 959,626� 0.30Global�Mediacom�Tbk�PT� 4,248,300� IDR� 981,281� 486,388� 0.15Gudang�Garam�Tbk�PT� 1,774,700� IDR� 8,830,542� 8,654,986� 2.70Hexindo�Adiperkasa�Tbk�PT� 2,304,000� IDR� 1,555,292� 648,819� 0.20Indika�Energy�Tbk�PT� 30,845,100� IDR� 10,835,468� 1,263,890� 0.39Indo�Tambangraya�Megah�Tbk�PT� 3,670,500� IDR� 10,579,468� 4,534,121� 1.41Indocement�Tunggal�Prakarsa�Tbk�PT� 3,165,600� IDR� 6,354,296� 6,358,414� 1.98Indofood�CBP�Sukses�Makmur�Tbk�PT� 5,014,200� IDR� 3,714,387� 5,277,469� 1.65Indofood�Sukses�Makmur�Tbk�PT� 12,605,300� IDR� 7,779,690� 6,836,120� 2.13Indomobil�Sukses�Internasional�Tbk�PT� 2,300,500� IDR� 1,265,879� 739,324� 0.23Indosat�Tbk�PT� 3,533,300� IDR� 1,135,999� 1,149,710� 0.36Japfa�Comfeed�Indonesia�Tbk�PT� 9,086,600� IDR� 1,318,509� 693,550� 0.22Jasa�Marga�Persero�Tbk�PT� 2,011,200� IDR� 1,025,669� 1,139,193� 0.36Kalbe�Farma�Tbk�PT� 15,989,100� IDR� 1,584,810� 2,350,866� 0.73Lippo�Karawaci�Tbk�PT� 21,983,875� IDR� 1,935,068� 1,801,595� 0.56Matahari�Department�Store�Tbk�PT� 2,762,900� IDR� 3,166,387� 3,329,731� 1.04Medco�Energi�Internasional�Tbk�PT� 2,840,500� IDR� 881,872� 867,224� 0.27Media�Nusantara�Citra�Tbk�PT� 13,546,400� IDR� 2,719,347� 2,764,460� 0.86Modernland�Realty�Tbk�PT� 56,903,300� IDR� 2,871,934� 2,377,352� 0.74Pakuwon�Jati�Tbk�PT� 44,557,100� IDR� 1,220,023� 1,843,643� 0.57Panin�Financial�Tbk�PT� 180,716,200� IDR� 3,107,244� 4,341,312� 1.35Perusahaan�Gas�Negara�Persero�Tbk�PT� 24,211,600� IDR� 10,978,249� 11,671,522� 3.64Perusahaan�Perkebunan�London�Sumatra�Indonesia�Tbk�PT� 18,860,300� IDR� 3,026,118� 2,863,935� 0.89Ramayana�Lestari�Sentosa�Tbk�PT� 6,673,000� IDR� 730,426� 423,546� 0.13Salim�Ivomas�Pratama�Tbk�PT� 46,758,700� IDR� 3,634,356� 2,648,526� 0.83Semen�Baturaja�Tbk�PT� 100,900,100� IDR� 4,118,301� 3,088,654� 0.96Semen�Indonesia�Persero�Tbk�PT� 5,393,400� IDR� 6,820,848� 7,019,891� 2.19Summarecon�Agung�Tbk�PT� 27,494,100� IDR� 2,352,064� 3,357,653� 1.05Surya�Citra�Media�Tbk�PT� 9,715,200� IDR� 1,774,390� 2,731,949� 0.85Tambang�Batubara�Bukit�Asam�Persero�Tbk�PT� 2,196,300� IDR� 3,332,034� 2,205,741� 0.69Telekomunikasi�Indonesia�Persero�Tbk�PT� 90,931,600� IDR� 17,592,159� 20,931,108� 6.52Tempo�Scan�Pacific�Tbk�PT� 3,743,600� IDR� 1,670,406� 861,721� 0.27Tiga�Pilar�Sejahtera�Food�Tbk� 13,918,300� IDR� 2,202,779� 2,342,734� 0.73
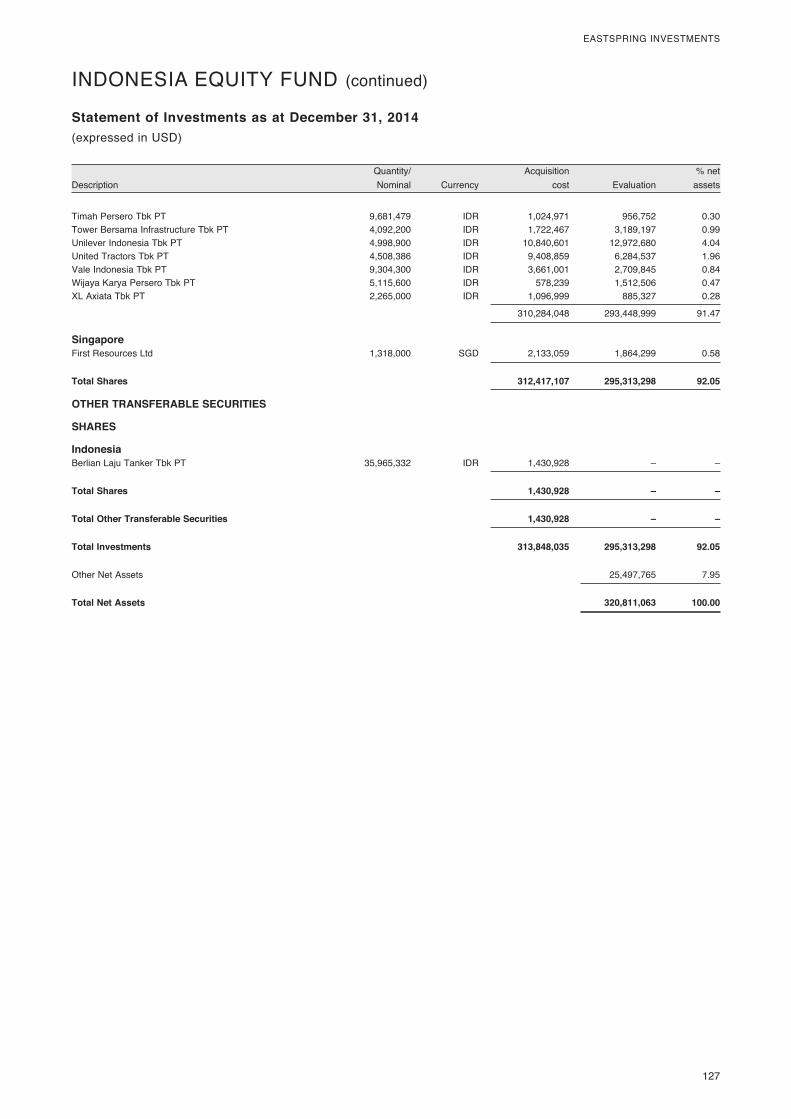
� 127
EASTSPRING�INVESTMENTS
� Quantity/�� � Acquisition�� � %�net�Description� Nominal�� Currency�� cost�� Evaluation�� assets�
Statement of Investments as at December 31, 2014(expressed�in�USD)
INDONESIA�EQUITY�FUND�(continued)
Timah�Persero�Tbk�PT� 9,681,479� IDR� 1,024,971� 956,752� 0.30Tower�Bersama�Infrastructure�Tbk�PT� 4,092,200� IDR� 1,722,467� 3,189,197� 0.99Unilever�Indonesia�Tbk�PT� 4,998,900� IDR� 10,840,601� 12,972,680� 4.04United�Tractors�Tbk�PT� 4,508,386� IDR� 9,408,859� 6,284,537� 1.96Vale�Indonesia�Tbk�PT� 9,304,300� IDR� 3,661,001� 2,709,845� 0.84Wijaya�Karya�Persero�Tbk�PT� 5,115,600� IDR� 578,239� 1,512,506� 0.47XL�Axiata�Tbk�PT�� 2,265,000� IDR� 1,096,999� 885,327� 0.28
� � � 310,284,048� 293,448,999� 91.47
Singapore First�Resources�Ltd�� 1,318,000� SGD� 2,133,059� 1,864,299� 0.58
Total Shares 312,417,107 295,313,298 92.05
OTHER TRANSFERABLE SECURITIES
SHARES
Indonesia Berlian�Laju�Tanker�Tbk�PT�� 35,965,332� IDR� 1,430,928� –� –
Total Shares 1,430,928 – –
Total Other Transferable Securities 1,430,928 – –
Total Investments 313,848,035 295,313,298 92.05
Other�Net�Assets� � � � 25,497,765� 7.95
Total Net Assets 320,811,063 100.00
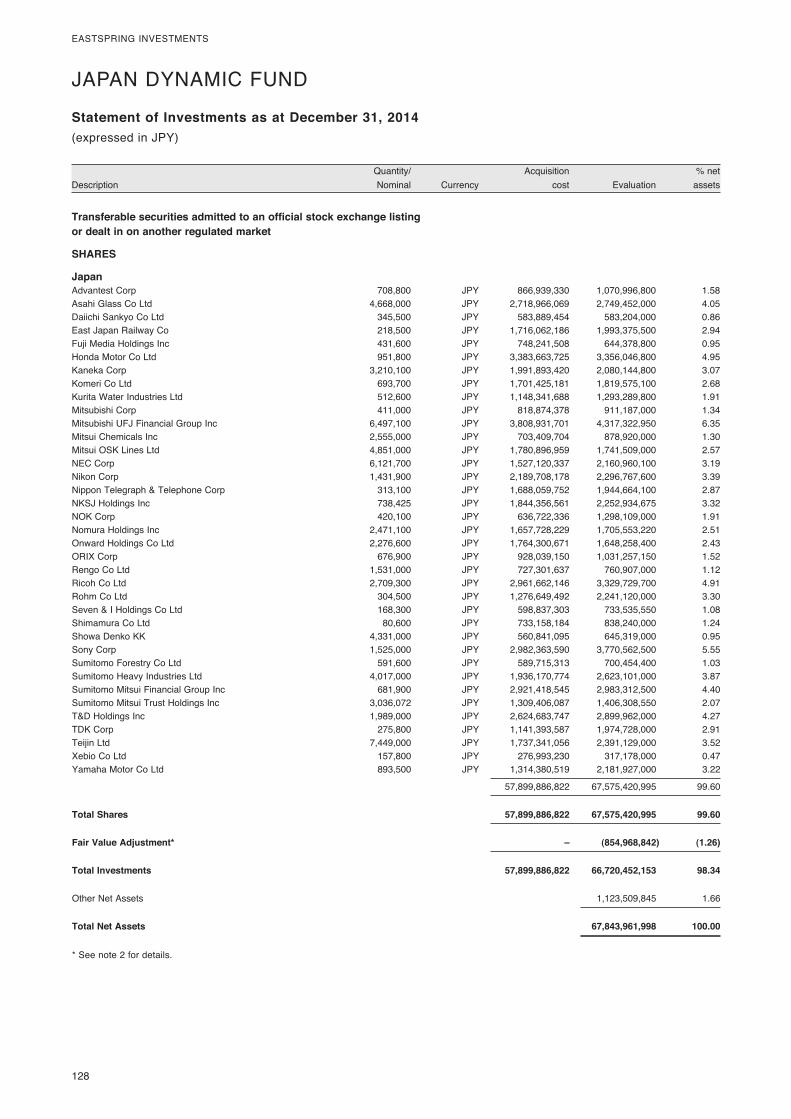
128�
EASTSPRING�INVESTMENTS
� Quantity/�� � Acquisition�� � %�net�Description� Nominal�� Currency�� cost�� Evaluation�� assets�
Statement of Investments as at December 31, 2014(expressed�in�USD)(expressed�in�JPY)
JAPAN�DYNAMIC�FUND�
Transferable securities admitted to an official stock exchange listing or dealt in on another regulated market
SHARES
Japan Advantest�Corp� 708,800� JPY� 866,939,330� 1,070,996,800� 1.58Asahi�Glass�Co�Ltd� 4,668,000� JPY� 2,718,966,069� 2,749,452,000� 4.05Daiichi�Sankyo�Co�Ltd� 345,500� JPY� 583,889,454� 583,204,000� 0.86East�Japan�Railway�Co� 218,500� JPY� 1,716,062,186� 1,993,375,500� 2.94Fuji�Media�Holdings�Inc� 431,600� JPY� 748,241,508� 644,378,800� 0.95Honda�Motor�Co�Ltd� 951,800� JPY� 3,383,663,725� 3,356,046,800� 4.95Kaneka�Corp� 3,210,100� JPY� 1,991,893,420� 2,080,144,800� 3.07Komeri�Co�Ltd� 693,700� JPY� 1,701,425,181� 1,819,575,100� 2.68Kurita�Water�Industries�Ltd� 512,600� JPY� 1,148,341,688� 1,293,289,800� 1.91Mitsubishi�Corp� 411,000� JPY� 818,874,378� 911,187,000� 1.34Mitsubishi�UFJ�Financial�Group�Inc� 6,497,100� JPY� 3,808,931,701� 4,317,322,950� 6.35Mitsui�Chemicals�Inc� 2,555,000� JPY� 703,409,704� 878,920,000� 1.30Mitsui�OSK�Lines�Ltd� 4,851,000� JPY� 1,780,896,959� 1,741,509,000� 2.57NEC�Corp� 6,121,700� JPY� 1,527,120,337� 2,160,960,100� 3.19Nikon�Corp� 1,431,900� JPY� 2,189,708,178� 2,296,767,600� 3.39Nippon�Telegraph�&�Telephone�Corp� 313,100� JPY� 1,688,059,752� 1,944,664,100� 2.87NKSJ�Holdings�Inc� 738,425� JPY� 1,844,356,561� 2,252,934,675� 3.32NOK�Corp� 420,100� JPY� 636,722,336� 1,298,109,000� 1.91Nomura�Holdings�Inc� 2,471,100� JPY� 1,657,728,229� 1,705,553,220� 2.51Onward�Holdings�Co�Ltd� 2,276,600� JPY� 1,764,300,671� 1,648,258,400� 2.43ORIX�Corp� 676,900� JPY� 928,039,150� 1,031,257,150� 1.52Rengo�Co�Ltd� 1,531,000� JPY� 727,301,637� 760,907,000� 1.12Ricoh�Co�Ltd� 2,709,300� JPY� 2,961,662,146� 3,329,729,700� 4.91Rohm�Co�Ltd� 304,500� JPY� 1,276,649,492� 2,241,120,000� 3.30Seven�&�I�Holdings�Co�Ltd� 168,300� JPY� 598,837,303� 733,535,550� 1.08Shimamura�Co�Ltd� 80,600� JPY� 733,158,184� 838,240,000� 1.24Showa�Denko�KK� 4,331,000� JPY� 560,841,095� 645,319,000� 0.95Sony�Corp� 1,525,000� JPY� 2,982,363,590� 3,770,562,500� 5.55Sumitomo�Forestry�Co�Ltd� 591,600� JPY� 589,715,313� 700,454,400� 1.03Sumitomo�Heavy�Industries�Ltd� 4,017,000� JPY� 1,936,170,774� 2,623,101,000� 3.87Sumitomo�Mitsui�Financial�Group�Inc� 681,900� JPY� 2,921,418,545� 2,983,312,500� 4.40Sumitomo�Mitsui�Trust�Holdings�Inc� 3,036,072� JPY� 1,309,406,087� 1,406,308,550� 2.07T&D�Holdings�Inc� 1,989,000� JPY� 2,624,683,747� 2,899,962,000� 4.27TDK�Corp� 275,800� JPY� 1,141,393,587� 1,974,728,000� 2.91Teijin�Ltd� 7,449,000� JPY� 1,737,341,056� 2,391,129,000� 3.52Xebio�Co�Ltd� 157,800� JPY� 276,993,230� 317,178,000� 0.47Yamaha�Motor�Co�Ltd�� 893,500� JPY� 1,314,380,519� 2,181,927,000� 3.22
� � � 57,899,886,822� 67,575,420,995� 99.60
Total Shares 57,899,886,822 67,575,420,995 99.60
Fair Value Adjustment* – (854,968,842) (1.26)
Total Investments 57,899,886,822 66,720,452,153 98.34
Other�Net�Assets� � � � 1,123,509,845� 1.66
Total Net Assets 67,843,961,998 100.00
*�See�note�2�for�details.
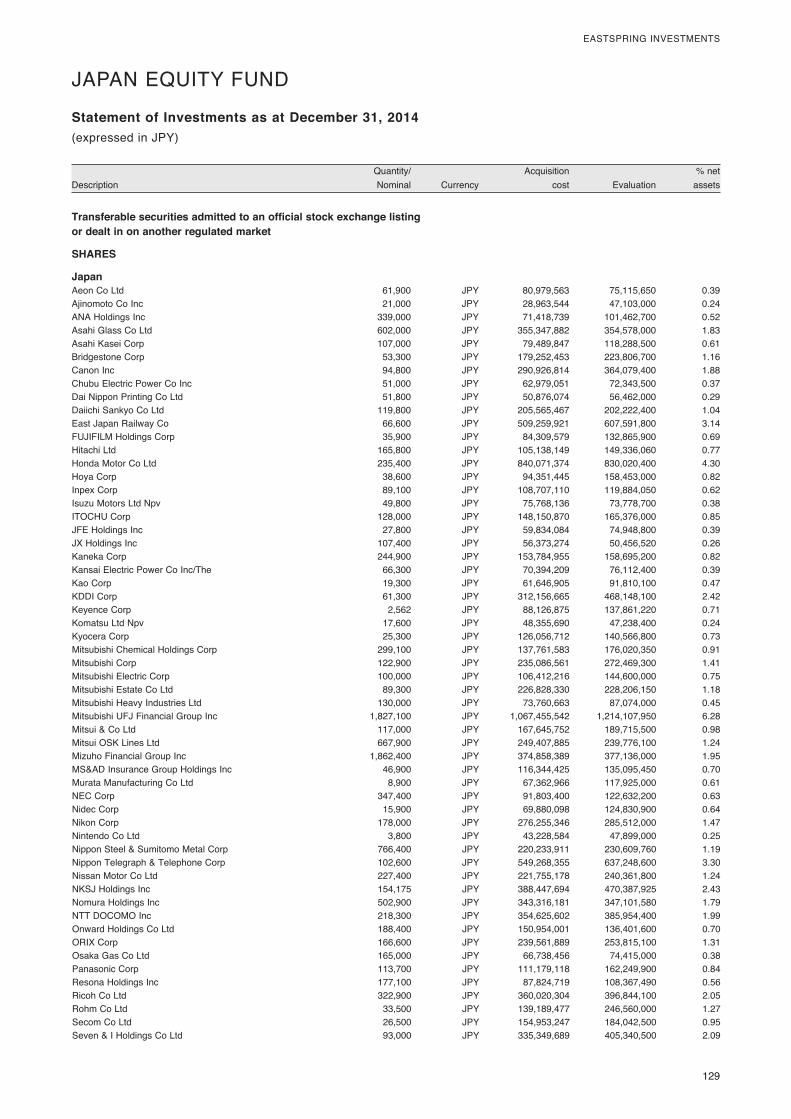
� 129
EASTSPRING�INVESTMENTS
� Quantity/�� � Acquisition�� � %�net�Description� Nominal�� Currency�� cost�� Evaluation�� assets�
Statement of Investments as at December 31, 2014(expressed�in�USD)
JAPAN�EQUITY�FUND�
Transferable securities admitted to an official stock exchange listing or dealt in on another regulated market
SHARES
Japan Aeon�Co�Ltd� 61,900� JPY� 80,979,563� 75,115,650� 0.39Ajinomoto�Co�Inc� 21,000� JPY� 28,963,544� 47,103,000� 0.24ANA�Holdings�Inc� 339,000� JPY� 71,418,739� 101,462,700� 0.52Asahi�Glass�Co�Ltd� 602,000� JPY� 355,347,882� 354,578,000� 1.83Asahi�Kasei�Corp� 107,000� JPY� 79,489,847� 118,288,500� 0.61Bridgestone�Corp� 53,300� JPY� 179,252,453� 223,806,700� 1.16Canon�Inc� 94,800� JPY� 290,926,814� 364,079,400� 1.88Chubu�Electric�Power�Co�Inc� 51,000� JPY� 62,979,051� 72,343,500� 0.37Dai�Nippon�Printing�Co�Ltd� 51,800� JPY� 50,876,074� 56,462,000� 0.29Daiichi�Sankyo�Co�Ltd� 119,800� JPY� 205,565,467� 202,222,400� 1.04East�Japan�Railway�Co� 66,600� JPY� 509,259,921� 607,591,800� 3.14FUJIFILM�Holdings�Corp� 35,900� JPY� 84,309,579� 132,865,900� 0.69Hitachi�Ltd� 165,800� JPY� 105,138,149� 149,336,060� 0.77Honda�Motor�Co�Ltd� 235,400� JPY� 840,071,374� 830,020,400� 4.30Hoya�Corp� 38,600� JPY� 94,351,445� 158,453,000� 0.82Inpex�Corp� 89,100� JPY� 108,707,110� 119,884,050� 0.62Isuzu�Motors�Ltd�Npv� 49,800� JPY� 75,768,136� 73,778,700� 0.38ITOCHU�Corp� 128,000� JPY� 148,150,870� 165,376,000� 0.85JFE�Holdings�Inc� 27,800� JPY� 59,834,084� 74,948,800� 0.39JX�Holdings�Inc� 107,400� JPY� 56,373,274� 50,456,520� 0.26Kaneka�Corp� 244,900� JPY� 153,784,955� 158,695,200� 0.82Kansai�Electric�Power�Co�Inc/The� 66,300� JPY� 70,394,209� 76,112,400� 0.39Kao�Corp� 19,300� JPY� 61,646,905� 91,810,100� 0.47KDDI�Corp� 61,300� JPY� 312,156,665� 468,148,100� 2.42Keyence�Corp� 2,562� JPY� 88,126,875� 137,861,220� 0.71Komatsu�Ltd�Npv� 17,600� JPY� 48,355,690� 47,238,400� 0.24Kyocera�Corp� 25,300� JPY� 126,056,712� 140,566,800� 0.73Mitsubishi�Chemical�Holdings�Corp� 299,100� JPY� 137,761,583� 176,020,350� 0.91Mitsubishi�Corp� 122,900� JPY� 235,086,561� 272,469,300� 1.41Mitsubishi�Electric�Corp� 100,000� JPY� 106,412,216� 144,600,000� 0.75Mitsubishi�Estate�Co�Ltd� 89,300� JPY� 226,828,330� 228,206,150� 1.18Mitsubishi�Heavy�Industries�Ltd� 130,000� JPY� 73,760,663� 87,074,000� 0.45Mitsubishi�UFJ�Financial�Group�Inc� 1,827,100� JPY� 1,067,455,542� 1,214,107,950� 6.28Mitsui�&�Co�Ltd� 117,000� JPY� 167,645,752� 189,715,500� 0.98Mitsui�OSK�Lines�Ltd� 667,900� JPY� 249,407,885� 239,776,100� 1.24Mizuho�Financial�Group�Inc� 1,862,400� JPY� 374,858,389� 377,136,000� 1.95MS&AD�Insurance�Group�Holdings�Inc� 46,900� JPY� 116,344,425� 135,095,450� 0.70Murata�Manufacturing�Co�Ltd� 8,900� JPY� 67,362,966� 117,925,000� 0.61NEC�Corp� 347,400� JPY� 91,803,400� 122,632,200� 0.63Nidec�Corp� 15,900� JPY� 69,880,098� 124,830,900� 0.64Nikon�Corp� 178,000� JPY� 276,255,346� 285,512,000� 1.47Nintendo�Co�Ltd� 3,800� JPY� 43,228,584� 47,899,000� 0.25Nippon�Steel�&�Sumitomo�Metal�Corp� 766,400� JPY� 220,233,911� 230,609,760� 1.19Nippon�Telegraph�&�Telephone�Corp� 102,600� JPY� 549,268,355� 637,248,600� 3.30Nissan�Motor�Co�Ltd� 227,400� JPY� 221,755,178� 240,361,800� 1.24NKSJ�Holdings�Inc� 154,175� JPY� 388,447,694� 470,387,925� 2.43Nomura�Holdings�Inc� 502,900� JPY� 343,316,181� 347,101,580� 1.79NTT�DOCOMO�Inc� 218,300� JPY� 354,625,602� 385,954,400� 1.99Onward�Holdings�Co�Ltd� 188,400� JPY� 150,954,001� 136,401,600� 0.70ORIX�Corp� 166,600� JPY� 239,561,889� 253,815,100� 1.31Osaka�Gas�Co�Ltd� 165,000� JPY� 66,738,456� 74,415,000� 0.38Panasonic�Corp� 113,700� JPY� 111,179,118� 162,249,900� 0.84Resona�Holdings�Inc� 177,100� JPY� 87,824,719� 108,367,490� 0.56Ricoh�Co�Ltd� 322,900� JPY� 360,020,304� 396,844,100� 2.05Rohm�Co�Ltd� 33,500� JPY� 139,189,477� 246,560,000� 1.27Secom�Co�Ltd� 26,500� JPY� 154,953,247� 184,042,500� 0.95Seven�&�I�Holdings�Co�Ltd� 93,000� JPY� 335,349,689� 405,340,500� 2.09
(expressed�in�JPY)
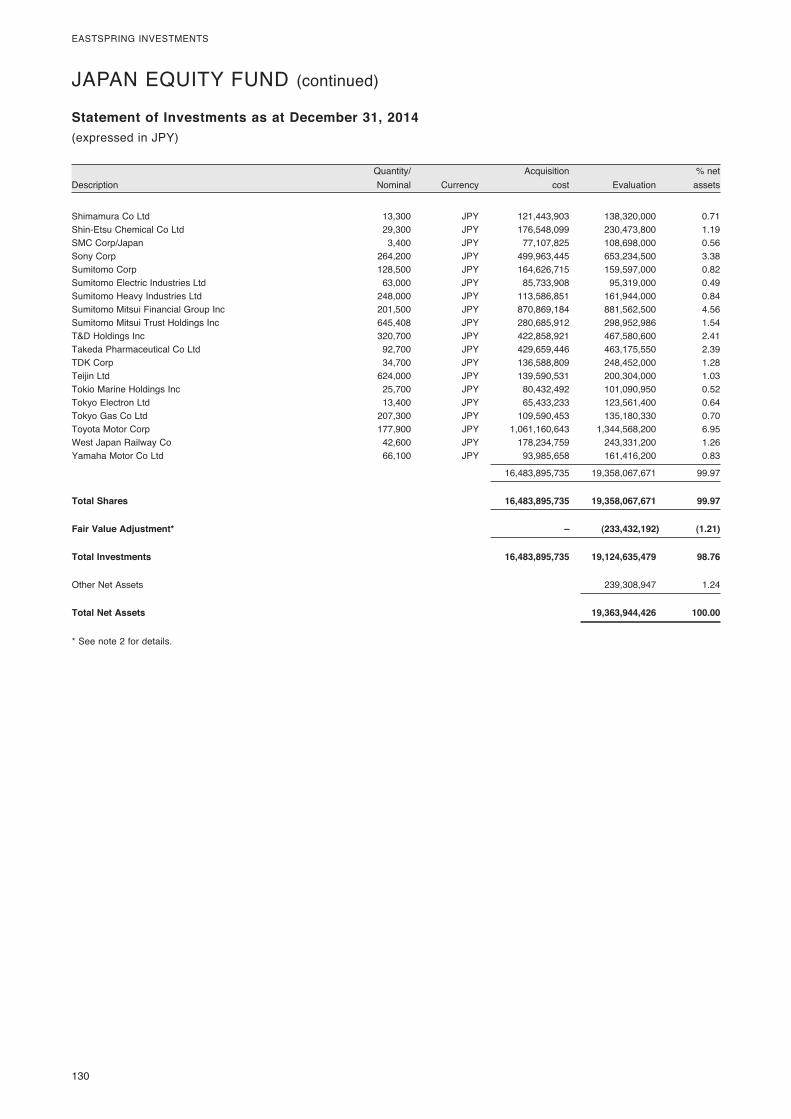
130�
EASTSPRING�INVESTMENTS
� Quantity/�� � Acquisition�� � %�net�Description� Nominal�� Currency�� cost�� Evaluation�� assets�
Statement of Investments as at December 31, 2014(expressed�in�USD)
JAPAN�EQUITY�FUND�(continued)
Shimamura�Co�Ltd� 13,300� JPY� 121,443,903� 138,320,000� 0.71Shin-Etsu�Chemical�Co�Ltd� 29,300� JPY� 176,548,099� 230,473,800� 1.19SMC�Corp/Japan� 3,400� JPY� 77,107,825� 108,698,000� 0.56Sony�Corp� 264,200� JPY� 499,963,445� 653,234,500� 3.38Sumitomo�Corp� 128,500� JPY� 164,626,715� 159,597,000� 0.82Sumitomo�Electric�Industries�Ltd� 63,000� JPY� 85,733,908� 95,319,000� 0.49Sumitomo�Heavy�Industries�Ltd� 248,000� JPY� 113,586,851� 161,944,000� 0.84Sumitomo�Mitsui�Financial�Group�Inc� 201,500� JPY� 870,869,184� 881,562,500� 4.56Sumitomo�Mitsui�Trust�Holdings�Inc� 645,408� JPY� 280,685,912� 298,952,986� 1.54T&D�Holdings�Inc� 320,700� JPY� 422,858,921� 467,580,600� 2.41Takeda�Pharmaceutical�Co�Ltd� 92,700� JPY� 429,659,446� 463,175,550� 2.39TDK�Corp� 34,700� JPY� 136,588,809� 248,452,000� 1.28Teijin�Ltd� 624,000� JPY� 139,590,531� 200,304,000� 1.03Tokio�Marine�Holdings�Inc� 25,700� JPY� 80,432,492� 101,090,950� 0.52Tokyo�Electron�Ltd� 13,400� JPY� 65,433,233� 123,561,400� 0.64Tokyo�Gas�Co�Ltd� 207,300� JPY� 109,590,453� 135,180,330� 0.70Toyota�Motor�Corp� 177,900� JPY� 1,061,160,643� 1,344,568,200� 6.95West�Japan�Railway�Co� 42,600� JPY� 178,234,759� 243,331,200� 1.26Yamaha�Motor�Co�Ltd�� 66,100� JPY� 93,985,658� 161,416,200� 0.83
� � � 16,483,895,735� 19,358,067,671� 99.97
Total Shares 16,483,895,735 19,358,067,671 99.97
Fair Value Adjustment* – (233,432,192) (1.21)
Total Investments 16,483,895,735 19,124,635,479 98.76
Other�Net�Assets� � � � 239,308,947� 1.24
Total Net Assets 19,363,944,426 100.00
*�See�note�2�for�details.
(expressed�in�JPY)
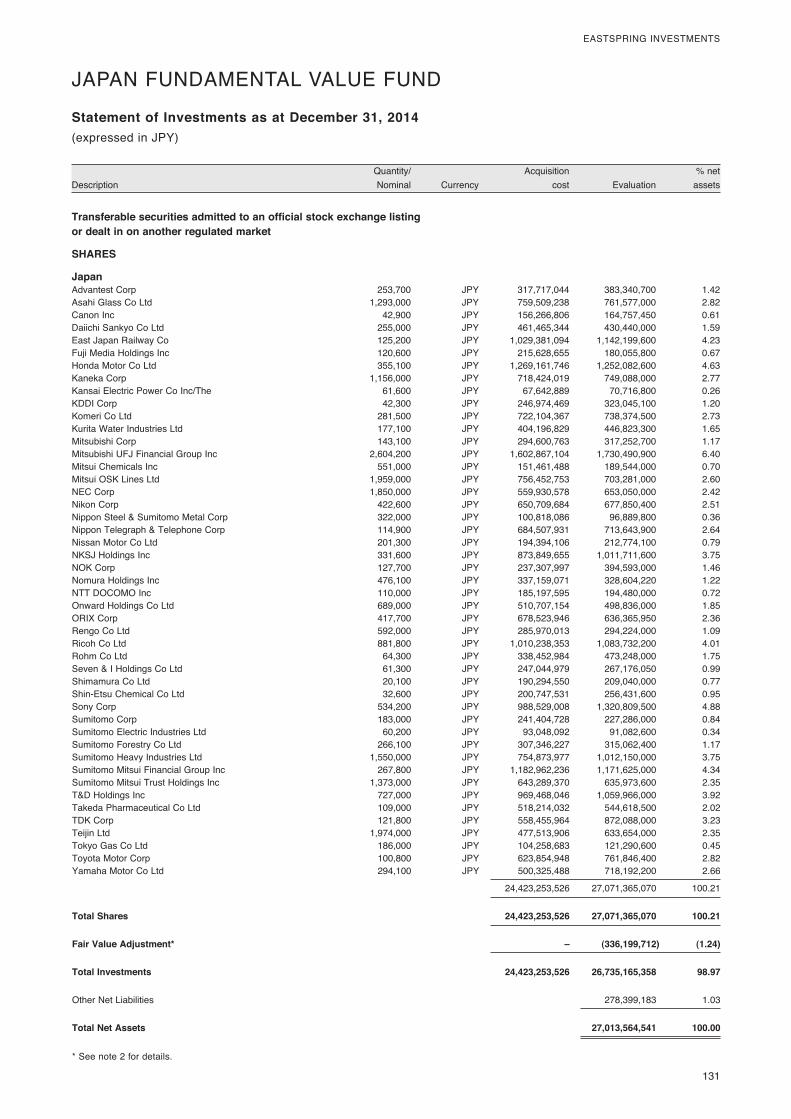
� 131
EASTSPRING�INVESTMENTS
� Quantity/�� � Acquisition�� � %�net�Description� Nominal�� Currency�� cost�� Evaluation�� assets�
Statement of Investments as at December 31, 2014(expressed�in�USD)
Transferable securities admitted to an official stock exchange listing or dealt in on another regulated market
SHARES
Japan Advantest�Corp� 253,700� JPY� 317,717,044� 383,340,700� 1.42Asahi�Glass�Co�Ltd� 1,293,000� JPY� 759,509,238� 761,577,000� 2.82Canon�Inc� 42,900� JPY� 156,266,806� 164,757,450� 0.61Daiichi�Sankyo�Co�Ltd� 255,000� JPY� 461,465,344� 430,440,000� 1.59East�Japan�Railway�Co� 125,200� JPY� 1,029,381,094� 1,142,199,600� 4.23Fuji�Media�Holdings�Inc� 120,600� JPY� 215,628,655� 180,055,800� 0.67Honda�Motor�Co�Ltd� 355,100� JPY� 1,269,161,746� 1,252,082,600� 4.63Kaneka�Corp� 1,156,000� JPY� 718,424,019� 749,088,000� 2.77Kansai�Electric�Power�Co�Inc/The� 61,600� JPY� 67,642,889� 70,716,800� 0.26KDDI�Corp� 42,300� JPY� 246,974,469� 323,045,100� 1.20Komeri�Co�Ltd� 281,500� JPY� 722,104,367� 738,374,500� 2.73Kurita�Water�Industries�Ltd� 177,100� JPY� 404,196,829� 446,823,300� 1.65Mitsubishi�Corp� 143,100� JPY� 294,600,763� 317,252,700� 1.17Mitsubishi�UFJ�Financial�Group�Inc� 2,604,200� JPY� 1,602,867,104� 1,730,490,900� 6.40Mitsui�Chemicals�Inc� 551,000� JPY� 151,461,488� 189,544,000� 0.70Mitsui�OSK�Lines�Ltd� 1,959,000� JPY� 756,452,753� 703,281,000� 2.60NEC�Corp� 1,850,000� JPY� 559,930,578� 653,050,000� 2.42Nikon�Corp� 422,600� JPY� 650,709,684� 677,850,400� 2.51Nippon�Steel�&�Sumitomo�Metal�Corp� 322,000� JPY� 100,818,086� 96,889,800� 0.36Nippon�Telegraph�&�Telephone�Corp� 114,900� JPY� 684,507,931� 713,643,900� 2.64Nissan�Motor�Co�Ltd� 201,300� JPY� 194,394,106� 212,774,100� 0.79NKSJ�Holdings�Inc� 331,600� JPY� 873,849,655� 1,011,711,600� 3.75NOK�Corp� 127,700� JPY� 237,307,997� 394,593,000� 1.46Nomura�Holdings�Inc� 476,100� JPY� 337,159,071� 328,604,220� 1.22NTT�DOCOMO�Inc� 110,000� JPY� 185,197,595� 194,480,000� 0.72Onward�Holdings�Co�Ltd� 689,000� JPY� 510,707,154� 498,836,000� 1.85ORIX�Corp� 417,700� JPY� 678,523,946� 636,365,950� 2.36Rengo�Co�Ltd� 592,000� JPY� 285,970,013� 294,224,000� 1.09Ricoh�Co�Ltd� 881,800� JPY� 1,010,238,353� 1,083,732,200� 4.01Rohm�Co�Ltd� 64,300� JPY� 338,452,984� 473,248,000� 1.75Seven�&�I�Holdings�Co�Ltd� 61,300� JPY� 247,044,979� 267,176,050� 0.99Shimamura�Co�Ltd� 20,100� JPY� 190,294,550� 209,040,000� 0.77Shin-Etsu�Chemical�Co�Ltd� 32,600� JPY� 200,747,531� 256,431,600� 0.95Sony�Corp� 534,200� JPY� 988,529,008� 1,320,809,500� 4.88Sumitomo�Corp� 183,000� JPY� 241,404,728� 227,286,000� 0.84Sumitomo�Electric�Industries�Ltd� 60,200� JPY� 93,048,092� 91,082,600� 0.34Sumitomo�Forestry�Co�Ltd� 266,100� JPY� 307,346,227� 315,062,400� 1.17Sumitomo�Heavy�Industries�Ltd� 1,550,000� JPY� 754,873,977� 1,012,150,000� 3.75Sumitomo�Mitsui�Financial�Group�Inc� 267,800� JPY� 1,182,962,236� 1,171,625,000� 4.34Sumitomo�Mitsui�Trust�Holdings�Inc� 1,373,000� JPY� 643,289,370� 635,973,600� 2.35T&D�Holdings�Inc� 727,000� JPY� 969,468,046� 1,059,966,000� 3.92Takeda�Pharmaceutical�Co�Ltd� 109,000� JPY� 518,214,032� 544,618,500� 2.02TDK�Corp� 121,800� JPY� 558,455,964� 872,088,000� 3.23Teijin�Ltd� 1,974,000� JPY� 477,513,906� 633,654,000� 2.35Tokyo�Gas�Co�Ltd� 186,000� JPY� 104,258,683� 121,290,600� 0.45Toyota�Motor�Corp� 100,800� JPY� 623,854,948� 761,846,400� 2.82Yamaha�Motor�Co�Ltd�� 294,100� JPY� 500,325,488� 718,192,200� 2.66
� � � 24,423,253,526� 27,071,365,070� 100.21
Total Shares 24,423,253,526 27,071,365,070 100.21
Fair Value Adjustment* – (336,199,712) (1.24)
Total Investments 24,423,253,526 26,735,165,358 98.97
Other�Net�Liabilities� � � � 278,399,183� 1.03
Total Net Assets 27,013,564,541 100.00
*�See�note�2�for�details.� � � ��
JAPAN�FUNDAMENTAL�VALUE�FUND
(expressed�in�JPY)
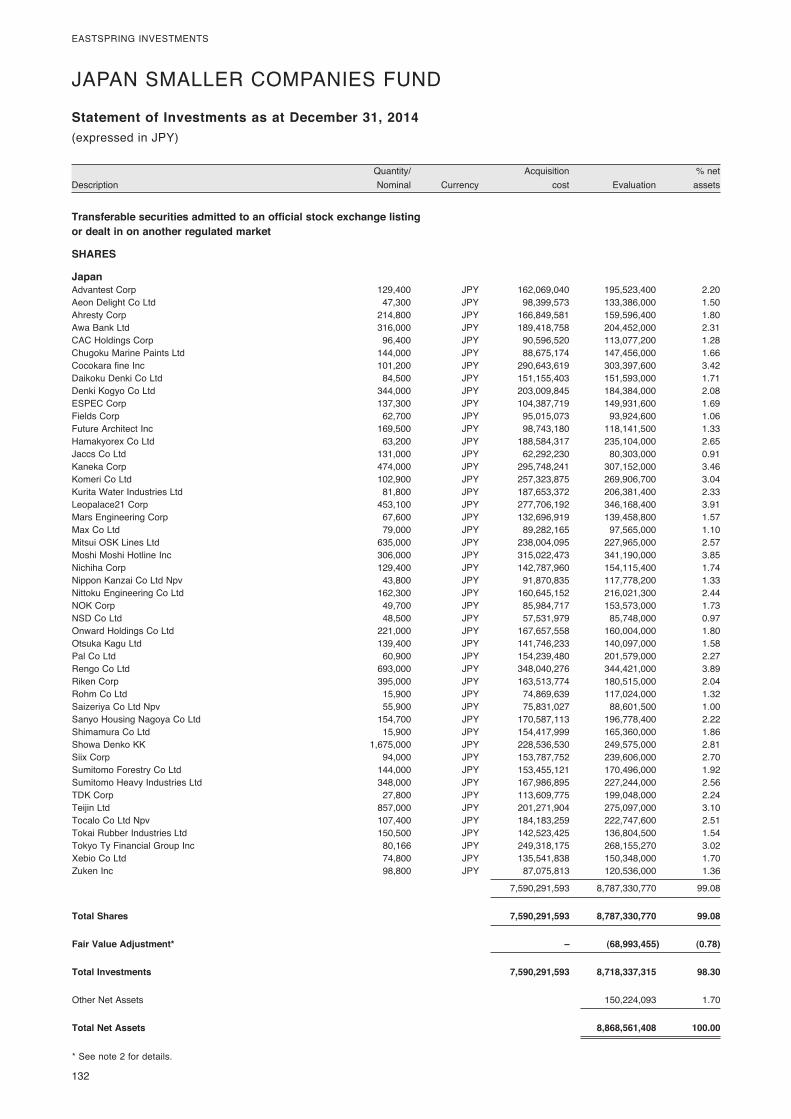
132�
EASTSPRING�INVESTMENTS
� Quantity/�� � Acquisition�� � %�net�Description� Nominal�� Currency�� cost�� Evaluation�� assets�
Statement of Investments as at December 31, 2014(expressed�in�USD)
JAPAN�SMALLER�COMPANIES�FUND�
Transferable securities admitted to an official stock exchange listing or dealt in on another regulated market
SHARES
Japan Advantest�Corp� 129,400� JPY� 162,069,040� 195,523,400� 2.20Aeon�Delight�Co�Ltd� 47,300� JPY� 98,399,573� 133,386,000� 1.50Ahresty�Corp� 214,800� JPY� 166,849,581� 159,596,400� 1.80Awa�Bank�Ltd� 316,000� JPY� 189,418,758� 204,452,000� 2.31CAC�Holdings�Corp� 96,400� JPY� 90,596,520� 113,077,200� 1.28Chugoku�Marine�Paints�Ltd� 144,000� JPY� 88,675,174� 147,456,000� 1.66Cocokara�fine�Inc� 101,200� JPY� 290,643,619� 303,397,600� 3.42Daikoku�Denki�Co�Ltd� 84,500� JPY� 151,155,403� 151,593,000� 1.71Denki�Kogyo�Co�Ltd� 344,000� JPY� 203,009,845� 184,384,000� 2.08ESPEC�Corp� 137,300� JPY� 104,387,719� 149,931,600� 1.69Fields�Corp� 62,700� JPY� 95,015,073� 93,924,600� 1.06Future�Architect�Inc� 169,500� JPY� 98,743,180� 118,141,500� 1.33Hamakyorex�Co�Ltd� 63,200� JPY� 188,584,317� 235,104,000� 2.65Jaccs�Co�Ltd� 131,000� JPY� 62,292,230� 80,303,000� 0.91Kaneka�Corp� 474,000� JPY� 295,748,241� 307,152,000� 3.46Komeri�Co�Ltd� 102,900� JPY� 257,323,875� 269,906,700� 3.04Kurita�Water�Industries�Ltd� 81,800� JPY� 187,653,372� 206,381,400� 2.33Leopalace21�Corp� 453,100� JPY� 277,706,192� 346,168,400� 3.91Mars�Engineering�Corp� 67,600� JPY� 132,696,919� 139,458,800� 1.57Max�Co�Ltd� 79,000� JPY� 89,282,165� 97,565,000� 1.10Mitsui�OSK�Lines�Ltd� 635,000� JPY� 238,004,095� 227,965,000� 2.57Moshi�Moshi�Hotline�Inc� 306,000� JPY� 315,022,473� 341,190,000� 3.85Nichiha�Corp� 129,400� JPY� 142,787,960� 154,115,400� 1.74Nippon�Kanzai�Co�Ltd�Npv� 43,800� JPY� 91,870,835� 117,778,200� 1.33Nittoku�Engineering�Co�Ltd� 162,300� JPY� 160,645,152� 216,021,300� 2.44NOK�Corp� 49,700� JPY� 85,984,717� 153,573,000� 1.73NSD�Co�Ltd� 48,500� JPY� 57,531,979� 85,748,000� 0.97Onward�Holdings�Co�Ltd� 221,000� JPY� 167,657,558� 160,004,000� 1.80Otsuka�Kagu�Ltd� 139,400� JPY� 141,746,233� 140,097,000� 1.58Pal�Co�Ltd� 60,900� JPY� 154,239,480� 201,579,000� 2.27Rengo�Co�Ltd� 693,000� JPY� 348,040,276� 344,421,000� 3.89Riken�Corp� 395,000� JPY� 163,513,774� 180,515,000� 2.04Rohm�Co�Ltd� 15,900� JPY� 74,869,639� 117,024,000� 1.32Saizeriya�Co�Ltd�Npv� 55,900� JPY� 75,831,027� 88,601,500� 1.00Sanyo�Housing�Nagoya�Co�Ltd� 154,700� JPY� 170,587,113� 196,778,400� 2.22Shimamura�Co�Ltd� 15,900� JPY� 154,417,999� 165,360,000� 1.86Showa�Denko�KK� 1,675,000� JPY� 228,536,530� 249,575,000� 2.81Siix�Corp� 94,000� JPY� 153,787,752� 239,606,000� 2.70Sumitomo�Forestry�Co�Ltd� 144,000� JPY� 153,455,121� 170,496,000� 1.92Sumitomo�Heavy�Industries�Ltd� 348,000� JPY� 167,986,895� 227,244,000� 2.56TDK�Corp� 27,800� JPY� 113,609,775� 199,048,000� 2.24Teijin�Ltd� 857,000� JPY� 201,271,904� 275,097,000� 3.10Tocalo�Co�Ltd�Npv� 107,400� JPY� 184,183,259� 222,747,600� 2.51Tokai�Rubber�Industries�Ltd� 150,500� JPY� 142,523,425� 136,804,500� 1.54Tokyo�Ty�Financial�Group�Inc� 80,166� JPY� 249,318,175� 268,155,270� 3.02Xebio�Co�Ltd� 74,800� JPY� 135,541,838� 150,348,000� 1.70Zuken�Inc�� 98,800� JPY� 87,075,813� 120,536,000� 1.36
� � � 7,590,291,593� 8,787,330,770� 99.08
Total Shares 7,590,291,593 8,787,330,770 99.08
Fair Value Adjustment* – (68,993,455) (0.78)
Total Investments 7,590,291,593 8,718,337,315 98.30
Other�Net�Assets� � � � 150,224,093� 1.70
Total Net Assets 8,868,561,408 100.00
*�See�note�2�for�details.� � � ��
(expressed�in�JPY)
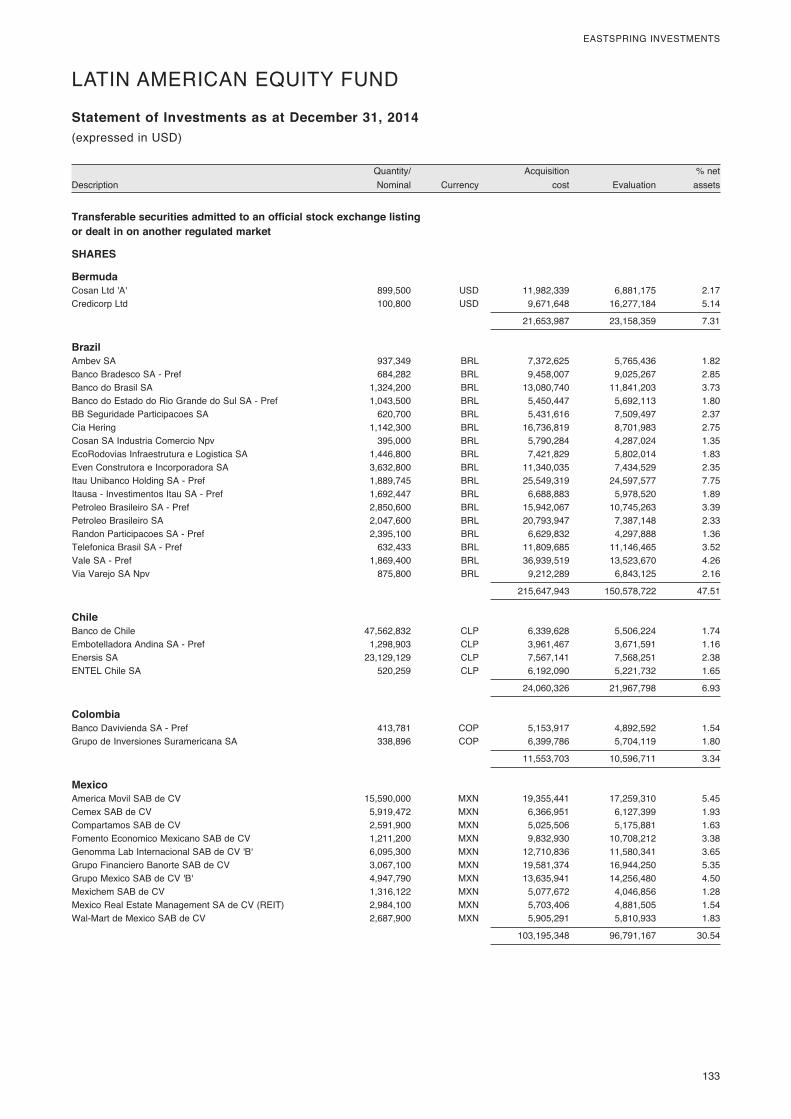
� 133
EASTSPRING�INVESTMENTS
� Quantity/�� � Acquisition�� � %�net�Description� Nominal�� Currency�� cost�� Evaluation�� assets�
Statement of Investments as at December 31, 2014(expressed�in�USD)
LATIN�AMERICAN�EQUITY�FUND�
Transferable securities admitted to an official stock exchange listing or dealt in on another regulated market
SHARES
Bermuda Cosan�Ltd�'A'� 899,500� USD� 11,982,339� 6,881,175� 2.17Credicorp�Ltd�� 100,800� USD� 9,671,648� 16,277,184� 5.14
� � � 21,653,987� 23,158,359� 7.31
Brazil Ambev�SA� 937,349� BRL� 7,372,625� 5,765,436� 1.82Banco�Bradesco�SA�-�Pref� 684,282� BRL� 9,458,007� 9,025,267� 2.85Banco�do�Brasil�SA� 1,324,200� BRL� 13,080,740� 11,841,203� 3.73Banco�do�Estado�do�Rio�Grande�do�Sul�SA�-�Pref� 1,043,500� BRL� 5,450,447� 5,692,113� 1.80BB�Seguridade�Participacoes�SA� 620,700� BRL� 5,431,616� 7,509,497� 2.37Cia�Hering� 1,142,300� BRL� 16,736,819� 8,701,983� 2.75Cosan�SA�Industria�Comercio�Npv� 395,000� BRL� 5,790,284� 4,287,024� 1.35EcoRodovias�Infraestrutura�e�Logistica�SA� 1,446,800� BRL� 7,421,829� 5,802,014� 1.83Even�Construtora�e�Incorporadora�SA� 3,632,800� BRL� 11,340,035� 7,434,529� 2.35Itau�Unibanco�Holding�SA�-�Pref� 1,889,745� BRL� 25,549,319� 24,597,577� 7.75Itausa�-�Investimentos�Itau�SA�-�Pref� 1,692,447� BRL� 6,688,883� 5,978,520� 1.89Petroleo�Brasileiro�SA�-�Pref� 2,850,600� BRL� 15,942,067� 10,745,263� 3.39Petroleo�Brasileiro�SA� 2,047,600� BRL� 20,793,947� 7,387,148� 2.33Randon�Participacoes�SA�-�Pref� 2,395,100� BRL� 6,629,832� 4,297,888� 1.36Telefonica�Brasil�SA�-�Pref� 632,433� BRL� 11,809,685� 11,146,465� 3.52Vale�SA�-�Pref� 1,869,400� BRL� 36,939,519� 13,523,670� 4.26Via�Varejo�SA�Npv�� 875,800� BRL� 9,212,289� 6,843,125� 2.16
� � � 215,647,943� 150,578,722� 47.51
Chile Banco�de�Chile� 47,562,832� CLP� 6,339,628� 5,506,224� 1.74Embotelladora�Andina�SA�-�Pref� 1,298,903� CLP� 3,961,467� 3,671,591� 1.16Enersis�SA� 23,129,129� CLP� 7,567,141� 7,568,251� 2.38ENTEL�Chile�SA�� 520,259� CLP� 6,192,090� 5,221,732� 1.65
� � � 24,060,326� 21,967,798� 6.93
Colombia Banco�Davivienda�SA�-�Pref� 413,781� COP� 5,153,917� 4,892,592� 1.54Grupo�de�Inversiones�Suramericana�SA�� 338,896� COP� 6,399,786� 5,704,119� 1.80
� � � 11,553,703� 10,596,711� 3.34
Mexico America�Movil�SAB�de�CV� 15,590,000� MXN� 19,355,441� 17,259,310� 5.45Cemex�SAB�de�CV� 5,919,472� MXN� 6,366,951� 6,127,399� 1.93Compartamos�SAB�de�CV� 2,591,900� MXN� 5,025,506� 5,175,881� 1.63Fomento�Economico�Mexicano�SAB�de�CV� 1,211,200� MXN� 9,832,930� 10,708,212� 3.38Genomma�Lab�Internacional�SAB�de�CV�'B'� 6,095,300� MXN� 12,710,836� 11,580,341� 3.65Grupo�Financiero�Banorte�SAB�de�CV� 3,067,100� MXN� 19,581,374� 16,944,250� 5.35Grupo�Mexico�SAB�de�CV�'B'� 4,947,790� MXN� 13,635,941� 14,256,480� 4.50Mexichem�SAB�de�CV� 1,316,122� MXN� 5,077,672� 4,046,856� 1.28Mexico�Real�Estate�Management�SA�de�CV�(REIT)� 2,984,100� MXN� 5,703,406� 4,881,505� 1.54Wal-Mart�de�Mexico�SAB�de�CV�� 2,687,900� MXN� 5,905,291� 5,810,933� 1.83
� � � 103,195,348� 96,791,167� 30.54
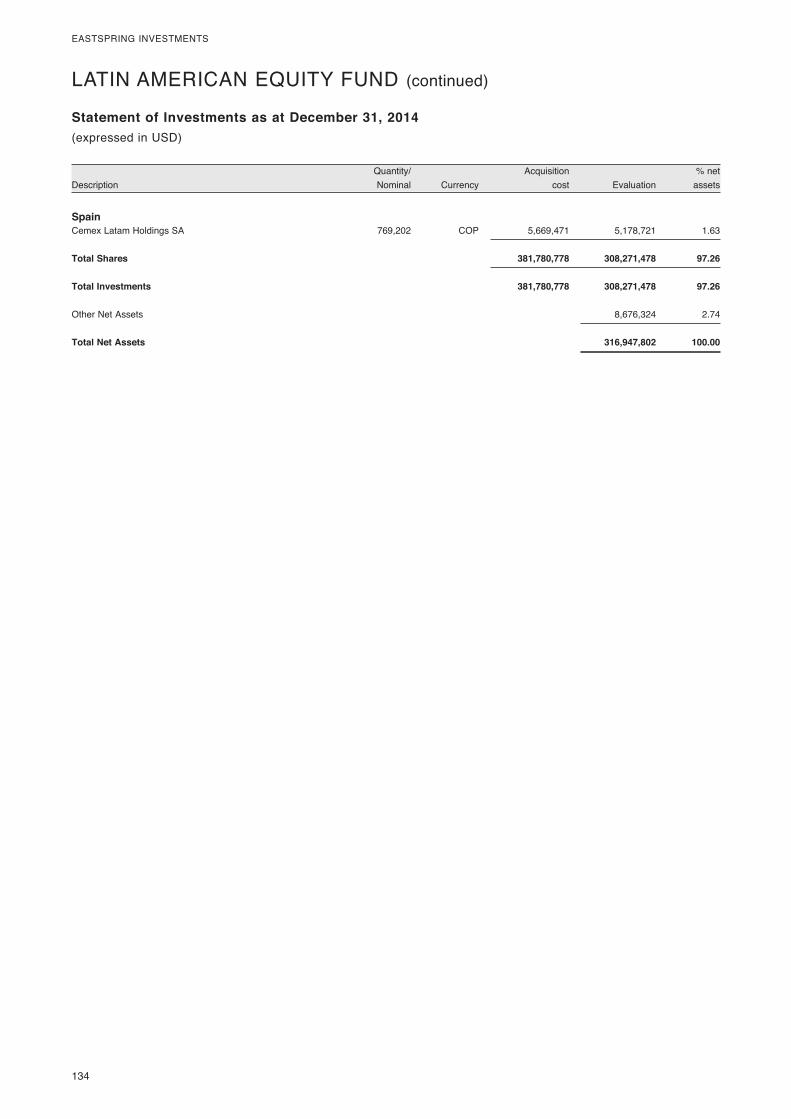
134�
EASTSPRING�INVESTMENTS
� Quantity/�� � Acquisition�� � %�net�Description� Nominal�� Currency�� cost�� Evaluation�� assets�
Statement of Investments as at December 31, 2014(expressed�in�USD)
Spain Cemex�Latam�Holdings�SA�� 769,202� COP� 5,669,471� 5,178,721� 1.63
Total Shares 381,780,778 308,271,478 97.26
Total Investments 381,780,778 308,271,478 97.26
Other�Net�Assets� � � � 8,676,324� 2.74
Total Net Assets 316,947,802 100.00
LATIN�AMERICAN�EQUITY�FUND�(continued)
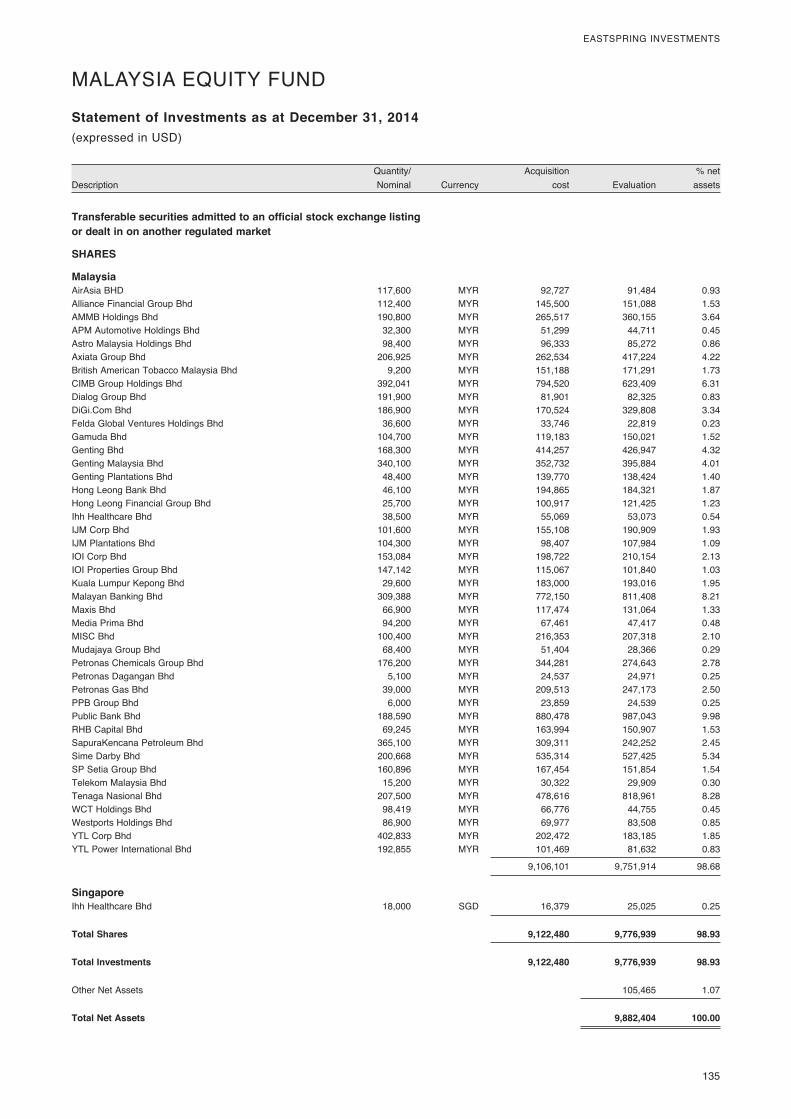
� 135
EASTSPRING�INVESTMENTS
� Quantity/�� � Acquisition�� � %�net�Description� Nominal�� Currency�� cost�� Evaluation�� assets�
Statement of Investments as at December 31, 2014(expressed�in�USD)
MALAYSIA�EQUITY�FUND�
Transferable securities admitted to an official stock exchange listing or dealt in on another regulated market
SHARES
Malaysia AirAsia�BHD� 117,600� MYR� 92,727� 91,484� 0.93Alliance�Financial�Group�Bhd� 112,400� MYR� 145,500� 151,088� 1.53AMMB�Holdings�Bhd� 190,800� MYR� 265,517� 360,155� 3.64APM�Automotive�Holdings�Bhd� 32,300� MYR� 51,299� 44,711� 0.45Astro�Malaysia�Holdings�Bhd� 98,400� MYR� 96,333� 85,272� 0.86Axiata�Group�Bhd� 206,925� MYR� 262,534� 417,224� 4.22British�American�Tobacco�Malaysia�Bhd� 9,200� MYR� 151,188� 171,291� 1.73CIMB�Group�Holdings�Bhd� 392,041� MYR� 794,520� 623,409� 6.31Dialog�Group�Bhd� 191,900� MYR� 81,901� 82,325� 0.83DiGi.Com�Bhd� 186,900� MYR� 170,524� 329,808� 3.34Felda�Global�Ventures�Holdings�Bhd� 36,600� MYR� 33,746� 22,819� 0.23Gamuda�Bhd� 104,700� MYR� 119,183� 150,021� 1.52Genting�Bhd� 168,300� MYR� 414,257� 426,947� 4.32Genting�Malaysia�Bhd� 340,100� MYR� 352,732� 395,884� 4.01Genting�Plantations�Bhd� 48,400� MYR� 139,770� 138,424� 1.40Hong�Leong�Bank�Bhd� 46,100� MYR� 194,865� 184,321� 1.87Hong�Leong�Financial�Group�Bhd� 25,700� MYR� 100,917� 121,425� 1.23Ihh�Healthcare�Bhd� 38,500� MYR� 55,069� 53,073� 0.54IJM�Corp�Bhd� 101,600� MYR� 155,108� 190,909� 1.93IJM�Plantations�Bhd� 104,300� MYR� 98,407� 107,984� 1.09IOI�Corp�Bhd� 153,084� MYR� 198,722� 210,154� 2.13IOI�Properties�Group�Bhd� 147,142� MYR� 115,067� 101,840� 1.03Kuala�Lumpur�Kepong�Bhd� 29,600� MYR� 183,000� 193,016� 1.95Malayan�Banking�Bhd� 309,388� MYR� 772,150� 811,408� 8.21Maxis�Bhd� 66,900� MYR� 117,474� 131,064� 1.33Media�Prima�Bhd� 94,200� MYR� 67,461� 47,417� 0.48MISC�Bhd� 100,400� MYR� 216,353� 207,318� 2.10Mudajaya�Group�Bhd� 68,400� MYR� 51,404� 28,366� 0.29Petronas�Chemicals�Group�Bhd� 176,200� MYR� 344,281� 274,643� 2.78Petronas�Dagangan�Bhd� 5,100� MYR� 24,537� 24,971� 0.25Petronas�Gas�Bhd� 39,000� MYR� 209,513� 247,173� 2.50PPB�Group�Bhd� 6,000� MYR� 23,859� 24,539� 0.25Public�Bank�Bhd� 188,590� MYR� 880,478� 987,043� 9.98RHB�Capital�Bhd� 69,245� MYR� 163,994� 150,907� 1.53SapuraKencana�Petroleum�Bhd� 365,100� MYR� 309,311� 242,252� 2.45Sime�Darby�Bhd� 200,668� MYR� 535,314� 527,425� 5.34SP�Setia�Group�Bhd� 160,896� MYR� 167,454� 151,854� 1.54Telekom�Malaysia�Bhd� 15,200� MYR� 30,322� 29,909� 0.30Tenaga�Nasional�Bhd� 207,500� MYR� 478,616� 818,961� 8.28WCT�Holdings�Bhd� 98,419� MYR� 66,776� 44,755� 0.45Westports�Holdings�Bhd� 86,900� MYR� 69,977� 83,508� 0.85YTL�Corp�Bhd� 402,833� MYR� 202,472� 183,185� 1.85YTL�Power�International�Bhd�� 192,855� MYR� 101,469� 81,632� 0.83
� � � 9,106,101� 9,751,914� 98.68
Singapore Ihh�Healthcare�Bhd�� 18,000� SGD� 16,379� 25,025� 0.25
Total Shares 9,122,480 9,776,939 98.93
Total Investments 9,122,480 9,776,939 98.93
Other�Net�Assets� � � � 105,465� 1.07
Total Net Assets 9,882,404 100.00
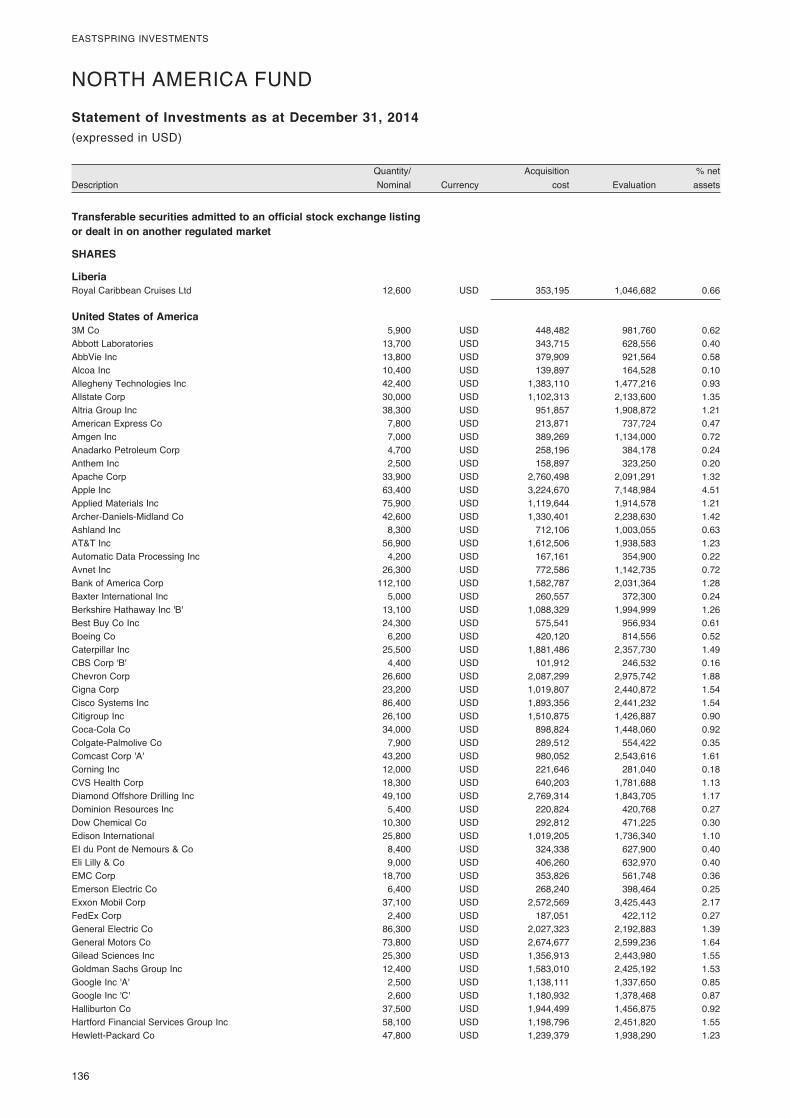
136�
EASTSPRING�INVESTMENTS
� Quantity/�� � Acquisition�� � %�net�Description� Nominal�� Currency�� cost�� Evaluation�� assets�
Statement of Investments as at December 31, 2014(expressed�in�USD)
NORTH�AMERICA�FUND�
Transferable securities admitted to an official stock exchange listing or dealt in on another regulated market
SHARES
Liberia Royal�Caribbean�Cruises�Ltd�� 12,600� USD� 353,195� 1,046,682� 0.66
United States of America 3M�Co� 5,900� USD� 448,482� 981,760� 0.62Abbott�Laboratories� 13,700� USD� 343,715� 628,556� 0.40AbbVie�Inc� 13,800� USD� 379,909� 921,564� 0.58Alcoa�Inc� 10,400� USD� 139,897� 164,528� 0.10Allegheny�Technologies�Inc� 42,400� USD� 1,383,110� 1,477,216� 0.93Allstate�Corp� 30,000� USD� 1,102,313� 2,133,600� 1.35Altria�Group�Inc� 38,300� USD� 951,857� 1,908,872� 1.21American�Express�Co� 7,800� USD� 213,871� 737,724� 0.47Amgen�Inc� 7,000� USD� 389,269� 1,134,000� 0.72Anadarko�Petroleum�Corp� 4,700� USD� 258,196� 384,178� 0.24Anthem�Inc� 2,500� USD� 158,897� 323,250� 0.20Apache�Corp� 33,900� USD� 2,760,498� 2,091,291� 1.32Apple�Inc� 63,400� USD� 3,224,670� 7,148,984� 4.51Applied�Materials�Inc� 75,900� USD� 1,119,644� 1,914,578� 1.21Archer-Daniels-Midland�Co� 42,600� USD� 1,330,401� 2,238,630� 1.42Ashland�Inc� 8,300� USD� 712,106� 1,003,055� 0.63AT&T�Inc� 56,900� USD� 1,612,506� 1,938,583� 1.23Automatic�Data�Processing�Inc� 4,200� USD� 167,161� 354,900� 0.22Avnet�Inc� 26,300� USD� 772,586� 1,142,735� 0.72Bank�of�America�Corp� 112,100� USD� 1,582,787� 2,031,364� 1.28Baxter�International�Inc� 5,000� USD� 260,557� 372,300� 0.24Berkshire�Hathaway�Inc�'B'� 13,100� USD� 1,088,329� 1,994,999� 1.26Best�Buy�Co�Inc� 24,300� USD� 575,541� 956,934� 0.61Boeing�Co� 6,200� USD� 420,120� 814,556� 0.52Caterpillar�Inc� 25,500� USD� 1,881,486� 2,357,730� 1.49CBS�Corp�'B'� 4,400� USD� 101,912� 246,532� 0.16Chevron�Corp� 26,600� USD� 2,087,299� 2,975,742� 1.88Cigna�Corp� 23,200� USD� 1,019,807� 2,440,872� 1.54Cisco�Systems�Inc� 86,400� USD� 1,893,356� 2,441,232� 1.54Citigroup�Inc� 26,100� USD� 1,510,875� 1,426,887� 0.90Coca-Cola�Co� 34,000� USD� 898,824� 1,448,060� 0.92Colgate-Palmolive�Co� 7,900� USD� 289,512� 554,422� 0.35Comcast�Corp�'A'� 43,200� USD� 980,052� 2,543,616� 1.61Corning�Inc� 12,000� USD� 221,646� 281,040� 0.18CVS�Health�Corp� 18,300� USD� 640,203� 1,781,688� 1.13Diamond�Offshore�Drilling�Inc� 49,100� USD� 2,769,314� 1,843,705� 1.17Dominion�Resources�Inc� 5,400� USD� 220,824� 420,768� 0.27Dow�Chemical�Co� 10,300� USD� 292,812� 471,225� 0.30Edison�International� 25,800� USD� 1,019,205� 1,736,340� 1.10EI�du�Pont�de�Nemours�&�Co� 8,400� USD� 324,338� 627,900� 0.40Eli�Lilly�&�Co� 9,000� USD� 406,260� 632,970� 0.40EMC�Corp� 18,700� USD� 353,826� 561,748� 0.36Emerson�Electric�Co� 6,400� USD� 268,240� 398,464� 0.25Exxon�Mobil�Corp� 37,100� USD� 2,572,569� 3,425,443� 2.17FedEx�Corp� 2,400� USD� 187,051� 422,112� 0.27General�Electric�Co� 86,300� USD� 2,027,323� 2,192,883� 1.39General�Motors�Co� 73,800� USD� 2,674,677� 2,599,236� 1.64Gilead�Sciences�Inc� 25,300� USD� 1,356,913� 2,443,980� 1.55Goldman�Sachs�Group�Inc� 12,400� USD� 1,583,010� 2,425,192� 1.53Google�Inc�'A'� 2,500� USD� 1,138,111� 1,337,650� 0.85Google�Inc�'C'� 2,600� USD� 1,180,932� 1,378,468� 0.87Halliburton�Co� 37,500� USD� 1,944,499� 1,456,875� 0.92Hartford�Financial�Services�Group�Inc� 58,100� USD� 1,198,796� 2,451,820� 1.55Hewlett-Packard�Co� 47,800� USD� 1,239,379� 1,938,290� 1.23
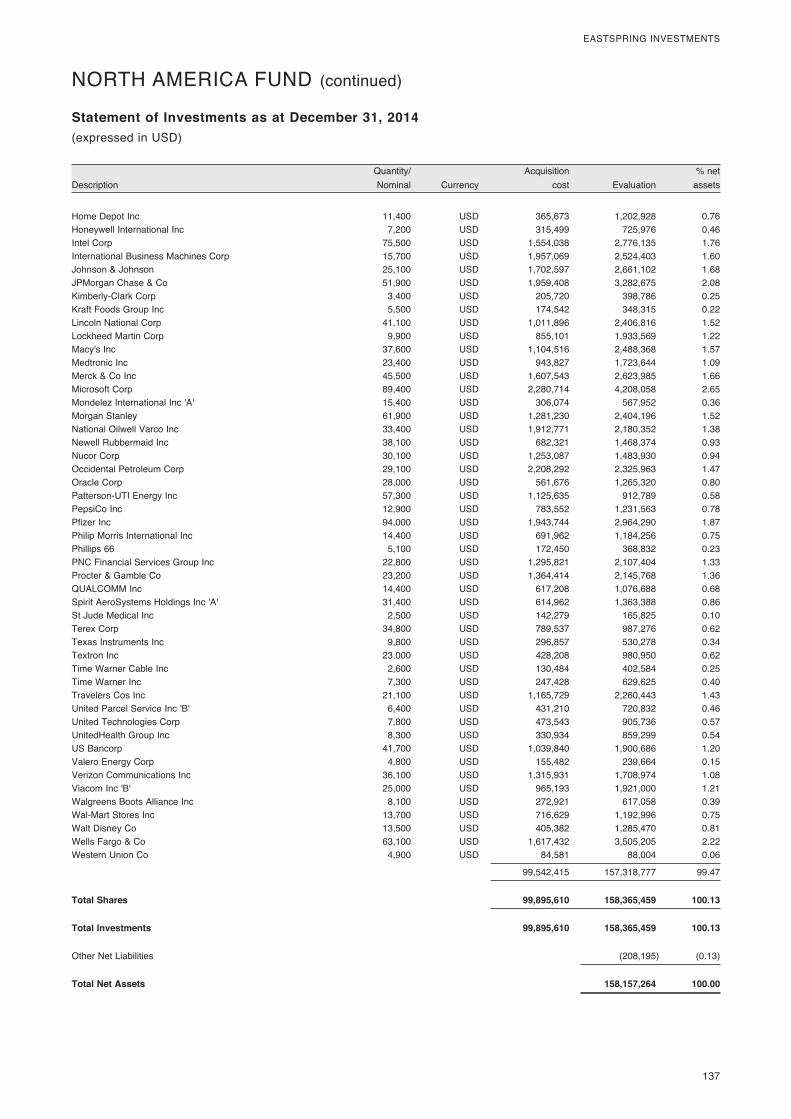
� 137
EASTSPRING�INVESTMENTS
� Quantity/�� � Acquisition�� � %�net�Description� Nominal�� Currency�� cost�� Evaluation�� assets�
Statement of Investments as at December 31, 2014(expressed�in�USD)
NORTH�AMERICA�FUND�(continued)
Home�Depot�Inc� 11,400� USD� 365,673� 1,202,928� 0.76Honeywell�International�Inc� 7,200� USD� 315,499� 725,976� 0.46Intel�Corp� 75,500� USD� 1,554,038� 2,776,135� 1.76International�Business�Machines�Corp� 15,700� USD� 1,957,069� 2,524,403� 1.60Johnson�&�Johnson� 25,100� USD� 1,702,597� 2,661,102� 1.68JPMorgan�Chase�&�Co� 51,900� USD� 1,959,408� 3,282,675� 2.08Kimberly-Clark�Corp� 3,400� USD� 205,720� 398,786� 0.25Kraft�Foods�Group�Inc� 5,500� USD� 174,542� 348,315� 0.22Lincoln�National�Corp� 41,100� USD� 1,011,896� 2,406,816� 1.52Lockheed�Martin�Corp� 9,900� USD� 855,101� 1,933,569� 1.22Macy's�Inc� 37,600� USD� 1,104,516� 2,488,368� 1.57Medtronic�Inc� 23,400� USD� 943,827� 1,723,644� 1.09Merck�&�Co�Inc� 45,500� USD� 1,607,543� 2,623,985� 1.66Microsoft�Corp� 89,400� USD� 2,280,714� 4,208,058� 2.65Mondelez�International�Inc�'A'� 15,400� USD� 306,074� 567,952� 0.36Morgan�Stanley� 61,900� USD� 1,281,230� 2,404,196� 1.52National�Oilwell�Varco�Inc� 33,400� USD� 1,912,771� 2,180,352� 1.38Newell�Rubbermaid�Inc� 38,100� USD� 682,321� 1,468,374� 0.93Nucor�Corp� 30,100� USD� 1,253,087� 1,483,930� 0.94Occidental�Petroleum�Corp� 29,100� USD� 2,208,292� 2,325,963� 1.47Oracle�Corp� 28,000� USD� 561,676� 1,265,320� 0.80Patterson-UTI�Energy�Inc� 57,300� USD� 1,125,635� 912,789� 0.58PepsiCo�Inc� 12,900� USD� 783,552� 1,231,563� 0.78Pfizer�Inc� 94,000� USD� 1,943,744� 2,964,290� 1.87Philip�Morris�International�Inc� 14,400� USD� 691,962� 1,184,256� 0.75Phillips�66� 5,100� USD� 172,450� 368,832� 0.23PNC�Financial�Services�Group�Inc� 22,800� USD� 1,295,821� 2,107,404� 1.33Procter�&�Gamble�Co� 23,200� USD� 1,364,414� 2,145,768� 1.36QUALCOMM�Inc� 14,400� USD� 617,208� 1,076,688� 0.68Spirit�AeroSystems�Holdings�Inc�'A'� 31,400� USD� 614,962� 1,363,388� 0.86St�Jude�Medical�Inc� 2,500� USD� 142,279� 165,825� 0.10Terex�Corp� 34,800� USD� 789,537� 987,276� 0.62Texas�Instruments�Inc� 9,800� USD� 296,857� 530,278� 0.34Textron�Inc� 23,000� USD� 428,208� 980,950� 0.62Time�Warner�Cable�Inc� 2,600� USD� 130,484� 402,584� 0.25Time�Warner�Inc� 7,300� USD� 247,428� 629,625� 0.40Travelers�Cos�Inc� 21,100� USD� 1,165,729� 2,260,443� 1.43United�Parcel�Service�Inc�'B'� 6,400� USD� 431,210� 720,832� 0.46United�Technologies�Corp� 7,800� USD� 473,543� 905,736� 0.57UnitedHealth�Group�Inc� 8,300� USD� 330,934� 859,299� 0.54US�Bancorp� 41,700� USD� 1,039,840� 1,900,686� 1.20Valero�Energy�Corp� 4,800� USD� 155,482� 239,664� 0.15Verizon�Communications�Inc� 36,100� USD� 1,315,931� 1,708,974� 1.08Viacom�Inc�'B'� 25,000� USD� 965,193� 1,921,000� 1.21Walgreens�Boots�Alliance�Inc� 8,100� USD� 272,921� 617,058� 0.39Wal-Mart�Stores�Inc� 13,700� USD� 716,629� 1,192,996� 0.75Walt�Disney�Co� 13,500� USD� 405,382� 1,285,470� 0.81Wells�Fargo�&�Co� 63,100� USD� 1,617,432� 3,505,205� 2.22Western�Union�Co�� 4,900� USD� 84,581� 88,004� 0.06
� � � 99,542,415� 157,318,777� 99.47
Total Shares 99,895,610 158,365,459 100.13
Total Investments 99,895,610 158,365,459 100.13
Other�Net�Liabilities� � � � (208,195)� (0.13)
Total Net Assets 158,157,264 100.00
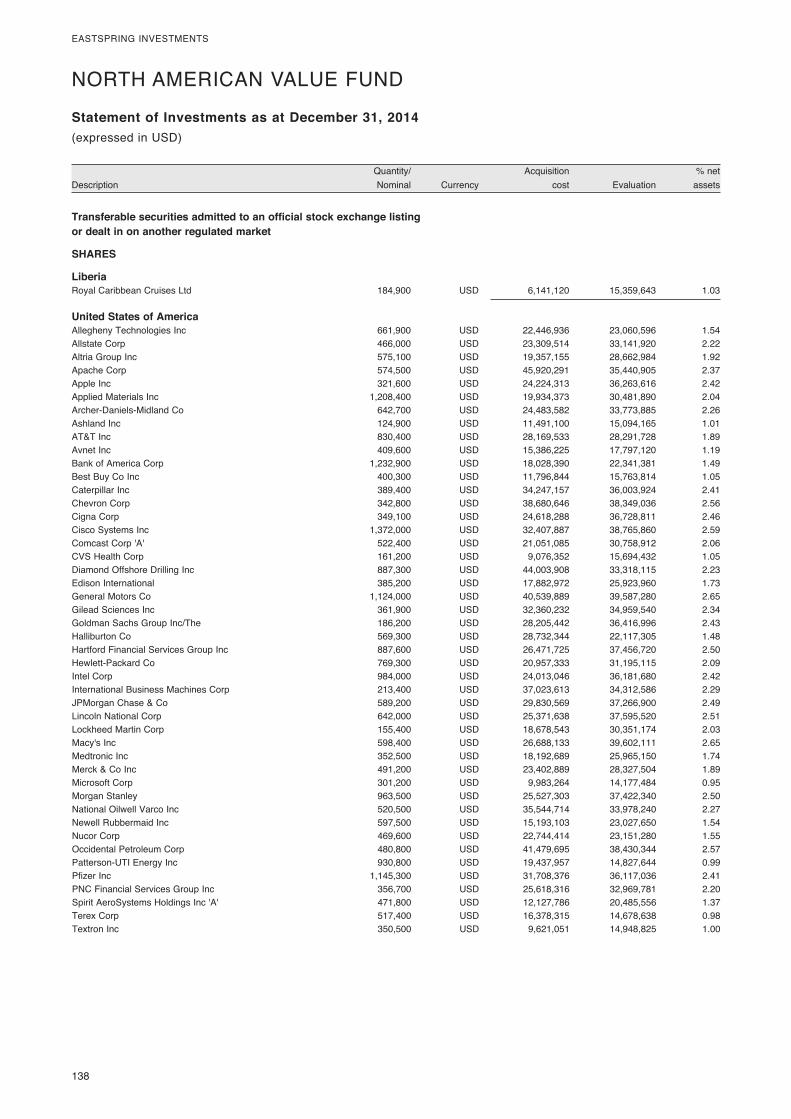
138�
EASTSPRING�INVESTMENTS
� Quantity/�� � Acquisition�� � %�net�Description� Nominal�� Currency�� cost�� Evaluation�� assets�
Statement of Investments as at December 31, 2014(expressed�in�USD)
NORTH�AMERICAN�VALUE�FUND�
Transferable securities admitted to an official stock exchange listing or dealt in on another regulated market
SHARES
Liberia Royal�Caribbean�Cruises�Ltd�� 184,900� USD� 6,141,120� 15,359,643� 1.03
United States of America Allegheny�Technologies�Inc� 661,900� USD� 22,446,936� 23,060,596� 1.54Allstate�Corp� 466,000� USD� 23,309,514� 33,141,920� 2.22Altria�Group�Inc� 575,100� USD� 19,357,155� 28,662,984� 1.92Apache�Corp� 574,500� USD� 45,920,291� 35,440,905� 2.37Apple�Inc� 321,600� USD� 24,224,313� 36,263,616� 2.42Applied�Materials�Inc� 1,208,400� USD� 19,934,373� 30,481,890� 2.04Archer-Daniels-Midland�Co� 642,700� USD� 24,483,582� 33,773,885� 2.26Ashland�Inc� 124,900� USD� 11,491,100� 15,094,165� 1.01AT&T�Inc� 830,400� USD� 28,169,533� 28,291,728� 1.89Avnet�Inc� 409,600� USD� 15,386,225� 17,797,120� 1.19Bank�of�America�Corp� 1,232,900� USD� 18,028,390� 22,341,381� 1.49Best�Buy�Co�Inc� 400,300� USD� 11,796,844� 15,763,814� 1.05Caterpillar�Inc� 389,400� USD� 34,247,157� 36,003,924� 2.41Chevron�Corp� 342,800� USD� 38,680,646� 38,349,036� 2.56Cigna�Corp� 349,100� USD� 24,618,288� 36,728,811� 2.46Cisco�Systems�Inc� 1,372,000� USD� 32,407,887� 38,765,860� 2.59Comcast�Corp�'A'� 522,400� USD� 21,051,085� 30,758,912� 2.06CVS�Health�Corp� 161,200� USD� 9,076,352� 15,694,432� 1.05Diamond�Offshore�Drilling�Inc� 887,300� USD� 44,003,908� 33,318,115� 2.23Edison�International� 385,200� USD� 17,882,972� 25,923,960� 1.73General�Motors�Co� 1,124,000� USD� 40,539,889� 39,587,280� 2.65Gilead�Sciences�Inc� 361,900� USD� 32,360,232� 34,959,540� 2.34Goldman�Sachs�Group�Inc/The� 186,200� USD� 28,205,442� 36,416,996� 2.43Halliburton�Co� 569,300� USD� 28,732,344� 22,117,305� 1.48Hartford�Financial�Services�Group�Inc� 887,600� USD� 26,471,725� 37,456,720� 2.50Hewlett-Packard�Co� 769,300� USD� 20,957,333� 31,195,115� 2.09Intel�Corp� 984,000� USD� 24,013,046� 36,181,680� 2.42International�Business�Machines�Corp� 213,400� USD� 37,023,613� 34,312,586� 2.29JPMorgan�Chase�&�Co� 589,200� USD� 29,830,569� 37,266,900� 2.49Lincoln�National�Corp� 642,000� USD� 25,371,638� 37,595,520� 2.51Lockheed�Martin�Corp� 155,400� USD� 18,678,543� 30,351,174� 2.03Macy's�Inc� 598,400� USD� 26,688,133� 39,602,111� 2.65Medtronic�Inc� 352,500� USD� 18,192,689� 25,965,150� 1.74Merck�&�Co�Inc� 491,200� USD� 23,402,889� 28,327,504� 1.89Microsoft�Corp� 301,200� USD� 9,983,264� 14,177,484� 0.95Morgan�Stanley� 963,500� USD� 25,527,303� 37,422,340� 2.50National�Oilwell�Varco�Inc� 520,500� USD� 35,544,714� 33,978,240� 2.27Newell�Rubbermaid�Inc� 597,500� USD� 15,193,103� 23,027,650� 1.54Nucor�Corp� 469,600� USD� 22,744,414� 23,151,280� 1.55Occidental�Petroleum�Corp� 480,800� USD� 41,479,695� 38,430,344� 2.57Patterson-UTI�Energy�Inc� 930,800� USD� 19,437,957� 14,827,644� 0.99Pfizer�Inc� 1,145,300� USD� 31,708,376� 36,117,036� 2.41PNC�Financial�Services�Group�Inc� 356,700� USD� 25,618,316� 32,969,781� 2.20Spirit�AeroSystems�Holdings�Inc�'A'� 471,800� USD� 12,127,786� 20,485,556� 1.37Terex�Corp� 517,400� USD� 16,378,315� 14,678,638� 0.98Textron�Inc� 350,500� USD� 9,621,051� 14,948,825� 1.00
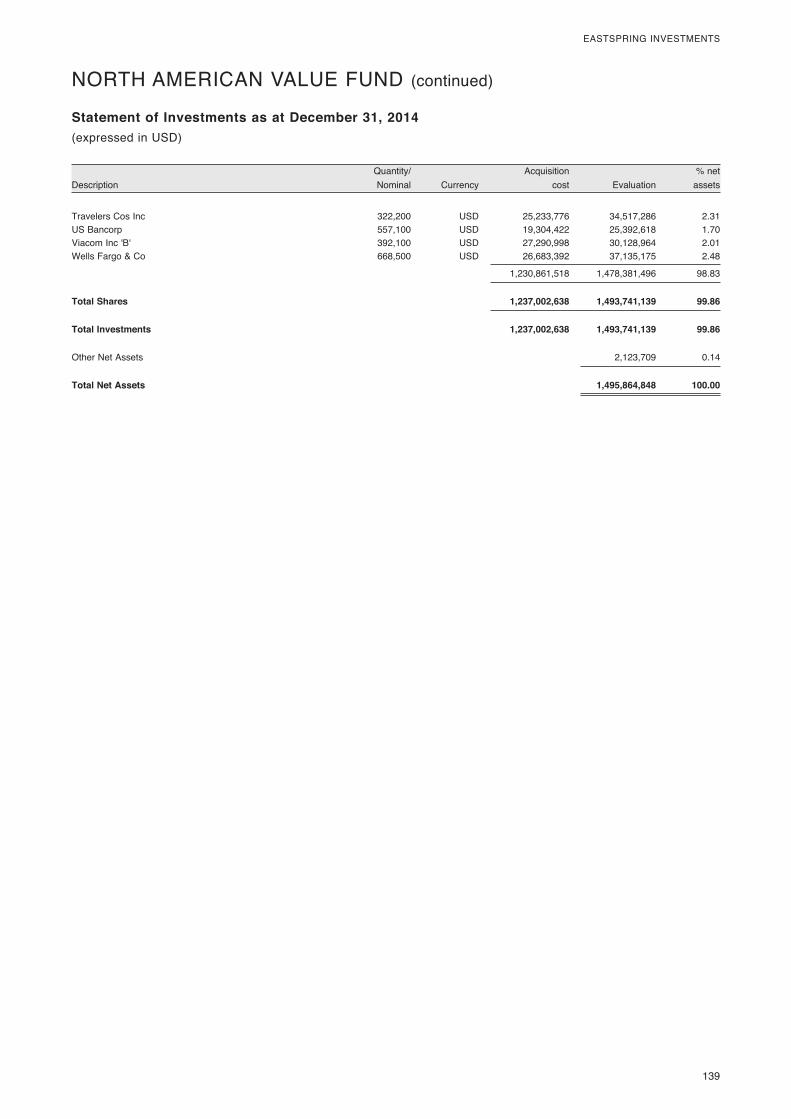
� 139
EASTSPRING�INVESTMENTS
� Quantity/�� � Acquisition�� � %�net�Description� Nominal�� Currency�� cost�� Evaluation�� assets�
Statement of Investments as at December 31, 2014(expressed�in�USD)
Travelers�Cos�Inc� 322,200� USD� 25,233,776� 34,517,286� 2.31US�Bancorp� 557,100� USD� 19,304,422� 25,392,618� 1.70Viacom�Inc�'B'� 392,100� USD� 27,290,998� 30,128,964� 2.01Wells�Fargo�&�Co�� 668,500� USD� 26,683,392� 37,135,175� 2.48
� � � 1,230,861,518� 1,478,381,496� 98.83
Total Shares 1,237,002,638 1,493,741,139 99.86
Total Investments 1,237,002,638 1,493,741,139 99.86
Other�Net�Assets� � � � 2,123,709� 0.14
Total Net Assets 1,495,864,848 100.00
NORTH�AMERICAN�VALUE�FUND�(continued)
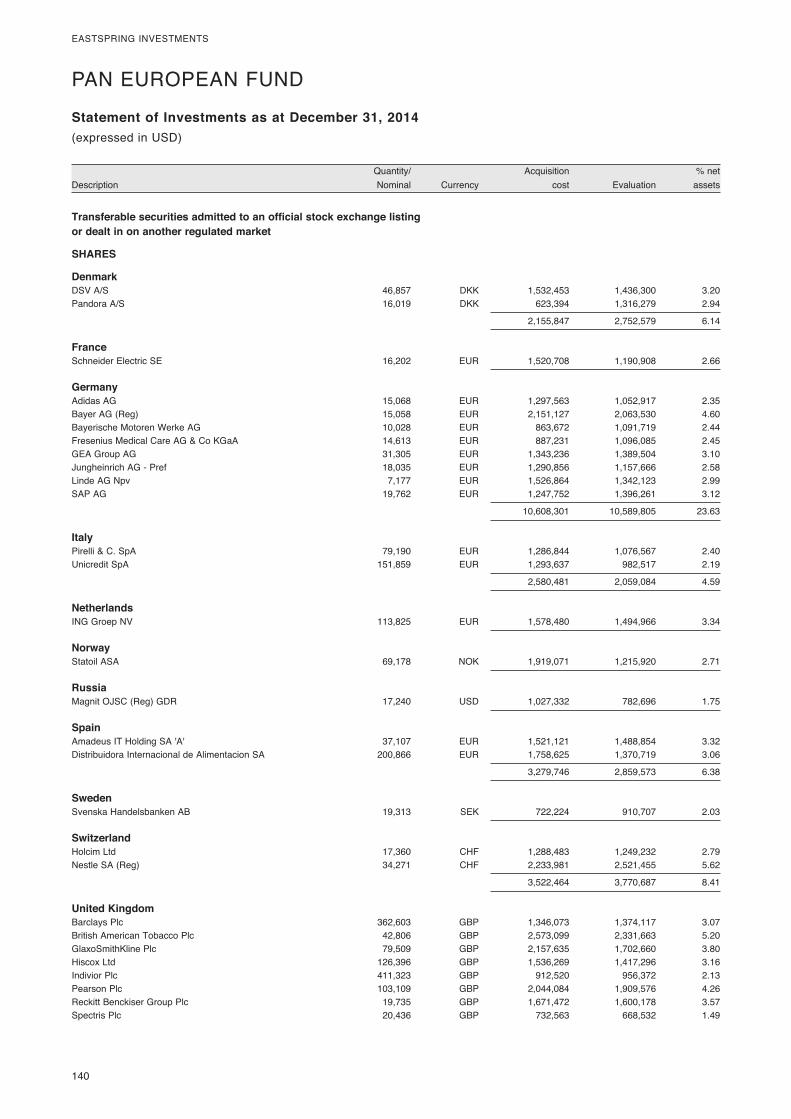
140�
EASTSPRING�INVESTMENTS
� Quantity/�� � Acquisition�� � %�net�Description� Nominal�� Currency�� cost�� Evaluation�� assets�
Statement of Investments as at December 31, 2014(expressed�in�USD)
PAN�EUROPEAN�FUND�
Transferable securities admitted to an official stock exchange listing or dealt in on another regulated market
SHARES
Denmark DSV�A/S� 46,857� DKK� 1,532,453� 1,436,300� 3.20Pandora�A/S�� 16,019� DKK� 623,394� 1,316,279� 2.94
� � � 2,155,847� 2,752,579� 6.14
France Schneider�Electric�SE�� 16,202� EUR� 1,520,708� 1,190,908� 2.66
Germany Adidas�AG� 15,068� EUR� 1,297,563� 1,052,917� 2.35Bayer�AG�(Reg)� 15,058� EUR� 2,151,127� 2,063,530� 4.60Bayerische�Motoren�Werke�AG� 10,028� EUR� 863,672� 1,091,719� 2.44Fresenius�Medical�Care�AG�&�Co�KGaA� 14,613� EUR� 887,231� 1,096,085� 2.45GEA�Group�AG� 31,305� EUR� 1,343,236� 1,389,504� 3.10Jungheinrich�AG�-�Pref� 18,035� EUR� 1,290,856� 1,157,666� 2.58Linde�AG�Npv� 7,177� EUR� 1,526,864� 1,342,123� 2.99SAP�AG�� 19,762� EUR� 1,247,752� 1,396,261� 3.12
� � � 10,608,301� 10,589,805� 23.63
Italy Pirelli�&�C.�SpA� 79,190� EUR� 1,286,844� 1,076,567� 2.40Unicredit�SpA�� 151,859� EUR� 1,293,637� 982,517� 2.19
� � � 2,580,481� 2,059,084� 4.59
Netherlands ING�Groep�NV�� 113,825� EUR� 1,578,480� 1,494,966� 3.34
Norway Statoil�ASA�� 69,178� NOK� 1,919,071� 1,215,920� 2.71
Russia Magnit�OJSC�(Reg)�GDR�� 17,240� USD� 1,027,332� 782,696� 1.75
Spain Amadeus�IT�Holding�SA�'A'� 37,107� EUR� 1,521,121� 1,488,854� 3.32Distribuidora�Internacional�de�Alimentacion�SA�� 200,866� EUR� 1,758,625� 1,370,719� 3.06
� � � 3,279,746� 2,859,573� 6.38
Sweden Svenska�Handelsbanken�AB�� 19,313� SEK� 722,224� 910,707� 2.03
Switzerland Holcim�Ltd� 17,360� CHF� 1,288,483� 1,249,232� 2.79Nestle�SA�(Reg)�� 34,271� CHF� 2,233,981� 2,521,455� 5.62
� � � 3,522,464� 3,770,687� 8.41
United Kingdom Barclays�Plc� 362,603� GBP� 1,346,073� 1,374,117� 3.07British�American�Tobacco�Plc� 42,806� GBP� 2,573,099� 2,331,663� 5.20GlaxoSmithKline�Plc� 79,509� GBP� 2,157,635� 1,702,660� 3.80Hiscox�Ltd� 126,396� GBP� 1,536,269� 1,417,296� 3.16Indivior�Plc� 411,323� GBP� 912,520� 956,372� 2.13Pearson�Plc� 103,109� GBP� 2,044,084� 1,909,576� 4.26Reckitt�Benckiser�Group�Plc� 19,735� GBP� 1,671,472� 1,600,178� 3.57Spectris�Plc� 20,436� GBP� 732,563� 668,532� 1.49
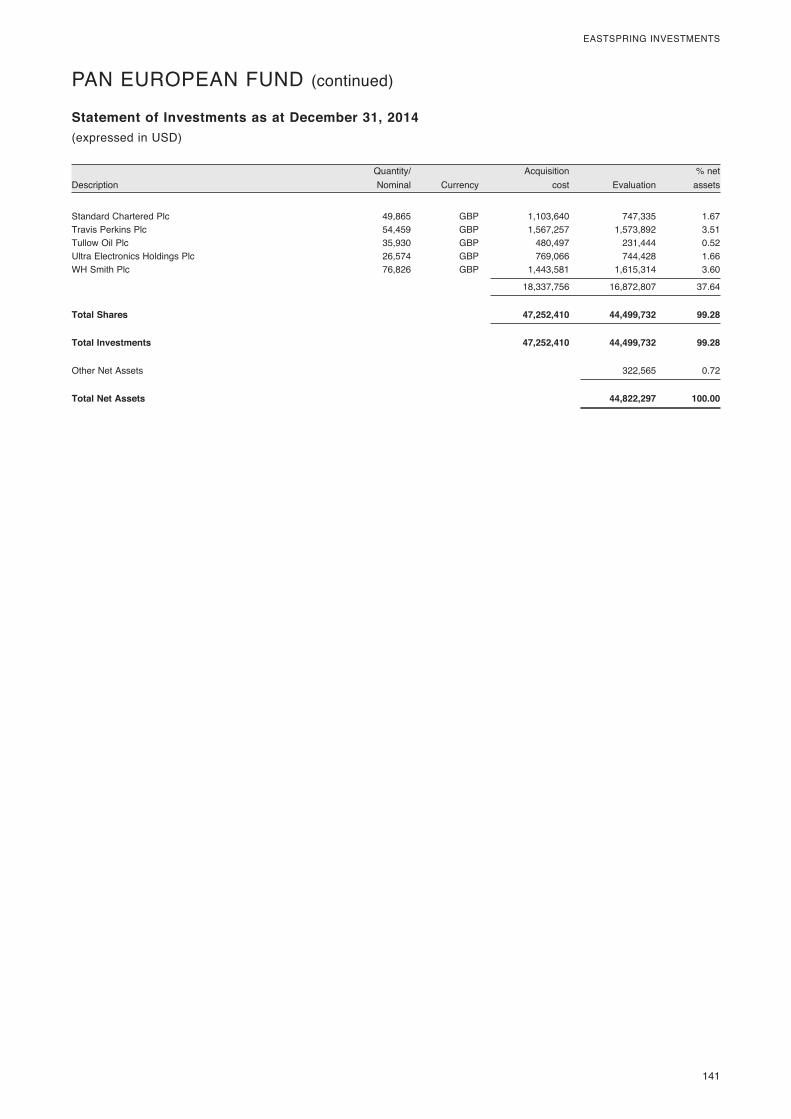
� 141
EASTSPRING�INVESTMENTS
� Quantity/�� � Acquisition�� � %�net�Description� Nominal�� Currency�� cost�� Evaluation�� assets�
Statement of Investments as at December 31, 2014(expressed�in�USD)
PAN�EUROPEAN�FUND�(continued)
Standard�Chartered�Plc� 49,865� GBP� 1,103,640� 747,335� 1.67Travis�Perkins�Plc� 54,459� GBP� 1,567,257� 1,573,892� 3.51Tullow�Oil�Plc� 35,930� GBP� 480,497� 231,444� 0.52Ultra�Electronics�Holdings�Plc� 26,574� GBP� 769,066� 744,428� 1.66WH�Smith�Plc�� 76,826� GBP� 1,443,581� 1,615,314� 3.60
� � � 18,337,756� 16,872,807� 37.64
Total Shares 47,252,410 44,499,732 99.28
Total Investments 47,252,410 44,499,732 99.28
Other�Net�Assets� � � � 322,565� 0.72
Total Net Assets 44,822,297 100.00
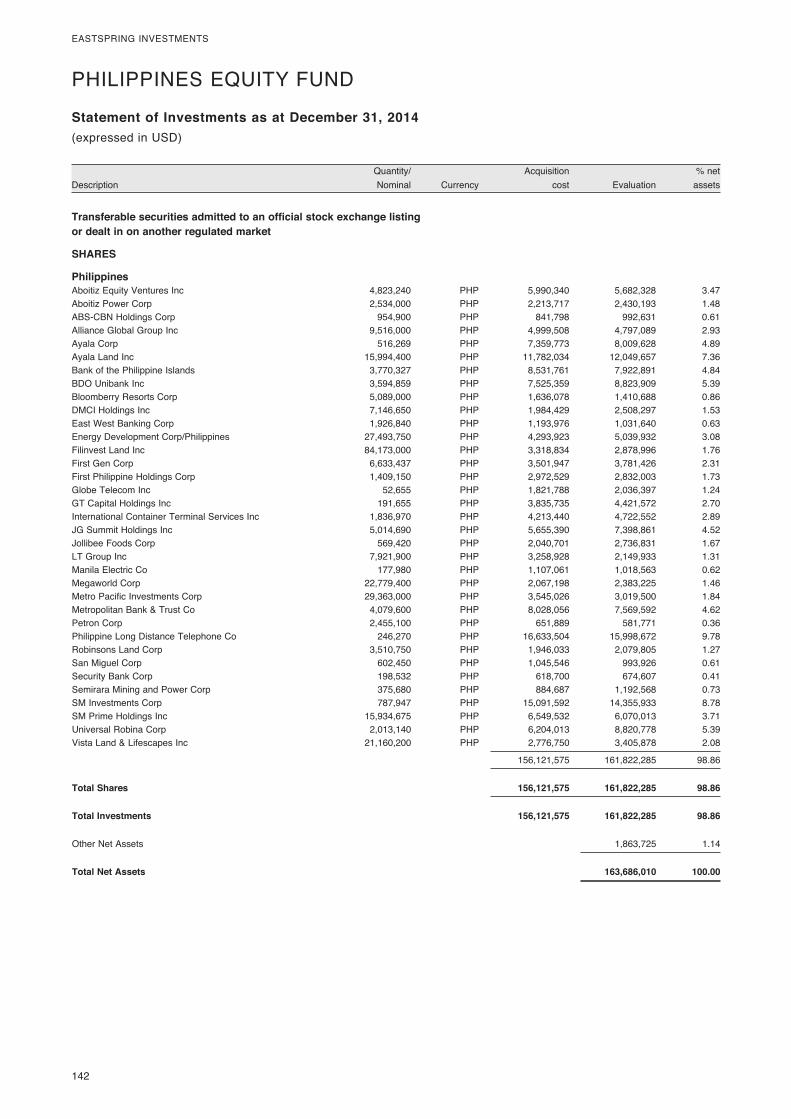
142�
EASTSPRING�INVESTMENTS
� Quantity/�� � Acquisition�� � %�net�Description� Nominal�� Currency�� cost�� Evaluation�� assets�
Statement of Investments as at December 31, 2014(expressed�in�USD)
PHILIPPINES�EQUITY�FUND�
Transferable securities admitted to an official stock exchange listing or dealt in on another regulated market
SHARES
Philippines Aboitiz�Equity�Ventures�Inc� 4,823,240� PHP� 5,990,340� 5,682,328� 3.47Aboitiz�Power�Corp� 2,534,000� PHP� 2,213,717� 2,430,193� 1.48ABS-CBN�Holdings�Corp� 954,900� PHP� 841,798� 992,631� 0.61Alliance�Global�Group�Inc� 9,516,000� PHP� 4,999,508� 4,797,089� 2.93Ayala�Corp� 516,269� PHP� 7,359,773� 8,009,628� 4.89Ayala�Land�Inc� 15,994,400� PHP� 11,782,034� 12,049,657� 7.36Bank�of�the�Philippine�Islands� 3,770,327� PHP� 8,531,761� 7,922,891� 4.84BDO�Unibank�Inc� 3,594,859� PHP� 7,525,359� 8,823,909� 5.39Bloomberry�Resorts�Corp� 5,089,000� PHP� 1,636,078� 1,410,688� 0.86DMCI�Holdings�Inc� 7,146,650� PHP� 1,984,429� 2,508,297� 1.53East�West�Banking�Corp� 1,926,840� PHP� 1,193,976� 1,031,640� 0.63Energy�Development�Corp/Philippines� 27,493,750� PHP� 4,293,923� 5,039,932� 3.08Filinvest�Land�Inc� 84,173,000� PHP� 3,318,834� 2,878,996� 1.76First�Gen�Corp� 6,633,437� PHP� 3,501,947� 3,781,426� 2.31First�Philippine�Holdings�Corp� 1,409,150� PHP� 2,972,529� 2,832,003� 1.73Globe�Telecom�Inc� 52,655� PHP� 1,821,788� 2,036,397� 1.24GT�Capital�Holdings�Inc� 191,655� PHP� 3,835,735� 4,421,572� 2.70International�Container�Terminal�Services�Inc� 1,836,970� PHP� 4,213,440� 4,722,552� 2.89JG�Summit�Holdings�Inc� 5,014,690� PHP� 5,655,390� 7,398,861� 4.52Jollibee�Foods�Corp� 569,420� PHP� 2,040,701� 2,736,831� 1.67LT�Group�Inc� 7,921,900� PHP� 3,258,928� 2,149,933� 1.31Manila�Electric�Co� 177,980� PHP� 1,107,061� 1,018,563� 0.62Megaworld�Corp� 22,779,400� PHP� 2,067,198� 2,383,225� 1.46Metro�Pacific�Investments�Corp� 29,363,000� PHP� 3,545,026� 3,019,500� 1.84Metropolitan�Bank�&�Trust�Co� 4,079,600� PHP� 8,028,056� 7,569,592� 4.62Petron�Corp� 2,455,100� PHP� 651,889� 581,771� 0.36Philippine�Long�Distance�Telephone�Co� 246,270� PHP� 16,633,504� 15,998,672� 9.78Robinsons�Land�Corp� 3,510,750� PHP� 1,946,033� 2,079,805� 1.27San�Miguel�Corp� 602,450� PHP� 1,045,546� 993,926� 0.61Security�Bank�Corp� 198,532� PHP� 618,700� 674,607� 0.41Semirara�Mining�and�Power�Corp� 375,680� PHP� 884,687� 1,192,568� 0.73SM�Investments�Corp� 787,947� PHP� 15,091,592� 14,355,933� 8.78SM�Prime�Holdings�Inc� 15,934,675� PHP� 6,549,532� 6,070,013� 3.71Universal�Robina�Corp� 2,013,140� PHP� 6,204,013� 8,820,778� 5.39Vista�Land�&�Lifescapes�Inc�� 21,160,200� PHP� 2,776,750� 3,405,878� 2.08
� � � 156,121,575� 161,822,285� 98.86
Total Shares 156,121,575 161,822,285 98.86
Total Investments 156,121,575 161,822,285 98.86
Other�Net�Assets� � � � 1,863,725� 1.14
Total Net Assets 163,686,010 100.00
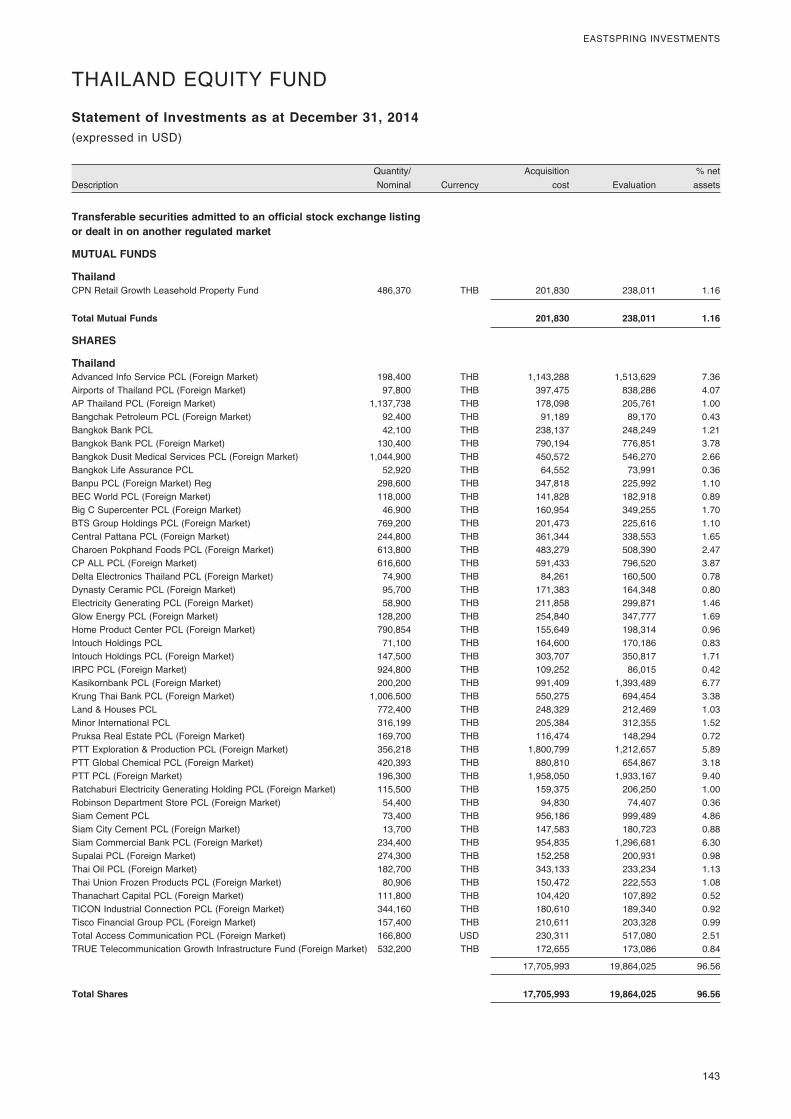
� 143
EASTSPRING�INVESTMENTS
� Quantity/�� � Acquisition�� � %�net�Description� Nominal�� Currency�� cost�� Evaluation�� assets�
Statement of Investments as at December 31, 2014(expressed�in�USD)
THAILAND�EQUITY�FUND�
Transferable securities admitted to an official stock exchange listing or dealt in on another regulated market
MUTUAL FUNDS
Thailand CPN�Retail�Growth�Leasehold�Property�Fund�� 486,370� THB� 201,830� 238,011� 1.16
Total Mutual Funds 201,830 238,011 1.16
SHARES
Thailand Advanced�Info�Service�PCL�(Foreign�Market)� 198,400� THB� 1,143,288� 1,513,629� 7.36Airports�of�Thailand�PCL�(Foreign�Market)� 97,800� THB� 397,475� 838,286� 4.07AP�Thailand�PCL�(Foreign�Market)� 1,137,738� THB� 178,098� 205,761� 1.00Bangchak�Petroleum�PCL�(Foreign�Market)� 92,400� THB� 91,189� 89,170� 0.43Bangkok�Bank�PCL� 42,100� THB� 238,137� 248,249� 1.21Bangkok�Bank�PCL�(Foreign�Market)� 130,400� THB� 790,194� 776,851� 3.78Bangkok�Dusit�Medical�Services�PCL�(Foreign�Market)� 1,044,900� THB� 450,572� 546,270� 2.66Bangkok�Life�Assurance�PCL� 52,920� THB� 64,552� 73,991� 0.36Banpu�PCL�(Foreign�Market)�Reg� 298,600� THB� 347,818� 225,992� 1.10BEC�World�PCL�(Foreign�Market)� 118,000� THB� 141,828� 182,918� 0.89Big�C�Supercenter�PCL�(Foreign�Market)� 46,900� THB� 160,954� 349,255� 1.70BTS�Group�Holdings�PCL�(Foreign�Market)� 769,200� THB� 201,473� 225,616� 1.10Central�Pattana�PCL�(Foreign�Market)� 244,800� THB� 361,344� 338,553� 1.65Charoen�Pokphand�Foods�PCL�(Foreign�Market)� 613,800� THB� 483,279� 508,390� 2.47CP�ALL�PCL�(Foreign�Market)� 616,600� THB� 591,433� 796,520� 3.87Delta�Electronics�Thailand�PCL�(Foreign�Market)� 74,900� THB� 84,261� 160,500� 0.78Dynasty�Ceramic�PCL�(Foreign�Market)� 95,700� THB� 171,383� 164,348� 0.80Electricity�Generating�PCL�(Foreign�Market)� 58,900� THB� 211,858� 299,871� 1.46Glow�Energy�PCL�(Foreign�Market)� 128,200� THB� 254,840� 347,777� 1.69Home�Product�Center�PCL�(Foreign�Market)� 790,854� THB� 155,649� 198,314� 0.96Intouch�Holdings�PCL� 71,100� THB� 164,600� 170,186� 0.83Intouch�Holdings�PCL�(Foreign�Market)� 147,500� THB� 303,707� 350,817� 1.71IRPC�PCL�(Foreign�Market)� 924,800� THB� 109,252� 86,015� 0.42Kasikornbank�PCL�(Foreign�Market)� 200,200� THB� 991,409� 1,393,489� 6.77Krung�Thai�Bank�PCL�(Foreign�Market)� 1,006,500� THB� 550,275� 694,454� 3.38Land�&�Houses�PCL� 772,400� THB� 248,329� 212,469� 1.03Minor�International�PCL� 316,199� THB� 205,384� 312,355� 1.52Pruksa�Real�Estate�PCL�(Foreign�Market)� 169,700� THB� 116,474� 148,294� 0.72PTT�Exploration�&�Production�PCL�(Foreign�Market)� 356,218� THB� 1,800,799� 1,212,657� 5.89PTT�Global�Chemical�PCL�(Foreign�Market)� 420,393� THB� 880,810� 654,867� 3.18PTT�PCL�(Foreign�Market)� 196,300� THB� 1,958,050� 1,933,167� 9.40Ratchaburi�Electricity�Generating�Holding�PCL�(Foreign�Market)� 115,500� THB� 159,375� 206,250� 1.00Robinson�Department�Store�PCL�(Foreign�Market)� 54,400� THB� 94,830� 74,407� 0.36Siam�Cement�PCL� 73,400� THB� 956,186� 999,489� 4.86Siam�City�Cement�PCL�(Foreign�Market)� 13,700� THB� 147,583� 180,723� 0.88Siam�Commercial�Bank�PCL�(Foreign�Market)� 234,400� THB� 954,835� 1,296,681� 6.30Supalai�PCL�(Foreign�Market)� 274,300� THB� 152,258� 200,931� 0.98Thai�Oil�PCL�(Foreign�Market)� 182,700� THB� 343,133� 233,234� 1.13Thai�Union�Frozen�Products�PCL�(Foreign�Market)� 80,906� THB� 150,472� 222,553� 1.08Thanachart�Capital�PCL�(Foreign�Market)� 111,800� THB� 104,420� 107,892� 0.52TICON�Industrial�Connection�PCL�(Foreign�Market)� 344,160� THB� 180,610� 189,340� 0.92Tisco�Financial�Group�PCL�(Foreign�Market)� 157,400� THB� 210,611� 203,328� 0.99Total�Access�Communication�PCL�(Foreign�Market)� 166,800� USD� 230,311� 517,080� 2.51TRUE�Telecommunication�Growth�Infrastructure�Fund�(Foreign�Market)�� 532,200� THB� 172,655� 173,086� 0.84
� � � 17,705,993� 19,864,025� 96.56
Total Shares 17,705,993 19,864,025 96.56
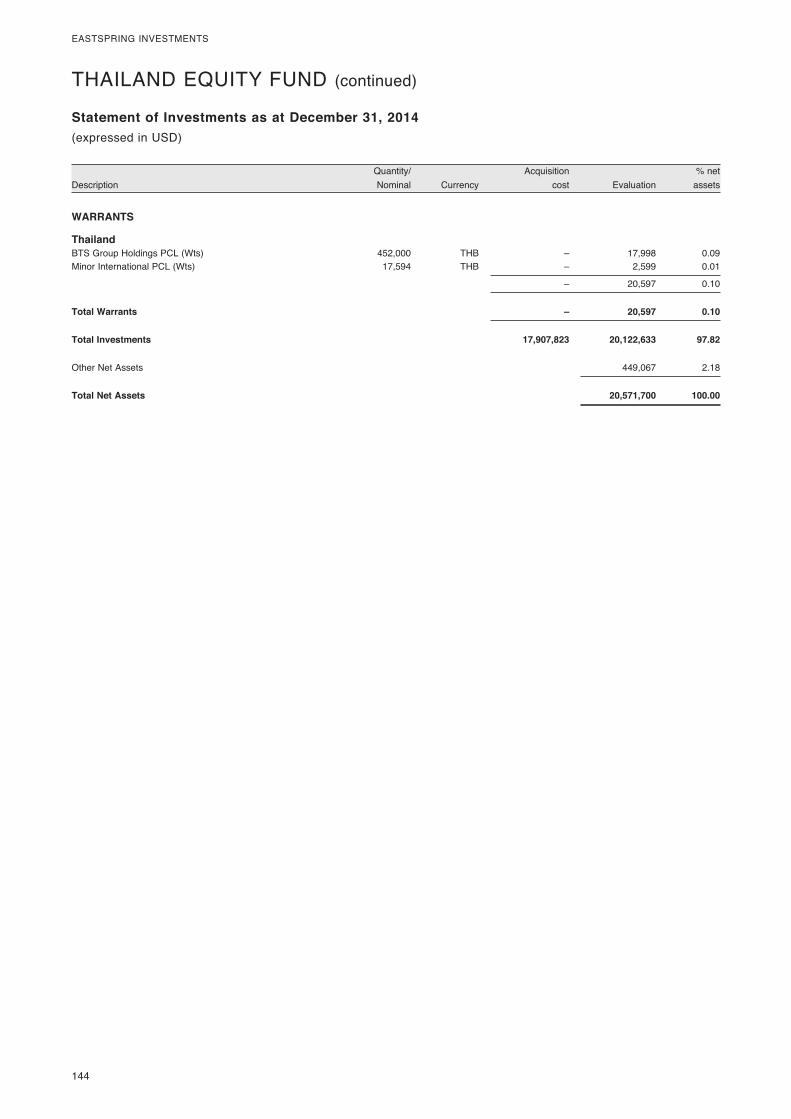
144�
EASTSPRING�INVESTMENTS
� Quantity/�� � Acquisition�� � %�net�Description� Nominal�� Currency�� cost�� Evaluation�� assets�
Statement of Investments as at December 31, 2014(expressed�in�USD)
WARRANTS
Thailand BTS�Group�Holdings�PCL�(Wts)� 452,000� THB� –� 17,998� 0.09Minor�International�PCL�(Wts)�� 17,594� THB� –� 2,599� 0.01
� � � –� 20,597� 0.10
Total Warrants – 20,597 0.10
Total Investments 17,907,823 20,122,633 97.82
Other�Net�Assets� � � � 449,067� 2.18
Total Net Assets 20,571,700 100.00
THAILAND�EQUITY�FUND�(continued)
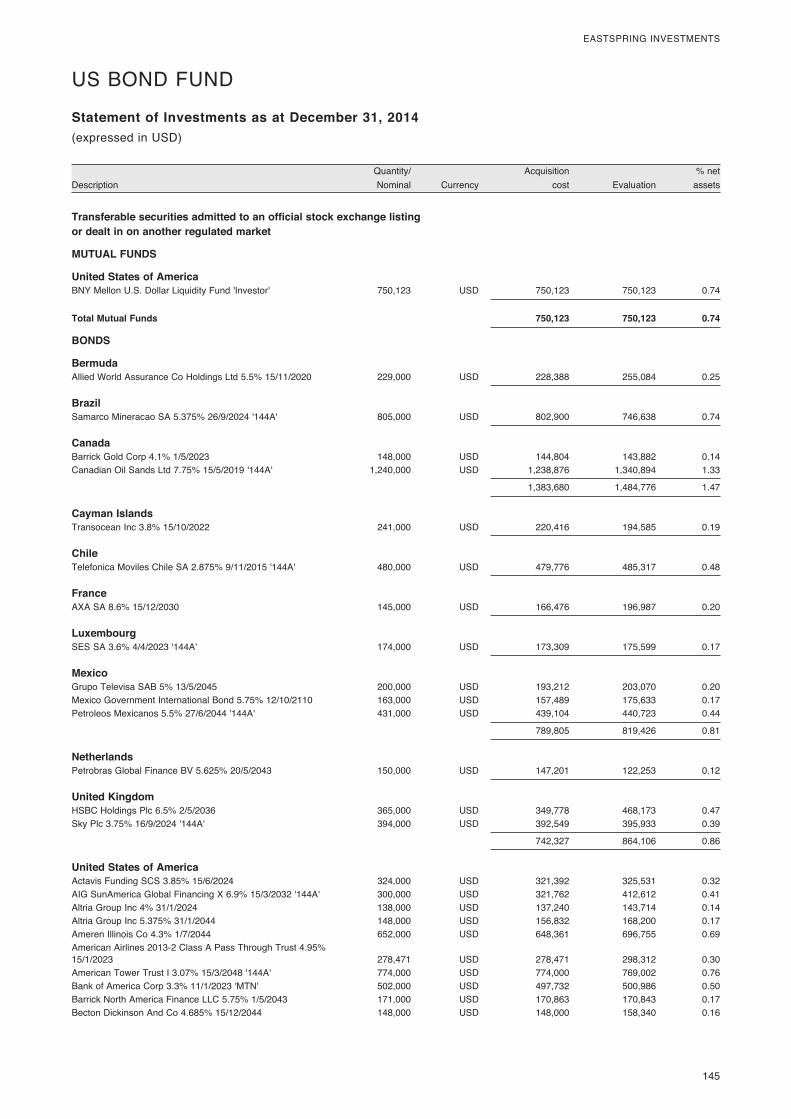
� 145
EASTSPRING�INVESTMENTS
� Quantity/�� � Acquisition�� � %�net�Description� Nominal�� Currency�� cost�� Evaluation�� assets�
Statement of Investments as at December 31, 2014(expressed�in�USD)
Transferable securities admitted to an official stock exchange listing or dealt in on another regulated market
MUTUAL FUNDS
United States of America BNY�Mellon�U.S.�Dollar�Liquidity�Fund�'Investor'�� 750,123� USD� 750,123� 750,123� 0.74
Total Mutual Funds 750,123 750,123 0.74
BONDS
Bermuda Allied�World�Assurance�Co�Holdings�Ltd�5.5%�15/11/2020�� 229,000� USD� 228,388� 255,084� 0.25
Brazil Samarco�Mineracao�SA�5.375%�26/9/2024�'144A'� 805,000� USD� 802,900� 746,638� 0.74
Canada Barrick�Gold�Corp�4.1%�1/5/2023�� 148,000� USD� 144,804� 143,882� 0.14Canadian�Oil�Sands�Ltd�7.75%�15/5/2019�'144A'� 1,240,000� USD� 1,238,876� 1,340,894� 1.33
� � � 1,383,680� 1,484,776� 1.47
Cayman Islands Transocean�Inc�3.8%�15/10/2022�� 241,000� USD� 220,416� 194,585� 0.19
Chile Telefonica�Moviles�Chile�SA�2.875%�9/11/2015�'144A'� 480,000� USD� 479,776� 485,317� 0.48
France AXA�SA�8.6%�15/12/2030�� 145,000� USD� 166,476� 196,987� 0.20
Luxembourg SES�SA�3.6%�4/4/2023�'144A'� 174,000� USD� 173,309� 175,599� 0.17
Mexico Grupo�Televisa�SAB�5%�13/5/2045�� 200,000� USD� 193,212� 203,070� 0.20Mexico�Government�International�Bond�5.75%�12/10/2110�� 163,000� USD� 157,489� 175,633� 0.17Petroleos�Mexicanos�5.5%�27/6/2044�'144A'� 431,000� USD� 439,104� 440,723� 0.44
� � � 789,805� 819,426� 0.81
Netherlands Petrobras�Global�Finance�BV�5.625%�20/5/2043�� 150,000� USD� 147,201� 122,253� 0.12
United Kingdom HSBC�Holdings�Plc�6.5%�2/5/2036�� 365,000� USD� 349,778� 468,173� 0.47Sky�Plc�3.75%�16/9/2024�'144A'� 394,000� USD� 392,549� 395,933� 0.39
� � � 742,327� 864,106� 0.86
United States of America Actavis�Funding�SCS�3.85%�15/6/2024�� 324,000� USD� 321,392� 325,531� 0.32AIG�SunAmerica�Global�Financing�X�6.9%�15/3/2032�'144A'� 300,000� USD� 321,762� 412,612� 0.41Altria�Group�Inc�4%�31/1/2024�� 138,000� USD� 137,240� 143,714� 0.14Altria�Group�Inc�5.375%�31/1/2044�� 148,000� USD� 156,832� 168,200� 0.17Ameren�Illinois�Co�4.3%�1/7/2044�� 652,000� USD� 648,361� 696,755� 0.69American�Airlines�2013-2�Class�A�Pass�Through�Trust�4.95%��15/1/2023�� 278,471� USD� 278,471� 298,312� 0.30American�Tower�Trust�I�3.07%�15/3/2048�'144A'� 774,000� USD� 774,000� 769,002� 0.76Bank�of�America�Corp�3.3%�11/1/2023�'MTN'� 502,000� USD� 497,732� 500,986� 0.50Barrick�North�America�Finance�LLC�5.75%�1/5/2043�� 171,000� USD� 170,863� 170,843� 0.17Becton�Dickinson�And�Co�4.685%�15/12/2044�� 148,000� USD� 148,000� 158,340� 0.16
US�BOND�FUND�
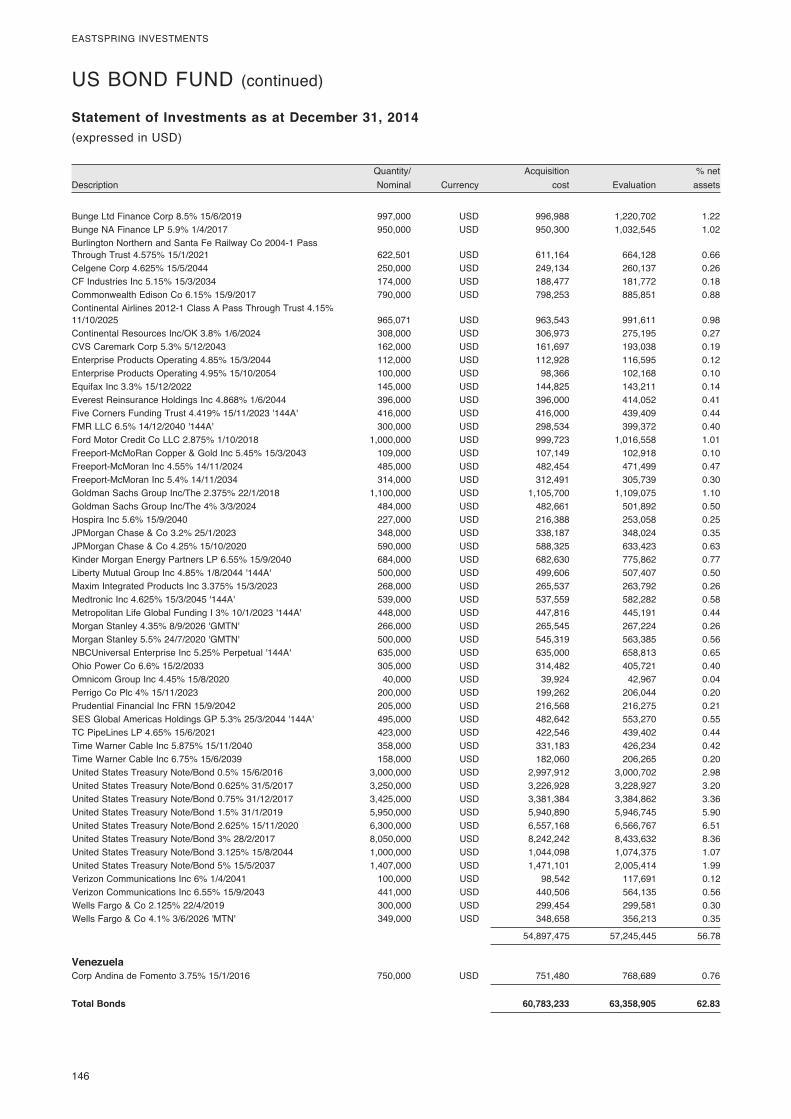
146�
EASTSPRING�INVESTMENTS
� Quantity/�� � Acquisition�� � %�net�Description� Nominal�� Currency�� cost�� Evaluation�� assets�
Statement of Investments as at December 31, 2014(expressed�in�USD)
US�BOND�FUND�(continued)
Bunge�Ltd�Finance�Corp�8.5%�15/6/2019�� 997,000� USD� 996,988� 1,220,702� 1.22Bunge�NA�Finance�LP�5.9%�1/4/2017�� 950,000� USD� 950,300� 1,032,545� 1.02Burlington�Northern�and�Santa�Fe�Railway�Co�2004-1�Pass��Through�Trust�4.575%�15/1/2021�� 622,501� USD� 611,164� 664,128� 0.66Celgene�Corp�4.625%�15/5/2044�� 250,000� USD� 249,134� 260,137� 0.26CF�Industries�Inc�5.15%�15/3/2034�� 174,000� USD� 188,477� 181,772� 0.18Commonwealth�Edison�Co�6.15%�15/9/2017�� 790,000� USD� 798,253� 885,851� 0.88Continental�Airlines�2012-1�Class�A�Pass�Through�Trust�4.15%��11/10/2025�� 965,071� USD� 963,543� 991,611� 0.98Continental�Resources�Inc/OK�3.8%�1/6/2024�� 308,000� USD� 306,973� 275,195� 0.27CVS�Caremark�Corp�5.3%�5/12/2043�� 162,000� USD� 161,697� 193,038� 0.19Enterprise�Products�Operating�4.85%�15/3/2044�� 112,000� USD� 112,928� 116,595� 0.12Enterprise�Products�Operating�4.95%�15/10/2054�� 100,000� USD� 98,366� 102,168� 0.10Equifax�Inc�3.3%�15/12/2022�� 145,000� USD� 144,825� 143,211� 0.14Everest�Reinsurance�Holdings�Inc�4.868%�1/6/2044�� 396,000� USD� 396,000� 414,052� 0.41Five�Corners�Funding�Trust�4.419%�15/11/2023�'144A'� 416,000� USD� 416,000� 439,409� 0.44FMR�LLC�6.5%�14/12/2040�'144A'� 300,000� USD� 298,534� 399,372� 0.40Ford�Motor�Credit�Co�LLC�2.875%�1/10/2018�� 1,000,000� USD� 999,723� 1,016,558� 1.01Freeport-McMoRan�Copper�&�Gold�Inc�5.45%�15/3/2043�� 109,000� USD� 107,149� 102,918� 0.10Freeport-McMoran�Inc�4.55%�14/11/2024�� 485,000� USD� 482,454� 471,499� 0.47Freeport-McMoran�Inc�5.4%�14/11/2034�� 314,000� USD� 312,491� 305,739� 0.30Goldman�Sachs�Group�Inc/The�2.375%�22/1/2018�� 1,100,000� USD� 1,105,700� 1,109,075� 1.10Goldman�Sachs�Group�Inc/The�4%�3/3/2024�� 484,000� USD� 482,661� 501,892� 0.50Hospira�Inc�5.6%�15/9/2040�� 227,000� USD� 216,388� 253,058� 0.25JPMorgan�Chase�&�Co�3.2%�25/1/2023�� 348,000� USD� 338,187� 348,024� 0.35JPMorgan�Chase�&�Co�4.25%�15/10/2020�� 590,000� USD� 588,325� 633,423� 0.63Kinder�Morgan�Energy�Partners�LP�6.55%�15/9/2040�� 684,000� USD� 682,630� 775,862� 0.77Liberty�Mutual�Group�Inc�4.85%�1/8/2044�'144A'� 500,000� USD� 499,606� 507,407� 0.50Maxim�Integrated�Products�Inc�3.375%�15/3/2023�� 268,000� USD� 265,537� 263,792� 0.26Medtronic�Inc�4.625%�15/3/2045�'144A'� 539,000� USD� 537,559� 582,282� 0.58Metropolitan�Life�Global�Funding�I�3%�10/1/2023�'144A'� 448,000� USD� 447,816� 445,191� 0.44Morgan�Stanley�4.35%�8/9/2026�'GMTN'� 266,000� USD� 265,545� 267,224� 0.26Morgan�Stanley�5.5%�24/7/2020�'GMTN'� 500,000� USD� 545,319� 563,385� 0.56NBCUniversal�Enterprise�Inc�5.25%�Perpetual�'144A'� 635,000� USD� 635,000� 658,813� 0.65Ohio�Power�Co�6.6%�15/2/2033�� 305,000� USD� 314,482� 405,721� 0.40Omnicom�Group�Inc�4.45%�15/8/2020�� 40,000� USD� 39,924� 42,967� 0.04Perrigo�Co�Plc�4%�15/11/2023�� 200,000� USD� 199,262� 206,044� 0.20Prudential�Financial�Inc�FRN�15/9/2042�� 205,000� USD� 216,568� 216,275� 0.21SES�Global�Americas�Holdings�GP�5.3%�25/3/2044�'144A'� 495,000� USD� 482,642� 553,270� 0.55TC�PipeLines�LP�4.65%�15/6/2021�� 423,000� USD� 422,546� 439,402� 0.44Time�Warner�Cable�Inc�5.875%�15/11/2040�� 358,000� USD� 331,183� 426,234� 0.42Time�Warner�Cable�Inc�6.75%�15/6/2039�� 158,000� USD� 182,060� 206,265� 0.20United�States�Treasury�Note/Bond�0.5%�15/6/2016�� 3,000,000� USD� 2,997,912� 3,000,702� 2.98United�States�Treasury�Note/Bond�0.625%�31/5/2017�� 3,250,000� USD� 3,226,928� 3,228,927� 3.20United�States�Treasury�Note/Bond�0.75%�31/12/2017�� 3,425,000� USD� 3,381,384� 3,384,862� 3.36United�States�Treasury�Note/Bond�1.5%�31/1/2019�� 5,950,000� USD� 5,940,890� 5,946,745� 5.90United�States�Treasury�Note/Bond�2.625%�15/11/2020�� 6,300,000� USD� 6,557,168� 6,566,767� 6.51United�States�Treasury�Note/Bond�3%�28/2/2017�� 8,050,000� USD� 8,242,242� 8,433,632� 8.36United�States�Treasury�Note/Bond�3.125%�15/8/2044�� 1,000,000� USD� 1,044,098� 1,074,375� 1.07United�States�Treasury�Note/Bond�5%�15/5/2037�� 1,407,000� USD� 1,471,101� 2,005,414� 1.99Verizon�Communications�Inc�6%�1/4/2041�� 100,000� USD� 98,542� 117,691� 0.12Verizon�Communications�Inc�6.55%�15/9/2043�� 441,000� USD� 440,506� 564,135� 0.56Wells�Fargo�&�Co�2.125%�22/4/2019�� 300,000� USD� 299,454� 299,581� 0.30Wells�Fargo�&�Co�4.1%�3/6/2026�'MTN'� 349,000� USD� 348,658� 356,213� 0.35
� � � 54,897,475� 57,245,445� 56.78
Venezuela Corp�Andina�de�Fomento�3.75%�15/1/2016�� 750,000� USD� 751,480� 768,689� 0.76
Total Bonds 60,783,233 63,358,905 62.83
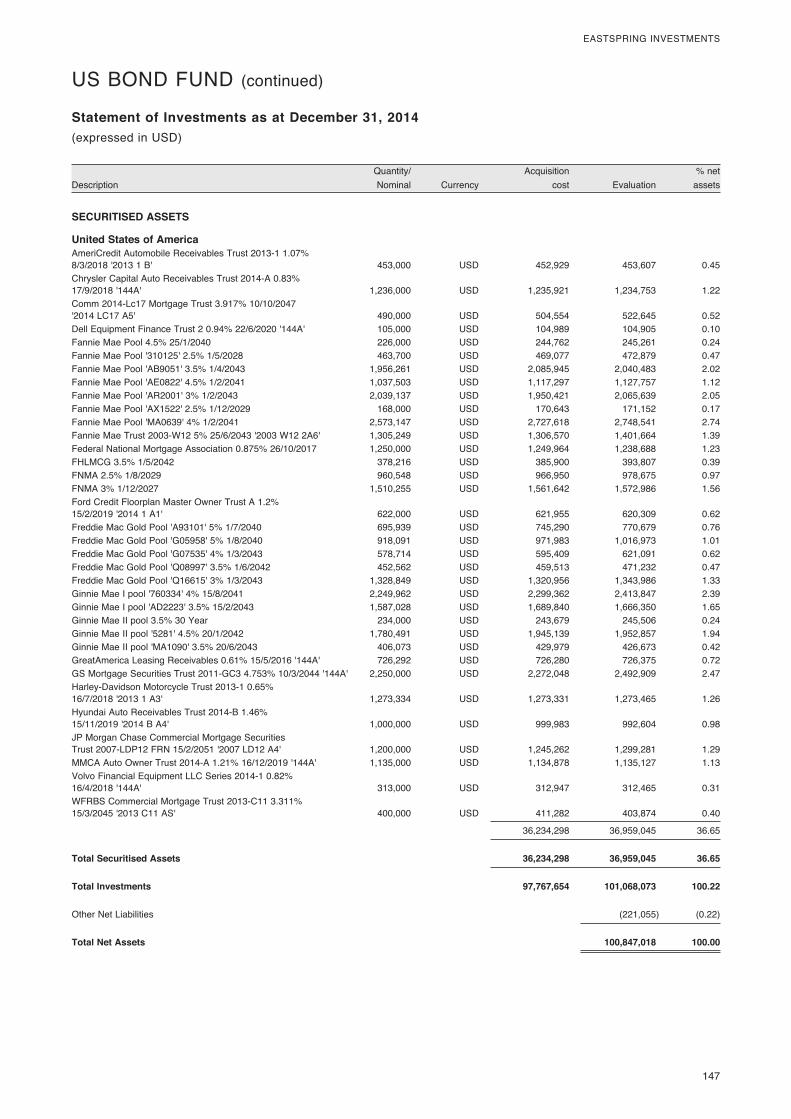
� 147
EASTSPRING�INVESTMENTS
� Quantity/�� � Acquisition�� � %�net�Description� Nominal�� Currency�� cost�� Evaluation�� assets�
Statement of Investments as at December 31, 2014(expressed�in�USD)
US�BOND�FUND�(continued)
SECURITISED ASSETS
United States of America AmeriCredit�Automobile�Receivables�Trust�2013-1�1.07%��8/3/2018�'2013�1�B'� 453,000� USD� 452,929� 453,607� 0.45Chrysler�Capital�Auto�Receivables�Trust�2014-A�0.83%��17/9/2018�'144A'� 1,236,000� USD� 1,235,921� 1,234,753� 1.22Comm�2014-Lc17�Mortgage�Trust�3.917%�10/10/2047��'2014�LC17�A5'� 490,000� USD� 504,554� 522,645� 0.52Dell�Equipment�Finance�Trust�2�0.94%�22/6/2020�'144A'� 105,000� USD� 104,989� 104,905� 0.10Fannie�Mae�Pool�4.5%�25/1/2040�� 226,000� USD� 244,762� 245,261� 0.24Fannie�Mae�Pool�'310125'�2.5%�1/5/2028�� 463,700� USD� 469,077� 472,879� 0.47Fannie�Mae�Pool�'AB9051'�3.5%�1/4/2043�� 1,956,261� USD� 2,085,945� 2,040,483� 2.02Fannie�Mae�Pool�'AE0822'�4.5%�1/2/2041�� 1,037,503� USD� 1,117,297� 1,127,757� 1.12Fannie�Mae�Pool�'AR2001'�3%�1/2/2043�� 2,039,137� USD� 1,950,421� 2,065,639� 2.05Fannie�Mae�Pool�'AX1522'�2.5%�1/12/2029�� 168,000� USD� 170,643� 171,152� 0.17Fannie�Mae�Pool�'MA0639'�4%�1/2/2041�� 2,573,147� USD� 2,727,618� 2,748,541� 2.74Fannie�Mae�Trust�2003-W12�5%�25/6/2043�'2003�W12�2A6'� 1,305,249� USD� 1,306,570� 1,401,664� 1.39Federal�National�Mortgage�Association�0.875%�26/10/2017�� 1,250,000� USD� 1,249,964� 1,238,688� 1.23FHLMCG�3.5%�1/5/2042�� 378,216� USD� 385,900� 393,807� 0.39FNMA�2.5%�1/8/2029�� 960,548� USD� 966,950� 978,675� 0.97FNMA�3%�1/12/2027�� 1,510,255� USD� 1,561,642� 1,572,986� 1.56Ford�Credit�Floorplan�Master�Owner�Trust�A�1.2%��15/2/2019�'2014�1�A1'� 622,000� USD� 621,955� 620,309� 0.62Freddie�Mac�Gold�Pool�'A93101'�5%�1/7/2040�� 695,939� USD� 745,290� 770,679� 0.76Freddie�Mac�Gold�Pool�'G05958'�5%�1/8/2040�� 918,091� USD� 971,983� 1,016,973� 1.01Freddie�Mac�Gold�Pool�'G07535'�4%�1/3/2043�� 578,714� USD� 595,409� 621,091� 0.62Freddie�Mac�Gold�Pool�'Q08997'�3.5%�1/6/2042�� 452,562� USD� 459,513� 471,232� 0.47Freddie�Mac�Gold�Pool�'Q16615'�3%�1/3/2043�� 1,328,849� USD� 1,320,956� 1,343,986� 1.33Ginnie�Mae�I�pool�'760334'�4%�15/8/2041�� 2,249,962� USD� 2,299,362� 2,413,847� 2.39Ginnie�Mae�I�pool�'AD2223'�3.5%�15/2/2043�� 1,587,028� USD� 1,689,840� 1,666,350� 1.65Ginnie�Mae�II�pool�3.5%�30�Year� 234,000� USD� 243,679� 245,506� 0.24Ginnie�Mae�II�pool�'5281'�4.5%�20/1/2042�� 1,780,491� USD� 1,945,139� 1,952,857� 1.94Ginnie�Mae�II�pool�'MA1090'�3.5%�20/6/2043�� 406,073� USD� 429,979� 426,673� 0.42GreatAmerica�Leasing�Receivables�0.61%�15/5/2016�'144A'� 726,292� USD� 726,280� 726,375� 0.72GS�Mortgage�Securities�Trust�2011-GC3�4.753%�10/3/2044�'144A'� 2,250,000� USD� 2,272,048� 2,492,909� 2.47Harley-Davidson�Motorcycle�Trust�2013-1�0.65%��16/7/2018�'2013�1�A3'� 1,273,334� USD� 1,273,331� 1,273,465� 1.26Hyundai�Auto�Receivables�Trust�2014-B�1.46%��15/11/2019�'2014�B�A4'� 1,000,000� USD� 999,983� 992,604� 0.98JP�Morgan�Chase�Commercial�Mortgage�Securities��Trust�2007-LDP12�FRN�15/2/2051�'2007�LD12�A4'� 1,200,000� USD� 1,245,262� 1,299,281� 1.29MMCA�Auto�Owner�Trust�2014-A�1.21%�16/12/2019�'144A'� 1,135,000� USD� 1,134,878� 1,135,127� 1.13Volvo�Financial�Equipment�LLC�Series�2014-1�0.82%��16/4/2018�'144A'� 313,000� USD� 312,947� 312,465� 0.31WFRBS�Commercial�Mortgage�Trust�2013-C11�3.311%��15/3/2045�'2013�C11�AS'� 400,000� USD� 411,282� 403,874� 0.40
� � � 36,234,298� 36,959,045� 36.65
Total Securitised Assets 36,234,298 36,959,045 36.65
Total Investments 97,767,654 101,068,073 100.22
Other�Net�Liabilities� � � � (221,055)� (0.22)
Total Net Assets 100,847,018 100.00
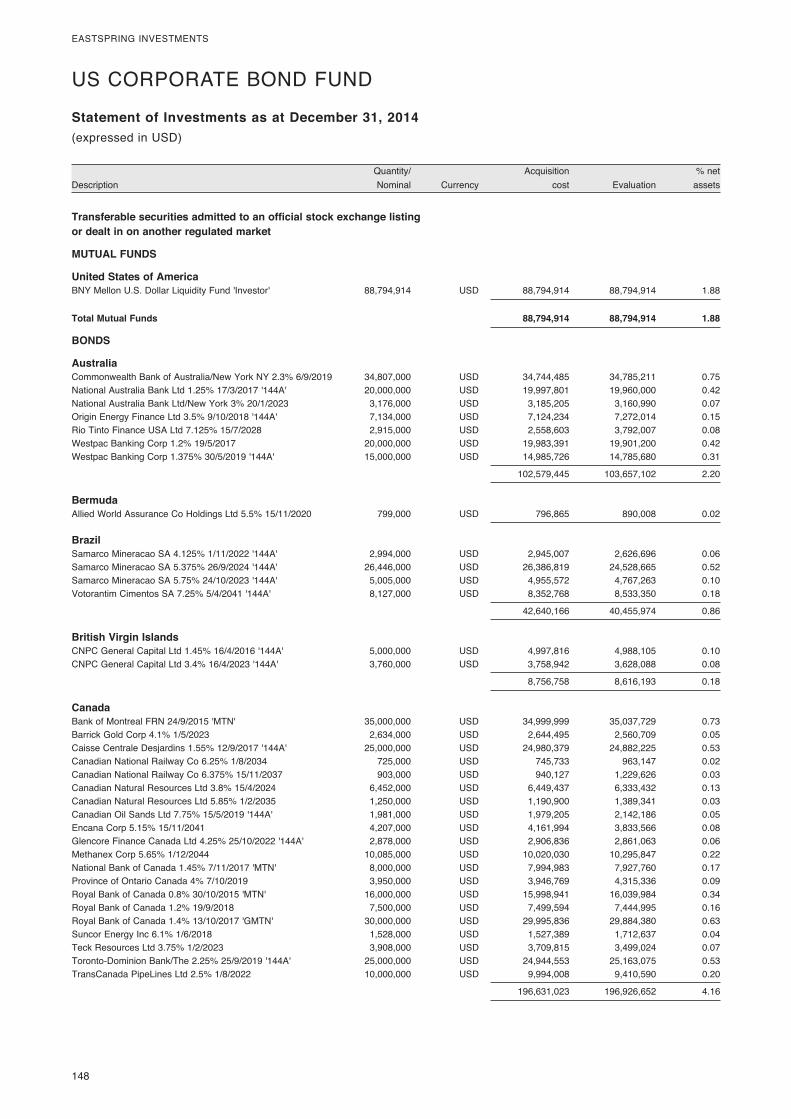
148�
EASTSPRING�INVESTMENTS
� Quantity/�� � Acquisition�� � %�net�Description� Nominal�� Currency�� cost�� Evaluation�� assets�
Statement of Investments as at December 31, 2014(expressed�in�USD)
US�CORPORATE�BOND�FUND�
Transferable securities admitted to an official stock exchange listing or dealt in on another regulated market
MUTUAL FUNDS
United States of America BNY�Mellon�U.S.�Dollar�Liquidity�Fund�'Investor'�� 88,794,914� USD� 88,794,914� 88,794,914� 1.88
Total Mutual Funds 88,794,914 88,794,914 1.88
BONDS
Australia Commonwealth�Bank�of�Australia/New�York�NY�2.3%�6/9/2019�� 34,807,000� USD� 34,744,485� 34,785,211� 0.75National�Australia�Bank�Ltd�1.25%�17/3/2017�'144A'� 20,000,000� USD� 19,997,801� 19,960,000� 0.42National�Australia�Bank�Ltd/New�York�3%�20/1/2023�� 3,176,000� USD� 3,185,205� 3,160,990� 0.07Origin�Energy�Finance�Ltd�3.5%�9/10/2018�'144A'� 7,134,000� USD� 7,124,234� 7,272,014� 0.15Rio�Tinto�Finance�USA�Ltd�7.125%�15/7/2028�� 2,915,000� USD� 2,558,603� 3,792,007� 0.08Westpac�Banking�Corp�1.2%�19/5/2017�� 20,000,000� USD� 19,983,391� 19,901,200� 0.42Westpac�Banking�Corp�1.375%�30/5/2019�'144A'� 15,000,000� USD� 14,985,726� 14,785,680� 0.31
� � � 102,579,445� 103,657,102� 2.20
Bermuda Allied�World�Assurance�Co�Holdings�Ltd�5.5%�15/11/2020�� 799,000� USD� 796,865� 890,008� 0.02
Brazil Samarco�Mineracao�SA�4.125%�1/11/2022�'144A'� 2,994,000� USD� 2,945,007� 2,626,696� 0.06Samarco�Mineracao�SA�5.375%�26/9/2024�'144A'� 26,446,000� USD� 26,386,819� 24,528,665� 0.52Samarco�Mineracao�SA�5.75%�24/10/2023�'144A'� 5,005,000� USD� 4,955,572� 4,767,263� 0.10Votorantim�Cimentos�SA�7.25%�5/4/2041�'144A'� 8,127,000� USD� 8,352,768� 8,533,350� 0.18
� � � 42,640,166� 40,455,974� 0.86
British Virgin Islands CNPC�General�Capital�Ltd�1.45%�16/4/2016�'144A'� 5,000,000� USD� 4,997,816� 4,988,105� 0.10CNPC�General�Capital�Ltd�3.4%�16/4/2023�'144A'� 3,760,000� USD� 3,758,942� 3,628,088� 0.08
� � � 8,756,758� 8,616,193� 0.18
Canada Bank�of�Montreal�FRN�24/9/2015�'MTN'� 35,000,000� USD� 34,999,999� 35,037,729� 0.73Barrick�Gold�Corp�4.1%�1/5/2023�� 2,634,000� USD� 2,644,495� 2,560,709� 0.05Caisse�Centrale�Desjardins�1.55%�12/9/2017�'144A'� 25,000,000� USD� 24,980,379� 24,882,225� 0.53Canadian�National�Railway�Co�6.25%�1/8/2034�� 725,000� USD� 745,733� 963,147� 0.02Canadian�National�Railway�Co�6.375%�15/11/2037�� 903,000� USD� 940,127� 1,229,626� 0.03Canadian�Natural�Resources�Ltd�3.8%�15/4/2024�� 6,452,000� USD� 6,449,437� 6,333,432� 0.13Canadian�Natural�Resources�Ltd�5.85%�1/2/2035�� 1,250,000� USD� 1,190,900� 1,389,341� 0.03Canadian�Oil�Sands�Ltd�7.75%�15/5/2019�'144A'� 1,981,000� USD� 1,979,205� 2,142,186� 0.05Encana�Corp�5.15%�15/11/2041�� 4,207,000� USD� 4,161,994� 3,833,566� 0.08Glencore�Finance�Canada�Ltd�4.25%�25/10/2022�'144A'� 2,878,000� USD� 2,906,836� 2,861,063� 0.06Methanex�Corp�5.65%�1/12/2044�� 10,085,000� USD� 10,020,030� 10,295,847� 0.22National�Bank�of�Canada�1.45%�7/11/2017�'MTN'� 8,000,000� USD� 7,994,983� 7,927,760� 0.17Province�of�Ontario�Canada�4%�7/10/2019�� 3,950,000� USD� 3,946,769� 4,315,336� 0.09Royal�Bank�of�Canada�0.8%�30/10/2015�'MTN'� 16,000,000� USD� 15,998,941� 16,039,984� 0.34Royal�Bank�of�Canada�1.2%�19/9/2018�� 7,500,000� USD� 7,499,594� 7,444,995� 0.16Royal�Bank�of�Canada�1.4%�13/10/2017�'GMTN'� 30,000,000� USD� 29,995,836� 29,884,380� 0.63Suncor�Energy�Inc�6.1%�1/6/2018�� 1,528,000� USD� 1,527,389� 1,712,637� 0.04Teck�Resources�Ltd�3.75%�1/2/2023�� 3,908,000� USD� 3,709,815� 3,499,024� 0.07Toronto-Dominion�Bank/The�2.25%�25/9/2019�'144A'� 25,000,000� USD� 24,944,553� 25,163,075� 0.53TransCanada�PipeLines�Ltd�2.5%�1/8/2022�� 10,000,000� USD� 9,994,008� 9,410,590� 0.20
� � � 196,631,023� 196,926,652� 4.16
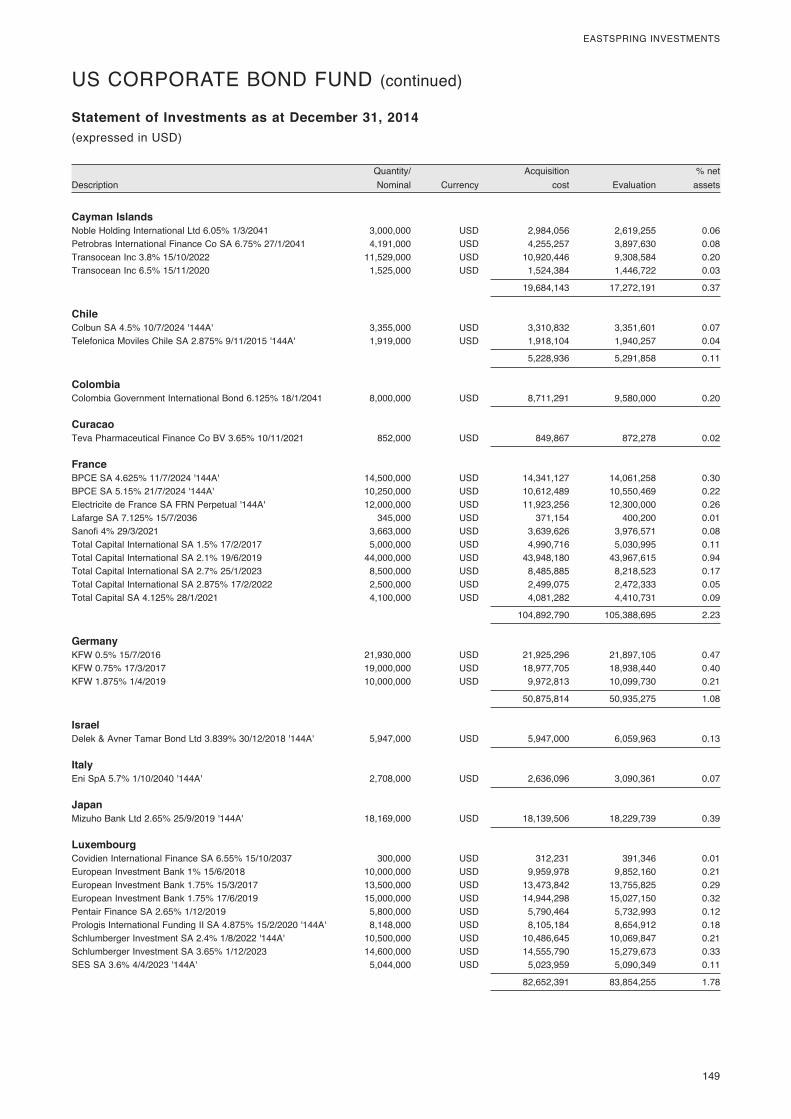
� 149
EASTSPRING�INVESTMENTS
� Quantity/�� � Acquisition�� � %�net�Description� Nominal�� Currency�� cost�� Evaluation�� assets�
Statement of Investments as at December 31, 2014(expressed�in�USD)
US�CORPORATE�BOND�FUND�(continued)
Cayman Islands Noble�Holding�International�Ltd�6.05%�1/3/2041�� 3,000,000� USD� 2,984,056� 2,619,255� 0.06Petrobras�International�Finance�Co�SA�6.75%�27/1/2041�� 4,191,000� USD� 4,255,257� 3,897,630� 0.08Transocean�Inc�3.8%�15/10/2022�� 11,529,000� USD� 10,920,446� 9,308,584� 0.20Transocean�Inc�6.5%�15/11/2020�� 1,525,000� USD� 1,524,384� 1,446,722� 0.03
� � � 19,684,143� 17,272,191� 0.37
Chile Colbun�SA�4.5%�10/7/2024�'144A'� 3,355,000� USD� 3,310,832� 3,351,601� 0.07Telefonica�Moviles�Chile�SA�2.875%�9/11/2015�'144A'� 1,919,000� USD� 1,918,104� 1,940,257� 0.04
� � � 5,228,936� 5,291,858� 0.11
Colombia Colombia�Government�International�Bond�6.125%�18/1/2041�� 8,000,000� USD� 8,711,291� 9,580,000� 0.20
Curacao Teva�Pharmaceutical�Finance�Co�BV�3.65%�10/11/2021�� 852,000� USD� 849,867� 872,278� 0.02
France BPCE�SA�4.625%�11/7/2024�'144A'� 14,500,000� USD� 14,341,127� 14,061,258� 0.30BPCE�SA�5.15%�21/7/2024�'144A'� 10,250,000� USD� 10,612,489� 10,550,469� 0.22Electricite�de�France�SA�FRN�Perpetual�'144A'� 12,000,000� USD� 11,923,256� 12,300,000� 0.26Lafarge�SA�7.125%�15/7/2036�� 345,000� USD� 371,154� 400,200� 0.01Sanofi�4%�29/3/2021�� 3,663,000� USD� 3,639,626� 3,976,571� 0.08Total�Capital�International�SA�1.5%�17/2/2017�� 5,000,000� USD� 4,990,716� 5,030,995� 0.11Total�Capital�International�SA�2.1%�19/6/2019�� 44,000,000� USD� 43,948,180� 43,967,615� 0.94Total�Capital�International�SA�2.7%�25/1/2023�� 8,500,000� USD� 8,485,885� 8,218,523� 0.17Total�Capital�International�SA�2.875%�17/2/2022�� 2,500,000� USD� 2,499,075� 2,472,333� 0.05Total�Capital�SA�4.125%�28/1/2021�� 4,100,000� USD� 4,081,282� 4,410,731� 0.09
� � � 104,892,790� 105,388,695� 2.23
Germany KFW�0.5%�15/7/2016�� 21,930,000� USD� 21,925,296� 21,897,105� 0.47KFW�0.75%�17/3/2017�� 19,000,000� USD� 18,977,705� 18,938,440� 0.40KFW�1.875%�1/4/2019�� 10,000,000� USD� 9,972,813� 10,099,730� 0.21
� � � 50,875,814� 50,935,275� 1.08
Israel Delek�&�Avner�Tamar�Bond�Ltd�3.839%�30/12/2018�'144A'� 5,947,000� USD� 5,947,000� 6,059,963� 0.13
Italy Eni�SpA�5.7%�1/10/2040�'144A'� 2,708,000� USD� 2,636,096� 3,090,361� 0.07
Japan Mizuho�Bank�Ltd�2.65%�25/9/2019�'144A'� 18,169,000� USD� 18,139,506� 18,229,739� 0.39
Luxembourg Covidien�International�Finance�SA�6.55%�15/10/2037�� 300,000� USD� 312,231� 391,346� 0.01European�Investment�Bank�1%�15/6/2018�� 10,000,000� USD� 9,959,978� 9,852,160� 0.21European�Investment�Bank�1.75%�15/3/2017�� 13,500,000� USD� 13,473,842� 13,755,825� 0.29European�Investment�Bank�1.75%�17/6/2019�� 15,000,000� USD� 14,944,298� 15,027,150� 0.32�Pentair�Finance�SA�2.65%�1/12/2019�� 5,800,000� USD� 5,790,464� 5,732,993� 0.12Prologis�International�Funding�II�SA�4.875%�15/2/2020�'144A'� 8,148,000� USD� 8,105,184� 8,654,912� 0.18Schlumberger�Investment�SA�2.4%�1/8/2022�'144A'� 10,500,000� USD� 10,486,645� 10,069,847� 0.21Schlumberger�Investment�SA�3.65%�1/12/2023�� 14,600,000� USD� 14,555,790� 15,279,673� 0.33SES�SA�3.6%�4/4/2023�'144A'� 5,044,000� USD� 5,023,959� 5,090,349� 0.11
� � � 82,652,391� 83,854,255� 1.78
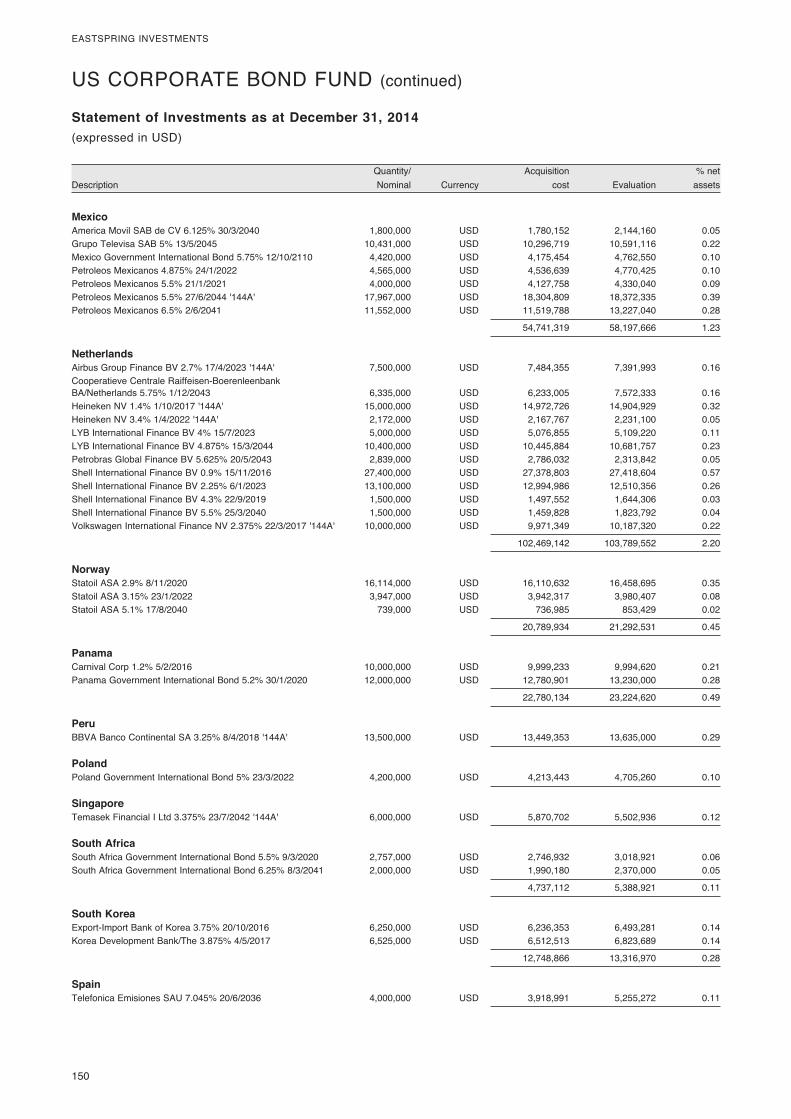
150�
EASTSPRING�INVESTMENTS
� Quantity/�� � Acquisition�� � %�net�Description� Nominal�� Currency�� cost�� Evaluation�� assets�
Statement of Investments as at December 31, 2014(expressed�in�USD)
US�CORPORATE�BOND�FUND�(continued)
Mexico America�Movil�SAB�de�CV�6.125%�30/3/2040�� 1,800,000� USD� 1,780,152� 2,144,160� 0.05Grupo�Televisa�SAB�5%�13/5/2045�� 10,431,000� USD� 10,296,719� 10,591,116� 0.22Mexico�Government�International�Bond�5.75%�12/10/2110�� 4,420,000� USD� 4,175,454� 4,762,550� 0.10Petroleos�Mexicanos�4.875%�24/1/2022�� 4,565,000� USD� 4,536,639� 4,770,425� 0.10Petroleos�Mexicanos�5.5%�21/1/2021�� 4,000,000� USD� 4,127,758� 4,330,040� 0.09Petroleos�Mexicanos�5.5%�27/6/2044�'144A'� 17,967,000� USD� 18,304,809� 18,372,335� 0.39Petroleos�Mexicanos�6.5%�2/6/2041�� 11,552,000� USD� 11,519,788� 13,227,040� 0.28
� � � 54,741,319� 58,197,666� 1.23
Netherlands Airbus�Group�Finance�BV�2.7%�17/4/2023�'144A'� 7,500,000� USD� 7,484,355� 7,391,993� 0.16Cooperatieve�Centrale�Raiffeisen-Boerenleenbank��BA/Netherlands�5.75%�1/12/2043�� 6,335,000� USD� 6,233,005� 7,572,333� 0.16Heineken�NV�1.4%�1/10/2017�'144A'� 15,000,000� USD� 14,972,726� 14,904,929� 0.32Heineken�NV�3.4%�1/4/2022�'144A'� 2,172,000� USD� 2,167,767� 2,231,100� 0.05LYB�International�Finance�BV�4%�15/7/2023�� 5,000,000� USD� 5,076,855� 5,109,220� 0.11LYB�International�Finance�BV�4.875%�15/3/2044�� 10,400,000� USD� 10,445,884� 10,681,757� 0.23Petrobras�Global�Finance�BV�5.625%�20/5/2043�� 2,839,000� USD� 2,786,032� 2,313,842� 0.05Shell�International�Finance�BV�0.9%�15/11/2016�� 27,400,000� USD� 27,378,803� 27,418,604� 0.57Shell�International�Finance�BV�2.25%�6/1/2023�� 13,100,000� USD� 12,994,986� 12,510,356� 0.26Shell�International�Finance�BV�4.3%�22/9/2019�� 1,500,000� USD� 1,497,552� 1,644,306� 0.03Shell�International�Finance�BV�5.5%�25/3/2040�� 1,500,000� USD� 1,459,828� 1,823,792� 0.04Volkswagen�International�Finance�NV�2.375%�22/3/2017�'144A'� 10,000,000� USD� 9,971,349� 10,187,320� 0.22
� � � 102,469,142� 103,789,552� 2.20
Norway Statoil�ASA�2.9%�8/11/2020�� 16,114,000� USD� 16,110,632� 16,458,695� 0.35Statoil�ASA�3.15%�23/1/2022�� 3,947,000� USD� 3,942,317� 3,980,407� 0.08Statoil�ASA�5.1%�17/8/2040�� 739,000� USD� 736,985� 853,429� 0.02
� � � 20,789,934� 21,292,531� 0.45
Panama Carnival�Corp�1.2%�5/2/2016�� 10,000,000� USD� 9,999,233� 9,994,620� 0.21Panama�Government�International�Bond�5.2%�30/1/2020�� 12,000,000� USD� 12,780,901� 13,230,000� 0.28
� � � 22,780,134� 23,224,620� 0.49
Peru BBVA�Banco�Continental�SA�3.25%�8/4/2018�'144A'� 13,500,000� USD� 13,449,353� 13,635,000� 0.29
Poland Poland�Government�International�Bond�5%�23/3/2022�� 4,200,000� USD� 4,213,443� 4,705,260� 0.10
Singapore Temasek�Financial�I�Ltd�3.375%�23/7/2042�'144A'� 6,000,000� USD� 5,870,702� 5,502,936� 0.12
South Africa South�Africa�Government�International�Bond�5.5%�9/3/2020�� 2,757,000� USD� 2,746,932� 3,018,921� 0.06South�Africa�Government�International�Bond�6.25%�8/3/2041�� 2,000,000� USD� 1,990,180� 2,370,000� 0.05
� � � 4,737,112� 5,388,921� 0.11
South Korea Export-Import�Bank�of�Korea�3.75%�20/10/2016�� 6,250,000� USD� 6,236,353� 6,493,281� 0.14Korea�Development�Bank/The�3.875%�4/5/2017�� 6,525,000� USD� 6,512,513� 6,823,689� 0.14
� � � 12,748,866� 13,316,970� 0.28
Spain Telefonica�Emisiones�SAU�7.045%�20/6/2036�� 4,000,000� USD� 3,918,991� 5,255,272� 0.11
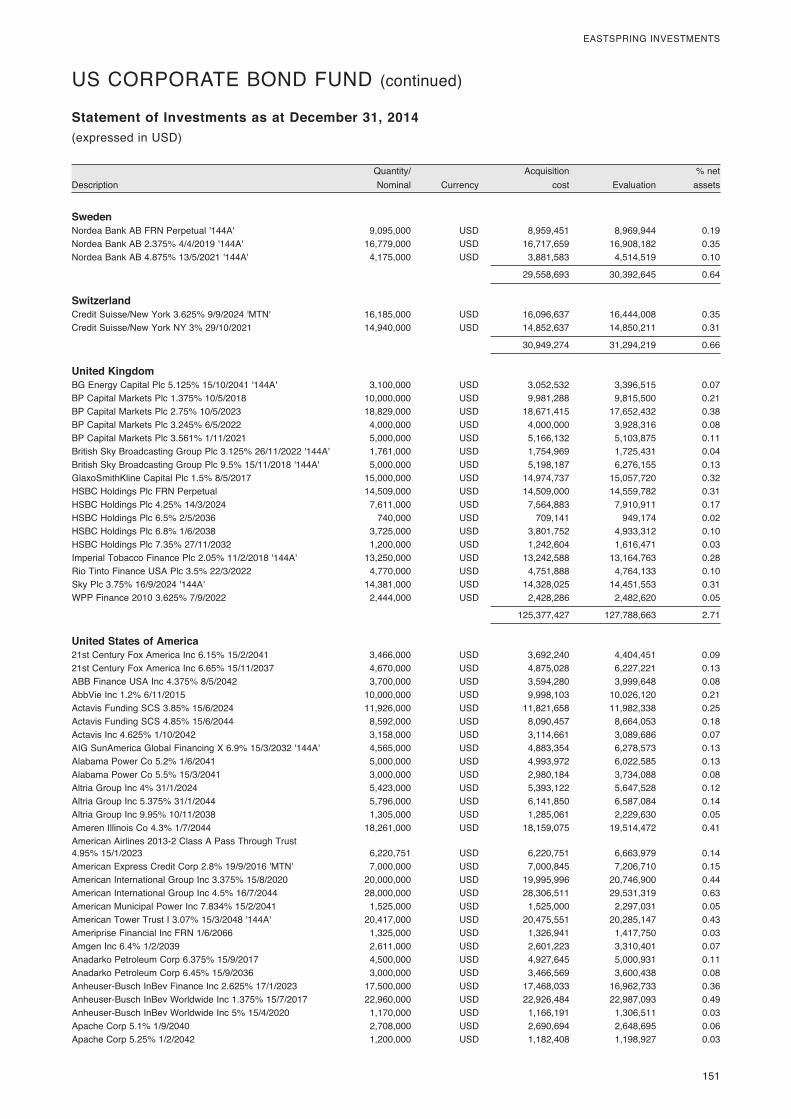
� 151
EASTSPRING�INVESTMENTS
� Quantity/�� � Acquisition�� � %�net�Description� Nominal�� Currency�� cost�� Evaluation�� assets�
Statement of Investments as at December 31, 2014(expressed�in�USD)
US�CORPORATE�BOND�FUND�(continued)
Sweden Nordea�Bank�AB�FRN�Perpetual�'144A'� 9,095,000� USD� 8,959,451� 8,969,944� 0.19Nordea�Bank�AB�2.375%�4/4/2019�'144A'� 16,779,000� USD� 16,717,659� 16,908,182� 0.35Nordea�Bank�AB�4.875%�13/5/2021�'144A'� 4,175,000� USD� 3,881,583� 4,514,519� 0.10
� � � 29,558,693� 30,392,645� 0.64
Switzerland Credit�Suisse/New�York�3.625%�9/9/2024�'MTN'� 16,185,000� USD� 16,096,637� 16,444,008� 0.35Credit�Suisse/New�York�NY�3%�29/10/2021�� 14,940,000� USD� 14,852,637� 14,850,211� 0.31
� � � 30,949,274� 31,294,219� 0.66
United Kingdom BG�Energy�Capital�Plc�5.125%�15/10/2041�'144A'� 3,100,000� USD� 3,052,532� 3,396,515� 0.07BP�Capital�Markets�Plc�1.375%�10/5/2018�� 10,000,000� USD� 9,981,288� 9,815,500� 0.21BP�Capital�Markets�Plc�2.75%�10/5/2023�� 18,829,000� USD� 18,671,415� 17,652,432� 0.38BP�Capital�Markets�Plc�3.245%�6/5/2022�� 4,000,000� USD� 4,000,000� 3,928,316� 0.08BP�Capital�Markets�Plc�3.561%�1/11/2021�� 5,000,000� USD� 5,166,132� 5,103,875� 0.11British�Sky�Broadcasting�Group�Plc�3.125%�26/11/2022�'144A'� 1,761,000� USD� 1,754,969� 1,725,431� 0.04British�Sky�Broadcasting�Group�Plc�9.5%�15/11/2018�'144A'� 5,000,000� USD� 5,198,187� 6,276,155� 0.13GlaxoSmithKline�Capital�Plc�1.5%�8/5/2017�� 15,000,000� USD� 14,974,737� 15,057,720� 0.32HSBC�Holdings�Plc�FRN�Perpetual�� 14,509,000� USD� 14,509,000� 14,559,782� 0.31HSBC�Holdings�Plc�4.25%�14/3/2024�� 7,611,000� USD� 7,564,883� 7,910,911� 0.17HSBC�Holdings�Plc�6.5%�2/5/2036�� 740,000� USD� 709,141� 949,174� 0.02HSBC�Holdings�Plc�6.8%�1/6/2038�� 3,725,000� USD� 3,801,752� 4,933,312� 0.10HSBC�Holdings�Plc�7.35%�27/11/2032�� 1,200,000� USD� 1,242,604� 1,616,471� 0.03Imperial�Tobacco�Finance�Plc�2.05%�11/2/2018�'144A'� 13,250,000� USD� 13,242,588� 13,164,763� 0.28Rio�Tinto�Finance�USA�Plc�3.5%�22/3/2022�� 4,770,000� USD� 4,751,888� 4,764,133� 0.10Sky�Plc�3.75%�16/9/2024�'144A'� 14,381,000� USD� 14,328,025� 14,451,553� 0.31WPP�Finance�2010�3.625%�7/9/2022�� 2,444,000� USD� 2,428,286� 2,482,620� 0.05
� � � 125,377,427� 127,788,663� 2.71
United States of America 21st�Century�Fox�America�Inc�6.15%�15/2/2041�� 3,466,000� USD� 3,692,240� 4,404,451� 0.0921st�Century�Fox�America�Inc�6.65%�15/11/2037�� 4,670,000� USD� 4,875,028� 6,227,221� 0.13ABB�Finance�USA�Inc�4.375%�8/5/2042�� 3,700,000� USD� 3,594,280� 3,999,648� 0.08AbbVie�Inc�1.2%�6/11/2015�� 10,000,000� USD� 9,998,103� 10,026,120� 0.21Actavis�Funding�SCS�3.85%�15/6/2024�� 11,926,000� USD� 11,821,658� 11,982,338� 0.25Actavis�Funding�SCS�4.85%�15/6/2044�� 8,592,000� USD� 8,090,457� 8,664,053� 0.18Actavis�Inc�4.625%�1/10/2042�� 3,158,000� USD� 3,114,661� 3,089,686� 0.07AIG�SunAmerica�Global�Financing�X�6.9%�15/3/2032�'144A'� 4,565,000� USD� 4,883,354� 6,278,573� 0.13Alabama�Power�Co�5.2%�1/6/2041�� 5,000,000� USD� 4,993,972� 6,022,585� 0.13Alabama�Power�Co�5.5%�15/3/2041�� 3,000,000� USD� 2,980,184� 3,734,088� 0.08Altria�Group�Inc�4%�31/1/2024�� 5,423,000� USD� 5,393,122� 5,647,528� 0.12Altria�Group�Inc�5.375%�31/1/2044�� 5,796,000� USD� 6,141,850� 6,587,084� 0.14Altria�Group�Inc�9.95%�10/11/2038�� 1,305,000� USD� 1,285,061� 2,229,630� 0.05Ameren�Illinois�Co�4.3%�1/7/2044�� 18,261,000� USD� 18,159,075� 19,514,472� 0.41American�Airlines�2013-2�Class�A�Pass�Through�Trust��4.95%�15/1/2023�� 6,220,751� USD� 6,220,751� 6,663,979� 0.14American�Express�Credit�Corp�2.8%�19/9/2016�'MTN'� 7,000,000� USD� 7,000,845� 7,206,710� 0.15American�International�Group�Inc�3.375%�15/8/2020�� 20,000,000� USD� 19,995,996� 20,746,900� 0.44American�International�Group�Inc�4.5%�16/7/2044�� 28,000,000� USD� 28,306,511� 29,531,319� 0.63American�Municipal�Power�Inc�7.834%�15/2/2041�� 1,525,000� USD� 1,525,000� 2,297,031� 0.05American�Tower�Trust�I�3.07%�15/3/2048�'144A'� 20,417,000� USD� 20,475,551� 20,285,147� 0.43Ameriprise�Financial�Inc�FRN�1/6/2066�� 1,325,000� USD� 1,326,941� 1,417,750� 0.03Amgen�Inc�6.4%�1/2/2039�� 2,611,000� USD� 2,601,223� 3,310,401� 0.07Anadarko�Petroleum�Corp�6.375%�15/9/2017�� 4,500,000� USD� 4,927,645� 5,000,931� 0.11Anadarko�Petroleum�Corp�6.45%�15/9/2036�� 3,000,000� USD� 3,466,569� 3,600,438� 0.08Anheuser-Busch�InBev�Finance�Inc�2.625%�17/1/2023�� 17,500,000� USD� 17,468,033� 16,962,733� 0.36Anheuser-Busch�InBev�Worldwide�Inc�1.375%�15/7/2017�� 22,960,000� USD� 22,926,484� 22,987,093� 0.49Anheuser-Busch�InBev�Worldwide�Inc�5%�15/4/2020�� 1,170,000� USD� 1,166,191� 1,306,511� 0.03Apache�Corp�5.1%�1/9/2040�� 2,708,000� USD� 2,690,694� 2,648,695� 0.06Apache�Corp�5.25%�1/2/2042�� 1,200,000� USD� 1,182,408� 1,198,927� 0.03
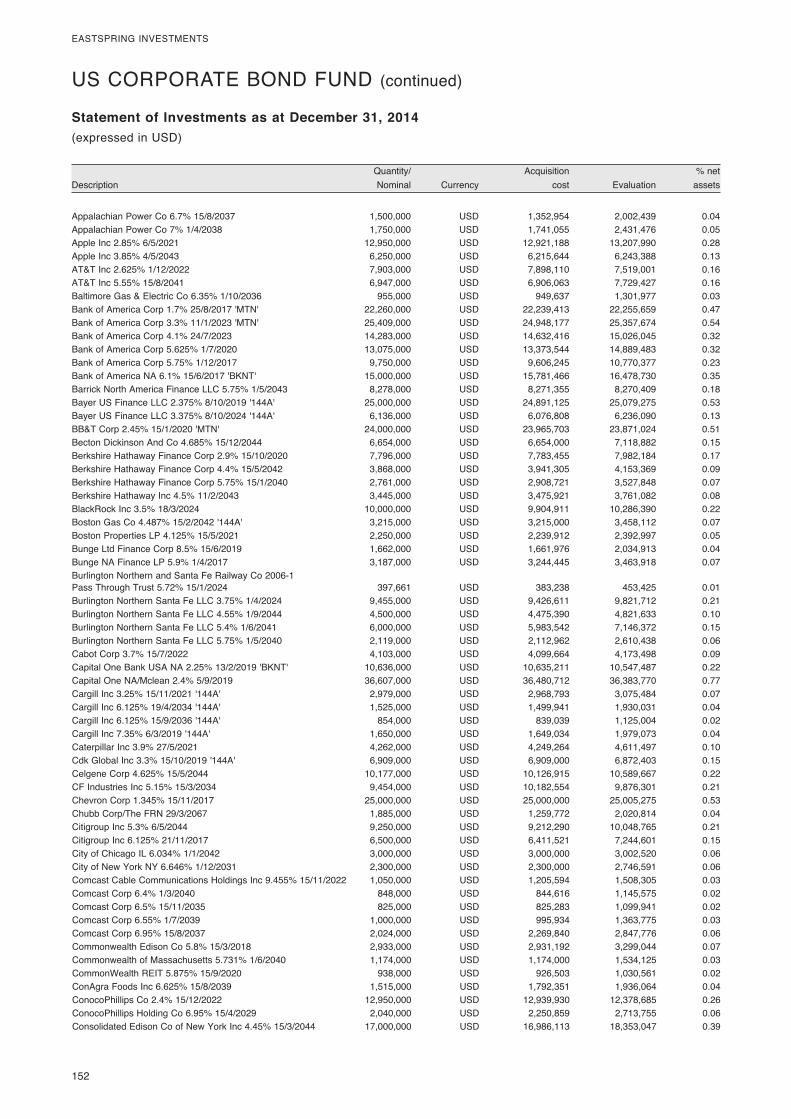
152�
EASTSPRING�INVESTMENTS
� Quantity/�� � Acquisition�� � %�net�Description� Nominal�� Currency�� cost�� Evaluation�� assets�
Statement of Investments as at December 31, 2014(expressed�in�USD)
US�CORPORATE�BOND�FUND�(continued)
Appalachian�Power�Co�6.7%�15/8/2037�� 1,500,000� USD� 1,352,954� 2,002,439� 0.04Appalachian�Power�Co�7%�1/4/2038�� 1,750,000� USD� 1,741,055� 2,431,476� 0.05Apple�Inc�2.85%�6/5/2021�� 12,950,000� USD� 12,921,188� 13,207,990� 0.28Apple�Inc�3.85%�4/5/2043�� 6,250,000� USD� 6,215,644� 6,243,388� 0.13AT&T�Inc�2.625%�1/12/2022�� 7,903,000� USD� 7,898,110� 7,519,001� 0.16AT&T�Inc�5.55%�15/8/2041�� 6,947,000� USD� 6,906,063� 7,729,427� 0.16Baltimore�Gas�&�Electric�Co�6.35%�1/10/2036�� 955,000� USD� 949,637� 1,301,977� 0.03Bank�of�America�Corp�1.7%�25/8/2017�'MTN'� 22,260,000� USD� 22,239,413� 22,255,659� 0.47Bank�of�America�Corp�3.3%�11/1/2023�'MTN'� 25,409,000� USD� 24,948,177� 25,357,674� 0.54Bank�of�America�Corp�4.1%�24/7/2023�� 14,283,000� USD� 14,632,416� 15,026,045� 0.32Bank�of�America�Corp�5.625%�1/7/2020�� 13,075,000� USD� 13,373,544� 14,889,483� 0.32Bank�of�America�Corp�5.75%�1/12/2017�� 9,750,000� USD� 9,606,245� 10,770,377� 0.23Bank�of�America�NA�6.1%�15/6/2017�'BKNT'� 15,000,000� USD� 15,781,466� 16,478,730� 0.35Barrick�North�America�Finance�LLC�5.75%�1/5/2043�� 8,278,000� USD� 8,271,355� 8,270,409� 0.18Bayer�US�Finance�LLC�2.375%�8/10/2019�'144A'� 25,000,000� USD� 24,891,125� 25,079,275� 0.53Bayer�US�Finance�LLC�3.375%�8/10/2024�'144A'� 6,136,000� USD� 6,076,808� 6,236,090� 0.13BB&T�Corp�2.45%�15/1/2020�'MTN'� 24,000,000� USD� 23,965,703� 23,871,024� 0.51Becton�Dickinson�And�Co�4.685%�15/12/2044�� 6,654,000� USD� 6,654,000� 7,118,882� 0.15Berkshire�Hathaway�Finance�Corp�2.9%�15/10/2020�� 7,796,000� USD� 7,783,455� 7,982,184� 0.17Berkshire�Hathaway�Finance�Corp�4.4%�15/5/2042�� 3,868,000� USD� 3,941,305� 4,153,369� 0.09Berkshire�Hathaway�Finance�Corp�5.75%�15/1/2040�� 2,761,000� USD� 2,908,721� 3,527,848� 0.07Berkshire�Hathaway�Inc�4.5%�11/2/2043�� 3,445,000� USD� 3,475,921� 3,761,082� 0.08BlackRock�Inc�3.5%�18/3/2024�� 10,000,000� USD� 9,904,911� 10,286,390� 0.22Boston�Gas�Co�4.487%�15/2/2042�'144A'� 3,215,000� USD� 3,215,000� 3,458,112� 0.07Boston�Properties�LP�4.125%�15/5/2021�� 2,250,000� USD� 2,239,912� 2,392,997� 0.05Bunge�Ltd�Finance�Corp�8.5%�15/6/2019�� 1,662,000� USD� 1,661,976� 2,034,913� 0.04Bunge�NA�Finance�LP�5.9%�1/4/2017�� 3,187,000� USD� 3,244,445� 3,463,918� 0.07Burlington�Northern�and�Santa�Fe�Railway�Co�2006-1��Pass�Through�Trust�5.72%�15/1/2024�� 397,661� USD� 383,238� 453,425� 0.01Burlington�Northern�Santa�Fe�LLC�3.75%�1/4/2024�� 9,455,000� USD� 9,426,611� 9,821,712� 0.21Burlington�Northern�Santa�Fe�LLC�4.55%�1/9/2044�� 4,500,000� USD� 4,475,390� 4,821,633� 0.10Burlington�Northern�Santa�Fe�LLC�5.4%�1/6/2041�� 6,000,000� USD� 5,983,542� 7,146,372� 0.15Burlington�Northern�Santa�Fe�LLC�5.75%�1/5/2040�� 2,119,000� USD� 2,112,962� 2,610,438� 0.06Cabot�Corp�3.7%�15/7/2022�� 4,103,000� USD� 4,099,664� 4,173,498� 0.09Capital�One�Bank�USA�NA�2.25%�13/2/2019�'BKNT'� 10,636,000� USD� 10,635,211� 10,547,487� 0.22Capital�One�NA/Mclean�2.4%�5/9/2019�� 36,607,000� USD� 36,480,712� 36,383,770� 0.77Cargill�Inc�3.25%�15/11/2021�'144A'� 2,979,000� USD� 2,968,793� 3,075,484� 0.07Cargill�Inc�6.125%�19/4/2034�'144A'� 1,525,000� USD� 1,499,941� 1,930,031� 0.04Cargill�Inc�6.125%�15/9/2036�'144A'� 854,000� USD� 839,039� 1,125,004� 0.02Cargill�Inc�7.35%�6/3/2019�'144A'� 1,650,000� USD� 1,649,034� 1,979,073� 0.04Caterpillar�Inc�3.9%�27/5/2021�� 4,262,000� USD� 4,249,264� 4,611,497� 0.10Cdk�Global�Inc�3.3%�15/10/2019�'144A'� 6,909,000� USD� 6,909,000� 6,872,403� 0.15Celgene�Corp�4.625%�15/5/2044�� 10,177,000� USD� 10,126,915� 10,589,667� 0.22CF�Industries�Inc�5.15%�15/3/2034�� 9,454,000� USD� 10,182,554� 9,876,301� 0.21Chevron�Corp�1.345%�15/11/2017�� 25,000,000� USD� 25,000,000� 25,005,275� 0.53Chubb�Corp/The�FRN�29/3/2067�� 1,885,000� USD� 1,259,772� 2,020,814� 0.04Citigroup�Inc�5.3%�6/5/2044�� 9,250,000� USD� 9,212,290� 10,048,765� 0.21Citigroup�Inc�6.125%�21/11/2017�� 6,500,000� USD� 6,411,521� 7,244,601� 0.15City�of�Chicago�IL�6.034%�1/1/2042�� 3,000,000� USD� 3,000,000� 3,002,520� 0.06City�of�New�York�NY�6.646%�1/12/2031�� 2,300,000� USD� 2,300,000� 2,746,591� 0.06Comcast�Cable�Communications�Holdings�Inc�9.455%�15/11/2022�� 1,050,000� USD� 1,205,594� 1,508,305� 0.03Comcast�Corp�6.4%�1/3/2040�� 848,000� USD� 844,616� 1,145,575� 0.02Comcast�Corp�6.5%�15/11/2035�� 825,000� USD� 825,283� 1,099,941� 0.02Comcast�Corp�6.55%�1/7/2039�� 1,000,000� USD� 995,934� 1,363,775� 0.03Comcast�Corp�6.95%�15/8/2037�� 2,024,000� USD� 2,269,840� 2,847,776� 0.06Commonwealth�Edison�Co�5.8%�15/3/2018�� 2,933,000� USD� 2,931,192� 3,299,044� 0.07Commonwealth�of�Massachusetts�5.731%�1/6/2040�� 1,174,000� USD� 1,174,000� 1,534,125� 0.03CommonWealth�REIT�5.875%�15/9/2020�� 938,000� USD� 926,503� 1,030,561� 0.02ConAgra�Foods�Inc�6.625%�15/8/2039�� 1,515,000� USD� 1,792,351� 1,936,064� 0.04ConocoPhillips�Co�2.4%�15/12/2022�� 12,950,000� USD� 12,939,930� 12,378,685� 0.26ConocoPhillips�Holding�Co�6.95%�15/4/2029�� 2,040,000� USD� 2,250,859� 2,713,755� 0.06Consolidated�Edison�Co�of�New�York�Inc�4.45%�15/3/2044�� 17,000,000� USD� 16,986,113� 18,353,047� 0.39
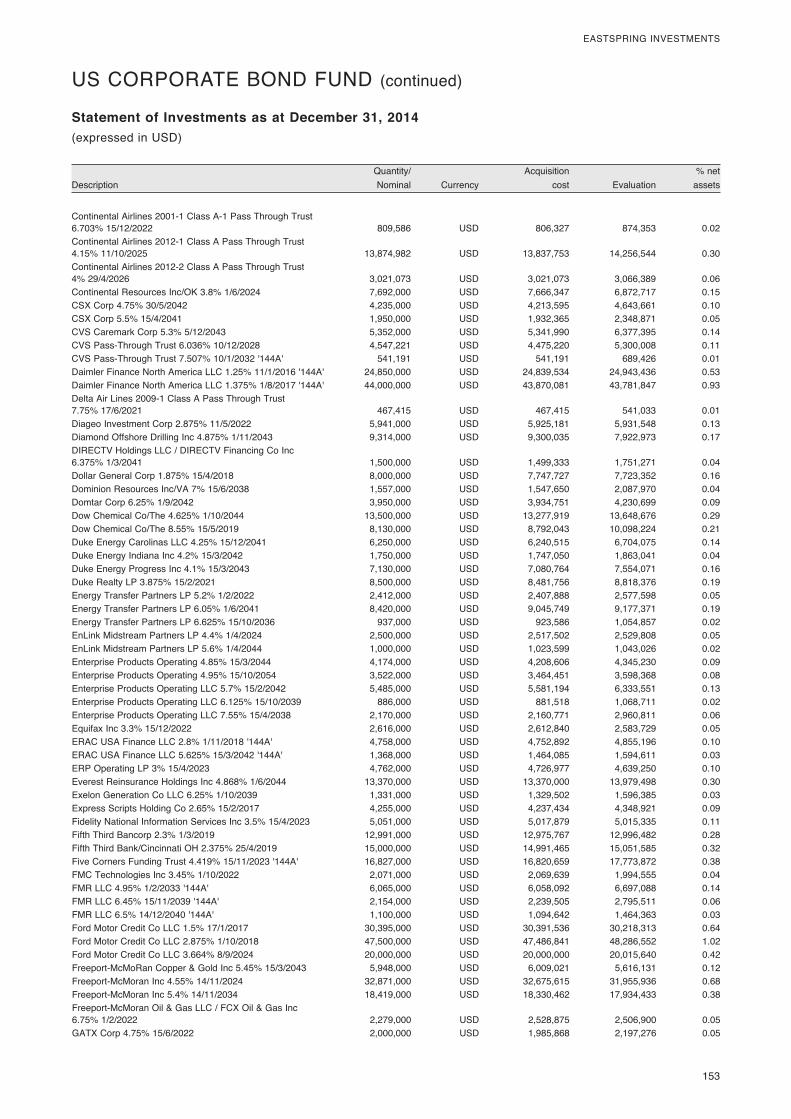
� 153
EASTSPRING�INVESTMENTS
� Quantity/�� � Acquisition�� � %�net�Description� Nominal�� Currency�� cost�� Evaluation�� assets�
Statement of Investments as at December 31, 2014(expressed�in�USD)
US�CORPORATE�BOND�FUND�(continued)
Continental�Airlines�2001-1�Class�A-1�Pass�Through�Trust��6.703%�15/12/2022�� 809,586� USD� 806,327� 874,353� 0.02Continental�Airlines�2012-1�Class�A�Pass�Through�Trust��4.15%�11/10/2025�� 13,874,982� USD� 13,837,753� 14,256,544� 0.30Continental�Airlines�2012-2�Class�A�Pass�Through�Trust��4%�29/4/2026�� 3,021,073� USD� 3,021,073� 3,066,389� 0.06Continental�Resources�Inc/OK�3.8%�1/6/2024�� 7,692,000� USD� 7,666,347� 6,872,717� 0.15CSX�Corp�4.75%�30/5/2042�� 4,235,000� USD� 4,213,595� 4,643,661� 0.10CSX�Corp�5.5%�15/4/2041�� 1,950,000� USD� 1,932,365� 2,348,871� 0.05CVS�Caremark�Corp�5.3%�5/12/2043�� 5,352,000� USD� 5,341,990� 6,377,395� 0.14CVS�Pass-Through�Trust�6.036%�10/12/2028�� 4,547,221� USD� 4,475,220� 5,300,008� 0.11CVS�Pass-Through�Trust�7.507%�10/1/2032�'144A'� 541,191� USD� 541,191� 689,426� 0.01Daimler�Finance�North�America�LLC�1.25%�11/1/2016�'144A'� 24,850,000� USD� 24,839,534� 24,943,436� 0.53Daimler�Finance�North�America�LLC�1.375%�1/8/2017�'144A'� 44,000,000� USD� 43,870,081� 43,781,847� 0.93Delta�Air�Lines�2009-1�Class�A�Pass�Through�Trust��7.75%�17/6/2021�� 467,415� USD� 467,415� 541,033� 0.01Diageo�Investment�Corp�2.875%�11/5/2022�� 5,941,000� USD� 5,925,181� 5,931,548� 0.13Diamond�Offshore�Drilling�Inc�4.875%�1/11/2043�� 9,314,000� USD� 9,300,035� 7,922,973� 0.17DIRECTV�Holdings�LLC�/�DIRECTV�Financing�Co�Inc��6.375%�1/3/2041�� 1,500,000� USD� 1,499,333� 1,751,271� 0.04Dollar�General�Corp�1.875%�15/4/2018�� 8,000,000� USD� 7,747,727� 7,723,352� 0.16Dominion�Resources�Inc/VA�7%�15/6/2038�� 1,557,000� USD� 1,547,650� 2,087,970� 0.04Domtar�Corp�6.25%�1/9/2042�� 3,950,000� USD� 3,934,751� 4,230,699� 0.09Dow�Chemical�Co/The�4.625%�1/10/2044�� 13,500,000� USD� 13,277,919� 13,648,676� 0.29Dow�Chemical�Co/The�8.55%�15/5/2019�� 8,130,000� USD� 8,792,043� 10,098,224� 0.21Duke�Energy�Carolinas�LLC�4.25%�15/12/2041�� 6,250,000� USD� 6,240,515� 6,704,075� 0.14Duke�Energy�Indiana�Inc�4.2%�15/3/2042�� 1,750,000� USD� 1,747,050� 1,863,041� 0.04Duke�Energy�Progress�Inc�4.1%�15/3/2043�� 7,130,000� USD� 7,080,764� 7,554,071� 0.16Duke�Realty�LP�3.875%�15/2/2021�� 8,500,000� USD� 8,481,756� 8,818,376� 0.19Energy�Transfer�Partners�LP�5.2%�1/2/2022�� 2,412,000� USD� 2,407,888� 2,577,598� 0.05Energy�Transfer�Partners�LP�6.05%�1/6/2041�� 8,420,000� USD� 9,045,749� 9,177,371� 0.19Energy�Transfer�Partners�LP�6.625%�15/10/2036�� 937,000� USD� 923,586� 1,054,857� 0.02EnLink�Midstream�Partners�LP�4.4%�1/4/2024�� 2,500,000� USD� 2,517,502� 2,529,808� 0.05EnLink�Midstream�Partners�LP�5.6%�1/4/2044�� 1,000,000� USD� 1,023,599� 1,043,026� 0.02Enterprise�Products�Operating�4.85%�15/3/2044�� 4,174,000� USD� 4,208,606� 4,345,230� 0.09Enterprise�Products�Operating�4.95%�15/10/2054�� 3,522,000� USD� 3,464,451� 3,598,368� 0.08Enterprise�Products�Operating�LLC�5.7%�15/2/2042�� 5,485,000� USD� 5,581,194� 6,333,551� 0.13Enterprise�Products�Operating�LLC�6.125%�15/10/2039�� 886,000� USD� 881,518� 1,068,711� 0.02Enterprise�Products�Operating�LLC�7.55%�15/4/2038�� 2,170,000� USD� 2,160,771� 2,960,811� 0.06Equifax�Inc�3.3%�15/12/2022�� 2,616,000� USD� 2,612,840� 2,583,729� 0.05ERAC�USA�Finance�LLC�2.8%�1/11/2018�'144A'� 4,758,000� USD� 4,752,892� 4,855,196� 0.10ERAC�USA�Finance�LLC�5.625%�15/3/2042�'144A'� 1,368,000� USD� 1,464,085� 1,594,611� 0.03ERP�Operating�LP�3%�15/4/2023�� 4,762,000� USD� 4,726,977� 4,639,250� 0.10Everest�Reinsurance�Holdings�Inc�4.868%�1/6/2044�� 13,370,000� USD� 13,370,000� 13,979,498� 0.30Exelon�Generation�Co�LLC�6.25%�1/10/2039�� 1,331,000� USD� 1,329,502� 1,596,385� 0.03Express�Scripts�Holding�Co�2.65%�15/2/2017�� 4,255,000� USD� 4,237,434� 4,348,921� 0.09Fidelity�National�Information�Services�Inc�3.5%�15/4/2023�� 5,051,000� USD� 5,017,879� 5,015,335� 0.11Fifth�Third�Bancorp�2.3%�1/3/2019�� 12,991,000� USD� 12,975,767� 12,996,482� 0.28Fifth�Third�Bank/Cincinnati�OH�2.375%�25/4/2019�� 15,000,000� USD� 14,991,465� 15,051,585� 0.32Five�Corners�Funding�Trust�4.419%�15/11/2023�'144A'� 16,827,000� USD� 16,820,659� 17,773,872� 0.38FMC�Technologies�Inc�3.45%�1/10/2022�� 2,071,000� USD� 2,069,639� 1,994,555� 0.04FMR�LLC�4.95%�1/2/2033�'144A'� 6,065,000� USD� 6,058,092� 6,697,088� 0.14FMR�LLC�6.45%�15/11/2039�'144A'� 2,154,000� USD� 2,239,505� 2,795,511� 0.06FMR�LLC�6.5%�14/12/2040�'144A'� 1,100,000� USD� 1,094,642� 1,464,363� 0.03Ford�Motor�Credit�Co�LLC�1.5%�17/1/2017�� 30,395,000� USD� 30,391,536� 30,218,313� 0.64Ford�Motor�Credit�Co�LLC�2.875%�1/10/2018�� 47,500,000� USD� 47,486,841� 48,286,552� 1.02Ford�Motor�Credit�Co�LLC�3.664%�8/9/2024�� 20,000,000� USD� 20,000,000� 20,015,640� 0.42Freeport-McMoRan�Copper�&�Gold�Inc�5.45%�15/3/2043�� 5,948,000� USD� 6,009,021� 5,616,131� 0.12Freeport-McMoran�Inc�4.55%�14/11/2024�� 32,871,000� USD� 32,675,615� 31,955,936� 0.68Freeport-McMoran�Inc�5.4%�14/11/2034�� 18,419,000� USD� 18,330,462� 17,934,433� 0.38Freeport-McMoran�Oil�&�Gas�LLC�/�FCX�Oil�&�Gas�Inc��6.75%�1/2/2022�� 2,279,000� USD� 2,528,875� 2,506,900� 0.05GATX�Corp�4.75%�15/6/2022�� 2,000,000� USD� 1,985,868� 2,197,276� 0.05
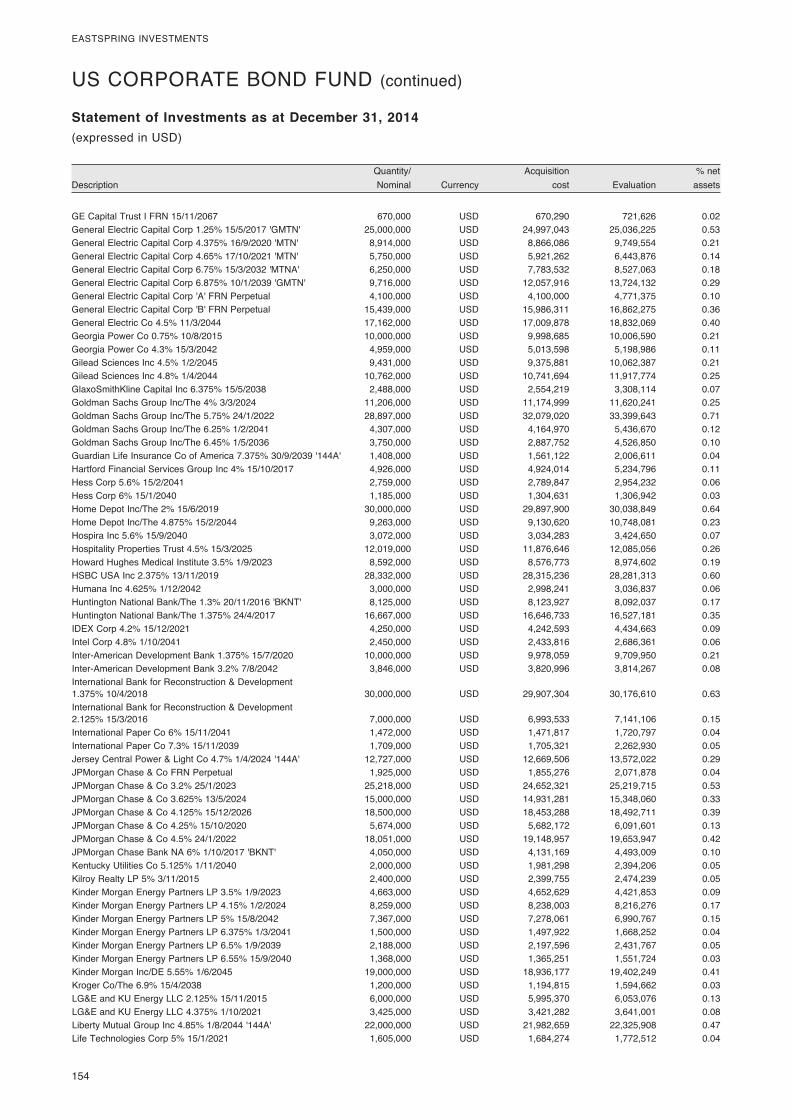
154�
EASTSPRING�INVESTMENTS
� Quantity/�� � Acquisition�� � %�net�Description� Nominal�� Currency�� cost�� Evaluation�� assets�
Statement of Investments as at December 31, 2014(expressed�in�USD)
US�CORPORATE�BOND�FUND�(continued)
GE�Capital�Trust�I�FRN�15/11/2067�� 670,000� USD� 670,290� 721,626� 0.02General�Electric�Capital�Corp�1.25%�15/5/2017�'GMTN'� 25,000,000� USD� 24,997,043� 25,036,225� 0.53General�Electric�Capital�Corp�4.375%�16/9/2020�'MTN'� 8,914,000� USD� 8,866,086� 9,749,554� 0.21General�Electric�Capital�Corp�4.65%�17/10/2021�'MTN'� 5,750,000� USD� 5,921,262� 6,443,876� 0.14General�Electric�Capital�Corp�6.75%�15/3/2032�'MTNA'� 6,250,000� USD� 7,783,532� 8,527,063� 0.18General�Electric�Capital�Corp�6.875%�10/1/2039�'GMTN'� 9,716,000� USD� 12,057,916� 13,724,132� 0.29General�Electric�Capital�Corp�'A'�FRN�Perpetual�� 4,100,000� USD� 4,100,000� 4,771,375� 0.10General�Electric�Capital�Corp�'B'�FRN�Perpetual�� 15,439,000� USD� 15,986,311� 16,862,275� 0.36General�Electric�Co�4.5%�11/3/2044�� 17,162,000� USD� 17,009,878� 18,832,069� 0.40Georgia�Power�Co�0.75%�10/8/2015�� 10,000,000� USD� 9,998,685� 10,006,590� 0.21Georgia�Power�Co�4.3%�15/3/2042�� 4,959,000� USD� 5,013,598� 5,198,986� 0.11Gilead�Sciences�Inc�4.5%�1/2/2045�� 9,431,000� USD� 9,375,881� 10,062,387� 0.21Gilead�Sciences�Inc�4.8%�1/4/2044�� 10,762,000� USD� 10,741,694� 11,917,774� 0.25GlaxoSmithKline�Capital�Inc�6.375%�15/5/2038�� 2,488,000� USD� 2,554,219� 3,308,114� 0.07Goldman�Sachs�Group�Inc/The�4%�3/3/2024�� 11,206,000� USD� 11,174,999� 11,620,241� 0.25Goldman�Sachs�Group�Inc/The�5.75%�24/1/2022�� 28,897,000� USD� 32,079,020� 33,399,643� 0.71Goldman�Sachs�Group�Inc/The�6.25%�1/2/2041�� 4,307,000� USD� 4,164,970� 5,436,670� 0.12Goldman�Sachs�Group�Inc/The�6.45%�1/5/2036�� 3,750,000� USD� 2,887,752� 4,526,850� 0.10Guardian�Life�Insurance�Co�of�America�7.375%�30/9/2039�'144A'� 1,408,000� USD� 1,561,122� 2,006,611� 0.04Hartford�Financial�Services�Group�Inc�4%�15/10/2017�� 4,926,000� USD� 4,924,014� 5,234,796� 0.11Hess�Corp�5.6%�15/2/2041�� 2,759,000� USD� 2,789,847� 2,954,232� 0.06Hess�Corp�6%�15/1/2040�� 1,185,000� USD� 1,304,631� 1,306,942� 0.03Home�Depot�Inc/The�2%�15/6/2019�� 30,000,000� USD� 29,897,900� 30,038,849� 0.64Home�Depot�Inc/The�4.875%�15/2/2044�� 9,263,000� USD� 9,130,620� 10,748,081� 0.23Hospira�Inc�5.6%�15/9/2040�� 3,072,000� USD� 3,034,283� 3,424,650� 0.07Hospitality�Properties�Trust�4.5%�15/3/2025�� 12,019,000� USD� 11,876,646� 12,085,056� 0.26Howard�Hughes�Medical�Institute�3.5%�1/9/2023�� 8,592,000� USD� 8,576,773� 8,974,602� 0.19HSBC�USA�Inc�2.375%�13/11/2019�� 28,332,000� USD� 28,315,236� 28,281,313� 0.60Humana�Inc�4.625%�1/12/2042�� 3,000,000� USD� 2,998,241� 3,036,837� 0.06Huntington�National�Bank/The�1.3%�20/11/2016�'BKNT'� 8,125,000� USD� 8,123,927� 8,092,037� 0.17Huntington�National�Bank/The�1.375%�24/4/2017�� 16,667,000� USD� 16,646,733� 16,527,181� 0.35IDEX�Corp�4.2%�15/12/2021�� 4,250,000� USD� 4,242,593� 4,434,663� 0.09Intel�Corp�4.8%�1/10/2041�� 2,450,000� USD� 2,433,816� 2,686,361� 0.06Inter-American�Development�Bank�1.375%�15/7/2020�� 10,000,000� USD� 9,978,059� 9,709,950� 0.21Inter-American�Development�Bank�3.2%�7/8/2042�� 3,846,000� USD� 3,820,996� 3,814,267� 0.08International�Bank�for�Reconstruction�&�Development��1.375%�10/4/2018�� 30,000,000� USD� 29,907,304� 30,176,610� 0.63International�Bank�for�Reconstruction�&�Development��2.125%�15/3/2016�� 7,000,000� USD� 6,993,533� 7,141,106� 0.15�International�Paper�Co�6%�15/11/2041�� 1,472,000� USD� 1,471,817� 1,720,797� 0.04International�Paper�Co�7.3%�15/11/2039�� 1,709,000� USD� 1,705,321� 2,262,930� 0.05Jersey�Central�Power�&�Light�Co�4.7%�1/4/2024�'144A'� 12,727,000� USD� 12,669,506� 13,572,022� 0.29JPMorgan�Chase�&�Co�FRN�Perpetual�� 1,925,000� USD� 1,855,276� 2,071,878� 0.04JPMorgan�Chase�&�Co�3.2%�25/1/2023�� 25,218,000� USD� 24,652,321� 25,219,715� 0.53JPMorgan�Chase�&�Co�3.625%�13/5/2024�� 15,000,000� USD� 14,931,281� 15,348,060� 0.33JPMorgan�Chase�&�Co�4.125%�15/12/2026�� 18,500,000� USD� 18,453,288� 18,492,711� 0.39JPMorgan�Chase�&�Co�4.25%�15/10/2020�� 5,674,000� USD� 5,682,172� 6,091,601� 0.13JPMorgan�Chase�&�Co�4.5%�24/1/2022�� 18,051,000� USD� 19,148,957� 19,653,947� 0.42JPMorgan�Chase�Bank�NA�6%�1/10/2017�'BKNT'� 4,050,000� USD� 4,131,169� 4,493,009� 0.10Kentucky�Utilities�Co�5.125%�1/11/2040�� 2,000,000� USD� 1,981,298� 2,394,206� 0.05Kilroy�Realty�LP�5%�3/11/2015�� 2,400,000� USD� 2,399,755� 2,474,239� 0.05Kinder�Morgan�Energy�Partners�LP�3.5%�1/9/2023�� 4,663,000� USD� 4,652,629� 4,421,853� 0.09Kinder�Morgan�Energy�Partners�LP�4.15%�1/2/2024�� 8,259,000� USD� 8,238,003� 8,216,276� 0.17Kinder�Morgan�Energy�Partners�LP�5%�15/8/2042�� 7,367,000� USD� 7,278,061� 6,990,767� 0.15Kinder�Morgan�Energy�Partners�LP�6.375%�1/3/2041�� 1,500,000� USD� 1,497,922� 1,668,252� 0.04Kinder�Morgan�Energy�Partners�LP�6.5%�1/9/2039�� 2,188,000� USD� 2,197,596� 2,431,767� 0.05Kinder�Morgan�Energy�Partners�LP�6.55%�15/9/2040�� 1,368,000� USD� 1,365,251� 1,551,724� 0.03Kinder�Morgan�Inc/DE�5.55%�1/6/2045�� 19,000,000� USD� 18,936,177� 19,402,249� 0.41Kroger�Co/The�6.9%�15/4/2038�� 1,200,000� USD� 1,194,815� 1,594,662� 0.03LG&E�and�KU�Energy�LLC�2.125%�15/11/2015�� 6,000,000� USD� 5,995,370� 6,053,076� 0.13LG&E�and�KU�Energy�LLC�4.375%�1/10/2021�� 3,425,000� USD� 3,421,282� 3,641,001� 0.08Liberty�Mutual�Group�Inc�4.85%�1/8/2044�'144A'� 22,000,000� USD� 21,982,659� 22,325,908� 0.47Life�Technologies�Corp�5%�15/1/2021�� 1,605,000� USD� 1,684,274� 1,772,512� 0.04
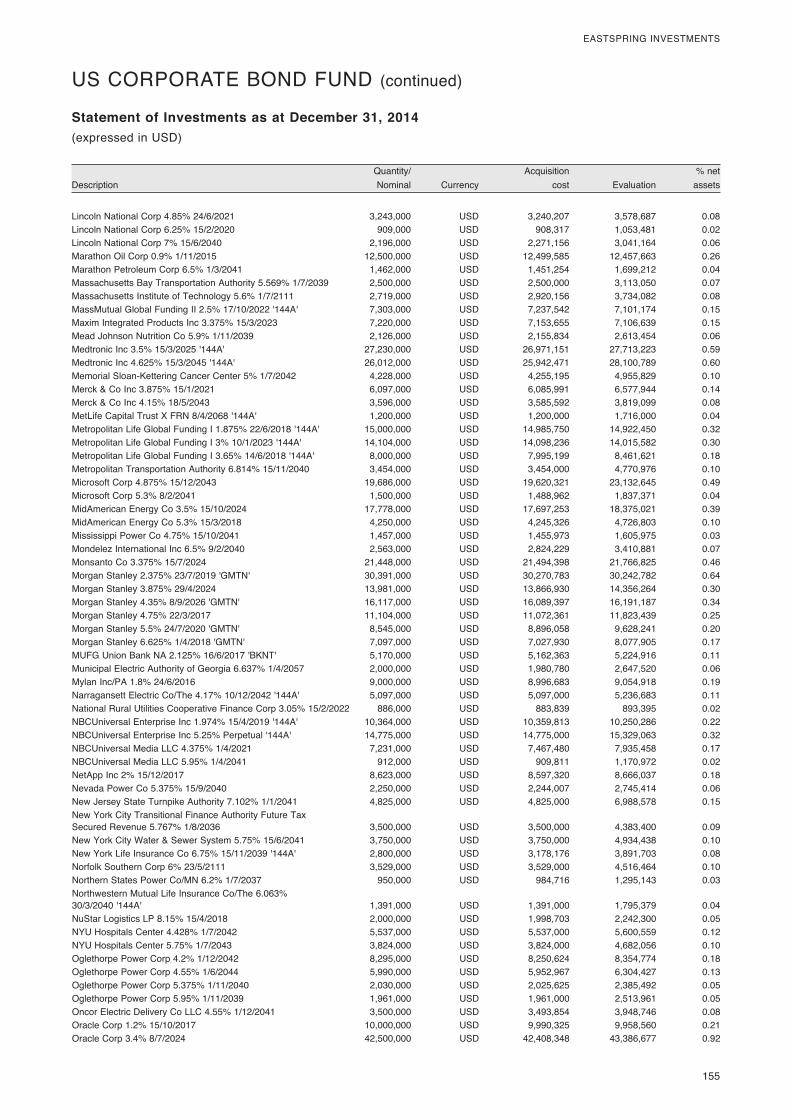
� 155
EASTSPRING�INVESTMENTS
� Quantity/�� � Acquisition�� � %�net�Description� Nominal�� Currency�� cost�� Evaluation�� assets�
Statement of Investments as at December 31, 2014(expressed�in�USD)
US�CORPORATE�BOND�FUND�(continued)
Lincoln�National�Corp�4.85%�24/6/2021�� 3,243,000� USD� 3,240,207� 3,578,687� 0.08Lincoln�National�Corp�6.25%�15/2/2020�� 909,000� USD� 908,317� 1,053,481� 0.02Lincoln�National�Corp�7%�15/6/2040�� 2,196,000� USD� 2,271,156� 3,041,164� 0.06Marathon�Oil�Corp�0.9%�1/11/2015�� 12,500,000� USD� 12,499,585� 12,457,663� 0.26Marathon�Petroleum�Corp�6.5%�1/3/2041�� 1,462,000� USD� 1,451,254� 1,699,212� 0.04Massachusetts�Bay�Transportation�Authority�5.569%�1/7/2039�� 2,500,000� USD� 2,500,000� 3,113,050� 0.07Massachusetts�Institute�of�Technology�5.6%�1/7/2111�� 2,719,000� USD� 2,920,156� 3,734,082� 0.08MassMutual�Global�Funding�II�2.5%�17/10/2022�'144A'� 7,303,000� USD� 7,237,542� 7,101,174� 0.15Maxim�Integrated�Products�Inc�3.375%�15/3/2023�� 7,220,000� USD� 7,153,655� 7,106,639� 0.15Mead�Johnson�Nutrition�Co�5.9%�1/11/2039�� 2,126,000� USD� 2,155,834� 2,613,454� 0.06Medtronic�Inc�3.5%�15/3/2025�'144A'� 27,230,000� USD� 26,971,151� 27,713,223� 0.59Medtronic�Inc�4.625%�15/3/2045�'144A'� 26,012,000� USD� 25,942,471� 28,100,789� 0.60Memorial�Sloan-Kettering�Cancer�Center�5%�1/7/2042�� 4,228,000� USD� 4,255,195� 4,955,829� 0.10Merck�&�Co�Inc�3.875%�15/1/2021�� 6,097,000� USD� 6,085,991� 6,577,944� 0.14Merck�&�Co�Inc�4.15%�18/5/2043�� 3,596,000� USD� 3,585,592� 3,819,099� 0.08MetLife�Capital�Trust�X�FRN�8/4/2068�'144A'� 1,200,000� USD� 1,200,000� 1,716,000� 0.04Metropolitan�Life�Global�Funding�I�1.875%�22/6/2018�'144A'� 15,000,000� USD� 14,985,750� 14,922,450� 0.32Metropolitan�Life�Global�Funding�I�3%�10/1/2023�'144A'� 14,104,000� USD� 14,098,236� 14,015,582� 0.30Metropolitan�Life�Global�Funding�I�3.65%�14/6/2018�'144A'� 8,000,000� USD� 7,995,199� 8,461,621� 0.18Metropolitan�Transportation�Authority�6.814%�15/11/2040�� 3,454,000� USD� 3,454,000� 4,770,976� 0.10Microsoft�Corp�4.875%�15/12/2043�� 19,686,000� USD� 19,620,321� 23,132,645� 0.49Microsoft�Corp�5.3%�8/2/2041�� 1,500,000� USD� 1,488,962� 1,837,371� 0.04MidAmerican�Energy�Co�3.5%�15/10/2024�� 17,778,000� USD� 17,697,253� 18,375,021� 0.39MidAmerican�Energy�Co�5.3%�15/3/2018�� 4,250,000� USD� 4,245,326� 4,726,803� 0.10Mississippi�Power�Co�4.75%�15/10/2041�� 1,457,000� USD� 1,455,973� 1,605,975� 0.03Mondelez�International�Inc�6.5%�9/2/2040�� 2,563,000� USD� 2,824,229� 3,410,881� 0.07Monsanto�Co�3.375%�15/7/2024�� 21,448,000� USD� 21,494,398� 21,766,825� 0.46Morgan�Stanley�2.375%�23/7/2019�'GMTN'� 30,391,000� USD� 30,270,783� 30,242,782� 0.64Morgan�Stanley�3.875%�29/4/2024�� 13,981,000� USD� 13,866,930� 14,356,264� 0.30Morgan�Stanley�4.35%�8/9/2026�'GMTN'� 16,117,000� USD� 16,089,397� 16,191,187� 0.34Morgan�Stanley�4.75%�22/3/2017�� 11,104,000� USD� 11,072,361� 11,823,439� 0.25Morgan�Stanley�5.5%�24/7/2020�'GMTN'� 8,545,000� USD� 8,896,058� 9,628,241� 0.20Morgan�Stanley�6.625%�1/4/2018�'GMTN'� 7,097,000� USD� 7,027,930� 8,077,905� 0.17MUFG�Union�Bank�NA�2.125%�16/6/2017�'BKNT'� 5,170,000� USD� 5,162,363� 5,224,916� 0.11Municipal�Electric�Authority�of�Georgia�6.637%�1/4/2057�� 2,000,000� USD� 1,980,780� 2,647,520� 0.06Mylan�Inc/PA�1.8%�24/6/2016�� 9,000,000� USD� 8,996,683� 9,054,918� 0.19Narragansett�Electric�Co/The�4.17%�10/12/2042�'144A'� 5,097,000� USD� 5,097,000� 5,236,683� 0.11National�Rural�Utilities�Cooperative�Finance�Corp�3.05%�15/2/2022�� 886,000� USD� 883,839� 893,395� 0.02NBCUniversal�Enterprise�Inc�1.974%�15/4/2019�'144A'� 10,364,000� USD� 10,359,813� 10,250,286� 0.22NBCUniversal�Enterprise�Inc�5.25%�Perpetual�'144A'� 14,775,000� USD� 14,775,000� 15,329,063� 0.32NBCUniversal�Media�LLC�4.375%�1/4/2021�� 7,231,000� USD� 7,467,480� 7,935,458� 0.17NBCUniversal�Media�LLC�5.95%�1/4/2041�� 912,000� USD� 909,811� 1,170,972� 0.02NetApp�Inc�2%�15/12/2017�� 8,623,000� USD� 8,597,320� 8,666,037� 0.18Nevada�Power�Co�5.375%�15/9/2040�� 2,250,000� USD� 2,244,007� 2,745,414� 0.06New�Jersey�State�Turnpike�Authority�7.102%�1/1/2041�� 4,825,000� USD� 4,825,000� 6,988,578� 0.15New�York�City�Transitional�Finance�Authority�Future�Tax��Secured�Revenue�5.767%�1/8/2036�� 3,500,000� USD� 3,500,000� 4,383,400� 0.09New�York�City�Water�&�Sewer�System�5.75%�15/6/2041�� 3,750,000� USD� 3,750,000� 4,934,438� 0.10New�York�Life�Insurance�Co�6.75%�15/11/2039�'144A'� 2,800,000� USD� 3,178,176� 3,891,703� 0.08Norfolk�Southern�Corp�6%�23/5/2111�� 3,529,000� USD� 3,529,000� 4,516,464� 0.10Northern�States�Power�Co/MN�6.2%�1/7/2037�� 950,000� USD� 984,716� 1,295,143� 0.03Northwestern�Mutual�Life�Insurance�Co/The�6.063%��30/3/2040�'144A'� 1,391,000� USD� 1,391,000� 1,795,379� 0.04NuStar�Logistics�LP�8.15%�15/4/2018�� 2,000,000� USD� 1,998,703� 2,242,300� 0.05NYU�Hospitals�Center�4.428%�1/7/2042�� 5,537,000� USD� 5,537,000� 5,600,559� 0.12NYU�Hospitals�Center�5.75%�1/7/2043�� 3,824,000� USD� 3,824,000� 4,682,056� 0.10Oglethorpe�Power�Corp�4.2%�1/12/2042�� 8,295,000� USD� 8,250,624� 8,354,774� 0.18Oglethorpe�Power�Corp�4.55%�1/6/2044�� 5,990,000� USD� 5,952,967� 6,304,427� 0.13Oglethorpe�Power�Corp�5.375%�1/11/2040�� 2,030,000� USD� 2,025,625� 2,385,492� 0.05Oglethorpe�Power�Corp�5.95%�1/11/2039�� 1,961,000� USD� 1,961,000� 2,513,961� 0.05Oncor�Electric�Delivery�Co�LLC�4.55%�1/12/2041�� 3,500,000� USD� 3,493,854� 3,948,746� 0.08Oracle�Corp�1.2%�15/10/2017�� 10,000,000� USD� 9,990,325� 9,958,560� 0.21Oracle�Corp�3.4%�8/7/2024�� 42,500,000� USD� 42,408,348� 43,386,677� 0.92
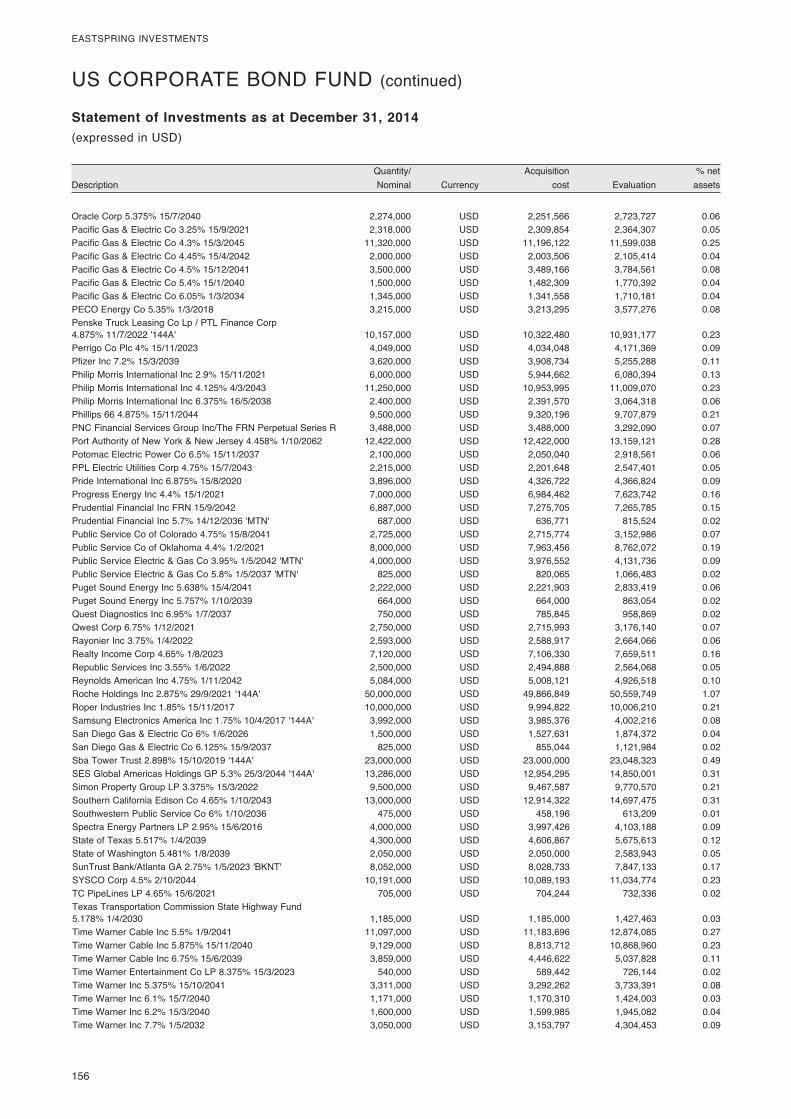
156�
EASTSPRING�INVESTMENTS
� Quantity/�� � Acquisition�� � %�net�Description� Nominal�� Currency�� cost�� Evaluation�� assets�
Statement of Investments as at December 31, 2014(expressed�in�USD)
US�CORPORATE�BOND�FUND�(continued)
Oracle�Corp�5.375%�15/7/2040�� 2,274,000� USD� 2,251,566� 2,723,727� 0.06Pacific�Gas�&�Electric�Co�3.25%�15/9/2021�� 2,318,000� USD� 2,309,854� 2,364,307� 0.05Pacific�Gas�&�Electric�Co�4.3%�15/3/2045�� 11,320,000� USD� 11,196,122� 11,599,038� 0.25Pacific�Gas�&�Electric�Co�4.45%�15/4/2042�� 2,000,000� USD� 2,003,506� 2,105,414� 0.04Pacific�Gas�&�Electric�Co�4.5%�15/12/2041�� 3,500,000� USD� 3,489,166� 3,784,561� 0.08Pacific�Gas�&�Electric�Co�5.4%�15/1/2040�� 1,500,000� USD� 1,482,309� 1,770,392� 0.04Pacific�Gas�&�Electric�Co�6.05%�1/3/2034�� 1,345,000� USD� 1,341,558� 1,710,181� 0.04PECO�Energy�Co�5.35%�1/3/2018�� 3,215,000� USD� 3,213,295� 3,577,276� 0.08Penske�Truck�Leasing�Co�Lp�/�PTL�Finance�Corp��4.875%�11/7/2022�'144A'� 10,157,000� USD� 10,322,480� 10,931,177� 0.23Perrigo�Co�Plc�4%�15/11/2023�� 4,049,000� USD� 4,034,048� 4,171,369� 0.09Pfizer�Inc�7.2%�15/3/2039�� 3,620,000� USD� 3,908,734� 5,255,288� 0.11Philip�Morris�International�Inc�2.9%�15/11/2021�� 6,000,000� USD� 5,944,662� 6,080,394� 0.13Philip�Morris�International�Inc�4.125%�4/3/2043�� 11,250,000� USD� 10,953,995� 11,009,070� 0.23Philip�Morris�International�Inc�6.375%�16/5/2038�� 2,400,000� USD� 2,391,570� 3,064,318� 0.06Phillips�66�4.875%�15/11/2044�� 9,500,000� USD� 9,320,196� 9,707,879� 0.21PNC�Financial�Services�Group�Inc/The�FRN�Perpetual�Series�R� 3,488,000� USD� 3,488,000� 3,292,090� 0.07Port�Authority�of�New�York�&�New�Jersey�4.458%�1/10/2062�� 12,422,000� USD� 12,422,000� 13,159,121� 0.28Potomac�Electric�Power�Co�6.5%�15/11/2037�� 2,100,000� USD� 2,050,040� 2,918,561� 0.06PPL�Electric�Utilities�Corp�4.75%�15/7/2043�� 2,215,000� USD� 2,201,648� 2,547,401� 0.05Pride�International�Inc�6.875%�15/8/2020�� 3,896,000� USD� 4,326,722� 4,366,824� 0.09Progress�Energy�Inc�4.4%�15/1/2021�� 7,000,000� USD� 6,984,462� 7,623,742� 0.16Prudential�Financial�Inc�FRN�15/9/2042�� 6,887,000� USD� 7,275,705� 7,265,785� 0.15Prudential�Financial�Inc�5.7%�14/12/2036�'MTN'� 687,000� USD� 636,771� 815,524� 0.02Public�Service�Co�of�Colorado�4.75%�15/8/2041�� 2,725,000� USD� 2,715,774� 3,152,986� 0.07Public�Service�Co�of�Oklahoma�4.4%�1/2/2021�� 8,000,000� USD� 7,963,456� 8,762,072� 0.19Public�Service�Electric�&�Gas�Co�3.95%�1/5/2042�'MTN'� 4,000,000� USD� 3,976,552� 4,131,736� 0.09Public�Service�Electric�&�Gas�Co�5.8%�1/5/2037�'MTN'� 825,000� USD� 820,065� 1,066,483� 0.02Puget�Sound�Energy�Inc�5.638%�15/4/2041�� 2,222,000� USD� 2,221,903� 2,833,419� 0.06Puget�Sound�Energy�Inc�5.757%�1/10/2039�� 664,000� USD� 664,000� 863,054� 0.02Quest�Diagnostics�Inc�6.95%�1/7/2037�� 750,000� USD� 785,845� 958,869� 0.02Qwest�Corp�6.75%�1/12/2021�� 2,750,000� USD� 2,715,993� 3,176,140� 0.07Rayonier�Inc�3.75%�1/4/2022�� 2,593,000� USD� 2,588,917� 2,664,066� 0.06Realty�Income�Corp�4.65%�1/8/2023�� 7,120,000� USD� 7,106,330� 7,659,511� 0.16Republic�Services�Inc�3.55%�1/6/2022�� 2,500,000� USD� 2,494,888� 2,564,068� 0.05Reynolds�American�Inc�4.75%�1/11/2042�� 5,084,000� USD� 5,008,121� 4,926,518� 0.10Roche�Holdings�Inc�2.875%�29/9/2021�'144A'� 50,000,000� USD� 49,866,849� 50,559,749� 1.07Roper�Industries�Inc�1.85%�15/11/2017�� 10,000,000� USD� 9,994,822� 10,006,210� 0.21Samsung�Electronics�America�Inc�1.75%�10/4/2017�'144A'� 3,992,000� USD� 3,985,376� 4,002,216� 0.08San�Diego�Gas�&�Electric�Co�6%�1/6/2026�� 1,500,000� USD� 1,527,631� 1,874,372� 0.04San�Diego�Gas�&�Electric�Co�6.125%�15/9/2037�� 825,000� USD� 855,044� 1,121,984� 0.02Sba�Tower�Trust�2.898%�15/10/2019�'144A'� 23,000,000� USD� 23,000,000� 23,048,323� 0.49SES�Global�Americas�Holdings�GP�5.3%�25/3/2044�'144A'� 13,286,000� USD� 12,954,295� 14,850,001� 0.31Simon�Property�Group�LP�3.375%�15/3/2022�� 9,500,000� USD� 9,467,587� 9,770,570� 0.21Southern�California�Edison�Co�4.65%�1/10/2043�� 13,000,000� USD� 12,914,322� 14,697,475� 0.31Southwestern�Public�Service�Co�6%�1/10/2036�� 475,000� USD� 458,196� 613,209� 0.01Spectra�Energy�Partners�LP�2.95%�15/6/2016�� 4,000,000� USD� 3,997,426� 4,103,188� 0.09State�of�Texas�5.517%�1/4/2039�� 4,300,000� USD� 4,606,867� 5,675,613� 0.12State�of�Washington�5.481%�1/8/2039�� 2,050,000� USD� 2,050,000� 2,583,943� 0.05SunTrust�Bank/Atlanta�GA�2.75%�1/5/2023�'BKNT'� 8,052,000� USD� 8,028,733� 7,847,133� 0.17SYSCO�Corp�4.5%�2/10/2044�� 10,191,000� USD� 10,089,193� 11,034,774� 0.23TC�PipeLines�LP�4.65%�15/6/2021�� 705,000� USD� 704,244� 732,336� 0.02Texas�Transportation�Commission�State�Highway�Fund��5.178%�1/4/2030�� 1,185,000� USD� 1,185,000� 1,427,463� 0.03Time�Warner�Cable�Inc�5.5%�1/9/2041�� 11,097,000� USD� 11,183,696� 12,874,085� 0.27Time�Warner�Cable�Inc�5.875%�15/11/2040�� 9,129,000� USD� 8,813,712� 10,868,960� 0.23Time�Warner�Cable�Inc�6.75%�15/6/2039�� 3,859,000� USD� 4,446,622� 5,037,828� 0.11Time�Warner�Entertainment�Co�LP�8.375%�15/3/2023�� 540,000� USD� 589,442� 726,144� 0.02Time�Warner�Inc�5.375%�15/10/2041�� 3,311,000� USD� 3,292,262� 3,733,391� 0.08Time�Warner�Inc�6.1%�15/7/2040�� 1,171,000� USD� 1,170,310� 1,424,003� 0.03Time�Warner�Inc�6.2%�15/3/2040�� 1,600,000� USD� 1,599,985� 1,945,082� 0.04Time�Warner�Inc�7.7%�1/5/2032�� 3,050,000� USD� 3,153,797� 4,304,453� 0.09
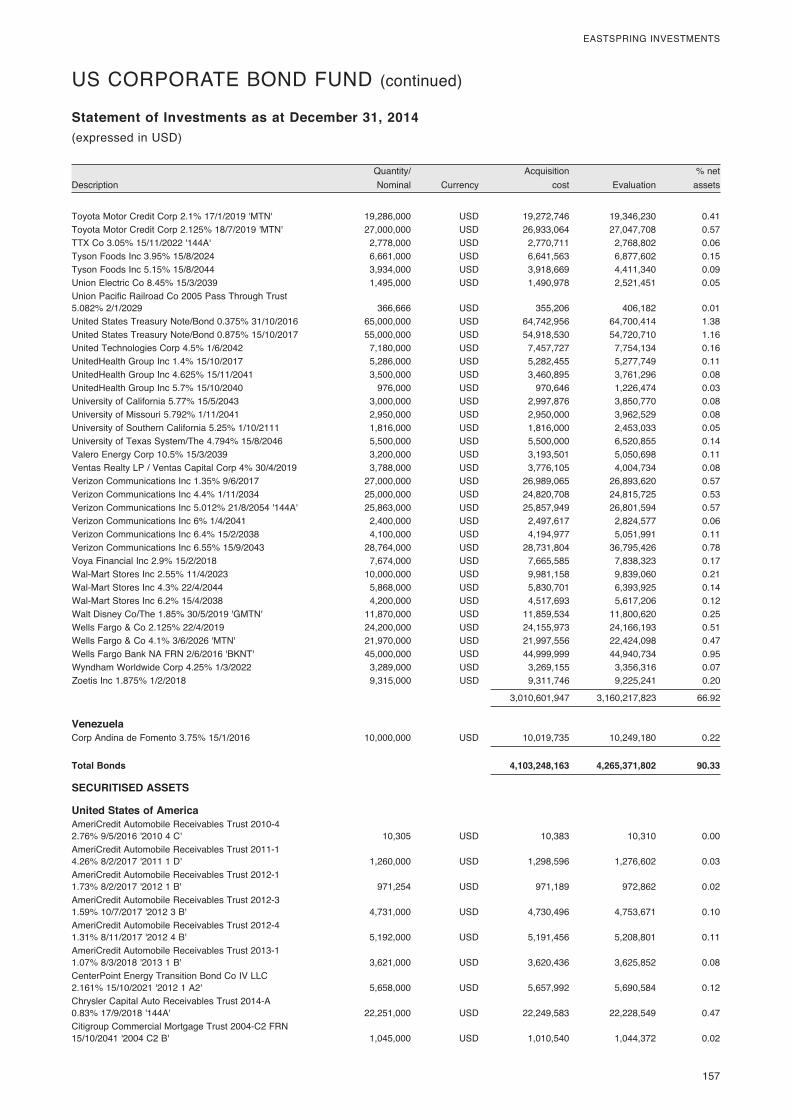
� 157
EASTSPRING�INVESTMENTS
� Quantity/�� � Acquisition�� � %�net�Description� Nominal�� Currency�� cost�� Evaluation�� assets�
Statement of Investments as at December 31, 2014(expressed�in�USD)
US�CORPORATE�BOND�FUND�(continued)
Toyota�Motor�Credit�Corp�2.1%�17/1/2019�'MTN'� 19,286,000� USD� 19,272,746� 19,346,230� 0.41Toyota�Motor�Credit�Corp�2.125%�18/7/2019�'MTN'� 27,000,000� USD� 26,933,064� 27,047,708� 0.57TTX�Co�3.05%�15/11/2022�'144A'� 2,778,000� USD� 2,770,711� 2,768,802� 0.06Tyson�Foods�Inc�3.95%�15/8/2024�� 6,661,000� USD� 6,641,563� 6,877,602� 0.15Tyson�Foods�Inc�5.15%�15/8/2044�� 3,934,000� USD� 3,918,669� 4,411,340� 0.09Union�Electric�Co�8.45%�15/3/2039�� 1,495,000� USD� 1,490,978� 2,521,451� 0.05Union�Pacific�Railroad�Co�2005�Pass�Through�Trust��5.082%�2/1/2029�� 366,666� USD� 355,206� 406,182� 0.01United�States�Treasury�Note/Bond�0.375%�31/10/2016�� 65,000,000� USD� 64,742,956� 64,700,414� 1.38United�States�Treasury�Note/Bond�0.875%�15/10/2017�� 55,000,000� USD� 54,918,530� 54,720,710� 1.16United�Technologies�Corp�4.5%�1/6/2042�� 7,180,000� USD� 7,457,727� 7,754,134� 0.16UnitedHealth�Group�Inc�1.4%�15/10/2017�� 5,286,000� USD� 5,282,455� 5,277,749� 0.11UnitedHealth�Group�Inc�4.625%�15/11/2041�� 3,500,000� USD� 3,460,895� 3,761,296� 0.08UnitedHealth�Group�Inc�5.7%�15/10/2040�� 976,000� USD� 970,646� 1,226,474� 0.03University�of�California�5.77%�15/5/2043�� 3,000,000� USD� 2,997,876� 3,850,770� 0.08University�of�Missouri�5.792%�1/11/2041�� 2,950,000� USD� 2,950,000� 3,962,529� 0.08University�of�Southern�California�5.25%�1/10/2111�� 1,816,000� USD� 1,816,000� 2,453,033� 0.05University�of�Texas�System/The�4.794%�15/8/2046�� 5,500,000� USD� 5,500,000� 6,520,855� 0.14Valero�Energy�Corp�10.5%�15/3/2039�� 3,200,000� USD� 3,193,501� 5,050,698� 0.11Ventas�Realty�LP�/�Ventas�Capital�Corp�4%�30/4/2019�� 3,788,000� USD� 3,776,105� 4,004,734� 0.08Verizon�Communications�Inc�1.35%�9/6/2017�� 27,000,000� USD� 26,989,065� 26,893,620� 0.57Verizon�Communications�Inc�4.4%�1/11/2034�� 25,000,000� USD� 24,820,708� 24,815,725� 0.53Verizon�Communications�Inc�5.012%�21/8/2054�'144A'� 25,863,000� USD� 25,857,949� 26,801,594� 0.57Verizon�Communications�Inc�6%�1/4/2041�� 2,400,000� USD� 2,497,617� 2,824,577� 0.06Verizon�Communications�Inc�6.4%�15/2/2038�� 4,100,000� USD� 4,194,977� 5,051,991� 0.11Verizon�Communications�Inc�6.55%�15/9/2043�� 28,764,000� USD� 28,731,804� 36,795,426� 0.78Voya�Financial�Inc�2.9%�15/2/2018�� 7,674,000� USD� 7,665,585� 7,838,323� 0.17Wal-Mart�Stores�Inc�2.55%�11/4/2023�� 10,000,000� USD� 9,981,158� 9,839,060� 0.21Wal-Mart�Stores�Inc�4.3%�22/4/2044�� 5,868,000� USD� 5,830,701� 6,393,925� 0.14Wal-Mart�Stores�Inc�6.2%�15/4/2038�� 4,200,000� USD� 4,517,693� 5,617,206� 0.12Walt�Disney�Co/The�1.85%�30/5/2019�'GMTN'� 11,870,000� USD� 11,859,534� 11,800,620� 0.25Wells�Fargo�&�Co�2.125%�22/4/2019�� 24,200,000� USD� 24,155,973� 24,166,193� 0.51Wells�Fargo�&�Co�4.1%�3/6/2026�'MTN'� 21,970,000� USD� 21,997,556� 22,424,098� 0.47Wells�Fargo�Bank�NA�FRN�2/6/2016�'BKNT'� 45,000,000� USD� 44,999,999� 44,940,734� 0.95Wyndham�Worldwide�Corp�4.25%�1/3/2022�� 3,289,000� USD� 3,269,155� 3,356,316� 0.07Zoetis�Inc�1.875%�1/2/2018�� 9,315,000� USD� 9,311,746� 9,225,241� 0.20
� � � 3,010,601,947� 3,160,217,823� 66.92
Venezuela Corp�Andina�de�Fomento�3.75%�15/1/2016�� 10,000,000� USD� 10,019,735� 10,249,180� 0.22
Total Bonds 4,103,248,163 4,265,371,802 90.33
SECURITISED ASSETS
United States of America AmeriCredit�Automobile�Receivables�Trust�2010-4��2.76%�9/5/2016�'2010�4�C'� 10,305� USD� 10,383� 10,310� 0.00AmeriCredit�Automobile�Receivables�Trust�2011-1��4.26%�8/2/2017�'2011�1�D'� 1,260,000� USD� 1,298,596� 1,276,602� 0.03AmeriCredit�Automobile�Receivables�Trust�2012-1��1.73%�8/2/2017�'2012�1�B'� 971,254� USD� 971,189� 972,862� 0.02AmeriCredit�Automobile�Receivables�Trust�2012-3��1.59%�10/7/2017�'2012�3�B'� 4,731,000� USD� 4,730,496� 4,753,671� 0.10AmeriCredit�Automobile�Receivables�Trust�2012-4��1.31%�8/11/2017�'2012�4�B'� 5,192,000� USD� 5,191,456� 5,208,801� 0.11AmeriCredit�Automobile�Receivables�Trust�2013-1��1.07%�8/3/2018�'2013�1�B'� 3,621,000� USD� 3,620,436� 3,625,852� 0.08CenterPoint�Energy�Transition�Bond�Co�IV�LLC��2.161%�15/10/2021�'2012�1�A2'� 5,658,000� USD� 5,657,992� 5,690,584� 0.12Chrysler�Capital�Auto�Receivables�Trust�2014-A��0.83%�17/9/2018�'144A'� 22,251,000� USD� 22,249,583� 22,228,549� 0.47Citigroup�Commercial�Mortgage�Trust�2004-C2�FRN��15/10/2041�'2004�C2�B'� 1,045,000� USD� 1,010,540� 1,044,372� 0.02
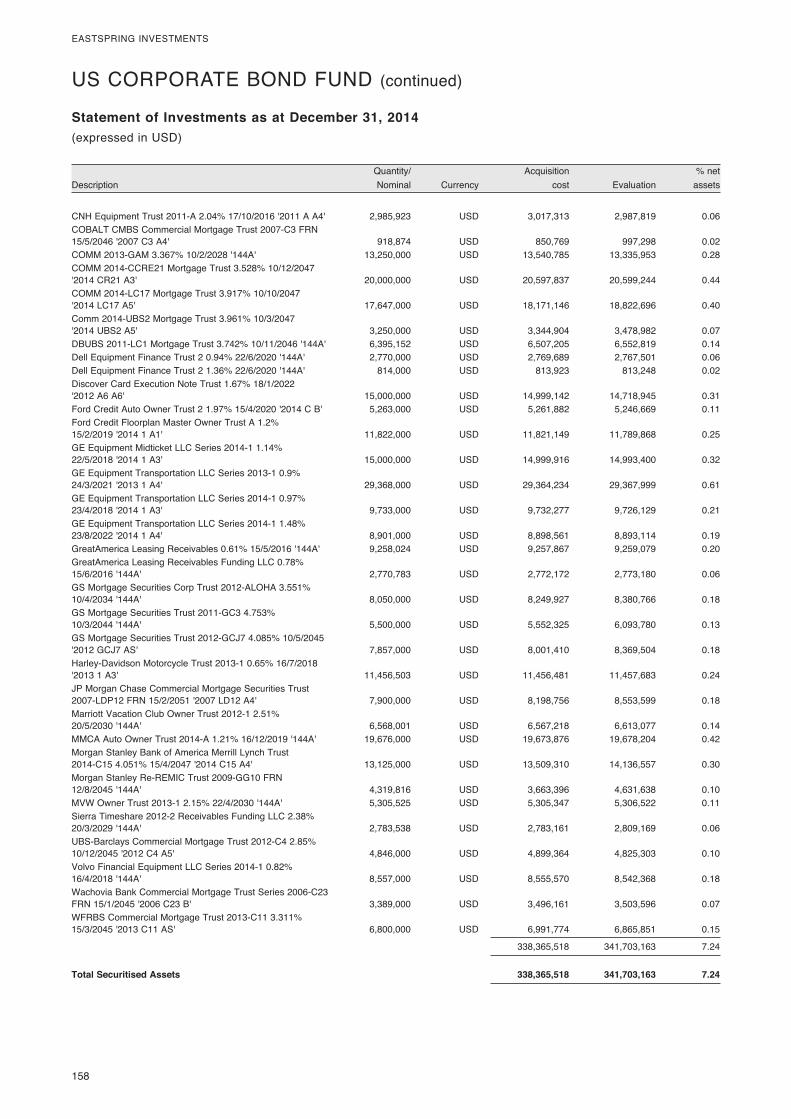
158�
EASTSPRING�INVESTMENTS
� Quantity/�� � Acquisition�� � %�net�Description� Nominal�� Currency�� cost�� Evaluation�� assets�
Statement of Investments as at December 31, 2014(expressed�in�USD)
CNH�Equipment�Trust�2011-A�2.04%�17/10/2016�'2011�A�A4'� 2,985,923� USD� 3,017,313� 2,987,819� 0.06COBALT�CMBS�Commercial�Mortgage�Trust�2007-C3�FRN��15/5/2046�'2007�C3�A4'� 918,874� USD� 850,769� 997,298� 0.02COMM�2013-GAM�3.367%�10/2/2028�'144A'� 13,250,000� USD� 13,540,785� 13,335,953� 0.28COMM�2014-CCRE21�Mortgage�Trust�3.528%�10/12/2047��'2014�CR21�A3'� 20,000,000� USD� 20,597,837� 20,599,244� 0.44COMM�2014-LC17�Mortgage�Trust�3.917%�10/10/2047��'2014�LC17�A5'� 17,647,000� USD� 18,171,146� 18,822,696� 0.40Comm�2014-UBS2�Mortgage�Trust�3.961%�10/3/2047��'2014�UBS2�A5'� 3,250,000� USD� 3,344,904� 3,478,982� 0.07DBUBS�2011-LC1�Mortgage�Trust�3.742%�10/11/2046�'144A'� 6,395,152� USD� 6,507,205� 6,552,819� 0.14Dell�Equipment�Finance�Trust�2�0.94%�22/6/2020�'144A'� 2,770,000� USD� 2,769,689� 2,767,501� 0.06Dell�Equipment�Finance�Trust�2�1.36%�22/6/2020�'144A'� 814,000� USD� 813,923� 813,248� 0.02Discover�Card�Execution�Note�Trust�1.67%�18/1/2022��'2012�A6�A6'� 15,000,000� USD� 14,999,142� 14,718,945� 0.31Ford�Credit�Auto�Owner�Trust�2�1.97%�15/4/2020�'2014�C�B'� 5,263,000� USD� 5,261,882� 5,246,669� 0.11Ford�Credit�Floorplan�Master�Owner�Trust�A�1.2%��15/2/2019�'2014�1�A1'� 11,822,000� USD� 11,821,149� 11,789,868� 0.25GE�Equipment�Midticket�LLC�Series�2014-1�1.14%��22/5/2018�'2014�1�A3'� 15,000,000� USD� 14,999,916� 14,993,400� 0.32GE�Equipment�Transportation�LLC�Series�2013-1�0.9%��24/3/2021�'2013�1�A4'� 29,368,000� USD� 29,364,234� 29,367,999� 0.61GE�Equipment�Transportation�LLC�Series�2014-1�0.97%��23/4/2018�'2014�1�A3'� 9,733,000� USD� 9,732,277� 9,726,129� 0.21GE�Equipment�Transportation�LLC�Series�2014-1�1.48%��23/8/2022�'2014�1�A4'� 8,901,000� USD� 8,898,561� 8,893,114� 0.19GreatAmerica�Leasing�Receivables�0.61%�15/5/2016�'144A'� 9,258,024� USD� 9,257,867� 9,259,079� 0.20GreatAmerica�Leasing�Receivables�Funding�LLC�0.78%��15/6/2016�'144A'� 2,770,783� USD� 2,772,172� 2,773,180� 0.06GS�Mortgage�Securities�Corp�Trust�2012-ALOHA�3.551%��10/4/2034�'144A'� 8,050,000� USD� 8,249,927� 8,380,766� 0.18GS�Mortgage�Securities�Trust�2011-GC3�4.753%��10/3/2044�'144A'� 5,500,000� USD� 5,552,325� 6,093,780� 0.13GS�Mortgage�Securities�Trust�2012-GCJ7�4.085%�10/5/2045��'2012�GCJ7�AS'� 7,857,000� USD� 8,001,410� 8,369,504� 0.18Harley-Davidson�Motorcycle�Trust�2013-1�0.65%�16/7/2018��'2013�1�A3'� 11,456,503� USD� 11,456,481� 11,457,683� 0.24JP�Morgan�Chase�Commercial�Mortgage�Securities�Trust��2007-LDP12�FRN�15/2/2051�'2007�LD12�A4'� 7,900,000� USD� 8,198,756� 8,553,599� 0.18Marriott�Vacation�Club�Owner�Trust�2012-1�2.51%��20/5/2030�'144A'� 6,568,001� USD� 6,567,218� 6,613,077� 0.14MMCA�Auto�Owner�Trust�2014-A�1.21%�16/12/2019�'144A'� 19,676,000� USD� 19,673,876� 19,678,204� 0.42Morgan�Stanley�Bank�of�America�Merrill�Lynch�Trust��2014-C15�4.051%�15/4/2047�'2014�C15�A4'� 13,125,000� USD� 13,509,310� 14,136,557� 0.30Morgan�Stanley�Re-REMIC�Trust�2009-GG10�FRN��12/8/2045�'144A'� 4,319,816� USD� 3,663,396� 4,631,638� 0.10MVW�Owner�Trust�2013-1�2.15%�22/4/2030�'144A'� 5,305,525� USD� 5,305,347� 5,306,522� 0.11Sierra�Timeshare�2012-2�Receivables�Funding�LLC�2.38%��20/3/2029�'144A'� 2,783,538� USD� 2,783,161� 2,809,169� 0.06UBS-Barclays�Commercial�Mortgage�Trust�2012-C4�2.85%��10/12/2045�'2012�C4�A5'� 4,846,000� USD� 4,899,364� 4,825,303� 0.10Volvo�Financial�Equipment�LLC�Series�2014-1�0.82%��16/4/2018�'144A'� 8,557,000� USD� 8,555,570� 8,542,368� 0.18Wachovia�Bank�Commercial�Mortgage�Trust�Series�2006-C23��FRN�15/1/2045�'2006�C23�B'� 3,389,000� USD� 3,496,161� 3,503,596� 0.07WFRBS�Commercial�Mortgage�Trust�2013-C11�3.311%��15/3/2045�'2013�C11�AS'� 6,800,000� USD� 6,991,774� 6,865,851� 0.15
� � � 338,365,518� 341,703,163� 7.24
Total Securitised Assets 338,365,518 341,703,163 7.24
US�CORPORATE�BOND�FUND�(continued)
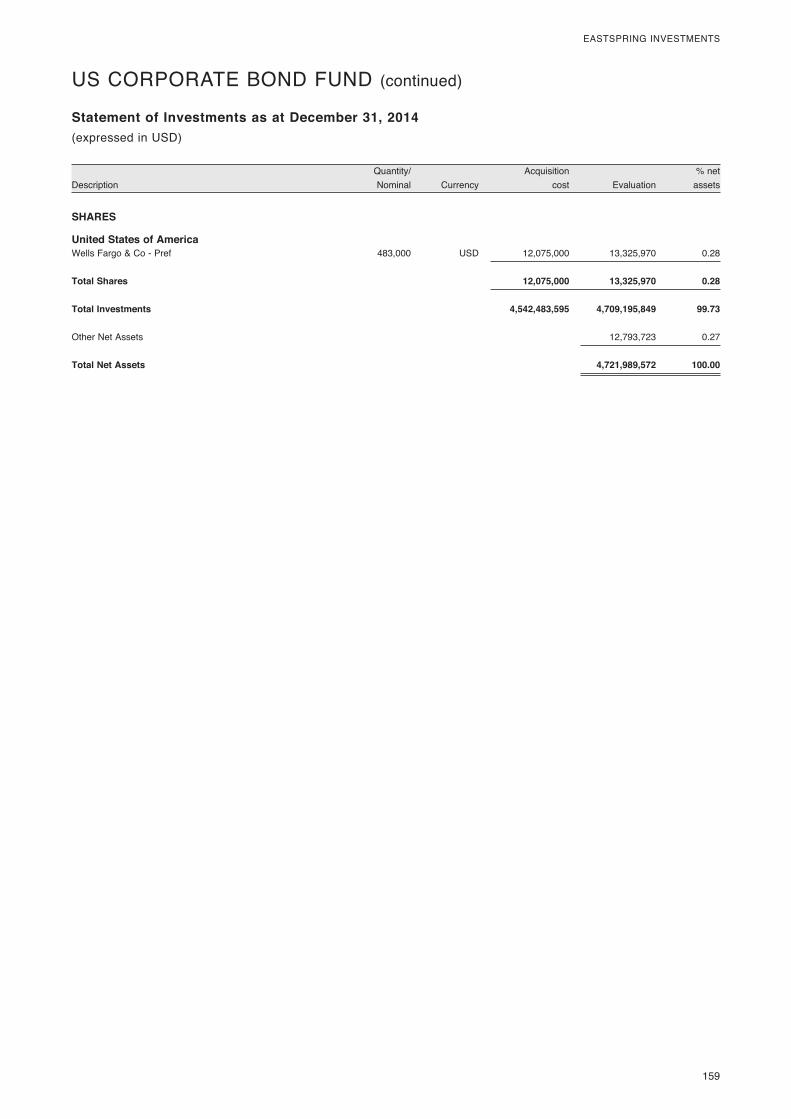
� 159
EASTSPRING�INVESTMENTS
� Quantity/�� � Acquisition�� � %�net�Description� Nominal�� Currency�� cost�� Evaluation�� assets�
Statement of Investments as at December 31, 2014(expressed�in�USD)
SHARES
United States of America Wells�Fargo�&�Co�-�Pref�� 483,000� USD� 12,075,000� 13,325,970� 0.28
Total Shares 12,075,000 13,325,970 0.28
Total Investments 4,542,483,595 4,709,195,849 99.73
Other�Net�Assets� � � � 12,793,723� 0.27
Total Net Assets 4,721,989,572 100.00
US�CORPORATE�BOND�FUND�(continued)
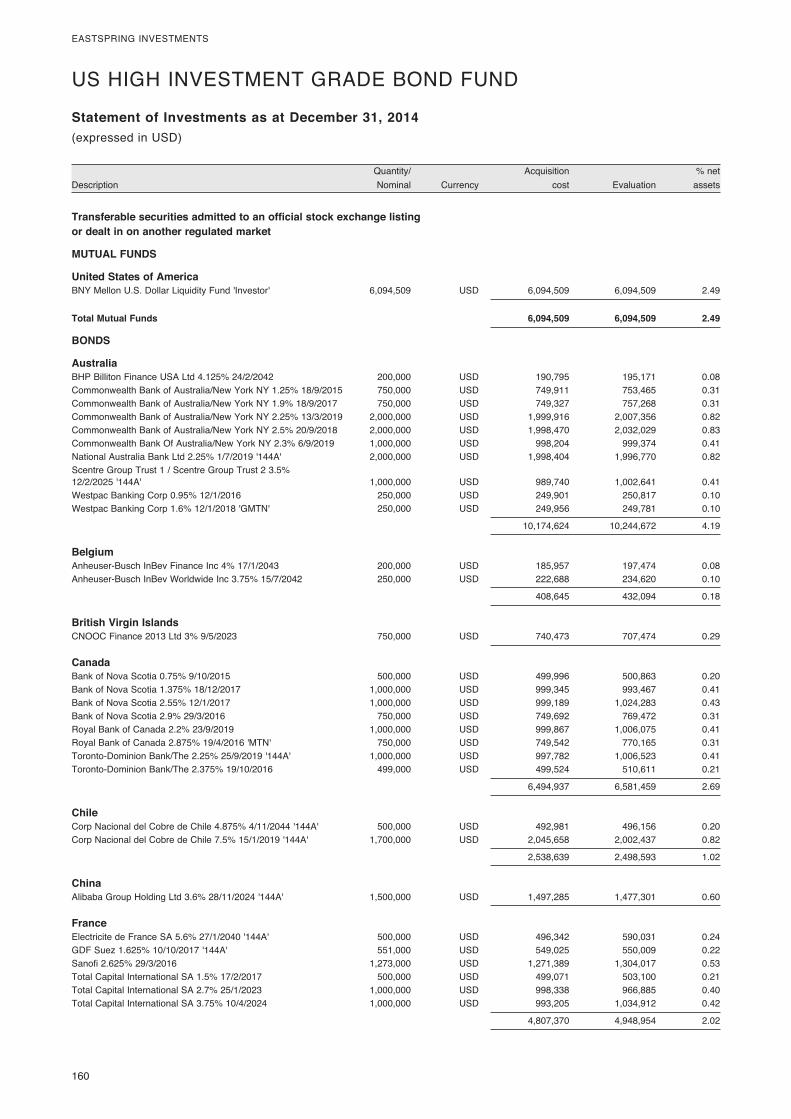
160�
EASTSPRING�INVESTMENTS
� Quantity/�� � Acquisition�� � %�net�Description� Nominal�� Currency�� cost�� Evaluation�� assets�
Statement of Investments as at December 31, 2014(expressed�in�USD)
US�HIGH�INVESTMENT�GRADE�BOND�FUND�
Transferable securities admitted to an official stock exchange listing or dealt in on another regulated market
MUTUAL FUNDS
United States of America BNY�Mellon�U.S.�Dollar�Liquidity�Fund�'Investor'�� 6,094,509� USD� 6,094,509� 6,094,509� 2.49
Total Mutual Funds 6,094,509 6,094,509 2.49
BONDS
Australia BHP�Billiton�Finance�USA�Ltd�4.125%�24/2/2042�� 200,000� USD� 190,795� 195,171� 0.08Commonwealth�Bank�of�Australia/New�York�NY�1.25%�18/9/2015�� 750,000� USD� 749,911� 753,465� 0.31Commonwealth�Bank�of�Australia/New�York�NY�1.9%�18/9/2017�� 750,000� USD� 749,327� 757,268� 0.31Commonwealth�Bank�of�Australia/New�York�NY�2.25%�13/3/2019�� 2,000,000� USD� 1,999,916� 2,007,356� 0.82Commonwealth�Bank�of�Australia/New�York�NY�2.5%�20/9/2018�� 2,000,000� USD� 1,998,470� 2,032,029� 0.83Commonwealth�Bank�Of�Australia/New�York�NY�2.3%�6/9/2019�� 1,000,000� USD� 998,204� 999,374� 0.41National�Australia�Bank�Ltd�2.25%�1/7/2019�'144A'� 2,000,000� USD� 1,998,404� 1,996,770� 0.82Scentre�Group�Trust�1�/�Scentre�Group�Trust�2�3.5%��12/2/2025�'144A'� 1,000,000� USD� 989,740� 1,002,641� 0.41Westpac�Banking�Corp�0.95%�12/1/2016�� 250,000� USD� 249,901� 250,817� 0.10Westpac�Banking�Corp�1.6%�12/1/2018�'GMTN'� 250,000� USD� 249,956� 249,781� 0.10
� � � 10,174,624� 10,244,672� 4.19
Belgium Anheuser-Busch�InBev�Finance�Inc�4%�17/1/2043�� 200,000� USD� 185,957� 197,474� 0.08Anheuser-Busch�InBev�Worldwide�Inc�3.75%�15/7/2042�� 250,000� USD� 222,688� 234,620� 0.10
� � � 408,645� 432,094� 0.18
British Virgin Islands CNOOC�Finance�2013�Ltd�3%�9/5/2023�� 750,000� USD� 740,473� 707,474� 0.29
Canada Bank�of�Nova�Scotia�0.75%�9/10/2015�� 500,000� USD� 499,996� 500,863� 0.20Bank�of�Nova�Scotia�1.375%�18/12/2017�� 1,000,000� USD� 999,345� 993,467� 0.41Bank�of�Nova�Scotia�2.55%�12/1/2017�� 1,000,000� USD� 999,189� 1,024,283� 0.43Bank�of�Nova�Scotia�2.9%�29/3/2016�� 750,000� USD� 749,692� 769,472� 0.31Royal�Bank�of�Canada�2.2%�23/9/2019�� 1,000,000� USD� 999,867� 1,006,075� 0.41Royal�Bank�of�Canada�2.875%�19/4/2016�'MTN'� 750,000� USD� 749,542� 770,165� 0.31Toronto-Dominion�Bank/The�2.25%�25/9/2019�'144A'� 1,000,000� USD� 997,782� 1,006,523� 0.41Toronto-Dominion�Bank/The�2.375%�19/10/2016�� 499,000� USD� 499,524� 510,611� 0.21
� � � 6,494,937� 6,581,459� 2.69
Chile Corp�Nacional�del�Cobre�de�Chile�4.875%�4/11/2044�'144A'� 500,000� USD� 492,981� 496,156� 0.20Corp�Nacional�del�Cobre�de�Chile�7.5%�15/1/2019�'144A'� 1,700,000� USD� 2,045,658� 2,002,437� 0.82
� � � 2,538,639� 2,498,593� 1.02
China Alibaba�Group�Holding�Ltd�3.6%�28/11/2024�'144A'� 1,500,000� USD� 1,497,285� 1,477,301� 0.60
France Electricite�de�France�SA�5.6%�27/1/2040�'144A'� 500,000� USD� 496,342� 590,031� 0.24GDF�Suez�1.625%�10/10/2017�'144A'� 551,000� USD� 549,025� 550,009� 0.22Sanofi�2.625%�29/3/2016�� 1,273,000� USD� 1,271,389� 1,304,017� 0.53Total�Capital�International�SA�1.5%�17/2/2017�� 500,000� USD� 499,071� 503,100� 0.21Total�Capital�International�SA�2.7%�25/1/2023�� 1,000,000� USD� 998,338� 966,885� 0.40Total�Capital�International�SA�3.75%�10/4/2024�� 1,000,000� USD� 993,205� 1,034,912� 0.42
� � � 4,807,370� 4,948,954� 2.02
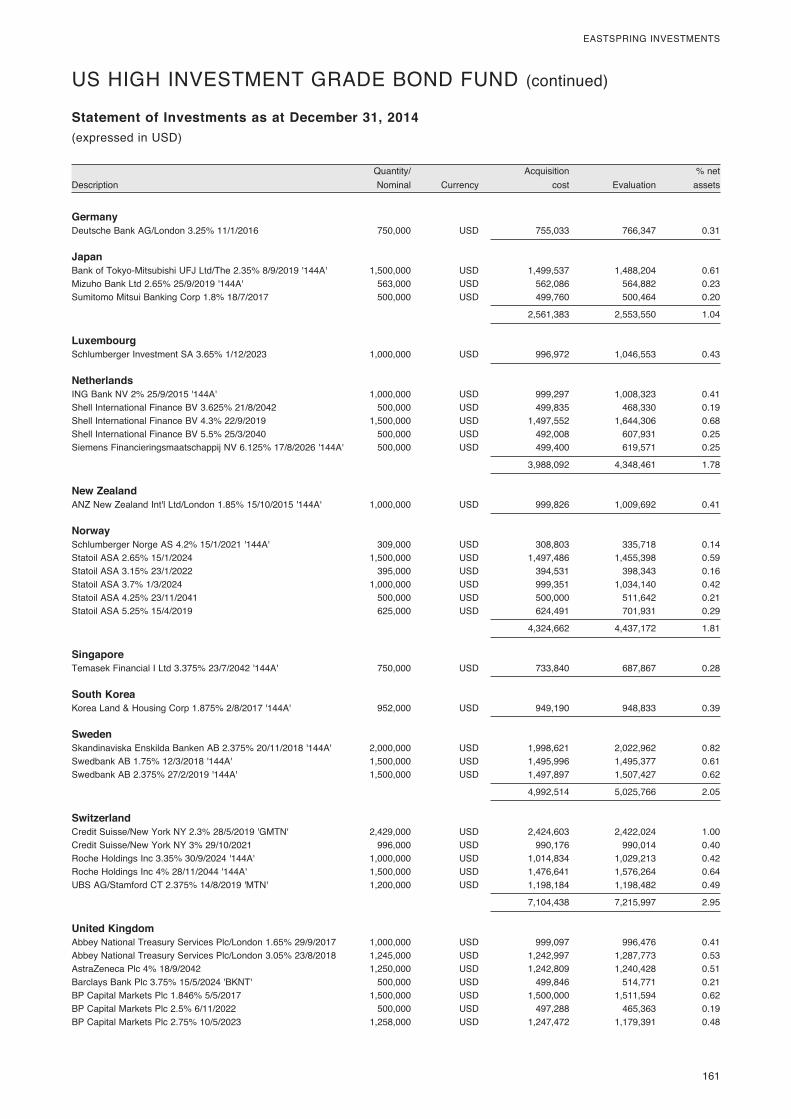
� 161
EASTSPRING�INVESTMENTS
� Quantity/�� � Acquisition�� � %�net�Description� Nominal�� Currency�� cost�� Evaluation�� assets�
Statement of Investments as at December 31, 2014(expressed�in�USD)
US�HIGH�INVESTMENT�GRADE�BOND�FUND�(continued)
Germany Deutsche�Bank�AG/London�3.25%�11/1/2016�� 750,000� USD� 755,033� 766,347� 0.31
Japan Bank�of�Tokyo-Mitsubishi�UFJ�Ltd/The�2.35%�8/9/2019�'144A'� 1,500,000� USD� 1,499,537� 1,488,204� 0.61Mizuho�Bank�Ltd�2.65%�25/9/2019�'144A'� 563,000� USD� 562,086� 564,882� 0.23Sumitomo�Mitsui�Banking�Corp�1.8%�18/7/2017�� 500,000� USD� 499,760� 500,464� 0.20
� � � 2,561,383� 2,553,550� 1.04
Luxembourg Schlumberger�Investment�SA�3.65%�1/12/2023�� 1,000,000� USD� 996,972� 1,046,553� 0.43
Netherlands ING�Bank�NV�2%�25/9/2015�'144A'� 1,000,000� USD� 999,297� 1,008,323� 0.41Shell�International�Finance�BV�3.625%�21/8/2042�� 500,000� USD� 499,835� 468,330� 0.19Shell�International�Finance�BV�4.3%�22/9/2019�� 1,500,000� USD� 1,497,552� 1,644,306� 0.68Shell�International�Finance�BV�5.5%�25/3/2040�� 500,000� USD� 492,008� 607,931� 0.25Siemens�Financieringsmaatschappij�NV�6.125%�17/8/2026�'144A'� 500,000� USD� 499,400� 619,571� 0.25
� � � 3,988,092� 4,348,461� 1.78
New Zealand ANZ�New�Zealand�Int'l�Ltd/London�1.85%�15/10/2015�'144A'� 1,000,000� USD� 999,826� 1,009,692� 0.41
Norway Schlumberger�Norge�AS�4.2%�15/1/2021�'144A'� 309,000� USD� 308,803� 335,718� 0.14Statoil�ASA�2.65%�15/1/2024�� 1,500,000� USD� 1,497,486� 1,455,398� 0.59Statoil�ASA�3.15%�23/1/2022�� 395,000� USD� 394,531� 398,343� 0.16Statoil�ASA�3.7%�1/3/2024�� 1,000,000� USD� 999,351� 1,034,140� 0.42Statoil�ASA�4.25%�23/11/2041�� 500,000� USD� 500,000� 511,642� 0.21Statoil�ASA�5.25%�15/4/2019�� 625,000� USD� 624,491� 701,931� 0.29
� � � 4,324,662� 4,437,172� 1.81
Singapore Temasek�Financial�I�Ltd�3.375%�23/7/2042�'144A'� 750,000� USD� 733,840� 687,867� 0.28
South Korea Korea�Land�&�Housing�Corp�1.875%�2/8/2017�'144A'� 952,000� USD� 949,190� 948,833� 0.39
Sweden Skandinaviska�Enskilda�Banken�AB�2.375%�20/11/2018�'144A'� 2,000,000� USD� 1,998,621� 2,022,962� 0.82Swedbank�AB�1.75%�12/3/2018�'144A'� 1,500,000� USD� 1,495,996� 1,495,377� 0.61Swedbank�AB�2.375%�27/2/2019�'144A'� 1,500,000� USD� 1,497,897� 1,507,427� 0.62
� � � 4,992,514� 5,025,766� 2.05
Switzerland Credit�Suisse/New�York�NY�2.3%�28/5/2019�'GMTN'� 2,429,000� USD� 2,424,603� 2,422,024� 1.00Credit�Suisse/New�York�NY�3%�29/10/2021�� 996,000� USD� 990,176� 990,014� 0.40Roche�Holdings�Inc�3.35%�30/9/2024�'144A'� 1,000,000� USD� 1,014,834� 1,029,213� 0.42Roche�Holdings�Inc�4%�28/11/2044�'144A'� 1,500,000� USD� 1,476,641� 1,576,264� 0.64UBS�AG/Stamford�CT�2.375%�14/8/2019�'MTN'� 1,200,000� USD� 1,198,184� 1,198,482� 0.49
� � � 7,104,438� 7,215,997� 2.95
United Kingdom Abbey�National�Treasury�Services�Plc/London�1.65%�29/9/2017�� 1,000,000� USD� 999,097� 996,476� 0.41Abbey�National�Treasury�Services�Plc/London�3.05%�23/8/2018�� 1,245,000� USD� 1,242,997� 1,287,773� 0.53AstraZeneca�Plc�4%�18/9/2042�� 1,250,000� USD� 1,242,809� 1,240,428� 0.51Barclays�Bank�Plc�3.75%�15/5/2024�'BKNT'� 500,000� USD� 499,846� 514,771� 0.21BP�Capital�Markets�Plc�1.846%�5/5/2017�� 1,500,000� USD� 1,500,000� 1,511,594� 0.62BP�Capital�Markets�Plc�2.5%�6/11/2022�� 500,000� USD� 497,288� 465,363� 0.19BP�Capital�Markets�Plc�2.75%�10/5/2023�� 1,258,000� USD� 1,247,472� 1,179,391� 0.48
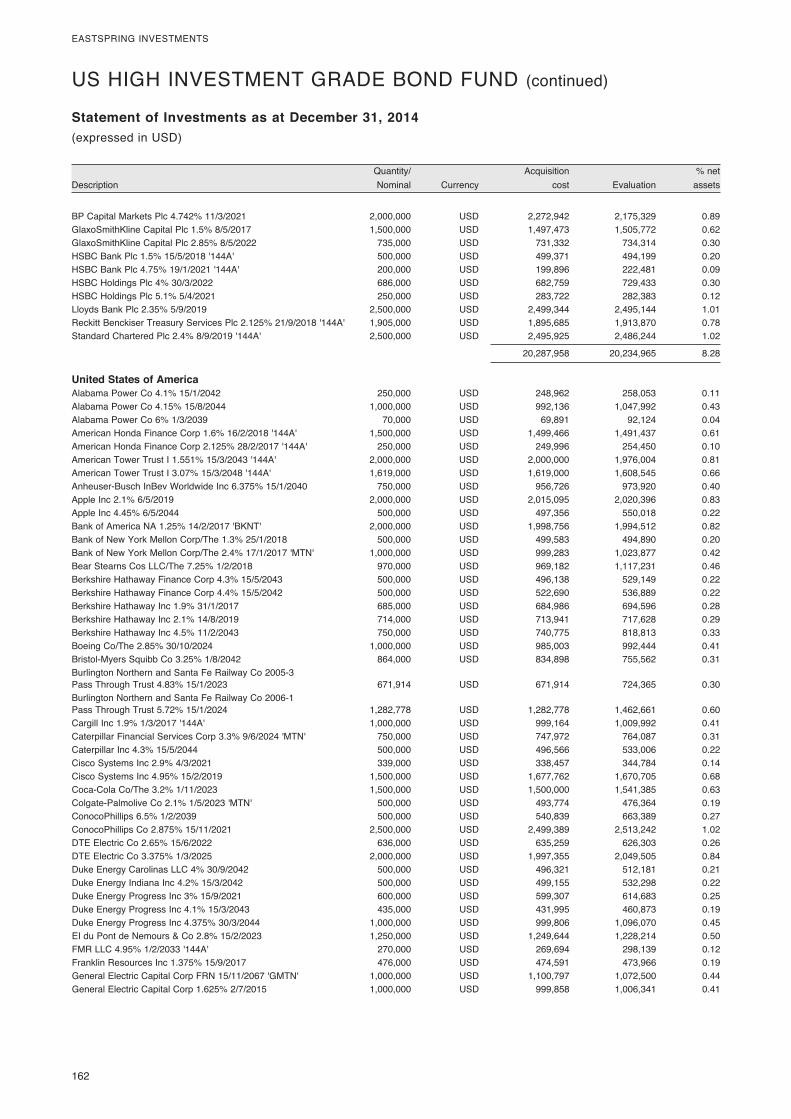
162�
EASTSPRING�INVESTMENTS
� Quantity/�� � Acquisition�� � %�net�Description� Nominal�� Currency�� cost�� Evaluation�� assets�
Statement of Investments as at December 31, 2014(expressed�in�USD)
US�HIGH�INVESTMENT�GRADE�BOND�FUND�(continued)
BP�Capital�Markets�Plc�4.742%�11/3/2021�� 2,000,000� USD� 2,272,942� 2,175,329� 0.89GlaxoSmithKline�Capital�Plc�1.5%�8/5/2017�� 1,500,000� USD� 1,497,473� 1,505,772� 0.62GlaxoSmithKline�Capital�Plc�2.85%�8/5/2022�� 735,000� USD� 731,332� 734,314� 0.30HSBC�Bank�Plc�1.5%�15/5/2018�'144A'� 500,000� USD� 499,371� 494,199� 0.20HSBC�Bank�Plc�4.75%�19/1/2021�'144A'� 200,000� USD� 199,896� 222,481� 0.09HSBC�Holdings�Plc�4%�30/3/2022�� 686,000� USD� 682,759� 729,433� 0.30HSBC�Holdings�Plc�5.1%�5/4/2021�� 250,000� USD� 283,722� 282,383� 0.12Lloyds�Bank�Plc�2.35%�5/9/2019�� 2,500,000� USD� 2,499,344� 2,495,144� 1.01Reckitt�Benckiser�Treasury�Services�Plc�2.125%�21/9/2018�'144A'� 1,905,000� USD� 1,895,685� 1,913,870� 0.78Standard�Chartered�Plc�2.4%�8/9/2019�'144A'� 2,500,000� USD� 2,495,925� 2,486,244� 1.02
� � � 20,287,958� 20,234,965� 8.28
United States of America Alabama�Power�Co�4.1%�15/1/2042�� 250,000� USD� 248,962� 258,053� 0.11Alabama�Power�Co�4.15%�15/8/2044�� 1,000,000� USD� 992,136� 1,047,992� 0.43Alabama�Power�Co�6%�1/3/2039�� 70,000� USD� 69,891� 92,124� 0.04American�Honda�Finance�Corp�1.6%�16/2/2018�'144A'� 1,500,000� USD� 1,499,466� 1,491,437� 0.61American�Honda�Finance�Corp�2.125%�28/2/2017�'144A'� 250,000� USD� 249,996� 254,450� 0.10American�Tower�Trust�I�1.551%�15/3/2043�'144A'� 2,000,000� USD� 2,000,000� 1,976,004� 0.81American�Tower�Trust�I�3.07%�15/3/2048�'144A'� 1,619,000� USD� 1,619,000� 1,608,545� 0.66Anheuser-Busch�InBev�Worldwide�Inc�6.375%�15/1/2040�� 750,000� USD� 956,726� 973,920� 0.40Apple�Inc�2.1%�6/5/2019�� 2,000,000� USD� 2,015,095� 2,020,396� 0.83Apple�Inc�4.45%�6/5/2044�� 500,000� USD� 497,356� 550,018� 0.22Bank�of�America�NA�1.25%�14/2/2017�'BKNT'� 2,000,000� USD� 1,998,756� 1,994,512� 0.82Bank�of�New�York�Mellon�Corp/The�1.3%�25/1/2018�� 500,000� USD� 499,583� 494,890� 0.20Bank�of�New�York�Mellon�Corp/The�2.4%�17/1/2017�'MTN'� 1,000,000� USD� 999,283� 1,023,877� 0.42Bear�Stearns�Cos�LLC/The�7.25%�1/2/2018�� 970,000� USD� 969,182� 1,117,231� 0.46Berkshire�Hathaway�Finance�Corp�4.3%�15/5/2043�� 500,000� USD� 496,138� 529,149� 0.22Berkshire�Hathaway�Finance�Corp�4.4%�15/5/2042�� 500,000� USD� 522,690� 536,889� 0.22Berkshire�Hathaway�Inc�1.9%�31/1/2017�� 685,000� USD� 684,986� 694,596� 0.28Berkshire�Hathaway�Inc�2.1%�14/8/2019�� 714,000� USD� 713,941� 717,628� 0.29Berkshire�Hathaway�Inc�4.5%�11/2/2043�� 750,000� USD� 740,775� 818,813� 0.33Boeing�Co/The�2.85%�30/10/2024�� 1,000,000� USD� 985,003� 992,444� 0.41Bristol-Myers�Squibb�Co�3.25%�1/8/2042�� 864,000� USD� 834,898� 755,562� 0.31Burlington�Northern�and�Santa�Fe�Railway�Co�2005-3��Pass�Through�Trust�4.83%�15/1/2023�� 671,914� USD� 671,914� 724,365� 0.30Burlington�Northern�and�Santa�Fe�Railway�Co�2006-1��Pass�Through�Trust�5.72%�15/1/2024�� 1,282,778� USD� 1,282,778� 1,462,661� 0.60Cargill�Inc�1.9%�1/3/2017�'144A'� 1,000,000� USD� 999,164� 1,009,992� 0.41Caterpillar�Financial�Services�Corp�3.3%�9/6/2024�'MTN'� 750,000� USD� 747,972� 764,087� 0.31Caterpillar�Inc�4.3%�15/5/2044�� 500,000� USD� 496,566� 533,006� 0.22Cisco�Systems�Inc�2.9%�4/3/2021�� 339,000� USD� 338,457� 344,784� 0.14Cisco�Systems�Inc�4.95%�15/2/2019�� 1,500,000� USD� 1,677,762� 1,670,705� 0.68Coca-Cola�Co/The�3.2%�1/11/2023�� 1,500,000� USD� 1,500,000� 1,541,385� 0.63Colgate-Palmolive�Co�2.1%�1/5/2023�'MTN'� 500,000� USD� 493,774� 476,364� 0.19ConocoPhillips�6.5%�1/2/2039�� 500,000� USD� 540,839� 663,389� 0.27ConocoPhillips�Co�2.875%�15/11/2021�� 2,500,000� USD� 2,499,389� 2,513,242� 1.02DTE�Electric�Co�2.65%�15/6/2022�� 636,000� USD� 635,259� 626,303� 0.26DTE�Electric�Co�3.375%�1/3/2025�� 2,000,000� USD� 1,997,355� 2,049,505� 0.84Duke�Energy�Carolinas�LLC�4%�30/9/2042�� 500,000� USD� 496,321� 512,181� 0.21Duke�Energy�Indiana�Inc�4.2%�15/3/2042�� 500,000� USD� 499,155� 532,298� 0.22Duke�Energy�Progress�Inc�3%�15/9/2021�� 600,000� USD� 599,307� 614,683� 0.25Duke�Energy�Progress�Inc�4.1%�15/3/2043�� 435,000� USD� 431,995� 460,873� 0.19Duke�Energy�Progress�Inc�4.375%�30/3/2044�� 1,000,000� USD� 999,806� 1,096,070� 0.45EI�du�Pont�de�Nemours�&�Co�2.8%�15/2/2023�� 1,250,000� USD� 1,249,644� 1,228,214� 0.50FMR�LLC�4.95%�1/2/2033�'144A'� 270,000� USD� 269,694� 298,139� 0.12Franklin�Resources�Inc�1.375%�15/9/2017�� 476,000� USD� 474,591� 473,966� 0.19General�Electric�Capital�Corp�FRN�15/11/2067�'GMTN'� 1,000,000� USD� 1,100,797� 1,072,500� 0.44General�Electric�Capital�Corp�1.625%�2/7/2015�� 1,000,000� USD� 999,858� 1,006,341� 0.41

� 163
EASTSPRING�INVESTMENTS
� Quantity/�� � Acquisition�� � %�net�Description� Nominal�� Currency�� cost�� Evaluation�� assets�
Statement of Investments as at December 31, 2014(expressed�in�USD)
US�HIGH�INVESTMENT�GRADE�BOND�FUND�(continued)
General�Electric�Capital�Corp�2.1%�11/12/2019�� 331,000� USD� 330,817� 330,012� 0.13General�Electric�Capital�Corp�2.15%�9/1/2015�� 2,000,000� USD� 1,999,983� 2,000,438� 0.82General�Electric�Capital�Corp�2.3%�27/4/2017�'MTN'� 2,500,000� USD� 2,498,481� 2,559,459� 1.04General�Electric�Capital�Corp�4.625%�7/1/2021�'GMTN'� 660,000� USD� 655,305� 735,077� 0.30General�Electric�Capital�Corp�5.875%�14/1/2038�'MTN'� 1,500,000� USD� 1,735,457� 1,895,357� 0.77General�Electric�Capital�Corp�6%�7/8/2019�'GMTN'� 773,000� USD� 772,605� 898,186� 0.37General�Electric�Capital�Corp�6.875%�10/1/2039�'GMTN'� 800,000� USD� 1,028,831� 1,130,023� 0.46General�Electric�Co�2.7%�9/10/2022�� 882,000� USD� 881,064� 881,436� 0.36General�Electric�Co�4.5%�11/3/2044�� 1,040,000� USD� 1,030,781� 1,141,204� 0.47General�Electric�Co�5.25%�6/12/2017�� 1,500,000� USD� 1,496,465� 1,662,690� 0.68GlaxoSmithKline�Capital�Inc�2.8%�18/3/2023�� 1,000,000� USD� 991,732� 986,326� 0.40GlaxoSmithKline�Capital�Inc�5.65%�15/5/2018�� 881,000� USD� 880,822� 991,703� 0.41Health�Care�Service�Corp�4.7%�15/1/2021�'144A'� 910,000� USD� 963,588� 1,000,044� 0.41Hershey�Co/The�2.625%�1/5/2023�� 1,000,000� USD� 997,824� 978,405� 0.40HSBC�USA�Inc�2.375%�13/2/2015�� 5,746,000� USD� 5,747,286� 5,757,882� 2.34HSBC�USA�Inc�2.625%�24/9/2018�� 733,000� USD� 732,062� 751,096� 0.31International�Business�Machines�Corp�1.875%�15/5/2019�� 2,500,000� USD� 2,497,663� 2,480,362� 1.01International�Business�Machines�Corp�5.7%�14/9/2017�� 1,000,000� USD� 1,088,423� 1,111,706� 0.45John�Deere�Capital�Corp�1.4%�15/3/2017�'MTN'� 1,000,000� USD� 999,875� 1,002,260� 0.41John�Deere�Capital�Corp�1.95%�13/12/2018�'MTN'� 2,500,000� USD� 2,495,797� 2,496,792� 1.02John�Deere�Capital�Corp�2.25%�17/4/2019�� 366,000� USD� 365,396� 368,850� 0.15John�Deere�Capital�Corp�2.3%�16/9/2019�'MTN'� 2,000,000� USD� 1,998,948� 2,009,394� 0.82John�Deere�Capital�Corp�2.8%�4/3/2021�'MTN'� 1,500,000� USD� 1,498,337� 1,516,625� 0.62JPMorgan�Chase�&�Co�1.8%�25/1/2018�� 2,000,000� USD� 1,999,180� 1,996,798� 0.82JPMorgan�Chase�&�Co�4.25%�15/10/2020�� 532,000� USD� 530,488� 571,155� 0.23JPMorgan�Chase�&�Co�6%�15/1/2018�� 600,000� USD� 603,716� 671,846� 0.27JPMorgan�Chase�&�Co�6.3%�23/4/2019�� 1,000,000� USD� 1,029,274� 1,159,106� 0.47JPMorgan�Chase�Bank�NA�6%�1/10/2017�'BKNT'� 1,600,000� USD� 1,660,787� 1,775,016� 0.73Kaiser�Foundation�Hospitals�3.5%�1/4/2022�� 1,500,000� USD� 1,491,225� 1,545,581� 0.63Kimberly-Clark�Corp�5.3%�1/3/2041�� 300,000� USD� 359,313� 370,391� 0.15Massachusetts�Institute�of�Technology�5.6%�1/7/2111�� 472,000� USD� 470,091� 648,211� 0.27MassMutual�Global�Funding�II�2.5%�17/10/2022�'144A'� 1,010,000� USD� 1,004,145� 982,088� 0.40MasterCard�Inc�3.375%�1/4/2024�� 2,000,000� USD� 1,992,075� 2,050,489� 0.84McDonald's�Corp�3.25%�10/6/2024�'MTN'� 2,000,000� USD� 1,994,720� 2,035,193� 0.83Medtronic�Inc�4.5%�15/3/2042�� 500,000� USD� 499,258� 508,891� 0.21Medtronic�Inc�4.625%�15/3/2044�� 500,000� USD� 496,784� 536,442� 0.22Medtronic�Inc�6.5%�15/3/2039�� 388,000� USD� 387,091� 506,052� 0.21Memorial�Sloan-Kettering�Cancer�Center�4.125%�1/7/2052�� 196,000� USD� 194,843� 194,484� 0.08Memorial�Sloan-Kettering�Cancer�Center�5%�1/7/2042�� 917,000� USD� 932,987� 1,074,857� 0.44Merck�&�Co�Inc�4.15%�18/5/2043�� 496,000� USD� 494,565� 526,772� 0.22Metropolitan�Life�Global�Funding�I�1.5%�10/1/2018�'144A'� 500,000� USD� 498,424� 496,477� 0.20Metropolitan�Life�Global�Funding�I�3%�10/1/2023�'144A'� 373,000� USD� 372,847� 370,662� 0.15Metropolitan�Life�Global�Funding�I�3.65%�14/6/2018�'144A'� 800,000� USD� 799,519� 846,162� 0.35Microsoft�Corp�3.5%�15/11/2042�� 1,500,000� USD� 1,484,155� 1,419,083� 0.58Microsoft�Corp�5.3%�8/2/2041�� 500,000� USD� 496,324� 612,457� 0.25MidAmerican�Energy�Co�3.5%�15/10/2024�� 417,000� USD� 415,106� 431,004� 0.18MidAmerican�Energy�Co�4.4%�15/10/2044�� 1,000,000� USD� 994,138� 1,097,679� 0.45Monsanto�Co�2.2%�15/7/2022�� 250,000� USD� 249,782� 236,306� 0.10National�Rural�Utilities�Cooperative�Finance�Corp�2.35%�15/6/2020�� 926,000� USD� 924,981� 918,311� 0.38New�York�Life�Global�Funding�1.65%�15/5/2017�'144A'� 1,500,000� USD� 1,498,792� 1,510,683� 0.62Northern�States�Power�Co/MN�4.85%�15/8/2040�� 200,000� USD� 199,516� 235,057� 0.10Northern�States�Power�Co/WI�3.7%�1/10/2042�� 1,000,000� USD� 992,384� 939,421� 0.38Novartis�Capital�Corp�3.7%�21/9/2042�� 148,000� USD� 145,711� 146,954� 0.06Novartis�Capital�Corp�4.4%�6/5/2044�� 2,000,000� USD� 1,984,379� 2,243,071� 0.92Oracle�Corp�1.2%�15/10/2017�� 750,000� USD� 749,274� 746,892� 0.31Oracle�Corp�4.3%�8/7/2034�� 600,000� USD� 599,766� 641,530� 0.26Oracle�Corp�6.125%�8/7/2039�� 800,000� USD� 795,651� 1,037,054� 0.42Pfizer�Inc�4.3%�15/6/2043�� 500,000� USD� 498,963� 534,543� 0.22Pfizer�Inc�6.2%�15/3/2019�� 800,000� USD� 799,659� 929,821� 0.38
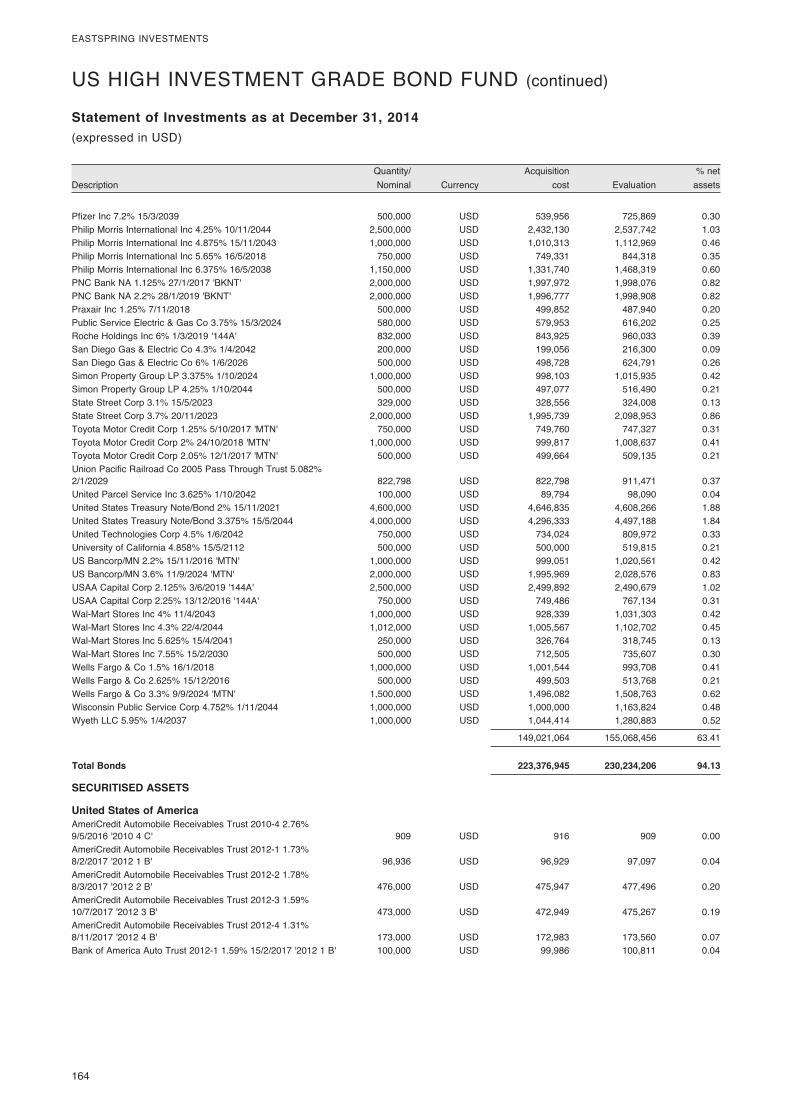
164�
EASTSPRING�INVESTMENTS
� Quantity/�� � Acquisition�� � %�net�Description� Nominal�� Currency�� cost�� Evaluation�� assets�
Statement of Investments as at December 31, 2014(expressed�in�USD)
US�HIGH�INVESTMENT�GRADE�BOND�FUND�(continued)
Pfizer�Inc�7.2%�15/3/2039�� 500,000� USD� 539,956� 725,869� 0.30Philip�Morris�International�Inc�4.25%�10/11/2044�� 2,500,000� USD� 2,432,130� 2,537,742� 1.03Philip�Morris�International�Inc�4.875%�15/11/2043�� 1,000,000� USD� 1,010,313� 1,112,969� 0.46Philip�Morris�International�Inc�5.65%�16/5/2018�� 750,000� USD� 749,331� 844,318� 0.35Philip�Morris�International�Inc�6.375%�16/5/2038�� 1,150,000� USD� 1,331,740� 1,468,319� 0.60PNC�Bank�NA�1.125%�27/1/2017�'BKNT'� 2,000,000� USD� 1,997,972� 1,998,076� 0.82PNC�Bank�NA�2.2%�28/1/2019�'BKNT'� 2,000,000� USD� 1,996,777� 1,998,908� 0.82Praxair�Inc�1.25%�7/11/2018�� 500,000� USD� 499,852� 487,940� 0.20Public�Service�Electric�&�Gas�Co�3.75%�15/3/2024�� 580,000� USD� 579,953� 616,202� 0.25Roche�Holdings�Inc�6%�1/3/2019�'144A'� 832,000� USD� 843,925� 960,033� 0.39San�Diego�Gas�&�Electric�Co�4.3%�1/4/2042�� 200,000� USD� 199,056� 216,300� 0.09San�Diego�Gas�&�Electric�Co�6%�1/6/2026�� 500,000� USD� 498,728� 624,791� 0.26Simon�Property�Group�LP�3.375%�1/10/2024�� 1,000,000� USD� 998,103� 1,015,935� 0.42Simon�Property�Group�LP�4.25%�1/10/2044�� 500,000� USD� 497,077� 516,490� 0.21State�Street�Corp�3.1%�15/5/2023�� 329,000� USD� 328,556� 324,008� 0.13State�Street�Corp�3.7%�20/11/2023�� 2,000,000� USD� 1,995,739� 2,098,953� 0.86Toyota�Motor�Credit�Corp�1.25%�5/10/2017�'MTN'� 750,000� USD� 749,760� 747,327� 0.31Toyota�Motor�Credit�Corp�2%�24/10/2018�'MTN'� 1,000,000� USD� 999,817� 1,008,637� 0.41Toyota�Motor�Credit�Corp�2.05%�12/1/2017�'MTN'� 500,000� USD� 499,664� 509,135� 0.21Union�Pacific�Railroad�Co�2005�Pass�Through�Trust�5.082%��2/1/2029�� 822,798� USD� 822,798� 911,471� 0.37United�Parcel�Service�Inc�3.625%�1/10/2042�� 100,000� USD� 89,794� 98,090� 0.04United�States�Treasury�Note/Bond�2%�15/11/2021�� 4,600,000� USD� 4,646,835� 4,608,266� 1.88United�States�Treasury�Note/Bond�3.375%�15/5/2044�� 4,000,000� USD� 4,296,333� 4,497,188� 1.84United�Technologies�Corp�4.5%�1/6/2042�� 750,000� USD� 734,024� 809,972� 0.33University�of�California�4.858%�15/5/2112�� 500,000� USD� 500,000� 519,815� 0.21US�Bancorp/MN�2.2%�15/11/2016�'MTN'� 1,000,000� USD� 999,051� 1,020,561� 0.42US�Bancorp/MN�3.6%�11/9/2024�'MTN'� 2,000,000� USD� 1,995,969� 2,028,576� 0.83USAA�Capital�Corp�2.125%�3/6/2019�'144A'� 2,500,000� USD� 2,499,892� 2,490,679� 1.02USAA�Capital�Corp�2.25%�13/12/2016�'144A'� 750,000� USD� 749,486� 767,134� 0.31Wal-Mart�Stores�Inc�4%�11/4/2043�� 1,000,000� USD� 928,339� 1,031,303� 0.42Wal-Mart�Stores�Inc�4.3%�22/4/2044�� 1,012,000� USD� 1,005,567� 1,102,702� 0.45Wal-Mart�Stores�Inc�5.625%�15/4/2041�� 250,000� USD� 326,764� 318,745� 0.13Wal-Mart�Stores�Inc�7.55%�15/2/2030�� 500,000� USD� 712,505� 735,607� 0.30Wells�Fargo�&�Co�1.5%�16/1/2018�� 1,000,000� USD� 1,001,544� 993,708� 0.41Wells�Fargo�&�Co�2.625%�15/12/2016�� 500,000� USD� 499,503� 513,768� 0.21Wells�Fargo�&�Co�3.3%�9/9/2024�'MTN'� 1,500,000� USD� 1,496,082� 1,508,763� 0.62Wisconsin�Public�Service�Corp�4.752%�1/11/2044�� 1,000,000� USD� 1,000,000� 1,163,824� 0.48Wyeth�LLC�5.95%�1/4/2037�� 1,000,000� USD� 1,044,414� 1,280,883� 0.52
� � � 149,021,064� 155,068,456� 63.41
Total Bonds 223,376,945 230,234,206 94.13
SECURITISED ASSETS
United States of America AmeriCredit�Automobile�Receivables�Trust�2010-4�2.76%��9/5/2016�'2010�4�C'� 909� USD� 916� 909� 0.00AmeriCredit�Automobile�Receivables�Trust�2012-1�1.73%��8/2/2017�'2012�1�B'� 96,936� USD� 96,929� 97,097� 0.04AmeriCredit�Automobile�Receivables�Trust�2012-2�1.78%��8/3/2017�'2012�2�B'� 476,000� USD� 475,947� 477,496� 0.20AmeriCredit�Automobile�Receivables�Trust�2012-3�1.59%��10/7/2017�'2012�3�B'� 473,000� USD� 472,949� 475,267� 0.19AmeriCredit�Automobile�Receivables�Trust�2012-4�1.31%��8/11/2017�'2012�4�B'� 173,000� USD� 172,983� 173,560� 0.07Bank�of�America�Auto�Trust�2012-1�1.59%�15/2/2017�'2012�1�B'� 100,000� USD� 99,986� 100,811� 0.04
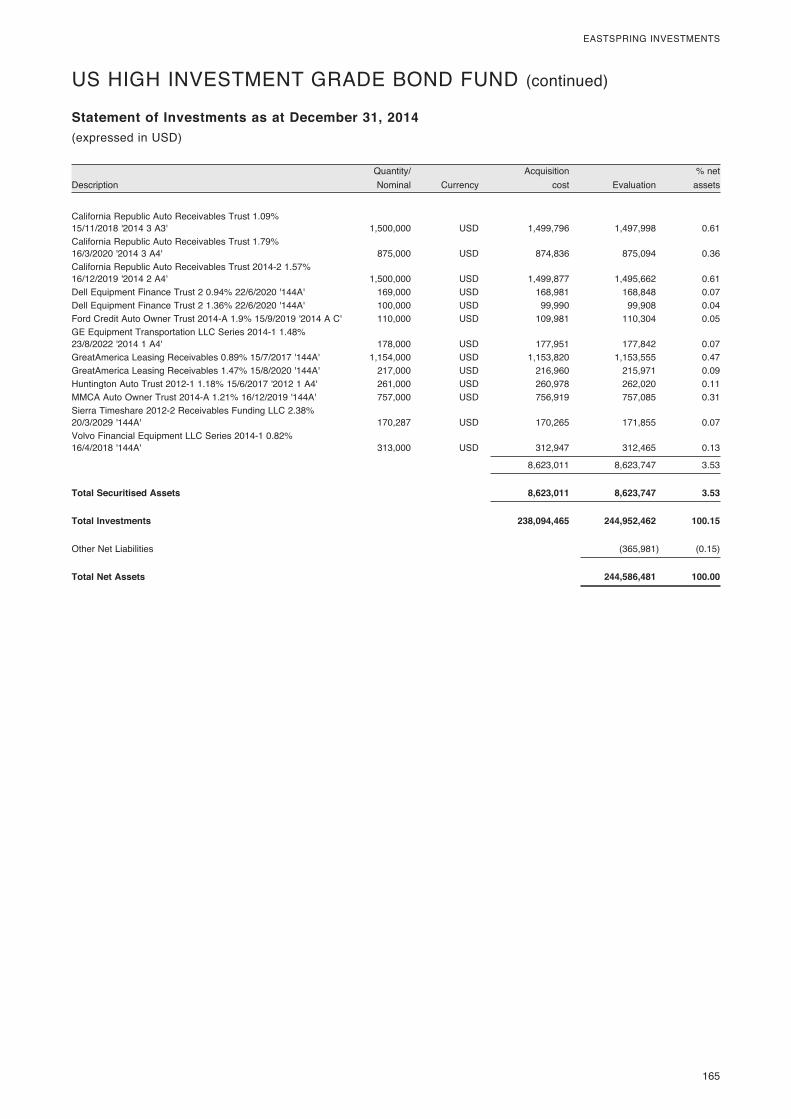
� 165
EASTSPRING�INVESTMENTS
� Quantity/�� � Acquisition�� � %�net�Description� Nominal�� Currency�� cost�� Evaluation�� assets�
Statement of Investments as at December 31, 2014(expressed�in�USD)
California�Republic�Auto�Receivables�Trust�1.09%��15/11/2018�'2014�3�A3'� 1,500,000� USD� 1,499,796� 1,497,998� 0.61California�Republic�Auto�Receivables�Trust�1.79%��16/3/2020�'2014�3�A4'� 875,000� USD� 874,836� 875,094� 0.36California�Republic�Auto�Receivables�Trust�2014-2�1.57%��16/12/2019�'2014�2�A4'� 1,500,000� USD� 1,499,877� 1,495,662� 0.61Dell�Equipment�Finance�Trust�2�0.94%�22/6/2020�'144A'� 169,000� USD� 168,981� 168,848� 0.07Dell�Equipment�Finance�Trust�2�1.36%�22/6/2020�'144A'� 100,000� USD� 99,990� 99,908� 0.04Ford�Credit�Auto�Owner�Trust�2014-A�1.9%�15/9/2019�'2014�A�C'� 110,000� USD� 109,981� 110,304� 0.05GE�Equipment�Transportation�LLC�Series�2014-1�1.48%��23/8/2022�'2014�1�A4'� 178,000� USD� 177,951� 177,842� 0.07GreatAmerica�Leasing�Receivables�0.89%�15/7/2017�'144A'� 1,154,000� USD� 1,153,820� 1,153,555� 0.47GreatAmerica�Leasing�Receivables�1.47%�15/8/2020�'144A'� 217,000� USD� 216,960� 215,971� 0.09Huntington�Auto�Trust�2012-1�1.18%�15/6/2017�'2012�1�A4'� 261,000� USD� 260,978� 262,020� 0.11MMCA�Auto�Owner�Trust�2014-A�1.21%�16/12/2019�'144A'� 757,000� USD� 756,919� 757,085� 0.31Sierra�Timeshare�2012-2�Receivables�Funding�LLC�2.38%��20/3/2029�'144A'� 170,287� USD� 170,265� 171,855� 0.07Volvo�Financial�Equipment�LLC�Series�2014-1�0.82%��16/4/2018�'144A'� 313,000� USD� 312,947� 312,465� 0.13
� � � 8,623,011� 8,623,747� 3.53
Total Securitised Assets 8,623,011 8,623,747 3.53
Total Investments 238,094,465 244,952,462 100.15
Other�Net�Liabilities� � � � (365,981)� (0.15)
Total Net Assets 244,586,481 100.00
US�HIGH�INVESTMENT�GRADE�BOND�FUND�(continued)
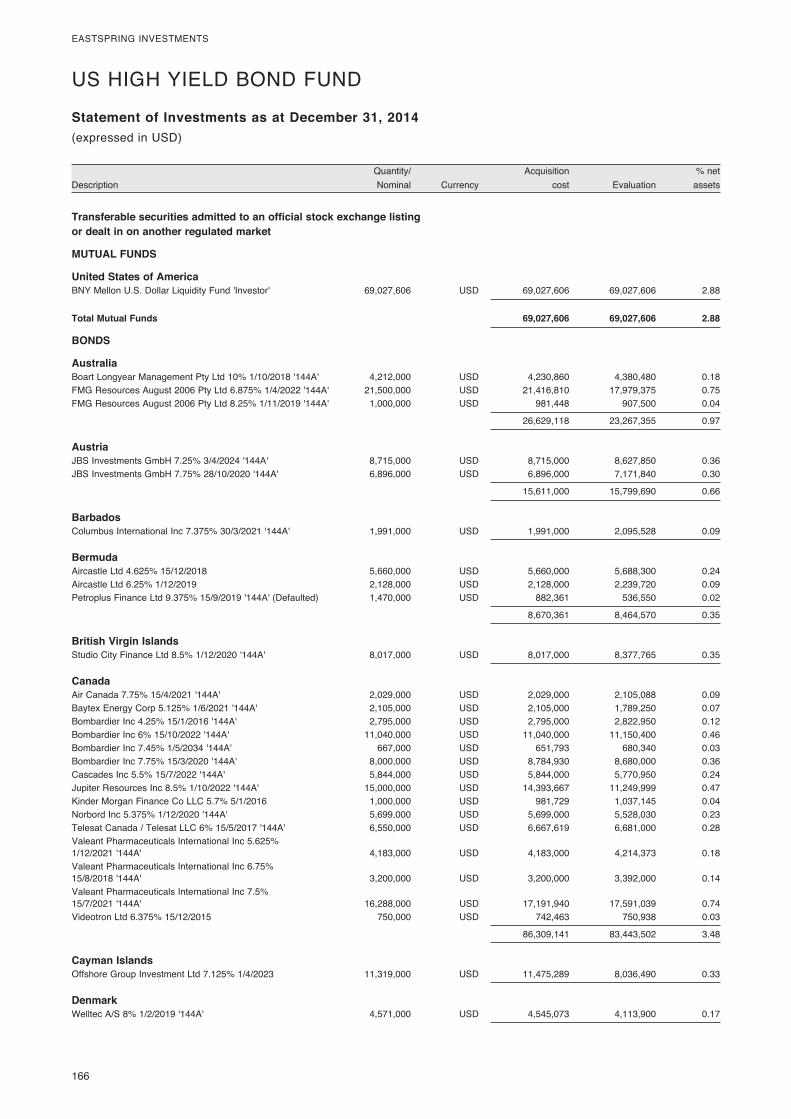
166�
EASTSPRING�INVESTMENTS
� Quantity/�� � Acquisition�� � %�net�Description� Nominal�� Currency�� cost�� Evaluation�� assets�
Statement of Investments as at December 31, 2014(expressed�in�USD)
US�HIGH�YIELD�BOND�FUND�
Transferable securities admitted to an official stock exchange listing or dealt in on another regulated market
MUTUAL FUNDS
United States of America BNY�Mellon�U.S.�Dollar�Liquidity�Fund�'Investor'�� 69,027,606� USD� 69,027,606� 69,027,606� 2.88
Total Mutual Funds 69,027,606 69,027,606 2.88
BONDS
Australia Boart�Longyear�Management�Pty�Ltd�10%�1/10/2018�'144A'� 4,212,000� USD� 4,230,860� 4,380,480� 0.18FMG�Resources�August�2006�Pty�Ltd�6.875%�1/4/2022�'144A'� 21,500,000� USD� 21,416,810� 17,979,375� 0.75FMG�Resources�August�2006�Pty�Ltd�8.25%�1/11/2019�'144A'� 1,000,000� USD� 981,448� 907,500� 0.04
� � � 26,629,118� 23,267,355� 0.97
Austria JBS�Investments�GmbH�7.25%�3/4/2024�'144A'� 8,715,000� USD� 8,715,000� 8,627,850� 0.36JBS�Investments�GmbH�7.75%�28/10/2020�'144A'� 6,896,000� USD� 6,896,000� 7,171,840� 0.30
� � � 15,611,000� 15,799,690� 0.66
Barbados Columbus�International�Inc�7.375%�30/3/2021�'144A'� 1,991,000� USD� 1,991,000� 2,095,528� 0.09
Bermuda Aircastle�Ltd�4.625%�15/12/2018�� 5,660,000� USD� 5,660,000� 5,688,300� 0.24Aircastle�Ltd�6.25%�1/12/2019�� 2,128,000� USD� 2,128,000� 2,239,720� 0.09Petroplus�Finance�Ltd�9.375%�15/9/2019�'144A'�(Defaulted)� 1,470,000� USD� 882,361� 536,550� 0.02
� � � 8,670,361� 8,464,570� 0.35
British Virgin Islands Studio�City�Finance�Ltd�8.5%�1/12/2020�'144A'� 8,017,000� USD� 8,017,000� 8,377,765� 0.35
Canada Air�Canada�7.75%�15/4/2021�'144A'� 2,029,000� USD� 2,029,000� 2,105,088� 0.09Baytex�Energy�Corp�5.125%�1/6/2021�'144A'� 2,105,000� USD� 2,105,000� 1,789,250� 0.07Bombardier�Inc�4.25%�15/1/2016�'144A'� 2,795,000� USD� 2,795,000� 2,822,950� 0.12Bombardier�Inc�6%�15/10/2022�'144A'� 11,040,000� USD� 11,040,000� 11,150,400� 0.46Bombardier�Inc�7.45%�1/5/2034�'144A'� 667,000� USD� 651,793� 680,340� 0.03Bombardier�Inc�7.75%�15/3/2020�'144A'� 8,000,000� USD� 8,784,930� 8,680,000� 0.36Cascades�Inc�5.5%�15/7/2022�'144A'� 5,844,000� USD� 5,844,000� 5,770,950� 0.24Jupiter�Resources�Inc�8.5%�1/10/2022�'144A'� 15,000,000� USD� 14,393,667� 11,249,999� 0.47Kinder�Morgan�Finance�Co�LLC�5.7%�5/1/2016�� 1,000,000� USD� 981,729� 1,037,145� 0.04Norbord�Inc�5.375%�1/12/2020�'144A'� 5,699,000� USD� 5,699,000� 5,528,030� 0.23Telesat�Canada�/�Telesat�LLC�6%�15/5/2017�'144A'� 6,550,000� USD� 6,667,619� 6,681,000� 0.28Valeant�Pharmaceuticals�International�Inc�5.625%��1/12/2021�'144A'� 4,183,000� USD� 4,183,000� 4,214,373� 0.18Valeant�Pharmaceuticals�International�Inc�6.75%��15/8/2018�'144A'� 3,200,000� USD� 3,200,000� 3,392,000� 0.14Valeant�Pharmaceuticals�International�Inc�7.5%��15/7/2021�'144A'� 16,288,000� USD� 17,191,940� 17,591,039� 0.74Videotron�Ltd�6.375%�15/12/2015�� 750,000� USD� 742,463� 750,938� 0.03
� � � 86,309,141� 83,443,502� 3.48
Cayman Islands Offshore�Group�Investment�Ltd�7.125%�1/4/2023�� 11,319,000� USD� 11,475,289� 8,036,490� 0.33
Denmark Welltec�A/S�8%�1/2/2019�'144A'� 4,571,000� USD� 4,545,073� 4,113,900� 0.17
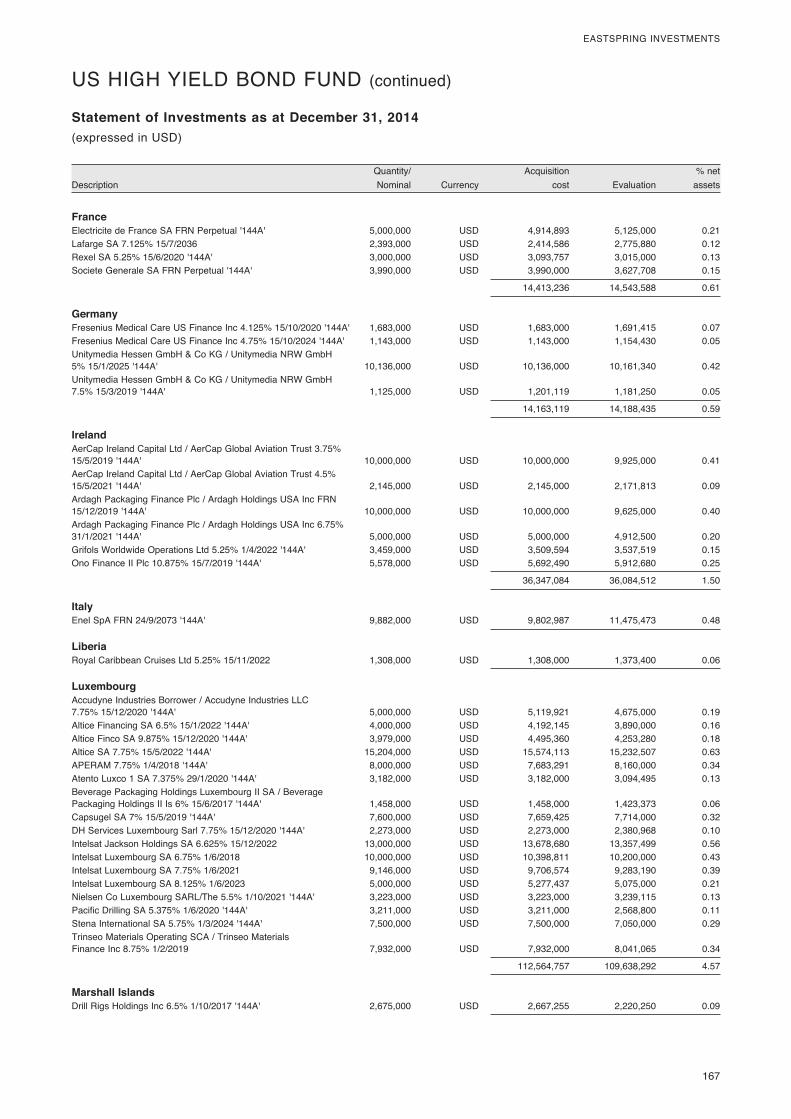
� 167
EASTSPRING�INVESTMENTS
� Quantity/�� � Acquisition�� � %�net�Description� Nominal�� Currency�� cost�� Evaluation�� assets�
Statement of Investments as at December 31, 2014(expressed�in�USD)
US�HIGH�YIELD�BOND�FUND�(continued)
France Electricite�de�France�SA�FRN�Perpetual�'144A'� 5,000,000� USD� 4,914,893� 5,125,000� 0.21Lafarge�SA�7.125%�15/7/2036�� 2,393,000� USD� 2,414,586� 2,775,880� 0.12Rexel�SA�5.25%�15/6/2020�'144A'� 3,000,000� USD� 3,093,757� 3,015,000� 0.13Societe�Generale�SA�FRN�Perpetual�'144A'� 3,990,000� USD� 3,990,000� 3,627,708� 0.15
� � � 14,413,236� 14,543,588� 0.61
Germany Fresenius�Medical�Care�US�Finance�Inc�4.125%�15/10/2020�'144A'� 1,683,000� USD� 1,683,000� 1,691,415� 0.07Fresenius�Medical�Care�US�Finance�Inc�4.75%�15/10/2024�'144A'� 1,143,000� USD� 1,143,000� 1,154,430� 0.05Unitymedia�Hessen�GmbH�&�Co�KG�/�Unitymedia�NRW�GmbH��5%�15/1/2025�'144A'� 10,136,000� USD� 10,136,000� 10,161,340� 0.42Unitymedia�Hessen�GmbH�&�Co�KG�/�Unitymedia�NRW�GmbH��7.5%�15/3/2019�'144A'� 1,125,000� USD� 1,201,119� 1,181,250� 0.05
� � � 14,163,119� 14,188,435� 0.59
Ireland AerCap�Ireland�Capital�Ltd�/�AerCap�Global�Aviation�Trust�3.75%��15/5/2019�'144A'� 10,000,000� USD� 10,000,000� 9,925,000� 0.41AerCap�Ireland�Capital�Ltd�/�AerCap�Global�Aviation�Trust�4.5%��15/5/2021�'144A'� 2,145,000� USD� 2,145,000� 2,171,813� 0.09Ardagh�Packaging�Finance�Plc�/�Ardagh�Holdings�USA�Inc�FRN��15/12/2019�'144A'� 10,000,000� USD� 10,000,000� 9,625,000� 0.40Ardagh�Packaging�Finance�Plc�/�Ardagh�Holdings�USA�Inc�6.75%��31/1/2021�'144A'� 5,000,000� USD� 5,000,000� 4,912,500� 0.20Grifols�Worldwide�Operations�Ltd�5.25%�1/4/2022�'144A'� 3,459,000� USD� 3,509,594� 3,537,519� 0.15Ono�Finance�II�Plc�10.875%�15/7/2019�'144A'� 5,578,000� USD� 5,692,490� 5,912,680� 0.25
� � � 36,347,084� 36,084,512� 1.50
Italy Enel�SpA�FRN�24/9/2073�'144A'� 9,882,000� USD� 9,802,987� 11,475,473� 0.48
Liberia Royal�Caribbean�Cruises�Ltd�5.25%�15/11/2022�� 1,308,000� USD� 1,308,000� 1,373,400� 0.06
Luxembourg Accudyne�Industries�Borrower�/�Accudyne�Industries�LLC��7.75%�15/12/2020�'144A'� 5,000,000� USD� 5,119,921� 4,675,000� 0.19Altice�Financing�SA�6.5%�15/1/2022�'144A'� 4,000,000� USD� 4,192,145� 3,890,000� 0.16Altice�Finco�SA�9.875%�15/12/2020�'144A'� 3,979,000� USD� 4,495,360� 4,253,280� 0.18Altice�SA�7.75%�15/5/2022�'144A'� 15,204,000� USD� 15,574,113� 15,232,507� 0.63APERAM�7.75%�1/4/2018�'144A'� 8,000,000� USD� 7,683,291� 8,160,000� 0.34Atento�Luxco�1�SA�7.375%�29/1/2020�'144A'� 3,182,000� USD� 3,182,000� 3,094,495� 0.13Beverage�Packaging�Holdings�Luxembourg�II�SA�/�Beverage��Packaging�Holdings�II�Is�6%�15/6/2017�'144A'� 1,458,000� USD� 1,458,000� 1,423,373� 0.06Capsugel�SA�7%�15/5/2019�'144A'� 7,600,000� USD� 7,659,425� 7,714,000� 0.32DH�Services�Luxembourg�Sarl�7.75%�15/12/2020�'144A'� 2,273,000� USD� 2,273,000� 2,380,968� 0.10Intelsat�Jackson�Holdings�SA�6.625%�15/12/2022�� 13,000,000� USD� 13,678,680� 13,357,499� 0.56Intelsat�Luxembourg�SA�6.75%�1/6/2018�� 10,000,000� USD� 10,398,811� 10,200,000� 0.43Intelsat�Luxembourg�SA�7.75%�1/6/2021�� 9,146,000� USD� 9,706,574� 9,283,190� 0.39Intelsat�Luxembourg�SA�8.125%�1/6/2023�� 5,000,000� USD� 5,277,437� 5,075,000� 0.21Nielsen�Co�Luxembourg�SARL/The�5.5%�1/10/2021�'144A'� 3,223,000� USD� 3,223,000� 3,239,115� 0.13Pacific�Drilling�SA�5.375%�1/6/2020�'144A'� 3,211,000� USD� 3,211,000� 2,568,800� 0.11Stena�International�SA�5.75%�1/3/2024�'144A'� 7,500,000� USD� 7,500,000� 7,050,000� 0.29Trinseo�Materials�Operating�SCA�/�Trinseo�Materials��Finance�Inc�8.75%�1/2/2019�� 7,932,000� USD� 7,932,000� 8,041,065� 0.34
� � � 112,564,757� 109,638,292� 4.57
Marshall Islands Drill�Rigs�Holdings�Inc�6.5%�1/10/2017�'144A'� 2,675,000� USD� 2,667,255� 2,220,250� 0.09
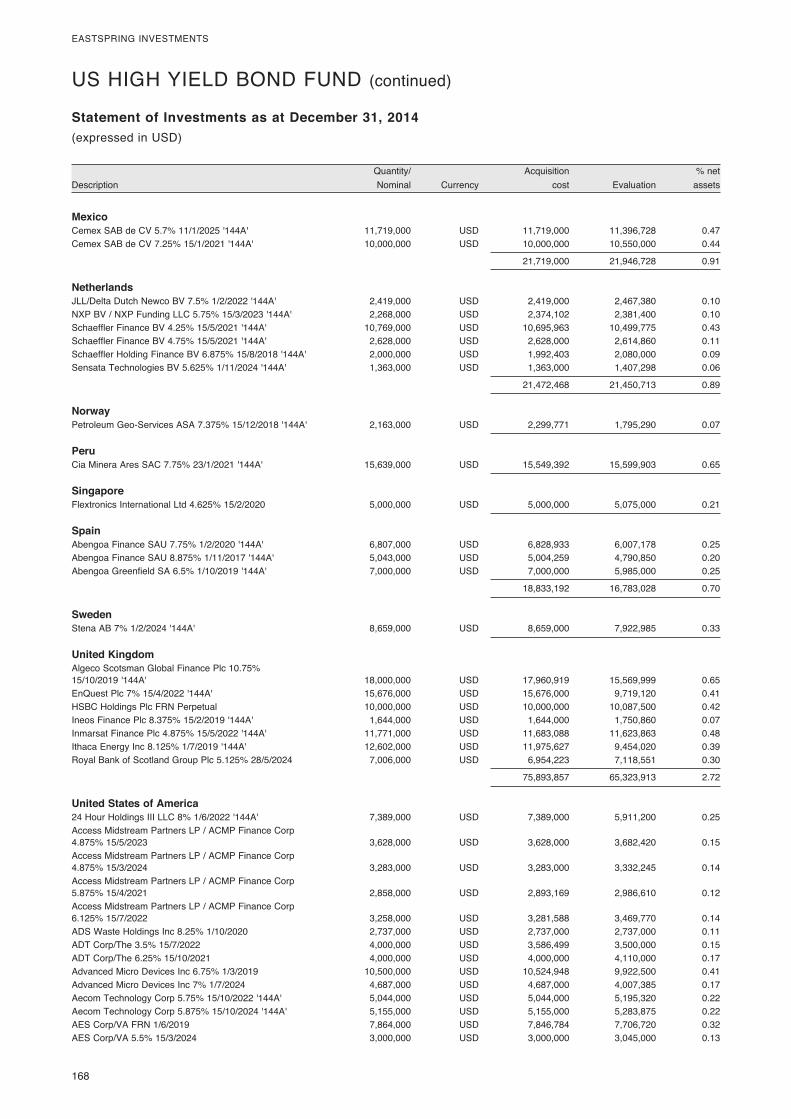
168�
EASTSPRING�INVESTMENTS
� Quantity/�� � Acquisition�� � %�net�Description� Nominal�� Currency�� cost�� Evaluation�� assets�
Statement of Investments as at December 31, 2014(expressed�in�USD)
US�HIGH�YIELD�BOND�FUND�(continued)
Mexico Cemex�SAB�de�CV�5.7%�11/1/2025�'144A'� 11,719,000� USD� 11,719,000� 11,396,728� 0.47Cemex�SAB�de�CV�7.25%�15/1/2021�'144A'� 10,000,000� USD� 10,000,000� 10,550,000� 0.44
� � � 21,719,000� 21,946,728� 0.91
Netherlands JLL/Delta�Dutch�Newco�BV�7.5%�1/2/2022�'144A'� 2,419,000� USD� 2,419,000� 2,467,380� 0.10NXP�BV�/�NXP�Funding�LLC�5.75%�15/3/2023�'144A'� 2,268,000� USD� 2,374,102� 2,381,400� 0.10Schaeffler�Finance�BV�4.25%�15/5/2021�'144A'� 10,769,000� USD� 10,695,963� 10,499,775� 0.43Schaeffler�Finance�BV�4.75%�15/5/2021�'144A'� 2,628,000� USD� 2,628,000� 2,614,860� 0.11Schaeffler�Holding�Finance�BV�6.875%�15/8/2018�'144A'� 2,000,000� USD� 1,992,403� 2,080,000� 0.09Sensata�Technologies�BV�5.625%�1/11/2024�'144A'� 1,363,000� USD� 1,363,000� 1,407,298� 0.06
� � � 21,472,468� 21,450,713� 0.89
Norway Petroleum�Geo-Services�ASA�7.375%�15/12/2018�'144A'� 2,163,000� USD� 2,299,771� 1,795,290� 0.07
Peru Cia�Minera�Ares�SAC�7.75%�23/1/2021�'144A'� 15,639,000� USD� 15,549,392� 15,599,903� 0.65
Singapore Flextronics�International�Ltd�4.625%�15/2/2020�� 5,000,000� USD� 5,000,000� 5,075,000� 0.21
Spain Abengoa�Finance�SAU�7.75%�1/2/2020�'144A'� 6,807,000� USD� 6,828,933� 6,007,178� 0.25Abengoa�Finance�SAU�8.875%�1/11/2017�'144A'� 5,043,000� USD� 5,004,259� 4,790,850� 0.20Abengoa�Greenfield�SA�6.5%�1/10/2019�'144A'� 7,000,000� USD� 7,000,000� 5,985,000� 0.25
� � � 18,833,192� 16,783,028� 0.70
Sweden Stena�AB�7%�1/2/2024�'144A'� 8,659,000� USD� 8,659,000� 7,922,985� 0.33
United Kingdom Algeco�Scotsman�Global�Finance�Plc�10.75%��15/10/2019�'144A'� 18,000,000� USD� 17,960,919� 15,569,999� 0.65EnQuest�Plc�7%�15/4/2022�'144A'� 15,676,000� USD� 15,676,000� 9,719,120� 0.41HSBC�Holdings�Plc�FRN�Perpetual�� 10,000,000� USD� 10,000,000� 10,087,500� 0.42Ineos�Finance�Plc�8.375%�15/2/2019�'144A'� 1,644,000� USD� 1,644,000� 1,750,860� 0.07Inmarsat�Finance�Plc�4.875%�15/5/2022�'144A'� 11,771,000� USD� 11,683,088� 11,623,863� 0.48Ithaca�Energy�Inc�8.125%�1/7/2019�'144A'� 12,602,000� USD� 11,975,627� 9,454,020� 0.39Royal�Bank�of�Scotland�Group�Plc�5.125%�28/5/2024�� 7,006,000� USD� 6,954,223� 7,118,551� 0.30
� � � 75,893,857� 65,323,913� 2.72
United States of America 24�Hour�Holdings�III�LLC�8%�1/6/2022�'144A'� 7,389,000� USD� 7,389,000� 5,911,200� 0.25Access�Midstream�Partners�LP�/�ACMP�Finance�Corp��4.875%�15/5/2023�� 3,628,000� USD� 3,628,000� 3,682,420� 0.15Access�Midstream�Partners�LP�/�ACMP�Finance�Corp��4.875%�15/3/2024�� 3,283,000� USD� 3,283,000� 3,332,245� 0.14Access�Midstream�Partners�LP�/�ACMP�Finance�Corp��5.875%�15/4/2021�� 2,858,000� USD� 2,893,169� 2,986,610� 0.12Access�Midstream�Partners�LP�/�ACMP�Finance�Corp��6.125%�15/7/2022�� 3,258,000� USD� 3,281,588� 3,469,770� 0.14ADS�Waste�Holdings�Inc�8.25%�1/10/2020�� 2,737,000� USD� 2,737,000� 2,737,000� 0.11ADT�Corp/The�3.5%�15/7/2022�� 4,000,000� USD� 3,586,499� 3,500,000� 0.15ADT�Corp/The�6.25%�15/10/2021�� 4,000,000� USD� 4,000,000� 4,110,000� 0.17Advanced�Micro�Devices�Inc�6.75%�1/3/2019�� 10,500,000� USD� 10,524,948� 9,922,500� 0.41Advanced�Micro�Devices�Inc�7%�1/7/2024�� 4,687,000� USD� 4,687,000� 4,007,385� 0.17Aecom�Technology�Corp�5.75%�15/10/2022�'144A'� 5,044,000� USD� 5,044,000� 5,195,320� 0.22Aecom�Technology�Corp�5.875%�15/10/2024�'144A'� 5,155,000� USD� 5,155,000� 5,283,875� 0.22AES�Corp/VA�FRN�1/6/2019�� 7,864,000� USD� 7,846,784� 7,706,720� 0.32AES�Corp/VA�5.5%�15/3/2024�� 3,000,000� USD� 3,000,000� 3,045,000� 0.13
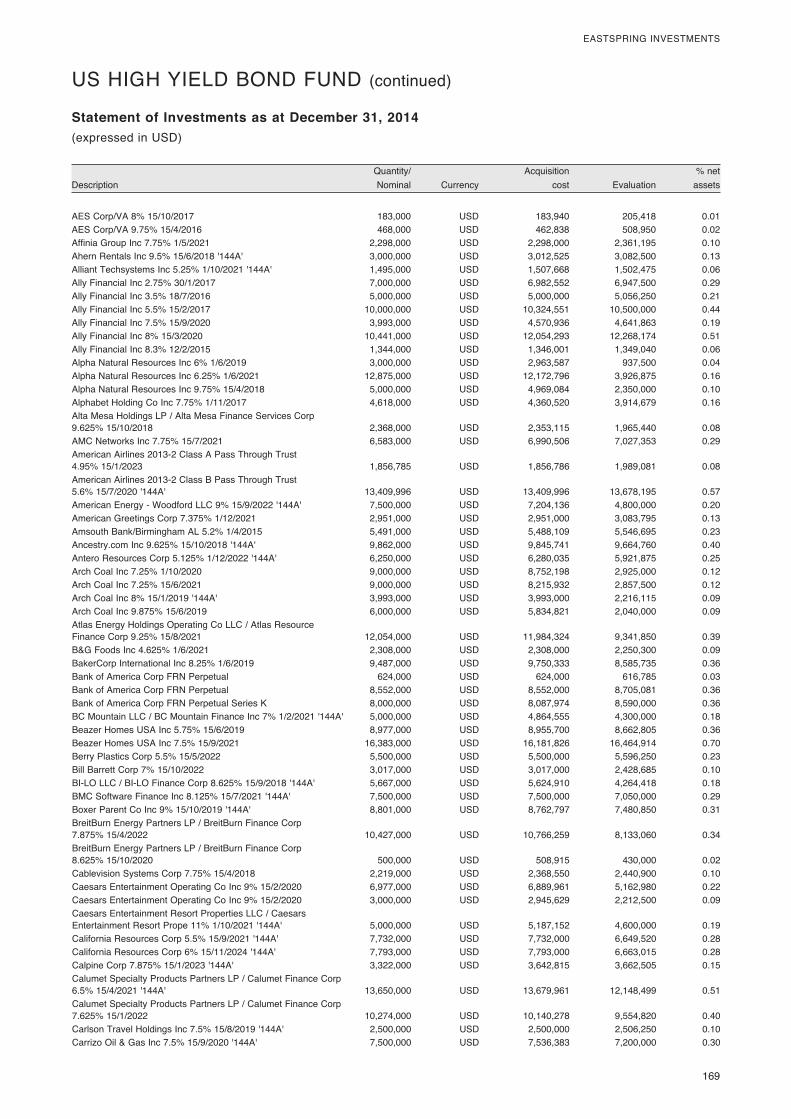
� 169
EASTSPRING�INVESTMENTS
� Quantity/�� � Acquisition�� � %�net�Description� Nominal�� Currency�� cost�� Evaluation�� assets�
Statement of Investments as at December 31, 2014(expressed�in�USD)
US�HIGH�YIELD�BOND�FUND�(continued)
AES�Corp/VA�8%�15/10/2017�� 183,000� USD� 183,940� 205,418� 0.01AES�Corp/VA�9.75%�15/4/2016�� 468,000� USD� 462,838� 508,950� 0.02Affinia�Group�Inc�7.75%�1/5/2021�� 2,298,000� USD� 2,298,000� 2,361,195� 0.10Ahern�Rentals�Inc�9.5%�15/6/2018�'144A'� 3,000,000� USD� 3,012,525� 3,082,500� 0.13Alliant�Techsystems�Inc�5.25%�1/10/2021�'144A'� 1,495,000� USD� 1,507,668� 1,502,475� 0.06Ally�Financial�Inc�2.75%�30/1/2017�� 7,000,000� USD� 6,982,552� 6,947,500� 0.29Ally�Financial�Inc�3.5%�18/7/2016�� 5,000,000� USD� 5,000,000� 5,056,250� 0.21Ally�Financial�Inc�5.5%�15/2/2017�� 10,000,000� USD� 10,324,551� 10,500,000� 0.44Ally�Financial�Inc�7.5%�15/9/2020�� 3,993,000� USD� 4,570,936� 4,641,863� 0.19Ally�Financial�Inc�8%�15/3/2020�� 10,441,000� USD� 12,054,293� 12,268,174� 0.51Ally�Financial�Inc�8.3%�12/2/2015�� 1,344,000� USD� 1,346,001� 1,349,040� 0.06Alpha�Natural�Resources�Inc�6%�1/6/2019�� 3,000,000� USD� 2,963,587� 937,500� 0.04Alpha�Natural�Resources�Inc�6.25%�1/6/2021�� 12,875,000� USD� 12,172,796� 3,926,875� 0.16Alpha�Natural�Resources�Inc�9.75%�15/4/2018�� 5,000,000� USD� 4,969,084� 2,350,000� 0.10Alphabet�Holding�Co�Inc�7.75%�1/11/2017�� 4,618,000� USD� 4,360,520� 3,914,679� 0.16Alta�Mesa�Holdings�LP�/�Alta�Mesa�Finance�Services�Corp��9.625%�15/10/2018�� 2,368,000� USD� 2,353,115� 1,965,440� 0.08AMC�Networks�Inc�7.75%�15/7/2021�� 6,583,000� USD� 6,990,506� 7,027,353� 0.29American�Airlines�2013-2�Class�A�Pass�Through�Trust��4.95%�15/1/2023�� 1,856,785� USD� 1,856,786� 1,989,081� 0.08American�Airlines�2013-2�Class�B�Pass�Through�Trust��5.6%�15/7/2020�'144A'� 13,409,996� USD� 13,409,996� 13,678,195� 0.57American�Energy�-�Woodford�LLC�9%�15/9/2022�'144A'� 7,500,000� USD� 7,204,136� 4,800,000� 0.20American�Greetings�Corp�7.375%�1/12/2021�� 2,951,000� USD� 2,951,000� 3,083,795� 0.13Amsouth�Bank/Birmingham�AL�5.2%�1/4/2015�� 5,491,000� USD� 5,488,109� 5,546,695� 0.23Ancestry.com�Inc�9.625%�15/10/2018�'144A'� 9,862,000� USD� 9,845,741� 9,664,760� 0.40Antero�Resources�Corp�5.125%�1/12/2022�'144A'� 6,250,000� USD� 6,280,035� 5,921,875� 0.25Arch�Coal�Inc�7.25%�1/10/2020�� 9,000,000� USD� 8,752,198� 2,925,000� 0.12Arch�Coal�Inc�7.25%�15/6/2021�� 9,000,000� USD� 8,215,932� 2,857,500� 0.12Arch�Coal�Inc�8%�15/1/2019�'144A'� 3,993,000� USD� 3,993,000� 2,216,115� 0.09Arch�Coal�Inc�9.875%�15/6/2019�� 6,000,000� USD� 5,834,821� 2,040,000� 0.09Atlas�Energy�Holdings�Operating�Co�LLC�/�Atlas�Resource��Finance�Corp�9.25%�15/8/2021�� 12,054,000� USD� 11,984,324� 9,341,850� 0.39B&G�Foods�Inc�4.625%�1/6/2021�� 2,308,000� USD� 2,308,000� 2,250,300� 0.09BakerCorp�International�Inc�8.25%�1/6/2019�� 9,487,000� USD� 9,750,333� 8,585,735� 0.36Bank�of�America�Corp�FRN�Perpetual�� 624,000� USD� 624,000� 616,785� 0.03Bank�of�America�Corp�FRN�Perpetual�� 8,552,000� USD� 8,552,000� 8,705,081� 0.36Bank�of�America�Corp�FRN�Perpetual�Series�K� 8,000,000� USD� 8,087,974� 8,590,000� 0.36BC�Mountain�LLC�/�BC�Mountain�Finance�Inc�7%�1/2/2021�'144A'� 5,000,000� USD� 4,864,555� 4,300,000� 0.18Beazer�Homes�USA�Inc�5.75%�15/6/2019�� 8,977,000� USD� 8,955,700� 8,662,805� 0.36Beazer�Homes�USA�Inc�7.5%�15/9/2021�� 16,383,000� USD� 16,181,826� 16,464,914� 0.70Berry�Plastics�Corp�5.5%�15/5/2022�� 5,500,000� USD� 5,500,000� 5,596,250� 0.23Bill�Barrett�Corp�7%�15/10/2022�� 3,017,000� USD� 3,017,000� 2,428,685� 0.10BI-LO�LLC�/�BI-LO�Finance�Corp�8.625%�15/9/2018�'144A'� 5,667,000� USD� 5,624,910� 4,264,418� 0.18BMC�Software�Finance�Inc�8.125%�15/7/2021�'144A'� 7,500,000� USD� 7,500,000� 7,050,000� 0.29Boxer�Parent�Co�Inc�9%�15/10/2019�'144A'� 8,801,000� USD� 8,762,797� 7,480,850� 0.31BreitBurn�Energy�Partners�LP�/�BreitBurn�Finance�Corp��7.875%�15/4/2022�� 10,427,000� USD� 10,766,259� 8,133,060� 0.34BreitBurn�Energy�Partners�LP�/�BreitBurn�Finance�Corp��8.625%�15/10/2020�� 500,000� USD� 508,915� 430,000� 0.02Cablevision�Systems�Corp�7.75%�15/4/2018�� 2,219,000� USD� 2,368,550� 2,440,900� 0.10Caesars�Entertainment�Operating�Co�Inc�9%�15/2/2020�� 6,977,000� USD� 6,889,961� 5,162,980� 0.22Caesars�Entertainment�Operating�Co�Inc�9%�15/2/2020�� 3,000,000� USD� 2,945,629� 2,212,500� 0.09Caesars�Entertainment�Resort�Properties�LLC�/�Caesars��Entertainment�Resort�Prope�11%�1/10/2021�'144A'� 5,000,000� USD� 5,187,152� 4,600,000� 0.19California�Resources�Corp�5.5%�15/9/2021�'144A'� 7,732,000� USD� 7,732,000� 6,649,520� 0.28California�Resources�Corp�6%�15/11/2024�'144A'� 7,793,000� USD� 7,793,000� 6,663,015� 0.28Calpine�Corp�7.875%�15/1/2023�'144A'� 3,322,000� USD� 3,642,815� 3,662,505� 0.15Calumet�Specialty�Products�Partners�LP�/�Calumet�Finance�Corp��6.5%�15/4/2021�'144A'� 13,650,000� USD� 13,679,961� 12,148,499� 0.51Calumet�Specialty�Products�Partners�LP�/�Calumet�Finance�Corp��7.625%�15/1/2022�� 10,274,000� USD� 10,140,278� 9,554,820� 0.40Carlson�Travel�Holdings�Inc�7.5%�15/8/2019�'144A'� 2,500,000� USD� 2,500,000� 2,506,250� 0.10Carrizo�Oil�&�Gas�Inc�7.5%�15/9/2020�'144A'� 7,500,000� USD� 7,536,383� 7,200,000� 0.30
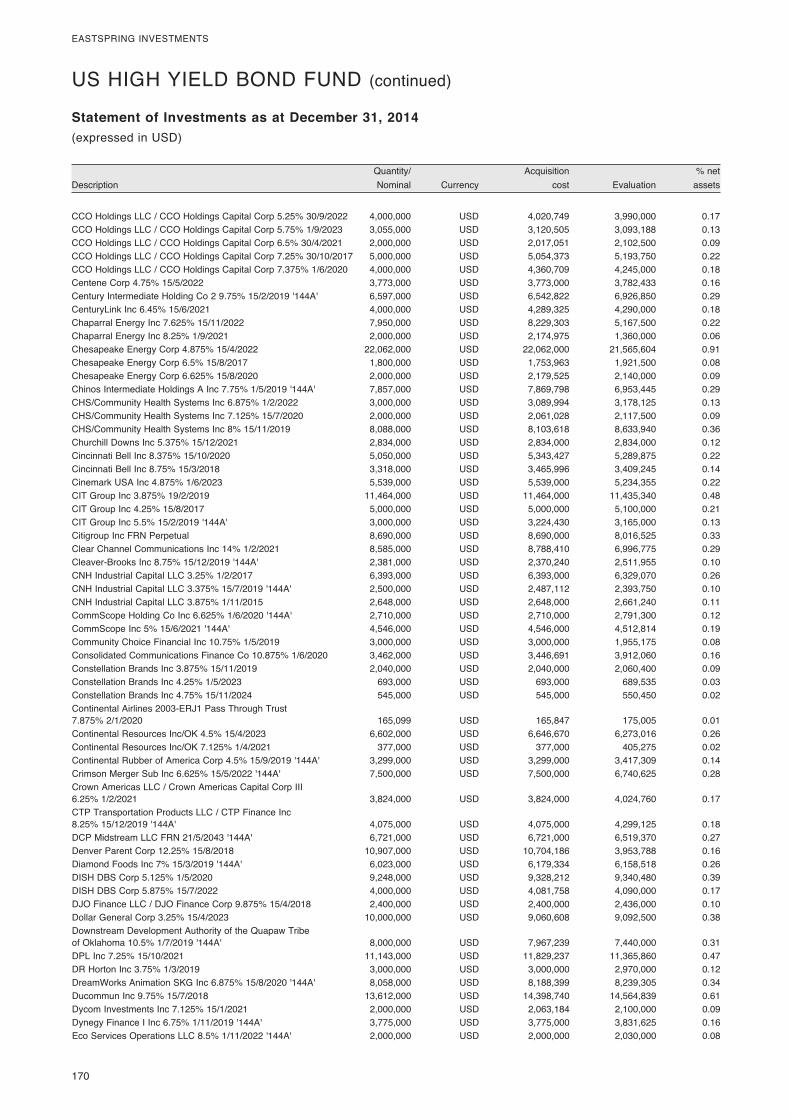
170�
EASTSPRING�INVESTMENTS
� Quantity/�� � Acquisition�� � %�net�Description� Nominal�� Currency�� cost�� Evaluation�� assets�
Statement of Investments as at December 31, 2014(expressed�in�USD)
US�HIGH�YIELD�BOND�FUND�(continued)
CCO�Holdings�LLC�/�CCO�Holdings�Capital�Corp�5.25%�30/9/2022�� 4,000,000� USD� 4,020,749� 3,990,000� 0.17CCO�Holdings�LLC�/�CCO�Holdings�Capital�Corp�5.75%�1/9/2023�� 3,055,000� USD� 3,120,505� 3,093,188� 0.13CCO�Holdings�LLC�/�CCO�Holdings�Capital�Corp�6.5%�30/4/2021�� 2,000,000� USD� 2,017,051� 2,102,500� 0.09CCO�Holdings�LLC�/�CCO�Holdings�Capital�Corp�7.25%�30/10/2017�� 5,000,000� USD� 5,054,373� 5,193,750� 0.22CCO�Holdings�LLC�/�CCO�Holdings�Capital�Corp�7.375%�1/6/2020�� 4,000,000� USD� 4,360,709� 4,245,000� 0.18Centene�Corp�4.75%�15/5/2022�� 3,773,000� USD� 3,773,000� 3,782,433� 0.16Century�Intermediate�Holding�Co�2�9.75%�15/2/2019�'144A'� 6,597,000� USD� 6,542,822� 6,926,850� 0.29CenturyLink�Inc�6.45%�15/6/2021�� 4,000,000� USD� 4,289,325� 4,290,000� 0.18Chaparral�Energy�Inc�7.625%�15/11/2022�� 7,950,000� USD� 8,229,303� 5,167,500� 0.22Chaparral�Energy�Inc�8.25%�1/9/2021�� 2,000,000� USD� 2,174,975� 1,360,000� 0.06Chesapeake�Energy�Corp�4.875%�15/4/2022�� 22,062,000� USD� 22,062,000� 21,565,604� 0.91Chesapeake�Energy�Corp�6.5%�15/8/2017�� 1,800,000� USD� 1,753,963� 1,921,500� 0.08Chesapeake�Energy�Corp�6.625%�15/8/2020�� 2,000,000� USD� 2,179,525� 2,140,000� 0.09Chinos�Intermediate�Holdings�A�Inc�7.75%�1/5/2019�'144A'� 7,857,000� USD� 7,869,798� 6,953,445� 0.29CHS/Community�Health�Systems�Inc�6.875%�1/2/2022�� 3,000,000� USD� 3,089,994� 3,178,125� 0.13CHS/Community�Health�Systems�Inc�7.125%�15/7/2020�� 2,000,000� USD� 2,061,028� 2,117,500� 0.09CHS/Community�Health�Systems�Inc�8%�15/11/2019�� 8,088,000� USD� 8,103,618� 8,633,940� 0.36Churchill�Downs�Inc�5.375%�15/12/2021�� 2,834,000� USD� 2,834,000� 2,834,000� 0.12Cincinnati�Bell�Inc�8.375%�15/10/2020�� 5,050,000� USD� 5,343,427� 5,289,875� 0.22Cincinnati�Bell�Inc�8.75%�15/3/2018�� 3,318,000� USD� 3,465,996� 3,409,245� 0.14Cinemark�USA�Inc�4.875%�1/6/2023�� 5,539,000� USD� 5,539,000� 5,234,355� 0.22CIT�Group�Inc�3.875%�19/2/2019�� 11,464,000� USD� 11,464,000� 11,435,340� 0.48CIT�Group�Inc�4.25%�15/8/2017�� 5,000,000� USD� 5,000,000� 5,100,000� 0.21CIT�Group�Inc�5.5%�15/2/2019�'144A'� 3,000,000� USD� 3,224,430� 3,165,000� 0.13Citigroup�Inc�FRN�Perpetual�� 8,690,000� USD� 8,690,000� 8,016,525� 0.33Clear�Channel�Communications�Inc�14%�1/2/2021�� 8,585,000� USD� 8,788,410� 6,996,775� 0.29Cleaver-Brooks�Inc�8.75%�15/12/2019�'144A'� 2,381,000� USD� 2,370,240� 2,511,955� 0.10CNH�Industrial�Capital�LLC�3.25%�1/2/2017�� 6,393,000� USD� 6,393,000� 6,329,070� 0.26CNH�Industrial�Capital�LLC�3.375%�15/7/2019�'144A'� 2,500,000� USD� 2,487,112� 2,393,750� 0.10CNH�Industrial�Capital�LLC�3.875%�1/11/2015�� 2,648,000� USD� 2,648,000� 2,661,240� 0.11CommScope�Holding�Co�Inc�6.625%�1/6/2020�'144A'� 2,710,000� USD� 2,710,000� 2,791,300� 0.12CommScope�Inc�5%�15/6/2021�'144A'� 4,546,000� USD� 4,546,000� 4,512,814� 0.19Community�Choice�Financial�Inc�10.75%�1/5/2019�� 3,000,000� USD� 3,000,000� 1,955,175� 0.08Consolidated�Communications�Finance�Co�10.875%�1/6/2020�� 3,462,000� USD� 3,446,691� 3,912,060� 0.16Constellation�Brands�Inc�3.875%�15/11/2019�� 2,040,000� USD� 2,040,000� 2,060,400� 0.09Constellation�Brands�Inc�4.25%�1/5/2023�� 693,000� USD� 693,000� 689,535� 0.03Constellation�Brands�Inc�4.75%�15/11/2024�� 545,000� USD� 545,000� 550,450� 0.02Continental�Airlines�2003-ERJ1�Pass�Through�Trust��7.875%�2/1/2020�� 165,099� USD� 165,847� 175,005� 0.01Continental�Resources�Inc/OK�4.5%�15/4/2023�� 6,602,000� USD� 6,646,670� 6,273,016� 0.26Continental�Resources�Inc/OK�7.125%�1/4/2021�� 377,000� USD� 377,000� 405,275� 0.02Continental�Rubber�of�America�Corp�4.5%�15/9/2019�'144A'� 3,299,000� USD� 3,299,000� 3,417,309� 0.14Crimson�Merger�Sub�Inc�6.625%�15/5/2022�'144A'� 7,500,000� USD� 7,500,000� 6,740,625� 0.28Crown�Americas�LLC�/�Crown�Americas�Capital�Corp�III��6.25%�1/2/2021�� 3,824,000� USD� 3,824,000� 4,024,760� 0.17CTP�Transportation�Products�LLC�/�CTP�Finance�Inc��8.25%�15/12/2019�'144A'� 4,075,000� USD� 4,075,000� 4,299,125� 0.18DCP�Midstream�LLC�FRN�21/5/2043�'144A'� 6,721,000� USD� 6,721,000� 6,519,370� 0.27Denver�Parent�Corp�12.25%�15/8/2018�� 10,907,000� USD� 10,704,186� 3,953,788� 0.16Diamond�Foods�Inc�7%�15/3/2019�'144A'� 6,023,000� USD� 6,179,334� 6,158,518� 0.26DISH�DBS�Corp�5.125%�1/5/2020�� 9,248,000� USD� 9,328,212� 9,340,480� 0.39DISH�DBS�Corp�5.875%�15/7/2022�� 4,000,000� USD� 4,081,758� 4,090,000� 0.17DJO�Finance�LLC�/�DJO�Finance�Corp�9.875%�15/4/2018�� 2,400,000� USD� 2,400,000� 2,436,000� 0.10Dollar�General�Corp�3.25%�15/4/2023�� 10,000,000� USD� 9,060,608� 9,092,500� 0.38Downstream�Development�Authority�of�the�Quapaw�Tribe��of�Oklahoma�10.5%�1/7/2019�'144A'� 8,000,000� USD� 7,967,239� 7,440,000� 0.31DPL�Inc�7.25%�15/10/2021�� 11,143,000� USD� 11,829,237� 11,365,860� 0.47DR�Horton�Inc�3.75%�1/3/2019�� 3,000,000� USD� 3,000,000� 2,970,000� 0.12DreamWorks�Animation�SKG�Inc�6.875%�15/8/2020�'144A'� 8,058,000� USD� 8,188,399� 8,239,305� 0.34Ducommun�Inc�9.75%�15/7/2018�� 13,612,000� USD� 14,398,740� 14,564,839� 0.61Dycom�Investments�Inc�7.125%�15/1/2021�� 2,000,000� USD� 2,063,184� 2,100,000� 0.09Dynegy�Finance�I�Inc�6.75%�1/11/2019�'144A'� 3,775,000� USD� 3,775,000� 3,831,625� 0.16Eco�Services�Operations�LLC�8.5%�1/11/2022�'144A'� 2,000,000� USD� 2,000,000� 2,030,000� 0.08
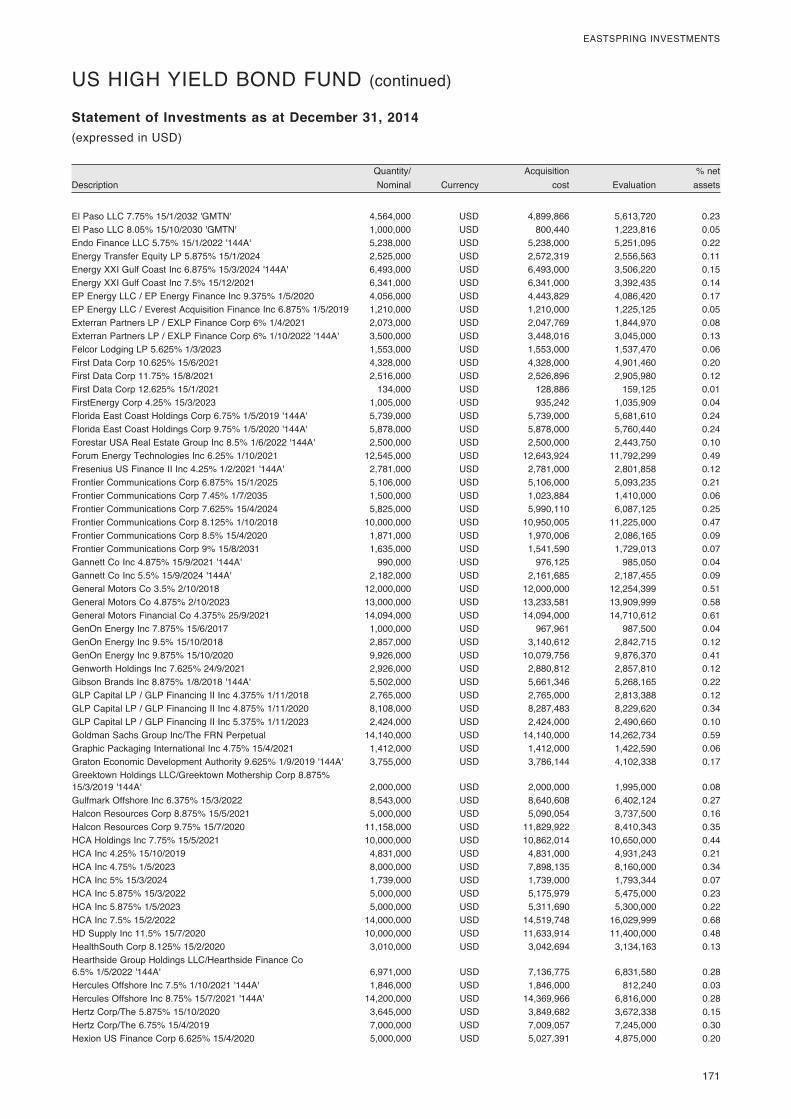
� 171
EASTSPRING�INVESTMENTS
� Quantity/�� � Acquisition�� � %�net�Description� Nominal�� Currency�� cost�� Evaluation�� assets�
Statement of Investments as at December 31, 2014(expressed�in�USD)
US�HIGH�YIELD�BOND�FUND�(continued)
El�Paso�LLC�7.75%�15/1/2032�'GMTN'� 4,564,000� USD� 4,899,866� 5,613,720� 0.23El�Paso�LLC�8.05%�15/10/2030�'GMTN'� 1,000,000� USD� 800,440� 1,223,816� 0.05Endo�Finance�LLC�5.75%�15/1/2022�'144A'� 5,238,000� USD� 5,238,000� 5,251,095� 0.22Energy�Transfer�Equity�LP�5.875%�15/1/2024�� 2,525,000� USD� 2,572,319� 2,556,563� 0.11Energy�XXI�Gulf�Coast�Inc�6.875%�15/3/2024�'144A'� 6,493,000� USD� 6,493,000� 3,506,220� 0.15Energy�XXI�Gulf�Coast�Inc�7.5%�15/12/2021�� 6,341,000� USD� 6,341,000� 3,392,435� 0.14EP�Energy�LLC�/�EP�Energy�Finance�Inc�9.375%�1/5/2020�� 4,056,000� USD� 4,443,829� 4,086,420� 0.17EP�Energy�LLC�/�Everest�Acquisition�Finance�Inc�6.875%�1/5/2019�� 1,210,000� USD� 1,210,000� 1,225,125� 0.05Exterran�Partners�LP�/�EXLP�Finance�Corp�6%�1/4/2021�� 2,073,000� USD� 2,047,769� 1,844,970� 0.08Exterran�Partners�LP�/�EXLP�Finance�Corp�6%�1/10/2022�'144A'� 3,500,000� USD� 3,448,016� 3,045,000� 0.13Felcor�Lodging�LP�5.625%�1/3/2023�� 1,553,000� USD� 1,553,000� 1,537,470� 0.06First�Data�Corp�10.625%�15/6/2021�� 4,328,000� USD� 4,328,000� 4,901,460� 0.20First�Data�Corp�11.75%�15/8/2021�� 2,516,000� USD� 2,526,896� 2,905,980� 0.12First�Data�Corp�12.625%�15/1/2021�� 134,000� USD� 128,886� 159,125� 0.01FirstEnergy�Corp�4.25%�15/3/2023�� 1,005,000� USD� 935,242� 1,035,909� 0.04Florida�East�Coast�Holdings�Corp�6.75%�1/5/2019�'144A'� 5,739,000� USD� 5,739,000� 5,681,610� 0.24Florida�East�Coast�Holdings�Corp�9.75%�1/5/2020�'144A'� 5,878,000� USD� 5,878,000� 5,760,440� 0.24Forestar�USA�Real�Estate�Group�Inc�8.5%�1/6/2022�'144A'� 2,500,000� USD� 2,500,000� 2,443,750� 0.10Forum�Energy�Technologies�Inc�6.25%�1/10/2021�� 12,545,000� USD� 12,643,924� 11,792,299� 0.49Fresenius�US�Finance�II�Inc�4.25%�1/2/2021�'144A'� 2,781,000� USD� 2,781,000� 2,801,858� 0.12Frontier�Communications�Corp�6.875%�15/1/2025�� 5,106,000� USD� 5,106,000� 5,093,235� 0.21Frontier�Communications�Corp�7.45%�1/7/2035�� 1,500,000� USD� 1,023,884� 1,410,000� 0.06Frontier�Communications�Corp�7.625%�15/4/2024�� 5,825,000� USD� 5,990,110� 6,087,125� 0.25Frontier�Communications�Corp�8.125%�1/10/2018�� 10,000,000� USD� 10,950,005� 11,225,000� 0.47Frontier�Communications�Corp�8.5%�15/4/2020�� 1,871,000� USD� 1,970,006� 2,086,165� 0.09Frontier�Communications�Corp�9%�15/8/2031�� 1,635,000� USD� 1,541,590� 1,729,013� 0.07Gannett�Co�Inc�4.875%�15/9/2021�'144A'� 990,000� USD� 976,125� 985,050� 0.04Gannett�Co�Inc�5.5%�15/9/2024�'144A'� 2,182,000� USD� 2,161,685� 2,187,455� 0.09General�Motors�Co�3.5%�2/10/2018�� 12,000,000� USD� 12,000,000� 12,254,399� 0.51General�Motors�Co�4.875%�2/10/2023�� 13,000,000� USD� 13,233,581� 13,909,999� 0.58General�Motors�Financial�Co�4.375%�25/9/2021�� 14,094,000� USD� 14,094,000� 14,710,612� 0.61GenOn�Energy�Inc�7.875%�15/6/2017�� 1,000,000� USD� 967,961� 987,500� 0.04GenOn�Energy�Inc�9.5%�15/10/2018�� 2,857,000� USD� 3,140,612� 2,842,715� 0.12GenOn�Energy�Inc�9.875%�15/10/2020�� 9,926,000� USD� 10,079,756� 9,876,370� 0.41Genworth�Holdings�Inc�7.625%�24/9/2021�� 2,926,000� USD� 2,880,812� 2,857,810� 0.12Gibson�Brands�Inc�8.875%�1/8/2018�'144A'� 5,502,000� USD� 5,661,346� 5,268,165� 0.22GLP�Capital�LP�/�GLP�Financing�II�Inc�4.375%�1/11/2018�� 2,765,000� USD� 2,765,000� 2,813,388� 0.12GLP�Capital�LP�/�GLP�Financing�II�Inc�4.875%�1/11/2020�� 8,108,000� USD� 8,287,483� 8,229,620� 0.34GLP�Capital�LP�/�GLP�Financing�II�Inc�5.375%�1/11/2023�� 2,424,000� USD� 2,424,000� 2,490,660� 0.10Goldman�Sachs�Group�Inc/The�FRN�Perpetual�� 14,140,000� USD� 14,140,000� 14,262,734� 0.59Graphic�Packaging�International�Inc�4.75%�15/4/2021�� 1,412,000� USD� 1,412,000� 1,422,590� 0.06Graton�Economic�Development�Authority�9.625%�1/9/2019�'144A'� 3,755,000� USD� 3,786,144� 4,102,338� 0.17Greektown�Holdings�LLC/Greektown�Mothership�Corp�8.875%��15/3/2019�'144A'� 2,000,000� USD� 2,000,000� 1,995,000� 0.08Gulfmark�Offshore�Inc�6.375%�15/3/2022�� 8,543,000� USD� 8,640,608� 6,402,124� 0.27Halcon�Resources�Corp�8.875%�15/5/2021�� 5,000,000� USD� 5,090,054� 3,737,500� 0.16Halcon�Resources�Corp�9.75%�15/7/2020�� 11,158,000� USD� 11,829,922� 8,410,343� 0.35HCA�Holdings�Inc�7.75%�15/5/2021�� 10,000,000� USD� 10,862,014� 10,650,000� 0.44HCA�Inc�4.25%�15/10/2019�� 4,831,000� USD� 4,831,000� 4,931,243� 0.21HCA�Inc�4.75%�1/5/2023�� 8,000,000� USD� 7,898,135� 8,160,000� 0.34HCA�Inc�5%�15/3/2024�� 1,739,000� USD� 1,739,000� 1,793,344� 0.07HCA�Inc�5.875%�15/3/2022�� 5,000,000� USD� 5,175,979� 5,475,000� 0.23HCA�Inc�5.875%�1/5/2023�� 5,000,000� USD� 5,311,690� 5,300,000� 0.22HCA�Inc�7.5%�15/2/2022�� 14,000,000� USD� 14,519,748� 16,029,999� 0.68HD�Supply�Inc�11.5%�15/7/2020�� 10,000,000� USD� 11,633,914� 11,400,000� 0.48HealthSouth�Corp�8.125%�15/2/2020�� 3,010,000� USD� 3,042,694� 3,134,163� 0.13Hearthside�Group�Holdings�LLC/Hearthside�Finance�Co��6.5%�1/5/2022�'144A'� 6,971,000� USD� 7,136,775� 6,831,580� 0.28Hercules�Offshore�Inc�7.5%�1/10/2021�'144A'� 1,846,000� USD� 1,846,000� 812,240� 0.03Hercules�Offshore�Inc�8.75%�15/7/2021�'144A'� 14,200,000� USD� 14,369,966� 6,816,000� 0.28Hertz�Corp/The�5.875%�15/10/2020�� 3,645,000� USD� 3,849,682� 3,672,338� 0.15Hertz�Corp/The�6.75%�15/4/2019�� 7,000,000� USD� 7,009,057� 7,245,000� 0.30Hexion�US�Finance�Corp�6.625%�15/4/2020�� 5,000,000� USD� 5,027,391� 4,875,000� 0.20
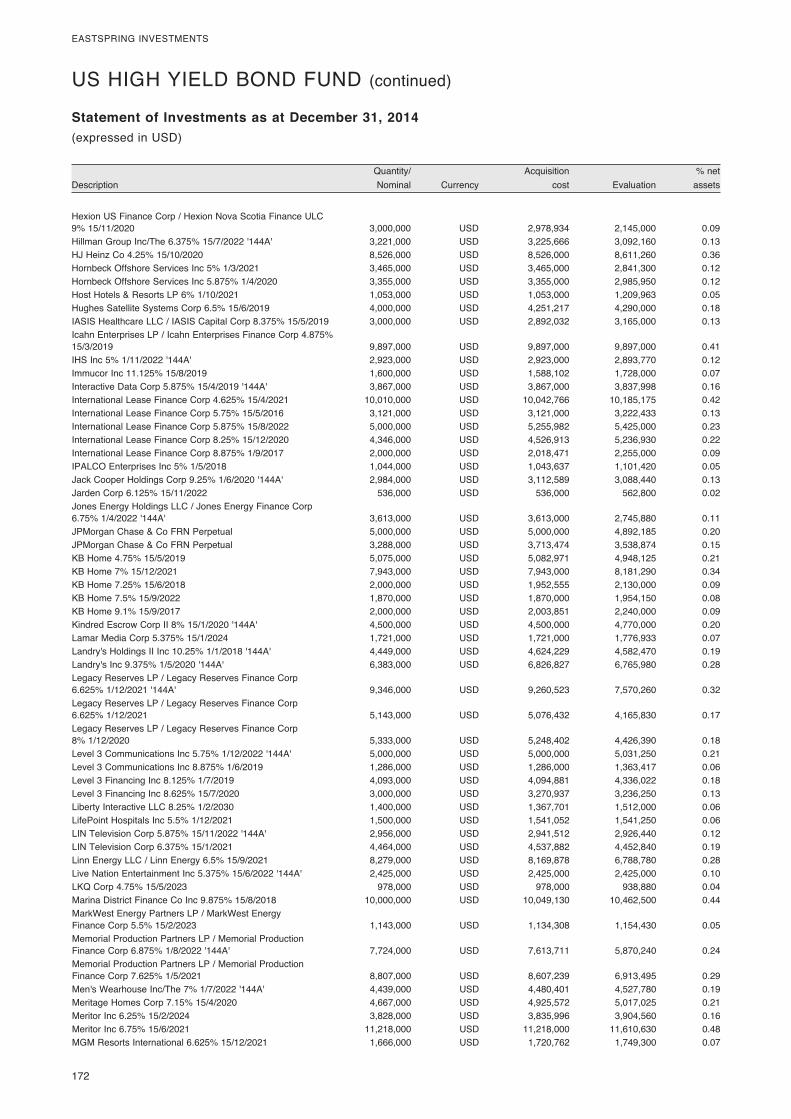
172�
EASTSPRING�INVESTMENTS
� Quantity/�� � Acquisition�� � %�net�Description� Nominal�� Currency�� cost�� Evaluation�� assets�
Statement of Investments as at December 31, 2014(expressed�in�USD)
Hexion�US�Finance�Corp�/�Hexion�Nova�Scotia�Finance�ULC��9%�15/11/2020�� 3,000,000� USD� 2,978,934� 2,145,000� 0.09Hillman�Group�Inc/The�6.375%�15/7/2022�'144A'� 3,221,000� USD� 3,225,666� 3,092,160� 0.13HJ�Heinz�Co�4.25%�15/10/2020�� 8,526,000� USD� 8,526,000� 8,611,260� 0.36Hornbeck�Offshore�Services�Inc�5%�1/3/2021�� 3,465,000� USD� 3,465,000� 2,841,300� 0.12Hornbeck�Offshore�Services�Inc�5.875%�1/4/2020�� 3,355,000� USD� 3,355,000� 2,985,950� 0.12Host�Hotels�&�Resorts�LP�6%�1/10/2021�� 1,053,000� USD� 1,053,000� 1,209,963� 0.05Hughes�Satellite�Systems�Corp�6.5%�15/6/2019�� 4,000,000� USD� 4,251,217� 4,290,000� 0.18IASIS�Healthcare�LLC�/�IASIS�Capital�Corp�8.375%�15/5/2019�� 3,000,000� USD� 2,892,032� 3,165,000� 0.13Icahn�Enterprises�LP�/�Icahn�Enterprises�Finance�Corp�4.875%��15/3/2019�� 9,897,000� USD� 9,897,000� 9,897,000� 0.41IHS�Inc�5%�1/11/2022�'144A'� 2,923,000� USD� 2,923,000� 2,893,770� 0.12Immucor�Inc�11.125%�15/8/2019�� 1,600,000� USD� 1,588,102� 1,728,000� 0.07Interactive�Data�Corp�5.875%�15/4/2019�'144A'� 3,867,000� USD� 3,867,000� 3,837,998� 0.16International�Lease�Finance�Corp�4.625%�15/4/2021�� 10,010,000� USD� 10,042,766� 10,185,175� 0.42International�Lease�Finance�Corp�5.75%�15/5/2016�� 3,121,000� USD� 3,121,000� 3,222,433� 0.13International�Lease�Finance�Corp�5.875%�15/8/2022�� 5,000,000� USD� 5,255,982� 5,425,000� 0.23International�Lease�Finance�Corp�8.25%�15/12/2020�� 4,346,000� USD� 4,526,913� 5,236,930� 0.22International�Lease�Finance�Corp�8.875%�1/9/2017�� 2,000,000� USD� 2,018,471� 2,255,000� 0.09IPALCO�Enterprises�Inc�5%�1/5/2018�� 1,044,000� USD� 1,043,637� 1,101,420� 0.05Jack�Cooper�Holdings�Corp�9.25%�1/6/2020�'144A'� 2,984,000� USD� 3,112,589� 3,088,440� 0.13Jarden�Corp�6.125%�15/11/2022�� 536,000� USD� 536,000� 562,800� 0.02Jones�Energy�Holdings�LLC�/�Jones�Energy�Finance�Corp��6.75%�1/4/2022�'144A'� 3,613,000� USD� 3,613,000� 2,745,880� 0.11JPMorgan�Chase�&�Co�FRN�Perpetual�� 5,000,000� USD� 5,000,000� 4,892,185� 0.20JPMorgan�Chase�&�Co�FRN�Perpetual�� 3,288,000� USD� 3,713,474� 3,538,874� 0.15KB�Home�4.75%�15/5/2019�� 5,075,000� USD� 5,082,971� 4,948,125� 0.21KB�Home�7%�15/12/2021�� 7,943,000� USD� 7,943,000� 8,181,290� 0.34KB�Home�7.25%�15/6/2018�� 2,000,000� USD� 1,952,555� 2,130,000� 0.09KB�Home�7.5%�15/9/2022�� 1,870,000� USD� 1,870,000� 1,954,150� 0.08KB�Home�9.1%�15/9/2017�� 2,000,000� USD� 2,003,851� 2,240,000� 0.09Kindred�Escrow�Corp�II�8%�15/1/2020�'144A'� 4,500,000� USD� 4,500,000� 4,770,000� 0.20Lamar�Media�Corp�5.375%�15/1/2024�� 1,721,000� USD� 1,721,000� 1,776,933� 0.07Landry's�Holdings�II�Inc�10.25%�1/1/2018�'144A'� 4,449,000� USD� 4,624,229� 4,582,470� 0.19Landry's�Inc�9.375%�1/5/2020�'144A'� 6,383,000� USD� 6,826,827� 6,765,980� 0.28Legacy�Reserves�LP�/�Legacy�Reserves�Finance�Corp��6.625%�1/12/2021�'144A'� 9,346,000� USD� 9,260,523� 7,570,260� 0.32Legacy�Reserves�LP�/�Legacy�Reserves�Finance�Corp��6.625%�1/12/2021�� 5,143,000� USD� 5,076,432� 4,165,830� 0.17Legacy�Reserves�LP�/�Legacy�Reserves�Finance�Corp��8%�1/12/2020�� 5,333,000� USD� 5,248,402� 4,426,390� 0.18Level�3�Communications�Inc�5.75%�1/12/2022�'144A'� 5,000,000� USD� 5,000,000� 5,031,250� 0.21Level�3�Communications�Inc�8.875%�1/6/2019�� 1,286,000� USD� 1,286,000� 1,363,417� 0.06Level�3�Financing�Inc�8.125%�1/7/2019�� 4,093,000� USD� 4,094,881� 4,336,022� 0.18Level�3�Financing�Inc�8.625%�15/7/2020�� 3,000,000� USD� 3,270,937� 3,236,250� 0.13Liberty�Interactive�LLC�8.25%�1/2/2030�� 1,400,000� USD� 1,367,701� 1,512,000� 0.06LifePoint�Hospitals�Inc�5.5%�1/12/2021�� 1,500,000� USD� 1,541,052� 1,541,250� 0.06LIN�Television�Corp�5.875%�15/11/2022�'144A'� 2,956,000� USD� 2,941,512� 2,926,440� 0.12LIN�Television�Corp�6.375%�15/1/2021�� 4,464,000� USD� 4,537,882� 4,452,840� 0.19Linn�Energy�LLC�/�Linn�Energy�6.5%�15/9/2021�� 8,279,000� USD� 8,169,878� 6,788,780� 0.28Live�Nation�Entertainment�Inc�5.375%�15/6/2022�'144A'� 2,425,000� USD� 2,425,000� 2,425,000� 0.10LKQ�Corp�4.75%�15/5/2023�� 978,000� USD� 978,000� 938,880� 0.04Marina�District�Finance�Co�Inc�9.875%�15/8/2018�� 10,000,000� USD� 10,049,130� 10,462,500� 0.44MarkWest�Energy�Partners�LP�/�MarkWest�Energy��Finance�Corp�5.5%�15/2/2023�� 1,143,000� USD� 1,134,308� 1,154,430� 0.05Memorial�Production�Partners�LP�/�Memorial�Production��Finance�Corp�6.875%�1/8/2022�'144A'� 7,724,000� USD� 7,613,711� 5,870,240� 0.24Memorial�Production�Partners�LP�/�Memorial�Production��Finance�Corp�7.625%�1/5/2021�� 8,807,000� USD� 8,607,239� 6,913,495� 0.29Men's�Wearhouse�Inc/The�7%�1/7/2022�'144A'� 4,439,000� USD� 4,480,401� 4,527,780� 0.19Meritage�Homes�Corp�7.15%�15/4/2020�� 4,667,000� USD� 4,925,572� 5,017,025� 0.21Meritor�Inc�6.25%�15/2/2024�� 3,828,000� USD� 3,835,996� 3,904,560� 0.16Meritor�Inc�6.75%�15/6/2021�� 11,218,000� USD� 11,218,000� 11,610,630� 0.48MGM�Resorts�International�6.625%�15/12/2021�� 1,666,000� USD� 1,720,762� 1,749,300� 0.07
US�HIGH�YIELD�BOND�FUND�(continued)
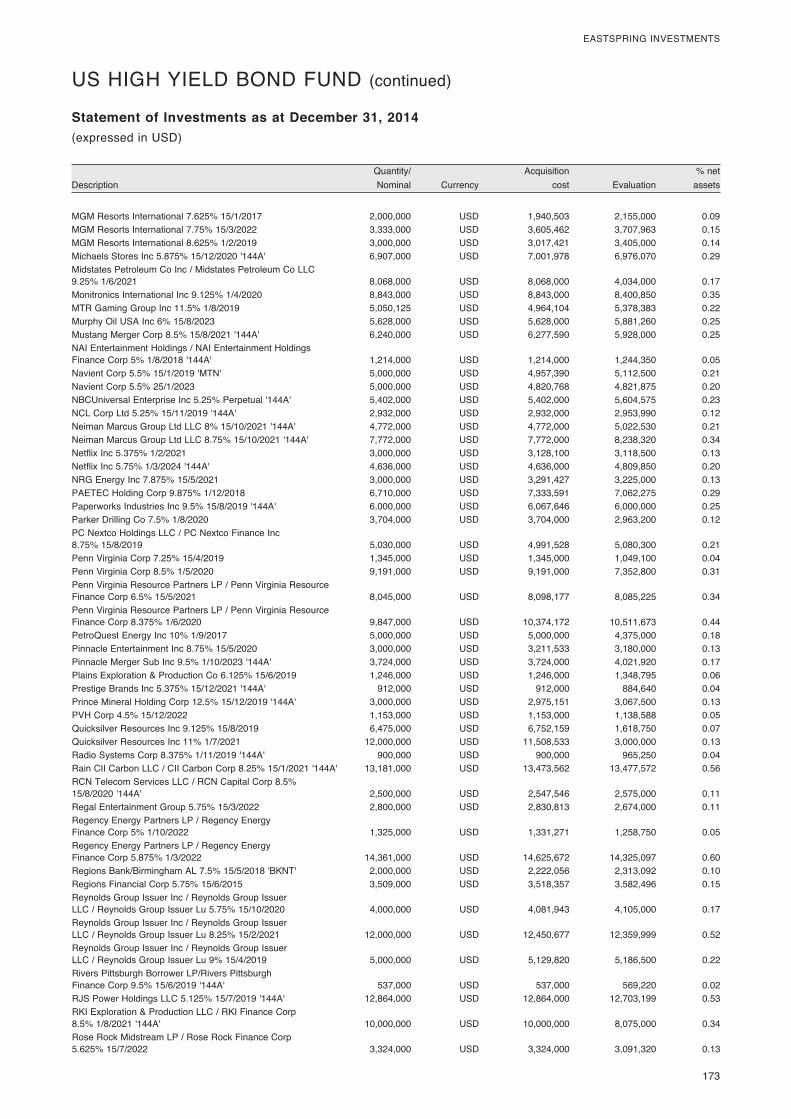
� 173
EASTSPRING�INVESTMENTS
� Quantity/�� � Acquisition�� � %�net�Description� Nominal�� Currency�� cost�� Evaluation�� assets�
Statement of Investments as at December 31, 2014(expressed�in�USD)
MGM�Resorts�International�7.625%�15/1/2017�� 2,000,000� USD� 1,940,503� 2,155,000� 0.09MGM�Resorts�International�7.75%�15/3/2022�� 3,333,000� USD� 3,605,462� 3,707,963� 0.15MGM�Resorts�International�8.625%�1/2/2019�� 3,000,000� USD� 3,017,421� 3,405,000� 0.14Michaels�Stores�Inc�5.875%�15/12/2020�'144A'� 6,907,000� USD� 7,001,978� 6,976,070� 0.29Midstates�Petroleum�Co�Inc�/�Midstates�Petroleum�Co�LLC��9.25%�1/6/2021�� 8,068,000� USD� 8,068,000� 4,034,000� 0.17Monitronics�International�Inc�9.125%�1/4/2020�� 8,843,000� USD� 8,843,000� 8,400,850� 0.35MTR�Gaming�Group�Inc�11.5%�1/8/2019�� 5,050,125� USD� 4,964,104� 5,378,383� 0.22Murphy�Oil�USA�Inc�6%�15/8/2023�� 5,628,000� USD� 5,628,000� 5,881,260� 0.25Mustang�Merger�Corp�8.5%�15/8/2021�'144A'� 6,240,000� USD� 6,277,590� 5,928,000� 0.25NAI�Entertainment�Holdings�/�NAI�Entertainment�Holdings��Finance�Corp�5%�1/8/2018�'144A'� 1,214,000� USD� 1,214,000� 1,244,350� 0.05Navient�Corp�5.5%�15/1/2019�'MTN'� 5,000,000� USD� 4,957,390� 5,112,500� 0.21Navient�Corp�5.5%�25/1/2023�� 5,000,000� USD� 4,820,768� 4,821,875� 0.20NBCUniversal�Enterprise�Inc�5.25%�Perpetual�'144A'� 5,402,000� USD� 5,402,000� 5,604,575� 0.23NCL�Corp�Ltd�5.25%�15/11/2019�'144A'� 2,932,000� USD� 2,932,000� 2,953,990� 0.12Neiman�Marcus�Group�Ltd�LLC�8%�15/10/2021�'144A'� 4,772,000� USD� 4,772,000� 5,022,530� 0.21Neiman�Marcus�Group�Ltd�LLC�8.75%�15/10/2021�'144A'� 7,772,000� USD� 7,772,000� 8,238,320� 0.34Netflix�Inc�5.375%�1/2/2021�� 3,000,000� USD� 3,128,100� 3,118,500� 0.13Netflix�Inc�5.75%�1/3/2024�'144A'� 4,636,000� USD� 4,636,000� 4,809,850� 0.20NRG�Energy�Inc�7.875%�15/5/2021�� 3,000,000� USD� 3,291,427� 3,225,000� 0.13PAETEC�Holding�Corp�9.875%�1/12/2018�� 6,710,000� USD� 7,333,591� 7,062,275� 0.29Paperworks�Industries�Inc�9.5%�15/8/2019�'144A'� 6,000,000� USD� 6,067,646� 6,000,000� 0.25Parker�Drilling�Co�7.5%�1/8/2020�� 3,704,000� USD� 3,704,000� 2,963,200� 0.12PC�Nextco�Holdings�LLC�/�PC�Nextco�Finance�Inc��8.75%�15/8/2019�� 5,030,000� USD� 4,991,528� 5,080,300� 0.21Penn�Virginia�Corp�7.25%�15/4/2019�� 1,345,000� USD� 1,345,000� 1,049,100� 0.04Penn�Virginia�Corp�8.5%�1/5/2020�� 9,191,000� USD� 9,191,000� 7,352,800� 0.31Penn�Virginia�Resource�Partners�LP�/�Penn�Virginia�Resource��Finance�Corp�6.5%�15/5/2021�� 8,045,000� USD� 8,098,177� 8,085,225� 0.34Penn�Virginia�Resource�Partners�LP�/�Penn�Virginia�Resource��Finance�Corp�8.375%�1/6/2020�� 9,847,000� USD� 10,374,172� 10,511,673� 0.44PetroQuest�Energy�Inc�10%�1/9/2017�� 5,000,000� USD� 5,000,000� 4,375,000� 0.18Pinnacle�Entertainment�Inc�8.75%�15/5/2020�� 3,000,000� USD� 3,211,533� 3,180,000� 0.13Pinnacle�Merger�Sub�Inc�9.5%�1/10/2023�'144A'� 3,724,000� USD� 3,724,000� 4,021,920� 0.17Plains�Exploration�&�Production�Co�6.125%�15/6/2019�� 1,246,000� USD� 1,246,000� 1,348,795� 0.06Prestige�Brands�Inc�5.375%�15/12/2021�'144A'� 912,000� USD� 912,000� 884,640� 0.04Prince�Mineral�Holding�Corp�12.5%�15/12/2019�'144A'� 3,000,000� USD� 2,975,151� 3,067,500� 0.13PVH�Corp�4.5%�15/12/2022�� 1,153,000� USD� 1,153,000� 1,138,588� 0.05Quicksilver�Resources�Inc�9.125%�15/8/2019�� 6,475,000� USD� 6,752,159� 1,618,750� 0.07Quicksilver�Resources�Inc�11%�1/7/2021�� 12,000,000� USD� 11,508,533� 3,000,000� 0.13Radio�Systems�Corp�8.375%�1/11/2019�'144A'� 900,000� USD� 900,000� 965,250� 0.04Rain�CII�Carbon�LLC�/�CII�Carbon�Corp�8.25%�15/1/2021�'144A'� 13,181,000� USD� 13,473,562� 13,477,572� 0.56RCN�Telecom�Services�LLC�/�RCN�Capital�Corp�8.5%��15/8/2020�'144A'� 2,500,000� USD� 2,547,546� 2,575,000� 0.11Regal�Entertainment�Group�5.75%�15/3/2022�� 2,800,000� USD� 2,830,813� 2,674,000� 0.11Regency�Energy�Partners�LP�/�Regency�Energy��Finance�Corp�5%�1/10/2022�� 1,325,000� USD� 1,331,271� 1,258,750� 0.05Regency�Energy�Partners�LP�/�Regency�Energy��Finance�Corp�5.875%�1/3/2022�� 14,361,000� USD� 14,625,672� 14,325,097� 0.60Regions�Bank/Birmingham�AL�7.5%�15/5/2018�'BKNT'� 2,000,000� USD� 2,222,056� 2,313,092� 0.10Regions�Financial�Corp�5.75%�15/6/2015�� 3,509,000� USD� 3,518,357� 3,582,496� 0.15Reynolds�Group�Issuer�Inc�/�Reynolds�Group�Issuer��LLC�/�Reynolds�Group�Issuer�Lu�5.75%�15/10/2020�� 4,000,000� USD� 4,081,943� 4,105,000� 0.17Reynolds�Group�Issuer�Inc�/�Reynolds�Group�Issuer��LLC�/�Reynolds�Group�Issuer�Lu�8.25%�15/2/2021�� 12,000,000� USD� 12,450,677� 12,359,999� 0.52Reynolds�Group�Issuer�Inc�/�Reynolds�Group�Issuer��LLC�/�Reynolds�Group�Issuer�Lu�9%�15/4/2019�� 5,000,000� USD� 5,129,820� 5,186,500� 0.22Rivers�Pittsburgh�Borrower�LP/Rivers�Pittsburgh��Finance�Corp�9.5%�15/6/2019�'144A'� 537,000� USD� 537,000� 569,220� 0.02RJS�Power�Holdings�LLC�5.125%�15/7/2019�'144A'� 12,864,000� USD� 12,864,000� 12,703,199� 0.53RKI�Exploration�&�Production�LLC�/�RKI�Finance�Corp��8.5%�1/8/2021�'144A'� 10,000,000� USD� 10,000,000� 8,075,000� 0.34Rose�Rock�Midstream�LP�/�Rose�Rock�Finance�Corp��5.625%�15/7/2022�� 3,324,000� USD� 3,324,000� 3,091,320� 0.13
US�HIGH�YIELD�BOND�FUND�(continued)
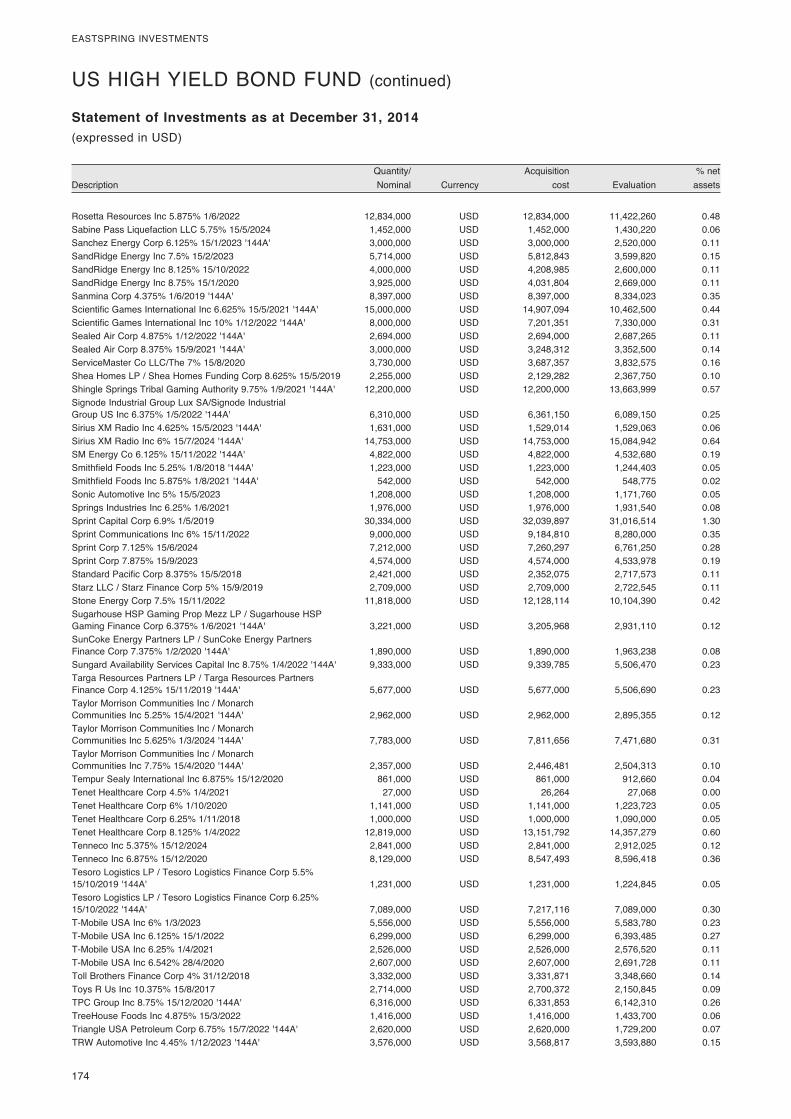
174�
EASTSPRING�INVESTMENTS
� Quantity/�� � Acquisition�� � %�net�Description� Nominal�� Currency�� cost�� Evaluation�� assets�
Statement of Investments as at December 31, 2014(expressed�in�USD)
Rosetta�Resources�Inc�5.875%�1/6/2022�� 12,834,000� USD� 12,834,000� 11,422,260� 0.48Sabine�Pass�Liquefaction�LLC�5.75%�15/5/2024�� 1,452,000� USD� 1,452,000� 1,430,220� 0.06Sanchez�Energy�Corp�6.125%�15/1/2023�'144A'� 3,000,000� USD� 3,000,000� 2,520,000� 0.11SandRidge�Energy�Inc�7.5%�15/2/2023�� 5,714,000� USD� 5,812,843� 3,599,820� 0.15SandRidge�Energy�Inc�8.125%�15/10/2022�� 4,000,000� USD� 4,208,985� 2,600,000� 0.11SandRidge�Energy�Inc�8.75%�15/1/2020�� 3,925,000� USD� 4,031,804� 2,669,000� 0.11Sanmina�Corp�4.375%�1/6/2019�'144A'� 8,397,000� USD� 8,397,000� 8,334,023� 0.35Scientific�Games�International�Inc�6.625%�15/5/2021�'144A'� 15,000,000� USD� 14,907,094� 10,462,500� 0.44Scientific�Games�International�Inc�10%�1/12/2022�'144A'� 8,000,000� USD� 7,201,351� 7,330,000� 0.31Sealed�Air�Corp�4.875%�1/12/2022�'144A'� 2,694,000� USD� 2,694,000� 2,687,265� 0.11Sealed�Air�Corp�8.375%�15/9/2021�'144A'� 3,000,000� USD� 3,248,312� 3,352,500� 0.14ServiceMaster�Co�LLC/The�7%�15/8/2020�� 3,730,000� USD� 3,687,357� 3,832,575� 0.16Shea�Homes�LP�/�Shea�Homes�Funding�Corp�8.625%�15/5/2019�� 2,255,000� USD� 2,129,282� 2,367,750� 0.10Shingle�Springs�Tribal�Gaming�Authority�9.75%�1/9/2021�'144A'� 12,200,000� USD� 12,200,000� 13,663,999� 0.57Signode�Industrial�Group�Lux�SA/Signode�Industrial��Group�US�Inc�6.375%�1/5/2022�'144A'� 6,310,000� USD� 6,361,150� 6,089,150� 0.25Sirius�XM�Radio�Inc�4.625%�15/5/2023�'144A'� 1,631,000� USD� 1,529,014� 1,529,063� 0.06Sirius�XM�Radio�Inc�6%�15/7/2024�'144A'� 14,753,000� USD� 14,753,000� 15,084,942� 0.64SM�Energy�Co�6.125%�15/11/2022�'144A'� 4,822,000� USD� 4,822,000� 4,532,680� 0.19Smithfield�Foods�Inc�5.25%�1/8/2018�'144A'� 1,223,000� USD� 1,223,000� 1,244,403� 0.05Smithfield�Foods�Inc�5.875%�1/8/2021�'144A'� 542,000� USD� 542,000� 548,775� 0.02Sonic�Automotive�Inc�5%�15/5/2023�� 1,208,000� USD� 1,208,000� 1,171,760� 0.05Springs�Industries�Inc�6.25%�1/6/2021�� 1,976,000� USD� 1,976,000� 1,931,540� 0.08Sprint�Capital�Corp�6.9%�1/5/2019�� 30,334,000� USD� 32,039,897� 31,016,514� 1.30Sprint�Communications�Inc�6%�15/11/2022�� 9,000,000� USD� 9,184,810� 8,280,000� 0.35Sprint�Corp�7.125%�15/6/2024�� 7,212,000� USD� 7,260,297� 6,761,250� 0.28Sprint�Corp�7.875%�15/9/2023�� 4,574,000� USD� 4,574,000� 4,533,978� 0.19Standard�Pacific�Corp�8.375%�15/5/2018�� 2,421,000� USD� 2,352,075� 2,717,573� 0.11Starz�LLC�/�Starz�Finance�Corp�5%�15/9/2019�� 2,709,000� USD� 2,709,000� 2,722,545� 0.11Stone�Energy�Corp�7.5%�15/11/2022�� 11,818,000� USD� 12,128,114� 10,104,390� 0.42Sugarhouse�HSP�Gaming�Prop�Mezz�LP�/�Sugarhouse�HSP��Gaming�Finance�Corp�6.375%�1/6/2021�'144A'� 3,221,000� USD� 3,205,968� 2,931,110� 0.12SunCoke�Energy�Partners�LP�/�SunCoke�Energy�Partners��Finance�Corp�7.375%�1/2/2020�'144A'� 1,890,000� USD� 1,890,000� 1,963,238� 0.08Sungard�Availability�Services�Capital�Inc�8.75%�1/4/2022�'144A'� 9,333,000� USD� 9,339,785� 5,506,470� 0.23Targa�Resources�Partners�LP�/�Targa�Resources�Partners��Finance�Corp�4.125%�15/11/2019�'144A'� 5,677,000� USD� 5,677,000� 5,506,690� 0.23Taylor�Morrison�Communities�Inc�/�Monarch��Communities�Inc�5.25%�15/4/2021�'144A'� 2,962,000� USD� 2,962,000� 2,895,355� 0.12Taylor�Morrison�Communities�Inc�/�Monarch��Communities�Inc�5.625%�1/3/2024�'144A'� 7,783,000� USD� 7,811,656� 7,471,680� 0.31Taylor�Morrison�Communities�Inc�/�Monarch��Communities�Inc�7.75%�15/4/2020�'144A'� 2,357,000� USD� 2,446,481� 2,504,313� 0.10Tempur�Sealy�International�Inc�6.875%�15/12/2020�� 861,000� USD� 861,000� 912,660� 0.04Tenet�Healthcare�Corp�4.5%�1/4/2021�� 27,000� USD� 26,264� 27,068� 0.00Tenet�Healthcare�Corp�6%�1/10/2020�� 1,141,000� USD� 1,141,000� 1,223,723� 0.05Tenet�Healthcare�Corp�6.25%�1/11/2018�� 1,000,000� USD� 1,000,000� 1,090,000� 0.05Tenet�Healthcare�Corp�8.125%�1/4/2022�� 12,819,000� USD� 13,151,792� 14,357,279� 0.60Tenneco�Inc�5.375%�15/12/2024�� 2,841,000� USD� 2,841,000� 2,912,025� 0.12Tenneco�Inc�6.875%�15/12/2020�� 8,129,000� USD� 8,547,493� 8,596,418� 0.36Tesoro�Logistics�LP�/�Tesoro�Logistics�Finance�Corp�5.5%��15/10/2019�'144A'� 1,231,000� USD� 1,231,000� 1,224,845� 0.05Tesoro�Logistics�LP�/�Tesoro�Logistics�Finance�Corp�6.25%��15/10/2022�'144A'� 7,089,000� USD� 7,217,116� 7,089,000� 0.30T-Mobile�USA�Inc�6%�1/3/2023�� 5,556,000� USD� 5,556,000� 5,583,780� 0.23T-Mobile�USA�Inc�6.125%�15/1/2022�� 6,299,000� USD� 6,299,000� 6,393,485� 0.27T-Mobile�USA�Inc�6.25%�1/4/2021�� 2,526,000� USD� 2,526,000� 2,576,520� 0.11T-Mobile�USA�Inc�6.542%�28/4/2020�� 2,607,000� USD� 2,607,000� 2,691,728� 0.11Toll�Brothers�Finance�Corp�4%�31/12/2018�� 3,332,000� USD� 3,331,871� 3,348,660� 0.14Toys�R�Us�Inc�10.375%�15/8/2017�� 2,714,000� USD� 2,700,372� 2,150,845� 0.09TPC�Group�Inc�8.75%�15/12/2020�'144A'� 6,316,000� USD� 6,331,853� 6,142,310� 0.26TreeHouse�Foods�Inc�4.875%�15/3/2022�� 1,416,000� USD� 1,416,000� 1,433,700� 0.06Triangle�USA�Petroleum�Corp�6.75%�15/7/2022�'144A'� 2,620,000� USD� 2,620,000� 1,729,200� 0.07TRW�Automotive�Inc�4.45%�1/12/2023�'144A'� 3,576,000� USD� 3,568,817� 3,593,880� 0.15
US�HIGH�YIELD�BOND�FUND�(continued)
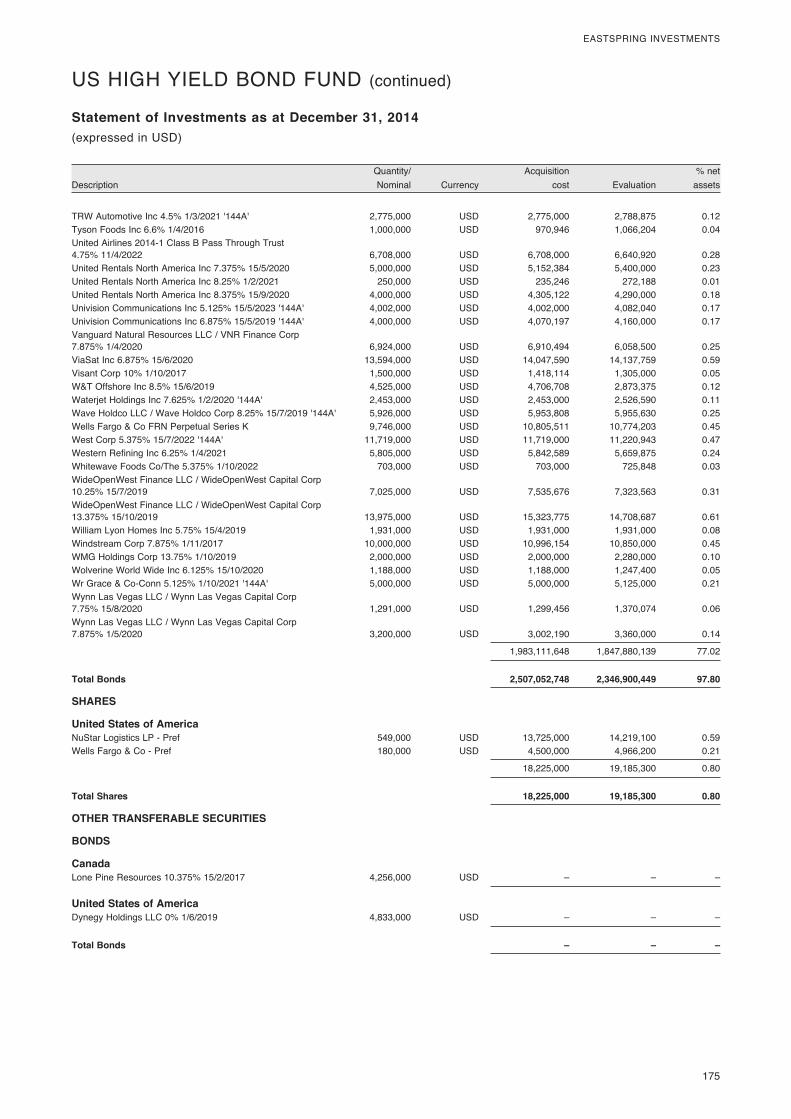
� 175
EASTSPRING�INVESTMENTS
� Quantity/�� � Acquisition�� � %�net�Description� Nominal�� Currency�� cost�� Evaluation�� assets�
Statement of Investments as at December 31, 2014(expressed�in�USD)
TRW�Automotive�Inc�4.5%�1/3/2021�'144A'� 2,775,000� USD� 2,775,000� 2,788,875� 0.12Tyson�Foods�Inc�6.6%�1/4/2016�� 1,000,000� USD� 970,946� 1,066,204� 0.04United�Airlines�2014-1�Class�B�Pass�Through�Trust��4.75%�11/4/2022�� 6,708,000� USD� 6,708,000� 6,640,920� 0.28United�Rentals�North�America�Inc�7.375%�15/5/2020�� 5,000,000� USD� 5,152,384� 5,400,000� 0.23United�Rentals�North�America�Inc�8.25%�1/2/2021�� 250,000� USD� 235,246� 272,188� 0.01United�Rentals�North�America�Inc�8.375%�15/9/2020�� 4,000,000� USD� 4,305,122� 4,290,000� 0.18Univision�Communications�Inc�5.125%�15/5/2023�'144A'� 4,002,000� USD� 4,002,000� 4,082,040� 0.17Univision�Communications�Inc�6.875%�15/5/2019�'144A'� 4,000,000� USD� 4,070,197� 4,160,000� 0.17Vanguard�Natural�Resources�LLC�/�VNR�Finance�Corp��7.875%�1/4/2020�� 6,924,000� USD� 6,910,494� 6,058,500� 0.25ViaSat�Inc�6.875%�15/6/2020�� 13,594,000� USD� 14,047,590� 14,137,759� 0.59Visant�Corp�10%�1/10/2017�� 1,500,000� USD� 1,418,114� 1,305,000� 0.05W&T�Offshore�Inc�8.5%�15/6/2019�� 4,525,000� USD� 4,706,708� 2,873,375� 0.12Waterjet�Holdings�Inc�7.625%�1/2/2020�'144A'� 2,453,000� USD� 2,453,000� 2,526,590� 0.11Wave�Holdco�LLC�/�Wave�Holdco�Corp�8.25%�15/7/2019�'144A'� 5,926,000� USD� 5,953,808� 5,955,630� 0.25Wells�Fargo�&�Co�FRN�Perpetual�Series�K� 9,746,000� USD� 10,805,511� 10,774,203� 0.45West�Corp�5.375%�15/7/2022�'144A'� 11,719,000� USD� 11,719,000� 11,220,943� 0.47Western�Refining�Inc�6.25%�1/4/2021�� 5,805,000� USD� 5,842,589� 5,659,875� 0.24Whitewave�Foods�Co/The�5.375%�1/10/2022�� 703,000� USD� 703,000� 725,848� 0.03WideOpenWest�Finance�LLC�/�WideOpenWest�Capital�Corp��10.25%�15/7/2019�� 7,025,000� USD� 7,535,676� 7,323,563� 0.31WideOpenWest�Finance�LLC�/�WideOpenWest�Capital�Corp��13.375%�15/10/2019�� 13,975,000� USD� 15,323,775� 14,708,687� 0.61William�Lyon�Homes�Inc�5.75%�15/4/2019�� 1,931,000� USD� 1,931,000� 1,931,000� 0.08Windstream�Corp�7.875%�1/11/2017�� 10,000,000� USD� 10,996,154� 10,850,000� 0.45WMG�Holdings�Corp�13.75%�1/10/2019�� 2,000,000� USD� 2,000,000� 2,280,000� 0.10Wolverine�World�Wide�Inc�6.125%�15/10/2020�� 1,188,000� USD� 1,188,000� 1,247,400� 0.05Wr�Grace�&�Co-Conn�5.125%�1/10/2021�'144A'� 5,000,000� USD� 5,000,000� 5,125,000� 0.21Wynn�Las�Vegas�LLC�/�Wynn�Las�Vegas�Capital�Corp��7.75%�15/8/2020�� 1,291,000� USD� 1,299,456� 1,370,074� 0.06Wynn�Las�Vegas�LLC�/�Wynn�Las�Vegas�Capital�Corp��7.875%�1/5/2020�� 3,200,000� USD� 3,002,190� 3,360,000� 0.14
� � � 1,983,111,648� 1,847,880,139� 77.02
Total Bonds 2,507,052,748 2,346,900,449 97.80
SHARES
United States of America NuStar�Logistics�LP�-�Pref� 549,000� USD� 13,725,000� 14,219,100� 0.59Wells�Fargo�&�Co�-�Pref�� 180,000� USD� 4,500,000� 4,966,200� 0.21
� � � 18,225,000� 19,185,300� 0.80
Total Shares 18,225,000 19,185,300 0.80
OTHER TRANSFERABLE SECURITIES
BONDS
Canada Lone�Pine�Resources�10.375%�15/2/2017�� 4,256,000� USD� –� –� –
United States of America Dynegy�Holdings�LLC�0%�1/6/2019�� 4,833,000� USD� –� –� –
Total Bonds – – –
US�HIGH�YIELD�BOND�FUND�(continued)
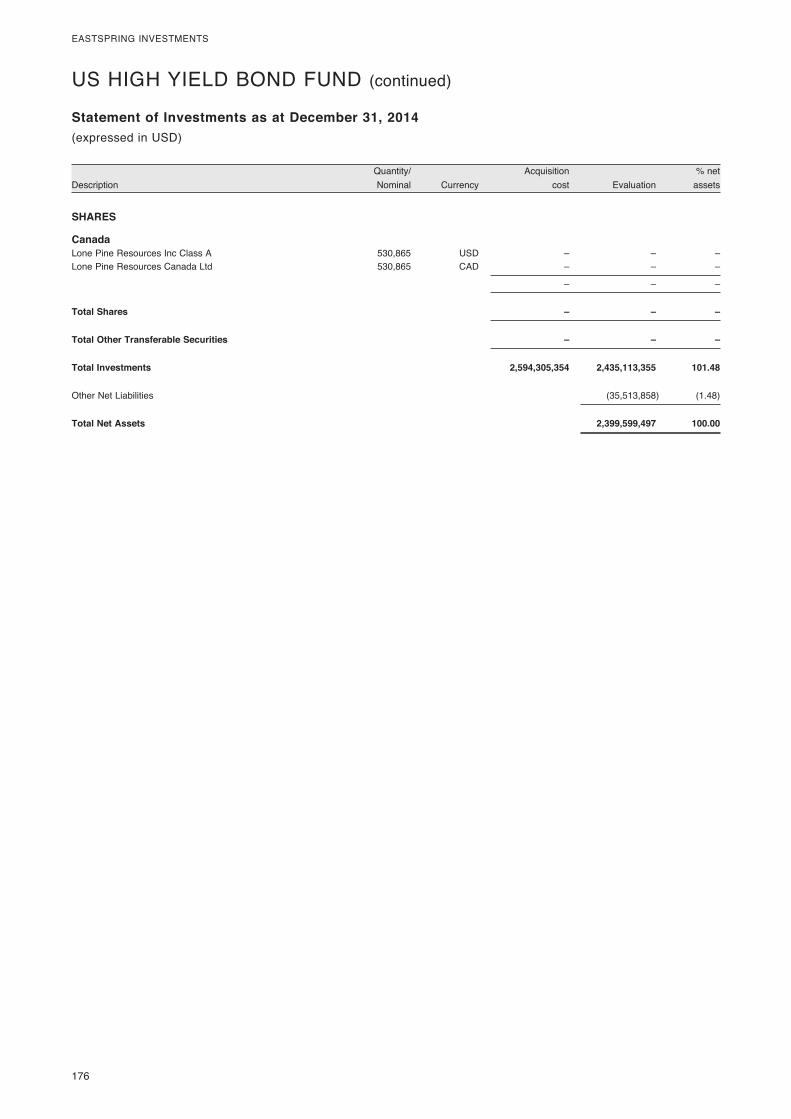
176�
EASTSPRING�INVESTMENTS
� Quantity/�� � Acquisition�� � %�net�Description� Nominal�� Currency�� cost�� Evaluation�� assets�
Statement of Investments as at December 31, 2014(expressed�in�USD)
US�HIGH�YIELD�BOND�FUND�(continued)
SHARES
Canada Lone�Pine�Resources�Inc�Class�A� 530,865� USD� –� –� –Lone�Pine�Resources�Canada�Ltd�� 530,865� CAD� –� –� –
� � � –� –� –
Total Shares – – –
Total Other Transferable Securities – – –
Total Investments 2,594,305,354 2,435,113,355 101.48
Other�Net�Liabilities� � � � (35,513,858)� (1.48)
Total Net Assets 2,399,599,497 100.00
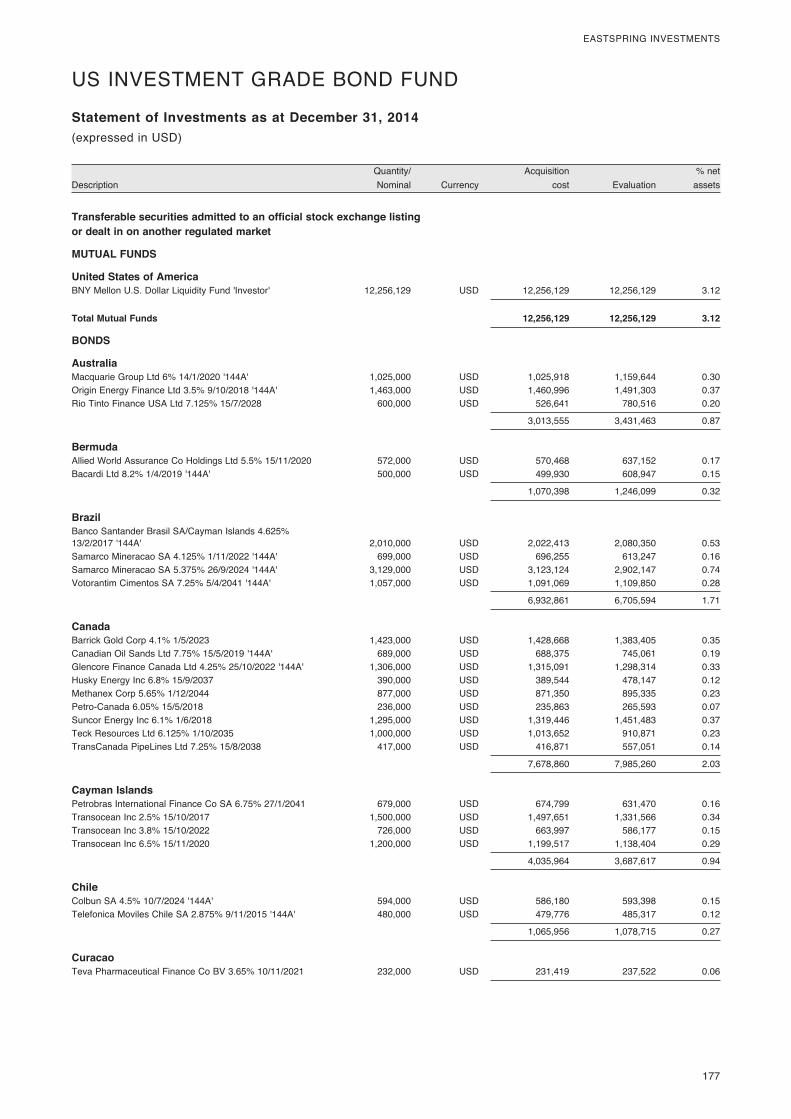
� 177
EASTSPRING�INVESTMENTS
� Quantity/�� � Acquisition�� � %�net�Description� Nominal�� Currency�� cost�� Evaluation�� assets�
Statement of Investments as at December 31, 2014(expressed�in�USD)
US�INVESTMENT�GRADE�BOND�FUND�
Transferable securities admitted to an official stock exchange listing or dealt in on another regulated market
MUTUAL FUNDS
United States of America BNY�Mellon�U.S.�Dollar�Liquidity�Fund�'Investor'�� 12,256,129� USD� 12,256,129� 12,256,129� 3.12
Total Mutual Funds 12,256,129 12,256,129 3.12
BONDS
Australia Macquarie�Group�Ltd�6%�14/1/2020�'144A'� 1,025,000� USD� 1,025,918� 1,159,644� 0.30Origin�Energy�Finance�Ltd�3.5%�9/10/2018�'144A'� 1,463,000� USD� 1,460,996� 1,491,303� 0.37Rio�Tinto�Finance�USA�Ltd�7.125%�15/7/2028�� 600,000� USD� 526,641� 780,516� 0.20
� � � 3,013,555� 3,431,463� 0.87
Bermuda Allied�World�Assurance�Co�Holdings�Ltd�5.5%�15/11/2020�� 572,000� USD� 570,468� 637,152� 0.17Bacardi�Ltd�8.2%�1/4/2019�'144A'� 500,000� USD� 499,930� 608,947� 0.15
� � � 1,070,398� 1,246,099� 0.32
Brazil Banco�Santander�Brasil�SA/Cayman�Islands�4.625%��13/2/2017�'144A'� 2,010,000� USD� 2,022,413� 2,080,350� 0.53Samarco�Mineracao�SA�4.125%�1/11/2022�'144A'� 699,000� USD� 696,255� 613,247� 0.16Samarco�Mineracao�SA�5.375%�26/9/2024�'144A'� 3,129,000� USD� 3,123,124� 2,902,147� 0.74Votorantim�Cimentos�SA�7.25%�5/4/2041�'144A'� 1,057,000� USD� 1,091,069� 1,109,850� 0.28
� � � 6,932,861� 6,705,594� 1.71
Canada Barrick�Gold�Corp�4.1%�1/5/2023�� 1,423,000� USD� 1,428,668� 1,383,405� 0.35Canadian�Oil�Sands�Ltd�7.75%�15/5/2019�'144A'� 689,000� USD� 688,375� 745,061� 0.19Glencore�Finance�Canada�Ltd�4.25%�25/10/2022�'144A'� 1,306,000� USD� 1,315,091� 1,298,314� 0.33Husky�Energy�Inc�6.8%�15/9/2037�� 390,000� USD� 389,544� 478,147� 0.12Methanex�Corp�5.65%�1/12/2044�� 877,000� USD� 871,350� 895,335� 0.23Petro-Canada�6.05%�15/5/2018�� 236,000� USD� 235,863� 265,593� 0.07Suncor�Energy�Inc�6.1%�1/6/2018�� 1,295,000� USD� 1,319,446� 1,451,483� 0.37Teck�Resources�Ltd�6.125%�1/10/2035�� 1,000,000� USD� 1,013,652� 910,871� 0.23TransCanada�PipeLines�Ltd�7.25%�15/8/2038�� 417,000� USD� 416,871� 557,051� 0.14
� � � 7,678,860� 7,985,260� 2.03
Cayman Islands Petrobras�International�Finance�Co�SA�6.75%�27/1/2041�� 679,000� USD� 674,799� 631,470� 0.16Transocean�Inc�2.5%�15/10/2017�� 1,500,000� USD� 1,497,651� 1,331,566� 0.34Transocean�Inc�3.8%�15/10/2022�� 726,000� USD� 663,997� 586,177� 0.15Transocean�Inc�6.5%�15/11/2020�� 1,200,000� USD� 1,199,517� 1,138,404� 0.29
� � � 4,035,964� 3,687,617� 0.94
Chile Colbun�SA�4.5%�10/7/2024�'144A'� 594,000� USD� 586,180� 593,398� 0.15Telefonica�Moviles�Chile�SA�2.875%�9/11/2015�'144A'� 480,000� USD� 479,776� 485,317� 0.12
� � � 1,065,956� 1,078,715� 0.27
Curacao Teva�Pharmaceutical�Finance�Co�BV�3.65%�10/11/2021�� 232,000� USD� 231,419� 237,522� 0.06
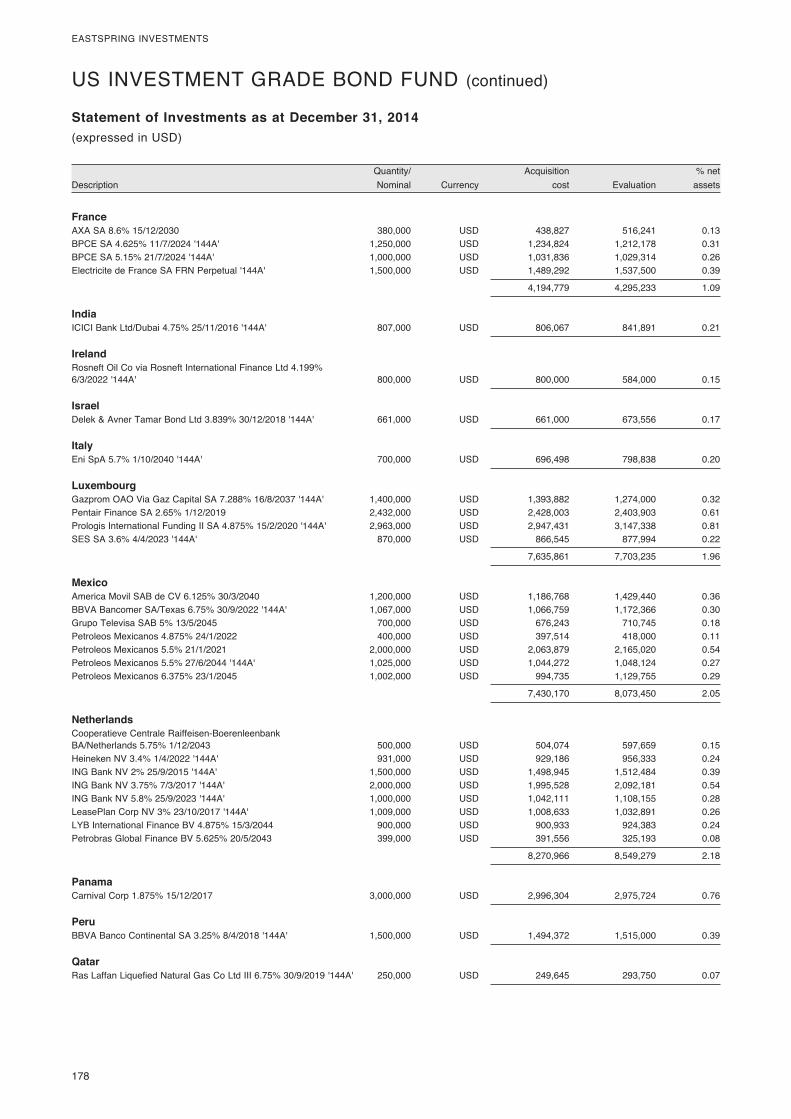
178�
EASTSPRING�INVESTMENTS
� Quantity/�� � Acquisition�� � %�net�Description� Nominal�� Currency�� cost�� Evaluation�� assets�
Statement of Investments as at December 31, 2014(expressed�in�USD)
US�INVESTMENT�GRADE�BOND�FUND�(continued)
France AXA�SA�8.6%�15/12/2030�� 380,000� USD� 438,827� 516,241� 0.13BPCE�SA�4.625%�11/7/2024�'144A'� 1,250,000� USD� 1,234,824� 1,212,178� 0.31BPCE�SA�5.15%�21/7/2024�'144A'� 1,000,000� USD� 1,031,836� 1,029,314� 0.26Electricite�de�France�SA�FRN�Perpetual�'144A'� 1,500,000� USD� 1,489,292� 1,537,500� 0.39
� � � 4,194,779� 4,295,233� 1.09
India ICICI�Bank�Ltd/Dubai�4.75%�25/11/2016�'144A'� 807,000� USD� 806,067� 841,891� 0.21
Ireland Rosneft�Oil�Co�via�Rosneft�International�Finance�Ltd�4.199%��6/3/2022�'144A'� 800,000� USD� 800,000� 584,000� 0.15
Israel Delek�&�Avner�Tamar�Bond�Ltd�3.839%�30/12/2018�'144A'� 661,000� USD� 661,000� 673,556� 0.17
Italy Eni�SpA�5.7%�1/10/2040�'144A'� 700,000� USD� 696,498� 798,838� 0.20
Luxembourg Gazprom�OAO�Via�Gaz�Capital�SA�7.288%�16/8/2037�'144A'� 1,400,000� USD� 1,393,882� 1,274,000� 0.32Pentair�Finance�SA�2.65%�1/12/2019�� 2,432,000� USD� 2,428,003� 2,403,903� 0.61Prologis�International�Funding�II�SA�4.875%�15/2/2020�'144A'� 2,963,000� USD� 2,947,431� 3,147,338� 0.81SES�SA�3.6%�4/4/2023�'144A'� 870,000� USD� 866,545� 877,994� 0.22
� � � 7,635,861� 7,703,235� 1.96
Mexico America�Movil�SAB�de�CV�6.125%�30/3/2040�� 1,200,000� USD� 1,186,768� 1,429,440� 0.36BBVA�Bancomer�SA/Texas�6.75%�30/9/2022�'144A'� 1,067,000� USD� 1,066,759� 1,172,366� 0.30Grupo�Televisa�SAB�5%�13/5/2045�� 700,000� USD� 676,243� 710,745� 0.18Petroleos�Mexicanos�4.875%�24/1/2022�� 400,000� USD� 397,514� 418,000� 0.11Petroleos�Mexicanos�5.5%�21/1/2021�� 2,000,000� USD� 2,063,879� 2,165,020� 0.54Petroleos�Mexicanos�5.5%�27/6/2044�'144A'� 1,025,000� USD� 1,044,272� 1,048,124� 0.27Petroleos�Mexicanos�6.375%�23/1/2045�� 1,002,000� USD� 994,735� 1,129,755� 0.29
� � � 7,430,170� 8,073,450� 2.05
Netherlands Cooperatieve�Centrale�Raiffeisen-Boerenleenbank��BA/Netherlands�5.75%�1/12/2043�� 500,000� USD� 504,074� 597,659� 0.15Heineken�NV�3.4%�1/4/2022�'144A'� 931,000� USD� 929,186� 956,333� 0.24ING�Bank�NV�2%�25/9/2015�'144A'� 1,500,000� USD� 1,498,945� 1,512,484� 0.39ING�Bank�NV�3.75%�7/3/2017�'144A'� 2,000,000� USD� 1,995,528� 2,092,181� 0.54ING�Bank�NV�5.8%�25/9/2023�'144A'� 1,000,000� USD� 1,042,111� 1,108,155� 0.28LeasePlan�Corp�NV�3%�23/10/2017�'144A'� 1,009,000� USD� 1,008,633� 1,032,891� 0.26LYB�International�Finance�BV�4.875%�15/3/2044�� 900,000� USD� 900,933� 924,383� 0.24Petrobras�Global�Finance�BV�5.625%�20/5/2043�� 399,000� USD� 391,556� 325,193� 0.08
� � � 8,270,966� 8,549,279� 2.18
Panama Carnival�Corp�1.875%�15/12/2017�� 3,000,000� USD� 2,996,304� 2,975,724� 0.76
Peru BBVA�Banco�Continental�SA�3.25%�8/4/2018�'144A'� 1,500,000� USD� 1,494,372� 1,515,000� 0.39
Qatar Ras�Laffan�Liquefied�Natural�Gas�Co�Ltd�III�6.75%�30/9/2019�'144A'� 250,000� USD� 249,645� 293,750� 0.07
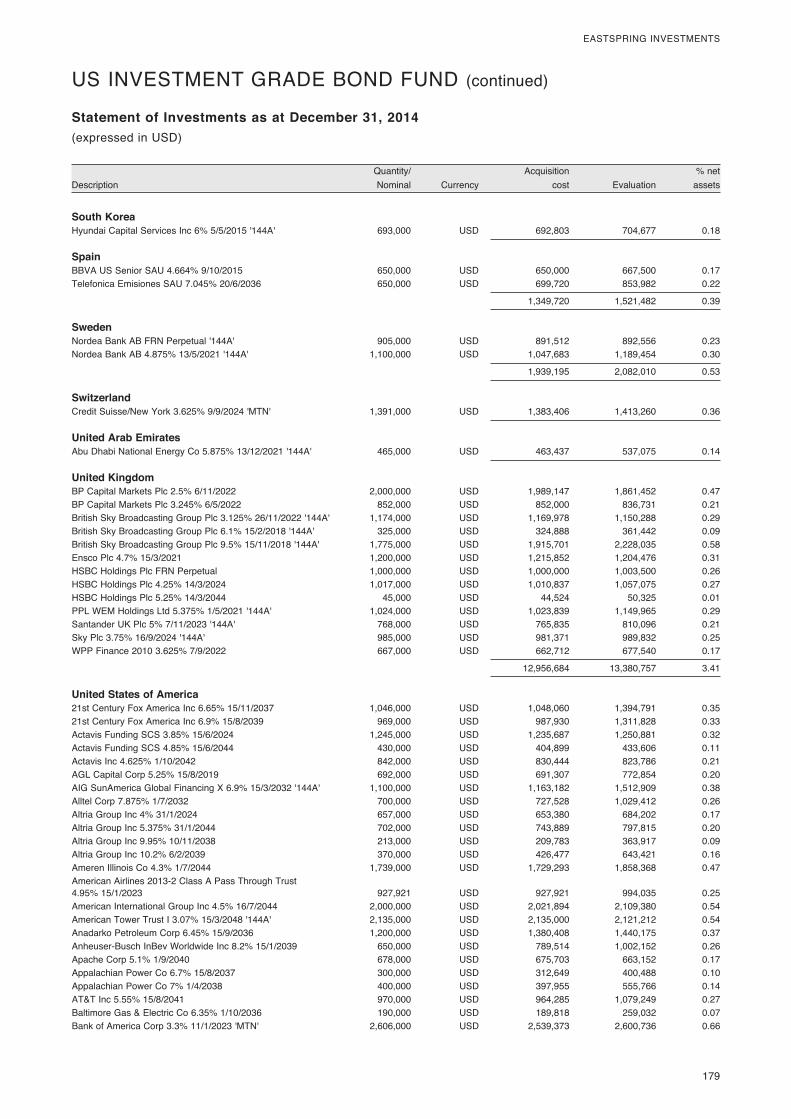
� 179
EASTSPRING�INVESTMENTS
� Quantity/�� � Acquisition�� � %�net�Description� Nominal�� Currency�� cost�� Evaluation�� assets�
Statement of Investments as at December 31, 2014(expressed�in�USD)
US�INVESTMENT�GRADE�BOND�FUND�(continued)
South Korea Hyundai�Capital�Services�Inc�6%�5/5/2015�'144A'� 693,000� USD� 692,803� 704,677� 0.18
Spain BBVA�US�Senior�SAU�4.664%�9/10/2015�� 650,000� USD� 650,000� 667,500� 0.17Telefonica�Emisiones�SAU�7.045%�20/6/2036�� 650,000� USD� 699,720� 853,982� 0.22
� � � 1,349,720� 1,521,482� 0.39
Sweden Nordea�Bank�AB�FRN�Perpetual�'144A'� 905,000� USD� 891,512� 892,556� 0.23Nordea�Bank�AB�4.875%�13/5/2021�'144A'� 1,100,000� USD� 1,047,683� 1,189,454� 0.30
� � � 1,939,195� 2,082,010� 0.53
Switzerland Credit�Suisse/New�York�3.625%�9/9/2024�'MTN'� 1,391,000� USD� 1,383,406� 1,413,260� 0.36
United Arab Emirates Abu�Dhabi�National�Energy�Co�5.875%�13/12/2021�'144A'� 465,000� USD� 463,437� 537,075� 0.14
United Kingdom BP�Capital�Markets�Plc�2.5%�6/11/2022�� 2,000,000� USD� 1,989,147� 1,861,452� 0.47BP�Capital�Markets�Plc�3.245%�6/5/2022�� 852,000� USD� 852,000� 836,731� 0.21British�Sky�Broadcasting�Group�Plc�3.125%�26/11/2022�'144A'� 1,174,000� USD� 1,169,978� 1,150,288� 0.29British�Sky�Broadcasting�Group�Plc�6.1%�15/2/2018�'144A'� 325,000� USD� 324,888� 361,442� 0.09British�Sky�Broadcasting�Group�Plc�9.5%�15/11/2018�'144A'� 1,775,000� USD� 1,915,701� 2,228,035� 0.58Ensco�Plc�4.7%�15/3/2021�� 1,200,000� USD� 1,215,852� 1,204,476� 0.31HSBC�Holdings�Plc�FRN�Perpetual�� 1,000,000� USD� 1,000,000� 1,003,500� 0.26HSBC�Holdings�Plc�4.25%�14/3/2024�� 1,017,000� USD� 1,010,837� 1,057,075� 0.27HSBC�Holdings�Plc�5.25%�14/3/2044�� 45,000� USD� 44,524� 50,325� 0.01PPL�WEM�Holdings�Ltd�5.375%�1/5/2021�'144A'� 1,024,000� USD� 1,023,839� 1,149,965� 0.29Santander�UK�Plc�5%�7/11/2023�'144A'� 768,000� USD� 765,835� 810,096� 0.21Sky�Plc�3.75%�16/9/2024�'144A'� 985,000� USD� 981,371� 989,832� 0.25WPP�Finance�2010�3.625%�7/9/2022�� 667,000� USD� 662,712� 677,540� 0.17
� � � 12,956,684� 13,380,757� 3.41
United States of America 21st�Century�Fox�America�Inc�6.65%�15/11/2037�� 1,046,000� USD� 1,048,060� 1,394,791� 0.3521st�Century�Fox�America�Inc�6.9%�15/8/2039�� 969,000� USD� 987,930� 1,311,828� 0.33Actavis�Funding�SCS�3.85%�15/6/2024�� 1,245,000� USD� 1,235,687� 1,250,881� 0.32Actavis�Funding�SCS�4.85%�15/6/2044�� 430,000� USD� 404,899� 433,606� 0.11Actavis�Inc�4.625%�1/10/2042�� 842,000� USD� 830,444� 823,786� 0.21AGL�Capital�Corp�5.25%�15/8/2019�� 692,000� USD� 691,307� 772,854� 0.20AIG�SunAmerica�Global�Financing�X�6.9%�15/3/2032�'144A'� 1,100,000� USD� 1,163,182� 1,512,909� 0.38Alltel�Corp�7.875%�1/7/2032�� 700,000� USD� 727,528� 1,029,412� 0.26Altria�Group�Inc�4%�31/1/2024�� 657,000� USD� 653,380� 684,202� 0.17Altria�Group�Inc�5.375%�31/1/2044�� 702,000� USD� 743,889� 797,815� 0.20Altria�Group�Inc�9.95%�10/11/2038�� 213,000� USD� 209,783� 363,917� 0.09Altria�Group�Inc�10.2%�6/2/2039�� 370,000� USD� 426,477� 643,421� 0.16Ameren�Illinois�Co�4.3%�1/7/2044�� 1,739,000� USD� 1,729,293� 1,858,368� 0.47American�Airlines�2013-2�Class�A�Pass�Through�Trust��4.95%�15/1/2023�� 927,921� USD� 927,921� 994,035� 0.25American�International�Group�Inc�4.5%�16/7/2044�� 2,000,000� USD� 2,021,894� 2,109,380� 0.54American�Tower�Trust�I�3.07%�15/3/2048�'144A'� 2,135,000� USD� 2,135,000� 2,121,212� 0.54Anadarko�Petroleum�Corp�6.45%�15/9/2036�� 1,200,000� USD� 1,380,408� 1,440,175� 0.37Anheuser-Busch�InBev�Worldwide�Inc�8.2%�15/1/2039�� 650,000� USD� 789,514� 1,002,152� 0.26Apache�Corp�5.1%�1/9/2040�� 678,000� USD� 675,703� 663,152� 0.17Appalachian�Power�Co�6.7%�15/8/2037�� 300,000� USD� 312,649� 400,488� 0.10Appalachian�Power�Co�7%�1/4/2038�� 400,000� USD� 397,955� 555,766� 0.14AT&T�Inc�5.55%�15/8/2041�� 970,000� USD� 964,285� 1,079,249� 0.27Baltimore�Gas�&�Electric�Co�6.35%�1/10/2036�� 190,000� USD� 189,818� 259,032� 0.07Bank�of�America�Corp�3.3%�11/1/2023�'MTN'� 2,606,000� USD� 2,539,373� 2,600,736� 0.66
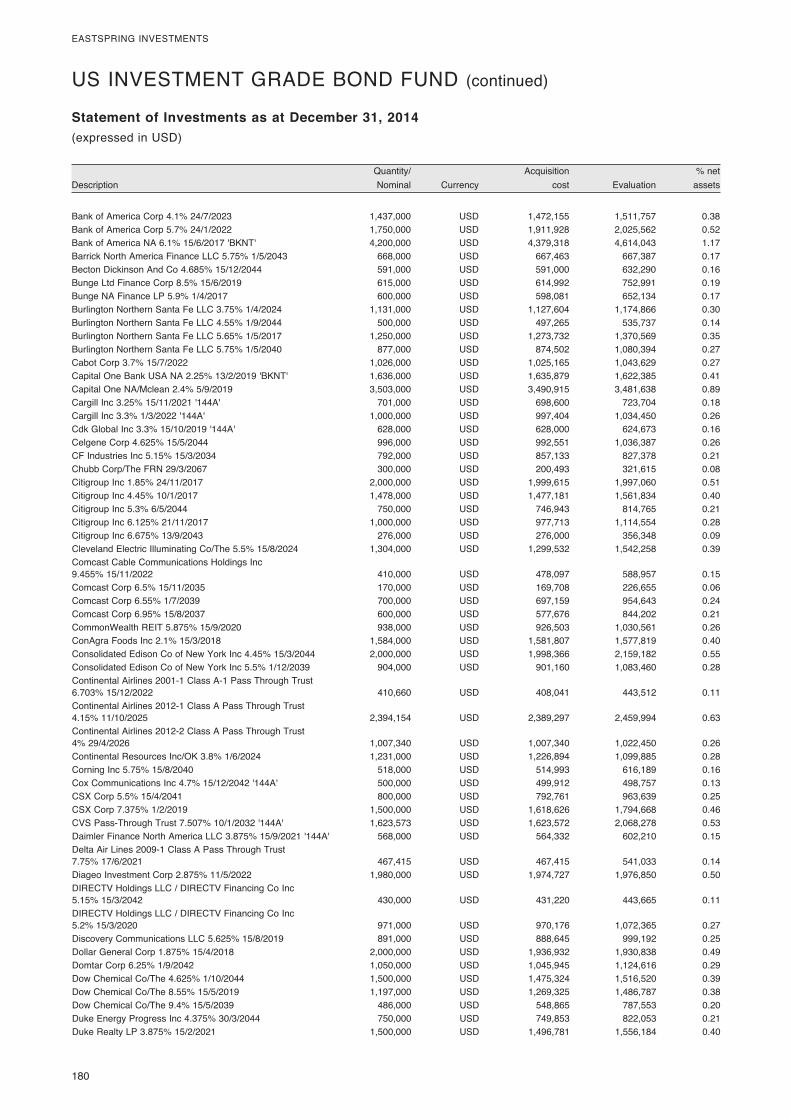
180�
EASTSPRING�INVESTMENTS
� Quantity/�� � Acquisition�� � %�net�Description� Nominal�� Currency�� cost�� Evaluation�� assets�
Statement of Investments as at December 31, 2014(expressed�in�USD)
US�INVESTMENT�GRADE�BOND�FUND�(continued)
Bank�of�America�Corp�4.1%�24/7/2023�� 1,437,000� USD� 1,472,155� 1,511,757� 0.38Bank�of�America�Corp�5.7%�24/1/2022�� 1,750,000� USD� 1,911,928� 2,025,562� 0.52Bank�of�America�NA�6.1%�15/6/2017�'BKNT'� 4,200,000� USD� 4,379,318� 4,614,043� 1.17Barrick�North�America�Finance�LLC�5.75%�1/5/2043�� 668,000� USD� 667,463� 667,387� 0.17Becton�Dickinson�And�Co�4.685%�15/12/2044�� 591,000� USD� 591,000� 632,290� 0.16Bunge�Ltd�Finance�Corp�8.5%�15/6/2019�� 615,000� USD� 614,992� 752,991� 0.19Bunge�NA�Finance�LP�5.9%�1/4/2017�� 600,000� USD� 598,081� 652,134� 0.17Burlington�Northern�Santa�Fe�LLC�3.75%�1/4/2024�� 1,131,000� USD� 1,127,604� 1,174,866� 0.30Burlington�Northern�Santa�Fe�LLC�4.55%�1/9/2044�� 500,000� USD� 497,265� 535,737� 0.14Burlington�Northern�Santa�Fe�LLC�5.65%�1/5/2017�� 1,250,000� USD� 1,273,732� 1,370,569� 0.35Burlington�Northern�Santa�Fe�LLC�5.75%�1/5/2040�� 877,000� USD� 874,502� 1,080,394� 0.27Cabot�Corp�3.7%�15/7/2022�� 1,026,000� USD� 1,025,165� 1,043,629� 0.27Capital�One�Bank�USA�NA�2.25%�13/2/2019�'BKNT'� 1,636,000� USD� 1,635,879� 1,622,385� 0.41Capital�One�NA/Mclean�2.4%�5/9/2019�� 3,503,000� USD� 3,490,915� 3,481,638� 0.89Cargill�Inc�3.25%�15/11/2021�'144A'� 701,000� USD� 698,600� 723,704� 0.18Cargill�Inc�3.3%�1/3/2022�'144A'� 1,000,000� USD� 997,404� 1,034,450� 0.26Cdk�Global�Inc�3.3%�15/10/2019�'144A'� 628,000� USD� 628,000� 624,673� 0.16Celgene�Corp�4.625%�15/5/2044�� 996,000� USD� 992,551� 1,036,387� 0.26CF�Industries�Inc�5.15%�15/3/2034�� 792,000� USD� 857,133� 827,378� 0.21Chubb�Corp/The�FRN�29/3/2067�� 300,000� USD� 200,493� 321,615� 0.08Citigroup�Inc�1.85%�24/11/2017�� 2,000,000� USD� 1,999,615� 1,997,060� 0.51Citigroup�Inc�4.45%�10/1/2017�� 1,478,000� USD� 1,477,181� 1,561,834� 0.40Citigroup�Inc�5.3%�6/5/2044�� 750,000� USD� 746,943� 814,765� 0.21Citigroup�Inc�6.125%�21/11/2017�� 1,000,000� USD� 977,713� 1,114,554� 0.28Citigroup�Inc�6.675%�13/9/2043�� 276,000� USD� 276,000� 356,348� 0.09Cleveland�Electric�Illuminating�Co/The�5.5%�15/8/2024�� 1,304,000� USD� 1,299,532� 1,542,258� 0.39Comcast�Cable�Communications�Holdings�Inc��9.455%�15/11/2022�� 410,000� USD� 478,097� 588,957� 0.15Comcast�Corp�6.5%�15/11/2035�� 170,000� USD� 169,708� 226,655� 0.06Comcast�Corp�6.55%�1/7/2039�� 700,000� USD� 697,159� 954,643� 0.24Comcast�Corp�6.95%�15/8/2037�� 600,000� USD� 577,676� 844,202� 0.21CommonWealth�REIT�5.875%�15/9/2020�� 938,000� USD� 926,503� 1,030,561� 0.26ConAgra�Foods�Inc�2.1%�15/3/2018�� 1,584,000� USD� 1,581,807� 1,577,819� 0.40Consolidated�Edison�Co�of�New�York�Inc�4.45%�15/3/2044�� 2,000,000� USD� 1,998,366� 2,159,182� 0.55Consolidated�Edison�Co�of�New�York�Inc�5.5%�1/12/2039�� 904,000� USD� 901,160� 1,083,460� 0.28Continental�Airlines�2001-1�Class�A-1�Pass�Through�Trust��6.703%�15/12/2022�� 410,660� USD� 408,041� 443,512� 0.11Continental�Airlines�2012-1�Class�A�Pass�Through�Trust��4.15%�11/10/2025�� 2,394,154� USD� 2,389,297� 2,459,994� 0.63Continental�Airlines�2012-2�Class�A�Pass�Through�Trust��4%�29/4/2026�� 1,007,340� USD� 1,007,340� 1,022,450� 0.26Continental�Resources�Inc/OK�3.8%�1/6/2024�� 1,231,000� USD� 1,226,894� 1,099,885� 0.28Corning�Inc�5.75%�15/8/2040�� 518,000� USD� 514,993� 616,189� 0.16Cox�Communications�Inc�4.7%�15/12/2042�'144A'� 500,000� USD� 499,912� 498,757� 0.13CSX�Corp�5.5%�15/4/2041�� 800,000� USD� 792,761� 963,639� 0.25CSX�Corp�7.375%�1/2/2019�� 1,500,000� USD� 1,618,626� 1,794,668� 0.46CVS�Pass-Through�Trust�7.507%�10/1/2032�'144A'� 1,623,573� USD� 1,623,572� 2,068,278� 0.53Daimler�Finance�North�America�LLC�3.875%�15/9/2021�'144A'� 568,000� USD� 564,332� 602,210� 0.15Delta�Air�Lines�2009-1�Class�A�Pass�Through�Trust��7.75%�17/6/2021�� 467,415� USD� 467,415� 541,033� 0.14Diageo�Investment�Corp�2.875%�11/5/2022�� 1,980,000� USD� 1,974,727� 1,976,850� 0.50DIRECTV�Holdings�LLC�/�DIRECTV�Financing�Co�Inc��5.15%�15/3/2042�� 430,000� USD� 431,220� 443,665� 0.11DIRECTV�Holdings�LLC�/�DIRECTV�Financing�Co�Inc��5.2%�15/3/2020�� 971,000� USD� 970,176� 1,072,365� 0.27Discovery�Communications�LLC�5.625%�15/8/2019�� 891,000� USD� 888,645� 999,192� 0.25Dollar�General�Corp�1.875%�15/4/2018�� 2,000,000� USD� 1,936,932� 1,930,838� 0.49Domtar�Corp�6.25%�1/9/2042�� 1,050,000� USD� 1,045,945� 1,124,616� 0.29Dow�Chemical�Co/The�4.625%�1/10/2044�� 1,500,000� USD� 1,475,324� 1,516,520� 0.39Dow�Chemical�Co/The�8.55%�15/5/2019�� 1,197,000� USD� 1,269,325� 1,486,787� 0.38Dow�Chemical�Co/The�9.4%�15/5/2039�� 486,000� USD� 548,865� 787,553� 0.20Duke�Energy�Progress�Inc�4.375%�30/3/2044�� 750,000� USD� 749,853� 822,053� 0.21Duke�Realty�LP�3.875%�15/2/2021�� 1,500,000� USD� 1,496,781� 1,556,184� 0.40
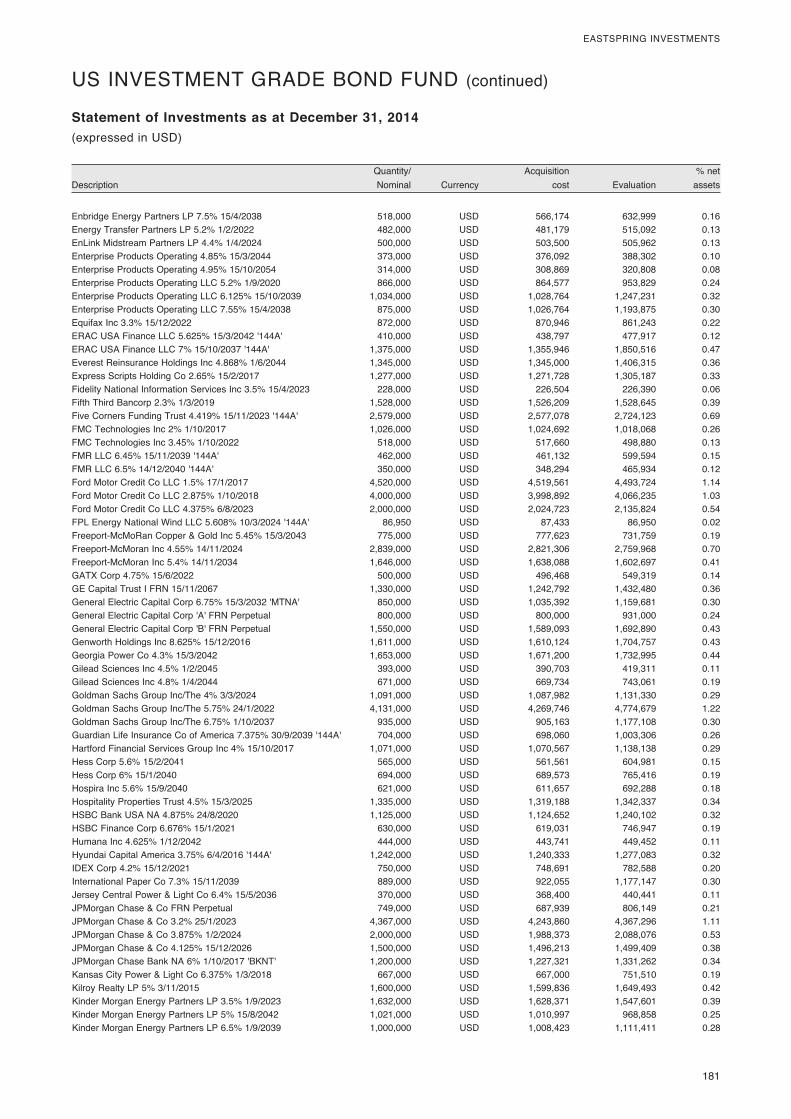
� 181
EASTSPRING�INVESTMENTS
� Quantity/�� � Acquisition�� � %�net�Description� Nominal�� Currency�� cost�� Evaluation�� assets�
Statement of Investments as at December 31, 2014(expressed�in�USD)
US�INVESTMENT�GRADE�BOND�FUND�(continued)
Enbridge�Energy�Partners�LP�7.5%�15/4/2038�� 518,000� USD� 566,174� 632,999� 0.16Energy�Transfer�Partners�LP�5.2%�1/2/2022�� 482,000� USD� 481,179� 515,092� 0.13EnLink�Midstream�Partners�LP�4.4%�1/4/2024�� 500,000� USD� 503,500� 505,962� 0.13Enterprise�Products�Operating�4.85%�15/3/2044�� 373,000� USD� 376,092� 388,302� 0.10Enterprise�Products�Operating�4.95%�15/10/2054�� 314,000� USD� 308,869� 320,808� 0.08Enterprise�Products�Operating�LLC�5.2%�1/9/2020�� 866,000� USD� 864,577� 953,829� 0.24Enterprise�Products�Operating�LLC�6.125%�15/10/2039�� 1,034,000� USD� 1,028,764� 1,247,231� 0.32Enterprise�Products�Operating�LLC�7.55%�15/4/2038�� 875,000� USD� 1,026,764� 1,193,875� 0.30Equifax�Inc�3.3%�15/12/2022�� 872,000� USD� 870,946� 861,243� 0.22ERAC�USA�Finance�LLC�5.625%�15/3/2042�'144A'� 410,000� USD� 438,797� 477,917� 0.12ERAC�USA�Finance�LLC�7%�15/10/2037�'144A'� 1,375,000� USD� 1,355,946� 1,850,516� 0.47Everest�Reinsurance�Holdings�Inc�4.868%�1/6/2044�� 1,345,000� USD� 1,345,000� 1,406,315� 0.36Express�Scripts�Holding�Co�2.65%�15/2/2017�� 1,277,000� USD� 1,271,728� 1,305,187� 0.33Fidelity�National�Information�Services�Inc�3.5%�15/4/2023�� 228,000� USD� 226,504� 226,390� 0.06Fifth�Third�Bancorp�2.3%�1/3/2019�� 1,528,000� USD� 1,526,209� 1,528,645� 0.39Five�Corners�Funding�Trust�4.419%�15/11/2023�'144A'� 2,579,000� USD� 2,577,078� 2,724,123� 0.69FMC�Technologies�Inc�2%�1/10/2017�� 1,026,000� USD� 1,024,692� 1,018,068� 0.26FMC�Technologies�Inc�3.45%�1/10/2022�� 518,000� USD� 517,660� 498,880� 0.13FMR�LLC�6.45%�15/11/2039�'144A'� 462,000� USD� 461,132� 599,594� 0.15FMR�LLC�6.5%�14/12/2040�'144A'� 350,000� USD� 348,294� 465,934� 0.12Ford�Motor�Credit�Co�LLC�1.5%�17/1/2017�� 4,520,000� USD� 4,519,561� 4,493,724� 1.14Ford�Motor�Credit�Co�LLC�2.875%�1/10/2018�� 4,000,000� USD� 3,998,892� 4,066,235� 1.03Ford�Motor�Credit�Co�LLC�4.375%�6/8/2023�� 2,000,000� USD� 2,024,723� 2,135,824� 0.54FPL�Energy�National�Wind�LLC�5.608%�10/3/2024�'144A'� 86,950� USD� 87,433� 86,950� 0.02Freeport-McMoRan�Copper�&�Gold�Inc�5.45%�15/3/2043�� 775,000� USD� 777,623� 731,759� 0.19Freeport-McMoran�Inc�4.55%�14/11/2024�� 2,839,000� USD� 2,821,306� 2,759,968� 0.70Freeport-McMoran�Inc�5.4%�14/11/2034�� 1,646,000� USD� 1,638,088� 1,602,697� 0.41GATX�Corp�4.75%�15/6/2022�� 500,000� USD� 496,468� 549,319� 0.14GE�Capital�Trust�I�FRN�15/11/2067�� 1,330,000� USD� 1,242,792� 1,432,480� 0.36General�Electric�Capital�Corp�6.75%�15/3/2032�'MTNA'� 850,000� USD� 1,035,392� 1,159,681� 0.30General�Electric�Capital�Corp�'A'�FRN�Perpetual�� 800,000� USD� 800,000� 931,000� 0.24General�Electric�Capital�Corp�'B'�FRN�Perpetual�� 1,550,000� USD� 1,589,093� 1,692,890� 0.43Genworth�Holdings�Inc�8.625%�15/12/2016�� 1,611,000� USD� 1,610,124� 1,704,757� 0.43Georgia�Power�Co�4.3%�15/3/2042�� 1,653,000� USD� 1,671,200� 1,732,995� 0.44Gilead�Sciences�Inc�4.5%�1/2/2045�� 393,000� USD� 390,703� 419,311� 0.11Gilead�Sciences�Inc�4.8%�1/4/2044�� 671,000� USD� 669,734� 743,061� 0.19Goldman�Sachs�Group�Inc/The�4%�3/3/2024�� 1,091,000� USD� 1,087,982� 1,131,330� 0.29Goldman�Sachs�Group�Inc/The�5.75%�24/1/2022�� 4,131,000� USD� 4,269,746� 4,774,679� 1.22Goldman�Sachs�Group�Inc/The�6.75%�1/10/2037�� 935,000� USD� 905,163� 1,177,108� 0.30Guardian�Life�Insurance�Co�of�America�7.375%�30/9/2039�'144A'� 704,000� USD� 698,060� 1,003,306� 0.26Hartford�Financial�Services�Group�Inc�4%�15/10/2017�� 1,071,000� USD� 1,070,567� 1,138,138� 0.29Hess�Corp�5.6%�15/2/2041�� 565,000� USD� 561,561� 604,981� 0.15Hess�Corp�6%�15/1/2040�� 694,000� USD� 689,573� 765,416� 0.19Hospira�Inc�5.6%�15/9/2040�� 621,000� USD� 611,657� 692,288� 0.18Hospitality�Properties�Trust�4.5%�15/3/2025�� 1,335,000� USD� 1,319,188� 1,342,337� 0.34HSBC�Bank�USA�NA�4.875%�24/8/2020�� 1,125,000� USD� 1,124,652� 1,240,102� 0.32HSBC�Finance�Corp�6.676%�15/1/2021�� 630,000� USD� 619,031� 746,947� 0.19Humana�Inc�4.625%�1/12/2042�� 444,000� USD� 443,741� 449,452� 0.11Hyundai�Capital�America�3.75%�6/4/2016�'144A'� 1,242,000� USD� 1,240,333� 1,277,083� 0.32IDEX�Corp�4.2%�15/12/2021�� 750,000� USD� 748,691� 782,588� 0.20International�Paper�Co�7.3%�15/11/2039�� 889,000� USD� 922,055� 1,177,147� 0.30Jersey�Central�Power�&�Light�Co�6.4%�15/5/2036�� 370,000� USD� 368,400� 440,441� 0.11JPMorgan�Chase�&�Co�FRN�Perpetual�� 749,000� USD� 687,939� 806,149� 0.21JPMorgan�Chase�&�Co�3.2%�25/1/2023�� 4,367,000� USD� 4,243,860� 4,367,296� 1.11JPMorgan�Chase�&�Co�3.875%�1/2/2024�� 2,000,000� USD� 1,988,373� 2,088,076� 0.53JPMorgan�Chase�&�Co�4.125%�15/12/2026�� 1,500,000� USD� 1,496,213� 1,499,409� 0.38JPMorgan�Chase�Bank�NA�6%�1/10/2017�'BKNT'� 1,200,000� USD� 1,227,321� 1,331,262� 0.34Kansas�City�Power�&�Light�Co�6.375%�1/3/2018�� 667,000� USD� 667,000� 751,510� 0.19Kilroy�Realty�LP�5%�3/11/2015�� 1,600,000� USD� 1,599,836� 1,649,493� 0.42Kinder�Morgan�Energy�Partners�LP�3.5%�1/9/2023�� 1,632,000� USD� 1,628,371� 1,547,601� 0.39Kinder�Morgan�Energy�Partners�LP�5%�15/8/2042�� 1,021,000� USD� 1,010,997� 968,858� 0.25Kinder�Morgan�Energy�Partners�LP�6.5%�1/9/2039�� 1,000,000� USD� 1,008,423� 1,111,411� 0.28
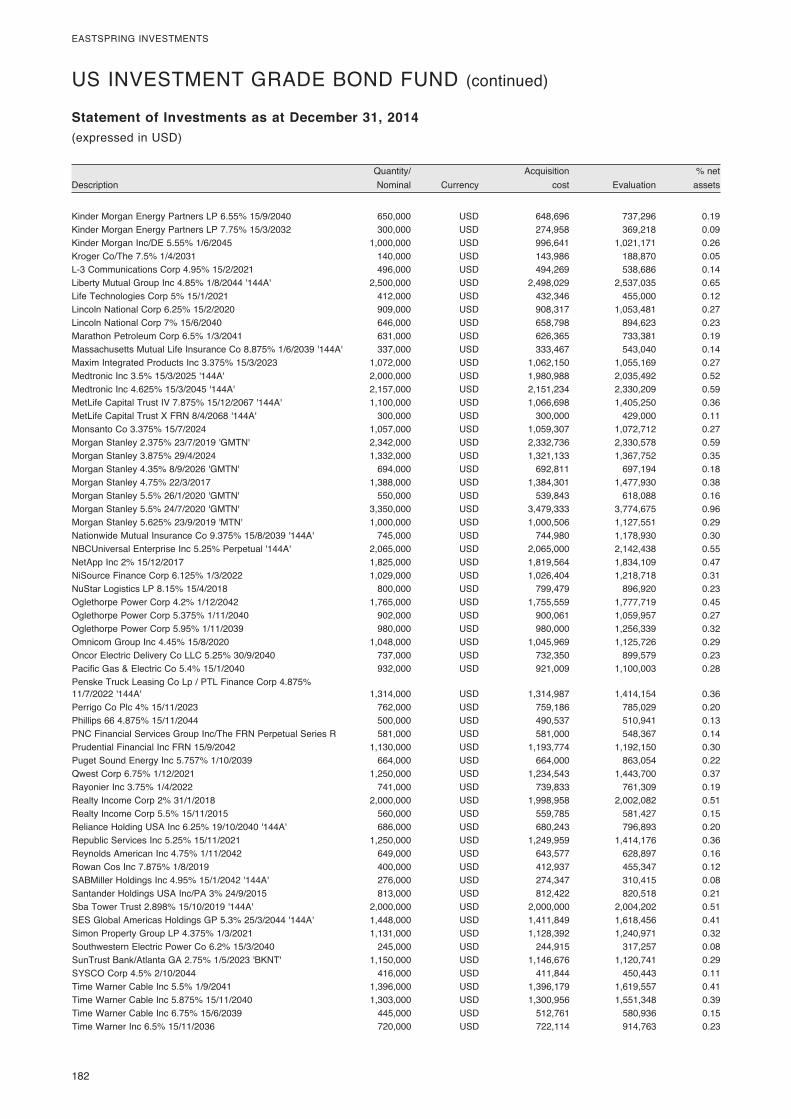
182�
EASTSPRING�INVESTMENTS
� Quantity/�� � Acquisition�� � %�net�Description� Nominal�� Currency�� cost�� Evaluation�� assets�
Statement of Investments as at December 31, 2014(expressed�in�USD)
US�INVESTMENT�GRADE�BOND�FUND�(continued)
Kinder�Morgan�Energy�Partners�LP�6.55%�15/9/2040�� 650,000� USD� 648,696� 737,296� 0.19Kinder�Morgan�Energy�Partners�LP�7.75%�15/3/2032�� 300,000� USD� 274,958� 369,218� 0.09Kinder�Morgan�Inc/DE�5.55%�1/6/2045�� 1,000,000� USD� 996,641� 1,021,171� 0.26Kroger�Co/The�7.5%�1/4/2031�� 140,000� USD� 143,986� 188,870� 0.05L-3�Communications�Corp�4.95%�15/2/2021�� 496,000� USD� 494,269� 538,686� 0.14Liberty�Mutual�Group�Inc�4.85%�1/8/2044�'144A'� 2,500,000� USD� 2,498,029� 2,537,035� 0.65Life�Technologies�Corp�5%�15/1/2021�� 412,000� USD� 432,346� 455,000� 0.12Lincoln�National�Corp�6.25%�15/2/2020�� 909,000� USD� 908,317� 1,053,481� 0.27Lincoln�National�Corp�7%�15/6/2040�� 646,000� USD� 658,798� 894,623� 0.23Marathon�Petroleum�Corp�6.5%�1/3/2041�� 631,000� USD� 626,365� 733,381� 0.19Massachusetts�Mutual�Life�Insurance�Co�8.875%�1/6/2039�'144A'� 337,000� USD� 333,467� 543,040� 0.14Maxim�Integrated�Products�Inc�3.375%�15/3/2023�� 1,072,000� USD� 1,062,150� 1,055,169� 0.27Medtronic�Inc�3.5%�15/3/2025�'144A'� 2,000,000� USD� 1,980,988� 2,035,492� 0.52Medtronic�Inc�4.625%�15/3/2045�'144A'� 2,157,000� USD� 2,151,234� 2,330,209� 0.59MetLife�Capital�Trust�IV�7.875%�15/12/2067�'144A'� 1,100,000� USD� 1,066,698� 1,405,250� 0.36MetLife�Capital�Trust�X�FRN�8/4/2068�'144A'� 300,000� USD� 300,000� 429,000� 0.11Monsanto�Co�3.375%�15/7/2024�� 1,057,000� USD� 1,059,307� 1,072,712� 0.27Morgan�Stanley�2.375%�23/7/2019�'GMTN'� 2,342,000� USD� 2,332,736� 2,330,578� 0.59Morgan�Stanley�3.875%�29/4/2024�� 1,332,000� USD� 1,321,133� 1,367,752� 0.35Morgan�Stanley�4.35%�8/9/2026�'GMTN'� 694,000� USD� 692,811� 697,194� 0.18Morgan�Stanley�4.75%�22/3/2017�� 1,388,000� USD� 1,384,301� 1,477,930� 0.38Morgan�Stanley�5.5%�26/1/2020�'GMTN'� 550,000� USD� 539,843� 618,088� 0.16Morgan�Stanley�5.5%�24/7/2020�'GMTN'� 3,350,000� USD� 3,479,333� 3,774,675� 0.96Morgan�Stanley�5.625%�23/9/2019�'MTN'� 1,000,000� USD� 1,000,506� 1,127,551� 0.29Nationwide�Mutual�Insurance�Co�9.375%�15/8/2039�'144A'� 745,000� USD� 744,980� 1,178,930� 0.30NBCUniversal�Enterprise�Inc�5.25%�Perpetual�'144A'� 2,065,000� USD� 2,065,000� 2,142,438� 0.55NetApp�Inc�2%�15/12/2017�� 1,825,000� USD� 1,819,564� 1,834,109� 0.47NiSource�Finance�Corp�6.125%�1/3/2022�� 1,029,000� USD� 1,026,404� 1,218,718� 0.31NuStar�Logistics�LP�8.15%�15/4/2018�� 800,000� USD� 799,479� 896,920� 0.23Oglethorpe�Power�Corp�4.2%�1/12/2042�� 1,765,000� USD� 1,755,559� 1,777,719� 0.45Oglethorpe�Power�Corp�5.375%�1/11/2040�� 902,000� USD� 900,061� 1,059,957� 0.27Oglethorpe�Power�Corp�5.95%�1/11/2039�� 980,000� USD� 980,000� 1,256,339� 0.32Omnicom�Group�Inc�4.45%�15/8/2020�� 1,048,000� USD� 1,045,969� 1,125,726� 0.29Oncor�Electric�Delivery�Co�LLC�5.25%�30/9/2040�� 737,000� USD� 732,350� 899,579� 0.23Pacific�Gas�&�Electric�Co�5.4%�15/1/2040�� 932,000� USD� 921,009� 1,100,003� 0.28Penske�Truck�Leasing�Co�Lp�/�PTL�Finance�Corp�4.875%��11/7/2022�'144A'� 1,314,000� USD� 1,314,987� 1,414,154� 0.36Perrigo�Co�Plc�4%�15/11/2023�� 762,000� USD� 759,186� 785,029� 0.20Phillips�66�4.875%�15/11/2044�� 500,000� USD� 490,537� 510,941� 0.13PNC�Financial�Services�Group�Inc/The�FRN�Perpetual�Series�R� 581,000� USD� 581,000� 548,367� 0.14Prudential�Financial�Inc�FRN�15/9/2042�� 1,130,000� USD� 1,193,774� 1,192,150� 0.30Puget�Sound�Energy�Inc�5.757%�1/10/2039�� 664,000� USD� 664,000� 863,054� 0.22Qwest�Corp�6.75%�1/12/2021�� 1,250,000� USD� 1,234,543� 1,443,700� 0.37Rayonier�Inc�3.75%�1/4/2022�� 741,000� USD� 739,833� 761,309� 0.19Realty�Income�Corp�2%�31/1/2018�� 2,000,000� USD� 1,998,958� 2,002,082� 0.51Realty�Income�Corp�5.5%�15/11/2015�� 560,000� USD� 559,785� 581,427� 0.15Reliance�Holding�USA�Inc�6.25%�19/10/2040�'144A'� 686,000� USD� 680,243� 796,893� 0.20Republic�Services�Inc�5.25%�15/11/2021�� 1,250,000� USD� 1,249,959� 1,414,176� 0.36Reynolds�American�Inc�4.75%�1/11/2042�� 649,000� USD� 643,577� 628,897� 0.16Rowan�Cos�Inc�7.875%�1/8/2019�� 400,000� USD� 412,937� 455,347� 0.12SABMiller�Holdings�Inc�4.95%�15/1/2042�'144A'� 276,000� USD� 274,347� 310,415� 0.08Santander�Holdings�USA�Inc/PA�3%�24/9/2015�� 813,000� USD� 812,422� 820,518� 0.21Sba�Tower�Trust�2.898%�15/10/2019�'144A'� 2,000,000� USD� 2,000,000� 2,004,202� 0.51SES�Global�Americas�Holdings�GP�5.3%�25/3/2044�'144A'� 1,448,000� USD� 1,411,849� 1,618,456� 0.41Simon�Property�Group�LP�4.375%�1/3/2021�� 1,131,000� USD� 1,128,392� 1,240,971� 0.32Southwestern�Electric�Power�Co�6.2%�15/3/2040�� 245,000� USD� 244,915� 317,257� 0.08SunTrust�Bank/Atlanta�GA�2.75%�1/5/2023�'BKNT'� 1,150,000� USD� 1,146,676� 1,120,741� 0.29SYSCO�Corp�4.5%�2/10/2044�� 416,000� USD� 411,844� 450,443� 0.11Time�Warner�Cable�Inc�5.5%�1/9/2041�� 1,396,000� USD� 1,396,179� 1,619,557� 0.41Time�Warner�Cable�Inc�5.875%�15/11/2040�� 1,303,000� USD� 1,300,956� 1,551,348� 0.39Time�Warner�Cable�Inc�6.75%�15/6/2039�� 445,000� USD� 512,761� 580,936� 0.15Time�Warner�Inc�6.5%�15/11/2036�� 720,000� USD� 722,114� 914,763� 0.23
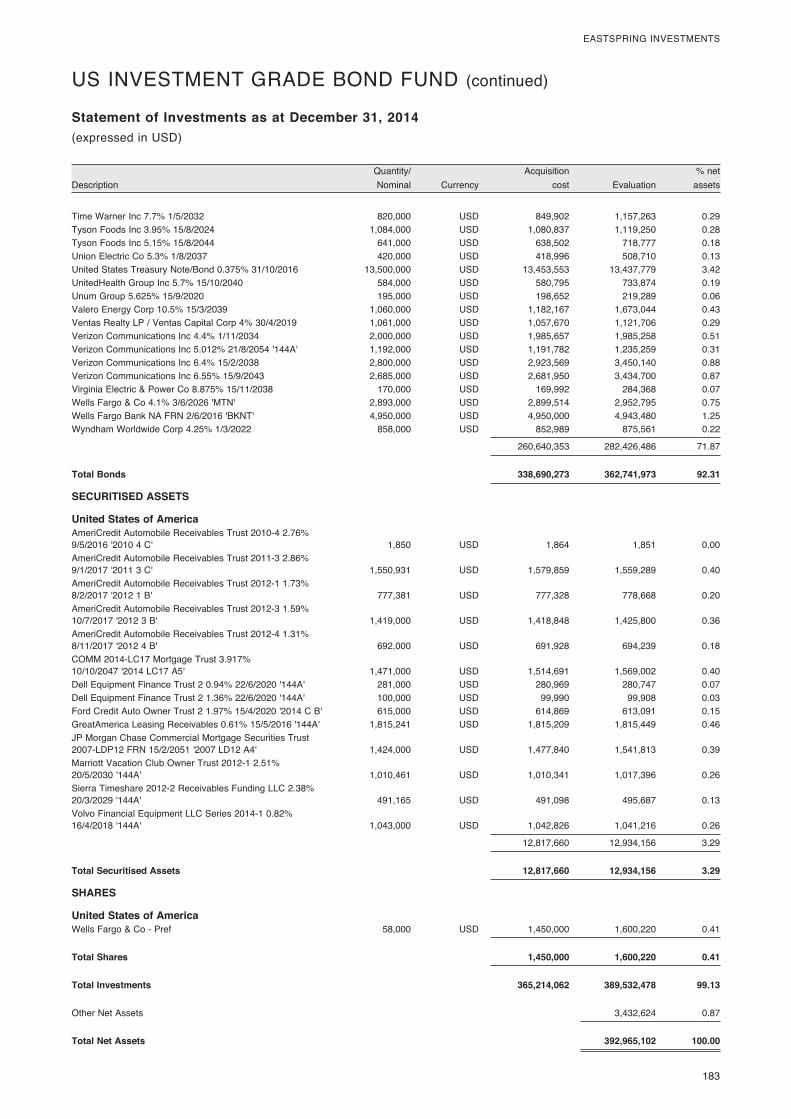
� 183
EASTSPRING�INVESTMENTS
� Quantity/�� � Acquisition�� � %�net�Description� Nominal�� Currency�� cost�� Evaluation�� assets�
Statement of Investments as at December 31, 2014(expressed�in�USD)
US�INVESTMENT�GRADE�BOND�FUND�(continued)
Time�Warner�Inc�7.7%�1/5/2032�� 820,000� USD� 849,902� 1,157,263� 0.29Tyson�Foods�Inc�3.95%�15/8/2024�� 1,084,000� USD� 1,080,837� 1,119,250� 0.28Tyson�Foods�Inc�5.15%�15/8/2044�� 641,000� USD� 638,502� 718,777� 0.18Union�Electric�Co�5.3%�1/8/2037�� 420,000� USD� 418,996� 508,710� 0.13United�States�Treasury�Note/Bond�0.375%�31/10/2016�� 13,500,000� USD� 13,453,553� 13,437,779� 3.42UnitedHealth�Group�Inc�5.7%�15/10/2040�� 584,000� USD� 580,795� 733,874� 0.19Unum�Group�5.625%�15/9/2020�� 195,000� USD� 198,652� 219,289� 0.06Valero�Energy�Corp�10.5%�15/3/2039�� 1,060,000� USD� 1,182,167� 1,673,044� 0.43Ventas�Realty�LP�/�Ventas�Capital�Corp�4%�30/4/2019�� 1,061,000� USD� 1,057,670� 1,121,706� 0.29Verizon�Communications�Inc�4.4%�1/11/2034�� 2,000,000� USD� 1,985,657� 1,985,258� 0.51Verizon�Communications�Inc�5.012%�21/8/2054�'144A'� 1,192,000� USD� 1,191,782� 1,235,259� 0.31Verizon�Communications�Inc�6.4%�15/2/2038�� 2,800,000� USD� 2,923,569� 3,450,140� 0.88Verizon�Communications�Inc�6.55%�15/9/2043�� 2,685,000� USD� 2,681,950� 3,434,700� 0.87Virginia�Electric�&�Power�Co�8.875%�15/11/2038�� 170,000� USD� 169,992� 284,368� 0.07Wells�Fargo�&�Co�4.1%�3/6/2026�'MTN'� 2,893,000� USD� 2,899,514� 2,952,795� 0.75Wells�Fargo�Bank�NA�FRN�2/6/2016�'BKNT'� 4,950,000� USD� 4,950,000� 4,943,480� 1.25Wyndham�Worldwide�Corp�4.25%�1/3/2022�� 858,000� USD� 852,989� 875,561� 0.22
� � � 260,640,353� 282,426,486� 71.87
Total Bonds 338,690,273 362,741,973 92.31
SECURITISED ASSETS
United States of America AmeriCredit�Automobile�Receivables�Trust�2010-4�2.76%��9/5/2016�'2010�4�C'� 1,850� USD� 1,864� 1,851� 0.00AmeriCredit�Automobile�Receivables�Trust�2011-3�2.86%��9/1/2017�'2011�3�C'� 1,550,931� USD� 1,579,859� 1,559,289� 0.40AmeriCredit�Automobile�Receivables�Trust�2012-1�1.73%��8/2/2017�'2012�1�B'� 777,381� USD� 777,328� 778,668� 0.20AmeriCredit�Automobile�Receivables�Trust�2012-3�1.59%��10/7/2017�'2012�3�B'� 1,419,000� USD� 1,418,848� 1,425,800� 0.36AmeriCredit�Automobile�Receivables�Trust�2012-4�1.31%��8/11/2017�'2012�4�B'� 692,000� USD� 691,928� 694,239� 0.18COMM�2014-LC17�Mortgage�Trust�3.917%��10/10/2047�'2014�LC17�A5'� 1,471,000� USD� 1,514,691� 1,569,002� 0.40Dell�Equipment�Finance�Trust�2�0.94%�22/6/2020�'144A'� 281,000� USD� 280,969� 280,747� 0.07Dell�Equipment�Finance�Trust�2�1.36%�22/6/2020�'144A'� 100,000� USD� 99,990� 99,908� 0.03Ford�Credit�Auto�Owner�Trust�2�1.97%�15/4/2020�'2014�C�B'� 615,000� USD� 614,869� 613,091� 0.15GreatAmerica�Leasing�Receivables�0.61%�15/5/2016�'144A'� 1,815,241� USD� 1,815,209� 1,815,449� 0.46JP�Morgan�Chase�Commercial�Mortgage�Securities�Trust��2007-LDP12�FRN�15/2/2051�'2007�LD12�A4'� 1,424,000� USD� 1,477,840� 1,541,813� 0.39Marriott�Vacation�Club�Owner�Trust�2012-1�2.51%��20/5/2030�'144A'� 1,010,461� USD� 1,010,341� 1,017,396� 0.26Sierra�Timeshare�2012-2�Receivables�Funding�LLC�2.38%��20/3/2029�'144A'� 491,165� USD� 491,098� 495,687� 0.13Volvo�Financial�Equipment�LLC�Series�2014-1�0.82%��16/4/2018�'144A'� 1,043,000� USD� 1,042,826� 1,041,216� 0.26
� � � 12,817,660� 12,934,156� 3.29
Total Securitised Assets 12,817,660 12,934,156 3.29
SHARES
United States of America Wells�Fargo�&�Co�-�Pref�� 58,000� USD� 1,450,000� 1,600,220� 0.41
Total Shares 1,450,000 1,600,220 0.41
Total Investments 365,214,062 389,532,478 99.13
Other�Net�Assets� � � � 3,432,624� 0.87
Total Net Assets 392,965,102 100.00
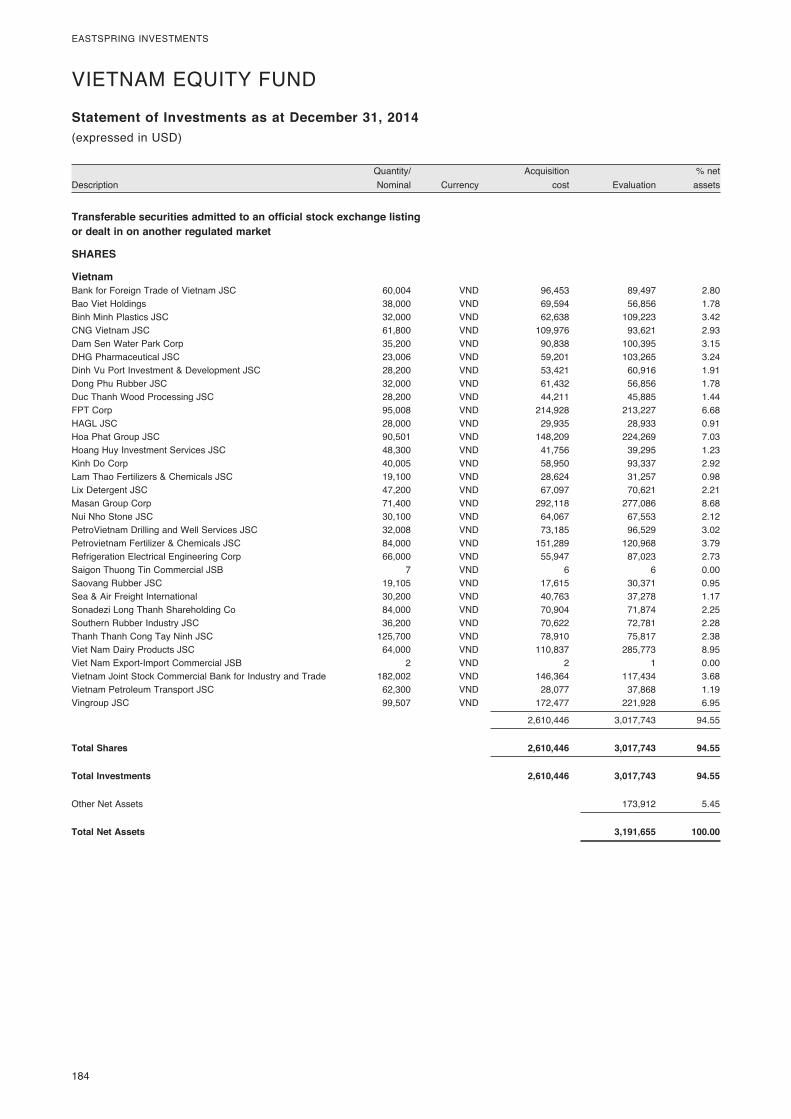
184�
EASTSPRING�INVESTMENTS
� Quantity/�� � Acquisition�� � %�net�Description� Nominal�� Currency�� cost�� Evaluation�� assets�
Statement of Investments as at December 31, 2014(expressed�in�USD)
VIETNAM�EQUITY�FUND�
Transferable securities admitted to an official stock exchange listing or dealt in on another regulated market
SHARES
Vietnam Bank�for�Foreign�Trade�of�Vietnam�JSC� 60,004� VND� 96,453� 89,497� 2.80Bao�Viet�Holdings� 38,000� VND� 69,594� 56,856� 1.78Binh�Minh�Plastics�JSC� 32,000� VND� 62,638� 109,223� 3.42CNG�Vietnam�JSC� 61,800� VND� 109,976� 93,621� 2.93Dam�Sen�Water�Park�Corp� 35,200� VND� 90,838� 100,395� 3.15DHG�Pharmaceutical�JSC� 23,006� VND� 59,201� 103,265� 3.24Dinh�Vu�Port�Investment�&�Development�JSC� 28,200� VND� 53,421� 60,916� 1.91Dong�Phu�Rubber�JSC� 32,000� VND� 61,432� 56,856� 1.78Duc�Thanh�Wood�Processing�JSC� 28,200� VND� 44,211� 45,885� 1.44FPT�Corp� 95,008� VND� 214,928� 213,227� 6.68HAGL�JSC� 28,000� VND� 29,935� 28,933� 0.91Hoa�Phat�Group�JSC� 90,501� VND� 148,209� 224,269� 7.03Hoang�Huy�Investment�Services�JSC� 48,300� VND� 41,756� 39,295� 1.23Kinh�Do�Corp� 40,005� VND� 58,950� 93,337� 2.92Lam�Thao�Fertilizers�&�Chemicals�JSC� 19,100� VND� 28,624� 31,257� 0.98Lix�Detergent�JSC� 47,200� VND� 67,097� 70,621� 2.21Masan�Group�Corp� 71,400� VND� 292,118� 277,086� 8.68Nui�Nho�Stone�JSC� 30,100� VND� 64,067� 67,553� 2.12PetroVietnam�Drilling�and�Well�Services�JSC� 32,008� VND� 73,185� 96,529� 3.02Petrovietnam�Fertilizer�&�Chemicals�JSC� 84,000� VND� 151,289� 120,968� 3.79Refrigeration�Electrical�Engineering�Corp� 66,000� VND� 55,947� 87,023� 2.73Saigon�Thuong�Tin�Commercial�JSB� 7� VND� 6� 6� 0.00Saovang�Rubber�JSC� 19,105� VND� 17,615� 30,371� 0.95Sea�&�Air�Freight�International� 30,200� VND� 40,763� 37,278� 1.17Sonadezi�Long�Thanh�Shareholding�Co� 84,000� VND� 70,904� 71,874� 2.25Southern�Rubber�Industry�JSC� 36,200� VND� 70,622� 72,781� 2.28Thanh�Thanh�Cong�Tay�Ninh�JSC� 125,700� VND� 78,910� 75,817� 2.38Viet�Nam�Dairy�Products�JSC� 64,000� VND� 110,837� 285,773� 8.95Viet�Nam�Export-Import�Commercial�JSB� 2� VND� 2� 1� 0.00Vietnam�Joint�Stock�Commercial�Bank�for�Industry�and�Trade� 182,002� VND� 146,364� 117,434� 3.68Vietnam�Petroleum�Transport�JSC� 62,300� VND� 28,077� 37,868� 1.19Vingroup�JSC�� 99,507� VND� 172,477� 221,928� 6.95
� � � 2,610,446� 3,017,743� 94.55
Total Shares 2,610,446 3,017,743 94.55
Total Investments 2,610,446 3,017,743 94.55
Other�Net�Assets� � � � 173,912� 5.45
Total Net Assets 3,191,655 100.00
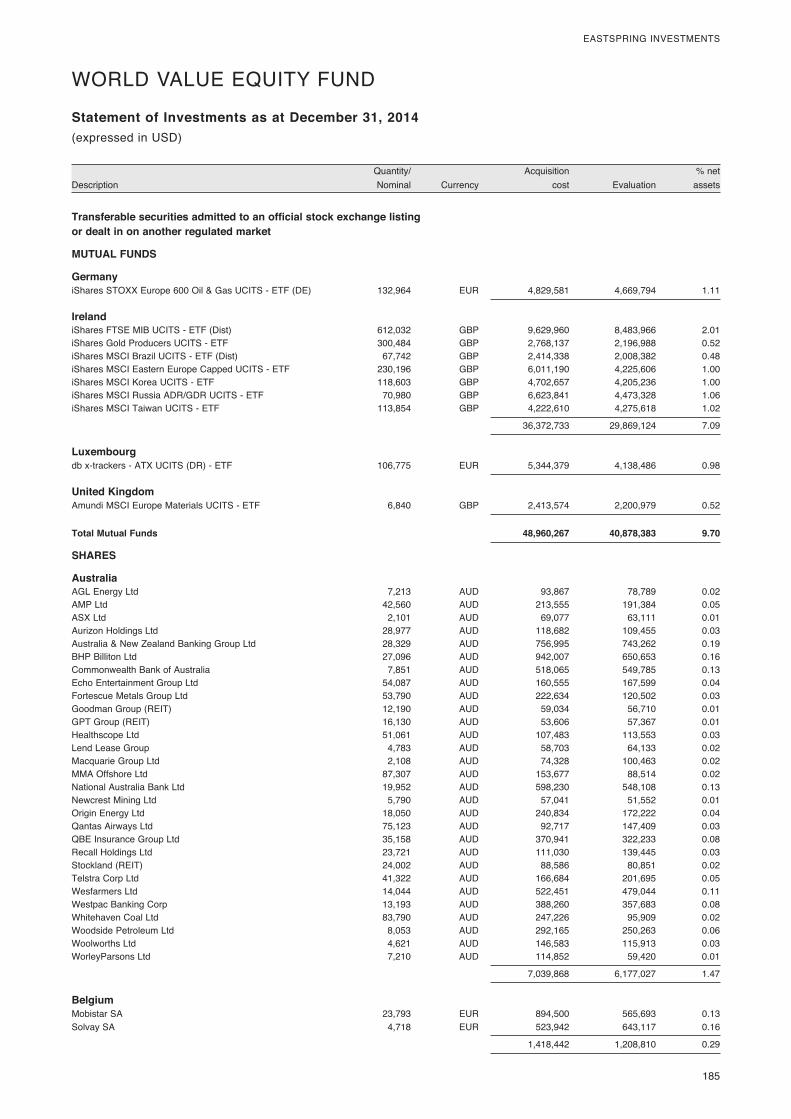
� 185
EASTSPRING�INVESTMENTS
� Quantity/�� � Acquisition�� � %�net�Description� Nominal�� Currency�� cost�� Evaluation�� assets�
Statement of Investments as at December 31, 2014(expressed�in�USD)
WORLD�VALUE�EQUITY�FUND�
Transferable securities admitted to an official stock exchange listing or dealt in on another regulated market
MUTUAL FUNDS
Germany iShares�STOXX�Europe�600�Oil�&�Gas�UCITS�-�ETF�(DE)�� 132,964� EUR� 4,829,581� 4,669,794� 1.11
Ireland iShares�FTSE�MIB�UCITS�-�ETF�(Dist)� 612,032� GBP� 9,629,960� 8,483,966� 2.01iShares�Gold�Producers�UCITS�-�ETF�� 300,484� GBP� 2,768,137� 2,196,988� 0.52iShares�MSCI�Brazil�UCITS�-�ETF�(Dist)�� 67,742� GBP� 2,414,338� 2,008,382� 0.48iShares�MSCI�Eastern�Europe�Capped�UCITS�-�ETF�� 230,196� GBP� 6,011,190� 4,225,606� 1.00iShares�MSCI�Korea�UCITS�-�ETF�� 118,603� GBP� 4,702,657� 4,205,236� 1.00iShares�MSCI�Russia�ADR/GDR�UCITS�-�ETF�� 70,980� GBP� 6,623,841� 4,473,328� 1.06iShares�MSCI�Taiwan�UCITS�-�ETF�� 113,854� GBP� 4,222,610� 4,275,618� 1.02
� � � 36,372,733� 29,869,124� 7.09
Luxembourg db�x-trackers�-�ATX�UCITS�(DR)�-�ETF�� 106,775� EUR� 5,344,379� 4,138,486� 0.98
United Kingdom Amundi�MSCI�Europe�Materials�UCITS�-�ETF�� 6,840� GBP� 2,413,574� 2,200,979� 0.52
Total Mutual Funds 48,960,267 40,878,383 9.70
SHARES
Australia AGL�Energy�Ltd� 7,213� AUD� 93,867� 78,789� 0.02AMP�Ltd� 42,560� AUD� 213,555� 191,384� 0.05ASX�Ltd� 2,101� AUD� 69,077� 63,111� 0.01Aurizon�Holdings�Ltd� 28,977� AUD� 118,682� 109,455� 0.03Australia�&�New�Zealand�Banking�Group�Ltd� 28,329� AUD� 756,995� 743,262� 0.19BHP�Billiton�Ltd� 27,096� AUD� 942,007� 650,653� 0.16Commonwealth�Bank�of�Australia� 7,851� AUD� 518,065� 549,785� 0.13Echo�Entertainment�Group�Ltd� 54,087� AUD� 160,555� 167,599� 0.04Fortescue�Metals�Group�Ltd� 53,790� AUD� 222,634� 120,502� 0.03Goodman�Group�(REIT)� 12,190� AUD� 59,034� 56,710� 0.01GPT�Group�(REIT)� 16,130� AUD� 53,606� 57,367� 0.01Healthscope�Ltd� 51,061� AUD� 107,483� 113,553� 0.03Lend�Lease�Group� 4,783� AUD� 58,703� 64,133� 0.02Macquarie�Group�Ltd� 2,108� AUD� 74,328� 100,463� 0.02MMA�Offshore�Ltd� 87,307� AUD� 153,677� 88,514� 0.02National�Australia�Bank�Ltd� 19,952� AUD� 598,230� 548,108� 0.13Newcrest�Mining�Ltd� 5,790� AUD� 57,041� 51,552� 0.01Origin�Energy�Ltd� 18,050� AUD� 240,834� 172,222� 0.04Qantas�Airways�Ltd� 75,123� AUD� 92,717� 147,409� 0.03QBE�Insurance�Group�Ltd� 35,158� AUD� 370,941� 322,233� 0.08Recall�Holdings�Ltd� 23,721� AUD� 111,030� 139,445� 0.03Stockland�(REIT)� 24,002� AUD� 88,586� 80,851� 0.02Telstra�Corp�Ltd� 41,322� AUD� 166,684� 201,695� 0.05Wesfarmers�Ltd� 14,044� AUD� 522,451� 479,044� 0.11Westpac�Banking�Corp� 13,193� AUD� 388,260� 357,683� 0.08Whitehaven�Coal�Ltd� 83,790� AUD� 247,226� 95,909� 0.02Woodside�Petroleum�Ltd� 8,053� AUD� 292,165� 250,263� 0.06Woolworths�Ltd� 4,621� AUD� 146,583� 115,913� 0.03WorleyParsons�Ltd�� 7,210� AUD� 114,852� 59,420� 0.01
� � � 7,039,868� 6,177,027� 1.47
Belgium Mobistar�SA� 23,793� EUR� 894,500� 565,693� 0.13Solvay�SA�� 4,718� EUR� 523,942� 643,117� 0.16
� � � 1,418,442� 1,208,810� 0.29
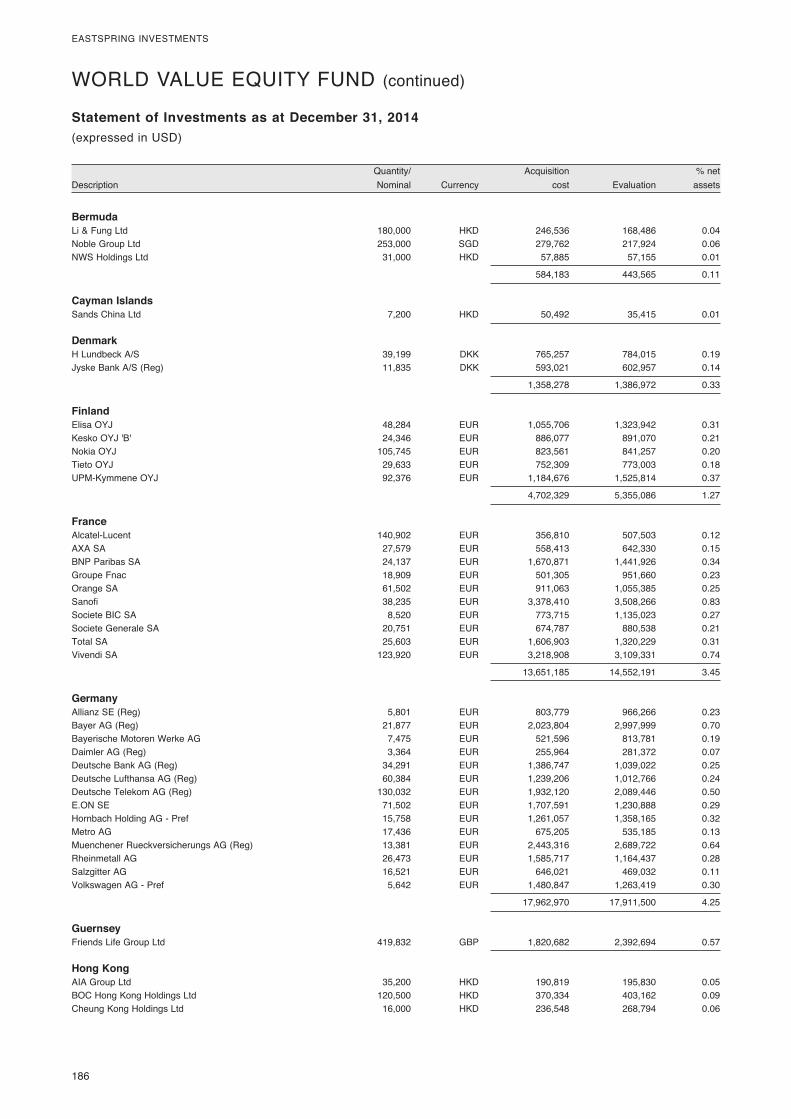
186�
EASTSPRING�INVESTMENTS
� Quantity/�� � Acquisition�� � %�net�Description� Nominal�� Currency�� cost�� Evaluation�� assets�
Statement of Investments as at December 31, 2014(expressed�in�USD)
WORLD�VALUE�EQUITY�FUND�(continued)
Bermuda Li�&�Fung�Ltd� 180,000� HKD� 246,536� 168,486� 0.04Noble�Group�Ltd� 253,000� SGD� 279,762� 217,924� 0.06NWS�Holdings�Ltd�� 31,000� HKD� 57,885� 57,155� 0.01
� � � 584,183� 443,565� 0.11
Cayman Islands Sands�China�Ltd�� 7,200� HKD� 50,492� 35,415� 0.01
Denmark H�Lundbeck�A/S� 39,199� DKK� 765,257� 784,015� 0.19Jyske�Bank�A/S�(Reg)�� 11,835� DKK� 593,021� 602,957� 0.14
� � � 1,358,278� 1,386,972� 0.33
Finland Elisa�OYJ� 48,284� EUR� 1,055,706� 1,323,942� 0.31Kesko�OYJ�'B'� 24,346� EUR� 886,077� 891,070� 0.21Nokia�OYJ� 105,745� EUR� 823,561� 841,257� 0.20Tieto�OYJ� 29,633� EUR� 752,309� 773,003� 0.18UPM-Kymmene�OYJ�� 92,376� EUR� 1,184,676� 1,525,814� 0.37
� � � 4,702,329� 5,355,086� 1.27
France Alcatel-Lucent� 140,902� EUR� 356,810� 507,503� 0.12AXA�SA� 27,579� EUR� 558,413� 642,330� 0.15BNP�Paribas�SA� 24,137� EUR� 1,670,871� 1,441,926� 0.34Groupe�Fnac� 18,909� EUR� 501,305� 951,660� 0.23Orange�SA� 61,502� EUR� 911,063� 1,055,385� 0.25Sanofi� 38,235� EUR� 3,378,410� 3,508,266� 0.83Societe�BIC�SA� 8,520� EUR� 773,715� 1,135,023� 0.27Societe�Generale�SA� 20,751� EUR� 674,787� 880,538� 0.21Total�SA� 25,603� EUR� 1,606,903� 1,320,229� 0.31Vivendi�SA�� 123,920� EUR� 3,218,908� 3,109,331� 0.74
� � � 13,651,185� 14,552,191� 3.45
Germany Allianz�SE�(Reg)� 5,801� EUR� 803,779� 966,266� 0.23Bayer�AG�(Reg)� 21,877� EUR� 2,023,804� 2,997,999� 0.70Bayerische�Motoren�Werke�AG� 7,475� EUR� 521,596� 813,781� 0.19Daimler�AG�(Reg)� 3,364� EUR� 255,964� 281,372� 0.07Deutsche�Bank�AG�(Reg)� 34,291� EUR� 1,386,747� 1,039,022� 0.25Deutsche�Lufthansa�AG�(Reg)� 60,384� EUR� 1,239,206� 1,012,766� 0.24Deutsche�Telekom�AG�(Reg)� 130,032� EUR� 1,932,120� 2,089,446� 0.50E.ON�SE� 71,502� EUR� 1,707,591� 1,230,888� 0.29Hornbach�Holding�AG�-�Pref� 15,758� EUR� 1,261,057� 1,358,165� 0.32Metro�AG� 17,436� EUR� 675,205� 535,185� 0.13Muenchener�Rueckversicherungs�AG�(Reg)� 13,381� EUR� 2,443,316� 2,689,722� 0.64Rheinmetall�AG� 26,473� EUR� 1,585,717� 1,164,437� 0.28Salzgitter�AG� 16,521� EUR� 646,021� 469,032� 0.11Volkswagen�AG�-�Pref�� 5,642� EUR� 1,480,847� 1,263,419� 0.30
� � � 17,962,970� 17,911,500� 4.25
Guernsey Friends�Life�Group�Ltd�� 419,832� GBP� 1,820,682� 2,392,694� 0.57
Hong Kong AIA�Group�Ltd� 35,200� HKD� 190,819� 195,830� 0.05BOC�Hong�Kong�Holdings�Ltd� 120,500� HKD� 370,334� 403,162� 0.09Cheung�Kong�Holdings�Ltd� 16,000� HKD� 236,548� 268,794� 0.06
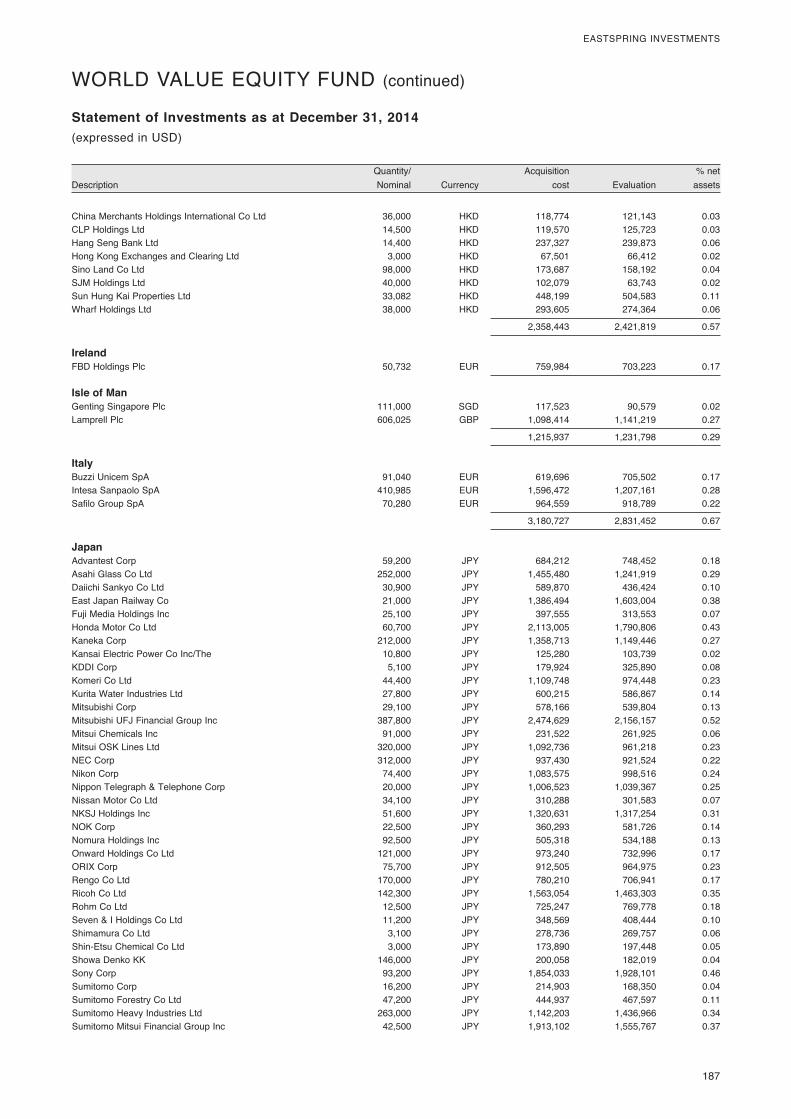
� 187
EASTSPRING�INVESTMENTS
� Quantity/�� � Acquisition�� � %�net�Description� Nominal�� Currency�� cost�� Evaluation�� assets�
Statement of Investments as at December 31, 2014(expressed�in�USD)
WORLD�VALUE�EQUITY�FUND�(continued)
China�Merchants�Holdings�International�Co�Ltd� 36,000� HKD� 118,774� 121,143� 0.03CLP�Holdings�Ltd� 14,500� HKD� 119,570� 125,723� 0.03Hang�Seng�Bank�Ltd� 14,400� HKD� 237,327� 239,873� 0.06Hong�Kong�Exchanges�and�Clearing�Ltd� 3,000� HKD� 67,501� 66,412� 0.02Sino�Land�Co�Ltd� 98,000� HKD� 173,687� 158,192� 0.04SJM�Holdings�Ltd� 40,000� HKD� 102,079� 63,743� 0.02Sun�Hung�Kai�Properties�Ltd� 33,082� HKD� 448,199� 504,583� 0.11Wharf�Holdings�Ltd�� 38,000� HKD� 293,605� 274,364� 0.06
� � � 2,358,443� 2,421,819� 0.57
Ireland FBD�Holdings�Plc�� 50,732� EUR� 759,984� 703,223� 0.17
Isle of Man Genting�Singapore�Plc� 111,000� SGD� 117,523� 90,579� 0.02Lamprell�Plc�� 606,025� GBP� 1,098,414� 1,141,219� 0.27
� � � 1,215,937� 1,231,798� 0.29
Italy Buzzi�Unicem�SpA� 91,040� EUR� 619,696� 705,502� 0.17Intesa�Sanpaolo�SpA� 410,985� EUR� 1,596,472� 1,207,161� 0.28Safilo�Group�SpA�� 70,280� EUR� 964,559� 918,789� 0.22
� � � 3,180,727� 2,831,452� 0.67
Japan Advantest�Corp� 59,200� JPY� 684,212� 748,452� 0.18Asahi�Glass�Co�Ltd� 252,000� JPY� 1,455,480� 1,241,919� 0.29Daiichi�Sankyo�Co�Ltd� 30,900� JPY� 589,870� 436,424� 0.10East�Japan�Railway�Co� 21,000� JPY� 1,386,494� 1,603,004� 0.38Fuji�Media�Holdings�Inc� 25,100� JPY� 397,555� 313,553� 0.07Honda�Motor�Co�Ltd� 60,700� JPY� 2,113,005� 1,790,806� 0.43Kaneka�Corp� 212,000� JPY� 1,358,713� 1,149,446� 0.27Kansai�Electric�Power�Co�Inc/The� 10,800� JPY� 125,280� 103,739� 0.02KDDI�Corp� 5,100� JPY� 179,924� 325,890� 0.08Komeri�Co�Ltd� 44,400� JPY� 1,109,748� 974,448� 0.23Kurita�Water�Industries�Ltd� 27,800� JPY� 600,215� 586,867� 0.14Mitsubishi�Corp� 29,100� JPY� 578,166� 539,804� 0.13Mitsubishi�UFJ�Financial�Group�Inc� 387,800� JPY� 2,474,629� 2,156,157� 0.52Mitsui�Chemicals�Inc� 91,000� JPY� 231,522� 261,925� 0.06Mitsui�OSK�Lines�Ltd� 320,000� JPY� 1,092,736� 961,218� 0.23NEC�Corp� 312,000� JPY� 937,430� 921,524� 0.22Nikon�Corp� 74,400� JPY� 1,083,575� 998,516� 0.24Nippon�Telegraph�&�Telephone�Corp� 20,000� JPY� 1,006,523� 1,039,367� 0.25Nissan�Motor�Co�Ltd� 34,100� JPY� 310,288� 301,583� 0.07NKSJ�Holdings�Inc� 51,600� JPY� 1,320,631� 1,317,254� 0.31NOK�Corp� 22,500� JPY� 360,293� 581,726� 0.14Nomura�Holdings�Inc� 92,500� JPY� 505,318� 534,188� 0.13Onward�Holdings�Co�Ltd� 121,000� JPY� 973,240� 732,996� 0.17ORIX�Corp� 75,700� JPY� 912,505� 964,975� 0.23Rengo�Co�Ltd� 170,000� JPY� 780,210� 706,941� 0.17Ricoh�Co�Ltd� 142,300� JPY� 1,563,054� 1,463,303� 0.35Rohm�Co�Ltd� 12,500� JPY� 725,247� 769,778� 0.18Seven�&�I�Holdings�Co�Ltd� 11,200� JPY� 348,569� 408,444� 0.10Shimamura�Co�Ltd� 3,100� JPY� 278,736� 269,757� 0.06Shin-Etsu�Chemical�Co�Ltd� 3,000� JPY� 173,890� 197,448� 0.05Showa�Denko�KK� 146,000� JPY� 200,058� 182,019� 0.04Sony�Corp� 93,200� JPY� 1,854,033� 1,928,101� 0.46Sumitomo�Corp� 16,200� JPY� 214,903� 168,350� 0.04Sumitomo�Forestry�Co�Ltd� 47,200� JPY� 444,937� 467,597� 0.11Sumitomo�Heavy�Industries�Ltd� 263,000� JPY� 1,142,203� 1,436,966� 0.34Sumitomo�Mitsui�Financial�Group�Inc� 42,500� JPY� 1,913,102� 1,555,767� 0.37
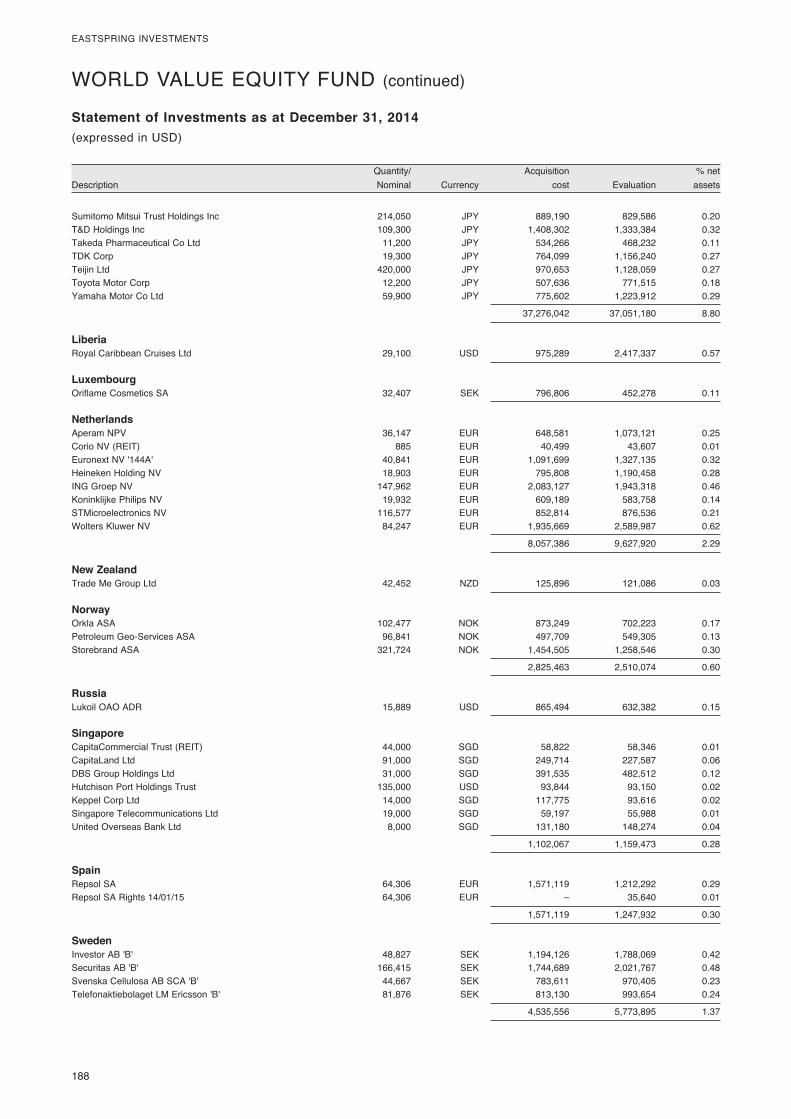
188�
EASTSPRING�INVESTMENTS
� Quantity/�� � Acquisition�� � %�net�Description� Nominal�� Currency�� cost�� Evaluation�� assets�
Statement of Investments as at December 31, 2014(expressed�in�USD)
WORLD�VALUE�EQUITY�FUND�(continued)
Sumitomo�Mitsui�Trust�Holdings�Inc� 214,050� JPY� 889,190� 829,586� 0.20T&D�Holdings�Inc� 109,300� JPY� 1,408,302� 1,333,384� 0.32Takeda�Pharmaceutical�Co�Ltd� 11,200� JPY� 534,266� 468,232� 0.11TDK�Corp� 19,300� JPY� 764,099� 1,156,240� 0.27Teijin�Ltd� 420,000� JPY� 970,653� 1,128,059� 0.27Toyota�Motor�Corp� 12,200� JPY� 507,636� 771,515� 0.18Yamaha�Motor�Co�Ltd�� 59,900� JPY� 775,602� 1,223,912� 0.29
� � � 37,276,042� 37,051,180� 8.80
Liberia Royal�Caribbean�Cruises�Ltd�� 29,100� USD� 975,289� 2,417,337� 0.57
Luxembourg Oriflame�Cosmetics�SA�� 32,407� SEK� 796,806� 452,278� 0.11
Netherlands Aperam�NPV� 36,147� EUR� 648,581� 1,073,121� 0.25Corio�NV�(REIT)� 885� EUR� 40,499� 43,607� 0.01Euronext�NV�'144A'� 40,841� EUR� 1,091,699� 1,327,135� 0.32Heineken�Holding�NV� 18,903� EUR� 795,808� 1,190,458� 0.28ING�Groep�NV� 147,962� EUR� 2,083,127� 1,943,318� 0.46Koninklijke�Philips�NV� 19,932� EUR� 609,189� 583,758� 0.14STMicroelectronics�NV� 116,577� EUR� 852,814� 876,536� 0.21Wolters�Kluwer�NV�� 84,247� EUR� 1,935,669� 2,589,987� 0.62
� � � 8,057,386� 9,627,920� 2.29
New Zealand Trade�Me�Group�Ltd�� 42,452� NZD� 125,896� 121,086� 0.03
Norway Orkla�ASA� 102,477� NOK� 873,249� 702,223� 0.17Petroleum�Geo-Services�ASA� 96,841� NOK� 497,709� 549,305� 0.13Storebrand�ASA�� 321,724� NOK� 1,454,505� 1,258,546� 0.30
� � � 2,825,463� 2,510,074� 0.60
Russia Lukoil�OAO�ADR�� 15,889� USD� 865,494� 632,382� 0.15
Singapore CapitaCommercial�Trust�(REIT)� 44,000� SGD� 58,822� 58,346� 0.01CapitaLand�Ltd� 91,000� SGD� 249,714� 227,587� 0.06DBS�Group�Holdings�Ltd� 31,000� SGD� 391,535� 482,512� 0.12Hutchison�Port�Holdings�Trust� 135,000� USD� 93,844� 93,150� 0.02Keppel�Corp�Ltd� 14,000� SGD� 117,775� 93,616� 0.02Singapore�Telecommunications�Ltd� 19,000� SGD� 59,197� 55,988� 0.01United�Overseas�Bank�Ltd�� 8,000� SGD� 131,180� 148,274� 0.04
� � � 1,102,067� 1,159,473� 0.28
Spain Repsol�SA� 64,306� EUR� 1,571,119� 1,212,292� 0.29Repsol�SA�Rights�14/01/15�� 64,306� EUR� –� 35,640� 0.01
� � � 1,571,119� 1,247,932� 0.30
Sweden Investor�AB�'B'� 48,827� SEK� 1,194,126� 1,788,069� 0.42Securitas�AB�'B'� 166,415� SEK� 1,744,689� 2,021,767� 0.48Svenska�Cellulosa�AB�SCA�'B'� 44,667� SEK� 783,611� 970,405� 0.23Telefonaktiebolaget�LM�Ericsson�'B'�� 81,876� SEK� 813,130� 993,654� 0.24
� � � 4,535,556� 5,773,895� 1.37
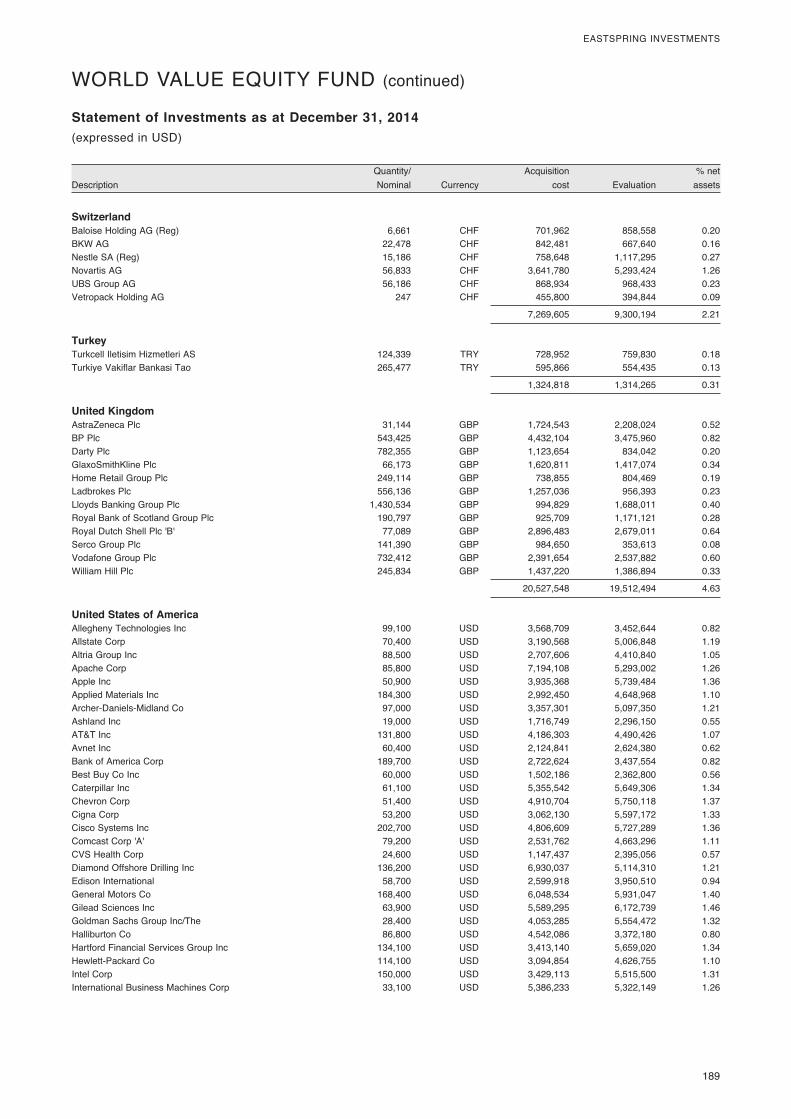
� 189
EASTSPRING�INVESTMENTS
� Quantity/�� � Acquisition�� � %�net�Description� Nominal�� Currency�� cost�� Evaluation�� assets�
Statement of Investments as at December 31, 2014(expressed�in�USD)
Switzerland Baloise�Holding�AG�(Reg)� 6,661� CHF� 701,962� 858,558� 0.20BKW�AG� 22,478� CHF� 842,481� 667,640� 0.16Nestle�SA�(Reg)� 15,186� CHF� 758,648� 1,117,295� 0.27Novartis�AG� 56,833� CHF� 3,641,780� 5,293,424� 1.26UBS�Group�AG� 56,186� CHF� 868,934� 968,433� 0.23Vetropack�Holding�AG�� 247� CHF� 455,800� 394,844� 0.09
� � � 7,269,605� 9,300,194� 2.21
Turkey Turkcell�Iletisim�Hizmetleri�AS� 124,339� TRY� 728,952� 759,830� 0.18Turkiye�Vakiflar�Bankasi�Tao�� 265,477� TRY� 595,866� 554,435� 0.13
� � � 1,324,818� 1,314,265� 0.31
United Kingdom AstraZeneca�Plc� 31,144� GBP� 1,724,543� 2,208,024� 0.52BP�Plc� 543,425� GBP� 4,432,104� 3,475,960� 0.82Darty�Plc� 782,355� GBP� 1,123,654� 834,042� 0.20GlaxoSmithKline�Plc� 66,173� GBP� 1,620,811� 1,417,074� 0.34Home�Retail�Group�Plc� 249,114� GBP� 738,855� 804,469� 0.19Ladbrokes�Plc� 556,136� GBP� 1,257,036� 956,393� 0.23Lloyds�Banking�Group�Plc� 1,430,534� GBP� 994,829� 1,688,011� 0.40Royal�Bank�of�Scotland�Group�Plc� 190,797� GBP� 925,709� 1,171,121� 0.28Royal�Dutch�Shell�Plc�'B'� 77,089� GBP� 2,896,483� 2,679,011� 0.64Serco�Group�Plc� 141,390� GBP� 984,650� 353,613� 0.08Vodafone�Group�Plc� 732,412� GBP� 2,391,654� 2,537,882� 0.60William�Hill�Plc�� 245,834� GBP� 1,437,220� 1,386,894� 0.33
� � � 20,527,548� 19,512,494� 4.63
United States of America Allegheny�Technologies�Inc� 99,100� USD� 3,568,709� 3,452,644� 0.82Allstate�Corp� 70,400� USD� 3,190,568� 5,006,848� 1.19Altria�Group�Inc� 88,500� USD� 2,707,606� 4,410,840� 1.05Apache�Corp� 85,800� USD� 7,194,108� 5,293,002� 1.26Apple�Inc� 50,900� USD� 3,935,368� 5,739,484� 1.36Applied�Materials�Inc� 184,300� USD� 2,992,450� 4,648,968� 1.10Archer-Daniels-Midland�Co� 97,000� USD� 3,357,301� 5,097,350� 1.21Ashland�Inc� 19,000� USD� 1,716,749� 2,296,150� 0.55AT&T�Inc� 131,800� USD� 4,186,303� 4,490,426� 1.07Avnet�Inc� 60,400� USD� 2,124,841� 2,624,380� 0.62Bank�of�America�Corp� 189,700� USD� 2,722,624� 3,437,554� 0.82Best�Buy�Co�Inc� 60,000� USD� 1,502,186� 2,362,800� 0.56Caterpillar�Inc� 61,100� USD� 5,355,542� 5,649,306� 1.34Chevron�Corp� 51,400� USD� 4,910,704� 5,750,118� 1.37Cigna�Corp� 53,200� USD� 3,062,130� 5,597,172� 1.33Cisco�Systems�Inc� 202,700� USD� 4,806,609� 5,727,289� 1.36Comcast�Corp�'A'� 79,200� USD� 2,531,762� 4,663,296� 1.11CVS�Health�Corp� 24,600� USD� 1,147,437� 2,395,056� 0.57Diamond�Offshore�Drilling�Inc� 136,200� USD� 6,930,037� 5,114,310� 1.21Edison�International� 58,700� USD� 2,599,918� 3,950,510� 0.94General�Motors�Co� 168,400� USD� 6,048,534� 5,931,047� 1.40Gilead�Sciences�Inc� 63,900� USD� 5,589,295� 6,172,739� 1.46Goldman�Sachs�Group�Inc/The� 28,400� USD� 4,053,285� 5,554,472� 1.32Halliburton�Co� 86,800� USD� 4,542,086� 3,372,180� 0.80Hartford�Financial�Services�Group�Inc� 134,100� USD� 3,413,140� 5,659,020� 1.34Hewlett-Packard�Co� 114,100� USD� 3,094,854� 4,626,755� 1.10Intel�Corp� 150,000� USD� 3,429,113� 5,515,500� 1.31International�Business�Machines�Corp� 33,100� USD� 5,386,233� 5,322,149� 1.26
WORLD�VALUE�EQUITY�FUND�(continued)
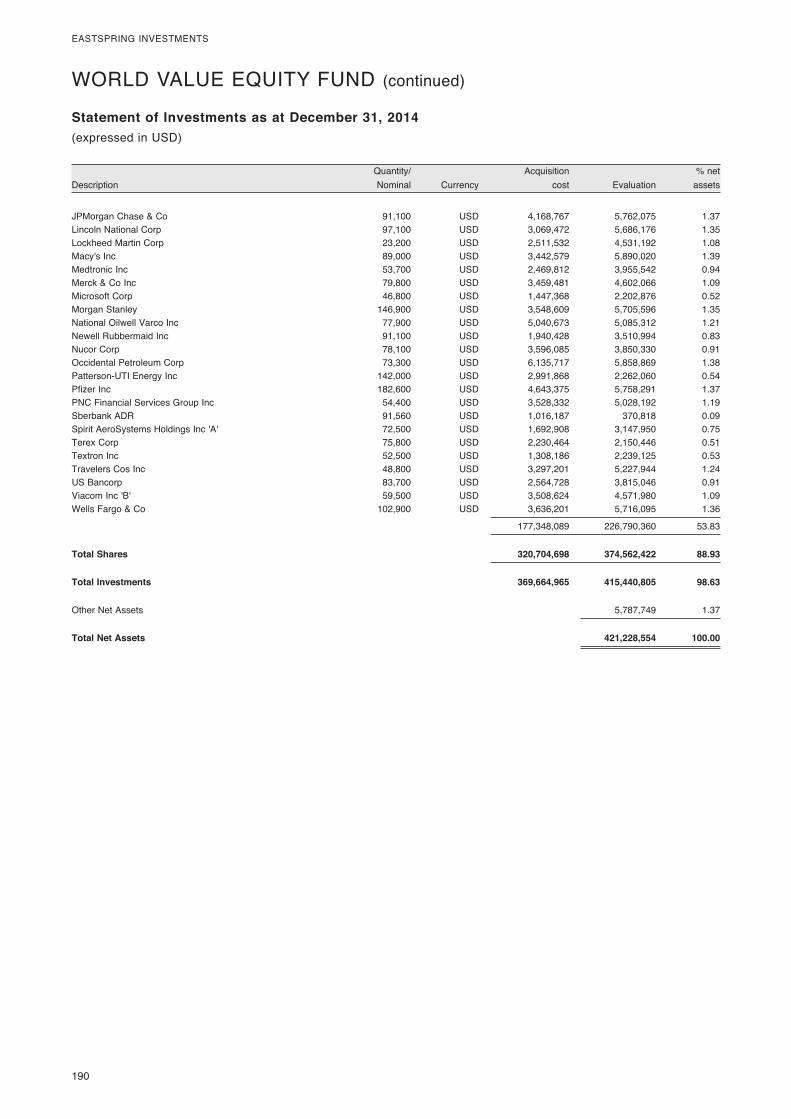
190�
EASTSPRING�INVESTMENTS
� Quantity/�� � Acquisition�� � %�net�Description� Nominal�� Currency�� cost�� Evaluation�� assets�
Statement of Investments as at December 31, 2014(expressed�in�USD)
JPMorgan�Chase�&�Co� 91,100� USD� 4,168,767� 5,762,075� 1.37Lincoln�National�Corp� 97,100� USD� 3,069,472� 5,686,176� 1.35Lockheed�Martin�Corp� 23,200� USD� 2,511,532� 4,531,192� 1.08Macy's�Inc� 89,000� USD� 3,442,579� 5,890,020� 1.39Medtronic�Inc� 53,700� USD� 2,469,812� 3,955,542� 0.94Merck�&�Co�Inc� 79,800� USD� 3,459,481� 4,602,066� 1.09Microsoft�Corp� 46,800� USD� 1,447,368� 2,202,876� 0.52Morgan�Stanley� 146,900� USD� 3,548,609� 5,705,596� 1.35National�Oilwell�Varco�Inc� 77,900� USD� 5,040,673� 5,085,312� 1.21Newell�Rubbermaid�Inc� 91,100� USD� 1,940,428� 3,510,994� 0.83Nucor�Corp� 78,100� USD� 3,596,085� 3,850,330� 0.91Occidental�Petroleum�Corp� 73,300� USD� 6,135,717� 5,858,869� 1.38Patterson-UTI�Energy�Inc� 142,000� USD� 2,991,868� 2,262,060� 0.54Pfizer�Inc� 182,600� USD� 4,643,375� 5,758,291� 1.37PNC�Financial�Services�Group�Inc� 54,400� USD� 3,528,332� 5,028,192� 1.19Sberbank�ADR� 91,560� USD� 1,016,187� 370,818� 0.09Spirit�AeroSystems�Holdings�Inc�'A'� 72,500� USD� 1,692,908� 3,147,950� 0.75Terex�Corp� 75,800� USD� 2,230,464� 2,150,446� 0.51Textron�Inc� 52,500� USD� 1,308,186� 2,239,125� 0.53Travelers�Cos�Inc� 48,800� USD� 3,297,201� 5,227,944� 1.24US�Bancorp� 83,700� USD� 2,564,728� 3,815,046� 0.91Viacom�Inc�'B'� 59,500� USD� 3,508,624� 4,571,980� 1.09Wells�Fargo�&�Co�� 102,900� USD� 3,636,201� 5,716,095� 1.36
� � � 177,348,089� 226,790,360� 53.83
Total Shares 320,704,698 374,562,422 88.93
Total Investments 369,664,965 415,440,805 98.63
Other�Net�Assets� � � � 5,787,749� 1.37
Total Net Assets 421,228,554 100.00
WORLD�VALUE�EQUITY�FUND�(continued)
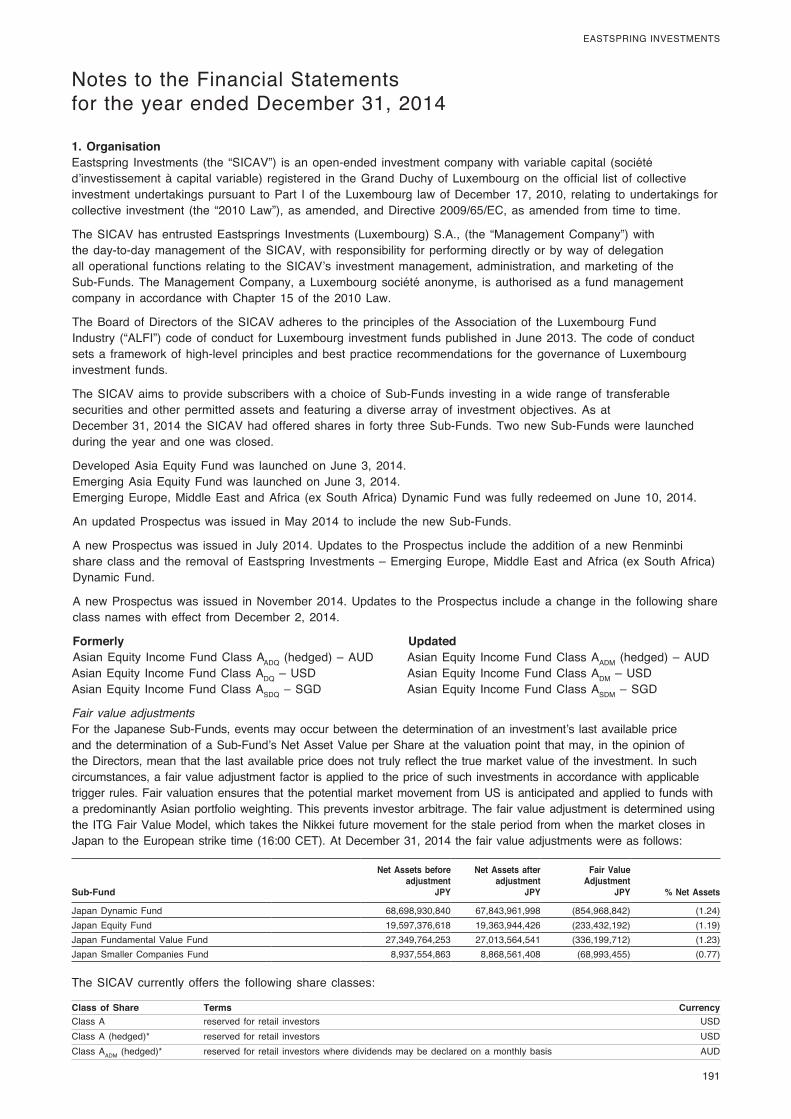
191
EASTSPRING�INVESTMENTS�
Notes�to�the�Financial�Statements�for�the�year�ended�December�31,�2014
1. OrganisationEastspring� Investments� (the� “SICAV”)� is�an�open-ended� investment�company�with�variable�capital� (société�d’investissement�à�capital�variable)� registered� in� the�Grand�Duchy�of�Luxembourg�on� the�official� list�of�collective�investment�undertakings�pursuant� to�Part� I�of� the�Luxembourg� law�of�December�17,�2010,� relating� to�undertakings� for�collective� investment� (the� “2010�Law”),�as�amended,�and�Directive�2009/65/EC,�as�amended� from� time� to� time.
The�SICAV�has�entrusted�Eastsprings� Investments� (Luxembourg)�S.A.,� (the� “Management�Company”)�with�the�day-to-day�management�of� the�SICAV,�with� responsibility� for�performing�directly�or�by�way�of�delegation�all�operational� functions� relating� to� the�SICAV’s� investment�management,�administration,�and�marketing�of� the�Sub-Funds.�The�Management�Company,�a�Luxembourg�société�anonyme,� is�authorised�as�a� fund�management�company� in�accordance�with�Chapter�15�of� the�2010�Law.
The�Board�of�Directors�of� the�SICAV�adheres� to� the�principles�of� the�Association�of� the�Luxembourg�Fund�Industry� (“ALFI”)�code�of�conduct� for�Luxembourg� investment� funds�published� in�June�2013.�The�code�of�conduct�sets�a� framework�of�high-level�principles�and�best�practice� recommendations� for� the�governance�of�Luxembourg�investment� funds.
The�SICAV�aims� to�provide�subscribers�with�a�choice�of�Sub-Funds� investing� in�a�wide� range�of� transferable�securities�and�other�permitted�assets�and� featuring�a�diverse�array�of� investment�objectives.�As�at�December�31,�2014� the�SICAV�had�offered�shares� in� forty� three�Sub-Funds.�Two�new�Sub-Funds�were� launched�during� the�year�and�one�was�closed.
Developed�Asia�Equity�Fund�was� launched�on�June�3,�2014.Emerging�Asia�Equity�Fund�was� launched�on�June�3,�2014.Emerging�Europe,�Middle�East�and�Africa� (ex�South�Africa)�Dynamic�Fund�was� fully� redeemed�on�June�10,�2014.
An�updated�Prospectus�was� issued� in�May�2014� to� include� the�new�Sub-Funds.
A�new�Prospectus�was� issued� in�July�2014.�Updates� to� the�Prospectus� include� the�addition�of�a�new�Renminbi�share�class�and� the� removal�of�Eastspring� Investments�–�Emerging�Europe,�Middle�East�and�Africa� (ex�South�Africa)�Dynamic�Fund.
A�new�Prospectus�was� issued� in�November�2014.�Updates� to� the�Prospectus� include�a�change� in� the� following�share�class�names�with�effect� from�December�2,�2014.�
Formerly UpdatedAsian�Equity� Income�Fund�Class�AADQ� (hedged)�–�AUD� Asian�Equity� Income�Fund�Class�AADM� (hedged)�–�AUDAsian�Equity� Income�Fund�Class�ADQ�–�USD� Asian�Equity� Income�Fund�Class�ADM�–�USDAsian�Equity� Income�Fund�Class�ASDQ�–�SGD� Asian�Equity� Income�Fund�Class�ASDM�–�SGD
Fair�value�adjustmentsFor� the�Japanese�Sub-Funds,�events�may�occur�between�the�determination�of�an� investment’s� last�available�price�and�the�determination�of�a�Sub-Fund’s�Net�Asset�Value�per�Share�at� the�valuation�point� that�may,� in� the�opinion�of�the�Directors,�mean�that� the� last�available�price�does�not� truly�reflect� the�true�market�value�of� the� investment.� In�such�circumstances,�a� fair�value�adjustment� factor� is�applied�to� the�price�of�such� investments� in�accordance�with�applicable�trigger�rules.�Fair�valuation�ensures�that� the�potential�market�movement� from�US�is�anticipated�and�applied�to� funds�with�a�predominantly�Asian�portfolio�weighting.�This�prevents� investor�arbitrage.�The�fair�value�adjustment� is�determined�using�the�ITG�Fair�Value�Model,�which�takes�the�Nikkei� future�movement� for� the�stale�period�from�when�the�market�closes� in�Japan�to� the�European�strike� time�(16:00�CET).�At�December�31,�2014�the�fair�value�adjustments�were�as�follows:
Sub-Fund
Net Assets before adjustment
JPY
Net Assets after adjustment
JPY
Fair Value Adjustment
JPY % Net Assets
Japan�Dynamic�Fund 68,698,930,840 67,843,961,998 (854,968,842) (1.24)Japan�Equity�Fund 19,597,376,618 19,363,944,426 (233,432,192) (1.19)Japan�Fundamental�Value�Fund 27,349,764,253 27,013,564,541 (336,199,712) (1.23)Japan�Smaller�Companies�Fund 8,937,554,863 8,868,561,408 (68,993,455) (0.77)
The�SICAV�currently�offers� the� following�share�classes:
Class of Share Terms Currency Class�A reserved� for� retail� investors� USDClass�A� (hedged)* reserved� for� retail� investors� USDClass�AADM� (hedged)* reserved� for� retail� investors�where�dividends�may�be�declared�on�a�monthly�basis AUD
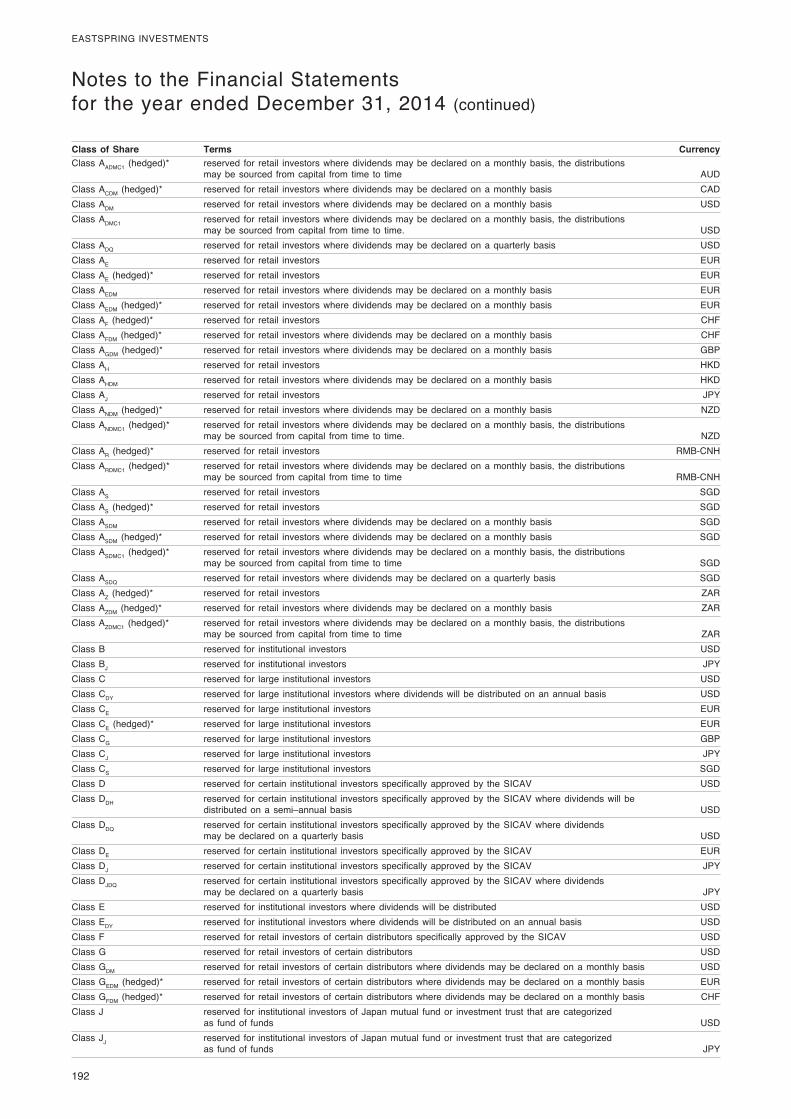
192
EASTSPRING�INVESTMENTS
Class of Share Terms Currency Class�AADMC1� (hedged)* reserved� for� retail� investors�where�dividends�may�be�declared�on�a�monthly�basis,� the�distributions� �
may�be�sourced� from�capital� from� time� to� time AUDClass�ACDM� (hedged)* reserved� for� retail� investors�where�dividends�may�be�declared�on�a�monthly�basis CADClass�ADM� reserved� for� retail� investors�where�dividends�may�be�declared�on�a�monthly�basis USDClass�ADMC1 reserved� for� retail� investors�where�dividends�may�be�declared�on�a�monthly�basis,� the�distributions� �
may�be�sourced� from�capital� from� time� to� time. USDClass�ADQ� reserved� for� retail� investors�where�dividends�may�be�declared�on�a�quarterly�basis USDClass�AE� reserved� for� retail� investors EURClass�AE� (hedged)* reserved� for� retail� investors EURClass�AEDM� reserved� for� retail� investors�where�dividends�may�be�declared�on�a�monthly�basis EURClass�AEDM� (hedged)* reserved� for� retail� investors�where�dividends�may�be�declared�on�a�monthly�basis EURClass�AF� (hedged)* reserved� for� retail� investors CHFClass�AFDM� (hedged)* reserved� for� retail� investors�where�dividends�may�be�declared�on�a�monthly�basis CHFClass�AGDM� (hedged)* reserved� for� retail� investors�where�dividends�may�be�declared�on�a�monthly�basis GBPClass�AH reserved� for� retail� investors HKDClass�AHDM� reserved� for� retail� investors�where�dividends�may�be�declared�on�a�monthly�basis HKDClass�AJ� reserved� for� retail� investors JPYClass�ANDM� (hedged)* reserved� for� retail� investors�where�dividends�may�be�declared�on�a�monthly�basis NZDClass�ANDMC1� (hedged)* reserved� for� retail� investors�where�dividends�may�be�declared�on�a�monthly�basis,� the�distributions� �
may�be�sourced� from�capital� from� time� to� time. NZDClass�AR� (hedged)* reserved� for� retail� investors RMB-CNHClass�ARDMC1� (hedged)* reserved� for� retail� investors�where�dividends�may�be�declared�on�a�monthly�basis,� the�distributions� �
may�be�sourced� from�capital� from� time� to� time RMB-CNHClass�AS� reserved� for� retail� investors SGDClass�AS� (hedged)* reserved� for� retail� investors SGDClass�ASDM� reserved� for� retail� investors�where�dividends�may�be�declared�on�a�monthly�basis SGDClass�ASDM� (hedged)* reserved� for� retail� investors�where�dividends�may�be�declared�on�a�monthly�basis SGDClass�ASDMC1� (hedged)* reserved� for� retail� investors�where�dividends�may�be�declared�on�a�monthly�basis,� the�distributions� �
may�be�sourced� from�capital� from� time� to� time SGDClass�ASDQ� reserved� for� retail� investors�where�dividends�may�be�declared�on�a�quarterly�basis SGDClass�AZ� (hedged)* reserved� for� retail� investors ZARClass�AZDM� (hedged)* reserved� for� retail� investors�where�dividends�may�be�declared�on�a�monthly�basis� ZARClass�AZDMC1� (hedged)* reserved� for� retail� investors�where�dividends�may�be�declared�on�a�monthly�basis,� the�distributions� �
may�be�sourced� from�capital� from� time� to� time ZARClass�B� reserved� for� institutional� investors USDClass�BJ reserved� for� institutional� investors JPYClass�C� reserved� for� large� institutional� investors USDClass�CDY� reserved� for� large� institutional� investors�where�dividends�will�be�distributed�on�an�annual�basis USDClass�CE� reserved� for� large� institutional� investors EURClass�CE� (hedged)* reserved� for� large� institutional� investors EURClass�CG reserved� for� large� institutional� investors GBPClass�CJ� reserved� for� large� institutional� investors JPYClass�CS� reserved� for� large� institutional� investors SGDClass�D� reserved� for�certain� institutional� investors�specifically�approved�by� the�SICAV USDClass�DDH� reserved� for�certain� institutional� investors�specifically�approved�by� the�SICAV�where�dividends�will�be�
distributed�on�a�semi–annual�basis USDClass�DDQ� reserved� for�certain� institutional� investors�specifically�approved�by� the�SICAV�where�dividends� �
may�be�declared�on�a�quarterly�basis USDClass�DE� reserved� for�certain� institutional� investors�specifically�approved�by� the�SICAV EURClass�DJ� reserved� for�certain� institutional� investors�specifically�approved�by� the�SICAV JPYClass�DJDQ� reserved� for�certain� institutional� investors�specifically�approved�by� the�SICAV�where�dividends� �
may�be�declared�on�a�quarterly�basis JPYClass�E� reserved� for� institutional� investors�where�dividends�will�be�distributed USDClass�EDY� reserved� for� institutional� investors�where�dividends�will�be�distributed�on�an�annual�basis USDClass�F� reserved� for� retail� investors�of�certain�distributors�specifically�approved�by� the�SICAV USDClass�G� reserved� for� retail� investors�of�certain�distributors USDClass�GDM� reserved� for� retail� investors�of�certain�distributors�where�dividends�may�be�declared�on�a�monthly�basis USDClass�GEDM� (hedged)* reserved� for� retail� investors�of�certain�distributors�where�dividends�may�be�declared�on�a�monthly�basis EURClass�GFDM� (hedged)* reserved� for� retail� investors�of�certain�distributors�where�dividends�may�be�declared�on�a�monthly�basis CHFClass�J� reserved� for� institutional� investors�of�Japan�mutual� fund�or� investment� trust� that�are�categorized� �
as� fund�of� funds� USDClass�JJ� reserved� for� institutional� investors�of�Japan�mutual� fund�or� investment� trust� that�are�categorized� �
as� fund�of� funds� JPY
Notes�to�the�Financial�Statements�for�the�year�ended�December�31,�2014�(continued)
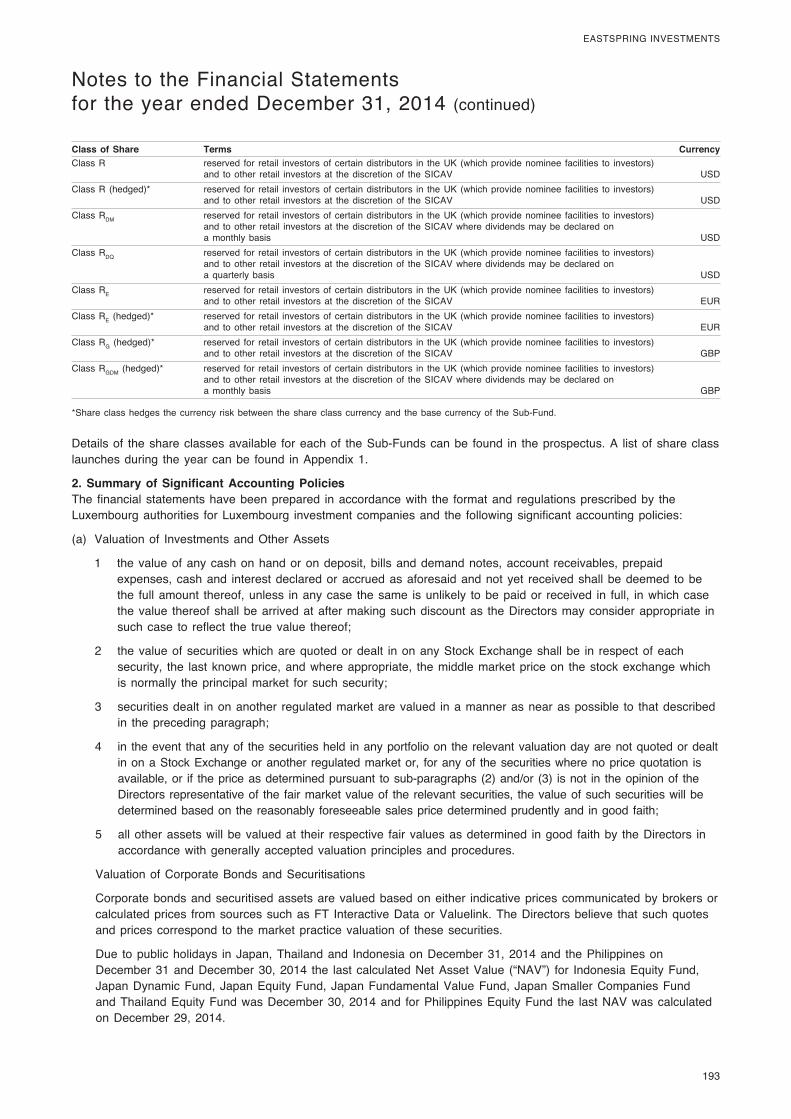
193
EASTSPRING�INVESTMENTS�
Class of Share Terms Currency Class�R� reserved� for� retail� investors�of�certain�distributors� in� the�UK�(which�provide�nominee� facilities� to� investors)�
and� to�other� retail� investors�at� the�discretion�of� the�SICAV USDClass�R� (hedged)* reserved� for� retail� investors�of�certain�distributors� in� the�UK�(which�provide�nominee� facilities� to� investors)�
and� to�other� retail� investors�at� the�discretion�of� the�SICAV USDClass�RDM reserved� for� retail� investors�of�certain�distributors� in� the�UK�(which�provide�nominee� facilities� to� investors)�
and� to�other� retail� investors�at� the�discretion�of� the�SICAV�where�dividends�may�be�declared�on� �a�monthly�basis USD
Class�RDQ reserved� for� retail� investors�of�certain�distributors� in� the�UK�(which�provide�nominee� facilities� to� investors)�and� to�other� retail� investors�at� the�discretion�of� the�SICAV�where�dividends�may�be�declared�on� �a�quarterly�basis USD
Class�RE reserved� for� retail� investors�of�certain�distributors� in� the�UK�(which�provide�nominee� facilities� to� investors)�and� to�other� retail� investors�at� the�discretion�of� the�SICAV EUR
Class�RE� (hedged)* reserved� for� retail� investors�of�certain�distributors� in� the�UK�(which�provide�nominee� facilities� to� investors)�and� to�other� retail� investors�at� the�discretion�of� the�SICAV EUR
Class�RG� (hedged)* reserved� for� retail� investors�of�certain�distributors� in� the�UK�(which�provide�nominee� facilities� to� investors)�and� to�other� retail� investors�at� the�discretion�of� the�SICAV� GBP
Class�RGDM� (hedged)* reserved� for� retail� investors�of�certain�distributors� in� the�UK�(which�provide�nominee� facilities� to� investors)�and� to�other� retail� investors�at� the�discretion�of� the�SICAV�where�dividends�may�be�declared�on� �a�monthly�basis GBP
*Share�class�hedges� the�currency� risk�between� the�share�class�currency�and� the�base�currency�of� the�Sub-Fund.
Details�of� the�share�classes�available� for�each�of� the�Sub-Funds�can�be� found� in� the�prospectus.�A� list�of�share�class�launches�during� the�year�can�be� found� in�Appendix�1.
2. Summary of Significant Accounting PoliciesThe� financial�statements�have�been�prepared� in�accordance�with� the� format�and� regulations�prescribed�by� the�Luxembourg�authorities� for�Luxembourg� investment�companies�and� the� following�significant�accounting�policies:
(a)� Valuation�of� Investments�and�Other�Assets
1� the�value�of�any�cash�on�hand�or�on�deposit,�bills�and�demand�notes,�account� receivables,�prepaid�expenses,�cash�and� interest�declared�or�accrued�as�aforesaid�and�not�yet� received�shall�be�deemed� to�be�the� full�amount� thereof,�unless� in�any�case� the�same� is�unlikely� to�be�paid�or� received� in� full,� in�which�case�the�value� thereof�shall�be�arrived�at�after�making�such�discount�as� the�Directors�may�consider�appropriate� in�such�case� to� reflect� the� true�value� thereof;
2� the�value�of�securities�which�are�quoted�or�dealt� in�on�any�Stock�Exchange�shall�be� in� respect�of�each�security,� the� last�known�price,�and�where�appropriate,� the�middle�market�price�on� the�stock�exchange�which�is�normally� the�principal�market� for�such�security;�
3� securities�dealt� in�on�another� regulated�market�are�valued� in�a�manner�as�near�as�possible� to� that�described�in� the�preceding�paragraph;
4� in� the�event� that�any�of� the�securities�held� in�any�portfolio�on� the�relevant�valuation�day�are�not�quoted�or�dealt�in�on�a�Stock�Exchange�or�another� regulated�market�or,� for�any�of� the�securities�where�no�price�quotation� is�available,�or� if� the�price�as�determined�pursuant� to�sub-paragraphs�(2)�and/or� (3)� is�not� in� the�opinion�of� the�Directors�representative�of� the� fair�market�value�of� the�relevant�securities,� the�value�of�such�securities�will�be�determined�based�on� the�reasonably� foreseeable�sales�price�determined�prudently�and� in�good� faith;
5� all�other�assets�will�be�valued�at� their� respective� fair�values�as�determined� in�good� faith�by� the�Directors� in�accordance�with�generally�accepted�valuation�principles�and�procedures.
Valuation�of�Corporate�Bonds�and�Securitisations
Corporate�bonds�and�securitised�assets�are�valued�based�on�either� indicative�prices�communicated�by�brokers�or�calculated�prices� from�sources�such�as�FT� Interactive�Data�or�Valuelink.�The�Directors�believe� that�such�quotes�and�prices�correspond� to� the�market�practice�valuation�of� these�securities.
Due� to�public�holidays� in�Japan,�Thailand�and� Indonesia�on�December�31,�2014�and� the�Philippines�on�December�31�and�December�30,�2014� the� last�calculated�Net�Asset�Value� (“NAV”)� for� Indonesia�Equity�Fund,�Japan�Dynamic�Fund,�Japan�Equity�Fund,�Japan�Fundamental�Value�Fund,�Japan�Smaller�Companies�Fund�and�Thailand�Equity�Fund�was�December�30,�2014�and� for�Philippines�Equity�Fund� the� last�NAV�was�calculated�on�December�29,�2014.
Notes�to�the�Financial�Statements�for�the�year�ended�December�31,�2014�(continued)
194
EASTSPRING�INVESTMENTS
As�described� in� the�above�accounting�policies,� the� investments�have�been�valued�based,�where�appropriate,�on�the�middle�market�prices�as�at�December�31,�2014.� If� the�SICAV�had�calculated� the�NAV’s�solely�with�a�view� to�presentation� in� these� financial�statements,� the�market�prices�used� to�value� the� investments�would�have�been� the�closing�prices�on�December�31,�2014.�This�would�have� resulted� in�a�net� impact�on� the�NAV’s�of� the� following�Sub-Funds:
Sub-Fund Net impact Net Impact in % of NAV
Global�Technology�Fund �USD�(819,298)� (0.90)North�America�Fund �USD�(1,676,814)� (1.06)North�American�Value�Fund �USD�(14,783,627)� (0.99)World�Value�Equity�Fund �USD�(2,291,006)� (0.54)
(b)� Income� from� Investments
The�SICAV� takes�credit� for� income� from� its� investments�on� the� following�basis:
•� on� fixed�deposits,�and�bonds�on�a� time�apportionment�basis;
•� on�other�stocks�on� the�basis�of�dividends�declared.
(c)� Forward�Foreign�Exchange�Contracts�and�Futures�Contracts
During� the�year� the�SICAV�has�entered� into�a�number�of� forward� foreign�exchange�and� futures�contracts.�Open�forward� foreign�exchange�and� futures�contracts�are�valued�at� the�cost� to�close� the�contracts�on� the�accounting�date.�Surpluses/deficits�arising� from�these�and�closed�unsettled�contracts�are� taken� to�unrealised�gain/loss�and�are�included�under�assets�or� liabilities� (as�appropriate)� in� the�Combined�Statement�of�Net�Assets�on�pages�8� to�18.
(d)� Conversion�of�Foreign�Currencies
The�value�of� the�assets�denominated� in�a�currency�other� than� the�Reference�Currency�of� the� relevant�Class�of�any�Sub-Fund�will�be� translated�at� the� rates�of�exchange�prevailing� in�Luxembourg�at� the� time�of� the�determination�of� the�corresponding�Net�Asset�Value�on� the� last�valuation�date�of� the�year.�Foreign�currency�transactions�during� the�year�are� translated� into� the�Reference�Currency�using� the�exchange� rates�prevailing�at�the�dates�of� the� transactions.
The� rates�used� to�convert�assets�and� liabilities�at�December�31,�2014�were�as� follows:
USD/AED �3.6730� USD/GBP �0.6425� USD/QAR �3.6418�USD/AUD �1.2231� USD/HKD �7.7561� USD/RUB �58.2500�USD/BRL �2.6582� USD/HUF �261.1627� USD/SEK �7.7743�USD/CAD �1.1593� USD/IDR �12,385.0006 USD/SGD �1.3235�USD/CHF �0.9915� USD/INR �63.1225� USD/THB �32.9000�USD/CLP �607.4251� USD/JPY �119.5150� USD/TRY �2.3319�USD/CNH �6.2190� USD/KRW �1,099.1500 USD/TWD �31.6020�USD/CNY �6.2040� USD/MXN �14.7325� USD/VND 21,387.5022USD/COP 2,376.5002 USD/MYR �3.4965� USD/ZAR �11.5717�USD/CZK �22.8510� USD/NOK �7.4644� EUR/GBP �0.7792�USD/DKK �6.1397� USD/NZD �1.2797� EUR/USD �1.2127�USD/EGP �7.1500� USD/PHP �44.7325�USD/EUR �0.8246� USD/PLN �3.5388�
The� rates�used� to�convert�assets�and� liabilities�at�December�30,�2014�were�as� follows:
EUR/JPY �145.0002� USD/JPY �119.0476�GBP/JPY �185.3031� USD/SGD �1.3220�SGD/JPY �90.1038� USD/THB �32.9000�USD/IDR 12,446.5003
The� rates�used� to�convert�assets�and� liabilities�at�December�29,�2014�were�as� follows:
USD/PHP 44.7325USD/SGD 1.3237
Notes�to�the�Financial�Statements�for�the�year�ended�December�31,�2014�(continued)
195
EASTSPRING�INVESTMENTS�
(e)� Total�Combined�Figures
The�combined� figures�of� the�SICAV�are�expressed� in�USD�and�are�equal� to� the�sum�of� the�net�assets�of�the�various�activated�Sub-Funds� translated� into�USD�(where� required)�at� the� rates�of�exchange�prevailing� in�Luxembourg�at� the�Sub-Fund’s� relevant�valuation�slot:
1�USD�=�0.8246�EUR�(December�31,�2014)1�USD�=�119.5150�JPY�(December�31,�2014)
*� �The�opening�balance�was�combined�using� the� foreign�exchange� rate�as�at�December�31,�2014.�The�same�net�assets�when�combined�using� the� foreign�exchange� rate� ruling�at�December�31,�2013� reflected�a� figure�of�USD�18,535,637,518.
3. Management FeesDuring� the�year�Eastspring� Investments� (Singapore)�Limited� (the� “Investment�Manager”)� is�entitled� to� receive�a� fee�payable�monthly� in�arrears�as�a�percentage�per�annum�of� the�average�monthly�Net�Asset�Value�of� the�Sub-Fund�during� the� relevant�month.
The�Management�Company�collects� from� the�SICAV� the�amount�of� fees�due� to� the� Investment�Manager.
For� the�year�ended�December�31,�2014,� the�Management�Fees�per�class�are�up� to�2%�as�stated� in� the�prospectus.
Sub-Funds
Class “A” Shares,including all their
subscriptions
Class “B” Shares,including all their
subscriptions
Class “C” Shares,including all their
subscriptions
Class “D” Shares,including all their
subscriptions
Class “E” Shares,including all their
subscriptions
Asia�Pacific�Equity�Fund 1.50% 0.90% 0.75% 0.00% 1.00%Asian�Bond�Fund 1.25% 0.625% 0.50% 0.00% 0.50%Asian�Dynamic�Fund 2.00% 1.20% 1.00% 0.00% 1.25%Asian�Equity�Fund 1.50% 0.90% 0.75% 0.00% 1.00%Asian�Equity� Income�Fund 1.50% 0.90% 0.75% 0.00% 1.00%Asian�High�Yield�Bond�Fund 1.25% 0.75% 0.625% 0.00% 0.50%Asian� Infrastructure�Equity�Fund 1.50% 0.90% 0.75% 0.00% 1.00%Asian�Local�Bond�Fund 1.25% 0.625% 0.50% 0.00% 0.50%Asian�Property�Securities�Fund 1.50% 0.90% 0.75% 0.00% 1.00%China�Equity�Fund 1.50% 0.90% 0.75% 0.00% 1.00%Developed�Asia�Equity�Fund 1.50% 0.90% 0.75% 0.00% 1.00%Dragon�Peacock�Fund 1.75% 1.05% 0.875% 0.00% 1.00%Emerging�Asia�Equity�Fund 1.50% 0.90% 0.75% 0.00% 1.00%Emerging�Europe,�Middle�East�and�Africa� �Dynamic�Fund 2.00% 1.20% 1.00% 0.00% 1.25%Emerging�Europe,�Middle�East�and�Africa� �(ex�South�Africa)�Dynamic�Fund* 2.00% 1.20% 1.00% 0.00% 0.00%European� Investment�Grade�Bond�Fund 1.25% 0.625% 0.50% 0.00% 0.50%Global�Bond�Navigator�Fund 1.25% 0.75% 0.625% 0.00% 0.50%Global�Emerging�Markets�Bond�Fund 1.25% 0.75% 0.625% 0.00% 0.50%Global�Emerging�Markets�Dynamic�Fund 1.50% 1.20% 1.00% 0.00% 1.25%Global�Equity�Navigator�Fund 1.50% 0.90% 0.75% 0.00% 1.00%Global�Market�Navigator�Fund 1.50% 0.90% 0.75% 0.00% 1.00%Global�Technology�Fund 1.75% 1.05% 0.875% 0.00% 1.00%Greater�China�Equity�Fund 1.50% 0.90% 0.75% 0.00% 1.00%Hong�Kong�Equity�Fund 1.50% 0.90% 0.75% 0.00% 1.00%India�Equity�Fund 1.50% 0.90% 0.75% 0.00% 1.00%Indonesia�Equity�Fund 1.50% 0.90% 0.75% 0.00% 1.00%Japan�Dynamic�Fund 1.50% 1.20% 0.75% 0.00% 1.25%Japan�Equity�Fund 1.50% 0.90% 0.75% 0.00% 1.00%Japan�Fundamental�Value�Fund 1.50% 0.90% 0.75% 0.00% 1.00%Japan�Smaller�Companies�Fund 1.50% 1.05% 0.875% 0.00% 1.00%Latin�American�Equity�Fund 1.50% 0.90% 0.75% 0.00% 1.00%Malaysia�Equity�Fund 1.50% 0.90% 0.75% 0.00% 1.00%North�America�Fund 1.50% 0.90% 0.75% 0.00% 1.00%North�American�Value�Fund 1.50% 0.90% 0.75% 0.00% 1.00%Pan�European�Fund 1.50% 0.90% 0.75% 0.00% 1.00%Philippines�Equity�Fund 1.50% 0.90% 0.75% 0.00% 1.00%
Notes�to�the�Financial�Statements�for�the�year�ended�December�31,�2014�(continued)
*Sub-Fund�was�fully�redeemed,�see�Note�1
196
EASTSPRING�INVESTMENTS
Sub-Funds
Class “A” Shares,including all their
subscriptions
Class “B” Shares,including all their
subscriptions
Class “C” Shares,including all their
subscriptions
Class “D” Shares,including all their
subscriptions
Class “E” Shares,including all their
subscriptions
Thailand�Equity�Fund 1.50% 0.90% 0.75% 0.00% 1.00%US�Bond�Fund 1.25% 0.625% 0.50% 0.00% 1.00%US�Corporate�Bond�Fund 1.25% 0.625% 0.50% 0.00% 0.50%US�High� Investment�Grade�Bond�Fund 1.25% 0.625% 0.50% 0.00% 0.50%US�High�Yield�Bond�Fund 1.25% 0.75% 0.625% 0.00% 0.50%US�Investment�Grade�Bond�Fund 1.25% 0.625% 0.50% 0.00% 0.50%Vietnam�Equity�Fund 2.00% 1.20% 1.00% 0.00% 1.75%World�Value�Equity�Fund 1.50% 0.90% 0.75% 0.00% 1.00%
Sub-Funds
Class “F” Shares,including all their
subscriptions
Class “G” Shares,including all their
subscriptions
Class “J” Shares,including all their
subscriptions
Class “R” Shares,including all their
subscriptions
Asia�Pacific�Equity�Fund � 1.00% 1.50% 1.00% 0.75%Asian�Bond�Fund � 0.50% 0.70% 0.50% 0.625%Asian�Dynamic�Fund � 1.25% 2.00% 1.25% 1.00%Asian�Equity�Fund � 1.00% 1.50% 0.325% 0.75%Asian�Equity� Income�Fund � 1.00% 1.50% 1.00% 0.75%Asian�High�Yield�Bond�Fund � 0.625% N/A 0.50% 0.625%Asian� Infrastructure�Equity�Fund � 1.00% 1.50% 0.45% 0.75%Asian�Local�Bond�Fund � 0.50% 0.70% 0.50% 0.625%Asian�Property�Securities�Fund � 1.00% 1.50% 1.00% 0.75%China�Equity�Fund � 1.00% 1.50% 0.225% 0.75%Developed�Asia�Equity�Fund � 1.00% 1.50% 1.00% 0.75%Dragon�Peacock�Fund � N/A 1.75% 1.00% 0.875%Emerging�Asia�Equity�Fund � 1.00% 1.50% 1.00% 0.75%Emerging�Europe,�Middle�East�and�AfricaDynamic�Fund
��
�1.25%
�2.00%
�1.25%
�1.00%
Emerging�Europe,�Middle�East�and�Africa� �(ex�South�Africa)�Dynamic�Fund*
��
�1.25%
�2.00%
�1.25%
�1.00%
European� Investment�Grade�Bond�Fund � 0.50% 0.70% 0.50% 0.625%Global�Bond�Navigator�Fund � N/A N/A 0.50% 0.625%Global�Emerging�Markets�Bond�Fund � 0.625% N/A 0.50% 0.625%Global�Emerging�Markets�Dynamic�Fund � 1.25% 2.00% 1.25% 1.00%Global�Equity�Navigator�Fund � 1.00% 1.50% 1.00% 0.75%Global�Market�Navigator�Fund � 1.00% 1.50% 1.00% 0.75%Global�Technology�Fund � N/A N/A 1.00% 0.875%Greater�China�Equity�Fund � 1.00% 1.50% 1.00% 0.75%Hong�Kong�Equity�Fund � 1.00% 1.50% 1.00% 0.75%India�Equity�Fund � 1.00% 1.50% 0.225% 0.75%Indonesia�Equity�Fund � 1.00% 1.50% 0.225% 0.75%Japan�Dynamic�Fund � 1.25% 2.00% 1.25% 0.75%Japan�Equity�Fund � 1.00% 1.50% 1.00% 0.75%Japan�Fundamental�Value�Fund � 1.00% 1.50% 1.00% 0.75%Japan�Smaller�Companies�Fund � N/A N/A 1.00% 0.75%Latin�American�Equity�Fund � 1.00% 1.50% 1.00% 0.75%Malaysia�Equity�Fund � 1.00% 1.50% 0.25% 0.75%North�America�Fund � 1.00% 1.50% 1.00% 0.75%North�American�Value�Fund � 1.00% 1.50% 1.00% 0.75%Pan�European�Fund � 1.00% 1.50% 1.00% 0.75%
Philippines�Equity�Fund � 1.00% 1.50%J:�0.25%�JJ:�0.50% 0.75%
Thailand�Equity�Fund � 1.00% 1.50% 0.225% 0.75%US�Bond�Fund � 0.50% 0.70% 0.50% 0.625%US�Corporate�Bond�Fund � 0.50% 0.70% 0.50% 0.625%US�High� Investment�Grade�Bond�Fund � 0.50% 0.70% 0.50% 0.625%US�High�Yield�Bond�Fund � 0.625% N/A 0.50% 0.625%US�Investment�Grade�Bond�Fund � 0.50% 0.70% 0.50% 0.625%Vietnam�Equity�Fund � 1.75% 2.00% 1.00% 1.00%World�Value�Equity�Fund � 1.00% 1.50% 1.00% 0.75%
*Sub-Fund�was�fully�redeemed,�see�Note�1
Notes�to�the�Financial�Statements�for�the�year�ended�December�31,�2014�(continued)
197
EASTSPRING�INVESTMENTS�
4. Administration FeesEastspring� Investments� (Singapore)�Limited� (the� “Global�Distributor”)� is�entitled� to� receive�a� fee,�payable�monthly� in�arrears�as�a�percentage�per�annum�of� the�average�monthly�Net�Asset�Value�of� the�Sub-Fund�during� the� relevant�month� in�consideration�of�distribution-related�services�provided� to� the� relevant�Sub-Funds.�The�Management�Company�collects� from� the�SICAV� the�amount�of� fees�due� to� the�Global�Distributor.
For� the�year�ended�December�31,�2014� the�Administration�Fees�per�Class�A�and�R�are�up� to�0.50%�and�Class�F�and�G�are�up� to�0.20%�as�stated� in� the�prospectus.�
5. Central Administration, Custodian, Registrar and Transfer Agent FeesThe�Bank�of�New�York�Mellon� (Luxembourg)�S.A.�acts�as�Custodian,�Central�Administrator�and�Registrar�and�Transfer�Agent� to� the�Company,�and� is�entitled� to� receive� from� the�SICAV� their�customary�annual� fees�which�are�payable�at� the�end�of�each�month�and�charges�all� rates� in�accordance�with�normal�banking�practices� in�Luxembourg.
The�SICAV�pays�the�Custodian�safekeeping�fees�per� line�of�stock�per�annum�and�transaction�fees�based�on�the�number�and�the� location�of� the�transactions.
6. Tax StatusThe�SICAV� is� registered�under�Luxembourg� law�as�an� investment�company.�Accordingly,�no�Luxembourg� income�or�capital�gains� tax� is�at�present�payable�by� the�Company.�However,� it� is�subject� to�an�annual� “taxe�d’abonnement”�calculated�at�an�annual� rate�of�0.05%�of� the�net�assets,�such� tax�being�payable�quarterly�and�calculated�on� the�basis�of� the�net�assets�of�all�Sub-Funds�at� the�end�of� the� relevant�quarter.�This� tax� is� reduced� to�0.01%�per�annum�of� the�net�assets� relative� to�shares� reserved� to� institutional� investors.�The�portion�of� the�net�assets� invested� in�undertakings�for�collective� investments�already�subject� to� the� “taxe�d’abonnement”�are�exempt� from� this� tax.
7. Audit Fees, Printing, Publication Expenses, Compliance Fee and Other ChargesThe�SICAV�bears�all� its�operating�expenses,� including�without� limitation� the�costs�of�buying�and�selling�securities,�governmental�charges,� legal�and�auditing� fees,� interest,�printing,� reporting�and�publication�expenses,�paying�agency�fees,�postage�and� telephone.
Any�charges�and�costs�attributable� to�a�specific�Sub-Fund�will�be�allocated�directly� to� that�Sub-Fund.
Any�charges�and�costs� that�cannot�be�directly�attributable� to�a�specific�Sub-Fund�will�be�allocated�equally� to� the�various�Sub-Funds�or,� if� the�amounts�so� require,� they�will�be�allocated� to� the�Sub-Funds� in�proportion� to� their�respective�net�assets.
The�Management�Company� is�entitled� to� receive� from� the�SICAV�on�demand� reimbursement� for� its� reasonable�cash�disbursements� in� the�performance�of� its�duties,� including�but�not� limited� to�out-of-pocket�expenses.
Fees�paid�out� to�Directors� in�consideration�of� their�duties� for� the�year�ended�December�31,�2014�amounted� to�EUR�80,000�gross�of� taxation.�Currently�only� Independent�Directors�are� remunerated�by� the�SICAV.
8. Registration and Distribution of Sub-FundsA� list�of�countries�where� the�Sub-Funds�are� registered,�notified�and�distributed� for�sale� is�provided� in�Appendix�2.
9. Risk ManagementThe�method�used� to�calculate� the�global�exposure�of� the�Sub-Funds� is� the�commitment�approach.
10. Forward Foreign Exchange ContractsAs�at�December�31,�2014,� the�SICAV�has� the� following�open� forward� foreign�exchange�contracts:
CurrencyAmount
Purchased CurrencyAmount
Sold Maturity Counterparty
Unrealisedappreciation/
(depreciation)
Asian Bond Fund USDIDR� 50,000,000,000 USD �4,032,258 16/3/2015 ANZ�Bank�Plc (63,858)IDR� 30,000,000,000 USD �2,401,922 28/5/2015 ANZ�Bank�Plc (54,125)USD� 23,730,422 CNH �150,000,000 9/6/2015 Standard�Charter�Bank�Plc (61,887)USD� 11,103,709 PHP �500,000,000 6/2/2015 BNP�Paribas (48,301)USD� 19,358,086 SGD �25,000,000 13/2/2015 UBS�AG 486,752AUD Class Hedges AUD� 19,162,115 USD �16,717,665 15/1/2015 BNY�Mellon�Corp (1,067,099)USD� 3,983,006 AUD �4,691,636 15/1/2015 BNY�Mellon�Corp 151,028CAD Class Hedges CAD� 1,097 USD �985 15/1/2015 BNY�Mellon�Corp (39)
Notes�to�the�Financial�Statements�for�the�year�ended�December�31,�2014�(continued)
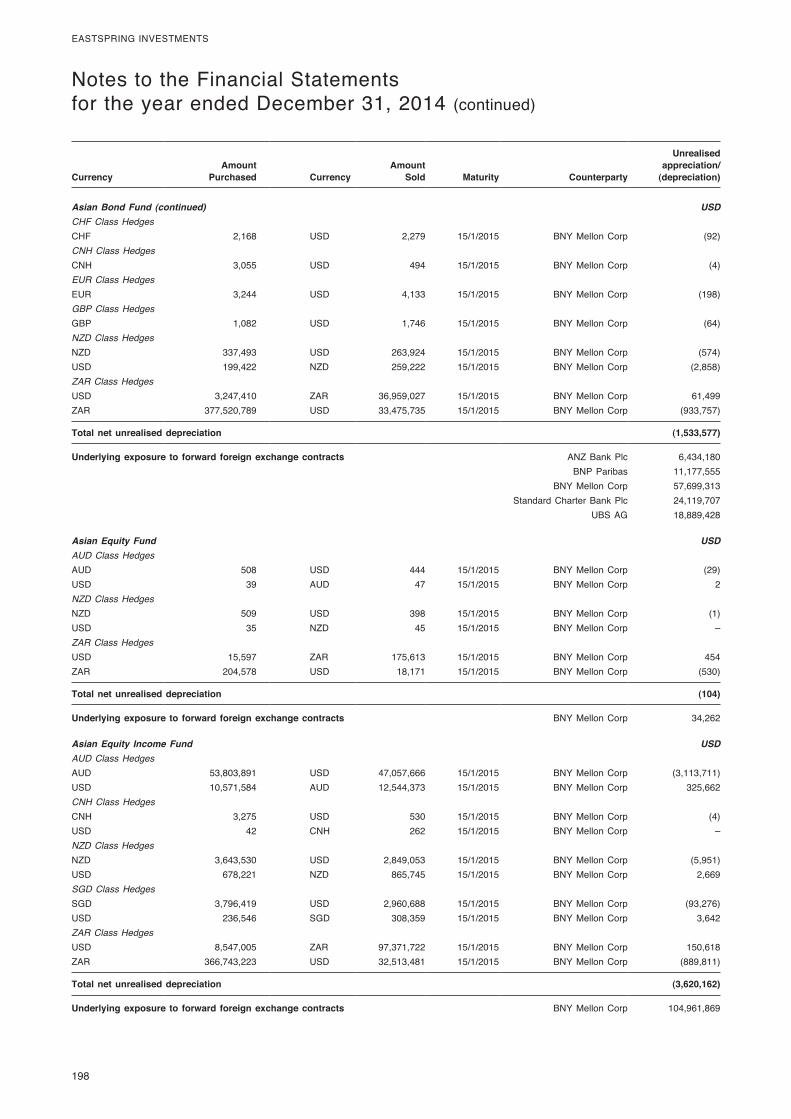
198
EASTSPRING�INVESTMENTS
CurrencyAmount
Purchased CurrencyAmount
Sold Maturity Counterparty
Unrealisedappreciation/
(depreciation)
Asian Bond Fund (continued) USDCHF Class Hedges CHF� 2,168 USD �2,279 15/1/2015 BNY�Mellon�Corp (92)CNH Class Hedges CNH� 3,055 USD �494 15/1/2015 BNY�Mellon�Corp (4)EUR Class Hedges EUR� 3,244 USD �4,133 15/1/2015 BNY�Mellon�Corp (198)GBP Class Hedges GBP� 1,082 USD �1,746 15/1/2015 BNY�Mellon�Corp (64)NZD Class Hedges NZD� 337,493 USD �263,924 15/1/2015 BNY�Mellon�Corp (574)USD� 199,422 NZD �259,222 15/1/2015 BNY�Mellon�Corp (2,858)ZAR Class Hedges USD� 3,247,410 ZAR �36,959,027 15/1/2015 BNY�Mellon�Corp 61,499ZAR� 377,520,789 USD �33,475,735 15/1/2015 BNY�Mellon�Corp (933,757)
Total net unrealised depreciation (1,533,577)
Underlying exposure to forward foreign exchange contracts ANZ�Bank�Plc 6,434,180BNP�Paribas 11,177,555
BNY�Mellon�Corp 57,699,313Standard�Charter�Bank�Plc 24,119,707
UBS�AG 18,889,428
Asian Equity Fund USDAUD Class Hedges AUD� 508 USD �444 15/1/2015 BNY�Mellon�Corp (29)USD� 39 AUD �47 15/1/2015 BNY�Mellon�Corp 2NZD Class Hedges NZD� 509 USD �398 15/1/2015 BNY�Mellon�Corp (1)USD� 35 NZD �45 15/1/2015 BNY�Mellon�Corp –ZAR Class Hedges USD� 15,597 ZAR �175,613 15/1/2015 BNY�Mellon�Corp 454ZAR� 204,578 USD �18,171 15/1/2015 BNY�Mellon�Corp (530)
Total net unrealised depreciation (104)
Underlying exposure to forward foreign exchange contracts BNY�Mellon�Corp 34,262
Asian Equity Income Fund USDAUD Class Hedges AUD� 53,803,891 USD �47,057,666 15/1/2015 BNY�Mellon�Corp (3,113,711)USD� 10,571,584 AUD �12,544,373 15/1/2015 BNY�Mellon�Corp 325,662CNH Class Hedges CNH� 3,275 USD �530 15/1/2015 BNY�Mellon�Corp (4)USD� 42 CNH �262 15/1/2015 BNY�Mellon�Corp –NZD Class Hedges NZD� 3,643,530 USD �2,849,053 15/1/2015 BNY�Mellon�Corp (5,951)USD� 678,221 NZD �865,745 15/1/2015 BNY�Mellon�Corp 2,669SGD Class Hedges SGD� 3,796,419 USD �2,960,688 15/1/2015 BNY�Mellon�Corp (93,276)USD� 236,546 SGD �308,359 15/1/2015 BNY�Mellon�Corp 3,642ZAR Class Hedges USD� 8,547,005 ZAR �97,371,722 15/1/2015 BNY�Mellon�Corp 150,618ZAR� 366,743,223 USD �32,513,481 15/1/2015 BNY�Mellon�Corp (889,811)
Total net unrealised depreciation (3,620,162)
Underlying exposure to forward foreign exchange contracts BNY�Mellon�Corp 104,961,869
Notes�to�the�Financial�Statements�for�the�year�ended�December�31,�2014�(continued)
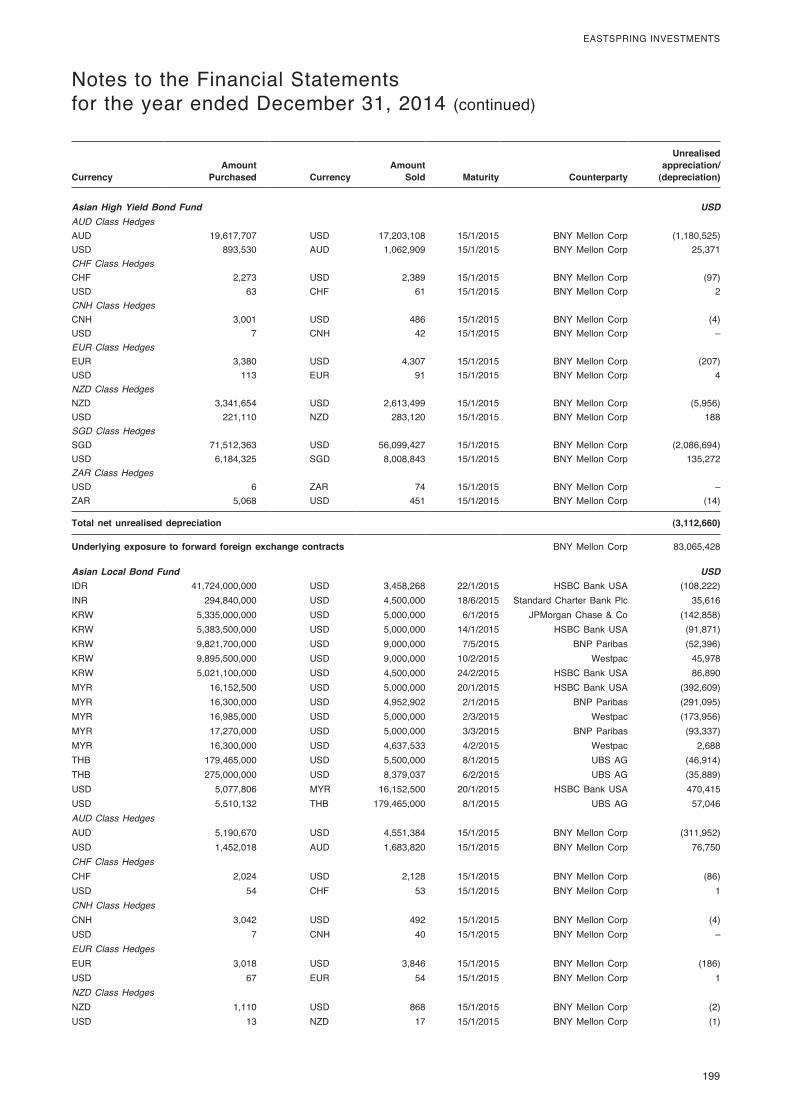
199
EASTSPRING�INVESTMENTS�
CurrencyAmount
Purchased CurrencyAmount
Sold Maturity Counterparty
Unrealisedappreciation/
(depreciation)
Asian High Yield Bond Fund USDAUD Class Hedges AUD� 19,617,707 USD �17,203,108 15/1/2015 BNY�Mellon�Corp (1,180,525)USD� 893,530 AUD �1,062,909 15/1/2015 BNY�Mellon�Corp 25,371CHF Class Hedges CHF� 2,273 USD �2,389 15/1/2015 BNY�Mellon�Corp (97)USD� 63 CHF �61 15/1/2015 BNY�Mellon�Corp 2CNH Class Hedges CNH� 3,001 USD �486 15/1/2015 BNY�Mellon�Corp (4)USD� 7 CNH �42 15/1/2015 BNY�Mellon�Corp –EUR Class Hedges EUR� 3,380 USD �4,307 15/1/2015 BNY�Mellon�Corp (207)USD� 113 EUR �91 15/1/2015 BNY�Mellon�Corp 4NZD Class Hedges NZD� 3,341,654 USD �2,613,499 15/1/2015 BNY�Mellon�Corp (5,956)USD� 221,110 NZD �283,120 15/1/2015 BNY�Mellon�Corp 188SGD Class Hedges SGD� 71,512,363 USD �56,099,427 15/1/2015 BNY�Mellon�Corp (2,086,694)USD� 6,184,325 SGD �8,008,843 15/1/2015 BNY�Mellon�Corp 135,272ZAR Class Hedges USD� 6 ZAR �74 15/1/2015 BNY�Mellon�Corp –ZAR� 5,068 USD �451 15/1/2015 BNY�Mellon�Corp (14)
Total net unrealised depreciation (3,112,660)
Underlying exposure to forward foreign exchange contracts BNY�Mellon�Corp 83,065,428
Asian Local Bond Fund USDIDR� 41,724,000,000 USD �3,458,268 22/1/2015 HSBC�Bank�USA (108,222)INR� 294,840,000 USD �4,500,000 18/6/2015 Standard�Charter�Bank�Plc 35,616KRW� 5,335,000,000 USD �5,000,000 6/1/2015 JPMorgan�Chase�&�Co (142,858)KRW� 5,383,500,000 USD �5,000,000 14/1/2015 HSBC�Bank�USA (91,871)KRW� 9,821,700,000 USD �9,000,000 7/5/2015 BNP�Paribas (52,396)KRW� 9,895,500,000 USD �9,000,000 10/2/2015 Westpac 45,978KRW� 5,021,100,000 USD �4,500,000 24/2/2015 HSBC�Bank�USA 86,890MYR� 16,152,500 USD �5,000,000 20/1/2015 HSBC�Bank�USA (392,609)MYR� 16,300,000 USD �4,952,902 2/1/2015 BNP�Paribas (291,095)MYR� 16,985,000 USD �5,000,000 2/3/2015 Westpac (173,956)MYR� 17,270,000 USD �5,000,000 3/3/2015 BNP�Paribas (93,337)MYR� 16,300,000 USD �4,637,533 4/2/2015 Westpac 2,688THB� 179,465,000 USD �5,500,000 8/1/2015 UBS�AG (46,914)THB� 275,000,000 USD �8,379,037 6/2/2015 UBS�AG (35,889)USD� 5,077,806 MYR �16,152,500 20/1/2015 HSBC�Bank�USA 470,415USD� 5,510,132 THB �179,465,000 8/1/2015 UBS�AG 57,046AUD Class Hedges AUD� 5,190,670 USD �4,551,384 15/1/2015 BNY�Mellon�Corp (311,952)USD� 1,452,018 AUD �1,683,820 15/1/2015 BNY�Mellon�Corp 76,750CHF Class Hedges CHF� 2,024 USD �2,128 15/1/2015 BNY�Mellon�Corp (86)USD� 54 CHF �53 15/1/2015 BNY�Mellon�Corp 1CNH Class Hedges CNH� 3,042 USD �492 15/1/2015 BNY�Mellon�Corp (4)USD� 7 CNH �40 15/1/2015 BNY�Mellon�Corp –EUR Class Hedges EUR� 3,018 USD �3,846 15/1/2015 BNY�Mellon�Corp (186)USD� 67 EUR �54 15/1/2015 BNY�Mellon�Corp 1NZD Class Hedges NZD� 1,110 USD �868 15/1/2015 BNY�Mellon�Corp (2)USD� 13 NZD �17 15/1/2015 BNY�Mellon�Corp (1)
Notes�to�the�Financial�Statements�for�the�year�ended�December�31,�2014�(continued)
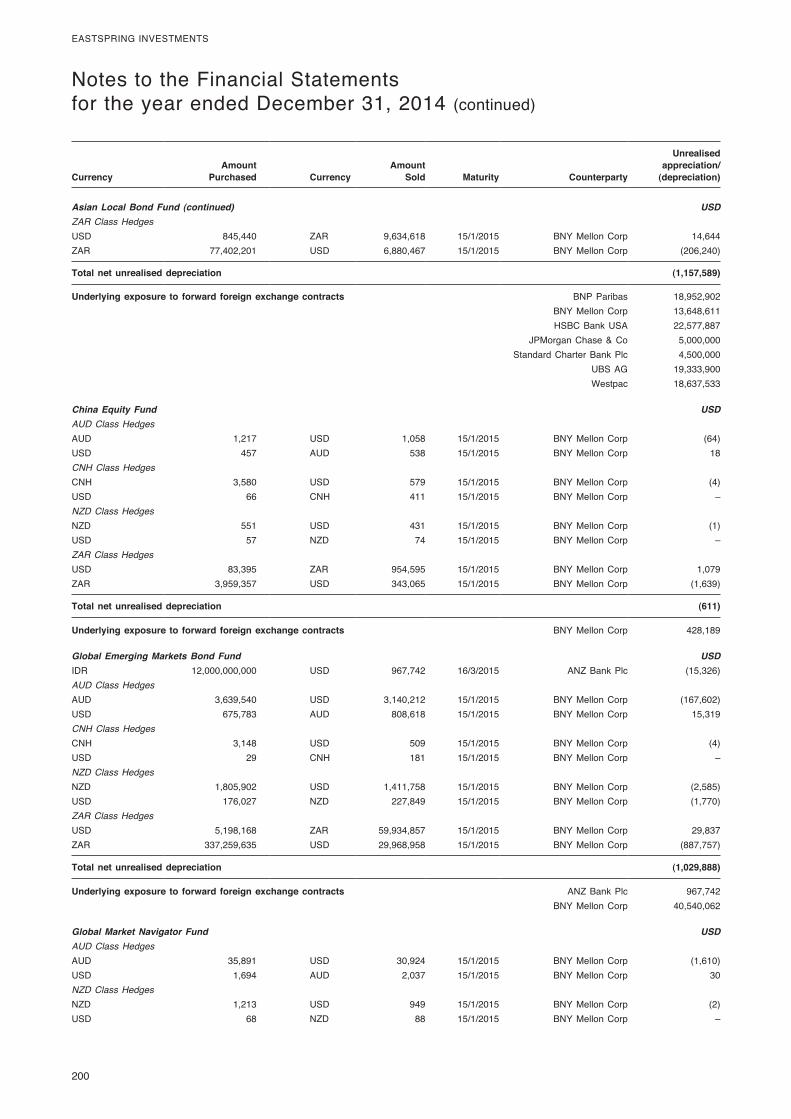
200
EASTSPRING�INVESTMENTS
Notes�to�the�Financial�Statements�for�the�year�ended�December�31,�2014�(continued)
CurrencyAmount
Purchased CurrencyAmount
Sold Maturity Counterparty
Unrealisedappreciation/
(depreciation)
Asian Local Bond Fund (continued) USDZAR Class Hedges USD� 845,440 ZAR �9,634,618 15/1/2015 BNY�Mellon�Corp 14,644ZAR� 77,402,201 USD �6,880,467 15/1/2015 BNY�Mellon�Corp (206,240)
Total net unrealised depreciation (1,157,589)
Underlying exposure to forward foreign exchange contracts BNP�Paribas 18,952,902BNY�Mellon�Corp 13,648,611HSBC�Bank�USA 22,577,887
JPMorgan�Chase�&�Co 5,000,000Standard�Charter�Bank�Plc 4,500,000
UBS�AG 19,333,900Westpac 18,637,533
China Equity Fund USDAUD Class Hedges AUD� 1,217 USD �1,058 15/1/2015 BNY�Mellon�Corp (64)USD� 457 AUD �538 15/1/2015 BNY�Mellon�Corp 18CNH Class Hedges CNH� 3,580 USD �579 15/1/2015 BNY�Mellon�Corp (4)USD� 66 CNH �411 15/1/2015 BNY�Mellon�Corp –NZD Class Hedges NZD� 551 USD �431 15/1/2015 BNY�Mellon�Corp (1)USD� 57 NZD �74 15/1/2015 BNY�Mellon�Corp –ZAR Class Hedges USD� 83,395 ZAR �954,595 15/1/2015 BNY�Mellon�Corp 1,079ZAR� 3,959,357 USD �343,065 15/1/2015 BNY�Mellon�Corp (1,639)
Total net unrealised depreciation (611)
Underlying exposure to forward foreign exchange contracts BNY�Mellon�Corp 428,189
Global Emerging Markets Bond Fund USDIDR� 12,000,000,000 USD �967,742 16/3/2015 ANZ�Bank�Plc (15,326)AUD Class Hedges AUD� 3,639,540 USD �3,140,212 15/1/2015 BNY�Mellon�Corp (167,602)USD� 675,783 AUD �808,618 15/1/2015 BNY�Mellon�Corp 15,319CNH Class Hedges CNH� 3,148 USD �509 15/1/2015 BNY�Mellon�Corp (4)USD� 29 CNH �181 15/1/2015 BNY�Mellon�Corp –NZD Class Hedges NZD� 1,805,902 USD �1,411,758 15/1/2015 BNY�Mellon�Corp (2,585)USD� 176,027 NZD �227,849 15/1/2015 BNY�Mellon�Corp (1,770)ZAR Class Hedges USD� 5,198,168 ZAR �59,934,857 15/1/2015 BNY�Mellon�Corp 29,837ZAR� 337,259,635 USD �29,968,958 15/1/2015 BNY�Mellon�Corp (887,757)
Total net unrealised depreciation (1,029,888)
Underlying exposure to forward foreign exchange contracts ANZ�Bank�Plc 967,742BNY�Mellon�Corp 40,540,062
Global Market Navigator Fund USDAUD Class Hedges AUD� 35,891 USD �30,924 15/1/2015 BNY�Mellon�Corp (1,610)USD� 1,694 AUD �2,037 15/1/2015 BNY�Mellon�Corp 30NZD Class Hedges NZD� 1,213 USD �949 15/1/2015 BNY�Mellon�Corp (2)USD� 68 NZD �88 15/1/2015 BNY�Mellon�Corp –
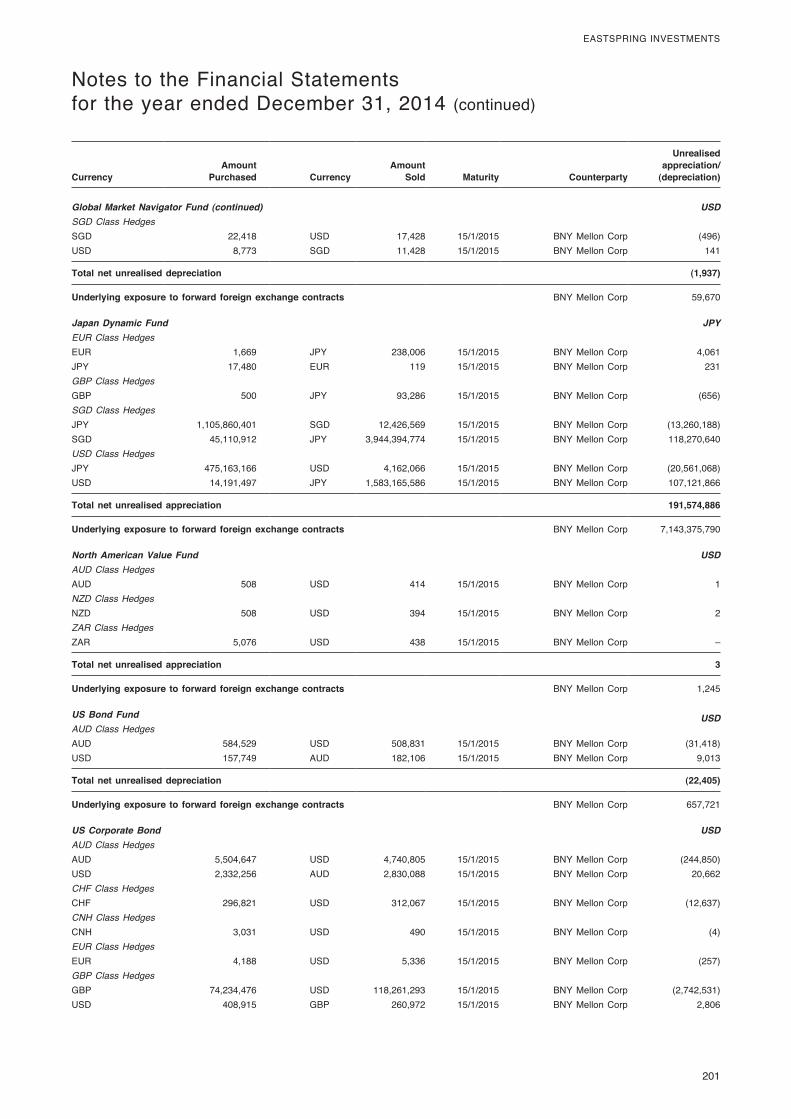
201
EASTSPRING�INVESTMENTS�
Notes�to�the�Financial�Statements�for�the�year�ended�December�31,�2014�(continued)
CurrencyAmount
Purchased CurrencyAmount
Sold Maturity Counterparty
Unrealisedappreciation/
(depreciation)
Global Market Navigator Fund (continued) USDSGD Class Hedges SGD� 22,418 USD �17,428 15/1/2015 BNY�Mellon�Corp (496)USD� 8,773 SGD �11,428 15/1/2015 BNY�Mellon�Corp 141
Total net unrealised depreciation (1,937)
Underlying exposure to forward foreign exchange contracts BNY�Mellon�Corp 59,670
Japan Dynamic Fund JPYEUR Class Hedges EUR� 1,669 JPY �238,006 15/1/2015 BNY�Mellon�Corp 4,061JPY� 17,480 EUR �119 15/1/2015 BNY�Mellon�Corp 231GBP Class Hedges GBP� 500 JPY �93,286 15/1/2015 BNY�Mellon�Corp (656)SGD Class Hedges JPY� 1,105,860,401 SGD �12,426,569 15/1/2015 BNY�Mellon�Corp (13,260,188)SGD� 45,110,912 JPY �3,944,394,774 15/1/2015 BNY�Mellon�Corp 118,270,640USD Class Hedges JPY� 475,163,166 USD �4,162,066 15/1/2015 BNY�Mellon�Corp (20,561,068)USD� 14,191,497 JPY �1,583,165,586 15/1/2015 BNY�Mellon�Corp 107,121,866
Total net unrealised appreciation 191,574,886
Underlying exposure to forward foreign exchange contracts BNY�Mellon�Corp 7,143,375,790
North American Value Fund USDAUD Class Hedges AUD� 508 USD �414 15/1/2015 BNY�Mellon�Corp 1NZD Class Hedges NZD� 508 USD �394 15/1/2015 BNY�Mellon�Corp 2ZAR Class Hedges ZAR� 5,076 USD �438 15/1/2015 BNY�Mellon�Corp –
Total net unrealised appreciation 3
Underlying exposure to forward foreign exchange contracts BNY�Mellon�Corp 1,245
US Bond Fund USDAUD Class Hedges AUD� 584,529 USD �508,831 15/1/2015 BNY�Mellon�Corp (31,418)USD� 157,749 AUD �182,106 15/1/2015 BNY�Mellon�Corp 9,013
Total net unrealised depreciation (22,405)
Underlying exposure to forward foreign exchange contracts BNY�Mellon�Corp 657,721
US Corporate Bond USDAUD Class Hedges AUD� 5,504,647 USD �4,740,805 15/1/2015 BNY�Mellon�Corp (244,850)USD� 2,332,256 AUD �2,830,088 15/1/2015 BNY�Mellon�Corp 20,662CHF Class Hedges CHF� 296,821 USD �312,067 15/1/2015 BNY�Mellon�Corp (12,637)CNH Class Hedges CNH� 3,031 USD �490 15/1/2015 BNY�Mellon�Corp (4)EUR Class Hedges EUR� 4,188 USD �5,336 15/1/2015 BNY�Mellon�Corp (257)GBP Class Hedges GBP� 74,234,476 USD �118,261,293 15/1/2015 BNY�Mellon�Corp (2,742,531)USD� 408,915 GBP �260,972 15/1/2015 BNY�Mellon�Corp 2,806
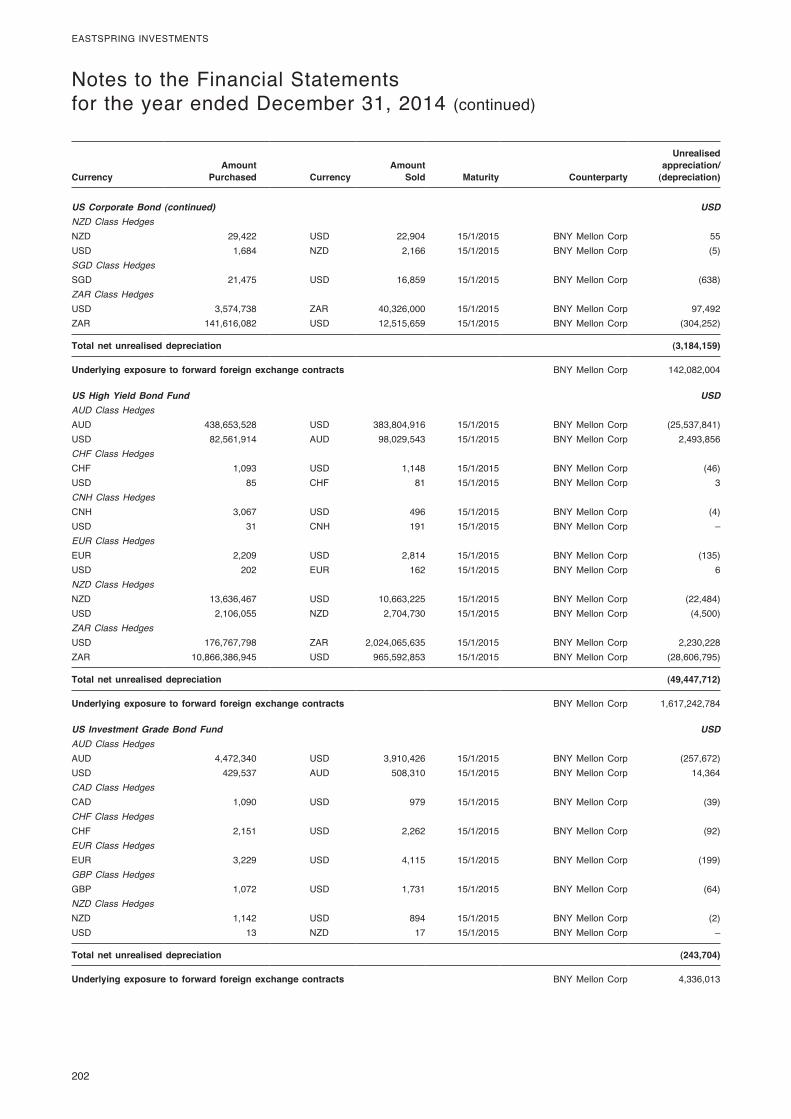
202
EASTSPRING�INVESTMENTS
Notes�to�the�Financial�Statements�for�the�year�ended�December�31,�2014�(continued)
CurrencyAmount
Purchased CurrencyAmount
Sold Maturity Counterparty
Unrealisedappreciation/
(depreciation)
US Corporate Bond (continued) USDNZD Class Hedges NZD� 29,422 USD �22,904 15/1/2015 BNY�Mellon�Corp 55USD� 1,684 NZD �2,166 15/1/2015 BNY�Mellon�Corp (5)SGD Class Hedges SGD� 21,475 USD �16,859 15/1/2015 BNY�Mellon�Corp (638)ZAR Class Hedges USD� 3,574,738 ZAR �40,326,000 15/1/2015 BNY�Mellon�Corp 97,492ZAR� 141,616,082 USD �12,515,659 15/1/2015 BNY�Mellon�Corp (304,252)
Total net unrealised depreciation (3,184,159)
Underlying exposure to forward foreign exchange contracts BNY�Mellon�Corp 142,082,004
US High Yield Bond Fund USDAUD Class Hedges AUD� 438,653,528 USD �383,804,916 15/1/2015 BNY�Mellon�Corp (25,537,841)USD� 82,561,914 AUD �98,029,543 15/1/2015 BNY�Mellon�Corp 2,493,856CHF Class Hedges CHF� 1,093 USD �1,148 15/1/2015 BNY�Mellon�Corp (46)USD� 85 CHF �81 15/1/2015 BNY�Mellon�Corp 3CNH Class Hedges CNH� 3,067 USD �496 15/1/2015 BNY�Mellon�Corp (4)USD� 31 CNH �191 15/1/2015 BNY�Mellon�Corp –EUR Class Hedges EUR� 2,209 USD �2,814 15/1/2015 BNY�Mellon�Corp (135)USD� 202 EUR �162 15/1/2015 BNY�Mellon�Corp 6NZD Class Hedges NZD� 13,636,467 USD �10,663,225 15/1/2015 BNY�Mellon�Corp (22,484)USD� 2,106,055 NZD �2,704,730 15/1/2015 BNY�Mellon�Corp (4,500)ZAR Class Hedges USD� 176,767,798 ZAR �2,024,065,635 15/1/2015 BNY�Mellon�Corp 2,230,228ZAR� 10,866,386,945 USD �965,592,853 15/1/2015 BNY�Mellon�Corp (28,606,795)
Total net unrealised depreciation (49,447,712)
Underlying exposure to forward foreign exchange contracts BNY�Mellon�Corp 1,617,242,784
US Investment Grade Bond Fund USDAUD Class Hedges AUD� 4,472,340 USD �3,910,426 15/1/2015 BNY�Mellon�Corp (257,672)USD� 429,537 AUD �508,310 15/1/2015 BNY�Mellon�Corp 14,364CAD Class Hedges CAD� 1,090 USD �979 15/1/2015 BNY�Mellon�Corp (39)CHF Class Hedges CHF� 2,151 USD �2,262 15/1/2015 BNY�Mellon�Corp (92)EUR Class Hedges EUR� 3,229 USD �4,115 15/1/2015 BNY�Mellon�Corp (199)GBP Class Hedges GBP� 1,072 USD �1,731 15/1/2015 BNY�Mellon�Corp (64)NZD Class Hedges NZD� 1,142 USD �894 15/1/2015 BNY�Mellon�Corp (2)USD� 13 NZD �17 15/1/2015 BNY�Mellon�Corp –
Total net unrealised depreciation (243,704)
Underlying exposure to forward foreign exchange contracts BNY�Mellon�Corp 4,336,013
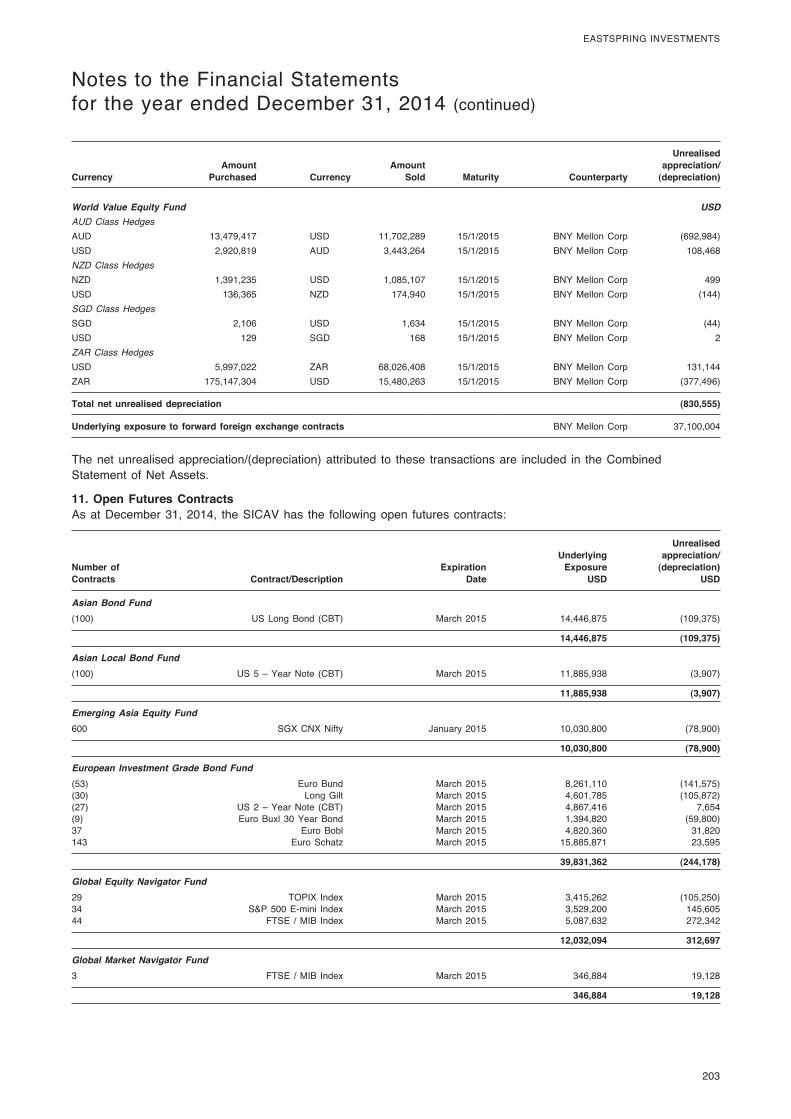
203
EASTSPRING�INVESTMENTS�
Notes�to�the�Financial�Statements�for�the�year�ended�December�31,�2014�(continued)
CurrencyAmount
Purchased CurrencyAmount
Sold Maturity Counterparty
Unrealisedappreciation/
(depreciation)
World Value Equity Fund USDAUD Class Hedges AUD� 13,479,417 USD �11,702,289 15/1/2015 BNY�Mellon�Corp (692,984)USD� 2,920,819 AUD �3,443,264 15/1/2015 BNY�Mellon�Corp 108,468NZD Class Hedges NZD� 1,391,235 USD �1,085,107 15/1/2015 BNY�Mellon�Corp 499USD� 136,365 NZD �174,940 15/1/2015 BNY�Mellon�Corp (144)SGD Class Hedges SGD� 2,106 USD �1,634 15/1/2015 BNY�Mellon�Corp (44)USD� 129 SGD �168 15/1/2015 BNY�Mellon�Corp 2ZAR Class Hedges USD� 5,997,022 ZAR �68,026,408 15/1/2015 BNY�Mellon�Corp 131,144ZAR� 175,147,304 USD �15,480,263 15/1/2015 BNY�Mellon�Corp (377,496)
Total net unrealised depreciation (830,555)
Underlying exposure to forward foreign exchange contracts BNY�Mellon�Corp 37,100,004
The�net�unrealised�appreciation/(depreciation)�attributed� to� these� transactions�are� included� in� the�Combined�Statement�of�Net�Assets.
11. Open Futures ContractsAs�at�December�31,�2014,� the�SICAV�has� the� following�open� futures�contracts:
Unrealised Underlying appreciation/Number of Expiration Exposure (depreciation)Contracts Contract/Description Date USD USD� � � �Asian Bond Fund (100)� US�Long�Bond� (CBT)� March�2015� 14,446,875� (109,375)
14,446,875 (109,375)
Asian Local Bond Fund (100)� US�5�–�Year�Note� (CBT)� March�2015� 11,885,938� (3,907)
11,885,938 (3,907)
Emerging Asia Equity Fund 600� SGX�CNX�Nifty� January�2015� 10,030,800� (78,900)
10,030,800 (78,900)
European Investment Grade Bond Fund (53)� Euro�Bund� March�2015� 8,261,110� (141,575)(30)� Long�Gilt� March�2015� 4,601,785� (105,872)(27)� US�2�–�Year�Note� (CBT)� March�2015� 4,867,416� 7,654(9)� Euro�Buxl�30�Year�Bond� March�2015� 1,394,820� (59,800)37� Euro�Bobl� March�2015� 4,820,360� 31,820143� Euro�Schatz� March�2015� 15,885,871� 23,595
39,831,362 (244,178)
Global Equity Navigator Fund 29� TOPIX� Index� March�2015� 3,415,262� (105,250)34� S&P�500�E-mini� Index� March�2015� 3,529,200� 145,60544� FTSE� /�MIB� Index� March�2015� 5,087,632� 272,342
12,032,094 312,697
Global Market Navigator Fund 3� FTSE� /�MIB� Index� March�2015� 346,884� 19,128
346,884 19,128
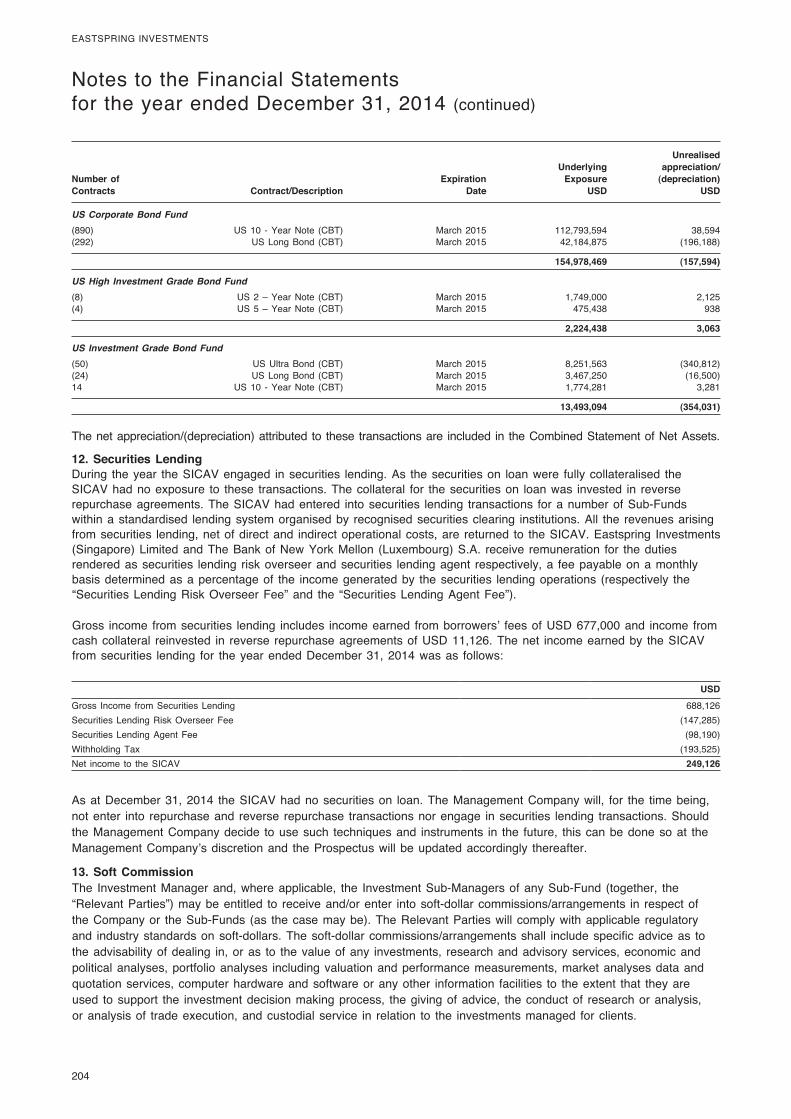
204
EASTSPRING�INVESTMENTS
Notes�to�the�Financial�Statements�for�the�year�ended�December�31,�2014�(continued)
Unrealised Underlying appreciation/Number of Expiration Exposure (depreciation)Contracts Contract/Description Date USD USD� � � �US Corporate Bond Fund (890)� US�10� -�Year�Note� (CBT)� March�2015� 112,793,594� 38,594(292)� US�Long�Bond� (CBT)� March�2015� 42,184,875� (196,188)
154,978,469 (157,594)
US High Investment Grade Bond Fund (8)� US�2�–�Year�Note� (CBT)� March�2015� 1,749,000� 2,125(4)� US�5�–�Year�Note� (CBT)� March�2015� 475,438� 938
2,224,438 3,063
US Investment Grade Bond Fund (50)� US�Ultra�Bond� (CBT)� March�2015� 8,251,563� (340,812)(24)� US�Long�Bond� (CBT)� March�2015� 3,467,250� (16,500)14� US�10� -�Year�Note� (CBT)� March�2015� 1,774,281� 3,281
13,493,094 (354,031)
The�net�appreciation/(depreciation)�attributed�to� these�transactions�are� included� in� the�Combined�Statement�of�Net�Assets.
12. Securities LendingDuring� the�year� the�SICAV�engaged� in�securities� lending.�As� the�securities�on� loan�were� fully�collateralised� the�SICAV�had�no�exposure� to� these� transactions.�The�collateral� for� the�securities�on� loan�was� invested� in� reverse�repurchase�agreements.�The�SICAV�had�entered� into�securities� lending� transactions� for�a�number�of�Sub-Funds�within�a�standardised� lending�system�organised�by� recognised�securities�clearing� institutions.�All� the� revenues�arising�from�securities� lending,�net�of�direct�and� indirect�operational�costs,�are� returned� to� the�SICAV.�Eastspring� Investments�(Singapore)�Limited�and�The�Bank�of�New�York�Mellon� (Luxembourg)�S.A.� receive� remuneration� for� the�duties�rendered�as�securities� lending� risk�overseer�and�securities� lending�agent� respectively,�a� fee�payable�on�a�monthly�basis�determined�as�a�percentage�of� the� income�generated�by� the�securities� lending�operations� (respectively� the�“Securities�Lending�Risk�Overseer�Fee”�and� the� “Securities�Lending�Agent�Fee”).
Gross� income� from�securities� lending� includes� income�earned� from�borrowers’� fees�of�USD�677,000�and� income� from�cash�collateral� reinvested� in� reverse� repurchase�agreements�of�USD�11,126.�The�net� income�earned�by� the�SICAV�from�securities� lending� for� the�year�ended�December�31,�2014�was�as� follows:
USDGross� Income� from�Securities�Lending 688,126Securities�Lending�Risk�Overseer�Fee (147,285)Securities�Lending�Agent�Fee (98,190)Withholding�Tax (193,525)Net� income� to� the�SICAV 249,126
As�at�December�31,�2014� the�SICAV�had�no�securities�on� loan.�The�Management�Company�will,� for� the� time�being,�not�enter� into� repurchase�and� reverse� repurchase� transactions�nor�engage� in�securities� lending� transactions.�Should�the�Management�Company�decide� to�use�such� techniques�and� instruments� in� the� future,� this�can�be�done�so�at� the�Management�Company’s�discretion�and� the�Prospectus�will�be�updated�accordingly� thereafter.
13. Soft CommissionThe� Investment�Manager�and,�where�applicable,� the� Investment�Sub-Managers�of�any�Sub-Fund� (together,� the�“Relevant�Parties”)�may�be�entitled� to� receive�and/or�enter� into�soft-dollar�commissions/arrangements� in� respect�of�the�Company�or� the�Sub-Funds� (as� the�case�may�be).�The�Relevant�Parties�will�comply�with�applicable� regulatory�and� industry�standards�on�soft-dollars.�The�soft-dollar�commissions/arrangements�shall� include�specific�advice�as� to�the�advisability�of�dealing� in,�or�as� to� the�value�of�any� investments,� research�and�advisory�services,�economic�and�political�analyses,�portfolio�analyses� including�valuation�and�performance�measurements,�market�analyses�data�and�quotation�services,�computer�hardware�and�software�or�any�other� information� facilities� to� the�extent� that� they�are�used� to�support� the� investment�decision�making�process,� the�giving�of�advice,� the�conduct�of� research�or�analysis,�or�analysis�of� trade�execution,�and�custodial�service� in� relation� to� the� investments�managed� for�clients.
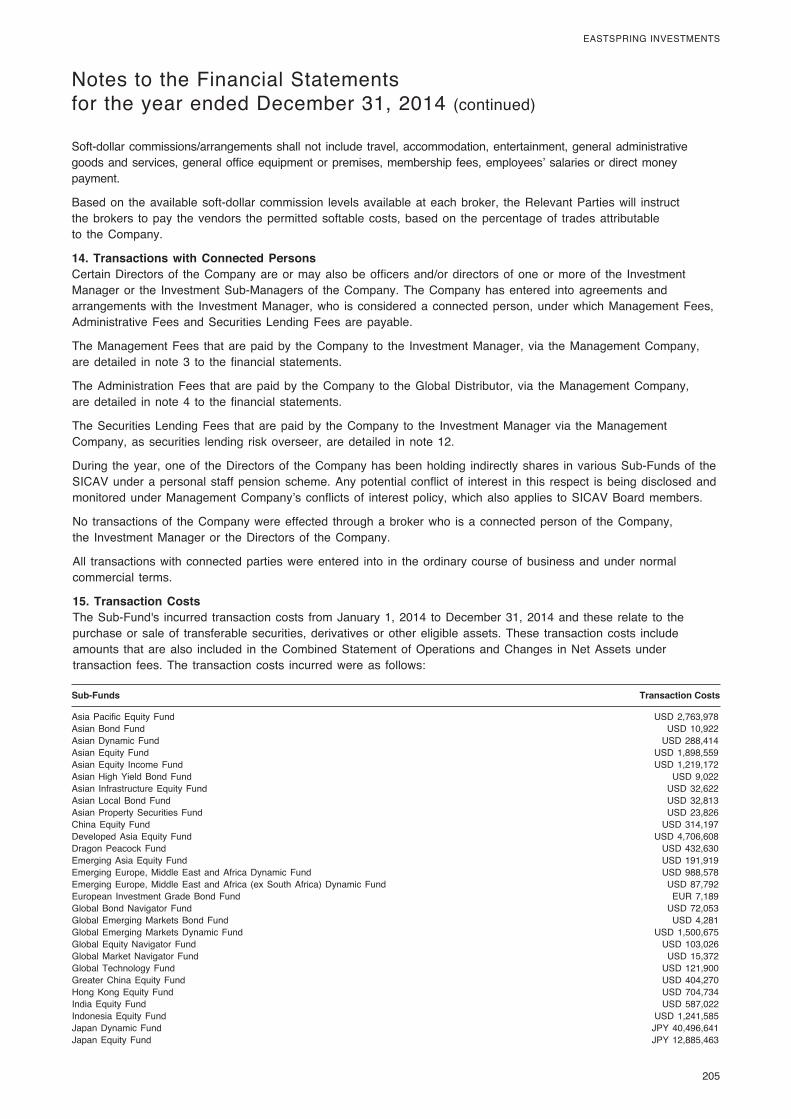
205
EASTSPRING�INVESTMENTS�
Notes�to�the�Financial�Statements�for�the�year�ended�December�31,�2014�(continued)
Soft-dollar�commissions/arrangements�shall�not� include�travel,�accommodation,�entertainment,�general�administrative�goods�and�services,�general�office�equipment�or�premises,�membership� fees,�employees’�salaries�or�direct�money�payment.
Based�on� the�available�soft-dollar�commission� levels�available�at�each�broker,� the�Relevant�Parties�will� instruct�the�brokers� to�pay� the�vendors� the�permitted�softable�costs,�based�on� the�percentage�of� trades�attributable�to� the�Company.
14. Transactions with Connected PersonsCertain�Directors�of� the�Company�are�or�may�also�be�officers�and/or�directors�of�one�or�more�of� the� Investment�Manager�or� the� Investment�Sub-Managers�of� the�Company.�The�Company�has�entered� into�agreements�and�arrangements�with� the� Investment�Manager,�who� is�considered�a�connected�person,�under�which�Management�Fees,�Administrative�Fees�and�Securities�Lending�Fees�are�payable.
The�Management�Fees� that�are�paid�by� the�Company� to� the� Investment�Manager,�via� the�Management�Company,�are�detailed� in�note�3� to� the� financial�statements.
The�Administration�Fees� that�are�paid�by� the�Company� to� the�Global�Distributor,�via� the�Management�Company,�are�detailed� in�note�4� to� the� financial�statements.
The�Securities�Lending�Fees� that�are�paid�by� the�Company� to� the� Investment�Manager�via� the�Management�Company,�as�securities� lending� risk�overseer,�are�detailed� in�note�12.�
During� the�year,�one�of� the�Directors�of� the�Company�has�been�holding� indirectly�shares� in�various�Sub-Funds�of� the�SICAV�under�a�personal�staff�pension�scheme.�Any�potential�conflict�of� interest� in� this� respect� is�being�disclosed�and�monitored�under�Management�Company’s�conflicts�of� interest�policy,�which�also�applies� to�SICAV�Board�members.�
No� transactions�of� the�Company�were�effected� through�a�broker�who� is�a�connected�person�of� the�Company,�the� Investment�Manager�or� the�Directors�of� the�Company.
All� transactions�with�connected�parties�were�entered� into� in� the�ordinary�course�of�business�and�under�normal�commercial� terms.
15. Transaction CostsThe�Sub-Fund's� incurred� transaction�costs� from�January�1,�2014� to�December�31,�2014�and� these� relate� to� the�purchase�or�sale�of� transferable�securities,�derivatives�or�other�eligible�assets.�These� transaction�costs� include�amounts� that�are�also� included� in� the�Combined�Statement�of�Operations�and�Changes� in�Net�Assets�under�transaction� fees.�The� transaction�costs� incurred�were�as� follows:
Sub-Funds Transaction Costs
Asia�Pacific�Equity�Fund� USD�2,763,978Asian�Bond�Fund� USD�10,922Asian�Dynamic�Fund� USD�288,414Asian�Equity�Fund� USD�1,898,559Asian�Equity� Income�Fund� USD�1,219,172Asian�High�Yield�Bond�Fund� USD�9,022Asian� Infrastructure�Equity�Fund� USD�32,622Asian�Local�Bond�Fund� USD�32,813Asian�Property�Securities�Fund� USD�23,826China�Equity�Fund� USD�314,197Developed�Asia�Equity�Fund� USD�4,706,608Dragon�Peacock�Fund� USD�432,630Emerging�Asia�Equity�Fund� USD�191,919Emerging�Europe,�Middle�East�and�Africa�Dynamic�Fund� USD�988,578Emerging�Europe,�Middle�East�and�Africa� (ex�South�Africa)�Dynamic�Fund� USD�87,792European� Investment�Grade�Bond�Fund� EUR�7,189Global�Bond�Navigator�Fund� USD�72,053Global�Emerging�Markets�Bond�Fund� USD�4,281Global�Emerging�Markets�Dynamic�Fund� USD�1,500,675Global�Equity�Navigator�Fund� USD�103,026Global�Market�Navigator�Fund� USD�15,372Global�Technology�Fund� USD�121,900Greater�China�Equity�Fund� USD�404,270Hong�Kong�Equity�Fund� USD�704,734India�Equity�Fund� USD�587,022Indonesia�Equity�Fund� USD�1,241,585Japan�Dynamic�Fund� JPY�40,496,641Japan�Equity�Fund� JPY�12,885,463
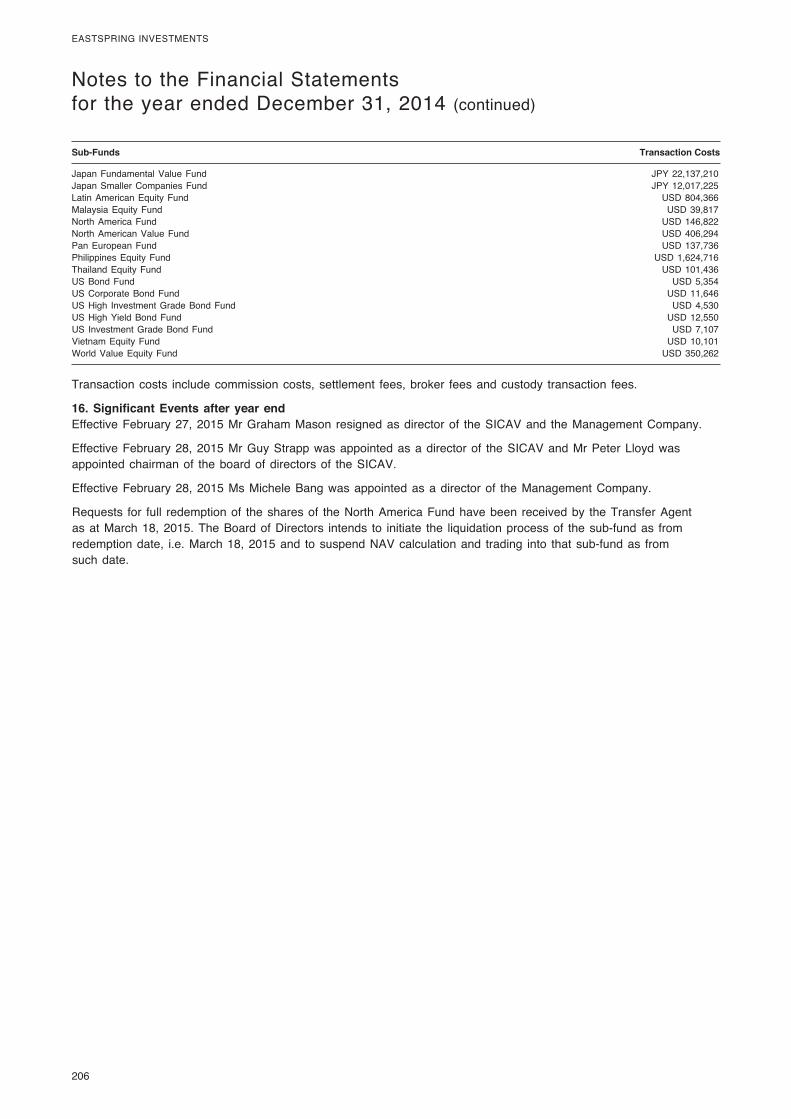
206
EASTSPRING�INVESTMENTS
Notes�to�the�Financial�Statements�for�the�year�ended�December�31,�2014�(continued)
Sub-Funds Transaction Costs
Japan�Fundamental�Value�Fund� JPY�22,137,210Japan�Smaller�Companies�Fund� JPY�12,017,225Latin�American�Equity�Fund� USD�804,366Malaysia�Equity�Fund� USD�39,817North�America�Fund� USD�146,822North�American�Value�Fund� USD�406,294Pan�European�Fund� USD�137,736Philippines�Equity�Fund� USD�1,624,716Thailand�Equity�Fund� USD�101,436US�Bond�Fund� USD�5,354US�Corporate�Bond�Fund� USD�11,646US�High� Investment�Grade�Bond�Fund� USD�4,530US�High�Yield�Bond�Fund� USD�12,550US�Investment�Grade�Bond�Fund� USD�7,107Vietnam�Equity�Fund� USD�10,101World�Value�Equity�Fund� USD�350,262
Transaction�costs� include�commission�costs,�settlement� fees,�broker� fees�and�custody� transaction� fees.
16. Significant Events after year endEffective�February�27,�2015�Mr�Graham�Mason� resigned�as�director�of� the�SICAV�and� the�Management�Company.
Effective�February�28,�2015�Mr�Guy�Strapp�was�appointed�as�a�director�of� the�SICAV�and�Mr�Peter�Lloyd�was�appointed�chairman�of� the�board�of�directors�of� the�SICAV.
Effective�February�28,�2015�Ms�Michele�Bang�was�appointed�as�a�director�of� the�Management�Company.�
Requests� for� full� redemption�of� the�shares�of� the�North�America�Fund�have�been� received�by� the�Transfer�Agent�as�at�March�18,�2015.�The�Board�of�Directors� intends� to� initiate� the� liquidation�process�of� the�sub-fund�as� from�redemption�date,� i.e.�March�18,�2015�and� to�suspend�NAV�calculation�and� trading� into� that�sub-fund�as� from�such�date.
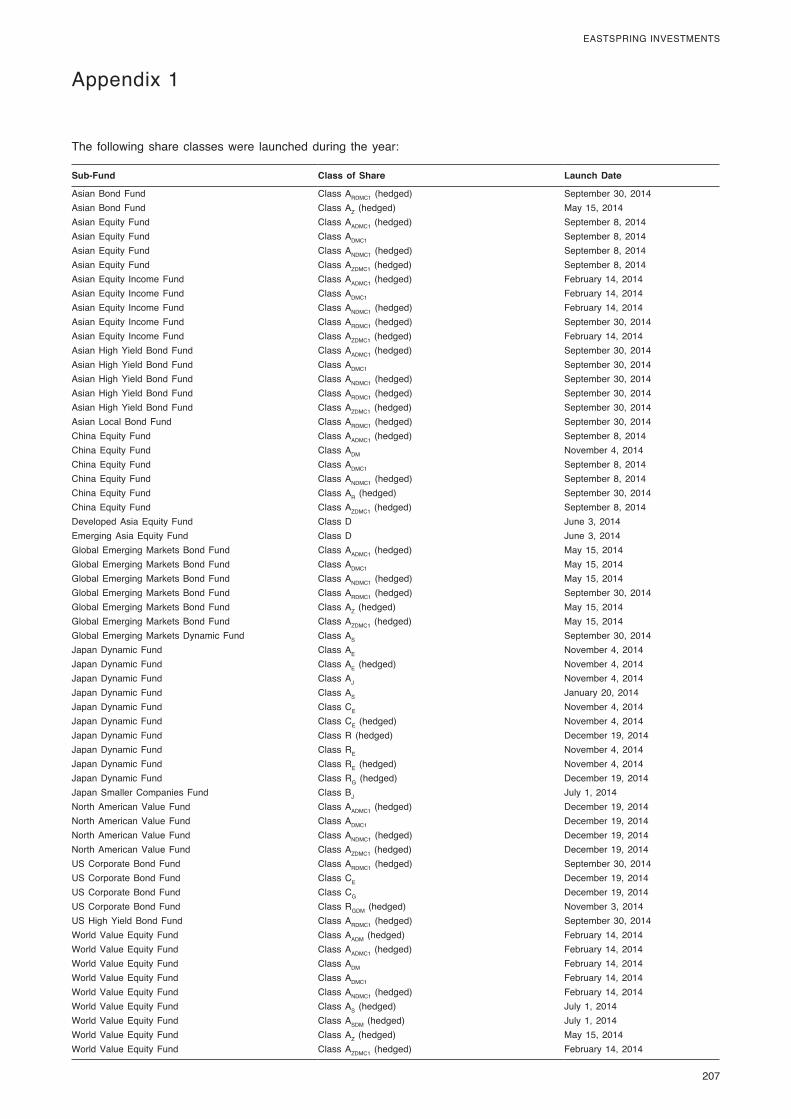
207
EASTSPRING�INVESTMENTS�
Appendix�1� �
The� following�share�classes�were� launched�during� the�year:
Sub-Fund Class of Share Launch Date
Asian�Bond�Fund Class�ARDMC1� (hedged) September�30,�2014Asian�Bond�Fund� Class�AZ� (hedged)� May�15,�2014Asian�Equity�Fund Class�AADMC1� (hedged) September�8,�2014Asian�Equity�Fund� Class�ADMC1� September�8,�2014Asian�Equity�Fund� Class�ANDMC1� (hedged) September�8,�2014Asian�Equity�Fund� Class�AZDMC1� (hedged) September�8,�2014Asian�Equity� Income�Fund� Class�AADMC1� (hedged) February�14,�2014Asian�Equity� Income�Fund� Class�ADMC1� February�14,�2014Asian�Equity� Income�Fund� Class�ANDMC1� (hedged) February�14,�2014Asian�Equity� Income�Fund� Class�ARDMC1� (hedged) September�30,�2014Asian�Equity� Income�Fund Class�AZDMC1� (hedged) February�14,�2014Asian�High�Yield�Bond�Fund Class�AADMC1� (hedged) September�30,�2014Asian�High�Yield�Bond�Fund Class�ADMC1 September�30,�2014�Asian�High�Yield�Bond�Fund� Class�ANDMC1� (hedged) September�30,�2014Asian�High�Yield�Bond�Fund� Class�ARDMC1� (hedged) September�30,�2014Asian�High�Yield�Bond�Fund� Class�AZDMC1� (hedged) September�30,�2014�Asian�Local�Bond�Fund Class�ARDMC1� (hedged) September�30,�2014China�Equity�Fund Class�AADMC1� (hedged) September�8,�2014China�Equity�Fund Class�ADM November�4,�2014China�Equity�Fund� Class�ADMC1 September�8,�2014�China�Equity�Fund� Class�ANDMC1� (hedged) September�8,�2014�China�Equity�Fund� Class�AR� (hedged) September�30,�2014China�Equity�Fund� Class�AZDMC1� (hedged) September�8,�2014Developed�Asia�Equity�Fund Class�D June�3,�2014Emerging�Asia�Equity�Fund Class�D June�3,�2014Global�Emerging�Markets�Bond�Fund� Class�AADMC1� (hedged) May�15,�2014Global�Emerging�Markets�Bond�Fund� Class�ADMC1� May�15,�2014Global�Emerging�Markets�Bond�Fund� Class�ANDMC1� (hedged) May�15,�2014Global�Emerging�Markets�Bond�Fund Class�ARDMC1� (hedged) September�30,�2014Global�Emerging�Markets�Bond�Fund� Class�AZ� (hedged)� May�15,�2014Global�Emerging�Markets�Bond�Fund� Class�AZDMC1� (hedged) May�15,�2014Global�Emerging�Markets�Dynamic�Fund Class�AS September�30,�2014�Japan�Dynamic�Fund Class�AE November�4,�2014Japan�Dynamic�Fund Class�AE� (hedged) November�4,�2014Japan�Dynamic�Fund Class�AJ November�4,�2014Japan�Dynamic�Fund Class�AS January�20,�2014Japan�Dynamic�Fund� Class�CE November�4,�2014�Japan�Dynamic�Fund Class�CE� (hedged) November�4,�2014Japan�Dynamic�Fund Class�R� (hedged) December�19,�2014Japan�Dynamic�Fund Class�RE November�4,�2014Japan�Dynamic�Fund Class�RE� (hedged) November�4,�2014Japan�Dynamic�Fund� Class�RG� (hedged) December�19,�2014Japan�Smaller�Companies�Fund Class�BJ July�1,�2014North�American�Value�Fund Class�AADMC1� (hedged) December�19,�2014North�American�Value�Fund Class�ADMC1 December�19,�2014North�American�Value�Fund Class�ANDMC1� (hedged) December�19,�2014North�American�Value�Fund� Class�AZDMC1� (hedged) December�19,�2014�US�Corporate�Bond�Fund Class�ARDMC1� (hedged) September�30,�2014�US�Corporate�Bond�Fund Class�CE December�19,�2014US�Corporate�Bond�Fund Class�CG December�19,�2014US�Corporate�Bond�Fund Class�RGDM� (hedged) November�3,�2014US�High�Yield�Bond�Fund Class�ARDMC1� (hedged) September�30,�2014World�Value�Equity�Fund� Class�AADM� (hedged) February�14,�2014World�Value�Equity�Fund� Class�AADMC1� (hedged) February�14,�2014World�Value�Equity�Fund� Class�ADM February�14,�2014World�Value�Equity�Fund� Class�ADMC1� February�14,�2014World�Value�Equity�Fund� Class�ANDMC1� (hedged) February�14,�2014World�Value�Equity�Fund� Class�AS� (hedged) July�1,�2014�World�Value�Equity�Fund Class�ASDM� (hedged) July�1,�2014World�Value�Equity�Fund� Class�AZ� (hedged) May�15,�2014World�Value�Equity�Fund� Class�AZDMC1� (hedged) February�14,�2014
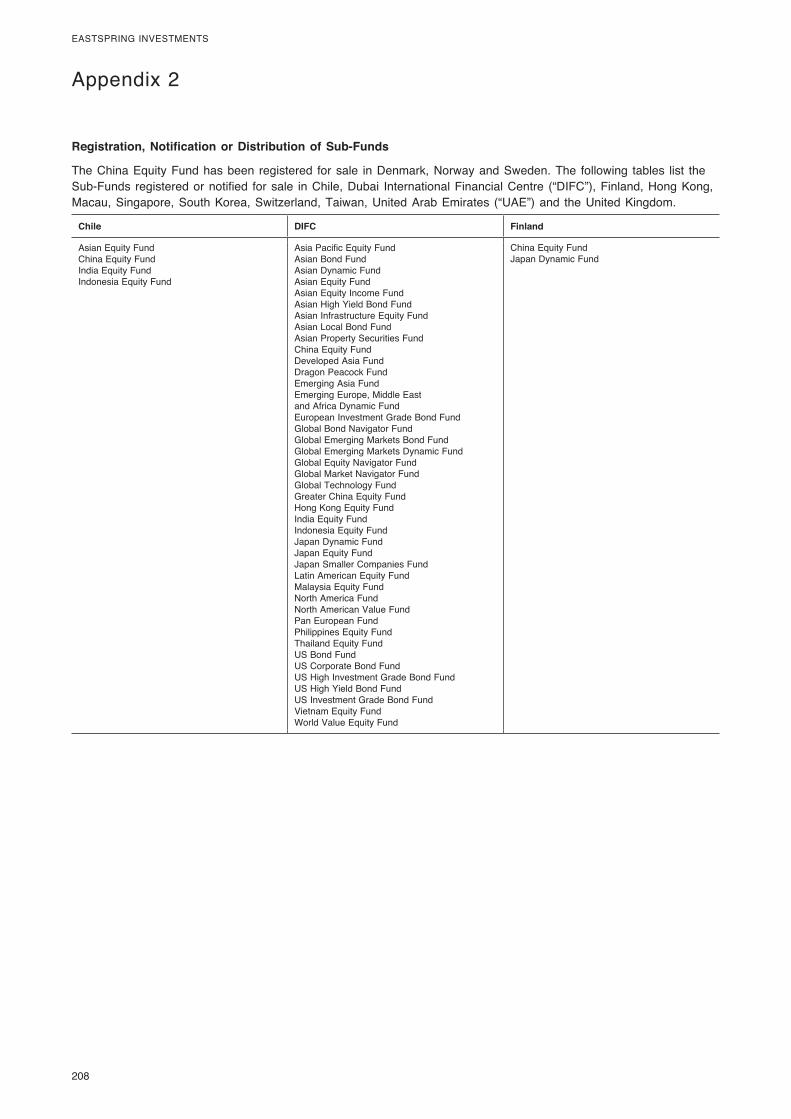
208
EASTSPRING�INVESTMENTS
Appendix�2�
Registration, Notification or Distribution of Sub-Funds
The�China�Equity�Fund�has�been� registered� for�sale� in�Denmark,�Norway�and�Sweden.�The� following� tables� list� the�Sub-Funds� registered�or�notified� for�sale� in�Chile,�Dubai� International�Financial�Centre� (“DIFC”),�Finland,�Hong�Kong,�Macau,�Singapore,�South�Korea,�Switzerland,�Taiwan,�United�Arab�Emirates� (“UAE”)�and� the�United�Kingdom.
Chile DIFC Finland
Asian�Equity�FundChina�Equity�FundIndia�Equity�FundIndonesia�Equity�Fund
Asia�Pacific�Equity�FundAsian�Bond�FundAsian�Dynamic�FundAsian�Equity�FundAsian�Equity�Income�FundAsian�High�Yield�Bond�FundAsian�Infrastructure�Equity�FundAsian�Local�Bond�FundAsian�Property�Securities�FundChina�Equity�FundDeveloped�Asia�FundDragon�Peacock�FundEmerging�Asia�FundEmerging�Europe,�Middle�Eastand�Africa�Dynamic�FundEuropean�Investment�Grade�Bond�FundGlobal�Bond�Navigator�FundGlobal�Emerging�Markets�Bond�FundGlobal�Emerging�Markets�Dynamic�FundGlobal�Equity�Navigator�FundGlobal�Market�Navigator�FundGlobal�Technology�FundGreater�China�Equity�FundHong�Kong�Equity�FundIndia�Equity�FundIndonesia�Equity�FundJapan�Dynamic�FundJapan�Equity�FundJapan�Smaller�Companies�FundLatin�American�Equity�FundMalaysia�Equity�FundNorth�America�FundNorth�American�Value�FundPan�European�FundPhilippines�Equity�FundThailand�Equity�FundUS�Bond�FundUS�Corporate�Bond�FundUS�High�Investment�Grade�Bond�FundUS�High�Yield�Bond�FundUS�Investment�Grade�Bond�FundVietnam�Equity�FundWorld�Value�Equity�Fund
China�Equity�FundJapan�Dynamic�Fund
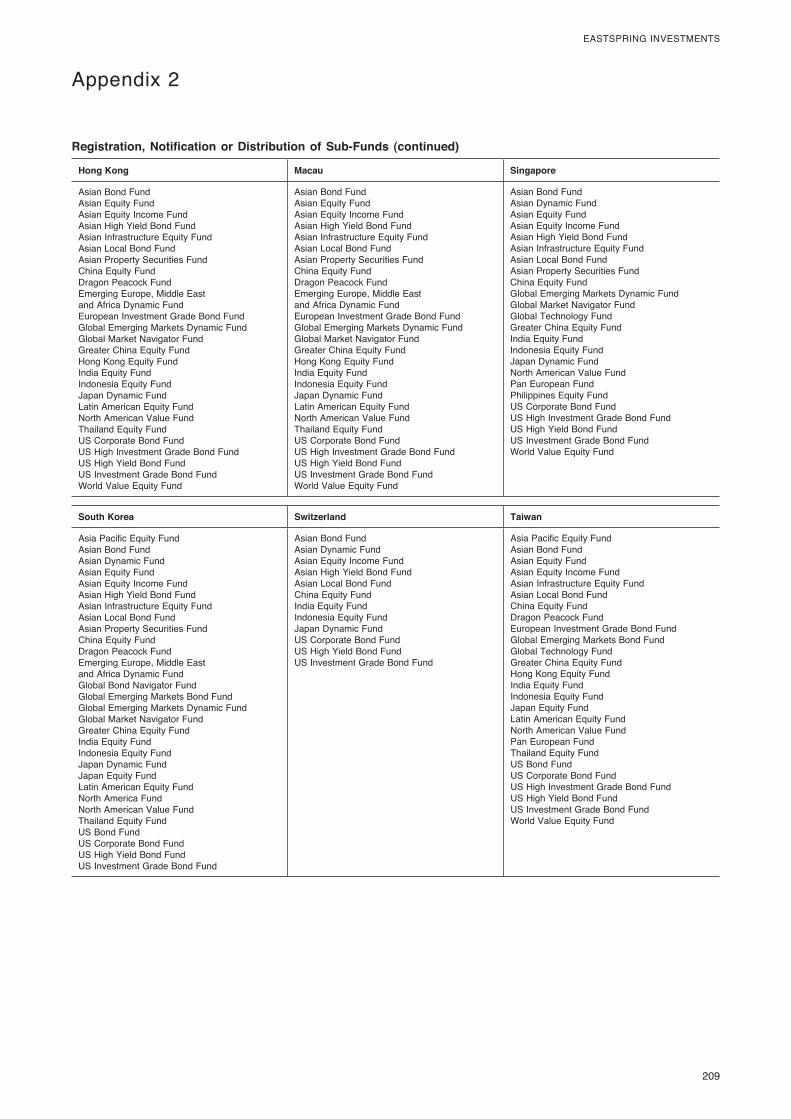
209
EASTSPRING�INVESTMENTS�
Appendix�2�
Registration, Notification or Distribution of Sub-Funds (continued)
Hong Kong Macau Singapore
Asian�Bond�FundAsian�Equity�FundAsian�Equity�Income�FundAsian�High�Yield�Bond�FundAsian�Infrastructure�Equity�FundAsian�Local�Bond�FundAsian�Property�Securities�FundChina�Equity�FundDragon�Peacock�FundEmerging�Europe,�Middle�Eastand�Africa�Dynamic�FundEuropean�Investment�Grade�Bond�FundGlobal�Emerging�Markets�Dynamic�FundGlobal�Market�Navigator�FundGreater�China�Equity�FundHong�Kong�Equity�FundIndia�Equity�FundIndonesia�Equity�FundJapan�Dynamic�FundLatin�American�Equity�FundNorth�American�Value�FundThailand�Equity�FundUS�Corporate�Bond�FundUS�High�Investment�Grade�Bond�FundUS�High�Yield�Bond�FundUS�Investment�Grade�Bond�FundWorld�Value�Equity�Fund
Asian�Bond�FundAsian�Equity�FundAsian�Equity�Income�FundAsian�High�Yield�Bond�FundAsian�Infrastructure�Equity�FundAsian�Local�Bond�FundAsian�Property�Securities�FundChina�Equity�FundDragon�Peacock�FundEmerging�Europe,�Middle�Eastand�Africa�Dynamic�FundEuropean�Investment�Grade�Bond�FundGlobal�Emerging�Markets�Dynamic�FundGlobal�Market�Navigator�FundGreater�China�Equity�FundHong�Kong�Equity�FundIndia�Equity�FundIndonesia�Equity�FundJapan�Dynamic�FundLatin�American�Equity�FundNorth�American�Value�FundThailand�Equity�FundUS�Corporate�Bond�FundUS�High�Investment�Grade�Bond�FundUS�High�Yield�Bond�FundUS�Investment�Grade�Bond�FundWorld�Value�Equity�Fund
Asian�Bond�FundAsian�Dynamic�FundAsian�Equity�FundAsian�Equity�Income�FundAsian�High�Yield�Bond�FundAsian�Infrastructure�Equity�FundAsian�Local�Bond�FundAsian�Property�Securities�FundChina�Equity�FundGlobal�Emerging�Markets�Dynamic�FundGlobal�Market�Navigator�FundGlobal�Technology�FundGreater�China�Equity�FundIndia�Equity�FundIndonesia�Equity�FundJapan�Dynamic�FundNorth�American�Value�FundPan�European�FundPhilippines�Equity�FundUS�Corporate�Bond�FundUS�High�Investment�Grade�Bond�FundUS�High�Yield�Bond�FundUS�Investment�Grade�Bond�FundWorld�Value�Equity�Fund
South Korea Switzerland Taiwan
Asia�Pacific�Equity�FundAsian�Bond�FundAsian�Dynamic�FundAsian�Equity�FundAsian�Equity�Income�FundAsian�High�Yield�Bond�FundAsian�Infrastructure�Equity�FundAsian�Local�Bond�FundAsian�Property�Securities�FundChina�Equity�FundDragon�Peacock�FundEmerging�Europe,�Middle�Eastand�Africa�Dynamic�FundGlobal�Bond�Navigator�FundGlobal�Emerging�Markets�Bond�FundGlobal�Emerging�Markets�Dynamic�FundGlobal�Market�Navigator�FundGreater�China�Equity�FundIndia�Equity�FundIndonesia�Equity�FundJapan�Dynamic�FundJapan�Equity�FundLatin�American�Equity�FundNorth�America�FundNorth�American�Value�FundThailand�Equity�FundUS�Bond�FundUS�Corporate�Bond�FundUS�High�Yield�Bond�FundUS�Investment�Grade�Bond�Fund
Asian�Bond�FundAsian�Dynamic�FundAsian�Equity�Income�FundAsian�High�Yield�Bond�FundAsian�Local�Bond�FundChina�Equity�FundIndia�Equity�FundIndonesia�Equity�FundJapan�Dynamic�FundUS�Corporate�Bond�FundUS�High�Yield�Bond�FundUS�Investment�Grade�Bond�Fund
Asia�Pacific�Equity�FundAsian�Bond�FundAsian�Equity�FundAsian�Equity�Income�FundAsian�Infrastructure�Equity�FundAsian�Local�Bond�FundChina�Equity�FundDragon�Peacock�FundEuropean�Investment�Grade�Bond�FundGlobal�Emerging�Markets�Bond�FundGlobal�Technology�FundGreater�China�Equity�FundHong�Kong�Equity�FundIndia�Equity�FundIndonesia�Equity�FundJapan�Equity�FundLatin�American�Equity�FundNorth�American�Value�FundPan�European�FundThailand�Equity�FundUS�Bond�FundUS�Corporate�Bond�FundUS�High�Investment�Grade�Bond�FundUS�High�Yield�Bond�FundUS�Investment�Grade�Bond�FundWorld�Value�Equity�Fund
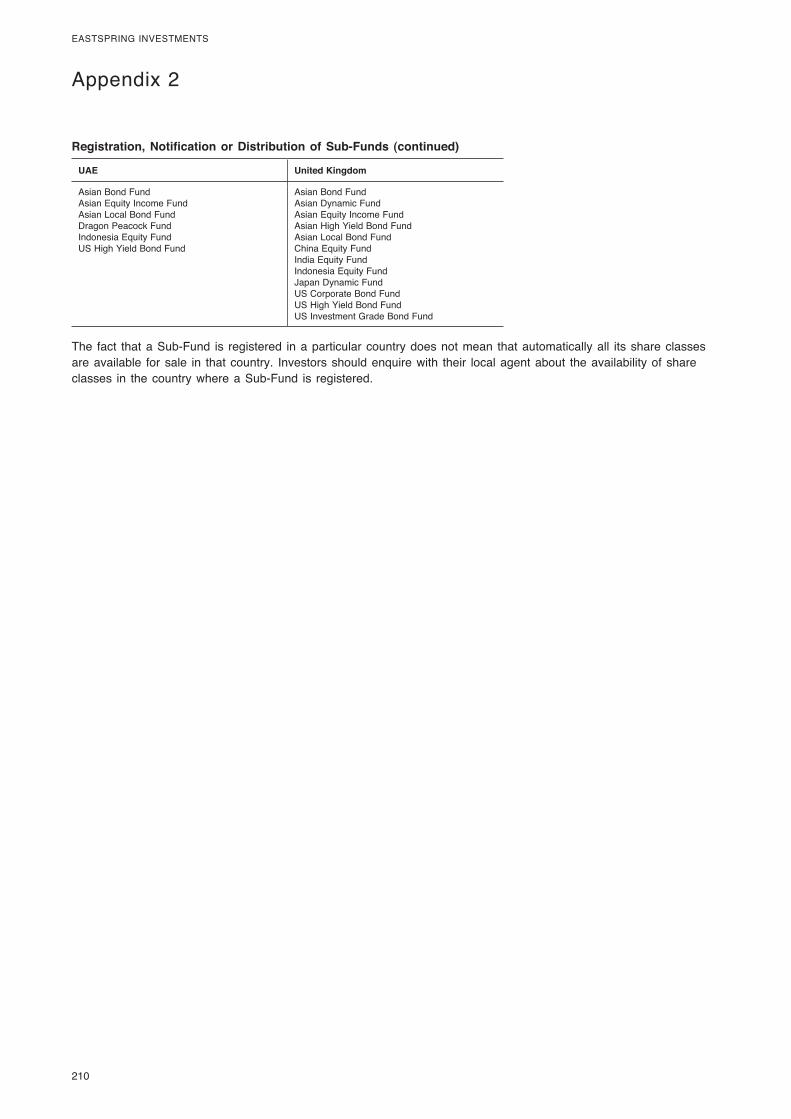
210
EASTSPRING�INVESTMENTS
Registration, Notification or Distribution of Sub-Funds (continued)
UAE United Kingdom
Asian�Bond�FundAsian�Equity�Income�FundAsian�Local�Bond�FundDragon�Peacock�FundIndonesia�Equity�FundUS�High�Yield�Bond�Fund
Asian�Bond�FundAsian�Dynamic�FundAsian�Equity�Income�FundAsian�High�Yield�Bond�FundAsian�Local�Bond�FundChina�Equity�FundIndia�Equity�FundIndonesia�Equity�FundJapan�Dynamic�FundUS�Corporate�Bond�FundUS�High�Yield�Bond�FundUS�Investment�Grade�Bond�Fund
The� fact� that�a�Sub-Fund� is� registered� in�a�particular�country�does�not�mean� that�automatically�all� its�share�classes�are�available� for�sale� in� that�country.� Investors�should�enquire�with� their� local�agent�about� the�availability�of�share�classes� in� the�country�where�a�Sub-Fund� is� registered.
Appendix�2�


