Embed Size (px)
Citation preview

1
Published in: Mann, S. (ed.), Sectors Matter - Exploring Mesoeconomics,
Springer, Heidelberg, Dordrecht, London, New York, 2011, 55-102
Economic Growth Through
The Emergence Of New Sectors Andreas Pyka, University of Hohenheim, Economics Institut, , D-70593 Stuttgart, Germany.
Pier Paolo Saviotti, UMR GAEL, Université Pierre Mendès-France, PO Box 47, F-38040
Grenoble, Cedex 9 , France, and CNRS GREDEG, Sophia Antipolis, France.
SEPTEMBER 2010
Abstract:
The basic theme underlying this chapter is the qualitative change taking place during
economic development. Qualitative change is represented by the emergence of new entities,
qualitatively different from those that preceded them. Qualitative change gives rise to changes
in the composition of the system. In turn, these changes in composition amount to something
very similar to structural change. In the model presented in this chapter qualitative change is
created by the emergence of new sectors, each of which produces an output that is
qualitatively different to, and thus distinguishable from, the outputs of all the other sectors.
Each sector produces a differentiated output. Typically such output will be an heterogeneous
multicharacteristics product. The output of each sector is produced by a population of firms,
whose processes of entry and exit are modelled as part of the dynamics of the sector. The
initial stimulus to the creation of the sector comes from an important innovation that creates
an adjustment gap, that is, a potential market that when the innovation is created is empty.
The model has a strong Schumpeterian flavour in that the first entrepreneur entering a market
enjoys a temporary monopoly. This temporary monopoly is eroded by the entry of imitators,
which gradually increases the intensity of competition. When the intensity of competition
becomes sufficiently high there is no more inducement for anyone to enter the population of
firms and there starts being an incentive for incumbent firms to exit the sector. The sector is
saturated. The saturation is reinforced as the demand for what was a new product comes to be
completely satisfied. In this way the adjustment gap initially created by the innovation is
gradually eliminated, thus transforming a niche into a mature market, which becomes one of
the routines of the economic system. The saturation of a sector is thus determined by the
increasing intensity of competition and by the saturation of demand. Furthermore, exit is also
determined by mergers and acquisitions, themselves dependent on returns to adoption. As
soon as a sector becomes saturated there is an increasing inducement for incumbent firms to
exit and to create a new niche, where once more they will have a temporary monopoly. The
same life cycle, constituted by entry, imitation, increasing intensity of competition, saturation
of demand, exit will be repeated all over again for each new sector. At the end of it what was
a highly profitable niche will become a standard, saturated market. In order for new niches to
be created the negative inducements determined by the saturation of a population must be
accompanied by some positive inducements for the creation of a new niche. Search activities
create innovations and determine the differential fitness of the new technology and the

2
expected differentiation of the niche. Financial availability is another factor required for the
creation of firms in a new niche. Different populations of firms thus interact in their evolution.
As one pre-existing population saturate,s it creates inducements for the creation of new
populations. In this sense the creation of new niches becomes the vehicle for variety growth
and for the expansion of the economic system.
1. Introduction
For many countries economic development has created an enormous amount of wealth
increasing the welfare of most members of their populations. In many growth models the
representation of economic development underlying formal modelling exercises assumed that
technical progress would in the course of time increase the productivity of all existing
processes, thus leading to the possibility of a greater output per unit of resources employed in
production. Economic growth would arise because more final goods would thus be available
for each member of the population. Even the most casual observation tells us that this
representation does not correspond to what happened in one important respect. Both the types
of output ad the activities used to produce them are qualitatively different from those that
were previously used in the economy. We can thus say that the composition of the economic
system changed during economic development. Here by composition we mean the list of all
objects (products or services), activities and actors (individual ad institutional) that are
required to describe the economic system at a given time. Furthermore, qualitative change
necessarily entails structural change, although the two phenomena are not identical. Structural
change only results from the emergence of new sectors, from the extinction of old ones, and
from the changing weights of surviving sectors. Qualitative change can occur at lower levels
of aggregation, for example in the internal composition of a sector or even in that of the
technical objects or of the activities within each sector. The two phenomena are, however,
closely related.
The importance of the previous considerations changes drastically depending on whether
qualitative change is only an effect of previous economic development or also a determinant
of subsequent economic development. In the latter case changes in the composition of the
economic system should become one of the important variables in models of economic
growth and development. Our knowledge of the relationship between economic development
and qualitative change is very limited. With our model of economic development by the
creation of new sectors we attempt to shed light on some important aspects of the role played
by qualitative change in economic development, by laying the foundations of a model in

3
which changes in the composition of the economic system are endogenously generated by the
evolution of the system itself and, in turn, affect its future development. To put it in another,
slightly different, form, we can say that economic development is a process in which new
activities emerge, old ones disappear, the weight of all economic activities and their patterns
of interaction change.
Most existing models of growth are macroeconomic models. Thus they do not take the
composition of the economic system into account. This does not mean that it is impossible for
any macroeconomic growth model to derive some of the implications of changing
composition. However, it means that this possibility is limited. For example, in Romer’s
models (1987, 1990) one of the outcomes of R&D activities is to increase the number of
sectors producing capital goods. Obviously, this amounts to a change in the composition of
the economic system. In Aghion and Howitt’s (1998) multisectoral extension of their
endogenous growth model the existence of several sectors producing intermediate outputs and
of their interactions are examined. However, the number of sectors does not change in the
course of time. In general, in these models there is no indication of what the new capital
goods could be or of their potential interactions with the consumer goods sectors. In fact
consumer goods and services are the really missing character from all these models. This is
probably due to the use of production functions that, while admitting many inputs, can
produce only one output. In particular, the implications of these models for the variety of the
economic system are unclear. In Romer’s models we can expect variety to increase, although
we do not know under what circumstances and in what directions. In Aghion and Howitt’s
models variety is likely to remain constant. Thus we can see here that endogenous growth
models, while being an important improvement with respect to the Solow-Swann vintage, still
have difficulties in coping with the dynamics of qualitative change taking place in the
economy. Macroeconomic growth models are useful precisely because they do away with all,
or some of the complexities inherent in the composition of the economic system. The
simplification that they achieve in this way helps these models to achieve in a parsimonious
and elegant way some important results, but limits their ability to deal with the composition of
the economic system. Of course, such limitation is much more serious in the long than in the
medium or short run, since changes in composition affect the macroeconomic level rather
slowly. Thus, the more profound limitation of macroeconomic growth models is likely to be
their ability to analyse long term trends in economic development.

4
Another type of research relevant for design of our model is that on structural change.
Important examples of this research are the work by Salter (1960), by Cornwall (1977), and
more recently by Fagerberg (2000) and by Fagerberg and Verspagen (1999). These works are
mostly empirical, but an important attempt to formulate a theoretical model linking structural
change and economic growth was made by Pasinetti (1981,1993). The work of all these
authors takes structural change into explicit account and they provide an important inspiration
for our work. However, this past work on structural change still leads to a number of
problems, at least some of which we aim at overcoming. First, the definition of structural
change used by the previously quoted authors refers to the emergence of new sectors, to the
disappearance of older ones and to their changing weights in the economic system. Aspects of
qualitative change taking place at a lower level of aggregation, although having impacts at the
sectoral level, are not taken into account. In this chapter the term qualitative change refers to a
wider range of changes in the composition of the economic system. Second, the possibility to
detect structural change and to study its effects depends heavily on the availability of
statistical data about production and above all on the definition of industrial sectors used.
Statistical classifications of production are changed infrequently and in ways that do not
necessarily reflect the real changes taking place in the economy. Thus, as it emerges clearly
from the work of Fagerberg and Verspagen (1999, 2000) the industrial classification that they
have to use in order to compare a large number of countries hides some types of structural
change. Third, these studies on structural change have remained somewhat separate with
respect to the macroeconomic growth models. Fourth, even the most sophisticated model
linking structural change and economic growth, that of Pasinetti, has very limited dynamic
features: it leads us to the conclusion that in the long run the economic system cannot follow a
balanced growth path unless new sectors emerge and ‘absorb’ the resources potentially
displaced by the evolution of older sectors, but it does not tell us anything about the dynamics
of emergence of new sectors or about their relationship to older ones.
Our chapter is introducing into the details of a model of economic development that includes
qualitative change amongst its main determinants. Thus, we hope to contribute to a better
understanding of the role of qualitative change and to bridge the gap between macroeconomic
growth models and structural change studies. In what follows the conceptual nature of the
present model will be explained, followed by the presentation of the more technical aspects of
the model. One section of this chapter introduces to a selection of results of simulation

5
experiments. The final section concludes and gives a brief outlook for future extensions of the
model which are on our research agenda.
2. A model of economic development by the creation of new sectors
Our model of economic development by the creation of new sectors has been developed over
the past seven years and has already undergone a number of modifications (see Saviotti, Pyka,
2004a, 2004b, 2004c, 2008a, 2008b, 2009, 2010). We will first give a brief verbal description
of the model and then introduce the equations.
2.1 A narrative description of the model
In the model, each sector is generated by an important innovation. Such innovation creates a
potential market and gives rise to what we call an adjustment gap. The term adjustment gap is
due to the fact that, as soon as a potential market is created, it is in fact empty: neither the
productive capacity nor the demand for the innovation is present. They are gradually
constructed during the life cycle of the new sector. As the new sector matures, the adjustment
gap is continuously closed: a productive capacity, which in the end matches demand, is
created. When this happens, the sector enters its saturation phase. The productive capacity is
generated by Schumpeterian entrepreneurs establishing new firms initially induced by the
expectation of a temporary monopoly and related extraordinary profits. The success of the
innovation gives rise to a band wagon of imitators. The number of firms in the new sector
gradually rises, but this also raises the intensity of competition in the sector, thus gradually
reducing the inducement to further entry. After the intensity of competition in the new sector
reaches levels comparable to those of established sectors, the new sector is no longer
innovating but becomes part of the circular flow. When a sector achieves maturity in the way
described above, an inducement exists for Schumpeterian entrepreneurs to set up a new niche,
which can eventually give rise to the emergence of a new industry. In other words, the
declining economic potential of maturing sectors induces the creation of newer and more
promising ones. Competition plays a very important role in this process of creation of new
industries. Entrepreneurs are induced to establish new firms by the expectation of a temporary
monopoly, that is, by the absence of competition. However, the new sector could not achieve
its economic potential unless imitative entry took place. As a result, the intensity of
competition rises, thus reducing the inducement to further entry. An additional contribution is
made to the dynamics of our artificial economic system by inter-sector competition. Inter-

6
sector competition arises when two sectors produce comparable services. Inter-sector
competition is an important component of contestable markets (Baumol et al. 1982) and can
keep the overall intensity of competition of the economic system high, even when each sector
achieves very high levels of industrial concentration.
In our model, the variety of the economic system plays an essential role. Economic variety is
approximated by the number of different sectors. By raising variety, the creation of new
sectors provides the mechanism whereby economic development can continue in the long run.
In this way, the economic system can escape the trap generated by the imbalance between
rising productivity and saturating demand (Pasinetti, 1982, 1993; Saviotti, 1996), which
would occur in a system at constant composition. This also affects the macroeconomic
employment situation: In particular, this artificial economic system can keep generating
employment, even when employment creation is falling within each sector (Saviotti, Pyka,
2004b).
In order to illustrate qualitatively the developments generated by our model, figure 1a shows
the development of the number of firms in a certain industry. Within a wide range of
conditions, the number of firms in each sector grows initially, reaches a maximum and then
falls to a fairly low value. Within these conditions, each sector seems to follow a life cycle,
similar to the ones detected by Klepper (1996), Jovanovic and MacDonald (1984), Utterback
and Suarez (1993). However, in our model, this industry life cycle is created by variables very
different from those used by the previous authors in their models which include increasing
returns to R&D, radical innovations and the emergence of dominant designs. In our case, the
cyclical behavior is caused only by the combined dynamics of competition and of market
saturation. We do not wish to say that cyclical behavior cannot arise under the conditions
identified by the previous authors. We simply say that cyclical behavior can arise also from
the interplay of competition and of market saturation. Figure 1b then shows the course of
development of employment in single industries - which first strongly increases, but in the
shake-out period also is reduced considerably – and the trend of the aggregate employment on
the macroeconomic level, which can be positive despite the decrease of sectoral employment.
Figure 1c displays the overall income development in our economic system. Despite the
severe shake-out processes reducing drastically both the number of firms in mature industries
and sectoral employment, figures 1b and 1c illustrate a decisive advantage of our approach of
numerically modelling industry evolution. By aggregating the various figures we can not only

7
observe the sectoral developments but also the macroeconomic figures, thereby detecting
overall beneficial or disadvantageous developments.
-
50
100
150
200
250
300
1 251 501 751
number of f irms
t-
50
100
150
200
250
300
350
1 251 501 751
sectoral employment and linear trend of
aggregate employment
t
figure 1a) number of firms figure 1b) employment
-
10
20
30
40
50
60
1 251 501 751
income development
t
figure 1c) income
2.2. The simulation model
In the following paragraphs, we describe the formal aspects of our model in detail. Two
remarks are necessary to ease the understanding of this formal description: First, to illustrate
the implemented relationships we display figures which document the results of one
numerical experiment we have labelled the standard scenario. In the results section we
introduce further experiments where we modify the various constants. The second remark
concerns these constants, which frequently can be found in our model. Basically they all serve
as weights for the different factors which play a role for economic development. To shorten to
some extent the following description we summarize these constants in a table in the
appendix.
Equation (1) is the central equation. It describes the change in the net number of firms dNit in
each sector i in the course of time. Accordingly Nit is the number of firms in sector i at time t.
The change in the net number of firms is the result of the processes of entry and exit into and
out of the sectors. The term k1FAitAGi
t describes the rate of entry, the two terms -ICit and -
MAit describe processes of exit. The variables determining the rate of entry, FAi
t and AGit, are
the financial availability and the adjustment gap respectively; the variables determining the

8
exit are the intensity of competition ICit and mergers and acquisitions MAi
t. The four entry
and exit terms are graphically displayed in figures 2a-d. Their meanings and how they are
computed is described immediately below. Figure 1a represents graphically the change in the
number of firms in different sectors. As it can be seen, the number of firms rises at first,
reaches a maximum and then falls to a low value. As already mentioned, the number of firms
in subsequent industries indicates the shape of an industry life cycle in our standard scenario.
t
i
t
i
t
i
t
i
t
iMAICAGFAkdN
1 (1)
This specific pattern emerges from the interplay of the four variables on the right hand side of
equation (1). FAit is the term for financial availability, a variable we expect to contribute
positively to industry development. In the standard scenario displayed in figure 2a the
financial availability for previous sectors is endangered with the emergence of a follow-up
industry with high growth rates (see Saviotti and Pyka, 2009).
AGit (figure 2b) is the adjustment gap at time t and describes the potential size of a market.
When a new industry emerges a new adjustment gap is opened up which is positively
influenced by the search activities in an industry and negatively influenced by an increasing
sectoral productivity and saturated demand.
ICit (figure 2c) is the intensity of competition at time t composed of two influences stemming
from intra-industry and from inter-industry competition. The intensity of competition
increases and declines with the number of firms in the respective industry and is influenced
positively by the emergence of subsequent industries later on (see Saviotti and Pyka, 2008a).
Finally, the term MAit (figure 2d) is the number of mergers and acquisitions at time t. During
industry development a consolidation process fed by mergers and acquisitions and failures
shapes the evolution (see Saviotti, Pyka, Krafft, 2007).
-
0.2
0.4
0.6
0.8
1.0
1.2
1 251 501 751 t
financial availability
-
0.2
0.4
0.6
0.8
1.0
1.2
1.4
1 251 501 751 t
adjustment gaps

9
figure 2a) financial availability figure 2b) adjustment gaps
-
2
4
6
8
10
12
14
1 251 501 751 t
intensity of competition
-
0.1
0.2
0.3
0.4
0.5
0.6
1 251 501 751
mergers & acquisitions
t
figure 2c) intensity of competition figure 2d) mergers and acquisitions
- Financial Availability
Financial availability represents the amount of financial resources which are available for
investment in sector i. It is not just the amount of resources in the economic system. It reflects
also the knowledge required to estimate the economic development potential of new
industries. In fact it is the fraction of the financial resources of the whole economic system
which investors are prepared to invest in sector i. Thus, FAit depends on the expectations of
the market potential of given innovations. We can expect growing financial availability to
accelerate the rate of entry of firms into a sector. The comparison of different constant levels
of financial availability will only tell us that an economic system able to invest more in an
emerging sector will have a higher rate of growth of firms in the sector but it will not give us
a realistic picture of the dynamics of investment in emerging sectors. Thus, it is possible to
assume that financial operators will observe the behaviour of the economic system and spot
the potential of emerging sectors. If they notice that some aspects of an emerging sector, for
example the rate of creation of new firms, grow more rapidly than average for the whole
economic system, they can invest more heavily in the emerging than in the average - and
typically more mature - sector in the expectation to enjoy higher than average (supranormal)
rates of profit. This kind of behaviour is represented by equation 2:
)](1[ 32 j
t
jt
it
idt
dN
dt
dNkkFA (2)
Equation 2 is a form of replicator dynamics and it tells us that the investment in sector i
(FAit) depends on the extent to which the rate of growth of the number of firms in sector i is
above that for the average in the rest of the economic system. However, for a given difference
between the rate of growth of the number of firms in sector i and in the rest of the economic
system the amount of FAit will depend on the two parameters k2 and k2, where k2 is the

10
amount of financial resources available in the whole economic system, and k3 is the optimism
(or over optimism) of financial operators with respect to the development potential of sector i.
A typical development of FAit is displayed in figure 2a.
- Adjustment Gap
The term adjustment gap AGit indicates the expected size of the market created by a pervasive
major innovation. The term gap indicates something to be compensated or filled. In fact, as
the innovation emerges there is neither a demand nor a production capacity for it. Potential
users and consumers do not know about its existence and properties and entrepreneurs have
not yet had the time to invest in new production facilities. As demand grows and production
facilities are built the gap is gradually closed giving rise to a saturated market. The gap may
never be completely closed if the output of the sector keeps changing in a qualitative way. An
example of this change would be today's cars compared to those of Henry Ford's era. In
today's cars there are many new internal structures and functionalities, supplying new
services, which were completely absent in much older cars. The implication of this is that
while a sector can saturate in volume terms it will not necessarily saturate in value terms
(Saviotti, Pyka, Krafft, 2007). Also, we cannot expect the size of the adjustment gap to fall at
all times after the emergence of a new sector. During the life cycle of the sector innovations,
the result of search activities (SEit, see later) have two effects: (i) they increase efficiency,
thus reducing costs and prices, (ii) they increase the services supplied by the product (Yit, see
later) and the degree of product differentiation (ΔYit, see later). As a consequence of both (i)
and (ii) the population of potential adopters of the output of sector i grows. Thus AGit can
even grow in the intermediate phases of the life cycle of the sector. Eventually, even if no
complete saturation takes place, the size of AGit will fall below its maximum. We can then
distinguish in the life cycle of each sector an early and more entrepreneurial period in which
there are high rates of dNit, of profit etc. and a more mature and more managerial period
during production which processes would become relatively more routine like. AGit can be
defined as the difference between maximum demand and instant demand (equation 3). Fig 2b
shows the dynamics of the adjustment gaps of different sectors in the system.
t
i
t
i
t
i DDAG max (3)
- Demand and Prices

11
In our model demand depends on product price pit, on the services Yi
t supplied by the product,
on product diversification ΔYit and the disposable income for purchases in this sector Dispoi
t
relative to the macroeconomic overall income (Incomet) according to equation (4). We can
expect demand to increase as pit (product price) falls and as Yi
t (services supplied by the
product) and ΔYit (product differentiation) rise. Also, pi
t can be expected to fall due to
growing efficiency of production processes and to rise due to growing product quality or to
growing product differentiation. The relative share of income available for sector i
(Dispoit/Incomet) exerts a positive influence as well and is of particular importance when the
new sector emerges. Equation (4) describes the formal relationship for demand in our model.
The constant kipref is introduced in order to investigate the influence of changing demand
preferences concerning the output of a sector.
t
i
t
i
t
i
t
t
ii
pref
t
ip
YY
Income
DispokkD
4 (4)
-
0.2
0.4
0.6
0.8
1.0
1 251 501 751
demand
t
Figure 3: Demand
The development of the sectoral demand in our standard scenario is displayed in figure 3.
Demand first strongly increases due to an increasing production efficiency which leads to
decreasing product prices. An enlargement of the services provided and the product
differentiation increases demand as well. Saturation tendencies and competition from other
sectors finally decreases sectoral demand.
The services Yit supplied by a given product i (equation 5) and the product differentiation ΔYi
t
(equation 6) can be expected to vary in the course of time due the effect of sectoral search
activities SEit. We expect Yi
t and ΔYit to rise according to a logistic equation. Only search
activities can lead to their growth, although this will occur at different rates due to the
effectiveness of search activities in different sectors. This differential effectiveness is

12
described in the model by the parameters k5 and k6 for services, k7 and k8 for product
differentiation.
)](exp[1
10
65
0
SESEkkyY
t
i
t
i
(5)
)]([1
10
87
0
SESEkkExpyY
t
i
t
i
(6)
-
0.2
0.4
0.6
0.8
1.0
1.2
1 251 501 751 1001 1251 1501 1751
product services
t
Figure 4: Product Services
Again for the standard scenario the development of product services Yit is displayed in figure
4. In early periods the potential for improvements of services is large and the service level
increases accelerated. In later periods the possibilities for further improvements are
increasingly exhausted and the respective development slows down and finally stops. The
development of the product differentiation ΔYit looks similar in dependence of the respective
constants.
Prices pit are calculated in equation (7) as unit costs uci
t plus a mark up kMU in equation (8).
Unit costs are determined by labour costs (labourit wi
t (wit:=wages in sector i at time t)),
physical capital costs (Investmentit i (i:=interest rate)), and by the effects of increasing
services and increasing product differentiation. The mark up kMU in the standard scenario is
fixed at 20% of unit costs.
t
iMU
t
i uckpp 0 (7)
t
i
t
i
t
i
t
i
t
i
t
i YkYkiInvestmentwlabourkuc
1211
1
9 exp)(1 (8)
t
i
t
i
t
i
wages
t
i
t
ilabour
PQkwages
11 (9)
t
iwages
t
i wageskwagesk 1100 (10)

13
Sectoral wages wagesit are determined by the industry turnover from the previous period
Qit-1Pi
t-1 and the size of the sectoral workforce labourit (equation 9). Furthermore, the weight
ktiwages is composed of a constant wages0 and a part which leads to higher wages in
consecutive sectors.
-
0.5
1.0
1.5
2.0
1 251 501 751
unit costs
t
5
6
6
7
7
8
1 251 501 751 t
prices
Figure 5a) Unit Costs Figure 5b) prices
-
0.2
0.4
0.6
0.8
1.0
1.2
1.4
1 251 501 751 t
w ages
Fig 5c) Wages
In figure 5a) the development of unit costs is displayed. Unit costs start to increase first driven
by increasing wages (displayed in figure 5c). The increasing wages are finally
overcompensated by an increased productivity, which leads to falling unit costs again. The
development of the prices (figure 5b) follows unit-costs closely.
- Search Activities
Search activities SEit are an important component in our model. They are a considered to be a
generalized analogue of R&D. Search activities include all the activities which scan the
external environment to look for alternatives to existing routines. Search activities can be
fundamental or sectoral. We can expect search activities to be affected by demand (equation
11). In particular, sectoral search activities rise with the accumulated demand Daccit (equation
14 and figure 6a) for the output of the same sector (equation 12 and figure 6b).
)]exp(1[ 1413
0 t
i
t
i DacckkSESE (11)

14
t
t
i
t
i DDacc (12)
-
100
200
300
400
500
600
1 251 501 751 t
accumulated demand
-
5
10
15
20
1 251 501 751
search activities
t
Figure 6a: Accumulated Demand Figure 6b: Sectoral Search Activities
The maximum demand Dmax,it defines the maximum possible size of the market for sector i.
The above described concept of adjustment gap AGit is defined as the difference between
maximum and instant demand. Since at time zero (creation of the new market) instant demand
Dit is equal to zero Dmax,i
t represents the maximum possible size of the market for i at the time
of the creation of the market. This maximum size is influenced by the technological
opportunities already exploited for this industry TIit which again are a function of search
activities and described in equation (13).
)]([1
10
1615 SESEkkExpTI
t
i
t
i
(13)
The maximum demand Dmax,it the is defined as the ratio between instant demand Di
t and
exploited opportunities TIit (equation 14). Figure 7a displays the exploitation of sectoral
opportunities. Figure 7b shows the development of maximum demand.
t
i
t
it
iTI
DD max (14)
-
0.1
0.2
0.3
0.4
0.5
1 251 501 751
Exploitation of sectoral opportunities
t-
0.5
1.0
1.5
2.0
1 251 501 751 t
maximum demand
Figure 7a: The exploitation of sectoral opportunities Figure 7b: Maximum Demand
- Income and Disposable Income
15
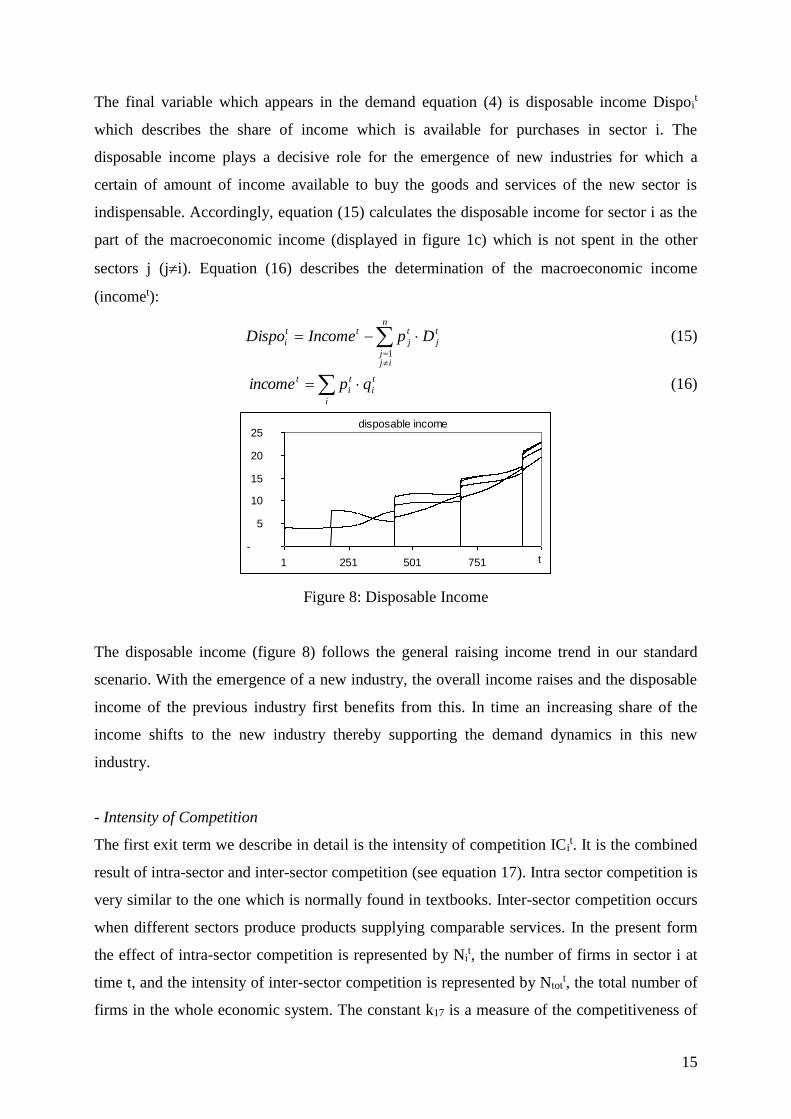
The final variable which appears in the demand equation (4) is disposable income Dispoit
which describes the share of income which is available for purchases in sector i. The
disposable income plays a decisive role for the emergence of new industries for which a
certain of amount of income available to buy the goods and services of the new sector is
indispensable. Accordingly, equation (15) calculates the disposable income for sector i as the
part of the macroeconomic income (displayed in figure 1c) which is not spent in the other
sectors j (ji). Equation (16) describes the determination of the macroeconomic income
(incomet):
n
ijj
t
j
t
j
tt
i DpIncomeDispo1
(15)
i
t
i
t
i
t qpincome (16)
-
5
10
15
20
25
1 251 501 751
disposable income
t
Figure 8: Disposable Income
The disposable income (figure 8) follows the general raising income trend in our standard
scenario. With the emergence of a new industry, the overall income raises and the disposable
income of the previous industry first benefits from this. In time an increasing share of the
income shifts to the new industry thereby supporting the demand dynamics in this new
industry.
- Intensity of Competition
The first exit term we describe in detail is the intensity of competition ICit. It is the combined
result of intra-sector and inter-sector competition (see equation 17). Intra sector competition is
very similar to the one which is normally found in textbooks. Inter-sector competition occurs
when different sectors produce products supplying comparable services. In the present form
the effect of intra-sector competition is represented by Nit, the number of firms in sector i at
time t, and the intensity of inter-sector competition is represented by Ntott, the total number of
firms in the whole economic system. The constant k17 is a measure of the competitiveness of

16
the economic system, as determined, for example, by anti-monopoly laws etc. The constant
RII is the ratio between inter- and intra-sector competition. When k18 = 0 there is only intra-
sector competition and as k18 grows inter-sector competition raises its importance. This is an
approximate form since we can expect the intensity of competition to be affected also by the
extent of product differentiation.
t
total
t
i
t
total
t
it
iNkN
NNkIC
18
1
1
17 (17)
The intensity of competition for the various sectors we observe in our standard simulation is
displayed in figure 2c. We see that due to the strong entry in the entrepreneurial period of an
industry the intensity of competition raises strongly driven by the increasing number of firms
in a sector. It slows down after a peak is reached and is shifted moderately higher when new
sectors enter the scene, which indicates the impact of inter-industry competition.
- Failure, Mergers and Acquisitions
The merger and acquisitions term MAit which is the second exit variable in equation 1
describes the failure and consolidation process during the shake-out period of an industry life
cycle. In figure 2d we see that MAit first strongly increases in young industries indicating a
high rate of failure in the entrepreneurial period. It slows down again with the coming up of a
dominant design and the establishment of the industry. Formally, equation (18) describes
MAit in dependence of the marginal costs MCi
t and the search activities SEit as well as instant
demand Dit. Marginal costs MCi
t so far are simply a constant although easily other
relationships are conceivable.
t
i
t
i
t
it
i
t
iDSE
MCNkMA
1
19 (18)
0MCMCti ; 10 constMC (19)
- Production
On the supply side the sectoral output Qit is determined by the sectoral search activities SEi
t,
the physical capital stock CSphysicalit and the level of human capital HCi
t as described in
equation (20):
)]exp(1[)1( 24232120
0 t
i
t
i
t
i
t
ci
t
i HCkCSphysicalkSEkkQQ (20)

17
-
0.5
1.0
1.5
2.0
2.5
3.0
3.5
1 251 501 751 t
output
-6
-4
-2
-
2
4
6
1 251 501 751
excess demand
t
Figure 8a: Output Figure 8b: Excess Demand
-0.6
-0.4
-0.2
-
0.2
0.4
0.6
1 251 501 751t
alpha
Figure 8c: adjustment parameter
To adjust the supply side with the demand side of our sectoral economic system we calculate
the excess demand EXDit in each period (equation 21) as the difference between demand and
output. The excess demand displayed in figure 8b then is used to determine an adjustment
variable it. This adjustment variable (figure 8c) is limited to an upper and lower value (0.5 in
the standard scenario) which does not allow for extreme reactions. This value is accumulated
in equation (23) to the production adjustment variable tci used in the output equation (20).
t
i
t
i
t
it
iD
QDEXD
(21)
2)EXD( t
i
t
i (22)
t
t
i
t
ci (23)
- Investment and Basic Research
Besides the search activities SEit which are responsible for increasing production efficiency,
the production Qit is also determined by the physical capital stock CSphysicali
t and the level
of human capital HCit which follow the investment decisions in our economic system. The
overall periodical volume of investment Total_Investmentt (equation 24) is a fraction (ms :=
marginal savings rate) of the macroeconomic income (incomet) displayed in figure 1c. The
investment is distributed on the different sectors following the relative size of the sectors
share_sectorit (equation 25).

18
tt IncomemsInvestmentTotal _ (24)
ms:= const = 0.25 (marginal saving rate)
t
t
i
t
it
iIncome
Qptorshare
sec_ (25)
The physical capital stock is then the accumulated and depreciated outcome of the sectoral
investment as described in equation (26) and displayed in figure 9.
-
50
100
150
200
250
300
350
400
1 251 501 751
physical capital stocks
t
Figure 9: Physical Capital Stocks
tt
i
t
i
t
i InvestmentTotaltorsharephysicalshareCSphysicalCSphysical _sec__)1( 1 (26)
Besides the physical capital stock, also human capital HCit matters for production. The level
of human capital is determined by the investment in human capital which determines the
capital stock of investment in human capital (CSed,it) in equation (27) and together with the
quantitative size of the labour force (labourit) determines the level of human capital HCi
t in
equation (28) and displayed in figure 10.
t
ied
t
i CSkh 22 (27)
t
i
t
i
t
i hlabourHC (28)
1
1
25
t
i
t
it
iQ
Nklabour (29)
i
t
i
t labouremployment (30)
-
20
40
60
80
100
120
1 251 501 751
Level of sectoral Human Capital
t
Figure 10: Level of sectoral human capital

19
The sectoral labour force is an important figure for the observation of macroeconomic trends
in our economic system. As we can aggregate the sectoral employment figures to a
macroeconomic employment figure (see figure 1b) we can not only make propositions on the
sectoral level but also on the aggregate level. The sectoral labour force labourit is determined
by the number of firms in the previous period Nit-1 and the sectoral output of the previous
period Qit-1 (equation 29). The overall employment variable is calculated in equation (30).
Besides sectoral research in our economic system fundamental research activities SEFt focus
on the exploration of new technological opportunities which might lay the foundation for new
industries. Investment in fundamental research activities depend on the share of investment in
fundamental research shareRD and the overall investment Total_Investmentt. Equation (31)
describes the calculation of fundamental research activities:
t
RD
t InvestmentTotalshareSEF _ (31)
- The Emergence of New Industries
One of the most distinctive features of our economic system is the endogenously variable
number of sectors. The creation of a new sector is induced by the previous dynamics of the
economic system. For a new industry i to emerge a few conditions need to be fulfilled. First,
sector i-1 has to become saturated; this is indicated by an adjustment gap of the sector i-1
which starts to close (AGt-1i-1 > AGt
i-1). A closing adjustment gap is indicating declining
opportunities for growth, and profit-oriented entrepreneurs start searching for new
opportunities. With a closing adjustment gap in industry i-1 we start a stepwise increasing
counter variable (counterit) which simply counts the periods of declining opportunities in
sector i-1. Each period then an entry threshold is calculated which decreases with increasing
accumulated fundamental research activities (equation 32):
)( 2726
tt
i SEFkkholdEntryThres (32)
Always when the condition counterit > EntryThresholdi
t is fulfilled, the new industry i starts to
work and a new industry life cycle is set up.

20
-
10
20
30
40
1 251 501 751
entry threshold (bold) and counter variable
t
Figure11: Entry threshold and counter variable
In figure 11 the development of the sectoral entry threshold is displayed. In periods with
increasing fundamental research activities the threshold decreases. Figure 11 also displays the
counter variable which starts to increase when the adjustment gap of a previous industry starts
to decline.
Figure 12: Structure of the model
Figure 12 summarizes the complex interdependent structure of our model. It has to be
mentioned for this graphical representation of the model that circular connections are to be
disbanded. In the simulation model this is done by a sequential structure for the various
calculations; so for example the various investment decisions in one period, which are
determined by the income in this period, start to exert their influences only one period later.
Nit dNi
t
AGit
FAit
MAit
Dmax,it
Dit
Dispoit
Yit,
Yit, pi
t
SEit
ucit
labourit
investmentit
incomeit
SEFit
Qit
ICit

21
3. Simulation Experiments
In this section we give an overview on the various experiments we have performed so far.
Before going into detail a few remarks concerning the numerical experiments are necessary.
Usually, for experiments one or several parameters are varied and the results are compared
with a standard scenario. Obviously, the model has to be tested for stability and robustness.
This has been done in several papers (Saviotti, Pyka, 2004b and Saviotti, Pyka 2008a) and
also new methodologies for robustness checks have been developed. The model is supposed
to produce qualitative stable results for the experiments which in some circumstances might
none the less mean that the corridor of possible values of single figures can be broad. As we
have not used any stochastic formulation in the model we can dispense Monte-Carlo
simulations.
The following seven experiments were chosen to illustrate the broad applicability of our
model to the analysis of a wide set of questions which deal with structural change, economic
development and growth. The first three experiments taken from Saviotti and Pyka (2004a)
deal with very general aspects of the model (variation of technological opportunities, variation
of learning rates and variation of production efficiencies) and allow to gain a better
understanding on the basic dynamics generated by our model. Experiment 4 (Saviotti and
Pyka, 2004c) then tackles already a macro-economic question and analyzes the relationship of
sectoral development and macroeconomic employment figures. Experiment 5 highlights the
important relationship between variety and economic development we allows us to confirm in
Saviotti and Pyka (2004c) the decisive role of a heterogeneous industrial structure for growth
and development which is inaccessible in traditional models of economic growth. In a similar
vein experiment 6 performed in Saviotti and Pyka (2008a) shed light on the inter-sectoral
coordination on the macroeconomic level, i.e. the critical question of the timing concerning
the emergence of new sectors. The final experiment 7 (Saviotti and Pyka, 2009) is used to
demonstrate one of the decisive advantages of our numerical model of economic development
by the emergence of new industry, namely the investigation of co-evolutionary processes
which introduce a high degree of complexity. In particular the relationship between the real
sphere of technology development and the monetary sphere of financial availability is
analyzed and it is shown that due to the co-evolutionary dynamics, there is scope for chaotic
developments.

22
3.1 Experiment 1: Varying technological opportunity
The constant k13, which appears in equation (11) for search activities SEit, measures the extent
of technological opportunity of the technology that created a new sector. In the standard
scenario k13 had the same value for the different populations. In this experiment we varied the
values of k13 for different populations. We explored the situation in which the technological
opportunity of each subsequent population is higher than that of the pre-existing one.
Although there is no guarantee that such a condition is going to apply systematically to all
new emerging sectors, it is also not an implausible one in particular cases. In the past it was
considered that agriculture had an intrinsically lower potential for productivity improvement
than manufacturing. Electronics and information based sectors seem to manifest a higher rate
of productivity growth than historically displayed by mechanical sectors. With these
considerations we do not want to prove that the pattern of increasing technological
opportunity by subsequent populations of firms is of general applicability, but simply that
there are a number of cases in which this could happen. We are exploring a scenario in which
technological opportunity increases for each subsequent population. In the experiment we
used two sets of values, corresponding to experiments 1a and experiment 1b respectively
(Table 1).
Table 1
Values of the constant k13 used in experiments 1a and 1b,
and different from those of the standard scenario.
Experiment 1a Experiment 1b
k131= 40 k13
1= 40
k132= 50 k13
2= 60
k133= 60 k13
3= 80
These changes (Figure 13) lead to an earlier start of the life cycle of populations 2 and 3, to a
higher maximum number of firms at the peak of the life cycle, to an increase in the steady
state level of demand of each population with respect to the pre-existing ones (Figure 14) and
to an increase of the maximum level of demand of each population with respect to the pre-
existing ones (Figure15). These effects are qualitatively the same, but greater in experiment
1b), where the increase in technological opportunity is even greater.

23
0
5
10
15
20
1 251 501 751 1001 1251
populat ion 1 populat ion 2 populat ion 3
number of f irms in a population (standard scenario)
0
5
10
15
1 251 501 751 1001 1251
populat ion 1 populat ion 2 populat ion 3
number of f irms in a population (experiment 1a)
0
5
10
15
1 251 501 751 1001 1251
populat ion 1 populat ion 2 populat ion 3
number of f irms in a population (experiment 1b)
Figure 13: Influence of technological opportunity on the number of firms.
0
5
10
15
20
25
30
35
1 251 501 751 1001 1251
populat ion 1 populat ion 2 populat ion 3
demand (standard scenario)
0
10
20
30
40
50
1 251 501 751 1001 1251
populat ion 1 populat ion 2 populat ion 3
demand (experiment 1a)
0
10
20
30
40
50
60
70
1 251 501 751 1001 1251
populat ion 1 populat ion 2 populat ion 3
demand (experiment 1b)
Figure 14: Influence of technological opportunity on demand

24
0
0,05
0,1
0,15
0,2
0,25
1 251 501 751 1001 1251
populat ion 1 populat ion 2 populat ion 3
intensity of competition (standard scenario)
0
0,05
0,1
0,15
0,2
0,25
1 251 501 751 1001 1251
populat ion 1 populat ion 2 populat ion 3
intensity of competition (experiment 1a)
0
0,05
0,1
0,15
0,2
0,25
0,3
1 251 501 751 1001 1251
populat ion 1 populat ion 2 populat ion 3
intensity of competition (experiment 1b)
Figure 15: Influence of technological opportunity on the intensity of competition
Summarising, we could say that the effect of an increase in technological opportunity of each
new sector with respect to pre-existing ones, is an acceleration of the process of economic
development, determined by a faster emergence of new sectors, and an increase in the scope
of economic development, as shown by the increase in the number of firms that each sector
can support and by the higher levels of demand eventually achieved in each sector.
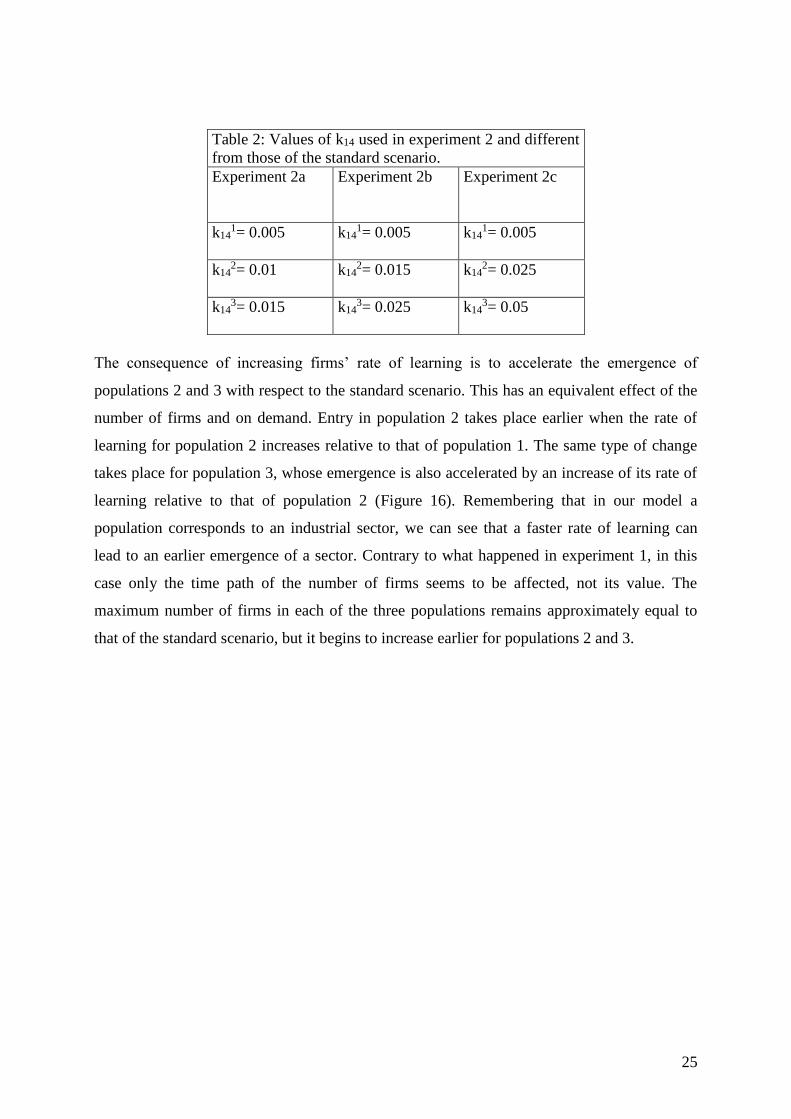
3.2 Experiment 2: Varying the rate of learning
In this experiment we varied the value of the constant k14 for different populations with
respect to the standard scenario. K12 takes a higher value for each subsequent population, that
is k141 k14
2 . k143. The values used are indicated in Table 2. Given the meaning of k14, this
experiment is equivalent to increase firms’ rate of learning. Three versions of the experiment
are performed.
25
Table 2: Values of k14 used in experiment 2 and different
from those of the standard scenario.
Experiment 2a
Experiment 2b
Experiment 2c
k141= 0.005 k14
1= 0.005 k141= 0.005
k142= 0.01 k14
2= 0.015 k142= 0.025
k143= 0.015 k14
3= 0.025 k143= 0.05
The consequence of increasing firms’ rate of learning is to accelerate the emergence of
populations 2 and 3 with respect to the standard scenario. This has an equivalent effect of the
number of firms and on demand. Entry in population 2 takes place earlier when the rate of
learning for population 2 increases relative to that of population 1. The same type of change
takes place for population 3, whose emergence is also accelerated by an increase of its rate of
learning relative to that of population 2 (Figure 16). Remembering that in our model a
population corresponds to an industrial sector, we can see that a faster rate of learning can
lead to an earlier emergence of a sector. Contrary to what happened in experiment 1, in this
case only the time path of the number of firms seems to be affected, not its value. The
maximum number of firms in each of the three populations remains approximately equal to
that of the standard scenario, but it begins to increase earlier for populations 2 and 3.

26
Figure 16: Influence of the rate of learning on the number of firms
The behaviour of sectoral demand is affected in a similar way (figure 17). The demand for
each sector output begins to rise more rapidly when we increase the rate of learning, up to the
point where the demand for the output of sector 2 can overtake that of sector 1. Long run
demand for the output of a sector does not seem to be affected by a change in learning rate.
This leads us to expect that the aggregate number of firms and the aggregate demand will
grow faster the faster the rate of learning. However, in our model a faster rate of learning does
not bring joy for everyone. While the system may display a faster growth the number of firms
in population 1 begins to fall sooner, due to the inter-sector competition provided by the
increased number of firms in populations 2 and 3. If the development of the system can be
described by means of the life cycles of different sectors, these life cycles follow a time path
that is determined both by the intrinsic features of each sector and by its interactions with
other sectors in the economy. We can observe that in the most extreme case considered here
(experiment 2c), when the rates of learning of populations 2 and 3 are the highest with respect
to population 1, the number of firms and the sectoral demand of population 2 very soon
overtakes those of populations 1 and 3.
0
5
10
15
20
1 251 501 751 1001 1251
populat ion 1 populat ion 2 populat ion 3
number of firms in a population (standard scenario)
0
5
10
15
20
1 163 325 487 649 811 973 1135 1297 1459
populat ion 1 populat ion 2 populat ion 3
number of f irms in a population (experiment 2a)
0
5
10
15
20
1 163 325 487 649 811 973 1135 1297 1459
populat ion 1 populat ion 2 populat ion 3
number of f irms in a population (experiment 2c)
0
5
10
15
20
1 163 325 487 649 811 973 1135 1297 1459
populat ion 1 populat ion 2 populat ion 3
number of f irms in a population (experiment 2b)

27
0
5
10
15
20
25
30
35
1 251 501 751 1001 1251
populat ion 1 populat ion 2 populat ion 3
demand (standard scenario)
0
5
10
15
20
25
30
35
1 163 325 487 649 811 973 1135 1297 1459
population 1 population 2 population 3
demand (experiment 2a)
Figure 17: Influence of the rate of learning on demand
If we compare the results of experiments 1 and 2, we can see that the general effect of an
increase in technological opportunity (Experiment 1) is both, to accelerate the creation of new
sectors and to increase their scope, that is, to increase the maximum number of firms in each
sector, demand and maximum demand. On the other hand, an increase in the rate of learning
of one sector relative to the others only influences the time path of the emergence of new
sectors and not their size, as measured either by the number of firms or by demand. Thus
technological opportunity is seen as having a greater expansive effect on the development of
the whole system than an increase in the rate of learning. However, an increase in the rate of
learning can also lead to an overall faster growth for the whole system, but this growth is
obtained more by greater efficiency than by an expansion of the markets of the various
sectors. In both cases the general improvement of the growth potential of the economic
system leads to a collective improvement, but some agents in the system may suffer. Thus an
emergence of new sectors may mean faster growth, but it also leads to an earlier and faster
emergence of competition for pre-existing (traditional) sectors.
All the analysis so far has been based on individual if interacting populations of firms. The
model can also help us to understand the consequences of sectoral dynamics for aggregate
growth. The total number of firms and aggregate demand for the whole economy are
represented in figure 18.
0
5
10
15
20
25
30
35
1 163 325 487 649 811 973 1135 1297 1459
populat ion 1 populat ion 2 populat ion 3
demand (experiment 2b)
0
5
10
15
20
25
30
35
1 163 325 487 649 811 973 1135 1297 1459
populat ion 1 populat ion 2 populat ion 3
demand (experiment 2c)

28
figure 18: Aggregate curves with the results of experiments 1 and 2. Fig 18a shows the
influence of technological opportunity and of the rate of learning on demand; figure 18b
shows the influence of technological opportunity and of the rate of learning on the number of
firms in each sector
Here we can see that aggregate demand is stimulated more by an increase in technological
opportunity than by an increase in the rate of learning. The total number of firms grows more
rapidly if the technological opportunity or the rate of learning of successive populations are
increased with respect to the standard scenario. However, in this case we can see that if the
economy were not to generate any more new sectors after sector 3, the number of firms would
converge irrespective of the technological opportunity or of the rate of learning. We have to
bear in mind that the behaviour of the system after the ‘maturity’ of sector 3 is artificial in the
sense that we expect new sectors to emerge. The experiment is valuable nevertheless because
it tells us that if the emergence of new sectors were to slow down, for example due to the
influence of particular economic policies, the overall number of firms in the economy would
fall. Increasing intensity of competition, failures, mergers and acquisitions would tend to
reduce continuously the number of surviving firms. The total number of firms can only
increase or at least remain constant if new sectors are continuously created. Conversely from
these results we can expect that in absence of new sectors the system will converge on a set of
0
20
40
60
80
100
120
140
1 251 501 751 1001 1251
standard scenario experiment 1b experiment 2b
fig. 18a) aggregate demand
0
5
10
15
20
25
30
35
1 251 501 751 1001 1251
standard scenario experiment 1b experiment 2b
fig. 18b) total number of firms
29
monopolies, their number being equal to that of the surviving sectors. The same cannot be
said about aggregate demand. Here the higher growth path that is established by an increase
of either technological opportunity or of the rate of learning persists beyond the maturity of
sector 3. By combining these two results we can expect that the output per firm will
continuously increase after the maturity of sector 3.
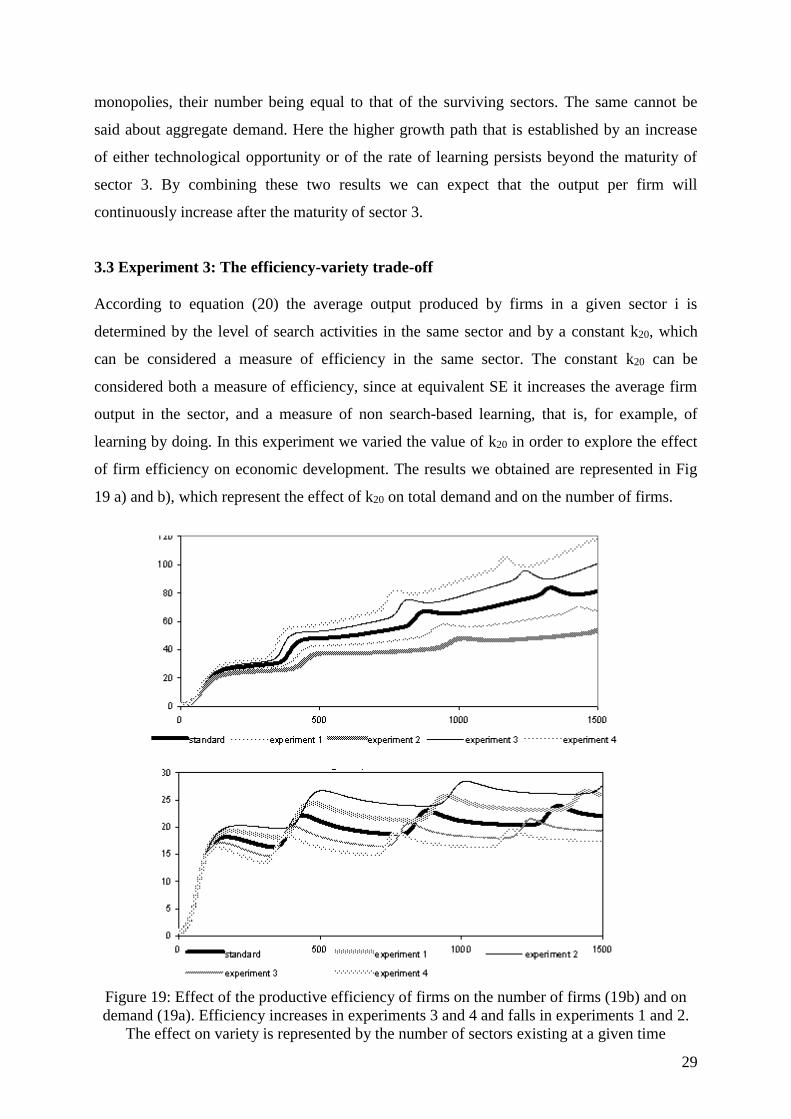
3.3 Experiment 3: The efficiency-variety trade-off
According to equation (20) the average output produced by firms in a given sector i is
determined by the level of search activities in the same sector and by a constant k20, which
can be considered a measure of efficiency in the same sector. The constant k20 can be
considered both a measure of efficiency, since at equivalent SE it increases the average firm
output in the sector, and a measure of non search-based learning, that is, for example, of
learning by doing. In this experiment we varied the value of k20 in order to explore the effect
of firm efficiency on economic development. The results we obtained are represented in Fig
19 a) and b), which represent the effect of k20 on total demand and on the number of firms.
Figure 19: Effect of the productive efficiency of firms on the number of firms (19b) and on
demand (19a). Efficiency increases in experiments 3 and 4 and falls in experiments 1 and 2.
The effect on variety is represented by the number of sectors existing at a given time

30
The results of this experiment are as follows:
Rate of creation of new sectors: The higher the value of k20 and thus the higher the efficiency
of a sector i, the faster the rate of creation of subsequent sectors. If we were to call the time at
which each sector first appears ti,0, then ti,0 would be inversely proportional to k20. Thus the
effect of generally increasing firms productive efficiency in all the sectors of the economic
system would be to accelerate the 'tempo' of economic development. This behaviour can be
explained by means of the inducement that the saturation of a given sector provides for the
creation of subsequent sectors. In turn, this inducement is determined by increasing intensity
of competition and by the saturation of demand. On the whole, a higher efficiency in sector i
leads to a faster saturation of the same sector, thus triggering the creation of the next one
(i+1).
Total demand: The total demand for each sector, and thus for the whole economic system,
increases with increasing k20. This is due to two reasons: first, since each sector emerges
earlier, at any subsequent time the number of sectors in the economic system is greater for a
greater value of k20. Second, the steady state level of demand achieved within each sector
increases with k20. Thus total demand at any time t will be greater because there are more
sectors in the economic system and because each sector has a higher steady state demand.
The number of firms in each sector: The maximum number of firms achieved in each sector at
the peak of the life cycle falls with increasing k20. The total number of firms in the economic
system (Figure 19a) increases more slowly when the average efficiency of each sector is
higher. A faster rise in output, corresponding to a higher intensity of competition, leads to
more exit and to more mergers and acquisitions. Thus the maximum number of firms reached
in the life cycle of each sector falls with the increasing efficiency of the same sector. Thus the
steady state rate of growth in the total number of firms (Figure 19a) falls with increasing
efficiency. In our calculations so far we varied by the same extent the efficiency of all sectors.
Of course, this does not need to be the case in a real economic system. In fact we expect
efficiency and its rate of growth to vary differentially amongst sectors, thus leading to
structural change. This possibility will be explored in subsequent experiments.
The results described above provide a considerable if not definitive confirmation for the
hypothesis about the complementarity between variety growth and efficiency growth

31
(Saviotti, 1996). A greater efficiency allows the more rapid creation of new sectors, and leads
to a greater net number of sectors in the economic system at a given time, that is to a higher
variety.
These results have some interesting implications for economic development. First, if we
consider the general development of the world system without focusing on any particular
country, we can see that the rate of growth of the economic system increases with the
increasing efficiency of each sector. We have to bear in mind at this point that the calculations
that we performed so far attribute the same value of k18 to all the sectors. Thus the
development we have analysed is a proportional form of development, in which all sectors
progress in the same way. Within this framework the saturation of any given existing sector
accelerates the rate of creation of subsequent ones. This type of development and structural
change takes place because new sectors are continuously (in the long run) added to the
economic system. Thus the composition of the system changes and this change in
composition drives its rate of growth. A clear relationship exists in our artificial economic
system between structural change and changes in the composition of the system on the one
hand, and the rate of growth of the system on the other hand. However, as pointed out before,
this type of structural change is not the only possible one. As pointed out above, a different
efficiency of each sector would add another component to the process of structural change by
making some sectors with high values of k20 grow more rapidly than others. This second
component of structural change has not yet been analysed in our experiments.
3.4 Experiment 4: Sectoral Employment and Productivity
Sectoral and total employment calculated for the standard scenario is shown in figure 20. The
dynamics of sectoral employment follows closely that of firm creation, with the rate of
employment growth being particularly high in the early phases of the life of a new sector and
then declining gradually. In figure 20 an aggregate representation has been superimposed on
the sectoral curves by adding up the contributions to employment of the different sectors at
each time. This aggregate representation is particularly useful if we are more interested in the
impact of variables such as productive efficiency, technological opportunity, rate of learning
etc. on the aggregate properties of the system than in the internal mechanisms of each sector.
What is immediately clear is that employment creation within each sector tends to decline and
that overall employment can keep growing only due to the emergence of new sectors. Thus,
the process of qualitative and structural change is a determinant of employment growth. This

32
conclusion is reinforced by figure 21, which displays the output shares of different sectors. As
the shares of old sectors declines that of emergent ones rises first and then starts declining as
the once new sectors move towards maturity. An interesting implication following from figure
20 is that a relatively stable macroeconomic growth pattern is produced by a much more
turbulent micro-economic evolution of individual sectors. To the extent that the patterns of
sectoral evolution described here are common, the achievement of a stable macroeconomic
growth pattern can only be obtained by creating new sectors that is by changing the
composition of the economic system. In this sense the flexibility required of the economic
system is the ability to create new sectors, or its creativity.
Figure 20. Evolution of sectoral and total employment in the standard scenario
Figure 21. Evolution of the sectoral output shares with the emergence of new sectors.
We can also notice (Figure 22) that productive efficiency and employment change in opposite
directions during the development of each sector: productivity rises as employment falls.
0
10
20
30
1 251 501 751 1001 1251
sectoral employment total employment
L
t
sectoral & total employment (linear trend)
0%
25%
50%
75%
100%
time 500 1000
sector 1 sector 2 sector 3 sector 4

33
0 250 500 750 1000 1250
productivity sectoral employment
# of
w orker
s
produc-
tivity
productivity and employment development in a sector
Figure 22. Productivity and employment development in a sector.
3.5 Experiment 5: Variety
Going back to our hypotheses about variety and efficiency, we find a further confirmation of
our hypothesis on the complementarity of increasing efficiency and increasing variety for
economic development. Not only an adequate succession of new sectors can compensate for
the growing inability of older ones to provide employment but faster entry of new sectors
leads to a higher rate of growth of variety and to a higher rate of growth of employment.
Starting from the sectoral shares displayed in figure 21, we calculated the varieties of each
sector and the aggregate variety of the economic system by means of the informational
entropy function. As we can see in figure 23, the variety of the economic system generally
increases during economic development as a consequence of the creation of new sectors.
However, there are short periods during which variety remains approximately constant or
falls. These periods correspond to the conjunction of the decline of mature sectors and of the
growth of emerging ones. As it was previously pointed out, the birth of a new sector is
triggered by the saturation of a previous one. Such a condition, amounting to an almost
perfect inter-temporal coordination, is not necessarily present in real economic systems. It is
possible for a new sector to emerge either before or after the complete saturation of a pre-
existing one. In the former case we expect both employment and variety to grow at a faster
pace than in our results, in the latter we expect employment and variety growth to slow down.
The latter case would be an example of poor inter-temporal coordination in which the new
sectors are not 'ready' when required. In order to display a greater number of sectors in the
calculations performed to obtain this figure we accelerated the process of development with

34
respect to that of the standard scenario by increasing the rate of learning k14 (see experiment
2).
Figure 23: Change in aggregate variety during the development of the economic system. A
higher rate of learning than in the standard scenario has been used to display a greater number
of sectors.
Figure 24 shows the relationship between employment and variety. There is a general trend
towards increasing employment as variety grows, but employment may fall during short
periods, presumably when the rate of variety growth is lower. In fact, the periods of negative
growth of employment in figure 24 correspond to the periods when variety is either growing
very slowly or falling in figure 23. Thus, this figure seems to confirm the generally positive
relationship between the variety of the economic system and the level of employment it can
sustain.
Figure 24: The relationship between employment and variety.
In order to further test the relationship between variety and employment creation we
calculated dL/dt as a function of variety. Different values of variety were obtained by varying
technological opportunity, the rate of learning and productive efficiency. The rate of creation
of new sectors, and thus the rate of variety growth, is accelerated by increasing each of these
variables, but by different mechanisms. Increasing the rate of learning accelerates the
15
25
0 0,2 0,4 0,6 0,8 1 1,2 1,4 1,6 1,8 2 2,2
relationship betw een variety and employment (k5 = 0.025)
employment
variety
0,00
0,40
0,80
1,20
1,60
2,00
2,40
0 500 1000 1500
variety
time

35
emergence of new sectors but leaves almost unchanged the maximum demand of each sector.
Increasing technological opportunity accelerates the rate of creation of new sectors and the
maximum demand in each sector. Increasing productive efficiency accelerates the rate of
creation of new sectors but reduces the number of firms that can supply even an increasing
demand. We can expect variety growth obtained by these different mechanisms to have
different effects on employment creation. If we remember that in this model variety depends
on the number of distinguishable sectors in the economic system, we can understand that a
higher level of demand or a lower number of firms can lead to different employment levels at
equivalent variety. Figures 25 and 26 show the effect of variety on the rate of employment
creation and figures 27 and 28 the effect of variety growth on the rate of employment
creation. Both higher levels of variety and higher rates of variety growth have a generally
positive effect on the rate of employment creation, except for the case in which variety is
increased by raising productive efficiency. In this case the positive effect of variety due to the
increasing number of economic activities corresponding to the sectors is more than
compensated by the rise in productive efficiency. As a result of these experiments our
hypothesis N° 1 may need to be slightly modified. Variety growth is likely to be a necessary
requirement for the continuation of long term economic development, and in most of the
situations we explored it contributes positively to employment creation, but it is not a
sufficient condition under all circumstances. It is still possible for productive efficiency to
increase fast enough to compensate the positive effect of variety growth.
Figure 25: Effect of variety on employment creation. The changes in variety are here obtained
by changing the rate of learning.
0,005
0,01
0,1 0,2 0,3 0,4 0,5 0,6 0,7
variety (av.)
dL/dt

36
Figure 26: Effect of variety on the rate of on employment creation. The changes in variety are
here obtained by changing k20, the rate constant for learning by doing.
0
0.001
0.002
0.003
0.004
0.005
0.006
0.007
0.008
0.009
0.01
0.0006 0.001 0.0014 0.0018
dL/dt
dH/dt
increasing k14 from 0.005 to 0.04 (step-size: 0.005)
Figure 27: The effect of variety growth on employment creation. Variety is changed by
changing k14, the rate of learning.
0
0.002
0.004
0.006
0.008
0.01
0.012
0.014
0.016
0.018
0.02
0.0009 0.001 0.0011 0.0012 0.0013 0.0014 0.0015 0.0016 0.0017
dL/dt
dH/dt
increasing k13 from 25 to 250 (step-size: 25)
Figure 28: The effect of variety growth on employment creation. Variety is changed by
changing k13, technological opportunity.
-0,002
0
0,002
0,004
0,006
0,008
0,01
0,012
0,014
0,25 0,26 0,27 0,28 0,29 0,3
variety (av.)
dL/dt

37
3.6 Experiment 6: Inter-sector Coordination and Macro-economic Trends
The basic features of the economic system simulated by this model seem to indicate the
existence of an industry life-cycle (ILC). This life-cycle is essentially driven by competition.
As a new innovation creates an adjustment gap, thus defining the scope of the sector, early
entrants find them in a situation of temporary monopoly. As imitation induces entry, the
intensity of competition increases, thus reducing further entry and eventually stimulates exit.
The intensity of competition does not only affect the dynamics of one population, but also of
the subsequent ones. The attainment of very intense competition in a population induces the
creation of new niches, where the early entrepreneurs will again enjoy a temporary monopoly.
The process of economic development simulated in this model involves a set of overlapping
and interacting populations/sectors. Let us also observe that the life-cycle predicted by the
model is the result of the balance of entry and exit, as determined by the adjustment gap, by
the intensity of competition and by mergers and acquisitions, without any reference to either
dominant designs (Utterback and Suarez, 1994) or to the balance between product and process
innovations (Klepper, Simons, 1997). Thus although industry life-cycles can be created by
different factors, including dominant designs and increasing returns to R&D, an ILC can also
be created by the joint dynamics of competition and demand. This is a genuine prediction
since our hypotheses on competition and demand cannot be expected ex-ante to produce a
cyclical behaviour under all possible circumstances.
In this experiment we investigate the effect of inter-sector coordination on macroeconomic
growth paths. Above we have seen that the time of emergence of a new sector can be affected
by the parameters of search activities. Inter-sector coordination can be measured by the delay
between the creation of sector n and that of sector (n+1). With an adequate inter-sector
coordination the growing employment creating capacity of sector (n+1) can be expected to
compensate for the falling capacity of sector n. Thus, not only new sectors need to be created
but they need to be created at the right times. Furthermore, we can expect a long delay
between sectors n and (n+1) to hinder the process of compensation, with employment falling
in sector n before it recovers due to the influence of sector (n+1). This process will interact
with the duration of the ILC, since when there is a ‘long’ ILC in sector n, macro-economic
stability will be more tolerant of a delay in the creation of sector (n+1). In principle the factors
that influence the shape and duration of the ILC can be expected to interact with the inter-
sector delay. Studying the joint influences of the factors affecting the ILC and of inter sector
delays should enable us to derive the most favourable conditions for the emergence of a

38
sustainable macro-economic growth path. We can expect that the shorter are ILCs the faster
the economic system will have to create new sectors in order to provide a balanced growth
path, which means one with a high trend rate of growth and with limited fluctuations. Figure
29 shows that the rate of growth of aggregate employment is considerably affected by inter-
sector delays.
-
10
20
30
40
50
60
70
80
90
100
1 101 201 301 401
slow entry semi slow standard
semi fast fast entry
employment trends for different entry speeds of new sectors
t
Fig 29: Effect of inter-sector coordination on the aggregate employment growth path
Figure 29 shows that the rate of growth of employment rises systematically as the rate of
entry of new sectors into the economy increases. Furthermore, in addition to affecting the
slope of the employment growth path, inter-sector coordination affects also the fluctuations in
employment arising from the patterns of growth and decay of different sectors. Figure 30
shows the combined effects of inter-sector coordination on the slope and on the fluctuations
of the employment growth path. As we can see from figure 29, the rate of the employment
growth rises with a growing rate of entry of new sectors but the fluctuations behave in a more
complex way, increasing first, then falling and subsequently increasing again. Considering
that a sustainable economic development is likely to require a high rate of employment
growth but low employment fluctuations, we are tempted to say that the most sustainable
economic development paths are likely to be found at the centre of figure 30.

39
Fig 30: Influence of the rate of entry of new sectors on the rate of
growth and on the fluctuations of employment
In summary, these experiments, although still limited, prove that inter-sector coordination can
exert an important influence on the rate of growth and on the fluctuations of employment, and
therefore on the sustainability of economic development. More precisely, a growing rate of
entry of new sectors into the economy raises the rate of employment growth but has a more
complex effect on the fluctuations of employment. To explore the conditions required to give
rise to the most sustainable economic development paths requires further work.
3.7. Experiments 7: The Co-Evolution of Technologies and Financial Institutions
In the experiments described here, we assess the impact of changes in the values of the
constants k3 and k2 on the creation of firms in each sector and on the rate of creation of
employment. Figures 31 and 32 show the effect of varying k3 from 0.1 to 0.3 for k2 = 1. It
can be clearly seen that, for values of k3 superior to 0.1, the economic system’s ability to
create new firms collapses. Given that economic development cannot be expected to proceed
without the creation of firms, the previous result leads us to expect that the overall process of
economic development will stop for k3 above a given threshold value.
-
10
20
30
40
50
1 101 201 301 t
Nit
-0.1
0
0.1
0.2
0
0.25
0.5
0.75
1
1.25
trend fluctuation
slow
entry
fast
entry
volatility and trend of different entry trend fluctuations

40
figure 31: Number of firms (k2 = 1; k3 = 0.1)
-
10
20
30
40
50
1 101 201 301 t
Nit
figure 32: Number of firms (k2 = 1; k3 = 0.3)
However, the threshold value of k3 rises with growing values of k2. In figures 33 and 34, we
show the results of similar experiments for higher values of k2 (k2 =2), which means a higher
availability of financial resources for all sectors. For this value of k2 strange fluctuations
emerge for k3-values around 0.5. The meaning of this result is clear: the richer an economic
system is in financial resources the greater its ability to absorb the effects of a bubble due to
excessive expectations of returns by investors in emerging sectors. Conversely, the richer an
economic system is in financial resources the easier it will be to find financial resources to
invest in emerging sectors. Higher general financial availability (k2) accordingly allows for
faster economic development, as single sectors can obtain larger portions (k3) of the available
financial resources without detrimental effects to other industries. This result could be
interpreted as implying the existence of increasing returns: the rich get richer. However, if
there are increasing returns, they are increasing returns with caution. If the rich get richer,
they are also most likely to create bubbles which will slow down their process of economic
development.
-
10
20
30
40
50
1 101 201 301 401 t
Nit
fig 33: Number of firms for k3 =0.2 and k2 = 2.

41
-
10
20
30
40
50
1 101 201 301 401 t
Nit
fig 34: Number of firms for k3 =0.5 and k2 = 2.
-
10
20
30
40
50
60
70
80
90
1 101 201 301 401
aggregate employment
time
fig 35: Employment creation for k3 = 0.1 and k2 = 1
-
10
20
30
40
50
60
70
80
90
1 101 201 301 401
aggregate employment
time
fig 36: Employment creation for k3 = 0.35 and k2 = 1
The emergence of strange behavior is confirmed also for employment creation. In this case as
well, and for the same values of k3 and k2, the behavior of the system becomes strange as we
raise k3 (figures 35 and 36). These results show that the behavior of the system changes
markedly and becomes strange for values of k3 above a threshold value. This led us to suspect
that the strange behavior could in fact be chaotic. We decided to carry out tests for the
presence of chaotic behavior. It has to be pointed out from the beginning that these tests were
designed to detect deterministic chaos generated by one equation. In contrast, the behavior of
our economic system is the result of complex interactions in a system of equations. Thus, in
our case, the results of these tests cannot be fully conclusive but are in line with procedures

42
suggested in non-linear econometrics (e.g. Dechert and Gencay, 1992). To start with, we
construct phase portraits, in which the behavior of the system at a given time is represented as
a function of the behavior of the system at a previous time. For non chaotic behavior, the
phase portraits are smooth curves (figure 37, left), while, in chaotic regions, they become
strange and apparently inexplicable (figure 37, right).
-0.02
0
0.02
0.04
0.06
0.08
0.1
-0.02 0 0.02 0.04 0.06 0.08 0.1
dWt/d
t
dWt+1/dt
-0.4
-0.3
-0.2
-0.1
0
0.1
0.2
0.3
0.4
0.5
-0.02 0 0.02 0.04 0.06 0.08 0.1
dWt/d
t
dWt+1/dt
figure 37: Phase portrait for employment creation (k3 = 0.1, left, and k3 = 0.2, right)
Since these phase portraits resemble those of time series characterized by deterministic chaos
(e.g. Kantz & Schreiber 1997), we decided to perform some econometric tests estimating the
Lyapunov-exponents which describe the sensitive dependence on initial conditions.
Lyapunov-exponents below zero characterize systems with stable fixed points, whereas
exponents larger than zero indicate chaos, in the sense of the unpredictability of the future
despite a deterministic development (see Kantz and Schreiber 1997, chapter 5).
The econometric tests are performed with the chaos package in R. For this purpose, we first
have to simulate long time series (1500 periods). For our standard scenario, k2 =1, k3 = 0.1,
we get a maximum Lyapunov-Exponent R = -1.558, which excludes the possibility of chaotic
behavior in this case. Figure 38 shows that the Lyapunov-exponent remains negative for a
large number of iterations, which follow the neighbours of each point under consideration, i.e.
the system remains within its trajectory. When we increase slightly, k3 (k2 =1, k3 = 0.2), the
estimated maximum Lyapunov-Exponent, becomes positive (R = 2.62), indicating that our
system shows now a behavior which resembles deterministic chaotic behavior (Figure 39).

43
Time
R
0 50 100 150 200
-5-4
-3-2
fig 38: Lyapunov-exponents (s=200) for k2 = 1, k3 = 0.1
Time
R
0 50 100 150 200
-2-1
01
2
figure 39: Lyapunov-exponents (s=200) for k2 = 1, k3 = 2
We can gain a better understanding of the dynamics of the interaction between financial
institutions and technologies by plotting the number of firms and financial availability as
functions of time (figure 40) during the period in which the transition between the 'normal'
and the ‘chaotic’ regimes occurs. For the fourth industrial sector this happens between t=308
and t=318. In figure 40 the bold curve represents the fourth sector, the normal curves
represent the first, second and third sector respectively. We can immediately see that (i) the
number of firms in all four sectors represented starts falling earlier and shows a more
pronounced decline in the chaotic than in the 'normal' regime (figure 40 a, c); (ii) financial
availability shows a much greater volatility and a much more drastic fall in the chaotic than in
the 'normal' regime (figure 40 b, d). In fact, figure 40 shows that the immediate impact of the

44
onset of chaos on financial availability is much faster and more pronounced than on the
number of firms.
Stable scenario
-
5
10
15
20
25
30
35
306 308 310 312 314 316 318 320
Number of firms (a)
Chaotic scenario
-
5
10
15
20
25
30
35
40
306 308 310 312 314 316 318 320
Number of firms (b)
-
0.2
0.4
0.6
0.8
1.0
1.2
306 308 310 312 314 316 318 320
Financial availability (c)
-
0.2
0.4
0.6
0.8
1.0
1.2
306 308 310 312 314 316 318 320
Financial availability (d)
fig 40: Comparison of Ni (number of firms in sector i, a and b) and of FAi (Financial
availability in sector i, c and d) in the transition periods between the pre-chaotic and the
chaotic regimes.
At this point, to have a better idea of the changes in behavior we could expect as we varied kx
and k2, we explore more systematically the parameter space of these two constants. The
results are shown in figure 41. There it can be seen that, for low values of k2, system behavior
becomes ‘chaotic’ for very low values of k3, and that values of the Lyapunov exponents
higher than 1 are only attained for k2 smaller than 2.5. In figure 41 we identify regions of
parameter space where economic development can easily occur (negative values of Lyapunov
exponents) and regions where it cannot (positive values of Lyapunov exponents). These
regions can be represented as valleys and peaks, the former providing conditions conducive to
economic development and the latter hindering it. Figure 41 implies that there is no unique
development path which all economic systems will have to follow in order to develop but that
there are ranges of conditions (corridors) within which economic development can occur and
other ranges where it is very difficult or impossible. The finding is compatible with the

45
observation that there are persistent asymmetries amongst countries for what concerns their
output structure and the institutional configurations required to produce such output
structures, asymmetries which underlie the concept of National Innovation System (Lundvall,
1992, Nelson, 1992).
0.1 0.15 0.2 0.25 0.3 0.35 0.4 0.45 0.50.5
1
1.5
2
2.5
3
3.5
2-3
1-2
0-1
-1-0
-2--1
-3--2
-4--3kx
k3
Lyapunov-
Exponent
fig 41: Emergence of ‘chaotic’ behavior as a result of the joint variation of k3 and of k2. White
regions correspond to normal behavior, while grey regions of increasing darkness correspond
to ‘chaotic’ behavior.
-2.5
-2
-1.5
-1
-0.5
0
0.5
1
1.5
2
0 0.1 0.2 0.3 0.4 0.5 0.6
1 2 3
Lyapunov
kx
variation of k3
fig 42: Variation of Lyapunov exponents as a function of k3 for different values of k2.
Figure 42 displays Lyapunov exponents from experiments varying k3 for different values of
k2. The general result of these experiments confirms our expectations from observing the
development of sector evolution as well as employment evolution, and shows that the region
where the behavior of our economic system is pre-chaotic when we vary k3 becomes wider for
higher values of k2, although the effect of k2 is not linear.
So far we have proved that the behavior of our economic system can become ‘chaotic’ as a
result of the co-evolution of technologies and of financial institutions. An increasing intensity
of feedback between technologies and financial institutions can accelerate the process of

46
economic development, but beyond a given intensity, the system moves to a ‘chaotic’ regime
and loses its ability to develop further. A higher intensity of feedback occurs when, for a
given differential rate of growth of the number of firms in sector i with respect to the average
sector in the economy, financial institutions allocate a greater amount of resources to sector i.
When such amount of resources, which is subject to a high uncertainty, is too low, the system
will not achieve its full potential. If the amount of feedback is too high, financial institutions
allocate an excessive amount of resources to sector i which at the same time means that
financial resources are taken away faster from previous sectors i-1. The amount is excessive if
it cannot achieve an adequate rate of return, thus leading to the collapse of financial
institutions and, in turn, of the whole system. In other words, the onset of chaotic behavior
coincides with a bubble like behavior in which an overestimate of the development potential
of particular technologies and markets by financial institutions leads the whole economic
system to an at least temporary collapse. ‘Chaotic’ behavior is not good for economic
development.
What we still do not know at this point is how the behavior or our system changes in the pre-
chaotic region. The results of further experiments carried out to explore this point are shown
in figure 43.
-0.1
-0.08
-0.06
-0.04
-0.02
0
0.02
0.04
0 0.1 0.2 0.3 0.4 0.5 0.6
1 2 3
trend of employment
grow th
kx
variations of k3
fig 43: Trend of employment growth as a function of k3 for different values of k2.
In figure 42, we can see that the range of values of k3 for which non chaotic behavior occurs
becomes wider when k2 rises from 1 to 2 and to 3. We can also see that, in the pre-chaotic
range, employment growth reaches its maximum value just before the onset of the chaotic
regime and the consequent collapse of economic development. In other words, these results
seem to indicate that the best conditions for economic evolution occur at the edge of chaos.

47
This result can be interpreted by combining the uncertainty which affects the behaviour of
entrepreneurs, uncertainty which they themselves increase, with the observation that
economic development creates growing diversity but not growing disorder. Our observations
on long term economic development can be better explained by the emergence of more
complex but ordered structures rather than by a growing disorder. The very same concept of
structure implies the existence of constraints amongst the components of the system. Hayek
(1978) maintains that the creation of "order", and not of equilibrium, is one of the main
features of economic development. We can then expect the creation of new economic entities
to contribute to economic development and their emergence to pass through different phases.
In the very early and entrepreneurial phases we can expect higher than average growth rates
and a greater propensity to fluctuations. As the sectors based on the new economic entities
move from emergence to maturity we can expect growth rates to converge to the average for
the economic system and volatility to fall. The presence and dynamics of co-evolution is quite
coherent with a Schumpeterian interpretative framework.
4. Concluding Remarks
In this chapter we give a detailed introduction to our model of economic development driven
by the creation of new industrial sectors. Each sector is considered equal to the population of
firms producing a differentiated product. The dynamics of each sector is determined by the
dynamics of the overlapping populations of firms corresponding to different sectors. The
model dynamics is based on entry, as determined by the adjustment gap created by an
innovation defining the sector, and by exit, as determined by the increasing intensity of
competition and by mergers and acquisitions. The adjustment gap represents the size of the
population of potential adopters of a given product that have not yet adopted. Alternatively,
the adjustment gap can be considered as the part of a given market that is still empty or
unexploited. In turn, the adjustment gap and the rate at which it is closed by the increasing
production capabilities of firms, are influenced by the technological opportunities of different
sectors and by their rate of learning. The dynamics of the emergence of new sectors depends
not only on the creation of new knowledge and innovations, but by the inducements for the
generation of new niches emerging within sectors that were once new and innovating, but
that, due to an increased intensity of competition, become ‘saturated’ and thus devoid of new
opportunities for growth. An increased intensity of competition within one sector, as
determined by the entry of imitators, constitutes the inducement to create a niche that could
subsequently become a new sector.

48
In this model competition for the firms in a sector does not come only from within the sector
(Intra-population or intra-sector) but also from other sectors (inter-population or inter-sector
competition). The model leads to the emergence of a life cycle for each population/sector. The
cycle in this case can be considered a competition life cycle (Saviotti, 1998) since it is started
by the temporary monopoly existing in the early stages and ended by the by the increasing
intensity of competition in the maturity phase. The model thus has a very strong
Schumpeterian flavour.
This model can be considered a very simplified and stylised representation of how economic
development is created by qualitative change, leading to a changing composition of the
system. Given its simplicity, it already provides some very interesting analysis of the effect of
changing composition on economic development. A very large number of experiments can be
performed on the model to vary the relative values of the constants contained in it. We
introduced to a small subset of experiments performed so far. Of course, these experiments do
not exhaust the scope for exploration of the model and there are other variables whose
influence ought to be analysed. We propose to do this in the near future.
The stylised results of the basic scenario show a number of firms that first increases and then
falls, a maximum sectoral demand that increases up to a constant value, a sectoral demand
that increases up to a maximum, falls and then follows a gradually increasing path in the long
term, a rate of mergers and acquisitions that first rises and then falls. On the whole the
behaviour can be described as a life cycle driven by competition. Entry is essentially
determined by an innovation defining the sector, while exit is due to the increasing intensity
of competition and by mergers and acquisitions. An aggregate view of this artificial economic
system allows for computing total income and aggregate employment and gives important
insights on the macroeconomic features of sectoral development.
In summary, the model that we have developed is a dynamic model of growth involving
qualitative change. Furthermore, it is a model of growth in which the aggregate output of the
sector can be calculated by means of the outputs of individual units (firms or sectors). Of
course, the model in its present form is still highly stylised. A number of modifications are
required in order to make it more realistic. One strategy for future research is to improve the
calibration side and to bring the model closer to empirical data. The second strategy we have

49
in mind for future research is to leave the population level and transfer the model into an
Agent-Based-Model (Pyka and Fagiolo, 2007) which will allow us to further investigate the
influence of heterogeneity of the actors’ knowledge and their decision mechanisms.
5. References
Aghion P., Howitt P.(1998), Endogenous Growth Theory, Cambridge, Mass, The MIT Press.
Baumol W.J., Panzar J.C., Willig R.D. (1982), Contestable Markets and the Theory of
Industry Structure, San Diego, Harcourt, Brace Jovanovich.
Cornwall (1977) Modern Capitalism: its Growth and Transformation, London, Martin
Robertson.
Fagerberg J.(2000), Technological progress, structural change and productivity growth: a
comparative study, Working paper N° 5/2000, Centre for Technology, Innovation and
Culture, University of Oslo.
Fagerberg J., and Verspagen B. (1999), Productivity, R&D spillovers and trade, Working
Paper N° 3/1999, Centre for Technology, Innovation and Culture, University of Oslo.
Hayek F.A., Competition as a discovery process, in New Studies in Philosophy, Politics,
Economics and the History of Ideas, London, Routledge, (1978) pp 179-190
Jovanovic B., MacDonald G.M., (1994) The life cycle of a competitive industry, Journal of
Political Economy, Vol. 102, 322-347.
Kantz, H., Schreiber, T. (1997), Nonlinear time series analysis, Cambridge University Press,
Cambridge UK.
Klepper S., (1996) Entry, exit growth and innovation over the product life cycle, American
Economic Review, 86, 562-583.
Lundvall BA (ed) (1992) National Systems of Innovation, London, Pinter
Nelson R.R. (ed) National Innovation Systems, Oxford, Oxford University Press (1992)
Pasinetti L.L. (1981). Structural Change and Economic Growth, Cambridge: Cambridge
University Press.
Pasinetti L.L., (1993), Structural Economic Dynamics, Cambridge, Cambridge University
Press, .
Pyka, A. and Fagiolo, G. (2007), Agent-based modelling: a methodology for a neo-
Schumpeterian modelling, in: Hanusch, H. und Pyka, A. (eds.), The Elgar Companion
on Neo-Schumpeterian Economics, Edward Elgar, Cheltenham U.K., 467-492
Romer P. (1987), Growth based on increasing returns due to specialization, American
Economic Review, Vol. 77, 565-62.
Romer P. (1990), Endogenous technical progress, Journal of Political Economy, Vol. 98, 71-
102.
Salter W.E.G., (1960), Productivity and Technical Change, Cambridge: Cambridge University
Press
Saviotti P. P. (1996), Technological Evolution, Variety and the Economy, Aldershot, Edward
Elgar, UK.

50
Saviotti P.P.(1998), On the dynamics of approriability, of tacit and codified knowledge,
Research Policy, Vol. 26, 843-56.
Saviotti P. P., Pyka A. (2004a), Economic development by the creation of new sectors,
Journal of Evolutionary Economics, Vol.14, 1-35.
Saviotti P.P., Pyka A. (2004b), Economic development, variety and employment, Revue Economique,
Vol 55 (6) special issue on Structural change and Growth, (J.L Gaffard, P.P. Saviotti eds),
(November 2004)
Saviotti P.P., Pyka A. (2004c) Economic development, qualitative change and employment creation,
Structural Change and Economic Dynamics Vol 15 (2004) 265-287.
Saviotti, P.P., Pyka, A. (2008a), Product Variety, Competition and Economic Growth, Journal of
Evolutionary Economics, Vol.18, 167-182.
Saviotti, P.P., Pyka, A. (2008b), Micro and macro dynamics: Industry life cycles, inter-sector
coordination and aggregate growth, Journal of Evolutionary Economics, Vol. 18, 323-348.
Saviotti, P.P., Pyka, A. (2009), The Co-Evolution of Technologies and Financial Institutions,
in: Pyka, A., Cantner, U., Greiner, A. und Kuhn T. (eds.), Recent Advances in Neo-
Schumpeterian Economics - Essays in Honour of Horst Hanusch, Edward Elgar
Cheltenham, 2009, 81-100.
Saviotti, P.P., Pyka, A. (2010), Generalized barriers to entry and economic development,
Journal of Evolutionary Economics, Vol. 20, forthcoming.
Saviotti, P.P., Pyka, A. and Krafft, J. (2007), On the determinants and dynamics of Industry Life
Cycles, presented at the EAEPE-conference in Porto 2007.
Utterback J.M., Suarez F.F., Innovation, competition and industry structure, Research Policy,
Vol 22, (1993) pp. 1-21.

51
Appendix 1: List of Variables:
Nit number of firms in industry i at time t
FAit financial availability in industry i at time t
AGit adjustment gap of industry i at time t
ICit intensity of competition in industry i a t time t
MAit mergers, acquisitions and failures in industry i at time t
Dmaxit maximum demand in industry i at time t
Dit instant demand in industry i at time t
Daccit accumulated demand in industry i at time t
Dispoit disposable income in industry i at time t
Yit product characteristics in industry i at time t
Yit product differentiation in industry i at time t
pit product price in industry i at time t
incomet macroeconomic income at time t
SEit search activities in industry i at time t
Qit output in industry i at time t
ucit unit costs in industry i at time t
labourit employment in industry i at time t
investmentit investment in industry i at time t
CSphysicalit physical capital stock in industry i at time t
CSedit accumulated investment in education in industry i at time t
hit quality of human capital in industry i a t time t
HCit human capital in industry i at time t
wagesit wages in industry i at time t
HCit Human capital in industry i at time t
MCit marginal costs in industry i at time t
TIit exploited technological opportunities in industry i at time t
EXDit Excess demand in industry i at time t
tci production adjustment in industry i at time t
Total_Investmentt macroeconomic investment figure at time t
SEFt fundamental research activities

52
Appendix 2: List of Constants
constant meaning value in standard
scenario
k1 weight for the entry terms 10
k2 overall financial availability 1
k3 speed of adjustment of financial availability 0.05
k4 weight of demand 10
k5 scope for the development of new services 1
k6 speed of the development of new services 0.25
k7 scope for product differentiation 1
k8 speed of product differentiation 0.25
k9 weight for unit costs 1/500
k10 wage adjustment 0.01
k11 value of product services 0.01
k12 value of product differentiation 0.01
k13 overall technological opportunities 10
k14 learning rate 0.025
k15 degree of technological opportunities 2
k16 speed of exploitation of opportunities 0.125
k17 weight of competition term 0.1
k18 ratio between inter- and intra-industry competition 1
k19 weight for mergers and acquisitions 0.01
k20 production efficiency 3
k21 weight for search activities 0.000015
k22 weight of human capital accumulation 1
k23 weight for physical capital stock 0.000005
k24 weight for human capital stock 0.0000005
k25 weight determining labour creation 1
k26 constant determining potential sectoral entry 50
k27 weight for fundamental research activities 100


