Embed Size (px)
Citation preview

April 2011, published 18, doi: 10.1098/rsta.2011.0002369 2011 Phil. Trans. R. Soc. A
A. J. Durant, C. Le Quéré, C. Hope and A. D. Friend global sources and sinks of carbon dioxideEconomic value of improved quantification in
References
related-urlshttp://rsta.royalsocietypublishing.org/content/369/1943/1967.full.html#
Article cited in: l.html#ref-list-1http://rsta.royalsocietypublishing.org/content/369/1943/1967.ful
This article cites 27 articles, 5 of which can be accessed free
Subject collections
(27 articles)biogeochemistry � collectionsArticles on similar topics can be found in the following
Email alerting service herein the box at the top right-hand corner of the article or click Receive free email alerts when new articles cite this article - sign up
http://rsta.royalsocietypublishing.org/subscriptions go to: Phil. Trans. R. Soc. ATo subscribe to
on March 12, 2014rsta.royalsocietypublishing.orgDownloaded from on March 12, 2014rsta.royalsocietypublishing.orgDownloaded from

Phil. Trans. R. Soc. A (2011) 369, 1967–1979doi:10.1098/rsta.2011.0002
Economic value of improved quantification inglobal sources and sinks of carbon dioxide
BY A. J. DURANT1,2,3,*, C. LE QUÉRÉ4,5,†, C. HOPE6 AND A. D. FRIEND7
1Centre for Atmospheric Science, Department of Chemistry,University of Cambridge, Lensfield Road, Cambridge CB2 1EW, UK
2Norwegian Institute for Air Research, PO Box 100, 2027 Kjeller, Norway3Department of Geological and Mining Engineering and Sciences,
Michigan Technological University, 1400 Townsend Drive, Houghton,MI 49931, USA
4School of Environmental Sciences, University of East Anglia,Norwich NR4 7TJ, UK
5The British Antarctic Survey, High Cross, Madingley Road,Cambridge CB3 0ET, UK
6Judge Business School, University of Cambridge, Trumpington Street,Cambridge CB2 1AG, UK
7Department of Geography, University of Cambridge, Downing Place,Cambridge CB2 3EN, UK
On average, about 45 per cent of global annual anthropogenic carbon dioxide (CO2)emissions remain in the atmosphere, while the remainder are taken up by carbonreservoirs on land and in the oceans—the CO2 ‘sinks’. As sink size and dynamics arehighly variable in space and time, cross-verification of reported anthropogenic CO2emissions with atmospheric CO2 measurements is challenging. Highly variable CO2 sinksalso limit the capability to detect anomolous changes in natural carbon reservoirs. Thispaper argues that significant uncertainty reduction in annual estimates of the globalcarbon balance could be achieved rapidly through coordinated up-scaling of existingmethods, and that this uncertainty reduction would provide incentive for accuratereporting of CO2 emissions at the country level. We estimate that if 5 per cent of globalCO2 emissions go unreported and undetected, the associated marginal economic impactscould reach approximately US$20 billion each year by 2050. The net present day valueof these impacts aggregated until 2200, and discounted back to the present would havea mean value exceeding US$10 trillion. The costs of potential impacts of unreportedemissions far outweigh the costs of enhancement of measurement infrastructure to reduceuncertainty in the global carbon balance.
Keywords: carbon; emissions; budget; measurement; climate; economics
*Author for correspondence ([email protected]).†Present address: Tyndall Centre for Climate Change Research, University of East Anglia,Norwich NR4 7TJ, UK.
One contribution of 17 to a Discussion Meeting Issue ‘Greenhouse gases in the Earth system:setting the agenda to 2030’.
This journal is © 2011 The Royal Society1967
on March 12, 2014rsta.royalsocietypublishing.orgDownloaded from

1968 A. J. Durant et al.
1. Introduction
The UN Climate Change Conference 2009 (COP15) in Copenhagen, Denmark,failed to reach agreement on binding cuts in greenhouse gas (GHG) emissions,in part owing to the requirement of compulsory reporting of anthropogenic GHGemissions by all countries and the difficulty in verifying the declared emissions.Carbon dioxide (CO2) is the largest contributor to global GHG emissions, andits relative contribution is growing [1]. Only about 45 per cent of the globalemissions of CO2 from the burning of fossil fuel, cement production, deforestationand other land use change (LUC) remain in the atmosphere on average [2],while the remainder are taken up by the land and ocean carbon reservoirs—theCO2 ‘sinks’.
The sizes of the CO2 sinks are variable and current estimates have alarge uncertainty [3]. Elevated atmospheric CO2 and warming of the climatesystem also influence exchanges of CO2 between surface reservoirs and theatmosphere [4]. Feedback between climate change and the natural carbonreservoirs could lead to large, abrupt and/or irreversible (on 1000 year timescale) changes in carbon reservoirs, and further increases in surface temperature[5–7]. Possible consequences of climate change include: failing water supplies inarid regions; flooding of coastal communities owing to sea-level rise; increasedwildfires; increase in the number and intensity of extreme surface temperaturefluctuations; all of which present high cost to society [8]. It follows that policy-and decision-makers need reliable estimates of the threshold at which possibleabrupt feedbacks in the Earth system may occur, so monitoring of the behaviourof CO2 sinks is essential.
In theory, it should be possible to independently verify CO2 emissions usinga mass balance approach (CO2 emissions = atmospheric CO2 growth + CO2sinks). However, the present uncertainty in the estimates of the sinks is toolarge to provide independent constraints on global emissions, and uncertaintyconcerning atmospheric transport compounds this problem at finer regional-scalespatial resolution [9]. At the same time, uncertainty in CO2 emissions is too largeto enable early detection of unexpected feedbacks in the CO2 sinks, if these wereto occur. Thus, a reduction in the overall uncertainty in the global CO2 budgetwould improve both the capability to verify reported CO2 emissions, and thecapability to detect unexpected feedbacks in the CO2 sinks.
This article aims to assess our ability to quantify the dynamics of theglobal carbon cycle to a minimum level necessary to independently constrainreported CO2 emissions. Additionally, improved emission constraints will increaseknowledge of flux responses to climate forcing and will improve our capabilityto detect climate–carbon feedbacks. The feasibility of uncertainty reductionin the carbon cycle budget and the capital costs of implementing systemsto reduce the uncertainty are also explored. In this paper, we assume thatimprovements in the closure of the global carbon balance will incentivize accuratereporting of CO2 emissions at the country level, and thus constitutes theminimum requirement considered in this paper. Information on the regionalcarbon balance or measurements to resolve regional CO2 emissions indirectlywould provide stronger constraints on regional emissions [10], but these arenot considered here except where necessary to reduce uncertainty in the globalcarbon balance.
Phil. Trans. R. Soc. A (2011)
on March 12, 2014rsta.royalsocietypublishing.orgDownloaded from

Economic value of constraining global CO2 1969
2. Components of the global carbon cycle and current sources of uncertainty
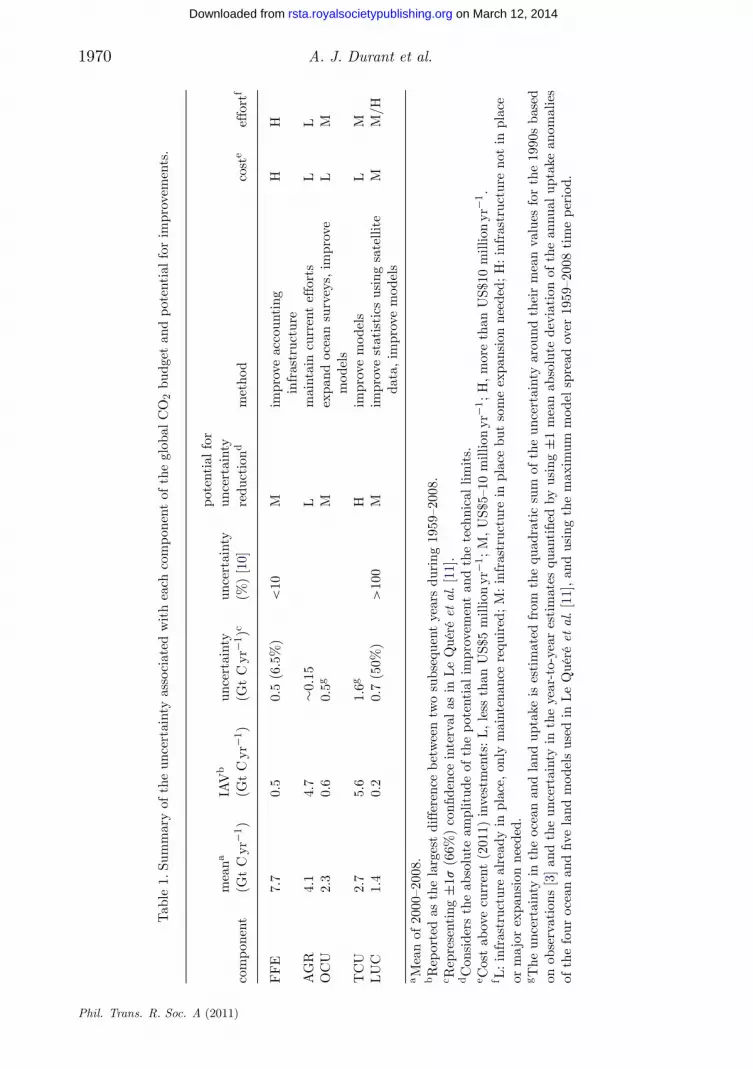
The contemporary global CO2 budget may be broken down into five components(table 1 and figure 1): (i) fossil fuel combustion and cement manufacture-related emissions (FFE) result from the combustion of hydrocarbons extractedfrom the Earth’s crust, with small contributions (approx. 3%) from cementmanufacture and gas flaring; (ii) emissions from LUC result from deforestationand anthropogenic management of terrestrial ecosystems; (iii) atmosphericgrowth rate (AGR) is the proportion of CO2 added to the atmosphere fromanthropogenic CO2 emissions (including oxidation of reduced carbon species suchas methane) minus the CO2 removed by the global sinks; (iv) ocean carbondioxide uptake (OCU) is the net flux of CO2 into the oceans and is primarily aresponse to the AGR [11]; and (v) terrestrial carbon dioxide uptake (TCU) occurswhen ecosystem rates of net primary productivity exceed rates of carbon loss, e.g.through respiration and fire, leading to a net increase in carbon storage. Inter-annual variability (IAV) in atmospheric CO2 concentration is driven primarilyby variability in TCU, with smaller contributions from variability in FFE (linkedclosely to global economies), OCU and LUC [3].
Uncertainty in FFE is ±0.5 Gt C yr−1 (i.e. ±6% of the mean for ±1s) whichstems from inadequate accounting infrastructure and methodologies, and non-standardized reporting; for example, the absence or poor quality of statisticson the rates at which reserves are exploited, stored and utilized, and emissionintensities for various fuel types [12]. Non-transparent and non-standardizedreporting of emissions estimates are particularly large in fast-growing countriesin non-Annex B nations [13]. This uncertainty is increasing through time inabsolute terms because both FFE and the share of global emissions of emergingeconomies are growing (figure 2). Uncertainty in quantification of the AGR islow at 0.15 Gt C yr−1 (approx. ±4% of the mean value). This is mainly owingto the fast mixing rate of the atmosphere, which allows the global averageconcentration to be well characterized with a sparse but strategic high-precisionobservational network.
Uncertainty in OCU is approximately ±0.5 Gt C yr−1 (i.e. ±22% of the meanvalue) which results mainly from uncertainty in the estimates of the long-termmean sink. Regional and global ocean CO2 fluxes and carbon stocks may beestimated indirectly through measurement of atmospheric oxygen [14], CFCs[15], and through oceanic biogeochemical measurements [16,17]. These methodsprovide a combined uncertainty of ±0.4 Gt C yr−1 for the 1990s, as reportedin the IPCC Fourth Assessment Report [3]. Combined estimates from oceanbiogeochemical models have been used to quantify the additional uncertaintyin OCU resulting from limited knowledge of IAV [11].
Uncertainty in LUC is approximately ±0.7 Gt C yr−1 (i.e. ±50% of the meanvalue) which results from uncertainty in the size of carbon stocks, and rates ofdeforestation and conversion of land for agricultural production or pasture, insome cases followed by later abandonment [18–20]. Uncertainty is influenced bycurrent limitations in methodological approaches (especially satellite techniques)to quantify LUC over time.
We estimate the uncertainty in TCU at approximately ±1.6 Gt C yr−1 (i.e.±59% of the mean value) as explained below. There are no methods to estimateTCU directly from in situ measurements. The sum of TCU and LUC can be
Phil. Trans. R. Soc. A (2011)
on March 12, 2014rsta.royalsocietypublishing.orgDownloaded from
1970 A. J. Durant et al.
Tab
le1.
Sum
mar
yof
the
unce
rtai
nty
asso
ciat
edw
ith
each
com
pone
ntof
the
glob
alC
O2
budg
etan
dpo
tent
ialfo
rim
prov
emen
ts.
pote
ntia
lfo
rm
eana
IAV
bun
cert
aint
yun
cert
aint
yun
cert
aint
yco
mpo
nent
(Gt
Cyr
−1)
(Gt
Cyr
−1)
(Gt
Cyr
−1)c
(%)
[10]
redu
ctio
ndm
etho
dco
ste
effo
rtf
FFE
7.7
0.5
0.5
(6.5
%)
<10
Mim
prov
eac
coun
ting
infr
astr
uctu
reH
H
AG
R4.
14.
7∼0
.15
Lm
aint
ain
curr
ent
effo
rts
LL
OC
U2.
30.
60.
5gM
expa
ndoc
ean
surv
eys,
impr
ove
mod
els
LM
TC
U2.
75.
61.
6gH
impr
ove
mod
els
LM
LU
C1.
40.
20.
7(5
0%)
>10
0M
impr
ove
stat
isti
csus
ing
sate
llite
data
,im
prov
em
odel
sM
M/H
a Mea
nof
2000
–200
8.bR
epor
ted
asth
ela
rges
tdi
ffer
ence
betw
een
two
subs
eque
ntye
ars
duri
ng19
59–2
008.
c Rep
rese
ntin
g±1
s(6
6%)
confi
denc
ein
terv
alas
inLe
Qué
réet
al.[1
1].
dC
onsi
ders
the
abso
lute
ampl
itud
eof
the
pote
ntia
lim
prov
emen
tan
dth
ete
chni
callim
its.
e Cos
tab
ove
curr
ent
(201
1)in
vest
men
ts:L,le
ssth
anU
S$5
mill
ion
yr−1
;M
,U
S$5–
10m
illio
nyr
−1;H
,m
ore
than
US$
10m
illio
nyr
−1.
f L:in
fras
truc
ture
alre
ady
inpl
ace,
only
mai
nten
ance
requ
ired
;M
:in
fras
truc
ture
inpl
ace
but
som
eex
pans
ion
need
ed;H
:in
fras
truc
ture
not
inpl
ace
orm
ajor
expa
nsio
nne
eded
.g T
heun
cert
aint
yin
the
ocea
nan
dla
ndup
take
ises
tim
ated
from
the
quad
rati
csu
mof
the
unce
rtai
nty
arou
ndth
eir
mea
nva
lues
for
the
1990
sba
sed
onob
serv
atio
ns[3
]an
dth
eun
cert
aint
yin
the
year
-to-
year
esti
mat
esqu
anti
fied
byus
ing
±1m
ean
abso
lute
devi
atio
nof
the
annu
alup
take
anom
alie
sof
the
four
ocea
nan
dfiv
ela
ndm
odel
sus
edin
Le
Qué
réet
al.[1
1],an
dus
ing
the
max
imum
mod
elsp
read
over
1959
–200
8ti
me
peri
od.
Phil. Trans. R. Soc. A (2011)
on March 12, 2014rsta.royalsocietypublishing.orgDownloaded from

Economic value of constraining global CO2 1971
8(a)
(b)
(c)
(e)
(d)
6
4
2
0
8
6
4
2
0
8
6
4
2
0
2
0
–2
–4
–6
2
0
–2
–4
–61960 1970 1980
year1990 2000 2010
ocea
n si
nkat
mos
pher
icgr
owth
land use changeland sink
foss
il fu
elan
d ce
men
t
Figure 1. Components of the global CO2 budget (Gt C yr−1). (a) CO2 emissions from fossil fuelcombustion and cement production (FFE) and (b) from land use change (LUC), (c) the atmosphericCO2 growth rate (AGR), (d) land CO2 sink (LCU; negative = land uptake), and (e) ocean CO2sink (OCU; negative = ocean uptake). The land and ocean sinks are shown as an average of severalmodels normalized to the mean ocean and land sinks estimated from observations for 1990–2000.The shaded area is the uncertainty associated with each component. See methods in Le Quéré et al.[11] for the sources of data and the text for an explanation of the associated uncertainty. (Adaptedfrom [11].)
estimated from measurement of O2 in the atmosphere [14], which provides anuncertainty for TCU decadal mean of ±1.0 Gt C yr−1 when combined with LUCuncertainty. The variability in TCU could be most accurately estimated from theother terms in the carbon budget (FFE + LUC − AGR − OCU), but here we areprimarily interested in quantifying uncertainty in TCU estimated independently
Phil. Trans. R. Soc. A (2011)
on March 12, 2014rsta.royalsocietypublishing.orgDownloaded from

1972 A. J. Durant et al.
1(a)
0
–1
0
1
0
–1
land use change
1
0
–1
land sinkfo
ssil
fuel
and
cem
ent
1
0
–1
atm
osph
eric
grow
th
1
0
–1
ocea
n si
nk
1960 1970 1980year
1990 2000 2010
(b)
(c)
(e)
(d)
Figure 2. Uncertainty in the components of the global CO2 budget (Gt C yr−1). (a) CO2 emissionsfrom fossil fuel combustion and cement production (FFE) and (b) from land use change (LUC),(c) the atmospheric CO2 growth rate (AGR), (d) land CO2 sink (LCU), and (e) ocean CO2 sink.See text for the sources of uncertainty.
from the other terms in the carbon balance. We used an ensemble of five globalecosystem models (e.g. [21]) to quantify the additional uncertainty in TCUcaused by our limited knowledge of IAV (maximum mean absolute deviation for1959–2008 of ±1.3 Pg C yr−1 [21]). The large spread in the model estimates resultsfrom a low level of understanding of how rates of photosynthesis and respirationvary with soil moisture, atmospheric CO2 concentration and temperature, and inturn, how the terrestrial carbon sink responds to rising CO2 and temperature onlonger time scales.
Phil. Trans. R. Soc. A (2011)
on March 12, 2014rsta.royalsocietypublishing.orgDownloaded from

Economic value of constraining global CO2 1973
3. Feasibility for uncertainty reduction
This section summarizes existing methods that can be used to improve theestimate of each component of the carbon cycle and assesses the respectivepotential for uncertainty reduction in their mean and IAV, time scale ofimplementation, and associated economic and societal costs. We providequalitative estimates only based on our own judgement, where low effort refersto efforts to maintain infrastructure of measurements that are already in place,medium efforts require an expansion of existing infrastructure that can be done byexisting institutions, and high effort requires major expansion or the developmentof new infrastructure beyond existing capacity (table 1). We relate the potentialuncertainty reduction to our assessment of the approximate cost above currentinvestments in order to identify the most efficient strategy.
Reduction of uncertainty in FFE requires improved measurement andaccounting infrastructure, particularly in developing countries; furthermore, thedegree of under-reporting may increase once a global carbon taxation system isin place [22]. Measurement of radiocarbon (14C) can distinguish FFEs of CO2from non-FFEs and sinks, and may provide a new tool that could reduce theassociated uncertainty in atmospheric model inversions [10]. The overall effortis assumed to have a high economic cost (table 1) and will be challenging interms of societal costs. Political commitment and restructuring of internal energyconsumption/production accounting procedures would be required. However, therestructuring will need to occur only once and subsequent recurrent annual costswould be lower.
Improving understanding of the consequences of LUC, such as deforestation,for carbon stocks is challenging, especially on the global scale. Reducing LUCuncertainty requires improved land conversion statistics [23] and greatly improvedunderstanding of carbon allocation to different pools following conversion, forexample, quantification of the amount of carbon released to the atmosphereduring biomass burning and wildfires [24]. We assume that restructuring ofinternal reporting statistics is costly. Dedicated satellite sensors are expensive, butthey can measure changes in vegetation cover over regional scales, as is alreadyroutinely established in Brazil [25,26] and other regions [27].
Improved conversion statistics would resolve only part of the problem.Quantification of carbon stocks using bottom-up methodologies (which accountsfor vegetation density and degradation) requires forest and soil inventories to becompiled every 10 years [28]. High resolution measurements of carbon stocks andfluxes are needed over both short and long time scales, for example, to determinethe impacts of fire and the variability of carbon stocks, respectively. Physicalchallenges include measurement of soil carbon to depths of several metres,over highly variable terrain, often in remote locations. While the cost of suchinventories is low to medium, the human effort is medium as the measurementsare labour intensive. Inventories and their associated costs would need to berepeated each decade, while the reporting statistics would need to be maintainedon an annual basis.
Regarding the partitioning of CO2 emissions, as previously described, theglobal AGR is known with very low uncertainty and requires only maintenanceof the current network. The value of enhanced regional network would come intoplay when regional CO2 budgets are required and to validate land and ocean
Phil. Trans. R. Soc. A (2011)
on March 12, 2014rsta.royalsocietypublishing.orgDownloaded from

1974 A. J. Durant et al.
models, but not directly for global budgets. Reducing uncertainty in OCU fromobservations directly would be possible, both for the long-term mean and for theIAV, particularly through the expansion of repeated pCO2 measurements fromships of opportunity [29]. Expanding the current network comes at low cost andlow effort. One ship line costs approximately US$150 000 per year and sufficientcoverage to recover IAV in the North Atlantic and Pacific [29] could be achieved atapproximately US$2–3 million yr−1 above current investments (A. Watson 2009,personal communication). The Northern Hemisphere observation-based estimatescan be complemented with inversion analysis of atmospheric CO2 concentrationsover the Southern Ocean (e.g. [22]).
At present, process-based and inversion models of ocean carbon fluxes providethe only method to estimate the IAV in the global ocean CO2 sink. There isno systematic effort to validate the models and only a few models (four to six)produce annual estimates of the global CO2 sink [11]. Such a small model ensembleis too limited to encompass all possible sources of errors. Improvements in modelsand data/model integrations through systematic validation would come at lowcost and low effort. Nevertheless, the potential for uncertainty reduction in OCUis relatively small, and may be realistically limited to reduce the uncertainty toabout ±0.3 Gt C yr−1, based on the formal analysis of Watson et al. [29] for theNorth Atlantic and the difficulty to expand the data coverage in remote regions.
It is critical to improve estimates of TCU through approaches that areindependent of emissions data. Direct measurement of changes in biomassand soil carbon content is labour intensive and impractical on the ecosystemscale, so quantification will rely on indirect approaches. Evaluation of carbonfluxes and the calculation of TCU may be improved through the refinement ofatmospheric inversions of measured CO2 concentration. Improvements in modelsand data/model integrations through systematic validation, particularly withregional patterns based on inversions of atmospheric CO2 and flux tower dataor though formal data assimilation systems, would provide constraints on themodel IAV by allowing for a better representation of the regional responseof productivity and respiration to warming and changes in water availability.Whereas it is challenging to determine how such constraints would reduce theuncertainty in IAV, there is a wealth of information that could be used toconstrain model estimates and reduce uncertainty in IAV by up to half its currentvalue (from ±1.3 Pg C yr−1 to approx. ±0.7 Pg C yr−1). The uncertainty in totalTCU (mean + IAV) would decrease from ±1.6 to approximately ±1.2 Pg C yr−1,further if the uncertainty in LUC and O2 detection method can also be improved.Inherent limits in observational coverage and associated uncertainty wouldpreclude further uncertainty reduction. Efforts to improve IAV estimates wouldcome at low cost and low effort as long-term datasets and models are mostlyin place.
When the sum of the possible uncertainty reductions in the partitioning ofOCU and TCU is considered, the combined uncertainty decreases from ±1.7to ±1.2 Gt C yr−1. This is close to the uncertainty in total emissions, which iscurrently ±0.9 Gt C yr−1 and increasing. Such significant uncertainty reductionin annual estimates of the global carbon partitioning would provide incentivefor accurate reporting of CO2 emissions at the country level, as inadequatereporting, if it was widespread, would lead to inconsistencies between the reportedemissions and the estimated partitioning, and in turn, lead to further questioning
Phil. Trans. R. Soc. A (2011)
on March 12, 2014rsta.royalsocietypublishing.orgDownloaded from

Economic value of constraining global CO2 1975
of the available data on a regional scale. It follows that reduction below athreshold uncertainty would be feasible at low cost and low effort, but as it isprimarily based on model improvements that would be constrained by enhancedobservations and understanding, major coordinated effort across the carbon cyclecommunity and sustained long-term observations would be required.
4. Financial and human benefits of reducing current uncertainty
In this study, the economic benefits of implementing an effective monitoringsystem were evaluated using the PAGE09 (Policy Analysis of the GreenhouseEffect) model, which is an updated version of the PAGE2002 integratedassessment model [30–32]. PAGE2002 was previously used to perform calculationsof the economic impacts and social cost of anthropogenic CO2 emissions for theStern review [8] and the Asian Development Bank’s review of climate change inSoutheast Asia [33]. PAGE09 applies simple parametrizations of global climateand financial systems, and accounts for the uncertainty in scientific and economicunderstanding, outlined primarily in the Fourth Assessment Report of the IPCC[34]. The description includes representation of carbon cycle feedbacks and sea-level changes, and assumptions about climate sensitivity based on the currentliterature, i.e. the global temperature rise in response to a doubling of CO2 (meanof 2.6◦C; 5–95% range corresponds to 1.6–4.2◦C with a maximum up to approx.7◦C). Positive impacts, e.g. on terrestrial ecosystem productivity owing to CO2fertilization, are also included. The model explicitly calculates the dependence ofclimate-related impacts on gross domestic product per capita and as changes inexpected utility, and accounts for the impacts of nonlinear and transient carboncycle feedbacks resulting from increased global warming. The PAGE09 calculatedimpacts do include the possibility of economic benefits for small temperature risesand can also account for the economic burden of developing non-carbon-basedinfrastructure (although we do not calculate the latter). The results are reportedas the total global net present value (NPV) of impacts in US$ in year 2005, whichis a parameter that aggregates the computed losses owing to climate change overthe future two centuries, and discounts it back to the present day.
The potential effects of underestimates in national emissions reporting(intentional or non-intentional) were evaluated relative to the cost ofimplementing effective monitoring infrastructure. A series of model scenarios wereevaluated (figure 3): (i) fully effective monitoring infrastructure that measuresemissions with zero uncertainty; (ii) current monitoring infrastructure whichprovides estimates of FFE with uncertainty of ±6.5 per cent (table 1); underthis condition it was assumed nations emit an additional 5 per cent more thanreported; (iii) fully effective monitoring infrastructure in place by 2020; nationsassumed to emit an additional 5 per cent more than reported until 2020; and(iv) the same as (iii) but unreported emissions stop in 2030. All regions wereassumed to sign up to quantitative targets of a 30 per cent decrease in CO2emissions from 2008 levels for Annex 1 countries, and a 30 per cent increase from2008 levels for non-Annex 1 countries.
The total global NPV of climate change impacts associated with FFE,aggregated from present until 2200, and discounted back to the present day, isjust under US$200 trillion (5–95% range is about US$30–670 trillion). Under
Phil. Trans. R. Soc. A (2011)
on March 12, 2014rsta.royalsocietypublishing.orgDownloaded from

1976 A. J. Durant et al.
2000 2005 2010 2015 2020 2025 2030 2035 2040 2045 2050 20550
5
10
15
20
25
year
drop
in lo
sses
(U
S$ b
illio
n)
Figure 3. Projected drop in economic losses from improved emissions monitoring if cheating iseliminated immediately, by 2020 or by 2030. All regions were assumed to sign up to quantitativetargets of a 30% decrease in CO2 emissions from 2008 levels for Annex 1 countries, and a 30%increase from 2008 levels for non-Annex 1 countries. Three scenarios are shown: (blue) drop inlosses if there is no cheating and nations emit as reported; (green) under current monitoringinfrastructure, it is assumed that nations under-report and globally emit an additional 5% ofCO2 until the implementation of a fully effective monitoring infrastructure by 2020, after whichemissions are as reported; and (red) as before if the fully effective monitoring infrastructure is inplace by 2030. The shaded areas show the 25–75% confidence intervals.
scenario (ii), regions emit an additional 5 per cent more CO2 than reportedwhich leads to extra economic losses: the mean extra annual impact increasesfrom about US$2 billion in 2010 to nearly US$20 billion in 2050 (the 5–95%range is from about US$2 billion to over US$45 billion in 2050). The mean NPVof these losses aggregated from today until 2200 and discounted back to thepresent day is just over US$10 trillion, reflecting much greater annual losses inthe second half of this century, and throughout the twenty-second century. Ifimproved monitoring is introduced so that 2030 is the last year in which regionscan ‘cheat’ on emissions reporting, then the mean drop in losses is predicted toincrease from about US$0.5 billion in 2040 to US$4 billion in 2050, comparedto the case with no new monitoring infrastructure (figure 3). The drop in lossesincreases greatly after 2050 (not shown) to about US$400 billion in 2200. Themean NPV of the impacts decreases by about US$7.5 trillion, which correspondsto about 75 per cent of the impacts from cheating on reporting if there is noaddition to monitoring infrastructure. However, if monitoring infrastructure isimproved so that 2020 is the last year in which regions can cheat on reporting,the drop in losses is greater, increasing from about US$3 billion in 2040 to US$8billion in 2050. The mean NPV of the aggregated impacts decreases by about
Phil. Trans. R. Soc. A (2011)
on March 12, 2014rsta.royalsocietypublishing.orgDownloaded from

Economic value of constraining global CO2 1977
US$8.5 trillion, which is about 85 per cent of the losses related to cheating inthe absence of new monitoring. In both cases, the annual mean drop in lossesincreases greatly after 2050, to greater than US$400 billion in 2200.
It follows that the benefits of improved monitoring (i.e. which will act tomitigate the cost of potential impacts) far outweigh the costs of enhancingmonitoring infrastructure by orders of magnitude. Investment in monitoring isnecessary now to reduce the uncertainty and limit the economic impacts fromclimate change related to uncertainty in emissions reporting.
5. Conclusions
We reviewed the sources of errors in the various components of the global CO2budget, and analysed the potential to reduce the errors to a level necessary toprovide independent constraints on reported CO2 emissions. Useful uncertaintyreduction can be achieved with existing methods through a globally coordinatedlong-term effort at low cost and low effort. This basic uncertainty reduction wouldbe sufficient to identify incoherence in reported emissions and/or unexpectedbehaviour in the carbon sinks, but it would not provide further indications of theorigin of the problem. Further reductions in uncertainty necessary to constrain theCO2 emissions at the regional level require a far greater expansion of observationsand models, which includes the refinement of atmospheric inversion techniques,additional space-based sensors and improved data assimilation methods; thiscomes with an associated high cost and high effort [28,35]. Our analysis is inline with a more detailed study by Pacala et al. [10] who conclude that expandedmeasurement infrastructure and improved inventories (focused carbon stocks insoils) are required to reduce uncertainty on FFE at the regional level, especiallyin developing countries. The cost of reducing uncertainty in global carbon balancewith current methods is extremely low in comparison to the potential financialimpacts of undetected and unreported FFEs, which could reach close to US$20billion annually by 2050.
A.J.D. acknowledges the Natural Environment Research Council for support during the writingof this manuscript. Development of the PAGE09 model received funding from the EuropeanCommunity’s Seventh Framework Programme, as part of the ClimateCost Project (Full Costsof Climate Change, grant agreement 212774; www/climatecost.eu), and from the UK Departmentof Energy and Climate Change. A.D.F. received funding from the European Community’s SeventhFramework Programme (FP7/2007–2013) under grant agreement no. 238366. The authors thankRalph Keeling and an anonymous reviewer for thoughtful and constructive reviews that improvedthe manuscript, and Euan Nisbet for editorial coordination.
References
1 Hofmann, D. J., Butler, J. H., Dlugokencky, E. J., Elkins, J. W., Masarie, K., Montzka, S. A. &Tans, P. 2006 The role of carbon dioxide in climate forcing from 1979 to 2004: introduction of theAnnual Greenhouse Gas Index. Tellus B 58, 614–619. (doi:10.1111/j.1600-0889.2006.00201.x)
2 Canadell, J. G. et al. 2007 Contributions to accelerating atmospheric CO2 growth from economicactivity, carbon intensity, and efficiency of natural sinks. Proc. Natl Acad. Sci. USA 104, 18 866–18 870. (doi:10.1073/pnas.0702737104)
3 Denman, K. L. et al. 2007 Couplings between changes in the climate system andbiogeochemistry. In Climate change 2007: the physical science basis. Contribution of Working
Phil. Trans. R. Soc. A (2011)
on March 12, 2014rsta.royalsocietypublishing.orgDownloaded from

1978 A. J. Durant et al.
Group I to the Fourth Assessment Report of the Intergovernmental Panel on Climate Change(eds S. Solomon, D. Qin, M. Manning, Z. Chen, M. Marquis, K. B. Averyt, M. Tignor & H. L.Miller), pp. 499–587. Cambridge, UK: Cambridge University Press.
4 Friedlingstein, P. et al. 2006 Climate–carbon cycle feedback analysis: results from the C4MIPmodel intercomparison. J. Climate 19, 3337–3353. (doi:10.1175/JCLI3800.1)
5 Cox, P. M., Betts, R. A., Jones, C. D., Spall, S. A. & Totterdell, I. J. 2002 Modelling vegetationand the carbon cycle as interactive elements of the climate system. In Meteorology at themillennium (ed. R. P. Pearce), pp. 259–279. San Diego, CA: Academic Press.
6 Le Quéré, C. et al. 2007 Saturation of the Southern Ocean CO2 sink due to recent climatechange. Science 316, 1735–1738. (doi:10.1126/science.1136188)
7 Lenton, T. M. & Schellnhuber, H. J. 2007 Tipping the scales. Nat. Rep. Climate Change 1,97–98. (doi:10.1038/climate.2007.65)
8 Stern, N. 2007 The economics of climate change: the Stern review. Cambridge, UK: CambridgeUniversity Press.
9 Carouge, C., Rayner, P. J., Peylin, P., Bousquet, P., Chevallier, F. & Ciais, P. 2010 Whatcan we learn from European continuous atmospheric CO2 measurements to quantify regionalfluxes—part 2: sensitivity of flux accuracy to inverse setup. Atmos. Chem. Phys. 10, 3119–3129.(doi:10.5194/acp-10-3119-2010)
10 Pacala, T. W. et al. 2010 Verifying greenhouse gas emissions: methods to support internationalclimate agreements. Washington, DC: The National Academies Press.
11 Le Quéré, C. et al. 2009 Trends in the sources and sinks of carbon dioxide. Nat. Geosci. 2,831–836. (doi:10.1038/ngeo689)
12 Marland, G. 2008 Uncertainties in accounting for CO2 from fossil fuels. J. Ind. Ecol. 12, 136–139.(doi:10.1111/j.1530-9290.2008.00014.x)
13 Gregg, J. S. & Andres, R. J. 2008 A method for estimating the temporal and spatialpatterns of carbon dioxide emissions from national fossil-fuel consumption. Tellus B 60, 1–10.(doi:10.1111/j.1600-0889.2007.00319.x)
14 Manning, A. C. & Keeling, R. F. 2006 Global oceanic and land biotic carbon sinks fromthe Scripps atmospheric oxygen flask sampling network. Tellus B 58, 95–116. (doi:10.1111/j.1600-0889.2006.00175.x)
15 McNeil, B. I., Matear, R. J., Key, R. M., Bullister, J. L. & Sarmiento, J. L. 2003 AnthropogenicCO2 uptake by the ocean based on the global chlorofluorocarbon data set. Science 299, 235–239.(doi:10.1126/science.1077429)
16 Dickson, A. G., Sabine, C. L. & Christian, J. R. (eds) 2007 Guide to best practices forocean CO2 measurements. PICES Special Publication no. 3. See http://cdiac.ornl.gov/oceans/Handbook_2007.html
17 Gruber, N. et al. 2009 Oceanic sources, sinks, and transport of atmospheric CO2. GlobalBiogeochem. Cycles 23, GB1005. (doi:10.1029/2008GB003349)
18 Grainger, A. 2008 Difficulties in tracking the long-term global trend in tropical forest area.Proc. Natl Acad. Sci. USA 105, 818–823. (doi:10.1073/pnas.0703015105)
19 Ito, A. et al. 2008 Can we reconcile differences in estimates of carbon fluxes from land-use changeand forestry for the 1990s? Atmos. Chem. Phys. 8, 3291–3310. (doi:10.5194/acp-8-3291-2008)
20 Ramankutty, N., Gibbs, H. K., Achard, F., Defriess, R., Foley, J. A. & Houghton, R. A. 2007Challenges to estimating carbon emissions from tropical deforestation. Global Change Biol. 13,51–66. (doi:10.1111/j.1365-2486.2006.01272.x)
21 Sitch, S. et al. 2008 Evaluation of the terrestrial carbon cycle, future plant geography andclimate-carbon cycle feedbacks using five Dynamic Global Vegetation Models (DGVMs). GlobalChange Biol. 14, 2015–2039. (doi:10.1111/j.1365-2486.2008.01626.x)
22 Nisbet, E. 2007 Earth monitoring: Cinderella science. Nature 450, 789–790. (doi:10.1038/450789a)
23 van der Werf, G. R., Morton, D. C., DeFries, R. S., Olivier, J. G. J., Kasibhatla, P. S., Jackson,R. B., Collatz, G. J. & Randerson, J. T. 2009 CO2 emissions from forest loss. Nat. Geosci. 2,737–738. (doi:10.1038/ngeo671)
24 Ramankutty, N., Gibbs, H. K., Achard, F., Defries, R., Foley, J. & Houghton, R. A. 2007Challenges to estimating carbon emissions from tropical deforestation. Global Change Biol. 13,51–66. (doi:10.1111/j.1365-2486.2006.01272.x)
Phil. Trans. R. Soc. A (2011)
on March 12, 2014rsta.royalsocietypublishing.orgDownloaded from

Economic value of constraining global CO2 1979
25 Asner, G. P., Knapp, D. E., Balaji, A. & Paez-Acosta, G. 2009 Automated mapping oftropical deforestation and forest degradation: CLASlite. J. Appl. Remote Sensing 3, 033543.(doi:10.1117/1.3223675)
26 Asner, G. P. 2009 Tropical forest carbon assessment: integrating satellite and airborne mappingapproaches. Environ. Res. Lett. 4, 034009. (doi:10.1088/1748-9326/4/3/034009)
27 Hansen, M. C., Stehman, S. V., Potapov, P. V., Arunarwati, B., Stolle, F. & Pittman, K.2009 Quantifying changes in the rates of forest clearing in Indonesia from 1990 to 2005 usingremotely sensed data sets. Environ. Res. Lett. 4, 034001. (doi:10.1088/1748-9326/4/3/034001)
28 Ciais, P., Dolman, A. J., Dargaville, R., Barrie, L., Bombelli, A., Butler, J., Canadell, P. &Moriyama, T. 2010 GEO carbon strategy. Geneva, Switzerland: GEO Secretariat; Rome, Italy:FAO.
29 Watson, A. J. et al. 2009 Tracking the variable North Atlantic sink for atmospheric CO2.Science 326, 1391–1393. (doi:10.1126/science.1177394)
30 Hope, C. 2006 The marginal impact of CO2 from PAGE2002: an integrated assessment modelincorporating the IPCC’s five reasons for concern. Integr. Assess. 6, 19–56.
31 Hope, C. 2008 Discount rates, equity weights and the social cost of carbon. Energy Econ. 30,1011–1019. (doi:10.1016/j.eneco.2006.11.006)
32 Hope, C. 2008 Optimal carbon emissions and the social cost of carbon over time underuncertainty. Integr. Assess. 8, 107–122.
33 ADB. 2009 The economics of climate change in Southeast Asia: a regional review. Manila,Philippines: Asian Development Bank.
34 IPCC. 2007 Climate change 2007: synthesis report. Contribution of Working Groups I, II and IIIto the Fourth Assessment Report of the Intergovernmental Panel on Climate Change. Geneva,Switzerland: IPCC.
35 Miller, C. E. et al. 2007 Precision requirements for space-based XCO2 data. J. Geophys. Res.112, D10314. (doi:10.1029/2006JD007659)
Phil. Trans. R. Soc. A (2011)
on March 12, 2014rsta.royalsocietypublishing.orgDownloaded from


