Embed Size (px)
Citation preview

1
The PostThe Post--Apartheid South African Apartheid South African Economy in Perspective: Growth, Poverty Economy in Perspective: Growth, Poverty
and Economic Policyand Economic Policy
Haroon Bhorat, Morne Oosthuizen, Laura PoswellHaroon Bhorat, Morne Oosthuizen, Laura PoswellDevelopment Policy Research Unit,
University of Cape Townwebsite: www.commerce.uct.ac.za/DPRU/
RBA/UNDP Regional Project for Economic Policies in Support of MDGs and Poverty Reduction
1. Contents1. Contents
1.1. IntroductionIntroduction2.2. Macroeconomic Policy In PostMacroeconomic Policy In Post--Apartheid South Apartheid South
AfricaAfrica3.3. Economic PerformanceEconomic Performance4.4. PostPost--Apartheid Fiscal PolicyApartheid Fiscal Policy5.5. PostPost--Apartheid Monetary PolicyApartheid Monetary Policy6.6. Measuring ProMeasuring Pro--Poor Growth In South AfricaPoor Growth In South Africa7.7. The Labour Market As A Key Constraint On The Labour Market As A Key Constraint On
Growth And EmploymentGrowth And Employment8.8. ConclusionConclusion

2
1. Introduction1. Introduction
South Africa = middle income countrySouth Africa = middle income countryGDP in 2002 in US$GDP in 2002 in US$
PPP: PPP: 380 billion380 billionMarket e:Market e: 104 billion104 billion
GDP per capita in 2002 in US$GDP per capita in 2002 in US$PPP:PPP: 98829882Market e:Market e: 28172817
GDP per capita PPP rank = 47GDP per capita PPP rank = 47HDI rank = 111 out of 175HDI rank = 111 out of 175
GDP rank GDP rank –– HDI = HDI = --64 (364 (3rdrd greatest difference)greatest difference)Paper: Policies Paper: Policies –– outcomes in the first 10 outcomes in the first 10 years of democracyyears of democracy
2. 2. Macroeconomic Policy In PostMacroeconomic Policy In Post--Apartheid South AfricaApartheid South Africa
1994 first democratic elections1994 first democratic elections1994 1994 -- Reconstruction and Development Reconstruction and Development ProgrammeProgramme (RDP)(RDP)
Growth through developmentGrowth through developmentGovernment to invest heavily in the poor to increase Government to invest heavily in the poor to increase productivity of resourcesproductivity of resources
1996 1996 –– Growth Employment and Redistribution Growth Employment and Redistribution (GEAR)(GEAR)
Development through growthDevelopment through growthPrivate sector investment to stimulate growthPrivate sector investment to stimulate growth
20012001-- Post GEARPost GEARGrowth remains central but acknowledgement that Growth remains central but acknowledgement that public sector must play greater rolepublic sector must play greater role
Even though changing Even though changing idealogiesidealogies, similar macro, similar macro--policies throughout the periodpolicies throughout the period
3
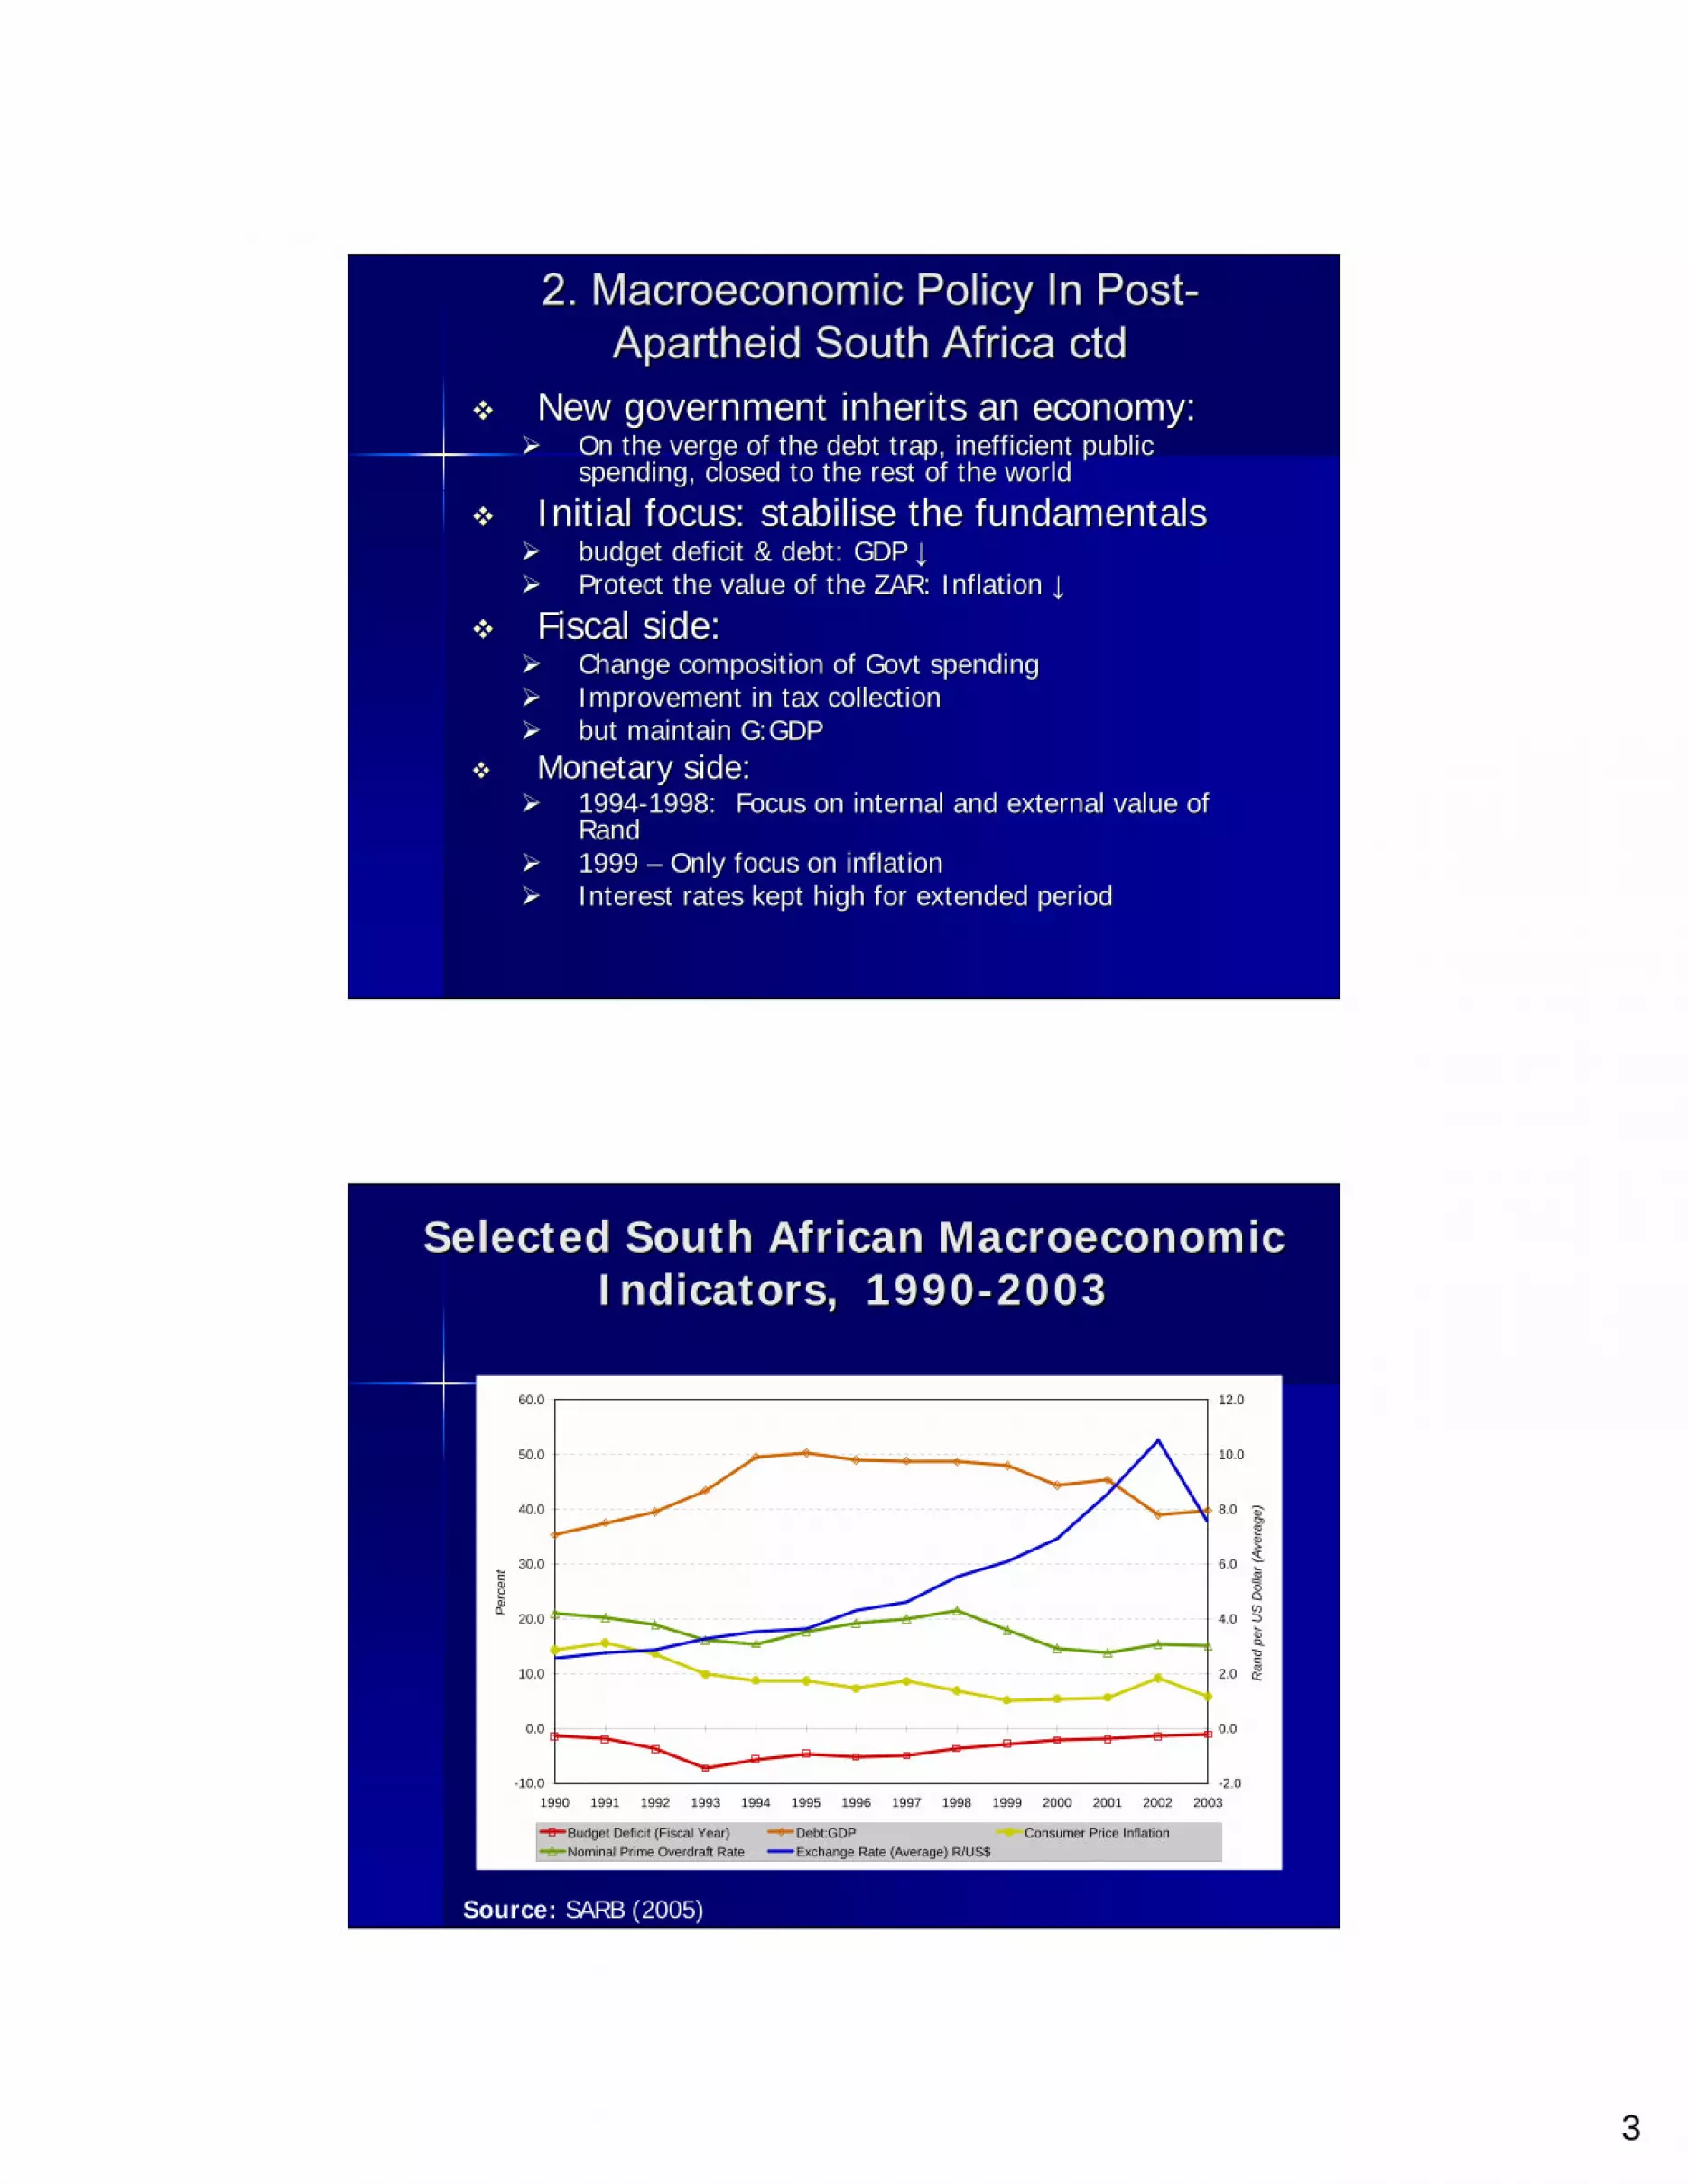
2. 2. Macroeconomic Policy In PostMacroeconomic Policy In Post--Apartheid South AfricaApartheid South Africa ctdctd
New government inherits an economy:New government inherits an economy:On the verge of the debt trap, inefficient public On the verge of the debt trap, inefficient public spending, closed to the rest of the worldspending, closed to the rest of the world
Initial focus: Initial focus: stabilisestabilise the fundamentalsthe fundamentalsbudget deficit & debt: GDP budget deficit & debt: GDP ↓↓Protect the value of the ZAR: Inflation Protect the value of the ZAR: Inflation ↓↓
Fiscal side:Fiscal side:Change composition of Change composition of GovtGovt spendingspendingImprovement in tax collection Improvement in tax collection but maintain G:GDPbut maintain G:GDP
Monetary side:Monetary side:19941994--1998: Focus on internal and external value of 1998: Focus on internal and external value of RandRand1999 1999 –– Only focus on inflationOnly focus on inflationInterest rates kept high for extended periodInterest rates kept high for extended period
Selected South African Macroeconomic Selected South African Macroeconomic Indicators, 1990Indicators, 1990--20032003
Source: SARB (2005)
-10.0
0.0
10.0
20.0
30.0
40.0
50.0
60.0
1990 1991 1992 1993 1994 1995 1996 1997 1998 1999 2000 2001 2002 2003
Perc
ent
-2.0
0.0
2.0
4.0
6.0
8.0
10.0
12.0
Ran
d pe
r US
Dol
lar (
Aver
age)
Budget Deficit (Fiscal Year) Debt:GDP Consumer Price InflationNominal Prime Overdraft Rate Exchange Rate (Average) R/US$

4
3.3. Economic PerformanceEconomic Performance
-20.0
-15.0
-10.0
-5.0
0.0
5.0
10.0
15.0
20.0
25.0
1990 1991 1992 1993 1994 1995 1996 1997 1998 1999 2000 2001 2002 2003
Per
cent
Real GDP Growth Public Investment Growth Private Investment Growth
Growth and Investment, 1990-2003 (Real Percentage Change (2000 Prices))
Source: SARB (2005)
3.3. Economic Performance Economic Performance
1994 1994 –– 2003 growth in 2003 growth in Real GDP = 2.9% paReal GDP = 2.9% paPopulation = Population = ±±2% pa2% paReal GDP per capita = 0.86Real GDP per capita = 0.86
Insufficient investmentInsufficient investmentLow savingsLow savingsImproving Consumption (largely M)Improving Consumption (largely M)↑↑s in X and M : GDPs in X and M : GDPNarrow Ue:17.5% (1995) to 28.2% (2003)Narrow Ue:17.5% (1995) to 28.2% (2003)Broad Broad UeUe : 30.8% (1995) to 41.8% (2003): 30.8% (1995) to 41.8% (2003)

5
3.3. Economic Performance Economic Performance ctdctd: Welfare shifts: Welfare shifts
Source: Hoogeveen and Ozler (2004).
Poverty line = R322 per person per month (2000 Rands)
Headcount Poverty Gap
Ratio Gini 1995 2000 1995 2000 1995 2000 African 0.68 0.67 0.32 0.34 * 0.467 0.501 (0.01) (0.01) (0.00) (0.01) (0.007) (0.005) Coloured 0.50 0.35 * 0.19 0.13 * 0.439 0.453 (0.02) (0.02) (0.01) (0.00) (0.009) (0.008) Asian 0.08 0.07 0.02 0.02 0.398 0.374 (0.01) (0.02) (0.00) (0.01) (0.019) (0.014) White 0.01 0.01 0.00 0.00 0.344 0.319 (0.00) (0.01) (0.00) (0.00) (0.007) (0.009) Urban 0.36 0.40 * 0.14 0.16 * 0.527 0.533 (0.01) (0.01) (0.00) (0.00) (0.006) (0.006) Rural 0.75 0.80 * 0.37 0.44 * 0.493 0.502 (0.01) (0.01) (0.01) (0.01) (0.009) (0.008) South Africa 0.58 0.58 0.27 0.29 * 0.565 0.577 (0.01) (0.01) (0.01) (0.01) (0.005) (0.005)
Government ExpenditureGovernment ExpenditureBudget deficit Budget deficit ↓↓G:GDP = 28% in 1996, 24.5 in 2000G:GDP = 28% in 1996, 24.5 in 2000--2002, now 2002, now ↑↑ingingagainagain↓↓s in real terms from R256 billion in 1997 to R245 s in real terms from R256 billion in 1997 to R245 billion in 2000 (2000)billion in 2000 (2000)ProcyclicalProcyclicalContractionaryContractionary up to postup to post--GEARGEAR
But: Composition changesBut: Composition changesAlso: Fiscal incidence has improved:Also: Fiscal incidence has improved:
ITO social spending (Van der Berg)ITO social spending (Van der Berg)1975: 1975: 55% on Whites, 28% on Africans55% on Whites, 28% on Africans1993: 1993: 15% on Whites, 70% on Africans15% on Whites, 70% on Africans19951995--2000: 2000: Concentration index Concentration index ↓↓s further from s further from --
0.057 to 0.057 to --0.1200.120

6
Selected Components of Government Expenditure (Share of Total Expenditure)
0.0
10.0
20.0
30.0
40.0
50.0
60.0
Social Selected Other Social Selected Other Social Selected Other Social Selected Other
1990/1 1995/6 2000/1 2005/6
Per
cent
Education InterestHealth DefenceSocial Security and Welfare Services PoliceHousing and Community Development
Source: Statistics South Africa (various years)
Household Services Access by Household Services Access by Income Quintile, 1996 and 2001Income Quintile, 1996 and 2001
Quintiles 1996 Quintiles 2001 1 2 3-5 Total 1 2 3-5 Total DWELLING TYPES
Formal 44 50 76 64 54 57 79 69 Informal 19 16 15 16 23 15 14 16 Traditional 35 33 7 18 23 28 7 15
WATER ACCESS Piped 64 66 90 80 74 72 89 82 Borehole/tank/vendor 8 10 4 6 5 6 3 4 Spring/river/dam/pool 26 22 5 12 15 17 4 9
ENERGY SOURCE: LIGHTING Electricity 33 37 74 58 54 57 80 69 Paraffin 21 19 8 13 10 9 5 7 Candles 45 43 18 29 35 33 14 23
Source: Census 1996 and Census 2001, 10% samples

7
Household Services Access by Household Services Access by Income Quintile, 1996 and 2001Income Quintile, 1996 and 2001
Quintiles 1996 Quintiles 2001 1 2 3-5 Total 1 2 3-5 Total
SANITATION Flush/ chemical toilet 22 23 69 50 35 29 68 53 Pit latrine 47 50 21 32 38 43 20 28 Bucket latrine 6 7 4 5 5 5 3 4 None 24 20 6 12 21 22 8 14
TELEPHONE In this dwelling/cellular phone 8 8 43 29 21 23 58 42 At a public telephone nearby 42 39 33 36 54 47 29 38 At another location 17 23 15 17 17 20 9 13 No access to a telephone 33 30 9 18 9 10 4 6
Source: Census 1996 and Census 2001, 10% samples
Fiscal IncidenceFiscal Incidence
Education Education 1/5 of national budget1/5 of national budgetVan der Berg estimates education cost index:Van der Berg estimates education cost index:1997: African=100, Whites = 1711997: African=100, Whites = 1712002: African=100, Whites = 128.8 (better 2002: African=100, Whites = 128.8 (better qualified teachers)qualified teachers)National norms and standards with poorer National norms and standards with poorer schools receiving proportionally higher funding schools receiving proportionally higher funding (poorest 40% loaded)(poorest 40% loaded)
HealthHealthFocus on Clinics (where the rural poor go)Focus on Clinics (where the rural poor go)

8
Fiscal Incidence Fiscal Incidence ctdctd
Social Grants Social Grants ±± 10 million recipients, > R2.5 billion 10 million recipients, > R2.5 billion (effecting about 50% of households)(effecting about 50% of households)Many rural, women, elderlyMany rural, women, elderlyMeans testedMeans testedWoolard estimates:Woolard estimates:Grants>2/3rds total income in poorest Grants>2/3rds total income in poorest 20% of households, 13% in 20% of households, 13% in quintquint 22Substantial poverty alleviation impact: Substantial poverty alleviation impact: almost halves poverty for the elderly almost halves poverty for the elderly Additional positive effects Additional positive effects –– school school attendance, employment ratesattendance, employment rates
Social Grants: Concentration CurveSocial Grants: Concentration Curve
0.0
10.0
20.0
30.0
40.0
50.0
60.0
70.0
80.0
90.0
100.0
1 2 3 4 5 6 7 8 9 10 11 12 13 14 15 16 17 18 19 20
Five Percent Quantiles of Households
Cum
ulat
ive
Prop
ortio
n
CSGOAPAll GrantsDiagonal
Concentration Curve of Grant Recipients by Household Per Capita Expenditure Quantile, 2003
Source: GHS 2003.

9
Social Spending by Income Social Spending by Income DecileDecile, 1995, 1995--20002000
Source: Van der Berg (2005: 33-34) and own calculations.
Category Year Decile 1
Decile 2
Decile 3
Decile 4
Decile 5-10
Total
1995 11.5 15.3 13.8 11.9 47.5 100.0 School Education 2000 11.6 18.2 16.6 13.9 39.7 100.0
1995 3.7 3.9 2.8 4.0 85.6 100.0 Tertiary Education 2000 4.7 2.4 3.0 4.0 85.9 100.0
1995 13.3 12.8 12.2 13.3 48.4 100.0 Health 2000 12.5 16.0 14.7 13.3 43.5 100.0 1995 43.2 15.5 10.2 7.6 23.5 100.0 Social Grants 2000 38.3 23.1 9.6 7.3 21.7 100.0 1995 16.9 13.8 11.9 11.0 46.4 100.0 Total 2000 17.1 17.3 13.4 11.5 40.7 100.0 1995 R2 611 R1 723 R1 597 R1 608 R1 655 R1 760 Spending per
capita 2000 R3 147 R2 385 R1 993 R1 890 R1 670 R2 006 Per capita change (percent)
1995-2000
20.5 38.4 24.8 17.5 0.9(7.3 to -
5.9)
14.0
InequalityInequality
Van der Berg estimates in 1995:Van der Berg estimates in 1995:PrePre--transfer incometransfer income :: GiniGini= 0.66= 0.66-- taxestaxes :: GiniGini= 0.64= 0.64+ social spending+ social spending :: GiniGini=0.44=0.44butbut↑↑s in access s in access vsvs outcomesoutcomesE.g. health and educational attainmentE.g. health and educational attainmentNow: Now: ↑↑s in quality of servicess in quality of services

10
South African Monetary Policy Since 1990South African Monetary Policy Since 1990
-12.0
-8.0
-4.0
0.0
4.0
8.0
12.0
16.0
20.0
24.0
28.0
Jan-
90
Jul-9
0
Jan-
91
Jul-9
1
Jan-
92
Jul-9
2
Jan-
93
Jul-9
3
Jan-
94
Jul-9
4
Jan-
95
Jul-9
5
Jan-
96
Jul-9
6
Jan-
97
Jul-9
7
Jan-
98
Jul-9
8
Jan-
99
Jul-9
9
Jan-
00
Jul-0
0
Jan-
01
Jul-0
1Ja
n-02
Jul-0
2
Jan-
03
Jul-0
3
Jan-
04
Jul-0
4
Perc
ent
0.0
50.0
100.0
150.0
200.0
250.0
Prime Lending Rate CPI Inflation (Metro) Coincident Indicator (% Change) Euro Exchange Rate (Jan 1994 = 100)
Source: SARB 2005; Statistics SA 2005.
Comparison of Inflation Rates for Comparison of Inflation Rates for Expenditure Quintiles, 1998Expenditure Quintiles, 1998--20052005
Source: Statistics SA 2005
-2.0
0.0
2.0
4.0
6.0
8.0
10.0
12.0
14.0
16.0
18.0
Jan-
98
Jul-9
8
Jan-
99
Jul-9
9
Jan-
00
Jul-0
0
Jan-
01
Jul-0
1
Jan-
02
Jul-0
2
Jan-
03
Jul-0
3
Jan-
04
Jul-0
4
Jan-
05
Perc
ent
Quintile 1 Quintile 2 Quintile 3 Quintile 4 Quintile 5

11
Official Consumer Price Index Weights, Official Consumer Price Index Weights, 2000 Base2000 Base--YearYear
Source: Statistics SA 2005
0.0
10.0
20.0
30.0
40.0
50.0
60.0
70.0
80.0
90.0Pe
rcen
t
Transport 4.0 5.1 6.8 8.3 16.3 11.4 13.7Clothing & Footwear 4.2 5.2 5.8 5.7 2.8 3.7 3.6Personal Care 7.4 6.7 6.0 5.2 3.2 4.5 3.9Fuel & Power 7.8 7.2 6.1 5.2 3.1 5.6 3.8Housing 10.0 10.1 10.7 15.9 23.5 14.3 20.7Food 51.2 49.7 43.9 33.7 16.7 30.4 23.0
Quintile 1 Quintile 2 Quintile 3 Quintile 4 Quintile 5 Pensioners Total CPI
Quintile 1 InflationQuintile 1 Inflation
Source: Statistics SA 2005
-5.0
0.0
5.0
10.0
15.0
20.0
25.0
Jan-
98
Jul-9
8
Jan-
99
Jul-9
9
Jan-
00
Jul-0
0
Jan-
01
Jul-0
1
Jan-
02
Jul-0
2
Jan-
03
Jul-0
3
Jan-
04
Jul-0
4
Jan-
05
Perc
ent
Quintile 1 Grain Products Food Fuel & Power

12
Percentage Share of Paraffin and Percentage Share of Paraffin and MealieMealie Meal in Meal in Selected Deciles' Overall Inflation RatesSelected Deciles' Overall Inflation Rates
Source: Own calculations based on Bhorat and Oosthuizen (2003)
Product Period Decile 1 Decile 2 Decile 3 Decile 4 Decile
10 1998 1.1 0.6 0.4 0.3 0.0 1999 6.2 3.3 2.3 1.4 0.0 2000 10.3 5.8 4.2 2.6 0.0 2001 6.9 3.7 2.6 1.6 0.0 2002 1.9 1.1 0.8 0.5 0.0
Paraffin
1998-2002 5.5 3.0 2.1 1.3 0.0 1998 5.5 3.6 2.7 2.1 0.2 1999 3.6 2.4 1.8 1.4 0.1 2000 3.4 2.4 1.8 1.4 0.1 2001 1.3 0.9 0.7 0.5 0.0 2002 7.3 5.1 4.0 3.1 0.3
Mealie Meal
1998-2002 4.0 2.7 2.0 1.6 0.1
Measuring ProMeasuring Pro--poor growth in SApoor growth in SAConsider Consider growthgrowth in expenditures in expenditures ofof poor relative poor relative to the rich (growth across each to the rich (growth across each centilecentile))
02
46
8A
nnua
l per
cap
gro
wth
in e
xpen
ditu
re
0 20 40 60 80 100Poorest p% ranked by per cap expenditure
Growth Incidence Curve Growth rate in meanMean of growth rates
Source:Statistics South Africa,1995 and 2000 & own calculations
Growth Incidence Curve for South Africa: 1995-2000

13
ElasticitiesElasticities of Poverty Measures for of Poverty Measures for South Africa, 1995South Africa, 1995--20002000
Source: Statistics South Africa (1995 & 2000) and own calculations
Category Poor Ultra-Poor Year 1995 2000 1995 2000
P1 -Mean Income Elasticity -1.00 -0.87 -1.58 -1.38 P2-Mean Income Elasticity -1.25 -1.10 -2.00 -1.56 P1-Gini Elasticity 2.45 3.48 6.66 8.84 P2-Gini Elasticity 4.36 6.10 10.77 13.73 MPRS: P1 2.45 3.99 4.21 6.43 MPRS: P2 3.49 5.55 5.38 8.83
MPRS-Marginal proportional rate of substitution betw income and income inequality:
In 2000, the economy needed a growth in mean incomes of 4%, to compensate for a 1% growth in the gini
DattDatt--RavallionRavallion Decompositions for Decompositions for South Africa, 1995South Africa, 1995--20002000
Measure relative contributions of changing inequality Measure relative contributions of changing inequality vsvschanging income growth to poverty changeschanging income growth to poverty changes
Category Growth
Component Redistribution
Component Total Change In
Poverty Poverty Line: R322 per capita per month
Total -9.38 14.65 5.27 African -8.84 14.21 5.37 Coloured -21.27 18.39 -2.88 Asian -4.31 8.72 4.41 White -0.93 1.67 0.74 Urban -8.79 17.69 8.89 Rural -4.79 9.85 5.06 Male -10.05 15.09 5.04 Female -8.48 13.96 5.48 Source: Statistics South Africa (1995 & 2000) and own calculations

14
Measuring ProMeasuring Pro--poor growth in SApoor growth in SA
-10
010
20An
nual
per
cap
gro
wth
in e
xpen
ditu
re
0 20 40 60 80 100Poorest p% ranked by per cap expenditure
African GIC African Mean Growth White GIC White Mean Growth
Source:Statistics South Africa,1995 and 2000 & own calculations
Growth Incidence Curves for Africans and Whites: 1995-2000
Constraints on Growth and EmploymentConstraints on Growth and Employment
Higher growth path is essential if Higher growth path is essential if we are to reduce povertywe are to reduce povertyWhy has growth been so low?Why has growth been so low?
High interest ratesHigh interest ratesVolatile exchange ratesVolatile exchange ratesSkills constraintsSkills constraintsCrimeCrimeHighly regulated Highly regulated labourlabour marketmarket

15
The Labour Market as aThe Labour Market as a Constraint on Constraint on Growth and EmploymentGrowth and Employment
Category/Firm Size 50-99 100-199 200+ Total Hire Fewer workers 39.58 34.48 31.87 36.02 Labour Substitution 33.57 31.82 40.66 35.09 Casualisation 38.03 38.64 38.46 38.32 Sub-Contracting 23.08 35.23 36.67 30.22 Improved labour relations 23.24 26.44 22.47 23.9 Increase in Labour Productivity 10.56 12.5 4.55 9.43 Sample Size 143 88 99 322
Reported Response Results to Impact of Labour Regulations, by Category
Source: World Bank Firm Survey, 1999 and author’s own calculations.
The Labour Market as aThe Labour Market as a Constraint on Growth & Constraint on Growth & EmploymentEmployment
Estimation of Retrenchment Costs, by Occupation
Source: World Bank Firm Survey, 1999 and author’s own calculations.
Size Class/Occupation 50-99 100-199 200+ Mean Retrenchment Costs
Manager 8659 10939 35062 Professional & Technical 7169 6792 19994 Clerical 7154 6094 20473 Service 7165 5505 15980 Craft 6926 5065 6532 Operators 7025 6955 10693 Labourers 7555 10295 12580 Manager to Lab. Ratio 1.15 1.06 2.79
Proportion of Monthly Mean Wage Manager 0.91 1.02 0.82 Professional & Technical 0.89 0.42 0.64 Clerical 1.75 1.07 1.69 Service 1.20 0.84 1.24 Craft 1.57 0.87 1.18 Operators 2.48 2.11 2.39 Labourers 3.79 5.68 3.62