Embed Size (px)
Citation preview
Taxation and Development
Henrik KlevenLondon School of Economics
June 2016
1 / 51
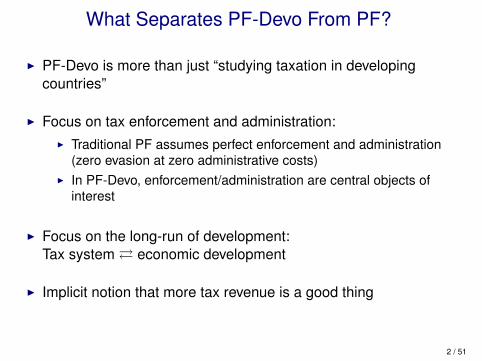
What Separates PF-Devo From PF?
I PF-Devo is more than just “studying taxation in developingcountries”
I Focus on tax enforcement and administration:I Traditional PF assumes perfect enforcement and administration
(zero evasion at zero administrative costs)I In PF-Devo, enforcement/administration are central objects of
interest
I Focus on the long-run of development:Tax system� economic development
I Implicit notion that more tax revenue is a good thing
2 / 51
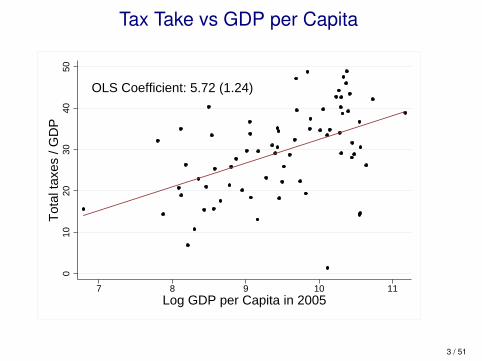
Tax Take vs GDP per Capita
OLS Coefficient: 5.72 (1.24)
010
2030
4050
Tot
al ta
xes
/ GD
P
7 8 9 10 11Log GDP per Capita in 2005
3 / 51
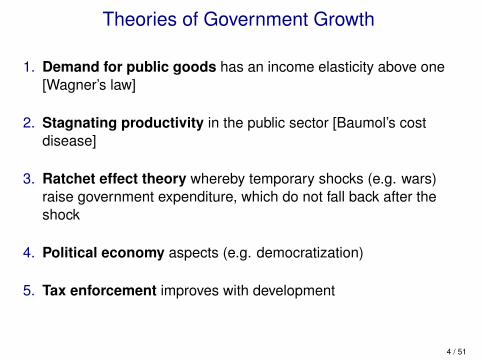
Theories of Government Growth
1. Demand for public goods has an income elasticity above one[Wagner’s law]
2. Stagnating productivity in the public sector [Baumol’s costdisease]
3. Ratchet effect theory whereby temporary shocks (e.g. wars)raise government expenditure, which do not fall back after theshock
4. Political economy aspects (e.g. democratization)
5. Tax enforcement improves with development
4 / 51
Two Approaches
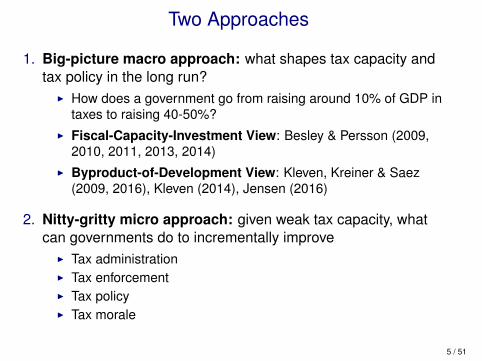
1. Big-picture macro approach: what shapes tax capacity andtax policy in the long run?
I How does a government go from raising around 10% of GDP intaxes to raising 40-50%?
I Fiscal-Capacity-Investment View: Besley & Persson (2009,2010, 2011, 2013, 2014)
I Byproduct-of-Development View: Kleven, Kreiner & Saez(2009, 2016), Kleven (2014), Jensen (2016)
2. Nitty-gritty micro approach: given weak tax capacity, whatcan governments do to incrementally improve
I Tax administrationI Tax enforcementI Tax policyI Tax morale
5 / 51
Two Approaches
I The big-picture macro approach is intellectually interesting, butunlikely to yield concrete and conclusive policy guidance
I So most recent work takes the nitty-gritty micro approachI Analyzes specific contexts and problems, one at a time
I Frontier of micro approach:I Data: administrative tax recordsI Identification: RCTs or quasi-experimentsI Models: “third-best” models with imperfect complianceI Policy: empirics and models inform the design of (incremental)
policy innovations
6 / 51
Overview of Topics
1. Tax enforcement
2. Tax policy
3. Tax administration
4. Tax morale
7 / 51
Tax Enforcement
8 / 51
Tax Enforcement
I Models of deterrence and compliance:I Allingham & Sandmo (1972):
Self-reporting; audits and penalties AS-Model
I Kleven et al. (2009, 2011, 2016):Third-party reporting; information; firm size/complexity
I Enforcement instruments1. Audits2. Penalties3. Third-party information reporting4. Other verifiable information trails (credit cards, receipts, etc.)5. Withholding
I Kleven et al. (2011, 2016): tax enforcement is fully successfuliff verifiable third-party information (3-4) has wide coverage
9 / 51
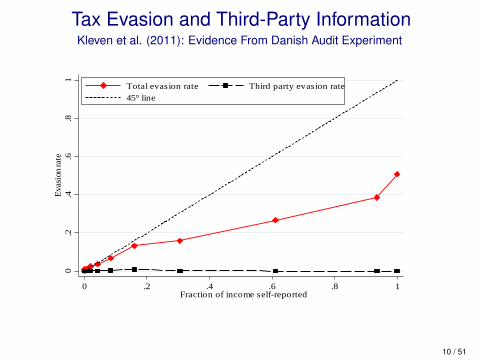
Tax Evasion and Third-Party InformationKleven et al. (2011): Evidence From Danish Audit Experiment
Figure 1: Evasion by Fraction of Income Self‐Reported
Notes: the source is Kleven et al. (2011). The figure displays estimates of the total evasion rate (fraction of total income undeclared)and the third‐party evasion rate (fraction of third‐party reported income undeclared), conditional on having positive evasion, bydeciles of the fraction of income self‐reported. Further details can be found in the original source.
0.2
.4.6
.81
Evas
ion
rate
0 .2 .4 .6 .8 1Fraction of income self-reported
Total evasion rate Third party evasion rate45° line
10 / 51
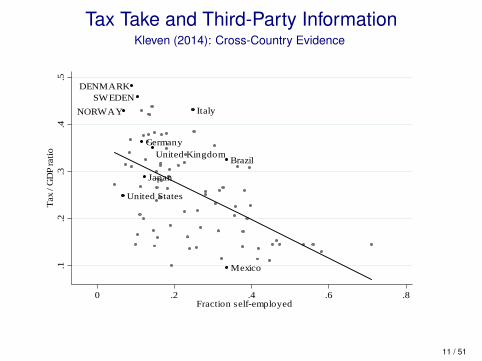
Tax Take and Third-Party InformationKleven (2014): Cross-Country EvidenceFigure 2: Tax Take and Third‐Party Reporting across Countries
Notes: Country‐level observations, latest available year. Countries with GDP per capita below $5000 (in 2005 PPP terms) or naturalresource rents as a fraction of GDP above 20% are excluded from the sample. Tax/GDP ratio is the share of tax revenue in a givencountry's nominal GDP in 2012 (source: Index of Economic Freedom, Heritage Foundation). In both panels, the "fraction self‐employed" is defined crudely as all non‐employees (self‐employed, employers, and non‐classifiable workers) as a fraction of theworkforce (source: World Bank). In Panel B, the "fraction of employees in evasive jobs" is defined as the fraction of the workforcewho are employees in sectors that (in part) provide labor intensive consumer services (source: ILO). These evasive sectors are definedaccording to ISIC codes 4F: construction, 4G: retail, wholesale, and repair of motor vehicles, motorcycles and personal and householdgoods, 4I: hotels and restaurants, 4S: other service activities, and 4T: employees of private households (nannies, cooks, gardeners,etc.). Regression line is plotted in each panel.
Panel B: Tax Take vs Fraction of Self‐Employed and Employees in Evasive Jobs
Panel A: Tax Take vs Fraction Self‐Employed
Brazil
Germany
Italy
Japan
Mexico
United Kingdom
United States
DENMARK
NORWAYSWEDEN
.1.2
.3.4
.5Ta
x / G
DP
ratio
.2 .4 .6 .8Fraction of self-employed and employees in evasive jobs
Brazil
Germany
Italy
Japan
Mexico
United Kingdom
United States
DENMARK
NORWAYSWEDEN
.1.2
.3.4
.5Ta
x / G
DP
ratio
0 .2 .4 .6 .8Fraction self-employed
11 / 51
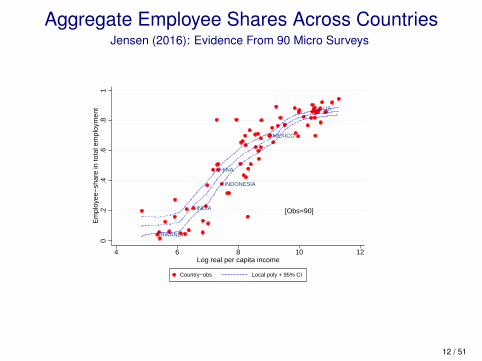
Aggregate Employee Shares Across CountriesJensen (2016): Evidence From 90 Micro Surveys
Start point: aggregate employee-share ↑ over development
RWANDA
INDIA
CHINA
INDONESIA
MEXICO
US
[Obs=90]
0.2
.4.6
.81
Em
ploy
ee−
shar
e in
tota
l em
ploy
men
t
4 6 8 10 12Log real per capita income
Country−obs Local poly + 95% CI
DENMARKDENMARKDENMARKDENMARKDENMARKDENMARKDENMARKDENMARKDENMARKDENMARK
INDIAINDIAINDIAINDIAINDIAINDIAINDIAINDIAINDIAINDIA
RWANDARWANDARWANDARWANDARWANDARWANDARWANDARWANDARWANDARWANDA
SOUTH AFRICASOUTH AFRICASOUTH AFRICASOUTH AFRICASOUTH AFRICASOUTH AFRICASOUTH AFRICASOUTH AFRICASOUTH AFRICASOUTH AFRICA
US1870
US1910
US1920US1930
US1940US1950
US1960US1970US1980US1990US2000US2010
0.2
.4.6
.81
Em
ploy
ee−
shar
e in
em
ploy
men
t
6 7 8 9 10 11Log real per capita income (Maddison data)
Cross−cty obs [n=67] Within−cty obs: US 1870−2010 [n=12]
12 / 51
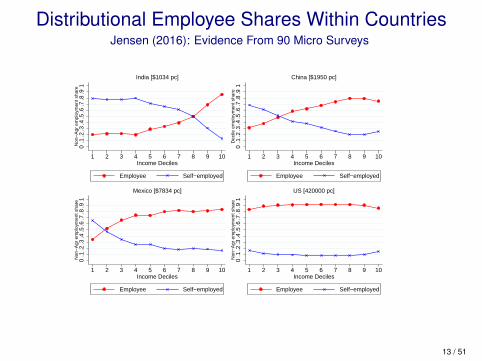
Distributional Employee Shares Within CountriesJensen (2016): Evidence From 90 Micro SurveysDescriptive evidence: new stylized facts
0.1
.2.3
.4.5
.6.7
.8.9
1N
on−
Agr
em
ploy
men
t sha
re
1 2 3 4 5 6 7 8 9 10Income Deciles
Employee Self−employed
India [$1034 pc]
0.1
.2.3
.4.5
.6.7
.8.9
1D
ecile
em
ploy
men
t sha
re
1 2 3 4 5 6 7 8 9 10Income Deciles
Employee Self−employed
China [$1950 pc]0
.1.2
.3.4
.5.6
.7.8
.91
Non
−A
gr e
mpl
oym
ent s
hare
1 2 3 4 5 6 7 8 9 10Income Deciles
Employee Self−employed
Mexico [$7834 pc]
0.1
.2.3
.4.5
.6.7
.8.9
1N
on−
Agr
em
ploy
men
t sha
re
1 2 3 4 5 6 7 8 9 10Income Deciles
Employee Self−employed
US [420000 pc]
13 / 51
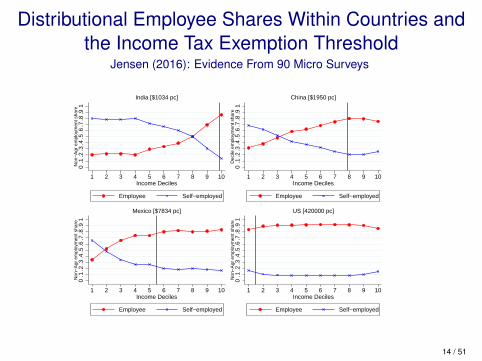
Distributional Employee Shares Within Countries andthe Income Tax Exemption Threshold
Jensen (2016): Evidence From 90 Micro SurveysDescriptive evidence: new stylized facts0
.1.2
.3.4
.5.6
.7.8
.91
Non
−A
gr e
mpl
oym
ent s
hare
1 2 3 4 5 6 7 8 9 10Income Deciles
Employee Self−employed
India [$1034 pc]
0.1
.2.3
.4.5
.6.7
.8.9
1D
ecile
em
ploy
men
t sha
re
1 2 3 4 5 6 7 8 9 10Income Deciles
Employee Self−employed
China [$1950 pc]
0.1
.2.3
.4.5
.6.7
.8.9
1N
on−
Agr
em
ploy
men
t sha
re
1 2 3 4 5 6 7 8 9 10Income Deciles
Employee Self−employed
Mexico [$7834 pc]
0.1
.2.3
.4.5
.6.7
.8.9
1N
on−
Agr
em
ploy
men
t sha
re
1 2 3 4 5 6 7 8 9 10Income Deciles
Employee Self−employed
US [420000 pc]
14 / 51
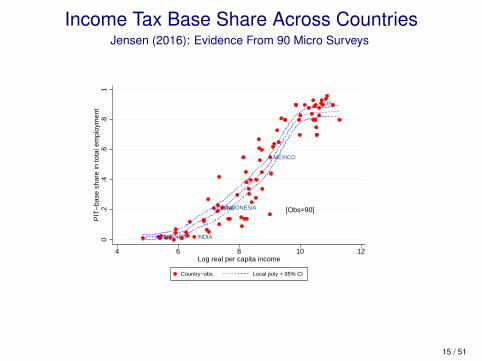
Income Tax Base Share Across CountriesJensen (2016): Evidence From 90 Micro Surveys
Fact #2 across and within country
RWANDA INDIA
CHINAINDONESIA
MEXICO
US
[Obs=90]
0.2
.4.6
.81
PIT
−ba
se s
hare
in to
tal e
mpl
oym
ent
4 6 8 10 12Log real per capita income
Country−obs Local poly + 95% CI
DENMARKDENMARKDENMARKDENMARKDENMARKDENMARKDENMARKDENMARKDENMARKDENMARK
INDIAINDIAINDIAINDIAINDIAINDIAINDIAINDIAINDIAINDIARWANDARWANDARWANDARWANDARWANDARWANDARWANDARWANDARWANDARWANDA
SOUTH AFRICASOUTH AFRICASOUTH AFRICASOUTH AFRICASOUTH AFRICASOUTH AFRICASOUTH AFRICASOUTH AFRICASOUTH AFRICASOUTH AFRICA
US1930
US1950
US1960
US1970US1980US1990
US2000US2010
0.2
.4.6
.81
PIT
−ba
se s
hare
in to
tal e
mpl
oym
ent
6 7 8 9 10 11Log real per capita income (Maddison data)
Cross−cty obs [n=67] Within−cty obs: US 1870−2010 [n=12]
15 / 51
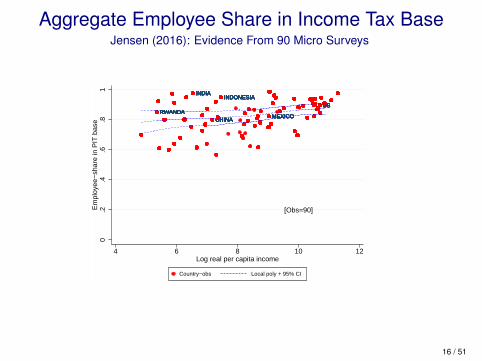
Aggregate Employee Share in Income Tax BaseJensen (2016): Evidence From 90 Micro Surveys
Fact #3 across and within country
RWANDARWANDARWANDARWANDARWANDARWANDARWANDARWANDARWANDARWANDA
INDIAINDIAINDIAINDIAINDIAINDIAINDIAINDIAINDIAINDIA
CHINACHINACHINACHINACHINACHINACHINACHINACHINACHINA
INDONESIAINDONESIAINDONESIAINDONESIAINDONESIAINDONESIAINDONESIAINDONESIAINDONESIAINDONESIA
MEXICOMEXICOMEXICOMEXICOMEXICOMEXICOMEXICOMEXICOMEXICOMEXICO
USUSUSUSUSUSUSUSUSUS
[Obs=90]
0.2
.4.6
.81
Em
ploy
ee−
shar
e in
PIT
bas
e
4 6 8 10 12Log real per capita income
Country−obs Local poly + 95% CI
DENMARKDENMARKDENMARKDENMARKDENMARKDENMARKDENMARKDENMARKDENMARKINDIAINDIAINDIAINDIAINDIAINDIAINDIAINDIAINDIAINDIA
RWANDARWANDARWANDARWANDARWANDARWANDARWANDARWANDARWANDARWANDASOUTH AFRICASOUTH AFRICASOUTH AFRICASOUTH AFRICASOUTH AFRICASOUTH AFRICAUS1930
US1950
US1960US1970US1980
US1990US2000US2010
0.2
.4.6
.81
Em
ploy
ee−
shar
e in
PIT
bas
e
6 7 8 9 10 11Log real per capita income (Maddison data)
Cross−cty obs [n=67] Within−cty obs: US 1870−2010 [n=12]
16 / 51
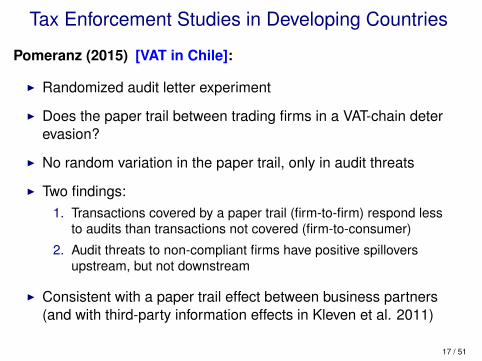
Tax Enforcement Studies in Developing Countries
Pomeranz (2015) [VAT in Chile]:
I Randomized audit letter experiment
I Does the paper trail between trading firms in a VAT-chain deterevasion?
I No random variation in the paper trail, only in audit threats
I Two findings:1. Transactions covered by a paper trail (firm-to-firm) respond less
to audits than transactions not covered (firm-to-consumer)
2. Audit threats to non-compliant firms have positive spilloversupstream, but not downstream
I Consistent with a paper trail effect between business partners(and with third-party information effects in Kleven et al. 2011)
17 / 51
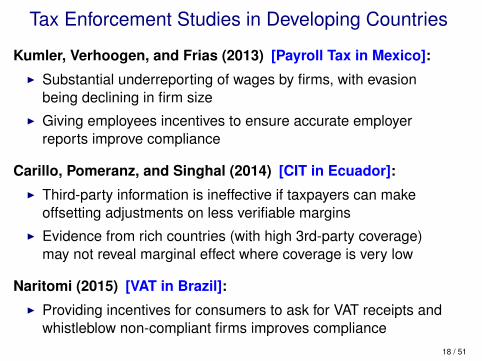
Tax Enforcement Studies in Developing Countries
Kumler, Verhoogen, and Frias (2013) [Payroll Tax in Mexico]:I Substantial underreporting of wages by firms, with evasion
being declining in firm sizeI Giving employees incentives to ensure accurate employer
reports improve compliance
Carillo, Pomeranz, and Singhal (2014) [CIT in Ecuador]:I Third-party information is ineffective if taxpayers can make
offsetting adjustments on less verifiable marginsI Evidence from rich countries (with high 3rd-party coverage)
may not reveal marginal effect where coverage is very low
Naritomi (2015) [VAT in Brazil]:I Providing incentives for consumers to ask for VAT receipts and
whistleblow non-compliant firms improves compliance18 / 51
Tax Policy
19 / 51
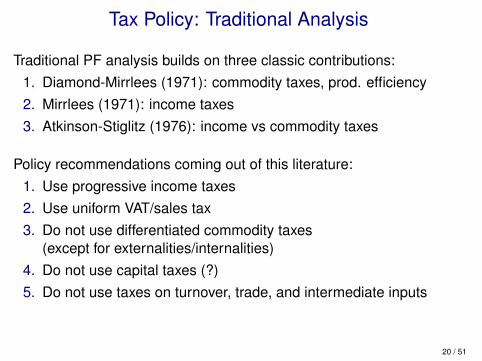
Tax Policy: Traditional Analysis
Traditional PF analysis builds on three classic contributions:1. Diamond-Mirrlees (1971): commodity taxes, prod. efficiency2. Mirrlees (1971): income taxes3. Atkinson-Stiglitz (1976): income vs commodity taxes
Policy recommendations coming out of this literature:1. Use progressive income taxes2. Use uniform VAT/sales tax3. Do not use differentiated commodity taxes
(except for externalities/internalities)4. Do not use capital taxes (?)5. Do not use taxes on turnover, trade, and intermediate inputs
20 / 51
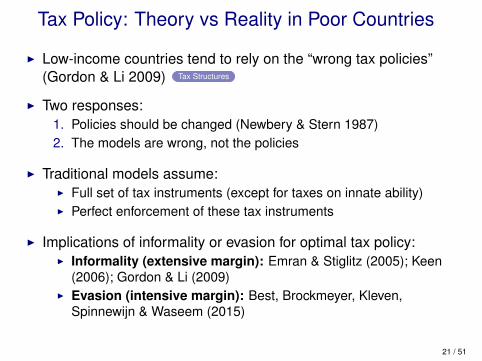
Tax Policy: Theory vs Reality in Poor Countries
I Low-income countries tend to rely on the “wrong tax policies”(Gordon & Li 2009) Tax Structures
I Two responses:1. Policies should be changed (Newbery & Stern 1987)2. The models are wrong, not the policies
I Traditional models assume:I Full set of tax instruments (except for taxes on innate ability)I Perfect enforcement of these tax instruments
I Implications of informality or evasion for optimal tax policy:I Informality (extensive margin): Emran & Stiglitz (2005); Keen
(2006); Gordon & Li (2009)I Evasion (intensive margin): Best, Brockmeyer, Kleven,
Spinnewijn & Waseem (2015)
21 / 51
From Tax Rates to Tax Instruments
I Much academic work studies the pattern of optimal tax ratesI Taking the tax instrument as given (e.g., nonlinear income tax)I Allowing for lots of flexibility in tax instruments
I This is second-order for developing economiesI Here the choice between tax instruments is keyI Which instruments represent the best trade-off between
standard efficiency-equity concerns and compliance concerns?
I Taxonomy of Taxes:I Modern: income taxes, social security taxes, VATI Traditional: property taxes, wealth transfer taxes, excises,
tariffs, etc.
22 / 51
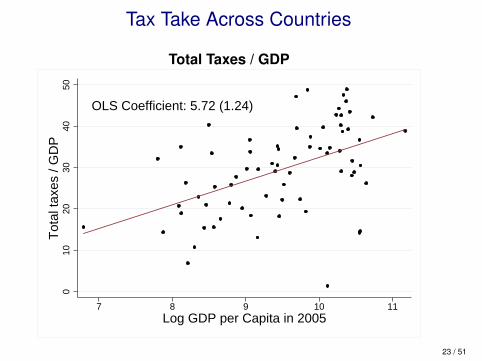
Tax Take Across Countries
Total Taxes / GDP
OLS Coefficient: 5.72 (1.24)
010
2030
4050
Tot
al ta
xes
/ GD
P
7 8 9 10 11Log GDP per Capita in 2005
23 / 51
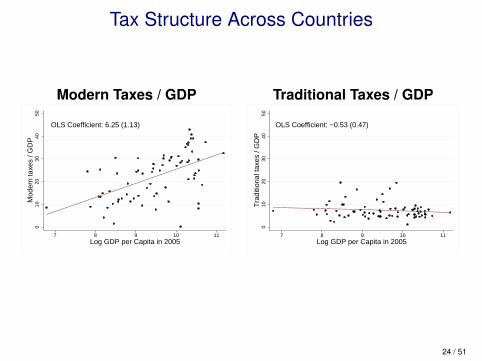
Tax Structure Across Countries
Modern Taxes / GDP Traditional Taxes / GDP
OLS Coefficient: 6.25 (1.13)
010
2030
4050
Mod
ern
taxe
s / G
DP
7 8 9 10 11Log GDP per Capita in 2005
OLS Coefficient: −0.53 (0.47)
010
2030
4050
Tra
ditio
nal t
axes
/ G
DP
7 8 9 10 11Log GDP per Capita in 2005
24 / 51
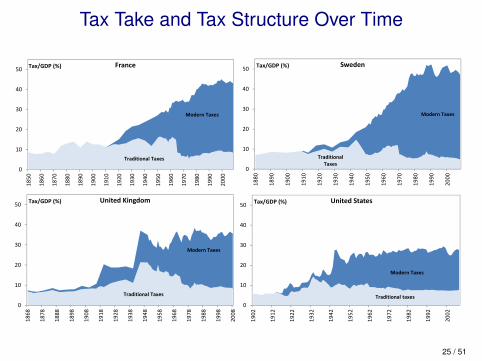
Tax Take and Tax Structure Over Time
Traditional Taxes
Modern Taxes
0
10
20
30
40
50
1850
1860
1870
1880
1890
1900
1910
1920
1930
1940
1950
1960
1970
1980
1990
2000
Tax/GDP (%) France
Traditional Taxes
Modern Taxes
0
10
20
30
40
50
1868
1878
1888
1898
1908
1918
1928
1938
1948
1958
1968
1978
1988
1998
2008
Tax/GDP (%) United Kingdom
Modern Taxes
0
10
20
30
40
50
1902
1912
1922
1932
1942
1952
1962
1972
1982
1992
2002
Tax/GDP (%) United States
Traditional taxes
Traditional Taxes
Modern Taxes
0
10
20
30
40
50
1880
1890
1900
1910
1920
1930
1940
1950
1960
1970
1980
1990
2000
Tax/GDP (%) Sweden
25 / 51
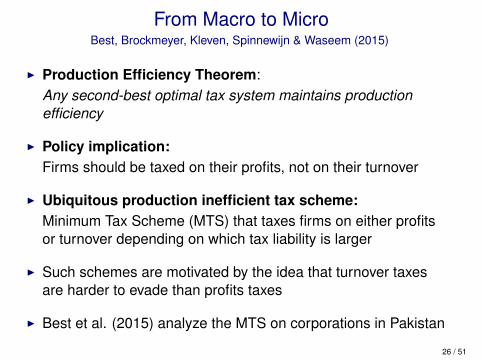
From Macro to MicroBest, Brockmeyer, Kleven, Spinnewijn & Waseem (2015)
I Production Efficiency Theorem:Any second-best optimal tax system maintains productionefficiency
I Policy implication:Firms should be taxed on their profits, not on their turnover
I Ubiquitous production inefficient tax scheme:Minimum Tax Scheme (MTS) that taxes firms on either profitsor turnover depending on which tax liability is larger
I Such schemes are motivated by the idea that turnover taxesare harder to evade than profits taxes
I Best et al. (2015) analyze the MTS on corporations in Pakistan
26 / 51
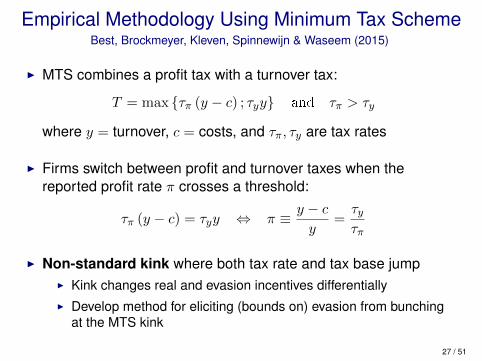
Empirical Methodology Using Minimum Tax SchemeBest, Brockmeyer, Kleven, Spinnewijn & Waseem (2015)
I MTS combines a profit tax with a turnover tax:
T = max {τπ (y − c) ; τyy} and τπ > τy
where y = turnover, c = costs, and τπ, τy are tax rates
I Firms switch between profit and turnover taxes when thereported profit rate π crosses a threshold:
τπ (y − c) = τyy ⇔ π ≡ y − cy
=τyτπ
I Non-standard kink where both tax rate and tax base jumpI Kink changes real and evasion incentives differentiallyI Develop method for eliciting (bounds on) evasion from bunching
at the MTS kink
27 / 51
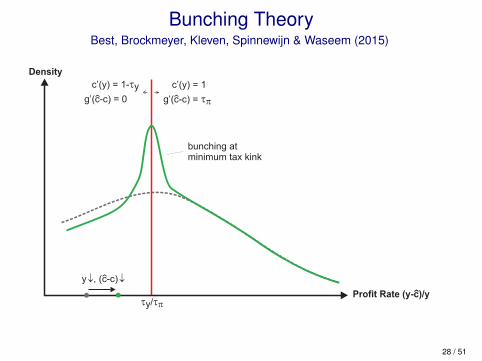
Bunching TheoryBest, Brockmeyer, Kleven, Spinnewijn & Waseem (2015)
bunching atminimum tax kink
Density
Profit Rate (y-c)/y
‹
t ty/ p
c’(y) = 1-ty
g’(c-c) = 0
‹
c’(y) = 1
g’(c-c) = tp
‹
y , (c-c)¯ ¯
‹
28 / 51
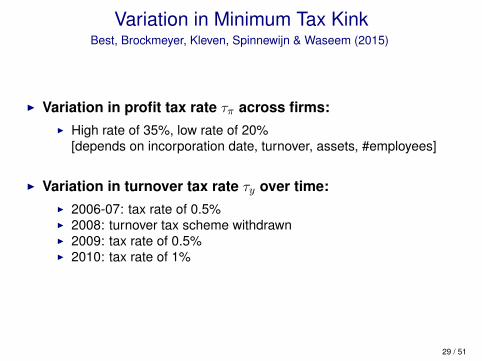
Variation in Minimum Tax KinkBest, Brockmeyer, Kleven, Spinnewijn & Waseem (2015)
I Variation in profit tax rate τπ across firms:I High rate of 35%, low rate of 20%
[depends on incorporation date, turnover, assets, #employees]
I Variation in turnover tax rate τy over time:I 2006-07: tax rate of 0.5%I 2008: turnover tax scheme withdrawnI 2009: tax rate of 0.5%I 2010: tax rate of 1%
29 / 51
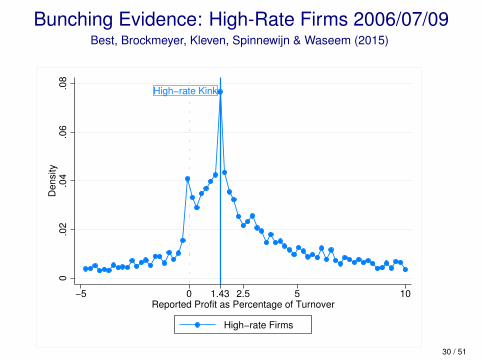
Bunching Evidence: High-Rate Firms 2006/07/09Best, Brockmeyer, Kleven, Spinnewijn & Waseem (2015)
High−rate Kink
0.0
2.0
4.0
6.0
8D
ensi
ty
−5 0 1.43 2.5 5 10Reported Profit as Percentage of Turnover
High−rate Firms
30 / 51
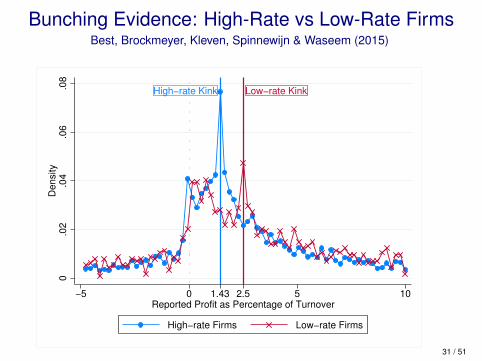
Bunching Evidence: High-Rate vs Low-Rate FirmsBest, Brockmeyer, Kleven, Spinnewijn & Waseem (2015)
High−rate Kink Low−rate Kink
0.0
2.0
4.0
6.0
8D
ensi
ty
−5 0 1.43 2.5 5 10Reported Profit as Percentage of Turnover
High−rate Firms Low−rate Firms
31 / 51
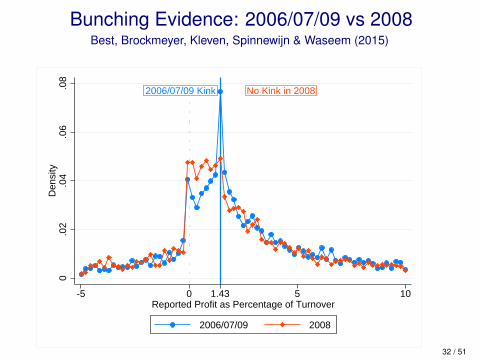
Bunching Evidence: 2006/07/09 vs 2008Best, Brockmeyer, Kleven, Spinnewijn & Waseem (2015)
2006/07/09 Kink No Kink in 2008
0.0
2.0
4.0
6.0
8D
ensi
ty
-5 0 1.43 5 10Reported Profit as Percentage of Turnover
2006/07/09 2008
32 / 51
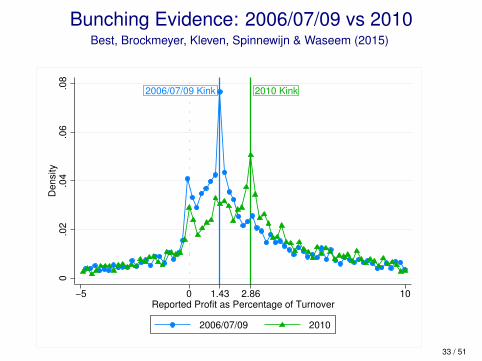
Bunching Evidence: 2006/07/09 vs 2010Best, Brockmeyer, Kleven, Spinnewijn & Waseem (2015)
2006/07/09 Kink 2010 Kink
0.0
2.0
4.0
6.0
8D
ensi
ty
−5 0 1.43 2.86 10Reported Profit as Percentage of Turnover
2006/07/09 2010
33 / 51
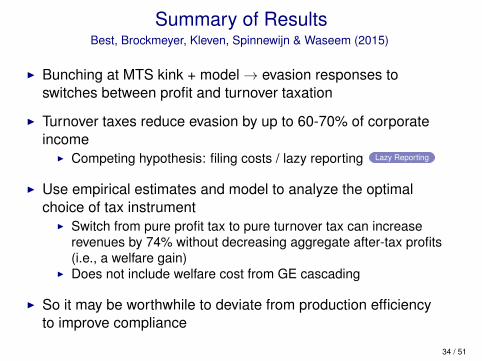
Summary of ResultsBest, Brockmeyer, Kleven, Spinnewijn & Waseem (2015)
I Bunching at MTS kink + model→ evasion responses toswitches between profit and turnover taxation
I Turnover taxes reduce evasion by up to 60-70% of corporateincome
I Competing hypothesis: filing costs / lazy reporting Lazy Reporting
I Use empirical estimates and model to analyze the optimalchoice of tax instrument
I Switch from pure profit tax to pure turnover tax can increaserevenues by 74% without decreasing aggregate after-tax profits(i.e., a welfare gain)
I Does not include welfare cost from GE cascading
I So it may be worthwhile to deviate from production efficiencyto improve compliance
34 / 51
Tax Administration
35 / 51
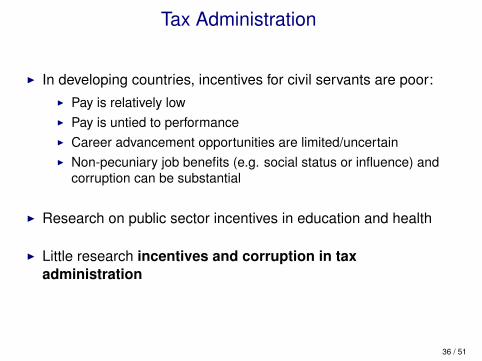
Tax Administration
I In developing countries, incentives for civil servants are poor:I Pay is relatively lowI Pay is untied to performanceI Career advancement opportunities are limited/uncertainI Non-pecuniary job benefits (e.g. social status or influence) and
corruption can be substantial
I Research on public sector incentives in education and health
I Little research incentives and corruption in taxadministration
36 / 51
Pakistan Performance Pay ProjectKhan, Khwaja & Olken (2016)
I RCT in collaboration with the Excise & Taxation Department inPunjab, Pakistan
I Focus on the local property tax in Punjab
I Implement performance pay for tax officials in order to:I Raise tax revenueI With minimum cost (wage outlays, taxpayer dissatisfaction)
I Randomly allocate tax officials to different incentive schemes:I RevenueI Revenue PLUS (adjusts for accuracy and taxpayer satisfaction)I Flexible Bonus (wider set of criteria, subjective adjustments)
37 / 51
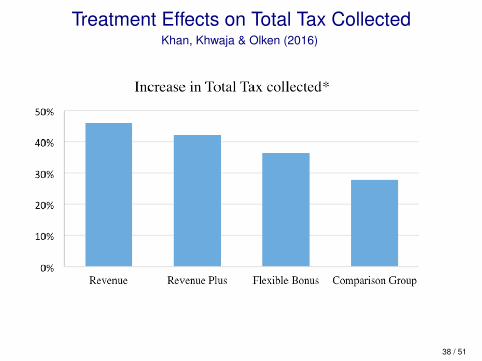
Treatment Effects on Total Tax CollectedKhan, Khwaja & Olken (2016)
26
IGC Project: Pakistan Performance Pay Project
Source: Khan, Khwaja, Olken (2014)
38 / 51
Corruption?Khan, Khwaja & Olken (2016)
I Revenue gains come from a small fraction of properties (3%)that become taxed at their true value
I In a survey, these taxpayers report not paying larger bribes
I The vast majority of properties in treated areas do not payhigher taxes, but instead report higher bribes
I This is roughly consistent with a collusion story:Performance pay increases tax collectors’ bargaining powerover taxpayers, who either have to pay higher bribes tocontinue evading or pay substantially higher taxes if collusionbreaks down
39 / 51
Tax Morale
40 / 51
Tax Morale
I Taxonomy of tax morale (Luttmer & Singhal 2014):I Intrinsic motivation (innate preference)I Social norms (depend on other individuals)I Reciprocity (depends on the state)I Culture (long-run societal effect)
I We know relatively little about such effects:I What is the quantitative importance of tax morale mechanisms?I Can policy makers affect tax morale through policy design?
I What we can say is that tax take and compliance arecorrelated with proxies for tax morale across countries
41 / 51
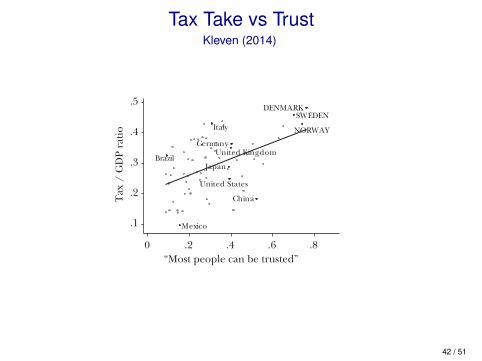
Tax Take vs TrustKleven (2014)
94 Journal of Economic Perspectives
Figure 6 Tax Take versus Social and Cultural Indicators across Countries
Notes and Sources: The figure shows the country-level observations, latest available year. Countries with GDP per capita below $5,000 (in 2005 PPP terms) or natural resource rents as a fraction of GDP above 20 percent are excluded from the sample. Tax/GDP ratio is the share of tax revenue in a given country’s nominal GDP in 2012 (source: Index of Economic Freedom, Heritage Foundation). Panel A: weighted-average survey response to the question of whether most people can be trusted, on a binary scale (source: WVS). Panel B: weighted-average survey response to the question of whether people live in need because of laziness or lack of willpower, or because of circumstances beyond individual control (injustice, luck, etc.). Panel C: social capital index is obtained from a principal component analysis of the following variables: 1) civic participation: weighted-average of a binary indicator for active membership of an organization (latest available year, source: WVS, various waves), 2) average voter turnout in elections held after 2000, excluding the European Parliament elections (source: Voter Turnout Database, IDEA), and 3) the inverse of the homicide rate (latest available year, source: UNODC). Panel C includes only democratic countries, defined as those with a Polity2 score above zero (source: Polity IV). Panel D: share of people donating money to charitable organizations in 2012 (source: World Giving Index, Charities Aid Foundation). A regression line is plotted in each panel.
Brazil
China
Germany
Italy
Japan
Mexico
United Kingdom
United States
DENMARK
NORWAY
SWEDEN
.1
.2
.3
.4
.5
Tax
/ G
DP
rati
o
0 .2 .4 .6 .8“Most people can be trusted”
Brazil
DENMARK
Germany
Italy
Japan
Mexico
United Kingdom
United States
NORWAY
SWEDEN
.1
.2
.3
.4
.5
Tax
/ G
DP
rati
o
0 .2 .4 .6 .8“People in need because of laziness,
lack of willpower”
A: Tax Take versus Trust
D: Tax Take versus Charitable DonationsC: Tax Take versus Social Capital Index(Civic Participation, Voter Turnout, Crime)
B: Tax Take versus Beliefs about the Poor
Germany
Italy
Japan
United Kingdom
United States
DENMARK
NORWAY SWEDEN
.1
.2
.3
.4
.5
Tax
/ G
DP
rati
o
−2 −1 0 1 2 3Social capital index
Brazil
China
Germany
Italy
Mexico
United Kingdom
United States
DENMARK
NORWAYSWEDEN
.1
.2
.3
.4
.5
Tax
/ G
DP
rati
o
0 .2 .4 .6 .8Fraction of people donating
money to charity
42 / 51
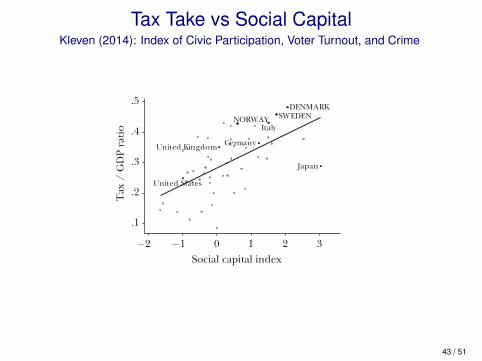
Tax Take vs Social CapitalKleven (2014): Index of Civic Participation, Voter Turnout, and Crime
94 Journal of Economic Perspectives
Figure 6 Tax Take versus Social and Cultural Indicators across Countries
Notes and Sources: The figure shows the country-level observations, latest available year. Countries with GDP per capita below $5,000 (in 2005 PPP terms) or natural resource rents as a fraction of GDP above 20 percent are excluded from the sample. Tax/GDP ratio is the share of tax revenue in a given country’s nominal GDP in 2012 (source: Index of Economic Freedom, Heritage Foundation). Panel A: weighted-average survey response to the question of whether most people can be trusted, on a binary scale (source: WVS). Panel B: weighted-average survey response to the question of whether people live in need because of laziness or lack of willpower, or because of circumstances beyond individual control (injustice, luck, etc.). Panel C: social capital index is obtained from a principal component analysis of the following variables: 1) civic participation: weighted-average of a binary indicator for active membership of an organization (latest available year, source: WVS, various waves), 2) average voter turnout in elections held after 2000, excluding the European Parliament elections (source: Voter Turnout Database, IDEA), and 3) the inverse of the homicide rate (latest available year, source: UNODC). Panel C includes only democratic countries, defined as those with a Polity2 score above zero (source: Polity IV). Panel D: share of people donating money to charitable organizations in 2012 (source: World Giving Index, Charities Aid Foundation). A regression line is plotted in each panel.
Brazil
China
Germany
Italy
Japan
Mexico
United Kingdom
United States
DENMARK
NORWAY
SWEDEN
.1
.2
.3
.4
.5
Tax
/ G
DP
rati
o
0 .2 .4 .6 .8“Most people can be trusted”
Brazil
DENMARK
Germany
Italy
Japan
Mexico
United Kingdom
United States
NORWAY
SWEDEN
.1
.2
.3
.4
.5
Tax
/ G
DP
rati
o
0 .2 .4 .6 .8“People in need because of laziness,
lack of willpower”
A: Tax Take versus Trust
D: Tax Take versus Charitable DonationsC: Tax Take versus Social Capital Index(Civic Participation, Voter Turnout, Crime)
B: Tax Take versus Beliefs about the Poor
Germany
Italy
Japan
United Kingdom
United States
DENMARK
NORWAY SWEDEN
.1
.2
.3
.4
.5
Tax
/ G
DP
rati
o
−2 −1 0 1 2 3Social capital index
Brazil
China
Germany
Italy
Mexico
United Kingdom
United States
DENMARK
NORWAYSWEDEN
.1
.2
.3
.4
.5
Tax
/ G
DP
rati
o
0 .2 .4 .6 .8Fraction of people donating
money to charity
43 / 51
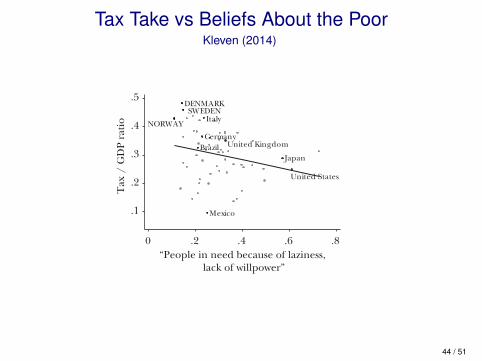
Tax Take vs Beliefs About the PoorKleven (2014)
94 Journal of Economic Perspectives
Figure 6 Tax Take versus Social and Cultural Indicators across Countries
Notes and Sources: The figure shows the country-level observations, latest available year. Countries with GDP per capita below $5,000 (in 2005 PPP terms) or natural resource rents as a fraction of GDP above 20 percent are excluded from the sample. Tax/GDP ratio is the share of tax revenue in a given country’s nominal GDP in 2012 (source: Index of Economic Freedom, Heritage Foundation). Panel A: weighted-average survey response to the question of whether most people can be trusted, on a binary scale (source: WVS). Panel B: weighted-average survey response to the question of whether people live in need because of laziness or lack of willpower, or because of circumstances beyond individual control (injustice, luck, etc.). Panel C: social capital index is obtained from a principal component analysis of the following variables: 1) civic participation: weighted-average of a binary indicator for active membership of an organization (latest available year, source: WVS, various waves), 2) average voter turnout in elections held after 2000, excluding the European Parliament elections (source: Voter Turnout Database, IDEA), and 3) the inverse of the homicide rate (latest available year, source: UNODC). Panel C includes only democratic countries, defined as those with a Polity2 score above zero (source: Polity IV). Panel D: share of people donating money to charitable organizations in 2012 (source: World Giving Index, Charities Aid Foundation). A regression line is plotted in each panel.
Brazil
China
Germany
Italy
Japan
Mexico
United Kingdom
United States
DENMARK
NORWAY
SWEDEN
.1
.2
.3
.4
.5
Tax
/ G
DP
rati
o
0 .2 .4 .6 .8“Most people can be trusted”
Brazil
DENMARK
Germany
Italy
Japan
Mexico
United Kingdom
United States
NORWAY
SWEDEN
.1
.2
.3
.4
.5
Tax
/ G
DP
rati
o
0 .2 .4 .6 .8“People in need because of laziness,
lack of willpower”
A: Tax Take versus Trust
D: Tax Take versus Charitable DonationsC: Tax Take versus Social Capital Index(Civic Participation, Voter Turnout, Crime)
B: Tax Take versus Beliefs about the Poor
Germany
Italy
Japan
United Kingdom
United States
DENMARK
NORWAY SWEDEN
.1
.2
.3
.4
.5
Tax
/ G
DP
rati
o
−2 −1 0 1 2 3Social capital index
Brazil
China
Germany
Italy
Mexico
United Kingdom
United States
DENMARK
NORWAYSWEDEN
.1
.2
.3
.4
.5
Tax
/ G
DP
rati
o
0 .2 .4 .6 .8Fraction of people donating
money to charity
44 / 51
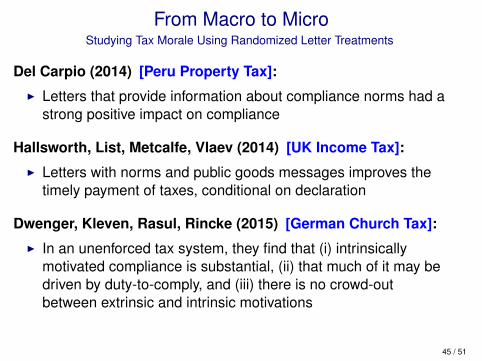
From Macro to MicroStudying Tax Morale Using Randomized Letter Treatments
Del Carpio (2014) [Peru Property Tax]:
I Letters that provide information about compliance norms had astrong positive impact on compliance
Hallsworth, List, Metcalfe, Vlaev (2014) [UK Income Tax]:
I Letters with norms and public goods messages improves thetimely payment of taxes, conditional on declaration
Dwenger, Kleven, Rasul, Rincke (2015) [German Church Tax]:
I In an unenforced tax system, they find that (i) intrinsicallymotivated compliance is substantial, (ii) that much of it may bedriven by duty-to-comply, and (iii) there is no crowd-outbetween extrinsic and intrinsic motivations
45 / 51
Conclusion
I PF-Devo was under-researched for a long time, but is nowquickly growing
I Recent work is fueled by the increasing availability ofadministrative data and a wealth of quasi-experimental variation
I Rather than relying on off-the-shelf developed countrysolutions, the literature takes a more “nitty-gritty microapproach” grounded in the specific context and constraints ofdeveloping countries
I There are still many unanswered questions, so hopefully wewill see much more work on this in the future
46 / 51

Appendix Graphs
47 / 51
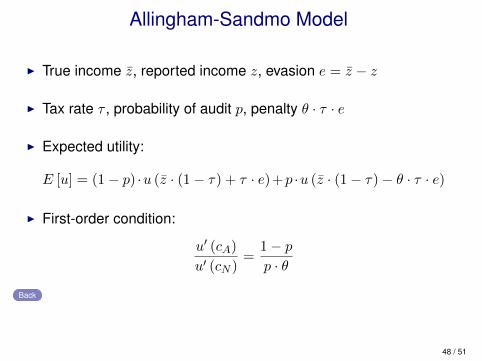
Allingham-Sandmo Model
I True income z̄, reported income z, evasion e = z̄ − z
I Tax rate τ , probability of audit p, penalty θ · τ · e
I Expected utility:
E [u] = (1− p) ·u (z̄ · (1− τ) + τ · e)+p ·u (z̄ · (1− τ)− θ · τ · e)
I First-order condition:
u′ (cA)
u′ (cN )=
1− pp · θ
Back
48 / 51
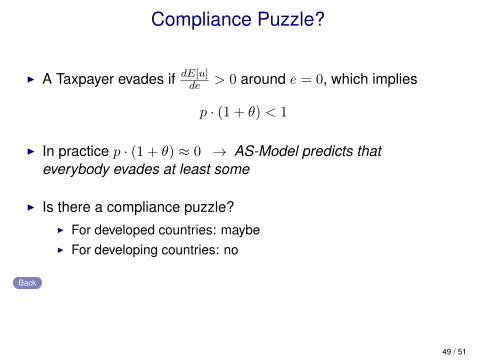
Compliance Puzzle?
I A Taxpayer evades if dE[u]de > 0 around e = 0, which implies
p · (1 + θ) < 1
I In practice p · (1 + θ) ≈ 0 → AS-Model predicts thateverybody evades at least some
I Is there a compliance puzzle?I For developed countries: maybeI For developing countries: no
Back
49 / 51
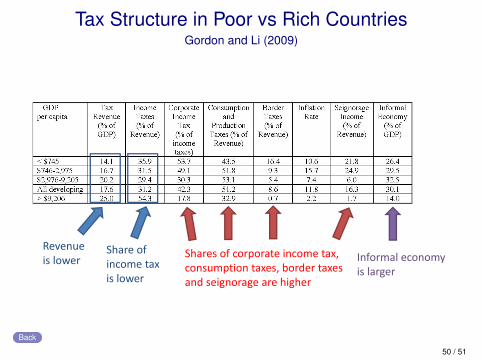
Tax Structure in Poor vs Rich CountriesGordon and Li (2009)
Revenue is lower
Share of income tax is lower
Shares of corporate income tax, consumption taxes, border taxesand seignorage are higher
Informal economyis larger
Back
50 / 51
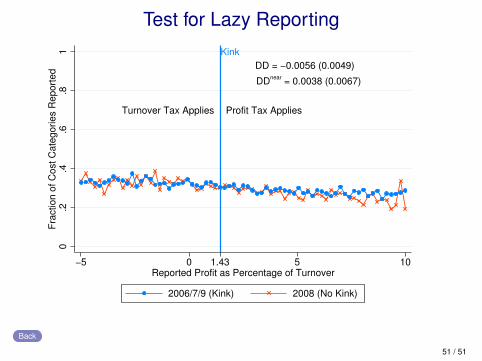
Test for Lazy Reporting
DD = −0.0056 (0.0049)
DDnear = 0.0038 (0.0067)
Turnover Tax Applies Profit Tax Applies
Kink0
.2.4
.6.8
1Fr
actio
n of
Cos
t Cat
egor
ies
Rep
orte
d
−5 0 1.43 5 10Reported Profit as Percentage of Turnover
2006/7/9 (Kink) 2008 (No Kink)
Back
51 / 51


