Embed Size (px)
Citation preview

www.elsevier.com/locate/lifescie
Life Sciences 73 (2003) 2939–2951
Effect of arachidonic acid on proliferation, cytokines production
and pleiotropic genes expression in Jurkat cells—A comparison
with oleic acid
Rozangela Verlengiaa,*, Renata Gorjaoa, Carla Cristine Kanunfreb, Silvana Bordina,Thais Martins de Limaa, Rui Curia
aDepartamento de Fisiologia e Biofısica, Instituto de Ciencias Biomedicas, Universidade de Sao Paulo,
Av. Prof. Lineu Prestes, 1524, 05508-900, Butanta, Sao Paulo, SP, BrazilbDepartment of Biology, University of Ponta Grossa, Ponta Grossa, SP, Brazil
Received 26 February 2003; accepted 14 April 2003
Abstract
The effects of arachidonic (AA) and oleic acids (OA) on proliferation, cytokine production and pleiotropic
genes expression in Jurkat T cells were investigated. The following parameters were evaluated: cytotoxicity
assessed by loss of membrane integrity and DNA fragmentation, cell proliferation as measured by [14C]-
thymidine incorporation, production of IL-2, IL-4, IL-10, and INF-g, and expression of pleiotropic genes as
determined by macroarray technique (83 genes in total). AA was more toxic for Jurkat cells than OA.
However, the inhibiting effect of OA on Jurkat cells proliferation was more pronounced than that of AA. The
reduction in the production of IL-2 and INF-g was more intense by OA (50 AM) than by AA (5 AM). The
percentage of genes changed by the fatty acids was: 20.5% (17 genes) for AA (5 AM) and only 2.4% (2 genes)
for OA (50 AM). AA markedly affected the expression of genes clustered as: signal transduction pathways,
transcription factors and related genes, cell cycle, defense and repair, apoptosis, DNA synthesis, cell adhesion,
cytoskeleton and related genes. In particular, AA induced marked changes in cell cycle, signal transduction,
and anti-apoptosis genes expression. Therefore, the effect of AA on T-lymphocyte function does involve
regulation of expression of important genes, whereas oleic acid did not markedly affect gene expression of
Jurkat cells.
D 2003 Elsevier Inc. All rights reserved.
Keywords: Jurkat cells; Gene expression; Macroarray; Arachidonic acid; Oleic acid; Proliferation; Cytokines and cytotoxicity
0024-3205/$ - see front matter D 2003 Elsevier Inc. All rights reserved.
doi:10.1016/j.lfs.2003.04.003
* Corresponding author. Tel.: +55-11-3091-7245; fax: +55-11-3091-7285.
E-mail address: [email protected] (R. Verlengia).

R. Verlengia et al. / Life Sciences 73 (2003) 2939–29512940
Introduction
T lymphocyte is an important cell for the body defense. This cell plays a critical role in defining
the type and magnitude of the immune response. Regulation of immune function by the T lymphocyte
is partially mediated by the type of cytokines it produces. The mechanism leading to the propagation
of T lymphocytes involves their activation, which leads to interleukin-2 (IL-2) production and
subsequent proliferation referred to as clonal expansion. Depending on the mode of activation, T
lymphocytes differentiates into either a helper Th-1 or Th-2 cells (CD4+ T lymphocytes), or become a
cytotoxic T lymphocyte (CD8 + cells). The Th-1 cell produces primarily IL-2, interferon-g (INF-g),
and tumor necrosis factor-a (TNF-a), resulting in enhanced cell-mediated or cytotoxic responses.
The Th-2 cell produces IL-4,-5,-6, and -10, generating a humoral or antibody-mediated immune
response.
Several studies have demonstrated that nonesterified fatty acids modulate T lymphocyte proliferation
and cytokines production (Calder et al., 1995; Jenski et al., 1998; Peterson et al., 1998). Arachidonic
acid inhibits the proliferation of cultured lymphocytes and decreases the production of IL-2 (Calder et
al., 2002). This fatty acid is precursor of eicosanoids such as prostaglandins, leukotrienes and
thromboxanes. Eicosanoids (particularly PGE2 and leukotriene B4) modulate the intensity and duration
of inflammatory and immune responses (Tilley et al., 2001). The pro-inflammatory effects of PGE2
include inducing fever, increasing vascular permeability and vasodilatation. PGE2 suppresses lympho-
cyte proliferation and inhibits the production of interleukins such as IL-2 and INF-g. LTB4 increases
vascular permeability and enhances blood flow. This leukotriene inhibits lymphocyte proliferation and
increases the production of cytokines such as IL-2 and INF-g (Calder and Field, 2002). Thus, the effects
of AA on inflammatory and immune responses are partially due to eicosanoids production. However,
arachidonic acid may affect lymphocyte function by eicosanoid-independent mechanisms including
actions on intracellular signalling pathways and transcription factor activity (McMurray et al., 2000).
It has become conventional to use monounsaturated fatty acid (such as oleic acid that can be found in
olive oil and cashew seed oil) as the baseline or neutral fatty acid. By this is meant that oleic acid neither
raises nor lowers total cholesterol concentrations (Mata et al., 1997). Yaqoob et al. (1998) and Yaqoob
(2002) using an oleic acid enriched diet did not observe changes in lymphocyte proliferation and
cytokines production. This issue however still remains controversial. Mata et al. (1997) showed that
patients receiving oleic acid-rich diets present low levels of oxidized LDL in plasma. Experiments in
isolated lymphocytes show that oleic acid in sufficient amounts can partially inhibit proliferation and IL-
2 production (Calder et al., 1995; Pompeia et al., 2000). In fact, oleic acid raises CD44 and CD45
expression in lymphocytes (Peck et al., 1996).
The information above led us to investigate the effect of arachidonic acid, a well-known modulator of
T cell function; on a T lymphocyte cell model (Jurkat cells) and its effects were compared with those of
oleic acid that is considered by several authors as a neutral fatty acid. The parameters evaluated were:
cytotoxicity assessed by Flow Cytometric Analysis (FACS) analysis for cell membrane integrity and
DNA fragmentation, Jurkat cells proliferation by the measurement of [14C]-thymidine incorporation,
production of IL-2, IL-4, IL-10 and INF-g by ELISA and expression of pleiotropic genes by macroarray
technique.

R. Verlengia et al. / Life Sciences 73 (2003) 2939–2951 2941
Material and methods
Determination of the toxic concentrations of AA and OA on Jurkat cells by flow cytometric analysis
Jurkat cells were obtained from the Dunn School of Pathology, Oxford University, England. The cells
(2 � 105 per mL) were plated in 24 wells plate and treated for 24 hours with arachidonic (C20:4) and
oleic (C18:1cis9) acids. These FA did not show any sign of toxicity up to 50 AM concentration (data not
shown). The FA concentrations (50, 100, 150, 200, 300 and 350 AM) were used to carry out membrane
integrity and DNA fragmentation analysis. The fatty acids were first dissolved in ethanol before
emulsification in the serum proteins containing medium. The percentage of ethanol was always lower
than 0.05% of the total volume of culture medium. This concentration of ethanol has shown not to be
toxic for the cells as also observed by Siddiqui et al. (2001).
At the end of the culture period, 0.5 mL of medium containing cells were used to test the membrane
integrity. In this assay, 50 AL of a propidium iodide (PI) solution (100 Ag per mL in saline buffer) were
added to the cells (Nicoletti et al., 1991). Propidium iodide is a highly water-soluble fluorescent
compound that cannot pass through intact membranes and is generally excluded from viable cells. It
binds to DNA by intercalating between the bases with little or no sequence preference. After 5 minutes
incubation at room temperature, the cells were evaluated in a FACScalibur flow cytometer equipment
(BectonDickinson, California, USA) by using the Cell Quest software. The loss of membrane integrity is
noticeable when the PI fluorescence (620 nm) arises. Ten thousand events were evaluated per
experiment. The remaining medium containing cells was centrifuged at high speed (12,000 � g, 30
seconds) and the pellet was resuspended in 0.2 mL lyse buffer (0.1% sodium citrate and 0.1% Triton X-
100) containing 50 Ag per mL of PI. The lysed cells were then incubated in the dark, at 4 jC for 24
hours, and used for the DNA fragmentation analysis. PI intercalates between bases in double stranded
nucleic acids of exposed nuclei. The DNA fragmentation is observed by the occurrence of low
fluorescent particles. This indicates that DNA was cleaved and there are little DNA fragments that,
because of their high condensation and small size, cannot be intensively bound by PI. These particles are
seen as low fluorescent particles.
Proliferation assay
Jurkat cells (3.3 � 105 cells per mL) were plated in 96 well microtiter plates and treated for 48
hours with AA (2.5, 5, 25, 50, 75 and 100 AM) and OA (25, 50, 100, 150, 200, 250 and 300 AM).
[14C] Thymidine (1 ACi per mL) was added to the medium at the beginning of the experiment. The
plates were incubated in a humidified atmosphere of 5% CO2 and 95% air at 37 jC. The radioactivity
was analysed by using a liquid scintillation counter (Packard TRI-CARB 2100 TR counters; Downers
Grove, IL, USA).
Measurement of cytokines
The cells (2 � 105 cells per mL) were plated in 24 wells plate and treated for 24 hours with AA (5
AM) and OA (50 AM). This concentration is in the plasma physiological range (Painter et al., 1994) and
it was the same employed to study pleiotropic genes expression. The cells were then cultured for another
period of 24 hours in the presence of the 25 Ag/mL concanavalin A (Con A)—a T lymphocyte mitogen

R. Verlengia et al. / Life Sciences 73 (2003) 2939–29512942
(Boyum, 1968). Afterwards, cell culture supernantant fluid was harvested to carry out the determinations
of secreted cytokines.
The production of IL-2, IL-10, IL-4 and INF-g was evaluated by enzyme-linked immunosorbent
assay (ELISA) using Kit OptEIAk from Pharmingen (San Diego, CA-USA). The detection limit of IL-
2, IL-10 and IL-4 was 7.8 pg/mL and of INF-g was 4.7 pg/mL according to the manufacturer.
Treatment of Jurkat cells with the fatty acids to evaluate pleotropic genes expression
Cells were resuspended at a density of 2 � 105 cells per mL in 25 cm3 flask containing RPMI 1640
medium and 10% fetal calf serum. The cells were treated for 24 hours with AA and OA at 5 AM and 50
AM concentrations, respectively.
Total RNA extraction
Total RNA was obtained from 0.5–1 � 107 cells using Trizol reagent (Life Technologies Inc.,
Rockville, MD, USA). Briefly, the cells were lysed using 1 mL Trizol reagent (Life Technologies,
Rockville, MD, USA). After 5 min incubation at room temperature, 200 AL chloroform were added to the
tubes and centrifuged at 12,000 � g. The aqueous phase was transferred to another tube and the RNA
was precipitated by centrifugation (12,000 � g) with cold ethanol and dried in air. RNA pellets were
eluated in RNase-free water and treated with DNase I. RNAs were then stored at � 70 jC until to the
time of the experiment. The RNAwas quantified by measuring absorbance at 260 nm. The purity of the
RNAs was assessed by the 260/280 nm ratio and on a 1% agarose gel stained with ethidium bromide at 5
Ag/mL (Sambrook and Russell, 2001). These samples were used for macroarray and RT-PCR analysis.
Synthesis of cDNA probes
The cDNA probes were synthetized using the pure total RNA labeling system Atlas Kitk according
to manufacturer’s recommendations (Clontech Laboratories, California, USA). Briefly, 10 Ag of total
RNA and 2 AL of primers mix ‘‘CDs’’ were heated at 70 jC for 5 min in a Techne-Genius Thermal
cycler (Oxford, UK). The temperature was decreased to 50 jC and 13.5 AL of the following reagents
were added: 4 AL reaction buffer 5� , 0.5 AL 100 mM DTT, 2 AL 10� dNTP mix (dCTP, dGTP,
dTTP), 5 AL of [a-33P] ATP (at 10 ACi/AL) and 2 AL of reverse superscript enzyme (Life Technologies
Inc., Rockville, MD, USA). The reaction was incubated for 25 min at 50 jC and stopped by using 2 ALTermination Mix. The 33P-labeled probe was purified from unincorporated nucleotides by passing the
reaction mixture through a push column (NucleoSpin Extraction Spin Column-Clontech Laboratories).
Experiments using 20 Ag total RNA were also performed and the results indicated saturation of the
hybridization reactions (data not shown).
Macroarrays hibridization
All solutions for hybridization were obtained from the Clontech Laboratories. The membrane was
pre-hybridized for 30 min at 68 jC in Express Hyb containing 50 Ag freshly denaturated salmon sperm
DNA. Subsequently the membrane was hybridized during 18 h at 68 jC with 2 � 106 cpm/mL 33P-
labeled denaturated probe. The membrane was washed twice at 68jC with 1 � SSC, 0.1% SDS

R. Verlengia et al. / Life Sciences 73 (2003) 2939–2951 2943
followed by two washings in 1 � SSC, 1% SDS and then exposed to phosphor screen for 48 hours and
scanned in the Storm 840 (Molecular Dynamics, Sunnyvale, CA, USA).
Analysis of macroarray results
Changes in the genes expression induced by the fatty acids were analysed by comparison with
untreated cells using the software Array-Prok Analyzer, version 4 (Media CyberneticsR, Silver Spring,MD, USA). Normalization was performed by housekeeping gene h-actin present in the membrane.
Duplicate hybridizations using separate sets of nylon membranes were performed for all conditions.
Only signals that differed from the control by at least 2-fold in the two independent experiments were
considered as significant. Similar procedure was used by Yamazak et al. (2002).
RT-PCR
RT-PCR using specific primers was performed to confirm the differential expression of the mRNAs
detected with the macroarray analysis. The sequences of the primers were designed using information
contained public database in GeneBank of the National Center for Biotechnology Information (NCBI).
The RT-PCR was performed using parameters described by Innis and Gelfand (1990). The number of
cycles used was selected to allow linear amplification of the cDNA under study. For semi-quantitative
PCR analysis, the housekeeping h-actin gene was used as reference. The primer sequences and their
respective PCR fragment lengths are shown in the Table 1. Published guidelines were followed to guard
against bacterial and nucleic acid contamination (Kwok and Higuchi, 1989).
Analysis of the PCR products
The analysis of PCR amplification products was performed in 1,5% agarose gels containing 0.5 Ag/mL ethidium bromide and electrophoresed for 1 h at 100 V. The gels were photographed using a DC120
Table 1
The standardized conditions for RT-PCR analysis. Sequences of the primers, PCR fragment lengths, temperature and number of
cycles are shown for each gene under study
Genes Sense primer Antisense primer Anneling
temperature
(jC)
PCR
fragment
lengths (bp)
Number
of cycles
PLA2 5V-AGCCCGTAGGTCATCTTGG-3V
5V-GCTTCAGCTTCGTCTCCTTGG-3V
56 559 30
PKC-beta 5V-CCATCAAATGCTCCCTCAACCC-3V
5V-TTGCCAAAGCTGCCTTTCCC-3V
57 424 35
TOP1 5V-CGTACAATGCCTC CATCACGC-3V
5V-ACTTCTTGCACCAAGCCACTG-3V
56 436 30
Kruppel related
zinc finger protein*
5V-GCAAAGCATTTAGCCAGCCTTC-3V
5V-TCTCTCCAGTGTGCATCCTCG-3V
56 313 40
For all genes 1.5 mM MgCl2 was used.
*For kruppel related zinc finger protein RT-PCR, formamide was used at 2.5% concentration. PLA2, phospholipase A2;
PKC-beta, Protein Kinase C type beta I; TOP1, DNA Topoisomerase 1.
R. Verlengia et al. / Life Sciences 73 (2003) 2939–29512944
Zoom Digital Camera System from Kodak (Life Technologies, Inc., Rockville, MD, USA). The images
were processed and analyzed in the software Kodak Digital Science 1D Image Analysis (Life
Technologies).
PCR band intensities were expressed as OD normalized for h-actin expression. The data are presentedas the ratio with the respective controls, which received an arbitrary value of 1 in each experiment.
Statistical analysis
The results of toxicity and proliferation assay and measurement of the production of cytokines were
expressed as mean F SEM. Comparisons between groups were performed by analysis of variance
(ANOVA). Significant differences were found by using the Turkey-Kramer’s method (INStat-Graph Pad
Software, Inc., San Diego, CA, USA) for comparison with control (ethanol).
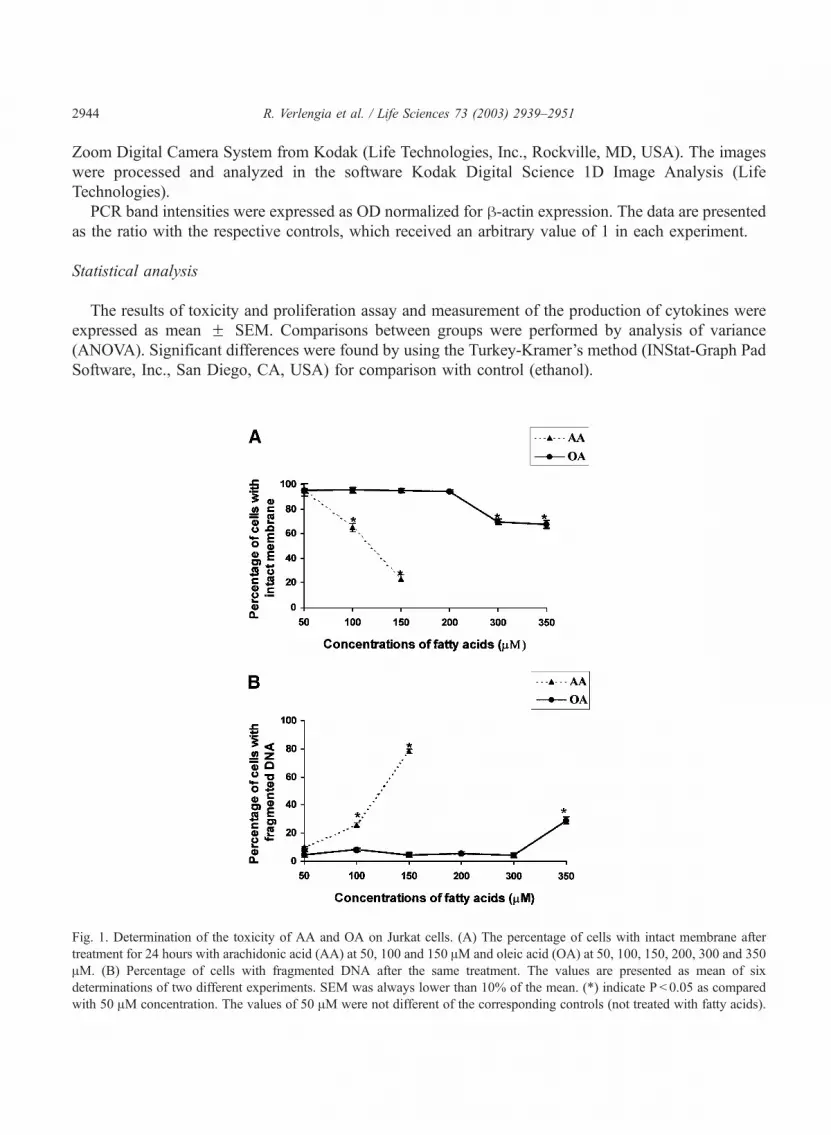
Fig. 1. Determination of the toxicity of AA and OA on Jurkat cells. (A) The percentage of cells with intact membrane after
treatment for 24 hours with arachidonic acid (AA) at 50, 100 and 150 AM and oleic acid (OA) at 50, 100, 150, 200, 300 and 350
AM. (B) Percentage of cells with fragmented DNA after the same treatment. The values are presented as mean of six
determinations of two different experiments. SEM was always lower than 10% of the mean. (*) indicate P < 0.05 as compared
with 50 AM concentration. The values of 50 AM were not different of the corresponding controls (not treated with fatty acids).

R. Verlengia et al. / Life Sciences 73 (2003) 2939–2951 2945
Results
Determination of the toxic concentrations of AA and OA acids to Jurkat cells
Initially the comparative toxicity of arachidonic and oleic acids on Jurkat cells was determined.
Toxicity was assessed by either loss of cell membrane integrity or DNA fragmentation using flow
cytometric analysis. There were remarkable differences in the toxicity of both fatty acids on Jurkat cells
(Fig. 1). The proportion (%) of control cells with integral membrane was 95.5 F 3.4 and with integral
DNAwas 94.3 F 3.2 after treatment. Oleic acid did not cause loss of membrane integrity up to 200 AMconcentration (94% of viable cells) and DNA fragmentation up to 300 AM (29% of cells with fragmented
DNA). In contrast, AA led to loss of membrane integrity already at 100 AM (65% of viable cells). The
Fig. 2. Effect of arachidonic (A) and oleic acid (B) on Jurkat cells proliferation. The cells (3.3 � 105 cells per mL) were
cultured in various fatty acids concentrations for 48 h. Cells were pulsed with 0.2 ACi/200 AL [14C]-thymidine, then harvested
and the radioactivity of the thymidine incorporated into DNA was determined by using a liquid scintillation counter. The
incorportion of [14C]-thymidine is expressed as total counts per min. The values are presented as mean F SEM of six
determinations from three experiments. (*) indicate P < 0.05 as compared with the corresponding controls (no fatty acids added).

R. Verlengia et al. / Life Sciences 73 (2003) 2939–29512946
concentrations then selected to examine the effect of these FA on cytokines production and pleiotropic
genes expression were much lower than those that caused toxic effect: 5 AM for AA and 50 AM for oleic
acid. Therefore, the changes observed were due to the effect of the FA per se and did not result from
induction of apoptosis or necrosis.
Proliferation assay
As compared with controls (no fatty acid added), [14C]-thymidine incorporation by Jurkat cells was
markedly reduced by OA already at 50 AM (12%) and 100 AM (42%) concentrations and reached
maximal inhibition at 200 AM (99%). The decrease of Jurkat cells proliferation by AAwas of 63% at 75
AM and of 80% at 100 AM (Fig. 2), as compared with controls. Therefore, oleic acid presented a stronger
inhibiting effect on Jurkat cells proliferation than AA.
Measurement of production of cytokines
AA (5 AM) and OA (50 AM) were able to inhibit the cytokines production in 24 h cultured Jurkat
cells, except for AA on IL-4 (Fig. 3). AA (at 5 AM) reduced the production of IL-2 (50%), IL-10 (by
32%), and INF-g (36%), as compared with control (no fatty acid added). Oleic acid (at 50 AM) caused a
marked reduction of the four cytokines production: IL-2 (66%), IL-4 (48%), IL-10 (56%) and INF-g
(61%); the values were compared with those of control.
Fig. 3. Effect of the fatty acids on cytokines production by Jurkat cells. The cells were cultured in the presence of AA (5 AM)
and OA (50 AM) for 24 hours. The cells were then cultured for another period of 24 hours in the presence of 25 Ag per mL
concanavalin A (Con A) and afterwards the supernatant was used for determination of the cytokines by ELISA as described in
Material and Methods. Values represent mean F SEM of six determinations from three experiments. (*) indicate P < 0.05 as
compared with the corresponding controls (no fatty acids added).

Pleiotropic genes expression
The comparative effect of AA (5 AM) and OA (50 AM) on expression of genes involved with several
aspects of T lymphocyte function is shown in the Table 2. To validate the results of themacroarray analysis,
four genes were selected for confirmation by RT-PCR (Fig. 4). Although the magnitude was not the same,
R. Verlengia et al. / Life Sciences 73 (2003) 2939–2951 2947
Table 2
Modifications in Jurkat cells genes expression after treatment with arachidonic (AA) and oleic (OA) acids
Cluster/GAN* Gene name AA Oleic
1. Signal transduction pathways
X06318 Protein Kinase C beta I (PKC-beta) � 2.8
M35203 Janus tyrosine-protein Kinase I (JAK-1) � 2.3
U39657 MAP Kinase Kinase 6 (MAPKK6) + 7.4
M86400 Phospholipase A2 (PLA2) + 2.4
2. Transcription factors and related genes
X12794 v-erbA homology-like 2 + 12.7
L11672 Kruppel related zinc finger protein � 4
M15400 Retinoblastoma-associated protein 1 (RB1);
phosphoprotein 110 (pp110)
� 2.1
3. Cell cycle
M81933 Cell division cycle 25 homolog A (CDC25A) � 2.0
X51688 G2/mitotic-specific cyclin A (CCNA) � 4.2
L27211 Cyclin-dependent kinase 4 inhibitor 2 (CDK4I) + 23.8
M25753 G2/mitotic-specific cyclin B1 (CCNB1) � 2.3
4. Defense and repair
X08058 Glutathione S-transferase pi (GSTP1) � 2.6
M25627 Glutathione S-transferase A1 (GSTA1) + 2.7
5. Apoptosis
U66879 Bcl2-binding component 6 (bbc6) + 19.8
U43746 Breast cancer type 2 susceptibility protein (BRCA2) + 3.8
6. DNA synthesis
J03250 DNA Topoisomerase I (TOP1) + 2.9
L04088 DNA topoisomerase II alpha (TOP2A) � 2.3
7. Cell adhesion, cytoskeleton, and related genes
Z15009 Laminin gamma 2 subunit (LAMC2) + 6.1
X02761 Fibronectin 1 (FN1) + 15.1
Jurkat cells were treated for 24 hours with arachidonic (5 AM) and oleic (50 AM) acids. Total RNA was isolated,
retrotranscribed, 33P-labelled and hybridized to the cDNA array presenting 83 transcripts of known genes. The signals were
then analyzed by pro-analysis software Array-Prok Analyzer, version 4 (Media CyberneticsR, Silver Spring, MD, USA) and
expressed as fold of increase or decrease in relation to untreated cells. Data are presented as means of two different experiments.
Only signals that differed from untreated cells by at least 2-fold were considered as significant. Changes are indicated as (+)
increase and (� ) decrease as compared to untreated cells.
*GAN – GeneBank accession number.
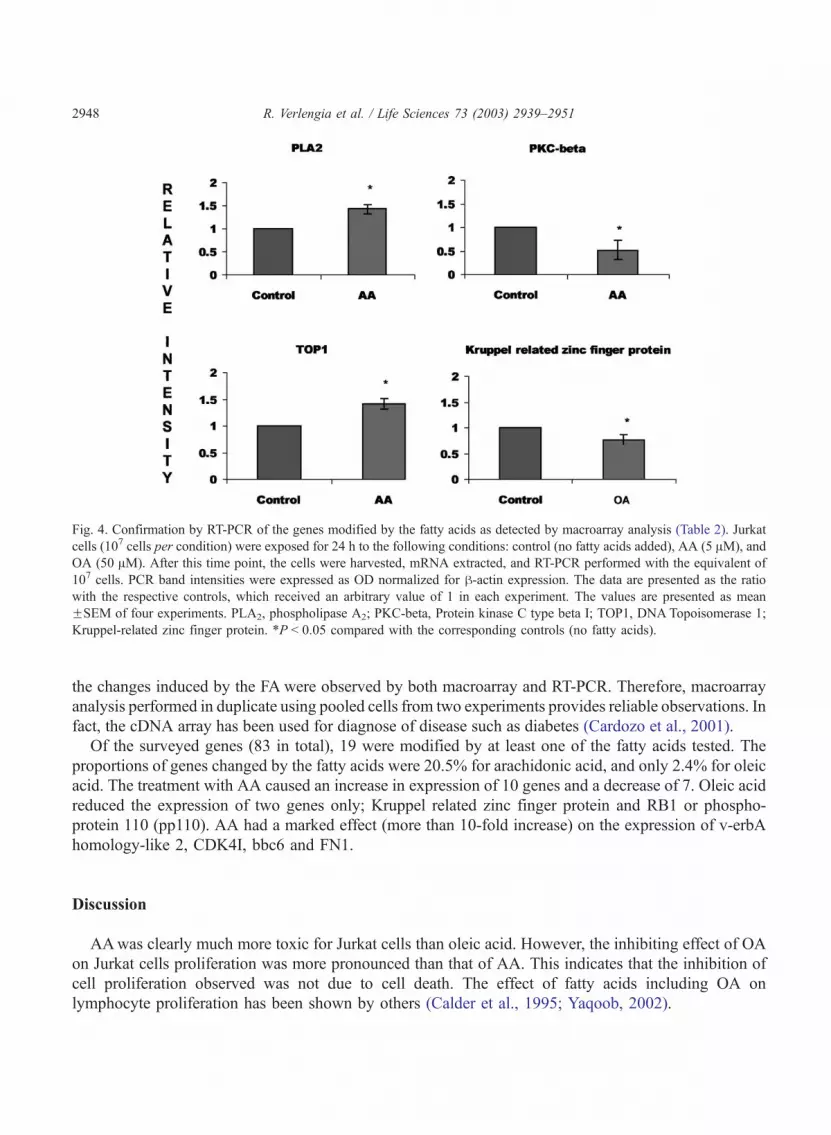
Fig. 4. Confirmation by RT-PCR of the genes modified by the fatty acids as detected by macroarray analysis (Table 2). Jurkat
cells (107 cells per condition) were exposed for 24 h to the following conditions: control (no fatty acids added), AA (5 AM), and
OA (50 AM). After this time point, the cells were harvested, mRNA extracted, and RT-PCR performed with the equivalent of
107 cells. PCR band intensities were expressed as OD normalized for h-actin expression. The data are presented as the ratio
with the respective controls, which received an arbitrary value of 1 in each experiment. The values are presented as mean
FSEM of four experiments. PLA2, phospholipase A2; PKC-beta, Protein kinase C type beta I; TOP1, DNA Topoisomerase 1;
Kruppel-related zinc finger protein. *P < 0.05 compared with the corresponding controls (no fatty acids).
R. Verlengia et al. / Life Sciences 73 (2003) 2939–29512948
the changes induced by the FA were observed by both macroarray and RT-PCR. Therefore, macroarray
analysis performed in duplicate using pooled cells from two experiments provides reliable observations. In
fact, the cDNA array has been used for diagnose of disease such as diabetes (Cardozo et al., 2001).
Of the surveyed genes (83 in total), 19 were modified by at least one of the fatty acids tested. The
proportions of genes changed by the fatty acids were 20.5% for arachidonic acid, and only 2.4% for oleic
acid. The treatment with AA caused an increase in expression of 10 genes and a decrease of 7. Oleic acid
reduced the expression of two genes only; Kruppel related zinc finger protein and RB1 or phospho-
protein 110 (pp110). AA had a marked effect (more than 10-fold increase) on the expression of v-erbA
homology-like 2, CDK4I, bbc6 and FN1.
Discussion
AAwas clearly much more toxic for Jurkat cells than oleic acid. However, the inhibiting effect of OA
on Jurkat cells proliferation was more pronounced than that of AA. This indicates that the inhibition of
cell proliferation observed was not due to cell death. The effect of fatty acids including OA on
lymphocyte proliferation has been shown by others (Calder et al., 1995; Yaqoob, 2002).

R. Verlengia et al. / Life Sciences 73 (2003) 2939–2951 2949
AA reduced the production of IL-2, IL-4, IL-10 and INF-g. Similar observations have been obtained
by others (Calder et al., 1995). OA at 10-fold higher concentrations than that of AA caused marked
reduction in the production of the four cytokines. Therefore, OA at high concentration is also able to
decrease cytokines production. These results confirm the findings of Calder et al. (1995) and Pompeia et
al. (2000).
The effect of both fatty acids on pleiotropic genes expression of Jurkat cells was then examined. The
fatty acids responsive genes were clustered according to main putative biological functions of their
encoded protein. AA markedly affected the expression of genes clustered as: signal transduction
pathways, transcription factors, cell cycle, defense and repair, apoptosis, DNA synthesis, cell adhesion,
cytoskeleton and related genes. AA increased the expression of 58.8% of the genes changed, whereas
OA decreased the expression of two genes only.
The mechanism of action of OA on T lymphocytes functions remains to be investigated. Oleic acid
contributes to enhance cellular antioxidant defenses against mitochondria oxidative stress induced by
glutathione peroxidase (Duval et al., 2002). This fatty acid is also involved in regulation of cell cycle
(Vacaresse et al., 1999; Zugaza et al., 1995).
E-6 Fatty acids are widely recognized as pro-inflammatory agents (Calder, 2001; Pompeia et al., 2000).
AA does lead to production of inflammatory mediators by macrophages (Grundy, 1997). The results
presented herein suggest that the effect of AA is not restricted to macrophages. Several genes are under
control of this fatty acid in T lymphocytes. AA decreased the expression of signal transduction proteins
(PKC-beta and JAK-1), cell cycle genes (CDC25A, CCNA, and CCNB1) and of GSTP1 (defense and
repair). AA raised the expression of MAPKK6, PLA2, v-erbA homology-like 2, CDK4I, GSTA1, bbc6,
BRCA2, Topoisomerase 1, LAMC2, and FN1. In particular, AA induced marked changes in cell cycle,
signal transduction, and anti apoptosis genes expression. This is a novel finding and led us to postulate that
the pro-inflammatory action of AA may also result from activation and/or inhibition of several genes in T
lymphocytes. However, it remains unknown if these effects were caused by the fatty acid itself or by the
eicosanoids produced through AAmetabolism (Kelley et al., 1998). There is substantial evidence that AA
may affect lymphocyte function eicosanoid-independent mechanisms (McMurray et al., 2000).
The results presented herein show important effects of AA and OA on a T lymphocytes cell line.
Evidence exists that macrophages are able to produce, export and transfer mainly arachidonic acid, but
also oleic acid to lymphocytes in co-culture (Peres et al., 1999). This process has been found to regulate
the proliferation activity and cytokines production by the acceptor cells (Nishiyama et al., 2000).
Therefore, AA derived from macrophages may modulate lymphocytes function by regulating genes
expression.
Conclusion
The findings presented herein led us to conclude that AA and OA present remarkable differences on
functional parameters and gene expression of Jurkat cells. AAwas more toxic than OA, but its inhibiting
effect on proliferation and cytokine production (mainly IL-2 and INF-g) was less pronounced than that
of OA. The changes in genes expression induced by AAwere much different than those caused by OA.
AA enhanced the expression of most genes and suppressed several others, whereas OA decreased the
expression of two genes only. AA induced changes mainly in cell cycle, signal transduction and anti-
apoptosis genes expression.

R. Verlengia et al. / Life Sciences 73 (2003) 2939–29512950
Acknowledgements
The authors are grateful to the technical assistance of J.R. Mendonc�a, G. de Souza, and E. Portioli andto Dr. C. K. Miyasaka. FAPESP, Pronex, CNPq, CAPES, and The British Council support this research.
References
Boyum, A., 1968. Isolation of mononuclear cells and granulocytes from human blood. Scandinavian Journal of Clinical and
Laboratory Investigation 21, 77–78.
Calder, P.C., 2001. Polyunsaturated fatty acids, inflammation, and immunity. Lipids 36, 1007–1024.
Calder, P.C., Field, C.J., 2002. Fatty acids, inflammation and immunity. In: Calder, P.C., Field, C.J., Gill, H.S. (Eds.), Nutrition
and Immune Function, 57–92.
Calder, P.C., Costa-Rosa, L.F., Curi, R., 1995. Effects of feeding lipids of different fatty acid compositions upon rat lymphocyte
proliferation. Life Sciences 56, 455–463.
Calder, P.C., Yaqoob, P., Thies, F., Wallace, F.A., Miles, E.A., 2002. Fatty acids and lymphocyte functions. British Journal of
Nutrition 87 (1), S31–S48.
Cardozo, A.K., Kruhøffer, M., Leeman, R., Ørntoft, T., Eizirik, D.L., 2001. Identification of novel cytokine-induced genes in
pancreatic h-cells by high-density oligonucleotide arrays. Diabetes 50, 909–920.
Duval, C., Auge, N., Frisach, M.F., Casteilla, L., Salvayre, R., Negre-Salvayre, A., 2002. Mitochondrial oxidative stress is
modulated by oleic acid via an epidermal growth factor receptor-dependent activation of glutathione peroxidase. Biochem-
ical Journal 367 (3), 889–894.
Grundy, S.M., 1997. What is the desirable ratio of saturated, polyunsaturated, and monounsaturated fatty acids in the diet? The
American Journal of Clinical Nutrition 66, 988S–990S.
Innis, M.A., Gelfand, D.H., 1990. Optimization of PCRs. In: Innis, M.A., Gelfand, D.H., Sninsky, J.J., White, T.J. (Eds.), PCR
Protocols: A Guide to Methods and Applications, 1st ed. Academic Press, San Diego, CA, pp. 3–12.
Jenski, L.J., Scherer, J.M., Caldwell, L.D., Ney, V.A., Stillwell, W., 1998. The triggering signal dictates the effect of doco-
sahexaenoic acid on lymphocyte function in vitro. Lipids 33, 869–878.
Kelley, D.S., Taylor, P.C., Nelson, G.J., Mackey, B.E., 1998. Arachidonic acid supplementation enhances synthesis of eico-
sanoids without suppressing immune functions in young healthy men. Lipids 33, 125–130.
Kwok, S., Higuchi, R., 1989. Avoiding false positives with PCR. Nature 339, 237–238.
Mata, P., Varela, O., Alonso, R., Lahoz, C., de Oya, M., Badimon, L., 1997. Monounsaturated and polyunsaturated n-6 fatty
acid-enriched diets modify LDL oxidation and decrease human coronary smooth muscle cell DNA synthesis. Arterio-
sclerosis, Thrombosis, and Vascular Biology 17, 2088–2095.
McMurray, D.N., Jolly, C.A., Chapkin, R.S., 2000. Effects of dietary n-3 fatty acids on T cell activation and T cell receptor-
mediated signalling in a murine model. The Journal Infectious Diseases 182, S103–S107.
Nicoletti, I., Migliorati, G., Pagliacci, M.C., Grignani, F., Riccardi, C., 1991. A rapid and simple method for measuring
thymocyte apoptosis by propidium iodide staining and flow cytometry. Journal of Immunological Methods 139, 271–279.
Nishiyama, A., Cavaglieri, C.R., Curi, R., Calder, P.C., 2000. Arachidonic acid-containing phosphatidylcholine inhibits lym-
phocyte proliferation and decreases interleukin-2 and interferon-g production from concanavalin A-stimulated rat lympho-
cytes. Biochimica et Biophysica Acta 1487, 50–60.
Painter, P.C., Cope, J.Y., Smith, J.L., 1994. In: Burtis, C.A, Ashwood, E.R. (Eds.), Tietz Textbook of Clinical Chemistry. W.B.
Saunders, Philadelphia, PA, pp. 2161–2217. Appendix.
Peck, M.D., Li, Z., Han, T., Wang, W., Jy, W., Ahn, Y.S., Ziboh, V.A., Chu, A.J., Bourguignon, L.Y., 1996. Fatty acid
unsaturation increases expression and capping of Murine lymphocyte CD44 and CD45. Nutrition 12, 616–622.
Peres, C.M., Procopio, J., Costa, M., Curi, R., 1999. Thioglycolate-elicited rat macrophages exhibit alterations in incorporation
and oxidation of fatty acids. Lipids 34, 1193–1197.
Peterson, L.D., Jeffery, N.M., Thies, F., Sanderson, P., Newsholme, E.A., Calder, P.C., 1998. Eicosapentaenoic and docosa-
hexaenoic acids alter rat spleen leukocyte fatty acid composition and prostaglandin E2 production but have different effects
on lymphocyte functions and cell-mediated immunity. Lipids 33, 171–180.

R. Verlengia et al. / Life Sciences 73 (2003) 2939–2951 2951
Pompeia, C., Lopes, L.R., Miyasaka, C.K., Procopio, J., Sannomiya, P., Curi, R., 2000. Effect of fatty acids on leukocyte
function. Brazilian Journal of Medical and Biological Research 33, 1255–1268.
Sambrook, J., Russell, D.W., 2001. Molecular Cloning: A Laboratory Manual, 3rd ed. Cold Spring Harbor Laboratory Press,
Cold Spring Harbor, New York. A8.21.
Siddiqui, R.A., Jenski, L.J., Neff, K., Harvey, K., Kovacs, R.J., Stilwell, W., 2001. Docosahexaenoic acid induces apoptosis in
Jurkat cells by a protein phosphatase-mediated process. Biochimica et Biophysica Acta 1499, 265–275.
Tilley, S.L., Coffman, T.M., Koller, B.H., 2001. Mixed messages: modulation of inflammation and immune responses by
prostaglandins and Thromboxanes. Journal of Clinical Investigation 108, 15–23.
Vacaresse, N., Lajoie-Mazenc, I., Auge, N., Suc, I., Frisach, M.F., Salvayre, R., Negre-Salvayre, A., 1999. Activation of
epithelial growth factor receptor pathway by unsaturated fatty acids. Circulation Research 85 (10), 892–899.
Yamazaki, K., Kuromitsu, J., Tanaka, I., 2002. Microarray analysis of gene expression changes in mouse liver induced by
peroxisome proliferator activated receptor a agonists. Biochemical and Biophysical Research Communications 290,
1114–1122.
Yaqoob, P., 2002. Monounsaturated fatty acids and immune function. European Journal of Clinical Nutrition 56 (Suppl 3),
S9–S13.
Yaqoob, P., Knapper, J.A., Webb, D.H., Williams, C.M., Newsholme, E.A., Calder, P.C., 1998. Effect of olive oil on immune
function in middle-aged men. American Journal Clinical Nutrition 67, 129–135.
Zugaza, J.L., Casabiell, X.A., Bokser, L., Eiras, A., Beiras, A., Casanueva, F.F., 1995. Pretreatment with oleic acid accelerates
the entrance into the mitotic cycle of EGF-stimulated fibroblasts. Experimental Cell Research 219 (1), 54–63.


