Embed Size (px)
Citation preview
arX
iv:0
903.
3488
v1 [
phys
ics.
bio-
ph]
20 M
ar 2
009
Growth and shape transformations of giant phospholipid vesicles upon interaction with anaqueous oleic acid suspension
Primoz Peterlina,∗, Vesna Arriglera, Ksenija Kogejb, Sasa Svetinaa,c, Peter Walded
aUniversity of Ljubljana, Faculty of Medicine, Institute ofBiophysics, Lipiceva 2, SI-1000 Ljubljana, SloveniabUniversity of Ljubljana, Faculty of Chemistry and ChemicalTechnology, Askerceva 5, SI-1000 Ljubljana, Slovenia
cJozef Stefan Institute, Jamova 39, SI-1000 Ljubljana, SloveniadETH Zurich, Department of Materials, Wolfgang-Pauli-Str. 10, CH-8093 Zurich, Switzerland
Abstract
The interaction of two types of vesicle systems was investigated: micrometer-sized, giant unilamellar vesicles (GUVs) formed from1-palmitoyl-2-oleoyl-sn-glycero-3-phosphocholine (POPC) and submicrometer-sized, large unilamellar vesicles (LUVs) formedfrom oleic acid and oleate, both in a buffered aqueous solution (pH= 8.8). Individual POPC GUVs were transferred with amicropipette into a suspension of oleic acid/oleate LUVs, and the shape changes of the GUVs were monitoredusing opticalmicroscopy. The behavior of POPC GUVs upon transfer into a 0.8 mM suspension of oleic acid, in which oleic acid/oleateforms vesicular bilayer structures, was qualitatively different from the behavior upon transfer into a 0.3 mM suspension of oleicacid/oleate, in which oleic acid/oleate is predominantly present in the form of monomers and possibly non-vesicular aggregates. Inboth cases, changes in vesicle morphology were observed within tens of seconds after the transfer. After an initial increase of thevesicle cross-section, the vesicle started to evaginate, spawning dozens of satellite vesicles connected to the mother vesicle withnarrow necks or tethers. In 60% of the cases of transfer into a0.8 mM oleic acid suspension, the evagination process reversedand proceeded to the point where the membrane formed invaginations. In some of these cases, several consecutive transitionsbetween invaginated and evaginated shapes were observed. In the remaining 40% of the cases of transfer into the 0.8 mM oleic acidsuspension and in all cases of vesicle transfer into the 0.3 mM oleic acid suspension, no invaginations nor subsequent evaginationswere observed. An interpretation of the observed vesicle shape transformation on the basis of the bilayer-couple modelis proposed,which takes into account uptake of oleic acid/oleate molecules by the POPC vesicles, oleic acid flip-flop processes and transientpore formation.
Key words: giant vesicle, oleic acid, phosphatidylcholine, membranegrowth
1. Introduction
The paper presents a study of the interaction between amicrometer-sized giant unilamellar vesicle (GUV) made from1-palmitoyl-2-oleoyl-sn-glycero-3-phosphocholine(POPC) anda buffered (pH 8.8) suspension of oleic acid/oleate, consistingof either 100 nm large unilamellar vesicles (LUVs) at a con-centration of oleic acid exceeding the critical concentration forvesicle formation (cvc), or predominantly monomers at con-centrations below the cvc. The interaction was studied throughthe growth and the morphological shape changes of the POPCGUV, as visualized by an optical microscope.
Certain single-chain amphiphiles,e.g., fatty acids with 10carbon atoms or more, are known to form bilayers when theirconcentration is above the cvc, the temperature of the suspen-sion is above the Krafft temperature (i.e., the temperature atwhich their solubility equals the cvc), and its pH is above 7 [1,2]. Their self-assembly differs from that of double-chain am-phiphiles in a number of ways. On one hand, the cvc for single-chain amphiphiles is much higher (∼ 10−3–10−4 M) than for
∗Corresponding author. Fax:+386-1-4315127.Email addresses:[email protected] (Primoz Peterlin)
phospholipids (e.g., the value for 1,2-dipalmitoyl-sn-glycero-3-phosphocholine (DPPC) is 4.6× 10⁻¹⁰ M) [3]. On the otherhand, unlike bilayers formed from phospholipids, which remainstable through a wide range of pH values, the type of aggregateformed by fatty acids in aqueous medium depends strongly onthe pH of the medium, with two immiscible phases when thepH is clearly below the (apparent) acid dissociation constant(pH ≪ pKa), bilayers when pH∼ pKa and micelles whenpH≫ pKa.
A number of studies exists where similar interactions be-tween phospholipid and oleic acid/oleate aggregates were stud-ied on LUVs. It has been shown previously [4] that upon mix-ing POPC vesicles and oleic acid/oleate vesicles buffered topH ∼ pKa, the oleic acid/oleate vesicles disappear, which hasbeen explained by the dissociation of oleate from the oleic acid/oleatevesicles and its uptake by the phosphatidylcholine vesicles. Inanother experiment [5], a similar migration of fatty acid moleculesfrom fatty acid vesicles to mixed phospholipid/fatty acid mi-celles has been observed. In suspensions of fatty acid vesiclesat pH ∼ pKa, Luisi and co-workers as well as others [6, 7, 8]reported that the presence of existing oleic acid or phospho-lipid [9] vesicles catalyzed the spontaneous formation of oleic
Preprint submitted to Chemistry and Physics of Lipids March 20, 2009
acid vesicles resulting in newly formed vesicles that were moreclosely related in size to the pre-formed vesicles than to thoseformed spontaneously. Experiments with ferritin-labeledvesi-cles [10] indicated that the new vesicles formed via the processof increase of membrane area and fission of the preformed vesi-cles, rather than by being formedde novo. These experimentswere conducted with large unilamellar vesicles, typicallybe-tween 50 and 200 nm in size, and the observation relied ondynamic light scattering and electron microscopy [10, 11, 12].The former method allows for monitoring the presence and/orsize of vesicles/micelles in dependence on time, but does notprovide a direct visual control, while the latter method offersa direct visual observation without the monitoring of the timedependence.
The work presented here tried to overcome the describedlimitations by studying the effects of fatty acid incorporationinto phospholipid GUVs in a manner which allowed for a real-time visual monitoring using optical microscopy. In the exper-iments described, a single POPC GUV was transferred with amicropipette into a chamber filled with a suspension of oleicacid/oleate vesicles. For a comparison, a transfer into a suspen-sion of oleic acid at a concentration lower than the cvc has alsobeen performed.
The vesicle shape is a very sensitive indicator of the amountof oleic acid/oleate and/or phospholipid molecules in either leafletof the bilayer, since the difference of the areas of the two mem-brane leaflets depends on them [13]. The occupancy of oleicacid/oleate molecules in either leaflet in turn depends on thebalance between the rates of association, dissociation andtranslo-cation (flip-flop) of oleic acid molecules in the phospholipidmembrane. Similar methodology – studying the effects of mem-brane modification through shape changes of phospholipid GUVs– has been used, for instance, in observations of chemically-induced shape transformations of GUVs [14], in experimentswith lysolipids which intercalate into the phospholipid mem-brane [15, 16, 17], in the case when flippase activity was in-duced [18], in experiments where phospholipase A2 was mi-croinjected onto or into individual vesicles, thus converting phos-pholipids into lysolipids [19], and for monitoring the effects ofpeptide incorporation into the phospholipid membrane [20,21].An important new feature of this study in relation to the onesmentioned above is that in the system studied here, during thecourse of the reaction, there is a much more significant increaseof the membrane area due to the oleic acid/oleate incorpora-tion into the membrane. Another important difference is that,unlike simple surfactants like lysolipids, which exist in eithermonomeric or micellar state, fatty acids can form bilayer struc-tures.
2. Materials and methods
2.1. Materials
Oleic acid (cis-9-octadecenoic acid), D-(+)-glucose and D-(+)-sucrose were from Fluka (Buchs, Switzerland); Trizma baseand Trizma HCl were from Sigma-Aldrich (St. Louis, MO,USA). 1-palmitoyl-2-oleoyl-sn-glycero-3-phosphocholine(POPC)
was purchased from Avanti Polar Lipids (Alabaster, AL, USA;purity > 99%, used without further purification). 2-(12-(7-nitrobenz-2-oxa-1,3-diazol-4-yl)amino)dodecanoyl-1-hexadecanoyl-sn-glycero-3-phosphocholine (NBD C12-HPC) was purchasedfrom Invitrogen (Eugene, OR, USA). Methanol and chloroformwere purchased from Kemika (Zagreb, Croatia). All the solu-tions were prepared in doubly distilled and sterile water.
2.2. Preparation of giant lipid vesicles
Giant lipid vesicles were prepared from POPC using elec-troformation (a modified method of Angelova [22]) in 0.2 M su-crose and diluted with 0.2 M glucose, both buffered with 5 mMTrizma (pH 8.8). The lipids were dissolved in a mixture ofchloroform/methanol (2:1, v/v) to a concentration of 1 mg/mL.25 µL of the lipid solution was spread onto two Pt electrodesand vacuum-dried for 2 hours. The electrodes were then placedinto an electroformation chamber [23], which was filled with0.2 M sucrose, buffered with 5 mM Trizma to pH 8.8. AC cur-rent (4 V/10 Hz) was then applied. After 2 hours the voltageand the frequency were reduced in steps, first to 3 V/5 Hz, af-ter 15 minutes to 2 V/2.5 Hz, and after additional 15 minutesto the final values of 1 V/1 Hz, which were held for 30 min-utes. The chamber was then drained and flushed with buffered0.2 M glucose solution, yielding a suspension of GUVs in a1:1 sucrose/glucose solution. The size distribution of the vesi-cles in the suspension was determined using dynamic light scat-tering on a 3D-DLS Research Lab (LS Instruments, Fribourg,Switzerland). Two samples were taken from a vial with a sus-pension of GUVs: one from the upper fraction, and another onefrom the bottom of the vial after the vesicles were left to settlefor 30 minutes. Photon correlation spectroscopy showed thatsize distributions of both samples have a peak at 150 nm, thedifference being that the bottom fraction contains a greater pro-portion of larger vesicles. As verified by optical microscopy,GUVs containing entrapped sucrose were mostly unilamellarand spherical, with diameters up to 100µm.
GUVs labeled with a fluorescent marker were prepared ina similar manner. First, NBD-labeled lipid was dissolved inchloroform/methanol (2:1, v/v) to a concentration of 1 mg/mL.Then, the solution of the NBD-labeled lipid in the chloroform/methanolmixture was added to a solution of lipid in the chloroform/methanolmixture in order to obtain either 1 or 2 wt% NBD-labeled lipidsolution. The rest of the procedure for GUV preparation wasthe same as for the unmarked lipids.
2.3. Oleic acid suspensions
A suspension of large unilamellar vesicles (LUVs) fromoleic acid/oleate was prepared using extrusion [24]. Oleic acidwas dispersed in 0.2 M glucose solution with 5 mM Trizmabuffer (pH 8.8) to a concentration of 50 mM. The suspensionwas stirred overnight with a magnetic stirrer bar before beingdiluted with 0.2 M glucose prepared with 5 mM Trizma buffer(pH 8.8) to the preferred concentration (0.3 mM or 0.8 mM).The rationale behind the choice of the oleic acid concentrationsused is that the lower one is assumed to be below the cvc, andthe higher one above it, as the cvc for oleic acid/oleate in the pH
2
range 8.5–9 is estimated to be around 0.4–0.7 mM [25], eventhough values as low as 0.082 mM [26] or as high as 1.0 mM[27] have been reported. The diluted suspension was subjectedto 11 passes through two 100 nm polycarbonate membranesmounted in an Avestin LiposoFast extruder (Ottawa, Canada).
The osmolality of the suspension was determined by a Knauerautomatic cryoscopic semi-micro osmometer (Berlin, Germany).The osmolality of 0.2 M buffered glucose solution was foundto be 216 mOsm/kg and the osmolality of the suspension of50 mM oleic acid in 0.2 M buffered glucose solution was foundto be 207 mOsm/kg. As the suspension was diluted with bufferedglucose solution before the experiment in a ratio 1:100 (v/v) ormore, the difference between the osmolality of suspension andthe osmolality of the buffered glucose solution was below theexperimental error.
The size of oleic acid/oleate vesicles was determined usingdynamic light scattering on a Malvern Zetasizer 3000 (MalvernInstruments, Malvern, UK). A 50 mM oleic acid/oleate suspen-sion was prepared as described above. In order to achieve suf-ficient optical scattering signal, the suspension was extrudedwithout dilution. A disposable cuvette was filled with approxi-mately 2 ml of this suspension. Photon correlation spectroscopyshowed that the distribution of oleic acid/oleate vesicle sizes(diameters) at pH 8.8 had a single peak at 69.1± 2.5 nm, with apolydispersity index [28] of 0.42± 0.14.
2.4. Suspension of POPC LUVs
POPC LUVs were prepared using the freeze-thaw extrusionmethod. A round-bottomed flask was filled with 120.8µL of10 mg/mL POPC dissolved in a chloroform/methanol (2:1, v/v)mixture, to which 200µL of chloroform was added. By turn-ing the flask, chloroform evaporated and a lipid film was evenlydistributed on the wall of the flask. Residual organic solventwas removed by drying at a reduced pressure (60 mmHg, wa-ter aspirator) for 2 h. The lipid film was then hydrated with2.1 mL of 0.2 M glucose solution and vortexed using 250µmglass beads. After six freeze-thaw cycles, 2 ml of the suspen-sion was passed 11 times through two 100 nm polycarbonatemembranes mounted in an Avestin LiposoFast extruder [24].
2.5. Microscopy and micromanipulation
The influence of aqueous suspensions of oleic acid on POPCGUVs was observed under an inverted optical microscope (Zeiss/OptonIM 35, objective Plan40/0.60 Ph2; Oberkochen, Germany) at0.3 mM or 0.8 mM concentrations of oleic acid/oleate in thesuspension. The micromanipulationchamber used had two com-partments; one was filled with a suspension of POPC GUVsbuffered to pH 8.8, the other (volume≈ 250µL) with an oleicacid/oleate suspension at a given oleic acid/oleate concentra-tion, also buffered to pH 8.8. A spherical POPC GUV wasselected, fully aspirated into a glass micropipette with a diam-eter exceeding the diameter of the vesicle, and transferredintothe target suspension containing oleic acid, where the contentof the micropipette was released (Fig. 1). After removing themicropipette, the vesicle was monitored and its shape changeswere observed until the vesicle shape did not change any more.
The whole process was recorded with a Sony SSC-M370CEB/W video camera (Sony, Tokyo, Japan) and a Panasonic AG-7350 S-VHS video recorder (Matsushita Electric IndustrialCo.,Osaka, Japan). To allow for access with a micropipette, bothcompartments in a micromanipulation chamber were relativelythick (approximately 3 mm) and open on one side. An un-wanted consequence of this was a constant convection flow inthe chamber, both because of the evaporation and because ofthe heating due to the illumination light.
Fluorescent micrographs were obtained with an inverted op-tical microscope (Nikon Diaphot 200, objective Fluor 60/0.70Ph3DM; Tokyo, Japan) with the epi-fluorescence attachment,micromanipulating equipment and a cooled digital camera (Hama-matsu ORCA-ER; C4742-95-12ERG; Hamamatsu, Japan), con-nected to a PC running Hamamatsu Wasabi software. The soft-ware also controlled a Uniblitz shutter (Vincent Associates, Rochester,NY, USA) in the light path of the Hg-arc light source. Micro-manipulation chamber and the transfer procedure were identicalin both setups.
Total internal reflection fluorescence microscopy was per-formed on an inverted optical microscope (Nikon Eclipse TE2000-E, objective Plan Apo TIRF 60/1.45 Oil) with an Ar-laser (488nm; Melles Griot, Carlsbad, CA, USA) and a cooled digitalcamera (Nikon DS-2MBWc), connected to a PC running LIMLucia G software (Laboratory Imaging, Prague, Czech Repub-lic).
In the preparation procedure used, POPC vesicles in theglucose/sucrose solution mixture containing entrapped sucrosesolution were transferred into an iso-osmolar glucose solutioncontaining oleic acids. As the refractive index of a 0.2 M glu-cose solution (n = 1.3316, 26◦C) differs from the refractiveindex of a 0.2 M sucrose solution (n = 1.3355, 26◦C), the vesi-cle interior appears darker under a phase contrast microscope,and also exhibits a characteristic white halo around the vesicle.Refractive indexes of glucose and sucrose solutions were mea-sured using an Abbe refractometer (Xintian WY1A, Guiyang,China).
2.6. Titration of a sodium oleate solution
A 20 mL sample of 10 mM oleic acid suspension in waterwas prepared and an equivalent amount of 1 M sodium hydrox-ide was added. 15 mL of this solution was transferred into athermostated measuring cell. The oleate solution was titratedat 25◦C with 0.1 M HCl in a nitrogen atmosphere under con-tinuous stirring. The pH reached a constant value within tenminutes after the addition of each portion of the titrant. ThepH was measured with an Iskra MA 5740 pH meter (Ljubljana,Slovenia).
2.7. Fluorescence spectrometry
Pyrene fluorescence emission spectra were recorded on aPerkin-Elmer LS-50 luminescence spectrometer (Norwalk, CT,USA) in a 10 mm quartz cuvette. The samples in concentra-tion range from 0.1 to 1.5 mM of oleic acid were buffered topH 8.7. Using excitation at 330 nm, the emission spectra ofpyrene were recorded in the range from 350 to 550 nm. From
3
e
f
dc
b
a
. . .
.....
. ..
.
..
.
.
..
.
.
. . .
...
...
. ..
.
..
.
.
..
.
(A) (B)
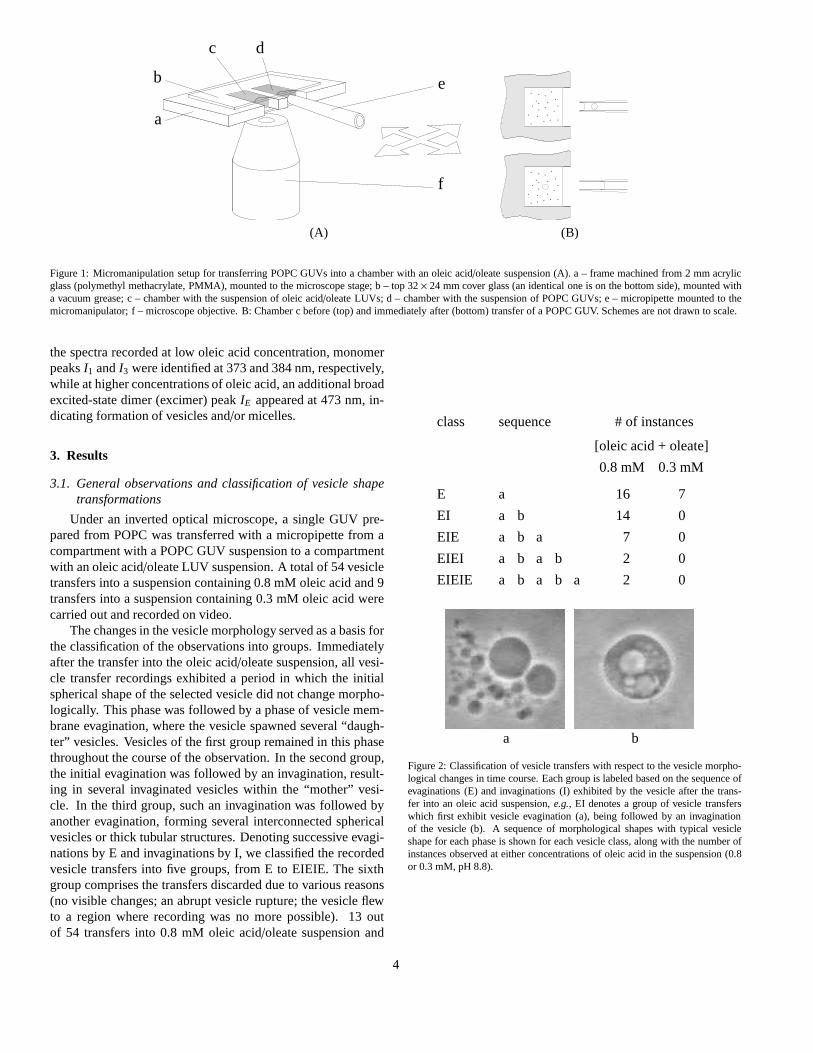
Figure 1: Micromanipulation setup for transferring POPC GUVs into a chamber with an oleic acid/oleate suspension (A). a – frame machined from 2 mm acrylicglass (polymethyl methacrylate, PMMA), mounted to the microscope stage; b – top 32× 24 mm cover glass (an identical one is on the bottom side), mounted witha vacuum grease; c – chamber with the suspension of oleic acid/oleate LUVs; d – chamber with the suspension of POPC GUVs; e – micropipette mounted to themicromanipulator; f – microscope objective. B: Chamber c before (top) and immediately after (bottom) transfer of a POPCGUV. Schemes are not drawn to scale.
the spectra recorded at low oleic acid concentration, monomerpeaksI1 andI3 were identified at 373 and 384 nm, respectively,while at higher concentrations of oleic acid, an additionalbroadexcited-state dimer (excimer) peakIE appeared at 473 nm, in-dicating formation of vesicles and/or micelles.
3. Results
3.1. General observations and classification of vesicle shapetransformations
Under an inverted optical microscope, a single GUV pre-pared from POPC was transferred with a micropipette from acompartment with a POPC GUV suspension to a compartmentwith an oleic acid/oleate LUV suspension. A total of 54 vesicletransfers into a suspension containing 0.8 mM oleic acid and9transfers into a suspension containing 0.3 mM oleic acid werecarried out and recorded on video.
The changes in the vesicle morphology served as a basis forthe classification of the observations into groups. Immediatelyafter the transfer into the oleic acid/oleate suspension, all vesi-cle transfer recordings exhibited a period in which the initialspherical shape of the selected vesicle did not change morpho-logically. This phase was followed by a phase of vesicle mem-brane evagination, where the vesicle spawned several “daugh-ter” vesicles. Vesicles of the first group remained in this phasethroughout the course of the observation. In the second group,the initial evagination was followed by an invagination, result-ing in several invaginated vesicles within the “mother” vesi-cle. In the third group, such an invagination was followed byanother evagination, forming several interconnected sphericalvesicles or thick tubular structures. Denoting successiveevagi-nations by E and invaginations by I, we classified the recordedvesicle transfers into five groups, from E to EIEIE. The sixthgroup comprises the transfers discarded due to various reasons(no visible changes; an abrupt vesicle rupture; the vesicleflewto a region where recording was no more possible). 13 outof 54 transfers into 0.8 mM oleic acid/oleate suspension and
sequenceclass # of instances
E
EI
EIE
EIEI
EIEIE
a
a
a
a
a
b
b
a
a a
0.3 mM
b
b
b
b
a
16
14
7
2
2
7
0
0
0
0
[oleic acid + oleate]
0.8 mM
a b
Figure 2: Classification of vesicle transfers with respect to the vesicle morpho-logical changes in time course. Each group is labeled based on the sequence ofevaginations (E) and invaginations (I) exhibited by the vesicle after the trans-fer into an oleic acid suspension,e.g., EI denotes a group of vesicle transferswhich first exhibit vesicle evagination (a), being followedby an invaginationof the vesicle (b). A sequence of morphological shapes with typical vesicleshape for each phase is shown for each vesicle class, along with the number ofinstances observed at either concentrations of oleic acid in the suspension (0.8or 0.3 mM, pH 8.8).
4
2 out of 9 transfers into 0.3 mM oleic acid/oleate suspensionwere discarded due to the problems described. Fig. 2 showsthe classification of the vesicle recordings into groups andin-dicates the frequency of observations, together with examplesof evaginated and invaginated shapes. No statistically convinc-ing relationship has been found between the class of the vesicletransfer and any measurable parameter. Possible influencesin-clude the volume and the area-to-volume ratio of the GUV, lo-cal variations in the temperature, pH, and the convective flow inthe chamber, as well as the effects of micropipette manipulationduring the transfer. The recording was terminated when eitherthe morphological changes apparently stopped, or the changeswere too slow to justify continuing recording.
During the course of the experiment, no significant changein the contrast between the GUV interior and exterior was ob-served,i.e., throughout the experiment, the vesicle interior ap-peared equally darker than the surrounding medium. This indi-cates that the amount of sucrose inside the vesicle which ex-changed with the glucose in the environment was below thedetection level of our setup. Since the osmotic conditions re-mained unchanged, we can assume that the volume of the GUVremained constant as well.
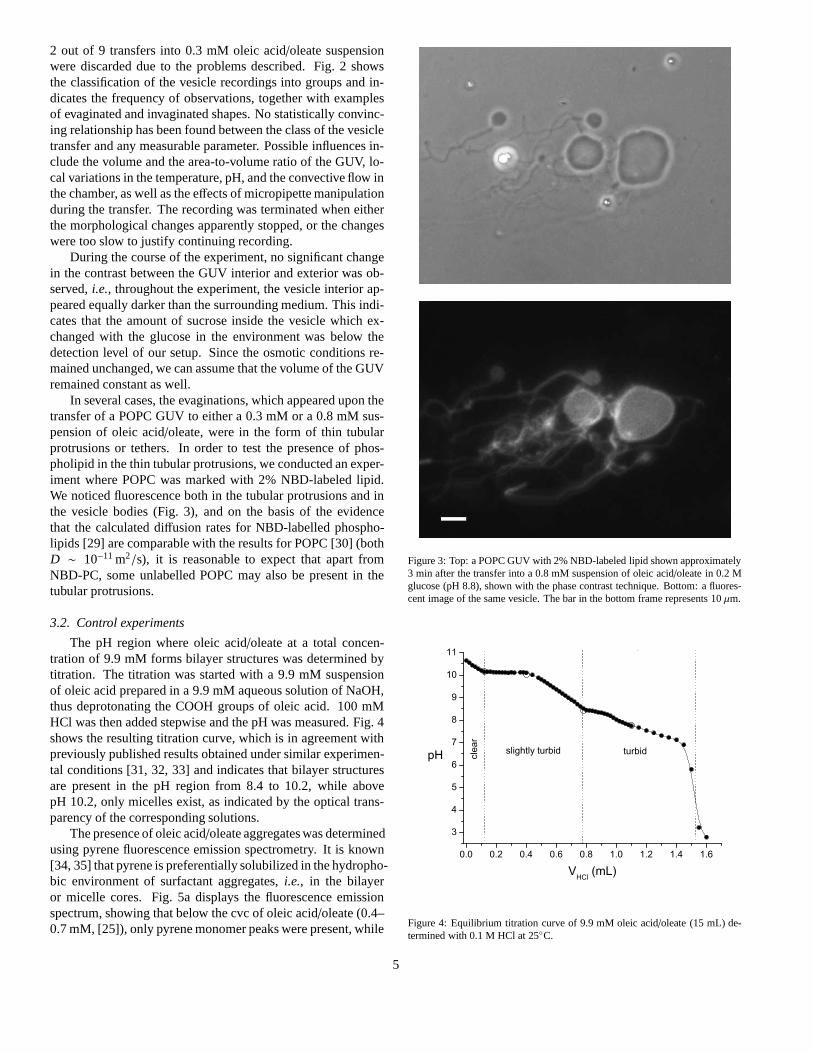
In several cases, the evaginations, which appeared upon thetransfer of a POPC GUV to either a 0.3 mM or a 0.8 mM sus-pension of oleic acid/oleate, were in the form of thin tubularprotrusions or tethers. In order to test the presence of phos-pholipid in the thin tubular protrusions, we conducted an exper-iment where POPC was marked with 2% NBD-labeled lipid.We noticed fluorescence both in the tubular protrusions and inthe vesicle bodies (Fig. 3), and on the basis of the evidencethat the calculated diffusion rates for NBD-labelled phospho-lipids [29] are comparable with the results for POPC [30] (bothD ∼ 10−11 m2/s), it is reasonable to expect that apart fromNBD-PC, some unlabelled POPC may also be present in thetubular protrusions.
3.2. Control experiments
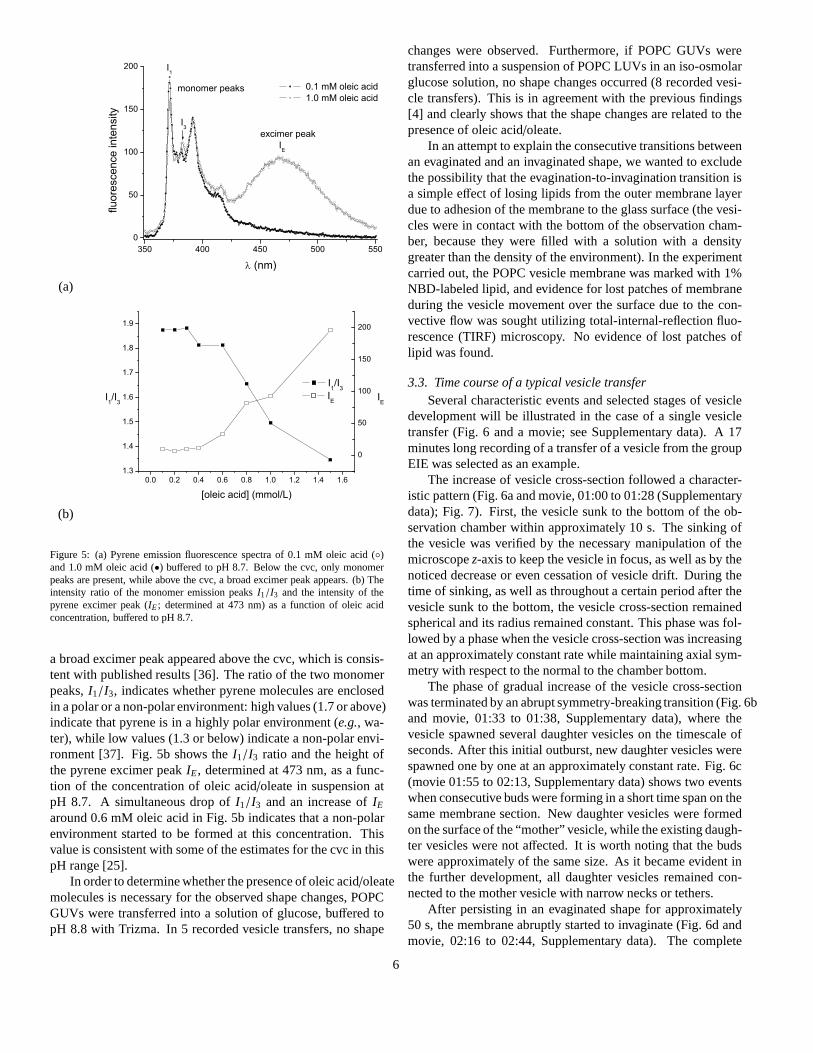
The pH region where oleic acid/oleate at a total concen-tration of 9.9 mM forms bilayer structures was determined bytitration. The titration was started with a 9.9 mM suspensionof oleic acid prepared in a 9.9 mM aqueous solution of NaOH,thus deprotonating the COOH groups of oleic acid. 100 mMHCl was then added stepwise and the pH was measured. Fig. 4shows the resulting titration curve, which is in agreement withpreviously published results obtained under similar experimen-tal conditions [31, 32, 33] and indicates that bilayer structuresare present in the pH region from 8.4 to 10.2, while abovepH 10.2, only micelles exist, as indicated by the optical trans-parency of the corresponding solutions.
The presence of oleic acid/oleate aggregates was determinedusing pyrene fluorescence emission spectrometry. It is known[34, 35] that pyrene is preferentially solubilized in the hydropho-bic environment of surfactant aggregates,i.e., in the bilayeror micelle cores. Fig. 5a displays the fluorescence emissionspectrum, showing that below the cvc of oleic acid/oleate (0.4–0.7 mM, [25]), only pyrene monomer peaks were present, while
Figure 3: Top: a POPC GUV with 2% NBD-labeled lipid shown approximately3 min after the transfer into a 0.8 mM suspension of oleic acid/oleate in 0.2 Mglucose (pH 8.8), shown with the phase contrast technique. Bottom: a fluores-cent image of the same vesicle. The bar in the bottom frame represents 10µm.
0.0 0.2 0.4 0.6 0.8 1.0 1.2 1.4 1.6
3
4
5
6
7
8
9
10
11
turbidslightly turbidclea
r
pH
VHCl (mL)
Figure 4: Equilibrium titration curve of 9.9 mM oleic acid/oleate (15 mL) de-termined with 0.1 M HCl at 25◦C.
5
(a)
350 400 450 500 5500
50
100
150
200
IE
I3
I1
monomer peaks
excimer peak
fluor
esce
nce
inte
nsity
(nm)
0.1 mM oleic acid 1.0 mM oleic acid
(b)
0.0 0.2 0.4 0.6 0.8 1.0 1.2 1.4 1.61.3
1.4
1.5
1.6
1.7
1.8
1.9
0
50
100
150
200
I1/I3
I1/I3
[oleic acid] (mmol/L)
IE IE
Figure 5: (a) Pyrene emission fluorescence spectra of 0.1 mM oleic acid (◦)and 1.0 mM oleic acid (•) buffered to pH 8.7. Below the cvc, only monomerpeaks are present, while above the cvc, a broad excimer peak appears. (b) Theintensity ratio of the monomer emission peaksI1/I3 and the intensity of thepyrene excimer peak (IE; determined at 473 nm) as a function of oleic acidconcentration, buffered to pH 8.7.
a broad excimer peak appeared above the cvc, which is consis-tent with published results [36]. The ratio of the two monomerpeaks,I1/I3, indicates whether pyrene molecules are enclosedin a polar or a non-polar environment: high values (1.7 or above)indicate that pyrene is in a highly polar environment (e.g., wa-ter), while low values (1.3 or below) indicate a non-polar envi-ronment [37]. Fig. 5b shows theI1/I3 ratio and the height ofthe pyrene excimer peakIE, determined at 473 nm, as a func-tion of the concentration of oleic acid/oleate in suspension atpH 8.7. A simultaneous drop ofI1/I3 and an increase ofIE
around 0.6 mM oleic acid in Fig. 5b indicates that a non-polarenvironment started to be formed at this concentration. Thisvalue is consistent with some of the estimates for the cvc in thispH range [25].
In order to determine whether the presence of oleic acid/oleatemolecules is necessary for the observed shape changes, POPCGUVs were transferred into a solution of glucose, buffered topH 8.8 with Trizma. In 5 recorded vesicle transfers, no shape
changes were observed. Furthermore, if POPC GUVs weretransferred into a suspension of POPC LUVs in an iso-osmolarglucose solution, no shape changes occurred (8 recorded vesi-cle transfers). This is in agreement with the previous findings[4] and clearly shows that the shape changes are related to thepresence of oleic acid/oleate.
In an attempt to explain the consecutive transitions betweenan evaginated and an invaginated shape, we wanted to excludethe possibility that the evagination-to-invagination transition isa simple effect of losing lipids from the outer membrane layerdue to adhesion of the membrane to the glass surface (the vesi-cles were in contact with the bottom of the observation cham-ber, because they were filled with a solution with a densitygreater than the density of the environment). In the experimentcarried out, the POPC vesicle membrane was marked with 1%NBD-labeled lipid, and evidence for lost patches of membraneduring the vesicle movement over the surface due to the con-vective flow was sought utilizing total-internal-reflection fluo-rescence (TIRF) microscopy. No evidence of lost patches oflipid was found.
3.3. Time course of a typical vesicle transferSeveral characteristic events and selected stages of vesicle
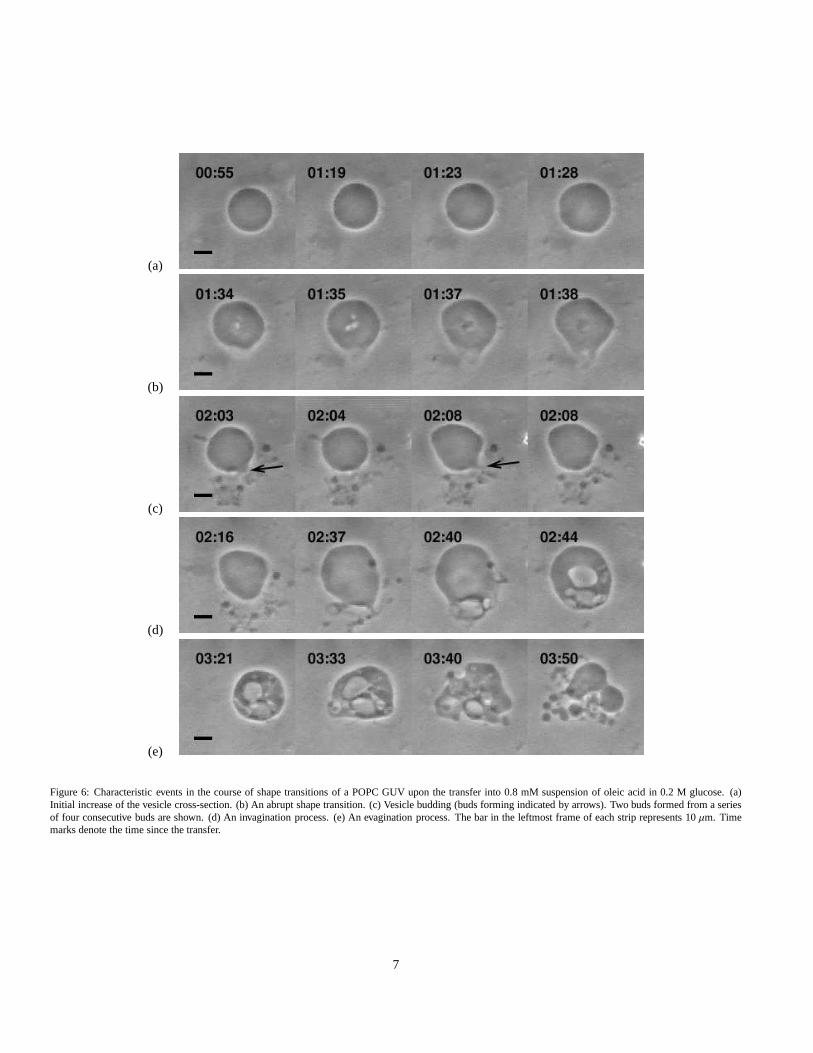
development will be illustrated in the case of a single vesicletransfer (Fig. 6 and a movie; see Supplementary data). A 17minutes long recording of a transfer of a vesicle from the groupEIE was selected as an example.
The increase of vesicle cross-section followed a character-istic pattern (Fig. 6a and movie, 01:00 to 01:28 (Supplementarydata); Fig. 7). First, the vesicle sunk to the bottom of the ob-servation chamber within approximately 10 s. The sinking ofthe vesicle was verified by the necessary manipulation of themicroscopez-axis to keep the vesicle in focus, as well as by thenoticed decrease or even cessation of vesicle drift. Duringthetime of sinking, as well as throughout a certain period afterthevesicle sunk to the bottom, the vesicle cross-section remainedspherical and its radius remained constant. This phase was fol-lowed by a phase when the vesicle cross-section was increasingat an approximately constant rate while maintaining axial sym-metry with respect to the normal to the chamber bottom.
The phase of gradual increase of the vesicle cross-sectionwas terminated by an abrupt symmetry-breaking transition (Fig. 6band movie, 01:33 to 01:38, Supplementary data), where thevesicle spawned several daughter vesicles on the timescaleofseconds. After this initial outburst, new daughter vesicles werespawned one by one at an approximately constant rate. Fig. 6c(movie 01:55 to 02:13, Supplementary data) shows two eventswhen consecutive buds were forming in a short time span on thesame membrane section. New daughter vesicles were formedon the surface of the “mother” vesicle, while the existing daugh-ter vesicles were not affected. It is worth noting that the budswere approximately of the same size. As it became evident inthe further development, all daughter vesicles remained con-nected to the mother vesicle with narrow necks or tethers.
After persisting in an evaginated shape for approximately50 s, the membrane abruptly started to invaginate (Fig. 6d andmovie, 02:16 to 02:44, Supplementary data). The complete
6
(a)
(b)
(c)
(d)
(e)
Figure 6: Characteristic events in the course of shape transitions of a POPC GUV upon the transfer into 0.8 mM suspension of oleic acid in 0.2 M glucose. (a)Initial increase of the vesicle cross-section. (b) An abrupt shape transition. (c) Vesicle budding (buds forming indicated by arrows). Two buds formed from a seriesof four consecutive buds are shown. (d) An invagination process. (e) An evagination process. The bar in the leftmost frame of each strip represents 10µm. Timemarks denote the time since the transfer.
7
104 s78 sµ
10
10.5
11
11.5
12
12.5
13
13.5
14
70 75 80 85 90 95 100 105t [s]
r [
m]
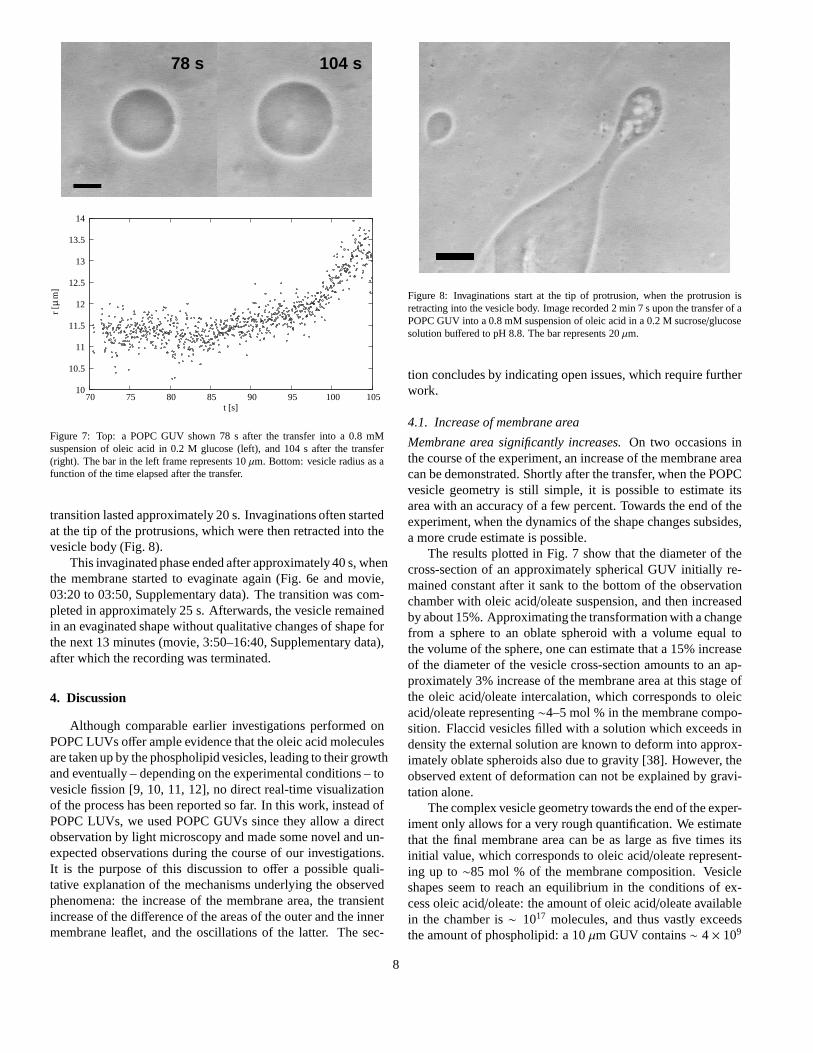
Figure 7: Top: a POPC GUV shown 78 s after the transfer into a 0.8 mMsuspension of oleic acid in 0.2 M glucose (left), and 104 s after the transfer(right). The bar in the left frame represents 10µm. Bottom: vesicle radius as afunction of the time elapsed after the transfer.
transition lasted approximately 20 s. Invaginations oftenstartedat the tip of the protrusions, which were then retracted intothevesicle body (Fig. 8).
This invaginated phase ended after approximately 40 s, whenthe membrane started to evaginate again (Fig. 6e and movie,03:20 to 03:50, Supplementary data). The transition was com-pleted in approximately 25 s. Afterwards, the vesicle remainedin an evaginated shape without qualitative changes of shapeforthe next 13 minutes (movie, 3:50–16:40, Supplementary data),after which the recording was terminated.
4. Discussion
Although comparable earlier investigations performed onPOPC LUVs offer ample evidence that the oleic acid moleculesare taken up by the phospholipid vesicles, leading to their growthand eventually – depending on the experimental conditions –tovesicle fission [9, 10, 11, 12], no direct real-time visualizationof the process has been reported so far. In this work, insteadofPOPC LUVs, we used POPC GUVs since they allow a directobservation by light microscopy and made some novel and un-expected observations during the course of our investigations.It is the purpose of this discussion to offer a possible quali-tative explanation of the mechanisms underlying the observedphenomena: the increase of the membrane area, the transientincrease of the difference of the areas of the outer and the innermembrane leaflet, and the oscillations of the latter. The sec-
Figure 8: Invaginations start at the tip of protrusion, whenthe protrusion isretracting into the vesicle body. Image recorded 2 min 7 s upon the transfer of aPOPC GUV into a 0.8 mM suspension of oleic acid in a 0.2 M sucrose/glucosesolution buffered to pH 8.8. The bar represents 20µm.
tion concludes by indicating open issues, which require furtherwork.
4.1. Increase of membrane area
Membrane area significantly increases.On two occasions inthe course of the experiment, an increase of the membrane areacan be demonstrated. Shortly after the transfer, when the POPCvesicle geometry is still simple, it is possible to estimateitsarea with an accuracy of a few percent. Towards the end of theexperiment, when the dynamics of the shape changes subsides,a more crude estimate is possible.
The results plotted in Fig. 7 show that the diameter of thecross-section of an approximately spherical GUV initiallyre-mained constant after it sank to the bottom of the observationchamber with oleic acid/oleate suspension, and then increasedby about 15%. Approximating the transformation with a changefrom a sphere to an oblate spheroid with a volume equal tothe volume of the sphere, one can estimate that a 15% increaseof the diameter of the vesicle cross-section amounts to an ap-proximately 3% increase of the membrane area at this stage ofthe oleic acid/oleate intercalation, which corresponds to oleicacid/oleate representing∼4–5 mol % in the membrane compo-sition. Flaccid vesicles filled with a solution which exceeds indensity the external solution are known to deform into approx-imately oblate spheroids also due to gravity [38]. However,theobserved extent of deformation can not be explained by gravi-tation alone.
The complex vesicle geometry towards the end of the exper-iment only allows for a very rough quantification. We estimatethat the final membrane area can be as large as five times itsinitial value, which corresponds to oleic acid/oleate represent-ing up to∼85 mol % of the membrane composition. Vesicleshapes seem to reach an equilibrium in the conditions of ex-cess oleic acid/oleate: the amount of oleic acid/oleate availablein the chamber is∼ 1017 molecules, and thus vastly exceedsthe amount of phospholipid: a 10µm GUV contains∼ 4× 10⁹
8
molecules, and even if 10- or 100-times as much lipid is un-intentionally introduced into the chamber with a micropipettetransfer, the ratio is still in the order of∼ 1 : 106.1 A signifi-cant increase of membrane area is in agreement with previousexperiments on POPC LUVs [9, 10, 11].
Membrane area growth can be related to system kinetics.In asimple kinetic scheme describing the kinetics of the interactionof fatty acids with phospholipid membranes [40], the systemisrepresented by the populations of oleic acid/oleate moleculesin the following four compartments: the vesicle exterior, theouter membrane leaflet, the inner membrane leaflet, and thevesicle interior. Two of these, the populations of oleic acid inboth membrane leaflets are directly related to the equilibriumareas of the outer (A20) and the inner (A10) membrane leaflet.2
Both A20 and A10 vary with time due to three processes: (i)association of fatty acid molecules with the phospholipid mem-brane, where the rate of the membrane area increase is propor-tional to the concentration of oleic acid/oleate in the membranevicinity and the area available for intercalation; (ii) dissociationof fatty acid molecules from the phospholipid membrane, itsrate being proportional to the oleic acid population in the mem-brane leaflet, and (iii) fatty acid translocation (flip-flop)in themembrane, its net flow being proportional to the difference ofoleic acid populations in the two leaflets. Fatty acid associa-tion and dissociation occur both on the external and the inter-nal membrane-water boundary. The association of oleic acidmonomers to a phosphatidylcholine membrane is considered tobe a very fast process [41, 42], while the question whether theoleic acid translocation is faster [43, 44] or slower [41, 45] thanthe dissociation appears to be an unresolved question.
The demonstrated increase of the membrane area requiresthat the areas of both membrane leaflets must increase, im-plying that by some means, translocation of oleic acid musthave occurred. Furthermore, the transitions cease once theoleicacid/oleate in the suspension is in equilibrium with the oleicacid/oleate in the membrane on both the internal and the exter-nal side of the membrane. This implies that the concentrationof oleic acid/oleate in the vesicle lumen is equal to the externalconcentration, and that both the translocation and dissociationmust have occurred within the observed timescale.
4.2. Transient increase of the difference between the areas ofthe outer and the inner membrane leaflet
Shape changes commence with an evagination.In all 48 ob-served cases of POPC GUV transfer into a suspension of oleicacid/oleate, its concentration being either above or below the
1It is assumed in the estimate that the average headgroup areaof a phospho-lipid molecule isa0 ≈ 60 Å2 [39, Ch. 3] and that the vesicles are unilamellar;therefore a GUV with a radiusr containsNPC ≈ 2× 4πr2/a0 molecules.
2We have used the index “0” to denote the equilibrium values ofthe area ofa membrane leaflet, as opposed to their instantaneous valuesA2 andA1. Thelatter may differ from their equilibrium values:e.g.,intercalation of moleculesinto the outer membrane leaflet, as in the experiment described, induces lateraltension in both membrane layers, the outer one being compressed and the innerone stretched.
cvc, shape transformations always commenced with a transi-tion into an evaginated shape. In 16 out of 41 cases where theconcentration of oleic acid/oleate in the suspension was abovecvc and in all 7 observed cases where the concentration of oleicacid/oleate in the suspension was below the cvc, vesicle per-sisted in this shape until the end of the experiment.
The relation with the bilayer couple model.Vesicle shape canbe related to the difference between the areas of the outer andthe inner membrane leaflet∆A0 = A20 − A10 [46]. Given thevalues ofA0 = 2A10A20/(A10 + A20) and∆A0, a vesicle adaptsits shape (along withA and∆A, which correspond to a givenshape) in order to minimize its total energy, comprising of mem-brane stretching and membrane bending energy [47], as well asthe entropic free energy contribution due to thermal fluctuations[48]. Shapes with∆A0 larger than the value of∆A0 for a sphereare evaginated, and those smaller are invaginated. At values of∆A0 which significantly exceed the value of∆A0 for a sphere,it is expected that vesicle shapes look like the so-called limit-ing shapes,i.e., shapes with a maximal volume at givenA and∆A, which were shown to consist of connected spheres of twoallowed sizes [13, 49, 50]. The observed (quasi-)equilibriumshapes were one or a few bigger spheres connected to numer-ous smaller spheres, which approximately agrees with the bi-layer couple model. This state may superficially resemble vesi-cle growth and fission observed in the experiments with LUVs(e.g., [6, 9, 11, 12]), however, we need to emphasize that inour case the newly formed daughter vesicles remained tetheredto the mother vesicle,i.e., no real separation of membrane intotwo entities has been observed.
The effect of oleic acid intercalation on spontaneous curvature.Apart from affectingA0 and∆A0, the intercalation of oleic acidmolecules into POPC membrane changes its composition. Thiscould also affect its spontaneous curvature [47], since the spon-taneous curvature depends on the shapes of the membrane con-stituents. POPC molecules are approximately cylinder-shaped,which makes their intrinsic curvature close to zero, favoringtheir aggregation into flat bilayer structures [51]. Protonatedoleic acid molecules have a slightly negative intrinsic curvature[52], while deprotonated oleic acid molecules,i.e., oleate ions,exert mutual electrostatic repulsion between their headgroups,which favors their aggregation into micelles or other structureswith highly positive curvature. At pH∼ pKa, where approx-imately half of the oleic acid molecules are protonated, it isknown that the aggregates formed by oleic acid/oleate moleculesare bilayers. If one assumes a similar behavior in mixed phos-pholipid/oleic acid/oleate bilayers, the average spontaneous cur-vature of a membrane composed of phospholipid, and equalamounts of oleic acid and oleate is expected to be close to zero.We can therefore conclude that in the conditions the experi-ment was conducted,i.e.,at pH∼ pKa, oleic acid/oleate formsbilayer structures with zero intrinsic curvature, and the effect ofoleic acid intercalation into the membrane onto the spontaneouscurvature is minor in comparision to its effect on∆A0.
Consecutive vesicle budding.On several occasions, usually laterin the course of morphological changes caused by the incorpo-
9
ration of oleic acid into the membrane, we noticed several con-secutive buds being formed on the same membrane section in ashort time span (Fig. 6c; movie 01:55 to 02:13, see Supplemen-tary data). Such a process, which lasted for a certain periodoftime, means that during this period,∆A0 andA0 were increasingin the appropriate ratio. Such processes have not been observedin the experiments with lysolipids [15, 53], because in the lattercase, no significant change ofA0 has been noticed. It is worthnoting that the buds were usually found to be of approximatelythe same size, which is a confirmation that the vesicle shapebelongs to limiting shapes. The budding is also an importantmechanism in the processes of membrane trafficking, e.g., inthe endoplasmatic reticulum and endocytosis. The studies ofbudding in cells indicate that this process can only occur withthe support of a complex protein network [54]. The observedconsecutive formation of buds during a certain period of timedemonstrates that budding can also occur as a simple physicalreaction of membrane to a simultaneous increase in both the to-tal membrane area and the difference in the outer and the innerleaflet area.
4.3. Oscillations of∆ANon-specific convective flow.In 25 out of 41 cases of vesi-cle transfer into a suspension where the concentration of oleicacid/oleate is above cvc, the initial membrane evagination hasbeen followed by a membrane evagination. Such shape changescorrespond to a decrease of∆A from a value larger to a valuesmaller than the value of∆A for a sphere. This phenomenoncan not be explained with a simple kinetic model mentionedabove. In addition to oleic acid association, dissociationanddiffusive translocation, we propose another non-specific mech-anism for translocation, which employs membrane defects orpores that occur stochastically [55, 56]. In the initial stageshortly after the transfer of GUV, oleic acid intercalationintothe outer membrane leaflet leads to the overpopulation of theouter membrane leaflet with respect to the inner one, and con-sequently to an imbalance in lateral tensions of the two mem-brane leaflets. The two membrane leaflets tend to relax, andwhen a membrane defect occurs, the difference in lateral ten-sions causes a convective flow of membrane components fromthe outer to the inner leaflet. It is to be noted that all speciesof molecules – phospholipid, oleic acid and oleate ions – cantraverse the membrane via the convective flow, their ratios inthe flow being proportional to their ratios in the outer mem-brane leaflet. Via this mechanism, the population of phospho-lipid in the inner membrane leaflet exceeds its population inthe outer membrane leaflet. At this point, phospholipids alonewould favour invaginated shape; however, due to the influx ofoleic acid/oleate into the outer membrane leaflet, the overallshape is still evaginated. As the diffusive flip-flop rate for oleicacid is much higher than the corresponding flip-flop rate forphospholipids [57, 58], at some point both the concentrationof oleic acid/oleate in the vesicle lumen equilibrates with theexternal concentration, and the population of oleic acid/oleatein the inner membrane leaflet equilibrates with the one in theouter membrane leaflet. A low flip-flop rate for phospholipidstogether with virtually no net convective flow, since there is no
imbalance in lateral tensions of the two membrane layers ei-ther, means that this quasi-equilibrium state is a kinetic trap forthe phospholipid. With oleic acid in balance, the vesicle shapeis determined by the populations of phospholipid in the twomembrane leaflets, which favour an invaginated shape. Notethat the vesicle interior is osmotically balanced with the exteriorthroughout the experiment, so no net flux of water is expectedto occur through these pores. We can thus conclude that the ob-served shape transition from evaginated to invaginated shapescan be explained, if one allows for a non-specific convectiveflow through stochastically occurring membrane defects [56].
4.4. Open issues
A burst of satellite vesicles vs. a gradual increase in theirnum-ber. In the experiments carried out, we observed an abrupt tran-sition, where GUV persisted in an approximately oblate shapefor a certain period of time, this being followed by sproutinga number of satellite vesicles in a short period of time. Thisis seemingly in contradiction with the bilayer-couple theory,which predicts a gradual one-by-one increase as the∆A0 in-creases. The explanation for this absence of intermediate stepspossibly involves the entropic contribution due to thermalfluc-tuations [48], which lowers the free energy of a fluctuatingoblate spheroid below the free energy of a spherical vesiclewithspherical satellites.
The satellite spheres were not all exactly the same size.Theobserved state with a few larger vesicles and several smallersatellite vesicles of approximately the same size is consistentwith the notion of the bilayer-couple model. However, the satel-lite vesicles observed in the experiment were not exactly ofthe same size, and there are several possible reasons for that:(a) the model is valid for an equilibrium system, while the ob-served system might not have reached the equilibrium yet, (b)the model is valid for a homogenous membrane, while the mixedphospholipid/oleic acid membrane is not necessarily laterallyhomogeneous, and (c) satellite vesicles formed at different timesare also formed at slightly different conditions (e.g.,the com-position of membrane changes); however, once formed, theyare found in a kinetic trap, as the energy needed to reopen andclose the neck connecting two spheres far exceeds the energydifference between different configurations.
Higher oscillations. We observed a comparably frequent (11out of 41 cases) shape transitions from invaginated shape backinto evaginated shape, and in a few cases even higher oscil-lations (Fig. 2). Although it remains to be seen whether theconvective-flow mechanism described above can reproduce suchbehaviour with realistic values of parameters, we would notwant to exclude the possibility that another mechanism is inef-fect, possibly connected to spatial inhomogeneity of oleicacid/oleateconcentration.
Direct interaction with oleic acid/oleate aggregates.A qualita-tive difference between the GUV behaviour in the cases wherethe concentration of oleic acid/oleate in the suspension was be-low cvc, and the cases where its concentration was above cvc,
10
i.e., where oleic acid aggregates were present, opens a possi-bility that another interaction pathway was present in the lattercase. While the prevalent opinion seems to be that the oleicacid/oleate monomers dissociate from the donor system beforebeing incorporated in the phospholipid membrane (e.g.,[40]),some authors allow for a possibility that oleic acid/oleate aggre-gated intermediates directly interact with a phospholipidmem-brane [36]. The two proposed pathways differ in their effect onthe vesicle shape. While the interaction with monomers directlyincreases the area of the outer membrane leaflet and only indi-rectly, through translocation, the area of the inner membraneleaflet, a possible interaction with an aggregated intermediatewould contribute to both membrane leaflets at the same time.However, since LUVs have a large intrinsic∆A0, both mecha-nisms are expected to result in a shape evagination, and the ex-periment we conducted can not be used to distinguish betweenthe two.
Oleic acid flip-flop: fast or slow?.There is an ongoing debatewhether the oleic acid translocation is fast or slow. The resultsobtained with free fatty acids [43, 44] yield much higher ratesthan those obtained with BSA-complexed fatty acids [41, 45].It has been suggested [42] that exposure to fatty acid concen-trations higher than 5µM somehow perturbs the bilayer struc-ture, which may result in a higher apparent translocation rate.We would like to emphasize that the two mechanisms for oleicacid/phospholipid translocation proposed in this paper – diffu-sive flip-flop and non-specific convective flow – work in a sim-ilar way. At very low concentration of oleic acid/oleate in thesuspension, there is virtually no imbalance in lateral tensions ofthe two membrane layers, and the outward and the inward con-vective flows are balanced, thus the only mechanism for oleicacid translocation is diffusive flip-flop, driven by the imbalancein oleic acid concentration. At higher concentrations, however,convective flow, driven by the imbalance in lateral tensions,opens another, possibly faster, pathway. Although this com-plex issue is probably far from being resolved, we hope this no-tion may help by providing another viewpoint to this seeminglyconflicting issue.
5. Conclusions
By working with GUVs in the optical microscopy regime,this study offers a new insight into the budding process by whichnew daughter vesicles can be formed from phospholipid vesi-cles by virtue of the incorporation of fatty acids into the phos-pholipid membrane. These observations complement previousfindings obtained by other methods, which showed an increaseof the number of LUVs upon the transfer into an oleic acid/oleatesuspension [12]. We offer a qualitative explanation of the ob-served phenomena, however, further work in the direction ofthedetermination of kinetic and mechanical properties of thissys-tem and building the corresponding theoretical model will beneeded for its confirmation. The observed budding and forma-tion of satellite vesicles induced solely by a membrane growthwithout the intervention of proteins may have an implication for
the understanding of the basic principles governing membranetrafficking.
Acknowledgments
The authors would like to thank Dr. Bojan Bozic, Dr. Mar-tin Hanczyc, Dr. Janja Majhenc, and Dr. Andrea Parmeggianifor their valuable discussions and suggestions. Dr. Pegi AhlinGrabnar performed the photon correlation spectroscopy of oleicacid/oleate vesicles, and MihaSustersic helped with the vesicleclassification. This work has been supported by the SlovenianResearch Agency research grant P1-0055 and the COST ActionD27.
Supplementary data
An annotated video recording from which the strips in Fig. 6were selected is available as an online supplement. This infor-mation is available via the Internet at http://biofiz.mf.uni-lj.si/∼peterlin/supplement1.a
References
[1] J. M. Gebicki, M. Hicks, Preparation and properties of vesicles enclosedby fatty-acid membranes, Chem. Phys. Lipids 16 (2) (1976) 142–150.
[2] W. R. Hargreaves, D. W. Deamer, Liposomes from ionic, single-chainamphiphiles, Biochemistry 17 (18) (1978) 3759–3768.
[3] R. Smith, C. Tanford, Critical micelle concentration ofL-α-dipalmitoylphosphatidylcholine in water and water/methanol solutions, J.Mol. Biol. 67 (1972) 75–83.
[4] Z. Cheng, P. L. Luisi, Coexistence and mutual competition of vesicleswith different size distributions, J. Phys. Chem. B 107 (2003) 10940–10945.
[5] S. M. Fujikawa, I. A. Chen, J. W. Szostak, Shrink-wrap vesicles, Lang-muir 21 (2005) 12124–12129.
[6] E. Blochliger, M. Blocher, P. Walde, P. L. Luisi, Matrixeffect in the sizedistribution of fatty acid vesicles, J. Phys. Chem. B 102 (1998) 10383–10390.
[7] M. Hanczyc, J. W. Szostak, Replicating vesicles as models of primitivecell growth and division, Curr. Opin. Chem. Biol. 8 (2004) 660–664.
[8] S. Chungcharoenwattana, H. Kashiwagi, M. Ueno, Effect of preformedegg phosphatidylcholine vesicles on spontaneous vesiculation of oleatemicelles, Colloid Polym. Sci. 283 (2005) 1180–1189.
[9] S. Lonchin, P. L. Luisi, P. Walde, B. H. Robinson, A matrixeffect inmixed phospholipid/fatty acid vesicle formation, J. Phys. Chem. B 103(1999) 10910–10916.
[10] N. Berclaz, M. Muller, P. Walde, P. L. Luisi, Growth andtransformationof vesicles studied by ferritin labelling and cryotransmission electron mi-croscopy, J. Phys. Chem. B 105 (2001) 1056–1064.
[11] N. Berclaz, E. Blochliger, M. Muller, P. L. Luisi, Matrix effect of vesi-cle formation as investigated by cryotransmission electron microscopy, J.Phys. Chem. B 105 (2001) 1065–1071.
[12] P. Stano, E. Wehrli, P. L. Luisi, Insights into the self-reproduction ofoleate vesicles, J. Phys.: Condens. Matter 18 (33) (2006) S2231–S2238.
[13] S. Svetina, B.Zeks, Membrane bending energy and shape determinitionof phospholipid vesicles and red blood cells, Eur. Biophys.J. 17 (1989)101–111.
[14] F. M. Menger, N. Balachander, Chemically-induced aggregation, buddingand fission in giant vesicles: direct observation by light microscopy, J.Am. Chem. Soc. 114 (1992) 5862–5863.
[15] D. Needham, D. V. Zhelev, Lysolipid exchange with lipidvesicle mem-branes, Ann. Biomed. Eng. 23 (1995) 287–298.
[16] T. Tanaka, R. Sano, Y. Yamashita, M. Yamazaki, Shape changes and vesi-cle fission of giant unilamellar vesicles of liquid-orderedphase membraneinduced by lysophosphatidylcholine, Langmuir 20 (2004) 9526–9534.
11
[17] Y. Inaoka, M. Yamazaki, Vesicle fission of giant unilamellar vesicles ofliquid-ordered-phase membranes induced by amphiphiles with a singlelong hydrocarbon chain, Langmuir 23 (2007) 720–728.
[18] A. Papadopulos, S. Vehring, I. Lopez-Montero, L. Kutschenko,M. Stockl, P. F. Devaux, M. Kozlov, T. Pomorski, A. Herrmann, Flip-pase activity detected with unlabeled lipids by shape changes of giantunilamellar vesicles, J. Biol. Chem. 282 (21) (2007) 15559–15568.
[19] R. Wick, M. I. Angelova, P. Walde, P. L. Luisi, Microinjection into giantvesicles and light microscopy investigation of enzyme-mediated vesicletransformations, Chem. Biol. 3 (1996) 105–111.
[20] Y. Tamba, M. Yamazaki, Single giant unilamellar vesicle method revealseffect of antimicrobial peptide magainin 2 on membrane permeability,Biochemistry 44 (2005) 15823–15833.
[21] M. Mally, J. Majhenc, S. Svetina, B.Zeks, The response of giant phospho-lipid vesicles to pore-forming peptide melittin, Biochim.Biophys. Acta1768 (2007) 1179–1189.
[22] M. I. Angelova, D. S. Dimitrov, Liposome electroformation, Faraday Dis-cuss. Chem. Soc. 81 (1986) 303–311.
[23] M. I. Angelova, D. S. Dimitrov, A mechanism of liposome electroforma-tion, Prog. Colloid Polym. Sci. 76 (1988) 59–67.
[24] R. C. MacDonald, R. I. MacDonald, B. P. M. Menco, K. Takeshita, N. K.Subbarao, L.-r. Hu, Small-volume extrusion apparatus for preparation oflarge, unilamellar vesicles, Biochim. Biophys. Acta 1061 (1991) 297–303.
[25] P. Walde, R. Wick, M. Fresta, A. Mangone, P. L. Luisi, Autopoietic self-reproduction of fatty acid vesicles, J. Am. Chem. Soc. 116 (1994) 11649–11654.
[26] I. A. Chen, J. W. Szostak, Membrane growth can generate atransmem-brane pH gradient in fatty acid vesicles, Proc. Natl. Acad. Sci. 101 (21)(2004) 7965–7970.
[27] A. Hildebrand, P. Garidel, R. Neubert, A. Blume, Thermodynamics ofdemicellization of mixed micelles composed of sodium oleate and bilesalts, Langmuir 20 (2004) 320–328.
[28] B. J. Frisken, Revisiting the method of cumulants for the analysis of dy-namic light-scattering data, Appl. Opt. 40 (24) (2001) 4087–4091.
[29] L. M. S. Loura, F. Fernandes, A. C. Fernandes, J. P. Prates Ramalho,Effects of fluorescent probe NBD-PC on the structure, dynamics andphase transition of DPPC. A molecular dynamics and differential scan-ning calorimetry study, Biochim. Biophys. Acta 1778 (2008)491–501.
[30] H. C. Gaede, K. Gawrisch, Lateral diffusion rates of lipid, water, anda hydrophobic drug in a multilamellar liposome, Biophys. J.85 (2003)1734–1740.
[31] D. P. Cistola, J. A. Hamilton, D. Jackson, D. M. Small, Ionization andphase behavior of fatty acids in water: application of Gibbsphase rule,Biochemistry 27 (1988) 1881–1888.
[32] H. Fukuda, A. Goto, H. Yoshioka, R. Goto, K. Morigaki, P.Walde, Elec-tron spin resonance study of the pH-induced transformationof micellesto vesicles in an aqueous oleic acid/oleate system, Langmuir 17 (2001)4223–4231.
[33] M. L. Rogerson, B. H. Robinson, S. Bucak, P. Walde, Kinetic studiesof the interaction of fatty acids with phosphatidylcholinevesicles (lipo-somes), Colloid. Surf. B 48 (2006) 24–34.
[34] J. M. Vanderkooi, J. B. Callis, Pyrene. a probe of lateral diffusion in thehydrophobic region of membranes, Biochemistry 13 (19) (1974) 4000–4006.
[35] M. Almgren, F. Grieser, K. J. Thomas, Dynamic and staticaspects ofsolubilization of neutral arenes in ionic micellar solutions, J. Am. Chem.Soc. 101 (2) (1979) 279–291.
[36] I. A. Chen, J. W. Szostak, A kinetic study of the growth offatty acidvesicles, Biophys. J. 87 (2004) 988–998.
[37] V. Arrigler, K. Kogej, J. Majhenc, S. Svetina, Interaction of cetylpyri-dinium chloride with giant lipid vesicles, Langmuir 21 (2005) 7653–7661.
[38] H.-G. Dobereiner, E. Evans, M. Kraus, U. Seifert, M. Wortis, Mappingvesicle shapes into the phase diagram: A comparison of experiment andtheory, Phys. Rev. E 55 (4) (1997) 4458–4474.
[39] G. Cevc, D. Marsh, Phospholipid bilayers: Physical principles and mod-els, Vol. 5 of Cell biology, John Wiley and Sons, New York, Chichester,Brisbane, Toronto, Singapore, 1987.
[40] R. M. Thomas, A. Baici, M. Werder, G. Schulthess, H. Hauser, Kinet-ics and mechanism of long-chain fatty acid transport into phosphatidyl-choline vesicles from various donor systems, Biochemistry41 (2002)
1591–1601.[41] A. M. Kleinfeld, P. Chu, C. Romero, Transport of long-chain native fatty
acids across lipid bilayer membranes indicates that transbilayer flip-flopis rate-limiting, Biochemistry 36 (1997) 14146–14158.
[42] D. Cupp, J. P. Kampf, A. M. Kleinfeld, Fatty acid-albumin complexesand the determination of the transport of long chain free fatty acids acrossmembranes, Biochemistry 43 (2004) 4473–4481.
[43] F. Kamp, D. Zakim, F. Zhang, N. Noy, J. A. Hamilton, Fattyacid flip-flop in phospholipid bilayers is extremely fast, Biochemistry 34 (1995)11928–11937.
[44] J. R. Simard, B. K. Pillai, J. A. Hamilton, Fatty acid flip-flop in a modelmembrane is faster than desorption in the aqueous phase, Biochemistry47 (2008) 9081–9089.
[45] J. P. Kampf, D. Cupp, A. M. Kleinfeld, Different mechanisms of freefatty acid flip-flop and dissociation revealed by temperature and molecu-lar species dependence of transport across lipid vesicles,J. Biol. Chem.281 (30) (2006) 21566–21574.
[46] S. Svetina, B.Zeks, The elastic deformability of closed multilayeredmembranes is the same as that of bilayer membrane, Eur. Biophys. J.21 (1992) 251–255.
[47] W. Helfrich, Elastic properties of lipid bilayers: Theory and possible ex-periments, Z. Naturforsch. C 28 (1973) 693–703.
[48] U. Seifert, Configurations of fluid membranes and vesicles, Adv. Phys.46 (1) (1997) 13–137.
[49] J. Kas, E. Sackmann, Shape transitions and shape stability of giant phos-pholipid vesicles in pure water induced by area-to-volume change, Bio-phys. J. 60 (1991) 825–844.
[50] E. Farge, P. F. Devaux, Shape changes of giant liposomesinduced by anasymmetric transmembrane distribution of phospholipids,Biophys. J. 61(1992) 347–357.
[51] J. Israelachvili, Intermolecular and Surface Forces,2nd Edition, Aca-demic Press, London, San Diego, 1992.
[52] N. Bergstrand, K. Edwards, Aggregate structure in dilute aqueous disper-sions of phospholipids, fatty acids, and lysophospholipids, Langmuir 17(2001) 3245–3253.
[53] D. V. Zhelev, Exchange of monooleoylphosphatidylcholine with singleegg phosphatidylcholine vesicle membranes, Biophys. J. 71(1996) 257–273.
[54] P. Watson, D. J. Stephens, ER-to-Golgi transport: Formand formationof vesicular and tubular carriers, Biochim. Biophys. Acta 1744 (2005)304–315.
[55] R. M. Raphael, R. E. Waugh, Accelerated interleaflet transport of phos-phatidylcholine molecules in membranes under deformation, Biophys. J.71 (3) (1996) 1374–1388.
[56] R. M. Raphael, R. E. Waugh, S. Svetina, B.Zeks, Fractional occurence ofdefects in membranes and mechanically driven interleaflet phospholipidtransport, Phys. Rev. E 64 (2001) 051913.
[57] K. John, S. Schreiber, J. Kubelt, A. Herrmann, P. Muller, Transbilayermovement of phospholipids at the main phase transition of lipid mem-branes: implications for rapid flip-flop in biological membranes, Biophys.J. 83 (6) (2002) 3315–3323.
[58] J. Liu, J. C. Conboy, 1,2-diacyl-phosphatidylcholineflip-flop measureddirectly by sum-frequency vibrational spectroscopy, Biophys. J. 89 (2005)2522–2532.
12


