Embed Size (px)
Citation preview

442 Stud. Geophys. Geod., 58 (2014), 442460, DOI: 10.1007/s11200-014-0407-3 © 2014 Inst. Geophys. AS CR, Prague
Effect of hydrocarbon-contaminated fluctuating groundwater on magnetic properties of shallow sediments
NAWRASS N. AMEEN1, NICOLE KLUEGLEIN1, ERWIN APPEL1*, EDUARD PETROVSKÝ2, ANDREAS
KAPPLER1 AND CARSTEN LEVEN1
1 Department of Geosciences, University of Tübingen, 72074 Tübingen, Germany ([email protected])
2 Institute of Geophysics, Academy of Sciences of the Czech Republic, Boční II/1401, 141 31 Praha 4, Czech Republic ([email protected])
* Corresponding author
Received: Janaury 31, 2014; Revised: April 7, 2014; Accepted: April 18, 2014
ABSTRACT
We investigate magnetic phase (trans)formation in the presence of petroleum hydrocarbons and its relation to bacterial activity, in particular in the zone of remediation driven fluctuating water levels at a former military air base in the Czech Republic. In a previous study an increase of magnetite concentration from the groundwater table towards the top of the groundwater fluctuation zone (GWFZ) was reported, however with limited reliability as there was no control on small-scale effects. To recognize statistically significant magnetic signatures versus depth, we obtained multiple sediment cores from three locations in January 2011 and April 2012, penetrating the unsaturated zone, the GWFZ and the uppermost one meter below the groundwater level (~2.3 m depth at the time of sampling). Magnetic concentration variation versus depth was determined by measuring magnetic susceptibility (MS) and remanence parameters. Small-scale features were identified and eliminated by statistical processing of multiple cores. A trend of increasing MS values from the lowermost position of the groundwater table upward was verified and highest magnetic concentration was found at the top of the GWFZ. Magnetic mineralogy indicates that newly formed fine-grained magnetite in the single domain to small pseudo-single domain range is responsible for the MS enhancement confirming previous results. There is no correlation with the depth variation of hydrocarbon (HC) concentrations; however, total organic carbon is linked to MS and may represent a degradation product of HC that is bioavailable for microorganisms. Bacterial activity is likely responsible for magnetite formation as indicated by most probable number (MPN) results of iron-metabolizing bacteria. The comparison of our results with an earlier study conducted at the same site revealed that magnetic concentration clearly decreased since remediation was terminated in 2008, possibly due to dissolution of magnetite.
Ke y wo rd s : environmental magnetism, magnetic susceptibility, groundwater table
fluctuation, hydrocarbon contamination, magnetite formation

Effect of hydrocarbon-contaminated groundwater on magnetic properties of sediments
Stud. Geophys. Geod., 58 (2014) 443
1. INTRODUCTION
Sediments, soils and groundwater can act as a natural storage for many types of pollution. Within the last three decades environmental magnetism has become a growing field of research, contributing to the development of efficient methodologies for localizing and characterizing pollution (Petrovský and Ellwood, 1999). Magnetic susceptibility (MS) can be measured fast in the laboratory and in-situ, even in high resolution along shallow ~0.5 m deep vertical sections (Petrovský et al., 2004). Measurements of MS yield information with low cost and consuming less time than chemical analysis and thus may complement chemical methods, increasing the efficiency and reliability of site assessment by a better targeted selection of sampling sites and sampling depths for chemical laboratory analyses (Appel et al., 2003; Blaha et al., 2008). Various magnetic studies were conducted on soils and sediments to detect heavy metal pollution. In the case of heavy metals magnetic phases often come from the same sources such as combustion processes (Spiteri et al., 2005), steel industries (Yang et al., 2012), mining activities (Petrovský et al., 1998; Jordanova et al., 2013) or road traffic (Hoffmann et al., 1999; Salo et al., 2012), and are transported into the environment in a similar way as the heavy metal pollutants. In contrast to heavy metals, however, the relationship of magnetic property changes due to organic compounds is far less investigated.
Magnetic signatures associated with the presence of underlying HC resources have been proposed by Perez-Perez et al. (2011) and Guzmán et al. (2011), in the latter study near-surface magnetic anomalies were found in oil fields of Venezuela, which are probably associated with maximum accumulation of hydrocarbons (HC) in the reservoir or with HC migration. Emmerton et al. (2013) reported a connection between magnetic mineralogy and oil biodegradation within oil-bearing sedimentary units, they concluded that a distinct decrease in MS is correlated to decreasing oil quality and the amount of organic matter, and that magnetite occurs in different grain sizes depending on oil quality. The results of Aldana et al. (2011) suggested that the magnetic signature in the HC microseepage can be magnetite or greigite. In another paper, Venkatachalapathy et al. (2011) proposed that instead of expensive and destructive chemical methods, MS can be used as a suitable rapid assessment of petroleum HC contamination in marine sediments. However, the studies of Morris et al. (1994) on sediments from Hamilton harbor (Canada) and Hanesch and Scholger (2002) on soil near a steel mill in Austria make us aware about complications and possible pitfalls. In both studies a significant correlation between MS and HC contents was found, but because of concurrent heavy metal contamination a direct tie of magnetic properties to the presence and origin of HC is unclear. At the former oil-field Hänigsen (Germany) the influence of heavy metal pollution is neglectable, and a reasonable relationship between magnetic enhancement and HC contents in soils and sediments seems to exist, however the relationship is complex (Rijal et al., 2012).
Technological advancement for detecting and monitoring HC contamination such as after oil spills would be of great interest for rapid site assessment and proper selection of remediation strategies. For this we focus on a field site at Hradčany (Czech Republic) that was used as a military airbase until 1990. Remediation was performed since 1997 using several techniques including air sparging which stimulated the degradation of organic contaminants and caused strong fluctuations of the groundwater table along with a simultaneous displacement of HC contaminants that were still present in the

N. Ameen et al.
444 Stud. Geophys. Geod., 58 (2014)
groundwater upward into the unsaturated zone. In this study we aim to investigate the effects of HC contamination and groundwater table fluctuation on iron mineralogy within the groundwater fluctuation zone (GWFZ) using magnetic methods. This work extends the previous study of Rijal et al. (2010) by improving the reliability of the magnetic signatures related to different levels (groundwater table, GWFZ) and adding additional insight into the nature of magnetic properties and the underlying processes, also documenting changes over some years. It was suggested that Fe(III)-reducing and Fe(II)-oxidizing bacteria in natural conditions can cycle bioavailable iron and thereby form magnetic minerals including magnetite, thus increasing MS (Porsch et al., 2010; Klueglein et al., 2013). Therefore we also include microbiological analysis in our study.
2. MATERIALS AND METHODS
2 . 1 . S t u d y a r e a
The study area is located at a former military air force base at Hradčany (503714N, 144417E) in the Czech Republic, about 100 km north-east of Prague (Fig. 1a). The total area of the site is 0.28 km2. It was used as a military site during 19401990 by Czechoslovak, German and finally Soviet armies. Leaks at storage areas and jet fuelling stations heavily contaminated the unsaturated zone and the groundwater with petroleum hydrocarbons (Fig. 1a). An estimate of about 7150 tons of hydrocarbon was released into the soil and groundwater (Machackova et al., 2008; Rijal et al., 2010).
The site and its vicinity are situated in the sediments of the Bohemian Cretaceous basin, which forms the main groundwater reservoir of the Czech Republic. The simplified stratigraphy at the site is as follows: the upper layers (0.53 m thick) consist of sandy-gravelly Quaternary river sediments; the aquifer is represented by middle to fine middle Turonian sandstone with a thickness of 6775 m (Machackova et al., 2005, 2008). The groundwater flows towards north-west direction as shown in Fig. 1b. Our study is located in the eastern part of the contaminated area. Pollution of soil and groundwater by hydrocarbons was spread into the alluvial sediments of Ploučnice River and in the middle Turonian sandstones.
During remediation soil vapour extraction and soil venting were used to remove the free oil phase and volatile compounds from the unsaturated zone. Air sparging and nutrient amendments were applied in the saturated zone to provide favorable conditions for aerobic biodegradation of contaminants in the groundwater. At the end, high concentrations of petroleum hydrocarbons remained around the groundwater table (Masak et al., 2003; Machackova et al., 2005, 2008), and the highest level of contamination was observed in the zone which was affected by groundwater table fluctuations (smear zone).
2 . 2 . S a m p l e s
Sediment cores were collected from three sites (C1-3; Fig. 1b) in January 2011 and April 2012, corresponding to the sites S1-3 sampled in 2008 and examined by Rijal at al. (2010). The cores penetrated the unsaturated zone, the GWFZ and extended to about one meter below the groundwater level (~2.3 m depth at the time of sampling). In the 2011 campaign only one core from each location was drilled, while in the 2012 campaign triplicate cores were collected from each location within less than one meter distance from

Effect of hydrocarbon-contaminated groundwater on magnetic properties of sediments
Stud. Geophys. Geod., 58 (2014) 445
each other in order to better recognize representative magnetic behavior versus depth. For soil sampling, dual tube sampling system (caliper of 5 cm) with a percussion aided unit (Geoprobe model 6610DT) was used. The sites C1 and C2 were located in the downstream direction of the groundwater flow from the pollution source (the fuel storage concrete bunker) whereas C3 was taken in the upstream region (Fig. 1b); therefore, the coring sites C1 and C2 were more contaminated. As air sparging was predominantly performed in the downstream region of the fuel storage area, C1 and C2 were stronger influenced by the remediation processes than C3.
Fig. 1. a) Location of the study area (Hradčany field site) in the Czech Republic showing the extent of the total polycyclic hydrocarbons (TPH) above the cleanup goal of 5000 mg/kg in both the soil and the groundwater (areas indicated in red). b) Close view of the sampling locations (C1, C2 and C3); the dot-dashed line represents the strongly hydrocarbon-contaminated area.

N. Ameen et al.
446 Stud. Geophys. Geod., 58 (2014)
2 . 3 . L a b o r a t o r y m e a s u r e m e n t s
M a g n e t i c p r o p e r t i e s
Three parallel sets of samples were prepared from each core at high resolution of 2 cm, air-dried at room temperature, and packed into 10 cm3 lidded plastic containers for magnetic measurements (for the 2011 and 2012 campaigns in total 830, 888 and 977 samples for C1, C2 and C3, respectively). At some depths, where the gravelly sand content was dominant, it was impossible to collect 3 parallel sets. Special care was taken to avoid cross contamination during sample preparation.
Magnetic susceptibility (converted to mass-specific values ) and anhysteretic remanent magnetization (ARM) were measured on all three sets, and frequency-dependent susceptibility (fd in %) and saturation isothermal remanent magnetization (SIRM) were measured on one set. Readings of MS were repeated three times for each sample, and the values were averaged. In the 2012 campaign, prior to the sub-sampling, volume-specific magnetic susceptibility ( was measured for the whole core using a Bartington MS2 magnetic susceptibility meter connected to a MS2C ring-sensor. For MS measurements in the laboratory we used an AGICO KLY-3 kappabridge, and for fd an AGICO MFK1-FA kappabridge at two different frequencies of 976 Hz and 15616 Hz in a peak field of 200 A/m. ARM was imparted with a DC bias field of 40 T and a peak alternating field of 100 mT, while the ARM intensity was measured in a 2G Enterprises superconducting magnetometer (2G-755R). IRM was imparted by a MMPM9 pulse magnetizer, and the IRM intensity was measured with a Molspin spinner magnetometer. The IRM acquired at 1 T is considered as the saturation IRM (SIRM), and a backfield IRM in a reverse field of 0.3 T (IRM300) was used to calculate the S-ratio according to the equation of Bloemendal et al. (1992). Thermomagnetic measurements were obtained using KLY3 kappabridge with an attached CS-3 heating unit (maximum temperature 700C). For selected samples with high and low MS values within the GWFZ from all three coring sites, further analyses were performed. IRM acquisition curves were generated up to a maximum magnetic field of 2.5 T and analyzed by the cumulative log-Gaussian method (Kruiver et al., 2001). Statistical assessment was applied to examine the data. A coefficient of variation (Cv) was calculated to analyze the data in order to detect outliers. The Cv value is defined as the ratio of the standard deviation to the mean ( v meanC ). Whenever the data from parallel sample sets were not within a given percent range of the mean, these data were excluded from further consideration.
S e d i m e n t p r o p e r t i e s
Selected samples from cores of all three sites and from different depths were measured for pH, total iron content (Fetot in %) and total organic carbon content (TOC in %). The pH was measured 24 h after adding 0.01 M CaCl2 solution according to ISO 1039 (1994) (Blume et al., 2000). The total iron content was identified by X-ray fluorescence (XRF) measurements using a Bruker AXS S4 Pioneer XRF device with a Rh-tube at 4 kW (Bruker AXS GmbH, Germany). Samples were first ground with an agate mill for 10 minutes, then 1.5 g of sample powder (dried at 105C) was mixed with 7.5 g MERCK spectromelt A12 (mixture of 66% Li-tetraborate and 34% Li-metaborate) and melted at

Effect of hydrocarbon-contaminated groundwater on magnetic properties of sediments
Stud. Geophys. Geod., 58 (2014) 447
1200C to fused beads. For determining TOC, the soil sample was dried at 60C, and 1 g (2 parallels) was used for analysis. Organic carbon was identified after removing the inorganic carbon by adding 16% HCl to the soil and stirring it with a glass rod until all CO2 bubbles disappeared. Then the sample was centrifuged at 2000 rpm after removing the glass rod and washing it with millipore water, repeating the washing step until the soil got rid of the acid. Finally the sample was dried again at 60C, weighed and measured for the TOC content using an elemental analyzer Vario EL (Elementar Analysensysteme GmbH, Germany).
H y d r o c a r b o n c o n t e n t
For the quantification of the hydrocarbon content, 19 g of selected samples from the coring site C1 and 7 g from coring sites C2 and C3, taken from the unsaturated, water fluctuated and saturated zones, were extracted with acetone. After shaking, the acetone was cleared from the soil and mixed with isohexane and water. Afterwards the acetone was dissolved, and 0.5 g florisil was added. The solution was measured by gas chromatograpy using a HP 6890-II/MS (MS 5973). The compounds were identified by matching retention times and ion mass fragments and compared with results from a standard mixture of diesel and kerosene. The sample concentration was calculated and calibrated to an external standard.
M o s t p r o b a b l e n u m b e r
To analyze bacterial activity within the GWFZ from the coring site C1 we used the most probable number (MPN) quantification. 1 g of the wet homogenized soil was added to 9 ml of sterile, anoxic freshwater medium containing 0.6 g/l KH2PO4, 0.3 g/l NH3Cl, 0.5 g/l MgSO4·H2O, 0.1 g/l CaCl2·2H2O with the pH adapted to the soil pH (modified from Hegler et al., 2008). From this a ten-fold dilution series (1011012) was prepared and then inoculated into deep well plates containing specific targeting additives: for Fe-reducers 5 mM ferrihydrite + 5 mM Na-lactate + 5 mM Na-acetate; for nitrate-dependent Fe(II)-oxidizers 10 mM FeCl2 + 4 mM Na-nitrate + 0.5 mM Na-acetate. Deep well plates were sealed and incubated anoxically for at least 8 weeks at 20C. Results were analyzed using the KLEE-software (Klee, 1993).
3. RESULTS
3 . 1 . G r o u n d w a t e r t a b l e
Three temporary small diameter groundwater monitoring wells were drilled about 30 cm away from the coring sites C1, C2 and C3 for monitoring the groundwater level. The groundwater table was measured twice using an electrical tape; the groundwater level on 19 April 2012 was at 2.3 m, 1.5 m, 2.1 m from ground level for C1, C2 and C3 respectively. We have to take into account that the surface elevations of C2 and C3 were 0.9 m and 0.2 m below the baseline of C1.
Groundwater fluctuation (GWF) at the study site is influenced by two factors, the natural seasonal variation and the remediation processes. At the site, air sparging caused spreading of contaminants over a broad zone (Rijal et al., 2010). The natural annual

N. Ameen et al.
448 Stud. Geophys. Geod., 58 (2014)
variation of the groundwater table is in the range of 3040 cm (Rijal et al., 2010). The GWF in wells closest (1.01.5 m) to our sampling locations C1 and C2 was observed to extend over 0.61 m and 0.66 m, respectively. These measurements were carried out by the remediation company (personal communication), but their results are based on only few readings (3 and 7, respectively). Thus the mentioned values only give a minimum extent of the zone of GWF; its actual range is unknown and it can be considerably larger.
3 . 2 . M a g n e t i c s u s c e p t i b i l i t y p r o f i l e s
The coefficient of variation (Cv) is used to determine the dispersion from the mean. This method was applied to our mass-specific susceptibility values () in order to detect outliers. We performed the procedure in two steps; in the first step we compared the values of the three parallel data sets from the same core, then in the second step we compared the mean values of the different cores from one site. If in both steps the Cv was below the defined threshold value, the mean value for the core at the corresponding level was accepted for further interpretation, otherwise results from this level were rejected. Fig. 2 shows the number of accepted samples for a given Cv threshold value for both levels (comparison within individual cores and for different cores from one location). For determining the Cv threshold value we checked the results in Fig. 2 for the Cv value at which the number of accepted samples drops more rapidly. From all curves we defined a uniform threshold value of 20%. The resulting vertical profiles of from the three locations according to this selection criterion are shown in Fig. 3b, together with the original raw data of individual cores (Fig. 3a). In the case of the 2011 campaign, no multiple cores from the same sampling sites C1, C2 and C3 were taken, thus for these data only the first step of the statistical procedure could be applied and spatially small-scale heterogeneities may still be present in the final downhole curve.
Fig. 2. Number of accepted depth levels (number of samples) versus coefficient of variation (Cv) for the three sampling locations C1, C2 and C3. The dashed curves show the analysis of individual cores; solid lines show the analysis between different cores from the same location. The vertical dashed lines mark the best estimate of the Cv threshold for each curve and the finally chosen Cv threshold value of 20%.
10 20 30 40 50
120
160
200
240
280
320C2
C [%]v
10 20 30 40 50
120
160
200
240
280
320C3
C [%]v
10 20 30 40 50
50
100
150
200
250
300C1
C [%]v
Num
ber
of S
am
ple
s

Effect of hydrocarbon-contaminated groundwater on magnetic properties of sediments
Stud. Geophys. Geod., 58 (2014) 449
Fig. 3. Vertical profiles of magnetic susceptibility for the three sampled sites C1, C2 and C3. The upper dashed horizontal line is the surface baseline given by C1. a) 1: raw data (outliers included) of mass-specific susceptibility () for all 8 measured cores of the 2012 sampling campaign; 2: volume-specific susceptibility () of Bartington MS2C long-core measurements (for each coring site the average of the three individual cores are shown). b) 1: mean values of after excluding outliers based on the threshold definition shown in Fig. 2; 2: mass-specific values of the 2011 campaign; 3: results published by Rijal et al. (2010) for samples taken in 2008 (depths adjusted to our coordinate system). The solid horizontal line represents the groundwater table at the time of sampling (according to Rijal et al., 2010) the natural groundwater table is near its topmost level at the season of our sampling). The shaded area is the minimum extent of the groundwater fluctuation zone according to measurements during the remediation phase (made by the company that carried out the remediation). The lowest bold dashed line represents the expected lower level of the natural seasonal groundwater table variation according to the seasonal variation shown by Rijal et al. (2010). The highest bold dashed line is a tentative assumption of the uppermost limit of the groundwater fluctuation during air sparging.

N. Ameen et al.
450 Stud. Geophys. Geod., 58 (2014)
For further discussion the vertical sequence of the sampling sites can be subdivided into the following zones (from bottom to top; see Fig. 3): 1) The permanently water saturated zone (PSZ) (the top of this zone we locate ca. 30 cm below the measured groundwater table as during the season of our sampling campaigns an average groundwater level maximum is expected); 2) the natural groundwater fluctuation zone (NGFZ); 3) the groundwater fluctuation zone (GWFZ) as indicated by the measurements of remediation company; 4) the GWFZ+ (a tentative higher level where the groundwater fluctuation has probably reached); 5) the permanently unsaturated zone (PUZ).
3 . 3 . M a g n e t i c p h a s e i d e n t i f i c a t i o n
The relationship between and ARM ( 40 μTARM ARM ) shows a linear dependence through the origin with high correlation coefficients for both data sets (Fig. 4a) and with outliers excluded according to the Cv threshold criterion (Fig. 4b) (correlation coefficients r of 0.94 and 0.93, respectively). The good correlation is indicative that is controlled by ferro(i)magnetic phases.
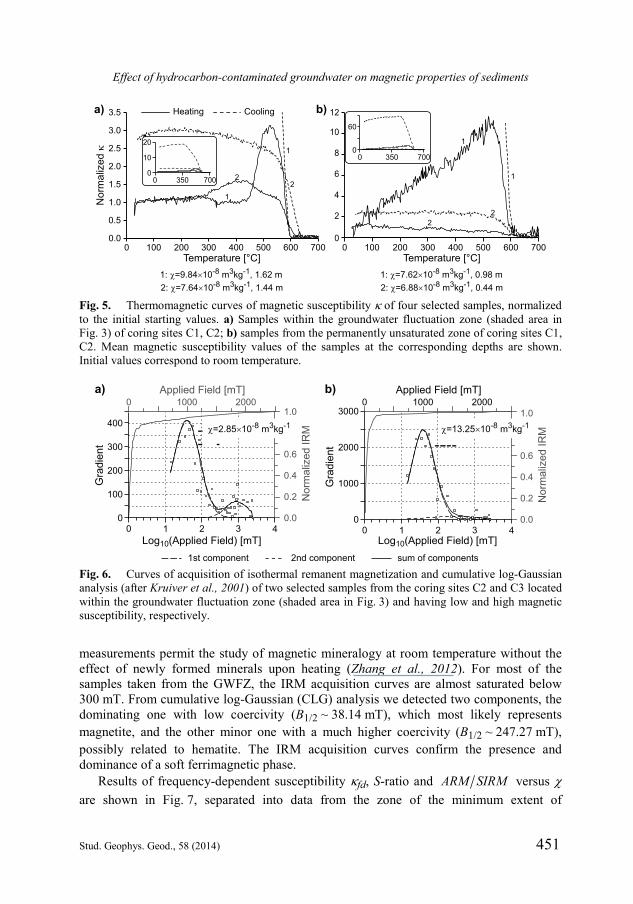
High-temperature susceptibility (-T) curves were measured on four selected samples taken from the GWFZ in the coring site C1 at depths of 1.44 m and 1.62 m (Fig. 5a) and from the PUZ in the coring sites C1 and C2 at depths of 0.98 m and 0.44 m (Fig. 5b). The temperature cycles reveal a strong effect of new formation of magnetite during heating, but the plateau-like behavior in the heating curves at lower temperatures and the detection of only a single Curie temperature near 600C indicates that magnetite is also present in the original samples. Results from hysteresis measurements support this conclusion (see further below).
Additional studies were conducted to reveal the magnetic mineralogy and the magnetic grain-size distribution (domain state) of magnetic minerals. IRM acquisition curves for selected samples within the GWFZ with low and high values are shown in Fig. 6. IRM
Fig. 4. Relationship between magnetic susceptibility () and susceptibility of anhysteretic remanent magnetization (ARM) on log-log scale and linear scale (insets); a) including outliers, b) excluding outliers. The correlation coefficients (r) and the number of data points are listed.
Effect of hydrocarbon-contaminated groundwater on magnetic properties of sediments
Stud. Geophys. Geod., 58 (2014) 451
measurements permit the study of magnetic mineralogy at room temperature without the effect of newly formed minerals upon heating (Zhang et al., 2012). For most of the samples taken from the GWFZ, the IRM acquisition curves are almost saturated below 300 mT. From cumulative log-Gaussian (CLG) analysis we detected two components, the dominating one with low coercivity (B1/2 ~ 38.14 mT), which most likely represents magnetite, and the other minor one with a much higher coercivity (B1/2 ~ 247.27 mT), possibly related to hematite. The IRM acquisition curves confirm the presence and dominance of a soft ferrimagnetic phase.
Results of frequency-dependent susceptibility fd, S-ratio and ARM SIRM versus are shown in Fig. 7, separated into data from the zone of the minimum extent of
Fig. 5. Thermomagnetic curves of magnetic susceptibility of four selected samples, normalized to the initial starting values. a) Samples within the groundwater fluctuation zone (shaded area in Fig. 3) of coring sites C1, C2; b) samples from the permanently unsaturated zone of coring sites C1, C2. Mean magnetic susceptibility values of the samples at the corresponding depths are shown. Initial values correspond to room temperature.
Fig. 6. Curves of acquisition of isothermal remanent magnetization and cumulative log-Gaussian analysis (after Kruiver et al., 2001) of two selected samples from the coring sites C2 and C3 located within the groundwater fluctuation zone (shaded area in Fig. 3) and having low and high magnetic susceptibility, respectively.
20
350 700
CoolingHeating
0 100 200 300 400 500 600 700
Temperature °C[ ]
22
1
0.0
0.5
1.0
1.5
2.0
2.5
3.0
3.5
0 100 200 300 400 500 600 700
No
rma
lize
d�
Temperature °C[ ]
0
2
4
6
8
10
12
1
2
2
b)a)
0
10
0
0
60
0 350 700
1
1
1: �=7.62 10 m kg , 0.98 m�-8 3 -11: 9.84�= 10 m kg , 1.62 m�
-8 3 -1
2 =7.6 10 m kg , 1.44 m� �-8 3 -1: 4 2 =6.88 10 m kg , 0.44 m� �
-8 3 -1:
Applied Field [mT]
Gra
die
nt
Norm
aliz
ed I
RM
Log (Applied Field) [mT]10
Applied Field [mT]0
00
100
200
300
400
0.0
0.2
0.4
0.6
1.0
1 2 3 4
01000 10002000 2000
Gra
die
nt
Log (Applied Field) [mT]10
00
1000
2000
3000
1 2 3 4N
orm
aliz
ed I
RM
0.0
0.2
0.4
0.6
1.0
a) b)
1st component 2nd component sum of components
�=13.25 10 m kg�-8 3 -1
�=2.85 10 m kg�-8 3 -1

N. Ameen et al.
452 Stud. Geophys. Geod., 58 (2014)
groundwater fluctuation (GWF), the additional zone upward to the tentative uppermost limit of groundwater fluctuation (GWFZ+), the assumed zone of natural groundwater variation (NGFZ), and the permanently unsaturated (PUZ) and saturated zones (PSZ). The relatively low fd values (few samples exceed 5%) suggest that superparamagnetic (SP) grains only play a subordinate role, but nevertheless they seem to be present. The higher fd values for weaker magnetic samples may indicate that the natural sediments contain a certain amount of SP particles. ARM SIRM is often used as magnetic grain-size indicator for magnetite (Evans and Heller, 2003). There is, however, no clear difference of this ratio in the different zones. In the GWFZ and GWFZ+ the scattering is somewhat smaller than in the other two zones and a positive trend versus susceptibility may exist.
Fig. 7. Bivariate plots of frequency-dependent susceptibility fd, S-ratio and ratio of anhysteretic over saturation remanence ( ARM SIRM ) versus mass-specific susceptibility separated for the different coring sites C1, C2 and C3 and different zones. Data (outliers excluded according to the coefficient of variation criteria) from the zones as discriminated in Fig. 3 are shown in the three rows as follows: Top: data from the permanently unsaturated zone (PUZ) (black) and from the zone that might have been influenced by groundwater fluctuation (GWFZ+; red); Middle: data from the zone of the minimum extent of groundwater fluctuation GWFZ (GWFZ; black) and from the zone GWFZ+ (red); Bottom: data from the zone that is permanently saturated (PSZ; black) and from the zone of the natural seasonal groundwater level variation (NGFZ; blue). The curve in the column at the right side is used to illustrate from which zones the data in the three rows are taken (a core from site C1 is selected for illustration).

Effect of hydrocarbon-contaminated groundwater on magnetic properties of sediments
Stud. Geophys. Geod., 58 (2014) 453
The trend and the smaller scattering for a given susceptibility value are an indication for the new formation of fine-sized magnetite. The lower values for the GWFZ stem from samples closer to the groundwater table. Dissolution of magnetite could explain this observation; the clearest trend is a non-linear increase of the S-ratio with susceptibility. This clearly supports the assumption of the new formation of magnetite in this zone. Moreover, in conjunction with the lower ratios for weak magnetic samples in the groundwater fluctuation zone compared to the unsaturated zone, we can conclude that in the saturated zone and lower fluctuation zone both new formation of SP magnetite and (partial) dissolution of all kinds of magnetite particles (originally present in the sediment and newly formed) are competing processes.
3 . 4 . C h e m i c a l a n a l y s e s
To investigate whether the changes in magnetic mineralogy are related to the presence of natural organic carbon or by the contamination with hydrocarbons due to fluctuations of the groundwater table, chemical analyses of selected samples from the coring sites C1, C2 and C3 within GWFZ were performed. The pH, TOC, Fetot and the bioavailable iron were measured and their statistical trends versus magnetic susceptibility ( values from long-core measurements) were analysed (Fig. 8). The pH values are all in the acidic range, varying between 4.5 and 5.5, independent of . Fetot shows a moderate positive correlation with while the bioavailable iron is uncorrelated. The most significant positive correlation was found between TOC and r = although TOC concentrations are very low (< 1%). TOC concentrations may be residuals from hydrocarbon contamination and their correlation with values indicate that hydrocarbons played a role in the new formation of magnetite in the sediments.
ARM SIRM
Fig. 8. Cross plots of the sediment properties: a) pH, b) total organic content TOC, c) total iron content Fetot, and d) bioavailable iron versus volume-specific magnetic susceptibility (long-core values) of selected samples from the groundwater fluctuation zone (as shown in Fig. 3); the correlation coefficients (r) and trend lines are indicated.
� [10 SI]-50 0 2 4 6 8 10
0.0
0.4
0.8
1.2
1.6
10 20 30 40
� [10 SI]-5
r = 0.45
Fe
[%]
tot r = 0.14
0.0
0.2
0.4
0.6
Fe
bio
av
[mg F
e/g
soil]
0 10 20 30 40
r = 0.75
0.0
0.1
0.3
0.2
0.4
0.5
TO
C [%
]
4.0
4.5
5.0
5.5
6.0
0 10 20 30 40
r = 0.15
pH
a) b)
c) d)

N. Ameen et al.
454 Stud. Geophys. Geod., 58 (2014)
3 . 5 . H y d r o c a r b o n c o n t e n t s
The total hydrocarbon content of selected samples from the coring sites C1, C2 and C3 are shown in Fig. 9. Low concentrations in C1 compared to C2 and C3 could be noticed which coincides with the previous results of HC analysis (47 mg/kg) conducted at the same site (Rijal et al., 2010). Trends of hydrocarbons from all three coring sites show no correlation with . The highest concentration of all three coring sites is above the groundwater table (in the GWFZ).
3 . 6 . M o s t p r o b a b l e n u m b e r q u a n t i f i c a t i o n
The MPN-method was used to investigate the bacterial activity within and around the GWFZ of coring site C1. Both bacterial metabolisms are important at this site, the nitrate-dependent Fe(II)-oxidizing bacteria show higher cell numbers at the top of the GWFZ (Fig. 10a), the Fe(III)-reducing bacteria show high cell numbers throughout the sediment depth with slightly higher numbers at the lower part of the GWFZ (Fig. 10b). This supports the assumption that the new formation of magnetite was strongly dominated by bacterial activity of Fe (III)-reducing bacteria.
4. DISCUSSION
Fluctuations of the groundwater table with strong hydrocarbon (HC) contamination were frequently triggered by air sparging during the remediation process, driving the HC contaminants upward into the groundwater fluctuation zone (GWFZ). To evaluate the temporal changes after remediation termination by the end of 2008, we compared our results from 2011 and 2012 sampling campaigns with the results from the earlier study of (Rijal et al., 2010) with sampling in July 2008 at the same site (Fig. 3b). The duplicate and triplicate sampling at each site in 2012 allowed recognizing small-scale outliers that cannot be considered as typical for the general trend with depth. Identification
Fig. 9. Scatter plots of hydrocarbon contents and volume-specific magnetic-susceptibility values (from long-core measurements) versus depth of selected samples from all three coring sites C1, C2 and C3. The horizontal dashed line represents the groundwater table at the time of sampling.

Effect of hydrocarbon-contaminated groundwater on magnetic properties of sediments
Stud. Geophys. Geod., 58 (2014) 455
of such small-scale anomalies in the two other data sets is unfortunately problematic. Such small scale features may be still related to hydrocarbon and water fluctuation driven changes, but as they are difficult to analyze due to their small dimension, we restrict ourselves on observation of the more general depth trend. A further problem for the vertical zonation is the uncertainty in the extent of the GWFZ as the measurements during air sparging remediation (by the company on duty) are limited and only provide a minimum value of the upward movement of groundwater during air sparging at nearby wells. It can be assumed that the real upward extent of the GWFZ is reaching to higher levels, as indicated in Fig. 3a. Another question is the boundary of the GWFZ to the permanently saturated zone. In the 2012 campaign, we thoroughly determined the depth of the groundwater table by different methods (wetness of samples, water level in the borehole, response during sampling activity). We know that the seasonal variation of the groundwater depth at the study site is around 3040 cm (Rijal et al., 2010) and that during our sampling season this seasonal variation was at about the upper limit. From these considerations we can derive the boundary of the always saturated zone at approx. 30 cm below the groundwater table, measured during the sampling season in 2012. However, the upper limit of the GWFZ remains an open question. During the earlier sampling of Rijal et al. (2010), remediation was still affecting the spread of the groundwater and thus the determination of the natural groundwater table and the GWFZ was difficult. In Rijal et al. (2010), the depth scale of sites S2 and S3 (equal to C2 and C3 in our study) were erroneously labeled from the surface levels, instead to the surface baseline of S1 (equal to C1 in our study). For comparison of all three campaigns the depth scale of Rijal et al. (2010) was adjusted to the coordinate system shown in Fig. 3b.
Fig. 10. Most-probable number counts for a) nitrate-dependent Fe(II)-oxidizing bacteria, b) Fe(III)-reducing bacteria versus depth, for samples taken from coring site C1. The dashed curve represents the volume-specific magnetic susceptibility (from long-core measurements). The shaded area is the minimum extent of the groundwater fluctuation zone. The solid horizontal line represents the groundwater table at the time of sampling and the top dashed horizontal line is a tentative assumption of the uppermost limit of the groundwater fluctuation during air sparging.
1 10 100 1000 10000 100000
2.5
2.0
1.5
1.0
0.5
0 4 8 12 16
a)1 10 100 1000 10000 100000
0 4 8 12 16
2.5
2.0
1.5
1.0
0.5
b)
� [10 SI]-5� [10 SI]-5
Depth
[m
]Cells/g of dry soil Cells/g of dry soil

N. Ameen et al.
456 Stud. Geophys. Geod., 58 (2014)
Results of magnetic susceptibility () reflect variations in the concentration of magnetite as shown by the thermomagnetic curves (Fig. 5) and the higher S-ratio values (Fig. 7) that are observed for samples with higher χ values. The more narrow distribution of ARM SIRM ratios for higher- samples in the groundwater fluctuation zone (Fig. 7) indicate that additional magnetite within a limited grain size range was formed here by a distinct process (likely caused by bacterial activity); the higher ARM SIRM ratio for samples with high in comparison to samples with low in this zone indicates that this newly formed magnetite is in a fine-grained comprising particles of single-domain to probably small pseudo-single domain states (but no significant superparamagnetic fraction (as indicated by lowfd values).
Results of MPN from C1 suggest that high numbers of Fe-metabolizing bacteria are likely a major factor for the new formation of magnetite in the GWFZ. Highest values at the top of the GWFZ indicate that the top of the GWFZ was the most active zone for magnetite formation due to bacterial activity. This underlined by the fact that a newly described Fe(III)-reducing bacterial strain Geothrix fermentans strain HradG1 was isolated from this exact field site, which formed magnetite as main mineral product (Klueglein et al., 2013).
Higher levels in the GWFZ are infiltrated with large amounts of water for the shortest time. A tendency of increasing values from the top of the permanently saturated zone towards the top of the GWFZ is revealed. From the location of peak values in these trends the top of the GWFZ can be assumed at approximately 1.3 m from the baseline in C1 and approximately 1.4 m in C2 (however, less clearly defined here from the peak), while it appears to be located deeper in C3 (1.7 m). The upper limit of the GWFZ in C3 can be expected as this site was less affected by air sparging. We found that total Fe content is increased for samples with higher magnetic concentration, but bioavailable iron and pH conditions seem not to be important for the formation of new magnetite (Fig. 8). Also, the distribution of the total content of hydrocarbons is unsystematic (Fig. 9) and is likely not a controlling factor. Interestingly, higher TOC contents (Fig. 8) are corresponding to higher values. We speculate that petroleum hydrocarbons are not usable for most of the microorganisms (or could even be toxic to them), but bioavailable organic carbon that formed as a degradation product by e.g. Pseudomonas species may provide a suitable carbon source for Fe(III)-reducing bacteria. Our observation that enhanced values in C3 (less contaminated) are similar to C1 and C2 point out that the amount of total hydrocarbon concentration is not a crucial factor. Once the organic carbon content from degradation of hydrocarbons (or natural origin) is sufficiently high, water level fluctuations can stimulate magnetite formation by bacterial activity.
The lower values in the permanently saturated zone and the lower part of the groundwater fluctuation zone point out that the new formation of magnetite and dissolution of magnetite in water logged conditions are competing processes. Interestingly, the absolute values of for the 2008 samples are clearly higher than for the 2011 and 2012 samples, in particular in the lower part with strong water logging. The decrease of values from 2008 (end of air sparging) to 2011 and 2012 could be explained by ongoing dissolution (the pH is in the acid range; Fig. 8a) and cease of new magnetite formation. Porsch et al. (2014) have shown that stimulation by adding nutrients

Effect of hydrocarbon-contaminated groundwater on magnetic properties of sediments
Stud. Geophys. Geod., 58 (2014) 457
(microbial growth medium according to Straub et al., 2005) is an important process of bacterial magnetite production; frequent groundwater fluctuations (during air sparging) may have acted as such stimulation. Could dissolution alone explain the observed low values in the depth range from the permanently saturated zone to the lower part of the groundwater fluctuation zone, i.e. the zones where high amounts of water reached frequently? It has been shown that decomposition of iron phases can occur under reducing hydromorphic conditions in soils (Terhorst et al., 2001). The relatively high values in the permanently unsaturated zone compared to the permanently or often saturated lower part may allow such a conclusion, but the clear maximum of values in the upper part of the groundwater fluctuation zone (GWFZ and GWFZ+) are contradictory to a mere dissolution effect.
5. CONCLUSIONS
The motivation for our study was (a) to improve the reliability of the magnetic signatures through a depth section of sediments which were affected by fluctuation of hydrocarbon contaminated groundwater, and (b) obtaining additional insight into the nature of magnetic properties and the underlying processes explaining their formation. Combining rock magnetic and biogeochemical methods we derive the following conclusions:
1. Statistical analyses confirm the results of Rijal et al. (2010), i.e. magnetic concentration increases from the groundwater table towards the top of the groundwater fluctuation zone (GWFZ).
2. Bacterial activity of Fe(III)-reducing bacteria is indicated as an important driving force for magnetite formation. The depth variation of magnetic concentration suggests that the top of the groundwater fluctuation zone (GWFZ) is the most active part.
3. The concentration of petroleum hydrocarbons is likely not important, but organic carbon formed as a degradation product of hydrocarbon contaminants driven upward into the GWFZ could provide a carbon source for enhanced bacterial activity.
4. Rock magnetic results show that the newly formed magnetite is in a fine-grained range comprising single domain to small pseudo- single domain particles.
5. A comparison with the results of Rijal et al. (2010) suggests that magnetic concentration of sediments has clearly decreased since remediation terminated in 2008, possibly due to dissolution of magnetite.
Acknowledgments: The authors wish to thank Aleš Kapička for accompanying the sampling
during the second field sampling and Ellen Struve for helping in the chemical analysis. The first author would like to thank the DAAD (Deutscher Akademischer Austauschdienst) for providing the scholarship which made this work possible. We further acknowledge the partial financial support of the Deutsche Forschungsgemeinschaft (DFG). EP would like to acknowledge the support provided by the Ministry of Education, Youth and Sports of the Czech Republic through INGO II project LG13042.

N. Ameen et al.
458 Stud. Geophys. Geod., 58 (2014)
References
Aldana M., Costanzo-Álvarez V., Gómez L., González C., Díaz M., Silva P. and Rada M., 2011. Identification of magnetic minerals related to hydrocarbon authigenesis in Venezuelan oil fields using an alternative decomposition of isothermal remanence curves. Stud. Geophys. Geod., 55, 343358.
Appel E., Hoffmann V., Rösler W. and Schibler L., 2003. Magnetic proxy mapping as a tool for outlining contaminated areas. In: Halm D. and Gratwohl P. (Eds), Proceedings of the 2nd International Workshop on Groundwater Risk Assessment at Contaminated Sites (GRACOS) and Integrated Soil and Water Protection (SOWA). Institute and Museum of Geology and Paleontology, University of Tubingen, Tubingen, Germany, ISSN: 0935-4948.
Blaha U., Appel E. and Stanjek H., 2008. Determination of anthropogenic boundary depth in industrially polluted soil and semi-quantification of heavy metal loads using magnetic susceptibility. Environ. Pollut., 156, 278289.
Bloemendal J., King J.W., Hall F.R. and Doh S.J., 1992. Rock magnetism of late Neogene and Pleistocene deep-sea sediments: relations to sediment source, diagenetic process, and sediment lithology. J. Geophys. Res., 97, 43614375.
Blume H.P., Deller B., Leschber R., Paetz A. and Wilke B.M., 2000. Handbuch der Bodenuntersuchung: Terminologie, Verfahrensvorschriften und Datenblätter - Physikalische, chemische, biologische Untersuchungsverfahren - Gesetzliche Regelwerke. Wiley-VCH, Weinheim, Germany (in German).
Emmerton S., Muxworthy A.R., Sephton M.A., Aldana M., Costanzo-Álvarez V., Bayona G. and Williams W., 2013. Correlating biodegradation to magnetization in oil bearing sedimentary rocks. Geochim. Cosmochim. Acta, 112, 146165.
Evans M.E. and Heller F., 2003. Environmental Magnetism: Principles and Applications of Enviromagnetics. Academic Press, New York, 299 pp.
Guzmán O., Costanzo-Álvarez V., Aldana M. and Diaz M., 2011. Study of magnetic contrasts applied to hydrocarbon exploration in the Maturin sub-basin (eastern Venezuela). Stud. Geophys. Geod., 55, 359376.
Hanesch M. and Scholger R., 2002. Mapping of heavy metal loadings in soils by means of magnetic susceptibility measurements. Environ. Geol., 42, 857870.
Hegler F., Posth N.R., Jiang J. and Kappler A., 2008. Physiology of phototrophic iron(II)-oxidizing bacteria: implications for modern and ancient environments. FEMS Microbiol. Ecol., 66, 250260.
Hoffmann V., Knab M. and Appel E., 1999. Magnetic susceptibility mapping of roadside pollution. J. Geochem. Explor., 66, 313326.
Jordanova D., Goddu S.R., Kotsev T. and Jordanova N., 2013. Industrial contamination of alluvial soils near Fe-Pb mining site revealed by magnetic and geochemical studies. Geoderma, 192, 237248.
Klee J.A., 1993. A computer program for the determination of most probable number and its confidence limits. J. Microbiol. Methods, 18, 9198.
Klueglein N., Behrens T.L., Obst M., Behrens S., Appel E. and Kappler A., 2013. Magnetite formation by the novel Fe(III)-reducing Geothrix fermentans strain HradG1 isolated from a hydrocarbon-contaminated sediment with increased magnetic susceptibility. Geomicrobiol. J., 30, 863873.

Effect of hydrocarbon-contaminated groundwater on magnetic properties of sediments
Stud. Geophys. Geod., 58 (2014) 459
Kruiver P.P., Dekkers M.J. and Heslop D., 2001. Quantification of magnetic coercivity components by the analysis of acquisition curves of isothermal remanent magnetization. Earth Planet. Sci. Lett., 189, 269276, DOI: 10.1016/S0012-821X(01)00367-3.
Machackova J., Vlk K., Hercik F. and Proksová S., 2005. In situ bioremediation of jet fuel at the former Soviet Hradcany AFB. http://www.srcosmos.gr/srcosmos/showpub.aspx?aa=8112.
Machackova J., Wittlingerova Z., Vlk K., Zima J. and Linka A., 2008. Comparison of two methods for assessment of in situ jet-fuel remediation efficiency. Water Air Soil Pollut., 187, 181194.
Masak J., Machackova J., Siglova M., Cejkova A. and Jirku V., 2003. Capacity of the bioremediation technology for clean-up of soil and groundwater contaminated with petroleum hydrocarbons. J. Environ. Sci. Health, 38, 24472452.
Morris W.A., Versteeg J.K., Marvin C.H., McCarry B.E. and Rukavina N.A., 1994. Preliminary comparisons between magnetic susceptibility and polycyclic aromatic hydrocarbon content in sediments from Hamilton Harbour, Western Lake Ontario. Sci. Tot. Environ., 152, 153160.
Perez-Perez A., D’Onofrio L., Bosch M. and Zapata E., 2011. Association between magnetic susceptibilities and hydrocarbon deposits in the Barinas-Apure Basin, Venezuela. Geophysics, 76, 3541.
Petrovský E., Hůlka Z., Kapička A. and MAGPROX Team, 2004. A new tool for in situ measurements of the vertical distribution of magnetic susceptibility in soils as basis for mapping deposited dust. Environ. Technol., 25, 10211029.
Petrovský E. and Ellwood B.B., 1999. Magnetic monitoring of air–land and water-pollution. In: Maher B.A. and Thompson R. (Eds.), Quaternary Climates, Environments and Magnetism. Cambridge University Press, Cambridge, U.K., 279322.
Petrovský E., Kapička A., Zapletal K., Šebestová E., Spanilá T., Dekkers M.J. and Rochette P., 1998. Correlation between magnetic parameters and chemical composition of lake sediments from Northern Bohemia - preliminary study. Phys. Chem. Earth, 23, 11231126.
Porsch K., Rijal M.L., Borch T., Behrens S., Troyer L.D.,Wehland F., Appel E. and Kappler A., 2014. Impact of organic Carbon and Iron bioavailability on the magnetic susceptibility of soils. Geochim. Cosmochim. Acta, 128, 4457.
Porsch K., Dippon U., Rijal M.L., Appel E. and Kappler A., 2010. In-situ magnetic susceptibility measurements as a tool to follow geomicrobiological transformation of Fe minerals. Environ. Sci. Technol., 44, 38463852.
Rijal M.L., Appel E., Petrovský E. and Blaha U., 2010. Change of magnetic properties due to fluctuations of hydrocarbon contaminated groundwater in unconsolidated sediments. Environ. Pollut., 158, 17561762.
Rijal M.L., Porsch K., Appel E. and Kappler A., 2012. Magnetic signature of hydrocarbon- contaminated soils and sediments at the former oil field Hänigsen, Germany. Stud. Geophys. Geod., 56, 889908.
Salo H., Bućko M.S., Vaahtovuo E., Limo J., Mäkinen J. and Pesonen L.J., 2012. Biomonitoring of air pollution in SW Finland by magnetic and chemical measurements of moss bags and lichens. J. Geochem. Explor., 115, 6981.
Spiteri C., Kalinski V., Rösler W., Hoffmann V., Appel E. and MAGPROX-Team, 2005. Magnetic screening of a pollution hotspot in the Lausitz area, Eastern Germany: correlation analysis between magnetic proxies and heavy metal pollution. Environ. Geol., 49, 19.

N. Ameen et al.
460 Stud. Geophys. Geod., 58 (2014)
Straub K. L., Kappler A. and Schink B., 2005. Enrichment and isolation of ferric-iron- and humic-acid-reducing bacteria. Methods Enzymol., 397, 5877.
Terhorst B., Appel E. and Werner A., 2001. Palaeopedology and magnetic susceptibility of a loess-palaeosol sequence in southwest Germany. Quatern. Int., 76/77, 231240.
Venkatachalapathy R., Veerasingam S., Basavaiah N. and Ramkumar T., 2011. Environmental magnetic and petroleum hydrocarbons records in sediment cores from the north east coast of Tamilnadu, Bay of Bengal, India. Mar. Pollut. Bull., 62, 681690.
Yang P., Yang M. and Shao H., 2012. Magnetic susceptibility and heavy metals distribution from risk-cultivated soil around the iron-steel plant, China. Clean-Soil Air Water, 40, 615618.
Zhang W., Appel E., Fang X.M., Yan M.D., Song C.H. and Cao L.W., 2012. Paleoclimatic implications of magnetic susceptibility in Late Pliocene-Quaternary sediments from deep drilling core SG-1 in the western Qaidam Basin (NE Tibetan Plateau), J. Geophys. Res., 117, B06101, DOI: 10.1029/2011JB008949.


