Embed Size (px)
Citation preview

www.elsevier.com/locate/foodchem
Food Chemistry 100 (2007) 1639–1648
FoodChemistry
Effect of increasing amounts of a linoleic-rich dietary fat on thefat composition of four pig breeds. Part II: Fatty acid
composition in muscle and fat tissues
J.V. Pascual a, M. Rafecas a, M.A. Canela b, J. Boatella a,R. Bou a, A.C. Barroeta c, R. Codony a,*
a Department of Nutrition and Food Science-CeRTA, Faculty of Pharmacy, University of Barcelona, Av. Joan XXIII s/n, 08028 Barcelona, Spainb Department of Applied Mathematics and Analysis, University of Barcelona, Gran Via Corts Catalanes 585, 08007 Barcelona, Spain
c Department of Nutrition and Animal Feeding, Faculty of Veterinary, Universitat Autonoma of Barcelona, 08193 Bellaterra-Cerdanyola, Spain
Received 22 November 2005; received in revised form 15 December 2005; accepted 15 December 2005
Abstract
This paper studies the change of fatty acid profile in four different tissues of the pig (backfat, abdominal fat, and the muscles trapezius
and longissimus thoracis et lumborum) in response to four diets containing increasing amounts (0%, 2%, 4% and 8%) of a high linoleic acidfat blend, in a sample of 48 pigs of four different breeds (Landrace, Large White, Duroc and a crossbreed Landrace · Duroc). The effectsof dietary fat and breed on this profile have been separately tested for each tissue. The diet effect (increasing % of linoleic acid intake) waspositive on linoleic acid deposit in all tissues, meanwhile it was negative on palmitic and stearic levels, as well as for the oleic acid. How-ever, this effect was clear in the four tissues for the linoleic acid, while the differences did not follow the same pattern for the saturatedfatty acids in trapezius muscle and abdominal fat. Although the levels of arachidonic acid in muscle tissues were higher than those foundin adipose tissues, the increasing effect of the diet was stronger, in relative terms, in adipose tissues. The breed effect was, in general, lowerthan the diet effect. Landrace showed the higher ability to increase linoleic acid levels, particularly in the loin (longissimus thoracis et
lumborum), whereas Duroc pigs seemed to be the most resistant to change of fatty acid composition according to the diet.� 2006 Elsevier Ltd. All rights reserved.
Keywords: Pig tissues; Fatty acids; Dietary fat; Breed; Metabolic markers
1. Introduction
The fatty acid (FA) composition and the total amountof saturated fatty acids (SFA) have been identified as die-tary risk factors, related to cardiovascular diseases (Katan,Zock, & Mensink, 1994). In the developed countries, ani-mal fats contribute substantially to the total fat intake
0308-8146/$ - see front matter � 2006 Elsevier Ltd. All rights reserved.
doi:10.1016/j.foodchem.2005.12.045
Abbreviations: FA, fatty acids; SFA, saturated fatty acids; MUFA,
monounsaturated fatty acids; PUFA, polyunsaturated fatty acids; EPA,
eicosapentaenoic acid; DHA, docosahexaenoic acid; FAME, fatty acid
methyl esters; LW, Large White; D, Duroc; L, Landrace; F1, crossbreed
Landrace · Duroc; LTL, longissimus thoracis et lumborum.* Corresponding author. Tel.: +34 934024514; fax: +34 934035931.
E-mail address: [email protected] (R. Codony).
and are the major sources of SFA. However, the composi-tions of these animal fats (i.e., pork tissues’ fat) can bemodified by the nature of feeding fat, which can affect theirmetabolic pathways in different ways. For example, whenpigs have a restricted feeding (low energy), fat synthesis isreduced and the muscular lean production is enhanced(Henry, 1977). It is also known that, under isocaloric con-ditions, the fat added to animal feed can induce a diminu-tion of endogenous fat synthesis, probably due to a parallelreduction of carbohydrates utilization, which is the mainsource of the lipogenesis (Allee, Baker, & Leveille, 1971;Enser, 1984). It seems that this affects only the endogenoussynthesis, but not the total amount of fat, which is mainlydue to the diet. Besides, the dietary FA profile seems toaffect the metabolic pathways. In this sense, an increase

Table 1Ingredients and composition, including FA, of the four experimental diets
Diet 1 Diet 2 Diet 3 Diet 4
Ingredients (g/100 g)
Wheat 61.86 48.06 27.76 10.00Barley 20.00 25.00 34.00 45.94Wheat bran 3.00 5.12 15.00 15.0047% soy meal 9.50 14.50 13.94 15.4450% meat meal 2.00 2.00 2.00 2.00Added fata 0.00 2.00 4.00 8.00Salt 0.50 0.50 0.50 0.58Calcium carbonate 0.88 0.78 0.74 0.94Bicalcium carbonate 1.10 1.16 1.20 1.2878% methionine 0.04 0.02 0.02 0.0178% lysine 0.40 0.24 0.22 0.18Vit-mineral premix 0.07 0.07 0.63 0.63
Composition (g/100 g)
Digestible energyb (kcal/kg) 3579 3579 3579 3734Dry matter 88.48 88.82 89.51 90.55Crude protein 16.4 17.5 17.9 17.5Ash 4.78 5.56 6.18 6.88Ether extract 2.71 4.34 7.35 10.56Crude fibre 3.50 3.40 4.26 4.17
Fatty acids (mg/100 g)
C14:0 16 38 66 133C16:0 334 668 946 1729C18:0 101 286 470 848C16:1 n � 7 12 36 59 128C18:1 n � 9 cis 392 917 1454 2575C18:1 transc 18 61 105 202C18:2 n � 6 897 1526 2140 3208C20:4 n � 6 2 4 5 12C18:3 n � 3 79 117 189 199C20:5 n � 3 5 11 13 25
a 50% acid oil (soy and sunflower) and 50% animal fat.b Estimated values.c Total C18:1 trans isomers.
1640 J.V. Pascual et al. / Food Chemistry 100 (2007) 1639–1648
of unsaturated and long chain FA can reduce the lipogen-esis enzymatic activity (Mourot, Aumaitre, Mounier, Pei-niau, & Francois, 1994). Finally, the enzyme regulationmechanisms in the pig for the desaturases and the elongasesare not well known, even though their activities are crucialfor FA tissue composition. D-9 desaturase activities can bemodulated by the dietary FA composition, so a diet rich inSFA can enhance these activities, whereas one rich in oleicacid (Klingenberg, Knabe, & Smith, 1995) or in PUFA(Kouba, Enser, Whittington, Nute, & Wood, 2003) candecrease them. There are several papers dealing with theeffects of dietary fats on the FA composition of pork adi-pose and muscle tissues, and with the interactions betweenthese effects and other factors, such as breed and feedenergy level (Averette Gatlin, See, Hansen, Sutton, & Odle,2002; Bee, Geert, & Messikommer, 2002; Eder, Nonn, &Kluge, 2001; Fontanillas, Barroeta, Baucells, & Codony,1997; Wood, Buxton, Whittington, & Enser, 1986). Someauthors (Ahn, Lutz, & Sim, 1996; Eder et al., 2001; Schee-der, Glaser, Eichenberger, & Wenk, 2000) have observedthat increasing the linoleic acid in the diet leads to a highercontent of linoleic acid in the loin, but not to a significantincrease in arachidonic acid. Fewer data are available onthe parallel increase of linoleic and arachidonic acids infat tissues in response to increased linoleic acid in the diet(D’Arrigo et al., 2002). Other authors have also attemptedto study a nutritional model of the FA distribution withinpig tissues (Lizardo, van Milgen, Mourot, Noblet, & Bon-neau, 2002). Such a model described the interactionsbetween dietetic FA intake and the different lipid metabolicpathways. Moreover, this study concluded that the avail-able models for predicting the FA composition of pork tis-sues were still too simple, and more knowledge is neededwith regard to some metabolic processes. These authorscalled for studies that might provide more informationon FA composition, taking into account different factorsto improve the accuracy of the predictions. We have exam-ined, in this paper, the effect of the addition of increasingamounts of a polyunsaturated fat in the diet on the FAcomposition of muscle and adipose tissues of pork. We alsoassess the differences between various breeds related tothese dietary changes. This information could be of greatinterest from a productive point of view, and could be usedfor enhancing some aspects of pork fat quality.
2. Materials and methods
2.1. Samples and experimental design
The experimental work was based on a 4 · 4 completefactorial design of two factors, diet and breed, with fourlevels per factor. The sample size was 48, with three ani-mals for each of the 16 diet–breed combinations. Cas-trated male pigs of four breeds were used: Large White,Duroc, Landrace and a commercial crossbreed Land-race · Duroc (F1). Animals of each breed were distributeduniformly according to their weight and original litter
(avoiding littermates inside the same group) and theywere fed a conventional adaptation diet during a 7-d per-iod, before the start of the experiment. The control ani-mal feeding (diet 1) was a mixture whose mainingredients were wheat, barley and soya meal. The threeother diets were obtained by adding increasing amountsof fat as follows: 2%, 4% and 8%, respectively, for diets2, 3 and 4. The fat added to the feed was a commercialmixture of 50% of a soy/sunflower acid oil and 50% ofanimal fat. Diets were formulated to achieve minimal dif-ferences in energy and protein content. A completedescription of the ingredients and the composition ofthe four diets is given in Table 1. The experiment was car-ried out under controlled conditions of temperature, light,and ventilation. Animals were given ad libitum access tofeed throughout the experiment, and animal weight andfeed consumption were recorded each 15 days, until theend of the experiment. Also, daily feed intake (kg feed/day), average daily gain (kg live weight/day) and feed con-
version ratio were calculated. After slaughter, which tookplace at a live weight of 85–90 kg, the following carcassmeasurements were taken: carcass weight, carcass yield,

J.V. Pascual et al. / Food Chemistry 100 (2007) 1639–1648 1641
backfat thickness measured at the 4th and last ribs (Fat-O-Meter, SFK Ltd., Denmark), and percentage of lean,calculated as proposed by Oliver, Gispert, Tibau, andDiestre (1991). After slaughter, samples of four tissueswere taken from each subject: two adipose tissues, backfatand abdominal fat, and two muscle tissues, longissimusthoracis et lumborum (muscle LTL) and trapezius. Backfatand longissimus samples were taken at the level of the10th rib. Samples were then vacuum stored in plasticbags, frozen and kept at �20 �C, until analysis.
2.2. Reagents
All solvents were ACS grade. Chloroform, methanoland diethyl ether were from Panreac (Montplet & Esteban,Barcelona, Spain) and n-hexane from E. Merck (Darms-tadt, Germany). The other reagents were anhydroussodium sulphate and sodium chloride (both for analysis)from Panreac and sodium (for synthesis), phenolphthalein(ACS) and boron trifluoride in methanol (14% p/v for syn-thesis) from E. Merck. All the standards of fatty acidmethyl esters (FAME) were supplied by Sigma ChemicalCo. (St. Louis, MO), except the dodecanoic acid methylester from Altech Associates Inc. (Deerfield, IL). A mixtureof some FAME (PUFA-2) was supplied by Supelco Inc.(Bellefonte, PA). Except for the C20:2 n � 6 methyl ester(98%), all the standards were of 99% purity.
2.3. Fatty acids determination
Lipids were obtained by extraction, following themethod of Folch, Lees, and Stanley (1957), but with afew modifications. Five gramme of muscle tissue or 0.5 gof adipose tissue were weighed and homogenised with30 ml of chloroform/methanol mixture (2:1 v/v) by usinga Polytron (PT 2000, Kinematica AG, Lucerne, Switzer-land), at 20,000 rpm, during 30 s. The solid residue wasre-extracted with 30 ml of the solvent mixture, and thecombined organic fractions were washed with a NaClaqueous solution (0.58%). The chloroform phase was thenfiltered through anhydrous sodium sulphate and evapo-rated to dryness. The fatty acids were determined in thisfat extract according to the method proposed by Guardi-ola, Codony, Rafecas, Boatella, and Lopez (1994), byobtaining their methyl esters (FAME) and by gas chro-
Table 2Classification of fatty acids in the pork as markers of different metabolic proc
Effect
Markers of dietary supply
Markers of the de novo synthesisMarkers of the D-9 desaturase activityMarkers of the D-6 desaturase activityMarkers of competition for the D-9 desaturaseMarkers of competition for the D-6 desaturase
between n � 3 and n � 6 PUFA
matographic analysis. The FA were quantified by applyingrelative response factors and the results were expressed ascompensated area normalisation. The repeatability andintermediate precision of the FA analysis were evaluated.In the repeatability assessment, six aliquots of a samplewere extracted, and their FAME were injected in triplicateon the same day, following the design: 1 day · 6 sam-ples · 3 replicates. In the intermediate precision determina-tion, 12 aliquots of a sample were used, following thedesign: 4 days · 3 samples · 3 replicates. The repeatabilityand intermediate precision estimates for the six selectedFA, expressed as % RSD (relative standard deviations inpercentage scale) ranged between 0.89% and 7.18% forthe repeatability, and between 0.52% and 6.73% for theintermediate precision. Values were similar for muscleand adipose tissues. For the non-reported FA, the resultswere similar.
2.4. Selection of FA markers
For this purpose, we classified the FA according to theiraccumulation pattern in different tissues, which allowed usto reduce the number of variables to be studied. So, in thisstudy, we determined 22 FA in all tissues, but the presenta-tion of the results is restricted to six selected FA (a-linoleic,palmitic, oleic, arachidonic, palmitoleic and eicosatrienoicacids). A previous study on these samples (Pascual,2000), based on correlations and on principal componentsanalysis, showed that the rest of the FA are highly corre-lated to one of the six markers. The six FA selected are suf-ficient to understand the effects of the diet on FA profile,and the strong correlations observed support the extrapola-tion to the rest of FA. Table 2 summarises the classificationof the 22 FA, based on these correlations. The first groupof FA showed a deposit from a dietary origin, not fromendogenous metabolism, and it consisted of the n � 3 andn � 6 PUFA located at the head of these two series, thetrans FA, C15:0 and C16:1 n � 9. From this group weselected linoleic acid (C18:2 n � 6), as it shows the highestlevel in all tissues. This is due to the composition of the fatadded to the feed. If a fat rich in n � 3 PUFA were to beadded to the feed, then C18:3 n � 3 would also be usefulas a marker of this group. And if a hydrogenated fat or tal-low were used in feed, then trans C18: isomers could also begood markers. The second group consists of FA whose
esses (bold letters indicates the markers selected)
Fatty acid markers
C18:2 n � 6, C18:3 n � 6, C20:2 n � 6C18:3 n � 3, C18:1 n � 9 trans, C18:2 n � 6 trans, C15:0, C16:1 n � 9C16:0, C18:0, C20:0, C20:1 n � 9C18:1 n � 9
C20:4 n � 6, C20:5 n � 3, C22:5 n � 3C16:1 n � 7, C18:1 n � 7, C10:0, C12:0, C14:0C20:3 n � 3
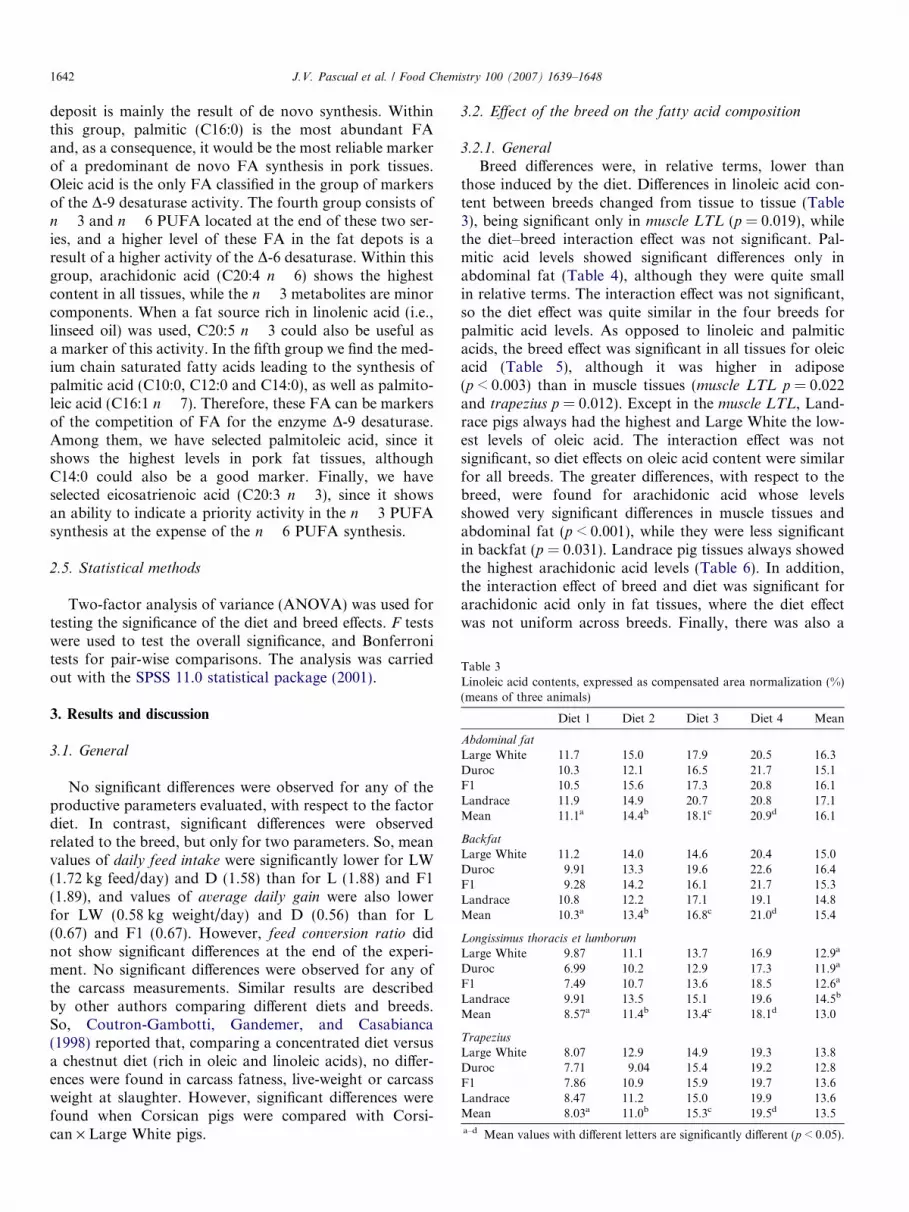
Table 3Linoleic acid contents, expressed as compensated area normalization (%)(means of three animals)
Diet 1 Diet 2 Diet 3 Diet 4 Mean
Abdominal fat
Large White 11.7 15.0 17.9 20.5 16.3Duroc 10.3 12.1 16.5 21.7 15.1F1 10.5 15.6 17.3 20.8 16.1Landrace 11.9 14.9 20.7 20.8 17.1Mean 11.1a 14.4b 18.1c 20.9d 16.1
Backfat
Large White 11.2 14.0 14.6 20.4 15.0Duroc 9.91 13.3 19.6 22.6 16.4F1 9.28 14.2 16.1 21.7 15.3Landrace 10.8 12.2 17.1 19.1 14.8Mean 10.3a 13.4b 16.8c 21.0d 15.4
Longissimus thoracis et lumborum
Large White 9.87 11.1 13.7 16.9 12.9a
Duroc 6.99 10.2 12.9 17.3 11.9a
F1 7.49 10.7 13.6 18.5 12.6a
Landrace 9.91 13.5 15.1 19.6 14.5b
Mean 8.57a 11.4b 13.4c 18.1d 13.0
Trapezius
Large White 8.07 12.9 14.9 19.3 13.8Duroc 7.71 9.04 15.4 19.2 12.8F1 7.86 10.9 15.9 19.7 13.6Landrace 8.47 11.2 15.0 19.9 13.6Mean 8.03a 11.0b 15.3c 19.5d 13.5
a–d Mean values with different letters are significantly different (p < 0.05).
1642 J.V. Pascual et al. / Food Chemistry 100 (2007) 1639–1648
deposit is mainly the result of de novo synthesis. Withinthis group, palmitic (C16:0) is the most abundant FAand, as a consequence, it would be the most reliable markerof a predominant de novo FA synthesis in pork tissues.Oleic acid is the only FA classified in the group of markersof the D-9 desaturase activity. The fourth group consists ofn � 3 and n � 6 PUFA located at the end of these two ser-ies, and a higher level of these FA in the fat depots is aresult of a higher activity of the D-6 desaturase. Within thisgroup, arachidonic acid (C20:4 n � 6) shows the highestcontent in all tissues, while the n � 3 metabolites are minorcomponents. When a fat source rich in linolenic acid (i.e.,linseed oil) was used, C20:5 n � 3 could also be useful asa marker of this activity. In the fifth group we find the med-ium chain saturated fatty acids leading to the synthesis ofpalmitic acid (C10:0, C12:0 and C14:0), as well as palmito-leic acid (C16:1 n � 7). Therefore, these FA can be markersof the competition of FA for the enzyme D-9 desaturase.Among them, we have selected palmitoleic acid, since itshows the highest levels in pork fat tissues, althoughC14:0 could also be a good marker. Finally, we haveselected eicosatrienoic acid (C20:3 n � 3), since it showsan ability to indicate a priority activity in the n � 3 PUFAsynthesis at the expense of the n � 6 PUFA synthesis.
2.5. Statistical methods
Two-factor analysis of variance (ANOVA) was used fortesting the significance of the diet and breed effects. F testswere used to test the overall significance, and Bonferronitests for pair-wise comparisons. The analysis was carriedout with the SPSS 11.0 statistical package (2001).
3. Results and discussion
3.1. General
No significant differences were observed for any of theproductive parameters evaluated, with respect to the factordiet. In contrast, significant differences were observedrelated to the breed, but only for two parameters. So, meanvalues of daily feed intake were significantly lower for LW(1.72 kg feed/day) and D (1.58) than for L (1.88) and F1(1.89), and values of average daily gain were also lowerfor LW (0.58 kg weight/day) and D (0.56) than for L(0.67) and F1 (0.67). However, feed conversion ratio didnot show significant differences at the end of the experi-ment. No significant differences were observed for any ofthe carcass measurements. Similar results are describedby other authors comparing different diets and breeds.So, Coutron-Gambotti, Gandemer, and Casabianca(1998) reported that, comparing a concentrated diet versusa chestnut diet (rich in oleic and linoleic acids), no differ-ences were found in carcass fatness, live-weight or carcassweight at slaughter. However, significant differences werefound when Corsican pigs were compared with Corsi-can · Large White pigs.
3.2. Effect of the breed on the fatty acid composition
3.2.1. General
Breed differences were, in relative terms, lower thanthose induced by the diet. Differences in linoleic acid con-tent between breeds changed from tissue to tissue (Table3), being significant only in muscle LTL (p = 0.019), whilethe diet–breed interaction effect was not significant. Pal-mitic acid levels showed significant differences only inabdominal fat (Table 4), although they were quite smallin relative terms. The interaction effect was not significant,so the diet effect was quite similar in the four breeds forpalmitic acid levels. As opposed to linoleic and palmiticacids, the breed effect was significant in all tissues for oleicacid (Table 5), although it was higher in adipose(p < 0.003) than in muscle tissues (muscle LTL p = 0.022and trapezius p = 0.012). Except in the muscle LTL, Land-race pigs always had the highest and Large White the low-est levels of oleic acid. The interaction effect was notsignificant, so diet effects on oleic acid content were similarfor all breeds. The greater differences, with respect to thebreed, were found for arachidonic acid whose levelsshowed very significant differences in muscle tissues andabdominal fat (p < 0.001), while they were less significantin backfat (p = 0.031). Landrace pig tissues always showedthe highest arachidonic acid levels (Table 6). In addition,the interaction effect of breed and diet was significant forarachidonic acid only in fat tissues, where the diet effectwas not uniform across breeds. Finally, there was also a

Table 5Oleic acid contents, expressed as compensated area normalization (%)(means of three animals)
Diet 1 Diet 2 Diet 3 Diet 4 Mean
Abdominal fat
Large White 34.2 34.2 32.9 33.4 33.7a
Duroc 35.7 33.9 35.2 33.5 34.6a
F1 36.4 34.1 33.9 34.5 34.7a
Landrace 38.6 37.4 35.7 35.1 36.7b
Mean 36.2 34.9 34.4 34.1 34.9
Backfat
Large White 37.7 37.2 37.2 36.3 37.1a
Duroc 38.7 38.5 36.6 35.8 37.4a
F1 41.0 37.7 36.8 34.8 37.6a
Landrace 39.6 40.1 38.7 39.4 39.4b
Mean 39.2c 38.4bc 37.3ab 36.6a 37.9
Longissimus thoracis et lumborum
Large White 38.3 38.3 36.6 35.8 37.2ab
Duroc 41.9 39.4 37.6 38.1 39.3c
F1 41.8 39.4 37.8 35.4 38.6bc
Landrace 39.1 37.6 37.5 33.7 37.0a
Mean 40.3c 38.7b 37.4b 35.8a 38.0
Trapezius
Large White 38.8 37.2 36.2 35.8 37.0a
Duroc 41.5 39.9 36.6 35.7 38.4ab
F1 42.5 39.2 37.1 35.1 38.5ab
Landrace 41.3 40.2 39.7 36.1 39.3b
Mean 41.0d 39.1c 37.4b 35.7a 38.3
a–d Mean values with different letters are significantly different (p < 0.05).
Table 4Palmitic acid contents, expressed as compensated area normalization (%)(means of three animals)
Diet 1 Diet 2 Diet 3 Diet 4 Mean
Abdominal fat
Large White 26.2 24.0 23.3 20.9 23.6b
Duroc 26.8 26.0 23.6 20.9 24.3b
F1 25.9 24.1 23.4 20.9 23.5b
Landrace 24.8 23.0 20.2 20.6 22.2a
Mean 25.9d 24.3c 22.6b 20.8a 23.4
Backfat
Large White 24.4 22.6 23.4 19.6 22.5Duroc 25.5 23.3 21.5 19.1 22.4F1 24.5 23.0 22.3 20.1 22.4Landrace 24.1 22.7 20.7 19.5 21.7Mean 24.6c 22.9b 21.9b 19.6a 22.3
Longissimus thoracis et lumborum
Large White 24.3 23.3 22.9 21.3 22.9Duroc 24.3 23.4 23.3 20.3 22.8F1 24.2 23.5 22.6 20.7 22.8Landrace 24.0 21.8 21.3 20.8 22.0Mean 24.2c 23.0b 22.5b 20.8a 22.6
Trapezius
Large White 24.6 22.4 22.5 19.8 22.3Duroc 24.0 23.9 22.4 20.1 22.6F1 23.5 23.2 21.4 19.9 22Landrace 23.5 22.1 20.2 19.4 21.3Mean 23.9d 22.9c 21.6b 19.8a 22.0
a–d Mean values with different letters are significantly different (p < 0.05).
J.V. Pascual et al. / Food Chemistry 100 (2007) 1639–1648 1643
very significant breed effect on the palmitoleic acid level(p < 0.01) in all tissues, except in trapezius muscle whereit was less significant (p = 0.044), while the interactioneffect was not significant for this FA. For palmitoleic acid,the higher levels were found in muscle tissues and in theDuroc breed (Table 7). Eicosatrienoic acid levels showedsignificant differences only in backfat related to the breed.The most relevant characteristics of each breed, related tothe modification of the FA composition according to a lin-oleic acid-rich diet, can be further categorised.
3.2.2. Large White
Results corresponding to this breed show a good abilityto change their FA composition in different tissues, accord-ing to increasing % on intake of this FA. But LW pigsshowed very small differences with respect to the otherthree breeds. Palmitic, palmitoleic and oleic acid levelsshowed no relevant differences. Only arachidonic acid lev-els showed small differences, which can be summarised in asignificant lower level in backfat with respect to the otherthree breeds, and in abdominal fat with respect to LDand F1.
3.2.3. F1 crossbreed
No relevant linoleic acid differences were observed forF1 pigs, while some interesting differences were noted forarachidonic acid. So, significantly higher levels wereobserved in adipose tissues with respect to the other threebreeds, while significantly lower levels in muscle tissues
Table 6Arachidonic acid contents, expressed as compensated area normalization(%) (means of three animals)
Diet 1 Diet 2 Diet 3 Diet 4 Mean
Abdominal fat
Large White 0.22 0.23 0.29 0.37 0.28a
Duroc 0.18 0.21 0.3 0.39 0.27a
F1 0.2 0.3 0.28 0.43 0.30b
Landrace 0.25 0.3 0.39 0.38 0.33c
Mean 0.21a 0.26b 0.32c 0.39d 0.29
Backfat
Large White 0.19 0.23 0.25 0.31 0.24a
Duroc 0.18 0.22 0.35 0.38 0.28b
F1 0.18 0.26 0.26 0.44 0.29b
Landrace 0.22 0.24 0.32 0.35 0.28b
Mean 0.19a 0.24b 0.29c 0.37d 0.27
Longissimus thoracis et lumborum
Large White 1.32 1.42 1.21 1.7 1.41a
Duroc 0.69 0.84 1.22 1.31 1.02a
F1 0.98 1.17 1.07 1.4 1.15a
Landrace 1.51 2.15 1.75 2.7 2.03b
Mean 1.12a 1.39ab 1.31a 1.78b 1.4
Trapezius
Large White 0.54 0.98 0.9 1.04 0.86a
Duroc 0.61 0.6 0.75 1 0.74a
F1 0.57 0.95 0.78 1.02 0.83a
Landrace 1.07 1.18 1.33 1.04 1.15b
Mean 0.69a 0.92b 0.94b 1.03b 0.9
a–d Mean values with different letters are significantly different (p < 0.05).

Table 7Palmitoleic acid contents, expressed as compensated area normalization(%) (means of three animals)
Diet 1 Diet 2 Diet 3 Diet 4 Mean
Abdominal fat
Large White 2.09 1.7 1.68 1.49 1.76a
Duroc 2.31 2.14 2.3 1.83 2.15c
F1 1.93 1.78 1.7 1.9 1.82ab
Landrace 2.36 2.11 1.83 1.71 2.00bc
Mean 2.17b 1.93a 1.88a 1.73a 1.93
Backfat
Large White 2.04 1.71 1.91 1.48 1.79a
Duroc 2.21 2.32 2.29 1.72 2.15b
F1 2.04 1.87 1.67 1.79 1.84a
Landrace 1.97 2 1.76 1.87 1.90a
Mean 2.07b 1.97b 1.91ab 1.73a 1.92
Longissimus thoracis et lumborum
Large White 2.52 2.36 2.51 2.18 2.38a
Duroc 3.13 2.77 3.24 2.38 2.88b
F1 2.89 2.28 2.31 2.09 2.48a
Landrace 2.67 2.36 2.29 2.48 2.45a
Mean 2.79b 2.54b 2.58ab 2.28a 2.55
Trapezius
Large White 2.32 1.94 2.15 1.89 2.08Duroc 2.61 2.57 2.43 1.91 2.38F1 2.39 2.2 1.9 1.78 2.07Landrace 2.45 2.16 2.07 1.91 2.15Mean 2.44c 2.22bc 2.14b 1.87a 2.17
a–d Mean values with different letters are significantly different (p < 0.05).
1644 J.V. Pascual et al. / Food Chemistry 100 (2007) 1639–1648
were only found with respect to LD pigs. This differencessuggest a clear different activation pattern of the D-6 desat-urase, depending on the type of tissue. More complex is theanalysis of the differences for palmitoleic and oleic acids,but in general there is not a particular pattern for F1 pigs.
3.2.4. Landrace
Pigs of this breed only showed linoleic acid differences inthe loin (muscle LTL), where the levels of these FA are sig-nificantly higher than those of the other three breeds(p = 0,019). Also, Landrace pigs showed arachidonic acidlevels much higher in muscle tissues than LW, D and F1pigs, while differences in adipose tissues were minimumor zero with respect to the other breeds. In contrast, levelsof the other FA markers were scarcely different withrespect to the other breeds. So, palmitic acid showed onlysignificantly lower levels for Landrace pigs in the abdomi-nal fat, but not in the other three tissues. Moreover, oleicacid levels, corresponding to Landrace pigs, were similarto those of LW in muscle LTL, and similar to those of Dand F1 in trapezius. Palmitoleic acid levels in Landracewere only significantly higher than those of LW in abdom-inal fat, and significantly lower than those of Duroc inbackfat and muscle LTL.
3.2.5. Duroc
In contrast to the results corresponding to the otherthree breeds, the FA profile of Duroc pigs seemed to bethe least affected by the fat content of the diet. This breed
showed only particular differences for oleic acid levels inloin, which were significantly higher levels than in LWand LD pigs, but similar to F1 pigs. Duroc pigs alsoshowed significantly higher levels of palmitoleic acid inbackfat and loin, with respect to the other breeds. Thesedifferences suggest a lower inhibition of the D-9 desaturasein Duroc, with respect to the other breeds, when linoleic-rich fat was added to the feed.
Our results agree with those reported by some authors,who also observed that D pigs showed a lower capacity todeposit linoleic acid when increasing amounts of polyunsat-urated fats were added to the feed (Wood et al., 1996). Mostof the works dealing with breed differences in pork FA com-position show that D carcasses are less polyunsaturatedthan those of L (Cameron & Enser, 1991), those of Land-race crossbreeds (Honkavaara, 1989), and those of LW(Bout, Girard, Sellier, & Runavot, 1990). Only Cameron,Warris, Porter, and Enser (1990) found that L backfatwas more polyunsaturated than D, at the expense of stearicacid levels. The fact that muscle LTL shows a lower linoleicacid accumulation rate than the corresponding backfat wasalso reported by some authors in D carcasses (Bout et al.,1990; Cameron et al., 1990). This could be explained bythe results reported in a study (van Laack & Spencer,1999), showing that D pigs have lower PUFA deposits inthe muscle phospholipid fraction than other breeds fedidentical diets. However, all of this effects cannot be takenas a whole, since the type of experimental diet can changesome patterns of increase or decrease of certain FA. So,we now consider the influence of the factor diet (% increaseof the linoleic acid supply) on the FA composition in muscleand adipose tissues, focusing on the FA markers selected.
3.3. Effect of the diet on the fatty acid composition
3.3.1. General
The results for fatty acid composition in the four tissuesare shown in Tables 3–8. FA content is expressed as meanvalues. We do not report the usual measures of dispersion,which have been used in testing the significance of the dietand breed effects, in order to simplify the Tables. As a glo-bal conclusion, the diet effect can be seen as a shift towardthe FA of the dietary supply. The increase in the levels ofthis group (represented by linoleic acid in this paper) andin the levels of those FA metabolised from them, repre-sented here by arachidonic acid, must be compensatedmainly by a decrease in palmitic, stearic and oleic acids.However, these differences seem to be tissue-dependent.Therefore, palmitic and stearic levels significantlydecreased in all tissues when linoleic acid levels increased,but oleic acid levels showed only a clear decrease in muscletissues, a slight decrease in backfat, and no significant dif-ferences in abdominal fat. The most notable pattern ofdeposit corresponded to arachidonic acid (Table 6), indi-cating a higher dietary linoleic effect on the D-6 desaturaseactivity in fat tissues than in muscle tissues, although levelswere much higher in muscle than in adipose tissues.

Table 8Eicosatrienoic acid contents, expressed as compensated area normaliza-tion (%) (means of three animals)
Diet 1 Diet 2 Diet 3 Diet 4 Mean
Abdominal fat
Large White 0.12 0.13 0.14 0.13 0.13Duroc 0.12 0.12 0.13 0.12 0.12F1 0.11 0.13 0.13 0.10 0.12Landrace 0.11 0.11 0.14 0.11 0.12Mean 0.12a 0.12ab 0.14b 0.12a 0.12
Backfat
Large White 0.14 0.15 0.14 0.15 0.14bc
Duroc 0.13 0.15 0.17 0.15 0.15c
F1 0.11 0.13 0.16 0.12 0.13ab
Landrace 0.12 0.11 0.14 0.13 0.13a
Mean 0.13a 0.14ab 0.15b 0.13a 0.14
Longissimus thoracis et lumborum
Large White 0.11 0.11 0.12 0.10 0.11Duroc 0.09 0.10 0.11 0.11 0.10F1 0.08 0.10 0.12 0.10 0.10Landrace 0.08 0.09 0.11 0.11 0.10Mean 0.09 0.10 0.11 0.10 0.10
Trapezius
Large White 0.11 0.14 0.15 0.14 0.13Duroc 0.10 0.11 0.15 0.13 0.12F1 0.09 0.11 0.15 0.12 0.12Landrace 0.10 0.09 0.12 0.14 0.11Mean 0.10a 0.11a 0.14b 0.13b 0.12
a–d Mean values with different letters are significantly different (p < 0.05).
J.V. Pascual et al. / Food Chemistry 100 (2007) 1639–1648 1645
3.3.2. Linoleic acid content
A large positive diet effect was evident (about a 100%increase in relative terms) for linoleic acid in the four tis-sues (p < 0.001). All the pair-wise comparisons betweendiets gave significant differences (Table 3). The linoleic acidlevels were higher in fat than in muscle tissues, but the rateof increase from diet to diet was similar in both types of tis-sue. These effects can be extrapolated to a group of FAhaving a high correlation with linoleic acid in the four tis-sues, which are C15:0 (minimum correlation 0.760 in mus-
cle LTL, and maximum 0.934 in trapezius), C16:1 n � 9(min. 0.756 in muscle LTL, and max. 0.809 in backfat),C18:1 n � 9 trans (min. 0.874 in muscle LTL, and max.0.942 in trapezius), C18:2 n � 6 trans (min. 0.819 in abdom-inal fat, and max. 0.921 in trapezius), C18:3 n � 3 (min.0.640 in muscle LTL, and max. 0.838 in backfat), C18:3n � 6 (min. 0.786 in muscle LTL, and max. 0.936 in trape-
zius) and C20:2 n � 6 (min. 0.820 in muscle LTL, and max.0.927 in trapezius). Our results, showing linoleic acid as agood marker of the influence of the dietary fat agree withthose found in other studies (Irie & Sakimoto, 1992; Mor-gan, Noble, Cocchi, & McCartney, 1992; Wiseman, Red-shaw, Jagger, Nute, & Wood, 2000), with diets rich inlinoleic, linolenic, and long chain PUFA (EPA andDHA, in fish oil diets). In all cases, a high positive correla-tion existed between levels in the diet and levels in fat andmuscle tissues for these FA, usually at the expense of pal-mitic and oleic levels in these tissues. In contrast, someauthors (Cava et al., 1997; Coutron-Gambotti et al.,
1998) found, in Iberian pigs and Corsican pigs respectively,that ‘‘montanera’’ diets (based on acorns) and chestnutdiets, both rich in oleic acid, led to higher linoleic depositsin intramuscular fats than other diets containing more lin-oleic acid. These authors propose that rustic breeds maypossess a different lipid metabolism, from commercialbreeds which are genetically more fatty.
3.3.3. Palmitic acid content
In contrast, the diet effect for palmitic acid was negative(about a 25% of decrease in relative terms, between diet 1and 4), but weaker than the positive effect for linoleic acid,.The overall significance level was less than 0.001 in all tis-sues, but the diet effect was slightly stronger in the adiposethan in the muscle tissue (Table 4). However, only inabdominal fat and muscle trapezius were the differences sig-nificant for the four tissues. In contrast, in backfat andmuscle LTL, diets 2 and 3 gave no differences in palmiticacid levels. The majority of remarks made for palmitic alsoapply to stearic acid, since their levels were well correlatedin all tissues (0.70–0.75). Other studies, which yielded sim-ilar conclusions for linoleic and linolenic acids, did not findsignificant decreases in palmitic acid (Averette Gatlin et al.,2002; Cherian & Sim, 1995; Warnants, Van Oeckel, & Bou-cque, 1999). However, the variety of experimental designsand dietary treatments tested in those studies should betaken into account, since they show the additional influ-ence of other dietary factors. The level of energy of feed,the simultaneous presence of high linoleic and linolenicacid levels, and the length of the treatment were able tomodify the rate of incorporation of linoleic, linolenic andpalmitic acids into pig tissues.
3.3.4. Oleic acid content
The diet effect on oleic acid tissue content was also neg-ative, showing a decrease between 2 and 5 points, which isstronger and more significant in muscle tissues (p < 0.001)than in backfat (p = 0.008), while for abdominal fat therewas no significant differences (Table 5). An interestingeffect is that oleic acid levels were higher in muscle thanin adipose tissues when there was no fat added to the feed(diet 1), but this pattern was changed by the diet, so thatthe differences between the tissues were reduced when theamount of added dietary fat increased. In contrast, otherstudies, working with diets rich in PUFA, did not find sig-nificant decreases in oleic acid levels (Bee et al., 2002; Bry-hni, Kjos, Ofstad, & Hunt, 2002; Enser, Richardson,Wood, Gill, & Sheard, 2000; Øverland, Taugbøl, Haug,& Sundstøl, 1996).
3.3.5. Arachidonic acid content
Arachidonic acid content in the four tissues increased asa function of the fat enrichment of the diets, more than50% in relative terms (Table 6). But, whereas in adipose tis-sues the pattern of increase was the same as for the linoleicacid, an unclear fluctuating pattern appeared in muscle tis-sues, where the level of arachidonic acid was much higher.

1646 J.V. Pascual et al. / Food Chemistry 100 (2007) 1639–1648
The overall significance level for the diet effect wasp < 0.001 in fat tissues and around p = 0.03 in muscle tis-sues. Except for muscle tissues, due to the fluctuationsmentioned above, all the pair-wise comparisons amongdiets showed significant differences. In muscle LTL, onlydiet 4 showed significantly higher values of arachidonicacid whereas, in trapezius, only diet 1 showed significantlylower values. These effects can be extrapolated, at least, toC22:5 n � 3, since the correlation between its levels andthose of arachidonic acid range from 0.59 in abdominalfat to 0.86 in muscle LTL. Table 6 shows very clear differ-ences in arachidonic acid content in the four tissues and thepattern of variation of the arachidonic acid depositbetween the different muscles was clearly related to the lin-oleic acid deposit, although the correlation was stronger inadipose tissues than in muscle (Table 9). Similar, but neg-ative, correlations were also found between arachidonicand palmitic acids. This suggests that the D-6 desaturasein pigs was more activated in adipose than in muscle tissuesby the increasing addition of a polyunsaturated fat in thediet. Different authors (Ahn et al., 1996; Eder et al.,2001; Scheeder et al., 2000) observed that diets with a highcontent of linoleic acid lead to a high linoleic deposit in theloin (muscle LTL), but not to significant increases in ara-chidonic acid. Only one study (Wood et al., 1986) reporteda slight but significant increase. More data is available onthe parallel increase of linoleic and arachidonic acids infat tissues when linoleic acid increases in the diet (D’Arrigoet al., 2002; Warnants et al., 1999). Other authors (Boutet al., 1990; Enser et al., 2000; Fontanillas et al., 1997; Les-kanich, Matthews, Warkup, Noble, & Hazzledine, 1997),giving dietary fats rich in linolenic acid, observed thatC20:5 and C22:6 levels in pig fat and muscle tissues weregood markers of the activity of D-6 desaturase, instead ofarachidonic acid, although the rate of increase was clearlyhigher for C20:5 than for C22:6.
Table 9Correlation matrix between the levels of the selected fatty acid markers, inthe four tissues (from left to right and from top to bottom: abdominal fat,backfat, longissimus thoracis et lumborum, and trapezius)
Linoleic Palmitic Oleic Arachidonic
Palmitic
�0.864 �0.876�0.867 �0.858
Oleic
�0.316 �0.617 �0.156 0.230�0.789 �0.793 0.429 0.411
Arachidonic
0.891 0.883 �0.893 �0.819 �0.039 �0.4670.497 0.365 �0.409 �0.455 �0.614 �0.221
Palmitoleic
�0.416 �0.239 0.420 0.414 0.317 0.135 �0.296 �0.172�0.518 �0.567 0.607 0.743 0.338 0.281 �0.171 �0.125
3.3.6. Palmitoleic acid content
An overall negative diet effect for palmitoleic acid wasclear (p < 0.02), in spite of the fluctuations observed whencomparing different tissues. The overall significance levelwas below 0.05 for all tissues, but pair wise comparisons(Table 7) revealed different patterns among the four tissues.So, significant differences were observed only between diet 1and diet 4 in backfat and muscle LTL, whereas in abdominalfat diets 2, 3 and 4 showed no differences, and in trapeziusthere were differences only between diets 1 and 3, andbetween diet 4 and the other three. These conclusion on pal-mitoleic acid could be extrapolated to another FA, since wefound a good correlation between palmitoleic acid andC18:1 n � 7 (around 0.8) and C14:0 (around 0.6), and lower,but worth mentioning, with C10:0 and C12:0 (around 0.5).
3.3.7. Eicosatrienoic acid content
As regards eicosatrienoic acid levels, only the trapezius
muscle showed a certain pattern of accumulation, depen-dent on the dietary treatment (Table 8). This could suggestthat competition for D-6 desaturase favours the synthesisof n � 3 PUFA at the expense of n � 6 PUFA, mainly inthis tissue. Eicosatrienoic acid is the marker that shows lesssignificant differences, which is easy to understand since thefat added to the diet was poor in linolenic acid. However,our results agree with those obtained by other authors(D’Arrigo et al., 2002; Fontanillas et al., 1997), who founda large increase in linolenic acid and total n � 3 PUFA inthe backfat of pigs fed linseed oil, as opposed to pigs fedolive or sunflower oils. But they also observed that C20:3n � 3 showed a higher rate of increase than the othern � 3 PUFA (EPA and DHA). This confirms that thisFA could be the best marker to indicate a synthesis favour-ing n � 3 PUFA at the expense of n � 6 PUFA.
3.3.8. Correlation matrix between FA markers
Finally, interesting changes between selected FA acrosstissues need to be considered. Table 9 shows the 4-fold cor-relation matrix for the FA selected as markers (except eicos-atrienoic acid). The main points are: (a) the negativecorrelation between linoleic and palmitic acids in terms ofthe opposition between the dietary supply and the de novosynthesis, and (b) the differences between fat and muscle tis-sues, in the accumulation patterns of oleic and arachidonicacids. Oleic acid and arachidonic acid correlations with thepair linoleic/palmitic changed from adipose to muscle tis-sues. The pattern is clear for arachidonic acid levels, whichshowed positive correlation with linoleic acid levels andnegative correlation with palmitic acid levels, the correla-tion being stronger for adipose than for muscle tissues. Incontrast, the oleic acid levels were negatively correlated withlinoleic acid levels in all tissues, the correlation being weakerin adipose tissues (particularly in abdominal fat). However,the correlation between oleic acid and palmitic acid levels iscontroversial. Our results suggest that there is a weak posi-tive correlation in muscle, but no correlation in adipose tis-sues. This can be due to the fact that oleic acid supply

J.V. Pascual et al. / Food Chemistry 100 (2007) 1639–1648 1647
increased a lot from diet 1 to 4 (Table 1), compared to theincrease of palmitic acid supply. So, levels of palmitic acidwould be more dependent on the activity of the de novo syn-thesis, whereas oleic acid levels would also be dependent onthe diet. Finally, the correlation between palmitoleic andpalmitic acids was higher in muscle than in adipose tissues.This could be attributed to a preferential activity of the D-9desaturase in muscle tissues for palmitoleic synthesis, at theexpense of oleic synthesis.
Acknowledgement
This work was supported by research grants from theComissio Interdepartamental de Recerca i Innovacio Tec-nologica (CIRIT) and the Comision Interministerial de
Ciencia y Tecnologıa (CICYT). Salgot S.A. and MartaRoca de Vinals provided technical support.
References
Ahn, D. U., Lutz, S., & Sim, J. S. (1996). Effects of dietary a-linolenic acidon the fatty acid composition, storage stability and sensory charac-teristics of pork loin. Meat Science, 43, 291–299.
Allee, G. L., Baker, D. H., & Leveille, G. A. (1971). Influence of level ofdietary fat on adipose tissue lipogenesis and enzymatic activity in thepig. Journal of Animal Science, 33, 1248–1254.
Averette Gatlin, L., See, M. T., Hansen, J. A., Sutton, D., & Odle, J.(2002). The effects of dietary fat sources, levels, and feeding intervalson pork fatty acid composition. Journal of Animal Science, 80,1606–1615.
Bee, G., Geert, S., & Messikommer, R. (2002). Effect of dietary energysupply and fat source on the fatty acid pattern of adipose tissues andlipogenesis in the pig. Journal of Animal Science, 80, 1564–1574.
Bout, J., Girard, J. P., Sellier, P., & Runavot, J. P. (1990). Comparaison deporcs Duroc et Large White pour la composition chimique du gras debardiere et du muscle long dorsal. Journees de la Recherche Porcine en
France, 22, 29–34.Bryhni, E. A., Kjos, N. P., Ofstad, R., & Hunt, M. (2002). Polyunsat-
urated fat and fish oil in diets for growing-finishing pigs: Effects onfatty acid composition and meat, fat, and sausage quality. Meat
Science, 62, 1–8.Cameron, N. D., & Enser, M. B. (1991). Fatty acid composition of
lipid in Longissimus dorsi muscle of Duroc and British Landracepigs and its relationship with eating quality. Meat Science, 29,295–307.
Cameron, N. D., Warris, P. D., Porter, S. J., & Enser, M. B. (1990).Comparison of Duroc and British Landrace pigs for meat and eatingquality. Meat Science, 27, 227–247.
Cava, R., Ruiz, J., Lopez-Bote, C., Martın, L., Garcıa, C., Ventanas, J.,et al. (1997). Influence of finishing diet on fatty acid profiles ofintramuscular lipids, triglycerides and phospholipids in muscles of theIberian pig. Meat Science, 45, 263–270.
Cherian, G., & Sim, J. S. (1995). Dietary a-linolenic acid alters the fattyacid composition of lipid classes in swine tissues. Journal of Agricul-
tural and Food Chemistry, 43, 2911–2916.Coutron-Gambotti, C., Gandemer, G., & Casabianca, F. (1998). Effects of
substituting a concentrated diet for chestnuts on the lipid traits ofmuscle and adipose tissues in Corsican and Corsican · Large Whitepigs reared in a sylvo-pastoral system in Corsica. Meat Science, 50,163–174.
D’Arrigo, M., Hoz, L., Lopez-Bote, C. J., Cambero, I., Pin, C., Rey,A. I., et al. (2002). Effect of dietary linseed oil and a-tocopherol onselected properties of pig fat. Canadian Journal of Animal Science,
82, 339–346.
Eder, K., Nonn, H., & Kluge, H. (2001). The fatty acid composition oflipids from muscle and adipose tissues of pigs fed various oil mixturesdiffering in their ratio between oleic acid and linoleic acid. European
Journal of Lipid Science and Technology, 103, 668–676.Enser, M. (1984). The relationship between the composition and consis-
tency of pig backfat. In: Fat quality in lean pigs (pp. 53–57). MeatResearch Institute, Special Report No. 2. Brussels: Commission of EC.
Enser, M., Richardson, R. I., Wood, J. D., Gill, B. P., & Sheard, P. R.(2000). Feeding linseed to increase the n � 3 PUFA of pork: Fatty acidcomposition of muscle, adipose tissue, liver and sausages. Meat
Science, 55, 201–212.Folch, J., Lees, M., & Stanley, G. H. S. (1957). A simple method for the
isolation and purification of total lipids from animal tissues. Journal of
Biological Chemistry, 226, 497–509.Fontanillas, R., Barroeta, A., Baucells, M. D., & Codony, R. (1997).
Effect of feeding highly cis-monounsaturated, trans or n � 3 fats onlipid composition of muscle and adipose tissue of pigs. Journal of
Agricultural and Food Chemistry, 45, 3070–3075.Guardiola, F., Codony, R., Rafecas, M., Boatella, J., & Lopez, A. (1994).
Fatty acid composition and nutritional value of fresh eggs, from large-and small-scale farms. Journal of Food Composition and Analysis, 7,171–178.
Henry, Y. (1977). Development morphologique et metabolique du tissueadipeux chez le porc: influence de la selection, de la alimentation et dumode d’elevage. Annales de Biologie Animale Biochimie Biophysique,
17, 923–952.Honkavaara, M. (1989). Influence of porcine stress and breed on the fatty
acid profiles of subcutaneous and intramuscular total lipids. Fle-
ischwirtsch, 69, 1429–1432.Irie, M., & Sakimoto, M. (1992). Fat characteristics of pigs fed fish oil
containing eicosapentaenoic and docosahexaenoic acids. Journal of
Animal Science, 70, 470–477.Katan, M. B., Zock, P. L., & Mensink, R. P. (1994). Effects of fats and
fatty acids on blood lipids in humans: an overview. American Journal
of Clinical Nutrition, 60, 1017S–1022S.Klingenberg, I. L., Knabe, D. A., & Smith, S. B. (1995). Lipid metabolism
in pigs fed beef tallow or high oleic sunflower oil. Comparative
Biochemistry and Physiology., 110, 183–192.Kouba, M., Enser, M., Whittington, F. M., Nute, G. R., & Wood, J. D.
(2003). Effect of a high linoleic acid diet on lipogenic enzyme activities,fatty acid composition, and meat quality in the growing pig. Journal of
Animal Science, 81, 1967–1979.Leskanich, C. O., Matthews, K. R., Warkup, C. C., Noble, R. C., &
Hazzledine, M. (1997). The effect of dietary oil containing (n � 3) fattyacids on the fatty acid, physicochemical, and organoleptic character-istics of pig meat and fat. Journal of Animal Science, 75, 673–683.
Lizardo, R., van Milgen, J., Mourot, J., Noblet, J., & Bonneau, M. (2002).A nutritional model of fatty acid composition in the growing-finishingpig. Livestock Production Science, 75, 167–182.
Morgan, C. A., Noble, R. C., Cocchi, M., & McCartney, R. (1992).Manipulation of the fatty acid composition of pig meat lipids bydietary means. Journal of the Science of Food and Agriculture, 58,357–368.
Mourot, J., Aumaitre, A., Mounier, A., Peiniau, P., & Francois, A. C.(1994). Nutritional and physiological effects of dietary glycerol in thegrowing pig: Consequences on adipose tissues and post mortem muscleparameters. Livestock Production Science, 98, 237–244.
Oliver, M. A., Gispert, M., Tibau, J., & Diestre, A. (1991). Themeasurement of light scattering and electrical conductivity for theprediction of PSE pig meat at various times post mortem. Meat
Science, 29, 141–151.Øverland, M., Taugbøl, O., Haug, A., & Sundstøl, E. (1996). Effect of fish
oil on growth performance, carcass characteristics, sensory parame-ters, and fatty acid composition of pigs. Acta Agriculturae Scandinav-
ica Section A-Animal Science, 46, 11–17.Pascual, J. (2000) PhD thesis, University of Barcelona.Scheeder, M. R. L., Glaser, K. R., Eichenberger, B., & Wenk, C. (2000).
Influence of different fats in pig feed on fatty acid composition of

1648 J.V. Pascual et al. / Food Chemistry 100 (2007) 1639–1648
phospholipids and physical meat quality. European Journal of Lipid
Science and Technology, 102, 391–401.SPSS 11.0 (2001). Chicago, IL, USA.Laack, R. L. J. M., & Spencer, E. (1999). van Influence of swine genotype
on fatty acid composition of phospholipids in longissimus muscle.Journal of Animal Science, 77, 1742–1745.
Warnants, N., Van Oeckel, M. J., & Boucque, C. V. (1999). Incorporationof dietary polyunsaturated fatty acids into pork fatty tissues. Journal of
Animal Science, 77, 2478–2490.
Wiseman, J., Redshaw, M. S., Jagger, S., Nute, G. R., & Wood, J. D.(2000). Influence of type and dietary rate of inclusion of oil on meatquality of finishing pigs. Animal Science, 70, 307–315.
Wood, J. D., Brown, S. N., Nute, G. R., Whittington, F. M., Perry, A. M.,Johnson, S. P., et al. (1996). Effects of breed, feed level and conditioningtime on the tenderness of pork. Meat Science, 44, 105–112.
Wood, J. D., Buxton, P. S., Whittington, F. M, & Enser, M. (1986). Thechemical composition of fat tissues in the pig: effect of castration andfeeding treatment. Livestock Production Science, 15, 73–82.


