Embed Size (px)
Citation preview

Published: October 15, 2011
r 2011 American Chemical Society 15054 dx.doi.org/10.1021/la2030186 | Langmuir 2011, 27, 15054–15064
ARTICLE
pubs.acs.org/Langmuir
Effect of Lipid Molecule Headgroup Mismatch on Non SteroidalAnti-Inflammatory Drugs Induced Membrane FusionSutapa Mondal Roy and Munna Sarkar*
Chemical Sciences Division, Saha Institute of Nuclear Physics, 1/AF, Bidhannagar, Kolkata-700064, India
bS Supporting Information
1. INTRODUCTION
Many processes in biological membranes occur due to theresult of defects in the packing of the component molecules ofthe bilayer.1 These processes include interbilayer and transbilayerlipid exchange,2 bilayer permeation,3 membrane fusion,4 etc. Mem-brane fusion, an important event found in many biological pro-cesses, namely, neurotransmission,5 fertilization,6 trafficking,7 viralinfection,8 etc., requires a significant participation of various externalfactors. These external factors may be in the form of other organicmolecules, drugs, proteins, and peptides that induce defects andfusion in membranes. The presence of defects in the membranes,introduced by the changes in lipid parameters, can also induce andcomplete the fusion process.9 The origin of such defects in a lipidbilayer can be varied, but the two common causes come from thepresence of lipid molecules having different headgroup size anddissimilar fatty acyl chains.
Though small drug molecule induced membrane fusion is arare event, non steroidal anti-inflammatory drugs (NSAIDs) in-duced membrane fusion, which was first shown by our group, isnow a well-established phenomenon.10�12 A direct biologicalconsequence of this fusogenic property of one of the oxicamNSAIDs, namely, piroxicam, manifests in its ability to fuse andrupture the mitochondrial outer membrane leading to release of
cytochrome c in the cytosol that signals the activation of thedownstream pro-apoptotic caspase-3.13
Drug induced membrane fusion, unlike protein inducedfusion, is controlled by the interplay of different physical andchemical parameters of both the participating drugs and thelipids. A clear understanding of that interplay will allow the use ofthese common drugs to induce and control membrane fusion inbiotechnological and biomedical procedures where fusion formsan integral step.14 In our previous studies,11,12 we have alreadyunraveled the effect of drug concentration, temperature, and lowconcentration of cholesterol which is known to increase the orienta-tional order of the lipid chains. In our present study, we monitor theeffect of changing the headgroup size of the lipidmolecules on oxicamNSAIDs induced membrane fusion. The three drugs studied includemeloxicam (Mx) [IUPAC name: (8E)-8-[hydroxy-[(5-methyl-1,3-thiazol-2-yl)amino] methylidene]-9-methyl-10,10-dioxo-10λ6-thia-9-azabicyclo[4.4.0]deca-1,3,5-trien-7-one], piroxicam (Px) [IUPACname: (8E)-8-[hydroxy-(pyridin-2-ylamino)methylidene]-9-methyl-10,10-dioxo-10λ6-thia-9-azabicyclo[4.4.0]deca-1,3,5-trien-7-one], and
Received: August 3, 2011Revised: October 12, 2011
ABSTRACT: Membrane fusion is an essential process guidingmany important biological events, which most commonly re-quires the aid of proteins and peptides as fusogenic agents. Smalldrug induced fusion at low drug concentration is a rare event.Only three drugs, namely, meloxicam (Mx), piroxicam (Px), andtenoxicam (Tx), belonging to the oxicam group of non steroidalanti-inflammatory drugs (NSAIDs) have been shown by us toinduce membrane fusion successfully at low drug concentration.A better elucidation of the mechanism and the effect of different parameters in modulating the fusion process will allow the use of thesecommon drugs to induce and control membrane fusion in various biochemical processes. In this study, we monitor the effect of lipidheadgroup size mismatch in the bilayer on oxicam NSAIDs induced membrane fusion, by introducing dimyristoylphosphatidyletha-nolamine (DMPE) in dimyristoylphosphatidylcholine (DMPC) small unilamellar vesicles (SUVs). Such headgroup mismatch affectsvarious lipid parameters which includes inhibition of trans-bilayer motion, domain formation, decrease in curvature, etc. Changes invarious lipidic parameters introduce defects in themembrane bilayer and therebymodulatemembrane fusion. SUVs formed byDMPCwith increasing DMPE content (10, 20, and 30 mol %) were used as simple model membranes. Transmission electron microscopy(TEM) and differential scanning calorimetry (DSC) were used to characterize the DMPC-DMPEmixed vesicles. Fluorescence assayswere used to probe the time dependence of lipidmixing, content mixing, and leakage and also used to determine the partitioning of thedrugs in the membrane bilayer. How the inhibition of trans-bilayer motion, heterogeneous distribution of lipids, decrease in vesiclecurvature, etc., arising due to headgroup mismatch affect the fusion process has been isolated and identified here. Mx amplifies theseeffectsmaximally followed by Px andTx. This has been correlated to the enhanced partitioning of the hydrophobicMx compared to themore hydrophilic Px and Tx in the mixed bilayer.

15055 dx.doi.org/10.1021/la2030186 |Langmuir 2011, 27, 15054–15064
Langmuir ARTICLE
tenoxicam (Tx) [IUPAC name: (3E)-3-[hydroxy(pyridin-2-ylamino)methylene]-2-methyl-2,3-dihydro-4H-thieno[2,3-e][1,2]thiazin-4-one-1,1-dioxide] [Figure 1].
Phosphatidylcholine (PC) and phosphatidylethanolamine(PE) are the main lipid molecules that are present in mosteukaryotic cells and cell organelles.15 PCs are the most commonand most largely present phospholipid in biological membranes.They have the advantage of having neutral charge, chemicalinertness, biocompatibility, and biodegradability.16 In earlierstudies, PCs and PEs derived from various natural sources wereused for in vitro studies. Since natural PCs or PEs contain fattyacyl chains with a wide variety of different lengths and variousdegrees of unsaturation, synthetic lipid bilayer membranes arenow used extensively as model membrane systems for the studiesof various physiological functions.17�20 For achieving a clearunderstanding of how individual parameters modulate druginduced membrane fusion, it is essential that we study theireffect on simplemodel membrane systems. That is why the use ofa synthetic lipid bilayer having only one type of fatty acyl chainwill help in parsing the effect of the individual parameter, that is,the mismatch in lipid headgroup size on membrane fusion. Herewe use small unilamellar vesicles (SUVs) of dimyristoylpho-sphatidylcholine (DMPC) mixed with 10, 20, or 30 mol %dimyristoylphosphatidylethanolamine (DMPE) to introducean increase in headgroup size mismatch. The working tempera-ture was chosen to be 39 �C which is close to the physiologicaltemperature, and also at this temperature the mixed bilayers areon the whole in the sol (Lα) phase as shown by Silvius.21 Theonly difference between the DMPC and DMPE headgroup isthat the DMPC contains a bulky quaternary amine with threemethyl substituents whereas DMPE has a primary amine head-group containing three hydrogen substituents [Figure 2]. SinceDMPE is small in size and has hydrogen atoms attached, ithas the ability to interact strongly with the neighboring lipidmolecules through inter- and intramolecular H-bonding.22
This creates a close packing of the lipid bilayer with an alignedhydrocarbon tail region which decreases the area per lipidmolecule.23 The distribution of DMPE in DMPC-DMPE mixedvesicles at neutral pH is preferably concentrated in the outermonolayer of the SUVs for low concentration of DMPE content,
that is, up to 20 mol %. The distribution of DMPE in the innermonolayer of the SUVs increases above this concentration.24
This heterogeneous distribution of PE lipids in PC-PE mixedSUVs does not show any aggregation of PE in the fluid state.22,25
However, in the partially melted DMPE and DMPC lipidmixtures, coexistence of the gel and fluid domains occur whichmelt at different temperatures leading to a broadening of thegel�fluid phase transition.26 Incomplete miscibility of both thelipids has been observed in the gel-phase according to the phasediagram as depicted earlier by Silvius.21 In supported mixedbilayers of DMPC and DMPE, increasing temperatures re-sulted in the melting of the upper and the lower leaflet atdifferent temperatures.15 In addition, presence of 10�30mol %DMPE in DMPC bilayers results in a significant decrease in therate of the DMPC trans-bilayer movement, that is, flip-flopmotion, considering the fact that addition of new lipid mol-ecules to the already closely packed inner monolayer is be-coming more and more difficult.1 This has been attributed tothe modulation of the spontaneous fluctuation defects in theDMPC bilayer by the presence of DMPE, which makes themmore ordered. Due to such a broad spectrum of typical physicaland structural properties of the mixed bilayer in the presenceof DMPE within DMPC vesicles, the DMPC-DMPE mixedbilayers and vesicles are the subject of intense study for the pastfew decades.27�30
To monitor the effect of change in different lipid parameters,which arise due to headgroup mismatch, on NSAIDs inducedfusion, the three major events in the fusion process, namely, lipidmixing, content mixing, and leakage, were followed. This wasdone by recording the time courses from the three differentfluorescence assays. Content mixing and leakage were monitored
Figure 1. Chemical structures of piroxicam, meloxicam, and tenoxicam.
Figure 2. Chemical structures of DMPC (i) and DMPE (ii).

15056 dx.doi.org/10.1021/la2030186 |Langmuir 2011, 27, 15054–15064
Langmuir ARTICLE
by the Tb3+/DPA assay, whereas lipid mixing was monitoredusing the standard N-NBD-PE/N-Rh-PE assay at physiologicalpH 7.4. Kinetic parameters were extracted from the time courses,where the change in fluorescence intensity of the probes used inthe three different assays were plotted against time. The effect ofchange in headgroup size was also monitored by determining thepartition coefficient with increasing DMPE in DMPC SUVs.DSC was used to monitor the change in chain melting tempera-ture in the presence of the three drugs with increasing moleconcentration of DMPE. Transmission electron microscopy(TEM) images were obtained to evaluate the change in averagediameter of the vesicles in the presence of enhanced concentra-tions of DMPE in DMPC vesicles. This detailed study will give aclear understanding of the effect of headgroup size mismatch thatin turn affects several lipidic parameters, on oxicam drugsinduced membrane fusion, and will help us in better elucidationof the molecular mechanism of this fusion process.
2. MATERIALS AND METHODS
Dimyristoylphosphatidylcholine (DMPC), dimyristoylphosphatidy-lethanolamine (DMPE), dipicolinic acid (DPA), TritonX-100 (ultra-pure), Terbium (Tb3+) chloride, (3-[N-morpholino]propanesulfonic acid)sodium salt (MOPS buffer), piroxicam, and tenoxicam were purchasedfrom Sigma-Aldrich, meloxicam from LKT Laboratories, N-(7-nitro-benz-2-oxa-1,3-diazol-4-yl)-1,2-dihexadecanoyl-sn-glycero-3-phosphoe-thanolamine, triammonium salt (N-NBD-PE) and lissamine rhodamineB-1,2-dihexadecanoyl-sn-glycero-3-phosphanolamine, triethylammo-nuim salt (N-Rh-PE) from Invitrogen Life Science Corporation, and2-[tris (hydroxymethyl) methylamine]-1-ethanesulfonic acid (TESbuffer) and sodium ethylene diamine tetra aceate (EDTA sodiumsalt) from SRL (India), and all were used without further purification.Sephadex G-50, for size exclusion column chromatography, waspurchased from Amersham Biosciences. Water was quartz distilledthrice before use. Stock solutions of meloxicam, piroxicam, andtenoxicam were prepared in dimethyl sulfoxide (DMSO) (Merck,Germany), and the exact concentration was adjusted by the corre-sponding buffer. The dilution of the drugs was done in such a way sothat each sample contains 0.5% (v/v) DMSO, which had no significanteffect over the SUV structure or membrane fusion process.6
2.1. Preparation of SUVs. SUVs of lipids, namely, DMPC anddifferent mol % of DMPE (10 mol %, 20 mol % and 30 mol %), wereprepared using the sonication method31 as done in our earlier experi-ments. The phospholipids were dissolved in 2:1 (v/v) chloroform/methanol solution, and the solvent was evaporated to dryness under astream of argon. The lipid film thus produced was then kept overnightinside a vacuumdesiccator at�20 �C. The dried films were hydrated andswelled in buffer at pH 7.4. The composition of the buffer solution variesin accordance with the requirement of the assay. For lipid mixing assay,either N-NBD-PE and N-Rh-PE containing vesicles or probe freevesicles were prepared in 10 mM TES containing 100 mM NaCl and0.1 mM EDTA. For content mixing assay, 10 mM TES buffer was usedfor DPA (80mM) containing vesicles, and 10mMTES buffer along with60 mM NaCl was used for TbCl3 (8 mM) containing vesicles. Forleakage assay, vesicles were prepared with coencapsulated probes having10mMTES buffer. After hydration, themixture was vortexed to dispersethe lipids. The dispersion was then sonicated for about 10 min, in threeequal time intervals, using a dr. Heilscher (Germany) probe sonicator(200 W). The samples were then allowed to stand for 40 min at 39 �C tobe hydrated completely. The sonicated samples were then centrifuged at10 000 rpm for 15 min to remove titanium particles and aggregatedlipids. These titanium particles were introduced as an impurity from thesonicator probe during process of sonication.32
2.2. Estimation of Phosphate. The phospholipid concentrationwas measured following the published protocol33 already used in ourprevious experiments. Vesicle samples of 0.2 mL were digested with0.8 mL of perchloric acid at 180 �C for 3 h. After cooling to roomtemperature, 5.0 mL of distilled water was added to it. Then 0.5 mL of5% ammonium molybdate solution was added followed by addition of0.4 mL of amminonaphthol sulfonic acid (ANSA) reagent (prepared bydissolving 7.5 g of sodium metabisulfate, 0.5 g of sodium sulfite, and0.125 g of ANSA in 50 mL of distilled water). The solutions wereallowed to stand for 20 min to develop the blue color. The amount ofphosphate was estimated from the absorbance measured at 660 nmusing a JASCO V � 650 absorption spectrophotometer. The lipidconcentration (DMPC together with DMPE) in all the experiments wasaround 1.0 mM as determined by this method (data not shown).2.3. Transmission Electron Microscopy (TEM) Measure-
ment. TEM experiments were done with a FEI electron microscopemodel Tecnai G2 20S Twin operating at 200 KV with a resolution of0.2 nm. Samples were spread over a copper grid coated with carbon.SUVs were negatively stained with 2% (v/v) phosphotungstic acid(PTA). The samples were spread over the copper grid and kept foraround 2 min, and then they were dried. The PTA solution was thenspread over the copper grid containing dehydrated lipid samples. ThePTA solution was kept only for 20 s over the dehydrated samples sothat, apart from staining, no significant morphological and sizechange occurred to the dehydrated lipid vesicles. The stained sampleson the copper grid were further dried in a vacuum desiccator forabout 3 days. The magnifications were at 19 500� for differentsamples, which are mentioned on the transmission electron micro-graphs. SUVs of DMPC and DMPC containing 10, 20, and 30 mol %DMPE were used in the experiments to compare the sizes of thevesicles on addition of the DMPE in DMPC SUVs without thepresence any drug.
The frequency of distribution plots of the average diameter of thevesicles were calculated from the TEM slides. For each sample underconsideration, data from at least four slides were taken. For each TEMslide, the diameters of the vesicles were obtained using the softwareImageJ 1.44p, National Institute of Health, USA. The data thus obtainedwere used to make a calculation of the frequency of distribution, andfinally it was plotted as a histogram where the y axis is the product ofnumber frequency f and x where x is the midpoint of the interval chosenagainst the average diameter of the vesicles. For such grouped data, themean diameter is given by Σfx/Σf.2.4. Differential Scanning Calorimetry (DSC). For the DSC
experiments, 1 mM lipid (DMPC + 10, 20, or 30 mol % DMPE) filmswere prepared, following similar method as described in the “Prepara-tion of SUVs” section. The dried lipid films were hydrated in 10 mMMOPS buffer at pH 7.4. Constant concentration of 30 μMof the oxicamNSAIDs was also used. The DSC scans were taken 2 h after drugaddition to ensure the completion of the fusion event in the presence ofdrugs. The DSC measurements were done using a Microcal, LLC(Northampton, MA) VP-DSC Micro calorimeter. All the samples andthe buffer were degassed by spinning them in the Eppendorf centrifuge(5415D) at 13 000 rpm for 30min and loading them into the sample andreference cells, respectively. Every sample was scanned four to five timesfrom 5 to 60 �Cwith a scan rate of 20 �C/h. In all cases, the last two scanswere identical. The DSC curves were analyzed by using the fittingprogram Origin 7.0, provided by Origin Lab (Northampton, MA).2.5. Calculation of Partition Coefficient (KP). The partition
coefficient (KP) of the oxicam drugs, namely, Mx, Px, and Tx, betweenthe aqueous phase, that is, the buffer phase at pH 7.4, and the lipid phase,that is, the DMPC vesicles along with varying concentration of DMPE(10, 20, and 30 mol %) was estimated. The change in fluorescenceintensity of the drugs in both the phases was monitored, and from therethe partition coefficient value is calculated. All emission spectra were

15057 dx.doi.org/10.1021/la2030186 |Langmuir 2011, 27, 15054–15064
Langmuir ARTICLE
corrected for instrument response at each wavelength. A 2mm� 10mmpath length quartz cell was used for fluorescence measurements to avoidany blue edge distortion of the emission spectrum due to the inner filtereffect.
At pH 7.4, all three oxicam NSAIDs exist in their anionic form.34 Theabsorption maxima of the anionic forms of Mx, Px, and Tx in ahydrophobic environment are at 362, 363, and 368 nm, respectively,and the emission maximum of Mx, Px, and Tx is at 500 nm.32,35 For thecalculation of the partition coefficient values, the changes in thefluorescence intensity of the respective drugs at λem = 500 nm weremonitored using aHitachi F-4010 fluorescence spectrophotometer, withincreasing concentration of lipid (DMPC containing DMPE). Therespective plots are hyperbolic in nature, which indicates a noncoopera-tive partitioning of the drugs in the lipid vesicles.
From the fluorescence emission spectra, the partition coefficients(KP) of the three oxicam drugs were calculated using the followingequation.36
I ¼ IW þ KPγImax½L�1 þ KPγ½L� ð1Þ
where I = fluorescence intensity of the drugs, that is, Mx, Px, and Tx, atany concentration of lipid; IW = fluorescence intensity of the drugs, thatis, Mx, Px, and Tx, in aqueous phase, that is, buffer phase; Imax =maximum fluorescence intensity of the oxicam drugs at saturating lipidconcentration; KP = partition coefficient of the oxicam drugs betweenlipid phase and aqueous phase; γ = molar volume of lipid; and [L] =concentration of lipid added during titration. Nonlinear least-squaresfitting of the I versus [L] plot was done using eq 1. The value of γ wasconsidered as 0.95.37 Maximum fluorescence intensity Imax was obtainedusing the following equation.38
1ΔI
¼ 1ΔImax
þ 1KappΔImax
� 1½lipid� � ½drug� ð2Þ
where ΔI = the change in fluorescence intensity at any concentration oflipid, ΔImax = the maximum change in fluorescence intensity at thesaturatingmolar concentration of lipid, andKapp = the apparent partitioncoefficient of the drug between the lipid and aqueous phase.
Since the concentration of the drugs, that is [drug] is almostnegligible compared to the concentration of the lipid added, that is,[lipid], hence during the calculation of partition coefficient values,[drug] was considered negligible. A plot of 1/ΔI versus 1/[lipid] gavea straight line with correlation coefficient greater than 0.9, whoseintercept on the y-axis gives the value of 1/ΔImax. Knowing ΔImax, Imax
can be calculated by subtracting the value of the initial fluorescenceintensity from theΔImax. Finally, for the actual calculation of the value ofKP, this value of Imax is used in eq 1.2.6. LipidMixingAssay.Measurement of the rate constant of lipid
mixing was done using standard lipid mixing assay as described inprevious works.39,40 F€orster resonance energy transfer (FRET) betweendonor and acceptor is the main basis of this assay. Two sets of vesicles,one probe containing vesicles and the other probe free vesicles, wereprepared. Both of the FRET probes N-NBD-PE (donor) and N-Rh-PE(acceptor) were used at a concentration of 0.8 mol % each, in the probecontaining vesicles. Both sets of vesicles were prepared in 10 mM TES,100 mM NaCl, and 0.1 mM EDTA buffer at pH 7.4. The probecontaining vesicles were mixed with probe free vesicles at a ratio of1:9 for the measurement. As membrane fusion occurs due to thepresence of drugs, lipids of probe containing vesicles get mixed withthe lipids of the probe free vesicles, resulting in dilution of the probes onthe fused vesicles. Thus, membrane fusion decreases the FRET due toenhanced probe distances which resulted in fluorescence dequenchingof N-NBD-PE. This increase in fluorescence intensity was monitoredwith time using a HORIBA Jobin Yvon Fluoromax-3 fluorescence
spectrophotometer with an excitation at 460 nm and emission at530 nm. The fluorescence data were taken at a constant concentrationof the oxicamNSAIDs at 30 μM, that is, drug to lipid (D/L) ratio at 0.03and at constant temperature of 39 �C. As already mentioned in theearlier work,7 oxicam drugs have a significant amount of quenching effecton the fluorescence intensity of the lipid probes. This quenching effectwas calculated and nullified from the original time course as was done inour previous work.
The lipid mixing is given by the following equation:
% lipid mixing ¼ F� F0F∞ � F0
� 100 ð3Þ
where F = fluorescence intensity at time t, F0 = initial fluorescence ofthe labeled liposomes set as 0% fluorescence, and F∞ = the maximumfluorescence set as 100%; it was determined by lysing the vesicles with1% (v/v) Triton X-100, thereby releasing the probes in aqueousbuffer resulting in high dilution and total absence of FRET. We usedultrapure Triton X-100, which did not affect the N-NBD-PE fluores-cence, and hence, the correction factor of 1.4�1.5 was not used.40
Each lipid mixing experiment is repeated at least three to four times,and the error bars in the data points represent the standard deviation ofthat data point. All the time courses of lipid mixing could be fitted to asingle exponential rate equation: f = a(1 � exp(�kt)) where theexponential constant k is referred to as the rate constant and the extentof percentage of lipid mixing at infinite time is given by the pre-exponential factor a.2.7. Content Mixing Assay. The rate constant of content mixing
of the inner contents of the fusing vesicles was measured using thestandard Tb-DPA assay.12,41 Two sets of vesicles were prepared, oneencapsulated with DPA (80 mM) and the other encapsulated withTbCl3 (8 mM) in the specific buffer as already discussed earlier insection 2.1 at pH 7.4. The untrapped probes, present in the externalbuffer of the vesicles, were removed using a Sephadex G-50 columnequilibrated with the elution buffer (10 mM TES, 100 mMNaCl, 1 mMEDTA at pH 7.4). To define the 0�100% interval, TbCl3 containingvesicles were also rechromatographed in the absence of EDTA. This waslysed with Triton X-100 at 1% (v/v), and the fluorescence intensity wasrecorded both in the absence and in the presence of an excess amount ofDPA. Membrane fusion was monitored in the presence of variousconcentration of DMPE (10, 20, and 30 mol %) in DMPC vesiclesinduced by constant concentration of oxicam NSAIDs of 30 μM, that is,D/L ratio of 0.03 at 39 �C.
During the determination of drug induced content mixing, 30 μM ofoxicam NSAIDs solutions was added to a (1:1) mixture of Tb3+ andDPA-containing vesicles. As fusion occurs, a highly fluorescent Tb-DPAcomplex is formed inside the fused vesicles. The complex fluoresces at490 nm upon being excited at 275 nm. The content mixing wasmonitored in terms of an increase in fluorescence intensity at 490 nmwith time using a HORIBA Jobin Yvon Fluoromax-3 fluorescencespectrophotometer. From the time courses of the content mixing, thepercent of content mixing was calculated using the following equation:
% content mixing ¼ ðF� F0Þ=F0ðFl � Fl0Þ=Fl0
� 100 ð4Þ
where F = fluorescence intensity of Tb-DPA complex at time t, F0 =fluorescence intensity of Tb-DPA complex at t = 0, Fl = fluorescenceintensity of rechromatographed, lysed Tb-vesicles in presence of ade-quate amount of DPA, and F0
l = fluorescence intensity of rechromato-graphed, lysed Tb-vesicles in absence of DPA
The content mixing experiments were also repeated three to fourtimes, and the standard deviation is included as the error bars in thedata. Similar to the time courses of the lipid mixing assay, all the timecourses of content mixing were fitted to a single exponential rate

15058 dx.doi.org/10.1021/la2030186 |Langmuir 2011, 27, 15054–15064
Langmuir ARTICLE
equation: f = a(1 � exp(�kt)), where the exponential constant k isreferred to as the rate constant and the extent of percentage of contentmixing at infinite time is given by the pre-exponential factor a.2.8. Leakage Assay. The leakage assay was performed by using
coencapsulated Tb-DPA vesicles, already referred in our previouspapers.12,39 Tb3+ (8 mM) and DPA (80 mM) coencapsulated DMPCvesicles with varying concentration of DMPE (10, 20, and 30 mol %)were prepared in 10 mM TES buffer at pH 7.4 and were chromato-graphed on a Sephadex G-50 column equilibrated with elution buffercontaining EDTA at pH 7.4 to eliminate unbound TbCl3 present in theexternal buffer. As leakage occurs in the presence of drugs, the Tb-DPAcomplex comes out of the vesicles and the stronger chelator EDTAcompetes with DPA to form the more stable Tb-EDTA complexdissociating the Tb-DPA complex. The associated decrease in fluores-cence intensity was measured at 490 nm with excitation wavelength at275 nm with time using a HORIBA Jobin Yvon Fluoromax-3 fluores-cence spectrophotometer at 39 �C. The percentage leakage wascalculated as
% leakage ¼ ðFd, t¼ 0CO � Fd, detCO Þ � ðFd, tCO � Fd, detCO Þ
Fd, t¼ 0CO � Fd, detCO
� 100 ð5Þ
where FCOd,t=0 = fluorescence intensity of Tb-DPA coencapsulated vesicles
at the time t = 0, FCOd,t = Fluorescence intensity of Tb-DPA coencapsu-
lated vesicles at time ‘t’, FCOd,det = fluorescence intensity of Tb-DPA
coencapsulated vesicles after lysing with 0.1% (v/v) Triton X-100.All the time courses of the leakage assay thus obtained were also fitted
to a single exponential rate equation: f = a(1 � exp(�kt)), where kmeasured the rate constant of leakage and pre-exponential factor ameasured the extent of the leakage of contents.
3. RESULTS
Characterization of DMPC-DMPE Mixed Vesicles: TEMImaging and DSC Thermograms. Figure 3a(i�iv) shows theTEM images for the vesicles without addition of any drugs. Theimages were taken with freshly prepared vesicles to avoid anyfusion event whose absence is clearly evident in each of thefigures. As the DMPE content increases in the DMPC vesicles,the vesicle size increases. The frequency of distribution studybased on the TEM slides (at least four slides were used for eachsample) is represented in the Figure 3b (i) to (iv). Thesehistogram plots show an increase in average diameter of thevesicles as the DMPE content increases. It is important to notethat the average diameter of the DMPC vesicles containing 10mol % DMPE is similar to the average diameter of pure DMPCSUVs, which is 50�60 nm. A slight increase in the averagediameter to 60�70 nm is seen in case of 20 mol % DMPE whilealmost 2-fold increase in average diameter, which is in between110 and 120 nm, occurs in DMPC vesicles containing 30 mol %of DMPE.The presence of DMPE in the DMPC changes the curvature of
the SUVs, which in turn changes the size of the vesicles in thestate of suspension. The reason for this lies in the fact that DMPEalone forms the lamellar phase and can form SUVs only in thepresence of other cylindrical phospholipids like DMPC.16,42
Despite vesicle formation in mixed bilayers, DMPE preferentiallyoccupies the outermonolayer at lowDMPE concentration and inthe inner monolayer at high DMPE concentration at neutralpH.24,43 This is the principal cause for the altered curvature
Figure 3. (a) Transmission electron microscopy images of untreated DMPC vesicles (control) (i), untreated DMPC vesicles containing 10 mol %DMPE (ii), 20 mol % DMPE (iii), and 30 mol % DMPE (iv). In all cases, grids were prepared just after vesicle preparation and stained withphosphotungstic acid (PTA). (b) Frequency distribution with respect to diameter of DMPC vesicles (i), DMPC vesicles containing 10 mol % DMPE(ii), 20 mol % DMPE (iii), and 30 mol % DMPE (iv) without any treatment with oxicam NSAIDs at 37 �C and pH 7.4, calculated from TEMmicrographs. For calculation, at least four micrographs of each sample were used.
15059 dx.doi.org/10.1021/la2030186 |Langmuir 2011, 27, 15054–15064
Langmuir ARTICLE
resulting in an increase in average diameter of the vesicles.Increase in diameter implies reduced curvature. Also largerdiameter is detrimental to trans-bilayer movements.44
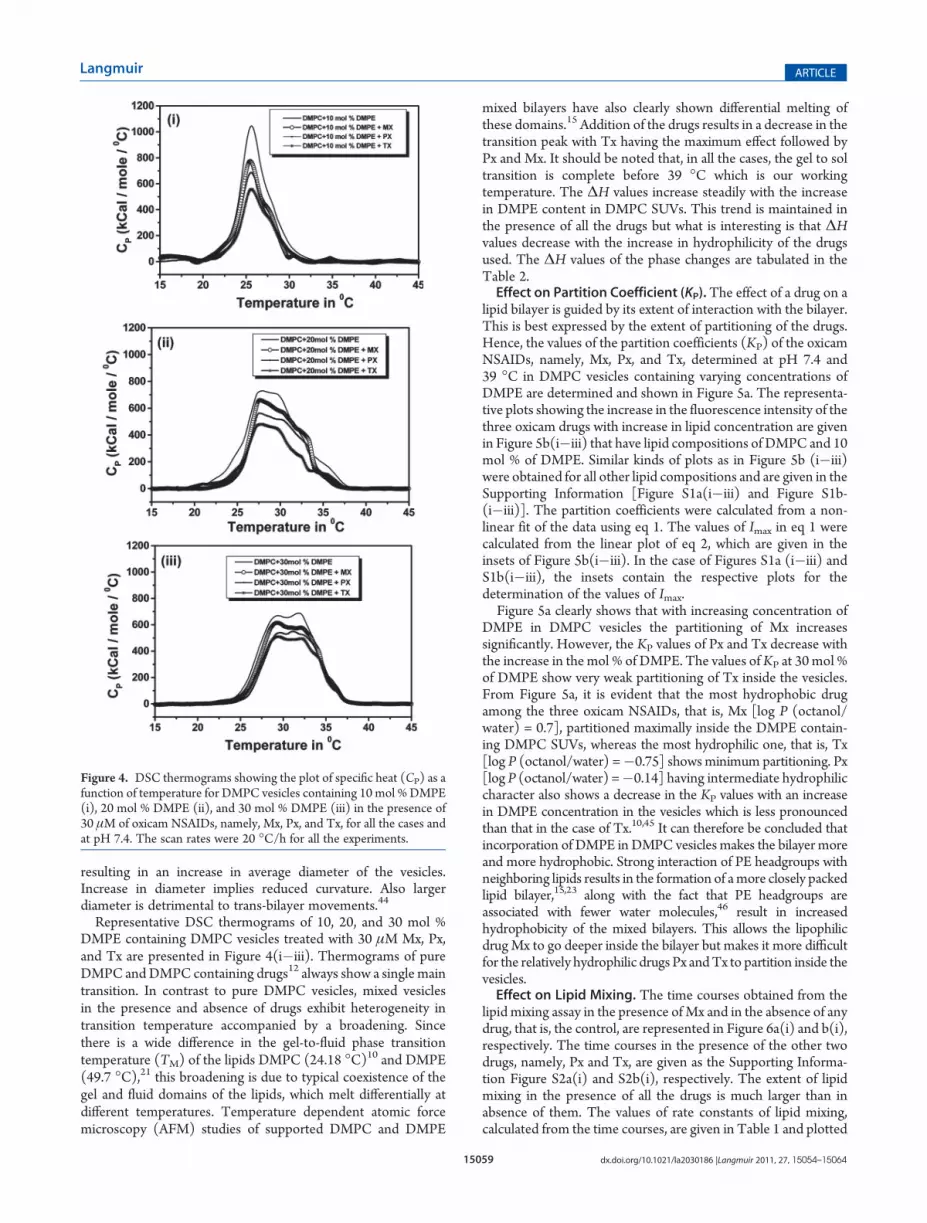
Representative DSC thermograms of 10, 20, and 30 mol %DMPE containing DMPC vesicles treated with 30 μM Mx, Px,and Tx are presented in Figure 4(i�iii). Thermograms of pureDMPC andDMPC containing drugs12 always show a single maintransition. In contrast to pure DMPC vesicles, mixed vesiclesin the presence and absence of drugs exhibit heterogeneity intransition temperature accompanied by a broadening. Sincethere is a wide difference in the gel-to-fluid phase transitiontemperature (TM) of the lipids DMPC (24.18 �C)10 and DMPE(49.7 �C),21 this broadening is due to typical coexistence of thegel and fluid domains of the lipids, which melt differentially atdifferent temperatures. Temperature dependent atomic forcemicroscopy (AFM) studies of supported DMPC and DMPE
mixed bilayers have also clearly shown differential melting ofthese domains.15 Addition of the drugs results in a decrease in thetransition peak with Tx having the maximum effect followed byPx and Mx. It should be noted that, in all the cases, the gel to soltransition is complete before 39 �C which is our workingtemperature. The ΔH values increase steadily with the increasein DMPE content in DMPC SUVs. This trend is maintained inthe presence of all the drugs but what is interesting is that ΔHvalues decrease with the increase in hydrophilicity of the drugsused. The ΔH values of the phase changes are tabulated in theTable 2.Effect on Partition Coefficient (KP).The effect of a drug on a
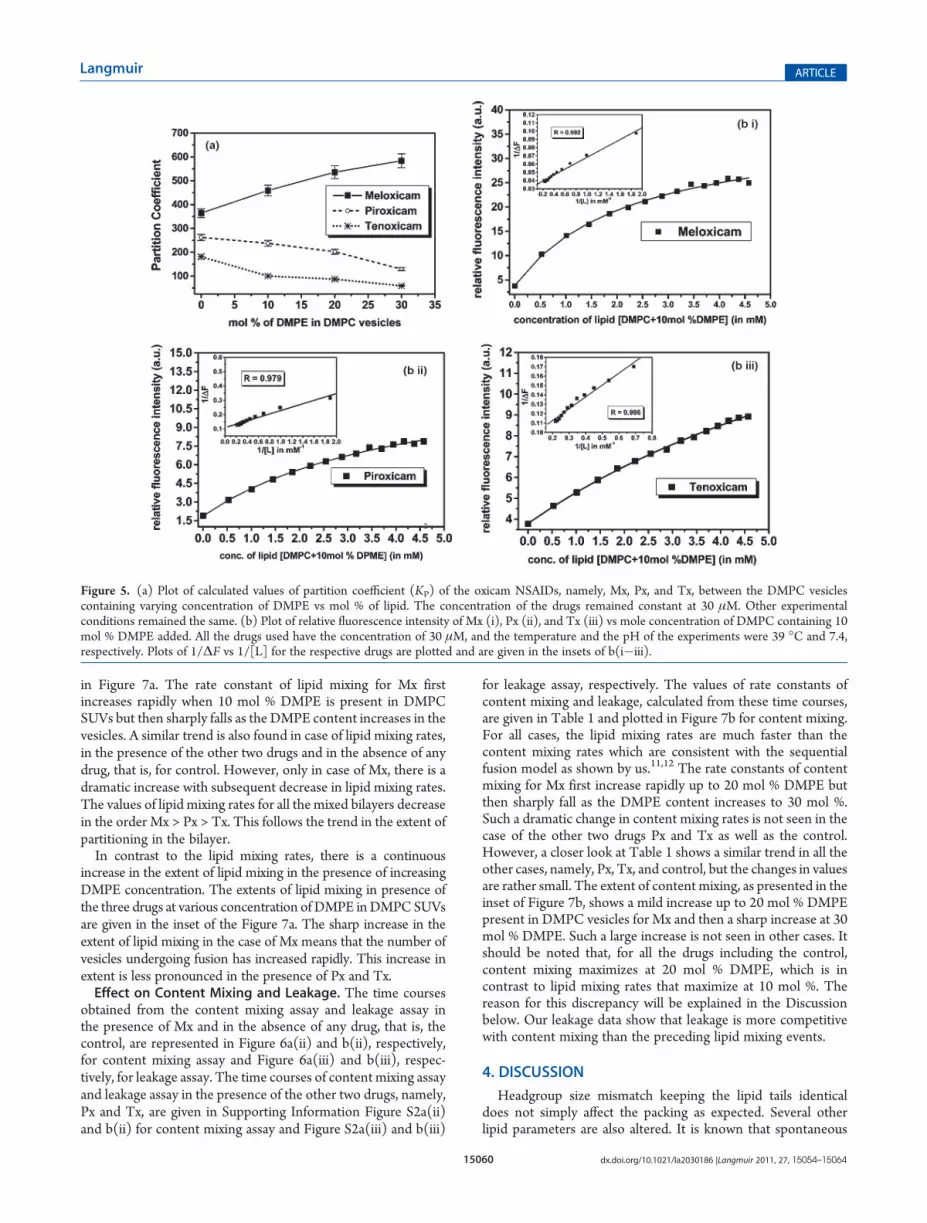
lipid bilayer is guided by its extent of interaction with the bilayer.This is best expressed by the extent of partitioning of the drugs.Hence, the values of the partition coefficients (KP) of the oxicamNSAIDs, namely, Mx, Px, and Tx, determined at pH 7.4 and39 �C in DMPC vesicles containing varying concentrations ofDMPE are determined and shown in Figure 5a. The representa-tive plots showing the increase in the fluorescence intensity of thethree oxicam drugs with increase in lipid concentration are givenin Figure 5b(i�iii) that have lipid compositions of DMPC and 10mol % of DMPE. Similar kinds of plots as in Figure 5b (i�iii)were obtained for all other lipid compositions and are given in theSupporting Information [Figure S1a(i�iii) and Figure S1b-(i�iii)]. The partition coefficients were calculated from a non-linear fit of the data using eq 1. The values of Imax in eq 1 werecalculated from the linear plot of eq 2, which are given in theinsets of Figure 5b(i�iii). In the case of Figures S1a (i�iii) andS1b(i�iii), the insets contain the respective plots for thedetermination of the values of Imax.Figure 5a clearly shows that with increasing concentration of
DMPE in DMPC vesicles the partitioning of Mx increasessignificantly. However, the KP values of Px and Tx decrease withthe increase in the mol % of DMPE. The values ofKP at 30 mol %of DMPE show very weak partitioning of Tx inside the vesicles.From Figure 5a, it is evident that the most hydrophobic drugamong the three oxicam NSAIDs, that is, Mx [log P (octanol/water) = 0.7], partitioned maximally inside the DMPE contain-ing DMPC SUVs, whereas the most hydrophilic one, that is, Tx[log P (octanol/water) =�0.75] showsminimum partitioning. Px[log P (octanol/water) =�0.14] having intermediate hydrophiliccharacter also shows a decrease in the KP values with an increasein DMPE concentration in the vesicles which is less pronouncedthan that in the case of Tx.10,45 It can therefore be concluded thatincorporation of DMPE in DMPC vesicles makes the bilayer moreand more hydrophobic. Strong interaction of PE headgroups withneighboring lipids results in the formation of amore closely packedlipid bilayer,15,23 along with the fact that PE headgroups areassociated with fewer water molecules,46 result in increasedhydrophobicity of the mixed bilayers. This allows the lipophilicdrugMx to go deeper inside the bilayer but makes it more difficultfor the relatively hydrophilic drugs Px andTx to partition inside thevesicles.Effect on Lipid Mixing. The time courses obtained from the
lipid mixing assay in the presence ofMx and in the absence of anydrug, that is, the control, are represented in Figure 6a(i) and b(i),respectively. The time courses in the presence of the other twodrugs, namely, Px and Tx, are given as the Supporting Informa-tion Figure S2a(i) and S2b(i), respectively. The extent of lipidmixing in the presence of all the drugs is much larger than inabsence of them. The values of rate constants of lipid mixing,calculated from the time courses, are given in Table 1 and plotted
Figure 4. DSC thermograms showing the plot of specific heat (CP) as afunction of temperature for DMPC vesicles containing 10 mol %DMPE(i), 20 mol % DMPE (ii), and 30 mol % DMPE (iii) in the presence of30 μM of oxicam NSAIDs, namely, Mx, Px, and Tx, for all the cases andat pH 7.4. The scan rates were 20 �C/h for all the experiments.
15060 dx.doi.org/10.1021/la2030186 |Langmuir 2011, 27, 15054–15064
Langmuir ARTICLE
in Figure 7a. The rate constant of lipid mixing for Mx firstincreases rapidly when 10 mol % DMPE is present in DMPCSUVs but then sharply falls as the DMPE content increases in thevesicles. A similar trend is also found in case of lipid mixing rates,in the presence of the other two drugs and in the absence of anydrug, that is, for control. However, only in case of Mx, there is adramatic increase with subsequent decrease in lipid mixing rates.The values of lipid mixing rates for all the mixed bilayers decreasein the order Mx > Px > Tx. This follows the trend in the extent ofpartitioning in the bilayer.In contrast to the lipid mixing rates, there is a continuous
increase in the extent of lipid mixing in the presence of increasingDMPE concentration. The extents of lipid mixing in presence ofthe three drugs at various concentration of DMPE inDMPCSUVsare given in the inset of the Figure 7a. The sharp increase in theextent of lipid mixing in the case of Mx means that the number ofvesicles undergoing fusion has increased rapidly. This increase inextent is less pronounced in the presence of Px and Tx.Effect on Content Mixing and Leakage. The time courses
obtained from the content mixing assay and leakage assay inthe presence of Mx and in the absence of any drug, that is, thecontrol, are represented in Figure 6a(ii) and b(ii), respectively,for content mixing assay and Figure 6a(iii) and b(iii), respec-tively, for leakage assay. The time courses of content mixing assayand leakage assay in the presence of the other two drugs, namely,Px and Tx, are given in Supporting Information Figure S2a(ii)and b(ii) for content mixing assay and Figure S2a(iii) and b(iii)
for leakage assay, respectively. The values of rate constants ofcontent mixing and leakage, calculated from these time courses,are given in Table 1 and plotted in Figure 7b for content mixing.For all cases, the lipid mixing rates are much faster than thecontent mixing rates which are consistent with the sequentialfusion model as shown by us.11,12 The rate constants of contentmixing for Mx first increase rapidly up to 20 mol % DMPE butthen sharply fall as the DMPE content increases to 30 mol %.Such a dramatic change in content mixing rates is not seen in thecase of the other two drugs Px and Tx as well as the control.However, a closer look at Table 1 shows a similar trend in all theother cases, namely, Px, Tx, and control, but the changes in valuesare rather small. The extent of content mixing, as presented in theinset of Figure 7b, shows a mild increase up to 20 mol % DMPEpresent in DMPC vesicles for Mx and then a sharp increase at 30mol % DMPE. Such a large increase is not seen in other cases. Itshould be noted that, for all the drugs including the control,content mixing maximizes at 20 mol % DMPE, which is incontrast to lipid mixing rates that maximize at 10 mol %. Thereason for this discrepancy will be explained in the Discussionbelow. Our leakage data show that leakage is more competitivewith content mixing than the preceding lipid mixing events.
4. DISCUSSION
Headgroup size mismatch keeping the lipid tails identicaldoes not simply affect the packing as expected. Several otherlipid parameters are also altered. It is known that spontaneous
Figure 5. (a) Plot of calculated values of partition coefficient (KP) of the oxicam NSAIDs, namely, Mx, Px, and Tx, between the DMPC vesiclescontaining varying concentration of DMPE vs mol % of lipid. The concentration of the drugs remained constant at 30 μM. Other experimentalconditions remained the same. (b) Plot of relative fluorescence intensity of Mx (i), Px (ii), and Tx (iii) vs mole concentration of DMPC containing 10mol % DMPE added. All the drugs used have the concentration of 30 μM, and the temperature and the pH of the experiments were 39 �C and 7.4,respectively. Plots of 1/ΔF vs 1/[L] for the respective drugs are plotted and are given in the insets of b(i�iii).

15061 dx.doi.org/10.1021/la2030186 |Langmuir 2011, 27, 15054–15064
Langmuir ARTICLE
trans-bilayer flip-flop movements are strongly affected by thepresence of 10�30 mol % DMPE in DMPC vesicles, leading to adecrease in spontaneous fluctuation defects, which in turn areknown to decrease fusion.9 Besides, mismatch in packing be-tween PE and PC headgroups leads to altered curvature, therebyincreasing the average diameter of the vesicles as seen from ourTEM studies. It should be mentioned that significant changes inaverage diameter occur only at 20 mol % and it becomes almostdouble at 30 mol % DMPE. An increase in diameter results in adecrease in vesicle curvature which is known to affect the fusionevents adversely.44 Also, an increase in diameter inhibits trans-bilayer movements whose effect is to decrease fusion synergisti-cally. Another important effect comes from the heterogeneousdistribution of DMPC and DMPE. DMPEs are known to occupythe outer monolayer more at a low concentration of DMPE in theSUVs. At higher concentration (30 mol % or more), the distribu-tion ofDMPE increases in the innermonolayer as compared to theouter monolayer. Since both DMPE and DMPC have differentshapes and formmonolayers with different spontaneous curvature,
this disparity in DMPE distribution affects the spontaneouscurvature of the bilayer.
Heterogeneity and the broadening in the transition tempera-ture as seen in our DSC thermograms is a clear indicator of thepresence of coexisting gel and fluid domains. What is interestingis that the presence of the three drugs does not affect the domainsbut decreases the gel�sol transition temperature enthalpy. In theabsence of the drugs, increasedΔH values with increasingDMPEfractions are due to stronger intermolecular attraction particu-larly between the headgroups. As a consequence of this stronginteraction between the headgroups, there is a closer packing ofthe lipid molecules resulting in a decrease in area occupied perlipid molecule and more aligned tails. This hinders the mobilityof the lipid tails as they get less room to move freely. Thishindered mobility of the tails is consistent with the fact that thereis a reduction in the spontaneous fluctuation defects. Eventhough the trend remains same for each drug, the ΔH valuesdecrease with the hydrophilicity of the drugs.45 This couldindicate that the gel�sol transition is less inhibited with
Figure 6. (a) Drug dependent lipidmixing followed byN-NBD-PE/NRh-PE assay (i); content mixing assay followed by Tb-DPA assay (ii); and leakagefollowed byTb-DPA assay (iii) of DMPC vesicles containing DMPE of different concentrations asmentioned with time for 30μMMx. The time courseswere fit to single exponential curves [f = a(1� exp(�kt))] using Origin 7.0. The temperature was kept constant at 39 �C throughout the experiments.(b) Lipidmixing followed byN-NBD-PE/NRh-PE assay (i); contentmixing assay followed by Tb-DPA assay (ii); and leakage followed by Tb-DPA assay(iii) of DMPC vesicles containing DMPE of different concentrations as mentioned with time. In control, no drugs were added; only DMSO having thesame volume as the drug was mixed. The time courses were fit to single exponential curves [f = a(1� exp(�kt))] using Origin 7.0. The temperature waskept constant at 39 �C throughout the experiments.

15062 dx.doi.org/10.1021/la2030186 |Langmuir 2011, 27, 15054–15064
Langmuir ARTICLE
increasing hydrophilicity of the drugs. We have deliberately keptthe working temperature at 39 �Cwhere the gel�sol transition iscomplete.
The extent of interaction of the drugs with these mixedbilayers having altered lipidic parameters is best quantized bytheir partition coefficients. Our results show that the mosthydrophobic drug Mx shows a large increase in partitioning withincreasing DMPE, whereas for both Px and Tx the partitioncoefficient decreases. There are two factors that work together tomake the mixed bilayers more hydrophobic. As has been men-tioned above, the PE headgroup has a greater ability to interactstrongly with neighboring lipid molecules than PC, leading to aclose-packed lipid bilayer with aligned hydrocarbon tails. Also,due to the shape and smaller size of the PE headgroups, fewerwater molecules are associated with it which makes the PEheadgroup more dehydrated compared to PC. These two factorstogether lead to a more hydrophobic bilayer interior. Mx beingthe most hydrophobic drug45 prefers the more hydrophobicbilayer environment as compared to Px and Tx.
Compared to the pure DMPC bilayer, which does not showany fusion under the experimental conditions used, someamount of fusion is seen in the case of DMPC-DMPE mixedvesicles. This is expected since DMPE is known to induce fusion
due to its ability to form the inverted hexagonal phase (HII),which in turn creates a negative spontaneous curvature of thebilayer that helps to stabilize the fusion intermediates and hencefacilitates fusion.47 The increase in lipid mixing rates at 10 mol %DMPE in the presence and absence of the drugs is due tothe increase in spontaneous fluctuation defects and thereby theincrease in flip-flop motion due to the decrease in activation freeenergy of trans-bilayer motion.1 Curvature does not play any roleat this concentration. TEM studies have indicated identicalaverage diameter compared to that of pure DMPC vesicles.However, this trans-bilayer motion is hindered at 20 and 30 mol %DMPE due to a more close packing of the headgroups, leading toa subsequent decrease in lipid mixing. Moreover a decrease incurvature also acts synergistically to decrease fusion. The ratesare maximum for Mx that shows highest partitioning followed byPx and Tx, whose partitioning decreases in that order. As shownby our previous studies,10,11 higher partitioning promotes fusion.
In contrast to lipid mixing, content mixing rates maximize at20 mol % DMPE. To elucidate this discrepancy, one needs torevisit the fusion pathway of protein-free lipidic fusion.9 Twotypes of intermediates dominate the fusion pathway, namely,hemifusion intermediate state or “stalk” that require extensivelipidic motion for effective mixing and fusion pore opening
Table 1. Calculated Values of Rate Constants of Lipid Mixing, Content Mixing, and Leakage in the Presence of Oxicam NSAIDs,namely, Mx, Px, and Tx, and in the Absence of Drugs (Control)a
DMPC/DMPE control meloxicam piroxicam tenoxicam
lipid mixing assay
100:0 0 (2.45( 0.04)� 10‑3 (7.81( 1.50)� 10‑3 (4.60( 0.32)� 10‑3
90:10 (4.56( 0.08)� 10‑3 (25.17( 0.57)� 10‑3 (8.46( 0.85)� 10‑3 (6.52( 0.76)� 10‑3
80:20 (2.71( 0.03)� 10‑3 (15.39( 0.75)� 10‑3 (6.15( 0.61)� 10‑3 (3.71( 0.09)� 10‑3
70:30 (2.22( 0.03)� 10‑3 (7.23( 0.45)� 10‑3 (5.19( 0.43)� 10‑3 (2.36( 0.10)� 10‑3
content mixing assay
100:0 0 (0.99( 0.12)� 10‑3 (0.52( 0.06)� 10‑3 (0.42( 0.05)� 10‑3
90:10 (0.43( 0.03)� 10‑3 (3.63( 0.17)� 10‑3 (0.76( 0.04)� 10‑3 (0.68( 0.07)� 10‑3
80:20 (0.44( 0.04)� 10‑3 (7.17( 0.26)� 10‑3 (0.86( 0.06)� 10‑3 (0.71( 0.05)� 10‑3
70:30 (0.23( 0.06)� 10‑3 (0.61( 0.05)� 10‑3 (0.41( 0.02)� 10‑3 (0.28( 0.02)� 10‑3
leakage assay
100:0 0 (2.95( 0.10)� 10‑3 (1.11( 0.40)� 10‑3 (1.92( 0.17)� 10‑3
90:10 (6.09 ( 0.15)� 10‑3 (1.38( 0.03)� 10‑3 (3.68( 0.12)� 10‑3 (3.81( 0.25)� 10‑3
80:20 (3.59( 0.08)� 10‑3 (2.07( 0.03)� 10‑3 (6.71( 0.31)� 10‑3 (2.34( 0.07)� 10‑3
70:30 (2.74( 0.04)� 10‑3 (1.69( 0.02)� 10‑3 (1.22( 0.05)� 10‑3 (1.46( 0.10)� 10‑3
aThe concentration of the drugs remained constant at 30 μM, and the temperature and pH were kept at 39 �C and 7.4, respectively, throughout theexperiments.
Table 2. Gel to Fluid Phase Transition Enthalpy Values in kJ mol�1 of DMPE Containing DMPCVesicles [DMPE ConcentrationVaries from 10 mol % to 20 mol % and Finally to 30 mol %] and in the Absence and in the Presence of 30 μMOxicam NSAIDs AsObtained from the DSC Experiments
enthalpy of phase transition (kJ mol‑1)
DMPC/DMPE no drug meloxicam [log P = 0.7]a piroxicam [log P = �0.14]a tenoxicam [log P = �0.75]a
100:0 10.24 ((0.41) 7.59 ((0.07) 5.31 ((0.04) 4.60 ((0.06)
90:10 17.66 ((0.13) 12.72 ((0.15) 11.38 ((0.09) 9.83 ((0.04)
80:20 24.14 ((0.45) 19.30 ((0.18) 16.61 ((0.14) 14.71 ((0.15)
70:30 22.34 ((0.34) 19.79 ((0.12) 17.27 ((0.08) 16.46 ((0.4)aThe log P (octanol/water) values are taken from the ref 45.

15063 dx.doi.org/10.1021/la2030186 |Langmuir 2011, 27, 15054–15064
Langmuir ARTICLE
leading to content mixing. Hemifusion intermediate involvesmixing of the outer leaflet of the opposedmembranes without theparticipation of the inner bilayer. Forming a stable fusion poreleading to content mixing requires the mixing of the inner leafletof the bilayers.48 Hemifusion intermediate requires an extensiveouter leaflet lipid molecule rearrangement attaining a net nega-tive curvature, whereas the subsequent formation of the fusionpore requires a typical arrangement of the inner monolayer toattain a net positive curvature.49 It is well established that DMPEhas a conelike effective shape and tends to form monolayers withnet negative curvature.48 As mentioned earlier, DMPE occupiesmainly the outer leaflet in DMPC-DMPE bilayers at 10 mol %DMPE. At 20 mol % DMPE, its concentration further increasesin the outer leaflet, but there is an accompanying decrease in thetrans-bilayer movement. The presence of DMPE in the outerleaflet promotes negative curvature due to lipid mixing up to 10mol % DMPE, leading to an increase in lipid mixing as well asstable hemifusion formation and finally content mixing. Beyondthis concentration, the lipid mixing rates decrease due torestricted trans-bilayer motion. On the other hand, stable poreformation leading to content mixing requires positive curvature
of the inner leaflet which is promoted by the presence of lessDMPE and hence more DMPC in the inner monolayer up to 20mol % DMPE. Beyond 20 mol %, DMPE starts moving towardthe inner monolayer which in turn hinders the positive curvatureof the inner layer thereby inhibiting pore formation and contentmixing. Moreover, the subsequent decrease in content mixingrates is also due to the decrease in spontaneous fluctuationdefects arising from trans-bilayer flip-flop motion and also due toreduction in curvature. Here too the values of the content mixingrates follow the same trend as lipid mixing with Mx > Px > Tx.
To sum up our results, the headgroup mismatches result inaltering several lipid parameters which all affect the fusion event.The changes in these lipid parameters and the oxicamNSAIDs workhand in hand to either induce or inhibit the fusion process. Theamplification of the effect of NSAIDs on the fusion event at allintermediate states such as lipidmixing and contentmixing is directlydependent on the extent of partitioning of the drugs in the bilayer.
’ASSOCIATED CONTENT
bS Supporting Information. Additional figures. This materi-al is available free of charge via the Internet at http://pubs.acs.org.
’AUTHOR INFORMATION
Corresponding Author*Fax: +91-33-23374637. E-mail: [email protected].
’ACKNOWLEDGMENT
We acknowledge the help of Mr. Pulak Ray and Mr. AjayChakrabarti of Biophysics Division of Saha Institute of NuclearPhysics for their help in TEM. We also thank Prof. DipakDasgupta of Biophysics Division for useful suggestions duringthe DSC experiments.
’REFERENCES
(1) Wimley, W. C.; Thompson, T. E. Biochemistry 1991, 30,1702–1709.
(2) Wimley, W. C.; Thompson, T. E. Biochemistry 1990, 29,1296–1303.
(3) Papahadjopoulos, D.; Jacobson, K.; Nir, S.; Isac, T. Biochim.Biophys. Acta 1973, 311, 330–348.
(4) Wong, M.; Thompson, T. E. Biochemistry 1982, 21, 4126–4132.(5) Wiedemann, C. Nat. Rev. Neurosci. 2009, 10, 172.(6) Stein, K. K.; Primakoff, P.; Myles, D. J. Cell Sci. 2004, 117,
6269–6274.(7) Rothman, J. E.; S€ollner, T. H. Science 1997, 276, 1212–1213.(8) Harrison, S. C. Nat. Struct. Mol. Biol. 2008, 15, 690–698.(9) Cevc, G.; Richardsen, H. Adv. Drug Delivery Rev. 1999, 38,
207–232.(10) Chakraborty, H.; Mondal, S.; Sarkar, M. Biophys. Chem. 2008,
137, 28–34.(11) Mondal, S.; Sarkar, M. J. Phys. Chem. B 2009, 113, 16323–16331.(12) Mondal Roy, S.; Bansode, A. S.; Sarkar, M. Langmuir 2010,
26, 18967–18975.(13) Chakraborty, H.; Chakraborty, P. K.; Raha, S.; Mandal, P. C.;
Sarkar, M. Biochim. Biophys. Acta, Biomembr. 2007, 1768, 1138–1146.(14) Chen, E. H.; Olson, E. N. Science 2005, 308, 369–373.(15) Nussio, M. R.; Voelcker, N. H.; Sykes, M. J.; McInnes, S. J. P.;
Gibson, C. T.; Lowe, R. D.; Miners, J. O.; Shapter, J. G. Biointerphases2008, 3, 96–104.
(16) Ishii, F.; Nii, T. Colloids Surf., B 2005, 41, 257–262.
Figure 7. (a) Plot of calculated values of rate constants of lipid mixingof DMPC vesicles containing several concentrations of DMPE, namely,10, 20, and 30 mol %, in the presence of 30 μMMx, Px, and Tx vs mol %DMPE at similar experimental conditions. The inset shows a plot of theextent (a) of lipid mixing of DMPC vesicles containing several ofconcentrations of DMPE, namely, 10, 20, and 30 mol %, in the presenceof 30 μMMx, Px, and Tx vs mol % DMPE present in the mixed vesicles.(b) Plot of calculated values of rate constants of content mixing ofDMPC vesicles containing several of concentrations of DMPE, namely,10, 20, and 30 mol % in the presence of 30 μMMx, Px, and Tx vs mol %DMPE at similar experimental conditions. The inset shows a plot of theextent (a) of content mixing of DMPC vesicles containing several ofconcentrations of DMPE, namely, 10, 20, and 30 mol %, in the presenceof 30 μMMx, Px, and Tx vs mol % DMPE present in the mixed vesicles.

15064 dx.doi.org/10.1021/la2030186 |Langmuir 2011, 27, 15054–15064
Langmuir ARTICLE
(17) Nussio, M. R.; Liddell, M.; Sykes, M. J.; Miners, J. O.; Shapter,J. G. J. Scanning Probe Microsc. 2007, 2, 41–45.(18) Domenech, O.; Sanz, F.; Montero, M. T.; Harnandez-Borell, J.
Biochim Biophys. Acta 2006, 1758, 213–221.(19) Chiantia, S.; Ries, J.; Kahya, N.; Schwille, P. ChemPhysChem
2006, 7, 2409–2418.(20) Kraft,M. L.;Weber, P. K.; Longo,M. L.; Hutcheon, I. D.; Boxer,
S. G. Science 2006, 313, 1948–1951.(21) Silvius, J. Biochim. Biophys. Acta 1986, 857, 217–228.(22) Leekumjorn, S.; Sum, A. K. Biophys. J. 2006, 90, 3951–3965.(23) Kranenburg, M.; Smit, B. J. Phys. Chem. B 2005, 109,
6553–6563.(24) Lentz, B. R.; Litman, B. J. Biochemistry 1978, 17, 5537–5543.(25) de Vries, A. H.; Mark, A. E.; Marrink, S. J. J. Phys. Chem. B 2004,
108, 2454–2463.(26) Chapman, D.; Urbina, J. J. Biol. Chem. 1974, 249, 2512–2521.(27) Yeagle, P. L.; Hutton, W. C.; Huang, C.-H.; Martin, R. B.
Biochemistry 1976, 15, 2121–2124.(28) Sugar, I. P.; Monticelli, G. Biophys. Chem. 1983, 18, 281–289.(29) Stillwell, W.; Brengle, B.; Cheng, Y. F.; Wassall, S. R. Phyto-
chemistry 1991, 30, 3539–3544.(30) Georgiev, G. A.; Sarker, D. K.; Al-Hanbali, O.; Georgiev, G. D.;
Lalchev, Z. Colloids Surf., B 2007, 59, 184–193.(31) Huang, C. H. Biochemistry 1969, 8, 344–352.(32) Chakraborty, H.; Roy, S.; Sarkar, M. Chem. Phys. Lipids 2005,
138, 20–28.(33) Fiske, C. H.; Subbarow, Y. J. Biol. Chem. 1925, 66, 375–400.(34) Tsai, R. S.; Carrupt, P. A.; Tayar, N. E.; Giroud, Y.; Andrade, P.;
Testa, B. Helv. Chim. Acta 1993, 76, 842–854.(35) Banerjee, R.; Chakraborty, H.; Sarkar, M. Spectrochim. Acta,
Part A 2003, 59, 1213–1222.(36) Santos, N. C.; Prieto, M.; Castanho, M. A. R. B. Biochim.
Biophys. Acta 2003, 1612, 123–135.(37) Barrantes, F. J.; Antollini, S. S.; Blanton, M. P.; Prieto, M. J. Biol.
Chem. 2000, 275, 37333–37339.(38) Wang, J. L.; Edelman, G.M. J. Biol. Chem. 1971, 246, 1185–1191.(39) Hoekstra, D.; D€uzg€unes-, N. InMethods in Enzymology; D€uzg€unes-,
N., Ed.; Academic Press, Inc.: San Diego, 1993; Vol. 220, pp 15�32.(40) D€uzg€unes-, N.; Bagatolli, L. A.; Meers, P.; Oh, Y.-K.; Straubinger,
R. M. In Liposomes: A Practical Approach, 2nd ed.; Torchilin, V., Weissig,V., Eds.; Oxford University Press: New York, 2003; pp 113�116.(41) D€uzg€unes-, N.; Wilschut, J. In Methods in Enzymology;
D€uzg€unes-, N., Ed.; Academic Press, Inc.: San Diego, 1993; Vol. 220,pp 3�14.(42) Sundler, R.; D€uzg€unes-, N.; Papahadjopoulos, D. Biochim.
Biophys. Acta 1981, 649, 751–758.(43) Nordlund, J. R.; Schmidt, C. F.; Dicken, S. N.; Thompson, T. E.
Biochemistry 1981, 20, 3237–3241.(44) Nir, S.; Wilschut, J.; Bentz, J. Biochim. Biophys. Acta 1982, 688,
275–278.(45) Luger, P.; Daneck, K.; Engel, W.; Trummlitz, G.; Waguer, K.
Eur. J. Pharm. Sci. 1996, 4, 175–187.(46) Gruner, S. M.; Cullis, P. R.; Hope, M. J.; Tilcock, C. P. S. Annu.
Rev. Biophys. Biophys. Chem. 1985, 14, 211–238.(47) Kinnunen, P. K. J. In Handbook of Nonmedical Applications of
Liposomes; Lasic, D. D., Barenholz, Y., Eds.; CRC Press, Inc.: BocaRaton, FL, 1996, Vol. 1, pp 153�171.(48) Chernomordik, L. V.; Kozlov, M. M. Nat. Struct. Mol. Biol.
2008, 15, 675–683.(49) Chernomordik, L. V.; Chanturiya, A.; Green, J.; Zimmerberg, J.
Biophys. J. 1995, 69, 922–929.


