Embed Size (px)
Citation preview

REPORT DOCUMENTATION PAGE Form Approved
OMB No. 0704-0188 Public reporting burden for this collection of information is estimated to average 1 hour per response, including the time for reviewing instructions, searching existing data sources, gathering and maintaining the data needed, and completing and reviewing this collection of information. Send comments regarding this burden estimate or any other aspect of this collection of information, including suggestions for reducing this burden to Department of Defense, Washington Headquarters Services, Directorate for Information Operations and Reports (0704-0188), 1215 Jefferson Davis Highway, Suite 1204, Arlington, VA 22202-4302. Respondents should be aware that notwithstanding any other provision of law, no person shall be subject to any penalty for failing to comply with a collection of information if it does not display a currently valid OMB control number. PLEASE DO NOT RETURN YOUR FORM TO THE ABOVE ADDRESS.
1. REPORT DATE (DD-MM-YYYY)
08-12-2008 2. REPORT TYPE
Technical Paper & Briefing Charts 3. DATES COVERED (From - To)
4. TITLE AND SUBTITLE
5a. CONTRACT NUMBER
Effect of Variable Phase Transverse Acoustic Fields on Coaxial Jet Forced Spread
Angles (Preprint)
5b. GRANT NUMBER
5c. PROGRAM ELEMENT NUMBER
6. AUTHOR(S)
Juan I. Rodriguez, Jeffrey Graham, Ivett A. Leyva, & Douglas Talley (AFRL/RZSA) 5d. PROJECT NUMBER
5f. WORK UNIT NUMBER
23080533
7. PERFORMING ORGANIZATION NAME(S) AND ADDRESS(ES)
AND ADDRESS(ES)
8. PERFORMING ORGANIZATION REPORT NUMBER
Air Force Research Laboratory (AFMC)
AFRL/RZSA
10 E. Saturn Blvd.
Edwards AFB CA 93524-7680
AFRL-RZ-ED-TP-2008-579
9. SPONSORING / MONITORING AGENCY NAME(S) AND ADDRESS(ES) 10. SPONSOR/MONITOR’S ACRONYM(S)
Air Force Research Laboratory (AFMC)
AFRL/RZS 11. SPONSOR/MONITOR’S
5 Pollux Drive
NUMBER(S)
Edwards AFB CA 93524-7048 AFRL-RZ-ED-TP-2008-579
12. DISTRIBUTION / AVAILABILITY STATEMENT
Approved for public release; distribution unlimited (PA #08475A).
13. SUPPLEMENTARY NOTES
For presentation at the 47th
AIAA Aerospace Sciences Meeting and Exhibit, Orlando, FL, 5-8 January 2009.
14. ABSTRACT
An experimental study on the effects of a variable phase transverse acoustic field on the inner jet spreading angle of a N2 shear
coaxial jet at nearcritical pressures is presented. The jet spreading angle is an important parameter which characterizes the mixing
between two flows. The transverse acoustic field is generated by two piezo-sirens which have a variable phase between them so
the position of the jet with respect to the pressure and velocity field can be adjusted. The main parameter investigated is the
spreading angle of the dark inner jet core. The angle measurements are made from approximately 1000 backlit images. The shear
coaxial injector used here is similar to those used in cryogenic liquid rockets. The acoustic field is driven at a frequency of 3.0 ±
0.1 kHz. It was observed that acoustic forcing has the strongest effect on the inner jet spreading angles at moderate values of the
outer to inner jet momentum flux ratio, providing further evidence of the existence of a regime where the inner jet is most
vulnerable to acoustic excitation effects.
15. SUBJECT TERMS
16. SECURITY CLASSIFICATION OF:
17. LIMITATION OF ABSTRACT
18. NUMBER OF PAGES
19a. NAME OF RESPONSIBLE PERSON
Dr. Douglas Talley a. REPORT
Unclassified
b. ABSTRACT
Unclassified
c. THIS PAGE
Unclassified
SAR
35
19b. TELEPHONE NUMBER (include area code)
N/A Standard Form 298 (Rev. 8-98)
Prescribed by ANSI Std. 239.18

Distribution A: Approved for public release; distribution unlimited
1
Effect of Variable Phase Transverse Acoustic Fields on
Coaxial Jet Forced Spread Angles (Preprint)
Juan I Rodriguez1, Jeffrey J Graham
2, Ivett A. Leyva
3 and Douglas Talley
4
Air Force Research Laboratory, Edwards AFB, CA 93524
An experimental study on the effects of a variable phase transverse acoustic field on the
inner jet spreading angle of a N2 shear coaxial jet at nearcritical pressures is presented. The
jet spreading angle is an important parameter which characterizes the mixing between two
flows. The transverse acoustic field is generated by two piezo-sirens which have a variable
phase between them so the position of the jet with respect to the pressure and velocity field
can be adjusted. The main parameter investigated is the spreading angle of the dark inner
jet core. The angle measurements are made from approximately 1000 backlit images. The
shear coaxial injector used here is similar to those used in cryogenic liquid rockets. The
acoustic field is driven at a frequency of 3.0 ± 0.1 kHz. It was observed that acoustic forcing
has the strongest effect on the inner jet spreading angles at moderate values of the outer to
inner jet momentum flux ratio, providing further evidence of the existence of a regime where
the inner jet is most vulnerable to acoustic excitation effects.
I. Introduction
HE study of coaxial jet behavior is of fundamental importance for the understanding of liquid rocket engines
(LRE‟s), since coaxial jet injectors are used in a variety of LRE‟s, including the Space Shuttle Main Engine.
Essential parameters to consider when using a coaxial jet injector are the momentum flux ratio and the conditions of
the combustion chamber. Knowing approximate values of these parameters is important in the early stages of
LRE‟s design so that factors such as propellant mixing behavior and predisposition to combustion instabilities can
be assessed. Improvement of LRE‟s performance has driven the mean combustion chamber pressure of these
devices to conditions where propellants reach a supercritical state. Thus, the following study investigates the
influence of parameters such as momentum flux ratio between the outer and inner jet and mean combustion chamber
pressure in the spreading angles of coaxial jets.
Spreading angles have been studied previously by Chehroudi et al.1 and others. Chehroudi‟s group presented an
extensive study of single round jets spanning subcritical to supercritical pressures, including experimental data on
variable-density gas-gas jets from different researchers in which the main variable investigated was the ratio of the
chamber density to the jet density. This parameter is important when considering the interaction between a single jet
and a quiescent atmosphere. It was shown that for jets at supercritical pressure and temperature the spreading angle
growth rate agreed quantitatively with the predictions of the other research efforts before. In the case of a coaxial
jet, the inner jet spreading angle is also an important parameter since it is an indication of the growth of the shear
layer between the inner and outer streams. Gutmark et al.2 concluded in their coaxial vs. free jet studies that in
coaxial flow configurations more of the surrounding fluid is entrained deeper into the inner jet as compared to the
free jet case, enhancing the overall mixing process. These researchers also found that the geometry of the injector
plays a role as well, with better mixing performance achieved by rectangular injectors compared to circular ones.
Gautam and Gupta3 reported in their cryogenic coaxial injector studies at atmospheric pressures an increase in the
evaporation of the inner jet and enhanced mixing with the surrounding flow with increasing outer to inner
1 Graduate Student, UCLA/ AFRL, Edwards AFB, CA 93524, AIAA Student Member
2 Combustion Research Scientist, AFRL/RZSA, Edwards AFB, CA 93524
3 Lead, Combustion Group, AFRL/RZSA, Edwards AFB, CA 93524, AIAA Senior Member
4 Sr. Aerospace Engineer, AFRL/RZSA, Edwards AFB, CA 93524, AIAA Member
T

Distribution A: Approved for public release; distribution unlimited
2
momentum flux ratio (J). They also change the geometry of their injector setup by modifying the recess length
between the inner jet and the outer jet exits. They found that larger recess lengths promote higher jet expansion and
more entrainment of surrounding gases into the flow. Their shear layer analysis confirms that mixing and jet
expansion are slower at lower J‟s. Zong and Yang4 also find in their numerical study of high pressure coaxial
reactive flow that as the J increases, turbulent mixing is enhanced whereas the inner jet dark core is reduced. Finally,
Richecoeur et al.5 studied an acoustically excited, multiple element, and reactive coaxial injector configuration at
elevated but still subcritical pressure conditions. They found that conditions where combustion became sensitive to
external oscillations happened at lower J‟s. The strong coupling between acoustics and combustion showed an
enhancement of the flame spread which might be associated with improved mixing. However, for combustion
instabilities these “enhanced” mixing might be something to avoid.
This paper focuses on the effects of both the magnitude and gradient of the pressure and velocity fields of an
acoustically forced coaxial jet flow, specifically on the inner jet spreading angles at nearcritical pressures. An earlier
study analyzed the behavior of the inner jet spreading angles at subcritical pressures6. In these studies, we vary the
magnitude and relative position of the jet with respect to the pressure and velocity acoustic field by alternating the
phase between the two acoustic resonators. It has been observed by Leyva et al.7,8
that the effects of acoustics on the
dark core length were the greatest at subcritical pressures and for certain range of momentum flux ratios (1 < J < 4).
This study includes spreading angle results for near-critical and supercritical pressures in the 0.6 < J < 10 range.
Because of the added complexity introduced when working with mixtures, N2 is used as the sole working fluid in
this study.
II. Experimental Setup
The experimental studies reported in this paper were performed at the Air Force Research Laboratory (AFRL)
located at Edwards Air Force Base, CA. The Cryogenic Supercritical Laboratory (EC-4) was the location where the
test took place. An overview of the test section is shown in Fig. 1. Gaseous N2 is used to supply the inner and outer
jet flows and to pressurize the chamber. The outer and inner jets are cooled by two or three heat exchangers (HE‟s)
depending on the plumbing configuration ran. The coolant for both the inner and outer jet is liquid nitrogen obtained
from a cryogenic tank. One heat exchanger cools the inner jet and the other two cool the outer jet. The temperature
(T) of the two jets is controlled by adjusting the flow rate of liquid nitrogen through the HE‟s. The mass flow rate
through the inner and outer jets is measured, before they are cooled, with Porter mass flow meters (122 and 123-
DKASVDAA), since it was found that it is much easier to measure the flow rates at ambient rather than at cryogenic
temperatures. The chamber pressure is measured with a Stellar 1500 transducer. To keep the amplitude of the
acoustic oscillations to a maximum near the jet, an inner chamber was created (Fig. 1). This inner chamber has a
nominal height of 6.6cm, a width of 7.6cm and a depth of 1.3cm.
Figure 1. Overview of the Main Chamber of the Supercritical Flow Facility, EC-4 at AFRL/Edwards.
Inner
Chamber
Coaxial Injector
Acoustic Drivers
Thermocouple and pressure
transducer probe
Distribution A: Approved for public release; distribution unlimited
3
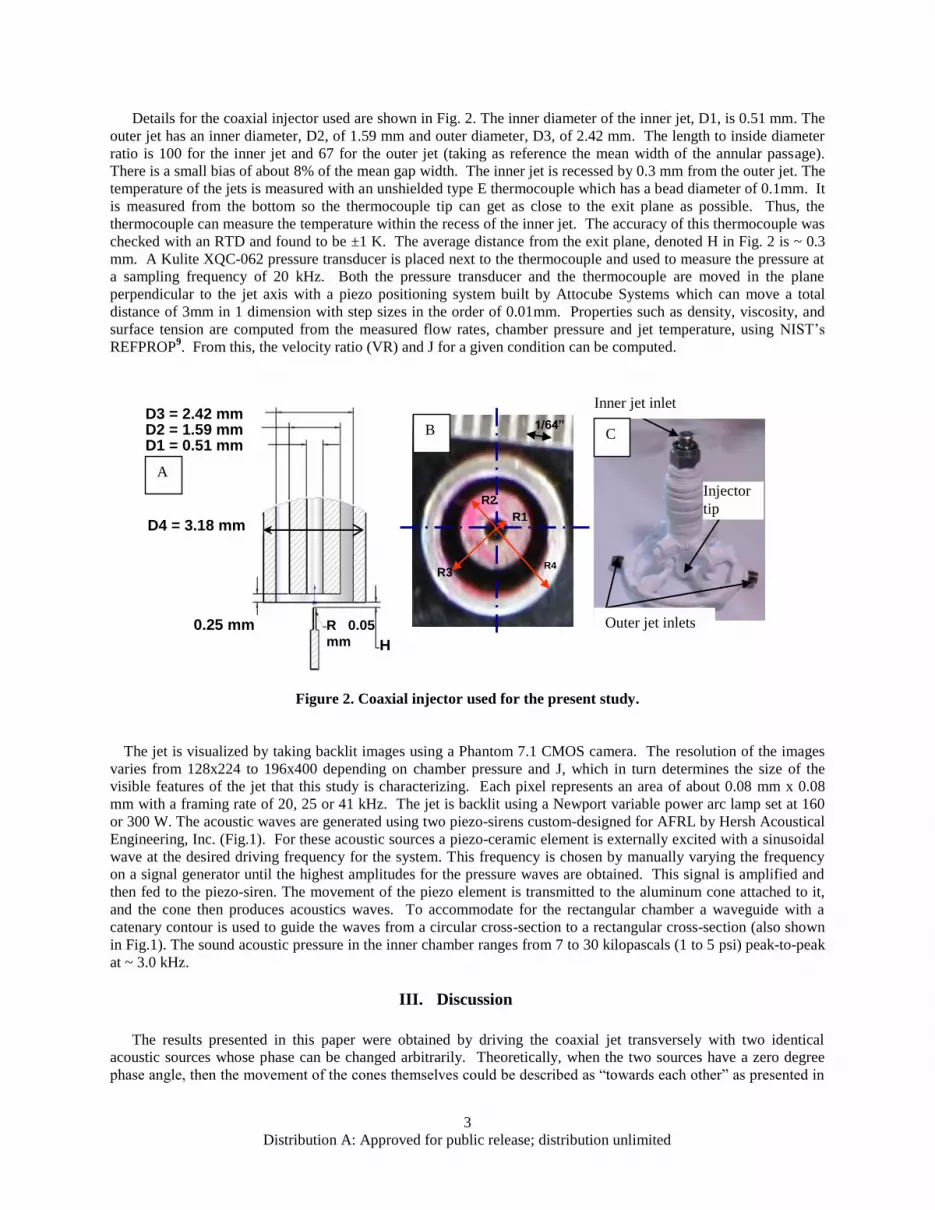
Details for the coaxial injector used are shown in Fig. 2. The inner diameter of the inner jet, D1, is 0.51 mm. The
outer jet has an inner diameter, D2, of 1.59 mm and outer diameter, D3, of 2.42 mm. The length to inside diameter
ratio is 100 for the inner jet and 67 for the outer jet (taking as reference the mean width of the annular passage).
There is a small bias of about 8% of the mean gap width. The inner jet is recessed by 0.3 mm from the outer jet. The
temperature of the jets is measured with an unshielded type E thermocouple which has a bead diameter of 0.1mm. It
is measured from the bottom so the thermocouple tip can get as close to the exit plane as possible. Thus, the
thermocouple can measure the temperature within the recess of the inner jet. The accuracy of this thermocouple was
checked with an RTD and found to be ±1 K. The average distance from the exit plane, denoted H in Fig. 2 is ~ 0.3
mm. A Kulite XQC-062 pressure transducer is placed next to the thermocouple and used to measure the pressure at
a sampling frequency of 20 kHz. Both the pressure transducer and the thermocouple are moved in the plane
perpendicular to the jet axis with a piezo positioning system built by Attocube Systems which can move a total
distance of 3mm in 1 dimension with step sizes in the order of 0.01mm. Properties such as density, viscosity, and
surface tension are computed from the measured flow rates, chamber pressure and jet temperature, using NIST‟s
REFPROP9. From this, the velocity ratio (VR) and J for a given condition can be computed.
Figure 2. Coaxial injector used for the present study.
The jet is visualized by taking backlit images using a Phantom 7.1 CMOS camera. The resolution of the images
varies from 128x224 to 196x400 depending on chamber pressure and J, which in turn determines the size of the
visible features of the jet that this study is characterizing. Each pixel represents an area of about 0.08 mm x 0.08
mm with a framing rate of 20, 25 or 41 kHz. The jet is backlit using a Newport variable power arc lamp set at 160
or 300 W. The acoustic waves are generated using two piezo-sirens custom-designed for AFRL by Hersh Acoustical
Engineering, Inc. (Fig.1). For these acoustic sources a piezo-ceramic element is externally excited with a sinusoidal
wave at the desired driving frequency for the system. This frequency is chosen by manually varying the frequency
on a signal generator until the highest amplitudes for the pressure waves are obtained. This signal is amplified and
then fed to the piezo-siren. The movement of the piezo element is transmitted to the aluminum cone attached to it,
and the cone then produces acoustics waves. To accommodate for the rectangular chamber a waveguide with a
catenary contour is used to guide the waves from a circular cross-section to a rectangular cross-section (also shown
in Fig.1). The sound acoustic pressure in the inner chamber ranges from 7 to 30 kilopascals (1 to 5 psi) peak-to-peak
at ~ 3.0 kHz.
III. Discussion
The results presented in this paper were obtained by driving the coaxial jet transversely with two identical
acoustic sources whose phase can be changed arbitrarily. Theoretically, when the two sources have a zero degree
phase angle, then the movement of the cones themselves could be described as “towards each other” as presented in
H
R 0.05
mm
0.25 mm
D4 = 3.18 mm
D1 = 0.51 mm D2 = 1.59 mm D3 = 2.42 mm
1/64”
R1
R2
R4 R3
Outer jet inlets
Inner jet inlet
Injector
tip
C B
A

Distribution A: Approved for public release; distribution unlimited
4
Figure 3. At the other extreme, when the two sources are at 180 degrees out of phase, then the motion could be seen
as “chasing” each other. For all cases, the two acoustic sources are fed with constant voltages throughout the phase
changes.
Figure 3. Schematic of the two acoustic sources with phase angles of 0° and 180° between them.
Dark Core Spreading Angle
To obtain the inner jet spread angles for a given condition, 998 images such as the one shown in Fig. 4a
were used. A raw image is converted to a black and white image using an image processing technique previously
described in detail in Leyva et al.7,8
. From the black and white image, a contour of the dark core is constructed as
shown in Fig. 4c. We use the dark core to describe the behavior of the inner jet since for our experiments the inner
jet is always colder, thus denser, than the outer jet and appears darker in the backlit images. In order to measure the
two angles, first, the locations of the left and right contours were recorded for each image as pictured in Fig. 4d.
Then, for each row, the leftmost and rightmost contour points from all 998 images were selected to build a
“maximum left contour” and a “maximum right contour” as can be seen in Fig. 5.
Figure 4a. Raw image from high-speed camera. 4b. Black and white conversion after image processing. 4c.
Dark core boundary extracted from the processed black and white image. 4c. Schematic of the left and right
contours used in this study.
A linear fit through each contour was used to calculate the left and right spread angles. In Fig. 5 the two
angles measured, αLeft and αRight, are shown. The linear fit was chosen to start where the contour was the thinnest.
This usually took place between ½ D1 (in supercritical cases at high Js, for example) up to 5 D1 (for cases at
moderate Js) and ended at the mean axial dark core length which is calculated by averaging the extracted axial
length (see Fig. 4b) of all 998 images for each case. The axial dark core length is the axial projection of the dark
core region connected to the injector and is also carefully explained in Leyva et al.7,8
. An important reason for not
choosing the first row of the contour to start the linear fit but begin a few inner jet diameters downstream was to
minimize the effect of a recirculation zone that is generated due to the geometry of our injector. This recirculation
occurs due to a thick inner jet post which prevents the inner jet and outer jet from coming into contact right away
0 ° 180 °
Acoustic
source
Acoustic
source
Right Contour
-10 0 10 20 30 40 50 60 70 80
20
40
60
80
100
120
140
Cont Hist
Cont Hist90
Cont Mat
Hist
Hist90
0 20 40 60
0
10
20
30
40
50
60
70
80
90
100
a
Axial Length
b d c
Left Contour

Distribution A: Approved for public release; distribution unlimited
5
after the inner jet post ends. The recirculation region appears just as dark as the inner jet dark core and biases the
measurements. By starting the linear fit where the contour is the thinnest we expect to avoid some of that bias.
Once the limits for the linear fit are chosen, a line is obtained and the angle associated with it is obtained.
Both left and right angles computed in this manner are shown in Fig. 5. It is the sum of both left and right angles
what is referred to in this study as the “inner jet spreading angle”. This computed spread angle represents the region
the inner jet traveled during the amount of time it took to record the 998 images. For the case of no acoustics, we
call it „maximum baseline spread angle‟. It is important to note that this „maximum baseline spread angle‟ will over
predict the mean of the spread angles. This is because we find the maximum contour out of all the images and then
find a linear fit to the composite contour, instead of fitting a line and finding a spread angle for each image and then
taking the average of those individual angles. When acoustics are present, this spreading angle encompasses a region
where the inner jet traveled during all acoustic cycles captured in the number of images processed. Thus, for the
cases where acoustics are on, this angle is referred to as the „maximum acoustic spread angle‟.
0
20
40
60
80
100
120
140
160
180
200-40 -30 -20 -10 0 10 20 30 40
num
ber
of
pix
els
number of pixels
Figure 5. Left and right angles derived using the maximum displacement of the dark core at each row over a
sample of 998 images.
The chamber pressure for the cases presented in this study is 3.6 MPa. For reference, the critical pressure, Pcr, of
N2 is 3.39 MPa and its critical temperature, Tcr, is 126.2 K. At subcritical pressures, the inner jet reaches the
saturation temperature while for these nearcritical pressures this temperature is kept as close as possible to the
critical value.
Spreading Angle Analysis of Nearcritical Data
Eight nearcritical cases are reported in this study. The momentum flux ratio, J, was varied from 0.55 to 9.3. The
coaxial jet was exposed to different acoustic conditions by varying the phase angle between the acoustic drivers.
Different acoustic conditions at the location of the jet were obtained by varying the phase angle in steps of 45°
starting at 0° and ending at 360°. A „baseline‟ condition, which was a condition were both acoustic drivers were off
was also part of each case. The maximum value of the peak-to-peak pressure perturbation normalized by the mean
chamber pressure for each of the eight cases varied from 0.72%, for the case with J = 0.55, to 0.97%, for the case
with J = 2.1. The maximum inner jet spreading angles, both baseline and acoustic, of all cases are shown in Fig. 6.
αLeft αRight
Maximum Left
Contour
Maximum Right Contour

Distribution A: Approved for public release; distribution unlimited
6
0
10
20
30
40
Sp
rea
din
g A
ng
le (
deg
)
Phase Angle (deg)
J=2.9
Left
Right
Total
0
10
20
30
40
Sp
rea
din
g A
ng
le (
deg
)
Phase Angle (deg)
J=1.1
Left
Right
Total
0
10
20
30
40
Sp
rea
din
g A
ng
le (
deg
)
Phase Angle (deg)
J=2.1
Left
Right
Total
0
10
20
30
40
Sp
rea
din
g A
ng
le (
deg
)
Phase Angle (deg)
J=0.56
Left
Right
Total 0
10
20
30
40
Sp
rea
din
g A
ng
le (
deg
)
Phase Angle (deg)
J=1.0
Left
Right
Total
0
10
20
30
40
Sp
rea
din
g A
ng
le (
deg
)
Phase Angle (deg)
J=1.6
Left
Right
Total
0
10
20
30
40
Sp
rea
din
g A
ng
le (
deg
)
Phase Angle (deg)
J=4.9
Left
Right
Total0
10
20
30
40
Sp
rea
din
g A
ng
le (
deg
)
Phase Angle (deg)
J=9.3
Left
Right
Total
Figure 6. Maximum spread angles as a function of acoustic phase angle for different Js.

Distribution A: Approved for public release; distribution unlimited
7
The behavior of the jet at J = 0.55 shows a very flat distribution of the spreading angles at different acoustic
conditions. Most angles, including the condition with no acoustics present, show a value near 10°. The only
exceptions are the spreading angles obtained at a phase angle of 0° and 360°. At these conditions, the dark core
bends more than the rest of the cases and the inner jet flow penetrates the outer jet and seems to reach the inner
chamber. The following two cases, J = 1.0 and 1.1, show a similar behavior. The values of the spreading angles fall
between 10° and 20° and their corresponding baseline spreading angle values are 16°. For these cases where J is
near or less than 1, acoustic forcing has little or no effect on the spreading angles. For J = 1.6 we observe that half of
the acoustic conditions showing a clear difference between their corresponding spreading angle and the baseline.
The spreading angle here shows a response to the acoustic forcing but there is still not a clear dependence on the
phase angle between acoustic drivers. Similar behavior takes place when J = 2.1 with the average angle for the
acoustic conditions over 20° in contrast with the baseline value of 17°. Both cases show maximum spreading angles
around 25°.
At J = 2.9 and 4.9 a similar but more enhanced behavior is observed. Both have average values for the spreading
angles under acoustic forcing that are significantly higher than their respective baselines. J = 2.9 has an average
spreading angle with acoustics of 26° and a baseline of 17° and for J = 4.9 these values are 27° and 4° respectively.
The effect of acoustics is the highest for these flow conditions. Finally, at J = 9.3, all the spreading are below 7° with
an average of 2°. The reason for this behavior is the very short dark core length of the inner jet, which makes very
difficult to capture any effect the acoustics might be having on it. The dark core itself is very straight until it mixes
completely with its surroundings just a few inner jet diameters downstream the injector exit.
Figure 7. Collection of coaxial jet images at Pchamber = 3.58 MPa, J = 0.55.

Distribution A: Approved for public release; distribution unlimited
8
Figure 8. Collection of coaxial jet images at Pchamber = 3.56 MPa, J = 4.9.
Figure 9. Collection of coaxial jet images at Pchamber = 3.56 MPa, J = 9.3.

Distribution A: Approved for public release; distribution unlimited
9
IV. Conclusions
It was observed that at moderate J values (1.5 < J < 5) the acoustics have the strongest effect on the inner jet
spreading angles. For the case where J is greater than 5, all spreading angles are well below 10° due to a very short
and straight inner jet dark core length. At values of J below 1.5, the spreading angles were consistently higher than
10°; however, the average value of the spreading angle with acoustics was very similar to the spreading angle
without acoustics. Therefore, the effects of the acoustics were not completely clear in this J range either. For the
results presented in this study, the largest inner jet spreading angles with acoustics were obtained for J = 2.9 and 4.9
with 39° and 40° respectively. The largest spreading angles for the spreading angles without acoustics were
obtained for J = 2.1 and 2.9 with both measuring 17°. The maximum peak to peak pressure perturbation as a
percentage of the mean chamber pressure for all cases ranged from 0.72% to 0.97%.
The analysis of the nearcritical cases showed that acoustics has an increasingly larger effect on the inner jet
spreading angles with increasing momentum flux ratio except for the highest value of J where the dark core length
was very short and the spreading angle was very small and independent of the acoustic excitation. This overall trend
was also observed on the subcritical pressure regime by our research group. In summary, the nearcritical data
presented in this study further supports the finding that a range of moderate J values exists for which acoustic
excitation effects are greatly enhanced and could potentially explain improved mixing and disruptive combustion
instability effects observed at lower outer to inner jet velocity ratios.
V. References
1. Chehroudi, B., Talley, D., Coy, E., “Visual characteristics and initial growth rates of round cryogenic jets at subcritical and
supercritical pressure”, Physics of Fluids, Vol. 14, No. 2, February 2002, pp. 851-861.
2. Gutmark, E., Schadow, K. C., Wilson, K. J., “Mixing Enhancement in Coaxial Supersonic Jets”, AIAA-89-1812.
3. Gautam, V., Gupta, A. K., “Simulation of Flow and Mixing from a Cryogenic Rocket Injector”, Journal of Propulsion and
Power, Vol. 23, No. 1, 2007, pp. 123-130.
4. Zong, N., Yang, V., “A Numerical Study of High-Pressure Oxygen/Methane Mixing and Combustion of a Shear Coaxial
Injector”, AIAA-2005-0152.
5. Richecoeur, F., Scouflaire, P., Ducruix, S., Candel, S., “High-Frequency Transverse Acoustic Coupling in a Multiple-Injector
Cryogenic Combustor”, Journal of Propulsion and Power, Vol. 22, No. 4, 2006, pp. 790-799.
6. Rodriguez, J. I., Graham, J. J., Leyva, I. A., Lyu, H.-Y., Talley, D., “On the Inner Jet Spread Angles of Coaxial Jets from
Subcritical to Supercritical Conditions with Preliminary Numerical Results”, 55th JANNAF Propulsion/4th Liquid Propulsion
Subcommittee Meeting, Orlando, FL, December 8-12, 2008.
7. Leyva, I. A., Chehroudi, B., Talley, D., “Dark-core analysis of Coaxial Injectors at Sub-, Near-, and Supercritical Conditions
in a Transverse Acoustic Field”, 54th JANNAF Meeting, Denver, CO, May 14-18, 2007.
8. Leyva, I. A., Chehroudi, B., Talley, D., “Dark-core analysis of Coaxial Injectors at Sub-, Near-, and Supercritical Conditions
in a Transverse Acoustic Field”, AIAA-2007-5456.
9. REFPROP, Reference Fluid Thermodynamic and Transport Properties, Software Package, Ver. 7.0, NIST, U.S. Department
of Commerce, Gaithersburg, MD, 2002.

Distribution A: Approved for public release; distribution unlimited
10
VI. Appendix
A. Data Summary for Nearcritical Cases
Tchamber
(K)
ρchamber
(kg/m3)
Pchamber
(MPa)
Touter
(K)
outer
(mg/s)
ρouter
(kg/m3)
uouter
(m/s)
Tinner
(K)
inner
(mg/s)
ρinner
(kg/m3)
uinner
(m/s)
Freq.
(kHz) VR
P’RMS
Baseline φ=0° φ=45° φ=90° φ=135° φ=180° φ=225° φ=270° φ=315° φ=360° (kPa) J
NEAR
near1 223 56.6 3.58 180 1060 75.4 5.38 123 290 520 2.8 3.08 2.0
Left 4.6 8.7 4.6 5.9 5.8 5.4 6.9 4.3 5.4 11.1
Right 4.8 7.6 5.4 4.7 7.8 5.7 5.8 5.3 6.8 10.7 9.04 0.55
near2 207 62.0 3.57 152 1570 101 5.95 117 289 590 2.4 3.04 2.5
Left 7.6 7.3 7.6 5.3 7.1 7.2 7.1 7.1 5.6 9.7
Right 8.2 7.5 8.0 4.3 4.8 4.8 7.4 9.2 12.0 9.3 10.8 1.0
near3 228 55.1 3.58 185 1590 72.4 8.40 126 293 440 3.3 3.00 2.6
Left 4.7 5.2 5.1 4.6 5.4 5.1 4.0 5.7 5.9 6.0
Right 10.9 13.2 11.8 13.1 9.6 7.5 11.6 8.6 12.0 10.8 11.8 1.1
near4 223 56.1 3.55 184 2170 72.3 11.5 127 294 360 4.0 3.01 2.8
Left 6.9 9.4 6.5 11.9 10.8 7.1 8.0 8.7 9.8 5.2
Right 4.4 7.3 3.6 13.4 9.6 6.8 3.0 10.3 7.3 3.3 11.4 1.6
near5 230 54.2 3.56 199 2120 65.1 12.5 126 292 440 3.3 3.03 3.8
Left 4.7 11.3 9.5 5.7 8.2 7.3 5.8 4.4 3.6 12.1
Right 11.9 12.9 13.1 15.2 15.4 17.1 15.7 12.4 8.3 11.4 12.1 2.1
near6 229 54.5 3.56 183 2690 73.1 14.1 126 292 420 3.4 3.05 4.1
Left 5.8 2.6 6.3 7.3 7.3 8.6 14.2 15.9 20.8 12.6
Right 11.4 14.7 10.0 16.9 14.2 14.1 19.5 17.1 18.5 11.8 11.1 2.9
near7 219 57.6 3.56 194 3080 67.4 17.5 125 289 480 3.0 3.06 5.9
Left 2.2 15.7 7.2 14.1 19.9 14.4 15.4 13.8 15.5 13.7
Right 2.0 12.5 6.2 10.7 20.2 12.5 15.0 11.3 12.0 9.9 11.8 4.9
near8 213 59.6 3.56 192 6460 68.3 36.2 128 295 220 6.6 2.93 5.5
Left 3.5 0.0 0.3 3.1 0.0 0.0 0.0 3.0 1.4 1.9
Right 3.5 0.0 1.4 6.2 1.4 0.0 0.0 3.0 2.3 6.7 9.73 9.3
Spreading Angles
m m
m m

Effect of Variable Phase Transverse Acoustic Fields on Coaxial Jet Forced
Spread Angles
Juan I. Rodriguez*, Jeffrey J. Graham †, Ivett A. Leyva†, Douglas Talley†
*UCLA/Edwards AFRL, †Edwards AFRL,
AIAA 47th Aerospace Sciences Meeting & Exhibit
5 Jan 2009
Distribution A: Approved for public release; distribution unlimited.
2
Outline
• Motivation & Objectives
• Experimental Setup
• Results
• Concluding Remarks
Distribution A: Approved for public release; distribution unlimited.

3
Motivation & Objectives
Reduce combustion instabilities
Characterize mixing enhancement
Unit Physics Problem:
Interaction of acoustics with coaxial jets spanning subcritical
to supercritical pressures
Inner and Outer Jet Spread Angles
Observe effect on jet mixing
Distribution A: Approved for public release; distribution unlimited.

4
Experimental Setup – EC4
Waveguide
Coaxial Injector
Piezo-Siren
A
BThermocouple and
Pressure Transducer
Second
Acoustic
Source
Inner
Chamber
Phase Angle
Setup
Outer Jet:
GN2 or
supercritical
Inner Jet:
GN2 , LN2,
supercritical
Distribution A: Approved for public release; distribution unlimited.

5
Coaxial injector
Outer Jet
Manifold Inner Jet
Inlet
1/64”
R1
R2
R4R3
Injector exit plane
R1 = 0.25 mm
R2 = 0.80 mm
R3 = 1.21 mm
R4 = 1.59 mm
Injector
Distribution A: Approved for public release; distribution unlimited.

6
Inner Jet Spread Angle Study: Behavior of Acoustic Sources at 0° and 180°
0 degrees
(in phase)
180 degrees
(out of phase)
Acoustic
source
Acoustic
source
Distribution A: Approved for public release; distribution unlimited.

7
Test History
No AcousticsOne Acoustic
SourceTwo Acoustic
Sources
Injector for Present Study
Subcritical Subcritical Subcritical
Nearcritical Nearcritical Nearcritical
Supercritical Supercritical Supercritical
New Injector
Subcritical Subcritical Subcritical
Nearcritical (IP*) Nearcritical Nearcritical (IP*)
Supercritical (IP*) Supercritical Supercritical (IP*)
Forcing
Configuration
*Currently In Progress
Inner Jet Spread Angle Results
Distribution A: Approved for public release; distribution unlimited.

8
0
1
2
3
4
5
6
0 5 10 15 20 25
Pch
amb
er(M
Pa)
Momentum Flux Ratio, J
Chamber Pressure vs. Momentum Flux Ratio
Subcritical
Nearcritical
Supercritical
Inner Jet Spread Angle Study: Test Cases
0
1
2
3
4
5
6
100 150 200 250 300
Pch
amb
er(M
Pa)
Jet Temperature (K)
Chamber Pressure vs. Jet Temperature
Subcritical
Subcritical
Nearcritical
Nearcritical
Supercritical
Supercritical
Inner Jet
TemperaturesOuter Jet
Temperatures
Distribution A: Approved for public release; distribution unlimited.

9
Minimum and maximum P’RMS separated by 180°
Inner Jet Spread Angle Study: Acoustic Characterization
0
2
4
6
8
10
12
14
16
18
-45 0 45 90 135 180 225 270 315 360
PR
MS
(kP
a)
Phase Angle (deg)
RMS of Pressure vs. Phase Angle (Nearcritical, J = 2.9)
Both Sources On
Right Source Only
Left Source Only
Both Sources Off
Atmospheric
3.56
3.57
3.58
3.59
3.6
3.61
3.62
3.63
3.64
0 0.5 1 1.5 2 2.5 3 3.5 4 4.5 5 5.5 6
Pre
ssu
re (M
Pa)
Time (ms)
Chamber Pressure vs. Time (Nearcritical, J = 2.9)
Baseline 45° 225°
Distribution A: Approved for public release; distribution unlimited.

10
Inner Jet Spread Angle Study: Acoustic Characterization Results
0%
1%
2%
3%
4%
-45 0 45 90 135 180 225 270 315 360
Δp
pe
ak-t
o-p
eak
/pm
ean
Phase Angle (deg)
J ≈ 9.5
Baseline
0%
1%
2%
3%
4%
-45 0 45 90 135 180 225 270 315 360
Δp
pe
ak-t
o-p
eak
/pm
ean
Phase Angle (deg)
J ≈ 1.0
Baseline
Pressure perturbation relative to overall pressure
significantly higher for subcritical regime
Distribution A: Approved for public release; distribution unlimited.

11
Inner Jet Spread Angle Study: How are angles measured?
Right Contour
-10 0 10 20 30 40 50 60 70 80
20
40
60
80
100
120
140
Cont Hist
Cont Hist90
Cont Mat
Hist
Hist90
0 20 40 60
0
10
20
30
40
50
60
70
80
90
100
Axial Length
Left Contour
0
20
40
60
80
100
120
140
160
180
200-40 -30 -20 -10 0 10 20 30 40
num
ber
of
pix
els
number of pixels
For each
frame
After all
frames have
been
processed
Distribution A: Approved for public release; distribution unlimited.

12
Nearcritical Case with J = 0.55 for different phase angles
Pchamber=3.6 MPa, J=0.55, VR=2.0
Dis
trib
ution A
: A
ppro
ved f
or
public
rele
ase; dis
trib
ution u
nlim
ited.

13
Nearcritical Case with J = 4.9 for different phase angles
Pchamber =3.6 MPa, J=4.9, VR=5.9
Dis
trib
ution A
: A
ppro
ved f
or
public
rele
ase; dis
trib
ution u
nlim
ited.

14
Nearcritical Case with J = 9.3 for different phase angles
Pchamber =3.6 MPa, J=9.3, VR=5.5
Dis
trib
ution A
: A
ppro
ved f
or
public
rele
ase; dis
trib
ution u
nlim
ited.

15
Inner Jet Spread Angle Study: Results at nearcritical pressures with acoustics
0
10
20
30
40
Sp
rea
din
g A
ng
le (
deg
)
Phase Angle (deg)
J=0.55
Left
Right
Total 0
10
20
30
40
Sp
rea
din
g A
ng
le (
deg
)Phase Angle (deg)
J=1.1
Left
Right
Total 0
10
20
30
40
Sp
rea
din
g A
ng
le (
deg
)
Phase Angle (deg)
J=1.6
Left
Right
Total
0
10
20
30
40
Sp
rea
din
g A
ng
le (
deg
)
Phase Angle (deg)
J=2.9
Left
Right
Total 0
10
20
30
40
Sp
rea
din
g A
ng
le (
deg
)
Phase Angle (deg)
J=4.9
Left
Right
Total0
10
20
30
40
Sp
rea
din
g A
ng
le (
deg
)
Phase Angle (deg)
J=9.3
Left
Right
Total
Distribution A: Approved for public release; distribution unlimited.

16
Effect of Phase for Different J and Chamber P
Nearcritical Pressure: 3.55 - 3.58 MPa
0
0.2
0.4
0.6
0.8
1
1.2
-90 -45 0 45 90 135 180 225 270 315 360 405
Phase Angle (degrees)
L w
/ aco
usti
cs/L
baselin
e w
/o a
co
usti
cs
MR=0.55 VR=2.0 MR=1.1 VR=2.6 MR=1.6 VR=2.8
MR=2.1 VR=3.8 MR=2.9 VR=4.1 MR=4.9 VR=5.9
MR=9.3 VR=5.5
Baseline w/o
acoustics
Nearcritical Pressure: 3.55 - 3.58 MPa, Pr=1.04-1.05
0
5
10
15
20
25
-90 -45 0 45 90 135 180 225 270 315 360 405
Phase Angle (degrees)
L/D
1 a
xia
l
Baseline w/o
acoustics
Approximates a single jet – different behavior
Most sensitive at middle J’s –
J range depends on Pchamber
Insensitive at higher J’s
Relative decrease on L is about 0.4 to 0.8 for
most sensitive cases
Jet is most sensitive to acoustics at middle J’s
MR=Mom Fllux Ratio =J
Distribution A: Approved for public release; distribution unlimited.

17
Concluding Remarks
• It was observed that at moderate J values (1.5 < J < 5) the acoustics have the strongest effect on the inner jet spreading angles.
– For J > 5, all spreading angles are well below 10°.
– For J < 1.5, the spreading angles were consistently higher than 10°; however, the average value of the spreading angle with acoustics was very similar to the spreading angle without acoustics.
• Largest inner jet spreading angles
– with acoustics: J = 2.9 and 4.9 with 39° and 40° respectively.
– without acoustics: J = 2.1 and 2.9 both measuring 17°.
• Maximum Δppeak-to-peak/pchamber for all cases ranged from 0.72% to 0.97%.
• Nearcritical data supports the ongoing observation that a range of
moderate J values exists for which acoustic excitation effects are greatly
enhanced and could potentially explain: – improved mixing and,
– disruptive combustion instability effects observed at lower outer to inner jet velocity
ratios
Distribution A: Approved for public release; distribution unlimited.

18
Research Team
• Researchers
– Dr. Ivett A. Leyva, Lead, Combustion Devices Group.
– Dr. Douglas Talley, Senior Research Scientist.
– Dr. Bruce Chehroudi, Principal Scientist, ERC Inc. (On Leave)
– Lt. Jeffrey Graham, Combustion Research Scientist.
– Juan Rodriguez, UCLA Ph.D. Student.
• Mechanical Crew
– Randy Harvey, Earl Thomas, Todd Newkirk (Jacobs Engineering), Dave Hill, ERC
• This work is sponsored by the Air Force Office of Scientific Research under Dr. Mitat Birkan, program manager.
Distribution A: Approved for public release; distribution unlimited.

19
Back Up Slides
Distribution A: Approved for public release; distribution unlimited.

20
0 20 40 60
0
20
40
60
80
100
120
140
160
Lt
Dark-Core Length vs. Momentum Flux Ratio with One Acoustic Source on/off for 2 Length Definitions
Acoustics shorten the curved and axial dark core lengths
irrespective of definition used
LAxial Length Curved Length
1
10
100
0.1 1.0 10.0 100.0
Outer to Inner Jet Momentum Flux
Ratio (MR)
Ax
ial
Da
rk C
ore
Le
ng
th L
/D1
subcritical P acoustics
off
nearcritical P
acoustics off
supercritical P
acoustics off
subcritical P acoustics
on
nearcritical P
acoustics on
supercritical P
acoustics on
1
10
100
0.1 1.0 10.0 100.0
Outer to Inner Jet Momentum
Flux Ratio (MR)
Cu
rve
d D
ark
Co
re L
en
gth
Lt/
D1
sub P, high T acous off
sub P low T acous off
near P high T acous off
near P low T acous on
super P high T acous off
super P low T
near P high T (2)
subl P high T acous on
sub P low T acous on
near P high T acous on
nearP low T acous on
super P high T acous on
super P low T acous on
near P high T (2) acous
onsub P T:180-181K acous
offsub P T:180-181K acous
onGreatest effect of
acoustics ~1<J<~4(J)
(J)
1
10
100
0.1 1.0 10.0 100.0
Outer to Inner Jet Momentum Flux Ratio (MR)
Ax
ial
Da
rk C
ore
Le
ng
th L
/D1
subcritical P acoustics off
nearcritical P acoustics off
supercritical P acoustics off
subcritical P acoustics on
nearcritical P acoustics on
supercritical P acoustics on
2
2
innerinner
outerouter
u
uJ
Dis
trib
ution A
: A
ppro
ved f
or
public
rele
ase;
dis
trib
ution u
nlim
ited.

21
Phase Diagram of Nitrogen
• Supercritical Conditions
– Very large Cp at Critical Point (CP)
– Surface tension vanishes
– Heat of vaporization vanishes above CP
– Distinction between liquid and gas phases disappears above CP
– For mixtures: Critical mixing T & P (critical lines for 2 components)
– Pcr = 3.39 MPa
– Tcr = 126.2 K
Distribution A: Approved for public release; distribution unlimited.

22
Detailed Injector Diagram
3.18
Units are in
millimeters
(mm)
Distribution A: Approved for public release; distribution unlimited.

23
Threshold Technique
• Threshold Images based on Otsu’s method ( N. Otsu, "A Threshold Selection
Method from Gray-Level Histograms,“ IEEE Transactions on Systems, Man, and Cybernetics, vol.
9, no. 1, pp. 62-66, 1979.)
• Accounts for variability from image to image (including D1, the
parameter by which the jet is normalized)
-10 0 10 20 30 40 50 60 70 80
20
40
60
80
100
120
140
Cont Hist
Cont Hist90
Cont Mat
Hist
Hist90
0 20 40 60
0
10
20
30
40
50
60
70
80
90
100
Axial
length (L)
Total or curved
length (Lt) =
average of left
and right sides
Pchamber = 1.50 MPa; VR = 7.5; MR = 2.6; Acoustics On
Distribution A: Approved for public release; distribution unlimited.

24
Test Conditions
Tchamber
(K)
ρchamber
(kg/m3)
Pchamber
(MPa)
Touter
(K)
outer
(mg/s)
ρouter
(kg/m3)
uouter
(m/s)
Tinner
(K)
inner
(mg/s)
ρinner
(kg/m3)
uinner
(m/s)
Freq.
(kHz) VR
P’RMS
Baseline φ=0° φ=45° φ=90° φ=135° φ=180° φ=225° φ=270° φ=315° φ=360° (kPa) J
NEAR
near1 223 56.6 3.58 180 1060 75.4 5.38 123 290 520 2.8 3.08 2.0
Left 4.6 8.7 4.6 5.9 5.8 5.4 6.9 4.3 5.4 11.1
Right 4.8 7.6 5.4 4.7 7.8 5.7 5.8 5.3 6.8 10.7 9.04 0.55
near2 207 62.0 3.57 152 1570 101 5.95 117 289 590 2.4 3.04 2.5
Left 7.6 7.3 7.6 5.3 7.1 7.2 7.1 7.1 5.6 9.7
Right 8.2 7.5 8.0 4.3 4.8 4.8 7.4 9.2 12.0 9.3 10.8 1.0
near3 228 55.1 3.58 185 1590 72.4 8.40 126 293 440 3.3 3.00 2.6
Left 4.7 5.2 5.1 4.6 5.4 5.1 4.0 5.7 5.9 6.0
Right 10.9 13.2 11.8 13.1 9.6 7.5 11.6 8.6 12.0 10.8 11.8 1.1
near4 223 56.1 3.55 184 2170 72.3 11.5 127 294 360 4.0 3.01 2.8
Left 6.9 9.4 6.5 11.9 10.8 7.1 8.0 8.7 9.8 5.2
Right 4.4 7.3 3.6 13.4 9.6 6.8 3.0 10.3 7.3 3.3 11.4 1.6
near5 230 54.2 3.56 199 2120 65.1 12.5 126 292 440 3.3 3.03 3.8
Left 4.7 11.3 9.5 5.7 8.2 7.3 5.8 4.4 3.6 12.1
Right 11.9 12.9 13.1 15.2 15.4 17.1 15.7 12.4 8.3 11.4 12.1 2.1
near6 229 54.5 3.56 183 2690 73.1 14.1 126 292 420 3.4 3.05 4.1
Left 5.8 2.6 6.3 7.3 7.3 8.6 14.2 15.9 20.8 12.6
Right 11.4 14.7 10.0 16.9 14.2 14.1 19.5 17.1 18.5 11.8 11.1 2.9
near7 219 57.6 3.56 194 3080 67.4 17.5 125 289 480 3.0 3.06 5.9
Left 2.2 15.7 7.2 14.1 19.9 14.4 15.4 13.8 15.5 13.7
Right 2.0 12.5 6.2 10.7 20.2 12.5 15.0 11.3 12.0 9.9 11.8 4.9
near8 213 59.6 3.56 192 6460 68.3 36.2 128 295 220 6.6 2.93 5.5
Left 3.5 0.0 0.3 3.1 0.0 0.0 0.0 3.0 1.4 1.9
Right 3.5 0.0 1.4 6.2 1.4 0.0 0.0 3.0 2.3 6.7 9.73 9.3
Spreading Angles
m m
m m
Distribution A: Approved for public release; distribution unlimited.


