Embed Size (px)
Citation preview
RAPID COMMUNICATIONS IN MASS SPECTROMETRY
Rapid Commun. Mass Spectrom. 2008; 22: 2955–2960
) DOI: 10.1002/rcm.3694
Published online in Wiley InterScience (www.interscience.wiley.comEffects of acidification on carbon and nitrogen
stable isotopes of benthic macrofauna from
a tropical coral reef
Joanna Kolasinski1*, Karyne Rogers2 and Patrick Frouin1
1Laboratoire d’Ecologie Marine, Universite de La Reunion, 15 avenue Rene Cassin, BP7151, 97715 Saint-Denis messag cedex 9, La Reunion,
France2National Isotope Centre, GNS Science, 30 Gracefield Road, PO Box 31 312, Lower Hutt, New Zealand
Received 5 May 2008; Revised 23 July 2008; Accepted 24 July 2008
*CorrespoUniversitSaint-DenE-mail: joContract/
Stable isotope analyses are widely used to determine trophic levels in ecological studies. We have
investigated the effects of carbonate removal via acidification on the stable carbon and nitrogen
isotopic composition of 33 species of tropical benthic macrofauna, and we report guidelines for
standardizing this procedure for higher taxa in tropical coral reef ecosystems. Many tropical benthic
invertebrates are small in size, and therefore body tissue isolation (separating organic carbon from
inorganic structures) is difficult and time-consuming. Literature reviews of invertebrate studies show
a lack of consistent procedures and guidelines for preparation techniques, especially for carbonate
removal via acidification of whole individuals. We find that acidification decreases the d13C values of
samples containing carbonate, with shifts ranging from 0.21 to 3.20%, which can be related to CaCO3
content (assessed by a carbonate proxy), justifying acid pre-treatment. Carbonate-containing taxa
benefiting from acidification included Amphinomida, Terebellida (Annelida), Anomura, Brachyura,
Caridea, Amphipoda, Tanaidacea (Arthropoda) and Edwardsiida (Cnidaria). The d13C shifts of
samples containing no carbonate varied up to 0.02W 0.20%. As this induced d13C shift was lower
than the range of an average trophic level shift (0.5 to 1%), we conclude that acid pre-treatment is
unnecessary. Carbonate-free taxa consisted of Eunicida, Phyllodocida (Annelida) and Mollusca. We
note minimal impact of acidification on d15N values except for Brachyura, which showed a shift of
0.83W 0.46%, which is still lower than a single trophic level shift (2.9–3.8%). We conclude that for
trophic level studies, both the d13C and the d15N of carbonate-rich macrofauna can be determined
from the same acidified sample. Copyright # 2008 John Wiley & Sons, Ltd.
Coral reefs are tropical biotopes of great ecological value,
well known for their remarkable biodiversity,1 trophic
complexity,2 and increasingly for their high vulnerability
in coping with anthropogenic stresses. The decline of these
ecosystems is caused primarily by pollution and nutrient
enrichment (eutrophication) from surface runoff or ground-
water.3 Benthic macrofaunal communities (sediment-dwelling
organisms of between 1 and 20mm) rapidly respond to
various human-induced disturbances in a predictable
manner.4 There is growing interest in using benthic
communities as a quality indicator tool for marine ecosys-
tems,5 especially through their trophic structure.6 However,
the food web structures of many coral reef communities are
still poorly known,7 restricting their use as reliable
indicators. Traditional approaches to food web analyses
usually focus on gut content analysis, together with field and
laboratory observations. These approaches are difficult and
ndence to: J. Kolasinski, Laboratoire d’Ecologie Marine,e de La Reunion, 15 avenue Rene Cassin, BP7151, 97715is messag cedex 9, La Reunion, [email protected] sponsor: French Conseil Regional de La Reunion.
time-consuming due to the typically small size of organisms
and low population density in coral reef habitats. Rapid, low-
cost analyses such as the use of stable isotopes are
progressively being developed to study macrofaunal com-
munities in coral reef ecosystems.8,9
More recently, stable isotope analysis has been established
as an alternative approach for investigating relative trophic
positions of organisms.10,11 The d13C values provide
information about the source of carbon entering a food
chain12 whereas the d15N value is used as an indicator of the
relative trophic level.13,14 Isotope ratios of both elements
usually show a constant change along different trophic levels
with a mean trophic split of consumer tissue relative to their
food source of around 2.9 to 3.8% for d15N values and 0.5 to
1% for d13C in marine systems.10,11,15,16 Compared with
temperate systems, few stable isotope studies have been
conducted in coral reef systems, with most dealing with
Scleractinian corals17,18 and primary producers such as
macroalgae,19,20 seagrasses,21 and cyanobacteria.22 Isotope
studies of sediment fauna from coral reefs6,18,23,24 are scarce,
and preparation techniques of tissue samples are often
unclear and differ between studies. Furthermore, some
authors who investigate the carbon stable isotope compo-
Copyright # 2008 John Wiley & Sons, Ltd.
2956 J. Kolasinski, K. Rogers and P. Frouin
sition of whole individuals do not take into consideration the
presence of calcareous structures inside their tissues.
Calcium carbonate (CaCO3) is the principal source of
inorganic carbon in coral reefs25 and one of the major mineral
components of the structure of an organism26 (i.e. exoskeleton
or internal structure). CaCO3 is significantly more enriched in13C than organic carbon27 due to differences between organic
matter synthesis and calcium carbonate precipitation.
Removal of the animal’s internal (i.e. spicules, radula) and
external (i.e. operculum, claw) carbonate structures is thus
required prior to analysis to ensure that only organic carbon is
quantified.28 In most cases, manual extraction of an organ-
ism’s calcareous component is impossible due to its small size
or time constraints.
Sample acidification with diluted hydrochloric acid
(1–2M) has been widely used and is the standard treatment
method for marine sample demineralization.27,29,30 How-
ever, some authors have shown that acidification could lead
to significant decreases in d15N values.27,31 It is assumed that
all nitrogen in animal tissue is organically bound, and is not
removed during the acidification process. A simple verifica-
tion procedure is usedwhich analyzes both the acidified sub-
sample and a portion of the untreated sample to ensure that
the d15N signature is unchanged.
This study provides new data on the effects of acidification
(using HCl) on the isotopic signature of common benthic fauna
found in tropical coral reefs. We report guidelines for
standardizing this procedure in tropical regions. We focus
on higher coral reef macrofauna taxa, which include Annelida
(polychaetes), Arthropoda (crustaceans), Cnidaria (anemones)
and Mollusca (bivalves and gastropods). A key aspect of this
study is the very large number of tropical taxa processed,which
gives a good assessment of the acidification efficiency on each
taxum. For each taxum we determined whether the acidifica-
tion improves the accuracy of the organic d13C values, and the
effects of acidification on nitrogen isotopic composition. This
work contributes to refining methods for food web investi-
gations through stable isotope analysis in tropical ecosystems.
Table 1. List of species and higher taxa submitted for isotopic an
Phylum Class OrderHigher taxa (Infra Ordeor Super Family)
Annelida Polychaeta Palpata AmphinomidaEunicida
PhyllodocidaTerebellida
Arthropoda Malacostraca Decapoda AnomuraBrachyuraCaridea
Peracarida AmphipodaTanaidacea
Cnidaria Anthozoa Actiniaria EdwardsiidaMollusca Bivalvia Veneroida Tellinacea
Gastropoda Cephalaspidea ActeonoideaHaminoeidea
Sorbeoconcha Littorinimorpha
Neogastropoda
N is the mean number of individuals pooled per sample (mean� SD).
Copyright # 2008 John Wiley & Sons, Ltd.
EXPERIMENTAL
SamplesStable isotope analyses were performed on faunal taxa
resident in the coral sediments of La Saline fringing reef,
located on the west coast of Reunion Island (218S, 558E), inthe south-western Indian Ocean. Macrofauna were sampled
using an air lift system from the top 15 cm of sediment
(maximum depth reached by macrofauna) to collect a large
variety of species. Nine replicates of 0.2m2 of sediment were
sieved on 1mm mesh to isolate organisms. Due to low
biomass of macrofauna specimens, large numbers of
replicates had to be collected to obtain enough material
for reliable detection. Samples were collected during March
2007 within a short time interval (1 week) to minimize
temporal changes in isotopic compositions.
Sample preparation and analysisMacrofauna species were dissected and cleaned using Milli-
Q deionized water under a dissecting microscope (Leica MZ-
16; Leica Microsystems GmbH, Weltzwar, Germany)
adapted with a cold light source. Dissecting tools were
acid-washed, rinsed with distilled water and roasted at
4508C for 4 h. Laboratory gloves were worn at all times
during macrofauna preparation to minimize carbon and
nitrogen contamination. Entire Annelida, Arthropoda and
Cnidaria individuals were rinsed three times, and detritus
and gut contents were manually removed with fine forceps.
Mollusca species were prepared by peeling back the
calcareous external skeleton (shell) and the operculum,
andmuscle tissue was rinsed three times in deionized water.
All invertebrates were identified to the lowest possible
taxonomic level. Whole individuals from each selected
species were pooled to obtain enough material for reliable
analysis (Table 1). All samples were kept frozen at �208Cuntil they were freeze-dried and ground to a fine homo-
geneous powder.
alyses
rSpecies N
Eurythoe complanata, Eurythoe sp1, Linopherus sp1 2.0� 0.9Arabella iricolor caerulea, Arabella sp1,Onuphis holobranchiata, Eunice cincta
4.7� 2.6
Nematonereis unicornis 23.0� 13Cirratulus africanus, Cirratulus sp1 8.6� 3.8Calcinus latens 3.0� 1.2Portunus longispinosus, Callapa hepatica 4.1� 1.6Alpheidae sp1, Alpheidae sp2 4.7� 2.1Amphitoe alluaudi, Gammaropsis latipalma 26.2� 15.1Tanaidacea sp1, Leptochelia sp1 38.5� 13.2Edwardsiidae sp1, Edwardsiidae sp2 33.6� 13.8Tellina rhomboides, Macoma sp1 2.0� 0.4Bullina vitrea 3.5� 1.7Haminoea cymbalum 1.5� 0.3Natica areolata, Polinices melanostoma,Strombus mutabilis, Cymatium encausticum
2.4� 0.4
Conus coronatus, Cronia sp1,Nassarius albescens gemmuliferus, Hebra horrida
2.5� 0.5
Rapid Commun. Mass Spectrom. 2008; 22: 2955–2960
DOI: 10.1002/rcm
Effects of acidification on benthic macrofauna 2957
Samples of macrofauna were divided into two sub-samples,
the first sub-sample was analyzed without any pre-treatment
to serve as a control, while the second was treated with 5mL
1M HCl30 until no further CO2 degassing was observed29
(18h max.). Acidified samples were neutralized with deio-
nized water,31,32 centrifuged three times (3600 rpm for 5min)
and the supernatant discarded before the sample was
freeze-dried and homogenized again. We chose this method
above other methods (e.g. dropwise addition of concentrated
or dilute HCl and evaporation30,33) to ensure the preservation
and longevity of the chemicals inside the combustion tube in
the elemental analyzer during the analytical phase.
Powdered samples were weighed into 6� 4mm tin
capsules. Carbon and nitrogen content and isotopic compo-
sition were analyzed in duplicate at the Stable Isotope
Laboratory, GNS Science, New Zealand, using a Europa Geo
20/20 isotope ratio mass spectrometer (PDZ Europa Ltd.,
Crewe, UK), interfaced to an ANCA-SL elemental analyzer
(PDZ Europa Ltd.) in continuous flow mode (EA-IRMS).
Carbon dioxide and nitrogen gases were separated on a GC
column at 608C, and analyzed for isotopic abundance. The13C/12C and 15N/14N compositions are expressed in
conventional delta notation in per mil (%) relative to the
levels of 13C in Vienna Pee Dee Belemnite (VPDB) and 15N in
atmospheric air. Repeated measurement of an internal
standard exhibited a precision of �0.1% for d13C and
�0.3% for d15N.
Statistical analysis was undertaken with Statistica 7.0
software (StatSoft, Inc., Tulsa, OK, USA). Acidification shifts
were expressed as a mean� standard deviation (SD). Data
were tested for normality by the Shapiro-Wilk’s test, and the
Levene’s test was used for homogeneity. Differences
amongst untreated and acidified samples were examined
with the paired Student’s t-test. The non-parametric
Wilcoxon test was used when the data did not fulfil
requirements. A probability level of less than 0.05 was
considered significant for comparison tests. As the CaCO3
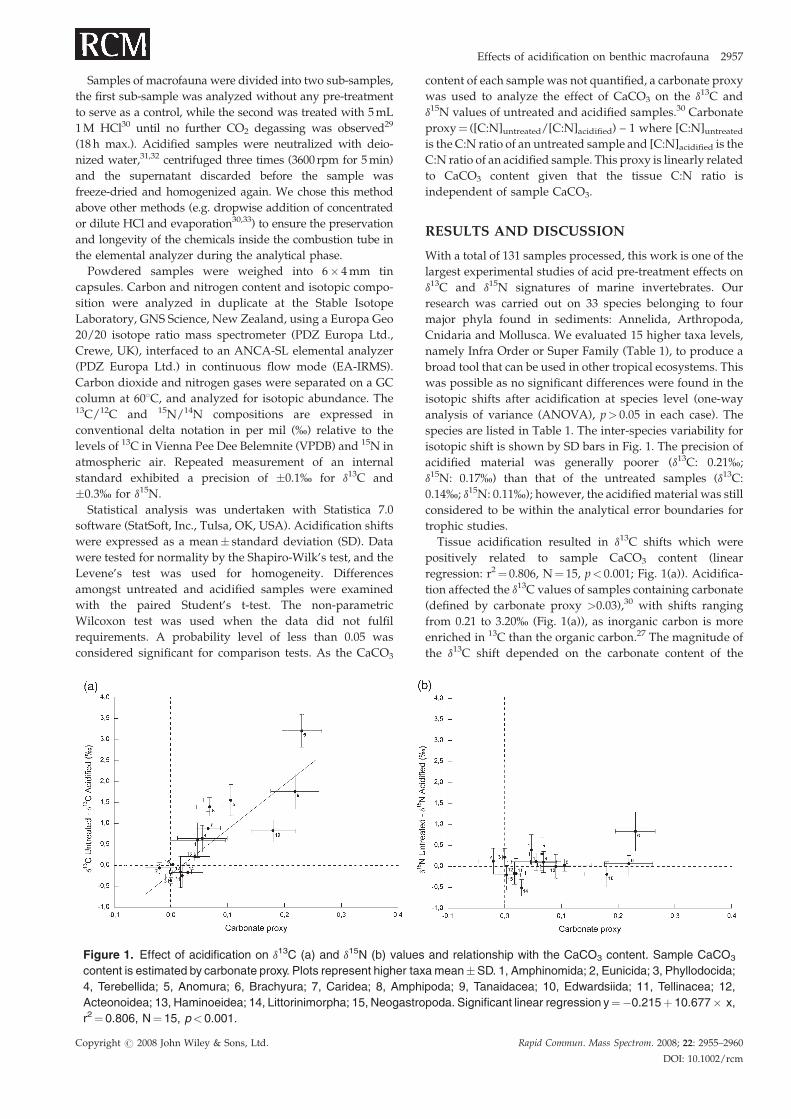
Figure 1. Effect of acidification on d13C (a) and d15N (b) values
content is estimated by carbonate proxy. Plots represent higher tax
4, Terebellida; 5, Anomura; 6, Brachyura; 7, Caridea; 8, Amph
Acteonoidea; 13, Haminoeidea; 14, Littorinimorpha; 15, Neogastro
r2¼ 0.806, N¼ 15, p< 0.001.
Copyright # 2008 John Wiley & Sons, Ltd.
content of each sample was not quantified, a carbonate proxy
was used to analyze the effect of CaCO3 on the d13C and
d15N values of untreated and acidified samples.30 Carbonate
proxy¼ ([C:N]untreated/[C:N]acidified) – 1 where [C:N]untreatedis the C:N ratio of an untreated sample and [C:N]acidified is the
C:N ratio of an acidified sample. This proxy is linearly related
to CaCO3 content given that the tissue C:N ratio is
independent of sample CaCO3.
RESULTS AND DISCUSSION
With a total of 131 samples processed, this work is one of the
largest experimental studies of acid pre-treatment effects on
d13C and d15N signatures of marine invertebrates. Our
research was carried out on 33 species belonging to four
major phyla found in sediments: Annelida, Arthropoda,
Cnidaria and Mollusca. We evaluated 15 higher taxa levels,
namely Infra Order or Super Family (Table 1), to produce a
broad tool that can be used in other tropical ecosystems. This
was possible as no significant differences were found in the
isotopic shifts after acidification at species level (one-way
analysis of variance (ANOVA), p> 0.05 in each case). The
species are listed in Table 1. The inter-species variability for
isotopic shift is shown by SD bars in Fig. 1. The precision of
acidified material was generally poorer (d13C: 0.21%;
d15N: 0.17%) than that of the untreated samples (d13C:
0.14%; d15N: 0.11%); however, the acidifiedmaterial was still
considered to be within the analytical error boundaries for
trophic studies.
Tissue acidification resulted in d13C shifts which were
positively related to sample CaCO3 content (linear
regression: r2¼ 0.806, N¼ 15, p< 0.001; Fig. 1(a)). Acidifica-
tion affected the d13C values of samples containing carbonate
(defined by carbonate proxy >0.03),30 with shifts ranging
from 0.21 to 3.20% (Fig. 1(a)), as inorganic carbon is more
enriched in 13C than the organic carbon.27 The magnitude of
the d13C shift depended on the carbonate content of the
and relationship with the CaCO3 content. Sample CaCO3
a mean�SD. 1, Amphinomida; 2, Eunicida; 3, Phyllodocida;
ipoda; 9, Tanaidacea; 10, Edwardsiida; 11, Tellinacea; 12,
poda. Significant linear regression y¼�0.215þ 10.677� x,
Rapid Commun. Mass Spectrom. 2008; 22: 2955–2960
DOI: 10.1002/rcm
2958 J. Kolasinski, K. Rogers and P. Frouin
animal, where a larger d13C shift suggests that acidification of
carbonate-rich samples effects a loss of inorganic carbon,
rather than a loss of acid-soluble organic carbon.
A negative carbonate proxy value was found for Eunicida
polychaetes (Fig. 1) where acidification of these samples
decreased the nitrogen content proportionally more than the
carbon content of tissue. However, Jacob et al.30 suggested
there was no need to correct carbonate proxy values for this
type of effect, as it is assumed to be independent of sample
CaCO3 content. Acidification of many samples containing no
carbonate (carbonate proxy�0.03)30 often induced a negative
effect with more positive d13C values (Fig. 1(a)). The range of
d13C shifts for carbonate-free samples was from 0.02 to
�0.37% and corresponded to values previously reported
concerning the acidification of some marine invert-
ebrates.30,33,34 These negative shifts could, however, be
caused by the removal of acid-soluble 13C-rich compounds in
biological tissues such as proteins, amino acids and
polysaccharides.35 Another hypothesis points to the loss of
hydrolyzed organic matter dissolved in the deionized water
discarded during the rinsing step.31 The mechanisms
controlling this undesirable change remain unclear and
should be further investigated.
Significant differences were found between d13C untreated
and d13C acidified samples of all taxa which contain
carbonate (i.e. carbonate proxy values >0.03, except the
Haminoeidea, Mollusca group) (Table 2). Two polychaete
taxa, Amphinomida and Terebellida, had mean d13C shifts of
0.59� 0.41% and 0.64� 0.32%, respectively. Arthropoda
(Anomura, Brachyura, Caridea, Amphipoda, Tanaidacea)
ranged from 0.88� 0.39% to 3.20� 0.39%, while Cnidaria
Edwardsiida had mean d13C shifts of up to 0.82� 0.26%(Table 2). Removal of the organism’s inorganic carbonate
structures via acidification revealed that the process
significantly decreases the d13C signature. Moreover, the
induced d13C shift from acidification of these organisms was
equal to or higher than the range of 0.5–1% typically
identified for a single trophic level shift. Hence acidification
of the carbonate-containing taxa appears essential to
Table 2. Carbonate proxy values and d13C and d15N isotopic shifts a
outputs
Higher taxa (Infra Orderor Super Family) N
Carbonate proxy(mean� SD)
d13C(mea
Amphinomida 21 0.047� 0.049 0.59Eunicida 5 �0.02� 0.026 �0.07Phyllodocida 5 0.00� 0.004 �0.37Terebellida 6 0.055� 0.044 0.63Anomura 10 0.106� 0.048 1.55Brachyura 10 0.230� 0.035 3.20Caridea 5 0.066� 0.021 0.88Amphipoda 5 0.068� 0.023 1.39Tanaidacea 5 0.219� 0.042 1.76Edwardsiida 24 0.180� 0.039 0.82Tellinacea 6 0.020� 0.030 �0.25Acteonoidea 7 0.017� 0.020 �0.16Haminoeidea 5 0.042� 0.027 0.21Littorinimorpha 6 0.030� 0.027 �0.17Neogastropoda 11 0.004� 0.024 0.02
N¼number of samples.�p< 0.05; ��p< 0.01; ���p< 0.001; ns: non-significant.
Copyright # 2008 John Wiley & Sons, Ltd.
producing unbiased values for ecological interpretation
and comparison of food sources.
However, Haminoeidea is an exception (carbonate proxy:
0.042) that shows that some samples with carbonate proxy
<0.05 CaCO3 do not induce bias on the d13C measurement.
We therefore suggest acidification of taxa with a carbonate
proxy �0.05. This threshold is lower than those defined by
Mateo et al.36 with a carbonate proxy >0.09 or Jacob et al.30
with a carbonate proxy >0.08. For carbonate proxies which
lie between 0.03 and 0.05 we recommend testing the
efficiency of the acidification step for all taxa.
The significance of d13C shifts from the acidification of
Amphinomida and Terebellida polychaetes has not pre-
viously been reported. We suggest that common preparation
techniques such as rinsing specimens with deionized water
after dissection would not be effective, as particulate
carbonate material can often be trapped in numerous large
chetae (found in Amphinomida) or dense tentacles which
are able to retain particles (found in Terebellida). This
highlights the importance of taking into account not only the
chemical composition of the organism, but also its physical
environment when devising standard preparation pro-
cedures, particularly in coral reefs where carbonates are
dominant. We have not found any published isotopic studies
of Cnidaria, Anomura, Amphipoda and Tanaidacea to
compare with this study. Brachyura showed a high
d13C shift (3.20� 0.39%) after acidification, which was in
accordance with results by Carabel et al.,29 who found a
significant decrease up to 2.4% for two similar Atlantic taxa
(Polybius henslowii, Necora puber, Portunidae). Bosley and
Wainright37 did not find any significant effects of acidifica-
tion treatment for a temperate Caridea species (Crangon
septemspinosa). This conflicts with results found in this study
which had d13C shifts of 0.88� 0.40 (Table 2). The variability
found in carbon shifts may be due to discrepancies in
methods (e.g. sampling effort, acid form) or geographical
changes in water chemistry such as temperature, pH or ion
chemistry38,39 that can influence the composition of the
structure of an organism and hence its response to the
fter acidification, with Wilcoxon and Student matched-pair test
shiftn� SD)
d15N shift(mean� SD)
d13C shifttest outputs
d15N shifttest outputs
� 0.41 0.39� 0.36 Z¼ 3.484��� ns� 0.14 0.12� 0.31 ns ns� 0.07 0.21� 0.21 ns ns� 0.32 0.11� 0.21 Z¼ 2.023� ns� 0.37 0.02� 0.14 Z¼ 2.803�� ns� 0.39 0.83� 0.46 t¼ 4.205�� Z¼ 2.034�
� 0.40 0.29� 0.39 Z¼ 2.068� ns� 0.22 0.09� 0.24 Z¼ 2.201� ns� 0.41 0.06� 0.19 Z¼ 2.521� ns� 0.26 �0.20� 0.30 Z¼ 5.077��� ns� 0.28 �0.16� 0.35 ns ns� 0.37 �0.16� 0.26 ns ns� 0.11 �0.01� 0.29 ns ns� 0.20 �0.51� 0.20 ns Z¼ 2.201�
� 0.20 �0.20� 0.22 ns ns
Rapid Commun. Mass Spectrom. 2008; 22: 2955–2960
DOI: 10.1002/rcm
Effects of acidification on benthic macrofauna 2959
acidification treatment. The latter hypothesis highlights the
importance of conducting preliminary assessments of
sample preparation techniques in each typical oceanographic
zone.
No significant d13C shift after acidification was observed
for any of the carbonate-free samples (Table 2): Mollusca
(mean d13C shift ranged from�0.25� 0.28% to 0.02� 0.20%),
and the polychaetes Eunicida (�0.07� 0.14%) and Phyllo-
docida (�0.37� 0.07%). These results suggest that any small
amounts of carbonate preserved internally within Mollusca,
Eunicida and Phyllodocida tissue (e.g. jaws) do not affect the
overall isotopic signature. Moreover, the induced d13C shifts
were still below the average trophic level shift for carbon
(0.5–1%) and we conclude that acid pre-treatment of these
groups is unnecessary and should be avoided. These results
agree with literature data of Mollusca d13C shifts;33 however,
there is no comparable literature data for polychaete taxa.
The effects of sample acidification on d15N values are
presented in Table 2 and Fig. 1(b). We observe that the
acidification process leads to changes in the d15N values of
some species. There was no statistically significant corre-
lation between tissue d15N acidification shift and CaCO3
content (linear regression: r2¼ 0.315, N¼ 15, p¼ 0.252). Loss
of 15N has previously been reported during acidifica-
tion33,34,40 and is attributed to small losses of acid-soluble
proteins and amino acids via the volatilization of oxidized
nitrogenous organic compounds.41,42 It has been found that
the deionized water rinsing step can also induce a loss of
nitrogen compounds.29 Acidification induced both positive
and negative changes in d15N values, which were lower than
the precision range of the EA-IRMS setup (0.3%) for 12
higher taxa out of 15 (d15N shifts from�0.20% to 0.29%). The
three remaining taxa that show d15N shifts exceeding the
precision range after acidification are Littorinimorpha,
Amphinomida and Brachyura (Table 2). Although signifi-
cant d15N shifts were found in Littorinimorpha after
acidification (�0.51� 0.20%), it is not considered an issue
as acidification of this taxa is not required. Whereas
Brachyura and Amphinomida required acid pre-treatment
before analysis, only Brachyura showed a significant
d15N shift of 0.83� 0.46% after acidification. From the 33
species studied, we suggest that acidification of carbonate-
containing taxa in this study will not lead to an under-
estimation of trophic level if we assume a 2.9–3.8% shift in
d15N values between consumer and prey.15,43 Under these
conditions, dual carbon and nitrogen isotope values
(d13C and d15N) can be determined from the same acidified
sample without compromising trophic levels. When more
precise d15N values are required,44,45 the d15N value should
be measured from a sub-sample of the untreated sample.
CONCLUSIONS
Acidification of whole specimens appears to be a necessary
process for accurate assessment of d13C values in many
higher tropical macrofauna taxa such as Amphinomida and
Terebellida (Annelida), Anomura, Brachyura, Caridea,
Amphipoda, Tanaidacea (Arthropoda) and Edwardsiida
(Cnidaria). The need for acidification is related to the CaCO3
Copyright # 2008 John Wiley & Sons, Ltd.
content in body tissue. Samples with a carbonate proxy�0.05
must be acidifed, while acidification efficiency should be
tested for taxa with carbonate proxies which lie between 0.03
and 0.05. Acid pre-treatment should be avoided for tropical
taxa which have no carbonate content (carbonate proxy
<0.03) (e.g.Mollusca, Eunicida, Phyllodocida) to prevent any
loss of soluble N and C compounds which could affect their
bulk isotopic signature. When acidifying the taxa reported in
this study for food web analysis via EA-IRMS, quantification
of the d13C and d15N values can be performed simultaneously
on the same acidified sample, as the d15N shift effects are
minimal and do not interfere with trophic level interpret-
ation. This study provides guidelines for processing tropical
macrofauna samples for ecological analyses, and it could be
extended by further investigations in other higher tropical
taxa.
AcknowledgementsThe authors would like to thank J. K.-L. Leung for laboratory
assistance. DrM. Potier is thanked for helpful suggestions on
a draft of themanuscript. This researchwas supported by the
French Conseil Regional de La Reunion. J.K. also benefited
from support of the Conseil Regional de La Reunion and the
European Social Fund through a PhD grant.
REFERENCES
1. Paulay G. Diversity and distribution of reef organisms. InLife and Death of Coral Reefs, Birkeland C (ed). Chapman &Hall Publications: London, 1997; 298–353.
2. Birkeland C. Implication for resource management. In Lifeand Death of Coral Reefs, Birkeland C (ed). Chapman & HallPublications: London, 1997; 411–435.
3. Pennisi E. Science 1997; 217: 491.4. Warwick RM. Aust. J. Ecol. 1993; 18: 63.5. Salas F, Marcos C, Neto JM, Patrıcio J, Perez-Ruzafa A,
Marques JC. Oc. Coast. Manag. 2006; 49: 308.6. Risk MJ, Erdmann MV. Mar. Poll. Bull. 2000; 40: 50.7. Fichez R, Adjeroud M, Bozec YM, Breau L, Chancerelle Y,
Chevillon C, Douillet P, Fernandez P, Frouin P, Kulbicki M,Moreton B, Ouillon S, Payri C, Perez T, Sasal P, Thebault J.Aquat. Liv. Resour. 2005; 18: 125.
8. Cocheret de la Moriniere E, Pollux BJA, Nagelkerken I,Hemminga MA, Huiskes AHL, van der Velde G. Mar. Ecol.Prog. Ser. 2003; 246: 279.
9. Abed-Navandi D, Dworschak PC. Mar. Ecol. Prog. Ser. 2005;291: 159.
10. Michener RH, Schell DM. Stable Isotopes in Ecology andEnvironmental Science. Blackwell Scientific Publications:Oxford, 1994; 138.
11. Peterson BJ, Fry B. Annu. Rev. Ecol. Syst. 1987; 18: 293.12. DeNiroMJ, Epstein S.Geochim. Cosmochim. Acta 1978; 42: 495.13. DeNiroMJ, Epstein S.Geochim. Cosmochim. Acta 1981; 45: 341.14. Vander Zanden JM, Rasmussen JB. Ecology 1999; 80: 1395.15. Minagawa M, Wada E. Geochim. Cosmochim. Acta 1984; 48:
1135.16. Vander Zanden MJ, Rasmussen JB. Limnol. Oceanogr. 2001;
46: 2061.17. Heikoop JM, Dunn JJ, Risk MJ. Limnol. Oceanogr. 1998; 43:
909.18. Schleyer MH, Heikoop JM, Risk MJ. Mar. Poll. Bull. 2006; 52:
503.19. Barile PJ, Lapointe BE. Mar. Poll. Bull. 2005; 50: 1262.20. Garrison V, Kroeger K, Fenner D, Craig P. Mar. Poll. Bull.
2007; 54: 1813.21. Yamamuro M, Umezawa Y, Koike I. Aquat. Bot. 2004; 79: 95.22. Kayanne H, Hirota M, Yamamuro M, Koike I. Coral Reefs
2005; 24: 197.23. Fry B, LutesR,NorthamM, Parker PL.Aquat. Bot. 1982; 14: 389.
Rapid Commun. Mass Spectrom. 2008; 22: 2955–2960
DOI: 10.1002/rcm
2960 J. Kolasinski, K. Rogers and P. Frouin
24. Smit AJ, Brearley A, Hyndes GA, Lavery PS, Walker DI. Est.Coast. Shelf Sci. 2005; 65: 545.
25. Gattuso JP, Allemand D, Frankignoulle M. Am. Zool. 1999;39: 160.
26. Meldrum FC. Int. Mater. Rev. 2003; 48: 187.27. Kennedy P, Kennedy H, Papadimitriou S. Rapid Commun.
Mass Spectrom. 2005; 19: 1063.28. Vizzini S, Mazzola A. Mar. Biol. 2003; 142: 1009.29. Carabel S, Godınez-Dominguez E, Verısimo P, Fernandez L,
Freire J. J. Exp. Mar. Biol. Ecol. 2006; 336: 254.30. Jacob U, Mintenbeck K, Brey T, Knust R, Beyer K. Mar. Ecol.
Prog. Ser. 2005; 287: 251.31. Schubert CJ, Nielsen B. Mar. Chem. 2000; 72: 55.32. KangCK, Kim JB, Lee KS, Kim JB, Lee PY,Hong JS.Mar. Ecol.
Prog. Ser. 2003; 259: 79.33. Ng JSS, Wai TK, Williams GA. Mar. Chem. 2007; 103: 97.34. Bunn SE, Loneragan NR, Kempster MA. Limnol. Oceanogr.
1995; 40: 622.
Copyright # 2008 John Wiley & Sons, Ltd.
35. Ostle NJ, Bol R, Petzke KJ, Jarvis SC. Soil Biol. Biochem. 1999;31: 1751.
36. Mateo MA, Serrano O, Serrano L, Michener RH. Oecology2008; 157: 105.
37. BosleyKL,Wainright SC.Can. J. Fish. Aquat. Sci. 1999; 56: 2181.38. Hinga KR, Arthur MA, Pilson MEQ, Whitaker D. Global
Biogeochem. Cycles 1994; 8: 91.39. Peeters FJC, Brummer GJA, Ganssen G. Global Planet. Change
2002; 34: 269.40. Pinnegar JK, Polunin NVC. Funct. Ecol. 1999; 13: 225.41. Goering J, Alexander V, Haubenstock N. Est. Coast. Shelf Sci.
1990; 30: 239.42. Lohse L, Kloosterhuis RT, de Stiger HC, Helder W, van
Raaphorst W, van Weering TCE. Mar. Chem. 2000; 69: 193.43. Fry B. Limnol. Oceanogr. 1988; 33: 1182.44. Anderson C, Cabana G. Sci. Total Environ. 2006; 367: 968.45. McClelland JW, Valiela I, Michener RH. Limnol. Oceanogr.
1997; 42: 930.
Rapid Commun. Mass Spectrom. 2008; 22: 2955–2960
DOI: 10.1002/rcm


