Embed Size (px)
Citation preview

Journal of Advanced Concrete Technology Vol. 5, No. 1, 1-11, February 2007 / Copyright © 2007 Japan Concrete Institute 1
Scientific paper
Effects of Size and Uncompacted Voids of Aggregate on Mortar Flow Ability Jiong Hu1 and Kejin Wang2
Received 15 June 2006, accepted 20 December 2006
Abstract The effects of aggregate characteristics on the flow ability of mortar mixtures were investigated. Two types, five single-sized and three graded fine aggregate were considered. Uncompacted voids of the aggregates were measured. Flow properties of 166 mortar batches made with different aggregates, sand-to-cement ratios (s/c) and water-to-cement ratios (w/c), were evaluated using the modified ASTM C109 flow table test method. The results indicated that in addition to w/c, the content, uncompacted voids, and size of aggregate all significantly affect mortar flow ability. Generally, aggre-gate having higher uncompacted void content provides its mortar with a lower flow. When aggregate content was low (s/c = 1), aggregate size had little effect on the flow ability of the mortar; when aggregate content was high (s/c = 3), aggregate size significantly influenced the mortar flow ability. The mortar with graded aggregate has better flow ability than the mortar with single-sized particles. River sand provides a mortar with better flow ability when compared to limestone. A statistical model was developed to predict the flow ability of mortar. The model can also be used to study the effect of different parameters on mortar flow properties.
1. Introduction
Aggregate is an important proportion in Portland ce-ment concrete because it generally occupies 70 to 80 volume percentages in the whole material. It is known that aggregate not only affects the mechanic properties of hardened concrete but also affects the properties of fresh concrete, such as concrete flow ability.
Previous investigations have indicated that the aspect ratio, angularity, and surface texture of aggregates sig-nificantly affect the flow ability of concrete (Geiker et al. 2002). Crushed sands often require higher water con-tent than river sands to achieve given workability (Mal-hotra 1964, Geiker et al. 2002). In addition to the prop-erties of the cement paste, concrete flow ability also depends on the amount and gradation of aggregate (Struble et al. 1998). The optimum gradation should have the lowest possible surface area and void content per unit weight (Smith and Collis 2001). Very fine sand, very coarse aggregate, or aggregate with large deficien-cies or excesses of any size cannot provide concrete with satisfactory flow properties and may increase the cost of the concrete.
To obtain concrete with desirable workability, a suit-able amount of cement paste is needed to fill the spaces among the aggregate. Based on the concept of particle
packing, well-graded (or well-packed) aggregate has fewer voids among particles than poorly graded aggre-gate, and it requires less cement paste to fill the voids. Thus, an additional amount of cement paste will coat the aggregate particles and improve the concrete flow. For the same reason, an increase in the volume fraction of aggregate in concrete generally results in a reduced flow (Szecsy 1997, Geiker et al. 2002).
In the present study, an uncompacted void content test was used to characterize aggregate gradation, shape, and surface texture. A modified flow table test based on ASTM C109 was employed to evaluate mortar flow properties. The effects of aggregate characteristics on mortar workability were analyzed. Excess paste theory was used to explain the effect of aggregate on mortar flow ability.
2. Research significance
Aggregate characteristics have significant effects on concrete workability and other properties. However, limited work has been conducted to study the effects systematically and quantitatively. Currently, no effective parameters are used to study the aggregate effects on concrete flow ability. The present study provides a sys-tematic examination on the effect of fine aggregate characteristics on mortar flow ability. The uncompacted void content of aggregate used in this investigation ef-fectively describes various aggregate characteristics, including aggregate type (shape and surface texture), size, and gradation. The research results will provide engineers with an insight into concrete mix design and material selection.
1Postdoctoral Research Associate, Civil, Construction, and Environmental Engineering, Iowa State University, USA. 2Associate Professor, Civil, Construction, and Environmental Engineering, Iowa State University, USA. E-mail: [email protected]
2 J. Hu and K. Wang / Journal of Advanced Concrete Technology Vol. 5, No. 1, 1-11, 2007
3. Excess thickness theory
Previous researchers found that the thickness of the paste coated around the aggregate particles in concrete can determine the concrete workability (Bui et al. 2002). The influence of aggregate content on workability can be explained by the layer of paste that surrounds all sand and gravel particles in varying thicknesses (Denis et al. 2002). The theory of excess paste states that the total volume of cement paste can be divided into two parts: one part is the paste in between voids among ag-gregates; the other part is the excess paste that covers the aggregate and separates the particles. According to Oh et al. (1999), the volume of excess paste can be cal-culated as the total volume of paste subtracted by the volume of paste in between voids. A higher percentage of voids among aggregate particles usually requires a higher paste volume to fill the space among solid parti-cles, to maintain the same amount of excess paste, and to provide concrete with the same flow ability.
Besides filling the spaces among aggregate particles, excess paste is required for concrete to flow. The results showed that when the thickness of excess paste in-creases, flow ability of concrete improved (Oh et al. 1999). Generally, a higher volume of excess paste indi-cates a greater distance between solid particles, which results in better flow ability. According to the concept of excess paste thickness, it is the amount of excess paste rather than the total amount of paste that decides the rheology properties of mortar or concrete. The concept of the excess paste thickness is used in this paper to explain the effects of aggregate properties on the mortar flow ability. The details of the calculation of excess paste thickness will be presented in a separated publica-tion.
4. Experimental work
4.1 Materials Type I Portland cement was used in the experiment and its chemical and physical properties are shown in Table 1. As the focus of the present study was to investigate effect of fine aggregate on mortar flow ability, no chemical admixture was applied in the mortar mixtures studied.
Two different kinds of fine aggregates (river sand and crushed limestone sand) were used as fine aggregates. The specific gravity of the fine aggregates was 2.63 and
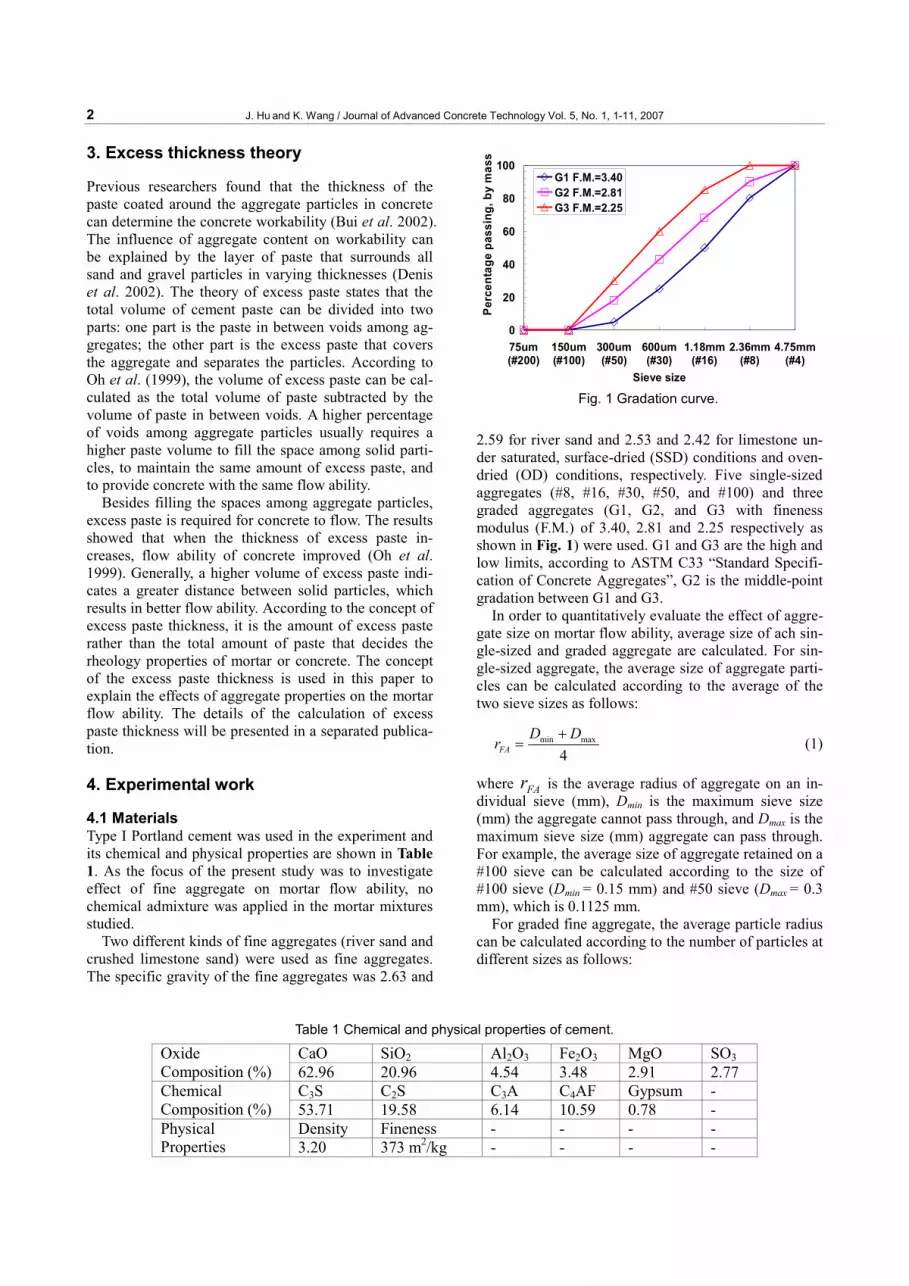
2.59 for river sand and 2.53 and 2.42 for limestone un-der saturated, surface-dried (SSD) conditions and oven-dried (OD) conditions, respectively. Five single-sized aggregates (#8, #16, #30, #50, and #100) and three graded aggregates (G1, G2, and G3 with fineness modulus (F.M.) of 3.40, 2.81 and 2.25 respectively as shown in Fig. 1) were used. G1 and G3 are the high and low limits, according to ASTM C33 “Standard Specifi-cation of Concrete Aggregates”, G2 is the middle-point gradation between G1 and G3.
In order to quantitatively evaluate the effect of aggre-gate size on mortar flow ability, average size of ach sin-gle-sized and graded aggregate are calculated. For sin-gle-sized aggregate, the average size of aggregate parti-cles can be calculated according to the average of the two sieve sizes as follows:
min max
4FAD D
r+
= (1)
where FAr is the average radius of aggregate on an in-dividual sieve (mm), Dmin is the maximum sieve size (mm) the aggregate cannot pass through, and Dmax is the maximum sieve size (mm) aggregate can pass through. For example, the average size of aggregate retained on a #100 sieve can be calculated according to the size of #100 sieve (Dmin = 0.15 mm) and #50 sieve (Dmax = 0.3 mm), which is 0.1125 mm.
For graded fine aggregate, the average particle radius can be calculated according to the number of particles at different sizes as follows:
Table 1 Chemical and physical properties of cement.
CaO SiO2 Al2O3 Fe2O3 MgO SO3 Oxide Composition (%) 62.96 20.96 4.54 3.48 2.91 2.77
C3S C2S C3A C4AF Gypsum - Chemical Composition (%) 53.71 19.58 6.14 10.59 0.78 -
Density Fineness - - - - Physical Properties 3.20 373 m2/kg - - - -
0
20
40
60
80
100
4.75mm(#4)
2.36mm(#8)
1.18mm (#16)
600um (#30)
300um(#50)
150um(#100)
75um(#200)
Sieve size
Perc
enta
ge p
assi
ng, b
y m
ass
G1 F.M.=3.40G2 F.M.=2.81G3 F.M.=2.25
Fig. 1 Gradation curve.

J. Hu and K. Wang / Journal of Advanced Concrete Technology Vol. 5, No. 1, 1-11, 2007 3
i FA i FAFA
i FA
N rr
N− −
−
= ∑∑
(2)
where Ni-FA is the number of aggregate in a certain size and FAir − is the average radius of aggregate in a certain size (mm).
All fine aggregates were oven-dried so as to obtain the same moisture condition. Because dry aggregate absorbs water after contacting it, the w/c of the mortar will change from the original mix design based on the OD condition fine aggregate. The absorption from dif-ferent fine aggregates was measured according to the testing specified in ASTM C128 “Test Method for Den-sity, Relative Density (Specific Gravity), and Absorp-tion of Fine Aggregate.” The absorption (Abs%) of dif-ferent fine aggregates is shown in Fig. 2. The results indicated that river sand absorbs less water than lime-stone. The absorption of river sand increased with the size of aggregate, which might be caused by the larger amount of porosity contained inside larger aggregate particles. However, this tendency was not clearly ob-served in limestone. The graded river sand used in the present research had absorption between that of #30 and #16 river sand.
4.2 Mixture proportions The mortar mix design is listed in Table 2. The design variables included aggregate types, sizes, gradations, sand-to-cement ratios (s/c), and w/c. The different w/c was selected to ensure that all mixtures would have a measurable flow. A total of 166 mortar batches were prepared.
In Table 2, the w/c of the mortars was back calcu-lated from the OD sand moisture condition to the SSD condition according to the absorption of the fine aggre-gates. The following equation was used in the calcula-tion:
%ODw / c ( w / c ) s / c Abs= − × (3)
where w/c is the water-to-cement ratio in the SSD mix design of a mortar, (w/c)OD is the water-to-cement ratio in the OD mix design of the mortar, s/c is the sand-to-cement ratio of mortar, and Abs% is the absorption of fine aggregate. 4.3 Mixing procedure All mortar mixtures were mixed according to ASTM C305 “Standard Practice for Mechanical Mixing of Hy-draulic Cement Pastes and Mortars of Plastic Consis-tency.” The mixing procedure can be described as fol-lows: Place all of the mixing water in the bowl, add the cement to the water, and start the mixer. Mix the water and cement at slow speed (140+5r/min) for 30 seconds, and then slowly add the entire quantity of fine aggregate over a 30-second period, while mixing at slow speed. Stop the mixer, change to medium speed (285+10r/min), and mix for 30 seconds. Stop the mixer for 90 seconds.
During the first 15 seconds, scrape down into the batch any mortar that may have collected on the sides of the bowl. Start the mixer at medium speed and mix for 60 more seconds. Stop the mixer, remove the material from the bowl, and prepare it for flow table measurement. 4.4 Test method 4.4.1 Fine aggregate angularity Particle shape is the shape of the individual aggregate particle, and surface texture is the degree of roughness or irregularity of the surface of an aggregate particle. Currently, there is no directly ASTM and AASHTO standard test or detailed definition for fine aggregate particle shape and surface texture. A fine aggregate an-gularity test was applied based on procedures from ASTM C1252 “Standard Test Methods for Uncom-pacted Void Content of Fine Aggregate (as influenced by particle shape, surface texture, and grading),” which defined fine aggregate angularity as the percent of air voids present in loosely compacted fine aggregates. Higher void content generally means more fractured faces and more irregular shapes, which results in more difficult packing of particles.
According to ASTM C1252, a sample of fine aggre-gate is poured into a cylinder with a known volume by
0
1
2
3
4
5
6
#100 #50 #30 #16 #8
Abs
orpt
ion,
%
RiversandLimestone
(a) Single-sized aggregates
0
1
2
3
4
5
6
G1 F.M.=3.40 G2 F.M.=2.81 G3 F.M.=2.25
Abs
orpt
ion,
%
RiversandLimestone
(b) Graded aggregates
Fig. 2 Absorption of fine aggregate.

4 J. Hu and K. Wang / Journal of Advanced Concrete Technology Vol. 5, No. 1, 1-11, 2007
using a standard funnel. The uncompacted voids percent can then be calculated based on the difference between the cylinder volume and the fine aggregate volume col-lected in the cylinder. The bulk specific gravity is used to calculate the fine aggregate volume. The calculation of the uncompacted void content of fine aggregate can be determined by the following equation:
100%FAn
V W /VV
γ−= × (4)
where Vn is the uncompacted voids (%), V is the volume of the cylinder, W is the weight of the aggregate in the cylinder; and γFA is the specific gravity of the aggregate. 4.4.2 Flow measurement In the present study, the flow ability of mortar was measured using the flow table specified in ASTM C230, “Standard Specification for Flow Table for Use in Tests of Hydraulic Cement.” The flow ability of mortar was measured according to a procedure similar to ASTM C109, “Standard Test Method for Compressive Strength of Hydraulic Cement Mortars,” which was originally designed to determine the water content needed for a cement paste sample to obtain a given flow spread of
110+5 %. In the present research, the water content of a mortar was pre-designed. In the test, a mortar sample from the different mixtures was placed on the same flow table and subjected to 25 times of standard table drops. Then the spread diameter of the sample was measured. The flow ability of the mortar was expressed as a flow percentage: the percentage of the spread diameter over the original bottom diameter of the sample.
Because the standard flow table has a limited diame-ter, mortars with high flow ability can flow out of the flow table before 25 drops are applied. To solve this problem, a smaller number of drops were applied to the samples with high flow ability. The spread diameters of these samples at 25 drops were predicted from a newly developed relationship between the number of flow ta-ble drops and the spread diameter.
The relationship between flow percentage and drop number in a flow table test was studied. The examples in Fig. 3 demonstrate that flow percentage has a linear relationship with the number of flow table drops in a logarithm scale. A group of 40 samples was tested on this modified flow table. Each sample was subjected to a varying number of flow table drops and the resulting spread diameter measured. This relationship can be ex-
Table 2 Mix design for mortar.
w/c s/c Sand
River Sand Limestone 3 #100 0.50, 0.53, 0.56, 0.62 0.37, 0.42, 0.47, 0.57 3 #50 0.44, 0.47, 0.50, 0.53, 0.55 0.32, 0.37, 0.42, 0.47, 0.52 3 #30 0.39, 0.42, 0.45, 0.48 0.35, 0.40, 0.45, 0.50 3 #16 0.33, 0.36, 0.39, 0.42, 0.45 0.24, 0.34, 0.44, 0.49 3 #8 0.27, 0.29, 0.32, 0.35, 0.38, 0.41 0.21, 0.26, 0.31, 0.36, 0.41 3 G1 0.30, 0.35, 0.40, 0.50 0.20, 0.25, 0.35, 0.45 3 G2 0.30, 0.35, 0.40, 0.50 0.20, 0.25, 0.35, 0.45 3 G3 0.33, 0.38, 0.43, 0.53 0.20, 0.25, 0.35, 0.45 2 #100 0.36, 0.41, 0.46 0.31, 0.36, 0.41 2 #50 0.34, 0.36, 0.41, 0.46 0.27, 0.32, 0.37 2 #30 0.30, 0.33, 0.35, 0.40, 0.45 0.28, 0.33, 0.38 2 #16 0.27, 0.30, 0.32, 0.37, 0.42 0.28, 0.33, 0.38 2 #8 0.25, 0.30, 0.35, 0.40 0.20, 0.25, 0.30 2 G1 0.33, 0.38, 0.43 0.29, 0.34, 0.39 2 G2 0.34, 0.39, 0.44 0.28, 0.33, 0.38 2 G3 0.36, 0.41, 0.46 0.28, 0.33, 0.38 1 #100 0.28, 0.32, 0.38, 0.48 0.26, 0.31, 0.41 1 #50 0.28, 0.32, 0.38, 0.48 0.21, 0.31, 0.41 1 #30 0.23, 0.27, 0.33, 0.37, 0.47 0.22, 0.32, 0.42 1 #16 0.21, 0.26, 0.36, 0.46 0.21, 0.31, 0.41 1 #8 0.20, 0.25, 0.35, 0.45 0.20, 0.30, 0.40 1 G1 0.37 0.32 1 G2 0.37 0.32 1 G3 0.38 0.32
J. Hu and K. Wang / Journal of Advanced Concrete Technology Vol. 5, No. 1, 1-11, 2007 5
pressed as follows.
25 t 46.779(ln 25 ln )= + −F F t (5)
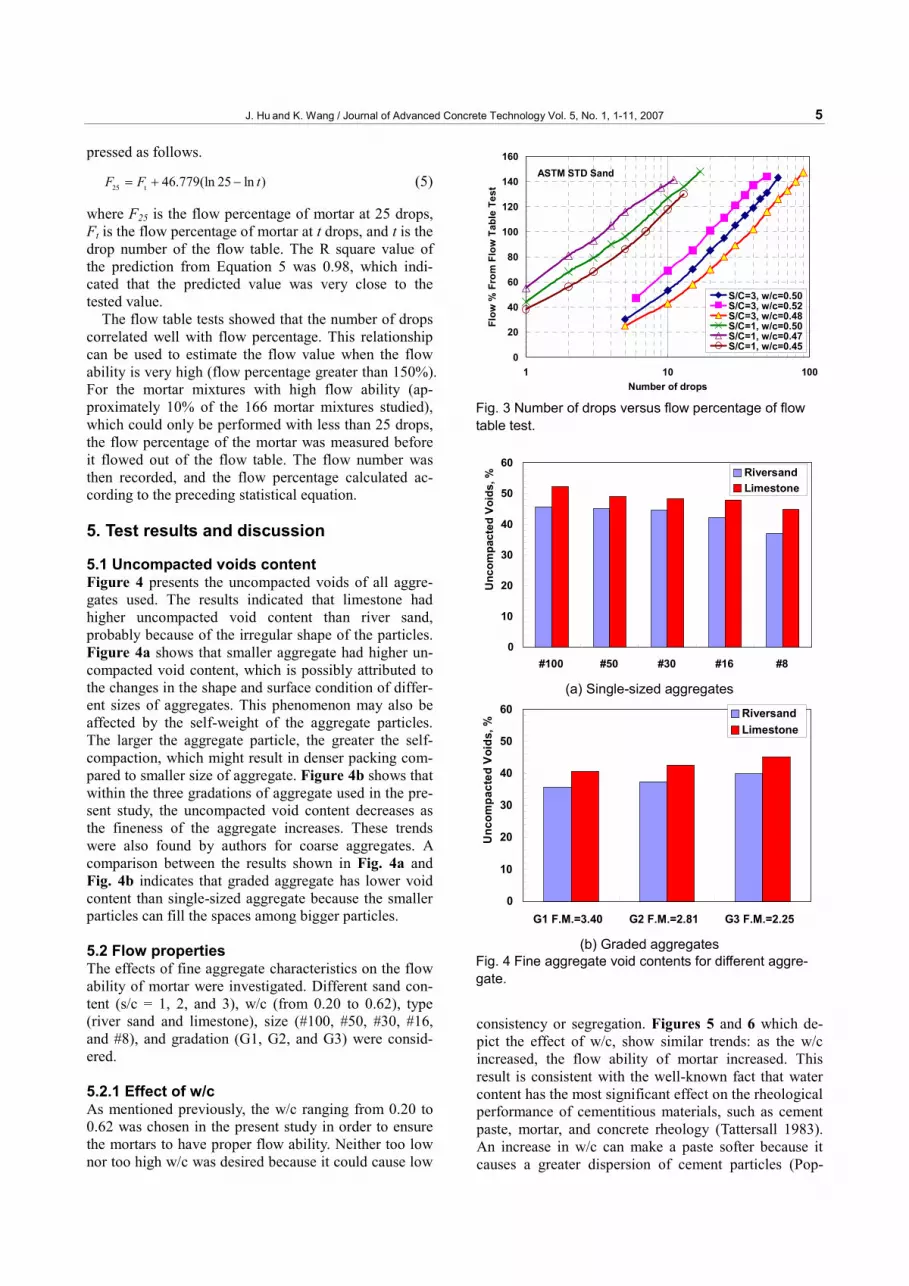
where F25 is the flow percentage of mortar at 25 drops, Ft is the flow percentage of mortar at t drops, and t is the drop number of the flow table. The R square value of the prediction from Equation 5 was 0.98, which indi-cated that the predicted value was very close to the tested value.
The flow table tests showed that the number of drops correlated well with flow percentage. This relationship can be used to estimate the flow value when the flow ability is very high (flow percentage greater than 150%). For the mortar mixtures with high flow ability (ap-proximately 10% of the 166 mortar mixtures studied), which could only be performed with less than 25 drops, the flow percentage of the mortar was measured before it flowed out of the flow table. The flow number was then recorded, and the flow percentage calculated ac-cording to the preceding statistical equation.
5. Test results and discussion
5.1 Uncompacted voids content Figure 4 presents the uncompacted voids of all aggre-gates used. The results indicated that limestone had higher uncompacted void content than river sand, probably because of the irregular shape of the particles. Figure 4a shows that smaller aggregate had higher un-compacted void content, which is possibly attributed to the changes in the shape and surface condition of differ-ent sizes of aggregates. This phenomenon may also be affected by the self-weight of the aggregate particles. The larger the aggregate particle, the greater the self-compaction, which might result in denser packing com-pared to smaller size of aggregate. Figure 4b shows that within the three gradations of aggregate used in the pre-sent study, the uncompacted void content decreases as the fineness of the aggregate increases. These trends were also found by authors for coarse aggregates. A comparison between the results shown in Fig. 4a and Fig. 4b indicates that graded aggregate has lower void content than single-sized aggregate because the smaller particles can fill the spaces among bigger particles. 5.2 Flow properties The effects of fine aggregate characteristics on the flow ability of mortar were investigated. Different sand con-tent (s/c = 1, 2, and 3), w/c (from 0.20 to 0.62), type (river sand and limestone), size (#100, #50, #30, #16, and #8), and gradation (G1, G2, and G3) were consid-ered. 5.2.1 Effect of w/c As mentioned previously, the w/c ranging from 0.20 to 0.62 was chosen in the present study in order to ensure the mortars to have proper flow ability. Neither too low nor too high w/c was desired because it could cause low
consistency or segregation. Figures 5 and 6 which de-pict the effect of w/c, show similar trends: as the w/c increased, the flow ability of mortar increased. This result is consistent with the well-known fact that water content has the most significant effect on the rheological performance of cementitious materials, such as cement paste, mortar, and concrete rheology (Tattersall 1983). An increase in w/c can make a paste softer because it causes a greater dispersion of cement particles (Pop-
0
20
40
60
80
100
120
140
160
1 10 100Number of drops
Flow
% F
rom
Flo
w T
able
Tes
t
S/C=3, w/c=0.50S/C=3, w/c=0.52S/C=3, w/c=0.48S/C=1, w/c=0.50S/C=1, w/c=0.47S/C=1, w/c=0.45
ASTM STD Sand
Fig. 3 Number of drops versus flow percentage of flow table test.
0
10
20
30
40
50
60
#100 #50 #30 #16 #8
Unc
ompa
cted
Voi
ds, %
RiversandLimestone
(a) Single-sized aggregates
0
10
20
30
40
50
60
G1 F.M.=3.40 G2 F.M.=2.81 G3 F.M.=2.25
Unc
ompa
cted
Voi
ds, %
RiversandLimestone
(b) Graded aggregates Fig. 4 Fine aggregate void contents for different aggre-gate.

6 J. Hu and K. Wang / Journal of Advanced Concrete Technology Vol. 5, No. 1, 1-11, 2007
ovics 1982), and therefore, the mobility of the mortar increases with mobility of the paste. 5.2.2 Effect of aggregate content
As shown in Fig. 5, the difference in the flow ability
of mortar having different sizes of aggregate is not sig-nificant at a low s/c (s/c = 1), but it becomes more pro-nounced when s/c increases to 2 and 3. In a different plot, Fig. 7 also shows that as sand content increased,
Riversand S/C=1
0
50
100
150
200
250
0.20 0.30 0.40 0.50W/C
Flow
%
#100 (0.15mm)#50 (0.30mm)#30 (0.60mm)#16 (1.18mm)#8 (2.36mm)
Limestone S/C=1
0
50
100
150
200
250
0.20 0.30 0.40 0.50W/C
Flow
%
#100 (0.15mm)#50 (0.30mm)#30 (0.60mm)#16 (1.18mm)#8 (2.36mm)
(a) River sand, s/c = 1 (b) Limestone, s/c = 1
Riversand S/C=2
0
40
80
120
160
200
0.25 0.35 0.45 0.55W/C
Flow
%
#100 (0.15mm)#50 (0.30mm)#30 (0.60mm)#16 (1.18mm)#8 (2.36mm)
Limestone S/C=2
0
40
80
120
160
200
0.25 0.35 0.45 0.55W/C
Flow
%
#100 (0.15mm)#50 (0.30mm)#30 (0.60mm)#16 (1.18mm)#8 (2.36mm)
(c) River sand, s/c = 2 (d) Limestone, s/c = 2
Riversand S/C=3
0
30
60
90
120
150
180
0.30 0.40 0.50 0.60 0.70 0.80W/C
Flow
%
#100 (0.15mm)#50 (0.30mm)#30 (0.60mm)#16 (1.18mm)#8 (2.36mm)
Limestone S/C=3
0
30
60
90
120
150
180
0.30 0.40 0.50 0.60 0.70 0.80W/C
Flow
%
#100 (0.15mm)#50 (0.30mm)#30 (0.60mm)#16 (1.18mm)#8 (2.36mm)
(e) River sand, s/c = 3 (f) Limestone, s/c = 3
Fig. 5 Mortar flow ability with single-sized aggregate.

J. Hu and K. Wang / Journal of Advanced Concrete Technology Vol. 5, No. 1, 1-11, 2007 7
the flow ability of mortar significantly decreased. This might be due to the degree of friction and interlocking of the solid particles increased with the reduced dis-
tances between the sand particles. That is, additional amount of paste is necessary for the mortar having in-creased aggregate volume fraction to maintain a given
Riversand S/C=1
0
40
80
120
160
200
0.30 0.40 0.50 0.60w/c
Flow
%
G1 F.M.=3.40G2 F.M.=2.81G3 F.M.=2.25
Limestone S/C=1
0
40
80
120
160
200
0.30 0.40 0.50 0.60w/c
Flow
%
G1 F.M.=3.40G2 F.M.=2.81G3 F.M.=2.25
(a) River sand at s/c = 1 (b) Limestone at s/c = 1
Riversand S/C=2
0
40
80
120
160
200
0.30 0.40 0.50 0.60w/c
Flow
%
G1 F.M.=3.40G2 F.M.=2.81G3 F.M.=2.25
Limestone S/C=2
0
40
80
120
160
200
0.30 0.40 0.50 0.60w/c
Flow
%
G1 F.M.=3.40G2 F.M.=2.81G3 F.M.=2.25
(c) River sand at s/c = 2 (d) Limestone at s/c = 2
Riversand S/C=3
0
40
80
120
160
200
0.30 0.40 0.50 0.60W/C
Flow
%
G1 F.M.=3.40G2 F.M.=2.81G3 F.M.=2.25
Limestone S/C=3
0
40
80
120
160
200
0.30 0.40 0.50 0.60W/C
Flow
%
G1 F.M.=3.40G2 F.M.=2.81G3 F.M.=2.25
(e) River sand at s/c = 3 (f) Limestone at s/c = 3
Fig. 6 Mortar flow ability with graded aggregate.
(Note: In Fig. 6 (a) and (b), only selected mortars, with a low w/c, were tested because no significant differences were observed in flow of the mortars made with these graded aggregates)

8 J. Hu and K. Wang / Journal of Advanced Concrete Technology Vol. 5, No. 1, 1-11, 2007
flow.
5.2.3 Effect of aggregate size As mentioned previously, Fig. 5 indicates that for a given mix proportion, the mortar made with larger ag-gregate usually had higher flow ability. This can be ex-plained by the excess paste theory. For a given type and given volume of aggregate, the smaller the aggregate size, the larger the surface area the aggregate has. To achieve a proper flow, the aggregate surface in a mortar needs to be covered with a certain thickness of cement paste. Table 3 provides the calculated excess paste thickness of mortar mixes made with different type and size of aggregate for s/c=1 and w/c=0.40 (Hu 2005). It can be observed from the table that the excess paste thickness decreases with reduced size and fineness modulus of the fine aggregate in the mortar. The de-creased paste thickness on the aggregate particle surface could increase the interlock and friction between the particles, thus reducing the mortar flow ability. This result agrees with previous findings that a decrease in maximum particle size generally increases the water demand (Kosmatka et al. 2002). 5.2.4 Effect of aggregate type Aggregate type also significantly affects mortar flow. Figure 8 shows that for a given mix proportion, the
mortar made with limestone sand generally had a lower flow than the mortar made with river sand. This is at-tributed to the higher angularity of limestone. As ob-served in Fig. 4, limestone had higher uncompacted void content than river sand, and therefore requiring more cement paste to fill the spaces among the aggre-gate. As a result, less amount of excess cement paste would be available to coat the aggregate particles. Table 3 shows that compared with river sand, limestone sand provided its mortars with a smaller excess paste thick-ness. Thus, a higher degree of interlock and internal friction between the aggregate particles, provided by the irregular shape and rough surface texture of the lime-stone sand, would require more energy for initiating and processing the mortar flow. 5.2.5 Effect of aggregate gradation Figure 9 indicates that graded aggregate provides the mortar with higher flow ability than the single-sized aggregate having a similar FM. This is because in the graded aggregate, the smaller particles can fill the spaces among the bigger particles, thus resulting in low uncompacted void content. Graded aggregate has a low void content to be filled by paste, which results in a higher amount of excess paste and thicker excess paste coating with the same mix design, consequently offers a noticeable improvement in mortar flow ability. As
#50 Riversand
0
50
100
150
200
250
0.20 0.30 0.40 0.50 0.60 0.70W/C
Flow
%
S/C=3S/C=2S/C=1
#50 Limestone
0
50
100
150
200
250
0.20 0.30 0.40 0.50 0.60 0.70W/C
Flow
%
S/C=3S/C=2S/C=1
(a)River sand as aggregate (b) Limestone as aggregate
Fig. 7 Effect of aggregate content.
Table 3 Calculated excess paste thickness of selected mortar mixes (mm) (s/c=1, w/c=0.40).
Mortars with single-sized aggregate
#100 (0.15 mm)
#50 (0.30 mm)
#30 (0.60 mm)
#16 (1.18 mm)
#8 (2.36 mm)
River sand 0.039 0.079 0.157 0.332 0.741 Limestone 0.024 0.058 0.121 0.242 0.545 Mortars with graded aggregate
G3 (F.M. = 2.25)
G2 (F.M. = 2.81)
G1 (F.M. = 3.40)
River sand 0.085 0.118 0.186 Limestone 0.065 0.094 0.151

J. Hu and K. Wang / Journal of Advanced Concrete Technology Vol. 5, No. 1, 1-11, 2007 9
shown in Table 3, the graded aggregate used in present study was found to provide slightly larger excess paste thickness comparing to the aggregate with comparable fineness (#50 and #30 single-sized sand). This result also implies the importance of aggregate gradation in concrete mix design. Among the three aggregate grada-tions used in the present study, the aggregate with a lar-ger FM generally provided mortar with a higher flow ability, which can be caused by both the lower void con-tent (as shown in Fig. 4b) and the smaller surface area. 5.3 Statistical analysis Based on the test results discussed above, besides w/c, aggregate content, size, type, surface texture, and grada-tion all have clear effects on the mortar flow ability. The major characteristics of the aggregate (such as type, surface texture, and gradation) can be well described
with the parameter of the uncompacted void content. Therefore, a statistical analysis was conducted to quan-tify these effects with selected parameters (w/c, the ag-gregate volume content, uncompacted voids content, and size). The following equation results from the statis-tical analysis of the test data of 166 different mixes:
Flow% = 215-1.71Vn+390w/c-3.50Vs+24.1rFA (6)
where Vn is the uncompacted voids content (%),w/c is water-to-cement ratio in SSD condition, Vs is the vol-ume percentage of sand (%), and r is the average aggre-gate size (mm).
Table 4 summarizes the level of significance of the parameters used in the models. As shown, the uncom-pacted void content, water-to-cement ratio, volume per-centage of sand, and average size of aggregate had F-
#50 S/C=3
0
40
80
120
160
0.30 0.40 0.50 0.60 0.70W/C
Flow
%
LimestoneRiversand
#16 S/C=3
0
40
80
120
160
0.30 0.40 0.50 0.60 0.70W/C
Flow
%
LimestoneRiversand
(a) Size #50 fine aggregate (b) Size #16 fine aggregate
Fig. 8 Effect of aggregate type.
Riversand S/C=3
0
40
80
120
160
200
0.35 0.45 0.55 0.65W/C
Flow
%
G2 F.M.=2.81G3 F.M.=2.25#30 F.M.=3.00#50 F.M.=2.00
Limestone S/C=3
0
40
80
120
160
200
0.35 0.45 0.55 0.65W/C
Flow
%
G1 F.M.=3.40G2 F.M.=2.81#16 F.M.=4.00#30 F.M.=3.00
(a) River sand at fine aggregate (b) Limestone as fine aggregate
Fig. 9 Effect of gradation.

10 J. Hu and K. Wang / Journal of Advanced Concrete Technology Vol. 5, No. 1, 1-11, 2007
ratios of 10.72, 249.6, 269.0, and 26.89. These F-ratios correspond to p-values less than 0.05, which indicate that all of the parameters studied had a statistically sig-nificant effect on mortar flow ability. The statistical Equation (6) had an R square value of 0.76 and a p-value less than 0.0001, indicating a very good prediction.
The effect of different parameters on mortar flow ability is shown in Fig. 10. It can be observed in the figure that as the uncompacted void content of aggre-gate increases, the mortar flow ability generally de-creases. As previously discussed, it is because more paste is required to fill the spaces among aggregate par-ticles and allow less paste available for the mortar flow. The flow ability of a mortar increases with the w/c be-cause of the lubrication from water and the increase in the flow ability of the cement paste. The increased vol-ume fraction of aggregate results in lower flow ability because relatively less paste is available to provide the mortar with flow. Mortar flow ability also increases with aggregate size, but this effect is less significant when compared to other parameters. Other parameters, such as uncompacted voids, may surpass the effect of particle size, because the void content of the aggregate used in the present study generally decrease as the aggregate size increase. However, from the statistical point of view, aggregate size is still significant. This phenomenon can be explained by the theory of excess paste: a smaller particle size generally has a higher surface aggregate and requires more excess paste to maintain the flow, thus affecting the flow ability of the mortar (See Table 3). It is also noted that the moisture condition of the
aggregate used was actually between OD and SSD con-ditions, and the aggregate with different sizes had dif-ferent rates of water absorption, thus affecting the mor-tar flow ability. The smaller size of aggregate normally has a high absorption rate, which results in a fast flow ability loss. Equation 6 demonstrates the major factors that significantly affect mortar flow and can also be used to predict or quantify mortar flow ability based on aggregate characteristics and mix proportions.
6. Conclusions
In this study, the flow ability of mortar was investigated using a modified flow table test. A total of 166 mortar mixes were evaluated. Different variables relating to the effects of aggregate –including proportion, type, size, and gradation – on mortar flow ability were quantita-tively studied. Since the focus of the present study was to investigate effect of aggregate, no chemical admix-ture was applied in the mortar mixtures studied. The excess paste theory was used to explain the effect of aggregate on mortar flow ability. Based on the test data, a statistical model was developed to predict mortar flow ability as well as to evaluate the factors that influence mortar flow ability. The following conclusions can be drawn from the present research: 1. Aggregate gradation, shape, and surface texture
can be characterized by the measurement of un-compacted voids among the aggregate particles. Generally, aggregate with a higher uncompacted void content provides mortar with a lower flow.
2. In addition to w/c, uncompacted voids, aggregate size and volume significantly influence mortar flow ability. The effect of aggregate size, type and gradation on mortar flow ability may not be sig-nificant for mortar with a low s/c, but it becomes significant as s/c increases.
3. At a given w/c, increased aggregate content gener-ally reduces the flow ability of mortar. For a given aggregate content, aggregate with larger size pro-vides mortar with a better flow. Mortar containing a graded aggregate usually has better flow ability
Table 4 ANOVA for statistical model. Source Sum of Squares Mean Square F Ratio Prob > F
Vn 7068 7068 10.72 0.0013w/c 164593 164593 249.6 <.0001Vs 177416 177416 269.0 <.0001
Avg-size 17730 17730 26.89 <.0001Error 161 106170 659.4 Prob > F
C. Total 165 441974 <.0001
Flow
, %
247
0
117
Vn, %
35.5 52.1 43.7
w/c0.2 0.62
0.36Vs, %
32 6651.0
Avg-size, mm0.1125 1.77
0.67
Fig. 10 Effect of different parameters on mortar flow ability.

J. Hu and K. Wang / Journal of Advanced Concrete Technology Vol. 5, No. 1, 1-11, 2007 11
than mortar with single-sized particles because of the lower uncompacted voids.
4. Limestone, having high uncompacted void content and high friction between the particles, provides its mortar with less flow than river sand.
5. Based on the parameters of uncompacted voids, sand content, aggregate size, and w/c, the statisti-cal model developed in this study can be used to predict mortar flow and to study the effect of dif-ferent material parameters on the mortar flow abil-ity.
Acknowledgments The authors would like to thank the National Concrete Pavement Technology Center (CP Tech Center), Port-land Cement Concrete (PCC) Pavement and Materials Research Laboratory, and Materials Analysis and Re-search Lab (MARL) for their sponsorship of this study. References Bui, V. K., Akkaya, Y. and Shah, S. P. (2002).
“Rheological model for self-consolidating concrete.” ACI Materials Journal, 99 (6), 549-559.
Denis, A., Attar, A., Breysse, D. and Chauvin, J. J. (2002). “Effect of coarse aggregate on the workability of sandcrete.” Cement and Concrete Research, 32 (5), 701-706.
Geiker, M. R., Brandl, M., Thrane, L. N. and Nielsen, L. F. (2002). “On the effect of coarse aggregate fraction and shape on the rheological properties of self-compacting concrete.” Cement, Concrete, and
Aggregate, 24 (1), 3-6. Hu, J. (2005). “A study of effects of aggregate on
concrete rheology.” Ph.D. Dissertation, Iowa State University, Ames, Iowa.
Kosmatka, S, H., Kerkhoff, B. and Panarese, W. C. (2002). “Design and control of concrete mixture.” 14th ed., Portland Cement Association.
Malhotra, V. M. (1964). “Correlation between particle shape and surface texture of fine aggregates and their water requirement.” Materials Research & Standards, December, 656-658.
Oh, S. G., Noguchi, T. and Tomosawa F. (1999). “Toward mix design for rheology of self-compacting concrete.” RILEM SCC 99, University of Tokyo.
Popovics, S. (1982). “Fundamentals of Portland Cement Concrete: A Quantitative Approach - Vol. 1: Fresh Concrete.” New York: John Wiley & Sons, Inc.
Smith, M. R. and Collis, L. (2001). “Aggregates – Sand, Gravel and Crushed Rock Aggregates for Construction Purposes (3rd edition).” London: The Geological Society.
Struble, L., Szecsy, R., Lei, W. and Sun G. (1998). “Rheology of cement paste and concrete.” Cement, Concrete, and Aggregate, 20 (2), 296-277.
Szecsy, R. S. (1997). “Concrete Rheology.” Dissertation (PhD), University of Illinois at Urbana-Champaign, Urbana, Illinois.
Tattersall, G. H. and Banfill, P. F. G. (1983). “The Rheology of Fresh Concrete.” Marshfield, Massachusetts: Pitman Books Limited.


