Embed Size (px)
Citation preview

Mon. Not. R. Astron. Soc. 000, 000–000 (0000) Printed 1 April 2014 (MN LATEX style file v2.2)
The life and death of cosmic voids
P.M. Sutter1,2,3 ?, Pascal Elahi4, Bridget Falck5, Julian Onions6, Nico Hamaus1,2,Alexander Knebe7, Chaichalit Srisawat8, and Aurel Schneider8
1 Sorbonne Universites, UPMC Univ Paris 06, UMR7095, Institut d’Astrophysique de Paris, F-75014, Paris, France2 CNRS, UMR7095, Institut d’Astrophysique de Paris, F-75014, Paris, France3 Center for Cosmology and Astro-Particle Physics, Ohio State University, Columbus, OH 432104 Sydney Institute for Astronomy, University of Sydney, Sydney NSW 2016, Australia5 Institute of Cosmology and Gravitation, University of Portsmouth, Portsmouth PO1 3FX, UK6 School of Physics & Astronomy, University of Nottingham, Nottingham, NG7 2RD, UK7 Departamento de Fısica Teorica, Modulo C-15, Facultad de Ciencias, Universidad Autonoma de Madrid, 28049 Cantoblanco, Madrid,
Spain8 Department of Physics & Astronomy, University of Sussex, Brighton, BN1 9QH, UK
1 April 2014
ABSTRACTWe investigate the formation, growth, merger history, movement, and destruction ofcosmic voids detected via the watershed transform in a cosmological N -body darkmatter ΛCDM simulation. By adapting a method used to construct halo merger trees,we are able to trace individual voids back to their initial appearance and record themerging and evolution of their progenitors at high redshift. For the scales of void sizescaptured in our simulation, we find that the void formation rate peaks at scale factor0.3, which coincides with a growth in the void hierarchy and the emergence of darkenergy. Voids of all sizes appear at all scale factors, though the median initial void sizedecreases with time. When voids become detectable they have nearly their present-dayvolumes. Almost all voids have relatively stable growth rates and suffer only infrequentminor mergers. Dissolution of a void via merging is very rare. Instead, most voidsmaintain their distinct identity as annexed subvoids of a larger parent. The smallestvoids are collapsing at the present epoch, but void destruction ceases after scale factor0.3. In addition, voids centers tend to move very little, less than 10−2 of their effectiveradii per ln a, over their lifetimes. Overall, most voids exhibit little radical dynamicalevolution; their quiet lives make them pristine probes of cosmological initial conditionsand the imprint of dark energy.
Key words: cosmology: simulations, cosmology: large-scale structure of universe
1 INTRODUCTION
Since cosmic voids are, by definition, relatively empty ofmatter, they offer a unique and pristine laboratory for study-ing dark energy (Lavaux & Wandelt 2011; Sutter et al.2012a), exotic fifth forces (Li et al. 2012; Spolyar et al. 2013),and the early universe (Goldberg & Vogeley 2004). They alsooffer a complementary probe of the growth of structure viatheir size and shape distributions (Biswas et al. 2010; Boset al. 2012; Clampitt et al. 2013). Recently large catalogs ofvoids identified in galaxy redshift surveys (Pan et al. 2012;Sutter et al. 2012b; Nadathur & Hotchkiss 2014; Sutter et al.2014b) have opened the way for statistical and systematicmeasurements of void properties (Ceccarelli et al. 2013; Sut-
? Email: [email protected]
ter et al. 2014a), and their connections to cosmological pa-rameters (Planck Collaboration 2013; Melchior et al. 2013).
However, given the promising utility of voids, we stilllack a detailed understanding of their life cycles. For exam-ple, for a given void observed at low redshift, we do notknow when it formed, where it formed, whether it grew toits present size via simple expansion or through mergers,nor whether it will continue expanding or eventually col-lapse. We also do not understand basic statistics about voidsover cosmic time: their formation and merger rates, growthrates, and movement. Such understanding of the life cyclesof voids will solidify current void-based cosmological analy-sis and enable future probes. Also, if we are to use voids ascosmological probes we must understand the impact of theirdynamics on any primordial cosmological signal.
For example, void abundances are difficult to predictwith excursion set formalisms because small voids tend to
c© 0000 RAS
arX
iv:1
403.
7525
v1 [
astr
o-ph
.CO
] 2
8 M
ar 2
014

2 P.M. Sutter et al.
collapse. While there have been several attempts to improvethe initial theoretical result of Sheth & van de Weygaert(2004), such as by adjusting the void growth and destructionparameters (Furlanetto & Piran 2006; D’Aloisio & Furlan-etto 2007; Paranjape et al. 2012), rescaling void sizes (Jen-nings et al. 2013), and introducing a peaks formalism (Rus-sell 2013), there still remains very little correspondence tovoids identified with watershed techniques in galaxy sur-veys (Sutter et al. 2014b). We may improve excursion setpredictions by directly measuring the growth and destruc-tion rate in cosmological simulations.
The shapes of voids offer a particularly interesting cos-mological probe, whether by their distribution (e.g. Boset al. 2012) or via an application of the Alcock-Paczynskitest (Alcock & Paczynski 1979; Ryden 1995; Lavaux & Wan-delt 2011; Sutter et al. 2012a). However, these tests rely onthe assumption that the void identified in a galaxy surveycorresponds to a physical underdensity in the dark mat-ter. While this is largely an issue of sparsity and galaxybias (Sutter et al. 2014a), the watershed technique may spu-riously merge voids even in the dark matter. These voids willerroneously appear as larger voids that are not completelyempty and thus have suspect shapes. We can use a detailedmerger history to identify such suspect voids.
Recently Hamaus et al. (2014) pointed out that for agiven tracer population there exists a compensation scale,where the void-matter bias is identically zero. Below thisscale, voids generally collapse due to their surrounding over-dense walls, while above this scale voids tend to continueexpanding (Ceccarelli et al. 2013). However, these resultsare based on studies of the velocity profiles and clusteringstatistics at fixed time. Only by tracing the evolution — andthereby studying the dynamics — of voids could one accu-rately examine the properties of voids in relation to such acompensation scale.
Finally, the growth and merger rates of voids are po-tential cosmological probes, analogous to the growth rate ofcosmic structure. The nature of modified gravity and fifthforces can leave fingerprints on the evolution of the void pop-ulation at high redshift, potentially constraining the prop-erties of dark energy.
Unfortunately, to date this remains a largely unexploredtopic. Most early studies of voids in simulations focused onvisual identification and characterization (e.g., White et al.1987). For example, the pioneering works of Dubinski et al.(1993), which discussed the process of void merging, and vande Weygaert & van Kampen (1993), which first noted thehierarchical nature of void buildup, were entirely based onvisually examining thin slices of N -body simulations. Morerecent and more sophisticated analyses have focused on voidinteriors (e.g., Gottlober et al. 2003; Goldberg & Vogeley2004; Aragon-Calvo & Szalay 2012; Neyrinck et al. 2013) oron statistics at a fixed time such as those discussed above.
In this work we present a comprehensive study ofthe formation, subsequent evolution, and destruction ofvoids. We use techniques adapted from building halo mergertrees (Srisawat et al. 2013) to follow individual voids acrosscosmic time. This approach allows us to measure their for-mation time, identify when mergers occur, track their move-ment and growth, and, when it does happen, record theirtime of collapse. We translate this information into rates
and correlate these rates with void size, which can then in-form theoretical and observational results.
In the following section we review our simulation setup,void finding approach, merger identification technique, andsome definitions to be used throughout the work. In Sec-tion 3 we focus on the formation time of voids, followed bya discussion in Section 4 of their growth and merger his-tories. In Sections 5 and 6 we present an analysis of voidmovement and destruction rate over cosmological time, re-spectively. Finally, we conclude in Section 7 with a briefdiscussion of implications for theoretical modeling of voidsand directions for future work.
2 NUMERICAL APPROACH
2.1 Simulation
We study voids forming in a single cosmological dark mattersimulation run using the Gadget-3 N -body code (Springel2005) with initial conditions drawn from the WMAP-7cosmology (Komatsu et al. 2011). Voids are identified in62 snapshots from redshift 0 to ∼30. The snapshots areevenly spaced in ln a, where a is the scale factor. Thesimulation contains 2703 particles in a box of comovinglength 62.5 h−1Mpc, giving a dark matter particle mass of9.31×108 h−1 M. For more simulation details see Srisawatet al. (2013).
2.2 Void Finding
We identify voids with a heavily modified version ofZOBOV (Neyrinck 2008; Lavaux & Wandelt 2011; Sutteret al. 2012b). ZOBOV creates a Voronoi tessellation of thetracer particle population and uses the watershed trans-form to group Voronoi cells into zones and subsequentlyvoids (Platen et al. 2007). By implicitly performing a De-launey triangulation (the dual of the Voronoi tessellation),ZOBOV assumes constant density across the volume of eachVoronoi cell, which sets the smoothing scale for the con-tinuous field necessary to perform the watershed transform.There is no additional smoothing.
The algorithm proceeds by first grouping adjacentVoronoi cells into zones, which are local basins. Next, thewatershed transform merges zones into voids by examiningthe density barriers between them and joining them togetherto form ever-larger agglomerations. We impose a density-based threshold within ZOBOV where adjacent zones are onlyadded to a void if the density of the wall between them is lessthan 0.2 times the mean particle density. This prevents voidsfrom expanding deeply into overdense structures and limitsthe depth of the void hierarchy (Neyrinck 2008). However,this does not place a restriction on the density of the initialzone, and in principle a void can have any mean density.
The watershed transform identifies catchment basins asthe cores of voids and ridgelines, which separate the flow ofwater, as the boundaries of voids. In sum, we identify voidsas depressions in the tracer density; voids are non-sphericalaggregations of Voronoi cells that share a common basin andare bounded by a common set of higher-density walls.
These operations allow the construction of a nested hi-erarchy of voids (Lavaux & Wandelt 2011; Bos et al. 2012):
c© 0000 RAS, MNRAS 000, 000–000

The life and death of cosmic voids 3
0
1
22
1 1
0 0
"High-level"Parent Voids
"Low-level" Child Sub-voids
Figure 1. A cartoon of the assembly of the void hierarchy. Thetop panel shows ridgelines with line thickness proportional to den-
sity. The bottom panel shows the tree derived from such a collec-tion voids, with the tree level of each void indicated.
we identify the initial zones as the deepest voids, and as weprogressively merge voids across ridgelines we can identifysuper-voids. There is no unique definition of a void hierarchy,and we take the semantics of Lavaux & Wandelt (2011): aparent void contains all the zones of a sub-void plus at leastone more. All voids have only one parent but potentiallymany (or no) children, and the children of a parent occupydistinct subvolumes separated by low-lying ridgelines. Fig-ure 1 shows a cartoon of this void hierarchy construction.
Our simulation gives a mean particle spacing n−1/3 ≈0.25 h−1Mpc, which sets a lower size limit of the detectabil-ity of voids due to shot noise. For this work we will studyall voids with effective radius Reff > 1 h−1Mpc. We definethe effective radius as
Reff ≡(
3
4πV
)1/3
, (1)
where V is the total volume of the Voronoi cells that con-tribute to the void. We do not impose any other cuts based
Figure 2. Cumulative number functions for voids in different
levels of the hierarchy. Tree level 0 (dark blue) are the topmostparent voids, and tree level 8 (red) are subvoids deepest in the
hierarchy. Though higher-level voids tend to be larger, they spana broad range of sizes. At the topmost level, there are only a few
small “field” (i.e., childless) voids and some voids that span nearly
the entire simulation volume. We do not show these largest voidsso that we may highlight the relative differences of the remaining
hierarchy levels.
on density contrast or minimum density — we wish to seeif marginal voids have similar histories as deeper underden-sities.
Additionally, for the analysis below we need to define acenter for each void. For this work we take the barycenter, orvolume-weighted center of all the Voronoi cells in the void:
Xv =1∑i Vi
∑i
xiVi, (2)
where xi and Vi are the positions and Voronoi volumes ofeach tracer i, respectively.
Figure 2 shows the cumulative void number functionfor all voids in the final a = 1.0 snapshot, organized bylevel in the hierarchy. Note that these numbers functions donot turn over at small radii, as predicted by Sheth & vande Weygaert (2004), since we are plotting the cumulative,rather than differential, function, and we are only count-ing voids well above the resolution limit. At the top-mostparent root level (Tree Level 0) there are only a few smallfield voids and the largest voids in the simulation. As we godeeper into the hierarchy, we see increasingly smaller voids.We construct the void tree such that each void has only asingle parent (or no parents at all) and can potentially havemany children. One void is a parent of another if it sharesall zones of the child plus at least one more. Parents canthen become children of even larger super-voids. Withoutany density thresholds, there will be a single void that en-compasses the entire simulation volume. However, since wedo apply a density threshold, we have multiple root voids.The relatively small simulation box prevents us from exam-ining the very largest voids; however, the large voids that arediscovered in this box are representative of the voids foundin larger simulations and galaxy surveys.
c© 0000 RAS, MNRAS 000, 000–000
4 P.M. Sutter et al.
2.3 Merger Identification
To match voids from one snapshot to another, we use thetree building routine that is part of the publicly availableVELOCIraptor (aka STF) package1. The VELOCIraptor treebuilder code is a particle correlator: it takes two particle IDlists (named A and B) and for each object in list B iden-tifies those objects in list A (i.e., in the previous snapshot)that have particles in common. This first step produces agraph mapping the connections between objects rather thanan actual progenitor tree. To produce a tree the algorithmcalculates the merit of each connection:
MAiBj = N2Ai∩Bj
/(NAiNBj ), (3)
where NAi∩Bj is the number of shared particles betweenthe object i in catalog A and object j in catalog B, and NAi
and NBj are the number of particles in object i in catalog Aand j in B, respectively. Between two snapshots, the uniquemain progenitor is the object that maximises the merit. Thisstrategy has proven successful in building halo merger trees(see for instance Srisawat et al. 2013).
Note that while technically we are constructing bi-directional graphs, we will see that we are justified in callingthese trees since the void evolution is surprisingly simple.
However, unlike halos, which are defined by the particlesthey are composed of, voids are defined by the empty spacesbetween particles. Ideally we would correlate volumes ratherthan particles. However, this is computationally expensiveand fraught with difficulties: it would require modeling theVoronoi volume around each particle and making arbitrarydecisions on when one particle’s volume is correlated withanother. Instead of trying to determine the overlap in vol-ume, we simply use the volume associated with each particleas determined by ZOBOV, vl, to weight the merit function.Thus the modified merit function becomes
MAiBj = V 2Ai∩Bj
/(VAiVBj ), (4)
where the total volume of a void is V =∑N
l vl, and the
shared volume is V 2Ai∩Bj
=∑NAi∩Bj
l vl,Aivl,Bj . This sumis over all shared particles, with each particle weighted bythe volume associated with it in catalogs A and B. In orderto qualify as a progenitor the compared voids must shareat least 10 particles, though changes to this value do notproduce significantly different results.
We note that even a simple particle based approach isjustified as even our smallest voids contain hundreds of parti-cles. While the cores of voids are empty, there are sufficientnumbers of particle distributed throughout the remainingvolume that particles can be used as a proxy for the voidvolume. The volume weighting scheme used here simply re-duces instances where a void in catalog A shares particleswith several voids in catalog B. The volume weighted meritfunction chooses the progenitor which minimises the volumefluctuations on a particle by particle basis and for the voidas a whole.
For the remainder of this work when we examine themovement and growth of a void, we are discussing the evo-lutionary chain of the main progenitor.
1 https://www.dropbox.com/sh/177zo6q3qk5pdkz/T0V0eseLZu
3 VOID FORMATION
We begin with visual examination of voids as a function ofscale factor, shown in Figure 3. This figure shows slices ofthe dark matter particles that are identified as belonging tovoids. Initially there are only small, isolated voids just abovethe minimum size threshold. Since we do not apply a den-sity criterion, these are shallow basins that will eventuallyempty out (as seen in van de Weygaert et al. 2004). Thesedepressions in the initial density field then begin to expand,with small basins quickly merging with larger basins. As thewalls and filaments begin to coalesce around a = 0.2 − 0.4,a complex void hierarchy begins to form as subvoids groupinto larger parent points. At this epoch the density con-trast in the large scale structure becomes high enough forour void finder to identify the multi-level basins as distinctvoids. At late times, the larger voids simply grow and ex-pand into their local environment, and since the watershedmethod includes all particles within the ridgeline as voidmembers, we see very few gaps (e.g., the dense halos) in thevoid particle distribution.
The shallow basins at early times could be consideredas “proto-voids”. To separate these from mature voids onecould define a density threshold, as is done for halos (Sheth& van de Weygaert 2004). However, since voids exhibit onlylinear and quasi-linear evolution, there is no clear distinctionbetween early- and late-time voids: there is a one-to-onemapping from the initial to the final void state (Lavaux &Wandelt 2010; Hamaus et al. 2014).
To clarify this mapping, Figure 4 shows the formationscale factor af for each void identified at the present day.We define af as the scale factor at which the void reachesa fraction fV of its current volume. We examine values offV equal to 10−4, 8 × 10⁻³, and 0.2. These fractional vol-umes are chosen arbitrarily but pertain to specific increasesin void size by corresponding to fractional radii of 0.01, 0.05,and 0.1, respectively. All three values give nearly identicalresults: some voids have persisted since the beginning of thesimulation, and others have only appeared recently. As ex-pected, with larger values of fV the distribution skews tolater times (note the much smaller value of the green line ata = 0.0), but this is surprisingly insignificant: once a void isdetected, it has essentially its present-day volume. There isalso an increase in the formation time just before a = 1.0.While this may be due to numerical effects, it is not signifi-cantly different than the af > 0.4 fluctuations.
There is a noticeable spike at a ≈ 0.3. This coincideswith the initial growth of the void hierarchy; prior to thistime there are only isolated voids. Thus this time indicatesthe appearance of significant structural hierarchy in the cos-mic web. It also coincides with the appearance — though notdomination — of dark energy: in these epochs, ΩΛ ∼ 0.1ΩM .Thus a large void population forms at these scale factorsthrough a combination of the crystallization of the cosmicweb, allowing basins to be identified, and the emergence ofdark energy, which shuts off significant continued void pro-duction. Since all chosen values of fV give nearly the sameresults, voids reach their present-day volume quickly — es-sentially when they are first able to be identified as voids —and do not grow much. We will return to this subject later.
In Figure 5 we examine the distribution of void sizesas they appear in the simulation. Throughout most of cos-
c© 0000 RAS, MNRAS 000, 000–000

The life and death of cosmic voids 5
Figure 3. A visual impression of the buildup of voids. Shown are thin slices of the particle distribution at various simulation snapshots.
Only void member particles are shown. Slices are at scale factors 0.1 (left), 0.25 (middle), and 1.0 (right). Around a = 0.23, filaments
and walls become dense enough and the underdensities clear enough to support the formation of larger voids. While the parent voidsgently expand, the formation and merging of subvoids continues. Watershed void finders include as void members all particles within the
highest-density ridgeline; hence at late times almost all but the highest-density particles are included in voids.
Figure 4. Distribution of scale factors of formation for voids that
persist to a = 1.0. The peak around a = 0.2 − 0.4 corresponds to
a significant increase in the depth of the void hierarchy.
mic history, the median void formation size is centeredon 2 h−1Mpc, and a small population of medium-scale10−15 h−1Mpc voids continually appears. The median voidformation drops to nearly 1 h−1Mpcby the present day, sincenewer voids can only occupy smaller niches in the cosmicweb adjacent to larger, expanding neighbor voids. The verylargest voids appear at any times, as the walls between mid-scale voids empty out and the voids are joined into largersuper-voids. The fact that there is no noticeable peak for-mation time for voids of a specific size but there is a peakin the formation time of voids indicates that the level ofthese voids in the hierarchy changes with time. Althoughwe are showing the present-day a = 1 void sizes, the factthat voids do not grow much over time indicates that this isalso essentially their size at formation.
Figure 5. Distribution of a = 1 void sizes as a function of their
formation scale factor af . The black line is the median in bins
of width ∆af = 0.05, the dark bands are the inner 68% of thebinned distribution, and light grey bands are the bin extrema.
4 VOID MERGERS & GROWTH
We use Figure 6 to show an example of a void merger his-tory. In this figure we show slices of the dark matter densitycentered on a representative void at a = 1.0. We then showthe same slice at the same position at two other scale factors,0.8 and 0.4. In these additional slices we show the progeni-tors of the present-day void. While the voids in general havecomplex shapes due to the nature of the watershed (see,for example, Sutter et al. 2012b) we represent them here assimple circles with radii equal to the effective radius Reff .
We choose this void to highlight two distinct processesof void evolution. The first, pure merging, occurs when high-density barriers between two voids completely dissolve dueto outflows. When the barrier becomes too low (< 0.2ρ), theseparate voids become indistinguishable from each other,forming a single larger void. However, as we will discussbelow, this is a very rare process. Instead, what more fre-quently occurs is annexation of subvoids as a larger parentvoid assembles, generating a hierarchy. The subvoids remainas distinct and detectable basins, but comprise only a por-tion of the volume of a larger parent (Figure 1).
c© 0000 RAS, MNRAS 000, 000–000

6 P.M. Sutter et al.
Figure 6. Evolution of progenitor voids. We show thin slices through the dark matter density with voids superimposed on top. Voidsare represented as circles with radii equal to Reff . Slices are arranged from early (left) to late (right) times and trace the evolution of
a singe void to highlight different void merger histories. We only show progenitors of the final a = 1.0 void. To increase the density
contrast, each panel is scaled such that black and white are the minimum and maximum density of the cells shown, respectively. Thedensity is constructed using cloud-in-cell weighting and the shading is scaled according to log (1 + δ). Projection effects lead to void
centers occasionally appearing to lay on top of filaments. Several processes are highlighted by this evolution, including void merging as
barriers dissolve, and the formation of a void hierarchy as the larger parent void annexes smaller, but distinct, subvolumes.
For each progenitor tree leading up to each present-day void, we can track the total number of progenitors; inother words, the width of the merger tree. In Figure 7 weplot the average number of progenitors 〈Nprog〉 across allpresent-day voids as a function of scale factor. The fact thatthe mean number of progenitors is barely greater than oneindicates that almost all voids follow only a single line ofdescent and experience very few mergers. The number ofprogenitors begins to decrease at a = 0.4, which coincideswith the end of the peak formation time (Figure 4) and therelative lack of new voids after that time.
In Figure 8 we show the growth rate history, dlnReffd ln a
,for every void in the simulation as a function of scale factora. We plot a line for each individual void. As expected, thevoids with the highest growth rates are the largest; these arethe supervoids that form from the rapid merger of subvoidsas the basin empties out of substructure. Since they formin deeply-underdense environments with little substantialstructure surrounding them, they act as miniature universeswith Ωtot < 1. For these larger voids there are a few steepchanges as they merge with a smaller void or fragment intosmaller progenitors. Even though the merger or fragmen-tation ratio is small in terms of volume, it can impact theinstantaneous growth rate from one snapshot to another.
The small- and medium-scale voids show remarkablysteady growth histories, with very few strong deviations.Even though some of these voids do merge, they tend tojust absorb their subvoids, so the overall volume gained issmall. Interestingly, there is a population of collapsing voids:these are the voids located in overall overdense regions. Thisis the “void-in-cloud” phenomenon of Sheth & van de Wey-gaert (2004). Even though there are a few small voids withdiscontinuous merger histories, almost all the small voids areeither gently expanding or contracting.
We break down the growth rates into secular and merg-ing components, as we show in Figure 9. We define the sec-ular growth rate as the growth rate of voids which did notexperience a merger in that timestep. If instead that void
Figure 7. Average number of progenitors as a function of scale
factor for voids at a = 1.0. We calculate this quantity by count-ing the total number of progenitors for all present-day voids anddividing by the number of present-day voids. Hence, this quantitybecomes less than one as the lines of descent for individual voidsend.
did merge with another, its growth from snapshot to snap-shot is calculated in the average merger growth rate. Herewe plot the mean growth rate over all voids as a function ofscale factor. We also separate voids into their level in the hi-erarchy so that we may examine the nature of larger parentvoids and their subvoids separately.
First we notice that the merger growth rate far out-weighs the secular growth rate by an order of magnitude;
c© 0000 RAS, MNRAS 000, 000–000
The life and death of cosmic voids 7
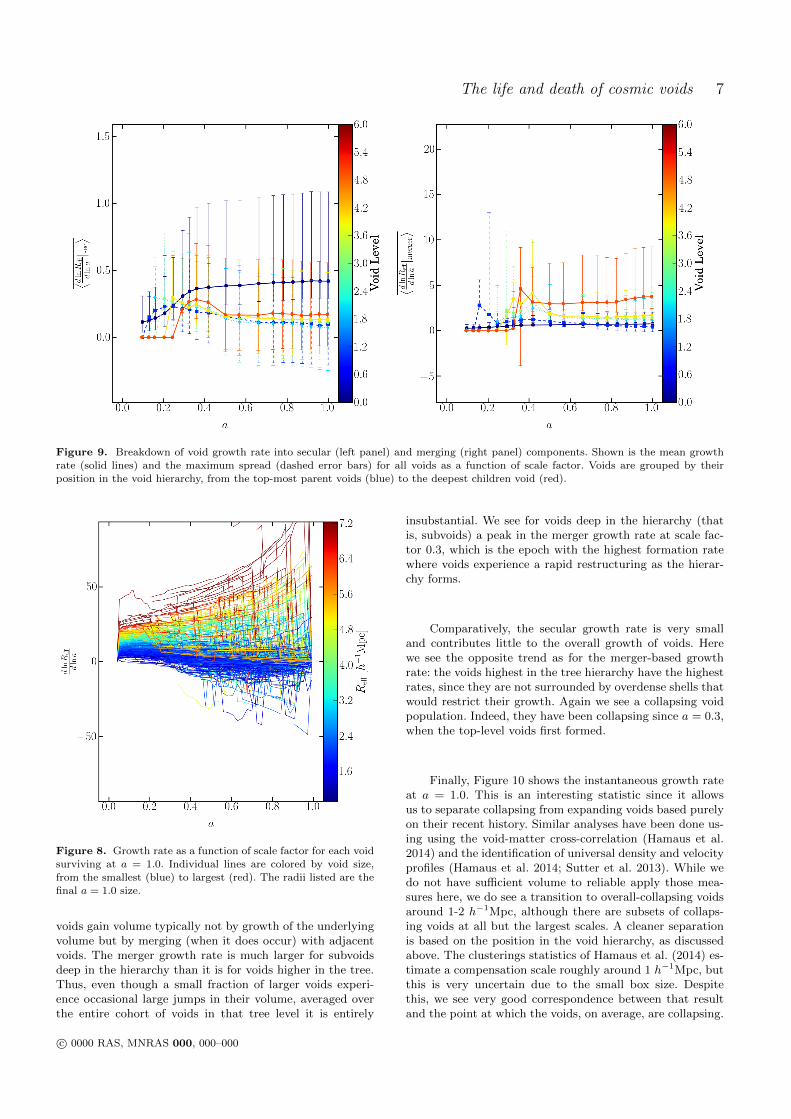
Figure 9. Breakdown of void growth rate into secular (left panel) and merging (right panel) components. Shown is the mean growthrate (solid lines) and the maximum spread (dashed error bars) for all voids as a function of scale factor. Voids are grouped by their
position in the void hierarchy, from the top-most parent voids (blue) to the deepest children void (red).
Figure 8. Growth rate as a function of scale factor for each voidsurviving at a = 1.0. Individual lines are colored by void size,from the smallest (blue) to largest (red). The radii listed are the
final a = 1.0 size.
voids gain volume typically not by growth of the underlyingvolume but by merging (when it does occur) with adjacentvoids. The merger growth rate is much larger for subvoidsdeep in the hierarchy than it is for voids higher in the tree.Thus, even though a small fraction of larger voids experi-ence occasional large jumps in their volume, averaged overthe entire cohort of voids in that tree level it is entirely
insubstantial. We see for voids deep in the hierarchy (thatis, subvoids) a peak in the merger growth rate at scale fac-tor 0.3, which is the epoch with the highest formation ratewhere voids experience a rapid restructuring as the hierar-chy forms.
Comparatively, the secular growth rate is very smalland contributes little to the overall growth of voids. Herewe see the opposite trend as for the merger-based growthrate: the voids highest in the tree hierarchy have the highestrates, since they are not surrounded by overdense shells thatwould restrict their growth. Again we see a collapsing voidpopulation. Indeed, they have been collapsing since a = 0.3,when the top-level voids first formed.
Finally, Figure 10 shows the instantaneous growth rateat a = 1.0. This is an interesting statistic since it allowsus to separate collapsing from expanding voids based purelyon their recent history. Similar analyses have been done us-ing using the void-matter cross-correlation (Hamaus et al.2014) and the identification of universal density and velocityprofiles (Hamaus et al. 2014; Sutter et al. 2013). While wedo not have sufficient volume to reliable apply those mea-sures here, we do see a transition to overall-collapsing voidsaround 1-2 h−1Mpc, although there are subsets of collaps-ing voids at all but the largest scales. A cleaner separationis based on the position in the void hierarchy, as discussedabove. The clusterings statistics of Hamaus et al. (2014) es-timate a compensation scale roughly around 1 h−1Mpc, butthis is very uncertain due to the small box size. Despitethis, we see very good correspondence between that resultand the point at which the voids, on average, are collapsing.
c© 0000 RAS, MNRAS 000, 000–000

8 P.M. Sutter et al.
Figure 10. Instantaneous secular (i.e., not merging) growth rateat a = 1.0 as a function of void effective radius. The solid black
line is the median growth rate in bins of 1 h−1Mpc, while the
dark and light bands are the 68% and 95% binned percentiles inthe distributions.
Figure 11. Distribution of mean velocities of the void barycenter
over the void lifetimes.
5 VOID MOVEMENT
Despite the occasional violent merger, all voids experiencevery little movement of their barycenters (Eq. 2). Figure 11shows the mean void barycenter velocity, which we define as〈d|X|/d ln a〉, and which we express as fractions of the voideffective radius at the current epoch. The average is takenover the entire void lifetime tracing from its current statealong the branch of its main progenitors.
The distribution of mean barycenter velocities has twodistinct peaks. One, at 10−3, represents the movement ofthe majority of voids, and is remarkably low. This meanvelocity gives rise to an average displacement of only a tiny
Figure 12. Fraction of the existing void population destroyedas a function of scale factor.
fraction of the void radius. This is not surprising: once adeep underdensity forms from the initial conditions, it isunlikely to move as the voids expand into the surroundingcosmic web.
The second peak, at 1×10⁻², is the small population ofvoids that experience violent mergers. Most of these voidsare small subvoids residing deep in the void hierarchy. Asbefore, we see that this is only a small fraction, roughly fivepercent, of all voids. Even in these cases, the mean displace-ment is very small, indicating that even when voids experi-ence mergers they are relatively gentle, since the barycenterremains relatively stable.
6 VOID DESTRUCTION
We show the destruction rate, or the fraction of the existingvoid population lost in each snapshot in Figure 12. Whileinitially high prior to a = 0.3, afterwards the destructionrate drops to essentially zero. The initial relatively high de-struction rate is not surprising, since at these early times thebasins are just beginning to become deep enough to be iden-tified as voids, and there is significant noise in the classifica-tion of these objects. However, even at these low scale factorsno more than ∼ 4% of voids are lost in every snapshot. Butat the same time the formation rate spikes, a = 0.3, the de-struction rate plummets. After this epoch, voids that havealready existed or will eventually form never cease to exist.Thus even voids that are collapsing aren’t squeezed entirely;instead they merely become subvoids of larger parent voids.In fact, the squeezing may help bolster their ability to bedetected: as the overdense shells around them grow higher,the density contrasts increase, allowing the void finder tocontinually detect them.
c© 0000 RAS, MNRAS 000, 000–000

The life and death of cosmic voids 9
7 CONCLUSIONS
We have performed a comprehensive analysis of the life cy-cle — covering formation, mergers, growth, movement, anddestruction — of cosmic voids. We have adapted merger treecodes originally designed to track the evolution of halos toaccount for the large spatial extents of voids. By applyingthis technique to a high-resolution N -body simulation, wehave gained a clear picture of voids as dynamic objects inthe cosmic web. Through the use of a watershed void finder,we are able to classify voids according to their position in ahierarchy and use that to identify key epochs and scales intheir evolution.
The past life of a cosmic void depends intimately on itsplace in the void hierarchy. Voids near the top of the hierar-chy primarily form at a scale factor of 0.3, when the densitycontrasts in the cosmic web become high enough to sup-port their identification and the introduction of dark energyshuts off continued structure formation. These higher-levelvoids suffer only minor mergers and tend to maintain consis-tent growth rates over cosmic time. In contrast, voids lyingdeep in the hierarchy continue to form and have a somewhatmore violent life due to the lower-density nature of their sur-roundings, but even most of these voids have only a singleline of descent. The location of a void in the hierarchy ismore important than its size: two voids of equal volume canhave radically different merger histories depending on theiramount of substructure.
Voids typically grow at slow rates. However, there isa population of small collapsing voids. These voids tendto live in overdense environments near filaments and walls.Their overdense surroundings slowly squeeze them as adja-cent larger voids expand. This picture is consistent with thetheory developed by Sheth & van de Weygaert (2004), thevelocity inflow-outflow analysis of Ceccarelli et al. (2013),the clustering study of Hamaus et al. (2014), and the den-sity profile studies of Hamaus et al. (2014) and Sutter et al.(2013). Despite being slowly crushed, after a = 0.3, thesevoids never get completely destroyed. Instead, they continueto survive as identifiable voids to the present day. Thus thevoid destruction rate does not play a significant role in thelate-time evolution of voids, and can be ignored in theo-retical treatments. Additionally, as pointed out by Russell(2013), the collapsing process is completely negligible for allbut the smallest voids.
Finally, voids don’t move much throughout their life-times. Only small voids in the frothy depths of the hierar-chy that undergo several mergers appear to have perturbedbarycenters. Even for these most active of voids, they typi-cally only move a few percent of their effective radii.
The combination of small box volume and high resolu-tion limits our study to relatively small (∼ 1− 15 h−1Mpc)voids, while voids in larger simulations and galaxy surveysare typically much larger. However, recently Sutter et al.(2013) were able to show that many void properties scaleas a function of sampling density and galaxy bias. Thus,properties and characteristics of voids studied in one popu-lation of tracers can, in principle, be immediately translatedto voids in another population. Thus the conclusions thatwe reach in this work are generally applicable to voids dis-covered in other simulations and galaxies.
We have examined the properties of voids defined using
a watershed technique. There are, of course, other plausibledefinitions of voids (see, for example, the comparison workof Colberg et al. 2008). These different algorithms mightgive different pictures of void histories, especially formationtimes, since they usually impose density thresholds. Addi-tionally, there are other approaches to defining merger trees.We have noticed that volume correlations based on particlescan give some non-intuitive results: voids that appear to oc-cupy similar positions (based on their barycenters and effec-tive radii) may not necessarily share any particles. The re-lationships between particle correlation and barycenter def-inition should be investigated further. However, we have ap-plied other merger tree algorithms, such as MergerTree andJMerge (both described in Srisawat et al. 2013), and foundqualitatively similar results.
Overall, voids live far quieter lives than their overdensecounterparts, the halos. Whereas up to 20% of halos havesuffered a recent major merger, voids experience essentiallyno major mergers throughout their lifetime. Likewise, whilesubhalos can be stripped of their mass as they pass througha larger parent halo, subvoids continue to be identifiableeven when a supervoid forms around them. The implicationis that voids are a much more pure cosmological probe; thefundamental cosmological signal imprinted from initial con-ditions and modified by dark energy is not corrupted by sig-nificant dynamics. Thus lower-redshift cosmological probes,such as the Alcock-Paczynski test and void-galaxy cross-correlations, will not be affected by recent spurious mergersin the void population.
ACKNOWLEDGMENTS
PMS acknowledges support from NSF Grant NSF AST 09-08693 ARRA, and would like to thank Mark Neyrinck, AlicePisani, Ravi Sheth, Ben Wandelt, and David Weinberg foruseful comments and discussions.
PJE would like to thank Krzysztof Bolejko for manyuseful discussions over tea. PJE is supported by the SSimPLprogramme and the Sydney Institute for Astronomy (SIfA),DP130100117.
BF is supported by the UK Science and TechnologyFacilities Council grants ST/K00090/1 and ST/L005573/1.
AK is supported by the Ministerio de Economıa y Com-petitividad (MINECO) in Spain through grant AYA2012-31101 as well as the Consolider-Ingenio 2010 Programme ofthe Spanish Ministerio de Ciencia e Innovacion (MICINN)under grant MultiDark CSD2009-00064. He also acknowl-edges support from the Australian Research Council (ARC)grants DP130100117 and DP140100198. He further thanksMomus for the myth of the bishonen.
All the authors are thankful for the generosity and hos-pitality of the organizers of the Sussing Merger Trees Work-shop 2, held in July 2013, where this project started, andespecially Frazer Pearce and Peter Thomas, who providedvaluable comments. The Sussing Merger Trees Workshopwas supported by the European Commission’s FrameworkProgramme 7 through the Marie Curie Initial Training Net-
2 http://popia.ft.uam.es/SussingMergerTrees
c© 0000 RAS, MNRAS 000, 000–000

10 P.M. Sutter et al.
work CosmoComp (PITN-GA-2009-238356). This also pro-vided fellowship support for AS.
The authors contributed in the following ways to thispaper: AK, CS, and AS were members of the SOC thatorganized the workshop from which this project originated.They helped design the comparison, plan, and organise thedata. The analysis presented here was performed by PE,PMS, BF, JO, and NH and the paper was written by PMS.The other authors contributed towards the content of thepaper and helped to proof-read it.
REFERENCES
Alcock C., Paczynski B., 1979, Nature, 281, 358
Aragon-Calvo M. A., Szalay A. S., 2012, ArXiv e-prints:1203.0248
Biswas R., Alizadeh E., Wandelt B., 2010, Phys. Rev. D, 82
Bos E. G. P., van de Weygaert R., Dolag K., Pettorino V., 2012,ArXiv e-prints: 1205.4238
Ceccarelli L., Paz D., Lares M., Padilla N., Garcıa Lambas D.,
2013, ArXiv e-prints: 1306.5798
Clampitt J., Cai Y.-C., Li B., 2013, Mon. Not. R. Astron. Soc.,
431, 749
Colberg J. M., et al., 2008, Mon. Not. R. Astron. Soc., 387, 933
D’Aloisio A., Furlanetto S. R., 2007, Mon. Not. R. Astron. Soc.,382, 860
Dubinski J., da Costa L. N., Goldwirth D. S., Lecar M., Piran
T., 1993, ApJ, 410, 458
Furlanetto S. R., Piran T., 2006, Mon. Not. R. Astron. Soc.,
366, 467
Goldberg D. M., Vogeley M. S., 2004, ApJ, 605, 1
Gottlober S., Lokas E. L., Klypin A., Hoffman Y., 2003, Mon.
Not. R. Astron. Soc., 344, 715
Hamaus N., Sutter P. M., Wandelt B. D., 2014, ArXiv e-prints:
1403.5499
Hamaus N., Wandelt B. D., Sutter P. M., Lavaux G., Warren
M. S., 2014, Physical Review Letters, 112, 041304
Jennings E., Li Y., Hu W., 2013, Mon. Not. R. Astron. Soc.,434, 2167
Komatsu E., et al., 2011, Astrophys. J. Supp., 192, 18
Lavaux G., Wandelt B. D., 2010, Mon. Not. R. Astron. Soc.,403, 1392
Lavaux G., Wandelt B. D., 2011, eprint arXiv:1110.0345
Li B., Zhao G.-B., Koyama K., 2012, Mon. Not. R. Astron. Soc.,
421, 3481
Melchior P., Sutter P. M., Sheldon E., Krause E., Wandelt B. D.,
2013, Mon. Not. R. Astron. Soc.(submitted)
Nadathur S., Hotchkiss S., 2014, Mon. Not. R. Astron. Soc.
Neyrinck M. C., 2008, Mon. Not. R. Astron. Soc., 386, 2101
Neyrinck M. C., Aragon-Calvo M. A., Jeong D., Wang X., 2013,ArXiv e-prints: 1309.6641
Pan D. C., Vogeley M. S., Hoyle F., Choi Y.-Y., Park C., 2012,Mon. Not. R. Astron. Soc., 421, 926
Paranjape A., Lam T. Y., Sheth R. K., 2012, Mon. Not. R.
Astron. Soc., 420, 1648
Planck Collaboration 2013, ArXiv e-prints: 1303.5079
Platen E., van de Weygaert R., Jones B. J. T., 2007, Mon. Not.R. Astron. Soc., 380, 551
Russell E., 2013, ArXiv e-prints: 1309.7059
Ryden B. S., 1995, ApJ, 452, 25
Sheth R. K., van de Weygaert R., 2004, Mon. Not. R. Astron.
Soc., 350, 517
Spolyar D., Sahlen M., Silk J., 2013, ArXiv e-prints: 1304.5239
Springel V., 2005, Mon. Not. R. Astron. Soc., 364, 1105
Srisawat C., et al., 2013, Mon. Not. R. Astron. Soc., 436, 150
Sutter P. M., Lavaux G., Wandelt B. D., Hamaus N., Weinberg
D. H., Warren M. S., 2013, ArXiv e-prints: 1309.5087Sutter P. M., Lavaux G., Wandelt B. D., Weinberg D. H., 2012a,
ApJ, 761, 187
Sutter P. M., Lavaux G., Wandelt B. D., Weinberg D. H., 2012b,ApJ, 761, 44
Sutter P. M., Lavaux G., Wandelt B. D., Weinberg D. H., Warren
M. S., 2014a, Mon. Not. R. Astron. Soc., 438, 3177Sutter P. M., Lavaux G., Wandelt B. D., Weinberg D. H., Warren
M. S., 2014b, ArXiv e-prints: 1310.7155
van de Weygaert R., Sheth R., Platen E., 2004, in Diaferio A.,ed., IAU Colloq. 195: Outskirts of Galaxy Clusters: Intense Life
in the Suburbs A hierarchy of voids. pp 58–63
van de Weygaert R., van Kampen E., 1993, Mon. Not. R. Astron.Soc., 263, 481
White S. D. M., Frenk C. S., Davis M., Efstathiou G., 1987,ApJ, 313, 505
c© 0000 RAS, MNRAS 000, 000–000


![Death and Death Anxiety [Ölüm ve Ölüm Kaygısı]](https://img.pdfslide.net/doc/110x75/635174e47d280cdb4307318c/death-and-death-anxiety-oeluem-ve-oeluem-kaygisi.jpg)


