Embed Size (px)
Citation preview

©20
13 N
atu
re A
mer
ica,
Inc.
All
rig
hts
res
erve
d.
protocol
nature protocols | VOL.8 NO.3 | 2013 | 595
IntroDuctIonThe genome-wide measurement of differences in protein abun-dance is the essence of proteomics. Thus far, the combination of liquid chromatography and mass spectrometry (LC-MS) has been indispensable for this endeavor. On-line or off-line multidimen-sional chromatography can achieve considerable separation of the several hundreds of thousands of peptides that are the result of enzymatic cleavage of the proteome. The latest generation of high-resolution, high-mass-accuracy mass spectrometers can resolve and acquire a substantial fraction of these peptide ions in a single 1D LC-MS experiment and target them for tandem mass spectrometry (MS/MS) analysis1–3. In the past decade, very accurate measurements of peptide and protein abundance have been achieved, despite the vastly differing electrospray ioniza-tion efficiencies of biomolecules4–11. As a result, state-of-the-art techniques have emerged, such as stable isotope dilution; metabolic labeling; and label-free quantitative measurements of proteomes of unicellular and multicellular organisms, as well as of their specific tissues12–17.
To understand molecular mechanisms, it is often necessary to compare protein levels across cellular states. The inherent complex-ity of proteomics data requires statistical selection and testing to pinpoint significant features that may be of interest. In principle, shotgun proteomics approaches enable the detection of any pro-tein in a given sample regardless of its concentration as long as the experiment is carried out a sufficiently large number of times6,18. High-quality proteomics profiling studies therefore often comprise tens to hundreds of shotgun proteomics analyses, thus producing hundreds of gigabytes to terabytes of data. This poses a consider-able analytical challenge. Software must grasp and record the mul-tivariate features of the data and the peptide ion signals, and it must map them to the data landscape for comparison. This will always come as a trade-off between the accuracy and comprehensiveness of feature detection and the computational cost.
Algorithms for analyzing MS dataRecently, new software tools have been developed for improved protein quantification using MS data. However, there are still limitations, especially in high-sample-throughput quantification methods, and most of these depend on extensive computational calculations in platforms such as MetAlign and MaxQuant19,20. We first published ProtMAX, a Windows Forms application in the Common Language Runtime (CLR) environment in 2008 (ref. 21). It was distinguished by feature detection with a single variable: the accurately measured peptide ion mass-to-charge ratio (m/z). This is the most informative feature parameter, and we used it to trace peptide ions in shotgun proteomics analyses for compari-son. For the number of MS/MS spectra recorded for each m/z, we used the spectral count to quantify the peptide ions in the analysis. This concept, called mass accuracy precursor alignment (MAPA), proved to be very powerful for data-dependent MS combining fea-ture detection and quantification at minimal cost, and thus made the comparison of nearly 200 shotgun proteomics analyses of 12 tissue states possible22. The MAPA approach was also successfully applied to the detection and quantification of in vivo phosphoryla-tion sites23. The current version of ProtMAX can additionally be used for LC-MS/MS-based metabolomics24,25.
Overview of ProtMAXProtMAX is a software tool that builds on the MAPA concept and includes several key features.
First, although the m/z measured with sub-p.p.m. error comes reasonably close to a unique definition of every tryptic peptide in the proteome of higher eukaryotes, it is overly simplistic. Indeed, it is not uncommon to observe two different baseline-separated peptide ion signals that share the same error-tolerated mass (m/z). ProtMAX pro-vides a local retention time (Rt) window (Environment) in order to discriminate peptides that share the same error-tolerated mass (m/z)
Using ProtMAX to create high-mass-accuracy precursor alignments from label-free quantitative mass spectrometry data generated in shotgun proteomics experimentsVolker Egelhofer1, Wolfgang Hoehenwarter1,2, David Lyon1, Wolfram Weckwerth1 & Stefanie Wienkoop1
1Department of Molecular Systems Biology, University of Vienna, Vienna, Austria. 2Present address: Proteome Analysis Research Group, Leibniz Institute for Plant Biochemistry, Halle, Germany. Correspondence should be addressed to S.W. ([email protected]).
Published online 28 February 2013; doi:10.1038/nprot.2013.013
recently, new software tools have been developed for improved protein quantification using mass spectrometry (Ms) data. However, there are still limitations especially in high-sample-throughput quantification methods, and most of these relate to extensive computational calculations. the mass accuracy precursor alignment (Mapa) strategy has been shown to be a robust method for relative protein quantification. Its major advantages are high resolution, sensitivity and sample throughput. Its accuracy is data dependent and thus best suited for precursor mass-to-charge precision of ~1 p.p.m. this protocol describes how to use a software tool (protMaX) that allows for the automated alignment of precursors from up to several hundred Ms runs within minutes without computational restrictions. It comprises features for ‘ion intensity count’ and ‘target search’ of a distinct set of peptides. this procedure also includes the recommended Ms settings for complex quantitative Mapa analysis using protMaX (http://www.univie.ac.at/mosys/software.html).
©20
13 N
atu
re A
mer
ica,
Inc.
All
rig
hts
res
erve
d.
protocol
596 | VOL.8 NO.3 | 2013 | nature protocols
but that do not elute within an expected Rt window. Thus, peaks eluting outside of the expected local Rt window will be placed in a different ‘bin’. Together with an absolute intensity–based noise filter, this is a simple yet effective means of incorporating the chro-matographic Rt into the peptide definition without the necessity of complex peak detection algorithms and the accompanying marked increase in computational cost.
Spectral counting is a popular strategy for LC-MS/MS–based differential protein expression analyses4–6. It refers to the total number of MS/MS spectra assigned to a protein. We provide sev-eral options for expanding peptide quantification. In addition to counting dependent MS/MS spectra (spectral count), it is also pos-sible to count the accurately measured precursor ions (m/z) of a given peak, again anchored by a dependent MS/MS spectrum. We call this the ion count. Here the peak is defined by the peak width setting (Environment Rt). The absolute signal intensity of the m/z can also be summed for intensity-based quantification, called ion intensity count.
These concepts in label-free quantification offer an increase in dynamic range and absolute signal. In a traditional spectral count approach, missing values can occur if the precursor has not been triggered for MS/MS in all replicates. As ion count and ion intensity count are independent of MS/MS spectral information, these fea-tures have a smaller number of missing values, thereby potentially improving quantification accuracy, particularly of low-abundance peptides. They also increase the resolution of a ‘peak’, resulting in more accurate quantitative ratio calculations. ProtMAX is an effi-cient, user-friendly and robust quantification tool. There is no need for complex preprocessing and knowledge of Java and R program-ming. It is optimized for huge proteomics data sets and is unique in its selection of m/z features on the basis of the MS/MS trigger. A workflow overview is given in Figure 1.
In principle, ProtMAX is not restricted to any MS instrument. However, the quality of the output depends on the quality of the input. For instance, for low-mass-accuracy data (>10 p.p.m.), the threshold for the mass-binning process is less stringent. As for protein identification, low mass accuracy will lead to less accurate results. Quantification comprises the comparison of different MS analyses. ProtMAX compares MS data derived from LC separations. High chromatographic variability between samples can impede comparison, or in worst cases, even render it impossible.
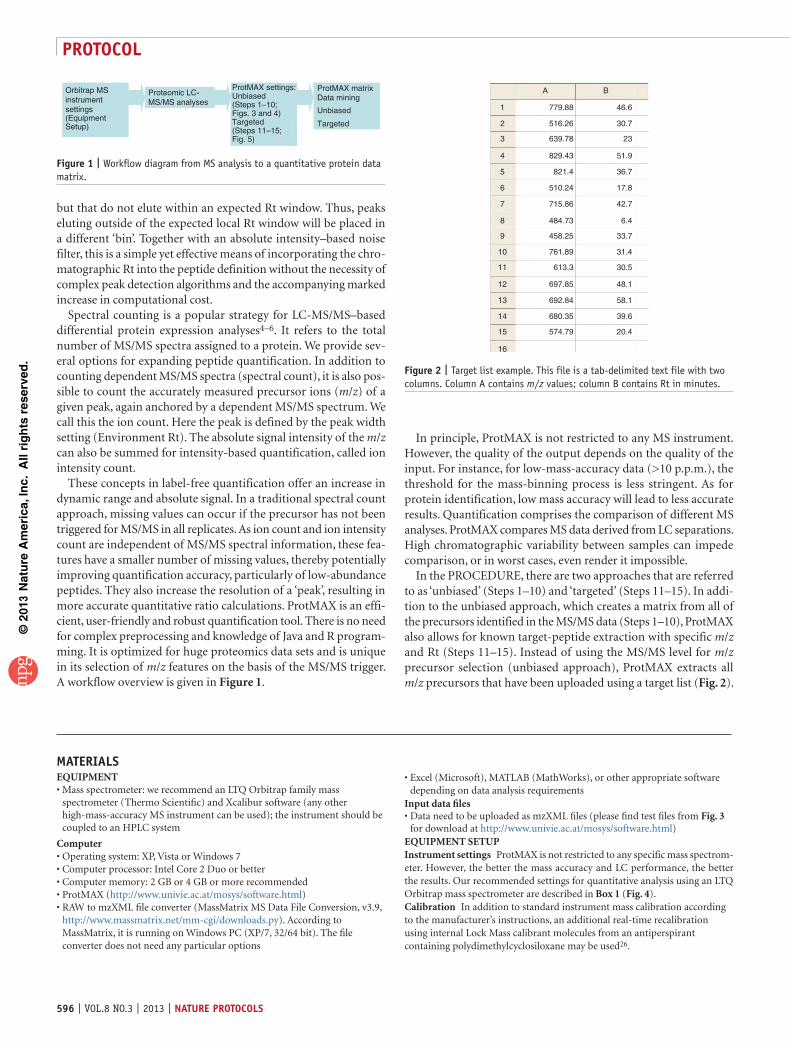
In the PROCEDURE, there are two approaches that are referred to as ‘unbiased’ (Steps 1–10) and ‘targeted’ (Steps 11–15). In addi-tion to the unbiased approach, which creates a matrix from all of the precursors identified in the MS/MS data (Steps 1–10), ProtMAX also allows for known target-peptide extraction with specific m/z and Rt (Steps 11–15). Instead of using the MS/MS level for m/z precursor selection (unbiased approach), ProtMAX extracts all m/z precursors that have been uploaded using a target list (Fig. 2).
Orbitrap MSinstrumentsettings(EquipmentSetup)
Proteomic LC-MS/MS analyses
ProtMAX settings: ProtMAX matrixData mining
Unbiased
Targeted
Unbiased(Steps 1–10;Figs. 3 and 4)Targeted(Steps 11–15;Fig. 5)
Figure 1 | Workflow diagram from MS analysis to a quantitative protein data matrix.
A
1 779.88 46.6
B
2
3
4
5
6
7
8
9
10
11
12
13
14
15
16
516.26
639.78
829.43
821.4
510.24
715.86
484.73
458.25
761.89
613.3
697.85
692.84
680.35
574.79
30.7
23
51.9
36.7
17.8
42.7
6.4
33.7
31.4
30.5
48.1
58.1
39.6
20.4
Figure 2 | Target list example. This file is a tab-delimited text file with two columns. Column A contains m/z values; column B contains Rt in minutes.
MaterIalsEQUIPMENT
Mass spectrometer: we recommend an LTQ Orbitrap family mass spectrometer (Thermo Scientific) and Xcalibur software (any other high-mass-accuracy MS instrument can be used); the instrument should be coupled to an HPLC system
ComputerOperating system: XP, Vista or Windows 7Computer processor: Intel Core 2 Duo or betterComputer memory: 2 GB or 4 GB or more recommendedProtMAX (http://www.univie.ac.at/mosys/software.html)RAW to mzXML file converter (MassMatrix MS Data File Conversion, v3.9, http://www.massmatrix.net/mm-cgi/downloads.py). According to MassMatrix, it is running on Windows PC (XP/7, 32/64 bit). The file converter does not need any particular options
•
•••••
Excel (Microsoft), MATLAB (MathWorks), or other appropriate software depending on data analysis requirements
Input data filesData need to be uploaded as mzXML files (please find test files from Fig. 3 for download at http://www.univie.ac.at/mosys/software.html)
EQUIPMENT SETUPInstrument settings ProtMAX is not restricted to any specific mass spectrom-eter. However, the better the mass accuracy and LC performance, the better the results. Our recommended settings for quantitative analysis using an LTQ Orbitrap mass spectrometer are described in Box 1 (Fig. 4).Calibration In addition to standard instrument mass calibration according to the manufacturer’s instructions, an additional real-time recalibration using internal Lock Mass calibrant molecules from an antiperspirant containing polydimethylcyclosiloxane may be used26.
•
•

©20
13 N
atu
re A
mer
ica,
Inc.
All
rig
hts
res
erve
d.
protocol
nature protocols | VOL.8 NO.3 | 2013 | 597
Tissue compatibility To our knowledge, any tissue can be analyzed if protein extraction and sample handling are compatible with MS. In general, there is no optimal protocol for all tissues. However, there are recommended protocols27. A discussion about different MS-compatible plant protein extraction methods can be found here28.HPLC separation A shotgun approach using HPLC coupled to MS is required. For higher sensitivity, nano-flow HPLC systems using reversed-phase columns suitable for low flow rates (with an inner diameter of ~75 µm) are recommended. We usually use a monolithic column (150 mm × 0.1 mm) (Merck) that seems to be very robust for large-scale sample analyses21–23.
Data for sample 1
a b c d e
Data for sample 2
m/z Charge state Count [all] al1_1 [Sum] al1_1 [Scan] al1_1 [Rt] al2_1 [Sum] al2_1 [Scan] al2_1 [Rt]
300.63301.14301.14
4.04E+072
2.79E+0 811879431015228
1.78E+0 70
0 0 0 0 2836 19.10
22047524911157291811348718192817526329421.6
0151484.21.76E+07183358.73423541159028418368171.14E+0739238152900347459961.81950017869223.517033081909969112729826905416898012186875.81.45E+0781385.9237067438429528
02006294793937.9254061.63778490487654.6845292.3
0
1.94E+071.43E+08671294243529
1.10E+070
20783262622588152577322890131873275102788.5
061681.821.17E+07
016379351244236631394.7497449510638792454803114685.2938587.5642399
810197.10
691543.3692244.72936522186875.88890250
018000533898936
0761097.1501277.3
0624560.644127.66125796.6
0
2486466119716521327295912787231506259251101
01628692
023128301527405981401120619182012122410301975281611763208477222897010792783683242816325993220224735525
17.34.710.112.610.819.910.57.11.56.38.59.50
12.56.90
16.37.811.94.18.926.114.98.514.610.29.114.419.110
21.44.915.88.89.418.96.816.912.538
15.717.235.1
253568897417121369
0158277743844110001160931166691016211962638156242010204020215794920711287106220532878121933258602313102711092855729263316645950248225275591
17.46.78.612.810.9
0127.44.34.38.89.78.412.58.212.214.16.311.94.28.925.915.28.514.810.49.114.719.310
21.97.916.18.99.419.27.117.912.537.617.117.335.4
302.16302.67303.17303.19304.16304.17305.18305.68306.13307.15307.64308.19308.19308.64308.67308.69308.69309.18309.18309.2309.67309.69310.17310.18311.16311.17311.2311.68312.15312.17312.17312.19312.21312.62312.69313.17313.71314.15314.17314.65314.66
2222222222222222222222222222222222222222222
2.10E+071.36E+08516649.2771699.36882081
0126426.5228856913923402582806944250.9226633
089802.355919995183358.71785607346048.4120542364065572859936445543.9345276.51011430226824.5893110.61909969435754.619982963961490
0564962581385.9219066904530592
01245197292660.6254061.63153929443526.9719495.6
0...
Figure 3 | ProtMAX output file. Samples 1 and 2 correspond to the test sample in the Equipment section. (a) Charge state (no information for target approach). (b) Sum across all samples. (c) Sum of ion intensity counts specific for sample 1 (can also be SC or Ion count, depending on the selected method). (d) Scan number of the most intense ion signal of the corresponding m/z value specific for sample 1. (e) Rt of the most intense ion signal of the corresponding m/z value specific for sample 1.
Box 1 | Instrument settings for the protein shotgun LC-MS/MS analysis using an Orbitrap MS The recommended LTQ Orbitrap MS settings are also shown in Figure 4.(a) Ms1 settings and internal lock Mass calibration crItIcal Before starting the LC-MS analysis, an Orbitrap mass calibration is recommended.1. Set micro-scans to 3.2. Check for spray stability.3. Run a protein standard digest (e.g., BSA) to check chromatographic performance.4. For each Fourier transform MS (FTMS) scan event (Scan Event 1), a resolution of 30,000 may be used. Scan range may be from 300 to 1,800 (Fig. 4a). Multiple replicate measurements are required for large-scale shotgun proteomics to achieve robust statistical signifi-cance. We usually use 6–15 independent MS analyses for each condition21–23. The replicate analysis must not be performed in sequence to exclude possible technical bias. For better reproducibility, experiments may be analyzed in one batch. At present, the most common normalization for label-free MS analysis may be the total ion current, but other methods are discussed29. In the future, ProtMAX will allow for automated internal standard normalization.5. The Lock Mass can manually be set to any value (e.g., 445.12002 or 371.10123 m/z for polydimethylcyclosiloxane, see Equipment Setup and Fig. 4a), the difficulty being the known elemental composition of the respective molecule. To achieve a steady supply of calibrant molecules over the entire LC/MS run, we used Lock Mass protection according to Lee et al.26.(B) Ms/Ms scan events1. For each MS/MS analysis, use 5–10 dependent ion trap MS scans (Scan Event 2–6 or 2–11) (Fig. 4b).(c) Dependent ion trap Ms scanThe following settings are recommended if not default (Fig. 4c):1. Dynamic Exclusion: set Repeat count 1, Repeat duration 20 s, Exclusion list size 500, Exclusion duration 60 s, Exclusion mass width 10 p.p.m. relative to reference mass.2. Current Segment: set Enable preview mode for FTMS master scans.3. Charge State: set Enable charge state screening, Enable monoisotopic precursor selection, Enable charge state rejection, reject charge state 1 and unassigned charge states.4. Current Scan Event: set Minimum signal threshold to 1000 counts. Note: this threshold should be relatively high to allow for an MS/MS trigger closer to the peak apex.
(continued)

©20
13 N
atu
re A
mer
ica,
Inc.
All
rig
hts
res
erve
d.
protocol
598 | VOL.8 NO.3 | 2013 | nature protocols
a c
b
Figure 4 | Graphical user interface of the Xcalibur MS instrument setup. The settings for the protein analysis are indicated by green circles that are numbered according to the steps in Box 1 (Instrument settings for the protein shotgun LC-MS/MS analysis using an Orbitrap) in which they are described. (a) MS1 settings and internal Lock Mass calibration. (b) MS/MS Scan Events. (c) Data-dependent settings for MS/MS scan events.
Box 1 | Instrument settings for the protein shotgun LC-MS/MS analysis using an Orbitrap MS (continued)Instrument settings for the metabolite lc-Ms/Ms analysisWe suggest changing the following settings for metabolite analyses compared to those introduced in (A) (MS1 settings and internal Lock Mass calibration).1. A low scan range limit for metabolomics experiments usually needs to be set, e.g., 140 to 380 m/z.2. For very complex samples a resolution of 60.000 is recommended.3. For metabolite analyses an accurate inclusion mass screening (AIMS)29 may be used for confirmation of identity.4. Only one data-dependent MS/MS scan using three micro scans is recommended.

©20
13 N
atu
re A
mer
ica,
Inc.
All
rig
hts
res
erve
d.
protocol
nature protocols | VOL.8 NO.3 | 2013 | 599
proceDureprotMaX settings for unbiased protein matrix generation crItIcal The ProtMAX settings are also shown in Figure 5. crItIcal Steps 1–10 cover the settings for Preferences if the data accuracy is ≤10 p.p.m. In the case of less-accurate data, the ′Decimals′ threshold (Step 2) needs to be adapted.
1| For a traditional spectral count (summed number of all MS/MS spectra triggered for a specific m/z value)-based quantification, use Method ‘Spectral Count’ and Quantifica-tion ‘Count’. For the ion count (summed number of all precursor ions belonging to a specific m/z value within a specified Rt window), select Method ‘Ion Count’ and Quantification ‘Count’, and for ion intensity count (summed intensity counts of all precursor ions belonging to one m/z value within a specified Rt window), use Method ‘Ion Count’ and Quantification ‘Intensity’.
2| Set Decimals to the expected data accuracy. In our case (≤10 p.p.m.), set Decimals to ‘2’ and ‘Cut’, which means that the m/z value is not rounded up or rounded down; it is merely cut off at the second digit.
3| Choose Unite Neighbors if you observe a mass shift (in this case at the second decimal, see Step 2). In other words, two precursor masses with a mass shift of ± 0.01 m/z eluting at the same time (occurring in the same Rt window, and thus most probably belonging to the same peptide) will be treated as one peptide. Neighboring precursor masses with a mass shift of ± 0.01 will be merged and treated as one peak (in the case of two decimals). Note: these mass shifts may also occur in rare cases because of differential mass rounding of the mzXML files compared with the RAW data.
4| It is possible to choose a Rt cutoff around the expected Rt, and thus to ensure that, for example, peaks eluting during equilibration phases will be excluded from further consideration.
5| It is possible to filter the charge state. ProtMAX will only select those monoisotopic precursor masses of acquired MS/MS scans with the selected charge state(s) if it was enabled in the MS analysis. In the case of protein quantification, we recommend leaving ′charge state 1 + ′ unchecked.
6| Define the largest peak width. In the case of MS/MS-based precursor selection (untargeted), we recommend increasing the Environment setting by up to three times the observed peak width because the MS/MS (m/z anchor of the Rt window) might have been recorded at the beginning of the peak. The Environment setting allows discriminating between peptides of identical m/z ratio because it is not very likely that two peptides of the exact (± 10 p.p.m.) same mass and charge state elute at the same time. If Environment is used, it is a constant width, as it defines the peak width for the whole analysis. Note that it is better to use a higher peak-width setting than a lower peak-width setting.
7| The intensity expected describes the upper limit of the background noise. The default setting is 1% of the maximum peak intensity.
8| The default setting of the minimum number of counts required to accept a peak is 8.
9| Choose a path for the output file or use the default setting. The checked ‘Launch Excel’ application will automatically open an Excel result file after processing (Fig. 2). Uncheck this if Microsoft Excel is not installed. A full version of the output file for Figure 4 can be downloaded at http://www.univie.ac.at/mosys/software.html.
10| RAW MS files must be converted to mzXML for upload into ProtMAX. Upload mzXML files by navigating to File→Import. Mark all desired files for import. ? trouBlesHootInG
Figure 5 | Graphical user interface of ProtMAX. The settings for the unbiased peptide matrix generation are indicated by green circles that are numbered according to the PROCEDURE steps in which they are described.

©20
13 N
atu
re A
mer
ica,
Inc.
All
rig
hts
res
erve
d.
protocol
600 | VOL.8 NO.3 | 2013 | nature protocols
protMaX settings for targeted protein or metabolite matrix generation! cautIon Because of the lack of information concerning the precursor charge state of the MS1 level within the mzXML file format after conversion of original MS RAW files, the target list quantification does not allow for charge-state matching. This also means that there is no charge-state restriction/filter for the targeted analysis available. Consequently, by using target mode, the mzXML format does not allow distinguishing between the monoisotopic and isotopomeric masses. crItIcal As the target analysis is restricted to the MS1 level, it can be performed with both LC-MS/MS and LC-MS (full scan only). Compared with LC-MS/MS analysis, pure LC-MS may result in more data points (ion counts) for the MS1 level, as there is no loss in time for MS/MS scans. Thus, short gradients are possible. This approach may also be used to analyze MS data from metabolomics experiments. crItIcal An Rt filter with each target is recommended, but this information is optional. When information for the Rt is given, ProtMAX only extracts quantitative information from this region of the chromatogram (± Environment settings). This will reduce the output file to the expected data and will thus facilitate data analysis.
11| Prepare a target precursor mass list containing all mass-to-charge ratios (m/z) of the peptide(s) of interest (Fig. 2).
12| Load the target list into ProtMAX: File→Load target list. The target list should be a tab-delimited text file without header, including the m/z values cut to the second decimal or more (rounding off the m/z data might degrade 1 p.p.m. accuracy) of the peptides of interest (targets) in row A.
13| In Preferences, select Method ‘Target List’ and Quantification ‘Intensity’.
14| Rt can be set for each target if it is added to the target list: m/z values in row A (according to Step 11) and Rt values in row B (Fig. 2). If there is more than one peptide with identical m/z (e.g., ± 10 p.p.m.), the Rt specification narrows the output down to the target of interest. If the Rt of the target of interest is not given, several hits of identical m/z ratios but different Rt and scan numbers, and perhaps charge states, will be listed in the ProtMAX output file. Note that if the Environment setting is disabled, all m/z values will be binned together, regardless of the Rt. This setting can be used for data mining of direct infusion (flow injection) analysis.
15| See ‘ProtMAX settings for unbiased protein matrix generation’ Steps 1–10 for other settings.
Data output and mining16| For further statistics (e.g., to examine the relationship between two or more variables), the data matrix generated by ProtMAX (Fig. 3) can be uploaded into the freely available MATLAB toolbox COVAIN29 or analyzed with any other software of choice after removing the columns for Rt and scan number.
? trouBlesHootInGThe current version of ProtMAX has been extensively tested and is very stable. We welcome feedback and would like to hear of any bugs that you encounter. General errors you may experience include the following:
File Access Error. This message appears when you are trying to import an mzXML file while the resulting file from the previous analysis is still open within Excel. Excel will lock it exclusively, and thus you must close the file before proceeding.Error Target List. This error occurs when the ‘Target List’ method is selected and the user tries to import the mzXML files before importing a target-list file.
● tIMInGThe total duration of the protocol is dependent on the number of MS analyses and the file size. The time required for the initial MS instrument setup is about 10 min.
The nanoLC-MS/MS analysis time for a complex sample usually is ~90 min, including gradient and column equilibration. It is thus the limiting step. Conversion of RAW files (around 150 MB) to mzXML files takes about 10 s per file. The conver-sion leads to data reduction, but depending on the number of RAW files, it may require some additional disc space. The MAPA matrix generation using ProtMAX is typically in the range of minutes. For instance, the generation of the matrix for 183 LC-MS runs took less than 1 h on a quad-core personal computer22.
antIcIpateD resultsProtMAX will create a data matrix in a tab-delimited format. The files can be opened with Microsoft Excel. Each row of the data matrix will contain values of the chosen method corresponding to the m/z values of a given sample, as well
•
•

©20
13 N
atu
re A
mer
ica,
Inc.
All
rig
hts
res
erve
d.
protocol
nature protocols | VOL.8 NO.3 | 2013 | 601
as the Rt and the scan number extracted from the LC-MS/MS data corresponding to the most intense MS signal from which the MS/MS was triggered. The ProtMAX result is database independent and does not provide protein or metabolite identifications.
After statistical filtering, the interesting m/z precursor masses of corresponding peptides can be matched against database-dependent search results. As precursor masses (m/z) of the ProtMAX output file depend on the measured and MS/MS-triggered masses of the MS analysis, they are identical to the list of masses used for identification (the measured, not calculated, m/z). MS/MS spectra of unidentified candidates can be extracted from the LC-MS/MS analysis for further identification.
acknowleDGMents We thank J. Hummel for interesting comments.
autHor contrIButIons V.E. developed the algorithm of the ProtMAX tool. W.H. contributed to the concept and optimization of the ProtMAX tool of protein analysis and writing of the manuscript. D.L. contributed to the concept of the ProtMAX tool and writing of the manuscript. W.W. conceived the concept of the MAPA strategy for proteomics. S.W. conceived Preferences and feature upgrading with the target approach of the ProtMAX tool and was responsible for project coordination and writing of the manuscript.
coMpetInG FInancIal Interests The authors declare no competing financial interests.
Published online at http://www.nature.com/doifinder/10.1038/nprot.2013.013. Reprints and permissions information is available online at http://www.nature.com/reprints/index.html.
1. Michalski, A., Cox, J. & Mann, M. More than 100,000 detectable peptide species elute in single shotgun proteomics runs but the majority is inaccessible to data-dependent LC-MS/MS. J. Proteome Res. 10, 1785–1793 (2011).
2. Michalski, A. et al. Mass spectrometry-based proteomics using Q Exactive, a high-performance benchtop quadrupole Orbitrap mass spectrometer. Mol. Cell. Proteomics 10, M111.011015 (2011).
3. Thakur, S.S. et al. Deep and highly sensitive proteome coverage by LC-MS/MS without prefractionation. Mol. Cell Proteomics 10, M110.003699 (2011).
4. Griffin, N.M. et al. Label-free, normalized quantification of complex mass spectrometry data for proteomic analysis. Nat. Biotechnol. 28, 83–89 (2010).
5. Ishihama, Y. et al. Exponentially modified protein abundance index (emPAI) for estimation of absolute protein amount in proteomics by the number of sequenced peptides per protein. Mol. Cell Proteomics 4, 1265–1272 (2005).
6. Liu, H., Sadygov, R.G. & Yates, J.R. A model for random sampling and estimation of relative protein abundance in shotgun proteomics. Anal. Chem. 76, 4193–4201 (2004).
7. Lu, P., Vogel, C., Wang, R., Yao, X. & Marcotte, E.M. Absolute protein expression profiling estimates the relative contributions of transcriptional and translational regulation. Nat. Biotechnol. 25, 117–124 (2007).
8. Paoletti, A.C. et al. Quantitative proteomic analysis of distinct mammalian Mediator complexes using normalized spectral abundance factors. Proc. Natl. Acad. Sci. USA 103, 18928–18933 (2006).
9. Schulze, W.X. & Usadel, B. Quantitation in mass-spectrometry-based proteomics. Annu. Rev. Plant Biol. 61, 491–516 (2010).
10. Schwanhausser, B. et al. Global quantification of mammalian gene expression control. Nature 473, 337–342 (2011).
11. Silva, J.C., Gorenstein, M.V., Li, G.Z., Vissers, J.P.C. & Geromanos, S.J. Absolute quantification of proteins by LCMSE—a virtue of parallel MS acquisition. Mol. Cell Proteomics 5, 144–156 (2006).
12. Baerenfaller, K. et al. Genome-scale proteomics reveals Arabidopsis thaliana gene models and proteome dynamics. Science 320, 938–941 (2008).
13. Brunner, E. et al. A high-quality catalog of the Drosophila melanogaster proteome. Nat. Biotechnol. 25, 576–583 (2007).
14. de Godoy, L.M.F. et al. Comprehensive mass-spectrometry-based proteome quantification of haploid versus diploid yeast. Nature 455, 1251–1260 (2008).
15. Graumann, J. et al. Stable isotope labeling by amino acids in cell culture (SILAC) and proteome quantitation of mouse embryonic stem cells to a depth of 5,111 proteins. Mol. Cell Proteomics 7, 672–683 (2008).
16. Malmstrom, J. et al. Proteome-wide cellular protein concentrations of the human pathogen Leptospira interrogans. Nature 460, 762–U112 (2009).
17. Nagaraj, N. et al. Deep proteome and transcriptome mapping of a human cancer cell line. Mol. Syst. Biol. 7, 548 (2011).
18. Pavelka, N. et al. Statistical similarities between transcriptomics and quantitative shotgun proteomics data. Mol. Cell Proteomics 7, 631–644 (2008).
19. Cox, J. & Mann, M. MaxQuant enables high peptide identification rates, individualized p.p.b.-range mass accuracies and proteome-wide protein quantification. Nat. Biotechnol. 26, 1367–1372 (2008).
20. De Vos, R.C.H. et al. Untargeted large-scale plant metabolomics using liquid chromatography coupled to mass spectrometry. Nat. Protoc. 2, 778–791 (2007).
21. Hoehenwarter, W. et al. A rapid approach for phenotype-screening and database independent detection of cSNP/protein polymorphism using mass accuracy precursor alignment. Proteomics 8, 4214–4225 (2008).
22. Hoehenwarter, W. et al. MAPA distinguishes genotype-specific variability of highly similar regulatory protein isoforms in potato tuber. J. Proteome Res. 10, 2979–2991 (2011).
23. Chen, Y., Hoehenwarther, W. & Weckwerth, W. Comparative analysis of phytohormone-responsive phosphoproteins in Arabidopsis thaliana using TiO2-phosphopeptide enrichment and mass accuracy precursor alignment. Plant J. 63, 1–17 (2010).
24. Doerfler, H. et al. Granger causality in integrated GC-MS and LC-MS metabolomics data reveals the interface of primary and secondary metabolism. Metabolomics. http://dx.doi.org/10.1007/s11306-012-0470-0 (25 October 2012).
25. Mari, A. et al. Phytochemical composition of Potentilla anserina L. analyzed by an integrative GC-MS and LC-MS metabolomics platform. Metabolomics. http://dx.doi.org/10.1007/s11306-012-0473-x (17 November 2012).
26. Lee, K.A., Farnsworth, C., Yu, W. & Bonilla, L.E. 24-hour lock mass protection. J. Proteome Res. 10, 880–885 (2011).
27. Isaacson, T. et al. Sample extraction techniques for enhanced proteomic analysis of plant tissues. Nat. Protoc. 2, 769–774 (2006).
28. Sheoran, I.S. et al. Compatibility of plant protein extraction methods with mass spectrometry for proteome analysis. Plant Sci. 176, 99–104 (2009).
29. Sun, X. & Weckwerth, W. COVAIN: a toolbox for uni- and multivariate statistics, time-series and correlation network analysis and inverse estimation of the differential Jacobian from metabolomics covariance data. Metabolomics 8, 81–93 (2012).


