Embed Size (px)
Citation preview

Transactions, SMiRT-23
Manchester, United Kingdom - August 10-14, 2015
Division I (Mechanics of Materials)
ELASTIC-PLASTIC CYCLIC FEA OF THINNED TIGHT RADIUS PIPE
ELBOWS
Usama Abdelsalam1, Dk Vijay2, and Andrew Glover3
1 Technical Expert, Amec Foster Wheeler, Nuclear Safety Solutions, Toronto, Ontario, CANADA 2 Section Manager, Amec Foster Wheeler, Nuclear Safety Solutions, Toronto, Ontario, CANADA 3 Senior Engineer, Bruce Power, Nuclear Safety Analysis & Support, Toronto, Ontario, CANADA
ABSTRACT
This paper presents a sample cyclic elastic-plastic finite element analysis to check the progressive distortion
of nuclear pipe elbows caused by cyclic load application. In addition to the pressure and thermal transient
loads, an initial large anchor movement is considered as it is found that the corresponding stresses do not
meet the 3Sm ASME Code requirement. Solid FEA mesh is constructed where the wall thinning is
represented by a uniformly thinned pipe wall. A representation of the centreline offset at the weld locations
is physically considered in the model. The elastic-plastic analysis is performed according to ASME SEC
III NB-3228.4 (b). The von Mises yield criterion along with associated flow rule is used with Kinematic
hardening model. The maximum accumulated principal plastic strain is determined and checked against the
ASME Code 5% criterion. To address the possibility of crack initiation, the maximum cumulative fatigue
usage factor is calculated at critical locations. This analysis demonstrates the effectiveness of detailed FEA
in extending a nuclear component life using the ASME (construction) Code.
INTRODUCTION
In a typical CANDU reactor, Fuel Channels (FC) are arranged horizontally in a lattice inside the Calandria
Vessel. The nuclear fuel bundles are placed inside the Fuel Channels. The heavy water flowing inside the
Fuel Channels transports the heat energy generated from the nuclear reaction to the steam generators. The
flow of the heavy water coolant through the Fuel Channels is provided by Primary Heat Transport (PHT)
pumps and carried through pipes running from the inlet headers and removed through pipes connecting to
the outlet header. Each Fuel Channel is connected to two pipes known as inlet and outlet feeders.
Feeders are made of Low Carbon Steel SA-106 Grade B pipes with tight radius bends/elbows welded to
the Grayloc hub that is assembled to the end-fittings at the ends of the Fuel Channels with a bolted
connection. The pipe sizes used for feeders in a typical CANDU reactor are in the 2-3.5” outer diameter
range with pipe wall thickness in the 0.218-0.3” range.
Feeder pipes in CANDU nuclear reactors are classified as Nuclear Class 1 Piping. Linear elastic piping
analyses of inlet and outlet feeders are performed according to the ASME Section III NB-3600 Code.
During operation, feeder pipes experience wall thinning due to flow accelerated corrosion (FAC) resulting
in locally thinned areas (LTA) super imposed on general thinning over the tight radius bends/elbows. The
continued wall thinning deteriorates the structural integrity of the feeder pipes and fitness for continued
service assessments, repair, or replacements is required.
The ASME Section III, being a construction code, does not provide explicit guidance as to how to deal with
thinned pipes. Section XI Code Case N-597-2 of the ASME Code provides evaluation procedures and
acceptance criteria to justify continued operation of Class 1, 2 & 3 piping items subject to wall thinning.
Scarth et al. (2006) provided description of the Code Case technical bases and validation against
experimental and historic wall thinning effects. The limits on the wall thinning from this Code case were

23rd Conference on Structural Mechanics in Reactor Technology
Manchester, United Kingdom - August 10-14, 2015
Division I (Mechanics of Materials)
examined by more sophisticated FEA methods. The plastic failure mechanism in a locally thinned straight
cylinder using the finite element method is explored by Reinhardt and Zobeiry (2009). Double tight radius
bends with general and local wall thinning are analyzed using idealized wall thickness profiles implemented
in detailed finite element models by Abdelsalam and Vijay (2009). In these analyses, pressure loading
assessments of typical CANDU feeder pipe bends are performed according to the ASME Code SEC III
NB-3221 criteria. The detailed modeling of the local thin area is achieved through smooth bounding axial
and circumferential thickness profiles based on the measured thickness data. The concept of a location
dependent thinning rate function is later on introduced by Abdelsalam and Vijay (2009 & 2010). In addition,
results from elastic plastic limit analyses (NB-3228.1) are presented and compared to the results from the
linear elastic rules of the ASME Code (NB-3221). Abdelsalam (2010) demonstrated the ability to qualify
very thin local spots using the detailed FEA approach following the elastic rules of the ASME Code SEC
III NB-3221. A tight radius pipe bend with general thinning and one locally thinned area is studied. The
LTA is located on the inner surface of the bend. Results are presented for the analysis models to show the
effect of the axial extension of the LTA on the life of the bend. Results from plastic limit analysis are also
presented. Bend ovality effects on stresses are discussed in Veerappan and Shanmugam (2008), Xu et. al
(2005), and Vlaicu, D. (2008).
Fuel channels (FC) on typical CANDU reactor are supported on the end-shield plates by journal rings to
allow for axial creep elongation. A locking mechanism is used at either the east or the west reactor faces to
control the axial position of the fuel channels. Figure 1 illustrates a typical fuel channel and feeders model
showing the end-fittings, pressure tube, and attached feeders. It also illustrates the support points on the
east and west end-fittings. In that particular diagram, the west end is axially locked using a welded stop
collar allowing the fuel channel to elongate axially in the east direction.
Figure 1: Typical Fuel Channel and Short Vertical Feeders’ ANSYS Model
To prevent east side Off-bearing condition, a fuel channel shift in the west direction may be used to
reposition the fuel channel axially allowing for additional axial elongation. For the feeders, this axial shift
is in effect an anchor movement that leads to increased stresses in the feeder pipes. The results of the piping
analysis of feeders indicated that many short vertical feeders do not meet the ASME Code 3Sm criterion for
one time anchor movement of the end-fitting (E/F) when uniform wall thinning at the tight radius elbows
is considered. These feeders are investigated using detailed Elastic Plastic (EP) cyclic Finite Element

23rd Conference on Structural Mechanics in Reactor Technology
Manchester, United Kingdom - August 10-14, 2015
Division I (Mechanics of Materials)
Analysis (FEA). ASME Code 5% strain limit is used as the acceptance criterion. The cumulative fatigue
usage factor is calculated to check potential for crack initiation. A target MAWT of 3.99 mm is
conservatively considered for this analysis as this is the minimum required at the intrados of tight radius
bends/elbows as per the ASME Code SEC XI Code Case N579-2.
This paper summarizes the ASME Section III Sub-section NB-3200 Cyclic Elastic-plastic FEA in ANSYS
to study one 2½” NPS tight radius outlet feeder not meeting (as a result of internal wall thinning) the linear
elastic 3Sm criterion for the one time anchor movement of the end fitting (E/F). A target (3.90 mm) uniform
minimum wall thickness meets all the NB-3600 requirements except for the stress incurred from the E/F
one time anchor movement.
The progressive distortion from cyclic load application is analyzed using elastic-plastic cyclic analysis as
per ASME Section III Sub-section NB-3200 article NB-3228.4 (Shakedown Analysis) to determine the
maximum accumulated principal plastic strain (5% maximum everywhere). To address the potential for
crack initiation, the maximum Cumulative Fatigue Usage Factor (CUF) considering the one time anchor
movement residual effects is calculated.
FINITE ELEMENT MODEL
Commercial stress analysis software ANSYS v14.5 is used to construct the FEA model and to perform
feeder cyclic elastic-plastic analyses.
Geometry
The nominal piping cross-section dimensions used to build the geometric models are:
Outer Diameter, Do = 3.03 in (~77 mm)
Nominal Thickness, tnom = 0.276 in (~ 7 mm)
The bend dimensions are as follows:
Bend Angle, θ = 39o
Bend Radius, Rb = 3.0 in (~ 76 mm)
Finite Element Mesh
Full length 3D finite element models are used adopting ANSYS PIPE16 and SOLID186 (20-node)
elements. Solid brick elements are used from the Grayloc hub up to the third bend, inclusive. The remainder
of the feeder beyond the field weld point is modelled using pipe elements for computational efficiency.
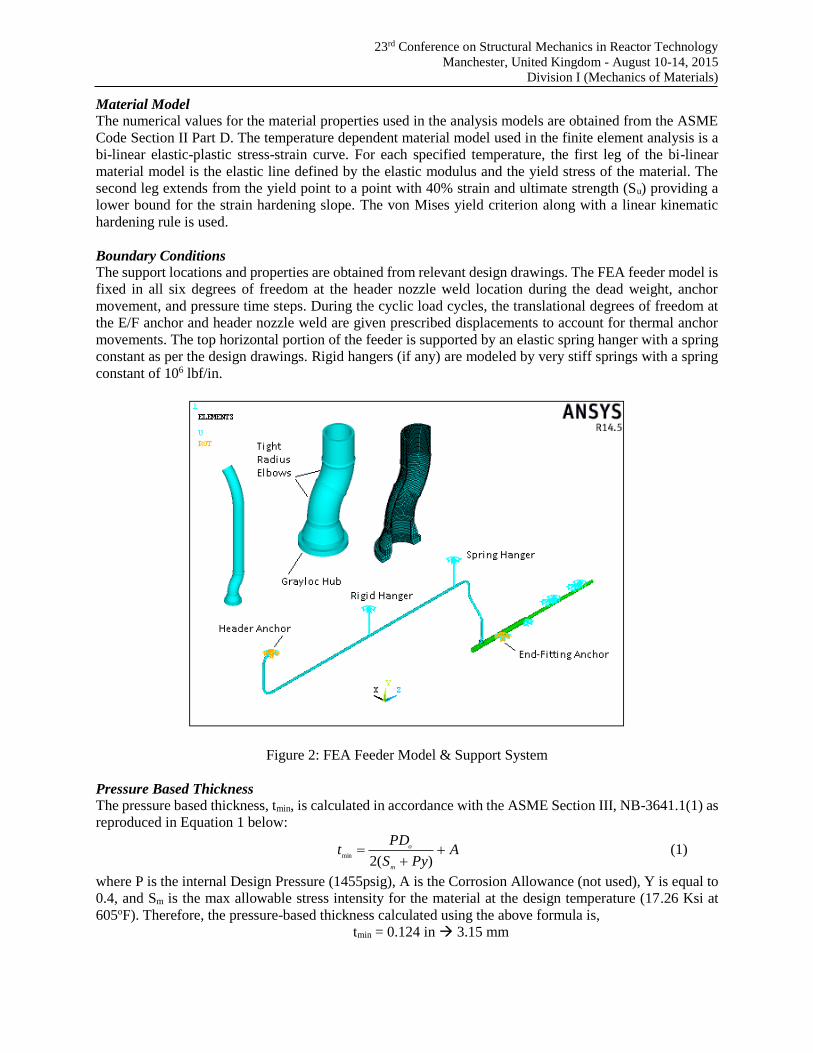
Figure 2 shows the three dimensional mixed finite elements model of the feeder pipe constructed in ANSYS
along with an axial cut-out view of the tight radius elbow region.
Weld Cap Profile
The Grayloc weld cap is modelled as a smooth profile with a uniform width of 11.0 mm and a maximum
height of 1.2 mm. All other welds are modelled as a smooth curve with a uniform width of 14.3 mm and a
maximum height of 1.8 mm. These dimensions are based on data from weld cap replica.
Centreline Offset at Welds
During the welding process, centreline offset may occur and this offset introduces additional source of
stress intensification that needs to be considered. In this paper, the potential centreline offset at all welds
on the tight radius elbows is conservatively modelled using 1/32 inch to capture the weld stress index, C2,
as per NB-3683.4 for as-welded girth butt welds joining items with nominal wall thickness t< 0.237 in (t <
6 mm). The direction of the offset is controlled by an offset angle with respect to the tight radius bend local
coordinate system. The offset angle at each weld location is not known. Therefore, it is conservatively
assumed that the offset angles are coincident with the directions of the maximum stress intensities at the
vicinity of each weld location.
23rd Conference on Structural Mechanics in Reactor Technology
Manchester, United Kingdom - August 10-14, 2015
Division I (Mechanics of Materials)
Material Model
The numerical values for the material properties used in the analysis models are obtained from the ASME
Code Section II Part D. The temperature dependent material model used in the finite element analysis is a
bi-linear elastic-plastic stress-strain curve. For each specified temperature, the first leg of the bi-linear
material model is the elastic line defined by the elastic modulus and the yield stress of the material. The
second leg extends from the yield point to a point with 40% strain and ultimate strength (Su) providing a
lower bound for the strain hardening slope. The von Mises yield criterion along with a linear kinematic
hardening rule is used.
Boundary Conditions
The support locations and properties are obtained from relevant design drawings. The FEA feeder model is
fixed in all six degrees of freedom at the header nozzle weld location during the dead weight, anchor
movement, and pressure time steps. During the cyclic load cycles, the translational degrees of freedom at
the E/F anchor and header nozzle weld are given prescribed displacements to account for thermal anchor
movements. The top horizontal portion of the feeder is supported by an elastic spring hanger with a spring
constant as per the design drawings. Rigid hangers (if any) are modeled by very stiff springs with a spring
constant of 106 lbf/in.
Figure 2: FEA Feeder Model & Support System
Pressure Based Thickness
The pressure based thickness, tmin, is calculated in accordance with the ASME Section III, NB-3641.1(1) as
reproduced in Equation 1 below:
APyS
PDt
m
o
)(2
min (1)
where P is the internal Design Pressure (1455psig), A is the Corrosion Allowance (not used), Y is equal to
0.4, and Sm is the max allowable stress intensity for the material at the design temperature (17.26 Ksi at
605oF). Therefore, the pressure-based thickness calculated using the above formula is,
tmin = 0.124 in 3.15 mm

23rd Conference on Structural Mechanics in Reactor Technology
Manchester, United Kingdom - August 10-14, 2015
Division I (Mechanics of Materials)
Allowable Local Thickness for Bends
For pipe bend, the following equation is provided by the ASME Code SEC XI Code Case N-597-2 for the
calculation of the allowable local wall thickness (taloc):
L
b
aloc
R
Rt
t
cos1
5.05.0
minmin
(2)
where,
Rmin pipe mean radius based on tmin
Rb bend radius
ӨL Circumferential Coordinate
Therefore the required thickness for the tight radius bend in consideration is 1.238 tmin (3.90 mm) on the
intrados (ӨL = 180o) and 0.878 tmin on the extrados (ӨL = 0 o).
ELASTIC ANALYSIS
Linear elastic FEA of the onetime anchor movement is performed to determine the orientations (angles) of
maximum stress intensities at the weld locations. These angles are used to implement the weld centerline
offsets at each weld location for the elastic-plastic analysis.
CYCLIC ELASTIC PLASTIC ANALYSIS
Anchor Movement Load:
The anchor movement loading is applied as a prescribed displacement of the end-fitting nodes in the
horizontal fuel channel direction (z-direction).
Pressure & Thermal Cyclic Load:
The following equivalent thermal and pressure transients are used in the elastic-plastic cyclic loading
analysis:
Pressure Range, PRange 1635 psig
Temperature Range, TRange 539oF
Number of Cycles 645
Thermal anchor movements at the header (HDR) and end-fitting (E/F) are applied in the orthogonal global
X, Y, and Z directions (Y Vertical, Z Fuel Channel. Through thickness temperature gradient, ∆T1 =
15 oF is applied as demonstrated in Figure 3.
The value of ∆T1 are obtained by iterating the AutoPIPE equivalent thermal cycle runs with gradually
increased ∆T1 values until the maximum peak stress range, Sp, in Equation (11) under NB-3653.2 has
bounded the corresponding value obtained by the actual thermal transients. The maximum stress intensities
and fatigue usage factors obtained from the AutoPIPE piping analysis using the equivalent transients are
compared to the results using the actual transients as per the design specifications and it is concluded that
the equivalent cyclic loading bounds the maximum stress intensities and fatigue usage factors.

23rd Conference on Structural Mechanics in Reactor Technology
Manchester, United Kingdom - August 10-14, 2015
Division I (Mechanics of Materials)
Figure 3: Through Thickness Linear Temperature Gradient (Loading & Unloading)
The time steps for the constant loads as shown on Figure 4 are detailed as follows: 1. Dead Weight (DW):
Apply the dead weight load gradually to its maximum value as shown in (Time Step=1).
2. Anchor Movement Displacement (WSP):
Apply the anchor prescribed displacement gradually to its maximum value (Time Step=2).
The time steps from 3 to 8 as shown in Figure 5 represent the first cycle of the cyclic load as follows:
3. Pressurization (Time Step=3):
Apply internal pressure load gradually to its maximum value.
4. Heat up – Transient (Time Step=4):
Apply a temperature load linear gradient through the thickness of the feeder with the maximum
temperature load of TRange applied on the inner surface and TRange - ∆T1) on the outer surface
Apply half the thermal anchor movement at the respective anchor points (Header Nozzle and End-
fitting)
5. Heat up - Steady-state (Time Step=5):
Apply the full temperature load on the feeder with the maximum temperature load of TRange applied
uniformly through the thickness
Apply the full thermal anchor movement at the respective anchor points (Header Nozzle and End-
fitting)
6. Cool down – Transient (Time Step=6):
Apply a temperature load linear gradient through the thickness of the feeder with the maximum
temperature load of TRange applied on the outer surface and (TRange - ∆T1) on the inner surface
Unload half the thermal anchor movement at the respective anchor points (Header Nozzle and End-
fitting)
7. Cool down - Steady-state (Time Step=7):
Unload the temperature load on the feeder
Unload the thermal anchor movement at the respective anchor points (Header Nozzle and End-
fitting)
8. De-pressurization (Time Step=8):
Unload the full internal pressure load

23rd Conference on Structural Mechanics in Reactor Technology
Manchester, United Kingdom - August 10-14, 2015
Division I (Mechanics of Materials)
Figure 5 illustrates the loading and unloading of the different cyclic loads considered for the first cycle. A
ratio of ∆T1/ TRange = 20% is used for illustrative purposes only.
Repeat time steps 3-8 for the estimated number of equivalent cycles of 645 or until convergence is
established.
Figure 4: Dead Weight & Anchor Movement Loading Figure 5: Cyclic Loading
Mesh Sensitivity Analysis
A mesh sensitivity analysis is performed for the feeder model with the target 3.90 mm thickness. A regular
mesh and an extra refined mesh where the number of brick elements is doubled in all three dimensions
(radial, circumferential, and axial) are used. It is found that there is about 2.8% increase in the maximum
accumulated principal plastic strain when using the extra refined mesh. Considering that one load cycle
using the extra-refined mesh took about 10 days of continuous run, it is decided to use the reference mesh
for computational efficiency as 7-10 cycles are required to demonstrate plastic shakedown. This is
considered appropriate in light of the small difference in the calculated principal plastic strains.
Elastic-plastic Cyclic Loading
In the following results presentation it is noted that the first initial cycle (constant dead weight and one time
anchor movement) corresponds to time step 1 and time step 2, respectively. Maximum anchor movement
is reached at the end of time step 2 (Cycle 0 or initial cycle). The first pressure and thermal cycle starts with
time step 3 and ends at time step 8. Maximum pressure, temperature, and thermal anchor movement loads
are reached at the end of time step 5. The second cyclic load cycle starts at load step 9 and ends at load step
14 and so on. In other words, each cyclic load cycle consists of 6 time steps (3 loading and 3 unloading
time steps).
Figure 6 shows the 1st principal plastic strain contour plot for the feeder tight radius elbow region at the end
of the 10th cyclic load cycle with a maximum accumulated principal plastic strain of 0.009 (0.9%) located
at the intrados of the second tight radius elbow. It is noted that the strains on all ANSYS plots do not include
the notch strain concentration factor at the welds. The notch strain concentration factor is applied during
post-processing of the analysis results for all nodes at weld locations. The node with the maximum first
principal plastic strain is identified (Node 68230 for this feeder model).
Figure 7 illustrates the von Mises plastic strain history for the node having the maximum first principal
plastic strain. It is observed that most of the strain is accumulated in the first cyclic load cycle and it rapidly
converges within the first few cycles.
Figure 8 illustrates the von Mises stress history for the same node.
0
0.2
0.4
0.6
0.8
1
1.2
0 1 2 3 4 5 6 7 8 9
No
rmal
ize
d L
oad
Time Step
DW
WSP
0
0.2
0.4
0.6
0.8
1
1.2
0 1 2 3 4 5 6 7 8 9
No
rmal
ize
d L
oad
Time Step
Pressure
Ti
To
TAM
UnloadingLoading
∆T1/TRange

23rd Conference on Structural Mechanics in Reactor Technology
Manchester, United Kingdom - August 10-14, 2015
Division I (Mechanics of Materials)
Figure 9 shows the stress-strain hysteresis cycle for the same node having the maximum
accumulated first principal plastic strain.
Figure 6: First Principal Plastic Strain (10th Cycle)
Figure 7: von Mises Plastic Strain History
Figure 8: von Mises Stress History Figure 9: von Mises Stress-Strain Hysteresis
Accumulated Principal Plastic Strain:
The maximum accumulated principal plastic strain (EPPL) obtained from the FEA is multiplied by strain
concentration factor Kε. The strain concentration factor used in this analysis is based on Neuber’s rule. The
ASME Code linear elastic stress & strain concentration factor for as-welded condition (Table NB-3681(a)-
1 Girth butt welds between nominally identical wall thickness items) is equal to 1.8. Therefore, the
maximum plastic strain concentration factor is Kε=k22=1.82 =3.24. Figure 10 illustrates the principal plastic
strain history for the node with the maximum accumulated principal plastic strain. In this figure, the strain
is multiplied by the strain concentration factor (3.24) as this node is located in the vicinity of the second
weld of the second tight radius elbow. It is observed that the FC anchor movement produced about 0.18%
principal plastic strain while an increment of about 1.72% is introduced in the first transient load cycle. In
other words, 1.90% principal plastic strain is accumulated in the initial and first cyclic load cycle. The rest
of the 645 equivalent cycles conservatively accumulated 0.12% plastic strain producing a total accumulated
first principal plastic strain of 2.02%.

23rd Conference on Structural Mechanics in Reactor Technology
Manchester, United Kingdom - August 10-14, 2015
Division I (Mechanics of Materials)
Figure 10: 1st Principal Plastic Strain & Fatigue Usage Factor
Fatigue Usage Factor:
The cumulative usage factor (CUF) for fatigue damage is calculated using NB-3222.4 (Analysis for Cyclic
Operation) using the alternating stress intensity (Sa) as per NB-3228.4 (Shakedown Analysis). The
alternating stress intensity at the point of interest is given by:
Sa= E * (max/2)
Where,
max Maximum Principal Total Strain Intensity Range
E Modulus of elasticity at the average temperature during the cycle.
The cumulative fatigue usage factor (CUF) is calculated as follows:
CUF = Σ(ni/Ni)
Where,
ni Actual number of load cycles
Ni Allowable number of load cycles
The principal strain ranges are calculated in a similar fashion to the stress ranges using ASME SECTION
III Sub-section NB-3216 (Derivation of Stress Differences) sub-article NB-3216.2 (Varying Principal
Stress Direction). The alternating stress intensity is corrected using the ratio between the elastic modulus
(30*106 psi) of the fatigue curves and the elastic modulus (27.3*106 psi) corresponding to the average
temperature during the cycle. The alternating stress values are obtained directly from the strains before the
elastic modulus correction.
Figure 10 illustrates the history of the cumulative usage factor (CUF) for fatigue for the node with the
maximum accumulated principal plastic strain. It is observed that the FC anchor movement produced about
0.003 CUF while an increment of about 0.071 is introduced in the first transient load cycle. In other words,
CUF of 0.074 is accumulated in the initial and first cyclic load cycle. The rest of the 645 equivalent cycles
conservatively added 0.119 to the CUF producing a total cumulative fatigue usage factor of 0.193.
CONCLUSIONS
Detailed cyclic elastic-plastic finite element analyses are performed on one 2½” NPS CANDU outlet feeder
to determine the minimum acceptable uniform wall thickness (MAWT). The ASME SECTION III Sub-
section NB-3200 Design by Analysis is followed. The weld centerline offset and weld cap profiles at all
weld locations on the tight radius elbows are physically modelled to reduce conservatism. A bi-linear
elastic-plastic material model is used with Kinematic hardening rule and von Mises yield criterion.
0.00
0.25
0.50
0.75
1.00
0.0
0.5
1.0
1.5
2.0
2.5
3.0
3.5
4.0
4.5
5.0
5.5
6.0
0 1 2 3 4 5 6 7 8 9 10 11
CU
F
%EP
PL
Cycle
EPPL
EPPL Criterion
CUF
CUF Criterion

23rd Conference on Structural Mechanics in Reactor Technology
Manchester, United Kingdom - August 10-14, 2015
Division I (Mechanics of Materials)
Cyclic elastic-plastic FEA is performed to determine the total accumulated first principal plastic strain and
the maximum fatigue usage factor.
It is demonstrated that the maximum accumulated first principal plastic strain meets the ASME Code 5%
maximum principal strain criterion. It is also demonstrated that the maximum cumulative fatigue usage
factor meets the fatigue requirement. This paper highlights the effectiveness of detailed FEA in extending
a nuclear component life using the ASME (construction) Code.
The effects of FEA details such as the centerline offset and through thickness temperature gradient need to
be studied closely to determine their relative impact on the final analysis results.
REFERENCES
ASME Boiler and Pressure Vessels Code (2007), Section III, “Rules for Construction of Nuclear Power
Plants” & Section II Part6 D “Material Properties”, 2007.
Abdelsalam, U. and Vijay, Dk (2008), “Finite Element Modelling of Locally Thinned Short Radius Pipe
Bends”, Presented at the 8th International Conference on CANDU Maintenance (CMC2008),
Toronto, Ontario, November 16-18, 2008.
Abdelsalam, U. and Vijay, Dk (2009), “Detailed FEA of Locally Thinned Pipe Bends”, 20th International
Conference on Structural Mechanics in Reactor Technology (SMiRT 20), SMiRT20-Division 3,
Paper 2575, Espoo, Finland, August 9-14, 2009.
Abdelsalam, U. and Vijay, Dk (2010), “ASME Code Qualification of Pipe Bends with Localized Wall
Thinning”, Proceedings of the ASME 2010 Pressure Vessels and Piping Division Conference, July
18-22, 2010, Bellevue, Washington, USA.
Abdelsalam, U., Taylor, H., Glover, A. and Bagga, P. (2013), “Application of the ASME Code Sec III
Pressure Requirements on Tight Radius Out-of-round Pipe Bends”, Transactions, SMiRT-22, San
Francisco, California, USA, August 18-23, 2013.
Abdelsalam, U. (2010), “Application of the ASME CODE SEC III Pressure Design Requirements on
Locally Thinned Tight Radius Pipe Bends”, Proceedings of the ASME 2010 Pressure Vessels and
Piping Division Conference, PVP2010, Bellevue, Washington, USA.
Reinhardt, W.and Zobeiry, N. (2009), “Implications of Limit Analysis on the Evaluation of Locally Thinned
Vessels and Piping”, Proceedings of the ASME 2009 Pressure Vessels and Piping Division
Conference, PVP2009-77896, Prague, Czech Republic.
Scarth, D.A. Hasegawa, K., Goyette, L.F. and Rush, P. (2006), “Supplementary Technical Basis for ASME
Section XI Code Case N-597-2”, Proceedings of PVP2006-ICPVT-11, 2006 ASME Pressure Vessels
and Piping Division Conference, July 23-27, 2006, Vancouver, BC, Canada.
Veerappan, A.R. and Shanmugam, S., (2008), “Analysis for Flexibility in the Ovality and Thinning Limits
of Pipe Bends”, ARPN Journal of Engineering and Applied Sciences, Vol 3, No 1, February 2008.
Vlaicu, D. (2008), “Nonlinear Cycling Analysis of Pipe Bends with Initial Ovality”, Proceedings of
PVP2008, July 27-31, 2008, Chicago, Illinois, USA.
Xu, H., Zhang, N., and Liu, G. (2005), “Stress Assessment Based on Ovality and Thickness Asymmetry
for an Internally Pressurized Pipe Elbow at High Temperature”, 18th International Conference on
Structural Mechanics in Reactor Technology (SMiRT 18), Beijing, China, August 7-12, 2005.


