Embed Size (px)
Citation preview
Electrocatalysis of reformate tolerance in proton exchangemembranes fuel cells: Part I
Richard C. Urian, Andrea F. Gulla, Sanjeev Mukerjee *
Department of Chemistry, Northeastern University, Boston, MA 02115, USA
Received 2 October 2002; received in revised form 15 February 2003; accepted 10 March 2003
Dedicated to Professor Michael Weaver and his contribution to surface science and electrochemistry
Journal of Electroanalytical Chemistry 554�/555 (2003) 307�/324
www.elsevier.com/locate/jelechem
Abstract
Electrocatalysis of anode electrode tolerance resulting from the presence of both CO and CO2 in the reformer feed was
investigated for Pt, Pt�/Ru (1:1) and various atomic ratios of supported Pt:Mo electrocatalysts in proton exchange membrane fuel
cells (PEMFCs). In order to elucidate the effects of CO and CO2 in the reformer feed, separate systematic studies were conducted
with varying levels of CO and CO2 in H2. The results were used to explain those obtained with a fixed reformate composition: 45%
H2, 10 ppm CO, 15% CO2, 1% CH4 balanced with N2. Results with CO in H2 showed that PtMo/C exhibits at least a threefold better
CO tolerance as compared to PtRu/C and fourfold with respect to Pt/C. The variation of PtMo atomic composition has a negligible
effect on CO tolerance. Additional surface poisoning was detected for all the electrocatalysts studied in the molar ratio (H2:CO2,
40:60 to 60:40). The presence of a reduced CO2 species was confirmed using cyclic voltammetry. An ensemble effect was proposed to
explain the variation of tolerance to CO2 as a function of Pt: Mo atomic ratio, this is in contrast to the effect in the presence of
adsorbed CO. Interestingly, the overpotential losses in the presence of H2:CO2 for PtMo/C (1:1) and PtRu/C (1:1) were very close.
As the Pt content of the PtMo/C alloys was increased, the overpotential losses followed those observed for pure Pt, clearly
demonstrating a relationship between overpotential loss and Pt site availability. Despite similar overpotential losses between Pt/C
and PtMo/C (5:1), both of which were greater than PtRu/C (1;1) the overpotential loss observed for PtMo in a CO2�/CO reformate
mix was far better than for both PtRu/C and Pt/C.
# 2003 Elsevier B.V. All rights reserved.
Keywords: Reformate tolerance; Electrocatalysis; Proton exchange membrane fuel cells; PtMo; Reverse shift reaction
1. Introduction
Proton exchange membrane fuel cells (PEMFCs) are
currently attractive candidates for low emission power
sources for both stationary and portable applications. In
this endeavor, the systems closest to commercialization
are those which include on-board reformation of a fuel
such as methanol, natural gas or even gasoline for
hydrogen production. This steam reformation process is
typically followed by clean up steps, which include the
high and low temperature shift converters and a selective
oxidizer (called the ‘prox’ unit) for lowering the CO
content of the reformer outlet. Typical levels of CO at
the inlet stream of a PEMFC are expected to be in the
range of 50 and 100 ppm. Besides CO, the major
constituent of the reformate gas outlet is CO2. The
levels of CO2 however can vary between 35 and 40%
(dry gas composition) for the high temperature iso-
octane system (gasoline) and 75% (dry gas composition)
for the relatively low temperature methanol reformation
[1]. The anode feed stream, therefore, typically contains
a mole fraction of hydrogen in the range of 0.4�/0.75,
with CO in the range of 50�/100 ppm and CO2 making
up the balance.
The presence of CO as a poison in the anode feed
stream together with hydrogen has been well documen-
ted and a large body of literature is available, both for* Corresponding author. Tel.: �/1-617-373-2382.
E-mail address: [email protected] (S. Mukerjee).
0022-0728/03/$ - see front matter # 2003 Elsevier B.V. All rights reserved.
doi:10.1016/S0022-0728(03)00241-9
PEMFCs as well as for the medium temperature
phosphoric acid systems. However, the presence of
CO2 and its effect has not yet been examined in detail.
There is very limited literature available in the publicdomain on the possibility of a reverse shift reaction of
CO2 (reduction) to produce CO at the typical PEMFC
operating temperature of 80 8C. For the higher tem-
perature phosphoric acid fuel cell (PAFC) system, the
presence of CO2 is largely considered as a diluent (96%
H3PO4 at 160 8C) [2]. One of the earliest reports on CO2
reduction at low temperatures was presented by Giner
[3]; it was shown that in acid solutions (H2SO4) CO2 isreduced by chemisorbed hydrogen in the potential range
of 0�/250 mV (vs. RHE). The activation energy was
determined to be 92 kJ mol�1. Giner, also indicated that
the adsorbed CO2 formed was what he called a reduced
CO2 species (hereby referred to as ‘CO2’) on the Pt
surface. This ‘CO2’ species was similar to those formed
in the presence of partially oxygenated fuels such as
methanol [4] and saturated hydrocarbon [4]. Earlyinvestigations focussing on the identification of the
type of species formed have suggested the formation of
carboxylic type moieties on the Pt surface [5]. Also
reported was the surface coverage (u ) on a platinized
surface for ‘CO2’ which was approximately 0.7 at 40 8Cwith the charge for oxidation of the adsorbed ‘CO2’ per
one adsorption site being equal to one. Similar results
were also reported by Kamath and Lal [6]. Stonehart [7]suggested a two electron oxidation process for the
adsorbed ‘CO2’ species and reported a higher rate
constant for ‘CO2’ as compared to CO mono-hydrate.
A number of reports have appeared on the different
species of adsorbed CO and ‘CO2’ (see Ref. by
Sobkowski and Czerwinski [8]) most of which agree on
a two-electron oxidation for reduced ‘CO2’. The general
consensus is that, based on the electrode potential,different species are formed by CO and CO2. For
example at low potentials, where Pt is covered by
adsorbed hydrogen (Pt�/Hads), CO forms both linear
and bridge bonded CO species. This observation is also
confirmed by prior in situ IR spectroscopy (EMIRS
technique) by Beden and coworkers [9,10] and Lamy et
al. [11]. Moreover, the ratio of linear and higher
coordinated forms (such as bridge bonded) appears tobe a function of electrode potential. Adsorption of CO2
on the platinum surface is expected to occur mainly in
the potential range where surface adsorbed hydrogen on
Pt is present (hence in the low potential hydrogen region
[12�/14]. These prior studies were mostly conducted in
aqueous electrolytes such as H2SO4 at or just above
room temperature.
The poisoning effect of a supported Pt electrocatalystdue to the presence of CO2 in the anode gas input has
been presented [15,16] for PEMFCs; moreover, such an
effect was also investigated in a recent report on
PEMFCs operating at 65 8C under ambient pressure
conditions [17]. In this work, an additional overpotential
loss of �/20 mV at 400 mA cm�2 was reported and it
was ascribed to the presence of 21% CO2 in the
reformate output (dry gas composition: 21% CO2, 30%
N2, balance H2). Such a result, if translated to interfacial
resistance, correlates to a 70�/90 mA cm�2 loss in the
linear region of the polarization curve.
The current state of the art electrocatalyst for
reformer fed anode electrodes in PEMFCs is PtRu/C.
The CO tolerance (with an economically viable electro-
catalyst loading, 0.1�/0.4 mg cm�2) at low levels (B/20
ppm) is acceptable. However, higher CO levels such as
those in the 100 ppm range result in a significant
overpotential loss (200�/250 mV at 0.7 A cm�2).
Presently, air bleeding in the anode feed stream is used
to mitigate the CO poisoning problem; however, a more
elegant solution would be an improved tolerance to both
CO and CO2.
In this context, recent and promising results [21,22]
with PtMo/C have been shown, some of which report up
to a threefold enhancement in performance with H2 (100
ppm CO)/O2 as compared to PtRu/C. Improvement in
CO tolerance relative to PtRu/C has also been observed
for supported PtW and PtCoMo [18,19]. However, there
has been very limited work on the effect of CO2 present
in the reformer output stream to the fuel cell, especially
with binary alloy electrocatalysts such as PtRu/C and
PtMo/C. A recent short communication [20] has com-
pared the effect of CO2 in the anode feed of a PEMFC,
between PtMo/C and PtRu/C with the atomic ratio of
the alloys being 77:23 and 51:49, respectively; Pt/C was
used as a control. In this report, the CO tolerance to a
H2/CO mixture (10�/100 ppm) was superior for PtMo/C
as compared to PtRu/C and in agreement with prior
reports [21]. However, in the presence of CO2 (25% dry
gas composition, balance H2), an additional overpoten-
tial loss of 500 mA cm�2 (80 8C cell temperature) was
reported for PtMo/C relative to Pt/C while PtRu/C
maintained a slightly better tolerance as compared to Pt/
C.
The present work is aimed at comparing the perfor-
mance of a series of carbon supported PtMo electro-
catalysts with Pt (control), and Pt:Ru (1:1 atomic ratio
a/o) in a typical reformer fed fuel cell. The objective is to
provide a systematic qualitative picture of the over-
potential losses as a result of varying amounts of CO2 in
the reformate feed to the anode. For this, a range of
ratios of CO2 to H2 has been used to examine the
additive nature of the surface poisoning on the PtRu/C
and PtMo/C as compared to the control Pt/C. The goal
was to draw distinctions between the poisoning effect of
CO and CO2 as a function of composition of the
electrocatalysts (choice of the alloying element, atomic
ratio and the methodology of preparation).
R.C. Urian et al. / Journal of Electroanalytical Chemistry 554�/555 (2003) 307�/324308
2. Experimental
2.1. Electrocatalyst and electrode specifications
Three types of carbon-supported Pt based electro-catalysts were used in the anode electrodes. These
comprised of 30% Pt/C, 30% PtRu (1:1 a/o) and four
different compositions of 30% PtMo/C (1:1, 3:1, 4:1 and
5:1, Pt:Mo a/o). The choice of PtRu/C (1:1) was based
on the fact that it is the most widely used electrocatalyst
for reformate tolerant anode electrodes. The four
different compositions of PtMo were used to determine
the influence of the Pt:Mo atomic ratio on the toleranceof CO2. Among these compositions, the data for 5:1 a/o
PtMo/C is reported in greater detail because this
composition allowed a maximum Pt to Mo ratio and
hence the greatest susceptibility to CO2. The other
compositions were used to understand the level of CO2
tolerance in the context of the PtRu/C (1:1a/o) and Pt/C
(control). All electrocatalysts used in this investigation
were obtained from De Nora N.A., E-TEK division,Somerset, NJ with the exception of PtMo/C (1:1). This
catalyst was synthesized in-house. In order to verify our
synthesis methodology, all of the PtMo/C compositions
obtained from De Nora N.A., E-TEK division, Somer-
set, NJ were also prepared in-house. Comparison of the
two sets of catalysts exhibited very close performance
characteristics.
The cathode electrode was the same in all experiments(a Pt/C electrode with 20% Pt on C, loading of 0.4 mg
cm�2 from De Nora N.A., E-TEK division, Somerset,
NJ). The anode electrodes were made in-house with a
metal loading of 0.4 mg cm�2, using a spraying process
and a non catalyzed single sided ELAT electrode from
De Nora N.A., E-TEK division. The MEA was
fabricated in-house with Nafion†1135 (1100 MW and
3.5 mill) using a standard in-house hot pressing techni-que. Nafion† loading in the MEA was approximately
0.6 mg cm�2.
2.2. Physico-chemical characterization
X-ray diffraction was conducted using the high
resolution X-18A beam line at the National Synchrotron
Light Source (NSLS) at Brookhaven National Labora-tory. The previously reported characterization of the 3:1
and 4:1 PtMo/C composition [22] showed the existence
of a fcc metallic phase with an average particle size of ca.
4 nm. Since the lattice constants for the PtMo solid
solutions are very close to that of pure Pt, the composi-
tions of the nanocrystalline phase could not be deter-
mined. Within the limits of this technique, however, no
separate phases associated with Mo, e.g. metal oxide, orcarbide were detected, suggesting thereby that most if
not all of the Mo was alloyed to the Pt. TEM analyses of
the as-received electrocatalysts were conducted using a
JOEL transmission electron spectrometer (model 3010)
operating at an energy of 200 kV. Electron diffraction
data was also obtained for every sample. Line broad-
ening analysis of the primary XRD peak �111� wasconducted using the Scherrer treatment of the data. The
data were first fitted to an indexing program, which
allowed accurate measurement of the line widths at half
maximum. These widths were then used to obtain the
particle size. Corrections for beam deviations in the
instrument were considered negligible due to the high
collimation of the synchrotron beam.
In addition, X-ray absorption near edge structure(XANES) data from in situ X-ray absorption spectro-
scopy (XAS) was measured. The objective was to verify
the nominal atomic ratios provided by the vendor as
well as the nature of alloying, especially in the case of
PtMo/C where the difference in the line shifts of the
XRD patterns were very small even with the high
resolution synchrotron radiation source. The XAS
spectra, with its two complimentary spectral compo-nents, the near edge region, XANES and the extended
part, X-ray absorption fine structure (EXAFS) provide
information on the changes in both electronic (Pt d-
band vacancy/atom) as well as short range atomic order
(bond distances, coordination numbers, etc.). The
advantages of this technique are its element specificity
and in situ capability. For the purpose of determining
the atomic ratio a special in situ spectro-electrochemicalcell (described in detail elsewhere [23]) was used, which
allowed XAS measurements in transmission mode with
the working electrode in a totally flooded state. XAS
measurements were conducted at beam line X-11A at
the National Synchrotron Light Source (NSLS) in
Brookhaven National Laboratory, with the storage
ring operating at 2.8 GeV and a current between 350
and 120 mA. Data were collected at both the Pt L (L3
and L2) and Ru and Mo K edges in the transmission
mode using a three detector set up comprising of the
incident and transmitted beams and a reference. The
reference detector provided accurate calibration and
alignment of the edge positions, for which a pure
standard foil (mx�/1) of the element edge being probed
was employed. Details of the beam line optics and the
monochromator are given elsewhere [24]. The mono-chromator, (Si 111 crystals) was detuned by 15% for the
Pt L edges and 10% for both the Mo and Ru K edges,
respectively, to reject higher harmonics.
In situ XAS data for all electrocatalysts (at the Pt L
and alloying element K edges) for the purpose of
XANES analysis were measured at 0.54 V versus RHE
using a computer interfaced potentiostat/galvanostat
(PGSTSAT 30, Autolab, Echochemie, Brinkmann In-struments). The electrolyte choice was 1 M HClO4. Prior
to acquiring the in situ XAS spectra, electrodes were
cycled between 0.0 and 0.65 V at least 25 times, the
choice of the upper potential cutoff was to avoid
R.C. Urian et al. / Journal of Electroanalytical Chemistry 554�/555 (2003) 307�/324 309
possible dissolution of Mo and Ru. Since the purpose of
the XAS experiment was primarily to determine the
atomic ratio of Pt and the alloying element, the in situ
spectra were taken at 0.54 V versus RHE. Data collectedat this potential were devoid of interference due to
adsorbed species, being in the double layer region and
close to the potential of zero charge. Detailed EXAFS
analysis at this potential using the Pt L3 edge data is
presented elsewhere [25].
2.3. Electrochemical characterization
All membrane electrode assemblies (MEAs) weretested in a 5-cm2 single cell fuel cell (Fuel Cell
Technologies, Albuquerque, NM) using a locally con-
structed test station facility for steady-state polarization
measurements. This test station allowed independent
control of humidification, cell temperature, gas flow
rate, etc. The single cell design incorporated reference
electrodes, which allowed simultaneous measurement of
the anode and cathode half-cell polarization along withthe single cell data. Polarization data were acquired
using a LabView† routine, written in-house. The
program was interfaced with a HP 60508 Electronic
Load main frame, which housed a HP 60501B 150 W
electronic load module.
All MEAs were conditioned prior to testing using a
series of steps. The initial step involved a slow ramp of
the cell temperature from room temperature to 85 8C(approximately 2 8C h�1) with saturated N2 flow on
both electrodes. After keeping the cell under these
conditions for approximately 5 h, the pressure was
slowly increased to 50/60 psig anode/cathode respec-
tively. The gases were switched to saturated H2 and O2
with the cell allowed to equilibrate for a couple of hours.
Humidification conditions were checked by monitoring
the cell backpressure and inlet gas temperatures. Fol-lowing this conditioning step all MEAs were initially
tested with H2/O2 measuring simultaneously the single
and half-cell polarization. Half-cell cathode polariza-
tions for all MEAs were compared to the control (Pt/C
electrodes, anode and cathode). Only those MEAs
which exhibited less than 9/5 mV variation at 1 A
cm�2 for the cathode half cell data were used for
subsequent measurements.The operating conditions for all fuel cell tests were:
cell temperature 85 8C, 100% relative humidification,
cathode side gas was oxygen and the anode gas
compositions were (i) H2, (ii) H2�/N2 and (iii) H2�/
CO2. Both (ii) and (iii) gas mixtures were taken in the
ratios of 60:40, 50:50, 40:60 molar ratios. In addition,
the steady-state polarization measurements were also
measured with anode gas compositions containing (i) 5,20, 50 and 100 ppm of CO (balance H2) as well as (ii)
reformate mixture of 45% H2, 10 ppm CO, 15% CO2,
1% CH4 balanced with N2. The cyclic voltammograms
were obtained using an Autolab potentiostat/galvano-
stat (PGSTAT-30, Ecochemie, Brinkman Instruments)
with software package. Cyclic voltammetry was per-
formed on all the MEA systems while still in the singlecells, after all polarization tests had been completed.
This involved passing pure H2 over the reference and
counter electrode chamber (cathode electrode) and N2
over the working electrode (anode electrode). In addi-
tion, cyclic voltammograms were also measured with
pure CO2 flowing in the working electrode chamber
(anode electrode) instead of N2.
All data reported in this paper are an average of atleast three separate polarization measurements, within
each set of data, variations were always less than 9/4�/5
mV at 500 mA cm�2. In addition each electrocatalyst
was tested at least as two separate MEAs to ensure
reproducibility.
2.4. Kinetic model for CO2 poisoning and dilution effects
As mentioned in the introduction section, the aim of
this report is to provide a systematic and quantitative
picture of the overpotential losses due to the presence of
varying amounts of CO2 in the reformate feed-stream. A
detailed kinetic model for examining this effect has beenformulated and it is the subject of a different publica-
tion. In this report, a part of this model has been used to
determine the level of CO coverage on the electrocata-
lysts surface, resulting from the reverse water gas shift
reaction (conversion of CO2 to CO). Such a conversion
process can be written in accordance to two reaction
pathways [3]: (i) CO2�/H2?/CO�/H2O (known as the
reverse water gas shift reaction) and/or (ii) CO2�/
2H��/2e�?/CO�/H2O (known as the electro-reduc-
tion reaction). The effect of either in terms of the effect
of surface coverage and its effect on overpotentials will
be the same. Hence CO is expected to be produced at the
interface, whenever there is adjacent CO2 and H2
adsorption and consequently the overpotential losses
will depend upon the various H2�/CO2 mixtures. At the
rather low operational temperatures, typical to PEMfuel cells, the poisoning effect of CO will be more
pronounced as compared to the CO2 dilution effects.
Further, this reverse shift process is likely to occur only
in the forward direction; because under the operational
conditions, the rate of the forward reaction is higher
when compared to the rate of the reverse reaction. The
equilibrium concentrations can be calculated as follows:
nCO2;inCO2�nH2;in
H2�nH2O;inH2O
0 nCO2 ;outCO2�nH2;outH2�nH2O;outH2O�nCO;outCO
kP�PCO2;out � PH2O;out
PH2;out � PCO2 ;out
(1)
The steady-state model presented here for the under-
R.C. Urian et al. / Journal of Electroanalytical Chemistry 554�/555 (2003) 307�/324310
standing of CO poisoning on the catalyst surface of the
Pt-alloys is based on a four step kinetic process and on a
previous analytical discussion of the problem proposed
in an earlier work by Springer et al. [26] The modelassumes that the ionic resistance of the catalyst layer is
low enough to neglect any potential changes across the
catalyst layer. In the context of this investigation,
poisoning due to the formation of ‘reduced CO2’ species
is studied as a function of different H2:CO2 concentra-
tions.
CO�M *kfc
bfc(uCO)kfc
(M�CO) [1]
H2�2M ?kfh(uCO)
bfhkfh(uCO)2(M�H) [2]
2(M�H)0keh
H��e��M [3]
H2O�(M�CO)0kec
M�CO�2H��2e� [4] (2)
In Eq. (2), which refers to a sequence of steps (1�/4), M
represents the metal considered for the system under
investigation. The first two steps in Eq. (2) are both
occurring on the catalyst surface layer and represent the
two competing steps of the kinetics; step (1) denotes theCO adsorption and step (2) corresponds to the dis-
sociative chemisorption of H2. The third step in Eq. (2)
represents the current density corresponding to the
anodic H2 oxidation. The last step in Eq. (2) denotes
the electrochemical oxidation of CO to CO2. Moreover,
the forward rate constants, for both the hydrogen (kfh)
and CO (kfc) adsorption, are expressed in units of A
cm�2, while the ratio of the backward-to-forward rateconstants are expressed in units of atmosphere (atm).
Both the desorption rate for CO and the adsorption rate
for hydrogen are assumed to be a function of CO
coverage, while the ratio of adsorption/desorption rate
for hydrogen and the adsorption rate for CO are
considered to be constant with CO coverage.
It is well recognized that the rate determining step in
the case of CO oxidation is the formation of surfaceoxide and oxyhydroxides from the anodic water activa-
tion step; this corresponds to step 4 presented in Eq. (2).
3. Results and discussion
3.1. Characterization of the nano-cluster size and
morphology: powder XRD, TEM and in situ XAS
measurements
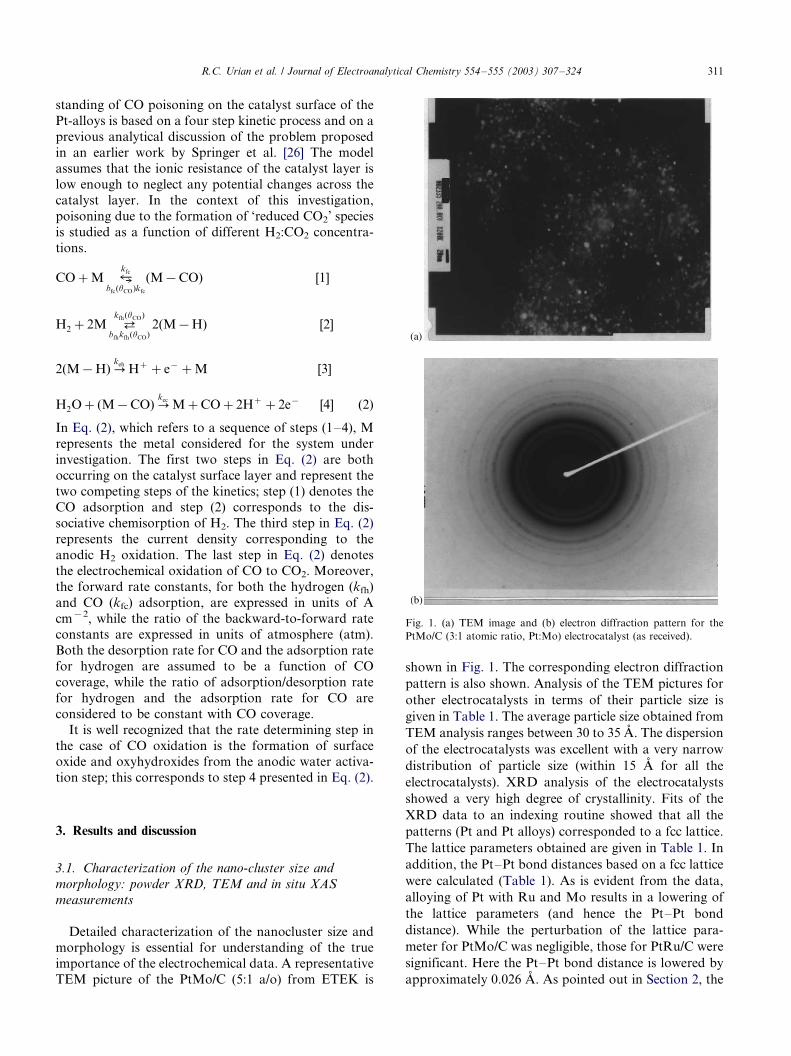
Detailed characterization of the nanocluster size andmorphology is essential for understanding of the true
importance of the electrochemical data. A representative
TEM picture of the PtMo/C (5:1 a/o) from ETEK is
shown in Fig. 1. The corresponding electron diffraction
pattern is also shown. Analysis of the TEM pictures for
other electrocatalysts in terms of their particle size is
given in Table 1. The average particle size obtained from
TEM analysis ranges between 30 to 35 A. The dispersion
of the electrocatalysts was excellent with a very narrow
distribution of particle size (within 15 A for all the
electrocatalysts). XRD analysis of the electrocatalysts
showed a very high degree of crystallinity. Fits of the
XRD data to an indexing routine showed that all the
patterns (Pt and Pt alloys) corresponded to a fcc lattice.
The lattice parameters obtained are given in Table 1. In
addition, the Pt�/Pt bond distances based on a fcc lattice
were calculated (Table 1). As is evident from the data,
alloying of Pt with Ru and Mo results in a lowering of
the lattice parameters (and hence the Pt�/Pt bond
distance). While the perturbation of the lattice para-
meter for PtMo/C was negligible, those for PtRu/C were
significant. Here the Pt�/Pt bond distance is lowered by
approximately 0.026 A. As pointed out in Section 2, the
Fig. 1. (a) TEM image and (b) electron diffraction pattern for the
PtMo/C (3:1 atomic ratio, Pt:Mo) electrocatalyst (as received).
R.C. Urian et al. / Journal of Electroanalytical Chemistry 554�/555 (2003) 307�/324 311
XRD pattern for PtMo/C was very close to that of Pt/C,
hence a strong conclusion on alloy formation was not
possible. As shown in Table 1, the lattice parameters
were very close to that for Pt/C, hence a negligible
change in the Pt�/Pt bond distance as compared to Pt/C.
The electron diffraction patterns for Pt/C and PtMo/C
were also very close. The particle size obtained from
using the �111�-diffraction line broadening analysis
showed remarkable agreement with the corresponding
TEM data. The particle sizes obtained were all in the
range of 28�/35 A.
XANES analysis at the Pt L and alloying element K
edge at 0.54 V involved measurement of edge jumps in
the transmission mode. Analysis using methodology
described in detail elsewhere [23,25,27] provided Pt
and alloying element loading in mg cm�2, which was
then converted to the atomic ratios given in Table 1.
These atomic ratios were in reasonably good agreement
with the specified nominal loading of the electrocatalyst.
Detailed analysis of the EXAFS at the Pt L3 edge on
these PtMo/C alloys has been reported recently [28]; this
analysis has confirmed the alloy formation in the PtMo/
C electrocatalysts. Confirmation of alloying was evident
from both the perturbation of the short-range atomic
order (Pt�/Pt bond distance and coordination numbers)
as well as the increase in the Pt d-band vacancy/atom
due to alloying with Mo or Ru.It is interesting to note that with the exception of the
1:1 atomic ratio of Pt:Mo, other compositions show
very good agreement between results of XANES analy-
sis and the nominal composition given by the manufac-
turer (De Nora N.A., E-TEK division, Somerset, NJ).
XANES analysis of the 1:1 composition shows the
actual ratio to be 65:35 (Pt:Mo). The most probable
reason for this discrepancy is based on the limit of
solubility of Mo in the Pt, which according to prior
reports [29,30] is approximately �/27 a/o. This limit ofsolubility is however controversial with somewhat
higher values reported elsewhere [31].
3.2. Electrochemical characterization: dynamic and
steady-state measurements
In order to understand reformate tolerance, the
interaction of both CO and CO2 with the catalyst
surface has to be investigated. For CO tolerance, the
key parameters are the work function of the surface for
CO adsorption and its oxidation using surface oxides. In
contrast the poisoning (if any) due to reverse shift
reaction with CO2 to produce CO requires the presence
of surface H2 and available active surface reactioncenters, the most favored surface being bare Pt. In
order to understand reformate tolerance better, this
section examines the surface interaction of both CO and
CO2 on these different electrocatalysts.
Fig. 2 shows the single cell polarization curves for
carbon supported Pt, PtRu (1:1) and PtMo (5:1)
electrocatalysts at 85 8C, 60/50 psig backpressure for
cathode and anode electrodes respectively (100% humi-dification condition) with both H2 [100 ppm CO]/O2 and
reformate/O2 (reformate composition: 45% H2, 10 ppm
CO, 15% CO2, 1% CH4 balanced with N2). Comparison
with the H2/O2 polarization curve up to a current
density of approximately 1 A cm�2 shows that the
primary contribution to the kinetic losses is due to the
presence of reformate gases, (most significantly CO).
The contributions due to mass transport polarizationare negligible and the extent of ohmic polarization losses
are approximately the same for all the MEAs tested up
to 1 A cm�2 current density. A more accurate evalua-
Table 1
Results of TEM, XRD and in situ XANES spectroscopy on PtRu/C (1:1 a/o), Pt/C and different alloying compositions of PtMo/C (5:1; 4:1; 3:1 and
1:1 a/o)
Electrocatalyst Nominal atomic ratio (a/o)*
metal loading/C/%
Atomic ratio (from
XANES) Pt/M/%
XRD analysis Particle size/A
XRD lattice para-
meter/A
Pt�/Pt bond dis-
tance/A
X-ray line broadening
analysis
TEM
Pt/C �/ �/ 3.927 2.777 28 30
20
PtRu/C 1:1 62:38 3.8905 2.751 35 35
30
PtMo/C 5:1 84:16 3.9255 2.776 31 31
30
PtMo/C 4:1 78:22 3.9212 2.773 33 35
30
PtMo/C 3:1 72:28 3.9145 2.768 32 31
30
PtMo/C 1:1 65:35 3.9105 2.765 35 34
30
The in situ XANES data is taken at both the Pt L3 and alloying element K edge at 0.54 V vs. RHE. All alloying compositions are expressed in
atomic percent ratio (a/o) of Pt:M, where M is the alloying element.
R.C. Urian et al. / Journal of Electroanalytical Chemistry 554�/555 (2003) 307�/324312
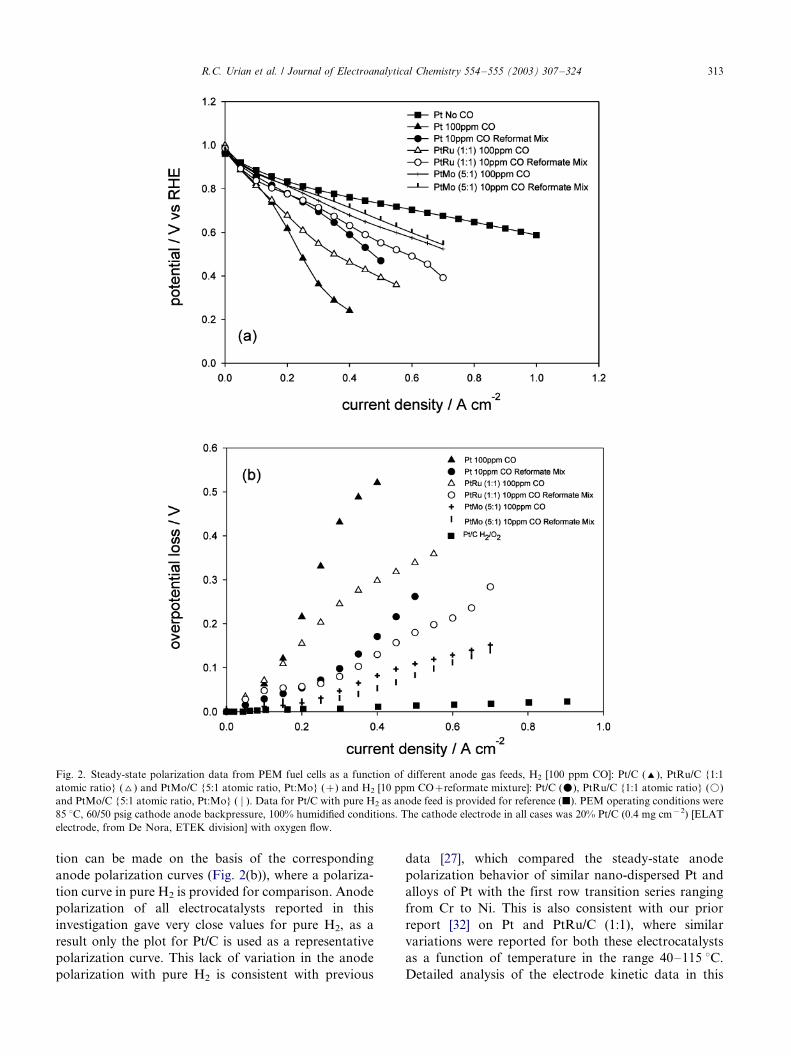
tion can be made on the basis of the corresponding
anode polarization curves (Fig. 2(b)), where a polariza-
tion curve in pure H2 is provided for comparison. Anode
polarization of all electrocatalysts reported in this
investigation gave very close values for pure H2, as a
result only the plot for Pt/C is used as a representative
polarization curve. This lack of variation in the anode
polarization with pure H2 is consistent with previous
data [27], which compared the steady-state anode
polarization behavior of similar nano-dispersed Pt and
alloys of Pt with the first row transition series ranging
from Cr to Ni. This is also consistent with our prior
report [32] on Pt and PtRu/C (1:1), where similar
variations were reported for both these electrocatalysts
as a function of temperature in the range 40�/115 8C.
Detailed analysis of the electrode kinetic data in this
Fig. 2. Steady-state polarization data from PEM fuel cells as a function of different anode gas feeds, H2 [100 ppm CO]: Pt/C ('), PtRu/C {1:1
atomic ratio} (^) and PtMo/C {5:1 atomic ratio, Pt:Mo} (�/) and H2 [10 ppm CO�/reformate mixture]: Pt/C (m), PtRu/C {1:1 atomic ratio} (k)
and PtMo/C {5:1 atomic ratio, Pt:Mo} ( j ). Data for Pt/C with pure H2 as anode feed is provided for reference (j). PEM operating conditions were
85 8C, 60/50 psig cathode anode backpressure, 100% humidified conditions. The cathode electrode in all cases was 20% Pt/C (0.4 mg cm�2) [ELAT
electrode, from De Nora, ETEK division] with oxygen flow.
R.C. Urian et al. / Journal of Electroanalytical Chemistry 554�/555 (2003) 307�/324 313
previous study [27], including comparison of the activa-
tion energies indicated negligible differences in the
activity for hydrogen oxidation as a consequence of
alloying. Hence the differences in the single cell polar-
ization is almost entirely due to differences in the
electrocatalytic activity for CO oxidation on the differ-
ent electrocatalyst surfaces as shown in the half-cell
polarization data in Fig. 2. Comparison of the single cell
performance as well as the anode polarization profiles
for the three electrocatalysts under conditions of H2 [100
ppm CO]/O2 shows that the PtMo (5:1) maintains
superior CO tolerance as compared to PtRu (1:1),
both of which are significantly higher than Pt/C. This
result is in agreement with those previously reported
based on a similar comparison using PtMo (4:1 atomic
ratio) [21] and more recently [20] with a comparison of
the same three electrocatalysts with the PtMo atomic
ratio being 3:1. A more quantitative picture of the
comparison shown in Fig. 2(a and b) is delineated in
Table 2, where the current densities (after iR correction)
at two different overpotentials (100 and 50 mV) are
listed for the three electrocatalysts, PtRu (1:1), Pt, and
PtMo (5:1). As is evident from the values in Table 2,
PtMo (5:1), exhibits between 3- and 3.5-fold (depending
on the overpotential at which the comparison is made)
enhancement in performance as compared to the current
state of the art electrocatalyst PtRu (1:1). The corre-
sponding enhancement relative to Pt/C is greater than
fourfold.
Also shown in Fig. 2 is a comparison of the
polarization profiles for reformate with the composition
of 45% H2, 10 ppm CO, 15% CO2, 1% CH4 balance N2.
This comparison, both in terms of single cell (Fig. 2(a))
as well as anode polarization (Fig. 2(b)) shows that the
trend in the terms of tolerance to this reformate
composition is the same as those observed earlier with
H2 [100 ppm CO] in the anode feed stream. It is
important to emphasize that in this case the reformate
feed had 10 ppm of CO and 15% (by dry gas volumetric
basis) of CO2. As is evident from the plots, PtMo (5:1)
exhibits significantly better reformate tolerance as
compared to PtRu (1:1) and Pt/C. Further, the differ-
ence in overpotential losses for PtMo (5:1) under both
CO [100 ppm] and reformate feed [10 ppm CO and 15 v/
o CO2] are relatively small as compared to Pt and PtRu(1:1). The choice of reformate composition was to assess
poisoning due to the reverse shift reaction of CO2, and
probe for any additional poisoning effects CO2 could
contribute. As a result the concentration of CO was kept
low at 10 ppm.
This result is in contrast to a recent report, in which a
similar comparison is made between Pt, PtRu (1:1) and
PtMo (3:1) using 25% CO2, balance N2 (dry gascomposition) [20]. Here the overpotential loss, com-
pared at 0.5 A cm�2 due to the presence of CO2 for
PtRu (1:1) was similar to the effect of Pt with H2 [10
ppm of CO]. In contrast, the overpotential loss (at the
same current density) for PtMo (3:1) was significantly
higher, and closer to the effect of Pt with H2 [100 ppm of
CO]. However, the electrocatalysts used in this study
had widely fluctuating roughness factors (electrochemi-cally active surface areas determined from hydrogen
adsorption region of the cyclic voltammograms), be-
tween PtRu and PtMo despite close particle size in terms
of their diffracting domains. Therefore a more detailed
and systematic evaluation is required, where both the
effect of CO tolerance and the reverse shift reaction are
examined in detail for the PtMo electrocatalyst.
3.3. The issue of CO tolerance
A more detailed comparison of the anode polarization
response can be made more appropriately using the
corresponding Tafel response. Such a comparison has
been reported earlier by us with PtMo/C (4:1) alloy
(same source), PtRu/C (1:1) and Pt/C [33]. Detailed
examination of Fig. 2(b) shows that in the absence of
CO, both reactions (2) and (3) are very fast (see Section2), the overall reaction kinetics are described by a very
large exchange current density and a Tafel slope (b)
close to 30 mV dec�1. On the other hand, in the
presence of CO, depending on the extent of CO cover-
age, reaction (2) may become the rate-determining step.
However, at low overpotential or low current densities
the surface coverage of H may be enough to allow
reaction (3) to occur at full speed, which explains thevalues of Tafel slopes of 20�/30 mV dec�1 obtained
experimentally for overpotentials less than 50 mV for all
catalysts. This has been shown previously [33] and is
qualitatively evident from the closeness of the over-
potential values at low current densities (below 100 mA
cm�2). At higher overpotentials, while the rate of
reaction (2) is negligible, the current generation is
controlled by the rate of H adsorption, and a limitingcurrent may be observed in the polarization diagram.
Under these conditions, the hydrogen current originates
only from the oxidation of the M�/H being formed on
Table 2
Electrode kinetic parameters for CO tolerance using H2 [100 ppm CO]/
O2 feed in a 5 cm2 MEA, PEM fuel cell operating at 85 8C, 60/50 psig
cathode, anode backpressure, 100% humidified conditions
Electrocatalyst Current density at 100 mV Current density at 50 mV
j /mA cm�2 j /mA cm�2
Pt/C 115 75
PtRu/C 150 90
PtMo/C 475 325
Current densities at 100 and 50 mV anode overpotential are
compared for Pt/C, PtRu/C (1:1) and PtMo/C (5:1). Atomic composi-
tion is expressed as a percent, Pt:M ratio, where M is the alloying
element.
R.C. Urian et al. / Journal of Electroanalytical Chemistry 554�/555 (2003) 307�/324314
the holes of a compact CO surface monolayer. As
pointed out above, for Pt/C, limiting currents were
clearly seen at 85 8C, 100 ppm CO (Fig. 2(b)). The
appearance of a limiting current is less evident for PtRu/C and not observed for PtMo/C. The absence of limiting
currents can be explained either by a weakening of the
CO adsorption process (reaction (2)) and/or to a
‘cleaning’ of the surface by the CO oxidation step
(reaction (3)). Prior reaction kinetic modeling efforts,
comparing PtRu/C (1:1) and Pt/C, with PtMo/C (4:1)
[33] and PtSn/C (3:1) [34], have shown that CO
oxidation is the most important contributor to thepolarization response in the case of CO tolerance (in
the presence of H2�/CO mixtures). The fact that PtMo/
C (5:1) shows very good CO tolerance implies that the
Mo oxy-hydroxides are very well dispersed on the PtMo
alloy nanocluster surface.
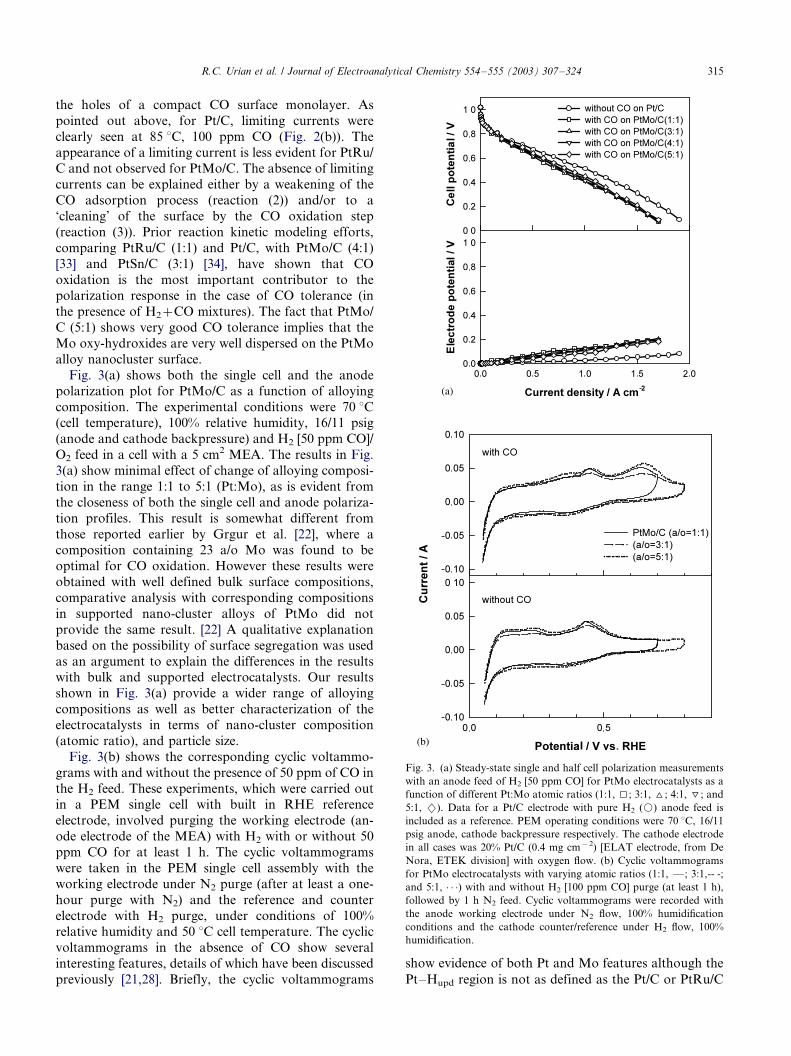
Fig. 3(a) shows both the single cell and the anode
polarization plot for PtMo/C as a function of alloying
composition. The experimental conditions were 70 8C(cell temperature), 100% relative humidity, 16/11 psig
(anode and cathode backpressure) and H2 [50 ppm CO]/
O2 feed in a cell with a 5 cm2 MEA. The results in Fig.
3(a) show minimal effect of change of alloying composi-
tion in the range 1:1 to 5:1 (Pt:Mo), as is evident from
the closeness of both the single cell and anode polariza-
tion profiles. This result is somewhat different from
those reported earlier by Grgur et al. [22], where acomposition containing 23 a/o Mo was found to be
optimal for CO oxidation. However these results were
obtained with well defined bulk surface compositions,
comparative analysis with corresponding compositions
in supported nano-cluster alloys of PtMo did not
provide the same result. [22] A qualitative explanation
based on the possibility of surface segregation was used
as an argument to explain the differences in the resultswith bulk and supported electrocatalysts. Our results
shown in Fig. 3(a) provide a wider range of alloying
compositions as well as better characterization of the
electrocatalysts in terms of nano-cluster composition
(atomic ratio), and particle size.
Fig. 3(b) shows the corresponding cyclic voltammo-
grams with and without the presence of 50 ppm of CO in
the H2 feed. These experiments, which were carried outin a PEM single cell with built in RHE reference
electrode, involved purging the working electrode (an-
ode electrode of the MEA) with H2 with or without 50
ppm CO for at least 1 h. The cyclic voltammograms
were taken in the PEM single cell assembly with the
working electrode under N2 purge (after at least a one-
hour purge with N2) and the reference and counter
electrode with H2 purge, under conditions of 100%relative humidity and 50 8C cell temperature. The cyclic
voltammograms in the absence of CO show several
interesting features, details of which have been discussed
previously [21,28]. Briefly, the cyclic voltammograms
show evidence of both Pt and Mo features although the
Pt�/Hupd region is not as defined as the Pt/C or PtRu/C
Fig. 3. (a) Steady-state single and half cell polarization measurements
with an anode feed of H2 [50 ppm CO] for PtMo electrocatalysts as a
function of different Pt:Mo atomic ratios (1:1, I; 3:1, ^; 4:1, \; and
5:1, 2). Data for a Pt/C electrode with pure H2 (k) anode feed is
included as a reference. PEM operating conditions were 70 8C, 16/11
psig anode, cathode backpressure respectively. The cathode electrode
in all cases was 20% Pt/C (0.4 mg cm�2) [ELAT electrode, from De
Nora, ETEK division] with oxygen flow. (b) Cyclic voltammograms
for PtMo electrocatalysts with varying atomic ratios (1:1, */; 3:1,-- -;
and 5:1, � � �) with and without H2 [100 ppm CO] purge (at least 1 h),
followed by 1 h N2 feed. Cyclic voltammograms were recorded with
the anode working electrode under N2 flow, 100% humidification
conditions and the cathode counter/reference under H2 flow, 100%
humidification.
R.C. Urian et al. / Journal of Electroanalytical Chemistry 554�/555 (2003) 307�/324 315
electrodes. As in the case of the bulk alloy [22], the
voltammogram of PtMo/C in the absence of CO shows
redox behavior in the potential range of 0.43�/0.50 V
versus RHE which can be attributed to Mo. Compar-ison with the Pourbaix diagram for Mo indicates that
this redox behavior is most likely due to a Mo4�l/
Mo6� oxidation state change. A recent report by us
[28], using in situ XANES spectroscopy at the Mo K
edge for these electrocatalysts has shown this oxidation
state change to be Mo5�l/Mo6�. Repeated cycling
between 0.05 and 1.2 V for 50 cycles showed no changes
indicating minimal dissolution of Mo from these elec-trocatalysts. The similarity of anode polarization beha-
vior exhibited by PtMo as a function of variation in
alloy composition indicates that a very small amount of
Mo is required for CO tolerance. The discussion related
to the anode polarization characteristics of Pt, PtRu
(1:1) and PtMo (5:1) shown in Fig. 2(b) implies an
efficient formation of gaps in the compact CO adsorbed
layer enabling sufficient hydrogen oxidation kinetics tooccur and thereby avoiding any limiting behavior. This
invariance with alloying composition in the range 1:1 to
5:1 shows that (a) Mo oxy-hydroxides are very efficient
in electro-oxidation of CO, which as shown in the
subsequent discussions below is initiated at low poten-
tials (close to hydrogen evolution potentials). (b) These
Mo species are well dispersed on the electrocatalyst
surface to enable the formation of gaps in the compactCO adsorbed layer and hence enable hydrogen oxida-
tion. Earlier reports on PtRu show that, in contrast to
PtMo, there is a variation on anode polarization as a
function of alloying composition (atomic ratio), with
PtRu (1:1) being optimal [35].
Experiments with H2 [50 ppm CO] purge for 1 h
followed by a minimum of 1 h of N2 purge under the
same PEM single cell conditions delineated above (Fig.3(b)) indicates that both Pt and Mo are active for the
CO oxidation. CO oxidation is first initiated at lower
potentials by oxygenated species on the Mo surface at
ca. 0.05 V. The second peak at approximately 0.65 V has
been shown to be due to CO oxidation by oxides of Pt.
This has been reported recently by us using both a
comparison with the corresponding voltammogram for
Pt/C as well as with in situ XAS at the Pt edge (see Ref.[28] for details). Prior studies [36] with bulk PtMo (3:1)
in 2% CO in Ar have shown CO oxidation to occur at
potentials as low as 0.05 V vs. RHE at 60 8C. This prior
study suggested that the primary role of Mo was to
create holes in the compact CO adsorbed layer by
initiating its oxidation at such low potentials. The
presence of two distinct peaks is significant, in that it
is in complete contrast to the corresponding voltam-metric response from electrocatalysts such as PtRu/C
and PtSn/C. This indicates a unique role for Mo in these
electrocatalysts because it exhibits a more complex
behavior as compared to predictions based on the
‘bifunctional mechanism’, where the oxides on the
more oxidizable element provide the necessary oxyge-
nated species for the CO oxidation on Pt. It is interesting
to note that the description of features mentioned aboveboth with and without the presence of CO in H2 over the
working electrode, are the same for all the alloying
compositions in the range 1:1 to 5:1. This is important,
since even with a 5:1 composition, there is a sufficient
amount of dispersed Mo on the surface of the electro-
catalyst to provide for the Mo features described above.
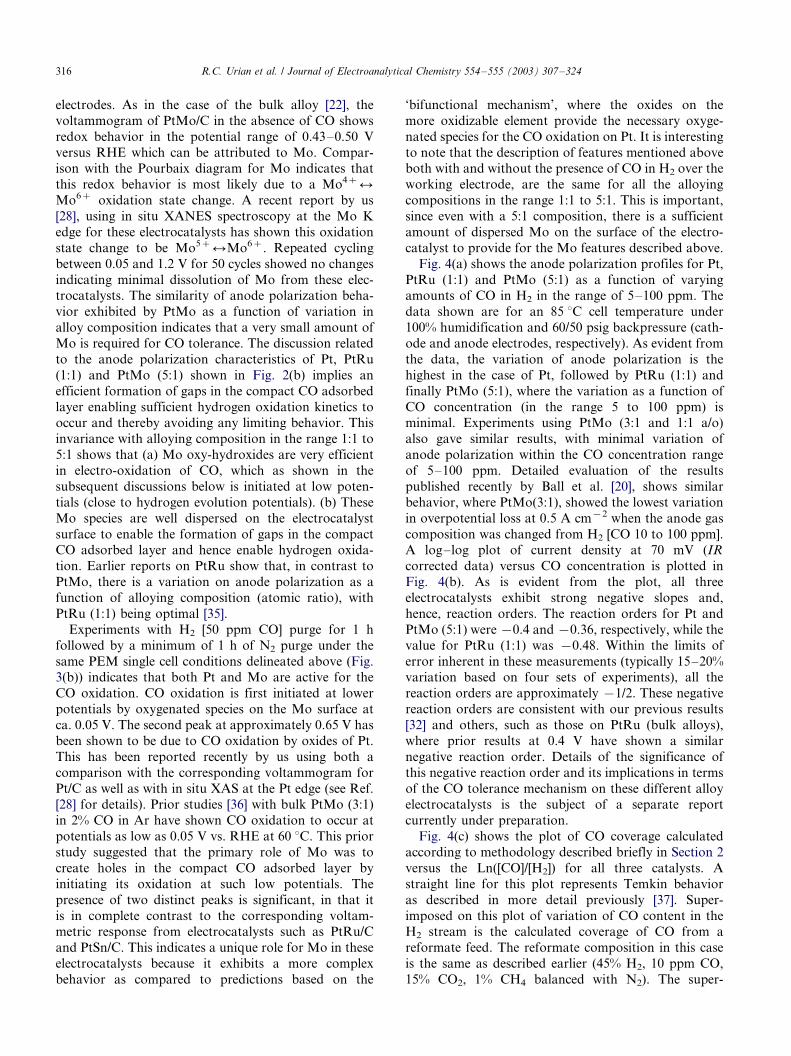
Fig. 4(a) shows the anode polarization profiles for Pt,
PtRu (1:1) and PtMo (5:1) as a function of varyingamounts of CO in H2 in the range of 5�/100 ppm. The
data shown are for an 85 8C cell temperature under
100% humidification and 60/50 psig backpressure (cath-
ode and anode electrodes, respectively). As evident from
the data, the variation of anode polarization is the
highest in the case of Pt, followed by PtRu (1:1) and
finally PtMo (5:1), where the variation as a function of
CO concentration (in the range 5 to 100 ppm) isminimal. Experiments using PtMo (3:1 and 1:1 a/o)
also gave similar results, with minimal variation of
anode polarization within the CO concentration range
of 5�/100 ppm. Detailed evaluation of the results
published recently by Ball et al. [20], shows similar
behavior, where PtMo(3:1), showed the lowest variation
in overpotential loss at 0.5 A cm�2 when the anode gas
composition was changed from H2 [CO 10 to 100 ppm].A log�/log plot of current density at 70 mV (IR
corrected data) versus CO concentration is plotted in
Fig. 4(b). As is evident from the plot, all three
electrocatalysts exhibit strong negative slopes and,
hence, reaction orders. The reaction orders for Pt and
PtMo (5:1) were �/0.4 and �/0.36, respectively, while the
value for PtRu (1:1) was �/0.48. Within the limits of
error inherent in these measurements (typically 15�/20%variation based on four sets of experiments), all the
reaction orders are approximately �/1/2. These negative
reaction orders are consistent with our previous results
[32] and others, such as those on PtRu (bulk alloys),
where prior results at 0.4 V have shown a similar
negative reaction order. Details of the significance of
this negative reaction order and its implications in terms
of the CO tolerance mechanism on these different alloyelectrocatalysts is the subject of a separate report
currently under preparation.
Fig. 4(c) shows the plot of CO coverage calculated
according to methodology described briefly in Section 2
versus the Ln([CO]/[H2]) for all three catalysts. A
straight line for this plot represents Temkin behavior
as described in more detail previously [37]. Super-
imposed on this plot of variation of CO content in theH2 stream is the calculated coverage of CO from a
reformate feed. The reformate composition in this case
is the same as described earlier (45% H2, 10 ppm CO,
15% CO2, 1% CH4 balanced with N2). The super-
R.C. Urian et al. / Journal of Electroanalytical Chemistry 554�/555 (2003) 307�/324316
imposed value based on the CO content of 10 ppm in the
reformate (Ln [CO]/[H2]) shows additional coverage due
to the presence of CO2. This is represented as a positive
shift in the CO coverage above the isotherm of each of
the electrocatalysts. This clearly demonstrates that CO2
has an additive poisoning effect. The next section
Fig. 4. (a) Steady-state anode polarization for Pt/C, PtRu (1:1, atomic ratio) and PtMo/C (5;1 atomic ratio, Pt:Mo) as a function of different CO
content in the H2 feed. H2 [5 ppm CO, (k); 20 ppm CO, (I); 50 ppm CO (^) and 100 ppm CO (2)]. (b) Log�/log plot of CO concentration and
current density at 70 mV for Pt, PtRu (1:1) and PtMo (5:1) and (c) Plot of Ln [CO]/[H2] vs. CO coverage (u ) for Pt/C (I), PtRu (1:1, atomic ratio,
^) and PtMo/C (5;1 atomic ratio, Pt:Mo, k). Coverage data is also plotted for 10 ppm CO�/reformate mixture (corresponding filled symbols). PEM
operating conditions for these tests were 85 8C, 60/50 cathode, anode backpressure, 100% humidification condition, with O2 as the cathode gas feed.
The cathode electrode in all cases was 20% Pt/C (0.4 mg cm�2) [ELAT electrode, from De Nora, ETEK division].
R.C. Urian et al. / Journal of Electroanalytical Chemistry 554�/555 (2003) 307�/324 317
examines in more detail this additional poisoning due to
the reverse shift reaction and its implication on PtRu
and PtMo alloy electrocatalysts.
3.4. Effect of CO2 in reformate feed
3.4.1. Results of dynamic tests using cyclic voltammetry
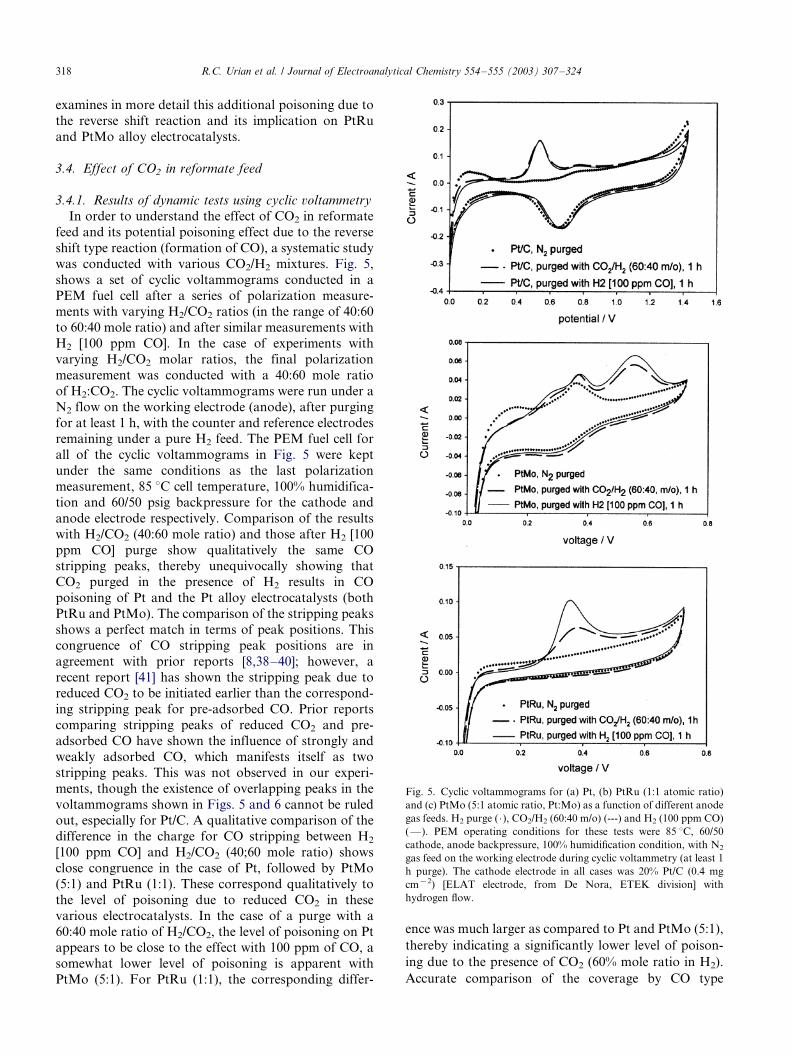
In order to understand the effect of CO2 in reformate
feed and its potential poisoning effect due to the reverse
shift type reaction (formation of CO), a systematic study
was conducted with various CO2/H2 mixtures. Fig. 5,
shows a set of cyclic voltammograms conducted in a
PEM fuel cell after a series of polarization measure-ments with varying H2/CO2 ratios (in the range of 40:60
to 60:40 mole ratio) and after similar measurements with
H2 [100 ppm CO]. In the case of experiments with
varying H2/CO2 molar ratios, the final polarization
measurement was conducted with a 40:60 mole ratio
of H2:CO2. The cyclic voltammograms were run under a
N2 flow on the working electrode (anode), after purging
for at least 1 h, with the counter and reference electrodesremaining under a pure H2 feed. The PEM fuel cell for
all of the cyclic voltammograms in Fig. 5 were kept
under the same conditions as the last polarization
measurement, 85 8C cell temperature, 100% humidifica-
tion and 60/50 psig backpressure for the cathode and
anode electrode respectively. Comparison of the results
with H2/CO2 (40:60 mole ratio) and those after H2 [100
ppm CO] purge show qualitatively the same COstripping peaks, thereby unequivocally showing that
CO2 purged in the presence of H2 results in CO
poisoning of Pt and the Pt alloy electrocatalysts (both
PtRu and PtMo). The comparison of the stripping peaks
shows a perfect match in terms of peak positions. This
congruence of CO stripping peak positions are in
agreement with prior reports [8,38�/40]; however, a
recent report [41] has shown the stripping peak due toreduced CO2 to be initiated earlier than the correspond-
ing stripping peak for pre-adsorbed CO. Prior reports
comparing stripping peaks of reduced CO2 and pre-
adsorbed CO have shown the influence of strongly and
weakly adsorbed CO, which manifests itself as two
stripping peaks. This was not observed in our experi-
ments, though the existence of overlapping peaks in the
voltammograms shown in Figs. 5 and 6 cannot be ruledout, especially for Pt/C. A qualitative comparison of the
difference in the charge for CO stripping between H2
[100 ppm CO] and H2/CO2 (40;60 mole ratio) shows
close congruence in the case of Pt, followed by PtMo
(5:1) and PtRu (1:1). These correspond qualitatively to
the level of poisoning due to reduced CO2 in these
various electrocatalysts. In the case of a purge with a
60:40 mole ratio of H2/CO2, the level of poisoning on Ptappears to be close to the effect with 100 ppm of CO, a
somewhat lower level of poisoning is apparent with
PtMo (5:1). For PtRu (1:1), the corresponding differ-
ence was much larger as compared to Pt and PtMo (5:1),
thereby indicating a significantly lower level of poison-
ing due to the presence of CO2 (60% mole ratio in H2).
Accurate comparison of the coverage by CO type
Fig. 5. Cyclic voltammograms for (a) Pt, (b) PtRu (1:1 atomic ratio)
and (c) PtMo (5:1 atomic ratio, Pt:Mo) as a function of different anode
gas feeds. H2 purge ( �/), CO2/H2 (60:40 m/o) (---) and H2 (100 ppm CO)
(*/). PEM operating conditions for these tests were 85 8C, 60/50
cathode, anode backpressure, 100% humidification condition, with N2
gas feed on the working electrode during cyclic voltammetry (at least 1
h purge). The cathode electrode in all cases was 20% Pt/C (0.4 mg
cm�2) [ELAT electrode, from De Nora, ETEK division] with
hydrogen flow.
R.C. Urian et al. / Journal of Electroanalytical Chemistry 554�/555 (2003) 307�/324318
species as a result of a CO2/H2 purge is difficult due to
the dynamic conditions of cyclic voltammetry, which
does not offer adequate correction for contributions due
to diffusion and interfacial capacitance in a typical PEM
gas diffusion electrode configuration. In a qualitative
sense, these results are in agreement with a recently
published report [41], where a comparison was made
between the extent of coverage between Pt/C and PtRu/
C (from ETEK div., of De Nora). In this prior study [41]
the relative peak height contribution of cyclic voltam-
mograms showed a value of ureduced CO2of 0.78, for Pt/
C, compared to 0.15 for PtRu/C. This study also pointed
out some of the difficulties in using cyclic voltammetry
as a tool for determining surface coverage. Here the
quantitative charges for surface desorption are more
ambiguous. Use of such analysis for PtMo/C is more
difficult due to the presence of an oxidative peak at �/
0.45 V versus RHE [28]. As reported previously [28], this
is part of a redox couple involving Mo�5l/Mo�6.
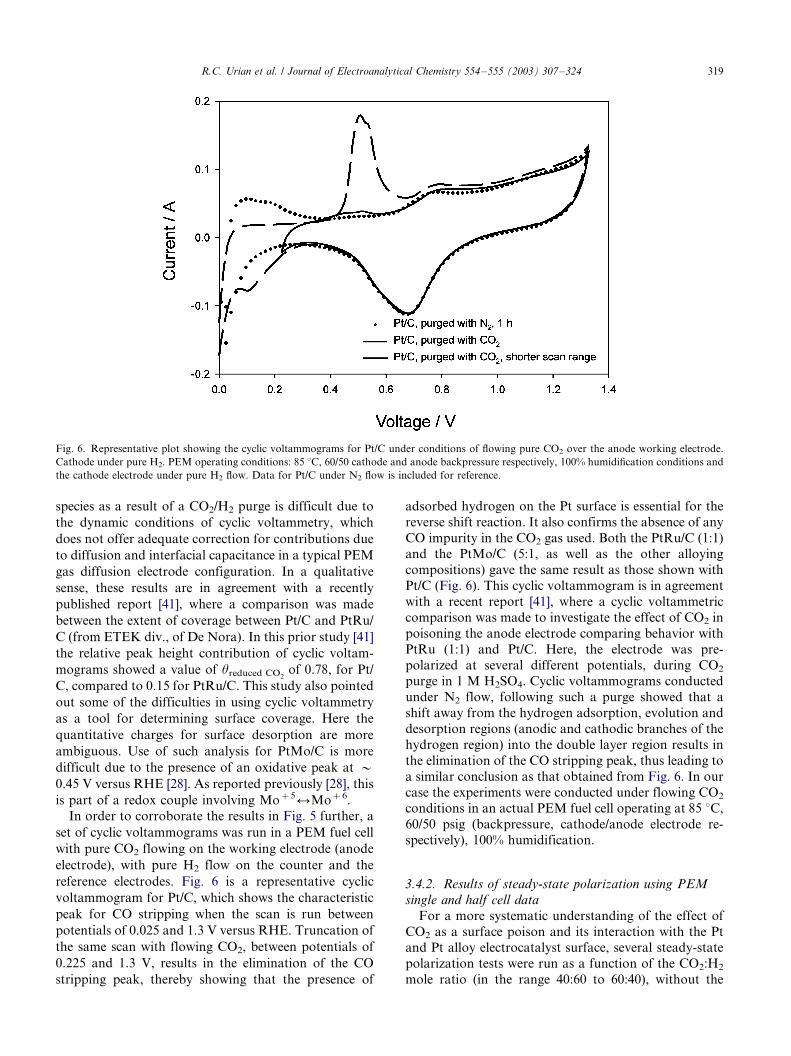
In order to corroborate the results in Fig. 5 further, a
set of cyclic voltammograms was run in a PEM fuel cell
with pure CO2 flowing on the working electrode (anode
electrode), with pure H2 flow on the counter and the
reference electrodes. Fig. 6 is a representative cyclic
voltammogram for Pt/C, which shows the characteristic
peak for CO stripping when the scan is run between
potentials of 0.025 and 1.3 V versus RHE. Truncation of
the same scan with flowing CO2, between potentials of
0.225 and 1.3 V, results in the elimination of the CO
stripping peak, thereby showing that the presence of
adsorbed hydrogen on the Pt surface is essential for the
reverse shift reaction. It also confirms the absence of any
CO impurity in the CO2 gas used. Both the PtRu/C (1:1)and the PtMo/C (5:1, as well as the other alloying
compositions) gave the same result as those shown with
Pt/C (Fig. 6). This cyclic voltammogram is in agreement
with a recent report [41], where a cyclic voltammetric
comparison was made to investigate the effect of CO2 in
poisoning the anode electrode comparing behavior with
PtRu (1:1) and Pt/C. Here, the electrode was pre-
polarized at several different potentials, during CO2
purge in 1 M H2SO4. Cyclic voltammograms conducted
under N2 flow, following such a purge showed that a
shift away from the hydrogen adsorption, evolution and
desorption regions (anodic and cathodic branches of the
hydrogen region) into the double layer region results in
the elimination of the CO stripping peak, thus leading to
a similar conclusion as that obtained from Fig. 6. In our
case the experiments were conducted under flowing CO2
conditions in an actual PEM fuel cell operating at 85 8C,
60/50 psig (backpressure, cathode/anode electrode re-
spectively), 100% humidification.
3.4.2. Results of steady-state polarization using PEM
single and half cell data
For a more systematic understanding of the effect of
CO2 as a surface poison and its interaction with the Ptand Pt alloy electrocatalyst surface, several steady-state
polarization tests were run as a function of the CO2:H2
mole ratio (in the range 40:60 to 60:40), without the
Fig. 6. Representative plot showing the cyclic voltammograms for Pt/C under conditions of flowing pure CO2 over the anode working electrode.
Cathode under pure H2. PEM operating conditions: 85 8C, 60/50 cathode and anode backpressure respectively, 100% humidification conditions and
the cathode electrode under pure H2 flow. Data for Pt/C under N2 flow is included for reference.
R.C. Urian et al. / Journal of Electroanalytical Chemistry 554�/555 (2003) 307�/324 319
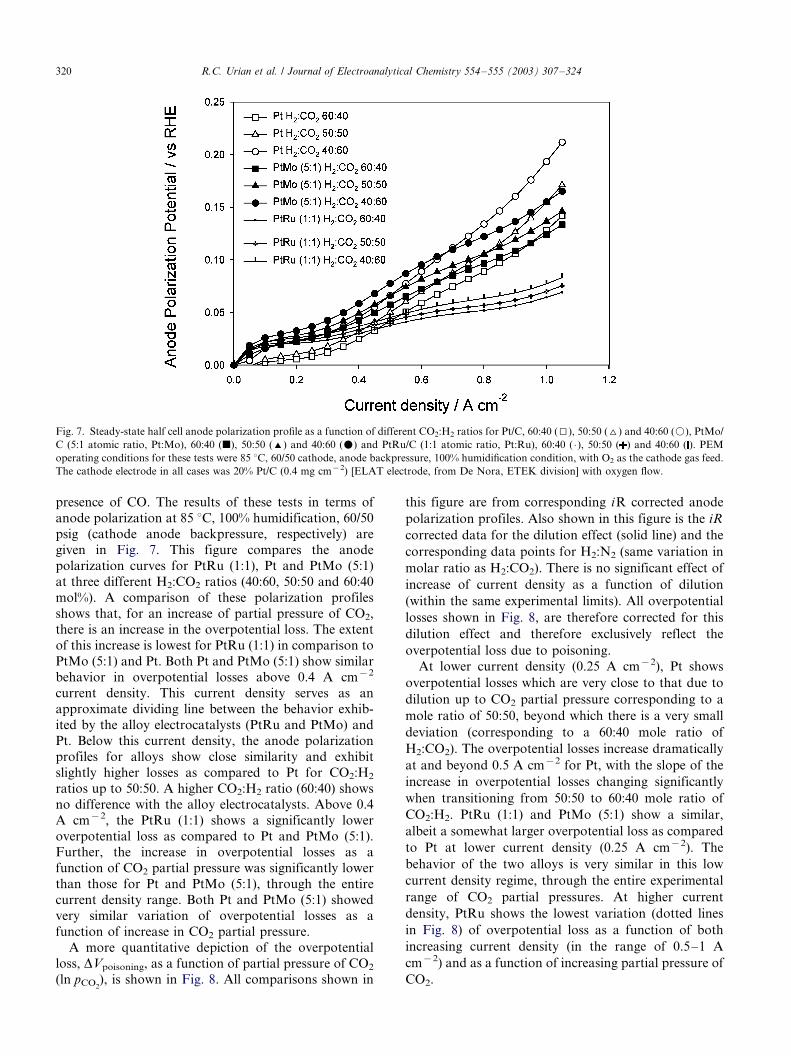
presence of CO. The results of these tests in terms of
anode polarization at 85 8C, 100% humidification, 60/50
psig (cathode anode backpressure, respectively) are
given in Fig. 7. This figure compares the anode
polarization curves for PtRu (1:1), Pt and PtMo (5:1)
at three different H2:CO2 ratios (40:60, 50:50 and 60:40
mol%). A comparison of these polarization profiles
shows that, for an increase of partial pressure of CO2,
there is an increase in the overpotential loss. The extent
of this increase is lowest for PtRu (1:1) in comparison to
PtMo (5:1) and Pt. Both Pt and PtMo (5:1) show similar
behavior in overpotential losses above 0.4 A cm�2
current density. This current density serves as an
approximate dividing line between the behavior exhib-
ited by the alloy electrocatalysts (PtRu and PtMo) and
Pt. Below this current density, the anode polarization
profiles for alloys show close similarity and exhibit
slightly higher losses as compared to Pt for CO2:H2
ratios up to 50:50. A higher CO2:H2 ratio (60:40) shows
no difference with the alloy electrocatalysts. Above 0.4
A cm�2, the PtRu (1:1) shows a significantly lower
overpotential loss as compared to Pt and PtMo (5:1).Further, the increase in overpotential losses as a
function of CO2 partial pressure was significantly lower
than those for Pt and PtMo (5:1), through the entire
current density range. Both Pt and PtMo (5:1) showed
very similar variation of overpotential losses as a
function of increase in CO2 partial pressure.
A more quantitative depiction of the overpotential
loss, DVpoisoning, as a function of partial pressure of CO2
(ln pCO2), is shown in Fig. 8. All comparisons shown in
this figure are from corresponding iR corrected anode
polarization profiles. Also shown in this figure is the iR
corrected data for the dilution effect (solid line) and the
corresponding data points for H2:N2 (same variation in
molar ratio as H2:CO2). There is no significant effect of
increase of current density as a function of dilution
(within the same experimental limits). All overpotential
losses shown in Fig. 8, are therefore corrected for this
dilution effect and therefore exclusively reflect the
overpotential loss due to poisoning.
At lower current density (0.25 A cm�2), Pt shows
overpotential losses which are very close to that due to
dilution up to CO2 partial pressure corresponding to a
mole ratio of 50:50, beyond which there is a very small
deviation (corresponding to a 60:40 mole ratio of
H2:CO2). The overpotential losses increase dramatically
at and beyond 0.5 A cm�2 for Pt, with the slope of the
increase in overpotential losses changing significantly
when transitioning from 50:50 to 60:40 mole ratio of
CO2:H2. PtRu (1:1) and PtMo (5:1) show a similar,
albeit a somewhat larger overpotential loss as compared
to Pt at lower current density (0.25 A cm�2). The
behavior of the two alloys is very similar in this low
current density regime, through the entire experimental
range of CO2 partial pressures. At higher current
density, PtRu shows the lowest variation (dotted lines
in Fig. 8) of overpotential loss as a function of both
increasing current density (in the range of 0.5�/1 A
cm�2) and as a function of increasing partial pressure of
CO2.
Fig. 7. Steady-state half cell anode polarization profile as a function of different CO2:H2 ratios for Pt/C, 60:40 (I), 50:50 (^) and 40:60 (k), PtMo/
C (5:1 atomic ratio, Pt:Mo), 60:40 (j), 50:50 (') and 40:60 (m) and PtRu/C (1:1 atomic ratio, Pt:Ru), 60:40 ( �/), 50:50 ( ) and 40:60 ( ). PEM
operating conditions for these tests were 85 8C, 60/50 cathode, anode backpressure, 100% humidification condition, with O2 as the cathode gas feed.
The cathode electrode in all cases was 20% Pt/C (0.4 mg cm�2) [ELAT electrode, from De Nora, ETEK division] with oxygen flow.
R.C. Urian et al. / Journal of Electroanalytical Chemistry 554�/555 (2003) 307�/324320
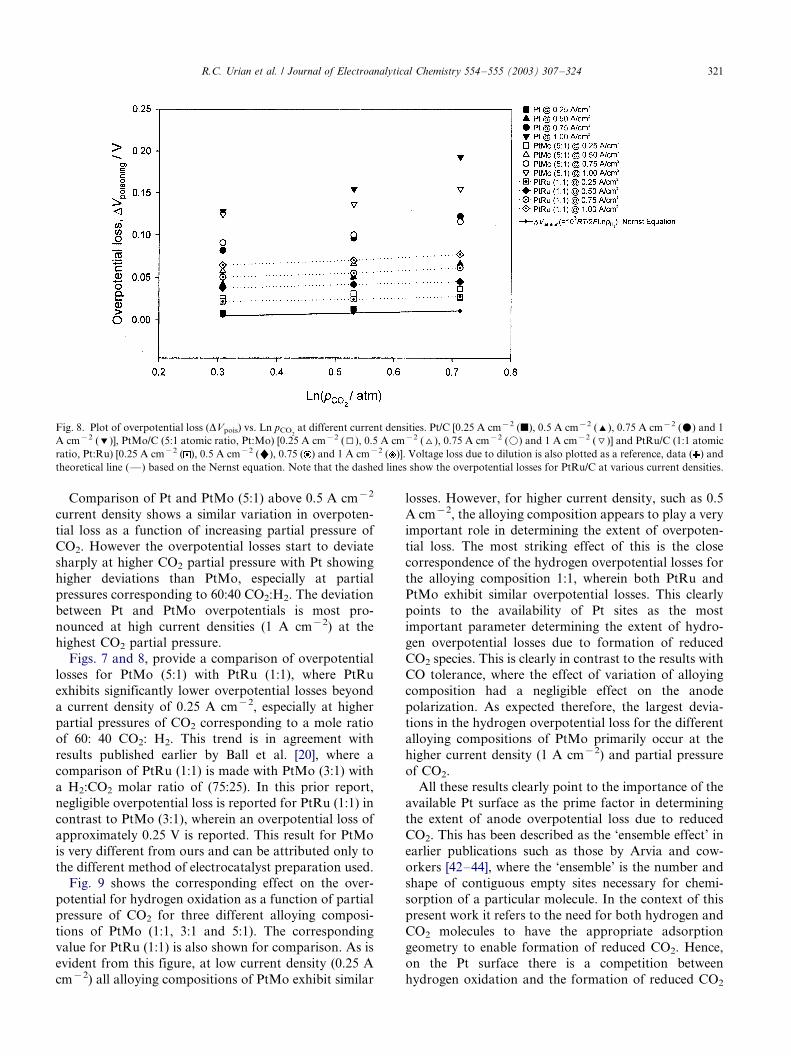
Comparison of Pt and PtMo (5:1) above 0.5 A cm�2
current density shows a similar variation in overpoten-
tial loss as a function of increasing partial pressure of
CO2. However the overpotential losses start to deviate
sharply at higher CO2 partial pressure with Pt showing
higher deviations than PtMo, especially at partial
pressures corresponding to 60:40 CO2:H2. The deviation
between Pt and PtMo overpotentials is most pro-
nounced at high current densities (1 A cm�2) at the
highest CO2 partial pressure.
Figs. 7 and 8, provide a comparison of overpotential
losses for PtMo (5:1) with PtRu (1:1), where PtRu
exhibits significantly lower overpotential losses beyond
a current density of 0.25 A cm�2, especially at higher
partial pressures of CO2 corresponding to a mole ratio
of 60: 40 CO2: H2. This trend is in agreement with
results published earlier by Ball et al. [20], where a
comparison of PtRu (1:1) is made with PtMo (3:1) with
a H2:CO2 molar ratio of (75:25). In this prior report,
negligible overpotential loss is reported for PtRu (1:1) in
contrast to PtMo (3:1), wherein an overpotential loss of
approximately 0.25 V is reported. This result for PtMo
is very different from ours and can be attributed only to
the different method of electrocatalyst preparation used.
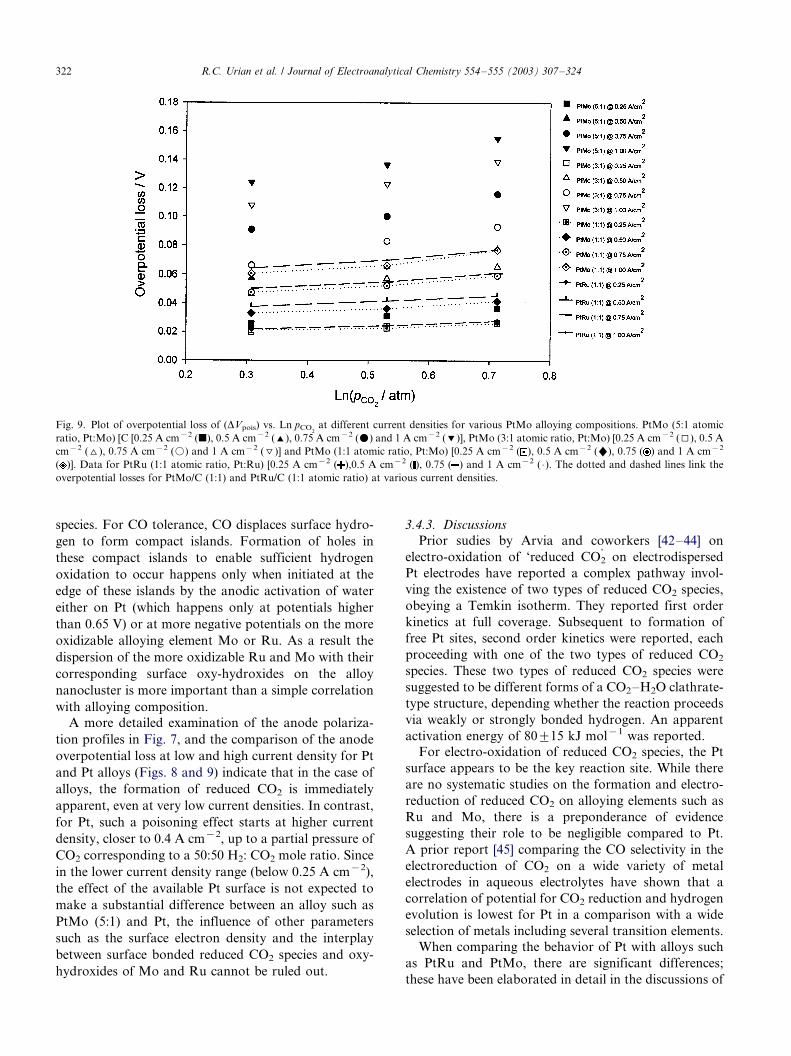
Fig. 9 shows the corresponding effect on the over-
potential for hydrogen oxidation as a function of partial
pressure of CO2 for three different alloying composi-
tions of PtMo (1:1, 3:1 and 5:1). The corresponding
value for PtRu (1:1) is also shown for comparison. As is
evident from this figure, at low current density (0.25 A
cm�2) all alloying compositions of PtMo exhibit similar
losses. However, for higher current density, such as 0.5
A cm�2, the alloying composition appears to play a very
important role in determining the extent of overpoten-
tial loss. The most striking effect of this is the close
correspondence of the hydrogen overpotential losses for
the alloying composition 1:1, wherein both PtRu and
PtMo exhibit similar overpotential losses. This clearly
points to the availability of Pt sites as the most
important parameter determining the extent of hydro-
gen overpotential losses due to formation of reduced
CO2 species. This is clearly in contrast to the results with
CO tolerance, where the effect of variation of alloying
composition had a negligible effect on the anode
polarization. As expected therefore, the largest devia-
tions in the hydrogen overpotential loss for the different
alloying compositions of PtMo primarily occur at the
higher current density (1 A cm�2) and partial pressure
of CO2.
All these results clearly point to the importance of the
available Pt surface as the prime factor in determining
the extent of anode overpotential loss due to reduced
CO2. This has been described as the ‘ensemble effect’ in
earlier publications such as those by Arvia and cow-
orkers [42�/44], where the ‘ensemble’ is the number and
shape of contiguous empty sites necessary for chemi-
sorption of a particular molecule. In the context of this
present work it refers to the need for both hydrogen and
CO2 molecules to have the appropriate adsorption
geometry to enable formation of reduced CO2. Hence,
on the Pt surface there is a competition between
hydrogen oxidation and the formation of reduced CO2
Fig. 8. Plot of overpotential loss (DVpois) vs. Ln pCO2
at different current densities. Pt/C [0.25 A cm�2 (j), 0.5 A cm�2 ('), 0.75 A cm�2 (m) and 1
A cm�2 (%)], PtMo/C (5:1 atomic ratio, Pt:Mo) [0.25 A cm�2 (I), 0.5 A cm�2 (^), 0.75 A cm�2 (k) and 1 A cm�2 (\)] and PtRu/C (1:1 atomic
ratio, Pt:Ru) [0.25 A cm�2 ( ), 0.5 A cm�2 ("), 0.75 ( ) and 1 A cm�2 ( )]. Voltage loss due to dilution is also plotted as a reference, data ( ) and
theoretical line (*/) based on the Nernst equation. Note that the dashed lines show the overpotential losses for PtRu/C at various current densities.
R.C. Urian et al. / Journal of Electroanalytical Chemistry 554�/555 (2003) 307�/324 321
species. For CO tolerance, CO displaces surface hydro-
gen to form compact islands. Formation of holes in
these compact islands to enable sufficient hydrogen
oxidation to occur happens only when initiated at the
edge of these islands by the anodic activation of water
either on Pt (which happens only at potentials higher
than 0.65 V) or at more negative potentials on the more
oxidizable alloying element Mo or Ru. As a result the
dispersion of the more oxidizable Ru and Mo with their
corresponding surface oxy-hydroxides on the alloy
nanocluster is more important than a simple correlation
with alloying composition.
A more detailed examination of the anode polariza-
tion profiles in Fig. 7, and the comparison of the anode
overpotential loss at low and high current density for Pt
and Pt alloys (Figs. 8 and 9) indicate that in the case of
alloys, the formation of reduced CO2 is immediately
apparent, even at very low current densities. In contrast,
for Pt, such a poisoning effect starts at higher current
density, closer to 0.4 A cm�2, up to a partial pressure of
CO2 corresponding to a 50:50 H2: CO2 mole ratio. Since
in the lower current density range (below 0.25 A cm�2),
the effect of the available Pt surface is not expected to
make a substantial difference between an alloy such as
PtMo (5:1) and Pt, the influence of other parameters
such as the surface electron density and the interplay
between surface bonded reduced CO2 species and oxy-
hydroxides of Mo and Ru cannot be ruled out.
3.4.3. Discussions
Prior sudies by Arvia and coworkers [42�/44] on
electro-oxidation of ‘reduced CO2’ on electrodispersed
Pt electrodes have reported a complex pathway invol-
ving the existence of two types of reduced CO2 species,
obeying a Temkin isotherm. They reported first order
kinetics at full coverage. Subsequent to formation of
free Pt sites, second order kinetics were reported, each
proceeding with one of the two types of reduced CO2
species. These two types of reduced CO2 species were
suggested to be different forms of a CO2�/H2O clathrate-
type structure, depending whether the reaction proceeds
via weakly or strongly bonded hydrogen. An apparent
activation energy of 809/15 kJ mol�1 was reported.For electro-oxidation of reduced CO2 species, the Pt
surface appears to be the key reaction site. While there
are no systematic studies on the formation and electro-
reduction of reduced CO2 on alloying elements such as
Ru and Mo, there is a preponderance of evidence
suggesting their role to be negligible compared to Pt.
A prior report [45] comparing the CO selectivity in the
electroreduction of CO2 on a wide variety of metal
electrodes in aqueous electrolytes have shown that a
correlation of potential for CO2 reduction and hydrogen
evolution is lowest for Pt in a comparison with a wide
selection of metals including several transition elements.
When comparing the behavior of Pt with alloys such
as PtRu and PtMo, there are significant differences;
these have been elaborated in detail in the discussions of
Fig. 9. Plot of overpotential loss of (DVpois) vs. Ln pCO2
at different current densities for various PtMo alloying compositions. PtMo (5:1 atomic
ratio, Pt:Mo) [C [0.25 A cm�2 (j), 0.5 A cm�2 ('), 0.75 A cm�2 (m) and 1 A cm�2 (%)], PtMo (3:1 atomic ratio, Pt:Mo) [0.25 A cm�2 (I), 0.5 A
cm�2 (^), 0.75 A cm�2 (k) and 1 A cm�2 (\)] and PtMo (1:1 atomic ratio, Pt:Mo) [0.25 A cm�2 ( ), 0.5 A cm�2 ("), 0.75 ( ) and 1 A cm�2
( )]. Data for PtRu (1:1 atomic ratio, Pt:Ru) [0.25 A cm�2 ( ),0.5 A cm�2 ( ), 0.75 ( ) and 1 A cm�2 ( �/). The dotted and dashed lines link the
overpotential losses for PtMo/C (1:1) and PtRu/C (1:1 atomic ratio) at various current densities.
R.C. Urian et al. / Journal of Electroanalytical Chemistry 554�/555 (2003) 307�/324322
Figs. 8 and 9. As mentioned above, factors related to the
different surface electron density of Pt in the alloy versus
unalloyed Pt as well as the interaction of the reduced
CO2 species with the oxy-hydroxides of the alloyingelement cannot be ruled out. A prior report [46] on
electro-oxidation of reduced CO2 on series of Pt single
crystal electrodes strongly support the argument for the
difference arising as a result of variation in surface
electron density. In this report, a series of single crystal
surfaces with various degree of step sites on (111) and
(100) surfaces was studied. The activity was directly
related to the degree of roughness brought about byintroduction of steps and the electrocatalytic activity for
CO2 reduction was directly related to the step atom
density. This study suggests that the higher degree of
imbalance in the surface electron density (lower d-band
vacancy or work function) at the lower coordination
step sites enhances the CO2 electroreduction. A prior
report [45] shows that there are three primary modes of
CO2 interaction with the transition elements. In allthese, bonding occurs via electron transfer from CO2 to
unoccupied metal orbitals (donation) and backbonding
from occupied metal orbitals to the lowest unfilled
orbital of CO2. Most of the prior molecular orbital
studies on these types of systems (see Ref. [45] for a
review) show that the coordinate bond is mostly
stabilized by back-donation from d-orbitals of the metal
atom to the anti-bonding p* orbital of CO2 rather thanby donation from CO2 to the metal orbitals. Among the
most favored coordination geometry is the C-coordina-
tion [45], wherein the extra negative charge on the
oxygen atom facilitates the protonation to the coordi-
nated CO2. Interaction with surface adsorbed hydrogen
atoms therefore has the potential for producing a wide
variety of species including clathrate compounds. The
choice of coordination, such as C-coordination has thepotential of exhibiting strong dependence on the surface
electronic properties of Pt. Prior studies using in situ X-
ray absorption spectroscopy have shown very different
Pt d-orbital vacancies for PtRu as compared to Pt and a
more systematic study of this parameter and the
interaction of the oxy-hydroxide species in the electro-
oxidation of the reduced CO2 species is the subject of the
second part of this publication.
4. Conclusions
This paper forms the first of a series, examining the
anode overpotential loss for PtMo electrocatalysts in the
presence of different reformate compositions. The focus
here is to understand the overall overpotential loss
under typical PEM fuel cell operating conditions inthe context of varying amounts of CO2 in the reformate
feed. A series of PtMo electrocatalysts have been
evaluated with systematic variation of the Pt:Mo atomic
ratio (in the range 1:1 to 5:1). For a better insight into
the anode polarization losses, both CO and CO2
poisoning effects have been examined systematically.
This has been presented in the context of both PtRu(1:1) (a current state of the art reformate tolerant
electrocatalyst) and Pt.
Evaluation of anode polarization in the context of CO
tolerance [H2 (100 ppm CO)] using varying Pt: Mo
atomic ratios (in the range of 1:1 to 5:1) show negligible
effects. PtMo exhibits greater than threefold enhance-
ment in CO tolerance as compared to PtRu (1:1) and
greater than fourfold enhancement relative to Pt. This isbased on current densities at two different overpoten-
tials (50 and 100 mV). The effect of variation of CO
content in H2 (in the range 5 to 100 ppm) also shows the
lowest variation in overpotential losses for PtMo
electrocatalyst (5:1) followed by PtRu (1:1) and Pt.
Correlation of these results on PtMo with the corre-
sponding cyclic voltammetry shows that unlike PtRu,
the oxidation of CO on Pt starts at very low potentialson PtMo, thus creating enough holes in the compact CO
adlayers to allow efficient oxidation of hydrogen to
proceed. The insensitivity of the anode polarization
losses with respect to both alloying compositions and
the variations of CO content in H2, shows that the Mo
oxy-hydroxides are well dispersed on the PtMo na-
noclusters. Subsequently, these act as efficient reaction
centers for water activation and hence initiation of holesin the compact CO adsorbed layers.
Comparison of the anode polarization profiles (and
corresponding overpotential losses) for PtMo (5:1),
PtRu (1:1) and Pt as a function of pCO2shows that
above 0.5 A cm�2 current density, Pt and PtMo (5:1)
exhibit comparatively closer characteristics in contrast
to PtRu (1:1). For PtRu (1:1), results above 0.5 A cm�2,
show significantly smaller variation in overpotentiallosses both in terms of increasing current density and
pCO2. Below 0.5 A cm�2, Pt showed lower overpotential
losses as compared to the alloys (both PtRu and PtMo),
especially when making this comparison below pCO2
corresponding to a 60:40 CO2: H2 mole ratio. Lowering
of the overpotential loss for Pt compared to Pt alloys at
current densities lower than 0.5 A cm�2 has been
ascribed to differences inherent to the Pt surface, mostlikely due to surface electron density. This is the subject
of a more detailed investigation in Part II of this report.
Correlation of the overpotential losses as a function
of Pt: Mo atomic ratio shows marked differences based
on the available Pt surface relative to Mo. An increase in
the Pt: Mo atomic ratio results in progressively larger
losses in anodic overpotential with 5:1 Pt: Mo ratio
showing characteristics close to unalloyed Pt. Compar-ison of PtMo and PtRu with a nominal 1:1 atomic ratio
show remarkably close values for overpotential losses.
As expected the results for the 3:1 Pt: Mo atomic ratio
fall in between those of 1:1 and 5:1. These results,
R.C. Urian et al. / Journal of Electroanalytical Chemistry 554�/555 (2003) 307�/324 323
however, are true for current densities above 0.5 A
cm�2. Below this current density, Pt exhibits better
polarization characteristics as discussed in the previous
section. These results show that CO2 and CO toleranceon PtMo follow very different characteristics. Unlike the
formation of compact adlayers of CO on the surface,
interaction of CO2 with the surface primarily involves an
interaction with adsorbed hydrogen on the surface
resulting in possible CO2�/H2O-clathrate type structures.
The need for interaction with surface adsorbed hydro-
gen to form the reduced CO2 species results in very
different surface requirements, wherein, as is evidentfrom the results of this investigation, the availability of
the Pt surface is key. Higher levels of available Pt
surface result in greater overpotential loss. In terms of
differences with PtRu, the results indicate a very close
similarity with PtMo when comparing overpotential
losses due to variations in partial pressure of CO2 for
the 1:1 atomic ratio.
Acknowledgements
The authors gratefully acknowledge a grant and
materials support from De Nora N.A., E-TEK division,
Somerset, NJ. The US Department of Education for
graduate assistant support through the GAANN fellow-
ship program is gratefully acknowledged as well as
Northeastern University for providing the start-up grantand the necessary infrastructure support.
References
[1] S.G. Chalk, J.F. Miller, F.W. Wagner, J. Power Sources 86 (2000)
40.
[2] H.P. Dhar, L.G. Christner, A.K. Kush, H.C. Maru, J. Electro-
chem. Soc. 133 (1986) 1574.
[3] J. Giner, Electrochim. Acta 8 (1963) 857.
[4] J. Giner, Electrochim. Acta 9 (1964) 63.
[5] S.B. Brummer, K. Cahill, J. Electroanal. Chem. 21 (1969) 463.
[6] V.N. Kamath, H. Lal, J. Electroanal. Chem. 19 (1968) 137.
[7] P. Stonehart, Electrochim. Acta 18 (1973) 63.
[8] J. Sobkowski, A. Czerwinski, J. Phys. Chem. 89 (1985) 365.
[9] B. Beden, A. Bewick, C. Lamy, J. Electroanal. Chem. 148 (1983)
147.
[10] B. Beden, C. Lamy, J. Electroanal. Chem. 148 (1983) 147.
[11] C. Lamy, J.M. Leger, J. Clavilier, R. Parsons, J. Electroanal.
Chem. 150 (1983) 71.
[12] J. Sobkowski, A. Czerwinski, J. Electroanal. Chem. 55 (1974) 391.
[13] J. Sobkowski, A. Czerwinski, J. Electroanal. Chem. 65 (1975) 327.
[14] A. Czerwinski, J. Sobkowski, J. Electroanal. Chem. 59 (1975) 41.
[15] M. Wilson, C. Derouin, J. Valerio, S. Gottesfeld, Proc. Intersoc.
Energy Convers. Eng. Conf. 1 (1993) 1203.
[16] S. Swathirajan, Fuel Cell Seminar Extended Abstracts, 1994, p.
204.
[17] S. Kocha, A. Gaskins, P. Plasse, D. Wheeler, Proc. Am. Chem.
Soc. 44 (1999) 972.
[18] A.G. Gunner, T.I. Hyde, R.J. Potter, D. Thompsett, US Patent
5,939,220 (1999).
[19] S.J. Cooper, A.G. Gunner, G. Hoogers, D. Thompsett, New
Materials for Fuel Cell and Modern Battery Systems II, Proceed-
ings of the International Symposium on New Materials for Fuel
Cell and Modern Battery Systems, 2nd, Montreal, 6�/10 July,
1997, p. 286.
[20] S. Ball, A. Hodgkinson, G. Hoogers, S. Maniguet, D. Thompsett,
B. Wong, Electrochem. Solid-State Lett. 5 (2002) A31.
[21] S. Mukerjee, S.J. Lee, E.A. Ticianelli, J. McBreen, B.N. Grgur,
N.M. Markovic, P.N. Ross, J.R. Giallombardo, E.S. De Castroc,
Electrochem. Solid-State Lett. 2 (1999) 12.
[22] B.N. Grgur, N.M. Markovic, P.N. Ross, J. Electrochem. Soc. 146
(1999) 1613.
[23] S. Mukerjee, S. Srinivasan, M.P. Soriaga, J. McBreen, J.
Electrochem. Soc. 142 (1995) 1409.
[24] J. McBreen, S. Mukerjee, J. Electrochem. Soc. 142 (1995) 3399.
[25] S. Mukerjee, R.C. Urian, C.K. Witham, T.I. Valdez, S.R.
Narayanan, Proc. Electrochem. Soc. 4 (2001) 136.
[26] T.E. Springer, T. Rockward, T.A. Zawodzinski, S. Gottesfeld, J.
Electrochem. Soc. 148 (2001) A11.
[27] S. Mukerjee, J. McBreen, J. Electrochem. Soc. 143 (1996) 2285.
[28] S. Mukerjee, R.C. Urian, Electrochim. Acta 47 (2002) 3219.
[29] H. Kimura, Trans. Natl. Res. Inst. Metals (Tokyo) 2 (1960) 30.
[30] H. Nishimura, H. Kimura, Nippon Kinzoku Gakkaishi 23 (1959)
616.
[31] A.G. Knapton, J. Inst. Metals 87 (1958) 28.
[32] S.J. Lee, S. Mukerjee, E.A. Ticianelli, J. McBreen, Electrochim.
Acta 44 (1999) 3283.
[33] S. Mukerjee, E.A. Ticianelli, S.J. Lee, J. McBreen, J.R. Giallom-
bardo, E.A DeCastro, in: S. Gottesfeld, T.F. Fuller, G. Helpert
(Eds.), Meeting of the Electrochemical Society, vols. 98-2,
Electrochemical Society, Boston, MA, 1998.
[34] G.A. Camara, E.A. Ticianelli, S. Mukerjee, S.J. Lee, J. McBreen,
J. Electrochem. Soc. 149 (2002) A748.
[35] R. Ianniello, V.M. Schmidt, U. Stimming, J. Stumper, A. Wallu,
Electrochim. Acta 39 (1994) 1863.
[36] B.N. Grgur, G. Zhuang, N.M. Markovic, P.N. Ross, J. Phys.
Chem. 101 (1997) 3910.
[37] H.P. Dhar, L.G. Christner, A.K. Kush, H.C. Maru, J. Electro-
chem. Soc. 133 (1986) 1574.
[38] J. Sobkowski, A. Czerwinski, J. Phys. Chem. 89 (1985) 365.
[39] S. Taguchi, A. Aramata, M. Enyo, J. Electroanal. Chem. 372
(1994) 161.
[40] S. Taguchi, T. Ohmori, A. Aramata, M. Enyo, J. Electroanal.
Chem. 369 (1994) 199.
[41] D.C. Papageorgopoulos, F.A. De Bruijn, J. Electrochem. Soc. 149
(2002) A140.
[42] M.L. Marcos, J.M. Vara, J. Gonzalez-Velasco, A.J. Arvia, J.
Electroanal. Chem. 224 (1987) 189.
[43] M.L. Marcos, J. Gonzalez-Velasco, J.M. Vara, M.C. Giordano,
A.J. Arvia, J. Electroanal. Chem. 270 (1989) 205.
[44] M.L. Marcos, J. Gonzalez-Velasco, J.M. Vara, M.C. Giordano,
A.J. Arvia, J. Electroanal. Chem. 287 (1990) 99.
[45] Y. Hori, H. Wakebe, T. Tsukamoto, O. Koga, Electrochim. Acta
39 (1994) 1833.
[46] N. Hoshi, Y. Hori, Electrochim. Acta 45 (2000) 4263.
R.C. Urian et al. / Journal of Electroanalytical Chemistry 554�/555 (2003) 307�/324324


