Embed Size (px)
Citation preview
EMPLOYEE WORK ENGAGEMENT: AN
EMPIRICAL STUDY OF HIGHER
EDUCATION SECTOR IN
PUNJAB
A
Thesis
Submitted to the
LOVELY PROFESSIONAL UNIVERSITY
For the award of degree
of
DOCTOR OF PHILOSOPHY
In
MANAGEMENT
By
Sunaina Ahuja
Guide
Dr. Sanjay Modi
Department of Management
Faculty of Business and Arts
LOVELY PROFESSIONAL UNIVERSITY
PUNJAB
SEPTEMBER, 2015
i
DECLARATION
I declare that the thesis entitled “Employee Work Engagement: An
Empirical Study of Higher Education Sector in Punjab” has been prepared by
me under the guidance of Dr. Sanjay Modi, Professor and Executive Dean, Faculty
of Business and Arts, Lovely Professional University. No part of this thesis has
formed the basis for the award of any degree or fellowship previously.
Sunaina Ahuja
Department of Management,
Lovely Professional University
Phagwara, Punjab
DATE:
ii
CERTIFICATE
I certify that Sunaina Ahuja has prepared her thesis entitled “Employee
Work Engagement: An Empirical Study of Higher Education Sector in
Punjab” for the award of Ph.D degree of Lovely Professional University, under my
guidance. She has carried out the work at the Department of Management, Lovely
Professional University.
Dr. Sanjay Modi
Professor and Executive Dean
Lovely Faculty of Business and Arts
Department of Management,
Lovely Professional University
Phagwara, Punjab.
DATE:
ix
ACKNOWLEDGEMENT
With the grace of Almighty, I take the privilege of expressing sincere
gratitude to all the people whose unflinching support and cooperation has been
indispensable in this accomplishment.
My foremost acknowledgment is for my esteemed guide, Dr. Sanjay Modi,
Professor and Executive Dean, Faculty of Business and Arts, Lovely Professional
University who has mentored me painstakingly. He inspired me for excellence. He
encouraged me through every trough in this journey. I shall ever be grateful for his
guidance and support which was the wind beneath my wings.
I express my sincere gratitude to Sh. Ashok Mittal, The Chancellor and Smt.
Rashmi Mittal, The Pro Chancellor, Lovely Professional University for providing
research infrastructure and facilitating the students for quality research work.
Words are not enough to express my gratitude to my parents Dr. Swaran
Ahuja and Dr. K.N Ahuja who provided me with all the facilities necessary to carry
out my work and inspired me to go ahead despite all the challenges. My daughter
Mehar has always been a sweet source of energy, commitment and motivation,
surging me ahead all the time. I feel lucky for being blessed with a caring brother
Dr. Saurabh Ahuja and my supportive sister-in-law Ms. Deepti Ahuja who always
encouraged me to do my best.
I am grateful to Dr. Rajesh Verma, Professor and Associate Dean, School of
Business, Lovely Professional University, for his kind support, advice and
motivation at all times. I deeply acknowledge the advice of Dr. Vishal Sareen, Head
of Department of Economics who took keen interest in statistical analysis and
spared time for discussions, even beyond the work schedule. I feel lucky to have the
support of my friends and colleagues Dr. Kavleen Sikand, Dr. Puneet Sikand,
Dr. Puja Tandon, Dr. Jasdeep Kaur Dhami, Dr. Savita Gupta, Dr. Anoop Beri,
Dr. Pooja Mehta, Dr. Vaneet Kashyap, Dr. Mridula Mishra, Mr. Sunil Bhudhiraja,
Ms. Priyanka Chibber, Mr. Sarabjit Singh Kwatra, Mr. Puneet Soni, Ms. Sharanjeet
Kaur, Mr. Gagandeep Chawla, Ms. Poonam, Dr. Girish Taneja, Dr. Sandeep Vij
Ms. Gazal Sharma and Ms. Mamta Rana who considered it a priority to extend
timely support in accomplishing this goal.
x
I am grateful to all the Heads of Departments and faculty members of all
Higher Education Institutions who participated in the survey and took keen interest
in it. I also acknowledge the services of the libraries of Lovely Professional
University, Punjab University Chandigarh and Guru Nanak Dev University
Amritsar. I am thankful to Hazooria Brothers, Jalandhar for extending meticulous
support in formatting, printing and binding of Thesis.
Dated : Sunaina Ahuja
xi
TABLE OF CONTENTS
CHAPTER TITLE PAGE NO.
1. INTRODUCTION 1-16
1.1 Employee Work Engagement 1
1.2 Evolution of the concept 4
1.3 Definitions 5
1.4 Theoretical Frameworks 7
1.5 Classification of employees according to engagement 9
1.6 Rationale and Significance of the study 11
1.7 Chapter Summary 15
2. REVIEW OF LITERATURE 17-42
2.1 Studies on Work Engagement as a unique construct 17
2.2 Studies on Measurement of work engagement 22
2.3 Studies on Factors affecting work engagement 24
2.4 Studies on Relationship of work engagement with job
crafting, organizational commitment, work life balance
and work stress
30
2.5 Studies on Engagement – performance link 34
2.6 The Research Gaps 36
2.7 Objectives of the Study 38
2.8 Hypotheses 39
2.9 Chapter Summary 39
3. RESEARCH METHODOLOGY 43-59
3.1 Research design and sampling 43
3.2 Data Collection 44
3.3 Sample Description 44
3.4 Research instruments 45
3.5 Statistical analysis approach 50
3.6 Limitations of the study 56
3.7 Chapter Summary 56
xii
CHAPTER TITLE PAGE NO.
4. RESULTS AND DISCUSSION: WORK
ENGAGEMENT IN THE HIGHER EDUCATION
SECTOR
60-87
4.1 Level of Work Engagement 60
4.2 Relationship of work engagement and personal
variables
62
4.2.1 Relationship of work engagement with type of
institution
63
4.2.2 Relationship of work engagement and faculty work
area
64
4.2.3 Relationship of work engagement and posting 66
4.2.4 Relationship of work engagement and district of
posting
67
4.2.5 Relationship of work engagement and designation 70
4.2.6 Relationship of work engagement and total experience 72
4.2.7 Relationship of work engagement and experience in
current organization
74
4.2.8 Relationship of work engagement and age 77
4.2.9 Relationship of work engagement and gender 79
4.2.10 Relationship of work engagement and educational
background
79
4.2.11 Relationship of work engagement and salary 83
4.3 Chapter Summary 85
5. RESULTS AND DISCUSSION: FACTORS
AFFECTING WORK ENGAGEMENT
88-133
5.1 Factors affecting Work Engagement 88
5.2 Measures to enhance Work Engagement 118
5.3 Chapter Summary 131
6. RESULTS AND DISCUSSION: RELATIONSHIP
OF WORK ENGAGEMENT WITH JOB
CRAFTING, WORK-LIFE BALANCE, WORK
STRESS AND ORGANIZATIONAL
COMMITMENT
134-165
6.1 Relationship between work engagement and job
crafting
134
xiii
CHAPTER TITLE PAGE NO.
6.2 Relationship between work engagement and work life
balance
142
6.3 Relationship between work engagement and work
stress
148
6.4 Relationship between work engagement and
organizational commitment
156
6.5 Chapter Summary 161
7. SUMMARY AND CONCLUSIONS 166-174
7.1 Summary and Findings 166
7.2 Key Recommendations 171
7.3 Future Research Prospects 173
BIBLIOGRAPHY 175-189
APPENDICES i-xvi
iii
ABSTRACT
This study is aimed at investigating work engagement amongst the faculty
members employed in selected Higher Education Institutions in Punjab. Kahn
(1990) is considered to be the pioneer academic who introduced this construct using
the term ‘personal engagement’ in work role. According to Kahn, engagement is
harnessing of organization members’ selves to their work roles. In a state of
engagement people employ and express themselves physically, cognitively and
emotionally. In the context of globalization, boundary less organizations need to
capitalize upon the strength of work engaged employees. The strong association of
work engagement with employee retention, customer satisfaction, productivity and
profitability has been brought out while similar relationships have not been found
for traditional constructs like job satisfaction. The rationale for the current study has
been explained in the light of the challenges faced by Indian higher education
system. Given the issues of below expected quality of teaching and learning, lack of
quality assurance and poor accountability of teaching staff in higher education
institutions, there is a massive exodus of India’s bright students to seemingly
greener pastures for higher education. It calls for enthusiasm of academicians to
mend the flaws in the prevailing system. Hence, need was felt for a study
investigating the level of faculty work engagement, factors affecting it, measures for
its enhancement and its relationship with other phenomena.
The review of literature began with general literature regarding employee
well being and work engagement followed by specific studies on work engagement.
Approximately, more than hundred research papers published in various
international journals, related articles from books and websites and significant
reports published on this subject were reviewed. All the studies were categorized
into five sections namely, studies on work engagement as a unique construct; studies
on measurement of work engagement; studies on factors affecting work
engagement; studies on relationship of work engagement with job crafting,
organizational commitment, work life balance and work stress and studies on
engagement –performance link.
The review revealed that engagement is clearly established as a novel and
unique concept. There is enough research evidence to distinguish engagement from
iv
job satisfaction, commitment, job involvement, workaholism and work related flow.
The instruments for measuring employee work engagement were explored. The
most cited instruments were found to be Gallup Workplace Audit or Q12, Maslach
Burnout Inventory, Oldenburg Burnout Inventory (OLBI) and Utrecht Work
Engagement Scale. Various studies on the factors affecting work engagement were
reviewed. A comparative analysis revealed that work engagement is predicted by a
host of factors which can be classified into: job characteristics, personal resources,
interpersonal relations and organizational support. Various research studies delved
deep into the relationship of these with work engagement. Being a multi
dimensional concept, work engagement, was found to be related other behavioral
phenomena. Extant research studies revealed a positive association between job
crafting and work engagement, indicating that employees who take proactive steps
to establish a better person-job fit are more work engaged. Work engagement is not
limited to the work place but cuts across various domains of life. Work-life balance
is positively associated with engagement. Employees who carry positive feelings
from their work life to personal life and vice versa experience higher levels of
engagement. Work engagement is also positively associated with organizational
commitment. Studies on the relationship between work engagement and work stress
revealed that the two are inversely related. Studies on the engagement performance
link revealed that engaged employees outshine others in both in-role and extra-role
performance. They are creative problem solvers and display the ability to inspire and
coach their co-workers.
Based on the review of literature, some research gaps were noticed. The
factors affecting work engagement of faculty members was found to be a less
researched area, particularly in the Indian higher education sector, having its unique
size and challenges. Very few studies explored the relationship of work engagement
with phenomena like job crafting, work life balance, organizational commitment and
work stress. Hence, this study addressed the gaps through its objectives.
A cross-sectional descriptive study was designed using the quota sampling.
A fixed number of faculty members from each of the four broad faculty work areas
namely Commerce and Business Management (CBM), Science, Engineering and
Technology (SET), Applied Medical Sciences (AMS) and Education and
Humanities (EHUM) were selected for the study. The respondents were drawn from
v
public and private higher education institutions located in the districts of Amritsar,
Bathinda, Jalandhar, Ludhiana, Patiala and the capital of Punjab – Chandigarh as
these districts are considered the hubs of higher education in Punjab. The sample
consisted of 463 faculty members from 41 Higher Education Institutions. The
research instrument used for data collection consisted of seven scales including (i) a
self developed 92 item scale that explored the respondents’ perception regarding
self, current job and current organization (ii) a 12 item scale adapted from job
crafting scale developed by Tims et al. (2012) (iii) work-life balance scale
developed by Hayman (2005) (iv) nine-item version of the Utrecht Work
Engagement Scale developed by Schaufeli et al. (2006) (v) a six item
Organizational Commitment scale developed by Saks (2006) (vi) a self developed
work stress scale consisting of 18 items adapted from Organization Role Stress
Scale developed by Udai Pareek (1983) (vii) an ordinal scale to see respondents’
ranking of changes required for improving engagement. The statistical analysis
approach included descriptive statistics, one-way ANOVA, exploratory factor
analysis, measurement of scale reliability with Cronbach’s alpha coefficient,
correlation analysis, non-metric correlation analysis using Spearmann’s rank
correlation coefficient and hierarchical multivariate regression analysis. The data
analysis was done using SPSS version 16.0.
Data analysis resulted in the following major findings and recommendations:
[1] Faculty work engagement in higher education sector of Punjab, is at a
moderate level. The statistics indicate a large scope for improvement. Given
the merits of a work engaged faculty team, HEIs are urged for action in this
direction.
[2] Relationship of work engagement with personal or demographic variables
explored using one-way analysis of variance (ANOVA) revealed that work
engagement varied significantly with faculty work area, district wise posting,
designation, experience in current organization, total experience, age,
educational background and salary. However, no statistically significant
variation was found with respect to respondents’ gender, government versus
private institution and posting at university campus or affiliated college. In
this regard, implications for HR policy design are discussed in chapter 4.
vi
[3] The factors affecting work engagement were identified through exploratory
factor analysis, correlation analysis and hierarchical multiple regression
analysis. They include perceived organizational support, personal and
professional orientation, intrinsic rewards, task variety, organizational
orientation for results and supervisory coaching.
[4] The top five measures required for enhancement of work engagement are
greater role clarity, more empowerment for decision making, better intrinsic
rewards, more openness towards change & innovation and organizational
support for career advancement. Interestingly, Spearmann’s rank Correlation
analysis revealed that work engagement measures can be more effective if
customized according to type of institution, designation and faculty work
areas. For instance, government and government aided Higher Education
Institutions need to focus on providing greater role clarity, empowerment
and open communication. Private sector HEIs need to pay attention to better
intrinsic rewards in terms of interesting work, satisfaction from work and a
sense of progress along with better organizational support for career
advancement.
[5] Work engagement of faculty members was significantly predicted by two
constituents of job crafting, namely, increasing structural job resources and
challenging job demands. It implies that work engagement is likely to
increase with a bottom–up approach wherein faculty members are
encouraged to use a two pronged strategy to alter their job design. One set of
initiatives they can take includes seeking structural job resources like
autonomy, task and skill variety and opportunities for self development.
Another set of efforts includes seeking challenging job demands by
volunteering for new projects, keeping abreast of the most recent
developments, taking initiative to start new projects and extra tasks.
[6] Work engagement is significantly predicted by two aspects of work – life
balance namely personal life interference with work and work-personal life
enhancement (WPLE). It implies that HR policy initiatives to establish a
mutually enhancing relationship between work and personal life for example
flexible work options could have a significant impact on work engagement.
Flexible working hours can be given wherein faculty members can choose
vii
their preferred timings subject to meeting a prefixed number of hours. The
option of telecommuting allows the employees to work from anywhere and
stay in touch with the office with advanced technological assistance for
example video conferencing and webinars in case of faculty members.
Flexible benefits or cafeteria style benefit program allows employees to
choose from a range of benefit options that best suit their personal and
family needs, upto the value of a set allowance. The option of having a
compressed work week allows employees to work for longer hours on
certain days and enjoy a longer week end for example it allows the freedom
to work ten hours a day for four days instead of eight hours a day for five
days. Another novel idea tried by some organizations is the option of job
sharing or twinning. Herein, two employees share the job responsibilities in a
full time job. Permission for availing career breaks for self development can
also be a highly sought after measure for better work life balance and hence
work engagement of faculty members.
[7] Work engagement was found to be inversely related with work stress.
Results of the present study revealed greatest dissatisfaction on role
interference dimension requiring them to compromise on quality of work due
to quantity, underutilization of talent and need to make changes in current
role profile. Self –role distance and role expectation conflict were inversely
related with work engagement. It calls for action by those in academic
leadership positions, playing supervisory role as Heads of Departments.
Intrinsic rewards in the form of allocating faculty preferred courses for
teaching and appreciation for good work can erode the negative impact of
work stress and create a positive gain spiral for faculty work engagement.
[8] Faculty members who are highly committed to their current organizations are
likely to be more work engaged. Work engagement of long tenured faculty
members (>20 years) was found to be higher than others who had less
experience (<5 years) in the current organization. It appears that when
faculty members stay associated with an organization for a long tenure, they
develop a clear understanding of organizational orientation for results which
was identified as another vital factor predicting faculty work engagement. A
long tenure could be an outcome of a match between organization’s result
viii
orientation with employees’ personal and professional orientation. Hence, it
implies that HEIs must design ingenious ways to map the two orientations so
that they can retain faculty members for long tenures and capitalize upon
their work engagement. An employee value proposition of care and concern
fuels affective commitment which has a strong positive association with
work engagement.
This study also found new vistas for future research. A majority of the
studies on work engagement especially in the Indian context have used a cross-
sectional design which cannot explain why even highly engaged employees may be
less engaged on some days. Hence, longitudinal studies are required to analyze the
pattern of daily changes in work engagement and identify the factors leading to
these. Such studies could have important implications for better understanding of
employee well being. The current study investigated the relationship between work
engagement and job crafting and found a positive association. Further studies in this
area may answer the question as to whether all employees are equally inclined for
job crafting. Can people be trained for job crafting? Is there a relationship between
personality and job crafting? The current study highlights the need for work-life
balance measures in HEIs. Studies mapping the perception of policy makers in the
government and private sector can be instrumental in identifying the feasibility of
adopting such initiatives. They can dramatically change the workplace scenario and
increase workforce participation of many sections of the society which can be
instrumental in enhancing the overall work engagement. Work engagement will be
sustainable when employee well being is also high (Robertson and Cooper, 2010).
Studies on work engagement can be furthered to construct workplace happiness
index – an aggregation of all vital metrics of employee well being.
**********
xiv
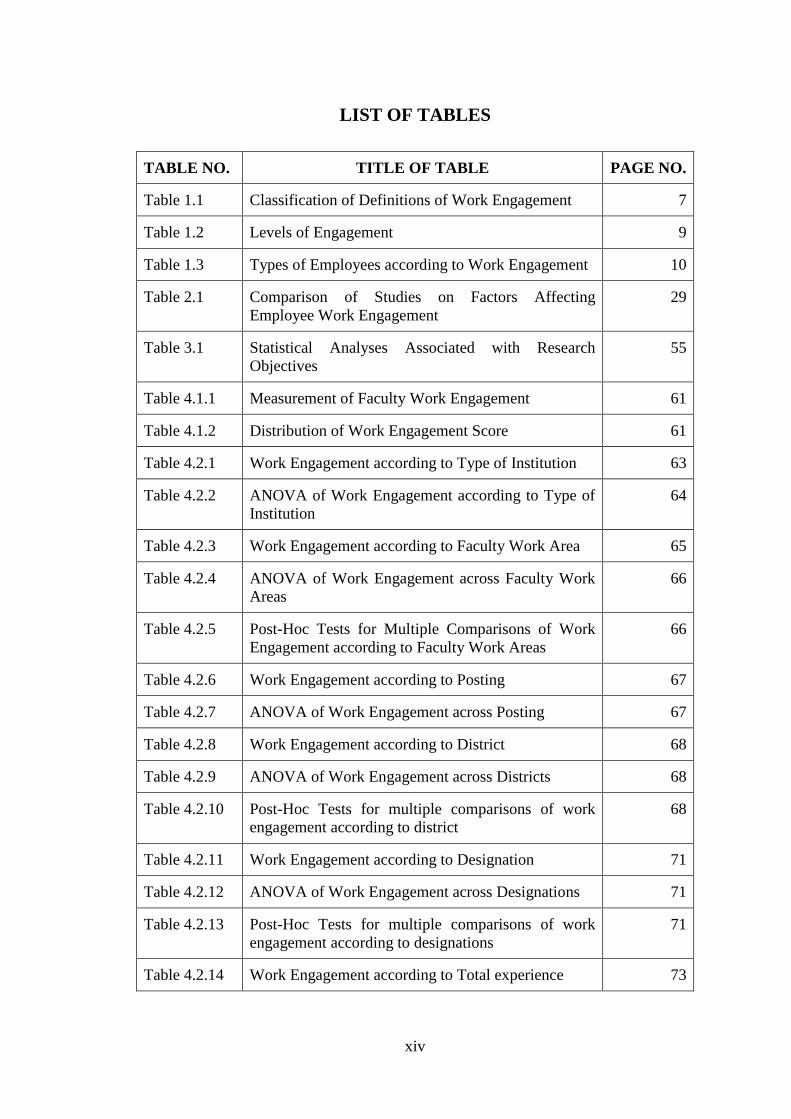
LIST OF TABLES
TABLE NO. TITLE OF TABLE PAGE NO.
Table 1.1 Classification of Definitions of Work Engagement 7
Table 1.2 Levels of Engagement 9
Table 1.3 Types of Employees according to Work Engagement 10
Table 2.1 Comparison of Studies on Factors Affecting
Employee Work Engagement
29
Table 3.1 Statistical Analyses Associated with Research
Objectives
55
Table 4.1.1 Measurement of Faculty Work Engagement 61
Table 4.1.2 Distribution of Work Engagement Score 61
Table 4.2.1 Work Engagement according to Type of Institution 63
Table 4.2.2 ANOVA of Work Engagement according to Type of
Institution
64
Table 4.2.3 Work Engagement according to Faculty Work Area 65
Table 4.2.4 ANOVA of Work Engagement across Faculty Work
Areas
66
Table 4.2.5 Post-Hoc Tests for Multiple Comparisons of Work
Engagement according to Faculty Work Areas
66
Table 4.2.6 Work Engagement according to Posting 67
Table 4.2.7 ANOVA of Work Engagement across Posting 67
Table 4.2.8 Work Engagement according to District 68
Table 4.2.9 ANOVA of Work Engagement across Districts 68
Table 4.2.10 Post-Hoc Tests for multiple comparisons of work
engagement according to district
68
Table 4.2.11 Work Engagement according to Designation 71
Table 4.2.12 ANOVA of Work Engagement across Designations 71
Table 4.2.13 Post-Hoc Tests for multiple comparisons of work
engagement according to designations
71
Table 4.2.14 Work Engagement according to Total experience 73
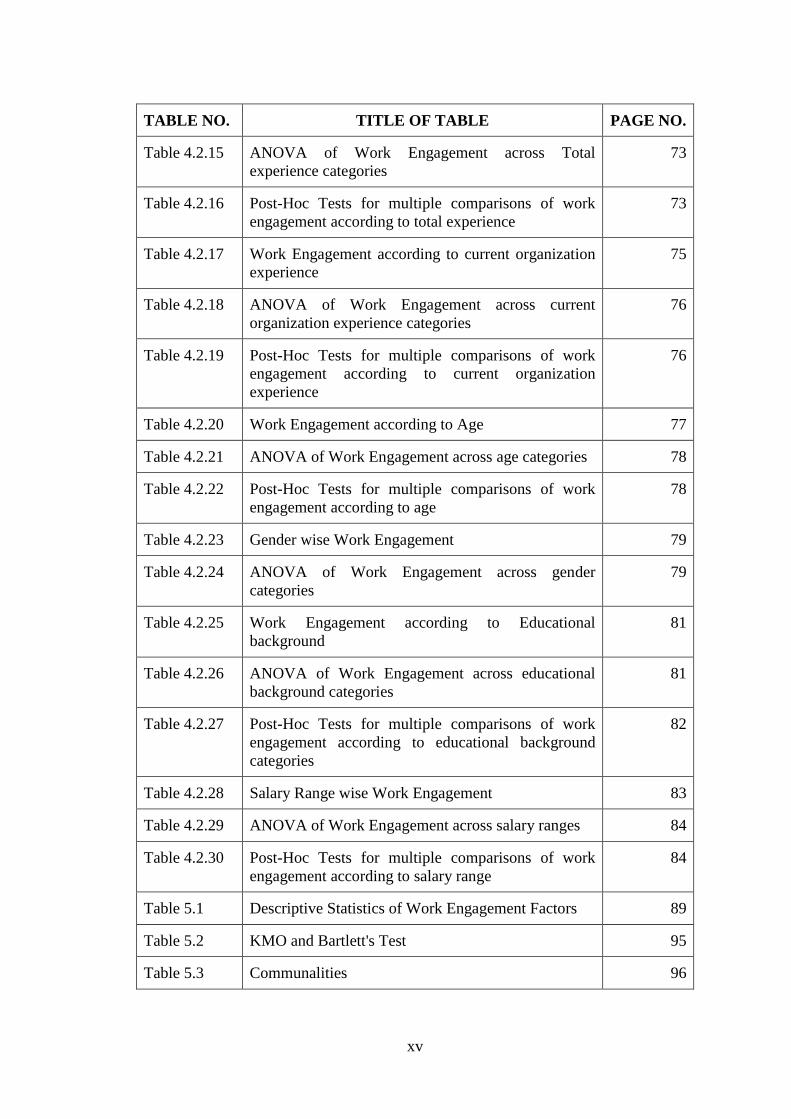
xv
TABLE NO. TITLE OF TABLE PAGE NO.
Table 4.2.15 ANOVA of Work Engagement across Total
experience categories
73
Table 4.2.16 Post-Hoc Tests for multiple comparisons of work
engagement according to total experience
73
Table 4.2.17 Work Engagement according to current organization
experience
75
Table 4.2.18 ANOVA of Work Engagement across current
organization experience categories
76
Table 4.2.19 Post-Hoc Tests for multiple comparisons of work
engagement according to current organization
experience
76
Table 4.2.20 Work Engagement according to Age 77
Table 4.2.21 ANOVA of Work Engagement across age categories 78
Table 4.2.22 Post-Hoc Tests for multiple comparisons of work
engagement according to age
78
Table 4.2.23 Gender wise Work Engagement 79
Table 4.2.24 ANOVA of Work Engagement across gender
categories
79
Table 4.2.25 Work Engagement according to Educational
background
81
Table 4.2.26 ANOVA of Work Engagement across educational
background categories
81
Table 4.2.27 Post-Hoc Tests for multiple comparisons of work
engagement according to educational background
categories
82
Table 4.2.28 Salary Range wise Work Engagement 83
Table 4.2.29 ANOVA of Work Engagement across salary ranges 84
Table 4.2.30 Post-Hoc Tests for multiple comparisons of work
engagement according to salary range
84
Table 5.1 Descriptive Statistics of Work Engagement Factors 89
Table 5.2 KMO and Bartlett's Test 95
Table 5.3 Communalities 96
xvi
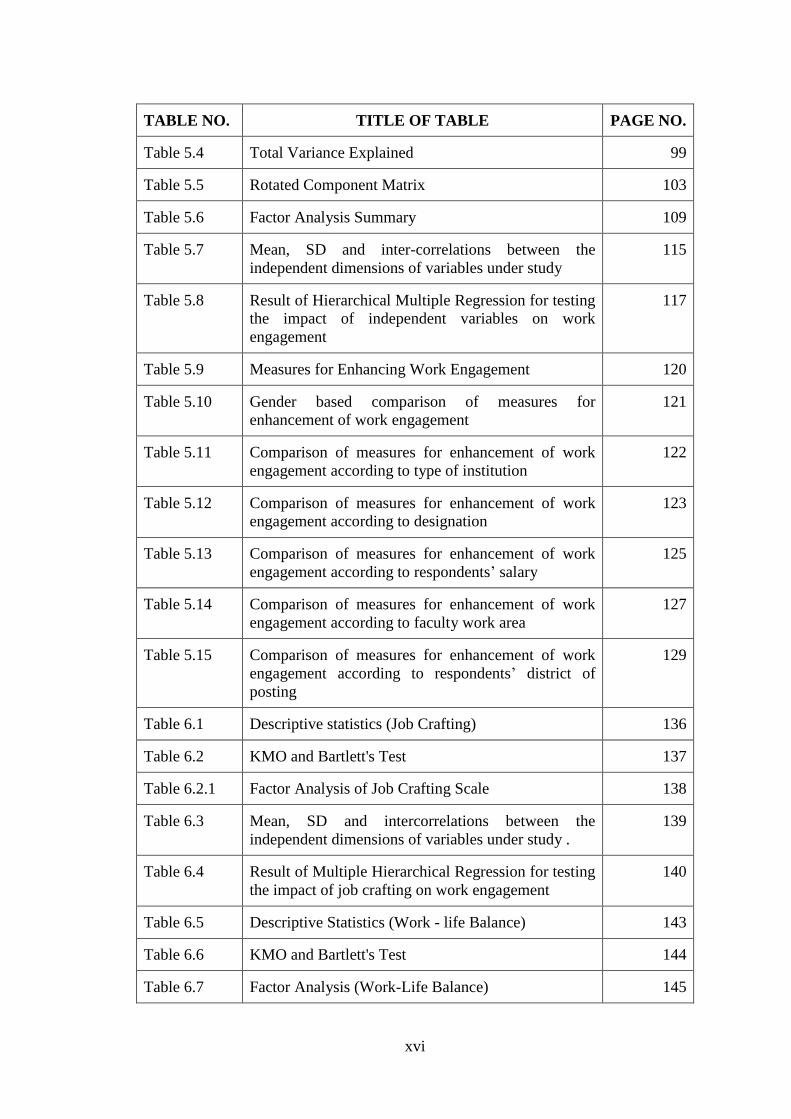
TABLE NO. TITLE OF TABLE PAGE NO.
Table 5.4 Total Variance Explained 99
Table 5.5 Rotated Component Matrix 103
Table 5.6 Factor Analysis Summary 109
Table 5.7 Mean, SD and inter-correlations between the
independent dimensions of variables under study
115
Table 5.8 Result of Hierarchical Multiple Regression for testing
the impact of independent variables on work
engagement
117
Table 5.9 Measures for Enhancing Work Engagement 120
Table 5.10 Gender based comparison of measures for
enhancement of work engagement
121
Table 5.11 Comparison of measures for enhancement of work
engagement according to type of institution
122
Table 5.12 Comparison of measures for enhancement of work
engagement according to designation
123
Table 5.13 Comparison of measures for enhancement of work
engagement according to respondents’ salary
125
Table 5.14 Comparison of measures for enhancement of work
engagement according to faculty work area
127
Table 5.15 Comparison of measures for enhancement of work
engagement according to respondents’ district of
posting
129
Table 6.1 Descriptive statistics (Job Crafting) 136
Table 6.2 KMO and Bartlett's Test 137
Table 6.2.1 Factor Analysis of Job Crafting Scale 138
Table 6.3 Mean, SD and intercorrelations between the
independent dimensions of variables under study .
139
Table 6.4 Result of Multiple Hierarchical Regression for testing
the impact of job crafting on work engagement
140
Table 6.5 Descriptive Statistics (Work - life Balance) 143
Table 6.6 KMO and Bartlett's Test 144
Table 6.7 Factor Analysis (Work-Life Balance) 145
xvii
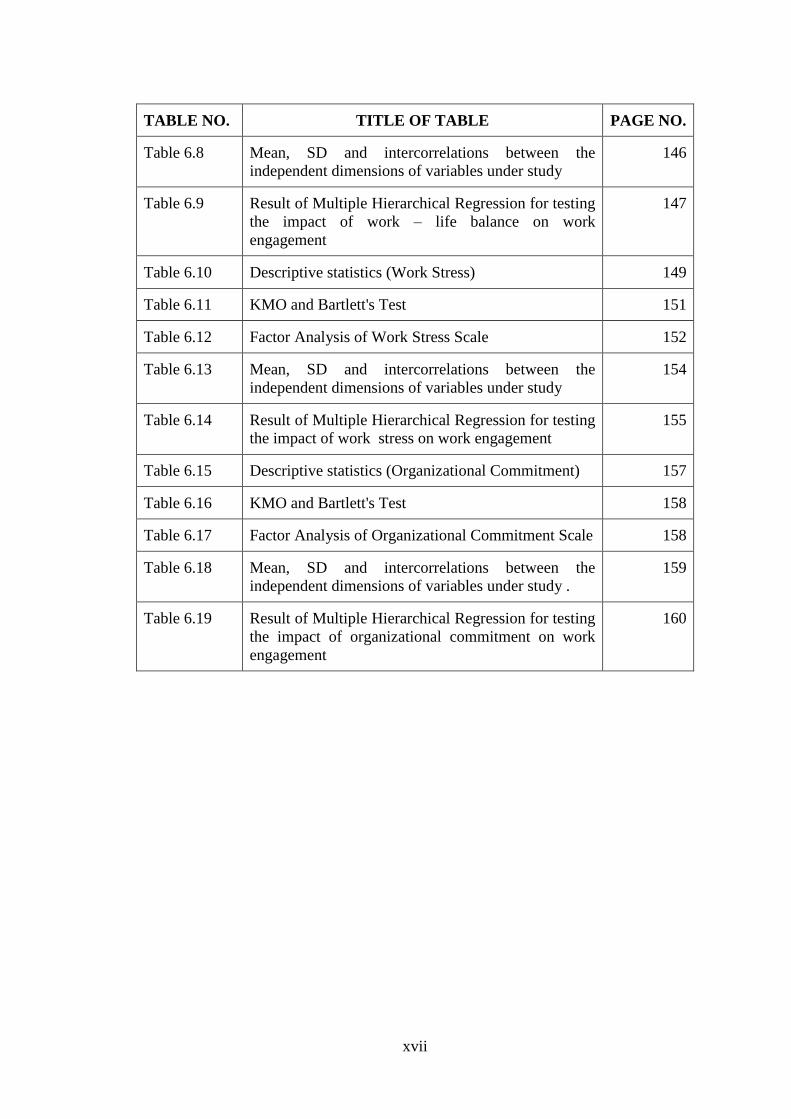
TABLE NO. TITLE OF TABLE PAGE NO.
Table 6.8 Mean, SD and intercorrelations between the
independent dimensions of variables under study
146
Table 6.9 Result of Multiple Hierarchical Regression for testing
the impact of work – life balance on work
engagement
147
Table 6.10 Descriptive statistics (Work Stress) 149
Table 6.11 KMO and Bartlett's Test 151
Table 6.12 Factor Analysis of Work Stress Scale 152
Table 6.13 Mean, SD and intercorrelations between the
independent dimensions of variables under study
154
Table 6.14 Result of Multiple Hierarchical Regression for testing
the impact of work stress on work engagement
155
Table 6.15 Descriptive statistics (Organizational Commitment) 157
Table 6.16 KMO and Bartlett's Test 158
Table 6.17 Factor Analysis of Organizational Commitment Scale 158
Table 6.18 Mean, SD and intercorrelations between the
independent dimensions of variables under study .
159
Table 6.19 Result of Multiple Hierarchical Regression for testing
the impact of organizational commitment on work
engagement
160
xviii
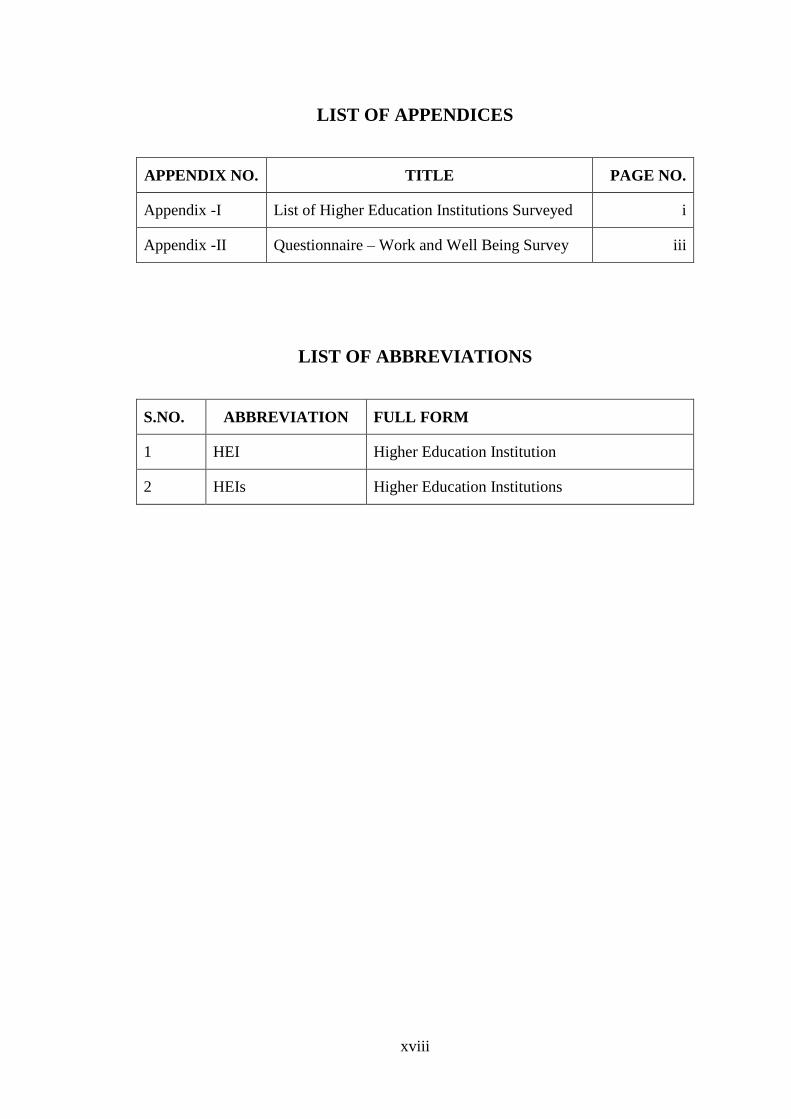
LIST OF APPENDICES
APPENDIX NO. TITLE PAGE NO.
Appendix -I List of Higher Education Institutions Surveyed i
Appendix -II Questionnaire – Work and Well Being Survey iii
LIST OF ABBREVIATIONS
S.NO. ABBREVIATION FULL FORM
1 HEI Higher Education Institution
2 HEIs Higher Education Institutions
CHAPTER – 1
INTRODUCTION
P a g e | 1
CHAPTER – 1
INTRODUCTION
——————————————————————————————————
“Employee contribution becomes a critical business issue because in trying to
produce more output with less employee input, companies have no
choice but to try to engage not only the body, but also the mind
and the soul of every employee.”
David Ulrich (1997)
This chapter introduces the concept of employee work engagement, traces its
evolution, definitions, theoretical frameworks, classification of employees according
to engagement and culminates with the rationale and significance of the study in
higher education sector.
1.1 EMPLOYEE WORK ENGAGEMENT
Contemporary organizations envision the creation of an environment in
which employees give their very best and stand by during difficult times. In their
quest for organizational excellence and value maximization organizations struggle to
effectively manage talent and transform employees into engaged associates who are
willing to go the extra mile. Bruce Henderson, the founder of Boston Consulting
Group believed that dedicated people, their ideas and a commitment to acting with
integrity has enormous potential to create value, influence the evolution of
industries, and indeed, to change the world (Boston Consulting Group, 2014). Sarah
(2014), explained in The Great Place to Work Model, that a great workplace is one
where organizational objectives are achieved with employees who enjoy working,
take pride in their work and give their personal best as a team, in an environment of
trust. The ingredients of a great workplace include great challenges, atmosphere,
rewards, pride, communication and great bosses too (Sarah, 2014). Consistent
participation of companies like Google Inc, SAS and The Boston Consulting Group
in surveys like Great Places to Work is an indicator of their concern for employee
work engagement. Most of the companies surveyed acknowledge the need to
provide an environment in which employees perceive their work to be meaningful
and themselves to be empowered to contribute towards organizational and societal
goals. The top ranking companies are able to engage employees from the most
P a g e | 2
diverse backgrounds and at different stages of their personal and professional lives.
A perusal of Fortune‘s list of the 100 best companies to work, reveals wide diversity
in the tangible and intangible rewards they offer, with the common outcome of being
able to successfully engage their workforce (Fortune - Best Companies 2014, 2014).
They take the widest range of measures from provision of personalized work space,
free food, space to grow vegetables and even avail the facility of nap pods (Sarah,
2014). Unfortunately, the scenario depicted in Fortune‘s List of Great Places to
Work is not representative of the common workplace where the large majority of the
workforce is employed. Studies reveal that work engagement appears to be declining
continuosly (Shuck & Wollard, 2008). Gruman and Saks (2011) suggested that
incremental performance may be best achieved by orienting the performance
management system to promote work engagement. Organizations need to build an
environment which truly inspires people to give their best. The challenges associated
with facilitating an organizational environment that promotes work engagement are
well documented. In this context work culture support has been identified as an
important factor for predicting higher supervisor support, colleague support and
work engagement (Biggs et al., 2014).
Over the years, work engagement has become a well-known construct to
both practitioners and social scientists alike. In the field of practice, many reports
have been publishing the status of employee work engagement in particular sectors
of the work force, thus classifying employees into various segments on the basis of
their engagement levels. However there is a lot of variation in the way engagement
has been defined in each of these reports. In common parlance, engagement refers to
passion, enthusiasm, commitment, involvement, focused effort, absorption and
dedication. Merriam - Webster dictionary describes it as ―emotional involvement or
commitment‖ and as ―being in gear‖. The lack of clarity over a common definition
of engagement was a major cause of concern for the academic researchers. Hence,
some researchers made an in depth study of the construct and developed a common
conceptualization of work engagement as a high level of personal investment in the
tasks performed on a job (Kahn, 1990; Schaufeli et al. 2002; May et al., 2004;
Macey & Schneider, 2008; Rich et al., 2010).
Engaged employees are good performers and are willing to go the extra mile.
They are creative problem solvers and possess an intrinsic interest and dedication
P a g e | 3
towards work. Hence, they possess an assortment of ways to handle work related
problems. They consistently perform better than their less engaged counterparts.
Engagement is not a standalone phenomenon. Engaged employees develop a
positive team climate, irrespective of the job demands faced and resources available
to them. They influence their colleagues to imbibe a ‗can do‘ and ‗make a
difference‘ approach. Thus engagement can be considered as transmittable. The
crossover or transmission of engagement is not limited to the work sphere alone, but
spreads across various domains of life. Hence, it can be said that both engagement as
well as the lack of it is contagious as it crosses over from one member to the other
whether at work or in personal life.
On the other hand disengaged employees do not care about organizational
growth, nor do they support a good work culture. They lack enthusiasm and too are
busy complaining, making excuses or gossiping. They believe that they ‗know it
all‘. Hence they do not invest in themselves to become better people and grow
within the company. They find it easy to work independently rather than collaborate
within and across teams. They seldom take initiative or ask questions. They often
lie, miss deadlines are distracted and are thus very difficult to depend upon.
Two critical factors that fuel employee work engagement are the degree of
challenge and ownership in the work. Employees own up the work which they
consider to be meaningful and challenging, thus getting engaged in it. However, too
much challenge might cause stress leading to a natural reaction of withdrawal from
work. Managers need to discover the sweet spot where their team can rise to the
occasion without being overwhelmed. Since, the level of acceptable challenge varies
from one team member to another, managers must be aware of where an associate
gets stuck and offer the required support. Too much anxiety leads to disengaged
employees.
Little and Little (2006) stated that employee work engagement has been
widely discussed in management literature, magazines, newspapers and the websites
of many human resource consulting firms. Despite the low numbers of engaged
employees, organizational leaders rate employee work engagement among the top
priorities (Ketter, 2008) since it has a great association with job performance
(Merrill, et al., 2013). Employee work engagement has been shown to have a
positive relationship with employee retention, efficiency, organizational profitability
P a g e | 4
and customer satisfaction (Buckingham & Coffman, 1999; Coffman & Gonzalez-
Molina, 2002). Similar relationships have not been shown for traditional constructs
such as job satisfaction (Fisher & Locke, 1992). Engaged workers are more open
minded, productive and more willing to go the extra mile (Bakker, 2011).
Engaging employees requires a closer examination of the unwritten,
psychological contract between the employer and the employees. It is
distinguishable from the formal written contract of employment. The written
contract identifies mutual duties and responsibilities in a general manner while the
psychological contract represents the informal obligations between the employer and
employee in the form of unwritten but strongly held beliefs and perceptions. The
onset of twenty first century marked a paradigm shift in the psychological contract.
A typical employer is faced with the pressure to cut costs, use cutting edge
technology for higher productivity and play against rivals trying to poach both
employees and customers. This is coupled with high employee attrition rates and
corresponding lower average length of service. It leads to an upsurge in the direct
costs for replacement and decreases the organization‘s ability to develop long-term
customer relationships and implement people dependent strategies. Upon examining
the employees‘ paradigm of the psychological contract it is evident that they now
believe that one needs to change jobs more frequently to ensure continued salary
growth and career advancement. The idea of a ‗job for life‘ is fading and current
focus is upon creating employability for future anywhere across the globe (Aselstine
and Alletson, 2006). In this scenario research on exploring the dynamics of work
engagement is quite meaningful and valuable.
1.2 EVOLUTION OF THE CONCEPT
According to Schaufeli (2013), it is not clear when the term engagement was
used in relation to work, however Gallup organization is credited for having coined
the term somewhere in the 1990s. Buckingham and Coffman (1999) in their best
selling book titled, First Break All The Rules, published the results of Gallup
organization‘s research of ‗strong work places‘. Employees perception of such
workplaces was assessed with a set of 12 questions which later became known as
Q12
, Gallup‘s engagement questionnaire. Around the turn of the century, many other
consulting firms followed suit with their measures and reports on employee work
P a g e | 5
engagement. In fact the first scholarly article on engagement was published by Kahn
in the year 1990 in Academy of Management Journal and it took ten years for others
to pick up the topic. However, during the period 2000-2010 the number of
publications on this topic grew sharply. The basic reason behind a sudden rise of
interest in this topic can be understood in terms of some developments in the broader
industrial scenario marked by globalization wherein employees were required to
mange continuous change, work in diverse teams, craft their jobs and operate in a
boundary less manner. Thus the human capital and contribution became more
important in the changed scenario.
The surge in interest of academicians on the subject of work engagement can
also be attributed to the positive psychology movement, rekindled by Martin E. P.
Seligman, President of American Psychological Association. According to Seligman
and Csikszentmihalyi (2000) positive psychology refers to the scientific study of
optimal human functioning aimed at promoting factors that enhance the
development of individuals, organizations and communities leading to overall
happiness. Hence, under this movement research studies are aimed at studying the
state of well being and its enhancement as against states like stress, burnout and the
like. Work engagement clearly fits well into this novel approach. Hence, the topic
blossomed in academic circles. Thus, the growing body of research on work
engagement can be attributed to the increase in importance of human capital
requiring psychological involvement of employees and the positive psychology
movement.
1.3 DEFINITIONS
Kahn (1990) used the term personal engagement and defined it as the degree
to which organizational members‘ harness themselves to their work roles expressing
physically, mentally, cognitively and emotionally during the performance of their
roles. According to Maslach and Leiter (1997) engagement and burnout are the two
end points of a single continuum. Engagement is the positive antithesis of burnout. It
implies that those who are high on engagement shall be low on burnout. Schaufeli et
al. (2002) stated that engagement and burnout are two separate concepts, negatively
related to each other. They defined engagement as a positive, fulfilling work related
state of mind characterized by vigour, dedication and absorption. According to the
P a g e | 6
Gallup Organization researchers, engagement refers to an individual‘s involvement,
satisfaction and enthusiasm for work (Harter et al., 2002). Saks (2006) defined
engagement as ―a distinct and unique construct consisting of cognitive, emotional
and behavioral components that are associated with individual role performance‖ (p.
602). The common link between this definition and that of Kahn (1990) is that both
focus on role performance at work. As an innovation, Saks (2006) categorized
engagement into two types namely job engagement and organization engagement.
Job engagement refers to performing the work role while organizational engagement
relates to performing the role as a member of the organization. Engagement being
such a vast and all-inclusive concept, the most sensitive question in defining it is,
what to include in it and what not to include. Macey and Schneider (2008) proposed
a synthesis of all aspects of engagement. Their conceptual framework includes trait
engagement, state engagement and behavioral engagement.
Consultancy firms conceptualized engagement by aggregating and relabeling
existing notions, such as involvement, commitment, satisfaction, motivation and
extra-role performance. For example, according to the consulting firm Mercer
(2007), engagement is ‗commitment‘ or ‗motivation‘ indicating a psychological
state where employees feel a vested interest in the company‘s success and perform
above the stated requirements of the job. On the engagement continuum, they move
from being satisfied, motivated, committed to becoming advocates of organizational
ethos (www.rapidbi.com). Towers Watson research (2014) defined engagement in
terms of three measurable elements namely employees‘ willingness to expend
discretionary effort on their job, availability of performance enabling factors like
resources and supervisory support and work environment that gives energy for
physical, emotional and interpersonal well-being. Another firm, Aon Hewitt (2015),
in its survey on Global Employee Engagement Trends - 2015 defined engagement as
the psychological state and behavioral outcomes that lead to better performance.
They state that engaged employees constantly exhibit three general behaviors
namely say, stay and strive. They speak positively about the organization, have a
strong desire to be members of the organization despite having opportunities to work
elsewhere and put in extra effort, time and initiative in their work. Collectively,
these definitions of engagement by various consulting firms suggest that in business,
engagement is defined as a mix of three existing concepts namely organizational
P a g e | 7
commitment, job satisfaction and extra-role behavior i.e. initiative to go beyond the
job description.
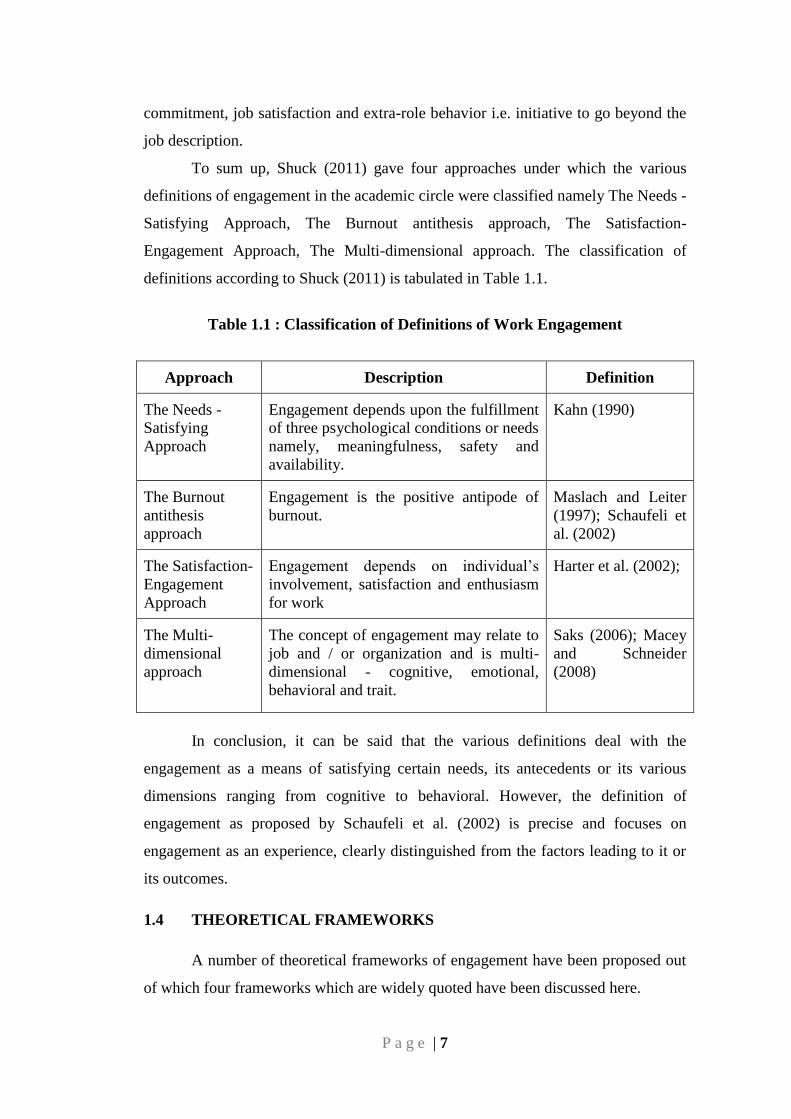
To sum up, Shuck (2011) gave four approaches under which the various
definitions of engagement in the academic circle were classified namely The Needs -
Satisfying Approach, The Burnout antithesis approach, The Satisfaction-
Engagement Approach, The Multi-dimensional approach. The classification of
definitions according to Shuck (2011) is tabulated in Table 1.1.
Table 1.1 : Classification of Definitions of Work Engagement
Approach Description Definition
The Needs -
Satisfying
Approach
Engagement depends upon the fulfillment
of three psychological conditions or needs
namely, meaningfulness, safety and
availability.
Kahn (1990)
The Burnout
antithesis
approach
Engagement is the positive antipode of
burnout.
Maslach and Leiter
(1997); Schaufeli et
al. (2002)
The Satisfaction-
Engagement
Approach
Engagement depends on individual‘s
involvement, satisfaction and enthusiasm
for work
Harter et al. (2002);
The Multi-
dimensional
approach
The concept of engagement may relate to
job and / or organization and is multi-
dimensional - cognitive, emotional,
behavioral and trait.
Saks (2006); Macey
and Schneider
(2008)
In conclusion, it can be said that the various definitions deal with the
engagement as a means of satisfying certain needs, its antecedents or its various
dimensions ranging from cognitive to behavioral. However, the definition of
engagement as proposed by Schaufeli et al. (2002) is precise and focuses on
engagement as an experience, clearly distinguished from the factors leading to it or
its outcomes.
1.4 THEORETICAL FRAMEWORKS
A number of theoretical frameworks of engagement have been proposed out
of which four frameworks which are widely quoted have been discussed here.
P a g e | 8
1.4.1 The Needs-Satisfying Approach
As discussed in the definitions of work engagement, Kahn (1990) gave this
approach stating that engagement depends upon the fulfillment of three
psychological conditions or needs. They are psychological meaningfulness, safety
and availability. How meaningful one finds one‘s work depends on the job
characteristics and the person – job fit. Psychological safety is determined by the
social environment, management style and group dynamics. A non-threatening
environment is best suited for engagement. Availability is governed by one‘s
personal resources such as physical energy, mental resilience and emotional
intelligence. As per this approach the strategies for enhancing employee work
engagement include job enrichment, role fit coupled with an environment of mutual
respect and trust generated through good interpersonal relations at work.
1.4.2 Job Demands and Resources Model (JD-R Model)
This model proposed by Bakker and Demerouti (2008) assumes that work
engagement is a function of job resources and personal resources. Job resources
such as performance feedback and job control play a key role in accomplishing work
goals and personal growth. Personal resources such as mental resilience are aspects
of the self which help in controlling the work environment. According to this model,
resources energize employees to make focused efforts. While at work one also faces
certain job demands such as work overload, time pressure, red tapism which
required physical and mental efforts on the parts of the employee. The impact of job
demands on work engagement depends on the nature of demand. Hindering job
demands such as role conflict reduce engagement while challenging job demands
such as high responsibility enhances work engagement. When job demands are high,
job resources and personal resources are instrumental in achieving the work goals.
1.4.3 The Affective Shift Model
Individual level of work engagement might vary throughout the day as one
shifts from one task to the other facing various types of events at work (Sonnentag et
al., 2010). This dynamic nature of work engagement is explained by the affective
shift model (Bledlow et al., 2011). The model proposes that high work engagement
P a g e | 9
results from the transition from negative to positive affect. Negative affect indicates
that things are not going on well and motivates the person to take corrective action.
It is this effort that creates a shift from negative to positive affect. Work engagement
is most likely to occur when the down regulation of negative affect is accompanied
by up regulation of positive affect, simultaneously.
1.4.4 Social Exchange Theory
This theory states that over a period of time, relationships evolve into
trusting and loyal mutual commitments if both parties adhere to certain rules of
exchange. For example when employees receive appropriate resources like decent
salary and appreciation from the employer, they feel obliged to repay the
organizations. According to Saks (2006) one form of repayment by employees is
their higher level of job and organization engagement. This is also supported by
Kahn (1990) who proposed that employees feel obliged to repay the organization by
investing themselves fully into their work role performances. On the other hand,
when the organization does not provide the required resources, employees
psychologically withdraw themselves from work, thus disengaging themselves
(Schaufeli, 2006).
1.5 CLASSIFICATION OF EMPLOYEES ACCORDING TO
ENGAGEMENT
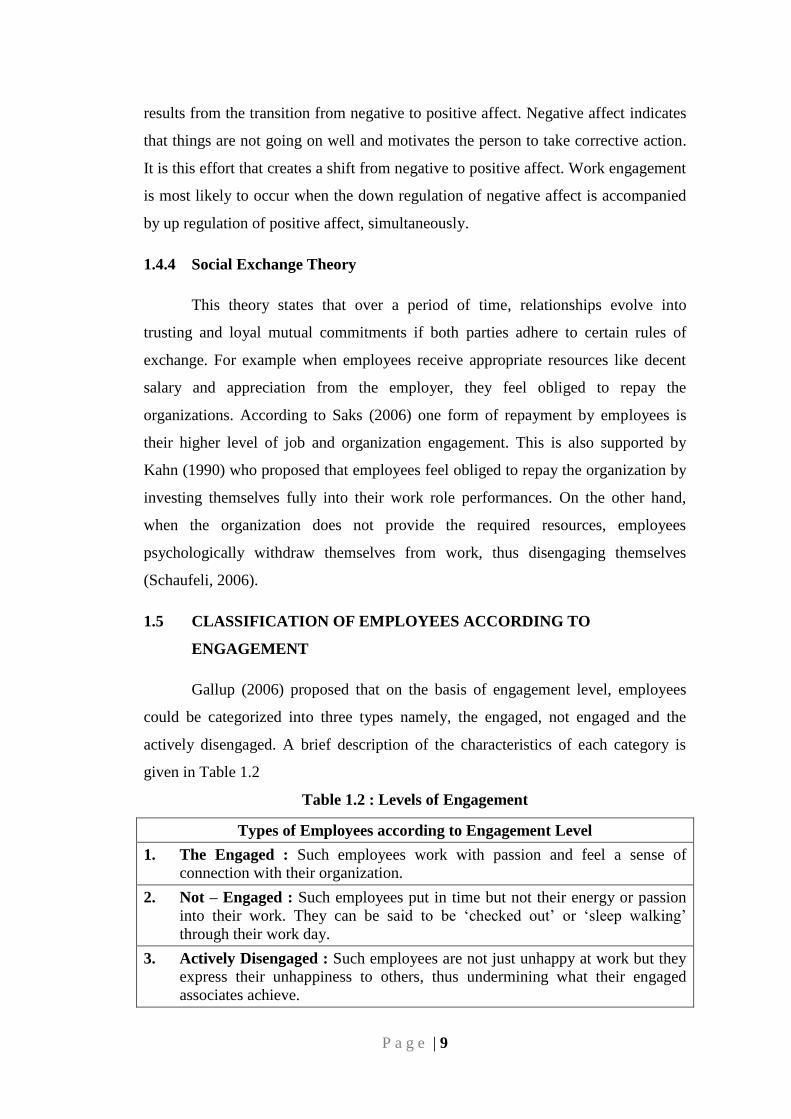
Gallup (2006) proposed that on the basis of engagement level, employees
could be categorized into three types namely, the engaged, not engaged and the
actively disengaged. A brief description of the characteristics of each category is
given in Table 1.2
Table 1.2 : Levels of Engagement
Types of Employees according to Engagement Level
1. The Engaged : Such employees work with passion and feel a sense of
connection with their organization.
2. Not – Engaged : Such employees put in time but not their energy or passion
into their work. They can be said to be ‗checked out‘ or ‗sleep walking‘
through their work day.
3. Actively Disengaged : Such employees are not just unhappy at work but they
express their unhappiness to others, thus undermining what their engaged
associates achieve.
P a g e | 10
The ‗actively disengaged‘ category is of utmost concern to the employer
brand because these staff members have a tendency of sharing their discontent with
their coworkers and the wider world.
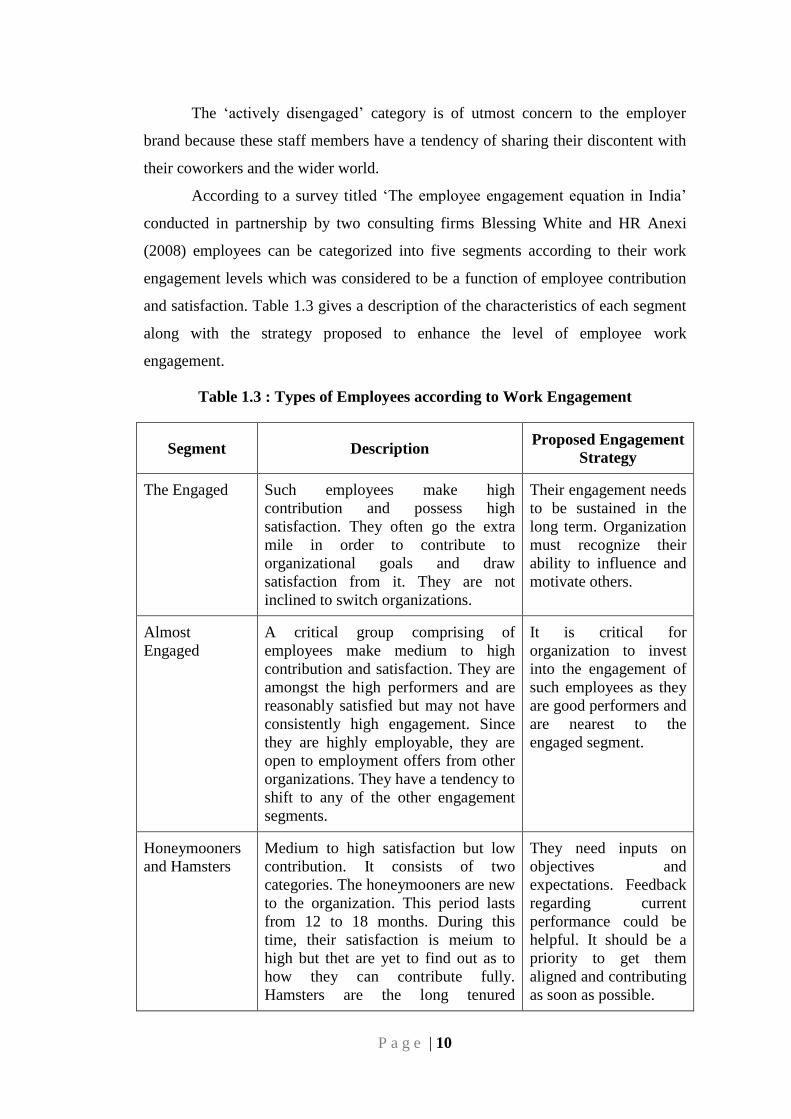
According to a survey titled ‗The employee engagement equation in India‘
conducted in partnership by two consulting firms Blessing White and HR Anexi
(2008) employees can be categorized into five segments according to their work
engagement levels which was considered to be a function of employee contribution
and satisfaction. Table 1.3 gives a description of the characteristics of each segment
along with the strategy proposed to enhance the level of employee work
engagement.
Table 1.3 : Types of Employees according to Work Engagement
Segment Description Proposed Engagement
Strategy
The Engaged Such employees make high
contribution and possess high
satisfaction. They often go the extra
mile in order to contribute to
organizational goals and draw
satisfaction from it. They are not
inclined to switch organizations.
Their engagement needs
to be sustained in the
long term. Organization
must recognize their
ability to influence and
motivate others.
Almost
Engaged
A critical group comprising of
employees make medium to high
contribution and satisfaction. They are
amongst the high performers and are
reasonably satisfied but may not have
consistently high engagement. Since
they are highly employable, they are
open to employment offers from other
organizations. They have a tendency to
shift to any of the other engagement
segments.
It is critical for
organization to invest
into the engagement of
such employees as they
are good performers and
are nearest to the
engaged segment.
Honeymooners
and Hamsters
Medium to high satisfaction but low
contribution. It consists of two
categories. The honeymooners are new
to the organization. This period lasts
from 12 to 18 months. During this
time, their satisfaction is meium to
high but thet are yet to find out as to
how they can contribute fully.
Hamsters are the long tenured
They need inputs on
objectives and
expectations. Feedback
regarding current
performance could be
helpful. It should be a
priority to get them
aligned and contributing
as soon as possible.
P a g e | 11
Segment Description Proposed Engagement
Strategy
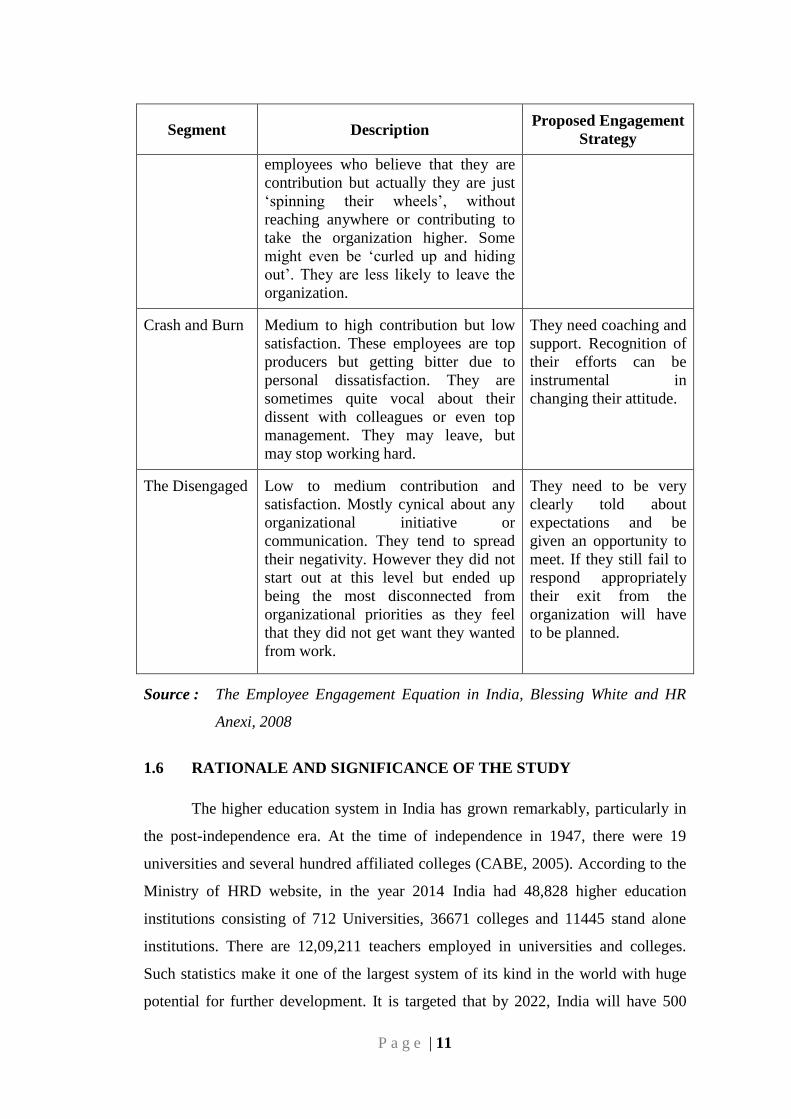
employees who believe that they are
contribution but actually they are just
‗spinning their wheels‘, without
reaching anywhere or contributing to
take the organization higher. Some
might even be ‗curled up and hiding
out‘. They are less likely to leave the
organization.
Crash and Burn Medium to high contribution but low
satisfaction. These employees are top
producers but getting bitter due to
personal dissatisfaction. They are
sometimes quite vocal about their
dissent with colleagues or even top
management. They may leave, but
may stop working hard.
They need coaching and
support. Recognition of
their efforts can be
instrumental in
changing their attitude.
The Disengaged Low to medium contribution and
satisfaction. Mostly cynical about any
organizational initiative or
communication. They tend to spread
their negativity. However they did not
start out at this level but ended up
being the most disconnected from
organizational priorities as they feel
that they did not get want they wanted
from work.
They need to be very
clearly told about
expectations and be
given an opportunity to
meet. If they still fail to
respond appropriately
their exit from the
organization will have
to be planned.
Source : The Employee Engagement Equation in India, Blessing White and HR
Anexi, 2008
1.6 RATIONALE AND SIGNIFICANCE OF THE STUDY
The higher education system in India has grown remarkably, particularly in
the post-independence era. At the time of independence in 1947, there were 19
universities and several hundred affiliated colleges (CABE, 2005). According to the
Ministry of HRD website, in the year 2014 India had 48,828 higher education
institutions consisting of 712 Universities, 36671 colleges and 11445 stand alone
institutions. There are 12,09,211 teachers employed in universities and colleges.
Such statistics make it one of the largest system of its kind in the world with huge
potential for further development. It is targeted that by 2022, India will have 500
P a g e | 12
million skilled workers. There is an important requirement to train fresh graduates in
new skills for ensuring their employability. In the period April 2000 to January
2015, the total amount of foreign direct investments (FDI) inflow into the education
sector in India was US$ 1,071.5 million, according to data released by Department
of Industrial Policy and Promotion (DIPP). The corporate sector has made major
investments in the education and training sector. There are plans to set up 2500
multi-skilling institutions in public private partnership mode. By 2022, India will
have to develop the skills of 120 million people in non-farm sectors. The highest
requirement of skilled labour is expected to come from the construction sector (31
million), followed by retail (17 million) and logistics (12 million). The Government
of India is opening of IITs and IIMs in new locations. With greater popularity of
online mode of education adopted by several higher education institutions, this
sector is all set for some major changes and developments in the coming years.
Appropriate and timely steps in this direction will enable India to take true
advantage of its demographic dividend.
According to a report titled, ‗Understanding India - The Future of Higher
Education and Opportunities for International Cooperation‘ published by the British
Council in 2014, despite of significant progress over the last ten years, the system is
facing certain challenges:
The demand-supply gap : The rate of enrolment in higher education in
India at 21.1% is lower than the global average of 26% and is again low as
compared to China at 26% and Brazil at 36%. Thus there is a huge demand for
higher education which is unmet at the moment. By 2030, The Government of India
aims at increasing the gross enrolment to 30% which means that India requires a
huge increase in the number of Higher Education Institutions.
Low quality of teaching and learning : Many of the educational institutions
are suffering from a serious shortage of faculty, outdated curriculum, rigid
pedagogy, poor quality teaching, separation of teaching and research, lack of quality
assurance and poor accountability.
Research capacity constraints : India does not have enough high quality
researchers, Ph.D enrolment is very low, opportunities for interdisciplinary research
are limited and not properly utilized due to low industry engagement in higher
education and on the whole a weak ecosystem for innovation.
P a g e | 13
Uneven growth and access to opportunity : The access to education is not
equitable across the social strata and geographic divisions. Hence the human
resource development is quite uneven.
The above constraints are reflected in the three central pillars of the
government‘s plans for education namely expansion, equity and excellence. The
system has many issues of concern at present, of which quality of higher education
is a major one. The Higher Education Institutions including the universities and
colleges envision to produce an intelligent human resource pool, by making
innovations in teaching, research and extension activities. Pandit (2010) expressed
conviction in the opinion of Nobel laureate Hans Krebs that it is only a great teacher
who can produce a great student. The teacher‘s role as a mentor who enthuses a
student to think beyond the boundaries of the given text is crucial in shaping the
future of education. He further quoted Tim Hunt, ‗Knowing how we know is at least
as important, for a real scientist, as what is known‘. This calls for a fresh approach
to tertiary education, in which the teacher assumes the pivotal role. Pandit (2010)
expressed his concern that it is worrying to be struggling with teacher absenteeism
and disinterest in colleges and universities. It needs to be immediately reversed with
encouraging statistics of teachers‘ work engagement in order to achieve the vision of
becoming a developed society. This concern is shared by the academicians leading
Indian Universities as none of Indian Universities could feature in the list of world‘s
top 200 Universities as per QS World University rankings for the year 2014-15.
According to a study titled, Skilling India: Empowering Indian Youth through
World Class Education conducted by the Associated Chamber of Commerce and
Industry of India (ASSOCHAM, 2014), Indians spend about $6-7 billion per annum
in sending their children abroad for higher education. This is not just the case of the
elite population but also the middle class families who spend their life time savings
for educating their children abroad. As per the study, more than 2.9 lakh Indians
went abroad in 2013 and the count shot up to 6.8 lakh in 2014. One of the major
reasons cited for this trend was the lack of quality of education in India. Hence,
there is a concern that the country is losing foreign exchange and revenue due to the
large exodus of students. If these students could got an opportunity to obtain
equivalent quality education in India, they might have stayed back. Thus, the quality
of tertiary education in India definitely needs to be increased to match global
standards.
P a g e | 14
Being a service, the quality of education is anchored to its service provider.
In the higher education sector, the massive exodus of India‘s best and
brightest science and engineering students to the seemingly greener pastures calls
for enthusiasm of academicians to mend the flaws in the prevailing education
system. Yadav and Yadav (2010) emphasized upon the role of universities in
national development by highlighting the facts that the celebrated Massachusetts
Institute of Technology (MIT) graduates alone originated technologies that have
generated worldwide revenues nearing US$ 2 trillion. United States houses half of
the top 20 universities in engineering and technology, which leaves no doubt
regarding why the country dominates the global order. For India to attain this
position, it is imperative to reconstitute India‘s innovation systems on the lines
prescribed by Pandit Jawaharlal Nehru who sowed the seeds of the Indian Institutes
of Technology (Yadav and Yadav, 2010). Department of Higher Education,
Ministry of HRD, Government of India launched Rashtriya Uchchatar Shiksha
Abhiyan (RUSA) a Centrally Sponsored Scheme (CSS), in 2013 with the aim of
providing strategic funding to eligible state higher educational institutions. The
funding to states would be based on a critical appraisal of State Higher Education
Plans, as to how do they address issues of equity, access and excellence in higher
education. Juluri (2014) commended Prime Minister Narendra Modi‘s idea of
investing in making good teachers expressed in his Teacher‘s Day address on
September 5, 2014. He emphasized on making the right social investment, to make
India a nation of teachers with a global presence, a ―Jagat Guru‖, so to speak. In
order to achieve this vision every higher education institution needs to emulate the
world‘s most celebrated universities. One of the key factors driving the quality of
education is teacher‘s engagement in their work. It highlights the vital need for
investigation of work engagement of teachers or faculty members in the higher
education sector. Hence, there is a strong rationale for empirical studies on work
engagement of faculty members in the higher education sector, so as to understand
the dynamics of this vital phenomena and measures for enhancing it. As Barkhuizen
and Rothmann (2006) on the basis of their study of academic staff in South African
Higher Education Institutions, aptly concluded that higher education institutions
should measure the engagement of their academic staff and provide feedback to the
individuals. There should be interventions to promote work engagement of academic
staff at all levels.
P a g e | 15
1.7 CHAPTER SUMMARY
This chapter introduces the concept of employee work engagement and its
significance in the contemporary work arena. It throws light on its evolution,
definitions, theoretical frameworks, classification of employees according to
engagement and finally the rationale and significance of the study.
With the onset of 21st century, the paradigm shift in psychological contract
between the employer and the employee has been examined. In this light, the need to
take special measures for work engagement of the 21st century employees has been
brought out. The characteristics of engaged and disengaged employees have been
identified. The evolution of the construct has been traced from 1990s to 2015. The
relevance of work engagement has been brought out in the context of globalization
giving rise to boundary less organizations. Success of global workforce is keyed in
their capacity to engage physically, mentally and emotionally in their work roles.
The various definitions of employee work engagement proposed by academic
authors and authors from consulting firms have been given. Four theoretical
frameworks for the construct have been explained in this chapter. These are (1) The
Needs – Satisfying Approach (2) Job Demands and Resources Model (3) The
Affective Shift Model (4) Social Exchange Theory. The classification of employees
into the ‗engaged‘, ‗not-engaged‘ and ‗disengaged‘ as conceived by Gallup (2006)
has been explained. Another interesting and relevant classification cited is by
Blessing White and HR Annexi (2008) which classifies employees into 5 categories
namely the ‗engaged‘, ‗almost engaged‘, ‗honeymooners and hamsters‘, ‗crash and
burn‘ and ‗the disengaged‘ has been reported along with the proposed engagement
strategy for each segment.
Towards its culmination, this chapter builds a rationale for the study. It
compares the current size of Indian Higher Education Sector with scenario at the
time of independence. The total Foreign Direct Investment into education sector
from 2000 to 2015 has been mentioned and potential for future growth has been
discussed. Government of India‘s steps for addressing issues of equity, access and
excellence in higher education like the Rashtriya Uchchatar Shiksha Abhiyan
(RUSA), launched in 2013 have been mentioned. Despite its size and growth
potential, the challenges faced by Indian higher education sector have been
P a g e | 16
discussed. A major one being the massive exodus of India‘s best and brightest
students to the seemingly greener pastures costing India a revenue loss of $ 6-7
billion per annum according to ASSOCHAM (2014). This calls for enthusiasm of
academicians to mend the flaws in the prevailing education system. Given the issue
of below expected quality of teaching and learning, lack of quality assurance and
poor accountability of teaching staff in higher education institutions, it is vital to
investigate the status of work engagement amongst faculty members, explore the
factors associated with it and identify measures for its enhancement. The
significance of a study on employee work engagement of teachers in the higher
education sector can be estimated from Prime Minister Narendra Modi‘s idea of
making the right social investment in making India a nation of teachers with a global
presence, a ―Jagat Guru‖. Thus, a strong rationale was found for an empirical study
on work engagement of faculty members in the higher education sector, so as to
understand the dynamics of this vital phenomena and measures for enhancing it.
**********
CHAPTER – 2
REVIEW OF LITERATURE
P a g e | 17
CHAPTER – 2
REVIEW OF LITERATURE
——————————————————————————————————
The construct of work engagement is truly multidimensional and its
dynamics have been explored from various perspectives. In order to arrive at a lucid
understanding of the construct from a holistic perspective a comprehensive review
of literature was undertaken. The classic and the contemporary research studies
clarifying various dimensions of work engagement have been carefully examined.
Extant research studies have been categorized as follows:
2.1 Studies on Work Engagement as a unique construct
2.2 Studies on Measurement of work engagement
2.3 Studies on Factors affecting work engagement
2.4 Studies on Relationship of work engagement with job crafting,
organizational commitment, work life balance and work stress
2.5 Studies on Engagement – performance link
Based on a careful review of previous studies, the research gaps were
identified. Accordingly, the objectives of the study and hypotheses were framed.
2.1 STUDIES ON WORK ENGAGEMENT AS A UNIQUE CONSTRUCT
Engagement is an important issue, not only for academics and researchers
but also for practitioners in organizations (May et al., 2004). Interest in engagement
arose with the shift in focus in industrial psychology to positive organizational
behavior (Rothmann & Storm, 2003; Strumpfer, 2003). Research by Schaufeli et al.
(2002) stimulated studies regarding work engagement as the antipode of burnout. In
order to gauge the construct validity of work engagement several definitions
available in extant literature were examined and the same are presented in the
following paragraphs according to similarity of content rather than chronology.
According to Bakker (2011), Kahn was one of the first to theorize about
work engagement. Kahn (1990) coined the terms personal engagement and personal
disengagement. The terms describe the behaviours depicting personal involvement
or withdrawal during performance of work roles. He defined personal engagement
as the harnessing of organization members' selves to their work roles. In a state of
P a g e | 18
engagement, people employ and express themselves physically, cognitively and
emotionally. He defined personal disengagement as the uncoupling of self from the
work role. According to Kahn (1990) people can use varying degrees of their selves,
in the roles they perform. The more people draw on their selves to perform their
roles, the more stirring are their performances. Kahn (1990) based his theory upon
the idea that people have an inherent tendency to protect themselves from both
isolation and engulfment by alternately pulling away from and moving towards
group memberships. Kahn‘s conceptualization is based the premises of work
redesign model of Hackman & Oldham (1980) stating that people's attitudes and
behaviors are driven by the psychological experience of work. Secondly, it is also
built upon individual, interpersonal, group, intergroup and organizational factors
influencing organizational behavior (Alderfer, 1985).Thus, engaged employees put
much effort into their work because they identify with it. According to Kahn (1990)
a dynamic, dialectical relationship exists between the person who invests personal
energies into one‘s work role on the one hand and the work role that allows this
person to express him or herself on the other hand.
Inspired by the work of Kahn (1990), Rothbard (2001) defined engagement
as a motivational construct consisting of two dimensions namely attention and
absorption. Attention refers to the duration of focus in work and remaining mentally
preoccupied in the work role. It can be gauged from the time spent in thinking about
and concentrating on the work role. Absorption refers to intensity of focus. It was
characterized as loosing track of time and becoming engrossed in work role. It is
noteworthy that the most contemporary research on work engagement has been
stimulated by research on burnout. Maslach and Leiter (1997) termed engagement as
the positive antipode of burnout. They rephrased burnout as an erosion of
engagement with the job. In the view of these authors, work engagement is
characterised by energy, involvement and efficacy, which are considered the direct
opposites of the three burnout dimensions namely exhaustion, cynicism and lack of
professional efficacy respectively.
Schaufeli et al. (2002) partly agreed with Maslach and Leiter‘s (1997)
description, but took a different perspective and defined work engagement in its own
right. They stated that burnout and engagement are not perfectly negatively
correlated. An employee who is not burned-out may score high or low on
P a g e | 19
engagement, whereas an engaged employee may score high or low on burnout.
Furthermore, they considered burnout and engagement on two independent
dimensions namely activation and identification. On the lowest end of activation
continuum lies exhaustion and on its highest end lies vigour. Identification ranges
from cynicism on the lowest end to dedication on the highest end. The state of
burnout is characterised by a combination of low activation or exhaustion with low
identification or cynicism. Engagement is characterised by a combination high
activation or vigour with high identification or dedication. Schaufeli et al. (2002)
defined work engagement as a positive, fulfilling, work-related state of mind that is
persistent and pervasive. It is not focused on any particular object, event, individual
or behaviour. Work engagement consists of three dimensions namely vigour,
dedication and absorption. Vigour at work is reflected in the form of high levels of
energy and mental resilience, the willingness to make efforts, persistence even in the
face of difficulties and not being easily fatigued. Dedication is characterised by
deriving a sense of meaning from one‘s work, feeling enthusiastic and proud of the
job while being inspired as well as challenged by it. Absorption is manifested as the
incumbent being totally and happily immersed in one‘s work to the extent of having
difficulties detaching oneself from it. In a state of absorption, one forgets everything
else that is around, feels that time passes quickly, so much so that while at work one
looses the sense of time.
Harter et al. (2002) defined engagement as the combination of individual‘s
involvement, satisfaction and enthusiasm for work. Colbert et al. (2004) defined
engagement as a high internal motivational state. Wellins and Concelman (2005)
considered it to be a synthesis commitment, loyalty, productivity and ownership.
They termed it as an illusive force that motivates employees to higher levels of
performance. They addressed it as a desirable energy similar to organizational
commitment, job ownership, high levels of discretionary effort, passion and
excitement for work. Fleming and Asplund (2007) drew a similarity between
employee work engagement and customer engagement as both are characterized by
confidence, pride, integrity and passion. In a joint survey by the consultants HR
Anexi and Blessing White (2008) engagement was defined in terms of an
individual‘s personal satisfaction in the role and contribution to the company‘s
success. Full engagement represents an alignment of maximum job satisfaction with
maximum job contribution.
P a g e | 20
Establishing a constructive critique of such definitions, Macey and Schneider
(2008) observed that many HR consultants avoid defining the term, instead refer
only to its presumed positive consequences. The question remains as to whether
engagement is a unique concept or merely a repackaging of other constructs.
Newman et al. (2011) stated that engagement actually commits the jangle fallacy, in
which apparently similar constructs measuring like nomological networks are
labeled unique from one another (Kelley, 1927). They raised a fundamental question
as to whether employee work engagement is different from an overall job attitude.
Macey and Schneider (2008) and Shuck et al. (2013) discretely established work
engagement as a unique concept, despite its seeming similarity with job satisfaction,
organizational commitment, job involvement and workaholism as detailed in the
following paragraphs.
Several authors defined engagement as a satisfaction-related concept
(Fleming & Asplund, 2007; Harter et al., 2002; Wagner & Harter, 2006). Harter et
al. (2002) defined engagement as ―satisfaction-engagement,‖ implying that
engagement and satisfaction with one‘s work are conceptually the same.
Furthermore, practitioner based models (Towers Watson, 2014) defined engagement
as having rational and cognitive elements, suggesting that engagement and
satisfaction are similar. On the contrary Erickson (2005) pointed out that,
engagement is a gradually forward moving state whereas satisfaction is stationary
and indicates fulfillment. Satisfaction is characterized by contentment and the
fulfillment of human needs through organizational means. This suggests that while
satisfaction connotes fulfillment, engagement connotes urgency, focus, and intensity
(Macey et al., 2009).
Fleming, et al. (2005), Gallup Organization researchers used the term
‗committed employees‘ as a synonym for engaged employees. The Corporate
Executive Board (2004) observed that engagement is the extent of employee
commitment to someone or something in their organization, the level of hard work
they put in and how long they stay in the organization as a result of that
commitment. According to Saks (2006) commitment is a person‘s attachment or
attitude towards an organization. Engagement is not an attitude but rather a state and
operationally speaking, it is the level upto which persons are attentive and absorbed
in their work (Saks, 2006). Comparing both, Kahn (1990) observed that
P a g e | 21
organizational commitment is comparatively stable over time, while engagement is
subject to variations as employees interpret and interact with a lot of environmental
stimuli in the workplace.
Work engagement has been often likened with job involvement. According
to Brown (1996), job involvement indicates a state of self engagement in the job. On
the contrary, Salanova et al. (2005), observed that job involvement is a part of
engagement but not equivalent to it. From the perspective of May et al. (2004),
engagement is as an antecedent to job involvement indicating that individuals who
experience high level of engagement in their roles should identify with their jobs. It
was further observed that job involvement is a cognitive judgment about the job,
which is anchored to self-image (Saks, 2006), whereas work engagement is a wider,
more inclusive construct consisting of energy and enthusiasm towards the job
(Christian et al., 2011; Kahn, 1990; Rich et al., 2010).
Another interesting investigation is that of the perceived similarity between
work engagement and workaholism, thus, answering the question whether engaged
employees are workaholics. The term workaholism was coined by Oates (1971),
who described it as the urge, compulsion or the uncontrollable need to work
persistently. Hence, workaholics tend to spend an exceptional amount of time to
work and incessantly think about work, even when not working. Hence, it can be
inferred that that workaholics are obsessed with their work. Simply opposite to these
characteristics, the behavioral characteristics of engaged employees show that they
are not addicted to work (Bakker and Demerouti, 2008). Unlike workaholics, they
enjoy doing things outside work, do not feel guilty when not working and do not
work hard because of a strong and irresistible inner drive. Rather, the engaged
employees work because they enjoy doing so.
Bakker (2011) clarified that work engagement is different from work-related
flow. Engagement refers to a longer performance experience whereas flow typically
refers to a peak experience that may last only an hour or even lesser than that. He
further stated that work engagement is different from motivation as it refers to
cognition and affect in addition to motivation.
Thus, on the basis of the comparison made in the preceding paragraphs,
engagement is clearly established as a novel and unique concept. Studies quoted
here provide substantial empirical evidence of employee work engagement being a
P a g e | 22
distinct construct. Further, it is worth mentioning that Rich et al. (2010) established
that performance-related outcomes were better predicted by work engagement as
compared to job involvement, job satisfaction and intrinsic motivation. They found
that engagement is the concurrent investment of cognitive, affective and bodily
energies into performance-related outcomes representing something exclusive,
differentiating engagement from other potentially related variables. Engagement is
now an established term in both managerial and academic literature and appears
unlikely to be forsaken as a fad (Guest, 2013).
2.2 STUDIES ON MEASUREMENT OF WORK ENGAGEMENT
Measurement of any phenomenon is vital for framing mechanisms to
increase its level or spread. For measuring employee work engagement, a 12
questions instrument developed was by Gallup Organization which has been referred
by various authors as the Q12, Gallup Workplace Audit (GWA) or Gallup
Engagement Index. The items measure four theoretical constructs namely, ‗what do
I get?, what do I give?, do I belong? and how can we grow?‘(Buckingham and
Coffman, 1999). Macey & Schneider (2008) observed that in the world of practice
some measures of conditions for engagement are relabeled as measures of
engagement (such as Buckingham & Coffman, 1999). Substantiating this argument
further, Schiemann and Morgan (2006) observed that the focus of measurement
should be on the construct of interest; if engagement is the target, then the measure
should map the content of the construct. Unfortunately Gallup Workplace Audit,
fails to measure up on these criteria.
Maslach and Leiter (1997) assessed work engagement by the opposite
pattern of scores on the three dimensions of Maslach Burnout Inventory - General
Survey (MBI-GS) developed by Schaufeli et al. (1996). The MBI-GS measures the
three dimensions of the burnout-engagement range: exhaustion-energy, cynicism-
involvement, and inefficacy-efficacy. The MBI-GS includes three subscales namely
exhaustion, cynicism and professional efficacy. MBI-GS is a 16-item measure. The
items are statements of job-related feelings. There are five items on exhaustion sub
scale, five items on cynicism sub scale and six items on professional efficacy sub
scale. All items are scored on a 7-point frequency rating scale ranging from ―never‖
indicated by 0 to ―always‖ indicated by 6. Example items are: ―I feel emotionally
P a g e | 23
drained from my work‖ (exhaustion); ―I have become more cynical about whether
my work contributes anything‖ (cynicism); ―At my work, I feel confident that I am
effective at getting things done‖ (professional efficacy). Maslach and Leiter (1997)
concluded that low scores on exhaustion and cynicism and high scores on
professional efficacy indicate engagement. In other words, according to them
engagement can be measured by opposite pattern of scores on MBI-GS.
With reference to the measurement of work engagement, Schaufeli et al.
(2002) disagreed with Maslach and Leiter (1997), who stated that engagement is
effectively measured by the opposite pattern of MBI scores. Instead, Schaufeli et al.
(2002) argued that, by using the MBI for measuring work engagement, it is not
feasible to make an empirical study of its relationship with burnout since both
concepts are considered to be opposite poles of a continuum that is covered by one
single instrument i.e MBI. They stated that work engagement is the positive
antithesis of burnout but the structure and hence measurement of both concepts
differ. Hence, Schaufeli et al. (2002) developed the Utrecht Work Engagement Scale
– UWES), a self-report questionnaire to measure work engagement. It includes three
dimensions namely vigour, dedication and absorption. It includes items such as: ―I
am bursting with energy in my work‖ (vigour); ―My job inspires me‖ (dedication);
―I feel happy when I‘m engrossed in my work‖ (absorption). As far as the number of
items is concerned, different versions of UWES are available namely UWES – 17,
UWES – 15 and UWES-9. Utrecht Work Engagement Scale (UWES) is one of the
often used instrument to measure engagement as it has been validated in many
countries across the world (Schaufeli et al., 2002). Schaufeli et al. (2006) developed
the nine-item version of the UWES and provided evidence for its cross-national
validity. UWES, is a valid and reliable indicator of work engagement that can be
used for future research (Schaufeli and Bakker, 2004).
Demerouti et al.(2010) proposed another instrument for the assessment of
work engagement called Oldenburg Burnout Inventory (OLBI). This instrument was
developed originally to assess burnout, but includes both positively and negatively
phrased items. It can be used to assess work engagement as well by recoding the
negatively framed items. The OLBI includes two dimensions namely exhaustion and
disengagement (from work). Contrary to MBI-GS, the OLBI encompasses not only
affective domain of exhaustion but also physical and cognitive domains. This
P a g e | 24
facilitates the application of the instrument to those workers who perform physical
work as well as those whose job deals mainly with processing information.
Disengagement in the OLBI refers to distancing oneself from one‘s work.
Disengagement items concern the relationship between employees and their jobs,
specifically with respect to identification with work and desire to continue in the
same occupation. Disengaged employees behold negative attitudes towards their
work. The reliability and factorial validity of the OLBI has been confirmed in
studies conducted in Germany, Greece, the Netherlands, the USA, and South Africa.
2.3 STUDIES ON FACTORS AFFECTING WORK ENGAGEMENT
Kahn (1990) did a pioneering qualitative study on personal engagement. He
interviewed summer camp counselors and members of an architecture firm in order
to enquire about their moments of engagement and disengagement at work. He
found that these experiences are associated with three psychological conditions
namely meaningfulness, safety and availability. Psychological meaningfulness is
determined by characteristics of the task, role and interactions at work. People
consider work to be meaningful when they feel that their tasks are worthwhile and
making a difference in the lives of others. Work that is challenging, clearly outlined,
varied, creative and somewhat autonomous is perceived to be meaningful.
Meaningfulness is also determined by people‘s liking or disliking for the role
identities that they are required to assume. There is more liking for roles which
made people feel important about their status in the organization and their influence
on the external world. Psychological meaningfulness is experienced when there are
gratifying interpersonal interactions with co-workers and clients during task
performance. Such interactions boost self-respect, self-appreciation and a sense of
being valuable. According to Kahn (1990), the second determinant of personal
engagement namely, psychological safety is linked with nonthreatening and
predictable social situations. It is experienced when people could engage themselves
in work freely, without fear of negative results to self image, career or status.
Psychological safety was indicated by interpersonal relationships depicting
openness, flexibility, trust, support and lack of threat. The third determinant of
personal engagement, namely, psychological availability is associated with the sense
of possession of the physical, psychological and emotional resources necessary for
P a g e | 25
role performance. Thus, Kahn (1990) delved deep into the factors affecting personal
engagement and was successful in identifying the same.
Kahn‘s (1990) model was empirically tested by May et al. (2004) who
substantiated the findings that psychological meaningfulness, safety, and availability
are significantly related to engagement. They found that job enrichment and role fit
are positive predictors of psychological meaningfulness. Gratifying co-worker
relations coupled with supportive supervisor relations positively predict
psychological safety. Adherence to co-worker norms and self-consciousness
negatively predict psychological safety. Availability of resources positively predicts
psychological availability. Participation in outside activities negatively predict
psychological availability.
As per the school of thought propounded by Maslach et al. (2001) job
engagement was described as the positive antithesis of burnout. According to them,
engagement is determined by six aspects of work-life namely, rewards and
recognition, workload, community and social support, degree of control, perceived
fairness and values. Job engagement is positively associated with work that is both
meaningful as well as valued, workload that is sustainable, sense of choice and
control over work, suitable recognition and rewards, a helpful work community and
a sense of fairness.
Saks (2006) remarked that Kahn‘s (1990) and Maslach et al.‘s (2001) models
do explain the conditions necessary for engagement but they do not fully explain
why individuals react to these conditions with dissimilar degrees of engagement.
Theoretically, he found a stronger underlying principle for explaining employee
work engagement in Social Exchange Theory (SET) proposed by Cropanzano and
Mitchell (2005). According to this theory when there is an interaction between two
or more mutually dependent parties, mutual obligations are generated. Over a period
of time, mutual commitments are developed, if they abide by certain rules of
exchange. For example, when organization gives economic and socio-emotional
resources like pay and recognition to the individuals, employees feel obliged to pay
back to the organization through their level of engagement (Cropanzano and
Mitchell, 2005). In consonance with Social Exchange Theory, Robinson et al.
(2004) also described engagement as a two-way relationship between the employer
and employee. Adding finer details to the factors affecting engagement, Saks (2006)
P a g e | 26
found that employee work engagement can be distinguished into two forms namely
job engagement and organizational engagement. Both the forms of engagement are
determined by a common factor, namely, perceived organizational support.
Employees who perceive higher organizational support are more likely to
reciprocate with greater levels of engagement in their job and in the organization.
Specifically, job engagement is predicted by job characteristics. Those who are
provided with jobs that are high on the job characteristics are more likely to exhibit
greater job engagement. Those who perceive higher procedural justice are more
likely to experience greater organization engagement. Thus, Saks (2006) concluded
that the level of physical, cognitive, and emotional resources invested by an
individual during role performance is predicted by the economic and socio-
emotional resources received from the organization. Engaged employees are also
more likely to have a high-quality relationship with their employer leading them to
also have more positive attitudes, intentions, and behaviors.
Bakker and Demerouti (2008) proposed Job Demands and Resources Model
of Work Engagement. This model is another important contribution to literature and
the field of practice alike as it identifies the factors affecting work engagement.
Bakker and Demerouti (2008) found that engagement is determined by typical job
resources and personal resources.
Job Demands and Resources model of work engagement (Bakker and
Demerouti, 2008) draws upon two assumptions from the Job Demands - Resources
(JD-R) model (Bakker and Demerouti, 2007; Demerouti et al., 2001). The first
assumption is that job resources result in work engagement and higher performance.
The second assumption is that job resources particularly impact work engagement
when job demands are high. It was built upon the work of Xanthopoulou et al.
(2007) which established personal resources to be independent determinants of work
engagement.
Job demands are those aspects of the job that require persistent effort or
skills and are therefore related with certain physiological and/or psychological costs
(Demerouti et al., 2001; Bakker and Demerouti, 2007). The nature of job demands
may be psychological, social, physical or organizational for example emotionally
P a g e | 27
demanding communication with clients, high work pressure and an adverse physical
environment. Job resources are those aspects of the job that are imperative for
reducing job demands, achieving work goals and enhancing personal development
(Demerouti et al., 2001; Bakker and Demerouti, 2007). Demerouti et al. (2001)
explained that the source of job resources may be the organization as far as pay,
career opportunities and job security is concerned. Alternately, job resources may be
provided by interpersonal and social relations for example support from co-workers
and team climate. The manner of organizing work for example giving role clarity
and participation in decision making are other forms of job resources. A job
providing task significance and identity, variety of skills, autonomy and
performance feedback is considered to be rich in job resources. Schaufeli and
Bakker (2004) found that job resources are essential for meeting job demands and
important in their own right. Job resources are positively associated with work
engagement (Bakker and Demerouti, 2007; Schaufeli and Salanova, 2007). Job
resources namely job control, climate, supervisor support, innovativeness,
information and appreciation were positively related to work engagement
(Demerouti et al., 2001; Hobfoll, 2001). In comparison with other job resources
tested, appreciation appeared to be the strongest predictor of all work engagement
dimensions.
Personal resources are positive self-evaluations about individuals‘ perception
of their ability to successfully control and influence their environment (Hobfoll et
al., 2003). Xanthopoulou et al. (2007) found that work engagement was predicted by
three specific personal resources namely self-efficacy, organizational-based self-
esteem and optimism. Results showed that engaged employees are highly self-
efficacious, thus believing they have the capacity to meet a variety of job demands.
Engaged workers are optimistic and resilient thus perceiving that they will generally
experience positive results and bounce back soon even after meeting failures. The
level of their organizational-based self-esteem is generally high due to which they
believe that can gratify their needs by performing roles within the organization
(Mauno et al., 2007).
P a g e | 28
The Job Demands and Resources Model of Work engagement (Bakker and
Demerouti, 2008) is synchronized with job characteristics theory of Hackman and
Oldham (1980) which states that job resources such as autonomy, feedback and task
significance lead to intrinsic motivation. This model is in agreement with
Conservation of Resources (COR) theory of Hobfoll (2001). This theory states that
people seek to find, protect and retain what they value. Actual or potential loss of
resources results in individual stress. Job resources become more important when
employees are faced with high job demands because they can help in work goal
achievement.
Macey and Schneider (2008) proposed a framework illuminating the unique
attributes of employee work engagement, in terms of trait, state and behavioral
engagement and the factors predicting these. They found that trait engagement can
be regarded as an inclination to experience the world positively with a feeling of
enthusiasm. Trait engagement gets reflected in psychological state engagement.
They conceptualized psychological state engagement as a precursor of behavioral
engagement. Behavioral engagement is defined in terms of discretionary effort
within or outside the assigned role (Erickson, 2005 and Towers Watson, 2014).
According to this framework proposed by Macey and Scheider (2008), work
engagement is determined by factors such as workplace environment, work
attributes like autonomy, challenge, variety and transformational leadership. This is
also in line with the earlier findings of Kahn (1990) and McGregor‘s (1960) Theory
Y, advocating a participative management style allowing people to explore their full
potential. Macey & Schneider (2008) beautifully concluded that organization that
get these conditions right will have an engaged workforce, which surely is a
sustainable competitive edge.
Based on the studies cited in the preceding paragraphs, the commonalties in
factors affecting work engagement were deduced. The common factors across all the
studies came out to be job characteristics, personal resources, interpersonal relations
and organizational support. Various studies used specific terms having some factors
in common. Table 2.1 depicts the common factors deduced from all the studies cited
in this section :
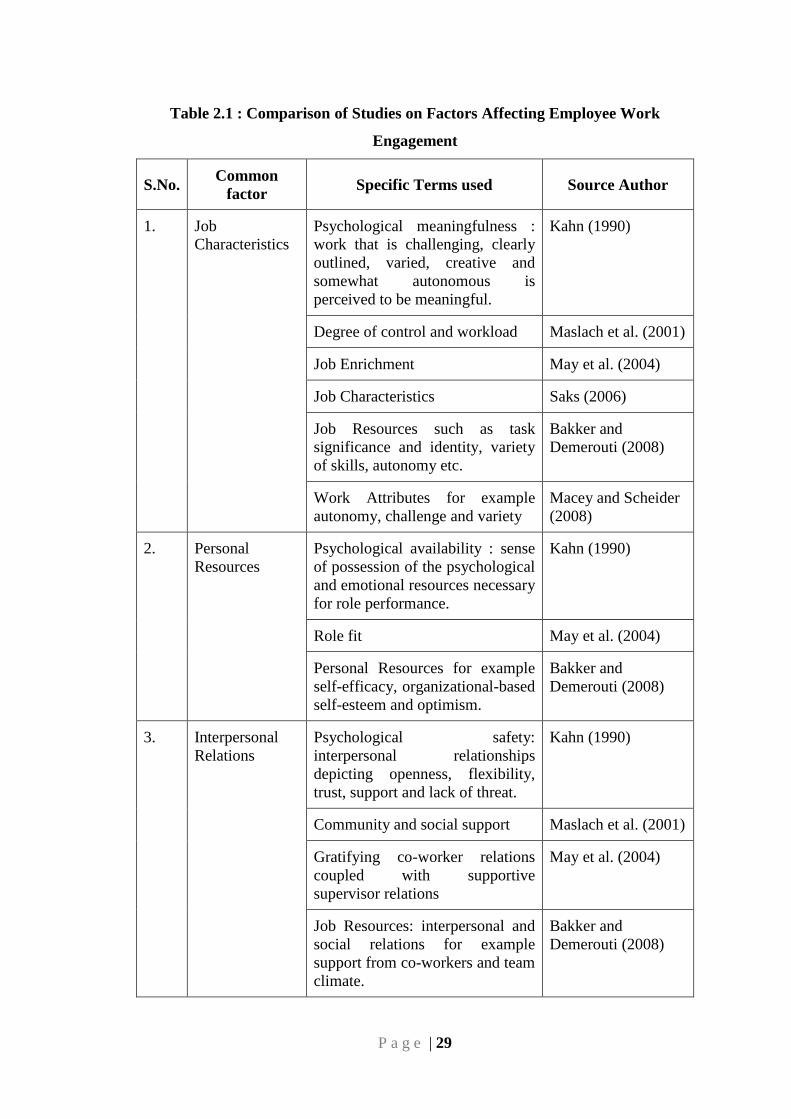
P a g e | 29
Table 2.1 : Comparison of Studies on Factors Affecting Employee Work
Engagement
S.No. Common
factor Specific Terms used Source Author
1. Job
Characteristics
Psychological meaningfulness :
work that is challenging, clearly
outlined, varied, creative and
somewhat autonomous is
perceived to be meaningful.
Kahn (1990)
Degree of control and workload Maslach et al. (2001)
Job Enrichment May et al. (2004)
Job Characteristics Saks (2006)
Job Resources such as task
significance and identity, variety
of skills, autonomy etc.
Bakker and
Demerouti (2008)
Work Attributes for example
autonomy, challenge and variety
Macey and Scheider
(2008)
2. Personal
Resources
Psychological availability : sense
of possession of the psychological
and emotional resources necessary
for role performance.
Kahn (1990)
Role fit May et al. (2004)
Personal Resources for example
self-efficacy, organizational-based
self-esteem and optimism.
Bakker and
Demerouti (2008)
3. Interpersonal
Relations
Psychological safety:
interpersonal relationships
depicting openness, flexibility,
trust, support and lack of threat.
Kahn (1990)
Community and social support Maslach et al. (2001)
Gratifying co-worker relations
coupled with supportive
supervisor relations
May et al. (2004)
Job Resources: interpersonal and
social relations for example
support from co-workers and team
climate.
Bakker and
Demerouti (2008)
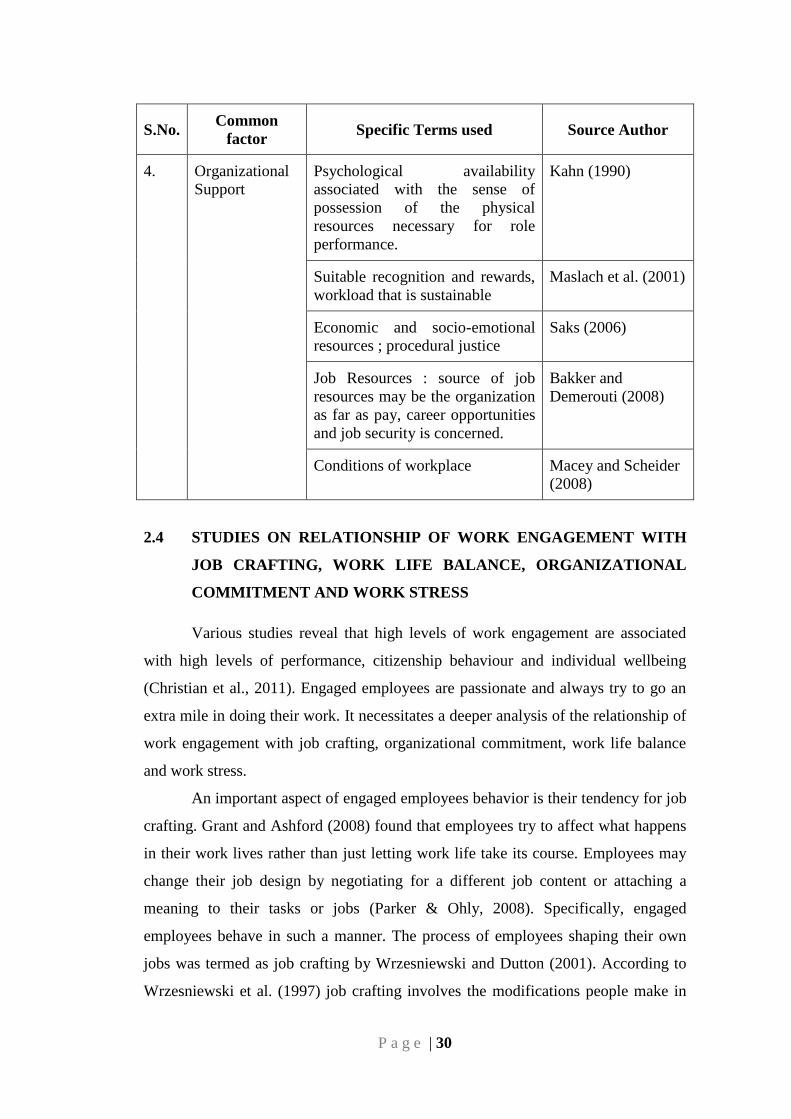
P a g e | 30
S.No. Common
factor Specific Terms used Source Author
4. Organizational
Support
Psychological availability
associated with the sense of
possession of the physical
resources necessary for role
performance.
Kahn (1990)
Suitable recognition and rewards,
workload that is sustainable
Maslach et al. (2001)
Economic and socio-emotional
resources ; procedural justice
Saks (2006)
Job Resources : source of job
resources may be the organization
as far as pay, career opportunities
and job security is concerned.
Bakker and
Demerouti (2008)
Conditions of workplace Macey and Scheider
(2008)
2.4 STUDIES ON RELATIONSHIP OF WORK ENGAGEMENT WITH
JOB CRAFTING, WORK LIFE BALANCE, ORGANIZATIONAL
COMMITMENT AND WORK STRESS
Various studies reveal that high levels of work engagement are associated
with high levels of performance, citizenship behaviour and individual wellbeing
(Christian et al., 2011). Engaged employees are passionate and always try to go an
extra mile in doing their work. It necessitates a deeper analysis of the relationship of
work engagement with job crafting, organizational commitment, work life balance
and work stress.
An important aspect of engaged employees behavior is their tendency for job
crafting. Grant and Ashford (2008) found that employees try to affect what happens
in their work lives rather than just letting work life take its course. Employees may
change their job design by negotiating for a different job content or attaching a
meaning to their tasks or jobs (Parker & Ohly, 2008). Specifically, engaged
employees behave in such a manner. The process of employees shaping their own
jobs was termed as job crafting by Wrzesniewski and Dutton (2001). According to
Wrzesniewski et al. (1997) job crafting involves the modifications people make in
P a g e | 31
their tasks or relational boundaries. The nature of change may be physical or
cognitive or both. A physical change refers to an alteration in the number, scope or
the form of job tasks. A cognitive change refers to one‘s perception of the job.
Relational boundaries pertain to job incumbent‘s discretion or choice over their
social interactions at work. The advantage of job crafting lies in its potential to
create a better person–job fit by enhancing the balance of job demands with
resources. Employees who derive a sense of enjoyment or fulfillment in their work
are more likely to engage in job crafting (Wrzesniewski et al.,1997). Job crafting is a
particular type of proactive work behavior that employees engage in to fine-tune
their job to their requirements, skills and preferences. Grant and Parker (2009)
proposed that job crafting can be classified under proactive person-environment fit
behaviors. While trying to craft their jobs employees try to change the situation or
oneself for better person-job fit. For example trying to increase work efficiency by
devising smarter ways of working and developing new skills required by the job.
Tims & Bakker (2010) defined individual job crafting as proactively increasing or
decreasing the job demands and resources. Job demands can be of two types namely
hindering job demands and challenging job demands (LePine et al., 2005).
Hindering job demands are those which interfere with work goal achievement.
Challenging job demands are those demands which appear to be difficult or stressful
but have positive results such as better skills and personal growth (Crawford et al.,
2010). In the face of job demands, the work environment may provide job resources
that not only help meet the demands but also kindle self growth, learning and
development (Demerouti et.al, 2001). On the basis of this framework of job
demands and resources, Tims et. al (2012) proposed that individual job crafting
includes four dimensions namely increasing social job resources for example,
seeking feedback from supervisor and peers; increasing structural job resources for
example requesting for greater autonomy; increasing challenging job demands for
example initiating new projects and decreasing hindering job demands for example
re-organizing work to avoid continuous sitting for long hours. In order to investigate
the effects of job crafting behaviours on employees' self-reported engagement, Chan
(2013) conducted a longitudinal study using daily diary method. The results revealed
that when job demands were high, increasing structural resources improved
engagement further as compared to a situation when demands were low. When
P a g e | 32
autonomy was high, increasing structural resources improved engagement further as
compared to when autonomy was low.
The term ―time bind‖ was coined by Hochschild (1997) to describe a number
of situations in which workers prefer dividing their time between work and personal
life in a manner which is different from the current state but find it difficult to do so
or are unable to do so. Tausig and Fenwick (2001) suggested that time bind can be
understood as a perceived imbalance between work and family/personal life. The
opposite of a time bind is a sense of work-life balance. Montgomery et al. (2003)
observed that employees who carry positive feelings from their work life to personal
life or vice versa demonstrate significantly higher levels of engagement in
comparison with employees experiencing no such cross-over. Bakker et al. (2003)
conducted a study of work engagement amongst working couples and showed that
wives' levels of vigor and dedication for work exclusively contributes to husbands'
levels of the same parameters. Thornthwaite (2004) reported that employees‘ desire
for work-life balance is on the increase and employers have begun to offer active
support in this direction. Emslie & Hunt (2009) observed that employers responded
to their employees‘ work-life balance needs by providing supplementary benefits
such as on-site childcare service and paid maternity leave. Organizational assistance
for work life balance is one of the criteria of Fortune magazine to declare its list of
the 100 best companies to work for (Muse et al., 2008). Both employees and
organizations benefit from effectively balanced work and family life. When
employees experience a harmony between their professional and personal lives, they
are able to devote themselves fully to their work roles. Hence, work-life balance
improves work engagement, which is associated with organizational performance
enhancement (Hammer et al., 2005; Greenhaus and Powell, 2006; Carlson et al.,
2008). Bakker et al. (2014) found that work engagement is positively associated
with work-family facilitation. Hence, it can be said that work engagement is
positively associated with work-life balance.
As managers look for ways to enhance employee performance and retention,
the concept of employee commitment to organizations has become all the more
important in research literature. Porter et. al (1974) defined organizational
commitment as the relative strength of an individual's identification with the
organization and involvement in its activities. Committed employees charac-
P a g e | 33
teristically possess a strong belief in the organization's goals and values, have a
willingness to exert substantial effort on behalf of the organization and a firm desire
to maintain membership in the organization. Highly committed employees may
outperform their less committed companions indicating that organizational
commitment may be a helpful indicator of the organizational effectiveness (Mowday
et. al, 1974). Hakanen et al. (2006) in a study of Finnish Teachers proved that work
engagement plays a mediating role in the relationship between job resources and
organizational commitment. There is a positive relationship between work
engagement and affective emotional commitment (Richardsen et al., 2006; Llorens
et al., 2006; Hakanen et al., 2006; Saks, 2006; Demerouti et al., 2001; Maslach et al.,
2001; Brown and Leigh, 1996).
Any discussion on the behavioral aspects of engaged employees would be
incomplete without explaining the results of over indulgence in work. Although
work engagement is a virtuous concept, over indulgence in work might lead to some
unwanted / unforeseen negative consequences for the engaged employees. In a
survey study conducted by Bakker et al. (2004) amongst the Dutch workforce it was
found that work engagement was positively associated with working overtime and
taking work home. Further, the work-life balance literature reveals that work-home
interference slows recovery from stress and may lead to health related issues (Geurts
& Demerouti, 2003). Specifically, the absorption component of work engagement
appears to lead to unhealthy behavior. The term ‗stress‘ is quietly widely used, yet
its meaning remains vague. Modern definitions of stress clarify that it is a personal
experience caused by work demands or pressure which influences the individual‘s
coping ability or perception of the same Blaug et.al, 2007). The National Institute of
Occupational Safety and Health (1999) defined stress as the harmful emotional and
physical responses that occur when job requirements do not match workers‘
capabilities, resources and needs. According to the demands–control model
(Karasek, 1979), job stress is specifically caused by the coupling of high job
demands particularly work overload and time pressure with low job control. Further
research on job stress and burnout revealed a list of job demands and job resources
whose deficiency leads to stress namely low social and supervisory support,
emotional demands and lack of performance feedback (Kahn & Byosiere, 1992; Lee
& Ashforth, 1996). The Health and Safety Executive (2006) identified six categories
P a g e | 34
of factors that can be identified as potential causes of work-related stress namely
control, demands, inter-personal relationships, change and role support. Palmer et. al
(2004) added a seventh driver of stress namely culture of the organization stating
that what matters is how work-related stress is approached and managed. Upon a
comparison of the factors affecting work engagement and the potential causes of
stress many commonalities can be noticed for example job demands, job resources,
inter-personal relationships and role support. The commonality in the causative
factors behind the two phenomena is the rationale for a deeper examination of the
relation between the two.
Pines et al. (1981) found that employees who are more vulnerable towards
falling in the ‗over engagement trap‘ are the ones who have been ―on fire‖ at one
time. Employees who are so much absorbed in their work life that they forget to rest
and recoup, may develop health problems, disturb their work-life harmony and fall
into the trap of ‗presenteeism‘ or ‗workaholism‘. Thus it can be said that there is a
thin line between engagement and over-engagement and by crossing it, one does
more harm than good to self as well as the larger system. Too much stress may lead
to a state of burnout. Burnout is defined as a condition of exhaustion, cynicism and
reduced professional efficacy (Maslach et al., 1996). According to the Job
Demands–Resources (JD–R) Model (Bakker et al.,2003) job demands and job
resources may give rise to two different, but related processes. On the positive side
there is a motivational process in which job resources promote engagement and
organizational commitment (Schaufeli & Bakker, 2004). On the flip side, there is an
energetic process in which high job demands wear out or exhaust employees‘ mental
and physical resources therefore leading to burnout and eventually to ill health. In a
specific study of burnout and work engagement amongst Finnish teachers, Hakanen
et. al (2006) proved that teachers‘ job demands would predict ill health through their
impact on burnout and that teachers‘ job resources would predict organizational
commitment through work engagement. They proved that burnout is inversely
related to work engagement.
2.5 STUDIES ON THE ENGAGEMENT – PERFORMANCE LINK
The study of work engagement would not be complete till the engagement –
performance link is thoroughly investigated. Only a few studies have investigated
P a g e | 35
the relationship between work engagement and job performance (Bakker &
Demerouti, 2007). Nevertheless, their results are promising. Bakker et al. (2004)
reported that engaged employees received higher ratings from their colleagues on in-
role and extra-role performance. It shows that engaged employees perform well and
are willing to go the extra mile. They outshine others in both in-role and extra-role
performance. They were more often asked to carry out additional task of particular
significance to the organization. Salanova et al. (2005) in a study among personnel
working in Spanish restaurants and hotels, concluded that organizational resources
and work engagement predicted service climate, which in turn predicted employee
performance and customer loyalty. Bakker et al. (2006) conducted a study on
engagement and performance among school principals and teachers. Their study
showed a strong association between engagement and performance in terms of
creativity. The higher school principals‘ levels of work engagement, the better they
were able to come up with a assortment of ways to handle work-related problems.
The engaged school principals were seen as transformational leaders, able to inspire
and coach their co-workers.
Xanthopoulou et al. (2007) made a strong case of work engagement as a
predictor of daily performance, on the basis of their study among Greek employees
working in a fast-food restaurant. Results proved that employees were more engaged
on days on which they possessed many job resources as well as personal resources
thus clearly showing that engaged employees perform better on a daily basis.
Thus, on the basis of various studies cited herein, it can be said that work
engagement has a positive impact on job performance. Bakker et al. (2008) observed
that employees who are engaged are able to create their own resources, which
creates a positive gain spiral. Engaged employees outperform the less engaged ones
as the former often experience positive emotions, better psychological and physical
health, create their own job and personal resources and transfer their engagement to
others. Fredrickson (2001) established that positive emotions broaden people‘s
thought-action repository. Employees who create their own resources are better able
to deal with their job demands and to achieve their work goals (Bakker &
Demerouti, 2007). Organizational performance is the result of the combined effort
of individual employees. It is therefore conceivable that the crossover of
engagement among members of the same work team increases performance.
P a g e | 36
According to Westman (2001), crossover or emotional contagion is the
transmission of positive or negative experiences from one person to another. An
innovative laboratory study was conducted by Barsade (2002) to study the transfer
of moods among people in a group and its impact on performance. It was concluded
that the pleasant mood of a colleague influenced the mood of the other team
members. More cooperative behaviour and better task performance resulted from the
transfer of positive moods. On similar lines, Sy et al. (2005) found that team
members coordinated better when leaders were in a positive mood, thus saving on
efforts as compared to groups with leaders in a negative mood. Bamford et.al (2013)
studied the role of managers in promoting work engagement among their team
mates. In a sample survey of nursing staff working in acute care hospitals, they
found that nurses who work for managers with higher levels of authentic leadership
reported greater work engagement. To add significantly to these findings, Bakker et
al. (2006) proved that engaged workers who communicate their sanguinity and
proactive behaviors to their colleagues, develop a positive team climate, irrespective
of the job demands faced and resources available to them.
Maku (2014) found that employee work engagement is a primary indicator
of innovative performance. This study of library staff postulated that creativity and
innovation are spurred by employee work engagement practices such as job
enrichment, commitment to employees, work life balance, transparent appraisal,
opportunities for continuous learning and engagement evaluation systems predict
organizational performance. Engaged employees are more productive, work safer,
keep healthier and are less likely to leave their employer (Fleming & Asplund, 2007;
Wagner & Harter, 2006). Thus it can be said that research strongly supports the link
between work engagement and performance.
2.6 THE RESEARCH GAPS
Review of literature revealed that most of the studies on work engagement
used a cross-sectional design which cannot explain why even highly engaged
employees may have an off day and sometimes show below average or poor
performance. Daily changes in work engagement can be examined using
longitudinal studies.
P a g e | 37
Various studies have shown that interaction between job demands, job
resources and personal resources plays a critical role in determining work
engagement. From the point to view of framing human resource management
policies, it could be meaningful to conduct engagement studies on individuals from
various professions in order to address specific needs of a profession.
As reported by several authors, employees try to shape their jobs, making
physical or cognitive changes in order to establish a better person-job fit and this
process is termed as job crafting (Wrzesniewski et al., 1997; Grant and Ashford,
2008; Parker & Ohly, 2008; Tims & Bakker, 2010; Tims et. al, 2012). Although a
few studies (e.g. Chan, 2013) investigated the relationship between work
engagement and job crafting, further studies in this area may answer the question
whether engaged employees really create virtuous cycles.
It is more likely that work engagement will be sustainable when employee
well being is also high (Robertson and Cooper, 2010). Further research exploring the
links between work engagement and well being is required. Work-life balance is a
significant indicator of employee well being. Since, work engagement is known to
crossover from work to family setting (Montgomery et al., 2003; Bakker et al.,
2003; Bakker et al., 2014), it is vital to examine the relationship between work
engagement and work life balance.
Although work engagement is a virtuous concept, over indulgence in work
might lead to some negative consequences for the engaged employees (Geurts and
Demerouti, 2003 and Bakker et. al, 2004). They may also fall in the ‗over
engagement trap‘ (Pines et al.,1981) and eventually face situations of stress or even
burnout. Hence, research studies are required to examine the relationship between
work engagement and work stress.
In the corporate world managers continually look for ways to enhance
employee performance and retention. In this context, employee commitment to
organizations and its relationship with work engagement has become the subject of
research interest. Extant research proved that work engagement plays a mediating
role in the relationship between job resources and organizational commitment
(Hakanen et. al, 2006). Further research to investigate the relationship between
employee work engagement and organizational commitment could be instrumental
in development of HR policies on a sound theoretical base.
P a g e | 38
Paying attention to the geographical spread of work engagement studies, it is
noteworthy that very few studies have been conducted in India. There is a
requirement to conduct such studies in India in order to map the perception of Indian
population in the light of its culture and value system. The review of literature
revealed the need to conduct a comprehensive study of work engagement of faculty
members in the higher education sector, as very few such studies existed. One of the
less researched areas was an exploration of the factors affecting work engagement of
faculty members particularly in the Indian higher education sector, having its unique
size and challenges. Very few studies explored the relationship of work engagement
with phenomena like job crafting, work life balance, organizational commitment and
work stress. Hence, it was found to be a subject of research gap and interest. Based
on these, measures for enhancement of work engagement were sought to be
identified. Hence, according to these research gaps, the study objectives and
hypotheses were framed.
2.7 OBJECTIVES OF THE STUDY
The present study attempts to address some of the research gaps through its
objectives:
1) To measure the level of work engagement amongst the employees (faculty
members) working in organizations under the study.
2) To study the relationship (if any) between the level of work engagement and
personal variables.
3) To identify factors affecting the level of work engagement amongst
employees (faculty members).
4) To identify the measures required for enhancement of work engagement
amongst the employees (faculty members).
5) To study the relationship (if any) between the level of work engagement
amongst employees (faculty members) and
job crafting initiatives
work - life balance
level of work stress
level of organization commitment
P a g e | 39
2.8 HYPOTHESES
Hypothesis is an unproven statement or proposition about a factor or
phenomenon (Malhotra and Dash, 2011). In the context of the study objectives, the
following null hypotheses were framed:
H0(1) : Work engagement does not differ across the type of institution.
H0(2) : Work engagement does not differ across faculty work areas.
H0(3) : Work engagement does not vary with posting.
H0(4) : Work engagement does not differ across districts.
H0(5) : Work engagement does not vary with designation.
H0(6) : Work engagement does not vary with total experience.
H0(7) : Work engagement does not vary with experience in current organization.
H0(8) : Work engagement does not differ across age groups.
H0(9) : Work engagement does not vary with gender.
H0(10) : Work engagement does not vary with educational background.
H0(11) : Work engagement does not vary with salary.
H0(12) : There is no significant relationship between job crafting and work
engagement.
H0(13) : There is no significant relationship between work life balance and work
engagement.
H0(14) : There is no significant relationship between work stress and work
engagement.
H0(15) : There is no significant relationship between organizational commitment
and work engagement.
2.9 CHAPTER SUMMARY
This chapter deals with the review of literature that was relevant to the
subject matter of the thesis. The review began with general literature regarding
employee well being and work engagement followed by specific studies classified
into the following sections :
2.1 Studies on Work Engagement as a unique construct –
Conceptualization of work engagement according to the pioneering academic study
on personal engagement by Kahn (1990) was analyzed based on the premises of
P a g e | 40
work redesign model of Hackman & Oldham (1980) and the factors influencing
organizational behavior (Alderfer, 1985). The construct of work engagement was
examined according to several definitions given by Maslach and Leiter (1997),
Rothbard (2001), Harter et al. (2002), Schaufeli et al. (2002), Colbert et al. (2004),
Wellins and Concelman (2005), Fleming and Asplund(2007), HR Anexi and Blessing
White (2008) and Towers Watson (2014). A fundamental question raised by many
authors like Newman et al. (2011) as to whether engagement is different from an
overall job attitude was addressed in the light of studies by Macey and Schneider
(2008) and Shuck et al. (2013) who discretely established work engagement as a
unique concept, despite its seeming similarity with job satisfaction, organizational
commitment, job involvement and work holism. Studies by Erickson (2005) and
Macey et al.(2009) were cited to bring out the uniqueness of work engagement with
respect to job satisfaction. A study by Saks (2006) distinguished engagement from
commitment as against Fleming, et al. (2005) and The Corporate Executive Board
(2004) who used the terms engagement and commitment almost as synonyms.
Studies by Kahn (1990), May et al. (2004), Salanova et al. (2005), Saks (2006), Rich
et al. (2010), Christian et al. (2011) were cited for distinguishing engagement from
job involvement thus clarifying the seeming overlap appearing in the definition of
job involvement given by Brown (1996). The perceived similarity between work
engagement and workaholism was clarified on the basis of a study by by Bakker and
Demerouti (2008). A study by Bakker (2011) was cited to distinguish work
engagement from work-related flow. Finally, a study by Guest (2013) was cited to
establish engagement as a novel and unique concept accepted in both managerial
and academic literature and unlikely to be forsaken as a fad.
2.2 Studies on Measurement of work engagement: This section of the
review helped in identifying the various scales available for measurement of work
engagement. Four widely used scales identified were Q12 or Gallup Workplace
Audit (GWA) or Gallup Engagement Index developed Gallup organization
researchers and reported by Buckingham and Coffman (1999); Maslach Burnout
Inventory - General Survey developed by Maslach and Leiter (1997); Utrecht Work
Engagement Scale – UWES developed by Schaufeli et al. (2002) and Oldenburg
Burnout Inventory (OLBI) designed by Demerouti et al. (2010). Details of the
dimensions and applicability of each scale were discussed in this section.
P a g e | 41
2.3 Studies on Factors affecting work engagement : Studies by Kahn
(1990) ; Maslach et al. (2001); May et al. (2004); Saks (2006); Bakker and
Demerouti (2008); Macey and Scheider (2008) were discussed to bring out the
factors affecting work engagement. To sum up these studies concur that work
engagement is predicted by factors such as job characteristics wherein, work that is
challenging, clearly outlined, varied, creative and somewhat autonomous is
perceived to be meaningful. Personal resources for example self-efficacy,
organizational-based self-esteem and optimism are vital antecedents of work
engagement. Interpersonal relationships depicting openness, flexibility, trust,
support and lack of threat are associated with high degree of work engagement.
Organizational Support in the form of economic and socio-emotional resources like
recognition, rewards, procedural justice have a positive impact on employee work
engagement.
2.4 Studies on Relationship of work engagement with job crafting,
work life balance, organizational commitment and work stress: The relationship
of work engagement and job crafting was explored on the basis of studies by
Wrzesniewski et al. (1997), Wrzesniewski and Dutton (2001), Demerouti et al.
(2001) Grant and LePine et al. (2005); Ashford (2008); Parker and Ohly (2008) ;
Tims and Bakker (2010); Crawford et al. (2010); Tims et. al (2012); Chan (2013).
To sum up, these studies concluded that work engagement is positively associated
with job crafting or employees‘ efforts to make changes in self and / or work
environment to establish a better person-job fit. The relationship of work
engagement and work life balance was explored on the basis of studies by
Hochschild (1997); Tausig and Fenwick (2001); Thornthwaite (2004); Hammer et
al. (2005); Greenhaus and Powell (2006); Muse et al. (2008); Carlson et al. (2008);
Emslie and Hunt (2009). Studies by Montgomery et al. (2003); Bakker et al. (2003);
Bakker et al. (2014) focussed on the cross-over of work engagement from work life
to personal life, thus establishing that work engagement is positively associated with
work-family facilitation. To sum up these studies concluded that work-life balance is
a shared responsibility of the employer and employees. Most contemporary
organizations make huge investments in establishing a better work life balance for
the employees as it improves role-related engagement. The relationship of work
engagement and organizational commitment was explored on the basis of studies
P a g e | 42
by; Mowday et. al (1974); Porter et. al (1974); Brown and Leigh (1996); Demerouti
et al. (2001); Maslach et al. (2001); Hakanen et al. (2006); Richardsen et al.
(2006); Llorens et al. (2006); Hakanen et al.(2006); Saks (2006). In a nutshell, these
studies established a positive association between work engagement and affective
organizational commitment. The relationship of work engagement and work stress
was explored on the basis of studies by Karasek (1979); Pines et al. (1981); Kahn
and Byosiere (1992); Lee and Ashforth (1996); Maslach et al. (1996); Geurts &
Demerouti (2003); Bakker et al.(2003); Bakker et al. (2004); Palmer et. al (2004);
Schaufeli and Bakker (2004); The Health and Safety Executive (2006); Hakanen et.
al (2006); Blaug et.al (2007). On the whole these studies concluded that work stress
is inversely related to work engagement.
2.5 Studies on the engagement – performance link : This section dealt
with the vital issue of exploring whether there is a link between work engagement
and performance of individuals, teams and the organization as a whole. Studies by
Westman (2001); Barsade (2002); Fredrickson (2001); Bakker et al.
(2004);Salanova et al. (2005); Sy et al. (2005); Bakker et al. (2006); Wagner and
Harter (2006); Bakker & Demerouti (2007); Xanthopoulou et al. (2007); Fleming
and Asplund (2007); Bakker et al. (2008); Gopal (2010); Bamford et.al (2013) were
cited in this context. All the studies converged on a common conclusion that there is
a significant positive association between work engagement and performance of
individuals, teams and organization as a whole.
Finally, on the basis of review of literature, the research gaps were identified
and accordingly the study objectives and hypotheses were framed.
**********
CHAPTER – 3
RESEARCH
METHODOLOGY
P a g e | 43
CHAPTER – 3
RESEARCH METHODOLOGY
——————————————————————————————————
The chapter deals with the research methodology adopted for the
achievement of the objectives of the current study. The chapter includes a
description of the research design and sampling, data collection, sample description,
research instruments employed for the measurement of the variables under study and
finally the statistical analysis approach has been explained.
3.1 RESEARCH DESIGN AND SAMPLING
A survey design was chosen to reach the research objectives. A cross-
sectional design was used, where a sample is drawn from a population at one time.
The study was descriptive in nature implying natural observation of the
characteristics of the research subject without deliberate manipulation of the
variables or control over the settings. The faculty members employed in higher
education institutions comprise of the population for the present study. Higher
education covers many disciplines. Higher Education Institutions namely
universities and colleges located across the country can be broadly categorized into
two types namely the public institutions which are fully or partially supported by the
Government and the private institutions which are self funded. Hence, for the sake
of feasibility and economy the scope of the study was narrowed down to disciplines
of Commerce and Business Management (CBM), Science, Engineering and
Technology (SET), Applied Medical Sciences (AMS) and Education and
Humanities (EHUM). As far as the regional scope of the sample is concerned,
respondents were drawn from higher education institutions located in the districts of
Amritsar, Bathinda, Jalandhar, Ludhiana, Patiala and the capital of Punjab –
Chandigarh. These districts were chosen as they are the hubs of higher education in
this region. Each of the districts has at least one University Campus in its
jurisdiction. Sample represented faculty members from all disciplines mentioned
here.
For appropriate representation of the population, quota sampling technique
was followed. A fixed quota of respondents was drawn from each type of HEI,
P a g e | 44
discipline and district. Hence, the sample was targeted at 10 faculty members from
each of the four disciplines of public HEIs and an equal number from private HEIs
in each of the six districts selected for the study. Accordingly, a sample size of 480
respondents was targeted.
3.2 DATA COLLECTION
A list of HEIs to be approached for data collection was prepared considering
University campuses and colleges having faculty members from the four disciplines
covered in the study (Refer Appendix I). A web link was developed for online data
collection and simultaneous preparation of database. Data collection was done
through personal visits, sending the questionnaire by post and seeking response on
the website. Data was collected from 41 Institutions / Departments. Personal visits
helped in seeking authentic data, timely collection and making note of qualitative
observations regarding the institutional work culture, which further aided in
interpretation of results. Nearly 600 questionnaires were distributed to the targeted
respondents out of which, 473 questionnaires were received which is a response rate
of 78%. 10 questionnaires could not be used as they were incomplete. Finally 463
fully filled questionnaires were utilized for the study.
3.3 SAMPLE DESCRIPTION
The sample consisted of 463 faculty members from 41 Higher Education
Institutions out of which 232 were from private sector and 231 were from public
institutions. According to faculty work area 27% of the respondents were from
commerce and business management 29% from science engineering and technology
22% from applied medical sciences and 22% from education and humanities. 52%
were posted in University campus and 48% in affiliated colleges. According to
designation, 13% were Lecturers, 64% Assistant Professors, 13% Associate
Professors, 7% Professors and 3% Heads of Departments. The gender wise
distribution of respondents was 58% female and 42% male. As per educational
background 1% were graduates, 56% Post graduates, 37% Doctorates and 6% had
done a Post doctoral study program. According to income groups 37% were drawing
monthly salary of upto Rs. 30000, 35% in the range of Rs. 30,001 to 50,000, 12% in
the range of Rs. 50001 to 70000, 6% in the range of Rs. 700001 to 90,000, 6% in the
range of 90,001 to 1,10,000 and 4% above Rs.1,10,000.
P a g e | 45
3.4 RESEARCH INSTRUMENTS
The research instruments required for the study were developed after
working out the information requirements to achieve the stated objectives.
Accordingly need was felt for having six metric scales for measuring the level of
work engagement, factors affecting work engagement, levels of job crafting, work
life balance, work stress and organizational commitment. The seventh, an ordinal
scale was required for ranking the measures for enhancement of work engagement.
Finally, the demographic details or personal variables were to be captured.
For each scale, the pre-published and tested instruments were explored.
Standardized scales were available for all variables except factors affecting work
engagement. The available scales were considered in the light of study objectives.
Accordingly some were used as such and others were adapted to suit the needs of
the study. The questionnaire consisted of eight parts. It was titled as ‗Work and Well
Being Survey in Higher Education Institutions in Punjab‘. Its development is
explained scale wise:
Scale 1 : Utrecht Work Engagement Scale
Various instruments available for measurement of work engagement were
explored such as Gallup Workplace Audit (GWA) or Gallup Engagement Index or
Q12, Maslach Burnout Inventory (MBI), Oldenburg Burnout Inventory (OLBI),
Utrecht Work Engagement Scale (UWES). Macey & Schneider (2008) noted that
from both research and practice perspectives, it is one thing to get the
conceptualization correct and another thing to get the operationalization correct. If
an engagement measure fails on the conceptualization front, it will not measure up
on the other front as well. They further observed that in the world of practice some
measures of conditions for engagement are relabeled as measures of engagement
(such as Buckingham & Coffman, 1999). The focus the measurement should be on
the construct of interest; if engagement is the target, then the measure should map
the content of the construct (Schiemann and Morgan, 2006). Considering this
rationale, Utrecht Work Engagement Scale (UWES) a self-reporting instrument that
has been validated in many countries across the world (Schaufeli et al., 2002) was
used in the study. UWES, is a valid and reliable indicator of work engagement that
can be used for future research on work engagement (Schaufeli and Bakker, 2004).
P a g e | 46
UWES includes 15 items for the assessment of the three engagement dimensions
namely vigor, dedication and absorption. Schaufeli et al. (2006) subsequently
developed a nine-item version of the UWES and provided evidence for its cross-
national validity. UWES has quite satisfactory psychometric properties that is
internal consistencies are well above the criterion of .60 that is recommended for
newly developed measurement instruments (Nunnaly & Bernstein, 1994). In the
present study work engagement was measured using the short nine-item version of
the Utrecht Work Engagement Scale (Schaufeli et al., 2006). It includes three
subscales, namely vigor, dedication and absorption (refer Appendix – II, Part IV).
The response was sought on a 7 point Likert scale ranging from 0 indicating ‗never‘
to 6 indicating ‗always or everyday‘. For the analyses, a composite score of all
subscales was used because the 1-factor solution has acceptable goodness of fit
(Schaufeli et al., 2006). The scale was found to be a reliable measure of work
engagement of faculty members in the higher education sector of Punjab India as
Cronbach‘s alpha was 0.862 which is above the acceptable limit of 0.70 (Hair et al.,
2009).
Scale 2: Factors affecting work engagement
The scale was developed, on the basis of an extensive and in depth literature
review. The process of scale development was an iterative one. After thorough
discussions with experts in the field of management and statistical analysis, many
iterations of the scale were developed with the broad aim of establishing scale
validity and eliminating any sort of overlap between statements. Modifications were
suggested in the statement construct with special reference to avoiding double
barreled questions. The sequence of statements was kept such that statements related
to a common aspect should be kept far from each other. Finally, a 92 item scale was
developed that explored the respondents‘ perception regarding self, current job and
current organization. There was a mix of positive and negatively worded statements
to ensure that the respondents read all the statements carefully before they respond
(refer Appendix - II, Part I).
The respondents were asked to consider their experiences of the past six
months or more in relation to self, current job and current organization, while
responding to the statements. They were asked to express their level of agreement or
P a g e | 47
disagreement for each statement on a seven -point Likert scale ranging from 0
representing ‗strongly disagree‘ to 6 representing ‗strongly agree‘. A seven point
scale was used against a five point scale in order to capture the exact perception of
the respondent, by giving a larger range of response. The 92 statement scale was
factor analysed and found to consist of ten unique factors or dimensions with
Cronbach‘s alpha as mentioned in the brackets. Perceived organizational support
(0.918), personal and professional orientation (0.894), supervisory support (0.904),
climate of participation and recognition(0.899), organizational orientation for
results(0.805), interaction with students (0.752), intrinsic rewards (0.750),
empowerment (0.644), task variety (0.616), support from associates (0.841). It is
noteworthy that all Cronbach‘s alpha values were above the acceptable limit of 0.60
for newly developed scales (Hair et al., 2009).
Scale 3 : Job Crafting
This scale sought to measure the degree to which respondents engaged in job
crafting. Job crafting has been defined as self initiated change behaviours that
employees engage in in order to align their jobs with their own preferences, motives
and passions (Wrzesniewski and Dutton, 2001). All the 12 statements used in this
scale were adapted from job crafting scale developed by Tims et al. (2012). The
original scale consisted of 21 statements on 4 dimensions namely increasing
structural job resources, increasing social job resources, increasing challenging job
demands and decreasing hindering job demands. The fourth dimension namely
decreasing hindering job demands, was found to have non-significant correlation
with other three dimensions indicating that this dimension was independent from
others. In addition, this dimension showed no significant correlation with work
engagement (Tims et al., 2012). Hence all items falling under this dimension were
excluded from the scale.
The 12 statements gauged how often did the respondents engage in the stated
behaviors while pursuing their current job and / or previous jobs. The response was
sought on a 7 point Likert scale ranging from 0 indicating never to 6 indicating
always or everyday (refer Appendix - II, Part II). On applying Exploratory Factor
Analysis, the scale was found to consist of three dimensions. The scale reliability
P a g e | 48
was estimated using Cronbach‘s alpha coefficient (Cronbach, 1951). Cronbach‘s
alpha values for the three dimensions were 0.862 for increasing structural job
resources, 0.809 for increasing social job resources and 0.768 for increasing
challenging job demands. The reliability estimates were above the acceptable limit
of 0.70 (Hair et al., 2009).
Scale 4 : Work Life Balance
Work-life balance scale developed by Hayman (2005) was used to measure
the respondents‘ self reported work life balance. It consists of 15 statements
regarding the perception of influence of work on personal life and vice-versa. The
scale consists of a mix of positively and negatively worded statements. The response
was sought on a 7 point Likert scale ranging from 0 indicating never to 6 indicating
always or everyday (refer Appendix - II, Part III). On applying Exploratory Factor
Analysis, the scale was found to consist of three dimensions. Cronbach‘s alpha
values for the three dimensions were 0.92 for work interference with personal life
(WIPL), 0.85 for personal life interference with work (PLIW), and 0.78 for
work/personal life enhancement (WPLE). The reliability estimates were above the
acceptable limit of 0.70 (Hair et al., 2009).
Scale 5 : Organizational Commitment
After exploring various alternatives, Organizational Commitment scale
developed by Saks (2006) was used in the study. It was chosen on account of its
sound psychometric properties and brevity. The scale consists of 6 statements
assessing the respondent‘s organizational commitment which is defined as the
relative strength of an individual‘s identification with and involvement in a
particular organization. (Mowday et al., 1979). The respondents were asked to
express their level of agreement or disagreement with the given statements
considering their current organization. Response was sought on a seven -point Likert
scale ranging from 0 representing ‗strongly disagree‘ to 6 representing ‗strongly
agree‘(refer Appendix - II, Part V). The scale was found to be a reliable measure of
work engagement of faculty members in the higher education sector of Punjab India
as Cronbach‘s alpha was computed as 0.911 which is above the acceptable limit of
0.70 (Hair et al., 2009)
P a g e | 49
Scale 6: Work stress
Work stress was measured using a self developed pretested scale consisting
of 18 items adapted from Organization Role Stress Scale developed by Udai Pareek
(1983). The statements relate to various aspects of work stress for example inter role
distance, role stagnation, role expectation conflict, role erosion, role overload, role
isolation, personal inadequacy, self role distance, role ambiguity and resource
inadequacy. The response was sought on a 7 point Likert scale ranging from 0
indicating never to 6 indicating always or everyday (refer Appendix - II, Part VI).
On applying Exploratory Factor Analysis, the scale was found to consist of four
dimensions. The reliability for the work stress scale was estimated using Cronbach
alpha coefficient (Cronbach, 1951). The Cronbach alpha values for the four
dimensions were 0.745 for self-role distance, 0.862 for inter role distance, 0.831 for
role expectation conflict and 0.68 for role inadequacy. The reliability estimates were
above the acceptable limit of 0.70 (Hair et al., 2009).
Scale 7: Measures for improving Work Engagement
An ordinal scale was used to seek response on the top 5 changes that the
respondent would want in their jobs and organizations so that they could work with
better energy, dedication and involvement which are basically the three dimensions
of work engagement. For this purpose they were given a set of 11 statements out of
which they were asked to identify top five, while giving a particular rank to one
statement only. Thus, response was sought on an ordinal scale. It was supplemented
by an open ended question in which respondents could give their suggestions for
work engagement enhancement (refer Appendix - II, Part VII).
Part 8: Demographic Profile
Part VIII of the questionnaire sought information regarding the demographic
profile of the respondent in terms of name of the Institution where the respondent
was currently employed; whether the Institution was Government, Government
aided or Private; faculty work area / department; whether posted at University
campus or affiliated college; district of posting; current designation; total
experience; experience in current organization; age; gender; educational background
and monthly salary (refer Appendix - II, Part VIII). Personal details like names of
the respondents or telephonic contacts were not sought as anonymity and
P a g e | 50
confidentiality were primary requirements for eliciting unbiased responses.
Moreover, personal details were not required as per the study objectives.
3.5 STATISTICAL ANALYSIS APPROACH
The statistical tools and techniques used for the study included descriptive
statistics, one-way ANOVA, exploratory factor analysis, measurement of scale
reliability, correlation analysis, non-metric correlation analysis and hierarchical
multivariate regression analysis. The analysis was done using SPSS version 16.0.
After entry of the data, the data was checked whether it had been uniformly entered.
Data analysis was then performed by applying above said techniques. Brief
description of the analytical tools and techniques used for the analysis is given as
follows:
3.5.1 Analysis of Variance (ANOVA)
Analysis of Variance (ANOVA) is commonly used for examining the
difference of means between two or more populations, based on the information
gathered from the samples of the respective populations. This technique was
developed by R.A Fisher. ANOVA is based on some assumptions. Each population
should have a normal distribution with equal variances. Each sample should be
randomly drawn and independent of all other samples. ANOVA is used for
comparing the means when there is one metric dependent variable (measured using
interval or ratio scale) and one or more non metric or categorical independent
variable (Malhotra & Dash, 2011). One-way ANOVA is employed when only one
independent variable is used to compare the differences in the mean values of the
dependent variable. In one – way ANOVA, testing of hypothesis is carried out by
partitioning the total variation of the data in two parts. The first part is the variance
between the samples and the second part is the variance within the samples. The
variance between the samples can be attributed to treatment effects and the variance
within the samples can be attributed to experimental errors. In the present study one-
way ANOVA was used to compare the differences in the level of dependent variable
namely work engagement of the samples drawn according to each of the personal
variables treated as independent variables. The independent variables for testing
each of the hypotheses H01 to H011 stated at the beginning of this chapter were: type
P a g e | 51
of institution, faculty work area, posting, designation, total experience, experience in
current organization, age, gender, educational background and salary respectively.
Wherever the difference in mean responses was found to be significant Post-Hoc test
using Least Square Difference (LSD) method was applied.
3.5.2 Exploratory Factor Analysis
The present study has used exploratory factor analysis (EFA) to reduce the
large number of variables into manageable number of variables. Factor analysis is a
technique used for data reduction which examines the relationships among sets of
many interrelated variables and represents in the form of a few underlying factors.
This technique is exploratory in nature; hence it is also called exploratory factor
analysis (EFA) (Malhotra and Dash, 2011). The key statistics associated with factor
analysis which were used by the study are described as follows:
Bartlett’s test of sphericity: This statistic was used to test the
appropriateness of the data for the factor analysis. Bartlett‘s test of sphericity
examines the null hypothesis that all variables are uncorrelated in the
population. It is based on chi-square transformation of determinant of
correlation matrix. Large value of the test favors the rejection of null
hypothesis (Malhotra and Dash, 2011). Therefore rejection of null hypothesis
determines the appropriateness of the factor model.
Kaiser-Meyer-Olkin (KMO) measure of sampling adequacy: This test was
also used to test the appropriateness of factor analysis. A value of 0.5 is
desirable to pursue factor analysis. High values between 0.5-1.0 indicate
appropriateness of factor analysis, whereas value less than 0.5 mean that
factor analysis is not appropriate (Malhotra and Dash, 2011).
Principal component analysis: The study used principal component analysis
method of factor analysis. In principal component analysis, the total variance
in the data is considered. Principal component analysis method is
recommended when the primary concern is to determine the minimum
number of factors for subsequent use in analysis (Malhotra and Dash, 2011).
Eigen values: In the study eigen value method was used to determine the
number of factors to be retained. Only factors with eigen values greater than
1.0 were retained and other factors were not included in the model (Malhotra
and Dash, 2011).
P a g e | 52
Varimax rotation: In the study the factor matrix was rotated using varimax
procedure of rotation. Varimax procedure is an orthogonal rotation which
minimizes the number of variables with high loadings on a factor (Malhotra
and Dash, 2011).
3.5.3 Scale Reliability
Scale reliability refers to the degree to which a measurement technique can
be depended upon to secure consistent results upon repeated application. Reliability
is the degree of consistency between multiple measurements of a variable. In this
study Cronbach‘s alpha was computed for reliability assessment of the various
scales. Cronbach‘s alpha is the reliability coefficient which determines the reliability
of entire scale. If there is no true score and only error in the items then the
coefficient alpha will be equal to zero. If all items are perfectly reliable and measure
the same thing, then coefficient alpha is equal to 1. The acceptable limit of
Cronbach‘s alpha is generally .70 but the limit may be decreased to .60 in case of
exploratory research (Hair et al., 2009).
3.5.4 Measures of Association
Measures of Association are statistics for measuring the strength of
association between two variables. Correlation measures the degree of association
between two variables. Karl Pearson‘s coefficient of correlation is a measure of the
linear correlation between two variables. It is also known as Pearson product-
moment correlation coefficient Pearson's correlation coefficient is the covariance of
the two variables divided by the product of their standard deviations. It is commonly
represented by the letter r. So if there is one dataset {x1,...,xn} containing n values
and another dataset {y1,...,yn} containing n values then formula for r is:
Karl Pearson‘s coefficient of correlation takes a value between +1 and −1
where 1 indicates total positive correlation, 0 is no correlation and −1 is total
P a g e | 53
negative correlation. In the present study it was used to analyze whether work
engagement, as a dependent variable, is associated with each of the ten factors
identified through factor analysis namely perceived organizational support, personal
and professional orientation, supervisory coaching, climate of participation and
recognition, organizational orientation for results, interaction with students, intrinsic
rewards, empowerment, task variety, support from associates, as independent
variables. Again, it was used to analyze whether work engagement, as a dependent
variable, is associated with the three dimensions of job crafting as independent
variables; with the three dimensions of work life balance as independent variables;
with the four dimensions of work stress as independent variables and finally with
organizational commitment as a one dimensional independent variable.
3.5.5 Non-metric Correlation Analysis
Spearman‘s rank correlation is used to test the association between two
ranked variables, or one ranked variable and one measurement variable. It is used to
see whether the two variables covary. It is assumed that the observations are
independent. In the present study Spearman‘s rho was used to study the correlation
between two ordinal scale variables namely the ranking of measures for
enhancement of work engagement by subgroups of respondents classified according
to gender, type of institution, designation, salary, faculty work area and district of
posting.
3.5.6 Hierarchical Multiple Regression Analysis
A multiple regression analysis method in which the researcher, not a
computer program, determines the order that the variables are entered into and
removed from the regression equation. It is used when the researcher believes that
certain variables should be included in the model and in what order. The general
form of multiple regression model is :
Y= β0 + β1X1 + β2X2 + β3X3+ ……….+ βkXk + e
which is estimated by the following equation
Ŷ =
a + b1X1+ b2X2+ b3X3+ …………..+bkXk
The coefficient a represents the intercept, bs are partial regression
coefficients.
P a g e | 54
The statistics associated with Multiple Regression are:
Adjusted R2
: R2, coefficient of Multiple Determination is adjusted for the
number of independent variables and the sample size to account for
diminishing returns. After the first few variables, the additional variables do
not make much contribution.
Coefficient of Multiple Determination : The strength of association in
multiple regression is measured by square of the multiple correlation
coefficient R2, which is also called the coefficient of multiple determination.
F test : The F test is used to test the null hypothesis that the coefficient of
Multiple Determination in the population, R2
pop is zero. This is equivalent to
testing the null hypothesis H0 : β1= β2= β3=….. βk=0. The test statistic has an F
distribution with k and (n-k-1) degrees of freedom.
Partial F Test : The significance of a partial regression coefficient, βi, of Xi
may be tested using an incremental F statistic. The incremental F statistic is
based on the increment in the explained sum of squares resulting from
addition of the independent variable Xi to the partial regression equation
after all the other independent variables have been included.
Partial Regression coefficient : The partial regression coefficient b1,
denotes the change in predicted value, Ŷ per unit change in X1 when the
other independent variables X2 to Xk are kept constant.
In chapter 5 of the present study, hierarchical multiple regression was used to
analyse whether work engagement, as a dependent variable, is predicted by the ten
factors identified through factor analysis namely perceived organizational support,
personal and professional orientation, supervisory coaching, climate of participation
and recognition, organizational orientation for results, interaction with students,
intrinsic rewards, empowerment, task variety, support from associates, as
independent variables. A two stage hierarchical multiple regression analysis was
conducted. All personal variables namely type of institution, faculty work area,
posting, designation, total experience, experience in current organization, age,
gender, educational background, regional background and salary were entered in
stage one to treat them as control variables. In chapter 6 of the present study, this
technique was used four times to analyze whether work engagement, as a dependent
variable, is predicted by job crafting dimensions; work-life balance dimensions;
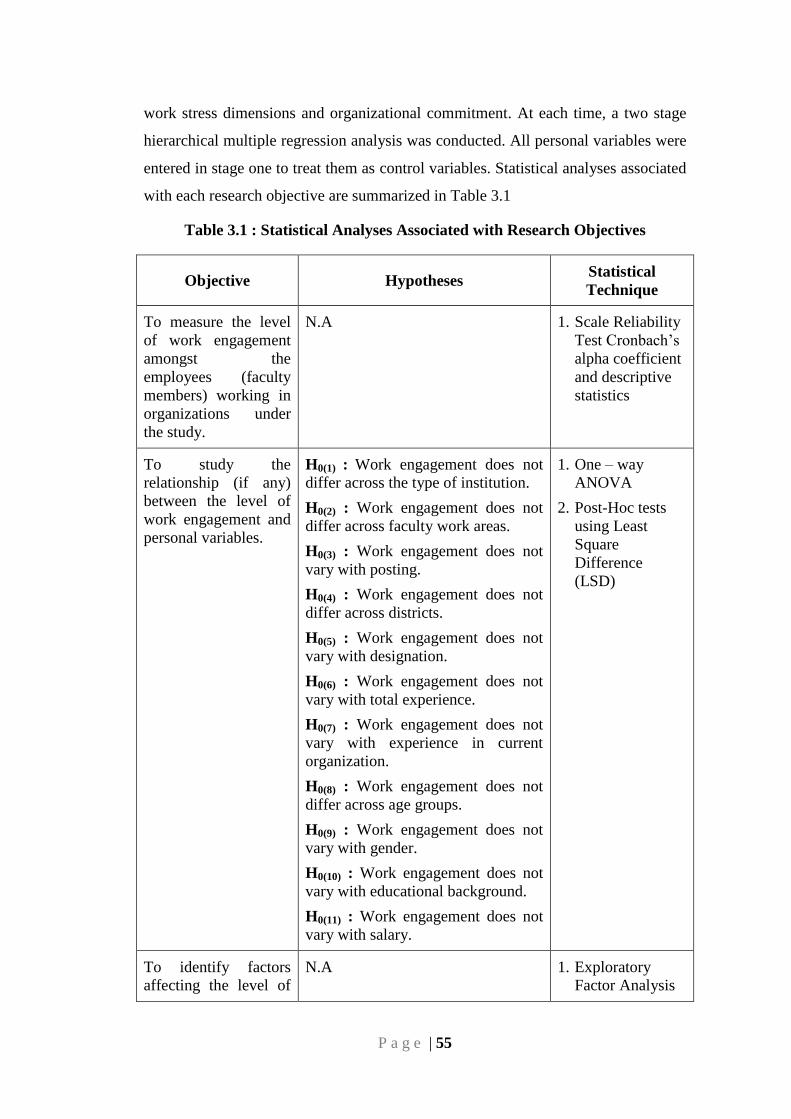
P a g e | 55
work stress dimensions and organizational commitment. At each time, a two stage
hierarchical multiple regression analysis was conducted. All personal variables were
entered in stage one to treat them as control variables. Statistical analyses associated
with each research objective are summarized in Table 3.1
Table 3.1 : Statistical Analyses Associated with Research Objectives
Objective Hypotheses Statistical
Technique
To measure the level
of work engagement
amongst the
employees (faculty
members) working in
organizations under
the study.
N.A 1. Scale Reliability
Test Cronbach‘s
alpha coefficient
and descriptive
statistics
To study the
relationship (if any)
between the level of
work engagement and
personal variables.
H0(1) : Work engagement does not
differ across the type of institution.
H0(2) : Work engagement does not
differ across faculty work areas.
H0(3) : Work engagement does not
vary with posting.
H0(4) : Work engagement does not
differ across districts.
H0(5) : Work engagement does not
vary with designation.
H0(6) : Work engagement does not
vary with total experience.
H0(7) : Work engagement does not
vary with experience in current
organization.
H0(8) : Work engagement does not
differ across age groups.
H0(9) : Work engagement does not
vary with gender.
H0(10) : Work engagement does not
vary with educational background.
H0(11) : Work engagement does not
vary with salary.
1. One – way
ANOVA
2. Post-Hoc tests
using Least
Square
Difference
(LSD)
To identify factors
affecting the level of
N.A 1. Exploratory
Factor Analysis
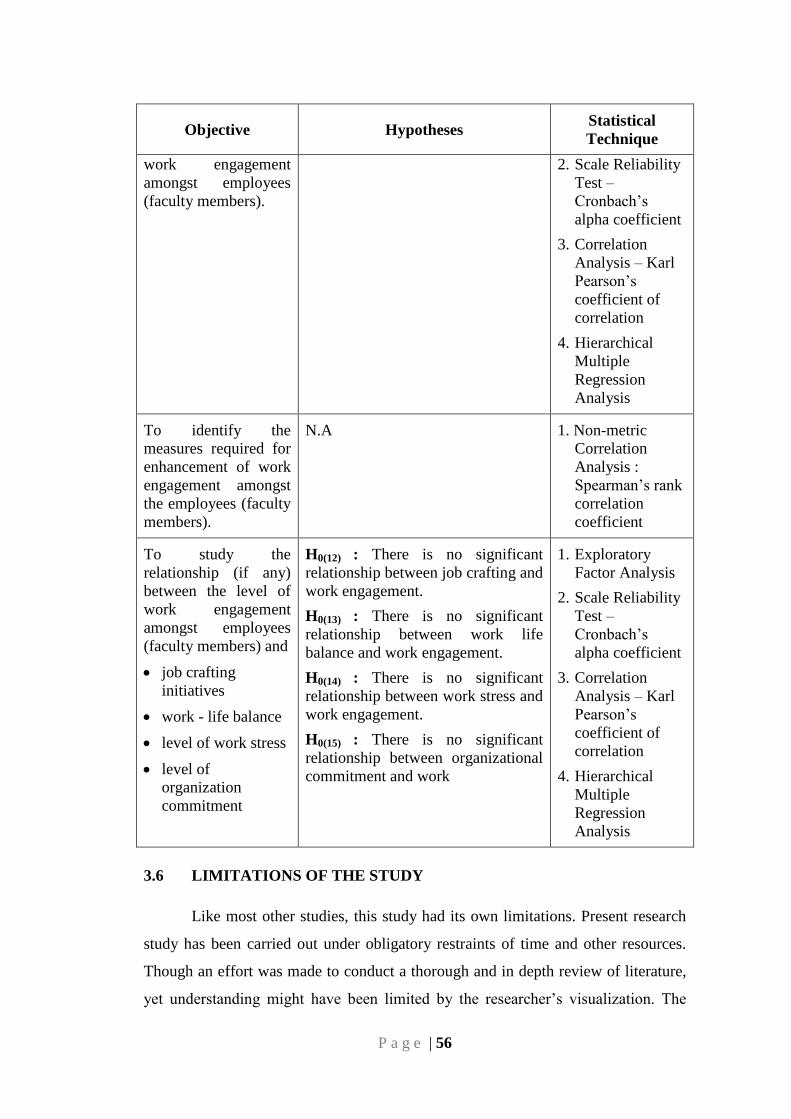
P a g e | 56
Objective Hypotheses Statistical
Technique
work engagement
amongst employees
(faculty members).
2. Scale Reliability
Test –
Cronbach‘s
alpha coefficient
3. Correlation
Analysis – Karl
Pearson‘s
coefficient of
correlation
4. Hierarchical
Multiple
Regression
Analysis
To identify the
measures required for
enhancement of work
engagement amongst
the employees (faculty
members).
N.A 1. Non-metric
Correlation
Analysis :
Spearman‘s rank
correlation
coefficient
To study the
relationship (if any)
between the level of
work engagement
amongst employees
(faculty members) and
job crafting
initiatives
work - life balance
level of work stress
level of
organization
commitment
H0(12) : There is no significant
relationship between job crafting and
work engagement.
H0(13) : There is no significant
relationship between work life
balance and work engagement.
H0(14) : There is no significant
relationship between work stress and
work engagement.
H0(15) : There is no significant
relationship between organizational
commitment and work
1. Exploratory
Factor Analysis
2. Scale Reliability
Test –
Cronbach‘s
alpha coefficient
3. Correlation
Analysis – Karl
Pearson‘s
coefficient of
correlation
4. Hierarchical
Multiple
Regression
Analysis
3.6 LIMITATIONS OF THE STUDY
Like most other studies, this study had its own limitations. Present research
study has been carried out under obligatory restraints of time and other resources.
Though an effort was made to conduct a thorough and in depth review of literature,
yet understanding might have been limited by the researcher‘s visualization. The
P a g e | 57
sample was geographically limited to the state of Punjab for the sake of economy of
data collection, as it required personal visits to most of the institutions.
3.7 CHAPTER SUMMARY
The chapter deals with the research methodology adopted for the
achievement of the objectives of the current study. The chapter includes a
description of the research design and sampling, data collection, sample description,
research instruments employed for the measurement of the variables under study and
finally the statistical analysis approach has been explained.
A cross-sectional descriptive study was designed using the quota sampling
technique for drawing a fixed number of faculty members from each of the four
broad faculty work areas namely Commerce and Business Management (CBM),
Science, Engineering and Technology (SET), Applied Medical Sciences (AMS) and
Education and Humanities (EHUM) from public and private higher education
institutions. The respondents from drawn from higher education institutions located
in the districts of Amritsar, Bathinda, Jalandhar, Ludhiana, Patiala and the capital of
Punjab – Chandigarh as these districts are considered the hubs of higher education in
Punjab. The sample consisted of 463 respondents from 41 Higher Education
Institutions / Departments. The sample was equitably distributed according to
gender, type of institution, posting, designation, faculty work area, posting, total
experience, current organization experience, educational background, regional
background and salary.
The questionnaire used in the present study consisted of eight parts. Part I
dealt with factors affecting work engagement for which a 92 item scale was
developed that explored the respondents‘ perception regarding self, current job and
current organization. There was a mix of positively and negatively worded
statements to which response was sought on a seven -point Likert scale ranging from
0 representing ‗strongly disagree‘ to 6 representing ‗strongly agree‘. The scale was
factor analysed and found to consist of ten unique factors or dimensions with
Cronbach‘s alpha values above the acceptable limit of 0.70 (Hair et al., 2009).
Part II dealt with measurement of degree to which respondents engaged in
Job Crafting. A 12 item scale adapted from job crafting scale developed by Tims et
al. (2012) was used. The statements gauged how often did the respondents engage in
P a g e | 58
the stated behaviors while pursuing their current job and / or previous jobs. The
response was sought on a 7 point Likert scale ranging from 0 indicating never to 6
indicating always or everyday. On applying Exploratory Factor Analysis, the scale
was found to consist of three dimensions having Cronbach‘s alpha values above the
acceptable limit of 0.70 (Hair et al., 2009).
Part III was dealt with measurement of Work-life balance for which the scale
developed by Hayman (2005) was used to measure the respondents‘ self reported
work life balance. It consists of 15 positively and negatively worded statements
regarding the perception of influence of work on personal life and vice-versa. The
response was sought on a 7 point Likert scale ranging from 0 indicating never to 6
indicating always or everyday. On applying Exploratory Factor Analysis, the scale
was found to consist of three dimensions. The Cronbach‘s alpha values for the three
dimensions were acceptable limit of 0.70 (Hair et al., 2009).
Part IV measured work engagement using the short nine-item version of the
Utrecht Work Engagement Scale (Schaufeli et al., 2006) and an answering scale
ranging from 0 = never to 6 = always. For the analyses, a composite score of all
subscales was used because the 1-factor solution has acceptable goodness of fit
(Schaufeli et al., 2006). The scale reliability was tested by computing Cronbach‘s
alpha which was above the acceptable limit of 0.70 (Hair et al., 2009).
Part V measured Organizational Commitment through the psychometrically
strong yet brief 6 item scale developed by Saks (2006). Response was sought on a
seven -point Likert scale ranging from 0 representing ‗strongly disagree‘ to 6
representing ‗strongly agree‘. The scale was found to be a reliable measure of work
engagement with Cronbach‘s alpha well above the acceptable limit of 0.70 (Hair et
al., 2009).
Part VI measured Work stress using a self developed pretested scale
consisting of 18 items adapted from Organization Role Stress Scale developed by
Udai Pareek (1983) was used to measure work stress. The response was sought on a
7 point Likert scale ranging from 0 indicating never to 6 indicating always or
everyday. On applying Exploratory Factor Analysis, the scale was found to consist
of four dimensions. The reliability for the work stress scale was estimated using
Cronbach‘s alpha coefficient (Cronbach, 1951) which were above the acceptable
limit of 0.70 (Hair et al., 2009).
P a g e | 59
Part VII of the questionnaire dealt with measures for improving Work
Engagement on an ordinal scale containing given a set of 11 statements from which
the respondent had to rank the top 5 changes required in their jobs and organizations
to work with better energy, dedication and involvement. There was an open ended
question seeking any other change apart from the mentioned statements. Part VIII
sought the demographic profile of the respondents.
Finally, this chapter describes the statistical analysis techniques used for the
study namely, one-way ANOVA, exploratory factor analysis, measurement of scale
reliability using Cronbach‘s alpha, correlation analysis, non-metric correlation
analysis and hierarchical multivariate regression analysis. The analysis was done
using SPSS version 16.0.
**********
CHAPTER – 4
RESULTS AND
DISCUSSION : WORK
ENGAGEMENT IN THE
HIGHER EDUCATION
SECTOR
P a g e | 60
CHAPTER – 4
RESULTS AND DISCUSSION: WORK ENGAGEMENT IN THE
HIGHER EDUCATION SECTOR
——————————————————————————————————
This chapter is devoted to an investigation of the level of work engagement
amongst the faculty members and its relationship with personal or demographic
variables.
Higher education is a powerful tool to build a knowledge-based information
society of the 21st Century. The Higher Education Institutions including the
universities and colleges envision to produce an intelligent and skilled human
resource pool, through challenging teaching, research and extension activities.
Hence, they require engaged teachers who are willing to go the extra mile.
According to a survey by Gallup consultants reported on their website by Steve
Crabtree (2013), only 13% of employees worldwide are engaged in their work. It
implies that merely one in eight employees are work engaged amongst the
approximately 180 million employees in the countries surveyed, including India.
This scenario raises a vital question regarding the work engagement of faculty
members in the higher education sector.
4.1 LEVEL OF WORK ENGAGEMENT
In order to measure the level of work engagement, the nine - item shortened
version of Utrecht Work Engagement Scale (UWES) developed by Schaufeli et al.
(2006) was used. The scale was found to be a reliable measure of work engagement
of faculty members in the higher education sector as Cronbach‘s alpha was 0.862,
which is above the acceptable limit of 0.70 (Hair et al., 2009). The response was
sought on a seven point Likert scale ranging from 0 to 6 where 0 stands for ―never‖
and 6 stands for ―always or everyday‖ (Appendix II). Descriptive statistics of
response on UWES are tabulated in Table 4.1.1
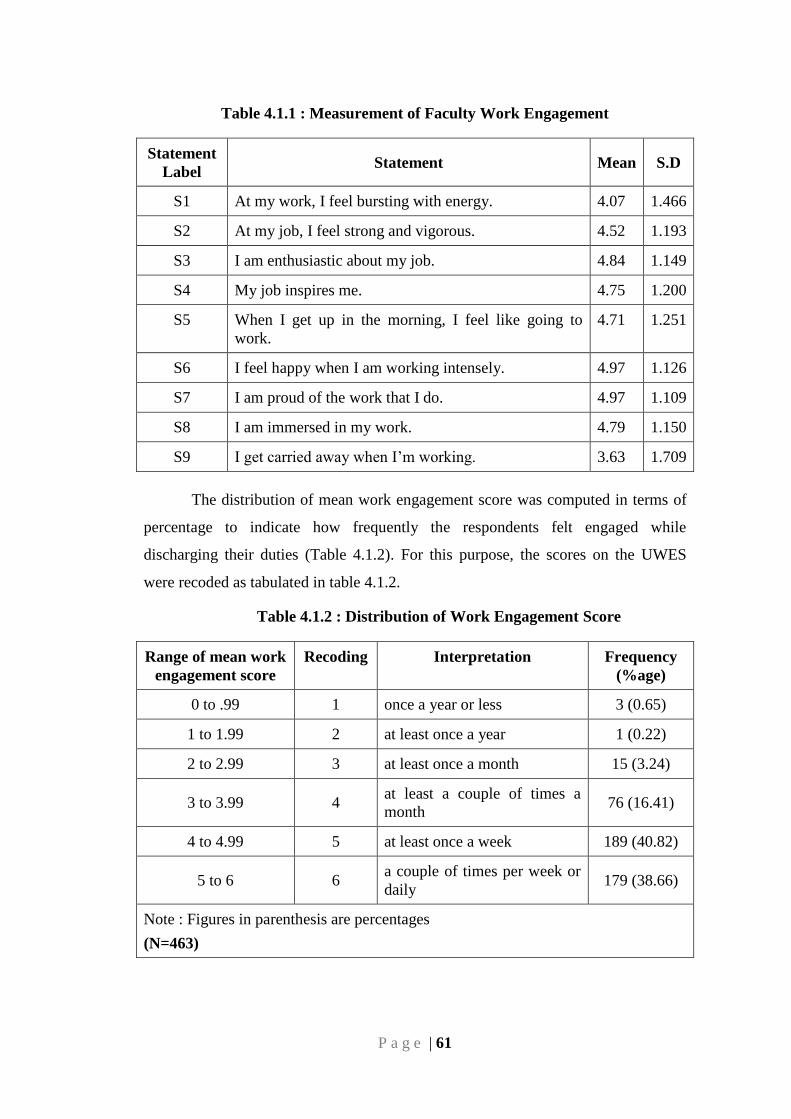
P a g e | 61
Table 4.1.1 : Measurement of Faculty Work Engagement
Statement
Label Statement Mean S.D
S1 At my work, I feel bursting with energy. 4.07 1.466
S2 At my job, I feel strong and vigorous. 4.52 1.193
S3 I am enthusiastic about my job. 4.84 1.149
S4 My job inspires me. 4.75 1.200
S5 When I get up in the morning, I feel like going to
work.
4.71 1.251
S6 I feel happy when I am working intensely. 4.97 1.126
S7 I am proud of the work that I do. 4.97 1.109
S8 I am immersed in my work. 4.79 1.150
S9 I get carried away when I‘m working. 3.63 1.709
The distribution of mean work engagement score was computed in terms of
percentage to indicate how frequently the respondents felt engaged while
discharging their duties (Table 4.1.2). For this purpose, the scores on the UWES
were recoded as tabulated in table 4.1.2.
Table 4.1.2 : Distribution of Work Engagement Score
Range of mean work
engagement score
Recoding Interpretation Frequency
(%age)
0 to .99 1 once a year or less 3 (0.65)
1 to 1.99 2 at least once a year 1 (0.22)
2 to 2.99 3 at least once a month 15 (3.24)
3 to 3.99 4 at least a couple of times a
month 76 (16.41)
4 to 4.99 5 at least once a week 189 (40.82)
5 to 6 6 a couple of times per week or
daily 179 (38.66)
Note : Figures in parenthesis are percentages
(N=463)
P a g e | 62
It was found that on a scale of 0 to 6, a majority (57.23%) of the respondents
were in the recoded categories 4 and 5. They reported a moderate level of work
engagement as indicated by a mean work engagement score of 3 to 4.99. While a
significant number of respondents (38.66%) were in the recoded category 6 that is,
they reported high level of work engagement indicated by a mean score of 5 to 6. It
does highlight the scope and need to improve the work engagement of faculty
members in higher education sector of Punjab to realize the national goals of higher
education.
It is significant to mention that it appears that the self appraisal of work
engagement by respondents of the present study was much more liberal as compared
to the results reported in the unpublished Utrecht Work Engagement Scale
preliminary manual version 1 reported by Schaufeli and Bakker in 2003. The
manual is based upon a database of 9679 mostly Dutch respondents from different
professions and the mean work engagement score is 3.74 on a scale of 0 to 6. In the
current study the mean score of work engagement was 4.58. Consequently, it can
also be safely concluded that had the self appraisal by respondents of the present
study not been liberal, it would have pointed out an even greater need for improving
the work engagement in higher education sector of Punjab.
4.2 RELATIONSHIP OF WORK ENGAGEMENT AND PERSONAL
VARIABLES
The study investigated the relationship between respondents‘ work
engagement and personal or demographic variables like faculty work area, type of
institution, posting, designation, total experience, experience in the current
organization, age, gender, educational background, monthly salary etc. Work
engagement was considered as dependent variable and demographic variables were
considered as independent variables. In the current study the dependent variable
namely work engagement was measured as a scale variable and all independent
variables namely the personal variables were measured as categorical variables.
Hence, the difference in mean work engagement across the samples categorized on
the basis of personal variables was analyzed using one-way analysis of variance
(ANOVA). After performing ANOVA, wherever the difference was found to be
significant, Post-Hoc tests using Least Square Difference (LSD) were applied.
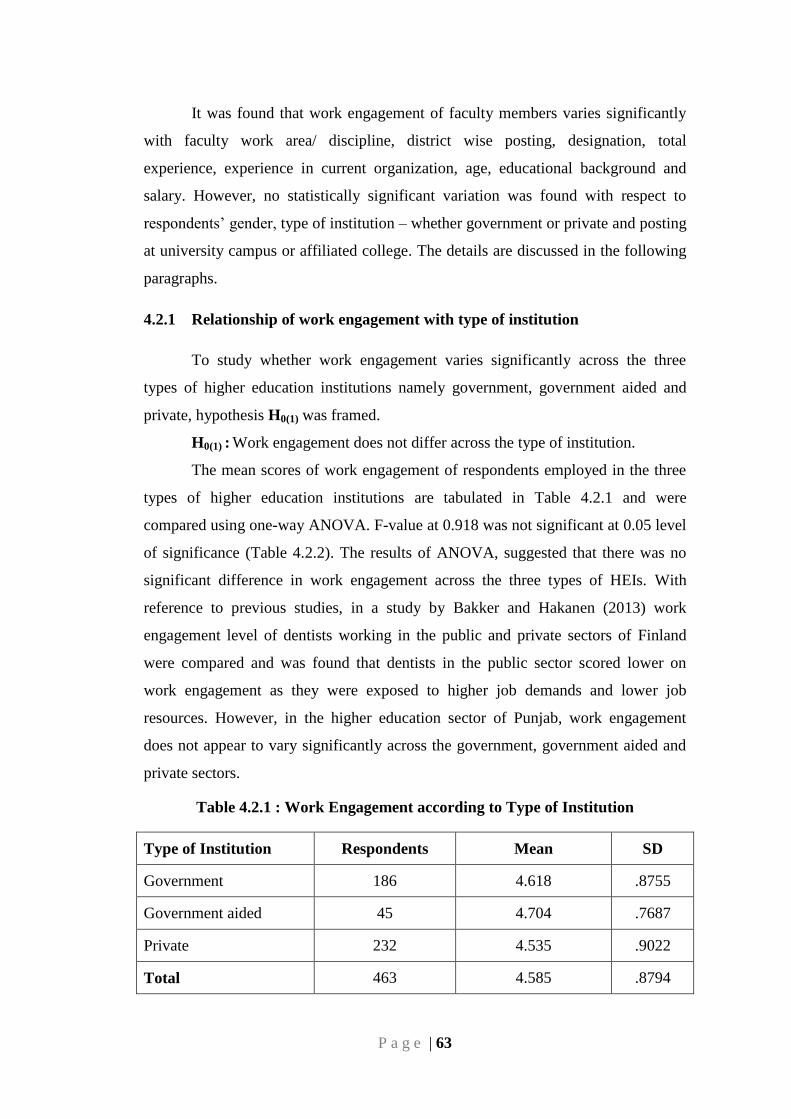
P a g e | 63
It was found that work engagement of faculty members varies significantly
with faculty work area/ discipline, district wise posting, designation, total
experience, experience in current organization, age, educational background and
salary. However, no statistically significant variation was found with respect to
respondents‘ gender, type of institution – whether government or private and posting
at university campus or affiliated college. The details are discussed in the following
paragraphs.
4.2.1 Relationship of work engagement with type of institution
To study whether work engagement varies significantly across the three
types of higher education institutions namely government, government aided and
private, hypothesis H0(1) was framed.
H0(1) : Work engagement does not differ across the type of institution.
The mean scores of work engagement of respondents employed in the three
types of higher education institutions are tabulated in Table 4.2.1 and were
compared using one-way ANOVA. F-value at 0.918 was not significant at 0.05 level
of significance (Table 4.2.2). The results of ANOVA, suggested that there was no
significant difference in work engagement across the three types of HEIs. With
reference to previous studies, in a study by Bakker and Hakanen (2013) work
engagement level of dentists working in the public and private sectors of Finland
were compared and was found that dentists in the public sector scored lower on
work engagement as they were exposed to higher job demands and lower job
resources. However, in the higher education sector of Punjab, work engagement
does not appear to vary significantly across the government, government aided and
private sectors.
Table 4.2.1 : Work Engagement according to Type of Institution
Type of Institution Respondents Mean SD
Government 186 4.618 .8755
Government aided 45 4.704 .7687
Private 232 4.535 .9022
Total 463 4.585 .8794
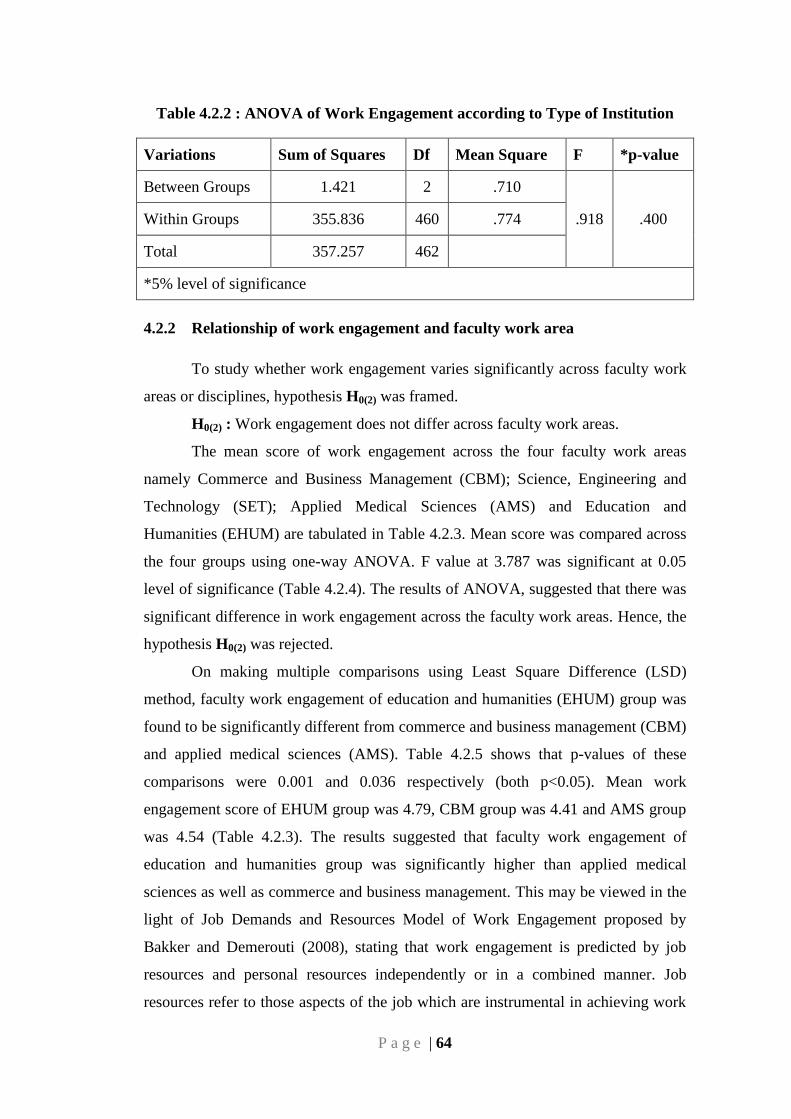
P a g e | 64
Table 4.2.2 : ANOVA of Work Engagement according to Type of Institution
Variations Sum of Squares Df Mean Square F *p-value
Between Groups 1.421 2 .710
.918 .400 Within Groups 355.836 460 .774
Total 357.257 462
*5% level of significance
4.2.2 Relationship of work engagement and faculty work area
To study whether work engagement varies significantly across faculty work
areas or disciplines, hypothesis H0(2) was framed.
H0(2) : Work engagement does not differ across faculty work areas.
The mean score of work engagement across the four faculty work areas
namely Commerce and Business Management (CBM); Science, Engineering and
Technology (SET); Applied Medical Sciences (AMS) and Education and
Humanities (EHUM) are tabulated in Table 4.2.3. Mean score was compared across
the four groups using one-way ANOVA. F value at 3.787 was significant at 0.05
level of significance (Table 4.2.4). The results of ANOVA, suggested that there was
significant difference in work engagement across the faculty work areas. Hence, the
hypothesis H0(2) was rejected.
On making multiple comparisons using Least Square Difference (LSD)
method, faculty work engagement of education and humanities (EHUM) group was
found to be significantly different from commerce and business management (CBM)
and applied medical sciences (AMS). Table 4.2.5 shows that p-values of these
comparisons were 0.001 and 0.036 respectively (both p<0.05). Mean work
engagement score of EHUM group was 4.79, CBM group was 4.41 and AMS group
was 4.54 (Table 4.2.3). The results suggested that faculty work engagement of
education and humanities group was significantly higher than applied medical
sciences as well as commerce and business management. This may be viewed in the
light of Job Demands and Resources Model of Work Engagement proposed by
Bakker and Demerouti (2008), stating that work engagement is predicted by job
resources and personal resources independently or in a combined manner. Job
resources refer to those aspects of the job which are instrumental in achieving work
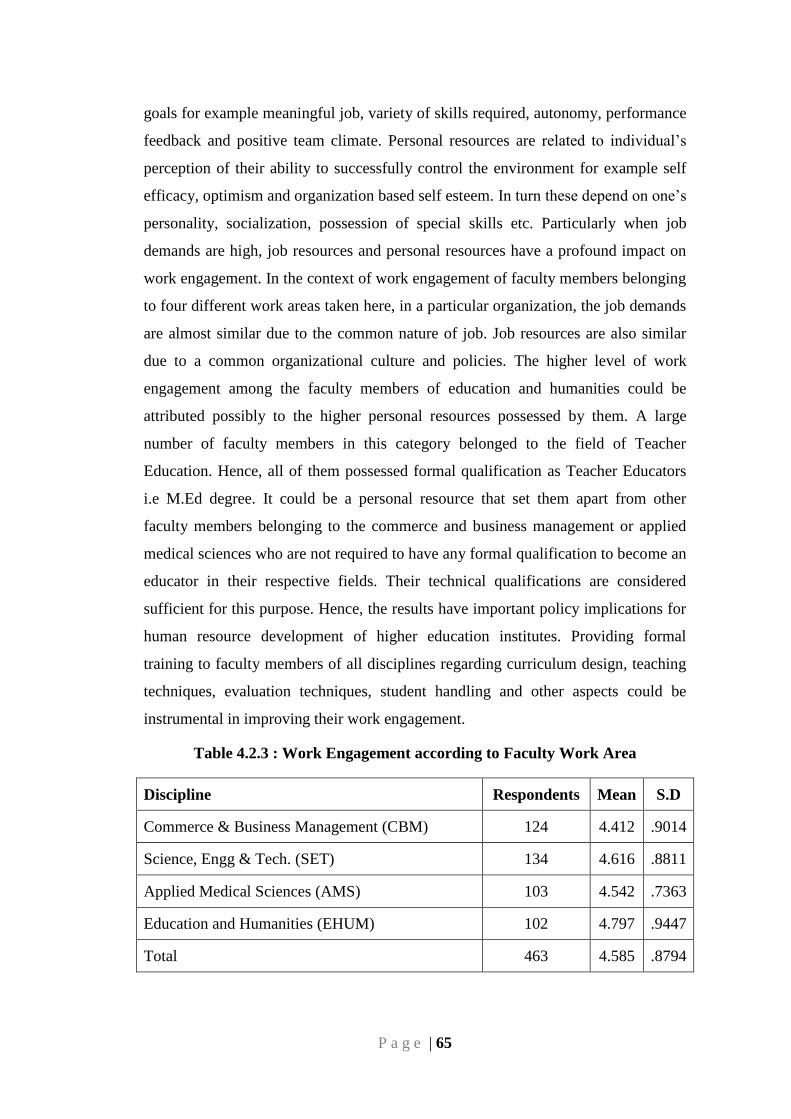
P a g e | 65
goals for example meaningful job, variety of skills required, autonomy, performance
feedback and positive team climate. Personal resources are related to individual‘s
perception of their ability to successfully control the environment for example self
efficacy, optimism and organization based self esteem. In turn these depend on one‘s
personality, socialization, possession of special skills etc. Particularly when job
demands are high, job resources and personal resources have a profound impact on
work engagement. In the context of work engagement of faculty members belonging
to four different work areas taken here, in a particular organization, the job demands
are almost similar due to the common nature of job. Job resources are also similar
due to a common organizational culture and policies. The higher level of work
engagement among the faculty members of education and humanities could be
attributed possibly to the higher personal resources possessed by them. A large
number of faculty members in this category belonged to the field of Teacher
Education. Hence, all of them possessed formal qualification as Teacher Educators
i.e M.Ed degree. It could be a personal resource that set them apart from other
faculty members belonging to the commerce and business management or applied
medical sciences who are not required to have any formal qualification to become an
educator in their respective fields. Their technical qualifications are considered
sufficient for this purpose. Hence, the results have important policy implications for
human resource development of higher education institutes. Providing formal
training to faculty members of all disciplines regarding curriculum design, teaching
techniques, evaluation techniques, student handling and other aspects could be
instrumental in improving their work engagement.
Table 4.2.3 : Work Engagement according to Faculty Work Area
Discipline Respondents Mean S.D
Commerce & Business Management (CBM) 124 4.412 .9014
Science, Engg & Tech. (SET) 134 4.616 .8811
Applied Medical Sciences (AMS) 103 4.542 .7363
Education and Humanities (EHUM) 102 4.797 .9447
Total 463 4.585 .8794
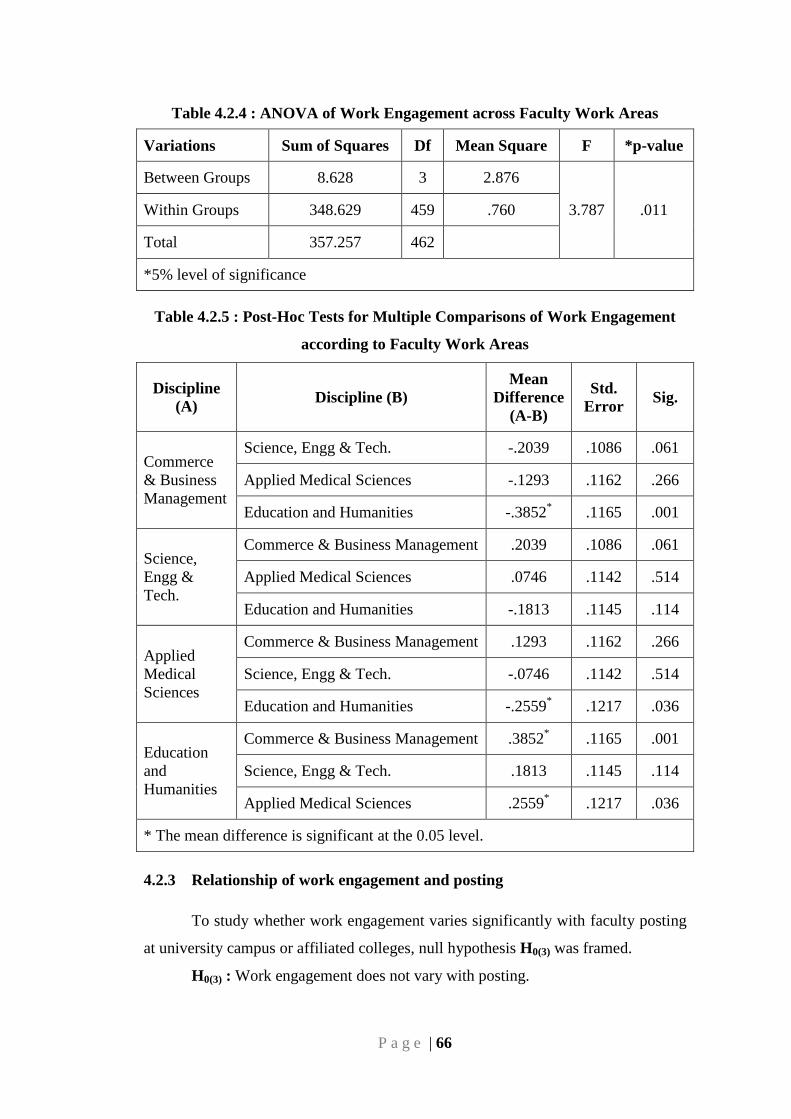
P a g e | 66
Table 4.2.4 : ANOVA of Work Engagement across Faculty Work Areas
Variations Sum of Squares Df Mean Square F *p-value
Between Groups 8.628 3 2.876
3.787 .011 Within Groups 348.629 459 .760
Total 357.257 462
*5% level of significance
Table 4.2.5 : Post-Hoc Tests for Multiple Comparisons of Work Engagement
according to Faculty Work Areas
Discipline
(A) Discipline (B)
Mean
Difference
(A-B)
Std.
Error Sig.
Commerce
& Business
Management
Science, Engg & Tech. -.2039 .1086 .061
Applied Medical Sciences -.1293 .1162 .266
Education and Humanities -.3852* .1165 .001
Science,
Engg &
Tech.
Commerce & Business Management .2039 .1086 .061
Applied Medical Sciences .0746 .1142 .514
Education and Humanities -.1813 .1145 .114
Applied
Medical
Sciences
Commerce & Business Management .1293 .1162 .266
Science, Engg & Tech. -.0746 .1142 .514
Education and Humanities -.2559* .1217 .036
Education
and
Humanities
Commerce & Business Management .3852* .1165 .001
Science, Engg & Tech. .1813 .1145 .114
Applied Medical Sciences .2559* .1217 .036
* The mean difference is significant at the 0.05 level.
4.2.3 Relationship of work engagement and posting
To study whether work engagement varies significantly with faculty posting
at university campus or affiliated colleges, null hypothesis H0(3) was framed.
H0(3) : Work engagement does not vary with posting.
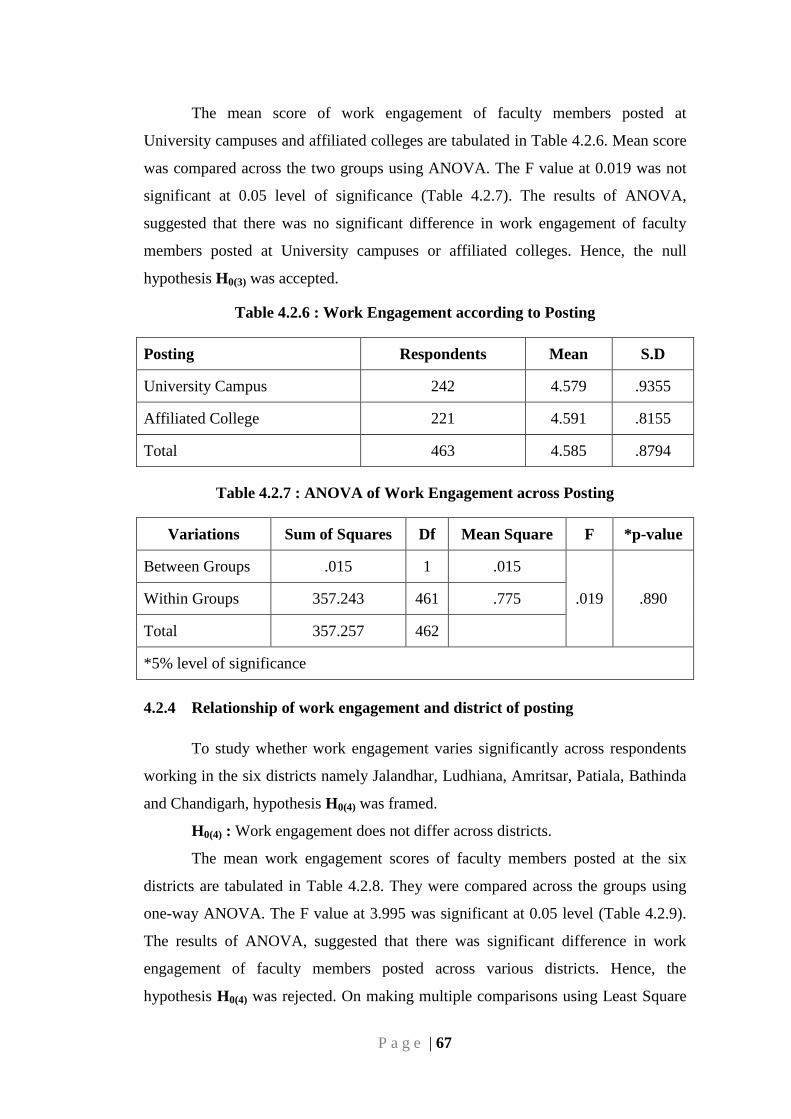
P a g e | 67
The mean score of work engagement of faculty members posted at
University campuses and affiliated colleges are tabulated in Table 4.2.6. Mean score
was compared across the two groups using ANOVA. The F value at 0.019 was not
significant at 0.05 level of significance (Table 4.2.7). The results of ANOVA,
suggested that there was no significant difference in work engagement of faculty
members posted at University campuses or affiliated colleges. Hence, the null
hypothesis H0(3) was accepted.
Table 4.2.6 : Work Engagement according to Posting
Posting Respondents Mean S.D
University Campus 242 4.579 .9355
Affiliated College 221 4.591 .8155
Total 463 4.585 .8794
Table 4.2.7 : ANOVA of Work Engagement across Posting
Variations Sum of Squares Df Mean Square F *p-value
Between Groups .015 1 .015
.019 .890 Within Groups 357.243 461 .775
Total 357.257 462
*5% level of significance
4.2.4 Relationship of work engagement and district of posting
To study whether work engagement varies significantly across respondents
working in the six districts namely Jalandhar, Ludhiana, Amritsar, Patiala, Bathinda
and Chandigarh, hypothesis H0(4) was framed.
H0(4) : Work engagement does not differ across districts.
The mean work engagement scores of faculty members posted at the six
districts are tabulated in Table 4.2.8. They were compared across the groups using
one-way ANOVA. The F value at 3.995 was significant at 0.05 level (Table 4.2.9).
The results of ANOVA, suggested that there was significant difference in work
engagement of faculty members posted across various districts. Hence, the
hypothesis H0(4) was rejected. On making multiple comparisons using Least Square
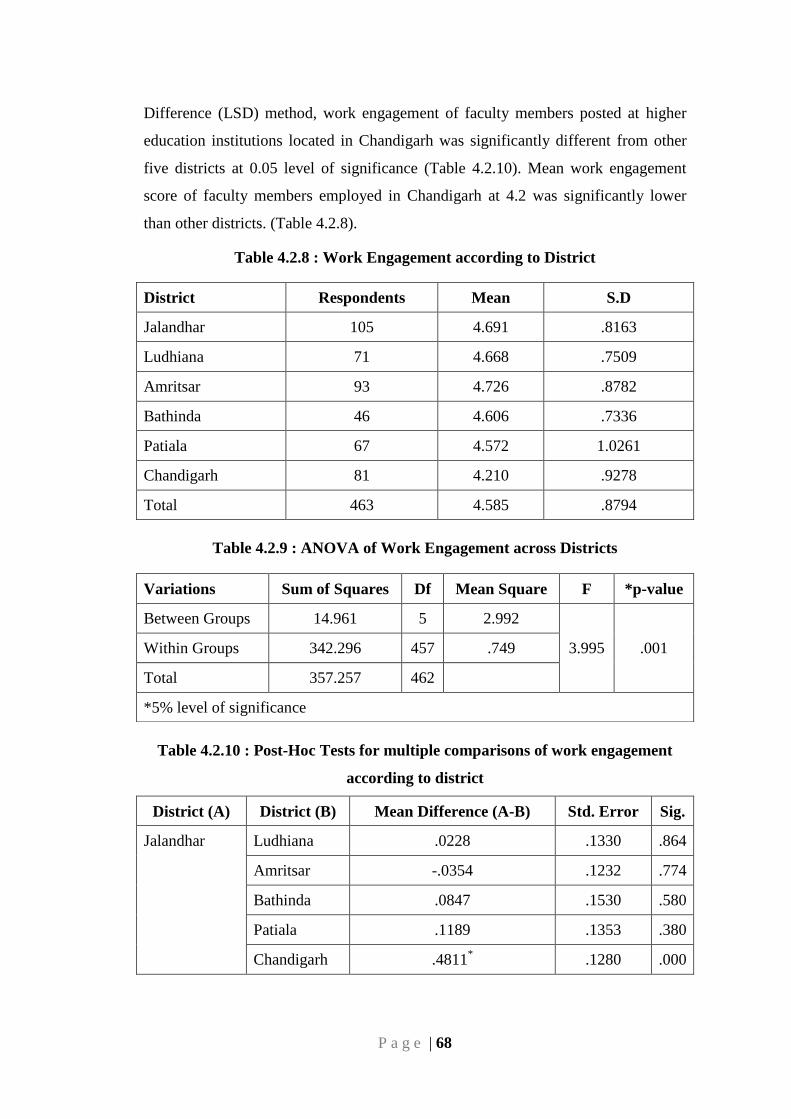
P a g e | 68
Difference (LSD) method, work engagement of faculty members posted at higher
education institutions located in Chandigarh was significantly different from other
five districts at 0.05 level of significance (Table 4.2.10). Mean work engagement
score of faculty members employed in Chandigarh at 4.2 was significantly lower
than other districts. (Table 4.2.8).
Table 4.2.8 : Work Engagement according to District
District Respondents Mean S.D
Jalandhar 105 4.691 .8163
Ludhiana 71 4.668 .7509
Amritsar 93 4.726 .8782
Bathinda 46 4.606 .7336
Patiala 67 4.572 1.0261
Chandigarh 81 4.210 .9278
Total 463 4.585 .8794
Table 4.2.9 : ANOVA of Work Engagement across Districts
Table 4.2.10 : Post-Hoc Tests for multiple comparisons of work engagement
according to district
District (A) District (B) Mean Difference (A-B) Std. Error Sig.
Jalandhar Ludhiana .0228 .1330 .864
Amritsar -.0354 .1232 .774
Bathinda .0847 .1530 .580
Patiala .1189 .1353 .380
Chandigarh .4811* .1280 .000
Variations Sum of Squares Df Mean Square F *p-value
Between Groups 14.961 5 2.992
3.995 .001 Within Groups 342.296 457 .749
Total 357.257 462
*5% level of significance
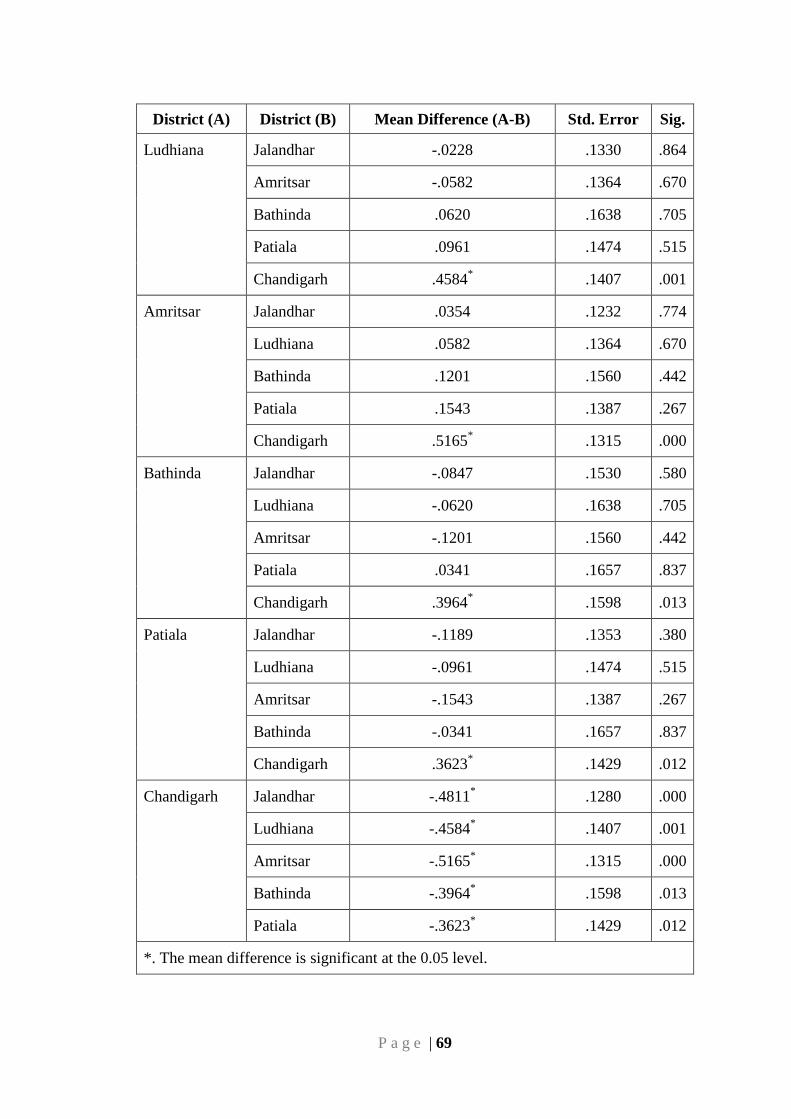
P a g e | 69
District (A) District (B) Mean Difference (A-B) Std. Error Sig.
Ludhiana Jalandhar -.0228 .1330 .864
Amritsar -.0582 .1364 .670
Bathinda .0620 .1638 .705
Patiala .0961 .1474 .515
Chandigarh .4584* .1407 .001
Amritsar Jalandhar .0354 .1232 .774
Ludhiana .0582 .1364 .670
Bathinda .1201 .1560 .442
Patiala .1543 .1387 .267
Chandigarh .5165* .1315 .000
Bathinda Jalandhar -.0847 .1530 .580
Ludhiana -.0620 .1638 .705
Amritsar -.1201 .1560 .442
Patiala .0341 .1657 .837
Chandigarh .3964* .1598 .013
Patiala Jalandhar -.1189 .1353 .380
Ludhiana -.0961 .1474 .515
Amritsar -.1543 .1387 .267
Bathinda -.0341 .1657 .837
Chandigarh .3623* .1429 .012
Chandigarh Jalandhar -.4811* .1280 .000
Ludhiana -.4584* .1407 .001
Amritsar -.5165* .1315 .000
Bathinda -.3964* .1598 .013
Patiala -.3623* .1429 .012
*. The mean difference is significant at the 0.05 level.
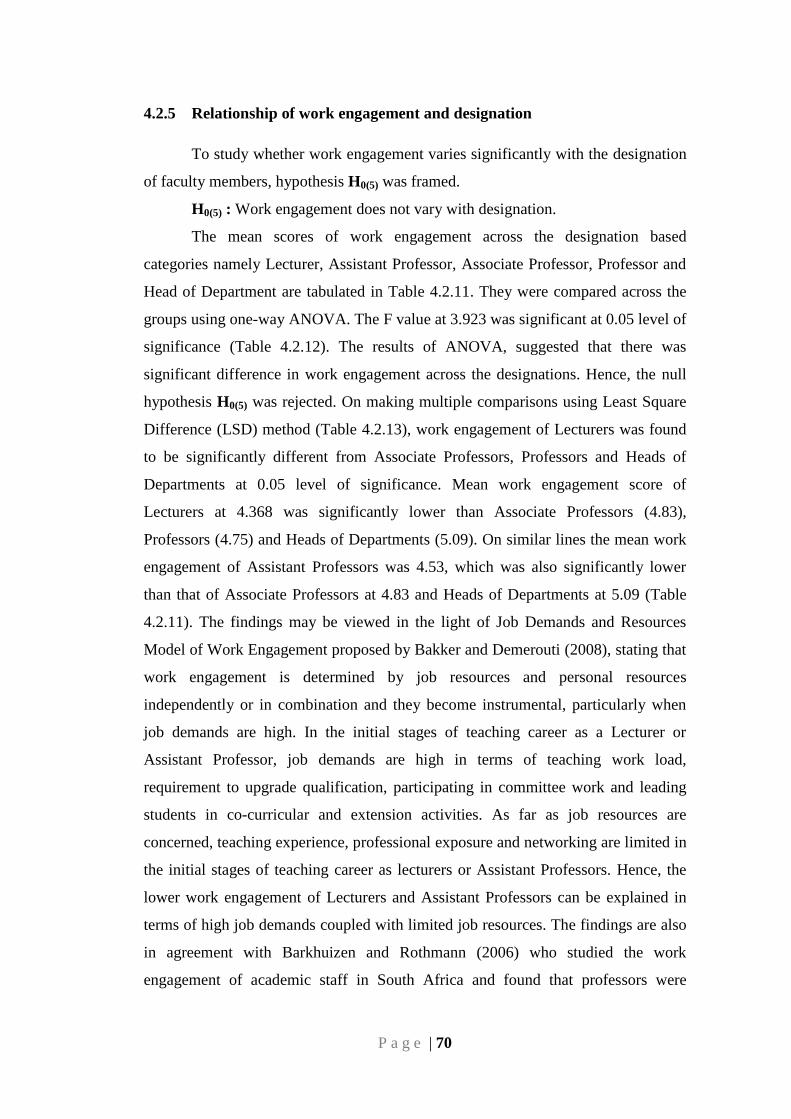
P a g e | 70
4.2.5 Relationship of work engagement and designation
To study whether work engagement varies significantly with the designation
of faculty members, hypothesis H0(5) was framed.
H0(5) : Work engagement does not vary with designation.
The mean scores of work engagement across the designation based
categories namely Lecturer, Assistant Professor, Associate Professor, Professor and
Head of Department are tabulated in Table 4.2.11. They were compared across the
groups using one-way ANOVA. The F value at 3.923 was significant at 0.05 level of
significance (Table 4.2.12). The results of ANOVA, suggested that there was
significant difference in work engagement across the designations. Hence, the null
hypothesis H0(5) was rejected. On making multiple comparisons using Least Square
Difference (LSD) method (Table 4.2.13), work engagement of Lecturers was found
to be significantly different from Associate Professors, Professors and Heads of
Departments at 0.05 level of significance. Mean work engagement score of
Lecturers at 4.368 was significantly lower than Associate Professors (4.83),
Professors (4.75) and Heads of Departments (5.09). On similar lines the mean work
engagement of Assistant Professors was 4.53, which was also significantly lower
than that of Associate Professors at 4.83 and Heads of Departments at 5.09 (Table
4.2.11). The findings may be viewed in the light of Job Demands and Resources
Model of Work Engagement proposed by Bakker and Demerouti (2008), stating that
work engagement is determined by job resources and personal resources
independently or in combination and they become instrumental, particularly when
job demands are high. In the initial stages of teaching career as a Lecturer or
Assistant Professor, job demands are high in terms of teaching work load,
requirement to upgrade qualification, participating in committee work and leading
students in co-curricular and extension activities. As far as job resources are
concerned, teaching experience, professional exposure and networking are limited in
the initial stages of teaching career as lecturers or Assistant Professors. Hence, the
lower work engagement of Lecturers and Assistant Professors can be explained in
terms of high job demands coupled with limited job resources. The findings are also
in agreement with Barkhuizen and Rothmann (2006) who studied the work
engagement of academic staff in South Africa and found that professors were
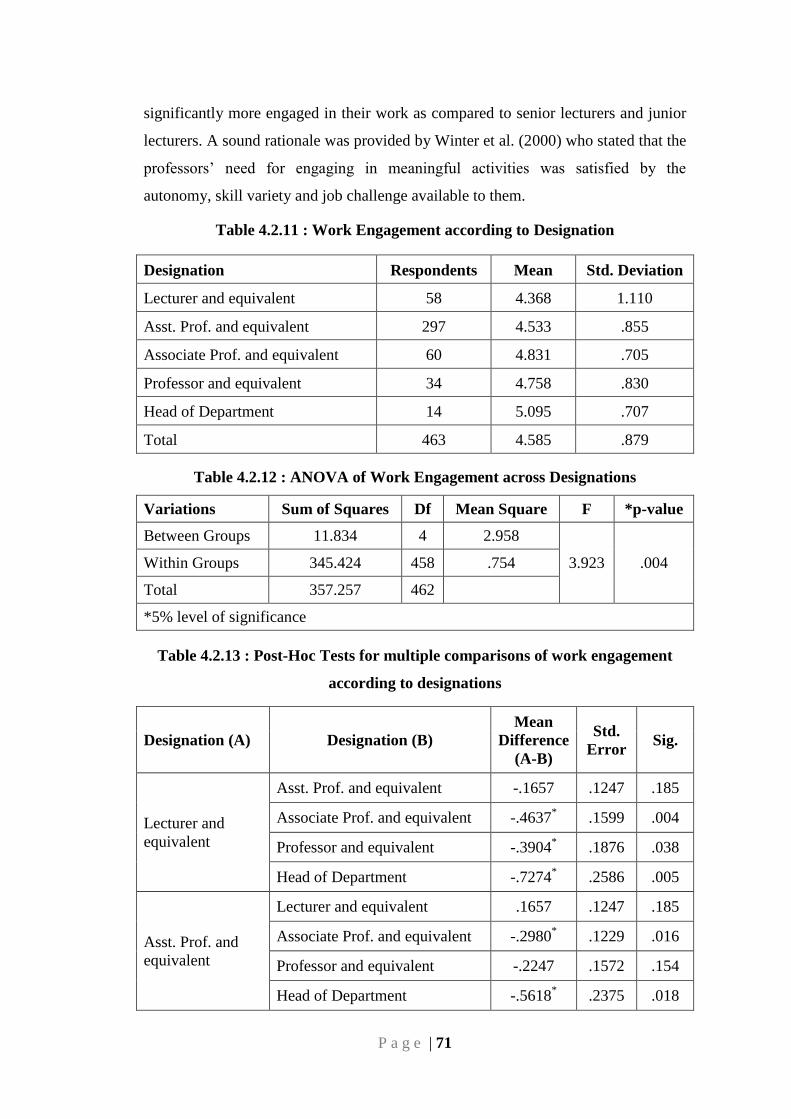
P a g e | 71
significantly more engaged in their work as compared to senior lecturers and junior
lecturers. A sound rationale was provided by Winter et al. (2000) who stated that the
professors‘ need for engaging in meaningful activities was satisfied by the
autonomy, skill variety and job challenge available to them.
Table 4.2.11 : Work Engagement according to Designation
Designation Respondents Mean Std. Deviation
Lecturer and equivalent 58 4.368 1.110
Asst. Prof. and equivalent 297 4.533 .855
Associate Prof. and equivalent 60 4.831 .705
Professor and equivalent 34 4.758 .830
Head of Department 14 5.095 .707
Total 463 4.585 .879
Table 4.2.12 : ANOVA of Work Engagement across Designations
Variations Sum of Squares Df Mean Square F *p-value
Between Groups 11.834 4 2.958
3.923 .004 Within Groups 345.424 458 .754
Total 357.257 462
*5% level of significance
Table 4.2.13 : Post-Hoc Tests for multiple comparisons of work engagement
according to designations
Designation (A) Designation (B)
Mean
Difference
(A-B)
Std.
Error Sig.
Lecturer and
equivalent
Asst. Prof. and equivalent -.1657 .1247 .185
Associate Prof. and equivalent -.4637* .1599 .004
Professor and equivalent -.3904* .1876 .038
Head of Department -.7274* .2586 .005
Asst. Prof. and
equivalent
Lecturer and equivalent .1657 .1247 .185
Associate Prof. and equivalent -.2980* .1229 .016
Professor and equivalent -.2247 .1572 .154
Head of Department -.5618* .2375 .018
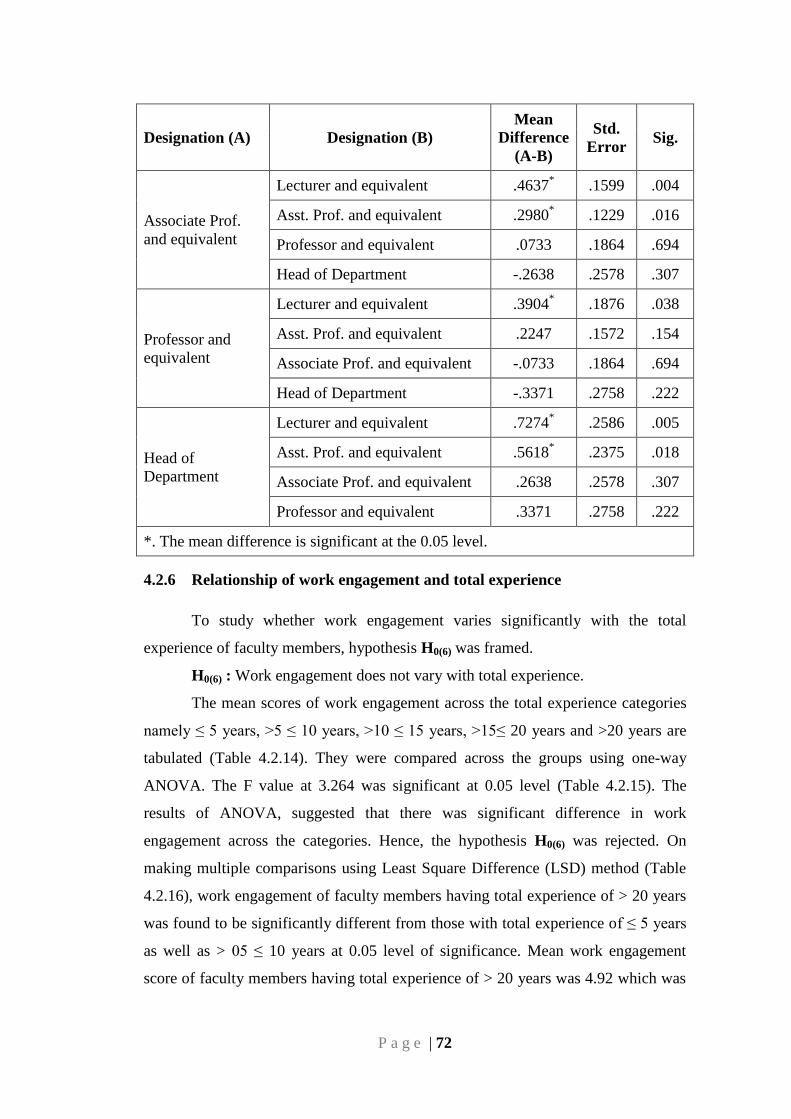
P a g e | 72
Designation (A) Designation (B)
Mean
Difference
(A-B)
Std.
Error Sig.
Associate Prof.
and equivalent
Lecturer and equivalent .4637* .1599 .004
Asst. Prof. and equivalent .2980* .1229 .016
Professor and equivalent .0733 .1864 .694
Head of Department -.2638 .2578 .307
Professor and
equivalent
Lecturer and equivalent .3904* .1876 .038
Asst. Prof. and equivalent .2247 .1572 .154
Associate Prof. and equivalent -.0733 .1864 .694
Head of Department -.3371 .2758 .222
Head of
Department
Lecturer and equivalent .7274* .2586 .005
Asst. Prof. and equivalent .5618* .2375 .018
Associate Prof. and equivalent .2638 .2578 .307
Professor and equivalent .3371 .2758 .222
*. The mean difference is significant at the 0.05 level.
4.2.6 Relationship of work engagement and total experience
To study whether work engagement varies significantly with the total
experience of faculty members, hypothesis H0(6) was framed.
H0(6) : Work engagement does not vary with total experience.
The mean scores of work engagement across the total experience categories
namely ≤ 5 years, >5 ≤ 10 years, >10 ≤ 15 years, >15≤ 20 years and >20 years are
tabulated (Table 4.2.14). They were compared across the groups using one-way
ANOVA. The F value at 3.264 was significant at 0.05 level (Table 4.2.15). The
results of ANOVA, suggested that there was significant difference in work
engagement across the categories. Hence, the hypothesis H0(6) was rejected. On
making multiple comparisons using Least Square Difference (LSD) method (Table
4.2.16), work engagement of faculty members having total experience of > 20 years
was found to be significantly different from those with total experience of ≤ 5 years
as well as > 05 ≤ 10 years at 0.05 level of significance. Mean work engagement
score of faculty members having total experience of > 20 years was 4.92 which was
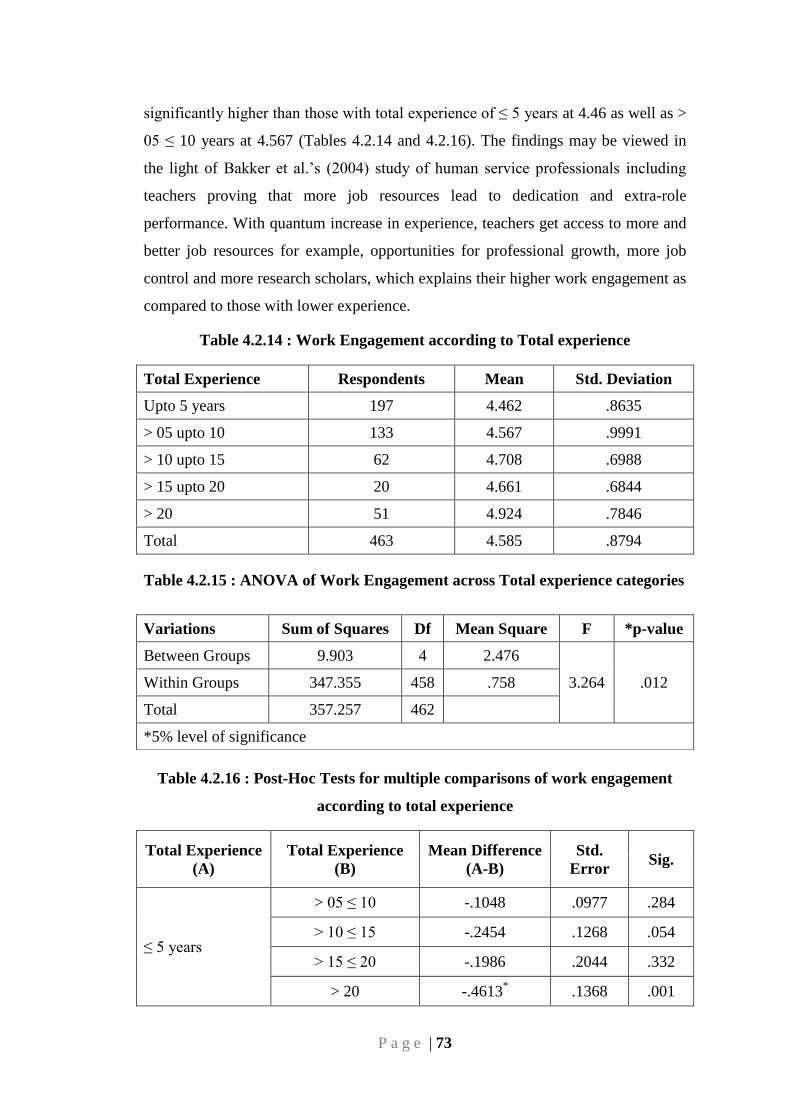
P a g e | 73
significantly higher than those with total experience of ≤ 5 years at 4.46 as well as >
05 ≤ 10 years at 4.567 (Tables 4.2.14 and 4.2.16). The findings may be viewed in
the light of Bakker et al.‘s (2004) study of human service professionals including
teachers proving that more job resources lead to dedication and extra-role
performance. With quantum increase in experience, teachers get access to more and
better job resources for example, opportunities for professional growth, more job
control and more research scholars, which explains their higher work engagement as
compared to those with lower experience.
Table 4.2.14 : Work Engagement according to Total experience
Total Experience Respondents Mean Std. Deviation
Upto 5 years 197 4.462 .8635
> 05 upto 10 133 4.567 .9991
> 10 upto 15 62 4.708 .6988
> 15 upto 20 20 4.661 .6844
> 20 51 4.924 .7846
Total 463 4.585 .8794
Table 4.2.15 : ANOVA of Work Engagement across Total experience categories
Table 4.2.16 : Post-Hoc Tests for multiple comparisons of work engagement
according to total experience
Total Experience
(A)
Total Experience
(B)
Mean Difference
(A-B)
Std.
Error Sig.
≤ 5 years
> 05 ≤ 10 -.1048 .0977 .284
> 10 ≤ 15 -.2454 .1268 .054
> 15 ≤ 20 -.1986 .2044 .332
> 20 -.4613* .1368 .001
Variations Sum of Squares Df Mean Square F *p-value
Between Groups 9.903 4 2.476
3.264 .012 Within Groups 347.355 458 .758
Total 357.257 462
*5% level of significance
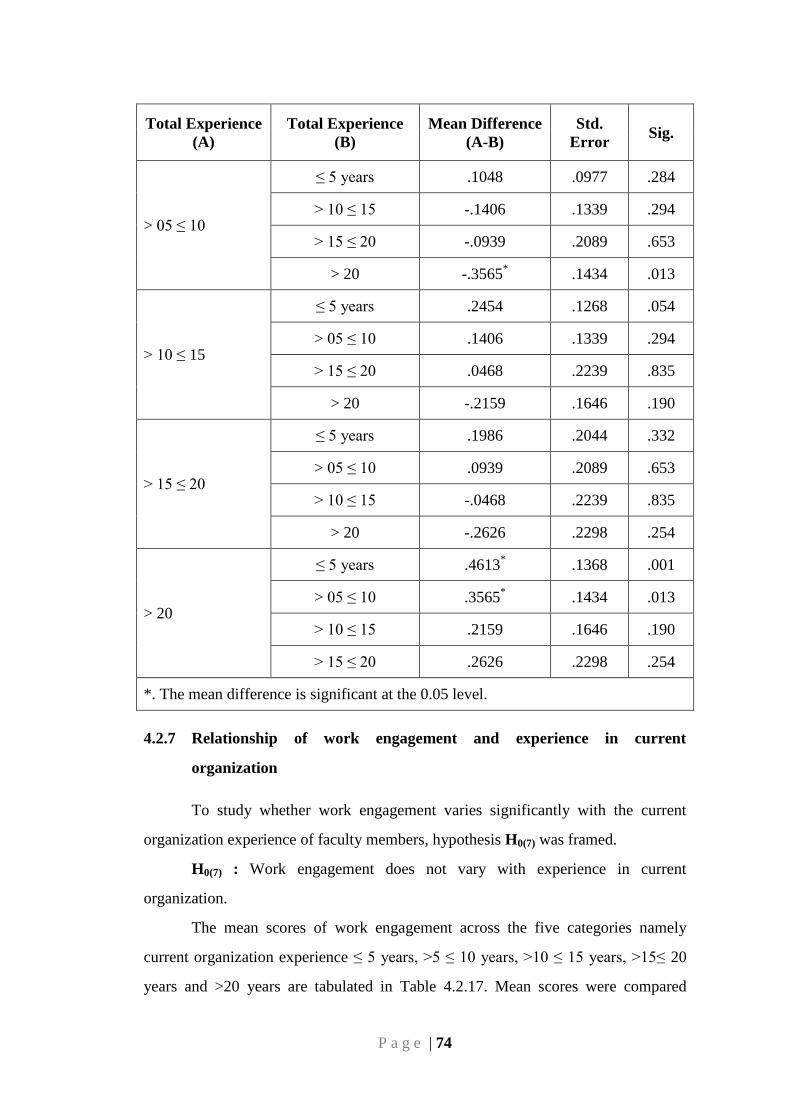
P a g e | 74
Total Experience
(A)
Total Experience
(B)
Mean Difference
(A-B)
Std.
Error Sig.
> 05 ≤ 10
≤ 5 years .1048 .0977 .284
> 10 ≤ 15 -.1406 .1339 .294
> 15 ≤ 20 -.0939 .2089 .653
> 20 -.3565* .1434 .013
> 10 ≤ 15
≤ 5 years .2454 .1268 .054
> 05 ≤ 10 .1406 .1339 .294
> 15 ≤ 20 .0468 .2239 .835
> 20 -.2159 .1646 .190
> 15 ≤ 20
≤ 5 years .1986 .2044 .332
> 05 ≤ 10 .0939 .2089 .653
> 10 ≤ 15 -.0468 .2239 .835
> 20 -.2626 .2298 .254
> 20
≤ 5 years .4613* .1368 .001
> 05 ≤ 10 .3565* .1434 .013
> 10 ≤ 15 .2159 .1646 .190
> 15 ≤ 20 .2626 .2298 .254
*. The mean difference is significant at the 0.05 level.
4.2.7 Relationship of work engagement and experience in current
organization
To study whether work engagement varies significantly with the current
organization experience of faculty members, hypothesis H0(7) was framed.
H0(7) : Work engagement does not vary with experience in current
organization.
The mean scores of work engagement across the five categories namely
current organization experience ≤ 5 years, >5 ≤ 10 years, >10 ≤ 15 years, >15≤ 20
years and >20 years are tabulated in Table 4.2.17. Mean scores were compared
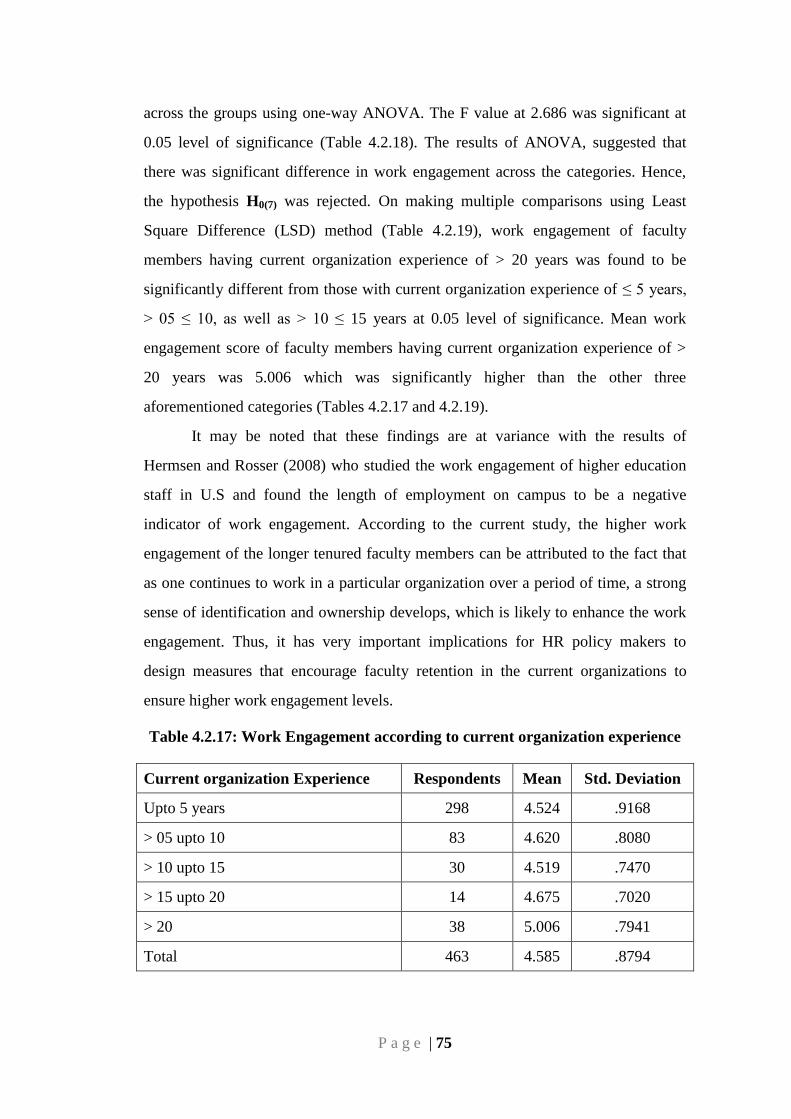
P a g e | 75
across the groups using one-way ANOVA. The F value at 2.686 was significant at
0.05 level of significance (Table 4.2.18). The results of ANOVA, suggested that
there was significant difference in work engagement across the categories. Hence,
the hypothesis H0(7) was rejected. On making multiple comparisons using Least
Square Difference (LSD) method (Table 4.2.19), work engagement of faculty
members having current organization experience of > 20 years was found to be
significantly different from those with current organization experience of ≤ 5 years,
> 05 ≤ 10, as well as > 10 ≤ 15 years at 0.05 level of significance. Mean work
engagement score of faculty members having current organization experience of >
20 years was 5.006 which was significantly higher than the other three
aforementioned categories (Tables 4.2.17 and 4.2.19).
It may be noted that these findings are at variance with the results of
Hermsen and Rosser (2008) who studied the work engagement of higher education
staff in U.S and found the length of employment on campus to be a negative
indicator of work engagement. According to the current study, the higher work
engagement of the longer tenured faculty members can be attributed to the fact that
as one continues to work in a particular organization over a period of time, a strong
sense of identification and ownership develops, which is likely to enhance the work
engagement. Thus, it has very important implications for HR policy makers to
design measures that encourage faculty retention in the current organizations to
ensure higher work engagement levels.
Table 4.2.17: Work Engagement according to current organization experience
Current organization Experience Respondents Mean Std. Deviation
Upto 5 years 298 4.524 .9168
> 05 upto 10 83 4.620 .8080
> 10 upto 15 30 4.519 .7470
> 15 upto 20 14 4.675 .7020
> 20 38 5.006 .7941
Total 463 4.585 .8794
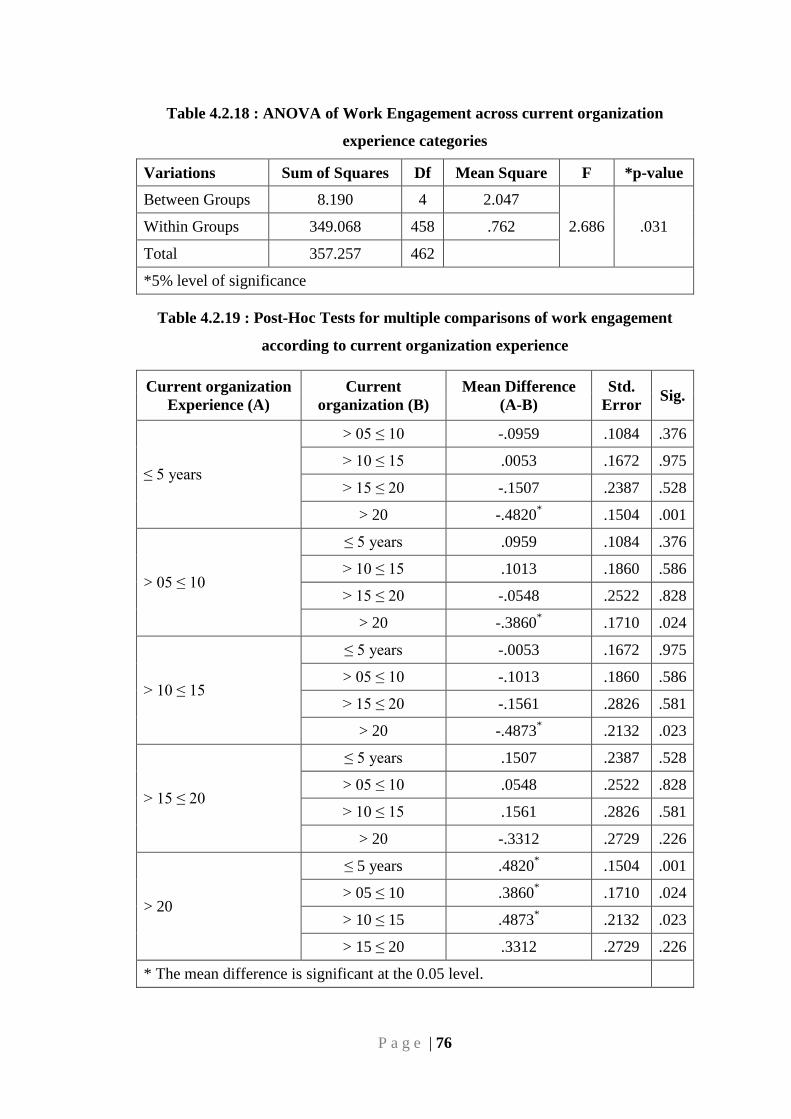
P a g e | 76
Table 4.2.18 : ANOVA of Work Engagement across current organization
experience categories
Variations Sum of Squares Df Mean Square F *p-value
Between Groups 8.190 4 2.047
2.686 .031 Within Groups 349.068 458 .762
Total 357.257 462
*5% level of significance
Table 4.2.19 : Post-Hoc Tests for multiple comparisons of work engagement
according to current organization experience
Current organization
Experience (A)
Current
organization (B)
Mean Difference
(A-B)
Std.
Error Sig.
≤ 5 years
> 05 ≤ 10 -.0959 .1084 .376
> 10 ≤ 15 .0053 .1672 .975
> 15 ≤ 20 -.1507 .2387 .528
> 20 -.4820* .1504 .001
> 05 ≤ 10
≤ 5 years .0959 .1084 .376
> 10 ≤ 15 .1013 .1860 .586
> 15 ≤ 20 -.0548 .2522 .828
> 20 -.3860* .1710 .024
> 10 ≤ 15
≤ 5 years -.0053 .1672 .975
> 05 ≤ 10 -.1013 .1860 .586
> 15 ≤ 20 -.1561 .2826 .581
> 20 -.4873* .2132 .023
> 15 ≤ 20
≤ 5 years .1507 .2387 .528
> 05 ≤ 10 .0548 .2522 .828
> 10 ≤ 15 .1561 .2826 .581
> 20 -.3312 .2729 .226
> 20
≤ 5 years .4820* .1504 .001
> 05 ≤ 10 .3860* .1710 .024
> 10 ≤ 15 .4873* .2132 .023
> 15 ≤ 20 .3312 .2729 .226
* The mean difference is significant at the 0.05 level.
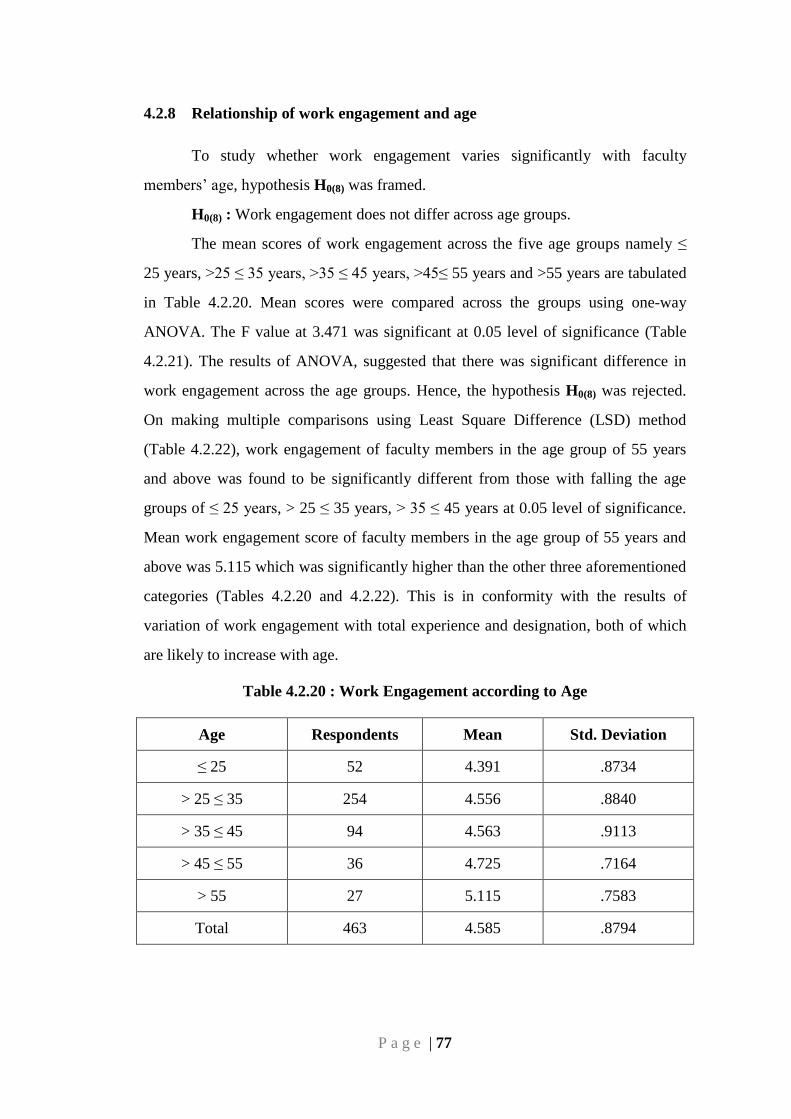
P a g e | 77
4.2.8 Relationship of work engagement and age
To study whether work engagement varies significantly with faculty
members‘ age, hypothesis H0(8) was framed.
H0(8) : Work engagement does not differ across age groups.
The mean scores of work engagement across the five age groups namely ≤
25 years, >25 ≤ 35 years, >35 ≤ 45 years, >45≤ 55 years and >55 years are tabulated
in Table 4.2.20. Mean scores were compared across the groups using one-way
ANOVA. The F value at 3.471 was significant at 0.05 level of significance (Table
4.2.21). The results of ANOVA, suggested that there was significant difference in
work engagement across the age groups. Hence, the hypothesis H0(8) was rejected.
On making multiple comparisons using Least Square Difference (LSD) method
(Table 4.2.22), work engagement of faculty members in the age group of 55 years
and above was found to be significantly different from those with falling the age
groups of ≤ 25 years, > 25 ≤ 35 years, > 35 ≤ 45 years at 0.05 level of significance.
Mean work engagement score of faculty members in the age group of 55 years and
above was 5.115 which was significantly higher than the other three aforementioned
categories (Tables 4.2.20 and 4.2.22). This is in conformity with the results of
variation of work engagement with total experience and designation, both of which
are likely to increase with age.
Table 4.2.20 : Work Engagement according to Age
Age Respondents Mean Std. Deviation
≤ 25 52 4.391 .8734
> 25 ≤ 35 254 4.556 .8840
> 35 ≤ 45 94 4.563 .9113
> 45 ≤ 55 36 4.725 .7164
> 55 27 5.115 .7583
Total 463 4.585 .8794
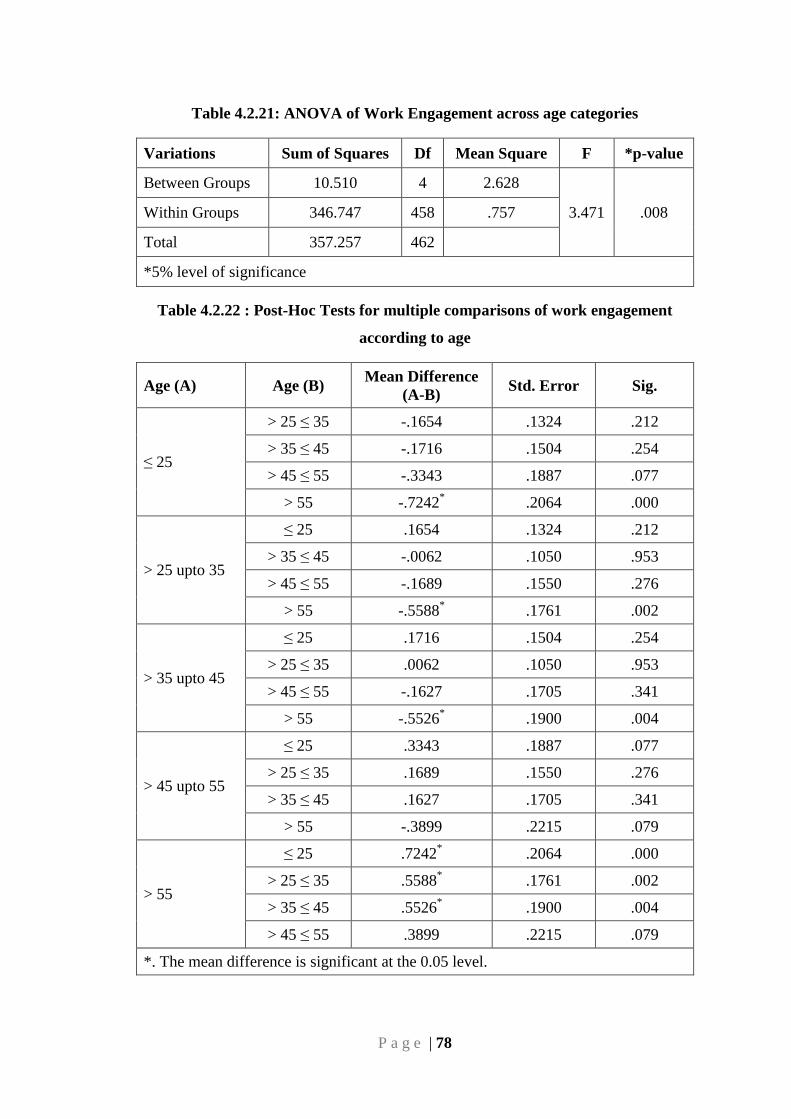
P a g e | 78
Table 4.2.21: ANOVA of Work Engagement across age categories
Variations Sum of Squares Df Mean Square F *p-value
Between Groups 10.510 4 2.628
3.471 .008 Within Groups 346.747 458 .757
Total 357.257 462
*5% level of significance
Table 4.2.22 : Post-Hoc Tests for multiple comparisons of work engagement
according to age
Age (A) Age (B) Mean Difference
(A-B) Std. Error Sig.
≤ 25
> 25 ≤ 35 -.1654 .1324 .212
> 35 ≤ 45 -.1716 .1504 .254
> 45 ≤ 55 -.3343 .1887 .077
> 55 -.7242* .2064 .000
> 25 upto 35
≤ 25 .1654 .1324 .212
> 35 ≤ 45 -.0062 .1050 .953
> 45 ≤ 55 -.1689 .1550 .276
> 55 -.5588* .1761 .002
> 35 upto 45
≤ 25 .1716 .1504 .254
> 25 ≤ 35 .0062 .1050 .953
> 45 ≤ 55 -.1627 .1705 .341
> 55 -.5526* .1900 .004
> 45 upto 55
≤ 25 .3343 .1887 .077
> 25 ≤ 35 .1689 .1550 .276
> 35 ≤ 45 .1627 .1705 .341
> 55 -.3899 .2215 .079
> 55
≤ 25 .7242* .2064 .000
> 25 ≤ 35 .5588* .1761 .002
> 35 ≤ 45 .5526* .1900 .004
> 45 ≤ 55 .3899 .2215 .079
*. The mean difference is significant at the 0.05 level.
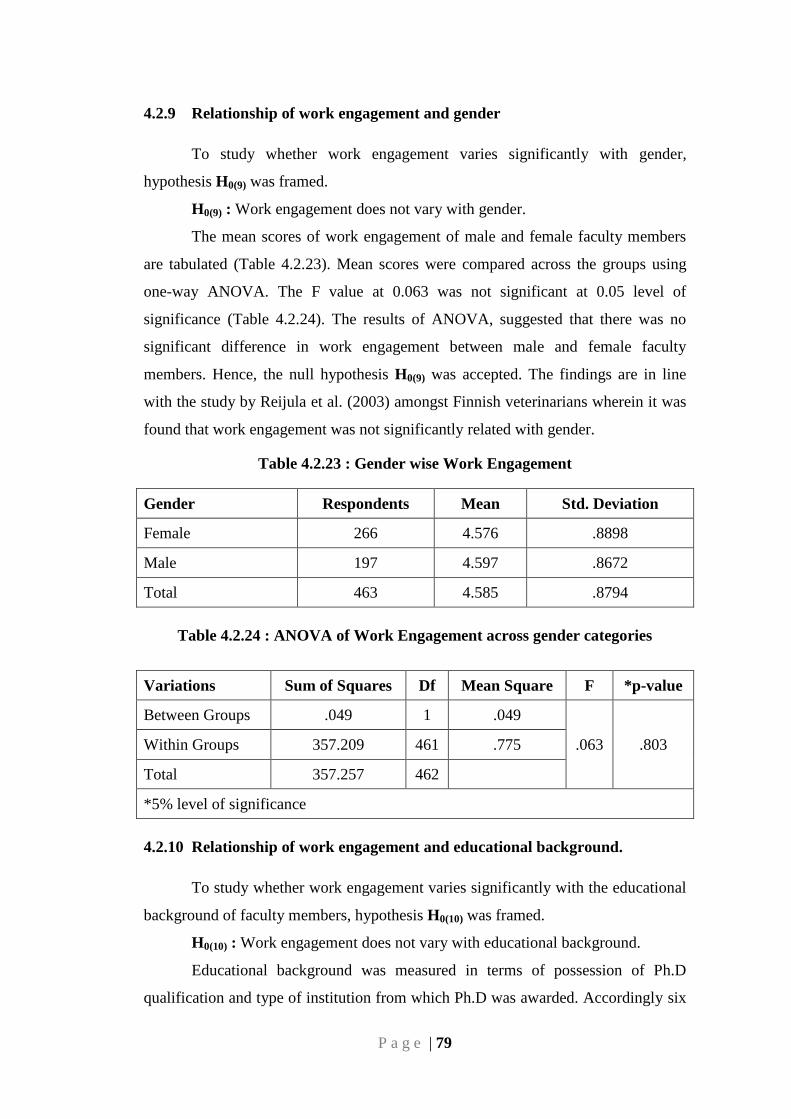
P a g e | 79
4.2.9 Relationship of work engagement and gender
To study whether work engagement varies significantly with gender,
hypothesis H0(9) was framed.
H0(9) : Work engagement does not vary with gender.
The mean scores of work engagement of male and female faculty members
are tabulated (Table 4.2.23). Mean scores were compared across the groups using
one-way ANOVA. The F value at 0.063 was not significant at 0.05 level of
significance (Table 4.2.24). The results of ANOVA, suggested that there was no
significant difference in work engagement between male and female faculty
members. Hence, the null hypothesis H0(9) was accepted. The findings are in line
with the study by Reijula et al. (2003) amongst Finnish veterinarians wherein it was
found that work engagement was not significantly related with gender.
Table 4.2.23 : Gender wise Work Engagement
Gender Respondents Mean Std. Deviation
Female 266 4.576 .8898
Male 197 4.597 .8672
Total 463 4.585 .8794
Table 4.2.24 : ANOVA of Work Engagement across gender categories
4.2.10 Relationship of work engagement and educational background.
To study whether work engagement varies significantly with the educational
background of faculty members, hypothesis H0(10) was framed.
H0(10) : Work engagement does not vary with educational background.
Educational background was measured in terms of possession of Ph.D
qualification and type of institution from which Ph.D was awarded. Accordingly six
Variations Sum of Squares Df Mean Square F *p-value
Between Groups .049 1 .049
.063 .803 Within Groups 357.209 461 .775
Total 357.257 462
*5% level of significance
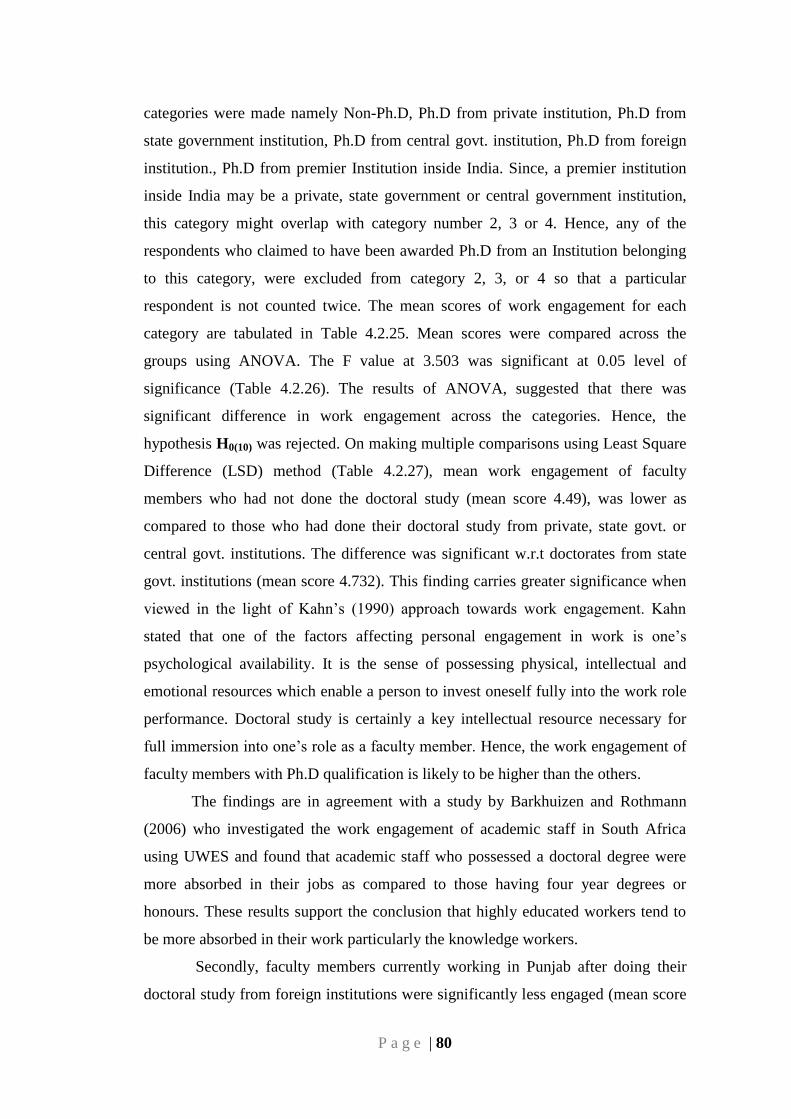
P a g e | 80
categories were made namely Non-Ph.D, Ph.D from private institution, Ph.D from
state government institution, Ph.D from central govt. institution, Ph.D from foreign
institution., Ph.D from premier Institution inside India. Since, a premier institution
inside India may be a private, state government or central government institution,
this category might overlap with category number 2, 3 or 4. Hence, any of the
respondents who claimed to have been awarded Ph.D from an Institution belonging
to this category, were excluded from category 2, 3, or 4 so that a particular
respondent is not counted twice. The mean scores of work engagement for each
category are tabulated in Table 4.2.25. Mean scores were compared across the
groups using ANOVA. The F value at 3.503 was significant at 0.05 level of
significance (Table 4.2.26). The results of ANOVA, suggested that there was
significant difference in work engagement across the categories. Hence, the
hypothesis H0(10) was rejected. On making multiple comparisons using Least Square
Difference (LSD) method (Table 4.2.27), mean work engagement of faculty
members who had not done the doctoral study (mean score 4.49), was lower as
compared to those who had done their doctoral study from private, state govt. or
central govt. institutions. The difference was significant w.r.t doctorates from state
govt. institutions (mean score 4.732). This finding carries greater significance when
viewed in the light of Kahn‘s (1990) approach towards work engagement. Kahn
stated that one of the factors affecting personal engagement in work is one‘s
psychological availability. It is the sense of possessing physical, intellectual and
emotional resources which enable a person to invest oneself fully into the work role
performance. Doctoral study is certainly a key intellectual resource necessary for
full immersion into one‘s role as a faculty member. Hence, the work engagement of
faculty members with Ph.D qualification is likely to be higher than the others.
The findings are in agreement with a study by Barkhuizen and Rothmann
(2006) who investigated the work engagement of academic staff in South Africa
using UWES and found that academic staff who possessed a doctoral degree were
more absorbed in their jobs as compared to those having four year degrees or
honours. These results support the conclusion that highly educated workers tend to
be more absorbed in their work particularly the knowledge workers.
Secondly, faculty members currently working in Punjab after doing their
doctoral study from foreign institutions were significantly less engaged (mean score
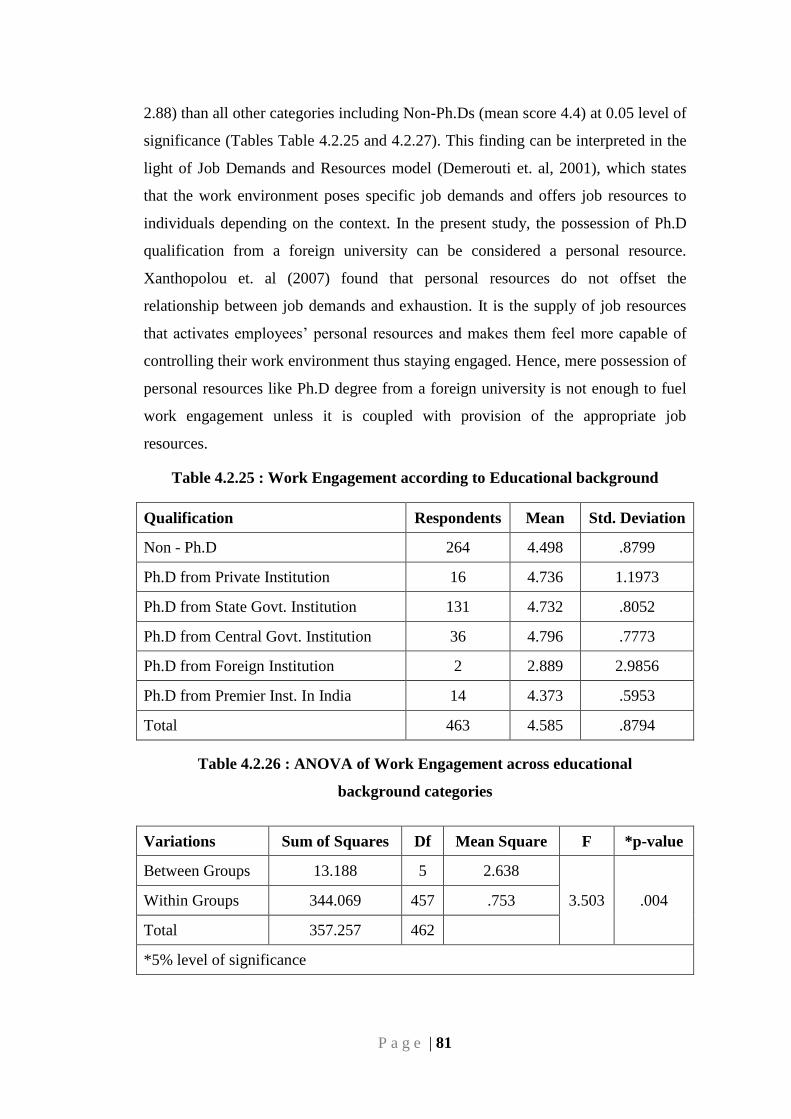
P a g e | 81
2.88) than all other categories including Non-Ph.Ds (mean score 4.4) at 0.05 level of
significance (Tables Table 4.2.25 and 4.2.27). This finding can be interpreted in the
light of Job Demands and Resources model (Demerouti et. al, 2001), which states
that the work environment poses specific job demands and offers job resources to
individuals depending on the context. In the present study, the possession of Ph.D
qualification from a foreign university can be considered a personal resource.
Xanthopolou et. al (2007) found that personal resources do not offset the
relationship between job demands and exhaustion. It is the supply of job resources
that activates employees‘ personal resources and makes them feel more capable of
controlling their work environment thus staying engaged. Hence, mere possession of
personal resources like Ph.D degree from a foreign university is not enough to fuel
work engagement unless it is coupled with provision of the appropriate job
resources.
Table 4.2.25 : Work Engagement according to Educational background
Qualification Respondents Mean Std. Deviation
Non - Ph.D 264 4.498 .8799
Ph.D from Private Institution 16 4.736 1.1973
Ph.D from State Govt. Institution 131 4.732 .8052
Ph.D from Central Govt. Institution 36 4.796 .7773
Ph.D from Foreign Institution 2 2.889 2.9856
Ph.D from Premier Inst. In India 14 4.373 .5953
Total 463 4.585 .8794
Table 4.2.26 : ANOVA of Work Engagement across educational
background categories
Variations Sum of Squares Df Mean Square F *p-value
Between Groups 13.188 5 2.638
3.503 .004 Within Groups 344.069 457 .753
Total 357.257 462
*5% level of significance
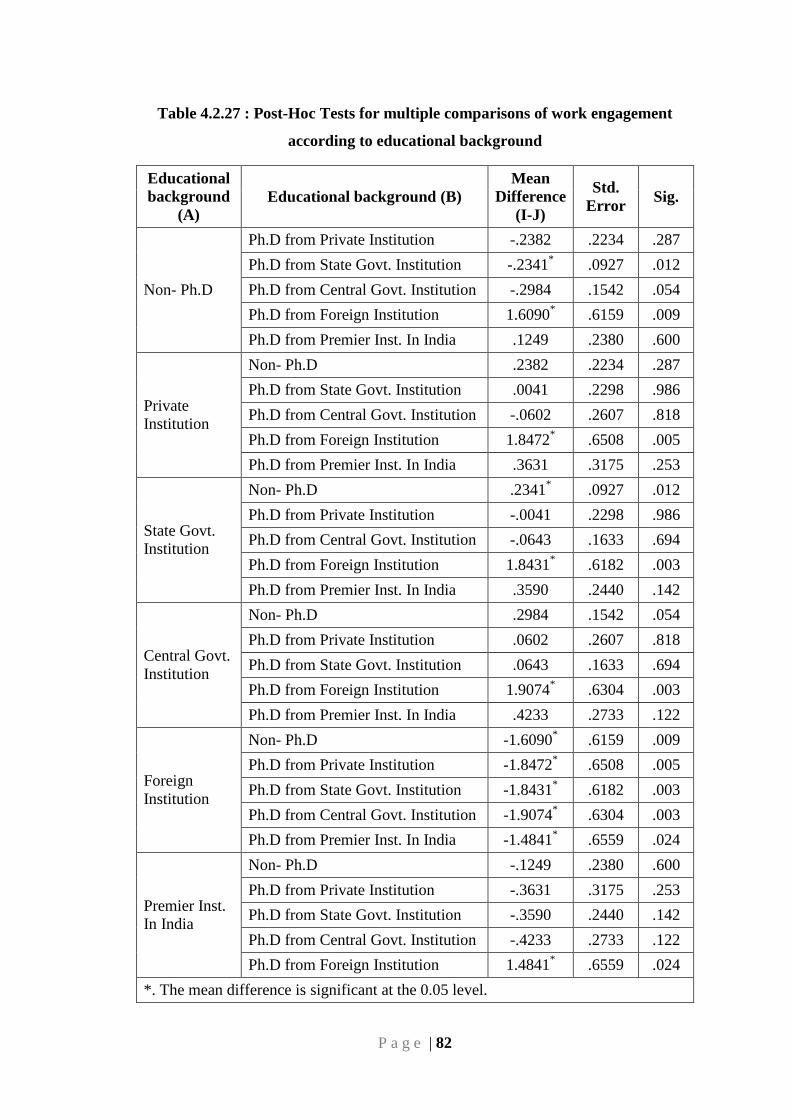
P a g e | 82
Table 4.2.27 : Post-Hoc Tests for multiple comparisons of work engagement
according to educational background
Educational
background
(A)
Educational background (B)
Mean
Difference
(I-J)
Std.
Error Sig.
Non- Ph.D
Ph.D from Private Institution -.2382 .2234 .287
Ph.D from State Govt. Institution -.2341* .0927 .012
Ph.D from Central Govt. Institution -.2984 .1542 .054
Ph.D from Foreign Institution 1.6090* .6159 .009
Ph.D from Premier Inst. In India .1249 .2380 .600
Private
Institution
Non- Ph.D .2382 .2234 .287
Ph.D from State Govt. Institution .0041 .2298 .986
Ph.D from Central Govt. Institution -.0602 .2607 .818
Ph.D from Foreign Institution 1.8472* .6508 .005
Ph.D from Premier Inst. In India .3631 .3175 .253
State Govt.
Institution
Non- Ph.D .2341* .0927 .012
Ph.D from Private Institution -.0041 .2298 .986
Ph.D from Central Govt. Institution -.0643 .1633 .694
Ph.D from Foreign Institution 1.8431* .6182 .003
Ph.D from Premier Inst. In India .3590 .2440 .142
Central Govt.
Institution
Non- Ph.D .2984 .1542 .054
Ph.D from Private Institution .0602 .2607 .818
Ph.D from State Govt. Institution .0643 .1633 .694
Ph.D from Foreign Institution 1.9074* .6304 .003
Ph.D from Premier Inst. In India .4233 .2733 .122
Foreign
Institution
Non- Ph.D -1.6090* .6159 .009
Ph.D from Private Institution -1.8472* .6508 .005
Ph.D from State Govt. Institution -1.8431* .6182 .003
Ph.D from Central Govt. Institution -1.9074* .6304 .003
Ph.D from Premier Inst. In India -1.4841* .6559 .024
Premier Inst.
In India
Non- Ph.D -.1249 .2380 .600
Ph.D from Private Institution -.3631 .3175 .253
Ph.D from State Govt. Institution -.3590 .2440 .142
Ph.D from Central Govt. Institution -.4233 .2733 .122
Ph.D from Foreign Institution 1.4841* .6559 .024
*. The mean difference is significant at the 0.05 level.
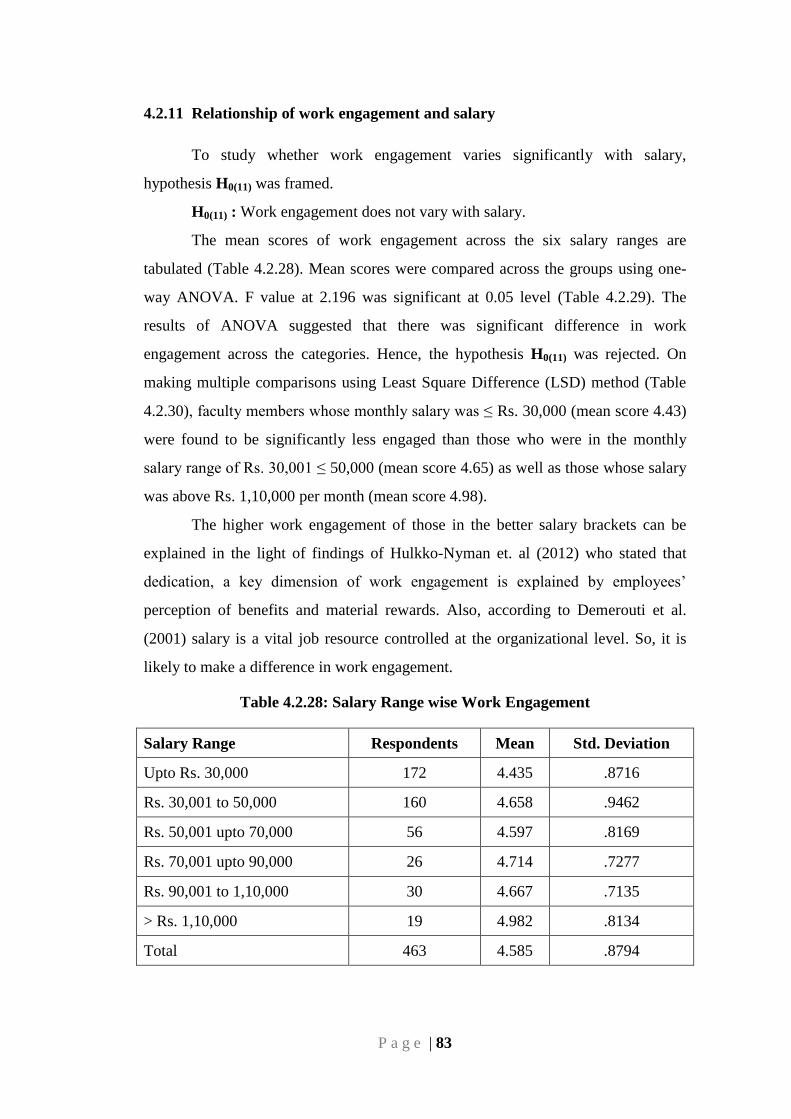
P a g e | 83
4.2.11 Relationship of work engagement and salary
To study whether work engagement varies significantly with salary,
hypothesis H0(11) was framed.
H0(11) : Work engagement does not vary with salary.
The mean scores of work engagement across the six salary ranges are
tabulated (Table 4.2.28). Mean scores were compared across the groups using one-
way ANOVA. F value at 2.196 was significant at 0.05 level (Table 4.2.29). The
results of ANOVA suggested that there was significant difference in work
engagement across the categories. Hence, the hypothesis H0(11) was rejected. On
making multiple comparisons using Least Square Difference (LSD) method (Table
4.2.30), faculty members whose monthly salary was ≤ Rs. 30,000 (mean score 4.43)
were found to be significantly less engaged than those who were in the monthly
salary range of Rs. 30,001 ≤ 50,000 (mean score 4.65) as well as those whose salary
was above Rs. 1,10,000 per month (mean score 4.98).
The higher work engagement of those in the better salary brackets can be
explained in the light of findings of Hulkko-Nyman et. al (2012) who stated that
dedication, a key dimension of work engagement is explained by employees‘
perception of benefits and material rewards. Also, according to Demerouti et al.
(2001) salary is a vital job resource controlled at the organizational level. So, it is
likely to make a difference in work engagement.
Table 4.2.28: Salary Range wise Work Engagement
Salary Range Respondents Mean Std. Deviation
Upto Rs. 30,000 172 4.435 .8716
Rs. 30,001 to 50,000 160 4.658 .9462
Rs. 50,001 upto 70,000 56 4.597 .8169
Rs. 70,001 upto 90,000 26 4.714 .7277
Rs. 90,001 to 1,10,000 30 4.667 .7135
> Rs. 1,10,000 19 4.982 .8134
Total 463 4.585 .8794
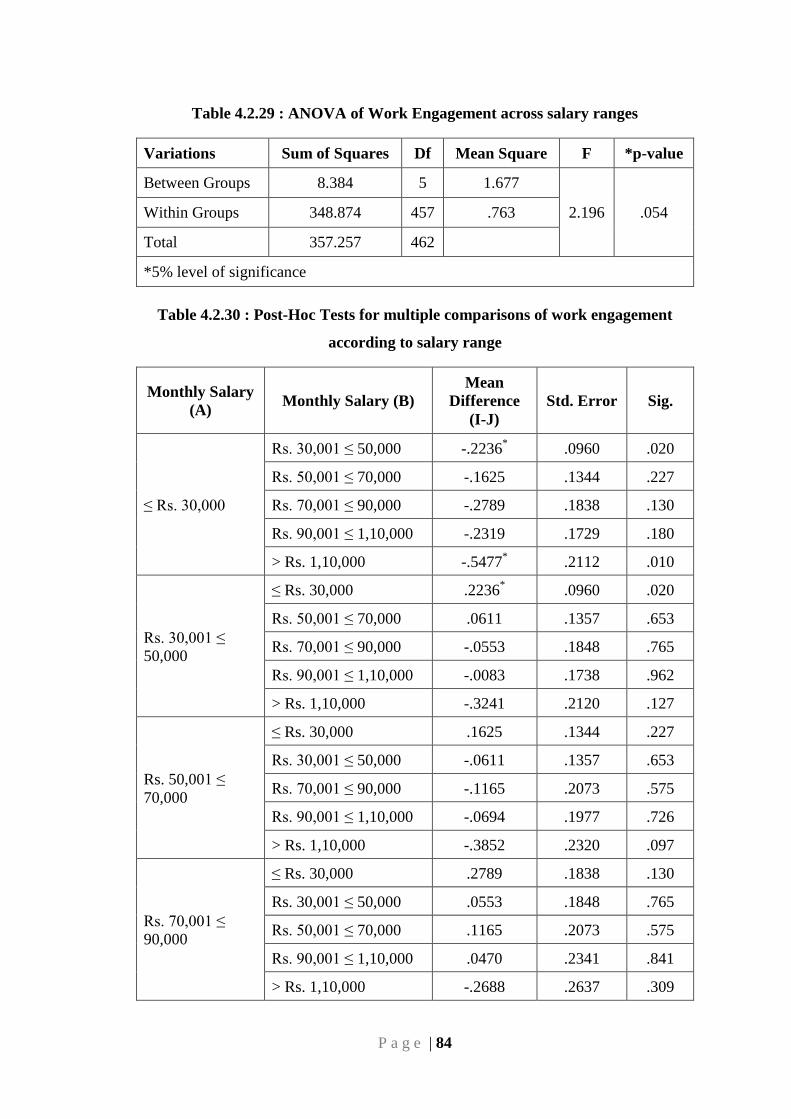
P a g e | 84
Table 4.2.29 : ANOVA of Work Engagement across salary ranges
Variations Sum of Squares Df Mean Square F *p-value
Between Groups 8.384 5 1.677
2.196 .054 Within Groups 348.874 457 .763
Total 357.257 462
*5% level of significance
Table 4.2.30 : Post-Hoc Tests for multiple comparisons of work engagement
according to salary range
Monthly Salary
(A) Monthly Salary (B)
Mean
Difference
(I-J)
Std. Error Sig.
≤ Rs. 30,000
Rs. 30,001 ≤ 50,000 -.2236* .0960 .020
Rs. 50,001 ≤ 70,000 -.1625 .1344 .227
Rs. 70,001 ≤ 90,000 -.2789 .1838 .130
Rs. 90,001 ≤ 1,10,000 -.2319 .1729 .180
> Rs. 1,10,000 -.5477* .2112 .010
Rs. 30,001 ≤
50,000
≤ Rs. 30,000 .2236* .0960 .020
Rs. 50,001 ≤ 70,000 .0611 .1357 .653
Rs. 70,001 ≤ 90,000 -.0553 .1848 .765
Rs. 90,001 ≤ 1,10,000 -.0083 .1738 .962
> Rs. 1,10,000 -.3241 .2120 .127
Rs. 50,001 ≤
70,000
≤ Rs. 30,000 .1625 .1344 .227
Rs. 30,001 ≤ 50,000 -.0611 .1357 .653
Rs. 70,001 ≤ 90,000 -.1165 .2073 .575
Rs. 90,001 ≤ 1,10,000 -.0694 .1977 .726
> Rs. 1,10,000 -.3852 .2320 .097
Rs. 70,001 ≤
90,000
≤ Rs. 30,000 .2789 .1838 .130
Rs. 30,001 ≤ 50,000 .0553 .1848 .765
Rs. 50,001 ≤ 70,000 .1165 .2073 .575
Rs. 90,001 ≤ 1,10,000 .0470 .2341 .841
> Rs. 1,10,000 -.2688 .2637 .309
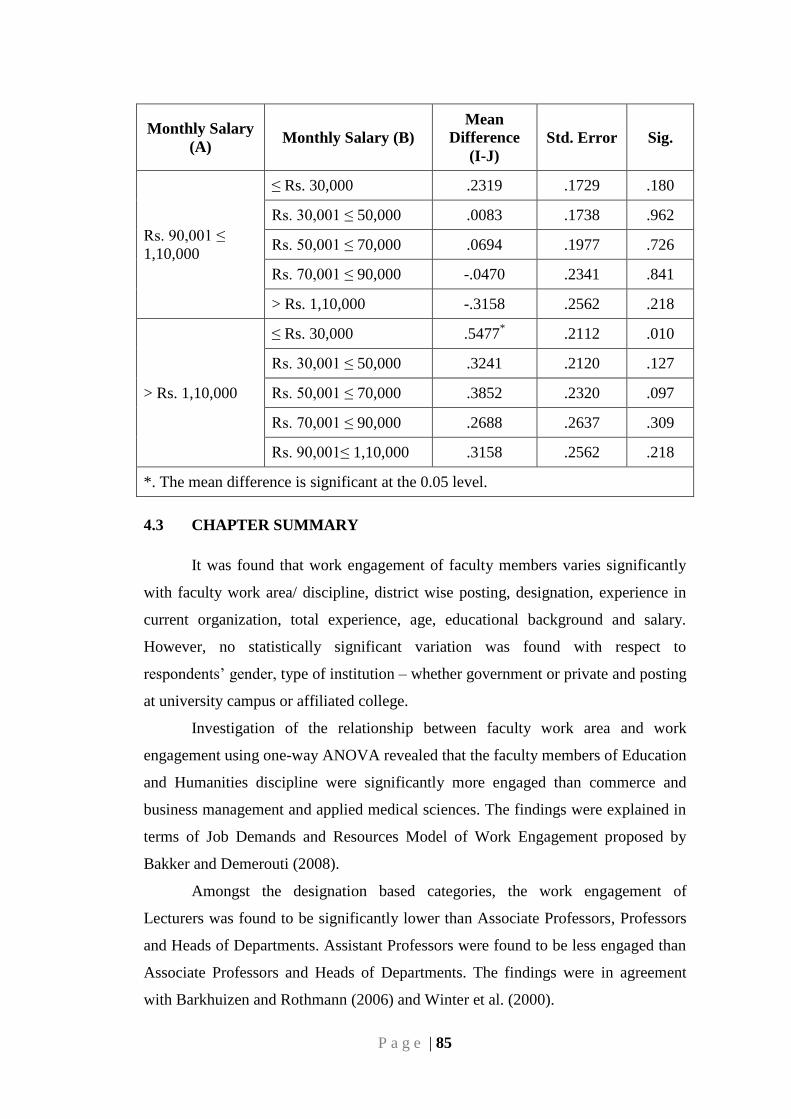
P a g e | 85
Monthly Salary
(A) Monthly Salary (B)
Mean
Difference
(I-J)
Std. Error Sig.
Rs. 90,001 ≤
1,10,000
≤ Rs. 30,000 .2319 .1729 .180
Rs. 30,001 ≤ 50,000 .0083 .1738 .962
Rs. 50,001 ≤ 70,000 .0694 .1977 .726
Rs. 70,001 ≤ 90,000 -.0470 .2341 .841
> Rs. 1,10,000 -.3158 .2562 .218
> Rs. 1,10,000
≤ Rs. 30,000 .5477* .2112 .010
Rs. 30,001 ≤ 50,000 .3241 .2120 .127
Rs. 50,001 ≤ 70,000 .3852 .2320 .097
Rs. 70,001 ≤ 90,000 .2688 .2637 .309
Rs. 90,001≤ 1,10,000 .3158 .2562 .218
*. The mean difference is significant at the 0.05 level.
4.3 CHAPTER SUMMARY
It was found that work engagement of faculty members varies significantly
with faculty work area/ discipline, district wise posting, designation, experience in
current organization, total experience, age, educational background and salary.
However, no statistically significant variation was found with respect to
respondents‘ gender, type of institution – whether government or private and posting
at university campus or affiliated college.
Investigation of the relationship between faculty work area and work
engagement using one-way ANOVA revealed that the faculty members of Education
and Humanities discipline were significantly more engaged than commerce and
business management and applied medical sciences. The findings were explained in
terms of Job Demands and Resources Model of Work Engagement proposed by
Bakker and Demerouti (2008).
Amongst the designation based categories, the work engagement of
Lecturers was found to be significantly lower than Associate Professors, Professors
and Heads of Departments. Assistant Professors were found to be less engaged than
Associate Professors and Heads of Departments. The findings were in agreement
with Barkhuizen and Rothmann (2006) and Winter et al. (2000).
P a g e | 86
Upon comparing work engagement according to total experience it was
found that faculty members having total experience of more than 20 years were
better work engagaged than those with total experience of upto 5 years or 5 to 10
years. The finding was in agreement with a Bakker et al.‘s (2004) study of human
service professionals including teachers, establishing that certain job resources
which come with increase in total experience are associated with higher work
engagement.
On similar lines when work engagement was compared across current
organization experience of faculty members, it was found that faculty members
having current organization experience of greater than 20 years were more work
engaged than those with ≤ 5 years, > 05 ≤ 10 as well as > 10 ≤ 15 years. The higher
work engagement of the longer tenured faculty members can be attributed to the
development of a strong sense of identification and ownership over a period of time,
which is likely to enhance the work engagement. Thus, it has very important
implications for HR policy makers to design measures that encourage faculty
retention in the current organizations.
When work engagement was compared across the various age groups faculty
members aged 55 years and above were more engaged in their work as compared to
those in the age groups of ≤ 25 years, >25 ≤ 35 years and >25 ≤ 35 years. This was
in consonance with the results obtained according to designation and total
experience which are also supposed to increase with age.
According to the educational background, faculty members who had a Ph.D
qualification were more engaged than the others with post graduate degrees. The
results were explained in the light of Kahn‘s (1990) model of personal engagement
considering Ph.D to be a key intellectual resource which is likely to enhance the
psychological availability of a faculty member to immerse fully in one‘s role.
According to salary bracket, the work engagement of faculty members
drawing a salary of less than Rs. 30,000 per month was found to be lower than the
next higher salary bracket 30,001 to 50,000 per month as well as the highest salary
bracket Rs. 1,10,000 and above. The rationale was found in the argument of Hulko-
Nyman et al (2012) stating that dedication which is a key dimension of work
engagement is explained by employees perception of benefits and material rewards.
P a g e | 87
Also according to Demerouti et al. (2001) salary is an important job resource driving
work engagement.
Finally, work engagement of faculty members was not found to vary
according to gender, type of institution whether private, government or government
aided and posting at University campus or affiliated college.
**********
CHAPTER – 5
RESULTS AND
DISCUSSION : FACTORS
AFFECTING WORK
ENGAGEMENT
P a g e | 88
CHAPTER – 5
RESULTS AND DISCUSSION:
FACTORS AFFECTING WORK ENGAGEMENT
——————————————————————————————————
This chapter deals with an assessment of factors affecting work engagement
of faculty members employed in Higher Education Institutions (HEIs) and measures
to enhance work engagement. People employ different degrees of their physical,
mental and affective domains, given the appropriate conditions. Visionaries realize
that engaged employees can make a significant difference to organizational
effectiveness and efficiency. They experiment with different methods to encourage
engagement. An endeavor to identify the factors affecting work engagement of
faculty members can help higher education institutions to better approach the issue
to the mutual benefit of the individual and organization.
5.1 FACTORS AFFECTING WORK ENGAGEMENT
The present study used a self developed scale consisting of 92 statements
(Part I of Appendix II). The scale explored the respondents‘ perception regarding
self, current job and current organization. The scale included statements pertaining
to the degree of intrinsic rewards experienced, social support, supervisory support,
role clarity, transparency in performance appraisal, opportunities for learning and
development, climate of openness, participation, satisfaction with salary, employee
benefits, job security, task variety and overall satisfaction with the organization.
Another vital aspect explored was the respondents‘ perception about self in terms of
self efficacy, organization based self esteem, optimism and professional orientation.
The respondents were asked to express their level of agreement or disagreement for
each statement on a seven -point Likert scale ranging from 0 to 6 representing
‗strongly disagree‘, ‗disagree‘, ‗disagree somewhat‘, ‗neither agree nor disagree,
‗agree somewhat‘, ‗agree‘ and ‗strongly agree‘. A seven point scale was used in
order to capture the precise perception of the respondents, by giving a larger range
of responses. Descriptive statistics are presented in Table 5.1. For interpretation of
scores, the mean response was recoded such that if the statement was positively
worded then mean response of 5 and above indicated high level of satisfaction; 4 to
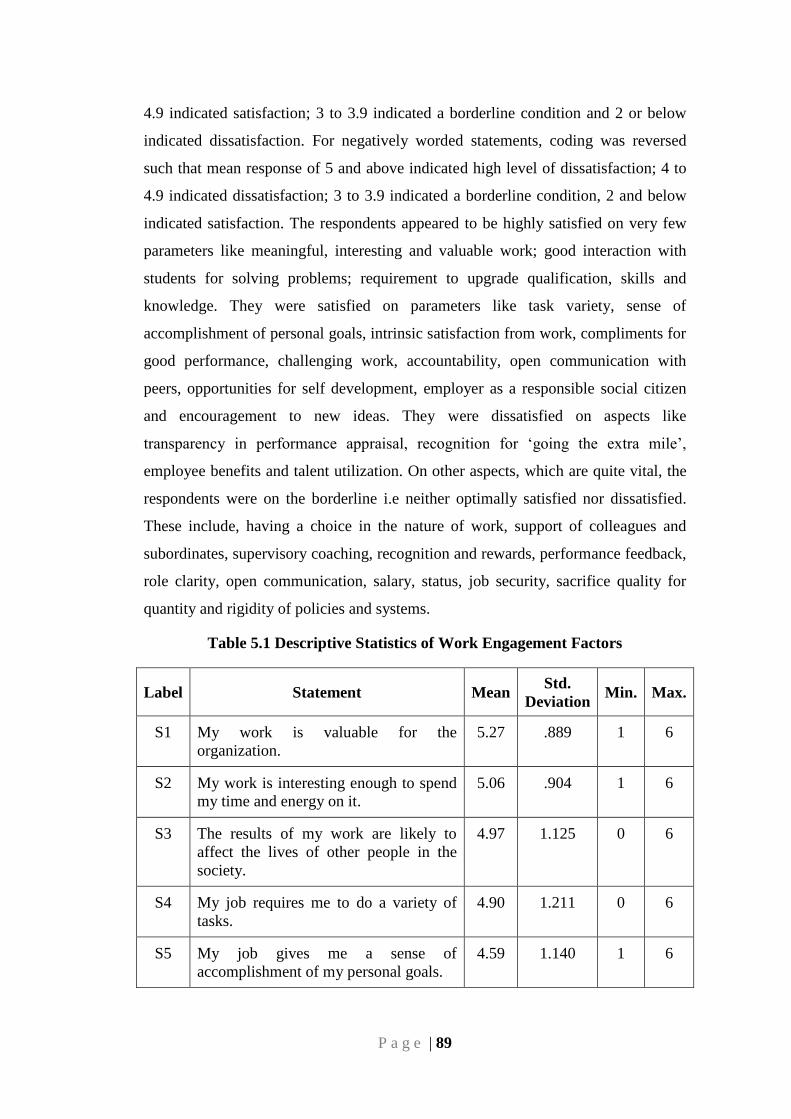
P a g e | 89
4.9 indicated satisfaction; 3 to 3.9 indicated a borderline condition and 2 or below
indicated dissatisfaction. For negatively worded statements, coding was reversed
such that mean response of 5 and above indicated high level of dissatisfaction; 4 to
4.9 indicated dissatisfaction; 3 to 3.9 indicated a borderline condition, 2 and below
indicated satisfaction. The respondents appeared to be highly satisfied on very few
parameters like meaningful, interesting and valuable work; good interaction with
students for solving problems; requirement to upgrade qualification, skills and
knowledge. They were satisfied on parameters like task variety, sense of
accomplishment of personal goals, intrinsic satisfaction from work, compliments for
good performance, challenging work, accountability, open communication with
peers, opportunities for self development, employer as a responsible social citizen
and encouragement to new ideas. They were dissatisfied on aspects like
transparency in performance appraisal, recognition for ‗going the extra mile‘,
employee benefits and talent utilization. On other aspects, which are quite vital, the
respondents were on the borderline i.e neither optimally satisfied nor dissatisfied.
These include, having a choice in the nature of work, support of colleagues and
subordinates, supervisory coaching, recognition and rewards, performance feedback,
role clarity, open communication, salary, status, job security, sacrifice quality for
quantity and rigidity of policies and systems.
Table 5.1 Descriptive Statistics of Work Engagement Factors
Label Statement Mean Std.
Deviation Min. Max.
S1 My work is valuable for the
organization.
5.27 .889 1 6
S2 My work is interesting enough to spend
my time and energy on it.
5.06 .904 1 6
S3 The results of my work are likely to
affect the lives of other people in the
society.
4.97 1.125 0 6
S4 My job requires me to do a variety of
tasks.
4.90 1.211 0 6
S5 My job gives me a sense of
accomplishment of my personal goals.
4.59 1.140 1 6
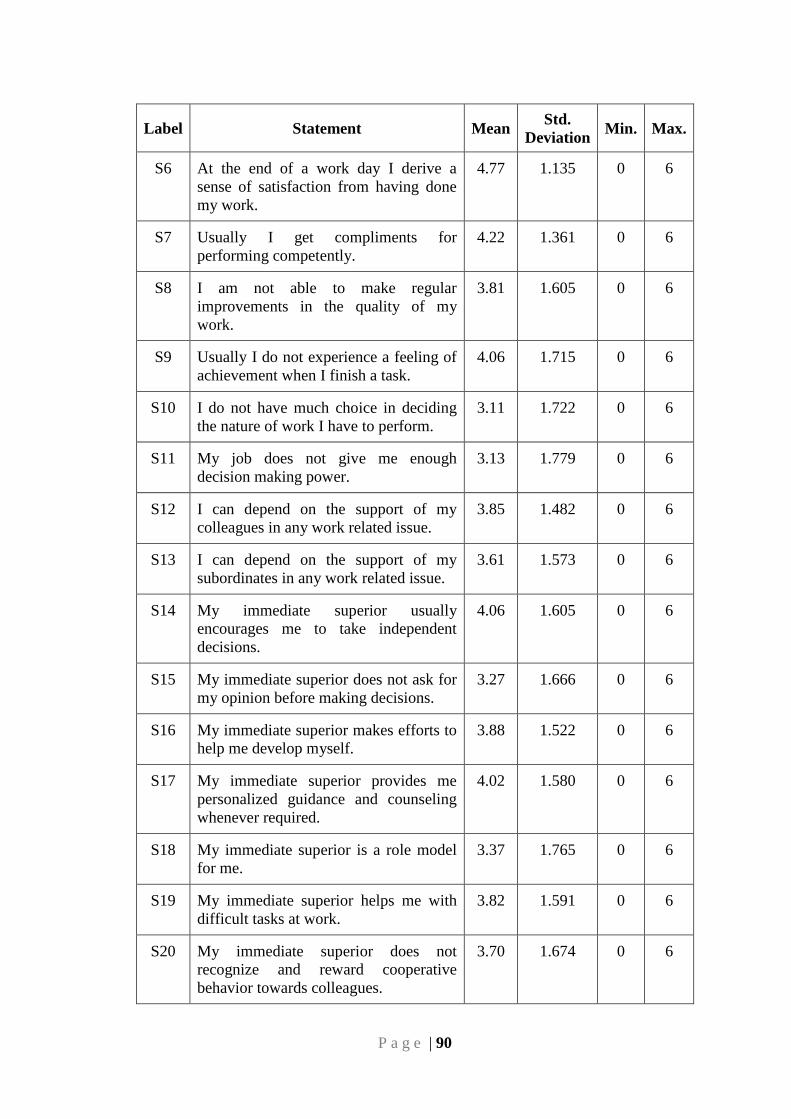
P a g e | 90
Label Statement Mean Std.
Deviation Min. Max.
S6 At the end of a work day I derive a
sense of satisfaction from having done
my work.
4.77 1.135 0 6
S7 Usually I get compliments for
performing competently.
4.22 1.361 0 6
S8 I am not able to make regular
improvements in the quality of my
work.
3.81 1.605 0 6
S9 Usually I do not experience a feeling of
achievement when I finish a task.
4.06 1.715 0 6
S10 I do not have much choice in deciding
the nature of work I have to perform.
3.11 1.722 0 6
S11 My job does not give me enough
decision making power.
3.13 1.779 0 6
S12 I can depend on the support of my
colleagues in any work related issue.
3.85 1.482 0 6
S13 I can depend on the support of my
subordinates in any work related issue.
3.61 1.573 0 6
S14 My immediate superior usually
encourages me to take independent
decisions.
4.06 1.605 0 6
S15 My immediate superior does not ask for
my opinion before making decisions.
3.27 1.666 0 6
S16 My immediate superior makes efforts to
help me develop myself.
3.88 1.522 0 6
S17 My immediate superior provides me
personalized guidance and counseling
whenever required.
4.02 1.580 0 6
S18 My immediate superior is a role model
for me.
3.37 1.765 0 6
S19 My immediate superior helps me with
difficult tasks at work.
3.82 1.591 0 6
S20 My immediate superior does not
recognize and reward cooperative
behavior towards colleagues.
3.70 1.674 0 6
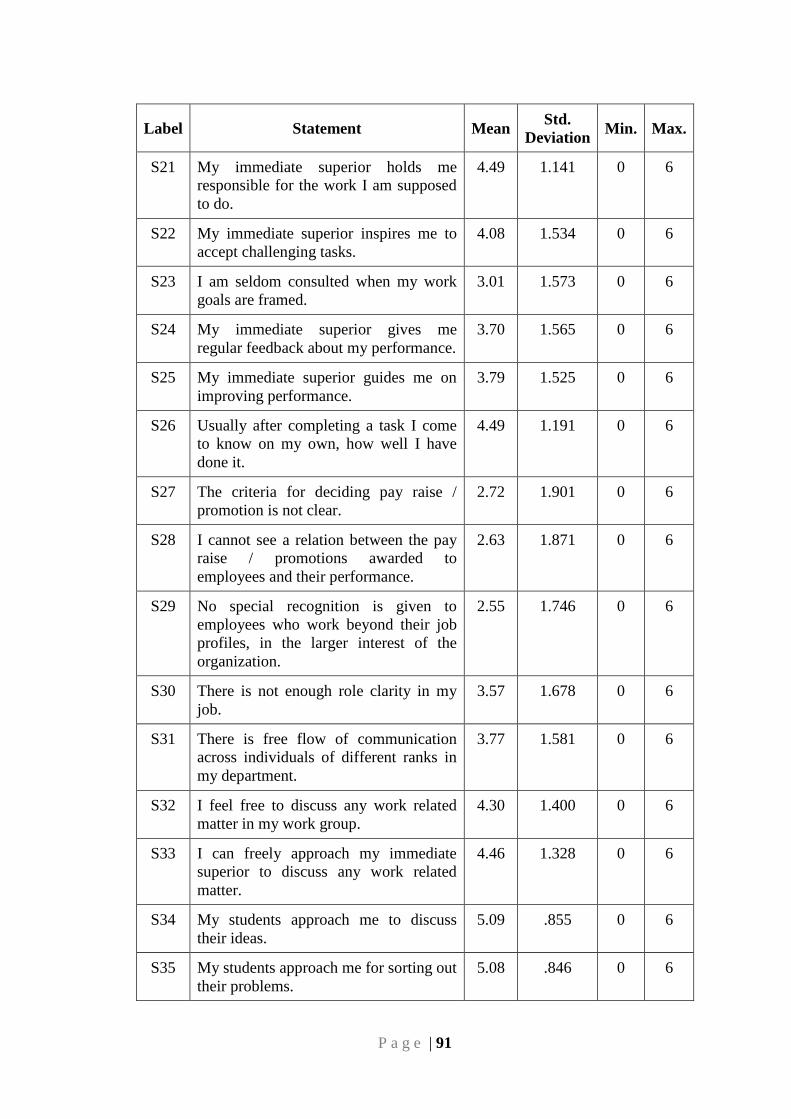
P a g e | 91
Label Statement Mean Std.
Deviation Min. Max.
S21 My immediate superior holds me
responsible for the work I am supposed
to do.
4.49 1.141 0 6
S22 My immediate superior inspires me to
accept challenging tasks.
4.08 1.534 0 6
S23 I am seldom consulted when my work
goals are framed.
3.01 1.573 0 6
S24 My immediate superior gives me
regular feedback about my performance.
3.70 1.565 0 6
S25 My immediate superior guides me on
improving performance.
3.79 1.525 0 6
S26 Usually after completing a task I come
to know on my own, how well I have
done it.
4.49 1.191 0 6
S27 The criteria for deciding pay raise /
promotion is not clear.
2.72 1.901 0 6
S28 I cannot see a relation between the pay
raise / promotions awarded to
employees and their performance.
2.63 1.871 0 6
S29 No special recognition is given to
employees who work beyond their job
profiles, in the larger interest of the
organization.
2.55 1.746 0 6
S30 There is not enough role clarity in my
job.
3.57 1.678 0 6
S31 There is free flow of communication
across individuals of different ranks in
my department.
3.77 1.581 0 6
S32 I feel free to discuss any work related
matter in my work group.
4.30 1.400 0 6
S33 I can freely approach my immediate
superior to discuss any work related
matter.
4.46 1.328 0 6
S34 My students approach me to discuss
their ideas.
5.09 .855 0 6
S35 My students approach me for sorting out
their problems.
5.08 .846 0 6
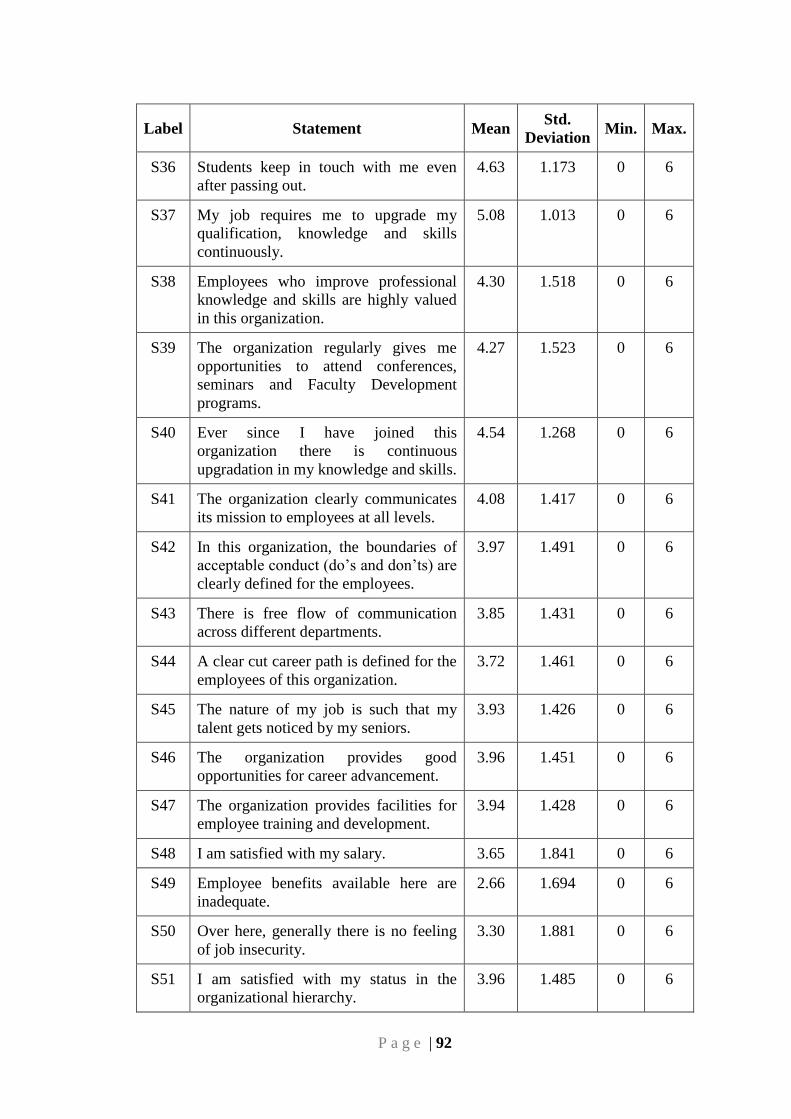
P a g e | 92
Label Statement Mean Std.
Deviation Min. Max.
S36 Students keep in touch with me even
after passing out.
4.63 1.173 0 6
S37 My job requires me to upgrade my
qualification, knowledge and skills
continuously.
5.08 1.013 0 6
S38 Employees who improve professional
knowledge and skills are highly valued
in this organization.
4.30 1.518 0 6
S39 The organization regularly gives me
opportunities to attend conferences,
seminars and Faculty Development
programs.
4.27 1.523 0 6
S40 Ever since I have joined this
organization there is continuous
upgradation in my knowledge and skills.
4.54 1.268 0 6
S41 The organization clearly communicates
its mission to employees at all levels.
4.08 1.417 0 6
S42 In this organization, the boundaries of
acceptable conduct (do‘s and don‘ts) are
clearly defined for the employees.
3.97 1.491 0 6
S43 There is free flow of communication
across different departments.
3.85 1.431 0 6
S44 A clear cut career path is defined for the
employees of this organization.
3.72 1.461 0 6
S45 The nature of my job is such that my
talent gets noticed by my seniors.
3.93 1.426 0 6
S46 The organization provides good
opportunities for career advancement.
3.96 1.451 0 6
S47 The organization provides facilities for
employee training and development.
3.94 1.428 0 6
S48 I am satisfied with my salary. 3.65 1.841 0 6
S49 Employee benefits available here are
inadequate.
2.66 1.694 0 6
S50 Over here, generally there is no feeling
of job insecurity.
3.30 1.881 0 6
S51 I am satisfied with my status in the
organizational hierarchy.
3.96 1.485 0 6
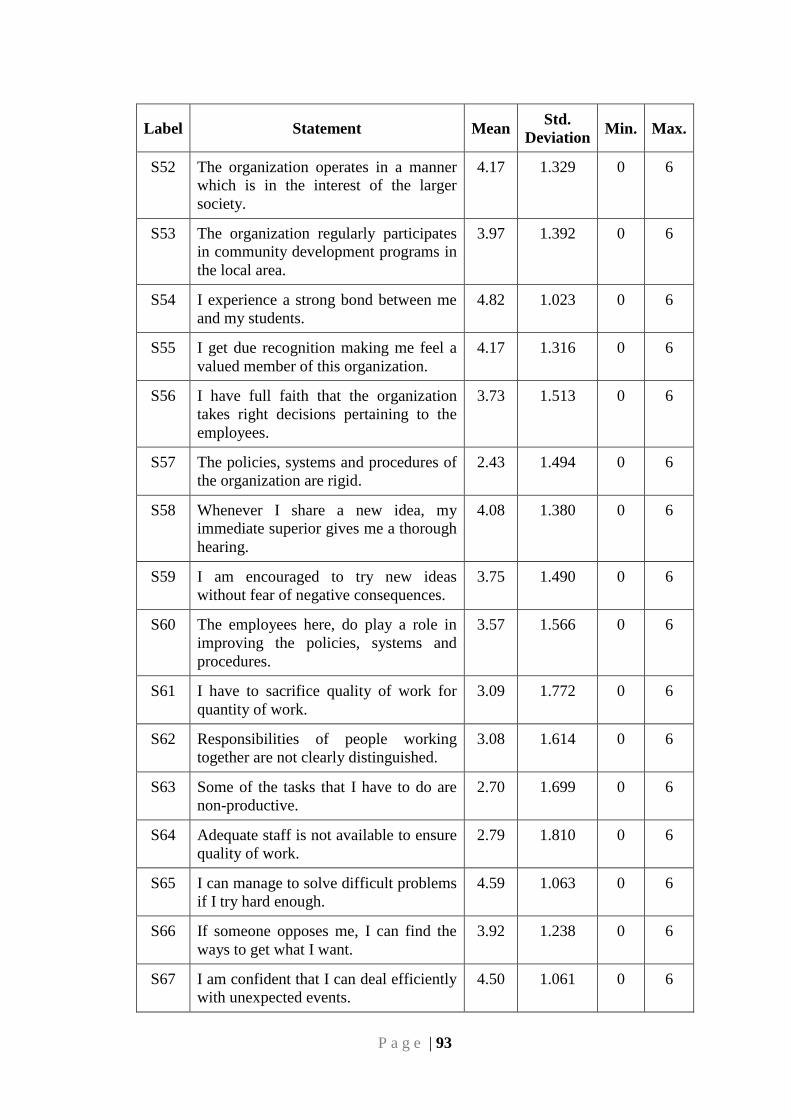
P a g e | 93
Label Statement Mean Std.
Deviation Min. Max.
S52 The organization operates in a manner
which is in the interest of the larger
society.
4.17 1.329 0 6
S53 The organization regularly participates
in community development programs in
the local area.
3.97 1.392 0 6
S54 I experience a strong bond between me
and my students.
4.82 1.023 0 6
S55 I get due recognition making me feel a
valued member of this organization.
4.17 1.316 0 6
S56 I have full faith that the organization
takes right decisions pertaining to the
employees.
3.73 1.513 0 6
S57 The policies, systems and procedures of
the organization are rigid.
2.43 1.494 0 6
S58 Whenever I share a new idea, my
immediate superior gives me a thorough
hearing.
4.08 1.380 0 6
S59 I am encouraged to try new ideas
without fear of negative consequences.
3.75 1.490 0 6
S60 The employees here, do play a role in
improving the policies, systems and
procedures.
3.57 1.566 0 6
S61 I have to sacrifice quality of work for
quantity of work.
3.09 1.772 0 6
S62 Responsibilities of people working
together are not clearly distinguished.
3.08 1.614 0 6
S63 Some of the tasks that I have to do are
non-productive.
2.70 1.699 0 6
S64 Adequate staff is not available to ensure
quality of work.
2.79 1.810 0 6
S65 I can manage to solve difficult problems
if I try hard enough.
4.59 1.063 0 6
S66 If someone opposes me, I can find the
ways to get what I want.
3.92 1.238 0 6
S67 I am confident that I can deal efficiently
with unexpected events.
4.50 1.061 0 6
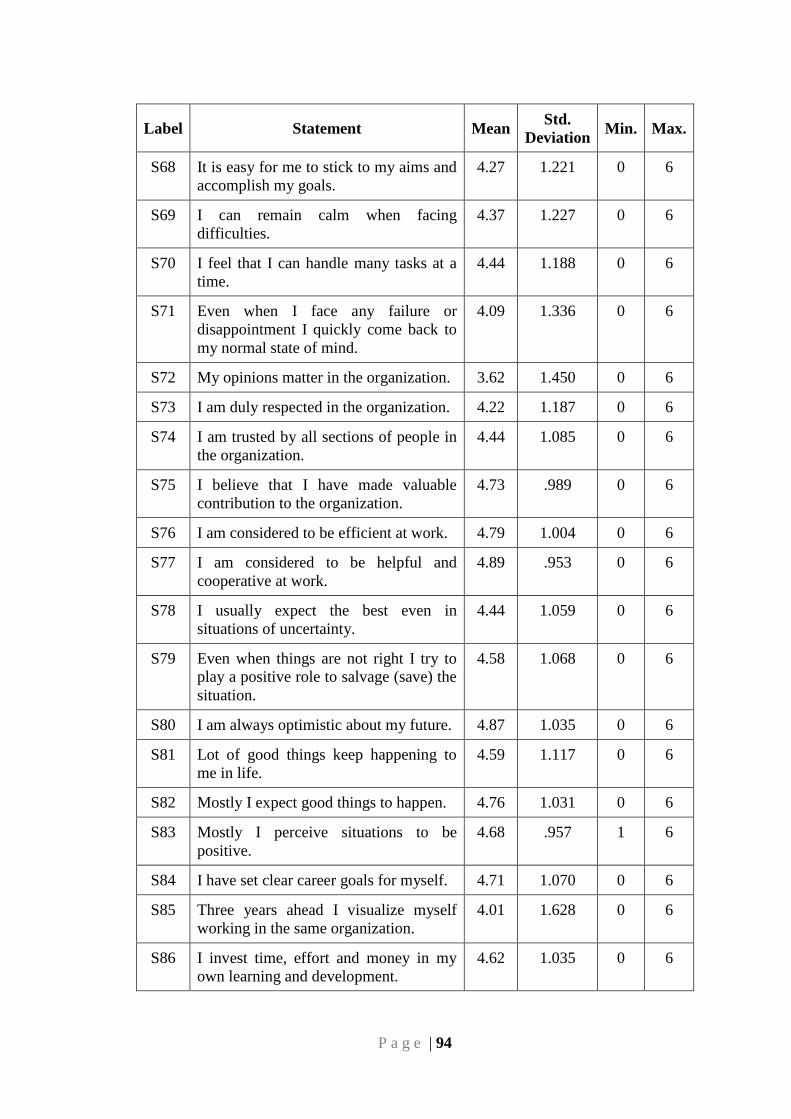
P a g e | 94
Label Statement Mean Std.
Deviation Min. Max.
S68 It is easy for me to stick to my aims and
accomplish my goals.
4.27 1.221 0 6
S69 I can remain calm when facing
difficulties.
4.37 1.227 0 6
S70 I feel that I can handle many tasks at a
time.
4.44 1.188 0 6
S71 Even when I face any failure or
disappointment I quickly come back to
my normal state of mind.
4.09 1.336 0 6
S72 My opinions matter in the organization. 3.62 1.450 0 6
S73 I am duly respected in the organization. 4.22 1.187 0 6
S74 I am trusted by all sections of people in
the organization.
4.44 1.085 0 6
S75 I believe that I have made valuable
contribution to the organization.
4.73 .989 0 6
S76 I am considered to be efficient at work. 4.79 1.004 0 6
S77 I am considered to be helpful and
cooperative at work.
4.89 .953 0 6
S78 I usually expect the best even in
situations of uncertainty.
4.44 1.059 0 6
S79 Even when things are not right I try to
play a positive role to salvage (save) the
situation.
4.58 1.068 0 6
S80 I am always optimistic about my future. 4.87 1.035 0 6
S81 Lot of good things keep happening to
me in life.
4.59 1.117 0 6
S82 Mostly I expect good things to happen. 4.76 1.031 0 6
S83 Mostly I perceive situations to be
positive.
4.68 .957 1 6
S84 I have set clear career goals for myself. 4.71 1.070 0 6
S85 Three years ahead I visualize myself
working in the same organization.
4.01 1.628 0 6
S86 I invest time, effort and money in my
own learning and development.
4.62 1.035 0 6
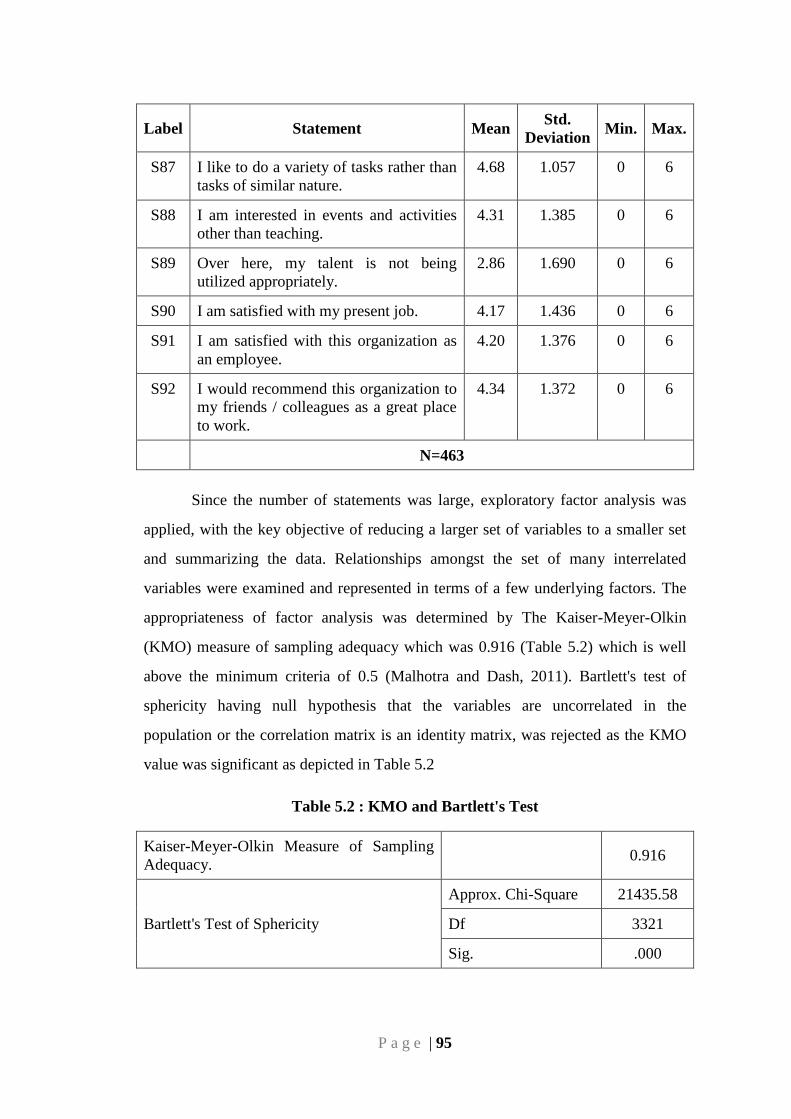
P a g e | 95
Label Statement Mean Std.
Deviation Min. Max.
S87 I like to do a variety of tasks rather than
tasks of similar nature.
4.68 1.057 0 6
S88 I am interested in events and activities
other than teaching.
4.31 1.385 0 6
S89 Over here, my talent is not being
utilized appropriately.
2.86 1.690 0 6
S90 I am satisfied with my present job. 4.17 1.436 0 6
S91 I am satisfied with this organization as
an employee.
4.20 1.376 0 6
S92 I would recommend this organization to
my friends / colleagues as a great place
to work.
4.34 1.372 0 6
N=463
Since the number of statements was large, exploratory factor analysis was
applied, with the key objective of reducing a larger set of variables to a smaller set
and summarizing the data. Relationships amongst the set of many interrelated
variables were examined and represented in terms of a few underlying factors. The
appropriateness of factor analysis was determined by The Kaiser-Meyer-Olkin
(KMO) measure of sampling adequacy which was 0.916 (Table 5.2) which is well
above the minimum criteria of 0.5 (Malhotra and Dash, 2011). Bartlett's test of
sphericity having null hypothesis that the variables are uncorrelated in the
population or the correlation matrix is an identity matrix, was rejected as the KMO
value was significant as depicted in Table 5.2
Table 5.2 : KMO and Bartlett's Test
Kaiser-Meyer-Olkin Measure of Sampling
Adequacy.
0.916
Bartlett's Test of Sphericity
Approx. Chi-Square 21435.58
Df 3321
Sig. .000
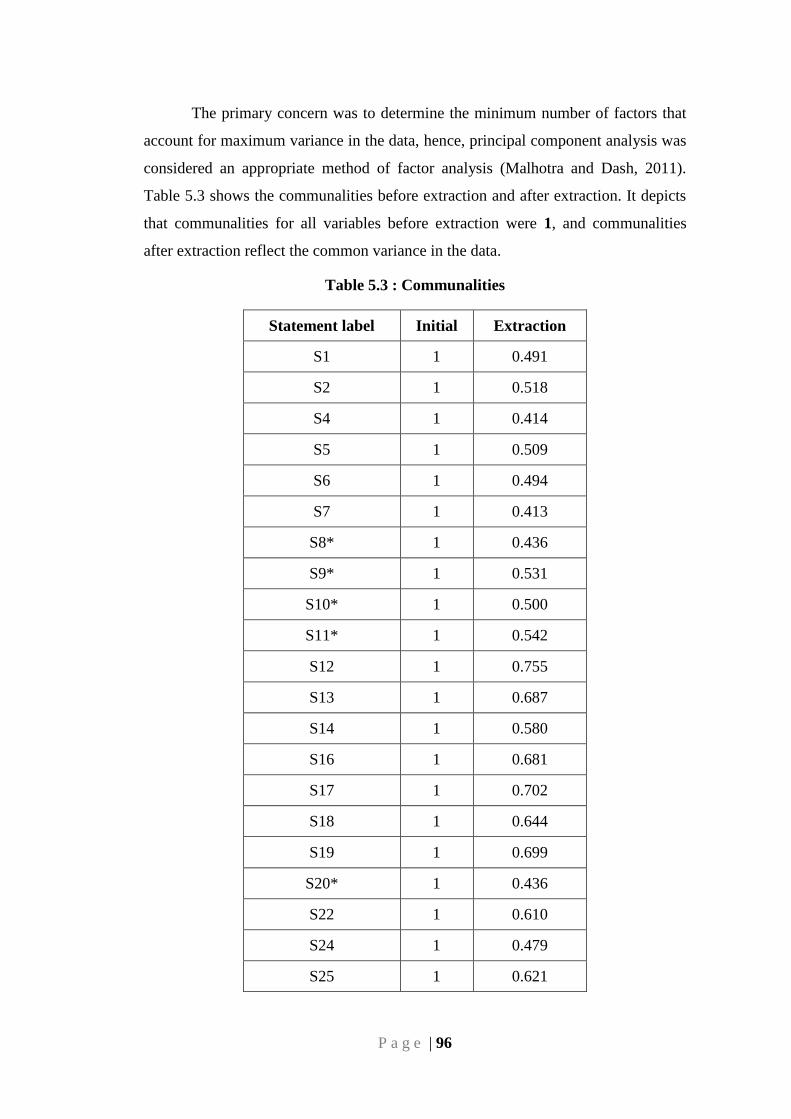
P a g e | 96
The primary concern was to determine the minimum number of factors that
account for maximum variance in the data, hence, principal component analysis was
considered an appropriate method of factor analysis (Malhotra and Dash, 2011).
Table 5.3 shows the communalities before extraction and after extraction. It depicts
that communalities for all variables before extraction were 1, and communalities
after extraction reflect the common variance in the data.
Table 5.3 : Communalities
Statement label Initial Extraction
S1 1 0.491
S2 1 0.518
S4 1 0.414
S5 1 0.509
S6 1 0.494
S7 1 0.413
S8* 1 0.436
S9* 1 0.531
S10* 1 0.500
S11* 1 0.542
S12 1 0.755
S13 1 0.687
S14 1 0.580
S16 1 0.681
S17 1 0.702
S18 1 0.644
S19 1 0.699
S20* 1 0.436
S22 1 0.610
S24 1 0.479
S25 1 0.621
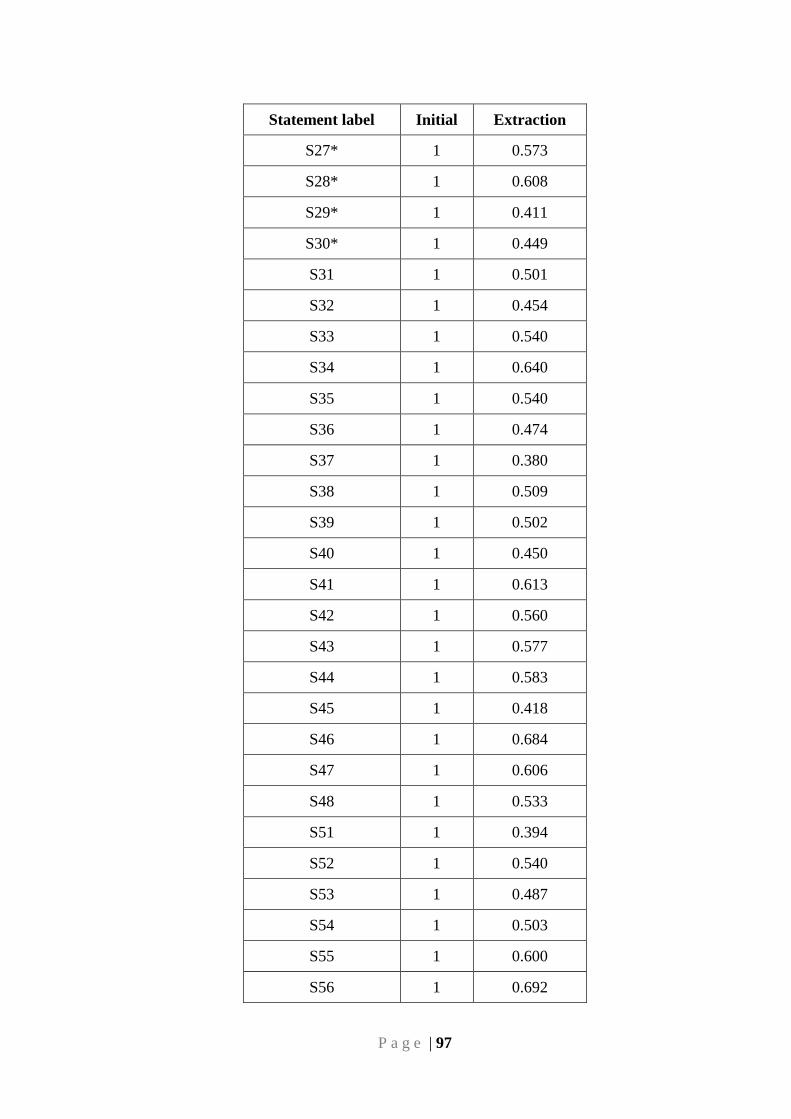
P a g e | 97
Statement label Initial Extraction
S27* 1 0.573
S28* 1 0.608
S29* 1 0.411
S30* 1 0.449
S31 1 0.501
S32 1 0.454
S33 1 0.540
S34 1 0.640
S35 1 0.540
S36 1 0.474
S37 1 0.380
S38 1 0.509
S39 1 0.502
S40 1 0.450
S41 1 0.613
S42 1 0.560
S43 1 0.577
S44 1 0.583
S45 1 0.418
S46 1 0.684
S47 1 0.606
S48 1 0.533
S51 1 0.394
S52 1 0.540
S53 1 0.487
S54 1 0.503
S55 1 0.600
S56 1 0.692
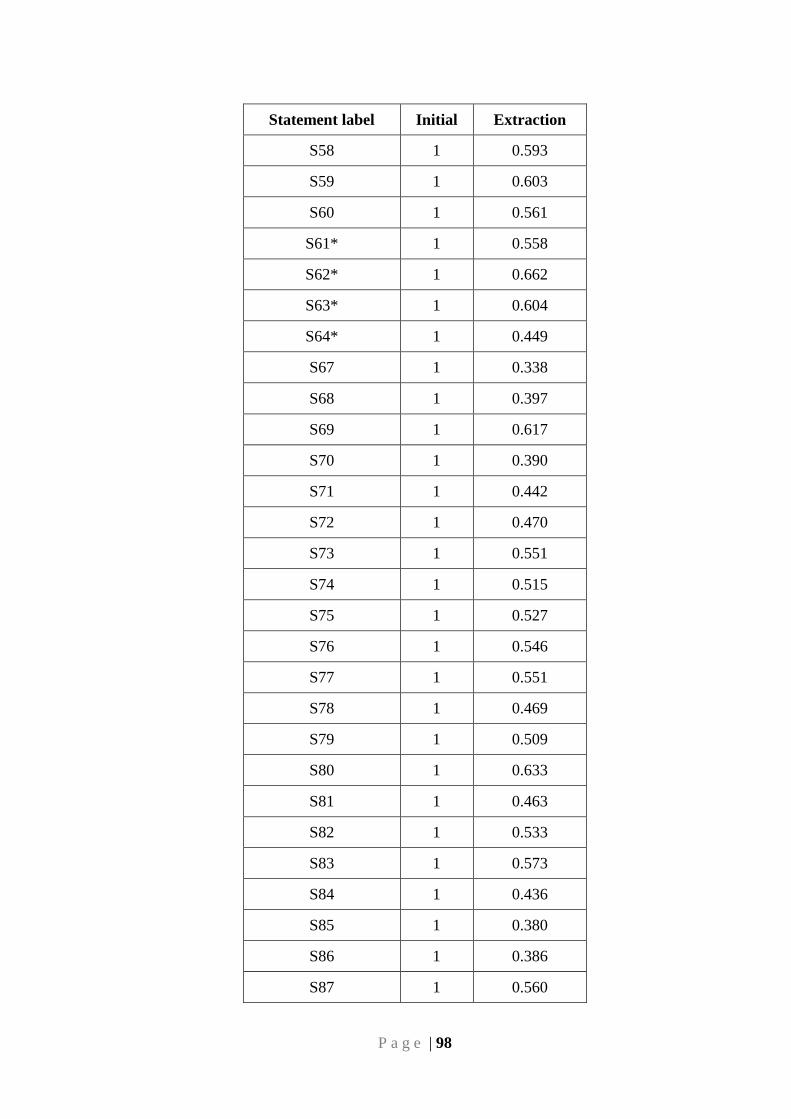
P a g e | 98
Statement label Initial Extraction
S58 1 0.593
S59 1 0.603
S60 1 0.561
S61* 1 0.558
S62* 1 0.662
S63* 1 0.604
S64* 1 0.449
S67 1 0.338
S68 1 0.397
S69 1 0.617
S70 1 0.390
S71 1 0.442
S72 1 0.470
S73 1 0.551
S74 1 0.515
S75 1 0.527
S76 1 0.546
S77 1 0.551
S78 1 0.469
S79 1 0.509
S80 1 0.633
S81 1 0.463
S82 1 0.533
S83 1 0.573
S84 1 0.436
S85 1 0.380
S86 1 0.386
S87 1 0.560
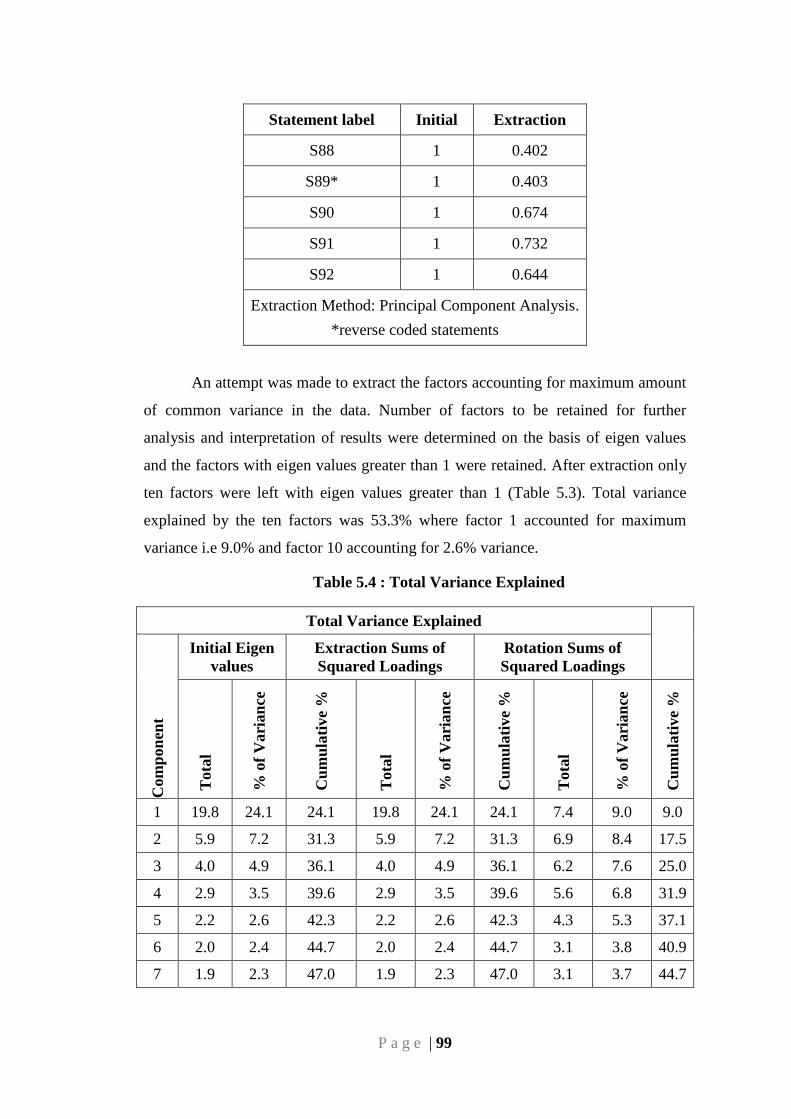
P a g e | 99
Statement label Initial Extraction
S88 1 0.402
S89* 1 0.403
S90 1 0.674
S91 1 0.732
S92 1 0.644
Extraction Method: Principal Component Analysis.
*reverse coded statements
An attempt was made to extract the factors accounting for maximum amount
of common variance in the data. Number of factors to be retained for further
analysis and interpretation of results were determined on the basis of eigen values
and the factors with eigen values greater than 1 were retained. After extraction only
ten factors were left with eigen values greater than 1 (Table 5.3). Total variance
explained by the ten factors was 53.3% where factor 1 accounted for maximum
variance i.e 9.0% and factor 10 accounting for 2.6% variance.
Table 5.4 : Total Variance Explained
Total Variance Explained
Com
pon
ent
Initial Eigen
values
Extraction Sums of
Squared Loadings
Rotation Sums of
Squared Loadings
Tota
l
% o
f V
ari
an
ce
Cu
mu
lati
ve
%
Tota
l
% o
f V
ari
an
ce
Cu
mu
lati
ve
%
Tota
l
% o
f V
ari
an
ce
Cu
mu
lati
ve
%
1 19.8 24.1 24.1 19.8 24.1 24.1 7.4 9.0 9.0
2 5.9 7.2 31.3 5.9 7.2 31.3 6.9 8.4 17.5
3 4.0 4.9 36.1 4.0 4.9 36.1 6.2 7.6 25.0
4 2.9 3.5 39.6 2.9 3.5 39.6 5.6 6.8 31.9
5 2.2 2.6 42.3 2.2 2.6 42.3 4.3 5.3 37.1
6 2.0 2.4 44.7 2.0 2.4 44.7 3.1 3.8 40.9
7 1.9 2.3 47.0 1.9 2.3 47.0 3.1 3.7 44.7
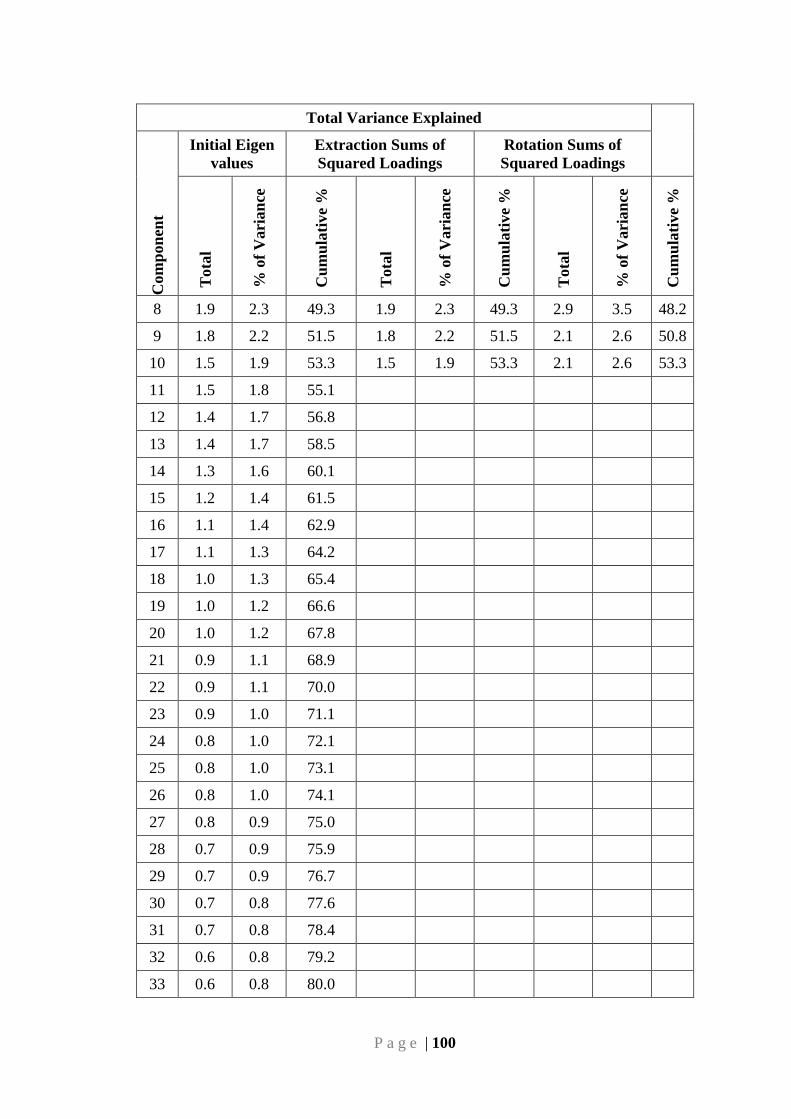
P a g e | 100
Total Variance Explained
Com
pon
ent
Initial Eigen
values
Extraction Sums of
Squared Loadings
Rotation Sums of
Squared Loadings
Tota
l
% o
f V
ari
an
ce
Cu
mu
lati
ve
%
Tota
l
% o
f V
ari
an
ce
Cu
mu
lati
ve
%
Tota
l
% o
f V
ari
an
ce
Cu
mu
lati
ve
%
8 1.9 2.3 49.3 1.9 2.3 49.3 2.9 3.5 48.2
9 1.8 2.2 51.5 1.8 2.2 51.5 2.1 2.6 50.8
10 1.5 1.9 53.3 1.5 1.9 53.3 2.1 2.6 53.3
11 1.5 1.8 55.1
12 1.4 1.7 56.8
13 1.4 1.7 58.5
14 1.3 1.6 60.1
15 1.2 1.4 61.5
16 1.1 1.4 62.9
17 1.1 1.3 64.2
18 1.0 1.3 65.4
19 1.0 1.2 66.6
20 1.0 1.2 67.8
21 0.9 1.1 68.9
22 0.9 1.1 70.0
23 0.9 1.0 71.1
24 0.8 1.0 72.1
25 0.8 1.0 73.1
26 0.8 1.0 74.1
27 0.8 0.9 75.0
28 0.7 0.9 75.9
29 0.7 0.9 76.7
30 0.7 0.8 77.6
31 0.7 0.8 78.4
32 0.6 0.8 79.2
33 0.6 0.8 80.0
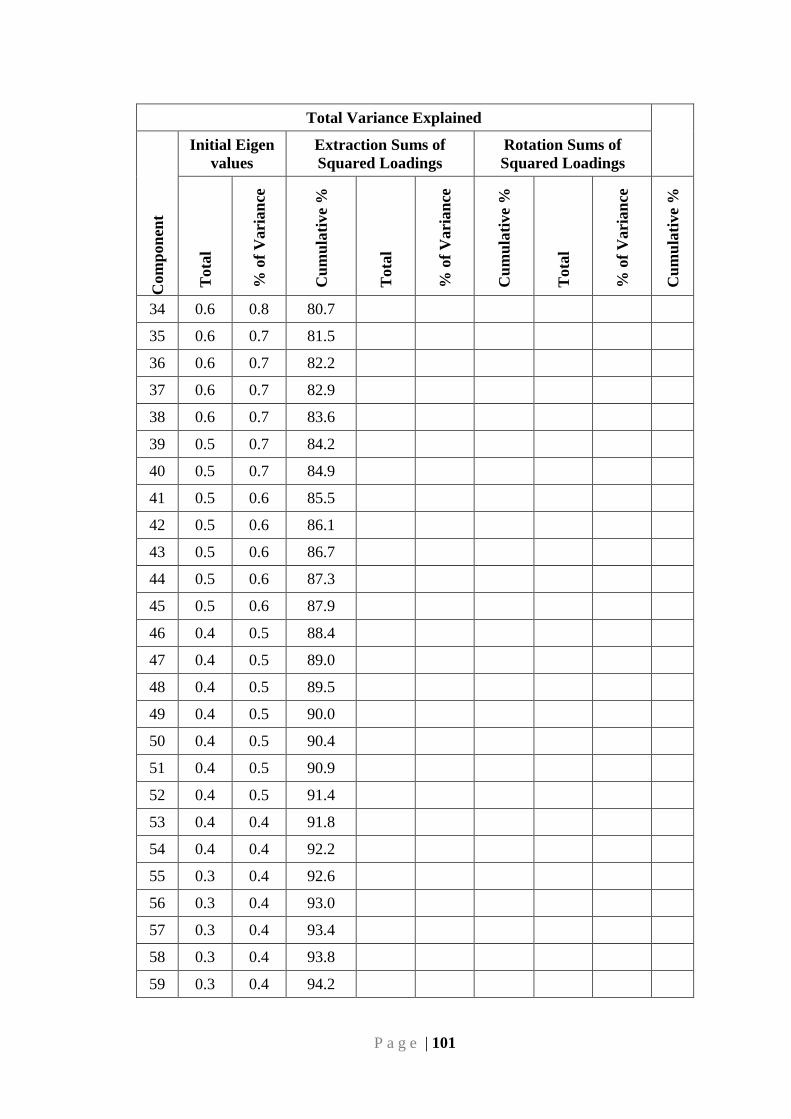
P a g e | 101
Total Variance Explained
Com
pon
ent
Initial Eigen
values
Extraction Sums of
Squared Loadings
Rotation Sums of
Squared Loadings
Tota
l
% o
f V
ari
an
ce
Cu
mu
lati
ve
%
Tota
l
% o
f V
ari
an
ce
Cu
mu
lati
ve
%
Tota
l
% o
f V
ari
an
ce
Cu
mu
lati
ve
%
34 0.6 0.8 80.7
35 0.6 0.7 81.5
36 0.6 0.7 82.2
37 0.6 0.7 82.9
38 0.6 0.7 83.6
39 0.5 0.7 84.2
40 0.5 0.7 84.9
41 0.5 0.6 85.5
42 0.5 0.6 86.1
43 0.5 0.6 86.7
44 0.5 0.6 87.3
45 0.5 0.6 87.9
46 0.4 0.5 88.4
47 0.4 0.5 89.0
48 0.4 0.5 89.5
49 0.4 0.5 90.0
50 0.4 0.5 90.4
51 0.4 0.5 90.9
52 0.4 0.5 91.4
53 0.4 0.4 91.8
54 0.4 0.4 92.2
55 0.3 0.4 92.6
56 0.3 0.4 93.0
57 0.3 0.4 93.4
58 0.3 0.4 93.8
59 0.3 0.4 94.2

P a g e | 102
Total Variance Explained
Com
pon
ent
Initial Eigen
values
Extraction Sums of
Squared Loadings
Rotation Sums of
Squared Loadings
Tota
l
% o
f V
ari
an
ce
Cu
mu
lati
ve
%
Tota
l
% o
f V
ari
an
ce
Cu
mu
lati
ve
%
Tota
l
% o
f V
ari
an
ce
Cu
mu
lati
ve
%
60 0.3 0.4 94.5
61 0.3 0.3 94.9
62 0.3 0.3 95.2
63 0.3 0.3 95.5
64 0.3 0.3 95.9
65 0.3 0.3 96.2
66 0.2 0.3 96.5
67 0.2 0.3 96.8
68 0.2 0.3 97.1
69 0.2 0.3 97.3
70 0.2 0.3 97.6
71 0.2 0.3 97.8
72 0.2 0.2 98.1
73 0.2 0.2 98.3
74 0.2 0.2 98.5
75 0.2 0.2 98.8
76 0.2 0.2 99.0
77 0.2 0.2 99.2
78 0.2 0.2 99.3
79 0.1 0.2 99.5
80 0.1 0.2 99.7
81 0.1 0.2 99.9
82 0.1 0.1 100.0
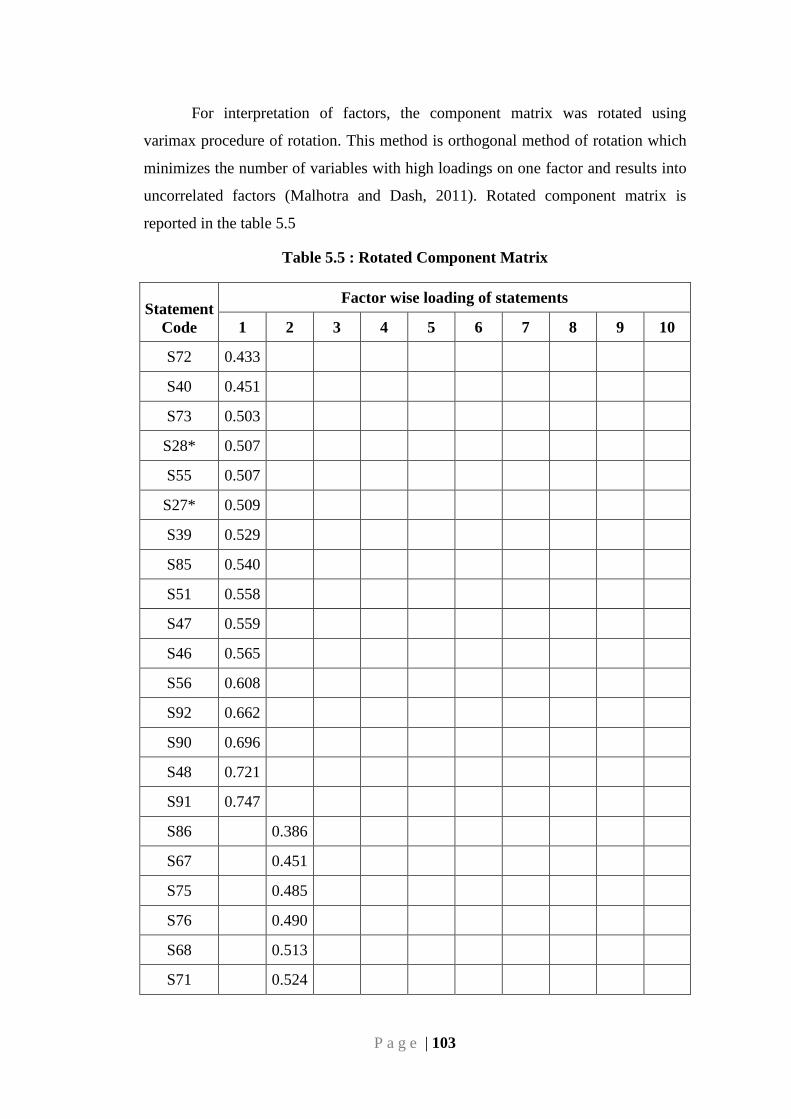
P a g e | 103
For interpretation of factors, the component matrix was rotated using
varimax procedure of rotation. This method is orthogonal method of rotation which
minimizes the number of variables with high loadings on one factor and results into
uncorrelated factors (Malhotra and Dash, 2011). Rotated component matrix is
reported in the table 5.5
Table 5.5 : Rotated Component Matrix
Statement
Code
Factor wise loading of statements
1 2 3 4 5 6 7 8 9 10
S72 0.433
S40 0.451
S73 0.503
S28* 0.507
S55 0.507
S27* 0.509
S39 0.529
S85 0.540
S51 0.558
S47 0.559
S46 0.565
S56 0.608
S92 0.662
S90 0.696
S48 0.721
S91 0.747
S86
0.386
S67
0.451
S75
0.485
S76
0.490
S68
0.513
S71
0.524
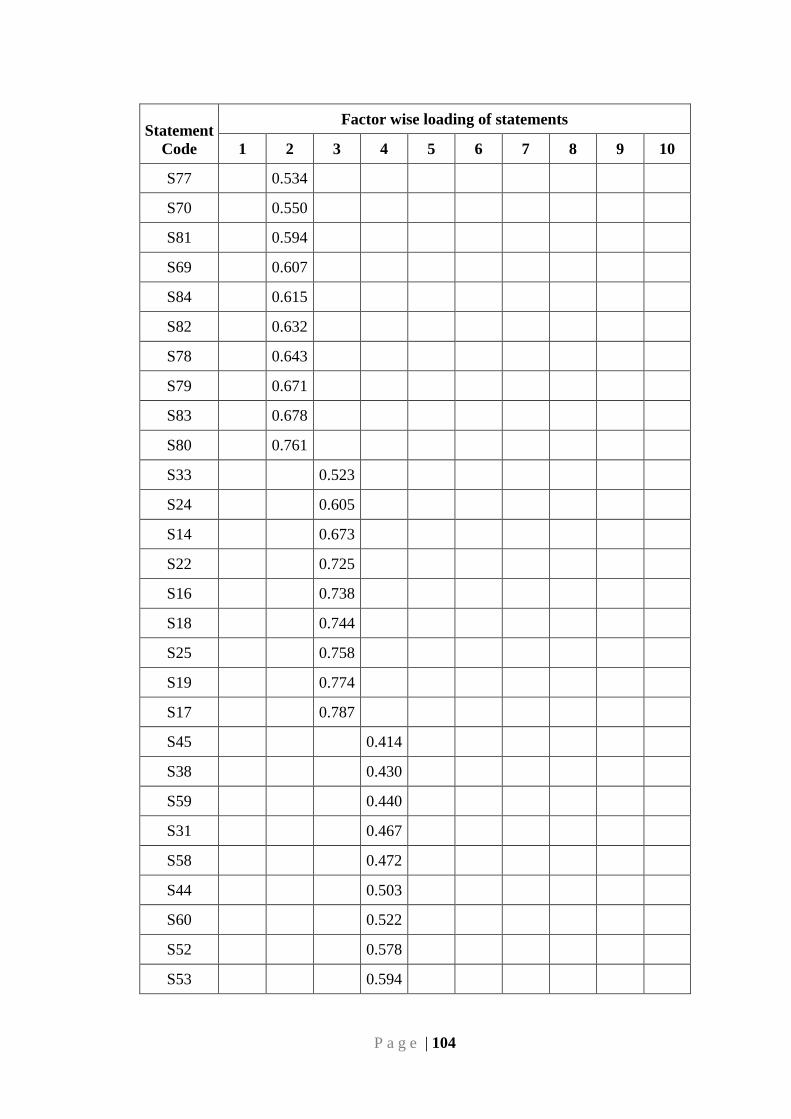
P a g e | 104
Statement
Code
Factor wise loading of statements
1 2 3 4 5 6 7 8 9 10
S77
0.534
S70
0.550
S81
0.594
S69
0.607
S84
0.615
S82
0.632
S78
0.643
S79
0.671
S83
0.678
S80
0.761
S33
0.523
S24
0.605
S14
0.673
S22
0.725
S16
0.738
S18
0.744
S25
0.758
S19
0.774
S17
0.787
S45
0.414
S38
0.430
S59
0.440
S31
0.467
S58
0.472
S44
0.503
S60
0.522
S52
0.578
S53
0.594
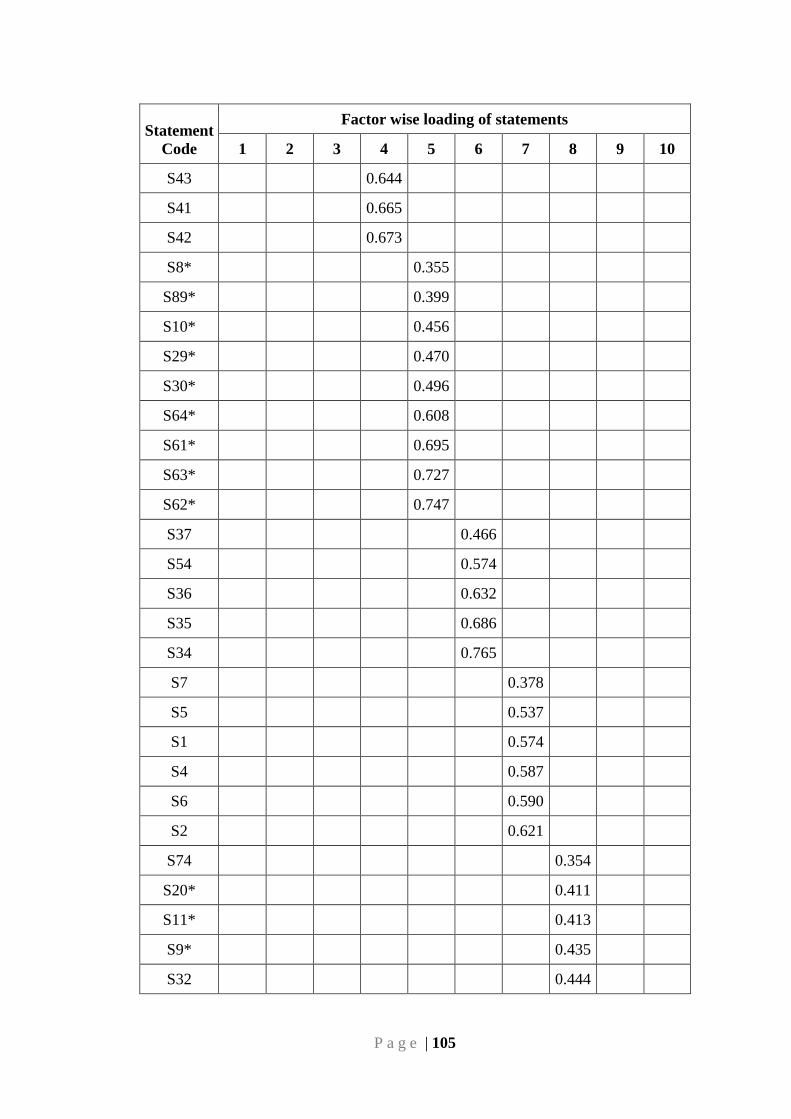
P a g e | 105
Statement
Code
Factor wise loading of statements
1 2 3 4 5 6 7 8 9 10
S43
0.644
S41
0.665
S42
0.673
S8*
0.355
S89*
0.399
S10*
0.456
S29*
0.470
S30*
0.496
S64*
0.608
S61*
0.695
S63*
0.727
S62*
0.747
S37
0.466
S54
0.574
S36
0.632
S35
0.686
S34
0.765
S7
0.378
S5
0.537
S1
0.574
S4
0.587
S6
0.590
S2
0.621
S74
0.354
S20*
0.411
S11*
0.413
S9*
0.435
S32
0.444
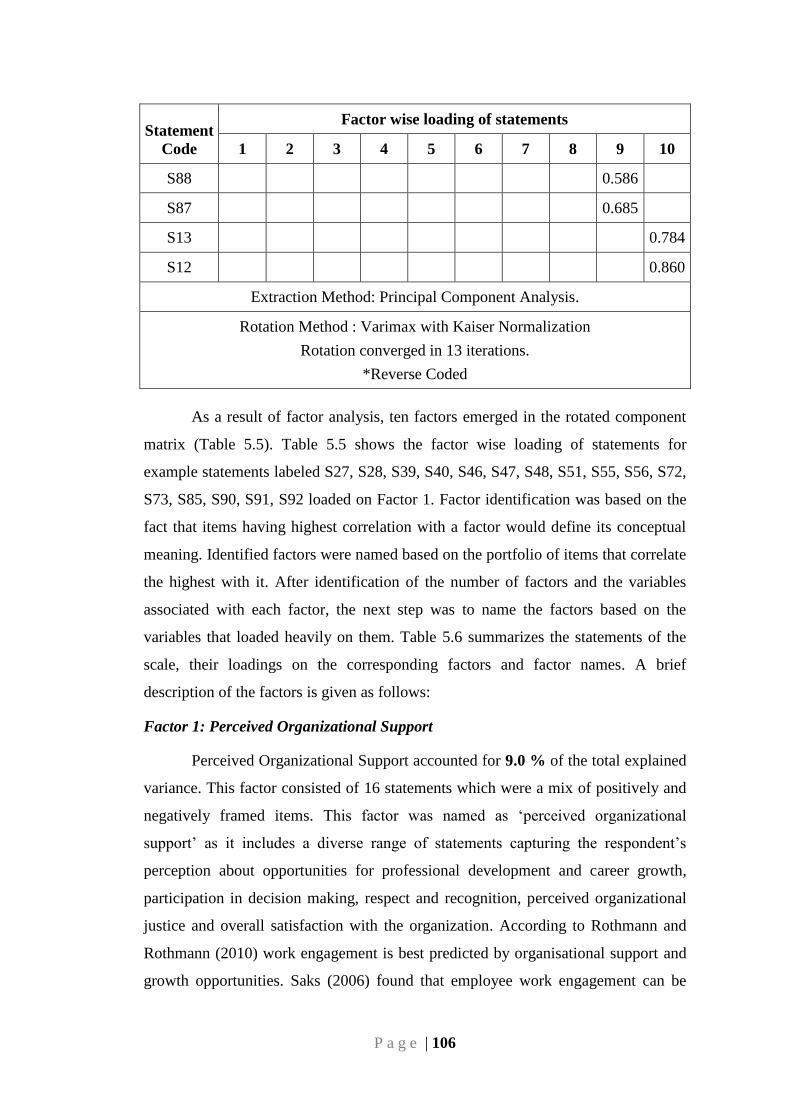
P a g e | 106
Statement
Code
Factor wise loading of statements
1 2 3 4 5 6 7 8 9 10
S88
0.586
S87
0.685
S13
0.784
S12
0.860
Extraction Method: Principal Component Analysis.
Rotation Method : Varimax with Kaiser Normalization
Rotation converged in 13 iterations.
*Reverse Coded
As a result of factor analysis, ten factors emerged in the rotated component
matrix (Table 5.5). Table 5.5 shows the factor wise loading of statements for
example statements labeled S27, S28, S39, S40, S46, S47, S48, S51, S55, S56, S72,
S73, S85, S90, S91, S92 loaded on Factor 1. Factor identification was based on the
fact that items having highest correlation with a factor would define its conceptual
meaning. Identified factors were named based on the portfolio of items that correlate
the highest with it. After identification of the number of factors and the variables
associated with each factor, the next step was to name the factors based on the
variables that loaded heavily on them. Table 5.6 summarizes the statements of the
scale, their loadings on the corresponding factors and factor names. A brief
description of the factors is given as follows:
Factor 1: Perceived Organizational Support
Perceived Organizational Support accounted for 9.0 % of the total explained
variance. This factor consisted of 16 statements which were a mix of positively and
negatively framed items. This factor was named as ‗perceived organizational
support‘ as it includes a diverse range of statements capturing the respondent‘s
perception about opportunities for professional development and career growth,
participation in decision making, respect and recognition, perceived organizational
justice and overall satisfaction with the organization. According to Rothmann and
Rothmann (2010) work engagement is best predicted by organisational support and
growth opportunities. Saks (2006) found that employee work engagement can be
P a g e | 107
distinguished into two forms namely job engagement and organizational
engagement. Both the forms of engagement are determined by a common factor,
namely, perceived organizational support. Employees who perceive higher
organizational support are more likely to reciprocate with greater levels of
engagement in their job and in the organization.
Factor 2: Personal and Professional Orientation
This factor explained 8.4% variance with 16 statements that in essence
sought to capture the respondents‘ orientation towards life in general and work
related situations in particular. The statements gauged a variety of personal and
professional aspects of the individual including optimism, resilience, organization
based self esteem, self efficacy, individual efforts for professional development,
perception of being cooperative and ability to handle multiple tasks. Hence this
factor was named as ‗Personal and Professional Orientation‘.
Factor 3: Supervisory Coaching
This factor explained 7.6% variance with 9 statements that sought to gauge
respondents‘ perception about the supervisor in terms of being approachable, giving
regular feedback and guidance on performance improvement, encouragement for
decision making, inspiration, developmental assistance, providing help with difficult
tasks at work and being a role model. Hence, the name ‗supervisory coaching‘ was
used for this factor as it encompasses all aspects of coaching by the supervisor.
Factor 4 : Climate of Participation and Recognition
This factor explained 6.8% variance with 12 statements that sought to gauge
respondents‘ perception about the existence of a climate of participation and
recognition within the organization and its image as a socially responsible employer.
The statements included in this factor assess clarity of organizational mission,
norms, free flow of communication within and across departments, clearly defined
career paths, openness for new ideas. This factor also included two statements about
participation of the organization in community development programs, gauging
whether inclusiveness spread across the organizational boundaries as good societal
citizenship. Hence, this factor was named as ‗climate of participation and
recognition‘.
P a g e | 108
Factor 5 : Organizational Orientation for Results
This factor explained 5.3% variance with 9 statements that sought to gauge
respondents‘ perception about the organizational focus on results. All the statements
tapped result orientation on two important parameters namely quality and quantity.
Factor 6 : Interaction with students
This factor explained 3.8% variance with 5 statements measuring the
respondents‘ interaction with students in terms of bond with students, whether
students approach for discussion of new ideas or problem solving, keep in touch
even after passing out and the need to upgrade qualification, skills and knowledge.
Hence, collectively these variables have been named as ‗interaction with students‘.
Factor 7 : Intrinsic Rewards
This factor explained 3.7% variance with 6 statements that mapped the
respondents‘ perception about availability of interesting work, variety of tasks,
satisfaction at the end of a work day, work being valuable for the organization,
appreciation and personal goal accomplishment. Hence these have been collectively
termed as intrinsic rewards. The findings are in line with those of Hulkko-Nyman et.
al (2012) stating that nonmonetary rewards, especially a perception of appreciated
work, were positively related to all aspects of work engagement.
Factor 8 : Empowerment
This factor explained 3.5% variance with 5 statements that gauged the
respondents‘ perception about the existence of a feeling of being empowered with
trust, decision making power, recognition, achievement and freedom to discuss work
related matters. Hence, collectively the statements have been labeled as
empowerment.
Factor 9 : Task variety
This factor explained 2.6% variance with 2 statements that measured the
respondents‘ interest towards doing a variety of tasks rather than tasks of a single
nature.
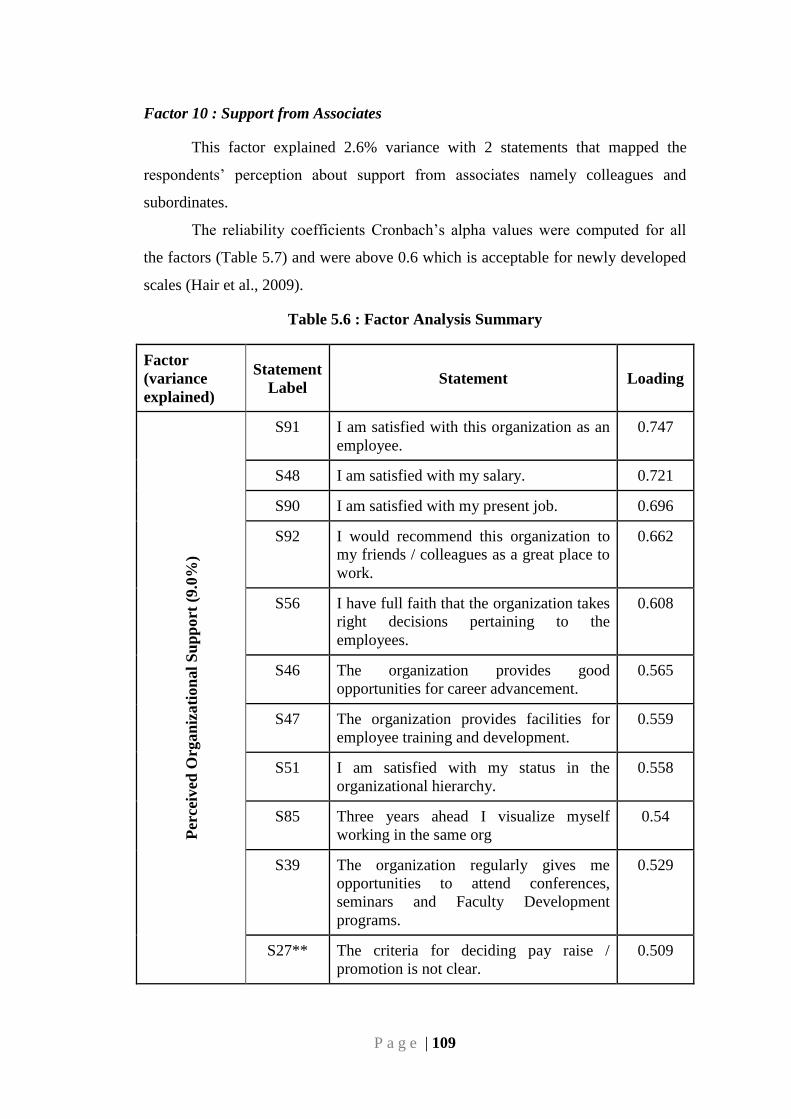
P a g e | 109
Factor 10 : Support from Associates
This factor explained 2.6% variance with 2 statements that mapped the
respondents‘ perception about support from associates namely colleagues and
subordinates.
The reliability coefficients Cronbach‘s alpha values were computed for all
the factors (Table 5.7) and were above 0.6 which is acceptable for newly developed
scales (Hair et al., 2009).
Table 5.6 : Factor Analysis Summary
Factor
(variance
explained)
Statement
Label Statement Loading
Per
cei
ved
Org
an
izati
on
al
Su
pp
ort
(9.0
%)
S91 I am satisfied with this organization as an
employee.
0.747
S48 I am satisfied with my salary. 0.721
S90 I am satisfied with my present job. 0.696
S92 I would recommend this organization to
my friends / colleagues as a great place to
work.
0.662
S56 I have full faith that the organization takes
right decisions pertaining to the
employees.
0.608
S46 The organization provides good
opportunities for career advancement.
0.565
S47 The organization provides facilities for
employee training and development.
0.559
S51 I am satisfied with my status in the
organizational hierarchy.
0.558
S85 Three years ahead I visualize myself
working in the same org
0.54
S39 The organization regularly gives me
opportunities to attend conferences,
seminars and Faculty Development
programs.
0.529
S27** The criteria for deciding pay raise /
promotion is not clear.
0.509
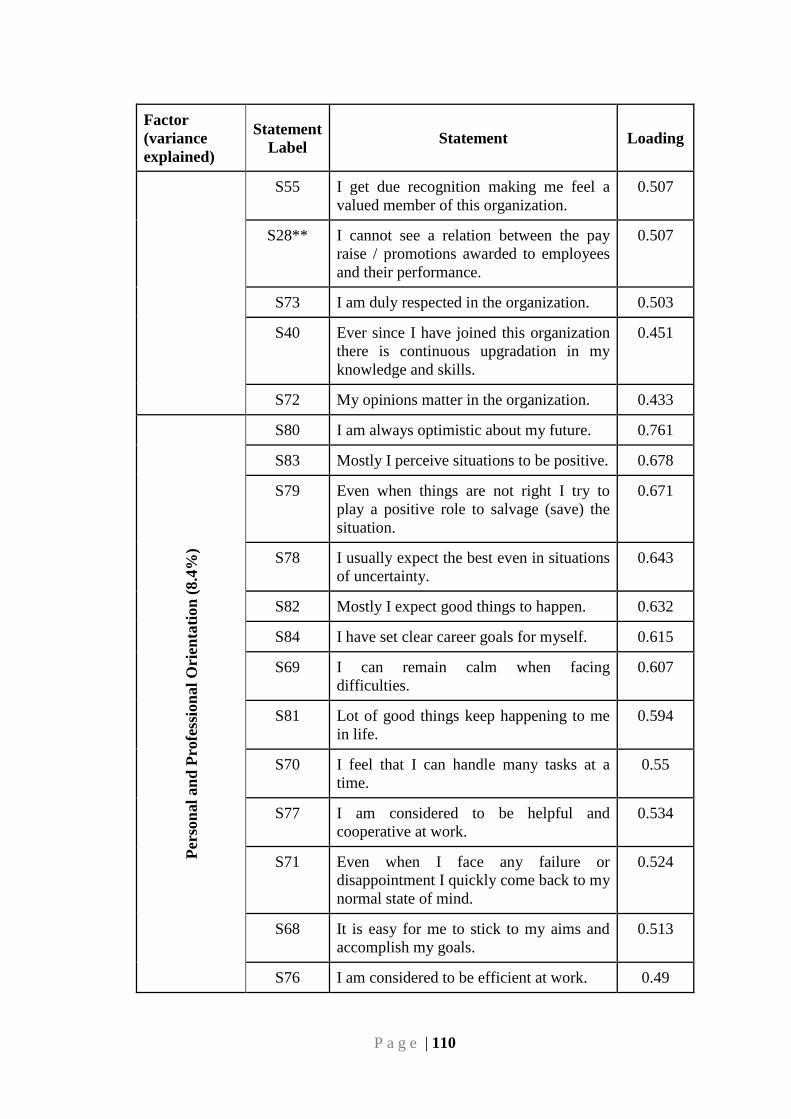
P a g e | 110
Factor
(variance
explained)
Statement
Label Statement Loading
S55 I get due recognition making me feel a
valued member of this organization.
0.507
S28** I cannot see a relation between the pay
raise / promotions awarded to employees
and their performance.
0.507
S73 I am duly respected in the organization. 0.503
S40 Ever since I have joined this organization
there is continuous upgradation in my
knowledge and skills.
0.451
S72 My opinions matter in the organization. 0.433
Per
son
al
an
d P
rofe
ssio
nal
Ori
enta
tion
(8.4
%)
S80 I am always optimistic about my future. 0.761
S83 Mostly I perceive situations to be positive. 0.678
S79 Even when things are not right I try to
play a positive role to salvage (save) the
situation.
0.671
S78 I usually expect the best even in situations
of uncertainty.
0.643
S82 Mostly I expect good things to happen. 0.632
S84 I have set clear career goals for myself. 0.615
S69 I can remain calm when facing
difficulties.
0.607
S81 Lot of good things keep happening to me
in life.
0.594
S70 I feel that I can handle many tasks at a
time.
0.55
S77 I am considered to be helpful and
cooperative at work.
0.534
S71 Even when I face any failure or
disappointment I quickly come back to my
normal state of mind.
0.524
S68 It is easy for me to stick to my aims and
accomplish my goals.
0.513
S76 I am considered to be efficient at work. 0.49
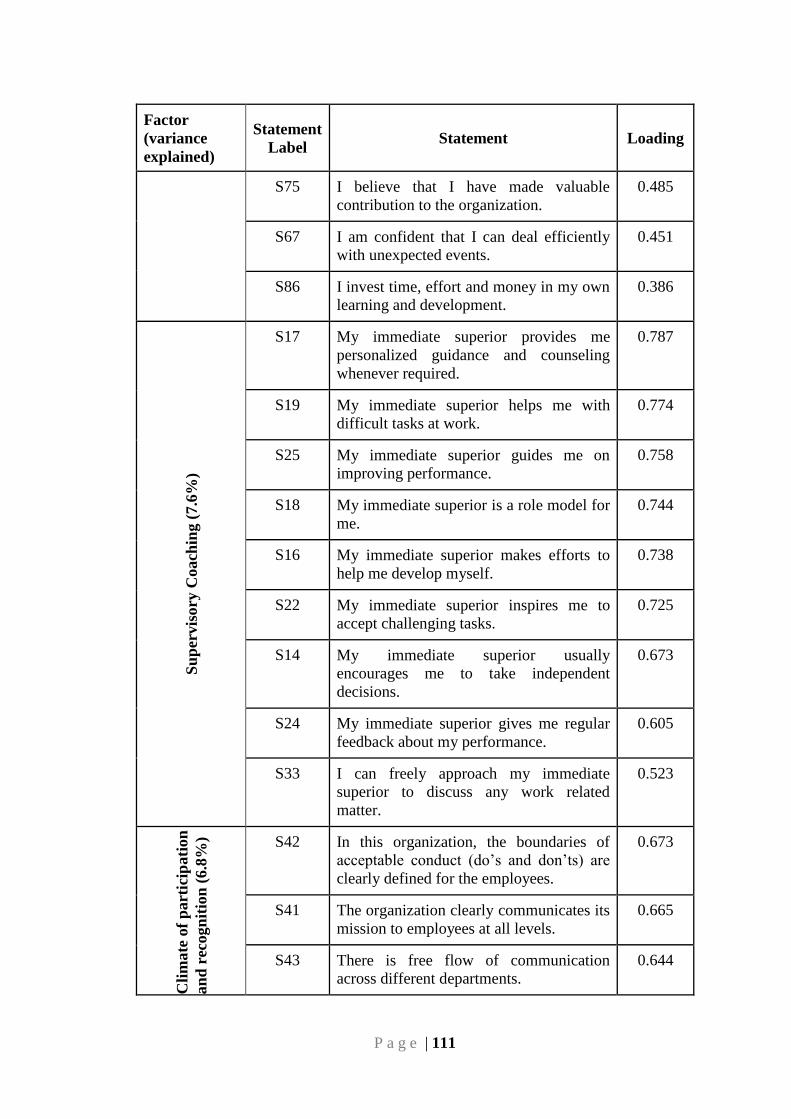
P a g e | 111
Factor
(variance
explained)
Statement
Label Statement Loading
S75 I believe that I have made valuable
contribution to the organization.
0.485
S67 I am confident that I can deal efficiently
with unexpected events.
0.451
S86 I invest time, effort and money in my own
learning and development.
0.386
Su
per
vis
ory
Coach
ing
(7.6
%)
S17 My immediate superior provides me
personalized guidance and counseling
whenever required.
0.787
S19 My immediate superior helps me with
difficult tasks at work.
0.774
S25 My immediate superior guides me on
improving performance.
0.758
S18 My immediate superior is a role model for
me.
0.744
S16 My immediate superior makes efforts to
help me develop myself.
0.738
S22 My immediate superior inspires me to
accept challenging tasks.
0.725
S14 My immediate superior usually
encourages me to take independent
decisions.
0.673
S24 My immediate superior gives me regular
feedback about my performance.
0.605
S33 I can freely approach my immediate
superior to discuss any work related
matter.
0.523
Cli
mate
of
part
icip
ati
on
an
d r
ecogn
itio
n (
6.8
%) S42 In this organization, the boundaries of
acceptable conduct (do‘s and don‘ts) are
clearly defined for the employees.
0.673
S41 The organization clearly communicates its
mission to employees at all levels.
0.665
S43 There is free flow of communication
across different departments.
0.644
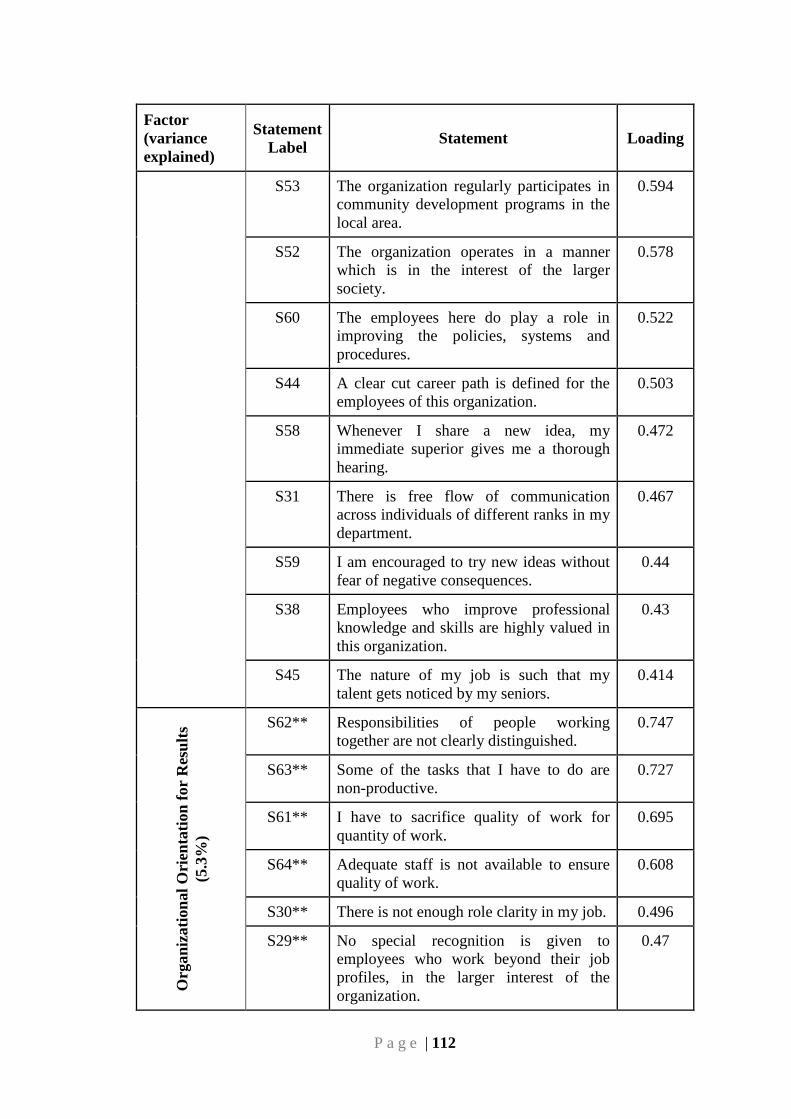
P a g e | 112
Factor
(variance
explained)
Statement
Label Statement Loading
S53 The organization regularly participates in
community development programs in the
local area.
0.594
S52 The organization operates in a manner
which is in the interest of the larger
society.
0.578
S60 The employees here do play a role in
improving the policies, systems and
procedures.
0.522
S44 A clear cut career path is defined for the
employees of this organization.
0.503
S58 Whenever I share a new idea, my
immediate superior gives me a thorough
hearing.
0.472
S31 There is free flow of communication
across individuals of different ranks in my
department.
0.467
S59 I am encouraged to try new ideas without
fear of negative consequences.
0.44
S38 Employees who improve professional
knowledge and skills are highly valued in
this organization.
0.43
S45 The nature of my job is such that my
talent gets noticed by my seniors.
0.414
Org
an
izati
on
al
Ori
enta
tion
for
Res
ult
s
(5.3
%)
S62** Responsibilities of people working
together are not clearly distinguished.
0.747
S63** Some of the tasks that I have to do are
non-productive.
0.727
S61** I have to sacrifice quality of work for
quantity of work.
0.695
S64** Adequate staff is not available to ensure
quality of work.
0.608
S30** There is not enough role clarity in my job. 0.496
S29** No special recognition is given to
employees who work beyond their job
profiles, in the larger interest of the
organization.
0.47
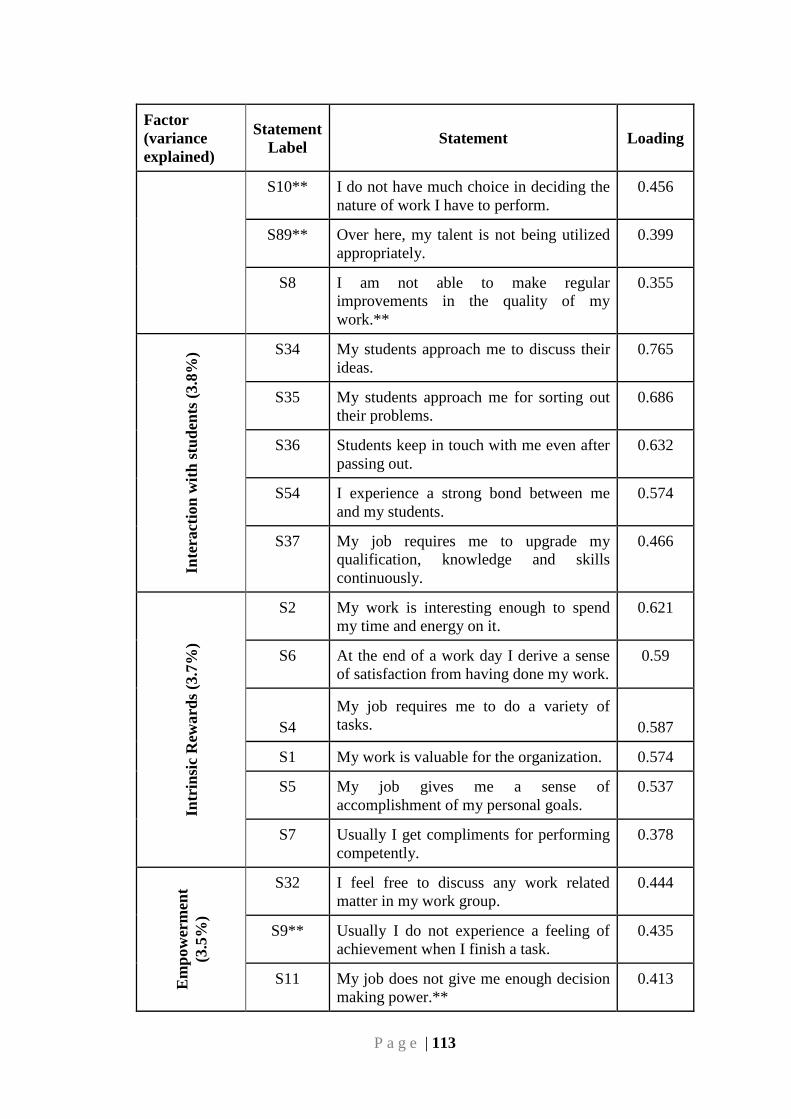
P a g e | 113
Factor
(variance
explained)
Statement
Label Statement Loading
S10** I do not have much choice in deciding the
nature of work I have to perform.
0.456
S89** Over here, my talent is not being utilized
appropriately.
0.399
S8 I am not able to make regular
improvements in the quality of my
work.**
0.355
Inte
ract
ion
wit
h s
tud
ents
(3.8
%) S34 My students approach me to discuss their
ideas.
0.765
S35 My students approach me for sorting out
their problems.
0.686
S36 Students keep in touch with me even after
passing out.
0.632
S54 I experience a strong bond between me
and my students.
0.574
S37 My job requires me to upgrade my
qualification, knowledge and skills
continuously.
0.466
Intr
insi
c R
eward
s (3
.7%
)
S2 My work is interesting enough to spend
my time and energy on it.
0.621
S6 At the end of a work day I derive a sense
of satisfaction from having done my work.
0.59
S4
My job requires me to do a variety of
tasks.
0.587
S1 My work is valuable for the organization. 0.574
S5 My job gives me a sense of
accomplishment of my personal goals.
0.537
S7 Usually I get compliments for performing
competently.
0.378
Em
pow
erm
ent
(3.5
%)
S32 I feel free to discuss any work related
matter in my work group.
0.444
S9** Usually I do not experience a feeling of
achievement when I finish a task.
0.435
S11 My job does not give me enough decision
making power.**
0.413
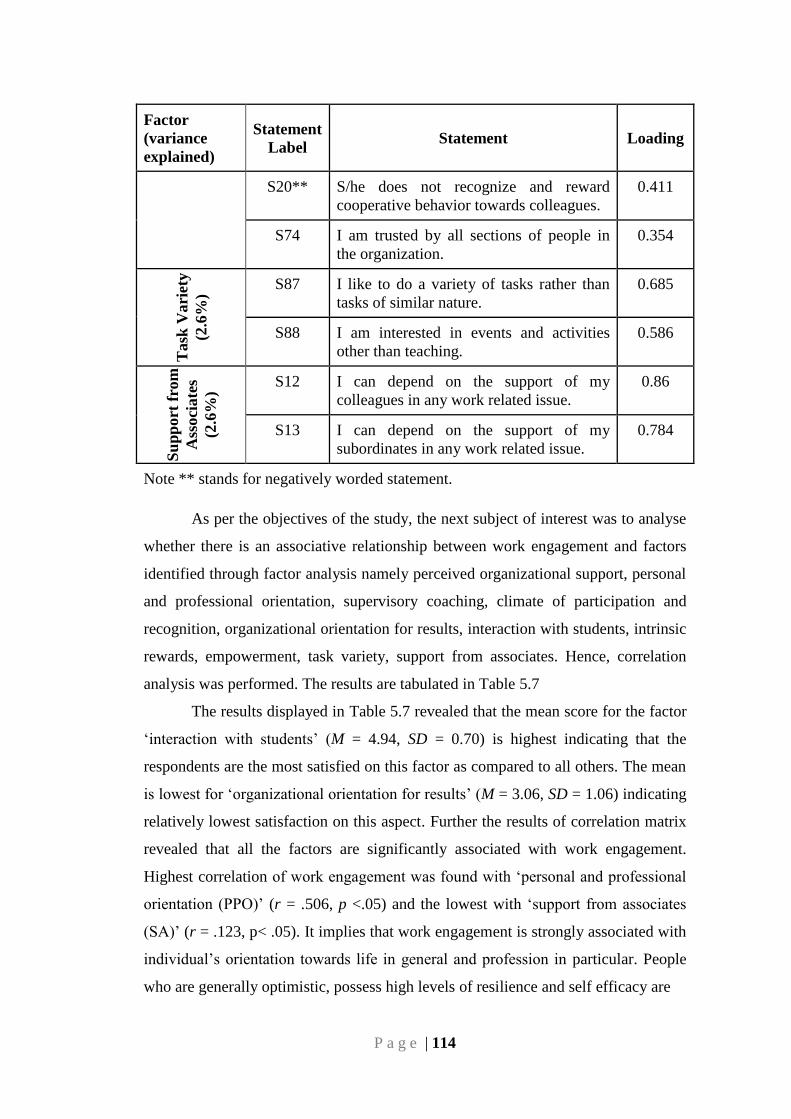
P a g e | 114
Factor
(variance
explained)
Statement
Label Statement Loading
S20** S/he does not recognize and reward
cooperative behavior towards colleagues.
0.411
S74 I am trusted by all sections of people in
the organization.
0.354
Task
Vari
ety
(2.6
%)
S87 I like to do a variety of tasks rather than
tasks of similar nature.
0.685
S88 I am interested in events and activities
other than teaching.
0.586
Su
pp
ort
fro
m
Ass
oci
ate
s
(2.6
%)
S12 I can depend on the support of my
colleagues in any work related issue.
0.86
S13 I can depend on the support of my
subordinates in any work related issue.
0.784
Note ** stands for negatively worded statement.
As per the objectives of the study, the next subject of interest was to analyse
whether there is an associative relationship between work engagement and factors
identified through factor analysis namely perceived organizational support, personal
and professional orientation, supervisory coaching, climate of participation and
recognition, organizational orientation for results, interaction with students, intrinsic
rewards, empowerment, task variety, support from associates. Hence, correlation
analysis was performed. The results are tabulated in Table 5.7
The results displayed in Table 5.7 revealed that the mean score for the factor
‗interaction with students‘ (M = 4.94, SD = 0.70) is highest indicating that the
respondents are the most satisfied on this factor as compared to all others. The mean
is lowest for ‗organizational orientation for results‘ (M = 3.06, SD = 1.06) indicating
relatively lowest satisfaction on this aspect. Further the results of correlation matrix
revealed that all the factors are significantly associated with work engagement.
Highest correlation of work engagement was found with ‗personal and professional
orientation (PPO)‘ (r = .506, p <.05) and the lowest with ‗support from associates
(SA)‘ (r = .123, p< .05). It implies that work engagement is strongly associated with
individual‘s orientation towards life in general and profession in particular. People
who are generally optimistic, possess high levels of resilience and self efficacy are
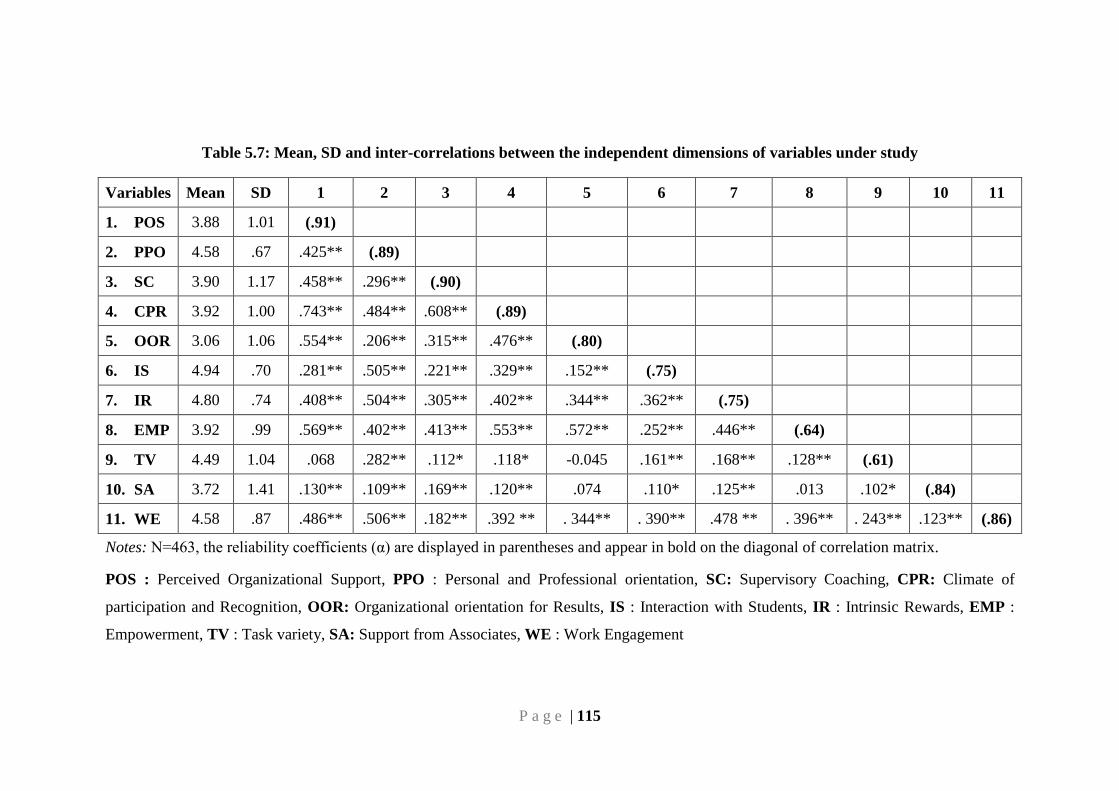
P a g e | 115
Table 5.7: Mean, SD and inter-correlations between the independent dimensions of variables under study
Variables Mean SD 1 2 3 4 5 6 7 8 9 10 11
1. POS 3.88 1.01 (.91)
2. PPO 4.58 .67 .425** (.89)
3. SC 3.90 1.17 .458** .296** (.90)
4. CPR 3.92 1.00 .743** .484** .608** (.89)
5. OOR 3.06 1.06 .554** .206** .315** .476** (.80)
6. IS 4.94 .70 .281** .505** .221** .329** .152** (.75)
7. IR 4.80 .74 .408** .504** .305** .402** .344** .362** (.75)
8. EMP 3.92 .99 .569** .402** .413** .553** .572** .252** .446** (.64)
9. TV 4.49 1.04 .068 .282** .112* .118* -0.045 .161** .168** .128** (.61)
10. SA 3.72 1.41 .130** .109** .169** .120** .074 .110* .125** .013 .102* (.84)
11. WE 4.58 .87 .486** .506** .182** .392 ** . 344** . 390** .478 ** . 396** . 243** .123** (.86)
Notes: N=463, the reliability coefficients (α) are displayed in parentheses and appear in bold on the diagonal of correlation matrix.
POS : Perceived Organizational Support, PPO : Personal and Professional orientation, SC: Supervisory Coaching, CPR: Climate of
participation and Recognition, OOR: Organizational orientation for Results, IS : Interaction with Students, IR : Intrinsic Rewards, EMP :
Empowerment, TV : Task variety, SA: Support from Associates, WE : Work Engagement
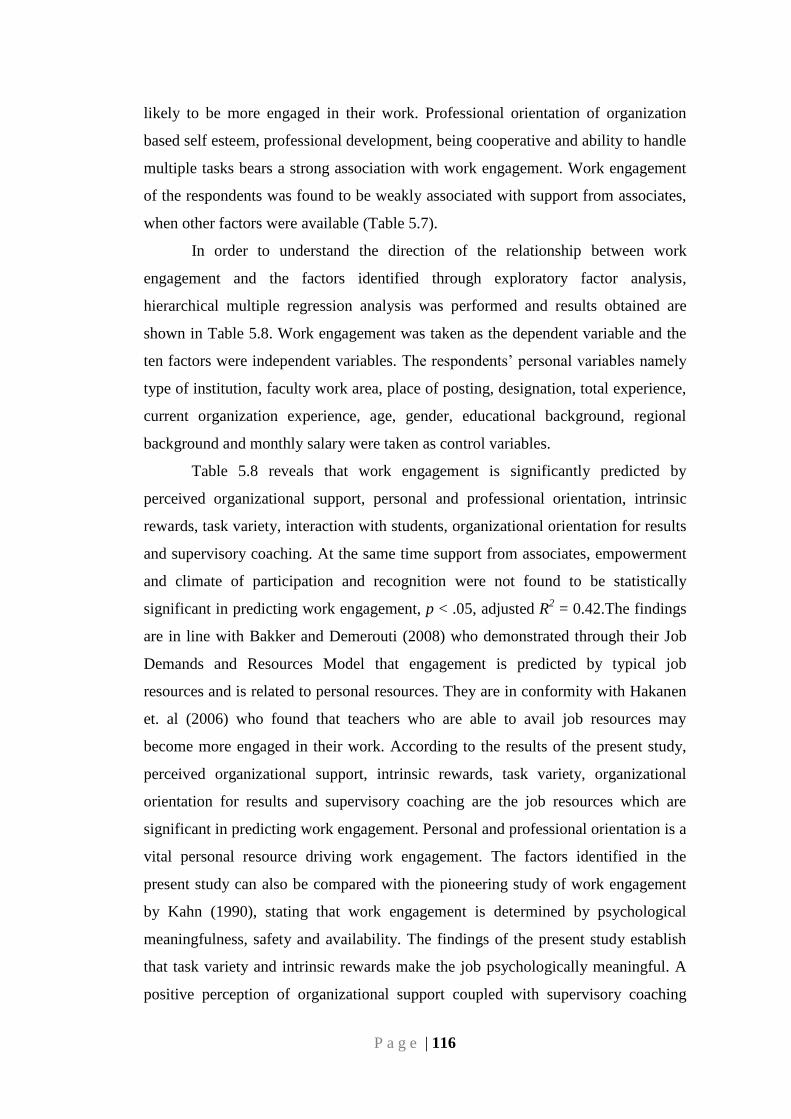
P a g e | 116
likely to be more engaged in their work. Professional orientation of organization
based self esteem, professional development, being cooperative and ability to handle
multiple tasks bears a strong association with work engagement. Work engagement
of the respondents was found to be weakly associated with support from associates,
when other factors were available (Table 5.7).
In order to understand the direction of the relationship between work
engagement and the factors identified through exploratory factor analysis,
hierarchical multiple regression analysis was performed and results obtained are
shown in Table 5.8. Work engagement was taken as the dependent variable and the
ten factors were independent variables. The respondents‘ personal variables namely
type of institution, faculty work area, place of posting, designation, total experience,
current organization experience, age, gender, educational background, regional
background and monthly salary were taken as control variables.
Table 5.8 reveals that work engagement is significantly predicted by
perceived organizational support, personal and professional orientation, intrinsic
rewards, task variety, interaction with students, organizational orientation for results
and supervisory coaching. At the same time support from associates, empowerment
and climate of participation and recognition were not found to be statistically
significant in predicting work engagement, p < .05, adjusted R2 = 0.42.The findings
are in line with Bakker and Demerouti (2008) who demonstrated through their Job
Demands and Resources Model that engagement is predicted by typical job
resources and is related to personal resources. They are in conformity with Hakanen
et. al (2006) who found that teachers who are able to avail job resources may
become more engaged in their work. According to the results of the present study,
perceived organizational support, intrinsic rewards, task variety, organizational
orientation for results and supervisory coaching are the job resources which are
significant in predicting work engagement. Personal and professional orientation is a
vital personal resource driving work engagement. The factors identified in the
present study can also be compared with the pioneering study of work engagement
by Kahn (1990), stating that work engagement is determined by psychological
meaningfulness, safety and availability. The findings of the present study establish
that task variety and intrinsic rewards make the job psychologically meaningful. A
positive perception of organizational support coupled with supervisory coaching
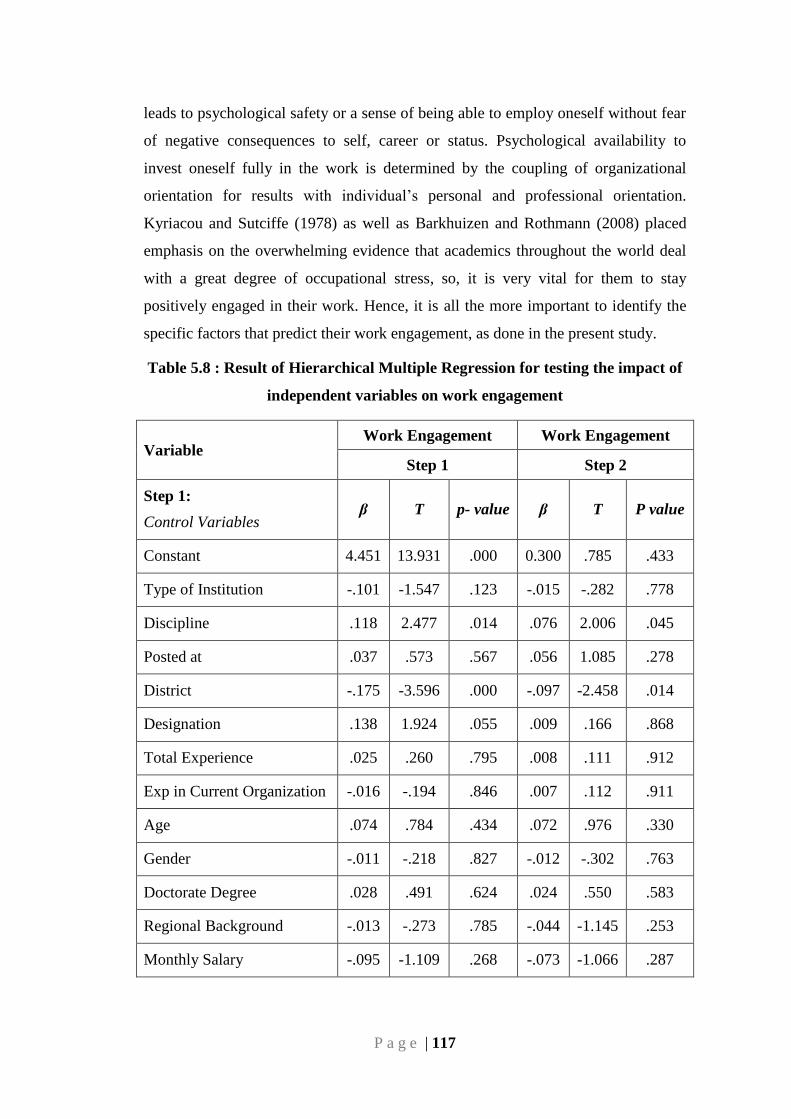
P a g e | 117
leads to psychological safety or a sense of being able to employ oneself without fear
of negative consequences to self, career or status. Psychological availability to
invest oneself fully in the work is determined by the coupling of organizational
orientation for results with individual‘s personal and professional orientation.
Kyriacou and Sutciffe (1978) as well as Barkhuizen and Rothmann (2008) placed
emphasis on the overwhelming evidence that academics throughout the world deal
with a great degree of occupational stress, so, it is very vital for them to stay
positively engaged in their work. Hence, it is all the more important to identify the
specific factors that predict their work engagement, as done in the present study.
Table 5.8 : Result of Hierarchical Multiple Regression for testing the impact of
independent variables on work engagement
Variable Work Engagement Work Engagement
Step 1 Step 2
Step 1:
Control Variables β T p- value β T P value
Constant 4.451 13.931 .000 0.300 .785 .433
Type of Institution -.101 -1.547 .123 -.015 -.282 .778
Discipline .118 2.477 .014 .076 2.006 .045
Posted at .037 .573 .567 .056 1.085 .278
District -.175 -3.596 .000 -.097 -2.458 .014
Designation .138 1.924 .055 .009 .166 .868
Total Experience .025 .260 .795 .008 .111 .912
Exp in Current Organization -.016 -.194 .846 .007 .112 .911
Age .074 .784 .434 .072 .976 .330
Gender -.011 -.218 .827 -.012 -.302 .763
Doctorate Degree .028 .491 .624 .024 .550 .583
Regional Background -.013 -.273 .785 -.044 -1.145 .253
Monthly Salary -.095 -1.109 .268 -.073 -1.066 .287
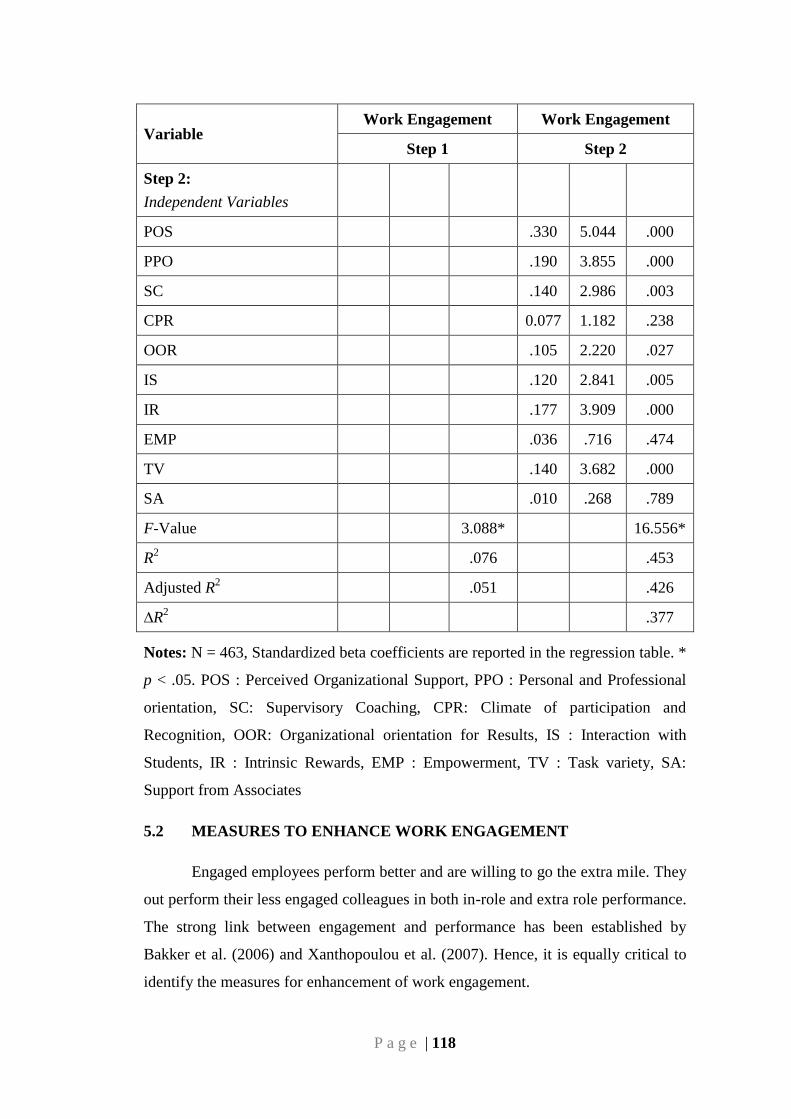
P a g e | 118
Variable Work Engagement Work Engagement
Step 1 Step 2
Step 2:
Independent Variables
POS .330 5.044 .000
PPO .190 3.855 .000
SC .140 2.986 .003
CPR 0.077 1.182 .238
OOR .105 2.220 .027
IS .120 2.841 .005
IR .177 3.909 .000
EMP .036 .716 .474
TV .140 3.682 .000
SA .010 .268 .789
F-Value 3.088* 16.556*
R2 .076 .453
Adjusted R2 .051 .426
∆R2 .377
Notes: N = 463, Standardized beta coefficients are reported in the regression table. *
p < .05. POS : Perceived Organizational Support, PPO : Personal and Professional
orientation, SC: Supervisory Coaching, CPR: Climate of participation and
Recognition, OOR: Organizational orientation for Results, IS : Interaction with
Students, IR : Intrinsic Rewards, EMP : Empowerment, TV : Task variety, SA:
Support from Associates
5.2 MEASURES TO ENHANCE WORK ENGAGEMENT
Engaged employees perform better and are willing to go the extra mile. They
out perform their less engaged colleagues in both in-role and extra role performance.
The strong link between engagement and performance has been established by
Bakker et al. (2006) and Xanthopoulou et al. (2007). Hence, it is equally critical to
identify the measures for enhancement of work engagement.
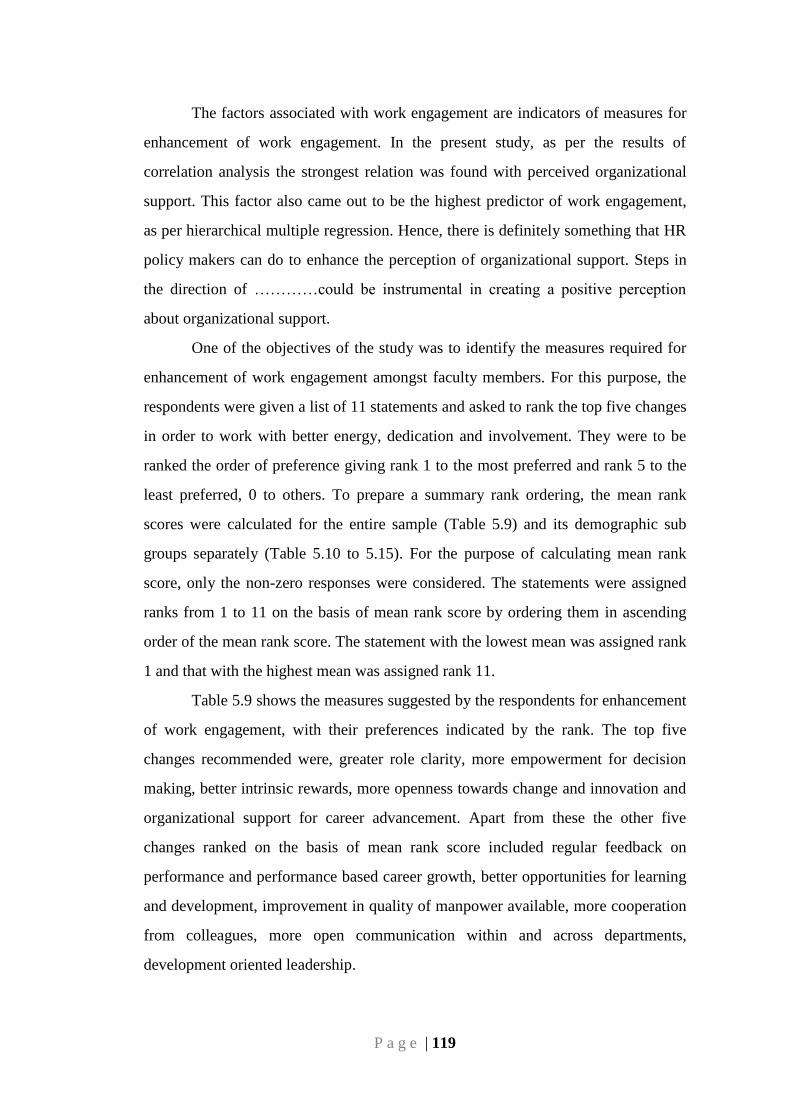
P a g e | 119
The factors associated with work engagement are indicators of measures for
enhancement of work engagement. In the present study, as per the results of
correlation analysis the strongest relation was found with perceived organizational
support. This factor also came out to be the highest predictor of work engagement,
as per hierarchical multiple regression. Hence, there is definitely something that HR
policy makers can do to enhance the perception of organizational support. Steps in
the direction of …………could be instrumental in creating a positive perception
about organizational support.
One of the objectives of the study was to identify the measures required for
enhancement of work engagement amongst faculty members. For this purpose, the
respondents were given a list of 11 statements and asked to rank the top five changes
in order to work with better energy, dedication and involvement. They were to be
ranked the order of preference giving rank 1 to the most preferred and rank 5 to the
least preferred, 0 to others. To prepare a summary rank ordering, the mean rank
scores were calculated for the entire sample (Table 5.9) and its demographic sub
groups separately (Table 5.10 to 5.15). For the purpose of calculating mean rank
score, only the non-zero responses were considered. The statements were assigned
ranks from 1 to 11 on the basis of mean rank score by ordering them in ascending
order of the mean rank score. The statement with the lowest mean was assigned rank
1 and that with the highest mean was assigned rank 11.
Table 5.9 shows the measures suggested by the respondents for enhancement
of work engagement, with their preferences indicated by the rank. The top five
changes recommended were, greater role clarity, more empowerment for decision
making, better intrinsic rewards, more openness towards change and innovation and
organizational support for career advancement. Apart from these the other five
changes ranked on the basis of mean rank score included regular feedback on
performance and performance based career growth, better opportunities for learning
and development, improvement in quality of manpower available, more cooperation
from colleagues, more open communication within and across departments,
development oriented leadership.
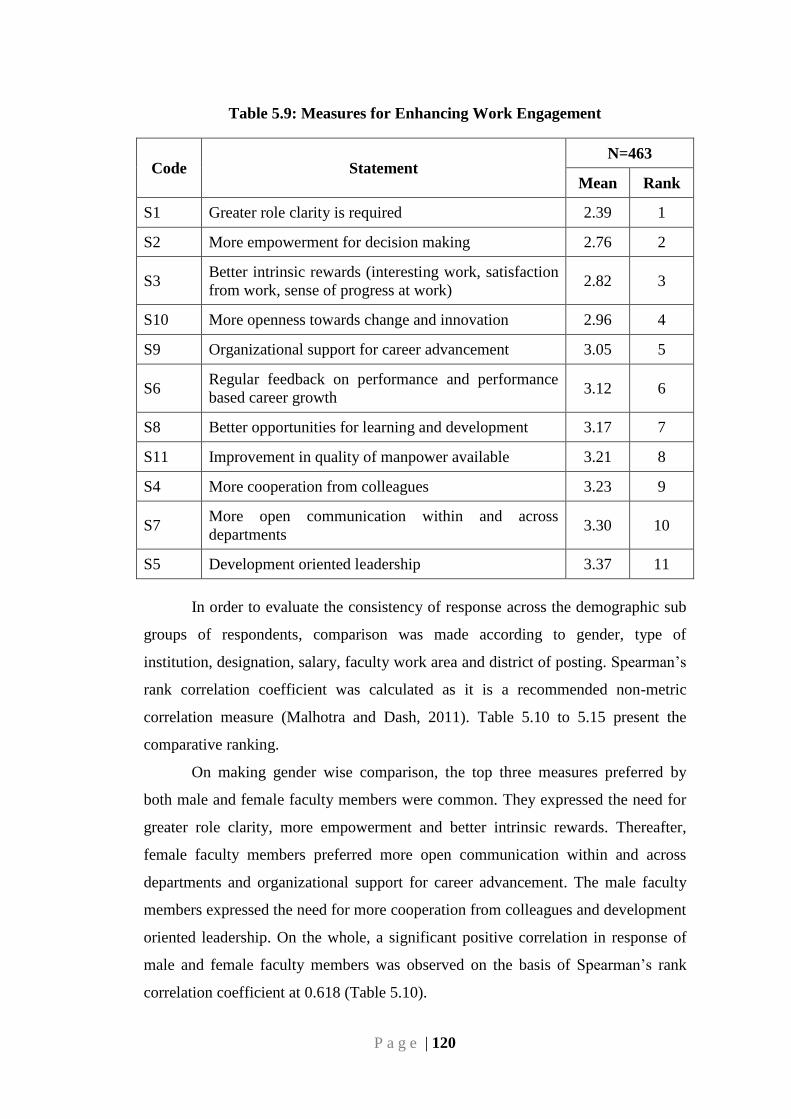
P a g e | 120
Table 5.9: Measures for Enhancing Work Engagement
Code Statement N=463
Mean Rank
S1 Greater role clarity is required 2.39 1
S2 More empowerment for decision making 2.76 2
S3 Better intrinsic rewards (interesting work, satisfaction
from work, sense of progress at work) 2.82 3
S10 More openness towards change and innovation 2.96 4
S9 Organizational support for career advancement 3.05 5
S6 Regular feedback on performance and performance
based career growth 3.12 6
S8 Better opportunities for learning and development 3.17 7
S11 Improvement in quality of manpower available 3.21 8
S4 More cooperation from colleagues 3.23 9
S7 More open communication within and across
departments 3.30 10
S5 Development oriented leadership 3.37 11
In order to evaluate the consistency of response across the demographic sub
groups of respondents, comparison was made according to gender, type of
institution, designation, salary, faculty work area and district of posting. Spearman‘s
rank correlation coefficient was calculated as it is a recommended non-metric
correlation measure (Malhotra and Dash, 2011). Table 5.10 to 5.15 present the
comparative ranking.
On making gender wise comparison, the top three measures preferred by
both male and female faculty members were common. They expressed the need for
greater role clarity, more empowerment and better intrinsic rewards. Thereafter,
female faculty members preferred more open communication within and across
departments and organizational support for career advancement. The male faculty
members expressed the need for more cooperation from colleagues and development
oriented leadership. On the whole, a significant positive correlation in response of
male and female faculty members was observed on the basis of Spearman‘s rank
correlation coefficient at 0.618 (Table 5.10).
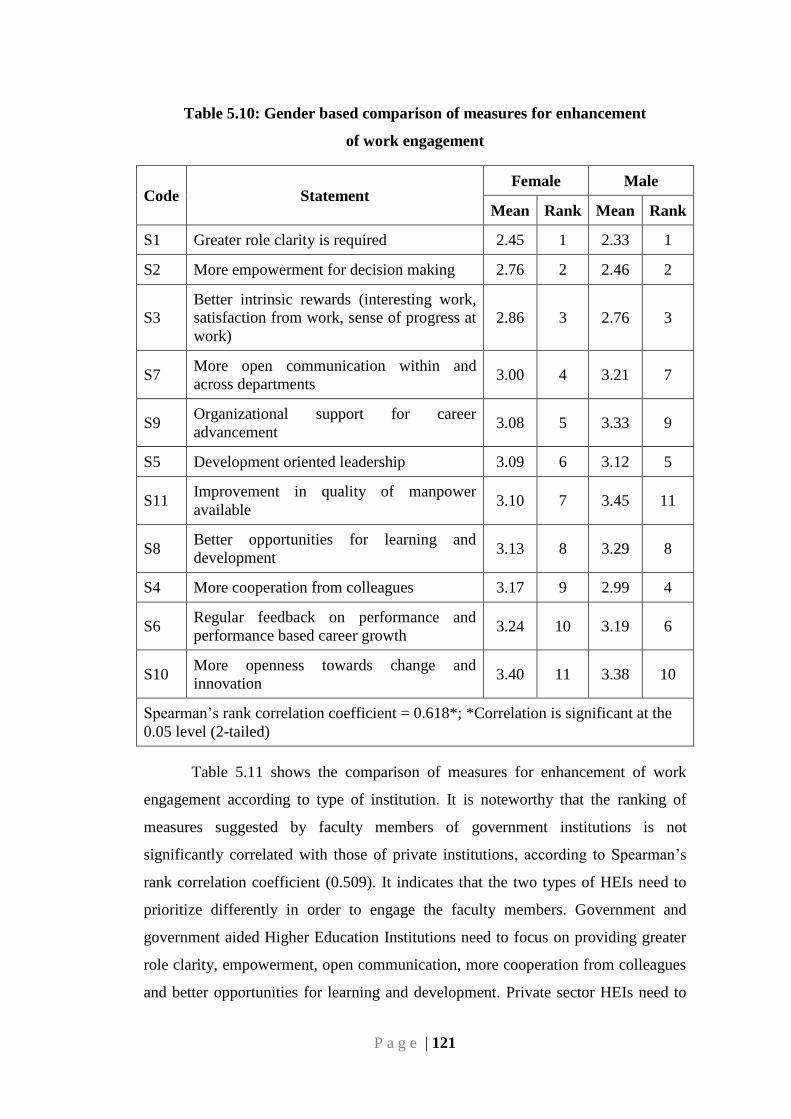
P a g e | 121
Table 5.10: Gender based comparison of measures for enhancement
of work engagement
Code Statement Female Male
Mean Rank Mean Rank
S1 Greater role clarity is required 2.45 1 2.33 1
S2 More empowerment for decision making 2.76 2 2.46 2
S3
Better intrinsic rewards (interesting work,
satisfaction from work, sense of progress at
work)
2.86 3 2.76 3
S7 More open communication within and
across departments 3.00 4 3.21 7
S9 Organizational support for career
advancement 3.08 5 3.33 9
S5 Development oriented leadership 3.09 6 3.12 5
S11 Improvement in quality of manpower
available 3.10 7 3.45 11
S8 Better opportunities for learning and
development 3.13 8 3.29 8
S4 More cooperation from colleagues 3.17 9 2.99 4
S6 Regular feedback on performance and
performance based career growth 3.24 10 3.19 6
S10 More openness towards change and
innovation 3.40 11 3.38 10
Spearman‘s rank correlation coefficient = 0.618*; *Correlation is significant at the
0.05 level (2-tailed)
Table 5.11 shows the comparison of measures for enhancement of work
engagement according to type of institution. It is noteworthy that the ranking of
measures suggested by faculty members of government institutions is not
significantly correlated with those of private institutions, according to Spearman‘s
rank correlation coefficient (0.509). It indicates that the two types of HEIs need to
prioritize differently in order to engage the faculty members. Government and
government aided Higher Education Institutions need to focus on providing greater
role clarity, empowerment, open communication, more cooperation from colleagues
and better opportunities for learning and development. Private sector HEIs need to
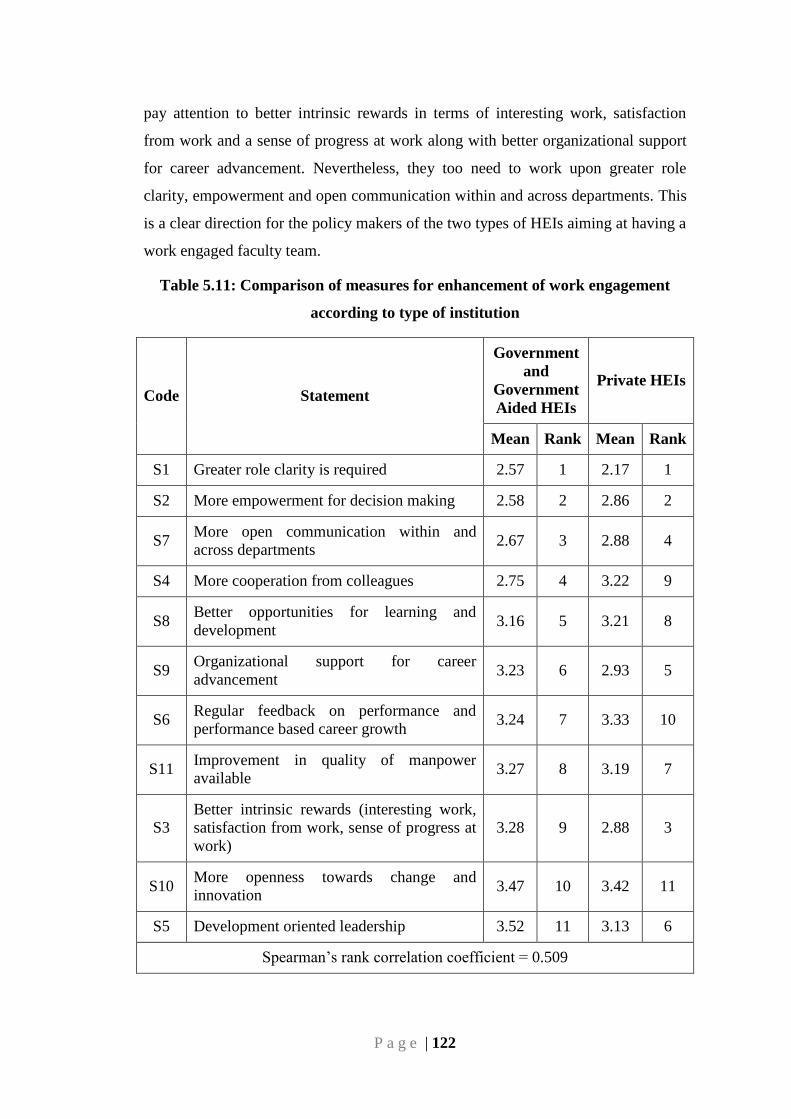
P a g e | 122
pay attention to better intrinsic rewards in terms of interesting work, satisfaction
from work and a sense of progress at work along with better organizational support
for career advancement. Nevertheless, they too need to work upon greater role
clarity, empowerment and open communication within and across departments. This
is a clear direction for the policy makers of the two types of HEIs aiming at having a
work engaged faculty team.
Table 5.11: Comparison of measures for enhancement of work engagement
according to type of institution
Code Statement
Government
and
Government
Aided HEIs
Private HEIs
Mean Rank Mean Rank
S1 Greater role clarity is required 2.57 1 2.17 1
S2 More empowerment for decision making 2.58 2 2.86 2
S7 More open communication within and
across departments 2.67 3 2.88 4
S4 More cooperation from colleagues 2.75 4 3.22 9
S8 Better opportunities for learning and
development 3.16 5 3.21 8
S9 Organizational support for career
advancement 3.23 6 2.93 5
S6 Regular feedback on performance and
performance based career growth 3.24 7 3.33 10
S11 Improvement in quality of manpower
available 3.27 8 3.19 7
S3
Better intrinsic rewards (interesting work,
satisfaction from work, sense of progress at
work)
3.28 9 2.88 3
S10 More openness towards change and
innovation 3.47 10 3.42 11
S5 Development oriented leadership 3.52 11 3.13 6
Spearman‘s rank correlation coefficient = 0.509
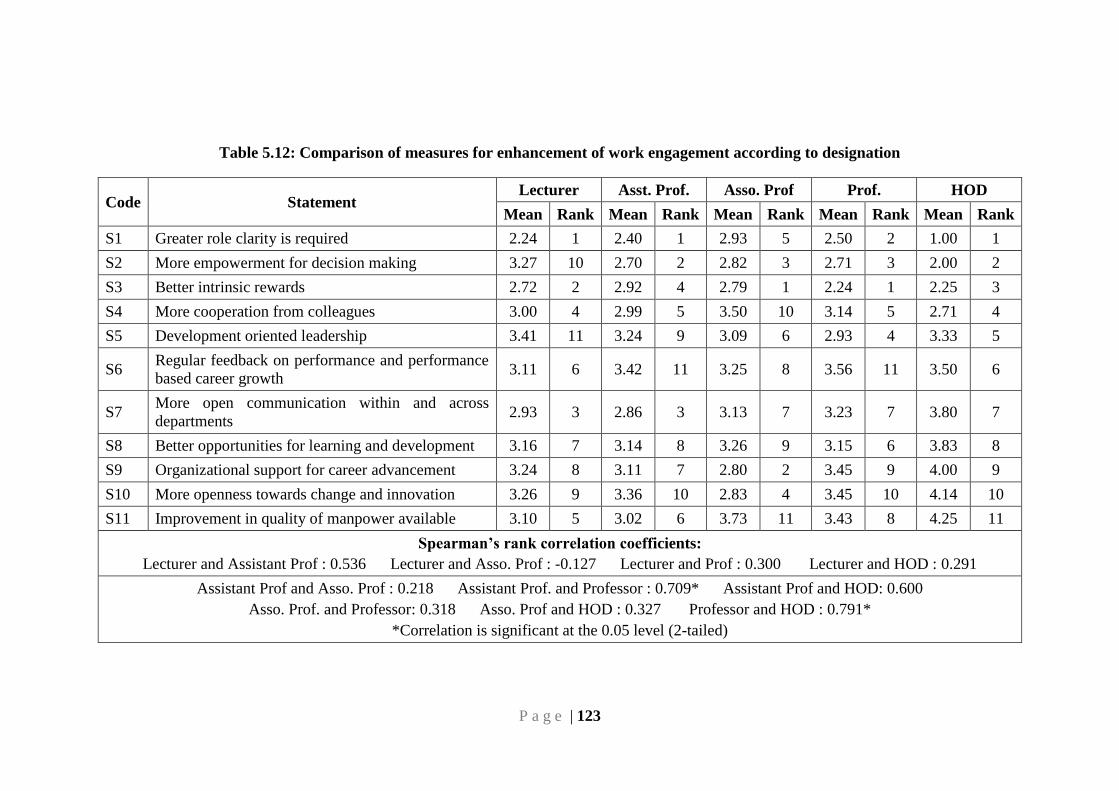
P a g e | 123
Table 5.12: Comparison of measures for enhancement of work engagement according to designation
Code Statement Lecturer Asst. Prof. Asso. Prof Prof. HOD
Mean Rank Mean Rank Mean Rank Mean Rank Mean Rank
S1 Greater role clarity is required 2.24 1 2.40 1 2.93 5 2.50 2 1.00 1
S2 More empowerment for decision making 3.27 10 2.70 2 2.82 3 2.71 3 2.00 2
S3 Better intrinsic rewards 2.72 2 2.92 4 2.79 1 2.24 1 2.25 3
S4 More cooperation from colleagues 3.00 4 2.99 5 3.50 10 3.14 5 2.71 4
S5 Development oriented leadership 3.41 11 3.24 9 3.09 6 2.93 4 3.33 5
S6 Regular feedback on performance and performance
based career growth 3.11 6 3.42 11 3.25 8 3.56 11 3.50 6
S7 More open communication within and across
departments 2.93 3 2.86 3 3.13 7 3.23 7 3.80 7
S8 Better opportunities for learning and development 3.16 7 3.14 8 3.26 9 3.15 6 3.83 8
S9 Organizational support for career advancement 3.24 8 3.11 7 2.80 2 3.45 9 4.00 9
S10 More openness towards change and innovation 3.26 9 3.36 10 2.83 4 3.45 10 4.14 10
S11 Improvement in quality of manpower available 3.10 5 3.02 6 3.73 11 3.43 8 4.25 11
Spearman’s rank correlation coefficients:
Lecturer and Assistant Prof : 0.536 Lecturer and Asso. Prof : -0.127 Lecturer and Prof : 0.300 Lecturer and HOD : 0.291
Assistant Prof and Asso. Prof : 0.218 Assistant Prof. and Professor : 0.709* Assistant Prof and HOD: 0.600
Asso. Prof. and Professor: 0.318 Asso. Prof and HOD : 0.327 Professor and HOD : 0.791*
*Correlation is significant at the 0.05 level (2-tailed)
P a g e | 124
Table 5.12 shows a comparison of measures for enhancement of work
engagement according to designation. A significant correlation was found in the
measures suggested by Professors and Heads of Departments (Spearman‘s rho=
0.791) as well as Assistant Professors and Professors (Spearman‘s rho= 0.709).
Since there was no significant correlation in the measures suggested by all other
designations, it indicates that the Higher Education Institutions might need to take
designation or cadre specific measures for enhancing the work engagement of
faculty members. Placed at starting rung of teaching hierarcy, the lecturers
expressed a strong need for role clarity, intrinsic rewards, open communication,
cooperation from colleagues and improvement in quality of manpower. The
Assistant Professors emphasized upon the need for empowerment, over and above
these measures. The Associate Professors gave top most priority to the need for
intrinsic rewards for example meaningful, interesting and valuable work. They were
also keen that the organization should provide support for career advancement and
be more open towards change and innovation. It indicates that if HEIs can take
special measures to address the dynamic needs of faculty members as they progress
through the organizational hierarchy, it can lead to an enhancement in their work
engagement.
Table 5.13 shows a comparison of measures for enhancement of work
engagement according to respondent‘s salary. The results indicate that there is very
low consistency in the preferred measures for enhancement of work engagement of
faculty members falling in various salary brackets. Those in the salary bracket of
upto Rs. 30,000 p.m stated maximum need for opportunities for learning and
development followed by role clarity, development oriented leadership, performance
feedback and performance based career growth. The next category consisting of
faculty members drawing Rs. 30001 to 50000, gave top most priority to better
opportunities for learning and development, followed by intrinsic rewards, better
communication, more openness to change and role clarity. Similarly the priorities of
other categories varied. A significantly consistent response was found from the
categories drawing 30,001 to 50,000 and 50,001 to 70,000 with Spearman‘s rho at
0.691. Hence, it implies that the work engagement measures need to be customized
according to salary bracket.
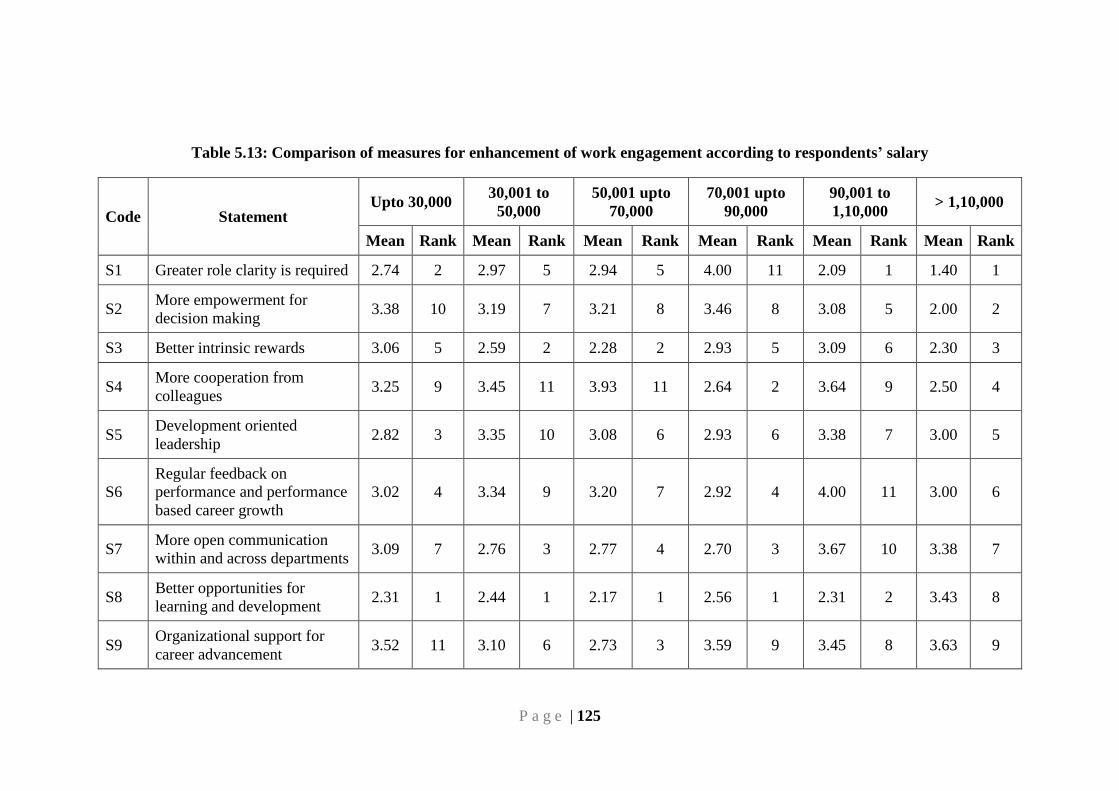
P a g e | 125
Table 5.13: Comparison of measures for enhancement of work engagement according to respondents’ salary
Code Statement Upto 30,000
30,001 to
50,000
50,001 upto
70,000
70,001 upto
90,000
90,001 to
1,10,000 > 1,10,000
Mean Rank Mean Rank Mean Rank Mean Rank Mean Rank Mean Rank
S1 Greater role clarity is required 2.74 2 2.97 5 2.94 5 4.00 11 2.09 1 1.40 1
S2 More empowerment for
decision making 3.38 10 3.19 7 3.21 8 3.46 8 3.08 5 2.00 2
S3 Better intrinsic rewards 3.06 5 2.59 2 2.28 2 2.93 5 3.09 6 2.30 3
S4 More cooperation from
colleagues 3.25 9 3.45 11 3.93 11 2.64 2 3.64 9 2.50 4
S5 Development oriented
leadership 2.82 3 3.35 10 3.08 6 2.93 6 3.38 7 3.00 5
S6
Regular feedback on
performance and performance
based career growth
3.02 4 3.34 9 3.20 7 2.92 4 4.00 11 3.00 6
S7 More open communication
within and across departments 3.09 7 2.76 3 2.77 4 2.70 3 3.67 10 3.38 7
S8 Better opportunities for
learning and development 2.31 1 2.44 1 2.17 1 2.56 1 2.31 2 3.43 8
S9 Organizational support for
career advancement 3.52 11 3.10 6 2.73 3 3.59 9 3.45 8 3.63 9
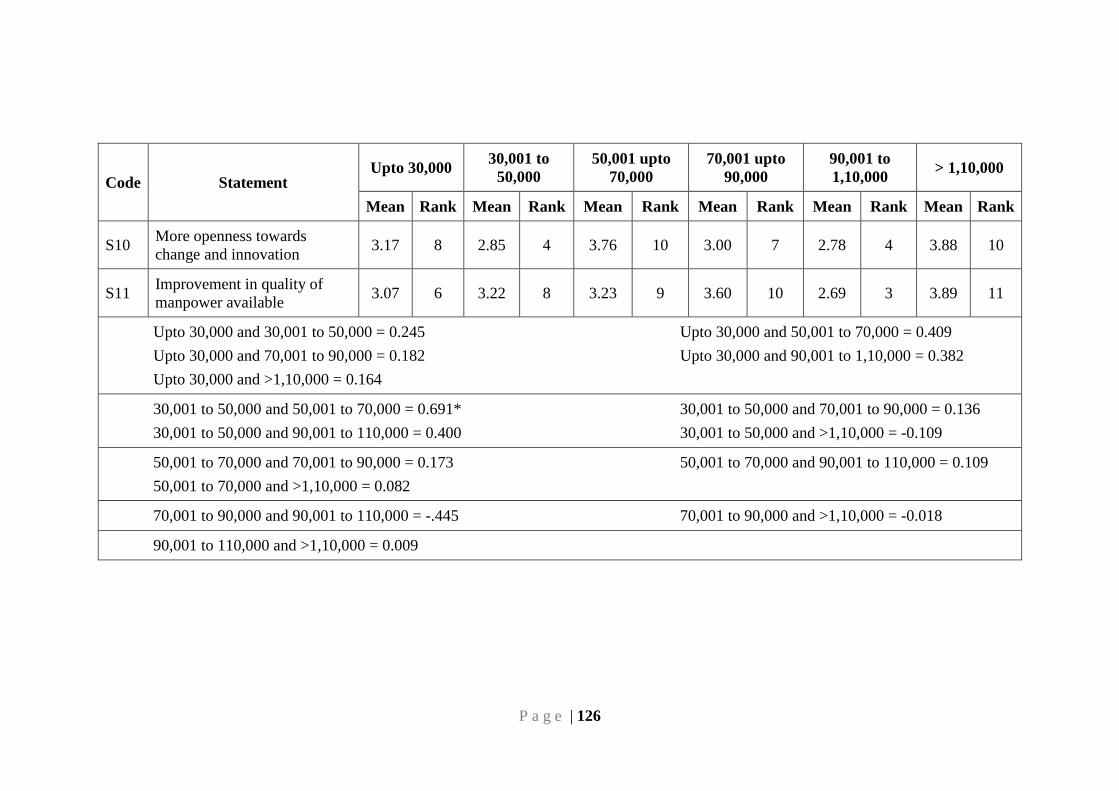
P a g e | 126
Code Statement Upto 30,000
30,001 to
50,000
50,001 upto
70,000
70,001 upto
90,000
90,001 to
1,10,000 > 1,10,000
Mean Rank Mean Rank Mean Rank Mean Rank Mean Rank Mean Rank
S10 More openness towards
change and innovation 3.17 8 2.85 4 3.76 10 3.00 7 2.78 4 3.88 10
S11 Improvement in quality of
manpower available 3.07 6 3.22 8 3.23 9 3.60 10 2.69 3 3.89 11
Upto 30,000 and 30,001 to 50,000 = 0.245 Upto 30,000 and 50,001 to 70,000 = 0.409
Upto 30,000 and 70,001 to 90,000 = 0.182 Upto 30,000 and 90,001 to 1,10,000 = 0.382
Upto 30,000 and >1,10,000 = 0.164
30,001 to 50,000 and 50,001 to 70,000 = 0.691* 30,001 to 50,000 and 70,001 to 90,000 = 0.136
30,001 to 50,000 and 90,001 to 110,000 = 0.400 30,001 to 50,000 and >1,10,000 = -0.109
50,001 to 70,000 and 70,001 to 90,000 = 0.173 50,001 to 70,000 and 90,001 to 110,000 = 0.109
50,001 to 70,000 and >1,10,000 = 0.082
70,001 to 90,000 and 90,001 to 110,000 = -.445 70,001 to 90,000 and >1,10,000 = -0.018
90,001 to 110,000 and >1,10,000 = 0.009
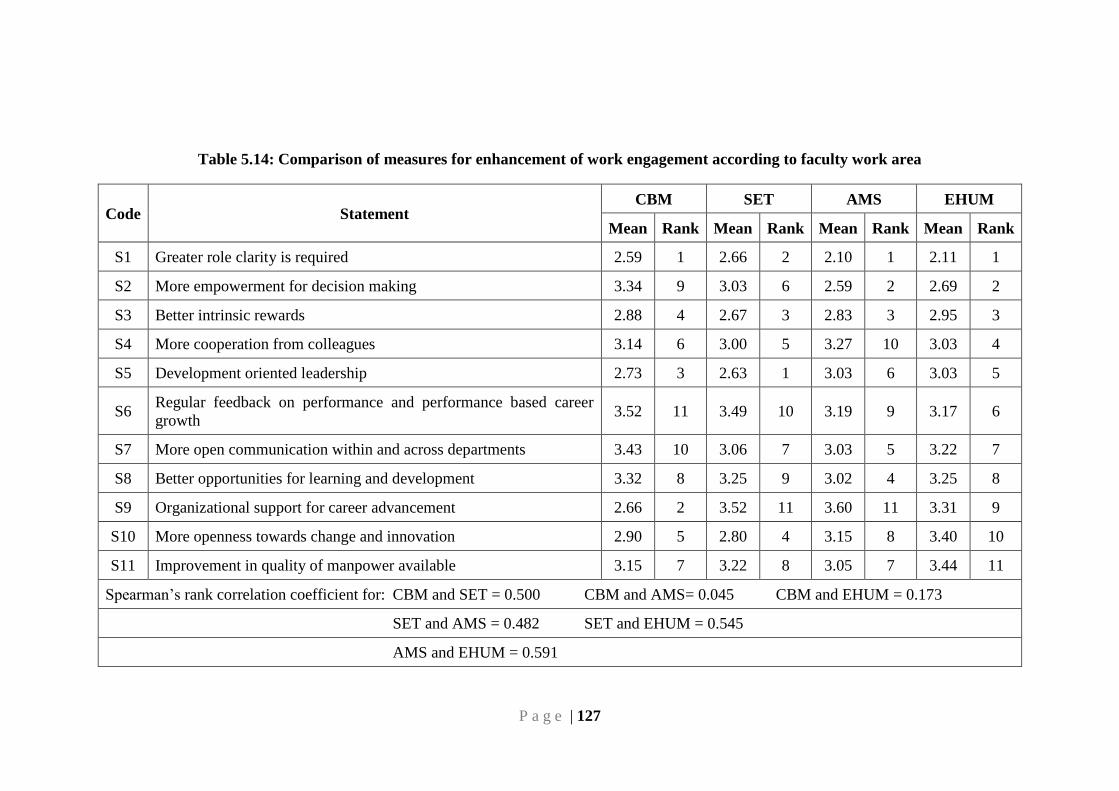
P a g e | 127
Table 5.14: Comparison of measures for enhancement of work engagement according to faculty work area
Code Statement CBM SET AMS EHUM
Mean Rank Mean Rank Mean Rank Mean Rank
S1 Greater role clarity is required 2.59 1 2.66 2 2.10 1 2.11 1
S2 More empowerment for decision making 3.34 9 3.03 6 2.59 2 2.69 2
S3 Better intrinsic rewards 2.88 4 2.67 3 2.83 3 2.95 3
S4 More cooperation from colleagues 3.14 6 3.00 5 3.27 10 3.03 4
S5 Development oriented leadership 2.73 3 2.63 1 3.03 6 3.03 5
S6 Regular feedback on performance and performance based career
growth 3.52 11 3.49 10 3.19 9 3.17 6
S7 More open communication within and across departments 3.43 10 3.06 7 3.03 5 3.22 7
S8 Better opportunities for learning and development 3.32 8 3.25 9 3.02 4 3.25 8
S9 Organizational support for career advancement 2.66 2 3.52 11 3.60 11 3.31 9
S10 More openness towards change and innovation 2.90 5 2.80 4 3.15 8 3.40 10
S11 Improvement in quality of manpower available 3.15 7 3.22 8 3.05 7 3.44 11
Spearman‘s rank correlation coefficient for: CBM and SET = 0.500 CBM and AMS= 0.045 CBM and EHUM = 0.173
SET and AMS = 0.482 SET and EHUM = 0.545
AMS and EHUM = 0.591
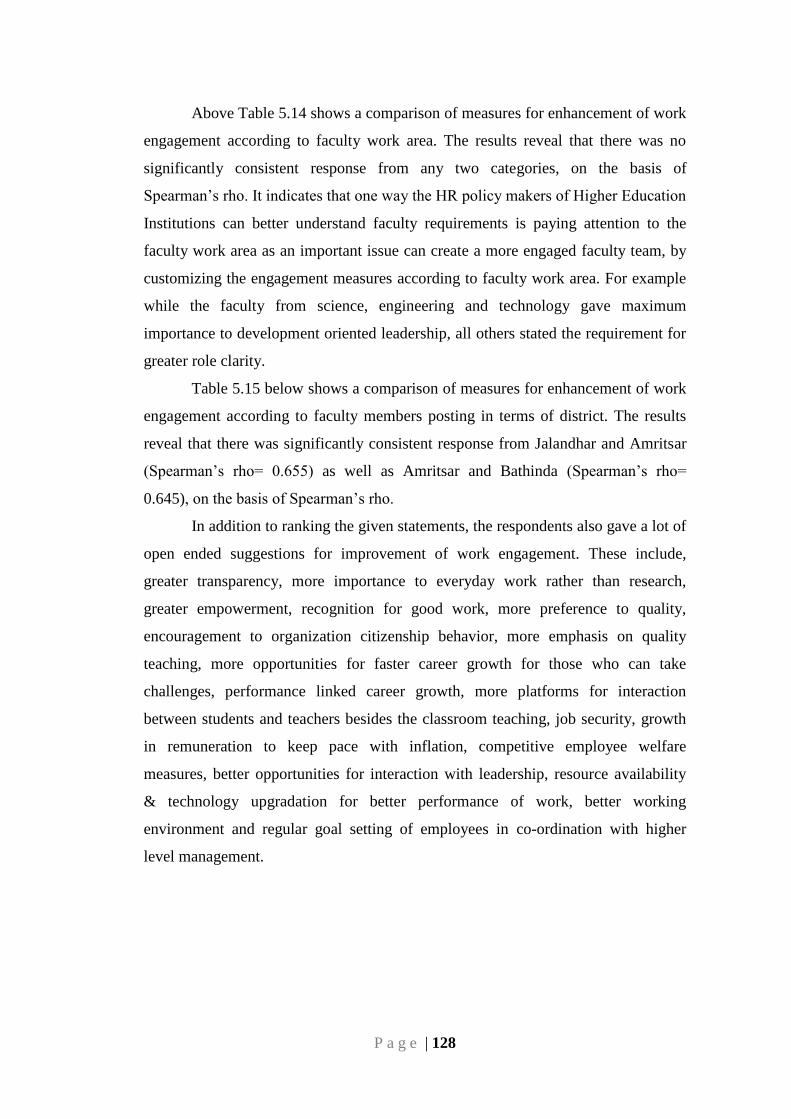
P a g e | 128
Above Table 5.14 shows a comparison of measures for enhancement of work
engagement according to faculty work area. The results reveal that there was no
significantly consistent response from any two categories, on the basis of
Spearman‘s rho. It indicates that one way the HR policy makers of Higher Education
Institutions can better understand faculty requirements is paying attention to the
faculty work area as an important issue can create a more engaged faculty team, by
customizing the engagement measures according to faculty work area. For example
while the faculty from science, engineering and technology gave maximum
importance to development oriented leadership, all others stated the requirement for
greater role clarity.
Table 5.15 below shows a comparison of measures for enhancement of work
engagement according to faculty members posting in terms of district. The results
reveal that there was significantly consistent response from Jalandhar and Amritsar
(Spearman‘s rho= 0.655) as well as Amritsar and Bathinda (Spearman‘s rho=
0.645), on the basis of Spearman‘s rho.
In addition to ranking the given statements, the respondents also gave a lot of
open ended suggestions for improvement of work engagement. These include,
greater transparency, more importance to everyday work rather than research,
greater empowerment, recognition for good work, more preference to quality,
encouragement to organization citizenship behavior, more emphasis on quality
teaching, more opportunities for faster career growth for those who can take
challenges, performance linked career growth, more platforms for interaction
between students and teachers besides the classroom teaching, job security, growth
in remuneration to keep pace with inflation, competitive employee welfare
measures, better opportunities for interaction with leadership, resource availability
& technology upgradation for better performance of work, better working
environment and regular goal setting of employees in co-ordination with higher
level management.
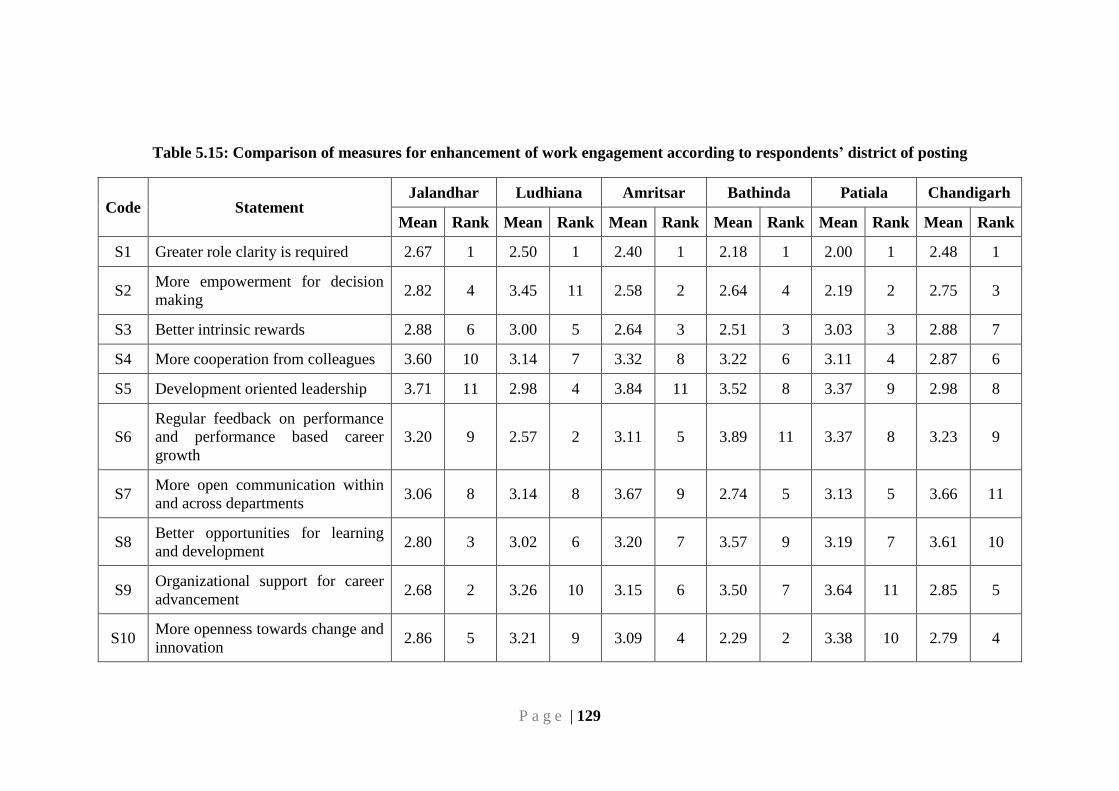
P a g e | 129
Table 5.15: Comparison of measures for enhancement of work engagement according to respondents’ district of posting
Code Statement Jalandhar Ludhiana Amritsar Bathinda Patiala Chandigarh
Mean Rank Mean Rank Mean Rank Mean Rank Mean Rank Mean Rank
S1 Greater role clarity is required 2.67 1 2.50 1 2.40 1 2.18 1 2.00 1 2.48 1
S2 More empowerment for decision
making 2.82 4 3.45 11 2.58 2 2.64 4 2.19 2 2.75 3
S3 Better intrinsic rewards 2.88 6 3.00 5 2.64 3 2.51 3 3.03 3 2.88 7
S4 More cooperation from colleagues 3.60 10 3.14 7 3.32 8 3.22 6 3.11 4 2.87 6
S5 Development oriented leadership 3.71 11 2.98 4 3.84 11 3.52 8 3.37 9 2.98 8
S6
Regular feedback on performance
and performance based career
growth
3.20 9 2.57 2 3.11 5 3.89 11 3.37 8 3.23 9
S7 More open communication within
and across departments 3.06 8 3.14 8 3.67 9 2.74 5 3.13 5 3.66 11
S8 Better opportunities for learning
and development 2.80 3 3.02 6 3.20 7 3.57 9 3.19 7 3.61 10
S9 Organizational support for career
advancement 2.68 2 3.26 10 3.15 6 3.50 7 3.64 11 2.85 5
S10 More openness towards change and
innovation 2.86 5 3.21 9 3.09 4 2.29 2 3.38 10 2.79 4
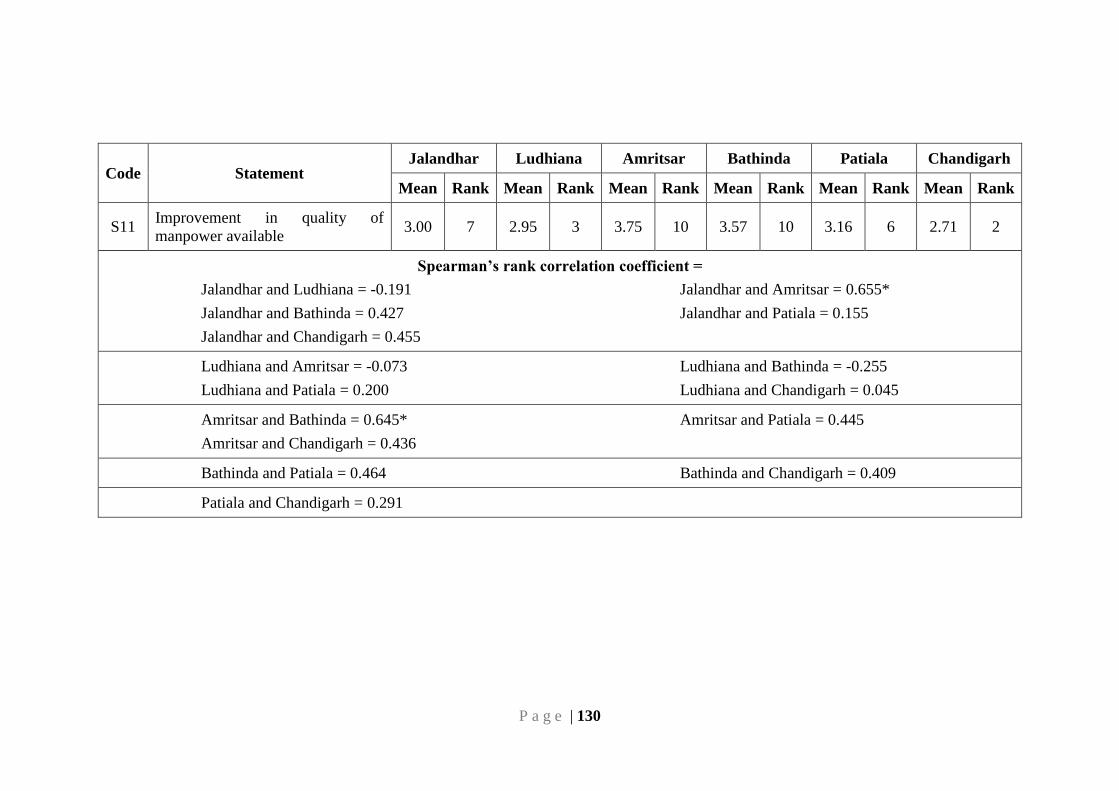
P a g e | 130
Code Statement Jalandhar Ludhiana Amritsar Bathinda Patiala Chandigarh
Mean Rank Mean Rank Mean Rank Mean Rank Mean Rank Mean Rank
S11 Improvement in quality of
manpower available 3.00 7 2.95 3 3.75 10 3.57 10 3.16 6 2.71 2
Spearman’s rank correlation coefficient =
Jalandhar and Ludhiana = -0.191 Jalandhar and Amritsar = 0.655*
Jalandhar and Bathinda = 0.427 Jalandhar and Patiala = 0.155
Jalandhar and Chandigarh = 0.455
Ludhiana and Amritsar = -0.073 Ludhiana and Bathinda = -0.255
Ludhiana and Patiala = 0.200 Ludhiana and Chandigarh = 0.045
Amritsar and Bathinda = 0.645* Amritsar and Patiala = 0.445
Amritsar and Chandigarh = 0.436
Bathinda and Patiala = 0.464 Bathinda and Chandigarh = 0.409
Patiala and Chandigarh = 0.291
P a g e | 131
5.3 CHAPTER SUMMARY
This chapter deals with identification of the factors affecting faculty work
engagement and measures for its enhancement. A self developed, pretested
questionnaire consisting of 92 statements was crafted to seek response on a 7 point
Likert scale. Descriptive statistics were closely examined. Exploratory factor
analysis was used for reducing a larger set of variables to a smaller set. Reliability
coefficient cronbach‘s alpha were computed for all the factors and were above the
minimum acceptable limit. Correlation analysis was performed to study whether
there is an associative relationship between work engagement and factors identified
through factor analysis. Hierarchical multiple regression analysis was conducted to
study the direction of relationship between the ten factors as independent variables
and work engagement as dependent variable, while taking the personal variables as
control variables. Thus the factors affecting work engagement were identified. The
measures for enhancement of work engagement amongst faculty members employed
in HEIs were suggested.
Descriptive statistical analysis revealed that the respondents appeared to be
highly satisfied on very few parameters like interesting and meaningful work;
interaction with students for solving problems; requirement of job to upgrade
qualification, skills and knowledge. They were satisfied on parameters like task
variety, sense of accomplishment of personal goals, intrinsic satisfaction from work,
compliments for good performance, challenging work, accountability, open
communication with peers, opportunities for self development, employer as a
responsible social citizen and encouragement to new ideas. They were dissatisfied
on aspects like transparency in performance appraisal, recognition for ‗going the
extra mile‘, employee benefits and talent utilization. On most other aspects, which
are quite vital, the respondents were on the borderline i.e neither satisfied nor
dissatisfied. These include, having a choice in the nature of work, support of
colleagues and subordinates, supervisory coaching, recognition and rewards,
performance feedback, role clarity, open communication, salary, status, job security,
sacrifice quality for quantity and rigidity of policies and systems.
As a result of exploratory factor analysis 92 statements emerged into ten
factors namely perceived organizational support, personal and professional
P a g e | 132
orientation, supervisory coaching, climate of participation and recognition,
organizational orientation for results, interaction with students, intrinsic rewards,
empowerment, task variety, support from associates. The next subject of interest was
to analyse whether there is an associative relationship between work engagement
and factors identified through factor analysis. Hence, correlation analysis was
performed. The results of correlation matrix revealed that all the factors are
significantly associated with work engagement. Highest correlation of work
engagement was found with ‗personal and professional orientation and the lowest
with ‗support from associates‘. It implies that work engagement is strongly
associated with individual‘s orientation towards life in general and profession in
specific. Work engagement of the respondents was found to be weakly associated
with support from associates, when other factors were present and available.
In order to understand the direction of the relationship, hierarchical multiple
regression analysis was performed. The results revealed that work engagement is
significantly predicted by perceived organizational support, personal and
professional orientation, intrinsic rewards, task variety, interaction with students,
organizational orientation for results and supervisory coaching. At the same time
support from associates, empowerment and climate of participation and recognition
were not found to be statistically significant in predicting work engagement. The
findings are in line with Bakker and Demerouti (2008) who demonstrated through
their Job Demands and Resources Model that engagement is predicted by typical job
resources and is related to personal resources. It is in conformity with Hakanen et. al
(2006) who found that teachers who are able to avail job resources may become
more engaged in their work. According to the results of the present study, the job
resources that predict faculty work engagement are perceived organizational
support, intrinsic rewards, task variety, organizational orientation for results and
supervisory coaching. Personal and professional orientation is a vital personal
resource driving work engagement. The factors identified in the present study were
also be compared with the pioneering study of work engagement by Kahn (1990).
Given the backdrop of the observations of Kyriacou & Sutciffe (1978) and
Barkhuizen & Rothmann (2008) teaching profession is known for having many job
demands. Academics around the world face a high degree of occupational stress
which makes it vital them to stay work engaged. Hence, it is equally important to
P a g e | 133
identify the specific factors that predict teachers‘ work engagement, as done in the
present study. Finally, the measures for enhancement of work engagement were
suggested on the basis of work engagement factors and respondents suggestions.
The top five changes recommended in the order to priority were, greater role clarity,
more empowerment for decision making, better intrinsic rewards, more openness
towards change and innovation and organizational support for career advancement.
Interestingly it was found if HEIs in Punjab can customize the engagement measures
according the type of institution, designation, salary bracket and faculty work area,
they can be more effective in having a work engaged faculty team.
**********
CHAPTER – 6
RESULTS AND DISCUSSION:
RELATIONSHIP OF WORK
ENGAGEMENT WITH JOB
CRAFTING, WORK-LIFE
BALANCE, WORK STRESS
AND ORGANIZATIONAL
COMMITMENT
P a g e | 134
CHAPTER – 6
RESULTS AND DISCUSSION:
RELATIONSHIP OF WORK ENGAGEMENT WITH JOB
CRAFTING, WORK-LIFE BALANCE, WORK STRESS AND
ORGANIZATIONAL COMMITMENT
——————————————————————————————————
This chapter deals with the study of the relationship of the level of work
engagement with job crafting, work - life balance, work stress and organizational
commitment. Accordingly the chapter is divided into four sections: Section 6.1 deals
with the study of relationship between work engagement and job crafting; Section
6.2 deals with the study of relationship between work engagement and work - life
balance; Section 6.3 deals with the study of relationship between work engagement
and work stress; Section 6.4 deals with the study of relationship between work
engagement and organizational commitment.
Work engaged employees seem to perceive work as a calling rather than
simply a means of livelihood. They are passionate and absorbed in their work
deriving intrinsic pleasure from it. This notion about work is bound to have an
impact on many aspects of an employee‘s life. It is closely associated with initiatives
to influence the job structure, social environment or attitude towards work in order
to establish a better person-job fit. Various studies reveal that high levels of work
engagement are associated with high levels of performance, organizational
commitment and individual wellbeing (Christian et al.,2011; Hakanen & Schaufeli,
2012; Soane 2013). Hence, there is a need for a deeper analysis of work engagement
in relation with other aspects of work life.
6.1 RELATIONSHIP BETWEEN WORK ENGAGEMENT AND JOB
CRAFTING
Employees working in present-day organizations are likely to have at least
some opportunity to modify and craft their jobs (Oldham & Hackman, 2010). Job
crafting is a bottom-up approach, with employees taking initiative to align work
with their personal preferences and abilities (Tims & Bakker, 2010). According to
Wrzesniewski and Dutton (2001), job crafting complements the customary focus on
P a g e | 135
top-down job redesign techniques. It permits employees to modify the meaning of
their work or their work identity by proactively changing the social work
environment or characteristics of the job. Job crafting includes modification in what
one does in the form of job, one‘s approach towards work or manner of interaction
with others (Tims et. al, 2013). According to Berg et. al (2010) and Lyons (2008)
employees are proactive to craft certain job characteristics for a better person-job fit.
As per the objectives of the current study, relationship between job crafting as an
independent variable and work engagement as a dependent variable was
investigated. A twelve item scale based on Job Crafting Scale developed by Tims et
al. (2012) was used to measure job crafting initiatives on a seven point Likert scale
ranging from 0 indicating ‗never‘ to 6 indicating ‗always or everyday‘. Descriptive
statistics of response on the job crafting scale were computed. Exploratory Factor
Analysis was done to identify the factors constituting job crafting. Scale reliability
was assessed by calculating Cronbach‘s alpha coefficient. Correlation analysis was
done to study whether there is an associative relationship between job crafting as an
independent variable and work engagement as a dependent variable. The direction of
association was investigated through hierarchical multiple regression analysis.
Table 6.1 shows the descriptive statistics. The highest mean response, 5 and
above, was on aspects like ‗I try to learn new things at work‘ and ‗I make sure that I
use my capacities to the maximum‘ On the other hand relatively lower mean
response, between 3 to less than 4, was on aspects like ‗I ask whether my supervisor
is satisfied with my work‘; ‗I ask others for feedback on my job performance‘ and ‗I
approach my supervisor for inspiration, coaching and advice‘. It implies that faculty
members make relatively less frequent efforts to seek feedback and suggestions
from their supervisors or colleagues for enhancing performance. On all other aspects
namely taking initiative in new projects, updating with new developments, starting
new projects and self development efforts, the response was moderate, between 4
to 5.
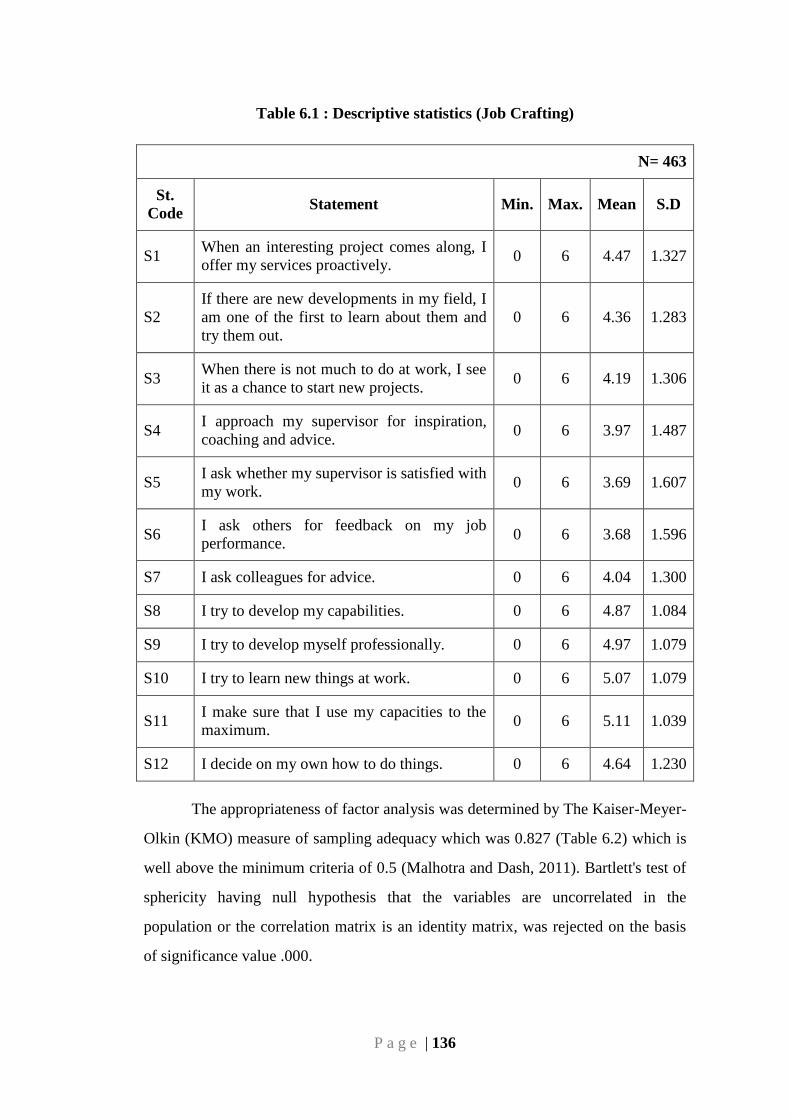
P a g e | 136
Table 6.1 : Descriptive statistics (Job Crafting)
N= 463
St.
Code Statement Min. Max. Mean S.D
S1 When an interesting project comes along, I
offer my services proactively. 0 6 4.47 1.327
S2
If there are new developments in my field, I
am one of the first to learn about them and
try them out.
0 6 4.36 1.283
S3 When there is not much to do at work, I see
it as a chance to start new projects. 0 6 4.19 1.306
S4 I approach my supervisor for inspiration,
coaching and advice. 0 6 3.97 1.487
S5 I ask whether my supervisor is satisfied with
my work. 0 6 3.69 1.607
S6 I ask others for feedback on my job
performance. 0 6 3.68 1.596
S7 I ask colleagues for advice. 0 6 4.04 1.300
S8 I try to develop my capabilities. 0 6 4.87 1.084
S9 I try to develop myself professionally. 0 6 4.97 1.079
S10 I try to learn new things at work. 0 6 5.07 1.079
S11 I make sure that I use my capacities to the
maximum. 0 6 5.11 1.039
S12 I decide on my own how to do things. 0 6 4.64 1.230
The appropriateness of factor analysis was determined by The Kaiser-Meyer-
Olkin (KMO) measure of sampling adequacy which was 0.827 (Table 6.2) which is
well above the minimum criteria of 0.5 (Malhotra and Dash, 2011). Bartlett's test of
sphericity having null hypothesis that the variables are uncorrelated in the
population or the correlation matrix is an identity matrix, was rejected on the basis
of significance value .000.
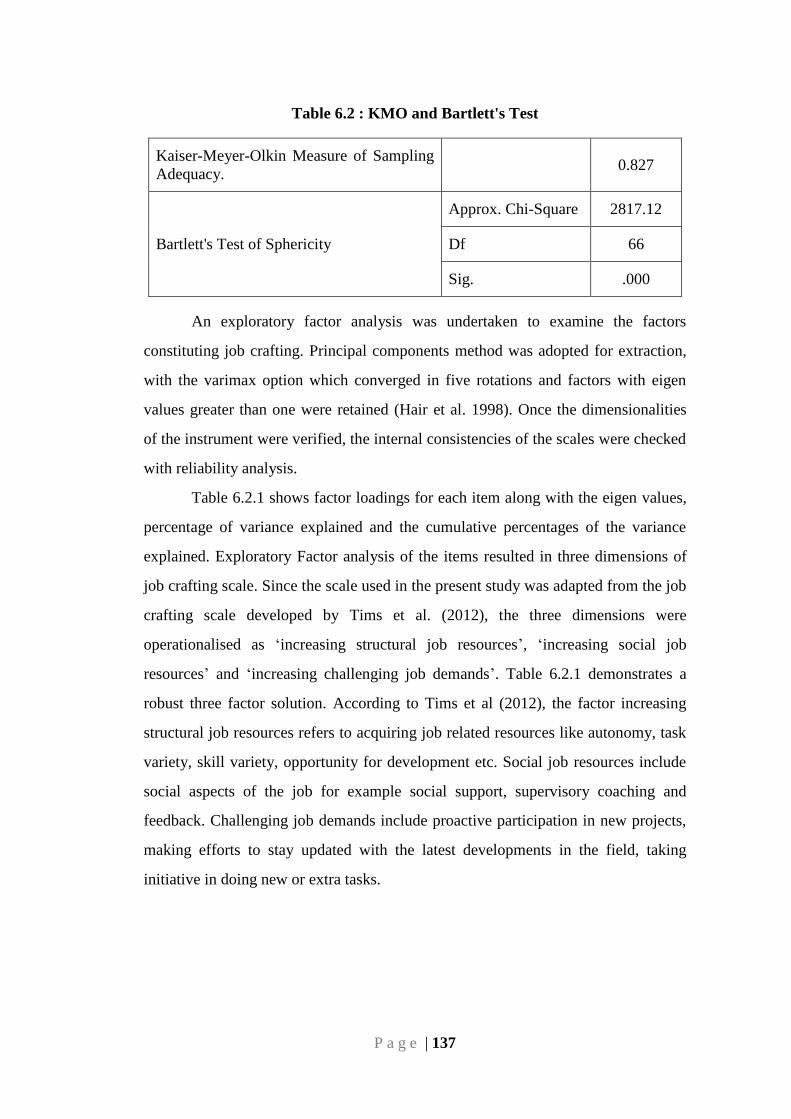
P a g e | 137
Table 6.2 : KMO and Bartlett's Test
Kaiser-Meyer-Olkin Measure of Sampling
Adequacy.
0.827
Bartlett's Test of Sphericity
Approx. Chi-Square 2817.12
Df 66
Sig. .000
An exploratory factor analysis was undertaken to examine the factors
constituting job crafting. Principal components method was adopted for extraction,
with the varimax option which converged in five rotations and factors with eigen
values greater than one were retained (Hair et al. 1998). Once the dimensionalities
of the instrument were verified, the internal consistencies of the scales were checked
with reliability analysis.
Table 6.2.1 shows factor loadings for each item along with the eigen values,
percentage of variance explained and the cumulative percentages of the variance
explained. Exploratory Factor analysis of the items resulted in three dimensions of
job crafting scale. Since the scale used in the present study was adapted from the job
crafting scale developed by Tims et al. (2012), the three dimensions were
operationalised as ‗increasing structural job resources‘, ‗increasing social job
resources‘ and ‗increasing challenging job demands‘. Table 6.2.1 demonstrates a
robust three factor solution. According to Tims et al (2012), the factor increasing
structural job resources refers to acquiring job related resources like autonomy, task
variety, skill variety, opportunity for development etc. Social job resources include
social aspects of the job for example social support, supervisory coaching and
feedback. Challenging job demands include proactive participation in new projects,
making efforts to stay updated with the latest developments in the field, taking
initiative in doing new or extra tasks.
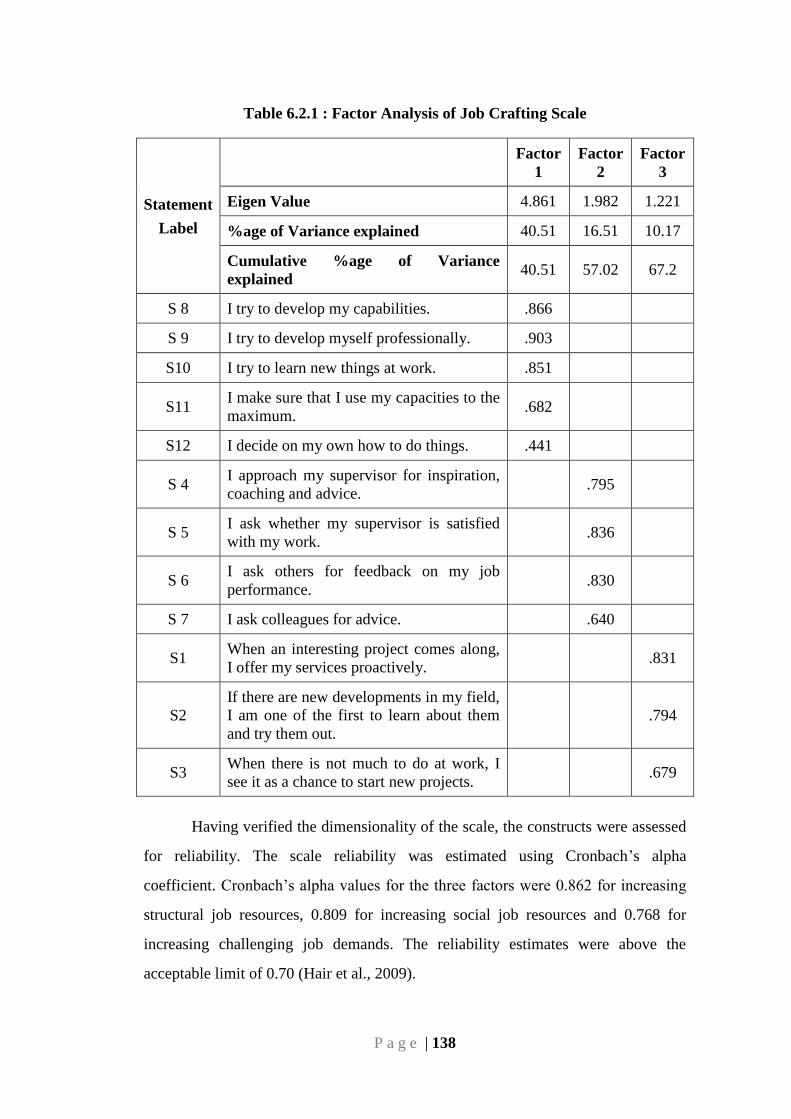
P a g e | 138
Table 6.2.1 : Factor Analysis of Job Crafting Scale
Statement
Label
Factor
1
Factor
2
Factor
3
Eigen Value 4.861 1.982 1.221
%age of Variance explained 40.51 16.51 10.17
Cumulative %age of Variance
explained 40.51 57.02 67.2
S 8 I try to develop my capabilities. .866
S 9 I try to develop myself professionally. .903
S10 I try to learn new things at work. .851
S11 I make sure that I use my capacities to the
maximum. .682
S12 I decide on my own how to do things. .441
S 4 I approach my supervisor for inspiration,
coaching and advice. .795
S 5 I ask whether my supervisor is satisfied
with my work. .836
S 6 I ask others for feedback on my job
performance. .830
S 7 I ask colleagues for advice. .640
S1 When an interesting project comes along,
I offer my services proactively. .831
S2
If there are new developments in my field,
I am one of the first to learn about them
and try them out.
.794
S3 When there is not much to do at work, I
see it as a chance to start new projects. .679
Having verified the dimensionality of the scale, the constructs were assessed
for reliability. The scale reliability was estimated using Cronbach‘s alpha
coefficient. Cronbach‘s alpha values for the three factors were 0.862 for increasing
structural job resources, 0.809 for increasing social job resources and 0.768 for
increasing challenging job demands. The reliability estimates were above the
acceptable limit of 0.70 (Hair et al., 2009).
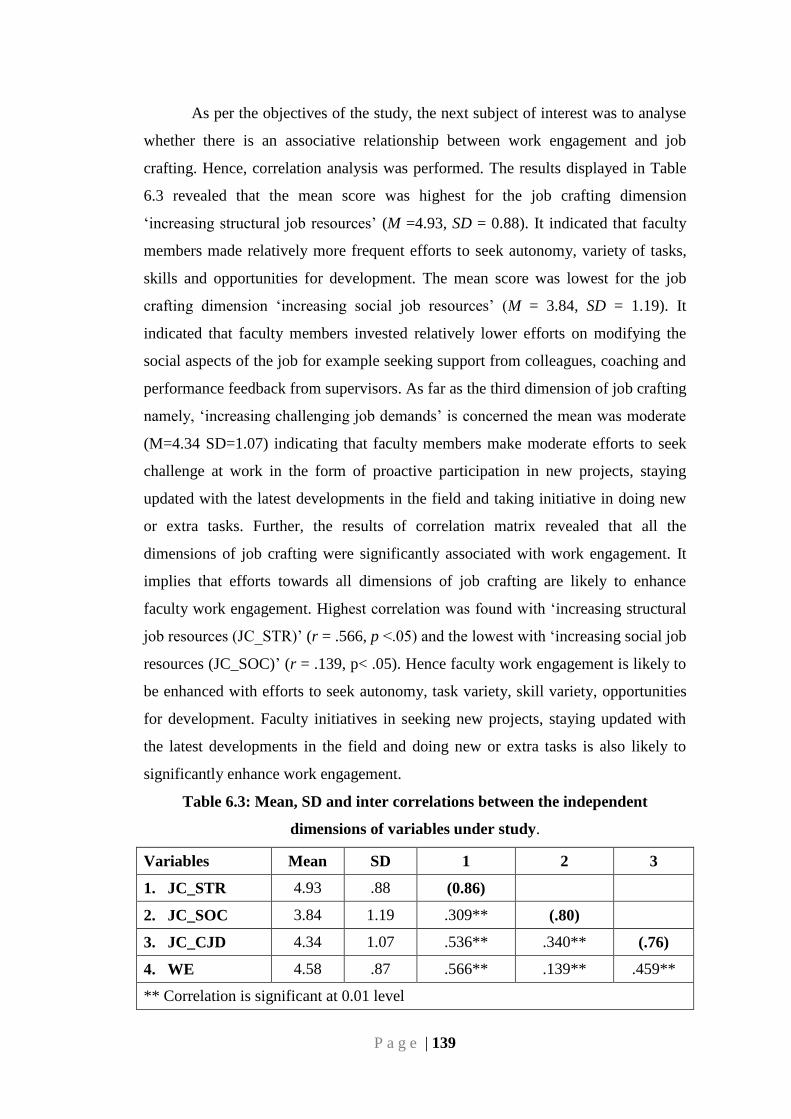
P a g e | 139
As per the objectives of the study, the next subject of interest was to analyse
whether there is an associative relationship between work engagement and job
crafting. Hence, correlation analysis was performed. The results displayed in Table
6.3 revealed that the mean score was highest for the job crafting dimension
‗increasing structural job resources‘ (M =4.93, SD = 0.88). It indicated that faculty
members made relatively more frequent efforts to seek autonomy, variety of tasks,
skills and opportunities for development. The mean score was lowest for the job
crafting dimension ‗increasing social job resources‘ (M = 3.84, SD = 1.19). It
indicated that faculty members invested relatively lower efforts on modifying the
social aspects of the job for example seeking support from colleagues, coaching and
performance feedback from supervisors. As far as the third dimension of job crafting
namely, ‗increasing challenging job demands‘ is concerned the mean was moderate
(M=4.34 SD=1.07) indicating that faculty members make moderate efforts to seek
challenge at work in the form of proactive participation in new projects, staying
updated with the latest developments in the field and taking initiative in doing new
or extra tasks. Further, the results of correlation matrix revealed that all the
dimensions of job crafting were significantly associated with work engagement. It
implies that efforts towards all dimensions of job crafting are likely to enhance
faculty work engagement. Highest correlation was found with ‗increasing structural
job resources (JC_STR)‘ (r = .566, p <.05) and the lowest with ‗increasing social job
resources (JC_SOC)‘ (r = .139, p< .05). Hence faculty work engagement is likely to
be enhanced with efforts to seek autonomy, task variety, skill variety, opportunities
for development. Faculty initiatives in seeking new projects, staying updated with
the latest developments in the field and doing new or extra tasks is also likely to
significantly enhance work engagement.
Table 6.3: Mean, SD and inter correlations between the independent
dimensions of variables under study.
Variables Mean SD 1 2 3
1. JC_STR 4.93 .88 (0.86)
2. JC_SOC 3.84 1.19 .309** (.80)
3. JC_CJD 4.34 1.07 .536** .340** (.76)
4. WE 4.58 .87 .566** .139** .459**
** Correlation is significant at 0.01 level
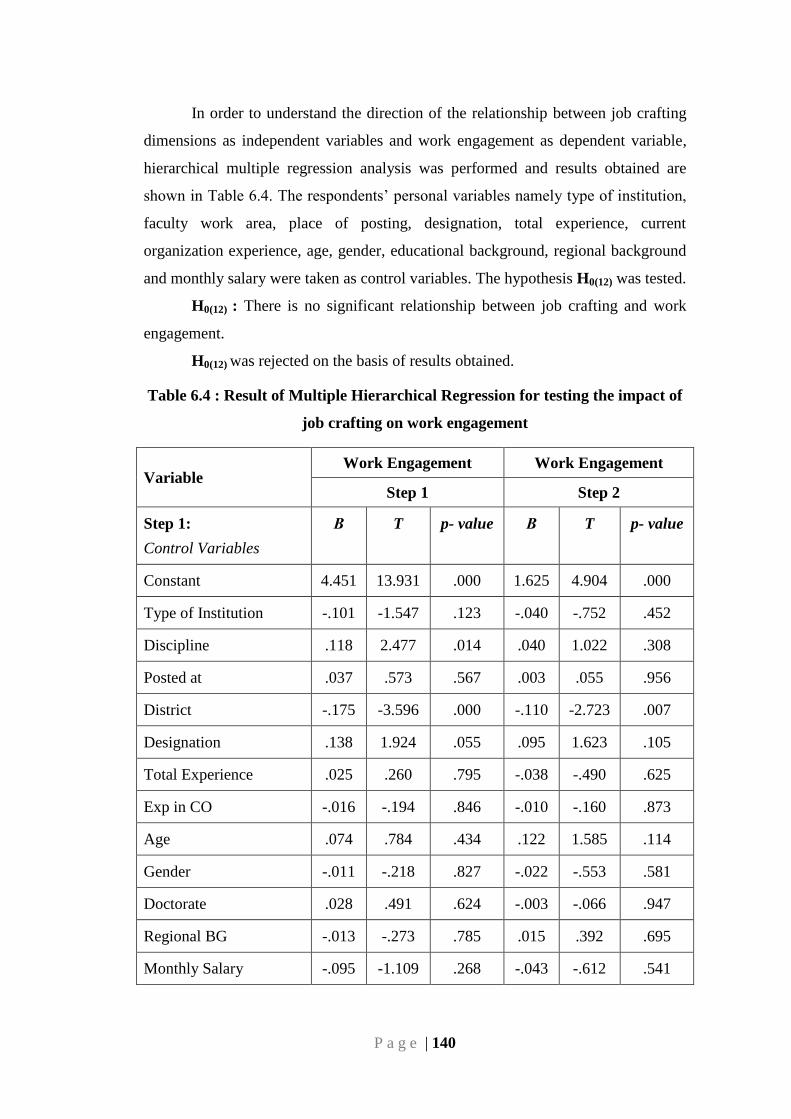
P a g e | 140
In order to understand the direction of the relationship between job crafting
dimensions as independent variables and work engagement as dependent variable,
hierarchical multiple regression analysis was performed and results obtained are
shown in Table 6.4. The respondents‘ personal variables namely type of institution,
faculty work area, place of posting, designation, total experience, current
organization experience, age, gender, educational background, regional background
and monthly salary were taken as control variables. The hypothesis H0(12) was tested.
H0(12) : There is no significant relationship between job crafting and work
engagement.
H0(12) was rejected on the basis of results obtained.
Table 6.4 : Result of Multiple Hierarchical Regression for testing the impact of
job crafting on work engagement
Variable Work Engagement Work Engagement
Step 1 Step 2
Step 1:
Control Variables
Β T p- value Β T p- value
Constant 4.451 13.931 .000 1.625 4.904 .000
Type of Institution -.101 -1.547 .123 -.040 -.752 .452
Discipline .118 2.477 .014 .040 1.022 .308
Posted at .037 .573 .567 .003 .055 .956
District -.175 -3.596 .000 -.110 -2.723 .007
Designation .138 1.924 .055 .095 1.623 .105
Total Experience .025 .260 .795 -.038 -.490 .625
Exp in CO -.016 -.194 .846 -.010 -.160 .873
Age .074 .784 .434 .122 1.585 .114
Gender -.011 -.218 .827 -.022 -.553 .581
Doctorate .028 .491 .624 -.003 -.066 .947
Regional BG -.013 -.273 .785 .015 .392 .695
Monthly Salary -.095 -1.109 .268 -.043 -.612 .541
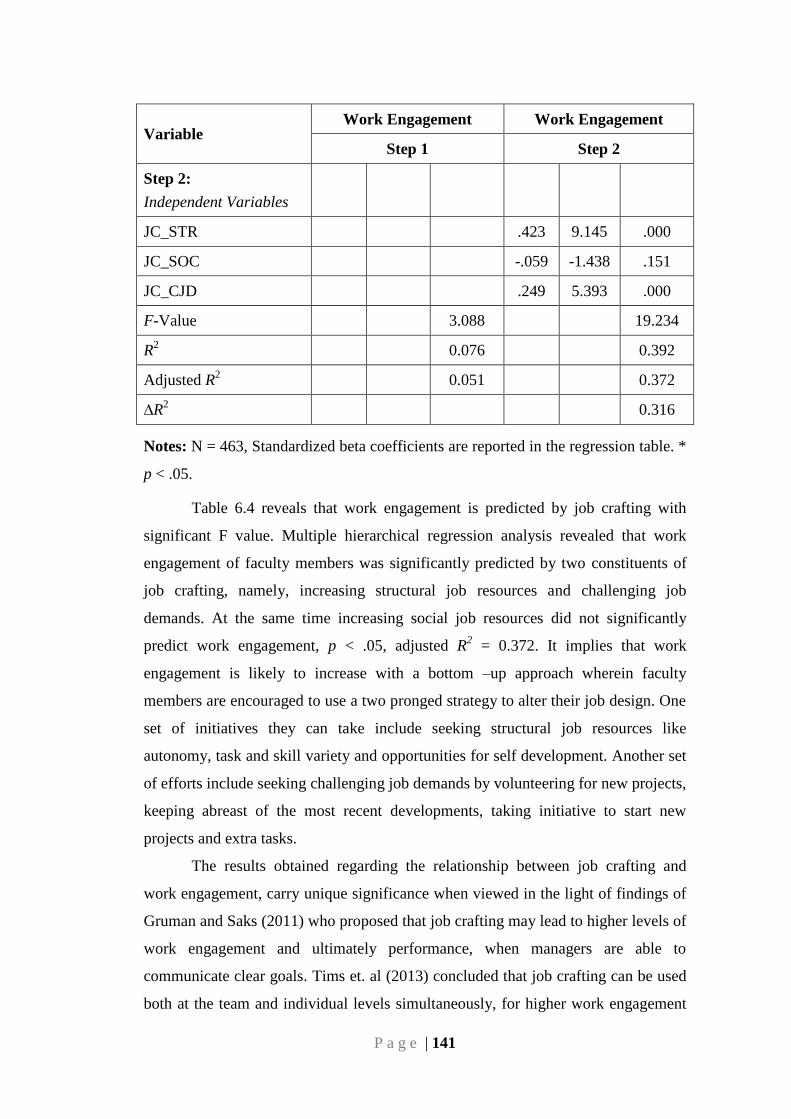
P a g e | 141
Variable Work Engagement Work Engagement
Step 1 Step 2
Step 2:
Independent Variables
JC_STR .423 9.145 .000
JC_SOC -.059 -1.438 .151
JC_CJD .249 5.393 .000
F-Value 3.088 19.234
R2 0.076 0.392
Adjusted R2 0.051 0.372
∆R2 0.316
Notes: N = 463, Standardized beta coefficients are reported in the regression table. *
p < .05.
Table 6.4 reveals that work engagement is predicted by job crafting with
significant F value. Multiple hierarchical regression analysis revealed that work
engagement of faculty members was significantly predicted by two constituents of
job crafting, namely, increasing structural job resources and challenging job
demands. At the same time increasing social job resources did not significantly
predict work engagement, p < .05, adjusted R2 = 0.372. It implies that work
engagement is likely to increase with a bottom –up approach wherein faculty
members are encouraged to use a two pronged strategy to alter their job design. One
set of initiatives they can take include seeking structural job resources like
autonomy, task and skill variety and opportunities for self development. Another set
of efforts include seeking challenging job demands by volunteering for new projects,
keeping abreast of the most recent developments, taking initiative to start new
projects and extra tasks.
The results obtained regarding the relationship between job crafting and
work engagement, carry unique significance when viewed in the light of findings of
Gruman and Saks (2011) who proposed that job crafting may lead to higher levels of
work engagement and ultimately performance, when managers are able to
communicate clear goals. Tims et. al (2013) concluded that job crafting can be used
both at the team and individual levels simultaneously, for higher work engagement
P a g e | 142
and performance. In the light of previous research, the results of the current study
have important implications for HR policy design. Work engagement of faculty
members is likely to increase if they are given opportunities to craft their jobs by
increasing structural job resources like having the autonomy to design the
curriculum, opting for a desired blend of teaching, research and administrative
responsibilities and choosing the required faculty development programs. Work
engagement will also be enhanced when faculty members opt for challenging job
demands like introducing new courses in the curriculum, adopting innovative
teaching methods for example a blend of class room teaching with online education,
experimenting with novel methods of evaluation for example open book exams and
many more. Such job crafting initiatives are likely to enhance faculty work
engagement, substantially.
6.2 RELATIONSHIP BETWEEN WORK ENGAGEMENT AND WORK
LIFE BALANCE
The term ―time bind‖ was coined by Hochschild (1997) to describe a number
of situations in which workers prefer dividing their time between work and personal
life in a manner which is different from the current state but find it difficult to do so
or are unable to do so. Tausig and Fenwick (2001) suggested that time bind can be
understood as a perceived imbalance between work and family/personal life. The
opposite of a time bind is a sense of work-life balance. As per the objectives of the
current study, relationship between work life balance as an independent variable and
work engagement as a dependent variable was investigated. Work-life balance was
measured with the 15 item work-life balance scale developed by Hayman (2005).
Response was sought on a seven point Likert scale ranging from 0 indicating never
to 6 indicating always or everyday. Descriptive statistics of response on the work
life balance scale were computed. Exploratory Factor Analysis was done to identify
the factors constituting work life balance. Scale reliability was assessed by
calculating Cronbach‘s alpha coefficient. Correlation analysis was done to study
whether there is an associate relationship between work life balance as an
independent variable and work engagement as a dependent variable. The direction of
association was investigated through hierarchical multiple regression analysis.
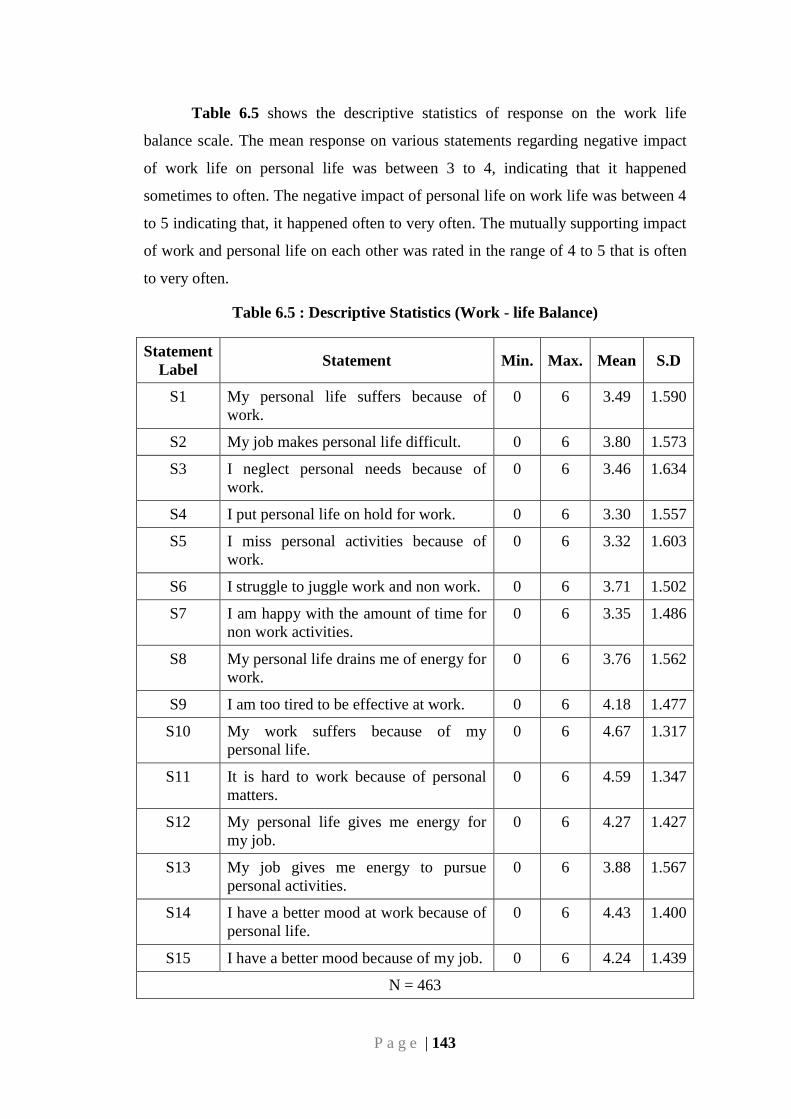
P a g e | 143
Table 6.5 shows the descriptive statistics of response on the work life
balance scale. The mean response on various statements regarding negative impact
of work life on personal life was between 3 to 4, indicating that it happened
sometimes to often. The negative impact of personal life on work life was between 4
to 5 indicating that, it happened often to very often. The mutually supporting impact
of work and personal life on each other was rated in the range of 4 to 5 that is often
to very often.
Table 6.5 : Descriptive Statistics (Work - life Balance)
Statement
Label Statement Min. Max. Mean S.D
S1 My personal life suffers because of
work.
0 6 3.49 1.590
S2 My job makes personal life difficult. 0 6 3.80 1.573
S3 I neglect personal needs because of
work.
0 6 3.46 1.634
S4 I put personal life on hold for work. 0 6 3.30 1.557
S5 I miss personal activities because of
work.
0 6 3.32 1.603
S6 I struggle to juggle work and non work. 0 6 3.71 1.502
S7 I am happy with the amount of time for
non work activities.
0 6 3.35 1.486
S8 My personal life drains me of energy for
work.
0 6 3.76 1.562
S9 I am too tired to be effective at work. 0 6 4.18 1.477
S10 My work suffers because of my
personal life.
0 6 4.67 1.317
S11 It is hard to work because of personal
matters.
0 6 4.59 1.347
S12 My personal life gives me energy for
my job.
0 6 4.27 1.427
S13 My job gives me energy to pursue
personal activities.
0 6 3.88 1.567
S14 I have a better mood at work because of
personal life.
0 6 4.43 1.400
S15 I have a better mood because of my job. 0 6 4.24 1.439
N = 463
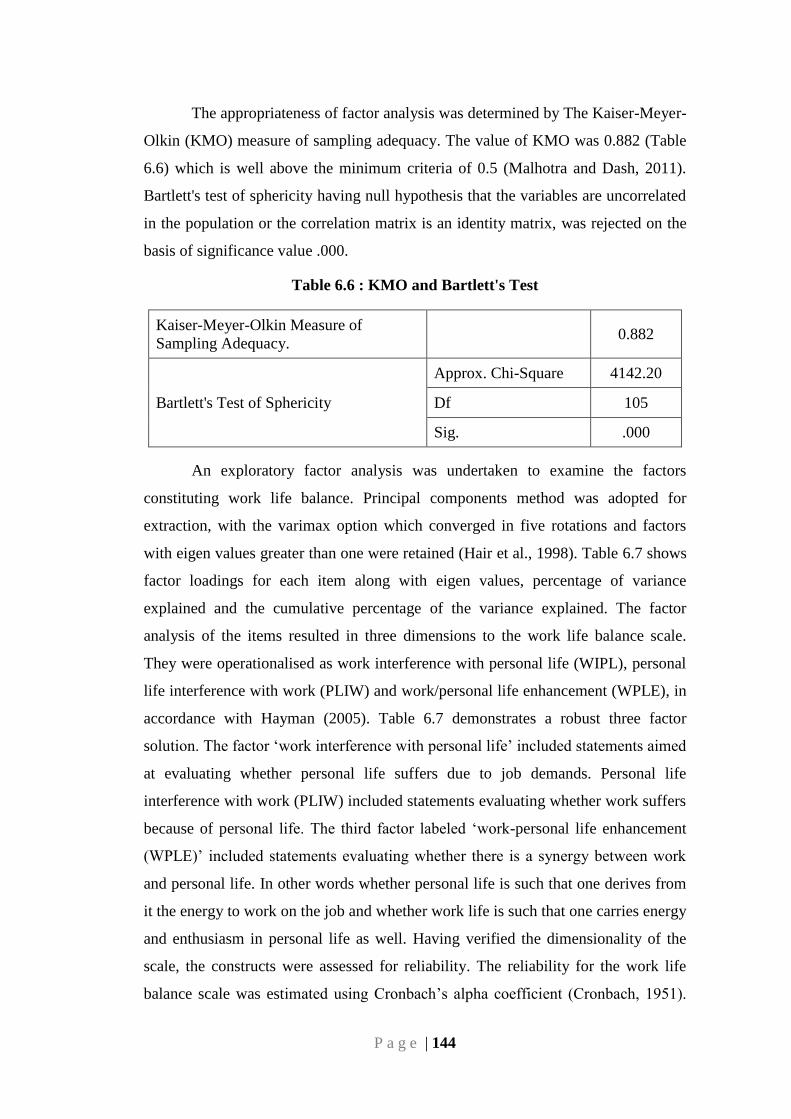
P a g e | 144
The appropriateness of factor analysis was determined by The Kaiser-Meyer-
Olkin (KMO) measure of sampling adequacy. The value of KMO was 0.882 (Table
6.6) which is well above the minimum criteria of 0.5 (Malhotra and Dash, 2011).
Bartlett's test of sphericity having null hypothesis that the variables are uncorrelated
in the population or the correlation matrix is an identity matrix, was rejected on the
basis of significance value .000.
Table 6.6 : KMO and Bartlett's Test
Kaiser-Meyer-Olkin Measure of
Sampling Adequacy.
0.882
Bartlett's Test of Sphericity
Approx. Chi-Square 4142.20
Df 105
Sig. .000
An exploratory factor analysis was undertaken to examine the factors
constituting work life balance. Principal components method was adopted for
extraction, with the varimax option which converged in five rotations and factors
with eigen values greater than one were retained (Hair et al., 1998). Table 6.7 shows
factor loadings for each item along with eigen values, percentage of variance
explained and the cumulative percentage of the variance explained. The factor
analysis of the items resulted in three dimensions to the work life balance scale.
They were operationalised as work interference with personal life (WIPL), personal
life interference with work (PLIW) and work/personal life enhancement (WPLE), in
accordance with Hayman (2005). Table 6.7 demonstrates a robust three factor
solution. The factor ‗work interference with personal life‘ included statements aimed
at evaluating whether personal life suffers due to job demands. Personal life
interference with work (PLIW) included statements evaluating whether work suffers
because of personal life. The third factor labeled ‗work-personal life enhancement
(WPLE)‘ included statements evaluating whether there is a synergy between work
and personal life. In other words whether personal life is such that one derives from
it the energy to work on the job and whether work life is such that one carries energy
and enthusiasm in personal life as well. Having verified the dimensionality of the
scale, the constructs were assessed for reliability. The reliability for the work life
balance scale was estimated using Cronbach‘s alpha coefficient (Cronbach, 1951).
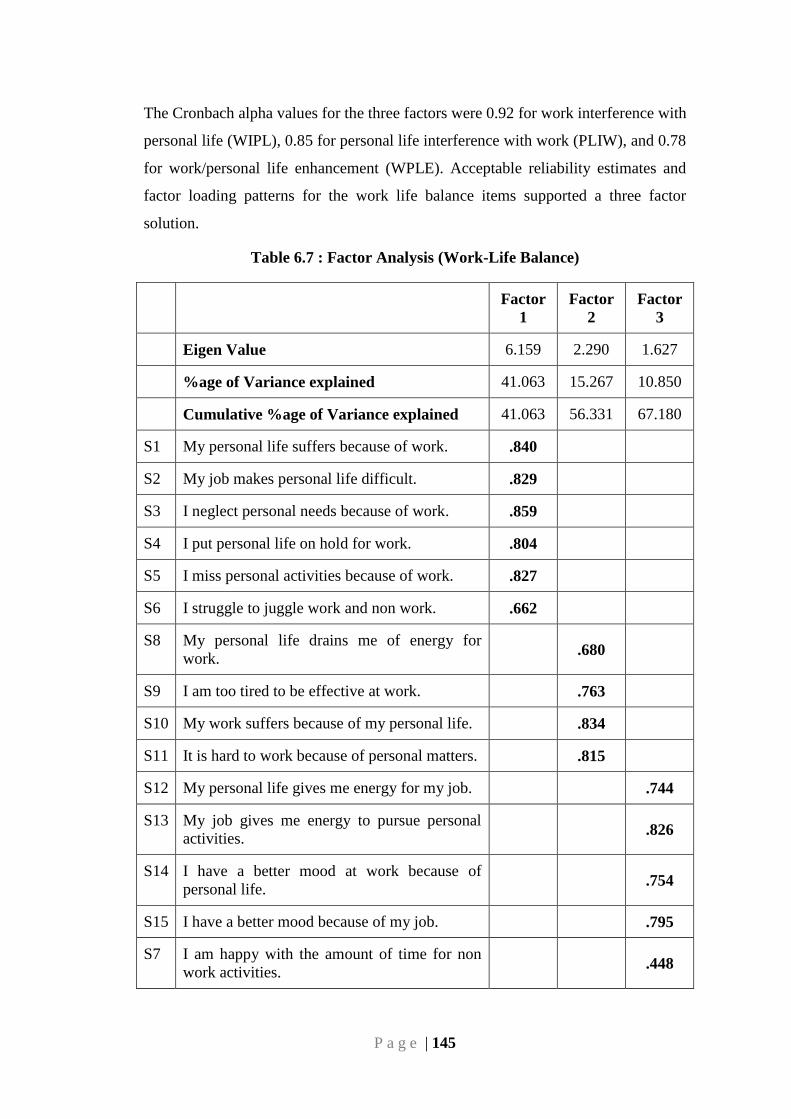
P a g e | 145
The Cronbach alpha values for the three factors were 0.92 for work interference with
personal life (WIPL), 0.85 for personal life interference with work (PLIW), and 0.78
for work/personal life enhancement (WPLE). Acceptable reliability estimates and
factor loading patterns for the work life balance items supported a three factor
solution.
Table 6.7 : Factor Analysis (Work-Life Balance)
Factor
1
Factor
2
Factor
3
Eigen Value 6.159 2.290 1.627
%age of Variance explained 41.063 15.267 10.850
Cumulative %age of Variance explained 41.063 56.331 67.180
S1 My personal life suffers because of work. .840
S2 My job makes personal life difficult. .829
S3 I neglect personal needs because of work. .859
S4 I put personal life on hold for work. .804
S5 I miss personal activities because of work. .827
S6 I struggle to juggle work and non work. .662
S8 My personal life drains me of energy for
work. .680
S9 I am too tired to be effective at work. .763
S10 My work suffers because of my personal life. .834
S11 It is hard to work because of personal matters. .815
S12 My personal life gives me energy for my job. .744
S13 My job gives me energy to pursue personal
activities. .826
S14 I have a better mood at work because of
personal life. .754
S15 I have a better mood because of my job. .795
S7 I am happy with the amount of time for non
work activities. .448
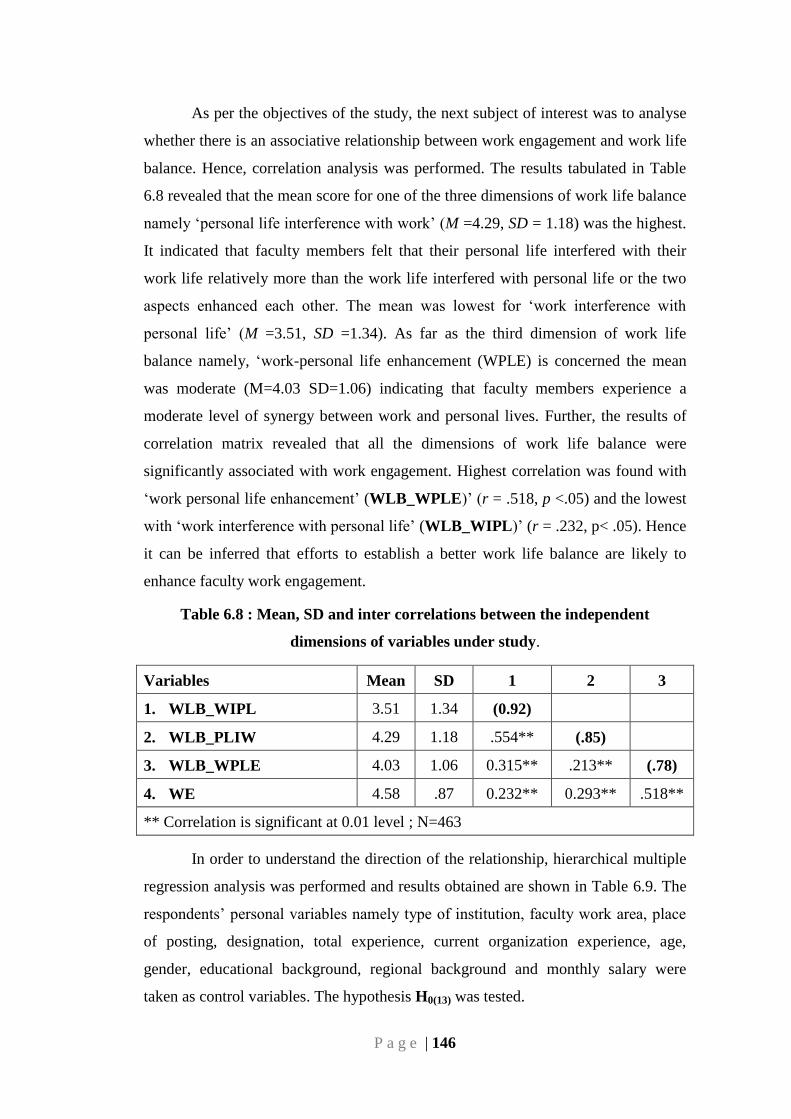
P a g e | 146
As per the objectives of the study, the next subject of interest was to analyse
whether there is an associative relationship between work engagement and work life
balance. Hence, correlation analysis was performed. The results tabulated in Table
6.8 revealed that the mean score for one of the three dimensions of work life balance
namely ‗personal life interference with work‘ (M =4.29, SD = 1.18) was the highest.
It indicated that faculty members felt that their personal life interfered with their
work life relatively more than the work life interfered with personal life or the two
aspects enhanced each other. The mean was lowest for ‗work interference with
personal life‘ (M =3.51, SD =1.34). As far as the third dimension of work life
balance namely, ‗work-personal life enhancement (WPLE) is concerned the mean
was moderate (M=4.03 SD=1.06) indicating that faculty members experience a
moderate level of synergy between work and personal lives. Further, the results of
correlation matrix revealed that all the dimensions of work life balance were
significantly associated with work engagement. Highest correlation was found with
‗work personal life enhancement‘ (WLB_WPLE)‘ (r = .518, p <.05) and the lowest
with ‗work interference with personal life‘ (WLB_WIPL)‘ (r = .232, p< .05). Hence
it can be inferred that efforts to establish a better work life balance are likely to
enhance faculty work engagement.
Table 6.8 : Mean, SD and inter correlations between the independent
dimensions of variables under study.
Variables Mean SD 1 2 3
1. WLB_WIPL 3.51 1.34 (0.92)
2. WLB_PLIW 4.29 1.18 .554** (.85)
3. WLB_WPLE 4.03 1.06 0.315** .213** (.78)
4. WE 4.58 .87 0.232** 0.293** .518**
** Correlation is significant at 0.01 level ; N=463
In order to understand the direction of the relationship, hierarchical multiple
regression analysis was performed and results obtained are shown in Table 6.9. The
respondents‘ personal variables namely type of institution, faculty work area, place
of posting, designation, total experience, current organization experience, age,
gender, educational background, regional background and monthly salary were
taken as control variables. The hypothesis H0(13) was tested.
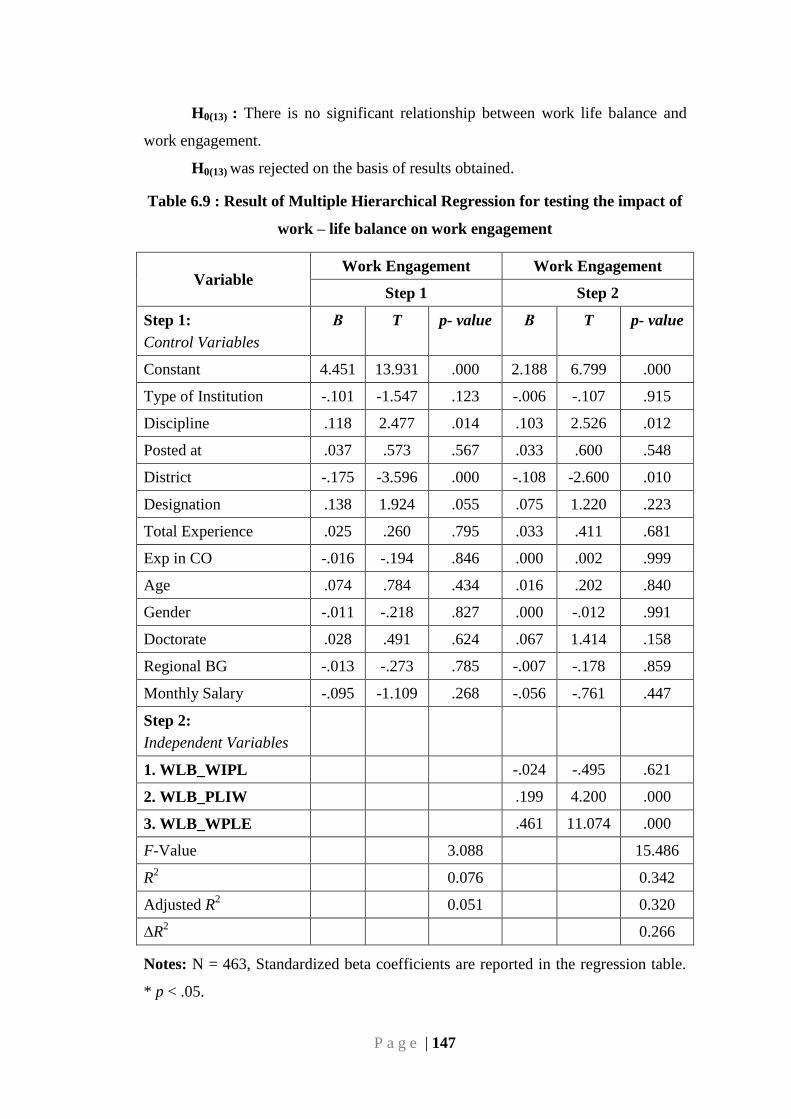
P a g e | 147
H0(13) : There is no significant relationship between work life balance and
work engagement.
H0(13) was rejected on the basis of results obtained.
Table 6.9 : Result of Multiple Hierarchical Regression for testing the impact of
work – life balance on work engagement
Variable Work Engagement Work Engagement
Step 1 Step 2
Step 1:
Control Variables
Β T p- value Β T p- value
Constant 4.451 13.931 .000 2.188 6.799 .000
Type of Institution -.101 -1.547 .123 -.006 -.107 .915
Discipline .118 2.477 .014 .103 2.526 .012
Posted at .037 .573 .567 .033 .600 .548
District -.175 -3.596 .000 -.108 -2.600 .010
Designation .138 1.924 .055 .075 1.220 .223
Total Experience .025 .260 .795 .033 .411 .681
Exp in CO -.016 -.194 .846 .000 .002 .999
Age .074 .784 .434 .016 .202 .840
Gender -.011 -.218 .827 .000 -.012 .991
Doctorate .028 .491 .624 .067 1.414 .158
Regional BG -.013 -.273 .785 -.007 -.178 .859
Monthly Salary -.095 -1.109 .268 -.056 -.761 .447
Step 2:
Independent Variables
1. WLB_WIPL -.024 -.495 .621
2. WLB_PLIW .199 4.200 .000
3. WLB_WPLE .461 11.074 .000
F-Value 3.088 15.486
R2 0.076 0.342
Adjusted R2 0.051 0.320
∆R2 0.266
Notes: N = 463, Standardized beta coefficients are reported in the regression table.
* p < .05.
P a g e | 148
Table 6.9 reveals that work engagement is significantly predicted by two
aspects of work – life balance (p<0.05) namely personal life interference with work
and work-personal life enhancement (WPLE). The results coincide with the findings
of Kim (2014) stating that when employees experience work-life balance it enhances
their affective commitment. Further, Albdour and Altarawneh (2014) proved that
affective commitment is positively associated with high job engagement and
organizational engagement. On the basis of the previous studies and the results of
the present study it can be said that HR policy initiatives to establish a mutually
enhancing relationship between work and personal life could have a significant
impact on work engagement. In this direction, giving, flexible work options can be
explored with the objective of better faculty work engagement. Flexible working
hours can be given wherein faculty members can choose their preferred timings
subject to meeting a prefixed number of hours. The option of telecommuting allows
the employees to work from home and stay in touch with the office with advanced
technological assistance for example video conferencing and webinars in case of
faculty members. Flexible benefits or cafeteria style benefit program allows
employees to choose from a range of benefit options that best suit their personal and
family needs, upto the value of a set allowance. The option of having a compressed
work week allows employees to work for longer hours on certain days and enjoy a
longer week end for example it allows the freedom to work ten hours a day for four
days instead of eight hours a day for five days. Another novel idea tried by some
organizations is the option of job sharing or twinning. Herein, two employees share
the job responsibilities in a full time job. Permission for availing career breaks for
self development can also be a highly sought after measure for better work life
balance and hence work engagement of faculty members.
6.3 RELATIONSHIP BETWEEN WORK ENGAGEMENT AND WORK
STRESS
As per the objectives of the current study, relationship between work stress
as an independent variable and work engagement as a dependent variable was
investigated. Work stress was measured using a self developed pretested scale
consisting of 18 items adapted from Organization Role Stress Scale developed by
Udai Pareek (1983). The response was sought on a 7 point Likert scale ranging
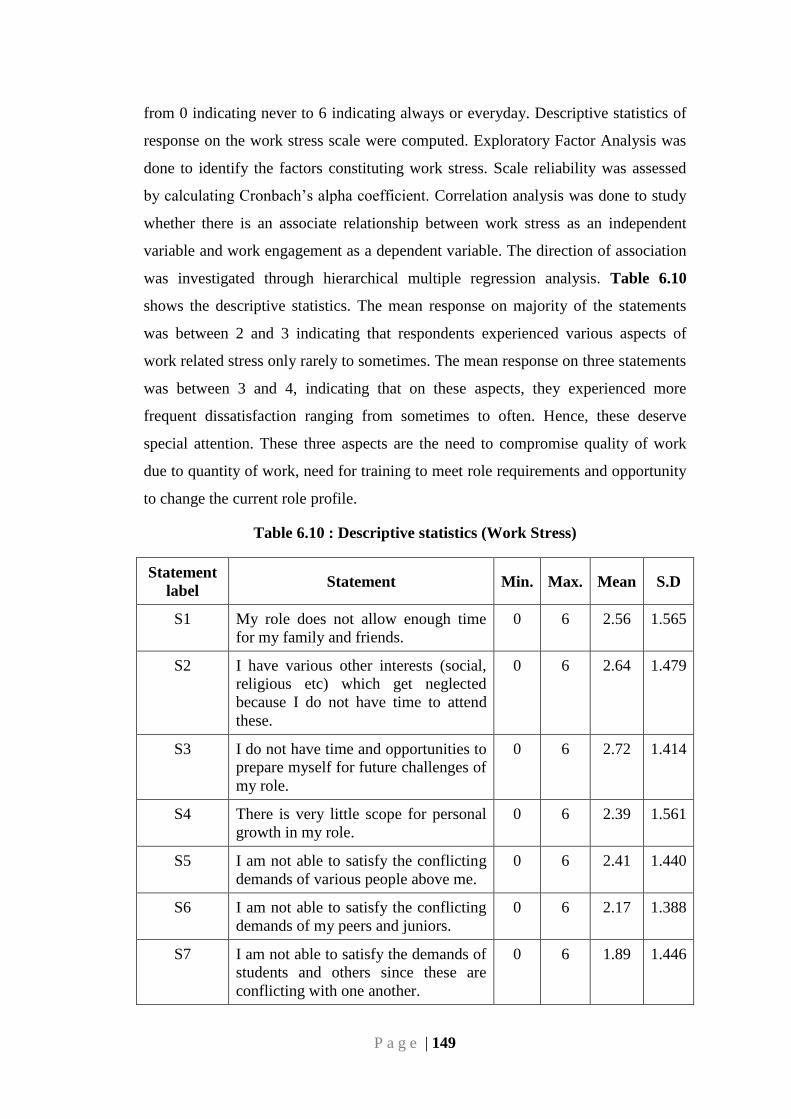
P a g e | 149
from 0 indicating never to 6 indicating always or everyday. Descriptive statistics of
response on the work stress scale were computed. Exploratory Factor Analysis was
done to identify the factors constituting work stress. Scale reliability was assessed
by calculating Cronbach‘s alpha coefficient. Correlation analysis was done to study
whether there is an associate relationship between work stress as an independent
variable and work engagement as a dependent variable. The direction of association
was investigated through hierarchical multiple regression analysis. Table 6.10
shows the descriptive statistics. The mean response on majority of the statements
was between 2 and 3 indicating that respondents experienced various aspects of
work related stress only rarely to sometimes. The mean response on three statements
was between 3 and 4, indicating that on these aspects, they experienced more
frequent dissatisfaction ranging from sometimes to often. Hence, these deserve
special attention. These three aspects are the need to compromise quality of work
due to quantity of work, need for training to meet role requirements and opportunity
to change the current role profile.
Table 6.10 : Descriptive statistics (Work Stress)
Statement
label Statement Min. Max. Mean S.D
S1 My role does not allow enough time
for my family and friends.
0 6 2.56 1.565
S2 I have various other interests (social,
religious etc) which get neglected
because I do not have time to attend
these.
0 6 2.64 1.479
S3 I do not have time and opportunities to
prepare myself for future challenges of
my role.
0 6 2.72 1.414
S4 There is very little scope for personal
growth in my role.
0 6 2.39 1.561
S5 I am not able to satisfy the conflicting
demands of various people above me.
0 6 2.41 1.440
S6 I am not able to satisfy the conflicting
demands of my peers and juniors.
0 6 2.17 1.388
S7 I am not able to satisfy the demands of
students and others since these are
conflicting with one another.
0 6 1.89 1.446
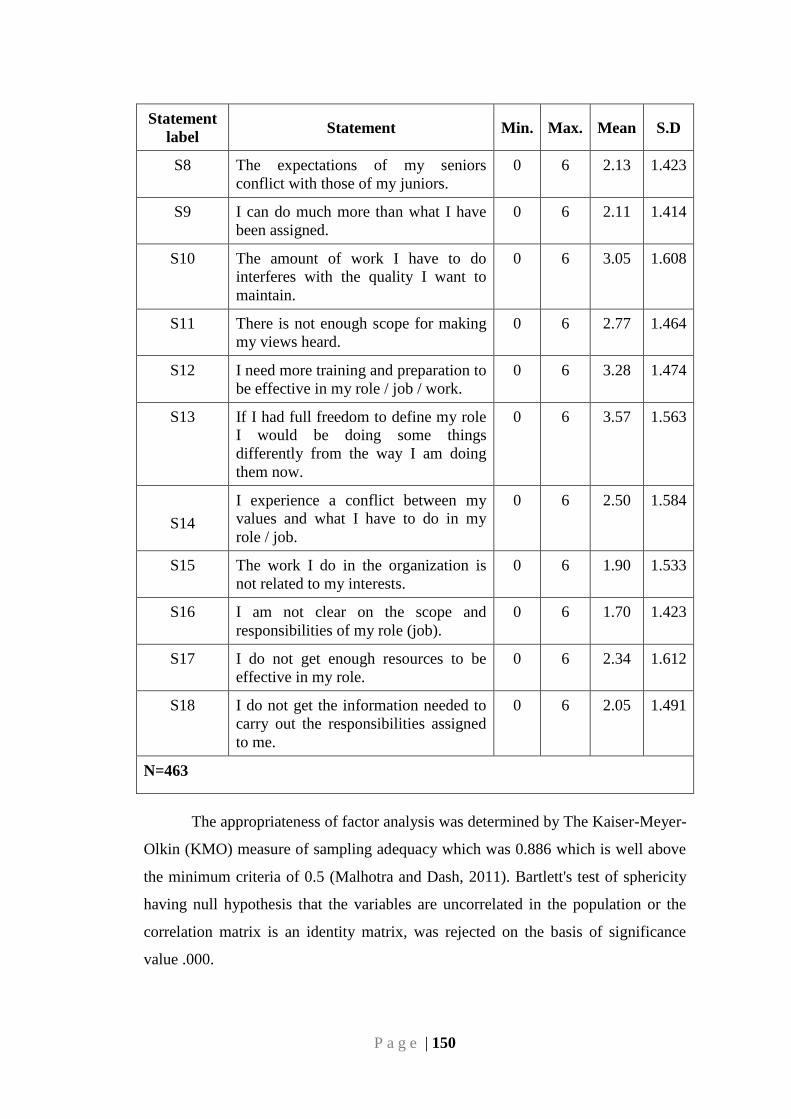
P a g e | 150
Statement
label Statement Min. Max. Mean S.D
S8 The expectations of my seniors
conflict with those of my juniors.
0 6 2.13 1.423
S9 I can do much more than what I have
been assigned.
0 6 2.11 1.414
S10 The amount of work I have to do
interferes with the quality I want to
maintain.
0 6 3.05 1.608
S11 There is not enough scope for making
my views heard.
0 6 2.77 1.464
S12 I need more training and preparation to
be effective in my role / job / work.
0 6 3.28 1.474
S13 If I had full freedom to define my role
I would be doing some things
differently from the way I am doing
them now.
0 6 3.57 1.563
S14
I experience a conflict between my
values and what I have to do in my
role / job.
0 6 2.50 1.584
S15 The work I do in the organization is
not related to my interests.
0 6 1.90 1.533
S16 I am not clear on the scope and
responsibilities of my role (job).
0 6 1.70 1.423
S17 I do not get enough resources to be
effective in my role.
0 6 2.34 1.612
S18 I do not get the information needed to
carry out the responsibilities assigned
to me.
0 6 2.05 1.491
N=463
The appropriateness of factor analysis was determined by The Kaiser-Meyer-
Olkin (KMO) measure of sampling adequacy which was 0.886 which is well above
the minimum criteria of 0.5 (Malhotra and Dash, 2011). Bartlett's test of sphericity
having null hypothesis that the variables are uncorrelated in the population or the
correlation matrix is an identity matrix, was rejected on the basis of significance
value .000.
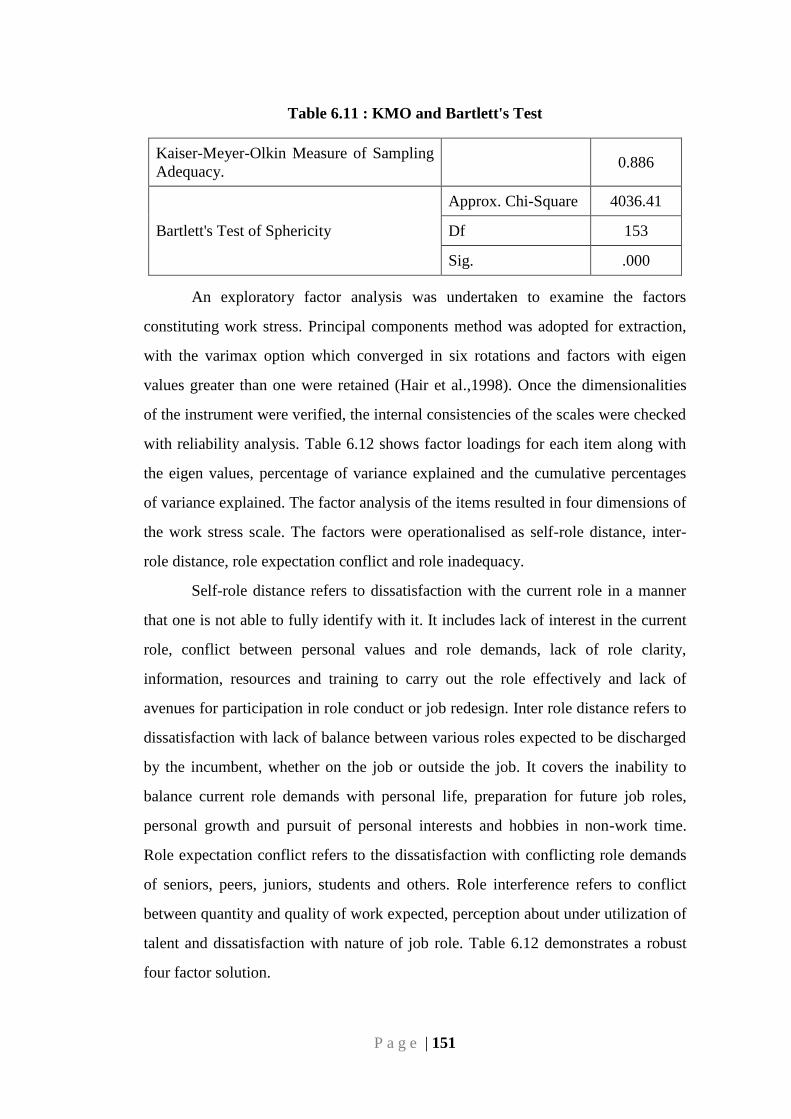
P a g e | 151
Table 6.11 : KMO and Bartlett's Test
Kaiser-Meyer-Olkin Measure of Sampling
Adequacy.
0.886
Bartlett's Test of Sphericity
Approx. Chi-Square 4036.41
Df 153
Sig. .000
An exploratory factor analysis was undertaken to examine the factors
constituting work stress. Principal components method was adopted for extraction,
with the varimax option which converged in six rotations and factors with eigen
values greater than one were retained (Hair et al.,1998). Once the dimensionalities
of the instrument were verified, the internal consistencies of the scales were checked
with reliability analysis. Table 6.12 shows factor loadings for each item along with
the eigen values, percentage of variance explained and the cumulative percentages
of variance explained. The factor analysis of the items resulted in four dimensions of
the work stress scale. The factors were operationalised as self-role distance, inter-
role distance, role expectation conflict and role inadequacy.
Self-role distance refers to dissatisfaction with the current role in a manner
that one is not able to fully identify with it. It includes lack of interest in the current
role, conflict between personal values and role demands, lack of role clarity,
information, resources and training to carry out the role effectively and lack of
avenues for participation in role conduct or job redesign. Inter role distance refers to
dissatisfaction with lack of balance between various roles expected to be discharged
by the incumbent, whether on the job or outside the job. It covers the inability to
balance current role demands with personal life, preparation for future job roles,
personal growth and pursuit of personal interests and hobbies in non-work time.
Role expectation conflict refers to the dissatisfaction with conflicting role demands
of seniors, peers, juniors, students and others. Role interference refers to conflict
between quantity and quality of work expected, perception about under utilization of
talent and dissatisfaction with nature of job role. Table 6.12 demonstrates a robust
four factor solution.
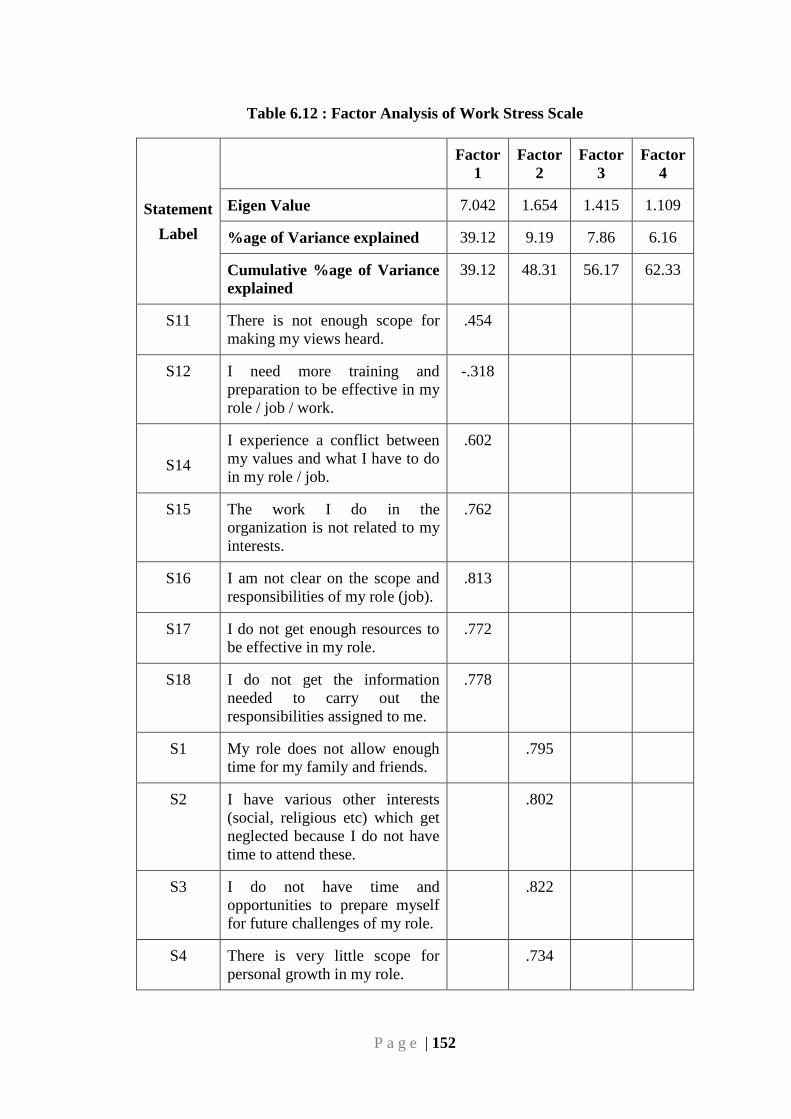
P a g e | 152
Table 6.12 : Factor Analysis of Work Stress Scale
Statement
Label
Factor
1
Factor
2
Factor
3
Factor
4
Eigen Value 7.042 1.654 1.415 1.109
%age of Variance explained 39.12 9.19 7.86 6.16
Cumulative %age of Variance
explained
39.12 48.31 56.17 62.33
S11 There is not enough scope for
making my views heard.
.454
S12 I need more training and
preparation to be effective in my
role / job / work.
-.318
S14
I experience a conflict between
my values and what I have to do
in my role / job.
.602
S15 The work I do in the
organization is not related to my
interests.
.762
S16 I am not clear on the scope and
responsibilities of my role (job).
.813
S17 I do not get enough resources to
be effective in my role.
.772
S18 I do not get the information
needed to carry out the
responsibilities assigned to me.
.778
S1 My role does not allow enough
time for my family and friends.
.795
S2 I have various other interests
(social, religious etc) which get
neglected because I do not have
time to attend these.
.802
S3 I do not have time and
opportunities to prepare myself
for future challenges of my role.
.822
S4 There is very little scope for
personal growth in my role.
.734
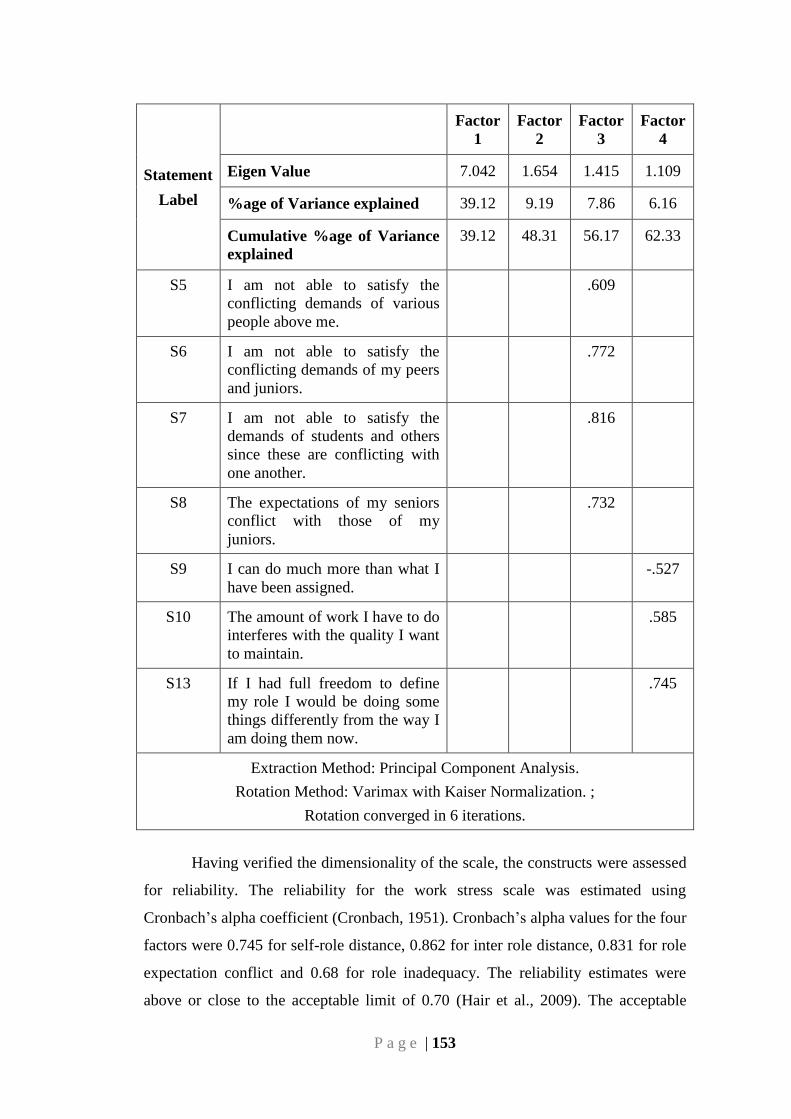
P a g e | 153
Statement
Label
Factor
1
Factor
2
Factor
3
Factor
4
Eigen Value 7.042 1.654 1.415 1.109
%age of Variance explained 39.12 9.19 7.86 6.16
Cumulative %age of Variance
explained
39.12 48.31 56.17 62.33
S5 I am not able to satisfy the
conflicting demands of various
people above me.
.609
S6 I am not able to satisfy the
conflicting demands of my peers
and juniors.
.772
S7 I am not able to satisfy the
demands of students and others
since these are conflicting with
one another.
.816
S8 The expectations of my seniors
conflict with those of my
juniors.
.732
S9 I can do much more than what I
have been assigned.
-.527
S10 The amount of work I have to do
interferes with the quality I want
to maintain.
.585
S13 If I had full freedom to define
my role I would be doing some
things differently from the way I
am doing them now.
.745
Extraction Method: Principal Component Analysis.
Rotation Method: Varimax with Kaiser Normalization. ;
Rotation converged in 6 iterations.
Having verified the dimensionality of the scale, the constructs were assessed
for reliability. The reliability for the work stress scale was estimated using
Cronbach‘s alpha coefficient (Cronbach, 1951). Cronbach‘s alpha values for the four
factors were 0.745 for self-role distance, 0.862 for inter role distance, 0.831 for role
expectation conflict and 0.68 for role inadequacy. The reliability estimates were
above or close to the acceptable limit of 0.70 (Hair et al., 2009). The acceptable
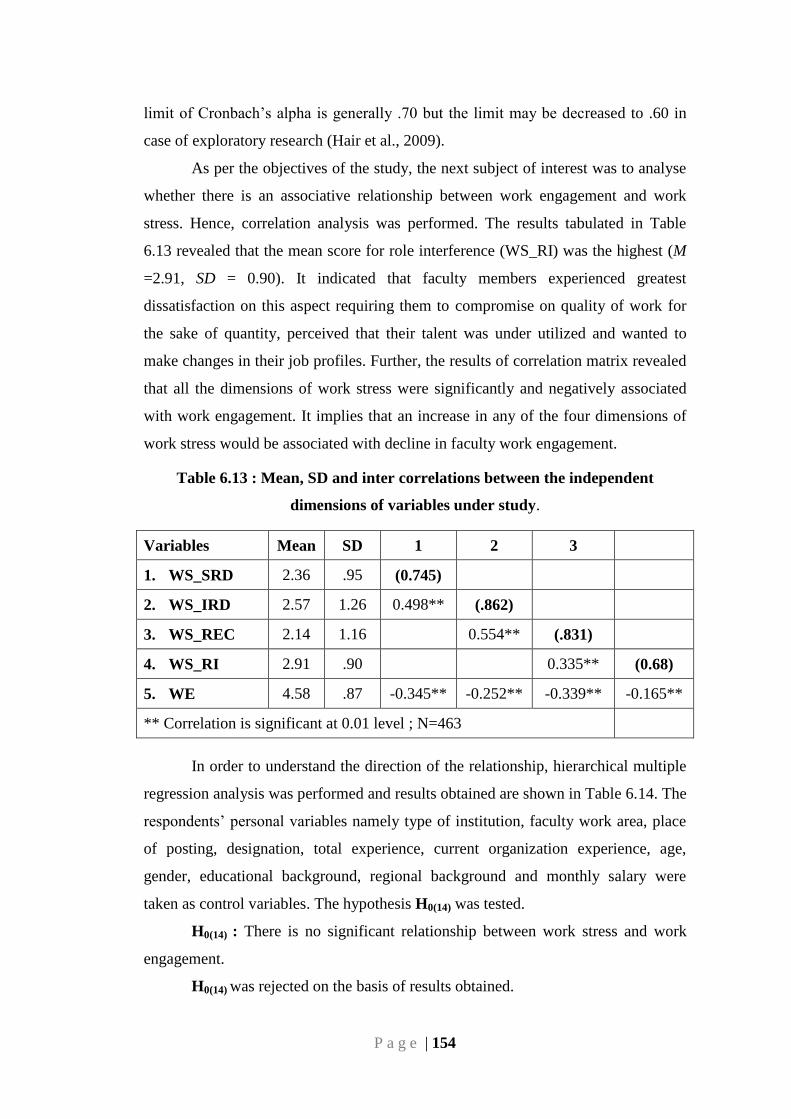
P a g e | 154
limit of Cronbach‘s alpha is generally .70 but the limit may be decreased to .60 in
case of exploratory research (Hair et al., 2009).
As per the objectives of the study, the next subject of interest was to analyse
whether there is an associative relationship between work engagement and work
stress. Hence, correlation analysis was performed. The results tabulated in Table
6.13 revealed that the mean score for role interference (WS_RI) was the highest (M
=2.91, SD = 0.90). It indicated that faculty members experienced greatest
dissatisfaction on this aspect requiring them to compromise on quality of work for
the sake of quantity, perceived that their talent was under utilized and wanted to
make changes in their job profiles. Further, the results of correlation matrix revealed
that all the dimensions of work stress were significantly and negatively associated
with work engagement. It implies that an increase in any of the four dimensions of
work stress would be associated with decline in faculty work engagement.
Table 6.13 : Mean, SD and inter correlations between the independent
dimensions of variables under study.
Variables Mean SD 1 2 3
1. WS_SRD 2.36 .95 (0.745)
2. WS_IRD 2.57 1.26 0.498** (.862)
3. WS_REC 2.14 1.16 0.554** (.831)
4. WS_RI 2.91 .90 0.335** (0.68)
5. WE 4.58 .87 -0.345** -0.252** -0.339** -0.165**
** Correlation is significant at 0.01 level ; N=463
In order to understand the direction of the relationship, hierarchical multiple
regression analysis was performed and results obtained are shown in Table 6.14. The
respondents‘ personal variables namely type of institution, faculty work area, place
of posting, designation, total experience, current organization experience, age,
gender, educational background, regional background and monthly salary were
taken as control variables. The hypothesis H0(14) was tested.
H0(14) : There is no significant relationship between work stress and work
engagement.
H0(14) was rejected on the basis of results obtained.
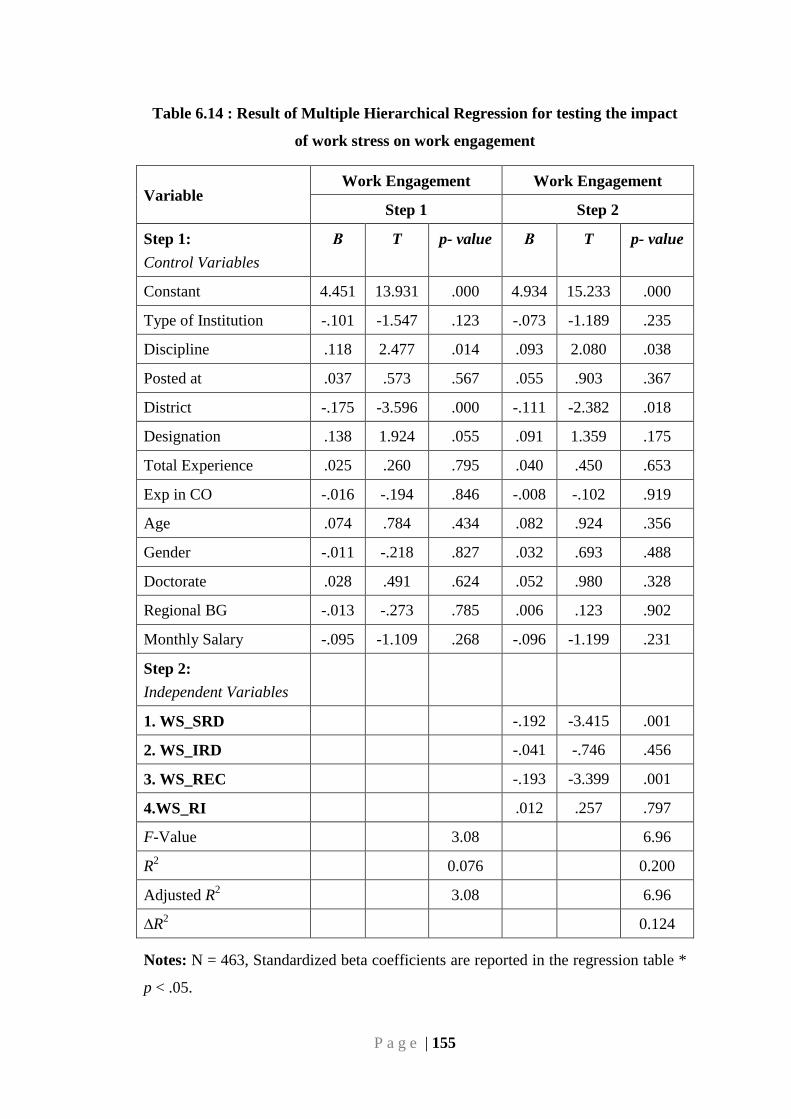
P a g e | 155
Table 6.14 : Result of Multiple Hierarchical Regression for testing the impact
of work stress on work engagement
Variable Work Engagement Work Engagement
Step 1 Step 2
Step 1:
Control Variables
Β T p- value Β T p- value
Constant 4.451 13.931 .000 4.934 15.233 .000
Type of Institution -.101 -1.547 .123 -.073 -1.189 .235
Discipline .118 2.477 .014 .093 2.080 .038
Posted at .037 .573 .567 .055 .903 .367
District -.175 -3.596 .000 -.111 -2.382 .018
Designation .138 1.924 .055 .091 1.359 .175
Total Experience .025 .260 .795 .040 .450 .653
Exp in CO -.016 -.194 .846 -.008 -.102 .919
Age .074 .784 .434 .082 .924 .356
Gender -.011 -.218 .827 .032 .693 .488
Doctorate .028 .491 .624 .052 .980 .328
Regional BG -.013 -.273 .785 .006 .123 .902
Monthly Salary -.095 -1.109 .268 -.096 -1.199 .231
Step 2:
Independent Variables
1. WS_SRD -.192 -3.415 .001
2. WS_IRD -.041 -.746 .456
3. WS_REC -.193 -3.399 .001
4.WS_RI .012 .257 .797
F-Value 3.08 6.96
R2 0.076 0.200
Adjusted R2 3.08 6.96
∆R2 0.124
Notes: N = 463, Standardized beta coefficients are reported in the regression table *
p < .05.
P a g e | 156
Table 6.14 reveals that work engagement is predicted by work stress with
significant F value. There is an inverse relationship between work stress and work
engagement. It implies that increase in work stress is likely to lower work
engagement. Two dimensions of work stress namely self-role distance and role
expectation conflict had a significant negative relationship with work engagement p
< .05, adjusted R2 = 6.96. It highlights the need for HR policy makers and all those
in leadership roles to take enough measures to control work stress so that it does not
have a dampening effect on work engagement. It also necessitates the need for
taking measures such as encouraging employees to craft their jobs so as to minimize
self role distance, inter role distance, role expectation conflict and role interference.
Job crafting measures as explained in section 6.1 can be instrumental in establishing
a better person-job fit. Besides, other measures for stress control such as role clarity,
work life balance initiatives, flexible work options and participative management
techniques can be instrumental in managing work stress. The findings reiterate the
empirical evidence given by Gonza´lez-Roma´et. al (2006) supporting that burnout
and engagement are conceptual opposites. They are also in line with the conclusion
of Maslach et al. (2001) stating that conceptually, burnout and engagement act as
each other‘s opposites.
6.4 RELATIONSHIP BETWEEN ORGANIZATIONAL COMMITMENT
AND WORK ENGAGEMENT
Porter et. al (1974) defined organizational commitment as the relative
strength of an individual's identification with the organization and involvement in its
activities. Committed employees characteristically possess a strong belief in the
organization's goals and values, have a willingness to exert substantial effort on
behalf of the organization and a firm desire to maintain membership in the
organization. As per the objectives of the current study, relationship between
organizational commitment as an independent variable and work engagement as a
dependent variable was investigated. Organizational Commitment was measured
with the six item scale developed by Saks (2006). The respondents were asked to
express their level of agreement or disagreement with the given statements
considering their current organization. Response was sought on a seven -point Likert
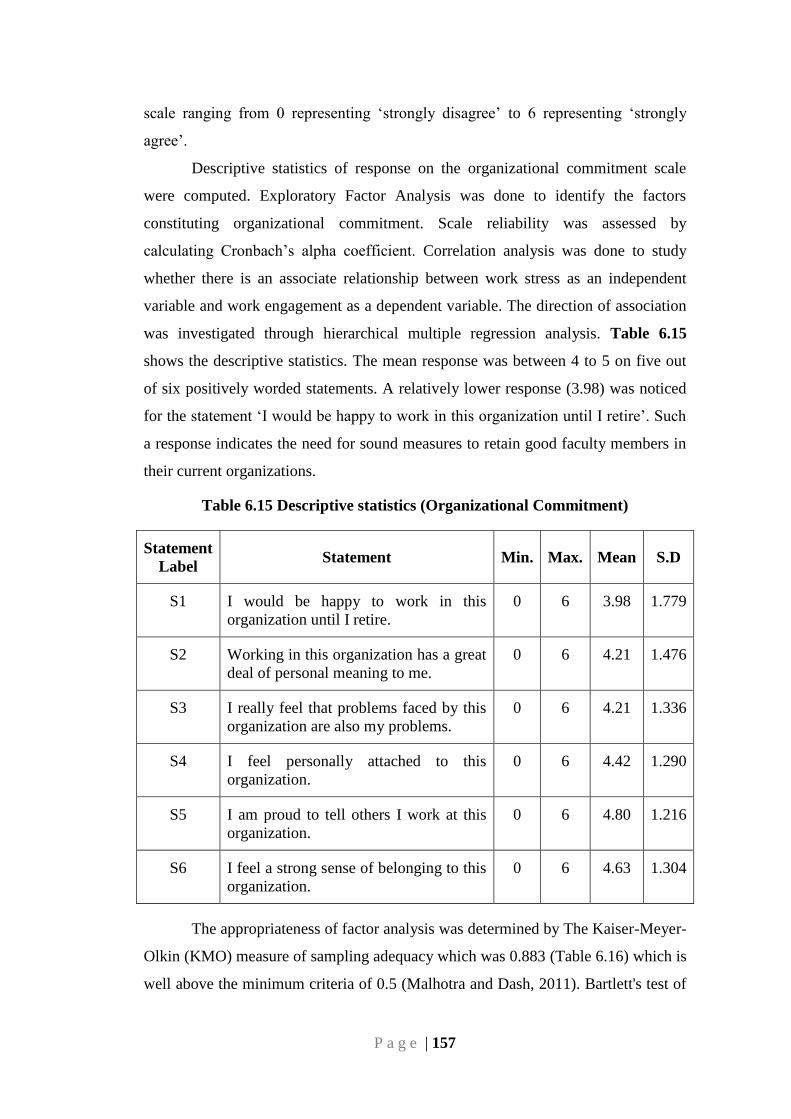
P a g e | 157
scale ranging from 0 representing ‗strongly disagree‘ to 6 representing ‗strongly
agree‘.
Descriptive statistics of response on the organizational commitment scale
were computed. Exploratory Factor Analysis was done to identify the factors
constituting organizational commitment. Scale reliability was assessed by
calculating Cronbach‘s alpha coefficient. Correlation analysis was done to study
whether there is an associate relationship between work stress as an independent
variable and work engagement as a dependent variable. The direction of association
was investigated through hierarchical multiple regression analysis. Table 6.15
shows the descriptive statistics. The mean response was between 4 to 5 on five out
of six positively worded statements. A relatively lower response (3.98) was noticed
for the statement ‗I would be happy to work in this organization until I retire‘. Such
a response indicates the need for sound measures to retain good faculty members in
their current organizations.
Table 6.15 Descriptive statistics (Organizational Commitment)
Statement
Label Statement Min. Max. Mean S.D
S1 I would be happy to work in this
organization until I retire.
0 6 3.98 1.779
S2 Working in this organization has a great
deal of personal meaning to me.
0 6 4.21 1.476
S3 I really feel that problems faced by this
organization are also my problems.
0 6 4.21 1.336
S4 I feel personally attached to this
organization.
0 6 4.42 1.290
S5 I am proud to tell others I work at this
organization.
0 6 4.80 1.216
S6 I feel a strong sense of belonging to this
organization.
0 6 4.63 1.304
The appropriateness of factor analysis was determined by The Kaiser-Meyer-
Olkin (KMO) measure of sampling adequacy which was 0.883 (Table 6.16) which is
well above the minimum criteria of 0.5 (Malhotra and Dash, 2011). Bartlett's test of
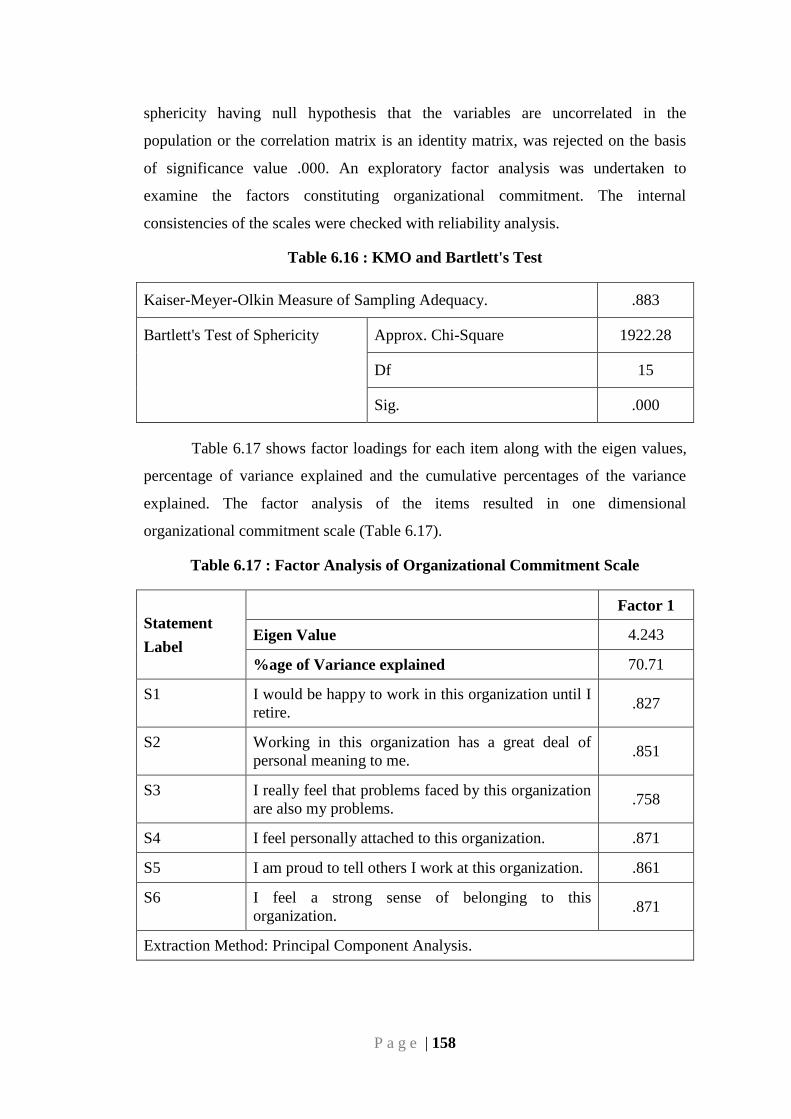
P a g e | 158
sphericity having null hypothesis that the variables are uncorrelated in the
population or the correlation matrix is an identity matrix, was rejected on the basis
of significance value .000. An exploratory factor analysis was undertaken to
examine the factors constituting organizational commitment. The internal
consistencies of the scales were checked with reliability analysis.
Table 6.16 : KMO and Bartlett's Test
Kaiser-Meyer-Olkin Measure of Sampling Adequacy. .883
Bartlett's Test of Sphericity Approx. Chi-Square 1922.28
Df 15
Sig. .000
Table 6.17 shows factor loadings for each item along with the eigen values,
percentage of variance explained and the cumulative percentages of the variance
explained. The factor analysis of the items resulted in one dimensional
organizational commitment scale (Table 6.17).
Table 6.17 : Factor Analysis of Organizational Commitment Scale
Statement
Label
Factor 1
Eigen Value 4.243
%age of Variance explained 70.71
S1 I would be happy to work in this organization until I
retire. .827
S2 Working in this organization has a great deal of
personal meaning to me. .851
S3 I really feel that problems faced by this organization
are also my problems. .758
S4 I feel personally attached to this organization. .871
S5 I am proud to tell others I work at this organization. .861
S6 I feel a strong sense of belonging to this
organization. .871
Extraction Method: Principal Component Analysis.
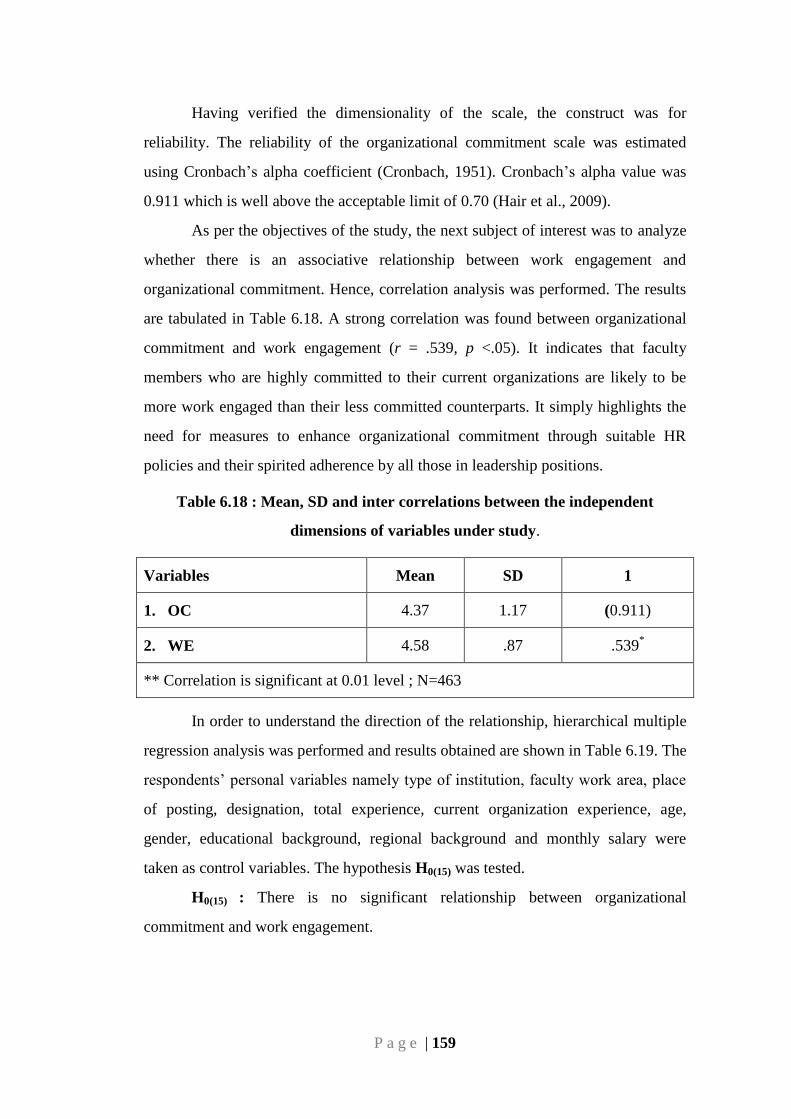
P a g e | 159
Having verified the dimensionality of the scale, the construct was for
reliability. The reliability of the organizational commitment scale was estimated
using Cronbach‘s alpha coefficient (Cronbach, 1951). Cronbach‘s alpha value was
0.911 which is well above the acceptable limit of 0.70 (Hair et al., 2009).
As per the objectives of the study, the next subject of interest was to analyze
whether there is an associative relationship between work engagement and
organizational commitment. Hence, correlation analysis was performed. The results
are tabulated in Table 6.18. A strong correlation was found between organizational
commitment and work engagement (r = .539, p <.05). It indicates that faculty
members who are highly committed to their current organizations are likely to be
more work engaged than their less committed counterparts. It simply highlights the
need for measures to enhance organizational commitment through suitable HR
policies and their spirited adherence by all those in leadership positions.
Table 6.18 : Mean, SD and inter correlations between the independent
dimensions of variables under study.
Variables Mean SD 1
1. OC 4.37 1.17 (0.911)
2. WE 4.58 .87 .539*
** Correlation is significant at 0.01 level ; N=463
In order to understand the direction of the relationship, hierarchical multiple
regression analysis was performed and results obtained are shown in Table 6.19. The
respondents‘ personal variables namely type of institution, faculty work area, place
of posting, designation, total experience, current organization experience, age,
gender, educational background, regional background and monthly salary were
taken as control variables. The hypothesis H0(15) was tested.
H0(15) : There is no significant relationship between organizational
commitment and work engagement.
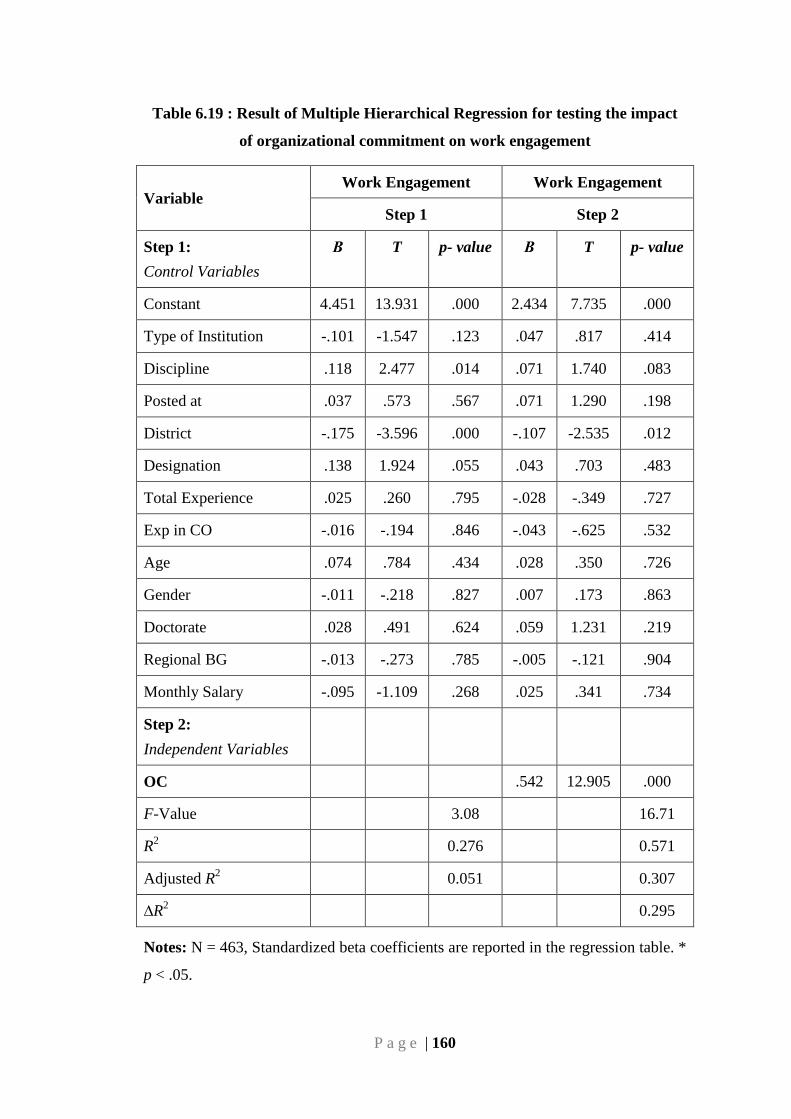
P a g e | 160
Table 6.19 : Result of Multiple Hierarchical Regression for testing the impact
of organizational commitment on work engagement
Variable Work Engagement Work Engagement
Step 1 Step 2
Step 1:
Control Variables
Β T p- value Β T p- value
Constant 4.451 13.931 .000 2.434 7.735 .000
Type of Institution -.101 -1.547 .123 .047 .817 .414
Discipline .118 2.477 .014 .071 1.740 .083
Posted at .037 .573 .567 .071 1.290 .198
District -.175 -3.596 .000 -.107 -2.535 .012
Designation .138 1.924 .055 .043 .703 .483
Total Experience .025 .260 .795 -.028 -.349 .727
Exp in CO -.016 -.194 .846 -.043 -.625 .532
Age .074 .784 .434 .028 .350 .726
Gender -.011 -.218 .827 .007 .173 .863
Doctorate .028 .491 .624 .059 1.231 .219
Regional BG -.013 -.273 .785 -.005 -.121 .904
Monthly Salary -.095 -1.109 .268 .025 .341 .734
Step 2:
Independent Variables
OC .542 12.905 .000
F-Value 3.08 16.71
R2 0.276 0.571
Adjusted R2 0.051 0.307
∆R2 0.295
Notes: N = 463, Standardized beta coefficients are reported in the regression table. *
p < .05.
P a g e | 161
H0(15) was rejected on the basis of results obtained. Table 6.18 reveals that
work engagement is predicted by organizational commitment with significant F
value. There is a significant positive relationship between organizational
commitment and work engagement, p < .05, adjusted R2 = 0.307. It implies that
increase in organizational commitment is likely to enhance work engagement. The
findings reinforce the results obtained by Albdour and Altarawneh (2014) who
found that affective commitment is positively associated with high job engagement
and organizational engagement.
6.5 CHAPTER SUMMARY
This chapter deals with the study of relationship of work engagement with
job crafting, work-life balance, work stress and organizational commitment. It is a
bottom-up approach, with employees taking initiative to align work with their
personal preferences and abilities (Tims & Bakker, 2010; Wrzesniewski & Dutton,
2001). Job crafting includes modification in what one does in the form of job, one‘s
approach towards work or manner of interaction with others (Tims et. al, 2013).
Section 6.1 of this chapter dealt with the investigation of the relationship between
job crafting as an independent variable and work engagement as a dependent
variable. A twelve item scale based on Job Crafting Scale developed by Tims et al.
(2012) was used to measure job crafting initiatives. Response was sought on a seven
point Likert scale seeking how frequently the respondents took the mentioned job
crafting initiatives, ranging from 0 indicating ‗never‘ to 6 indicating ‗always or
everyday‘. Descriptive statistics of response on the job crafting scale were
computed. Exploratory Factor Analysis was done to identify the factors constituting
job crafting. Scale reliability was assessed by calculating Cronbach‘s alpha
coefficient. Correlation analysis was done to study whether there is an associative
relationship between job crafting as an independent variable and work engagement
as a dependent variable. The direction of association was investigated through
hierarchical multiple regression analysis. Exploratory Factor analysis of the items
resulted in three dimensions of job crafting scale which were operationalised as
‗increasing structural job resources‘, ‗increasing social job resources‘ and
‗increasing challenging job demands‘. The scale reliability was estimated using
P a g e | 162
Cronbach alpha coefficient and the reliability estimates were above the acceptable
limit of 0.70 (Hair et al., 2009). The results of correlation matrix revealed that all the
dimensions of job crafting were significantly associated with work engagement.
Hierarchical multiple regression analysis revealed that work engagement of faculty
members was significantly predicted by two constituents of job crafting, namely,
increasing structural job resources and challenging job demands. It implies that work
engagement is likely to increase with job crafting, a bottom –up approach wherein
faculty members seek autonomy, task and skill variety and opportunities for self
development, and at the same time also volunteer for new projects, keep abreast of
the most recent developments and take on new projects / extra tasks.
Section 6.2 of this chapter investigated the relationship between work life
balance as an independent variable and work engagement as a dependent variable.
Work-life balance symbolizes harmony between work and personal life. The 15 item
work-life balance scale developed by Hayman (2005) was used to measure the
respondents‘ work life balance on a seven point Likert scale ranging from 0
indicating never to 6 indicating always or everyday. Descriptive statistics of
response on the work life balance scale were computed. Exploratory Factor Analysis
was done to identify the factors constituting work life balance. Scale reliability was
assessed by calculating Cronbach‘s alpha coefficient. Correlation analysis was done
to study whether there is an associate relationship between work life balance as an
independent variable and work engagement as a dependent variable. The direction of
association was investigated through hierarchical multiple regression analysis.
Exploratory factor analysis of the items resulted in three dimensions to the work life
balance scale. They were operationalised as work interference with personal life
(WIPL), personal life interference with work (PLIW) and work/personal life
enhancement (WPLE), in accordance with Hayman (2005). The scale reliability was
estimated using Cronbach alpha coefficient and the reliability estimates were above
the acceptable limit of 0.70 (Hair et al., 2009). Correlation analysis revealed that the
mean score was highest for ‗personal life interference with work‘. It indicated that
faculty members felt that their personal life interfered with their work life relatively
more than the work life interfered with personal life or the two aspects enhanced
each other. Further, the results of correlation matrix revealed that all the dimensions
P a g e | 163
of work life balance were significantly associated with work engagement. Highest
correlation was found with ‗work personal life enhancement‘ and the lowest with
‗work interference with personal life‘. Hierarchical multiple regression analysis
revealed work engagement is significantly predicted by two aspects of work – life
balance namely personal life interference with work and work-personal life
enhancement. The results coincide with the findings of Kim (2014) and Albdour and
Altarawneh (2014). Hence faculty work engagement is likely to be enhanced with
efforts to establish a better work life balance. HR policy initiatives like flextime,
telecommuting, flexible benefits program, job sharing, compressed work week and
career breaks can be explored with the objective of better faculty work engagement.
Section 6.3 of this chapter investigated the relationship between work stress
as an independent variable and work engagement as a dependent variable. Work
stress was measured using a self developed pretested scale consisting of 18 items
adapted from Organization Role Stress Scale developed by Udai Pareek (1983). The
response was sought on a 7 point Likert scale ranging from 0 indicating never to 6
indicating always or everyday. Descriptive statistics of response on the work stress
scale were computed. Exploratory Factor Analysis was done to identify the factors
constituting work stress. Scale reliability was assessed by calculating Cronbach
alpha coefficient. Correlation analysis was done to study whether there is an
associative relationship between work stress as an independent variable and work
engagement as a dependent variable. The direction of association was investigated
through hierarchical multiple regression analysis. Exploratory factor analysis of the
items resulted in four dimensions of the work stress scale. The factors were
operationalised as self-role distance, inter-role distance, role expectation conflict and
role inadequacy. The reliability for work stress scale was estimated using Cronbach
alpha coefficient (Cronbach, 1951). The reliability estimates were above or close to
the acceptable limit of 0.70 (Hair et al., 2009). Correlation analysis revealed that the
faculty members experienced greatest dissatisfaction on the aspect of role
interference which required them to compromise on quality of work for the sake of
quantity, they perceived that their talent was under utilized and wanted to make
changes in their job profiles. Further, the results of correlation matrix revealed that
all the dimensions of work stress were significantly and negatively associated with
P a g e | 164
work engagement. It implies that an increase in any of the four dimensions of work
stress would be associated with decline in faculty work engagement. In order to
understand the direction of the relationship, hierarchical multiple regression analysis
was performed which also revealed that there is an inverse relationship between
work stress and work engagement. Two dimensions of work stress namely self-role
distance and role expectation conflict had a significant negative relationship with
work engagement. It highlights the need for HR policy makers and all those in
leadership roles to take measures such as encouraging employees to craft their jobs;
provide role clarity, engage in work life balance initiatives, provide flexible work
options and participative management techniques. The findings coincide with those
of Gonza´lez-Roma´et. al (2006) and Maslach et al. (2001).
Section 6.4 investigated the relationship between organizational commitment
as an independent variable and work engagement as a dependent variable. Porter et.
al (1974) defined organizational commitment as the relative strength of an
individual's identification with the organization and involvement in its activities.
Organizational Commitment was measured with the six item scale developed by
Saks (2006). The respondents were asked to express their level of agreement or
disagreement with the given statements considering their current organization.
Response was sought on a seven -point Likert scale ranging from 0 representing
‗strongly disagree‘ to 6 representing ‗strongly agree‘. The scale was found to be a
reliable measure of organizational commitment as Cronbach‘s alpha was well
acceptable limit of 0.70 (Hair et al., 2009). Descriptive statistics of response on the
organizational commitment scale were computed. Exploratory Factor Analysis was
done to identify the factors constituting organizational commitment. Scale reliability
was assessed by calculating Cronbach‘s alpha coefficient. Correlation analysis was
done to study whether there is an associate relationship between work stress as an
independent variable and work engagement as a dependent variable. The direction of
association was investigated through hierarchical multiple regression analysis.
Exploratory factor analysis of the items resulted in one dimensional organizational
commitment scale. A strong correlation was found between organizational
commitment and work engagement. It indicates that faculty members who are highly
committed to their current organizations are likely to be more work engaged than
CHAPTER – 7
SUMMARY
AND
CONCLUSIONS
P a g e | 166
CHAPTER – 7
SUMMARY AND CONCLUSIONS
This chapter summarizes the entire study, draws the major conclusions from
each chapter and delineates the future avenues for research.
7.1 SUMMARY AND FINDINGS
Chapter 1 introduced the concept of employee work engagement and its
significance in the contemporary work arena. In the context of globalization,
boundary less organizations need to capitalize upon the strength of work engaged
employees. The strong association of work engagement with employee retention,
customer satisfaction, productivity and profitability was brought out while similar
relationships were not found for traditional constructs like job satisfaction. The
rationale for the current study was explained in the light of the challenges faced by
Indian higher education system. Given the issues of below expected quality of
teaching and learning, lack of quality assurance and poor accountability of teaching
staff in higher education institutions, it was found essential to investigate the status
of work engagement amongst faculty members, explore the factors associated with it
and identify measures for its enhancement.
Chapter 2 dealt with the review of literature that was relevant to the subject
matter of the thesis. Approximately, more than hundred research papers published in
various international journals, related articles from books and websites and
significant reports published on this subject were reviewed. All the studies were
categorized into five sections namely studies on work engagement as a unique
construct; studies on measurement of work engagement; studies on factors affecting
work engagement; studies on relationship of work engagement with job crafting,
organizational commitment, work life balance and work stress and studies on
engagement –performance link. The review revealed that engagement is a novel and
unique concept accepted in both managerial and academic literature and unlikely to
be forsaken as a fad. Engagement was distinguished from job satisfaction,
commitment, job involvement, work holism and work related flow. The instruments
for measuring employee work engagement were explored. The commonly cited
P a g e | 167
instruments were found to be Gallup Workplace Audit or Q12, Maslach Burnout
Inventory, Oldenburg Burnout Inventory (OLBI) and Utrecht Work Engagement
Scale. Various studies on the factors affecting work engagement were reviewed. A
comparative analysis revealed that work engagement is predicted by factors such as
job characteristics, personal resources, interpersonal relations and organizational
support. The studies detailed the qualitative aspects of each of these factors. Work
engagement, being a multi dimensional concept was found to be related other
behavioral phenomena. A few studies revealed a positive association between job
crafting and work engagement, indicating that employees who take proactive steps
to establish a better person-job fit are more work engaged. The relationship of work
-life balance and work engagement was explored by a few studies. They found that
employees who carry positive feelings from their work to personal life and vice
versa experience higher levels of engagement. A few studies investigated the
relationship between work engagement and organizational commitment. They found
a positive association between the two. Studies on the relationship between work
engagement and work stress revealed that the two are inversely related. Studies on
the engagement performance link highlighted that engaged employees outshine
others in both in-role and extra-role performance. They are creative problem solvers
and display the ability to inspire and coach their co-workers.
The review of literature revealed the need to conduct a comprehensive study
of work engagement of faculty members in the higher education sector, as very few
such studies existed in the Indian context. The factors affecting work engagement of
faculty members was found to be a less researched area, particularly in the Indian
higher education sector, having its unique size and challenges. The relationship of
work engagement with related phenomena like job crafting, work life balance,
organizational commitment and work stress was found to be a subject of research
gap and interest. Based on these, measures for enhancement of work engagement
were sought to be identified. Hence, according to these research gaps, the present
study was undertaken with the following objectives:
1) To measure the level of work engagement amongst the employees (faculty
members) working in organizations under the study.
2) To study the relationship (if any) between the level of work engagement and
personal variables.
P a g e | 168
3) To identify factors affecting the level of work engagement amongst
employees (faculty members).
4) To identify the measures required for enhancement of work engagement
amongst the employees (faculty members).
5) To study the relationship (if any) between the level of work engagement
amongst employees (faculty members) and
job crafting initiatives
work - life balance
level of work stress
level of organization commitment
Chapter 3 explained the research methodology including the research design
and sampling technique, data collection, sample description, research instruments
and finally the statistical analysis approach was explained. A cross-sectional
descriptive study was designed using the quota sampling technique for drawing a
fixed number of faculty members from each of the four broad faculty work areas
namely Commerce and Business Management (CBM), Science, Engineering and
Technology (SET), Applied Medical Sciences (AMS) and Education and
Humanities (EHUM) from public and private higher education institutions. The
respondents were drawn from higher education institutions located in the districts of
Amritsar, Bathinda, Jalandhar, Ludhiana, Patiala and the capital of Punjab –
Chandigarh as these districts are considered the hubs of higher education in Punjab.
A total of 463 fully filled questionnaires were received from 41 Higher Education
Institutions.
The research instrument used for data collection consisted of eight parts
including (i) a self developed 92 item scale that explored the respondents‘
perception regarding self, current job and current organization (ii) job crafting scale
adapted from Tims et al. (2012) (iii) work-life balance scale developed by Hayman
(2005) (iv) nine-item version of the Utrecht Work Engagement Scale developed by
Schaufeli et al., 2006 (v) Organizational Commitment scale developed by Saks
(2006) (vi) a work stress scale adapted from Organization Role Stress Scale
developed by Udai Pareek (1983) (vii) an ordinal scale to see respondents‘ ranking
of changes required for improving engagement. The statistical analysis approach
included descriptive statistics, one-way ANOVA, exploratory factor analysis,
P a g e | 169
measurement of scale reliability with Cronbach‘s alpha coefficient, correlation
analysis, non-metric correlation analysis using Spearmann‘s rank correlation
coefficient and hierarchical multivariate regression analysis. The data analysis was
done using SPSS version 16.0.
Chapter 4 dealt with data analysis related to level of faculty work
engagement and investigated its relationship with personal variables chosen for the
study. While a majority (57.23%) of the respondents reported a moderate level of
work engagement a significant number of respondents (38.66%) reported high level
of work engagement, thus highlighting the scope and need to improve the work
engagement of faculty members. The difference in mean work engagement across
the samples categorized on the basis of personal variables was analyzed using one-
way analysis of variance (ANOVA). Wherever the difference in the level of
engagement was found to be significant, Post-Hoc tests using Least Square
Difference (LSD) were applied. Work engagement of faculty members varied
significantly with faculty work area, district wise posting, designation, experience in
current organization, total experience, age, educational background and salary.
However, no statistically significant variation was found with respect to gender,
regional background, government versus private institution and posting at university
campus or affiliated college. Work engagement of faculty members belonging to
education and humanities (EHUM) was significantly higher than those belonging to
commerce and business management (CBM) and applied medical sciences (AMS).
It could be attributed possibly to the higher personal resources possessed by the
Education and humanities faculty most of whom possessed a formal qualification as
Teacher Educators. Faculty members who possessed a doctoral degree (Ph.D)
reported higher engagement than the others. In the light of Kahn‘s (1990) model of
personal engagement, doctoral degree can be considered a key intellectual resource
to enhance the psychological availability for the faculty role. This points to the need
to increase faculty enrolment in doctoral degrees. Those drawing a salary of less
than Rs. 30,000 per month were significantly less engaged than the next higher
salary bracket 30,001 to 50,000 per month as well as the highest salary bracket Rs.
1,10,000 and above.
Chapter 5 dealt with identification of the factors affecting work engagement
of faculty members and measures for enhancing the same. Exploratory factor
P a g e | 170
analysis was applied in the light of its key objective of reducing a larger set of
variables to a smaller set and to summarize the data. Ten unique factors or
dimensions were identified, all having acceptable Cronbach‘s alpha. They were
named as perceived organizational support, personal and professional orientation,
supervisory coaching, climate of participation and recognition, organizational
orientation for results, interaction with students, intrinsic rewards, empowerment,
task variety and support from associates. Correlation analysis was done to study
whether there is an associative relationship between work engagement and the ten
factors identified through factor analysis. The results revealed that all the factors
were significantly associated with work engagement. The highest correlation of
work engagement was found with ‗personal and professional orientation‘ and the
lowest with ‗support from associates‘. In order to understand the direction of the
relationship, hierarchical multiple regression analysis was performed. The results
revealed that typically in the higher education sector, the job related factors which
significantly predict faculty work engagement are perceived organizational support,
intrinsic rewards, task variety, organizational orientation for results and supervisory
coaching. At the individual level, personal and professional orientation is a vital
resource driving work engagement.
Chapter 5 also reported the measures required for enhancement of work
engagement amongst faculty members. The respondents were given a list of 11
statements and asked to rank the top five changes in order to work with better
energy, dedication and involvement. The top five measures identified were greater
role clarity, more empowerment for decision making, better intrinsic rewards, more
openness towards change and innovation and organizational support for career
advancement. In order to evaluate the consistency of response across the
demographic sub groups of respondents, comparison was made according to gender,
type of institution, designation, salary, faculty work area and district of posting.
Spearman‘s rank correlation coefficient was calculated. Results revealed that the
measures required for work engagement enhancement were significantly correlated
according to gender but there was no statistically significant correlation in the
response of faculty sub groups according to type of institution, designation, salary
bracket and work area. Placed at starting rung of teaching hierarchy, the lecturers
expressed a strong need for role clarity; Assistant Professors emphasized upon the
P a g e | 171
need for empowerment; Associate Professors gave top most priority to the need for
intrinsic rewards for example meaningful, interesting and valuable work. While the
faculty from science, engineering and technology gave maximum importance to
development oriented leadership, faculty from other work areas stated the
requirement for greater role clarity. It implies that if the target is to engage the
faculty in their work roles, a ‗one size fits all approach‘ may be insufficient.
Engagement measures might need to be customized to suit the needs of various
groups.
Chapter 6 dealt data analysis for investigation of the relationship of work
engagement with other phenomena. The results revealed that work engagement is
positively associated with job crafting, work-life balance and organizational
commitment and inversely related with work stress.
7.2 KEY RECOMMENDATIONS
In the light of previous research and the results of the current study the key
recommendations are:
[1] Faculty work engagement in higher education sector of Punjab, is at a
moderate level. The statistics indicate a large scope of improvement. Given
the merits of a work engaged faculty team, HEIs are urged for action in this
direction.
[2] The significant factors affecting work engagement of faculty members, as
per the current study are: perceived organizational support, personal and
professional orientation, intrinsic rewards, task variety, organizational
orientation for results and supervisory coaching.
[3] The top five measures required for enhancement of work engagement
include greater role clarity, more empowerment for decision making, better
intrinsic rewards, more openness towards change and innovation and
organizational support for career advancement. Interestingly, it was found
that if work engagement measures can be more effective if customized
according to type of institution, designation and faculty work areas. For
instance, government and government aided Higher Education Institutions
need to focus on providing greater role clarity, empowerment and open
communication. Private sector HEIs need to pay attention to better intrinsic
P a g e | 172
rewards in terms of interesting work, satisfaction from work and a sense of
progress along with better organizational support for career advancement.
[4] Work engagement of faculty members was significantly predicted by two
constituents of job crafting, namely, increasing structural job resources and
challenging job demands. It implies that work engagement is likely to
increase with a bottom –up approach wherein faculty members are
encouraged to use a two pronged strategy to alter their job design. One set of
initiatives they can take include seeking structural job resources like
autonomy, task and skill variety and opportunities for self development.
Another set of efforts include seeking challenging job demands by
volunteering for new projects, keeping abreast of the most recent
developments, taking initiative to start new projects and extra tasks.
[5] Work engagement is significantly predicted by two aspects of work – life
balance namely personal life interference with work and work-personal life
enhancement (WPLE). It implies that HR policy initiatives to establish a
mutually enhancing relationship between work and personal life could have a
significant impact on work engagement. In this direction, flexible work
options can be explored. Flexible working hours can be given wherein
faculty members can choose their preferred timings subject to meeting a
prefixed number of hours. The option of telecommuting allows the
employees to work from anywhere and stay in touch with the office with
advanced technological assistance for example video conferencing and
webinars in case of faculty members. Flexible benefits or cafeteria style
benefit program allows employees to choose from a range of benefit options
that best suit their personal and family needs, upto the value of a set
allowance. The option of having a compressed work week allows employees
to work for longer hours on certain days and enjoy a longer week end for
example it allows the freedom to work ten hours a day for four days instead
of eight hours a day for five days. Another novel idea tried by some
organizations is the option of job sharing or twinning. Herein, two
employees share the job responsibilities in a full time job. Permission for
availing career breaks for self development can also be a highly sought after
P a g e | 173
measure for better work life balance and hence work engagement of faculty
members.
[6] Work engagement was found to be inversely related with work stress.
Results of the present study revealed greatest dissatisfaction on role
interference dimension requiring them to compromise on quality of work due
to quantity, underutilization of talent and need to make changes in current
role profile. Self –role distance and role expectation conflict were inversely
related with work engagement. It calls for action by those in academic
leadership positions, playing supervisory role as Heads of Departments.
Intrinsic rewards in the form of allocating faculty preferred courses for
teaching and appreciation for good work can erode the negative impact of
work stress and create a positive gain spiral for faculty work engagement.
[7] Faculty members who are highly committed to their current organizations are
likely to be more work engaged. Work engagement of long tenured faculty
members (>20 years) was found to be higher than others who had less
experience (<5 years) in the current organization. It appears that when
faculty members stay associated with an organization for a long tenure, they
develop a clear understanding of organizational orientation for results which
was identified as another vital factor predicting faculty work engagement. A
long tenure could be an outcome of a match between organization‘s result
orientation with employees‘ personal and professional orientation. Hence, it
implies that HEIs must design ingenious ways to map the two orientations so
that they can retain faculty members for long tenures and capitalize upon
their work engagement. An employee value proposition of care and concern
fuels affective commitment which has a strong positive association with
work engagement.
7.3 FUTURE RESEARCH PROSPECTS
This study also found the vistas for future research. A majority of the studies
on work engagement especially in the Indian context have used a cross-sectional
design which cannot explain why even highly engaged employees may be less
engaged on some days. Hence, longitudinal studies are required to analyze the
pattern of daily changes in work engagement and identify the factors leading to
P a g e | 174
these. Such studies could have important implications for better understanding of
employee well being. The current study investigated the relationship between work
engagement and job crafting and found a positive association. Further studies in this
area may answer the question as to whether all employees are equally inclined for
job crafting. Can people be trained for job crafting? Is there a relationship between
personality and job crafting? The current study highlights the need for work-life
balance measures in HEIs. Studies mapping the perception of policy makers in the
government and private sector can be instrumental in identifying the feasibility of
adopting such initiatives. They can dramatically change the workplace scenario and
increase workforce participation of many sections of the society which can be
instrumental in enhancing the overall work engagement. Work engagement will be
sustainable when employee well being is also high (Robertson and Cooper, 2010).
Studies on work engagement can be furthered to construct workplace happiness
index – an aggregation of all vital metrics of employee well being.
**********

BIBLIOGRAPHY
P a g e | 175
BIBLIOGRAPHY
——————————————————————————————————
Albdour, A. A., & Altarawneh, I. I. (2014). Employee Engagement and
Organizational Commitment: Evidence from Jordan. International Journal of
Business, 19 (2), 193-212.
Alderfer, C. P. (1985). An Intergroup Perspective On Group Dynamics. In J. Lorsch
(Ed.), Handbook of Organizational Behaviour (pp. 190-222). Englewood Cliffs NJ:
Prentice Hall.
Aon Hewitt. (2015). 2015 Trends in Global Emplooyee Engagement. Retrieved
September 22, 2015, from aonhewitt.hu/download/608/file/final_trends_in_global_
employee_engagement_report_2015_.pdf
Aselstine, K., & Alletson, K. (2006). A new deal for 21st century workplace.
Retrieved May 25, 2010, from Ivey Business Journal: www.iveybusiness
journal.com
ASSOCHAM. (2015, June 24). The Associated Chambers of Commerce & Industry
of India. Retrieved September 22, 2015, from ASSOCHAM India:
http://assocham.org/newsdetail.php?id=5042
Bakker, A. B. (2011). An Evidence- Based Model of Work Engagement. Current
Directions in Psychological Science, 20 (4), 265-269.
Bakker, A. B., & Demerouti, E. (2007). The Job Demands - Resources Model : State
of The Art. Journal of Managerial Psychology, 22 (3), 309-328.
Bakker, A. B., & Demerouti, E. (2008). Towards a Model of Work Engagement.
Career Development International, 13 (3), 209-223.
Bakker, A. B., & Hakanen, J. J. (2013). Work engagement among public and private
sector dentists. In R. J. Burke, A. J. Noblet, & C. L. Cooper, Human resource
management in the public sector (pp. 109-131). Cheltenham, U.K: Edward Elgar.
Bakker, A. B., Demerouti, E., & Schaufeli, W. B. (2003). The Socially Induced
Burnout Model. In S. Shohov (Ed.), Advances in Psychology Research (Vol. 25, pp.
13-30). New York: Nova Science Publishers.
P a g e | 176
Bakker, A. B., Demerouti, E., & Verbeke, W. (2004). Using the Job Demands -
Resources model to predict burnout and performance. Human Resource
Management, 43, 83-104.
Bakker, A. B., Gierveld, J. H., & Van, R. K. (2006). Success factors amongst female
school principals in primary teaching: A study on burnout, work engagement and
performance. Diemen, The Netherlands : Right Management Consultatnts.
Bakker, A. B., Shimazu, A., Demerouti, E., Shimada, K., & Kawakami, N. (2014).
Work engagement versus workaholism: A test of spillover-crossover model. Journal
of Mangerial Psychology, 29 (1), 63-80.
Bamford, M., Wong, C. A., & Laschinger, H. (2013). The influence of authentic
leadership and areas of worklife on work engagement of registered nurses. Journal
of Nursing Management, 21, 529-540.
Barkhuizen, N., & Rothmann, S. (2008). Occupational stress of academic staff in
South Africa. South African Journal of Psychology, 321-336.
Barkhuizen, N., & Rothmann, S. (2006). Work engagement of academic staff in
South African Higher Education Institutions. Management Dynamics, 15 (1).
Barsade, S. (2002). The ripple effect: emotional contagion and its influence on
group behaviour. Adminstrative Science Quarterly, 644-677.
Batista-Taran, L. C., Shuck, M. B., Gutierrez, C. C., & Baralt, S. (2009). The Role
of Leadership Style in Employee Engagement. In M. S. Plakhotnik, S. M. Nielsen,
& D. M. Pane (Ed.), Proceedings of the Eight Annual College of Education & GSN
Research Conference (pp. 15-20). Miami: Florida International University.
Berg, J. M., Wrzesniewski, A., & Dutton, J. E. (2010). Perceiving and responding to
challenges in job crafting at different ranks: When proactivity requires adaptivity.
Journal of Organizational Behaviour, 31, 158-186.
Biggs, A., Brough, P., & Barbour, J. P. (2014). Relationships of individual and
organizational support with engagement: Examining various types of causality in a
three-wave study. Work & Stress: An International Journal of Work, Health and
Organisations, 236-254.
P a g e | 177
Blaug, R., Kenyon, A., & Lekhi, R. (2007, February 1). Stress at Work. Retrieved
September 23, 2015, from The Work Foundation - Part of Lancaster University:
http://www.theworkfoundation.com/Reports
Bledlow, R., Schmitt, A., Frese, M., & Kühnel, J. (2011). The affective shift model
of work engagement. Journal of Applied Psychology, 1246-57.
Bond, F. W., Flaxman, P. E., & Loivette, S. (2006). A business case for the
management standards of stress. Retrieved June 15, 2015, from Health and Safety
Exceutive: www.hse.gov.uk/research/rrpdf/rr431.pdf ;
Boston Consulting Group. (2014). Retrieved October 27, 2014, from
http://us.greatrated.com/the-boston-consulting-group
British Council. (2014). Understanding India - The Future Of Higher Education
And Opportunities For International Cooperation. Retrieved September 22, 2015,
from http://www.britishcouncil.in/sites/britishcouncil.in2/files/understanding_
india.pdf
Brown, S. P. (1996). A Meta-analysis and Review of Organizational Research on
Job Involvement. Psychological Bulletin, 120, 235-255.
Brown, S. P., & Leigh, T. W. (1996). A New look at Psychological Climate and Its
Relationship to Job Involvement, Effort, and Performance. Journal of Applied
Psychology, 81, 358-368.
Buckingham, M., & Coffman, C. (1999). First Break All the Rules: What the
World's Greatest Managers Do Differently. New York: Simon & Shuster.
CABE. (2005). Report of the Central Advisory Board of Education. Committee on
Autonomy of Higher Education Institutions Govt. of India.
Carlson, D. S., Witt, L. A., Zivnuska, S., & Kacmar, K. (2008). Supervisor appraisal
as the link between family-work balance and contextual performance. Journal of
business Psychology, 23 (1-2), 37-49.
Chan, F. (2013). Effects of Job crafting on Work Engagement and Performance.
Honours Thesis, Univesity of Queensland.
P a g e | 178
Christian, M. S., Garza, A. S., & Slaughter, J. E. (2011). Work engagement : A
quantitative review and test of its relationship with task and contextual performance.
Personnel Psychology, 64 (1), 89-136.
Coffman, C., & Gonzalez-Molina, G. (2002). Follow this path : How the world's
greatest organizations derive growth by unleashing human potential. New York:
Warner Books, Inc.
Colbert, A. E., Mount, M. K., Harter, J. K., Witt, L., & Barrick, M. R. (2004).
Interactive effects of personality and perceptions of the work situation on workplace
deviance. Journal of Applied Psychology, 89, 599-609.
Corporate Executive Board (2004). Driving Performance and Retention through
Employee Engagement : A Quantitative Analysis of Effective Engagement
Strategies. Retrieved November 9, 2014, from www.usc.edu/programs/cwfl/assets/
pdf/Employee%20engagement.pdf
Crabtree, S. (2013, October 8). Gallup. Retrieved June 21, 2015, from
http://www.gallup.com/poll/165269/worldwide-employees-engaged-work.aspx
Crawford, E. R., LePine, J. A., & Rich, B. L. (2010). Linking job demands and
resources to employee engagement and burnout: A theoretical extension and
metanalytic test. Journal of Applied Psychology, 834-848.
Cronbach, L. J. (1951). Coefficient alpha and the internal structure of tests.
Psychometrika, 16 (3), 297-334.
Cropanzano, R., & Mitchell, M. S. (2005). Social Exchange Theory : An
Interdisciplinary Review. Journal of Management, 31, 874-900.
Demerouti, E., Bakker, A. B., Nachreiner, F., & Schaufeli, W. B. (2001). The job
demands - resources model of burnout. Journal of Applied Psychology, 86, 499-512.
Demerouti, E., Mostert, K., & Bakker, A. B. (2010). Burnout and Work Engagement
: A Thorough Investigation of the Independency of Both Constructs. Journal of
Occupational Health Psychology, 15 (3), 209-222.
Emslie, C., & Hunt, K. (2009). 'Live to Work' or 'Work to Live'? A Qualitative
Study of Gender and Work-life Balance among Men and Women in Mid-life.
Gender,Work and Organization, 16, 151-172.
P a g e | 179
Erickson, T. J. (2005). Testimony submitted before the US Senate Committee on
Health, Education, Labour and Pensions. Washington: U.S. Government Printing
Office.
Fisher, C. D., & Locke, E. A. (1992). The New Look in Job Satisfaction Research
and Theory. In C. J. Cranny, P. C. Smith, & E. F. Stone (Eds.), Job Satisfaction :
How People Feel about their Jobs and How It Affects Their Performance (pp. 165-
194). NY : Lexington Books.
Fleming, J. H., & Asplund, J. (2007). Human Sigma. New York: Gallup Press.
Fleming, J. H., Coffman, C., & Harter, J. K. (2005). Manage your Human Sigma.
Harvard Business Review, 83, 106-115.
Fortune - Best Companies 2014. (2014). Retrieved October 27, 2014, from
http://fortune.com/best-companies
Fredrickson, B. L. (2001). The role of positive emotions in positive psychology: the
broaden-an-build theory of positive emotions. American Psychologist, 56, 218-226.
Geurts, S., & Demerouti, E. (2003). Work / Non-work Interference : A Review of
Theories and Findings. In M. Schabracq, J. Winnubust, & C. L. Cooper (Eds.), The
Handbook of Work and Health Psychology (2nd ed., pp. 279-312). Chichester:
Wiley.
Gichohi, P. M. (2014). The Role of Employee Engagement in revitalizing Creativity
and Innovation at the Workplace: A Survey of Selected Libraries in Meru County-
Kenya. Library Philosophy and Practice (e-journal).
Grant, A. M., & Ashford, S. J. (2008). The Dynamics of Proactivity at Work.
Research in Organizational Behaviour, 28, 3-34.
Grant, A. M., & Parker, S. K. (2009). Redesigning work design theories: The rise of
relational and proactive perspectives. Academy of Management Annals, 3, 317-375.
Greenhaus, J. H., & Powell, G. N. (2006). When Work and Family Are Allies: A
Theory of Work–Family Enrichment. Academy of Management Review, 31 (1),
72-92.
P a g e | 180
Gruman, J. A., & Saks, A. M. (2011). Performance Management and Employee
Engagement. Human Resource Management Review, 21 (2), 123-136.
Guest, D. E. (2013). Employee Engagement: Fashionable Fad or Long Term
Fixture? In C. Truss, K. Alfes, R. Delbridge, A. Shantz, & E. C. Soane (Eds.),
Employee Engagement in Theory and Practice. London: Routledge.
Hackman, J. R., & Oldham, G. R. (1980). Work Redesign Reading. Mass: Addison-
Wesley.
Hair, J. F., Black, W. C., Babin, B. J., & Anderson, R. E. (2009). Multivariate Data
Analysis. Prentice Hall.
Hakanen, J. J., Bakker, A. B., & Schaufeli, W. B. (2006). Burnout and work
engagement among teachers. Journal of School Psychology, 43, 495-513.
Hammer, L. B., Neal, M. B., Newson, J. T., Brockwood, K. J., & Colton, C. L.
(2005). A longitudinal study of the effects of dual-earner couples‘ utilization of
family-friendly workplace supports on work and family outcomes. Journal of
Applied Psychology, 90 (4), 799-810.
Harter, J. K., Schmidt, F. L., & Hayes, T. L. (2002). Business-unit-level relationship
between employee satisfaction, employee engagement and business outcomes- A
meta-analysis. Journal of Applied Psychology, 87, 268-279.
Hayman, J. (2005). Psychometric Assessment of an Instrument Designed to Measure
Work Life Balance. Research and Practice in Human Resource Management, 13
(1), 85-91.
Hermsen, J., & Rosser, V. (2008). Examining work engagement and job satisfaction
of staff members in higher education. CUPA-HR Journal, Fall/Winter, 11-18.
Hobfoll, S. E., & Shirom, A. (2001). Conservation of resources theory: Applications
to stress and management in the workplace. In R. T. Golembiewski (Ed.), Handbook
of Organizational Behaviour (pp. 57-81). New York: Dekker.
Hobfoll, S. E., Johnson, R. J., Ennis, N., & Jackson, A. P. (2003). Resource loss,
resource gain and emotional outcomes among inner city women. Journal of
Personality and Social Psychology, 84, 632-43.
P a g e | 181
Hochschild, A. R. (1997). The time bind: When work becomes home and home
becomes work. New York: Metropolitan Books.
HR Anexi and Blessing White. (2008). The Employee Engagement Equation in
India. Business World.
Hulkko-Nyman, K., Sarti, D., Hakonen, A., & Sweins, C. (2012). Total Rewards
Perceptions and Work Engagement in Elder-Care Organizations. International
Studies of Management and Organization, 42 (1), 24-49.
Juluri, V. (2014, September 6). Narendra Modi’s Teacher’s Day Speech – Pure
Vision, Zero Propaganda. Retrieved March 6, 2015, from NITI Central:
http://www.niticentral.com/2014/09/06/narendra-modis-teachers-day-speech-pure-
vision-zero-propaganda-237425.html
Kahn, R., & Byosiere, P. (1992). Stress in organizations. In M. D. Dunnette, & L.
M. Hough, Handbook of Industrial and Organizational Psychology (Vol. 3, pp. 571-
650). Palo Alto: Consulting Psychologists Press.
Kahn, W. A. (1990). Psychological Conditons of Personal Engagement and
Disengagement at Work. Academy of Management Journal, 33 (4), 692-724.
Karasek, R. A. (1979). Job demand, job decision latitude and mental strain:
Implications for job redesign. Adminstrative Science Quarterly, 24, 285-309.
Kelley, T. L. (1927). Interpretation of Educational Measurements. Yonkers-on-
Hudson, N.Y: World Book Company.
Ketter, P. (2008, January 3). What's the big deal about employee engagement.
Retrieved March 6, 2015, from Association for Talent Development:
https://www.td.org/Publications/Magazines/TD/TD-Archive/2008/01/The-Big-Deal-
About-Employee-Engagement
Kim, H. K. (2014). Work-Life Balance and Employees‘ Performance: The
Mediating Role of Affective Commitment. Global Business and management
Research:An International Journal, 6 (1).
Kulin, S. L. (Ed.). (2014). Great Place to Work Institute. Retrieved October 27,
2014, from http://www.greatplacetowork.com
P a g e | 182
Kyriacou, C., & Sutcliffe, J. (1996). Teacher stress: Prevelance, sources and
symptoms. British Council of Educational Psychology, 48, 159-167.
Lee, R. T., & Ashforth, B. E. (1996). A meta-analytic examination of the correlates
of the three dimensions of job burnout. Journal of Applied Psychology, 81, 123-133.
LePine, J. A., Podsakoff, N. P., & LePine, M. A. (2005). A meta-analytic test of the
challenge stressor–hindrance stressor framework: An explanation for inconsistent
relationships among stressors and performance. Academy of Management Journal
(48), 764-775.
Little, B., & Little, P. (2006). Employee Engagement : Conceptual Issues. Journal of
Organizational Culture, Communications and Conflict, 10 (1), 111-120.
Llorens, S., Bakker, A. B., Schaufeli, W. B., & Salanova, M. (2006). Testing the
Robustness of The Job Demands-resources Model. International Journal of Stress
Management, 13, 378-391.
Lucey, J. B., & Hines, P. (2005). Why major lean transitions have not been
sustained? Management Services, 49 (2), 9-14.
Lyons, P. (2008). The crafting of jobs and individual differences. Journal of
Business Psychology, 23, 25-36.
Macey, W. H., & Schneider, B. (2008). The meaning of employee engagement.
Industrial and Organizational Psychology, 1, 3-30.
Macey, W. H., Schneider, B., Barbera, K. M., & Young, S. A. (2009). Employee
Engagement: Tools for Analysis, Practice, and Competitive Advantage. Wiley-
Blackwell.
Malhotra, N. K., & Dash, S. (2011). Marketing Research An Applied Orientation.
Pearson.
Maslach, C., & Leiter, M. P. (1997). The truth about burnout: How organizations
cause personal stress and what to do about it. San Fransisco: Jossey-Bass.
Maslach, C., Jackson, S. E., & Leiter, M. P. (1996). Maslach Burnout Inventory
Manual. Palo Alto: Consulting Psychologists Press.
P a g e | 183
Maslach, C., Schaufeli, W. B., & Leiter, M. P. (2001). Job Burnout. Annual Review
of Psychology, 52, 397-422.
Mauno, S., Kinnunen, U., & Ruokolainen, M. (2007). Job demands and resources as
antecedents of work engagement : a longitudnal study. Journal of Organizational
Behaviour, 70, 149-71.
May, D. R., Gilson, R. L., & Harter, L. M. (2004). The psychological conditions of
meaningfulness, safety and availability and the engagement of the human spirit at
work. Journal of Occupational and Organizational Psychology, 77, 11-37.
McGregor, D. (1960). The Human Side of Enterprise. New Yok: McGraw Hill.
Merrill, R., Aldana, S. G., Pope, J. E., Anderson, D. R., Coberley, C. R.,
Grossmeier, J. J., et al. (2013). Self-Rated Job Performance and Absenteeism
According to Employee Engagement, Health Behaviours and Physical Health.
Journal of Occupational & Environmental Medicine, 55 (1), 10-18.
Montgomery, A., Peeters, M. W., Schaufeli, W. B., & Den Ouden, M. (2003). Work
- home interference amongst newspaper managers: Its relationship with Burnout and
Engagement. Anxiety, Stress & Coping, 16, 195-211.
Mowday, R. T., Porter, L. W., & Dubin, R. (1974). Unit performance, situational
factors and employee attitudes in spatially separated work units. Organizational
Behaviour and Human Performance, 12, 231-248.
Mowday, R. T., Steers, R. M., & Porter, L. W. (1979). The measurement of
organizational commitment. Journal of Vocational Behaviour, 14, 224-227.
Muse, L., Harris, S. G., Giles, W. F., & Field, H. S. (2008). Work-life benefits and
postive organizational behaviour: Is there a connection? Academy of Management
Review, 29 (2), 172-192.
Newman, D. A., Joseph, D. L., Sparkman, T. E., & Carpenter, N. C. (2011). The
work cognition inventory: Initial evidence of construct validity. Human Resource
Development Quarterly, 22 (1), 37-47.
Nunnaly, J. C., & Bernstein, I. H. (1994). Psychometric Theory. New York:
McGraw Hill.
P a g e | 184
Oates, W. (1971). Confessions of a workaholic : The facts about work addiction.
New York: World Publishing.
Oldham, G. R., & Hackman, J. R. (2010). Not what it was and not what it will be:
The future of job design research. Journal of Organizational BBehaviour, 31, 463-
479.
Palmer, S., Cooper, C., & Thomas, K. (2004). A Model of Work Stress. Retrieved
June 16, 2015, from Counselling at Work: www.bacpworkplace.org.uk/journal_pdf/
acw_winter04_a.pdf
Pandit, M. K. (2010). Higher education in India : in search of the teacher. Current
Science, 99 (6), 728-730.
Pareek, U. (1983). Role Stress Scales Manual. Group and Organizational Studies, 8
(3), 357-363.
Parker, S. K., & Ohly, S. (2008). Designing Motivating Jobs. In R. Kenfer, G. Chen,
& R. Pritchard (Eds.), Work Motivation : past, present and future. SIOP:
Organization Frontier Series.
Pines, A. M., Aronson, E., & Kafry, D. (1981). Burnout : From tedium to personal
growth. New York: Free Press.
Porter, L. W., Mowday, R. T., Steers, R. M., & Boulian, P. V. (1974).
Organizational commitment, job satisfaction and turnover among psychiatric
technicians. Journal of Applied Psychology (59), 603-609.
QS World University Rankings 2014/15. (2015). Retrieved September 22, 2015,
from QS Top Universities: http://www.topuniversities.com/university-
rankings/world-university-rankings/2014
Rapidbi. (2007, May 28). Employee Engagement and Satisfaction Models. Retrieved
December 14, 2014, from Rapidbi: https://rapidbi.com/employeeengagement
satisfactionmodels/
Rashtriya Uchchatar Shiksha Abhiyan (RUSA). (2015, February 13). Retrieved
September 22, 2015, from Department of Higher Education, Ministry of HRD,
Government of India : http://mhrd.gov.in/rusa
P a g e | 185
Reijula, K., Rasanen, K., Hamalainen, N., Juntunen, K., Lindbohm, M., Taskinen,
H., et al. (2003). Work environment and occupational health of Finnish
veterinarians. American Journal of Industrial Medicine, 44, 46-57.
Rich, B. L., Lepine, J. A., & Crawford, E. R. (2010). Job engagement: Antecedents
and effects on Job Performance. Academy of Management Journal, 617-635.
Richardsen, A. M., Burke, R. J., & Martinussen, M. (2006). Work and Health
Outcomes among Police Officers: The Mediating Role of Police Cynicism and
Engagement. International Journal of Stress Management, 13, 555-574.
Robertson, I. T., & Cooper, C. L. (2010). Full engagement: The inetgration of
employee engagement and psychological well-being. Leadership and
Organizational Development Journal, 31, 324-336.
Robinson, D., Perryman, S., & Hayday, S. (2004). The Drivers of Employee
Engagement. Retrieved December 12, 2014, from Institute for Public Relations:
http://www.instituteforpr.org/employee-engagement-5/
Rothbard, N. P. (2001). Enriching or Depleting? The Dynamics of Engagement in
Work and Family Roles. Administrative Science Quarterly, 46, 655-684.
Rothmann, S., & Rothmann, S. (2010). Factors associated with employee
engagement in South Africa. South African Journal of Industrial Psychology, 36 (2),
27-38.
Rothmann, S., & Storm, K. (2003). Work Enagement in the South African Police
Service. 11th European Congress of Work and Organizational Psychology, (pp. 14-
17). Lisbon.
Saks, A. M. (2006). Antecedents and Consequences of Employee Engagement.
Journal of Managerial Psychology, 21 (7), 600-619.
Salanova, M., Agut, S., & Peiro', J. M. (2005). Linking organizational resources and
work engagement to employee performance and customer loyalty : The mediation of
service climate. Journal of Applied Psychology, 90 (12), 171-227.
Sarah, L. K. (2014). Great Place To Work. Retrieved October 27, 2014, from
Google Inc: us.greatrated.com/google-inc
P a g e | 186
Scahufeli, W. B. (2013). What is Engagement? In C. Truss, K. Alfes, R. Delbridge,
A. Shantz, & E. C. Soane (Eds.), Employee Engagement in Theory and Practice.
London: Routledge.
Scahufeli, W. B., Bakker, A. B., & Salanova, M. (2006). The measurement of work
engagement with a brief questionnaire : a cross national study. Educational and
Psychological Measurement, 66, 701-16.
Schaufeli, W. B. (2006). The balance of give and take: Toward a social exchange
model of burnout. The International Review of Social Psychology, 19, 87-131.
Schaufeli, W. B., & Bakker, A. B. (2004). Job demands, job resources and their
relationship with burnout and engagement : a multisample study. Journal of
Organizational Behaviour, 25, 293-315.
Schaufeli, W. B., & Salanova, M. (2007). Work engagement : An emerging
psychological concept and its implications for organizations. (S. W. Gilliland, D. D.
Steiner, & D. P. Skarlicki, Eds.) Research in social issues in management, 5.
Schaufeli, W. B., Leiter, M. P., Maslach, C., & Jackson, S. E. (1996). Maslach
Burnout Inventory - General Survey. In C. Maslach, S. E. Jackson, & M. P. Leiter
(Eds.), Maslach Burnout Inventory - Test Manual (pp. 22-26). Palo Alto, CA:
Consulting Psychologists Press.
Schaufeli, W. B., Salanova, M., Gonza'lez-Roma', V., & Bakker, A. B. (2002). The
measurement of engagement and burnout : A two sample confirmatory factor
analytic approach. Journal of Happiness Studies, 3, 71-92.
Schiemann, W A; Morgan, B S. (2006). Strategic surveys :Linking people to
business strategy. (A. I. Kraut, Ed.) San Fransisco: Jossey-Bass.
Seligman, M. E., & Csikszentmihalyi, M. (2000). Positive Psychology : An
Introduction. American Psychologist, 55 (1), 5-14.
Shaufeli, W. B., & Bakker, A. B. The conceptualization and measurement of work
engagement : A review. In A. B. Bakker, & M. P. Leiter (Eds.), Work Engagement :
Recent Developments in Theory and Research. New York: Psychology Press.
P a g e | 187
Shuck, B., & Wollard, K. (2008). Employee engagement: Motivating and
connecting with tomorrow‘s workforce. New horizons in Adult Education and
Human Resource Development, 22 (1), 48-53.
Shuck, B., Ghosh, R., Zigarmi, D., & Nimon, K. (2013). The Jingle Jangle of
Employee Engagement: Further Exploration of the Emerging Construct and
Implications for Workplace Learning and Performance. Human Resource
Development Review, 12 (1), 11-35.
Shuck, B., Reio, T., & Rocco, T. (2011). Employee engagement: An antecedent and
outcome approach to model development. Human Resource Development
International, 14, 427-445.
Sonnentag, S., Dormann, C., & Demerouti, E. (2010). Not all days are created equal:
The concept of state work engagement. In A. B. Bakker, & M. P. Leiter (Eds.),
Work engagement: recent developments in theory and research (pp. 25-38). New
York: Psychology Press.
Stress at Work. (1999). Retrieved June 15, 2015, from National Institute of
Occupational Safety and Health: www.cdc.gov/niosh/docs/99-101/
Strumpfer, D. W. (2003). Reselience and Burnout : A stich that could save nine.
South African Journal of Psychology, 33, 69-79.
Sy, T., Cote, S., & Saavedra, R. (2005). The contagious leader: Impact of leader's
affect on group member affect and group processes. Journal of Applied Psychology,
90, 295-305.
Tausig, M., & Fenwick, R. (2011). Unbinding Time : Alternate Work Schedules and
Work Life Balance. Journal of Family and Economic Issues, 22 (2), 101-119.
Tausig, M., & Fenwick, R. (2001). Unbinding Time: Alternate Work Schedules and
Work-Life Balance. Journal of Family and Economic Issues, 22 (2), 101-119.
Thornthwaite, L. (2004). Working time and work-family balance: A review of
employees‘ preferences. Asia Pacific Journal of Human Resources, 42, 166-184.
Tims, M., & Bakker, A. B. (2010). Job crafting: Towards a new model of individual
job redesign. South African Journal of Industrial Psychology, 36, 1-9.
P a g e | 188
Tims, M., Bakker, A. B., & Derks, D. (2012). Development and validation of the job
crafting scale. Journal of Vocational Behaviour, 80, 173-186.
Tims, M., Bakker, A. B., Derks, D., & Rhenen, W. v. (2013). Job Crafting at the
Team and Individual Level: Implications for Work Engagement and Performance.
Group and Organization Management, XX (X), 1-28.
Tiwari, B. N. (2014, 12 22). Educational Statistics at a Glance. Retrieved June 15,
2015, from Government of India Ministry of HRD: http://mhrd.gov.in/sites/upload_
files/mhrd/files/statistics/EAG2014.pdf
Towers Watson. (2014, August). The 2014 Global Workforce Survey. Retrieved
September 22, 2015, from https://www.towerswatson.com/en-IN/Insights/IC-
Types/Survey-Research-Results/2014/08/the-2014-global-workforce-study
Ulrich, D. (1997). Human Resource Champions. Massachusetts : Harvard Business
School Press.
Wagner, R., & Harter, J. (2006). 12: The Elements of Great Managing. Washington,
D.C: The Gallup Organization.
Wellins, R., & Concelman, J. (2005). Personal engagement driving growth at the
see-level. Retrieved May 25, 2010, from www.ddiworld.com/pdf/ddi_personal
engagement_ar.pdf
Westman, M. (2001). Stress and Strain Crossover. Human Relations, 54, 557-91.
Winter, R., Taylor, T., & Sarros, J. (2000). Trouble at mill : Quality of academic
work life issues within a comprehensive Australian University. Studies in Higher
Education, 25, 279-294.
Wrzesniewski, A., & Dutton, J. E. (2001). Crafting a job : Revisioning employees as
active crafters of their work. Academy of Management Review, 26, 179-201.
Wrzesniewski, A., McCauley, C., Rozin, P., & Schwartz, B. (1997). Jobs, careers
and callings: People's reactions to their work. Journal of Research in Personality,
31, 21-33.
P a g e | 189
Xanthopoulou, D., Bakker, A. B., Demerouti, E., & Schaufeli, W. B. (2007). The
role of personal resources in job demands - resources model. International Journal
of Stress Management, 14, 121-141.
Yadav, V. G., & Yadav, G. D. (2010). Fuelling the Indian economic engine by
retooling Indian technical education. Current Science, 98 (11), 1442-1457.
**********
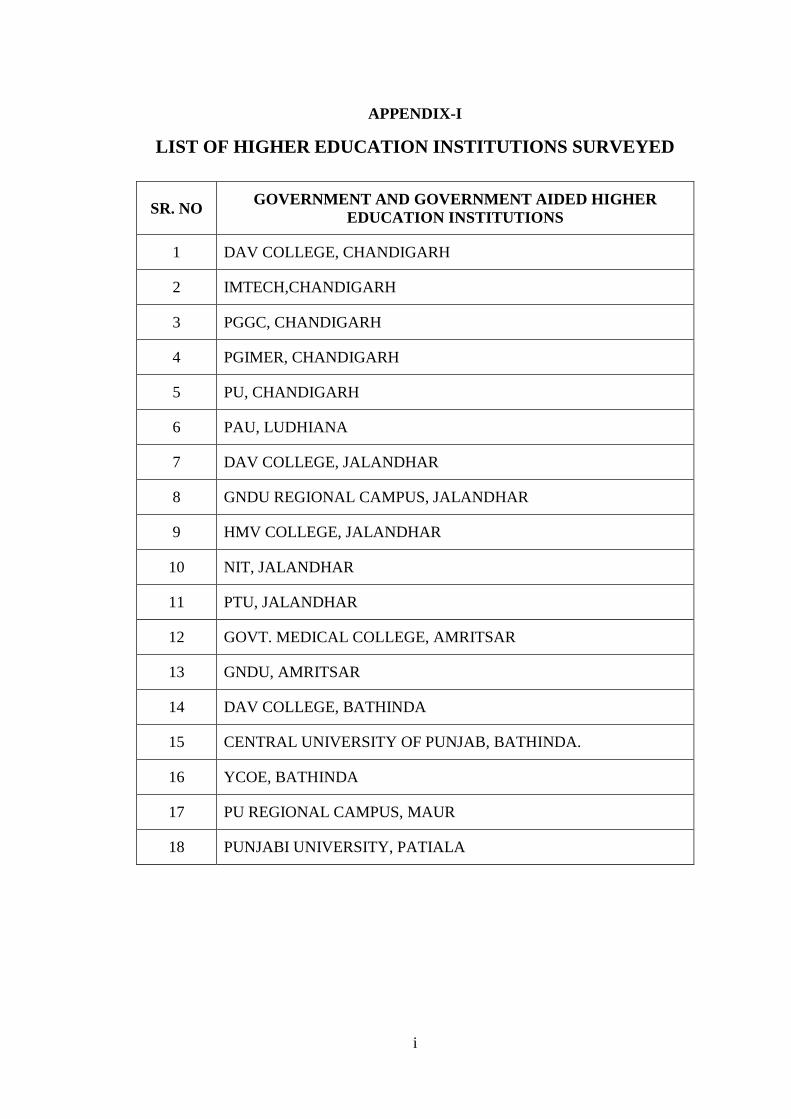
i
APPENDIX-I
LIST OF HIGHER EDUCATION INSTITUTIONS SURVEYED
SR. NO GOVERNMENT AND GOVERNMENT AIDED HIGHER
EDUCATION INSTITUTIONS
1 DAV COLLEGE, CHANDIGARH
2 IMTECH,CHANDIGARH
3 PGGC, CHANDIGARH
4 PGIMER, CHANDIGARH
5 PU, CHANDIGARH
6 PAU, LUDHIANA
7 DAV COLLEGE, JALANDHAR
8 GNDU REGIONAL CAMPUS, JALANDHAR
9 HMV COLLEGE, JALANDHAR
10 NIT, JALANDHAR
11 PTU, JALANDHAR
12 GOVT. MEDICAL COLLEGE, AMRITSAR
13 GNDU, AMRITSAR
14 DAV COLLEGE, BATHINDA
15 CENTRAL UNIVERSITY OF PUNJAB, BATHINDA.
16 YCOE, BATHINDA
17 PU REGIONAL CAMPUS, MAUR
18 PUNJABI UNIVERSITY, PATIALA
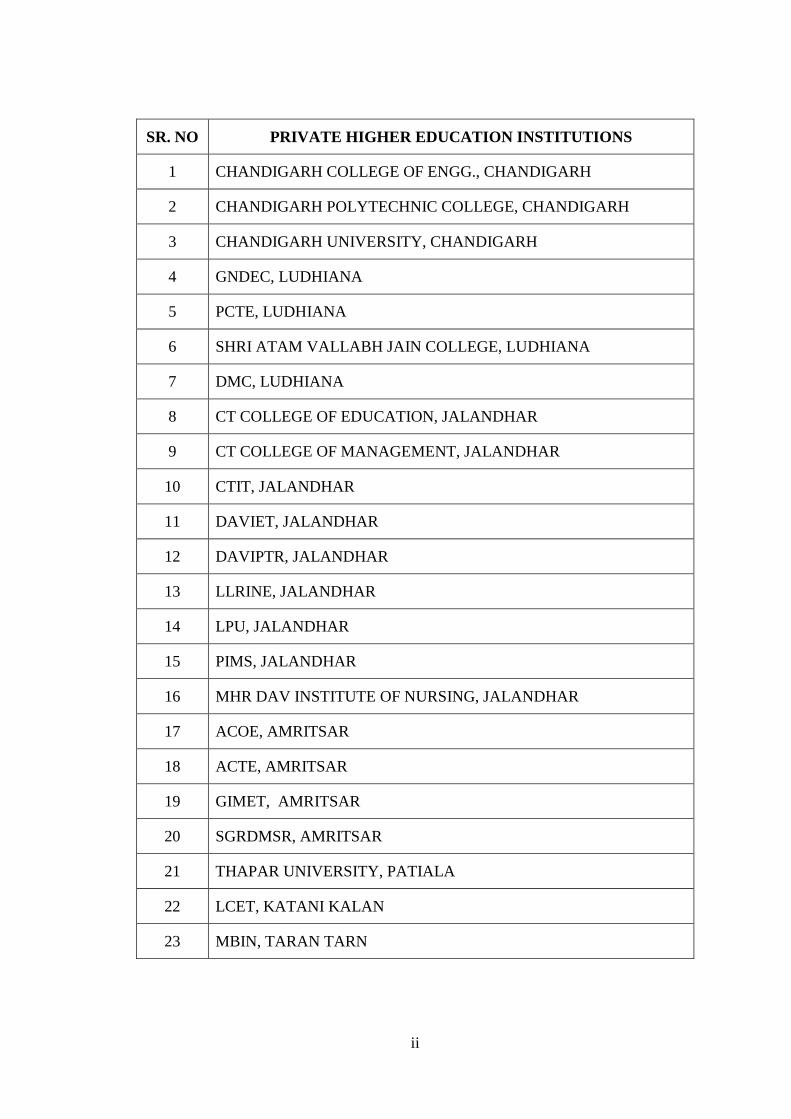
ii
SR. NO PRIVATE HIGHER EDUCATION INSTITUTIONS
1 CHANDIGARH COLLEGE OF ENGG., CHANDIGARH
2 CHANDIGARH POLYTECHNIC COLLEGE, CHANDIGARH
3 CHANDIGARH UNIVERSITY, CHANDIGARH
4 GNDEC, LUDHIANA
5 PCTE, LUDHIANA
6 SHRI ATAM VALLABH JAIN COLLEGE, LUDHIANA
7 DMC, LUDHIANA
8 CT COLLEGE OF EDUCATION, JALANDHAR
9 CT COLLEGE OF MANAGEMENT, JALANDHAR
10 CTIT, JALANDHAR
11 DAVIET, JALANDHAR
12 DAVIPTR, JALANDHAR
13 LLRINE, JALANDHAR
14 LPU, JALANDHAR
15 PIMS, JALANDHAR
16 MHR DAV INSTITUTE OF NURSING, JALANDHAR
17 ACOE, AMRITSAR
18 ACTE, AMRITSAR
19 GIMET, AMRITSAR
20 SGRDMSR, AMRITSAR
21 THAPAR UNIVERSITY, PATIALA
22 LCET, KATANI KALAN
23 MBIN, TARAN TARN
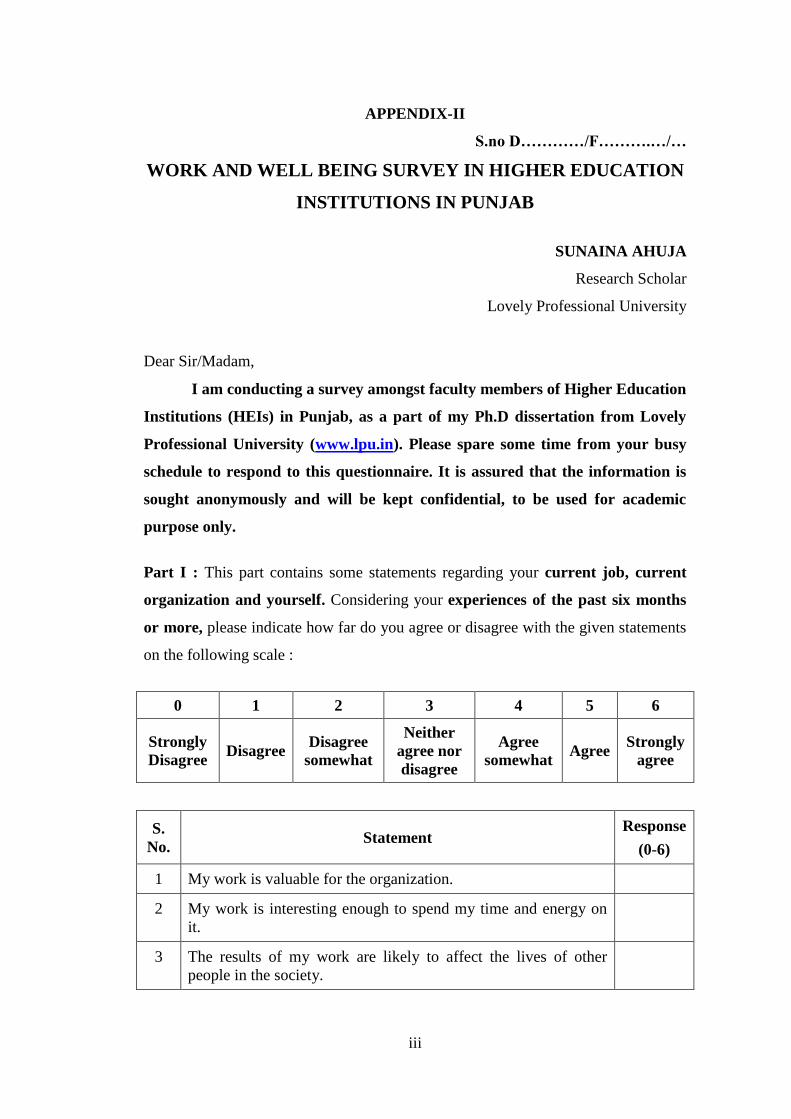
iii
APPENDIX-II
S.no D…………/F……….…/…
WORK AND WELL BEING SURVEY IN HIGHER EDUCATION
INSTITUTIONS IN PUNJAB
SUNAINA AHUJA
Research Scholar
Lovely Professional University
Dear Sir/Madam,
I am conducting a survey amongst faculty members of Higher Education
Institutions (HEIs) in Punjab, as a part of my Ph.D dissertation from Lovely
Professional University (www.lpu.in). Please spare some time from your busy
schedule to respond to this questionnaire. It is assured that the information is
sought anonymously and will be kept confidential, to be used for academic
purpose only.
Part I : This part contains some statements regarding your current job, current
organization and yourself. Considering your experiences of the past six months
or more, please indicate how far do you agree or disagree with the given statements
on the following scale :
0 1 2 3 4 5 6
Strongly
Disagree Disagree
Disagree
somewhat
Neither
agree nor
disagree
Agree
somewhat Agree
Strongly
agree
S.
No. Statement
Response
(0-6)
1 My work is valuable for the organization.
2 My work is interesting enough to spend my time and energy on
it.
3 The results of my work are likely to affect the lives of other
people in the society.
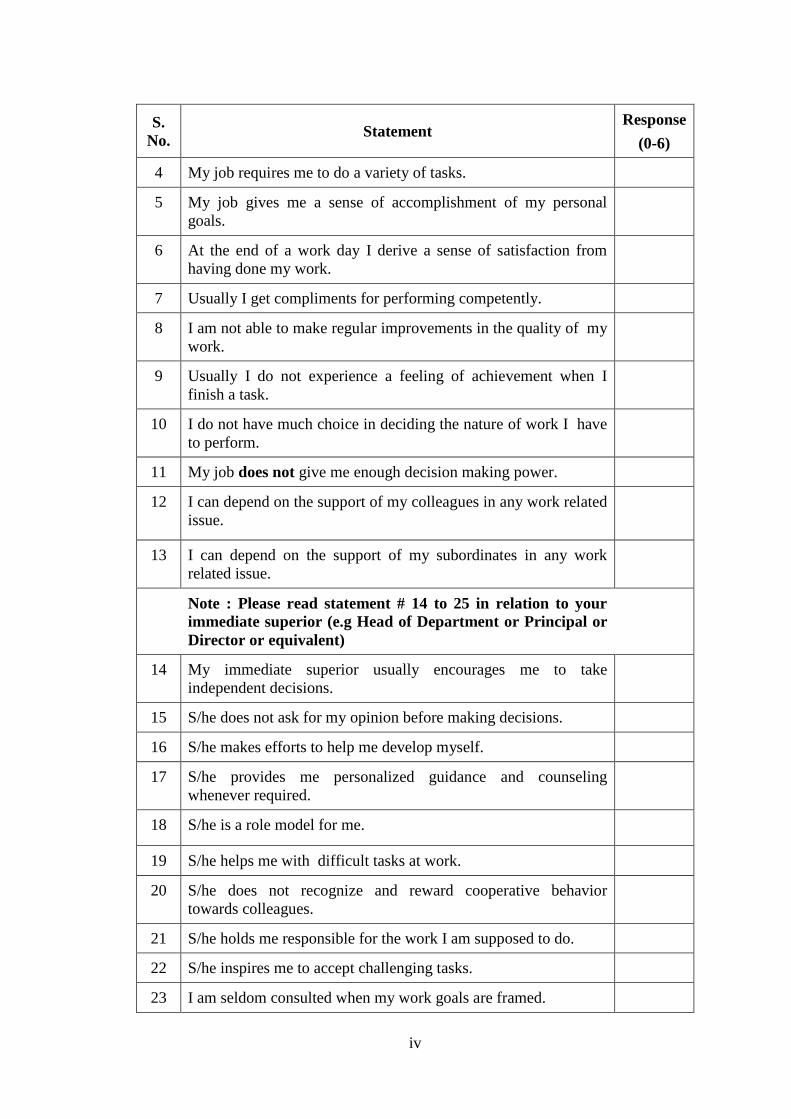
iv
S.
No. Statement
Response
(0-6)
4 My job requires me to do a variety of tasks.
5 My job gives me a sense of accomplishment of my personal
goals.
6 At the end of a work day I derive a sense of satisfaction from
having done my work.
7 Usually I get compliments for performing competently.
8 I am not able to make regular improvements in the quality of my
work.
9 Usually I do not experience a feeling of achievement when I
finish a task.
10 I do not have much choice in deciding the nature of work I have
to perform.
11 My job does not give me enough decision making power.
12
I can depend on the support of my colleagues in any work related
issue.
13 I can depend on the support of my subordinates in any work
related issue.
Note : Please read statement # 14 to 25 in relation to your
immediate superior (e.g Head of Department or Principal or
Director or equivalent)
14 My immediate superior usually encourages me to take
independent decisions.
15 S/he does not ask for my opinion before making decisions.
16 S/he makes efforts to help me develop myself.
17 S/he provides me personalized guidance and counseling
whenever required.
18 S/he is a role model for me.
19 S/he helps me with difficult tasks at work.
20 S/he does not recognize and reward cooperative behavior
towards colleagues.
21 S/he holds me responsible for the work I am supposed to do.
22 S/he inspires me to accept challenging tasks.
23 I am seldom consulted when my work goals are framed.
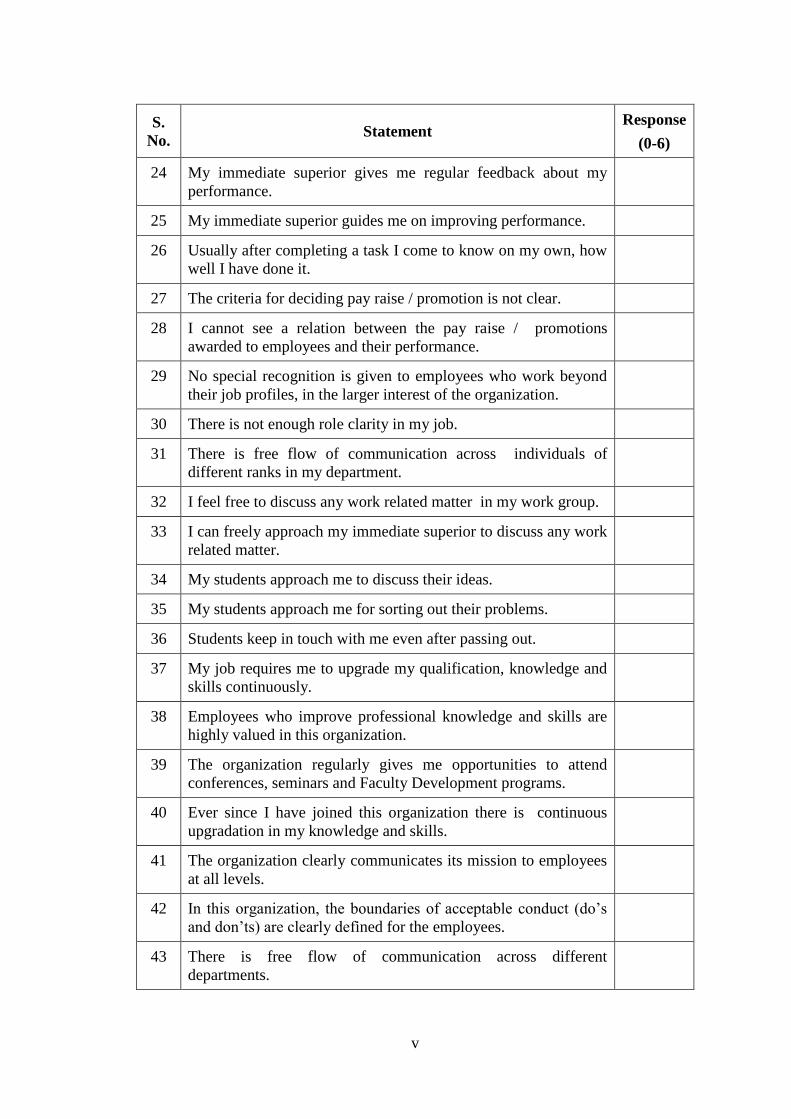
v
S.
No. Statement
Response
(0-6)
24 My immediate superior gives me regular feedback about my
performance.
25 My immediate superior guides me on improving performance.
26 Usually after completing a task I come to know on my own, how
well I have done it.
27 The criteria for deciding pay raise / promotion is not clear.
28 I cannot see a relation between the pay raise / promotions
awarded to employees and their performance.
29 No special recognition is given to employees who work beyond
their job profiles, in the larger interest of the organization.
30 There is not enough role clarity in my job.
31 There is free flow of communication across individuals of
different ranks in my department.
32 I feel free to discuss any work related matter in my work group.
33 I can freely approach my immediate superior to discuss any work
related matter.
34 My students approach me to discuss their ideas.
35 My students approach me for sorting out their problems.
36 Students keep in touch with me even after passing out.
37 My job requires me to upgrade my qualification, knowledge and
skills continuously.
38 Employees who improve professional knowledge and skills are
highly valued in this organization.
39 The organization regularly gives me opportunities to attend
conferences, seminars and Faculty Development programs.
40 Ever since I have joined this organization there is continuous
upgradation in my knowledge and skills.
41 The organization clearly communicates its mission to employees
at all levels.
42 In this organization, the boundaries of acceptable conduct (do’s
and don’ts) are clearly defined for the employees.
43 There is free flow of communication across different
departments.
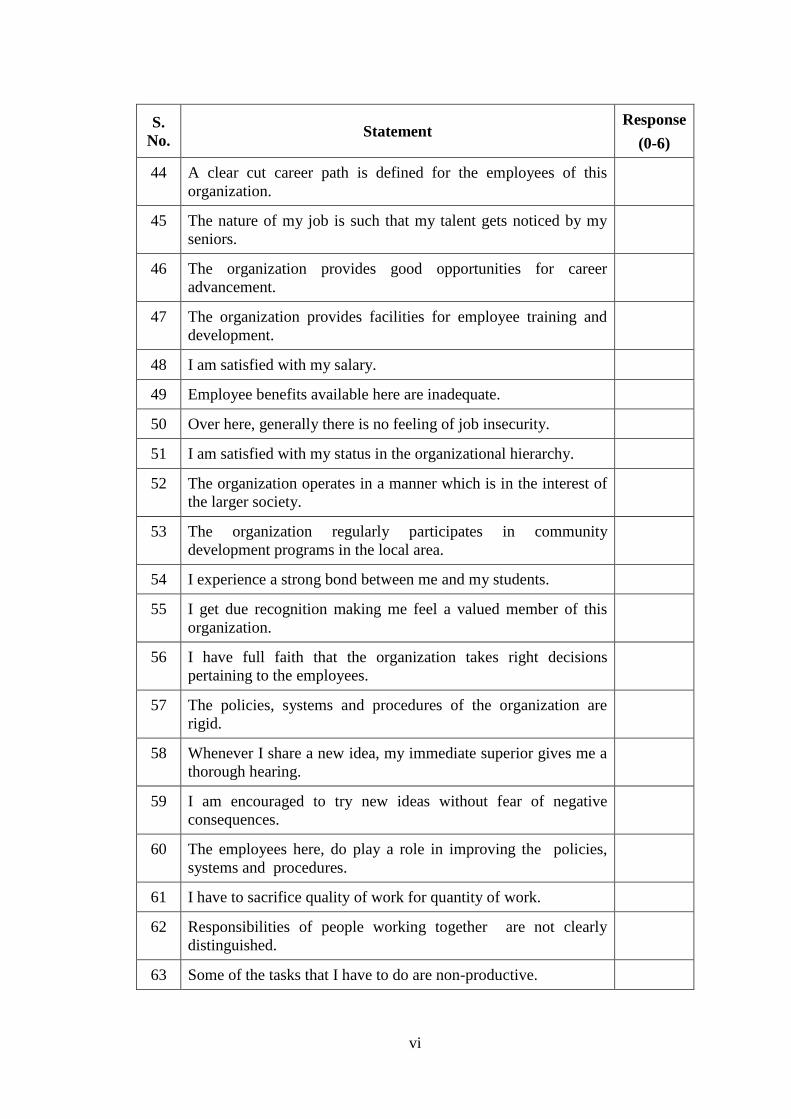
vi
S.
No. Statement
Response
(0-6)
44 A clear cut career path is defined for the employees of this
organization.
45 The nature of my job is such that my talent gets noticed by my
seniors.
46 The organization provides good opportunities for career
advancement.
47 The organization provides facilities for employee training and
development.
48 I am satisfied with my salary.
49 Employee benefits available here are inadequate.
50 Over here, generally there is no feeling of job insecurity.
51 I am satisfied with my status in the organizational hierarchy.
52 The organization operates in a manner which is in the interest of
the larger society.
53 The organization regularly participates in community
development programs in the local area.
54 I experience a strong bond between me and my students.
55 I get due recognition making me feel a valued member of this
organization.
56 I have full faith that the organization takes right decisions
pertaining to the employees.
57 The policies, systems and procedures of the organization are
rigid.
58 Whenever I share a new idea, my immediate superior gives me a
thorough hearing.
59 I am encouraged to try new ideas without fear of negative
consequences.
60 The employees here, do play a role in improving the policies,
systems and procedures.
61 I have to sacrifice quality of work for quantity of work.
62 Responsibilities of people working together are not clearly
distinguished.
63 Some of the tasks that I have to do are non-productive.
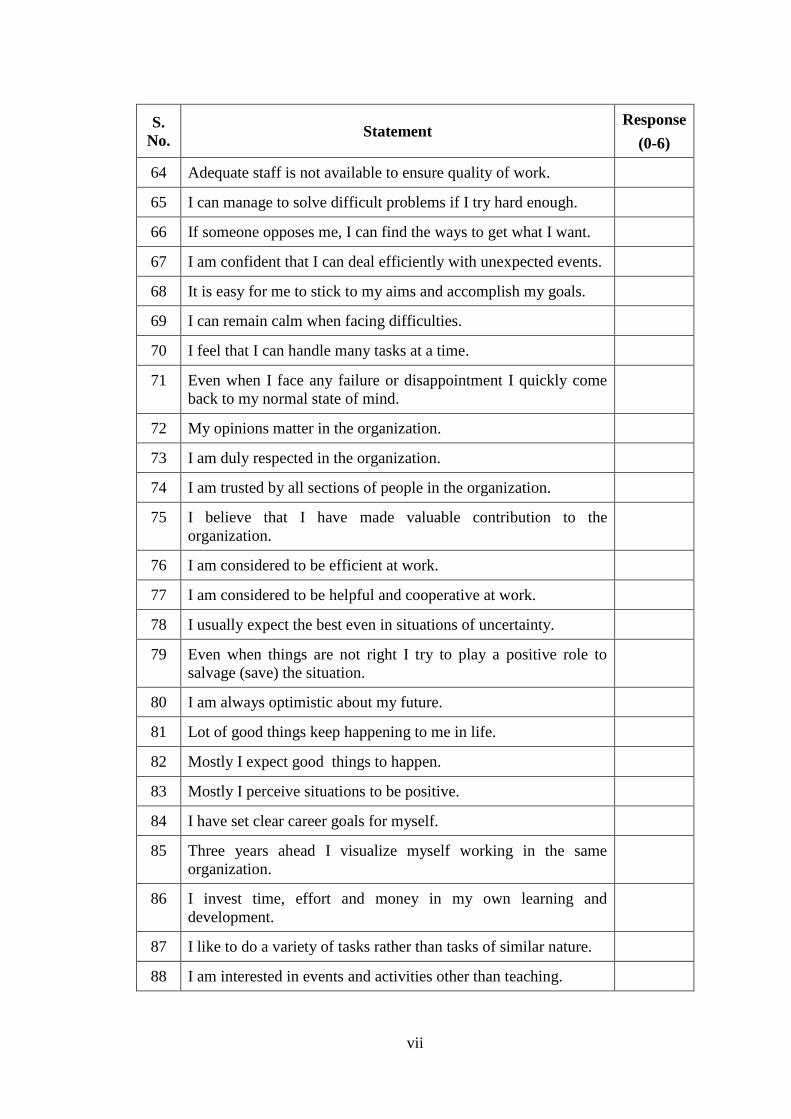
vii
S.
No. Statement
Response
(0-6)
64 Adequate staff is not available to ensure quality of work.
65 I can manage to solve difficult problems if I try hard enough.
66 If someone opposes me, I can find the ways to get what I want.
67 I am confident that I can deal efficiently with unexpected events.
68 It is easy for me to stick to my aims and accomplish my goals.
69 I can remain calm when facing difficulties.
70 I feel that I can handle many tasks at a time.
71 Even when I face any failure or disappointment I quickly come
back to my normal state of mind.
72 My opinions matter in the organization.
73 I am duly respected in the organization.
74 I am trusted by all sections of people in the organization.
75 I believe that I have made valuable contribution to the
organization.
76 I am considered to be efficient at work.
77 I am considered to be helpful and cooperative at work.
78 I usually expect the best even in situations of uncertainty.
79 Even when things are not right I try to play a positive role to
salvage (save) the situation.
80 I am always optimistic about my future.
81 Lot of good things keep happening to me in life.
82 Mostly I expect good things to happen.
83 Mostly I perceive situations to be positive.
84 I have set clear career goals for myself.
85 Three years ahead I visualize myself working in the same
organization.
86 I invest time, effort and money in my own learning and
development.
87 I like to do a variety of tasks rather than tasks of similar nature.
88 I am interested in events and activities other than teaching.
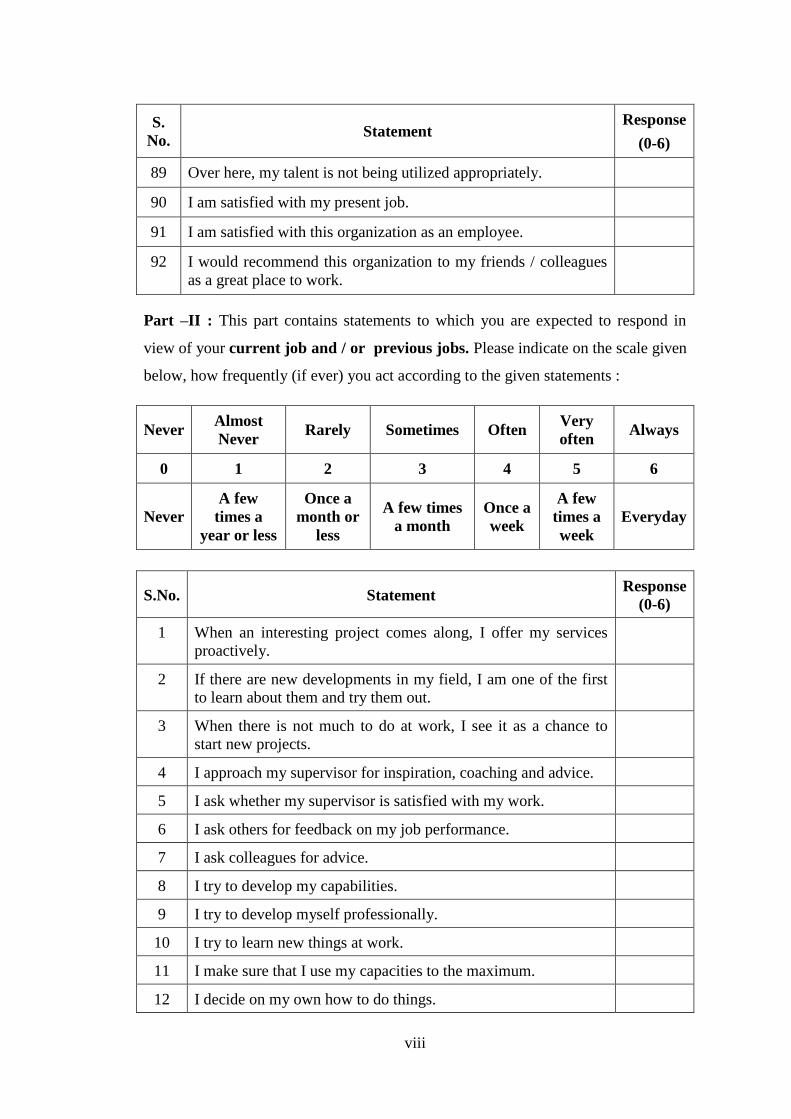
viii
S.
No. Statement
Response
(0-6)
89 Over here, my talent is not being utilized appropriately.
90 I am satisfied with my present job.
91 I am satisfied with this organization as an employee.
92 I would recommend this organization to my friends / colleagues
as a great place to work.
Part –II : This part contains statements to which you are expected to respond in
view of your current job and / or previous jobs. Please indicate on the scale given
below, how frequently (if ever) you act according to the given statements :
Never Almost
Never Rarely Sometimes Often
Very
often Always
0 1 2 3 4 5 6
Never
A few
times a
year or less
Once a
month or
less
A few times
a month
Once a
week
A few
times a
week
Everyday
S.No. Statement Response
(0-6)
1 When an interesting project comes along, I offer my services
proactively.
2 If there are new developments in my field, I am one of the first
to learn about them and try them out.
3 When there is not much to do at work, I see it as a chance to
start new projects.
4 I approach my supervisor for inspiration, coaching and advice.
5 I ask whether my supervisor is satisfied with my work.
6 I ask others for feedback on my job performance.
7 I ask colleagues for advice.
8 I try to develop my capabilities.
9 I try to develop myself professionally.
10 I try to learn new things at work.
11 I make sure that I use my capacities to the maximum.
12 I decide on my own how to do things.
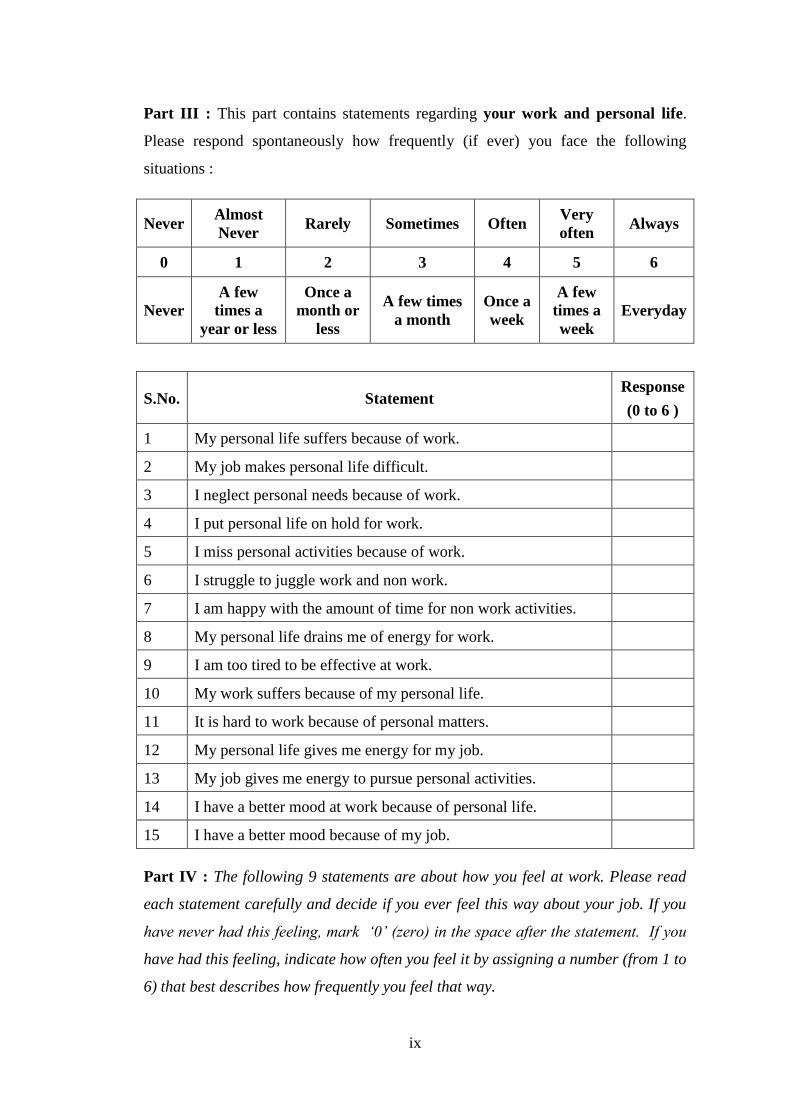
ix
Part III : This part contains statements regarding your work and personal life.
Please respond spontaneously how frequently (if ever) you face the following
situations :
Never Almost
Never Rarely Sometimes Often
Very
often Always
0 1 2 3 4 5 6
Never
A few
times a
year or less
Once a
month or
less
A few times
a month
Once a
week
A few
times a
week
Everyday
S.No. Statement Response
(0 to 6 )
1 My personal life suffers because of work.
2 My job makes personal life difficult.
3 I neglect personal needs because of work.
4 I put personal life on hold for work.
5 I miss personal activities because of work.
6 I struggle to juggle work and non work.
7 I am happy with the amount of time for non work activities.
8 My personal life drains me of energy for work.
9 I am too tired to be effective at work.
10 My work suffers because of my personal life.
11 It is hard to work because of personal matters.
12 My personal life gives me energy for my job.
13 My job gives me energy to pursue personal activities.
14 I have a better mood at work because of personal life.
15 I have a better mood because of my job.
Part IV : The following 9 statements are about how you feel at work. Please read
each statement carefully and decide if you ever feel this way about your job. If you
have never had this feeling, mark ‘0’ (zero) in the space after the statement. If you
have had this feeling, indicate how often you feel it by assigning a number (from 1 to
6) that best describes how frequently you feel that way.
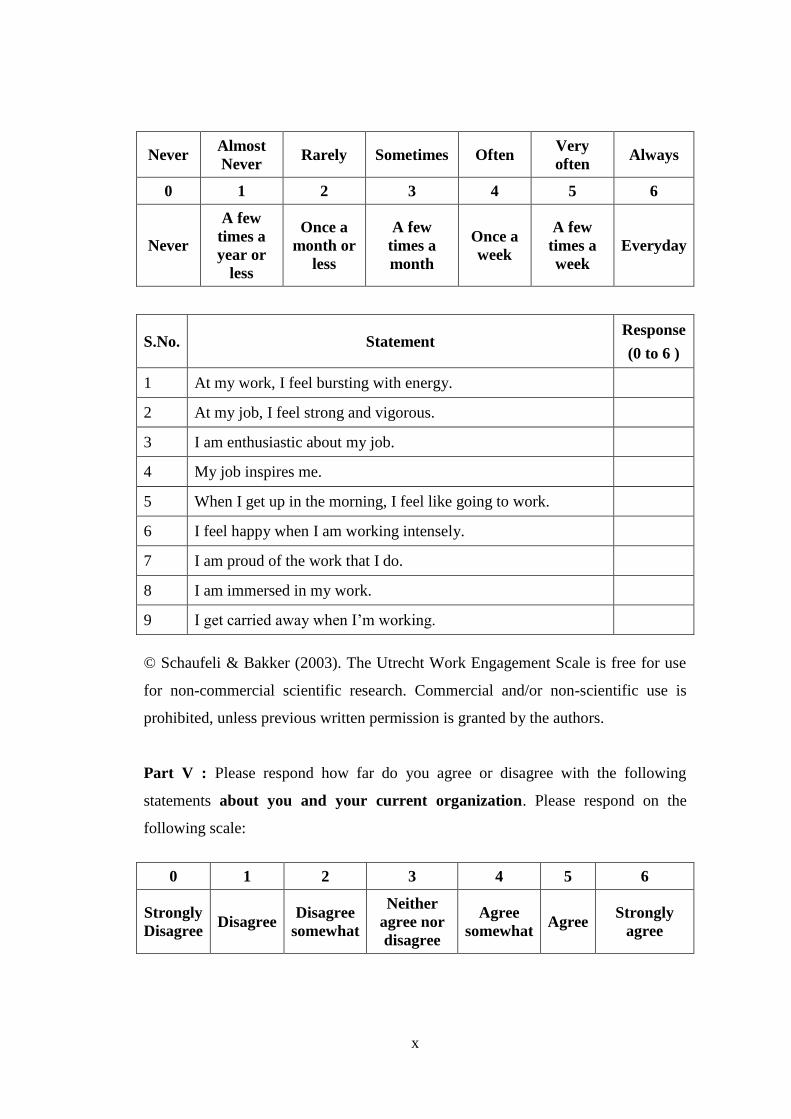
x
Never Almost
Never Rarely Sometimes Often
Very
often Always
0 1 2 3 4 5 6
Never
A few
times a
year or
less
Once a
month or
less
A few
times a
month
Once a
week
A few
times a
week
Everyday
S.No. Statement Response
(0 to 6 )
1 At my work, I feel bursting with energy.
2 At my job, I feel strong and vigorous.
3 I am enthusiastic about my job.
4 My job inspires me.
5 When I get up in the morning, I feel like going to work.
6 I feel happy when I am working intensely.
7 I am proud of the work that I do.
8 I am immersed in my work.
9 I get carried away when I’m working.
© Schaufeli & Bakker (2003). The Utrecht Work Engagement Scale is free for use
for non-commercial scientific research. Commercial and/or non-scientific use is
prohibited, unless previous written permission is granted by the authors.
Part V : Please respond how far do you agree or disagree with the following
statements about you and your current organization. Please respond on the
following scale:
0 1 2 3 4 5 6
Strongly
Disagree Disagree
Disagree
somewhat
Neither
agree nor
disagree
Agree
somewhat Agree
Strongly
agree
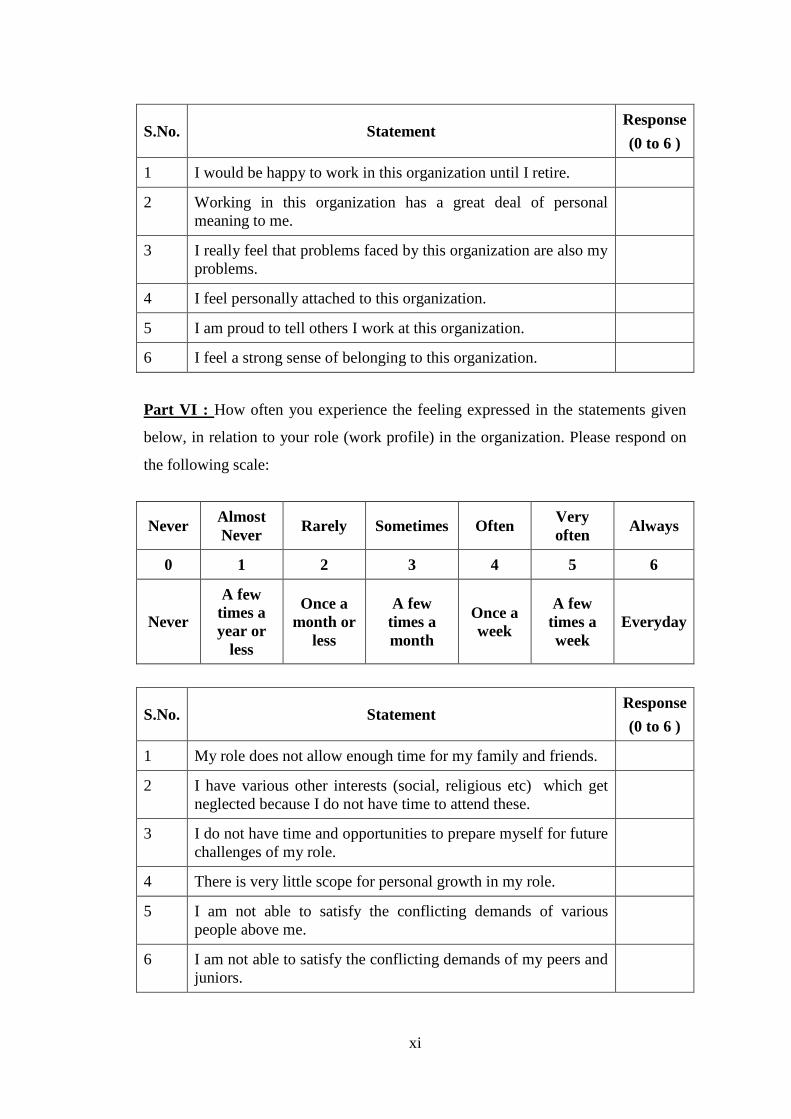
xi
S.No. Statement Response
(0 to 6 )
1 I would be happy to work in this organization until I retire.
2 Working in this organization has a great deal of personal
meaning to me.
3 I really feel that problems faced by this organization are also my
problems.
4 I feel personally attached to this organization.
5 I am proud to tell others I work at this organization.
6 I feel a strong sense of belonging to this organization.
Part VI : How often you experience the feeling expressed in the statements given
below, in relation to your role (work profile) in the organization. Please respond on
the following scale:
Never Almost
Never Rarely Sometimes Often
Very
often Always
0 1 2 3 4 5 6
Never
A few
times a
year or
less
Once a
month or
less
A few
times a
month
Once a
week
A few
times a
week
Everyday
S.No. Statement Response
(0 to 6 )
1 My role does not allow enough time for my family and friends.
2 I have various other interests (social, religious etc) which get
neglected because I do not have time to attend these.
3 I do not have time and opportunities to prepare myself for future
challenges of my role.
4 There is very little scope for personal growth in my role.
5 I am not able to satisfy the conflicting demands of various
people above me.
6 I am not able to satisfy the conflicting demands of my peers and
juniors.
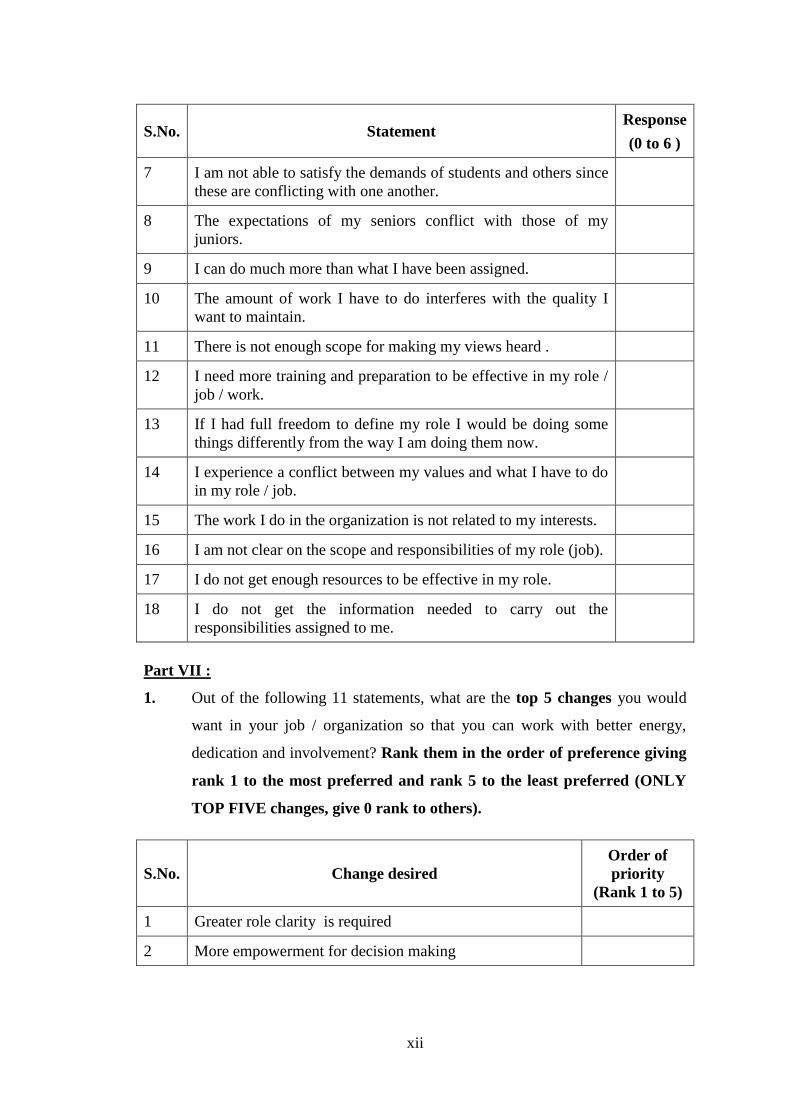
xii
S.No. Statement Response
(0 to 6 )
7 I am not able to satisfy the demands of students and others since
these are conflicting with one another.
8 The expectations of my seniors conflict with those of my
juniors.
9 I can do much more than what I have been assigned.
10 The amount of work I have to do interferes with the quality I
want to maintain.
11 There is not enough scope for making my views heard .
12 I need more training and preparation to be effective in my role /
job / work.
13 If I had full freedom to define my role I would be doing some
things differently from the way I am doing them now.
14 I experience a conflict between my values and what I have to do
in my role / job.
15 The work I do in the organization is not related to my interests.
16 I am not clear on the scope and responsibilities of my role (job).
17 I do not get enough resources to be effective in my role.
18 I do not get the information needed to carry out the
responsibilities assigned to me.
Part VII :
1. Out of the following 11 statements, what are the top 5 changes you would
want in your job / organization so that you can work with better energy,
dedication and involvement? Rank them in the order of preference giving
rank 1 to the most preferred and rank 5 to the least preferred (ONLY
TOP FIVE changes, give 0 rank to others).
S.No. Change desired
Order of
priority
(Rank 1 to 5)
1 Greater role clarity is required
2 More empowerment for decision making
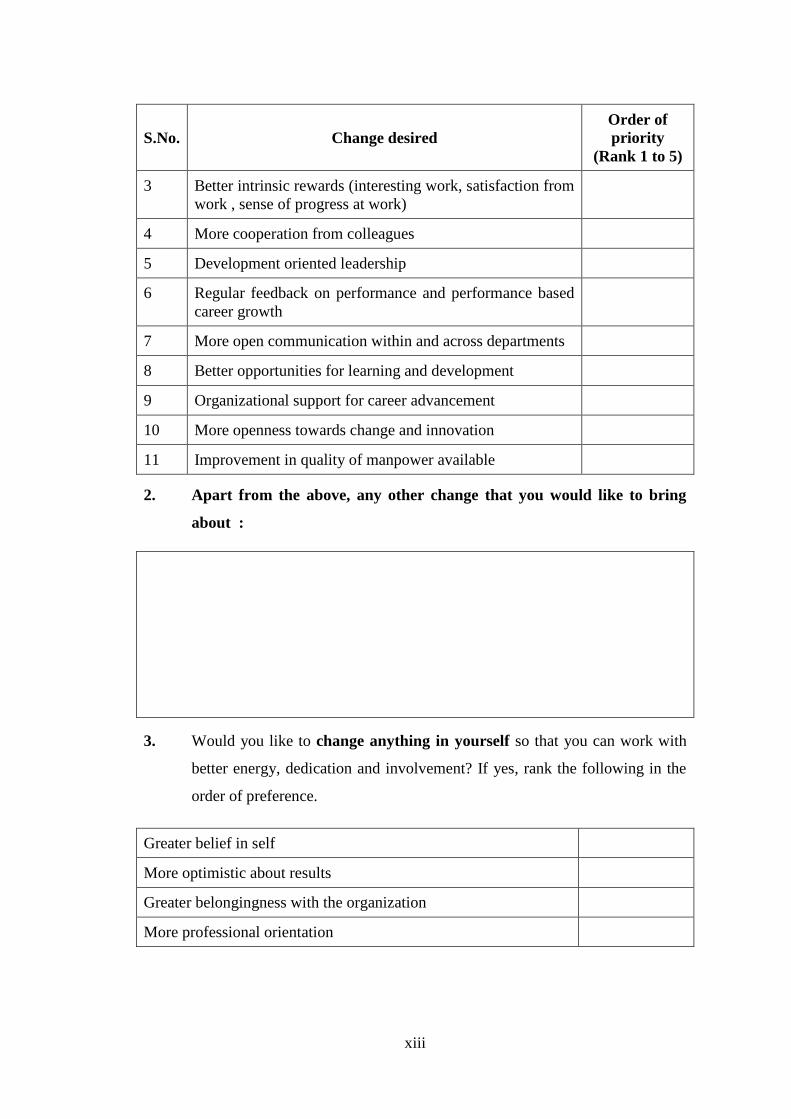
xiii
S.No. Change desired
Order of
priority
(Rank 1 to 5)
3 Better intrinsic rewards (interesting work, satisfaction from
work , sense of progress at work)
4 More cooperation from colleagues
5 Development oriented leadership
6 Regular feedback on performance and performance based
career growth
7 More open communication within and across departments
8 Better opportunities for learning and development
9 Organizational support for career advancement
10 More openness towards change and innovation
11 Improvement in quality of manpower available
2. Apart from the above, any other change that you would like to bring
about :
3. Would you like to change anything in yourself so that you can work with
better energy, dedication and involvement? If yes, rank the following in the
order of preference.
Greater belief in self
More optimistic about results
Greater belongingness with the organization
More professional orientation
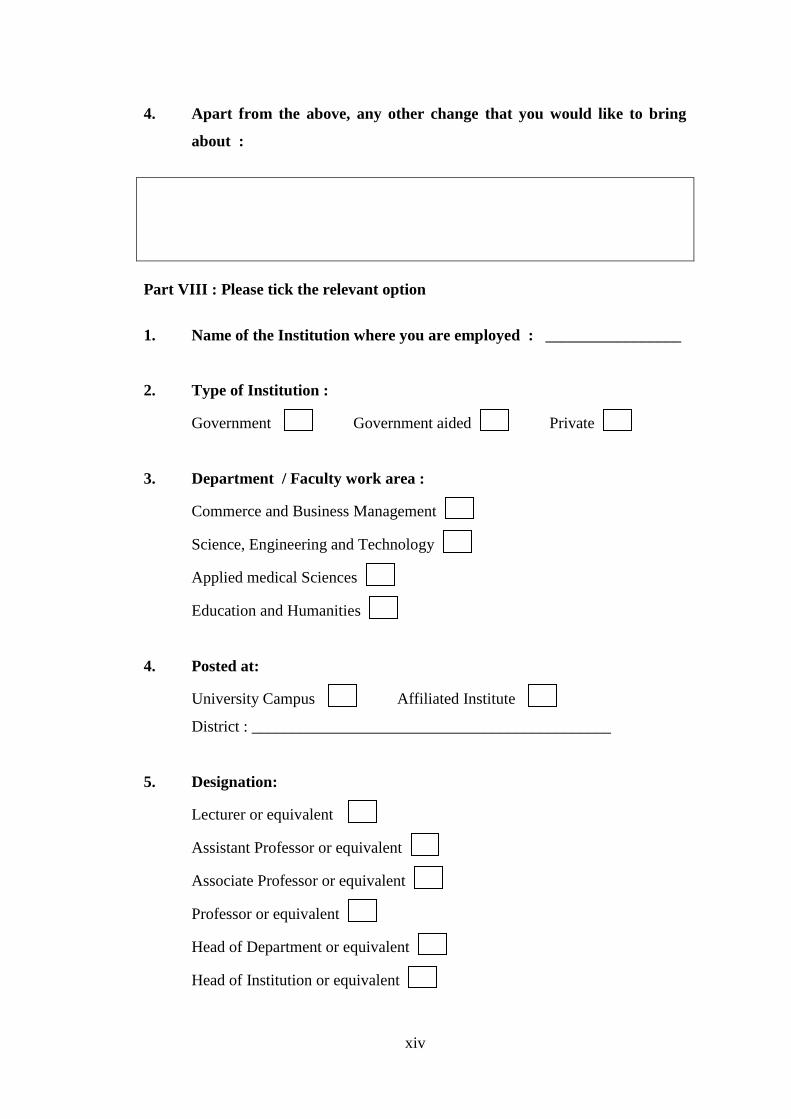
xiv
4. Apart from the above, any other change that you would like to bring
about :
Part VIII : Please tick the relevant option
1. Name of the Institution where you are employed : _________________
2. Type of Institution :
Government Government aided Private
3. Department / Faculty work area :
Commerce and Business Management
Science, Engineering and Technology
Applied medical Sciences
Education and Humanities
4. Posted at:
University Campus Affiliated Institute
District : _____________________________________________
5. Designation:
Lecturer or equivalent
Assistant Professor or equivalent
Associate Professor or equivalent
Professor or equivalent
Head of Department or equivalent
Head of Institution or equivalent
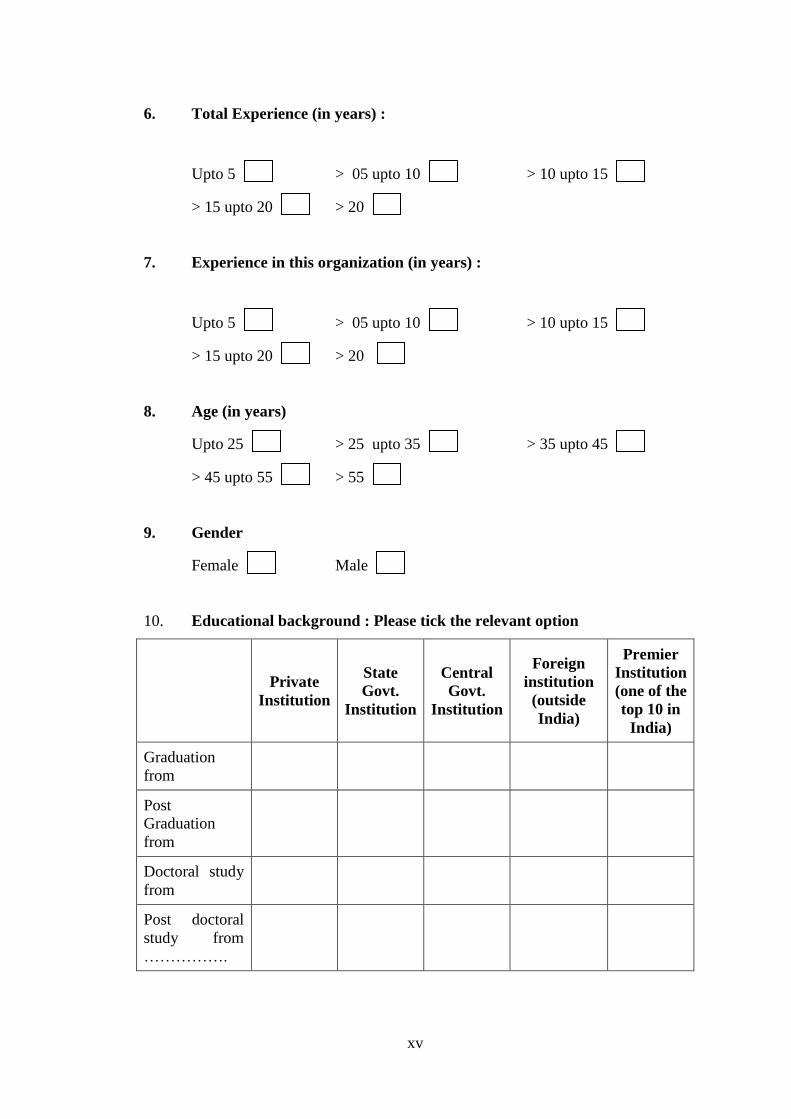
xv
6. Total Experience (in years) :
Upto 5 > 05 upto 10 > 10 upto 15
> 15 upto 20 > 20
7. Experience in this organization (in years) :
Upto 5 > 05 upto 10 > 10 upto 15
> 15 upto 20 > 20
8. Age (in years)
Upto 25 > 25 upto 35 > 35 upto 45
> 45 upto 55 > 55
9. Gender
Female Male
10. Educational background : Please tick the relevant option
Private
Institution
State
Govt.
Institution
Central
Govt.
Institution
Foreign
institution
(outside
India)
Premier
Institution
(one of the
top 10 in
India)
Graduation
from
Post
Graduation
from
Doctoral study
from
Post doctoral
study from
…………….
xvi
11. Regional background
Rural Urban
12. Your Monthly Salary (Rs.)
Upto 30,000 30,001 to 50,000
50,001 upto 70,000 70,001 upto 90,000
90,001 to 1,10,000 > 1,10,000
Thanks a lot for your cooperation.
…………………………
………………..
……….
…..
...


