Embed Size (px)
Citation preview

Accepted Manuscript
Energy Recovery in Individuals with Knee Osteoarthritis
Tawnee L. Sparling, BS Daniel Schmitt, PhD Charlotte E. Miller, PhD Farshid Guilak,PhD Tamara J. Somers, PhD Francis J. Keefe, PhD Robin M. Queen, PhD
PII: S1063-4584(14)01039-5
DOI: 10.1016/j.joca.2014.04.004
Reference: YJOCA 3116
To appear in: Osteoarthritis and Cartilage
Received Date: 31 July 2013
Revised Date: 10 March 2014
Accepted Date: 4 April 2014
Please cite this article as: Sparling TL, Schmitt D, Miller CE, Guilak F, Somers TJ, Keefe FJ, QueenRM, Energy Recovery in Individuals with Knee Osteoarthritis, Osteoarthritis and Cartilage (2014), doi:10.1016/j.joca.2014.04.004.
This is a PDF file of an unedited manuscript that has been accepted for publication. As a service toour customers we are providing this early version of the manuscript. The manuscript will undergocopyediting, typesetting, and review of the resulting proof before it is published in its final form. Pleasenote that during the production process errors may be discovered which could affect the content, and alllegal disclaimers that apply to the journal pertain.

MANUSCRIP
T
ACCEPTED
ACCEPTED MANUSCRIPT 1
Energy Recovery in Individuals with Knee Osteoarthritis 1
2
Tawnee L. Sparling, BS1, 2; Daniel Schmitt, PhD3; Charlotte E. Miller, PhD3; Farshid Guilak, PhD2,4; 3
Tamara J. Somers, PhD5; Francis J. Keefe5, PhD; Robin M. Queen, PhD1,2 4
5
1 Michael W. Krzyzewski Human Performance Research Laboratory, DUMC 3435 Duke University Medical 6
Center, Durham NC, 27710 7
2 Department of Orthopedic Surgery, Duke University Medical Center Box 3956, Durham NC 27710 8
3 Department of Evolutionary Anthropology, Duke University, Durham NC 9
4 Department of Biomedical Engineering, Duke University, Durham, NC 10
5 Duke Pain Prevention and Treatment Research Program, Department of Psychiatry and Behavioral Sciences, Duke 11
University Medical Center, Durham, NC 12
13
Corresponding Author: 14
Daniel Schmitt 15
Department of Evolutionary Anthropology 16
Room 108 Biological Sciences 17
Box 90383, Science Drive, Duke University 18
Durham, NC 27710 19
Email: [email protected] 20
Phone: (919) 684-5664 21
22
Co-author Emails: [email protected], [email protected], [email protected], 23
[email protected], [email protected], [email protected] 24
Running Title: Osteoarthritis Energy Recovery 25
Word Count: 3372 Figures/Tables: 5 26

MANUSCRIP
T
ACCEPTED
ACCEPTED MANUSCRIPT 2
Abstract Word Count: 239 27
Objective: Pathological gaits have been shown to limit transfer between potential (PE) and 28
kinetic (KE) energy during walking, which can increase locomotor costs. The purpose of this 29
study was to examine whether energy exchange would be limited in people with knee 30
osteoarthritis (OA). 31
Methods: Ground reaction forces during walking were collected from 93 subjects with 32
symptomatic knee OA (self-selected and fast speeds) and 13 healthy controls (self-selected 33
speed) and used to calculate their center of mass (COM) movements, PE and KE relationships, 34
and energy recovery during a stride. Correlations and linear regressions examined the impact of 35
energy fluctuation phase and amplitude, walking velocity, body mass, self-reported pain, and 36
radiographic severity on recovery. Paired t-tests were run to compare energy recovery between 37
cohorts. 38
Results: Symptomatic knee OA subjects displayed lower energetic recovery during self-selected 39
walking speeds than healthy controls (p=0.0018). PE and KE phase relationships explained the 40
majority (66%) of variance in recovery. Recovery had a complex relationship with velocity and 41
its change across speeds was significantly influenced by the self-selected walking speed of each 42
subject. Neither radiographic OA scores nor subject self-reported measures demonstrated any 43
relationship with energy recovery. 44
Conclusions: Knee OA reduces effective exchange of PE and KE, potentially increasing the 45
muscular work required to control movements of the COM. Gait retraining may return subjects 46
to more normal patterns of energy exchange and allow them to reduce fatigue. 47
48
Key Words: Knee osteoarthritis, Energy recovery, Mechanical work, Locomotor costs 49

MANUSCRIP
T
ACCEPTED
ACCEPTED MANUSCRIPT 1
Energy Recovery in Individuals with Knee Osteoarthritis 1
Introduction: 2
It is well understood that the movements of the center of mass (COM) of a person during normal 3
walking on a relatively stiff leg (with limited knee flexion) follow the cycle of an inverted 4
pendulum and that this pattern influences the exchange of energy and muscular work required to 5
accelerate and decelerate (strictly defined as positive or negative accelerate) the COM1-5. In 6
walking, the stored gravitational potential energy (PE) of the COM is at its highest during 7
midstance, when the kinetic energy (KE) of the COM is at its lowest. As it leaves this midstance 8
position and the COM descends, PE is converted to KE, and the horizontally directed component 9
of KE moves the body forward to land on the contralateral limb. After this footfall, the COM 10
again moves upward (as long as the limb remains relatively straight) driven partly by KE and 11
stores PE that can again be returned as KE at the next step-to-step transition. The efficiency of 12
this energy exchange between PE and KE can be as high as 70% during normal human walking 13
at preferred speeds. When the exchange is efficient, it can reduce the amount of muscular effort 14
needed to accelerate and decelerate the COM1, 6. Several studies have separately indicated that 15
the metabolic cost of walking is primarily allocated towards raising the COM throughout the gait 16
cycle7-9. Thus, this mechanism of exchanging KE and PE may serve to reduce the metabolic cost 17
of locomotion by reducing the muscular effort required to accelerate and decelerate the COM2. 18
19
Some studies have considered the mechanical energy required to raise the COM in various 20
populations affected by pathologies, such as cerebral palsy10 and hemiplegia11-13 that lead to gait 21
dysfunction and have been shown to increase metabolic costs. In all cases, subjects have been 22
shown to have abnormal patterns of energy exchange and recovery. To date, however, few 23

MANUSCRIP
T
ACCEPTED
ACCEPTED MANUSCRIPT 2
studies have examined the biomechanics of the COM and gait efficiency of people affected with 24
osteoarthritis, and those studies have to date been limited12-15. 25
26
Knee osteoarthritis affects over 9.2 million people over the age of 26 in the United States alone16, 27
making it the most widespread form of OA17. People affected by knee OA are more likely to 28
report general fatigue and pain after daily activities18, 19, walk at reduced speeds20, 21, and exhibit 29
lower maximal isometric strength in knee extension and flexion with quicker muscular fatigue22 30
when compared to those without OA. Previous studies have tested the physiological costs of gait 31
in people with knee OA, but have focused on cardiac and ventilatory costs rather than on 32
mechanical costs23, 24. The only study to date to specifically examine mechanical work in 33
patients with knee OA was conducted by Detrembleur, et al15 reported on a group of 8 patients 34
with mild to moderate OA who were still able to walk without the use of an assistive device. 35
This study reported that these OA patients had an energy recovery of 44% without intervention 36
and had an improvement of approximately 10% with a pharmacologic intervention15. The study 37
of Detrembleur and colleagues sets the stage for the current work15. Although their sample size 38
was small, the results suggest that energy recovery may be a considerable physiological problem 39
for patients with significant levels of knee OA. Yet the underlying mechanisms—what 40
mechanical factors are driving low energy recovery in subjects with OA—associated with low 41
energy recovery remain unknown. Nor is it known how walking speed will influence energy 42
recovery in this population. The goal of the present study is to examine patterns of energy 43
recovery in OA subjects and to examine the aspects of COM movements that are driving energy 44
recovery values in this population. 45
46

MANUSCRIP
T
ACCEPTED
ACCEPTED MANUSCRIPT 3
In that context, it is worth reviewing the factors that contribute to effective exchange of potential 47
and kinetic energy. Percentage recovery can be affected by fluctuations in the relative magnitude 48
of PE and KE and the phase relationships between KE and PE (the amount of time during the 49
stride in which PE and KE curves changed in the same direction), also described as congruity 50
(Fig. 1) 25, 26. Both the magnitude of PE and KE as well as the phase relationship can be 51
influenced by mechanical factors. For example, if the knee is flexed more deeply during stance 52
the rise of the COM could be reduced and therefore follow a flatter path. This in turn could 53
lower the amount of gravitational potential energy stored in the system and reduce the percentage 54
recovery. Similarly, if toe-off were delayed until the COM was rising (long double support 55
phase) then congruity may be increased which would result in a decrease in recovery. The 56
pattern of knee and ankle motion described above have been reported for subjects with OA22, 27. 57
But these gait parameters have not been examined in the context of COM movements and costs 58
of locomotion. As such, this study has the potential to fill a significant gap in the literature on 59
OA gait mechanics by looking at the consequences of gait changes on ambulatory function and 60
mobility. 61
62
In addition to kinematic parameters, changes in walking speed can directly alter recovery6, 9. 63
Previous work in knee OA has reported a significant decrease in walking speed when compared 64
to a healthy control group20. Previous studies have suggested that the relationship between 65
recovery, the efficiency of PE and KE energy exchange, and speed in a healthy individual is 66
parabolic with relatively low values at speeds that are exceptionally slower or faster than 67
preferred walking speed (i.e. recovery drops off by 10% or more when walking speed is less than 68
1 m/s or greater than 2 m/s when preferred speed is 1.5 m/s) 1, 6. Since KE primarily incorporates 69

MANUSCRIP
T
ACCEPTED
ACCEPTED MANUSCRIPT 4
energy from forward velocity and PE primarily represents energy from COM vertical 70
displacements, which can be influenced by stride length, one explanation for this pattern may be 71
a disproportionate magnitude of PE fluctuations relative to KE fluctuations at slower than 72
preferred speeds and the reverse at speeds higher than preferred. 73
74
As a result of the predictive (albeit parabolic) relationship between speed and recovery, it may be 75
possible to understand the influence of speed versus other OA-associated disability factors (i.e. 76
pain and range of motion) on energy recovery. The recognition of this complex relationship 77
between recovery and walking speed leads to a model in which subjects should be tested at their 78
preferred speed and the fastest speed at which they are comfortable. An analysis of recovery and 79
speed should explicitly compare those values relative to expectations for speed and recovery in 80
an asymptomatic population in order to better understand whether the energy recovery results are 81
due to walking speed or could be associated with other gait limitations in pathologic populations. 82
83
With this framework in mind, the following hypotheses were developed and tested. First, it was 84
hypothesized that individuals with knee OA would exhibit a decreased energy recovery during 85
level walking at all speeds when compared to normal, healthy individuals. Second, it was 86
hypothesized that change in energy recovery from self-selected to fast speeds would be 87
dependent on self-selected velocity, as described above, and allow us to account for the effect of 88
subject walking speed. Finally, we hypothesized that the energy recovery of subjects with knee 89
OA would be negatively correlated with the radiographic severity of the most affected limb28. 90
Since KL grade is also associated with self-report of pain, we expect a similar negative 91
relationship between energy recovery and self-reported measures of pain28. Therefore, subjects 92

MANUSCRIP
T
ACCEPTED
ACCEPTED MANUSCRIPT 5
with more severe OA based on radiographic assessment and/or self-report would have increased 93
gait disability and lower energy recovery. It is important to note that both radiographic 94
assessment and self-report are instruments that cannot capture all aspects of OA-related pain and 95
disability. Both approaches are blunt measurements. The first involves a rough 1 – 4 scale of 96
OA development. This is necessary and appropriate for organizing broad patterns of OA but this 97
system misses nuance in OA severity. Similarly, self-report relies on people’s subjective sense 98
of both pain and disability and, in this case, data for each knee were not reported. Nonetheless, 99
these tools are standard measures in both clinical and research settings and some measures of 100
gait disability have been shown to be reflected in self-report29. 101
102
Methods: 103
Subjects 104
Ninety-three subjects (18 men, 75 women) with symptomatic knee OA were examined in this 105
study. Subjects were participating in a larger clinical trial29-32 in which they had to exhibit 106
chronic knee pain, be overweight or obese (BMI between 25 and 42kg/m2), meet the American 107
College of Rheumatology criteria for symptomatic knee OA, and have no other weight bearing 108
joint symptomatically affected by OA. ACR criteria for referral to this study by a diagnosing 109
physician include knee pain, joint stiffness, crepitus, joint enlargement, and joint tenderness. 110
Radiographic estimations of joint OA severity were completed after the subject was referred to 111
the research study. As a result, in some cases, baseline gait data was collected before 112
radiographic scores were reported. Subjects were excluded from the study if they had a 113
significant medical condition that would increase the risk of an adverse experience, were 114

MANUSCRIP
T
ACCEPTED
ACCEPTED MANUSCRIPT 6
involved in regular exercise, had an abnormal cardiac response to exercise, had a non-OA 115
inflammatory arthropathy, were morbidly obese, or if they regularly used corticosteroids. 116
117
Radiographic estimations of OA severity and self-reported measures of pain and disability: 118
Weight bearing, fixed-flexion (30°) posterior-anterior radiographs of both knees were examined 119
by a reader experienced in diagnosing OA severity and graded on the Kellgren/Lawrence scale33. 120
For bilaterally affected subjects, the most affected limb was used in all analyses. The goal of this 121
study was to determine changes in energy recovery in patients with osteoarthritis. The subject 122
pool include persons with bilateral or unilateral disease because the analysis was performed on 123
the entire stride and the presence of any OA will affect the entire stride patterns and therefore 124
will influence recovery. In this sample, we did not have a self-reported measure of pain or 125
disability associated with a specific limb, therefore, we chose to use the knee with the greatest 126
radiographic OA severity as the KL score for the subject, which we expected to have the greatest 127
influence on gait. At the time of testing, each OA subject completed self-reported assessments 128
of pain, including the Arthritis Impact Measurement Scales (AIMS), Western Ontario and 129
McMaster Universities Osteoarthritis Index (WOMAC), and a Visual Analog Pain Scale 130
(VAS).34 The specific protocol used in this study for filling out the questionnaires is discussed in 131
detail in a previous study by Nebel et al29. 132
133
Subject pool demographics and metrics 134
Prior to participation, each subject read and signed a consent form approved by the Institutional 135
Review Board. At the time of testing, the OA subjects had a mean age of 58.9±10.7 years, a 136
mean BMI of 32.9±4.7 kg/m2, and a median radiographically determined K/L score of 3 on the 137

MANUSCRIP
T
ACCEPTED
ACCEPTED MANUSCRIPT 7
most affected knee (Table 1). Thirteen healthy control subjects (8 men, 5 women), that were 138
recruited for a separate study in our lab35, were included in the study analysis . These controls 139
were between the age of 40 and 70 and had to be pain free at the time of testing, have no 140
previous history of lower extremity surgeries, and no clinical diagnosis of OA in any other 141
lower extremity joint aside from the knee. At the time of testing, the control subjects had a mean 142
age of 49.8±7.5 years and a mean BMI of 26.3±8.7 kg/m2. 143
144
The population under study here, like many populations of subjects with knee OA, are mildly to 145
moderately overweight. In that sense the results of this study are potentially influenced by two 146
factors—weight and OA—but we control for some of that by having records of both 147
radiographic severity and self-report of pain as well as by testing for the effect of BMI on 148
recovery. Soft tissue movement is a concern in kinematic studies of overweight persons. But in 149
this case only the sacral marker was used for any analysis. The sacral marker was used to test for 150
acceleration and deceleration within a stride and provide a conservative exclusion criterion. 151
152
Gait Data 153
An eight-camera motion analysis system sampling at 120Hz (Motion Analysis Corporation, 154
Santa Rosa, CA) was used in conjunction with four force plates embedded in the walkway 155
sampling at 1200Hz (AMTI, Watertown, MA) to collect ground reaction forces during level 156
walking. A single reflective marker was placed at the sacrum in order to track the speed of the 157
COM (walking speed) within each stride during each of the walking trials. This marker was 158
used in order to evaluate whether strides met steady-state criteria of no notable acceleration or 159
deceleration. Only steps in which no obvious acceleration or deceleration over the time of the 160

MANUSCRIP
T
ACCEPTED
ACCEPTED MANUSCRIPT 8
stride were selected for analysis. This steady state was determined by calculating whether or not 161
a single marker placed at the sacrum exhibited anterior-posterior acceleration or deceleration 162
across the stride with an average value not significantly different from zero. 163
164
Five walking trials were collected along a 10m walkway at both a self-selected preferred and a 165
self-selected fast walking speed for the symptomatic subjects and at only a self-selected 166
preferred walking speed for the healthy control group. For each of the self-selected preferred 167
walking trials, subjects were asked to walk at the speed at which they typically perform their 168
daily activities. For the fast speeds, subjects were asked to walk as fast as they felt comfortable. 169
Gait speed was measured during data collection using two wireless infrared photocell timing 170
devices placed 5m apart in the middle of the 10m walkway. This walking speed data was used to 171
ensure that subjects completed all walking trials within ±5% of their average walking speed for 3 172
practice walking trials before the self-selected preferred and self-selected fast walking speeds. 173
174
Calculations 175
Stored gravitational potential energy (PE) and kinetic energy (KE) were calculated from all three 176
components of force output using MATLAB software version R2010a (The Mathworks Inc., 177
Natick, Massachusetts, United States) following the computations set forth originally by 178
Cavagna et al.1 and used in subsequent studies6, 10, 12, 13, 15, 25, 26. All calculations were carried out 179
for walking trials in which a complete stride was obtained with one clean foot strike of each leg 180
on different force plates in order to acquire complete ground reaction forces for both legs and the 181
ability to reconstruct the forces over the entire stride. This requirement, along with the steady 182
state requirement for integration as described below, limited the number of subjects who could 183

MANUSCRIP
T
ACCEPTED
ACCEPTED MANUSCRIPT 9
be included at preferred and fast speeds. As a result, of the 93 total participants, 82 subjects 184
could be included in the analysis of the self-selected preferred speed, while 70 subjects could be 185
included in the analysis of the self-selected fast speed. Of these two groups, 59 subjects 186
overlapped and were therefore included in both analyses. 187
188
The force plate outputs were combined to generate the force values for the entire stride. The 189
output was divided by mass, and acceleration due to gravity was removed from the vertical 190
component resulting in curves representing the acceleration of the COM in all three orthogonal 191
planes of motion (vertical, anterior-posterior, medial-lateral). Integration of the acceleration data 192
provided velocity, while double integration provided the displacement of the COM, which were 193
both used to calculate the KE of the COM in all three planes and the PE of the COM in the 194
vertical plane. 195
196
Following previous methods of integrating the acceleration and velocity curves1, 26, it was 197
assumed that average vertical velocity and displacement during a complete stride were both zero, 198
which served as the integration constant for the vertical plane analyses. The same assumption 199
was made for the medial-lateral motion. However, for the anterior-posterior calculations of KE, 200
the average horizontal velocity of the subject served as the integration constant. The horizontal 201
velocity was determined based on the velocity of the sacral marker that was collected using three 202
dimensional motion capture. As much as was possible with a pathological population, only steps 203
that could be considered steady state were used based on inclusion criteria described above. 204
The percent of COM energy recovery was calculated according to the formula 26 (KE=kinetic 205
energy, PE=potential energy, TE=total energy): 206
MANUSCRIP
T
ACCEPTED
ACCEPTED MANUSCRIPT 10
%�=△��+ △�− ∑△��△��+ ∑△� × 100 207
208 (1) 209
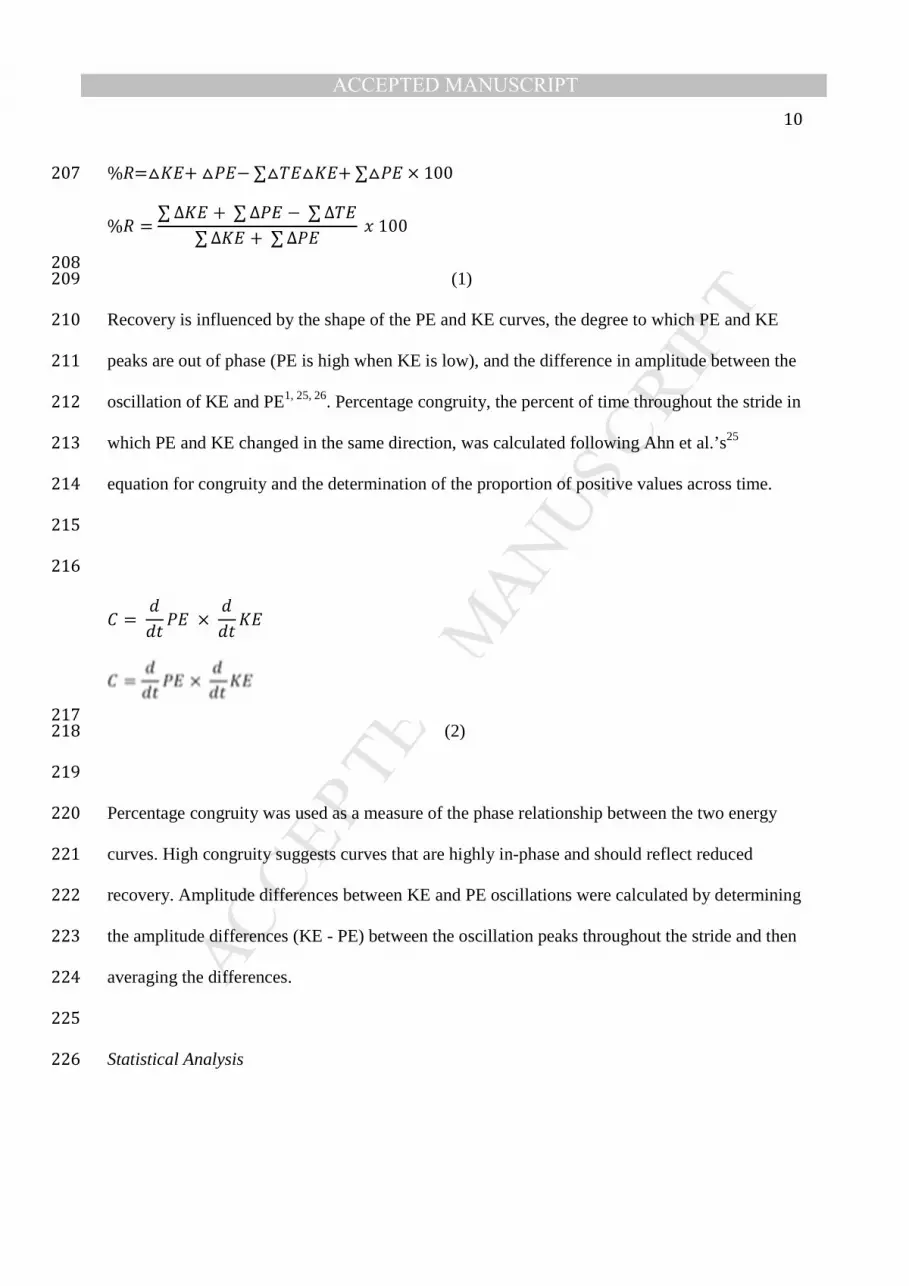
Recovery is influenced by the shape of the PE and KE curves, the degree to which PE and KE 210
peaks are out of phase (PE is high when KE is low), and the difference in amplitude between the 211
oscillation of KE and PE1, 25, 26. Percentage congruity, the percent of time throughout the stride in 212
which PE and KE changed in the same direction, was calculated following Ahn et al.’s25 213
equation for congruity and the determination of the proportion of positive values across time. 214
215
216
� = �
��� ×
�
����
217 (2) 218
219
Percentage congruity was used as a measure of the phase relationship between the two energy 220
curves. High congruity suggests curves that are highly in-phase and should reflect reduced 221
recovery. Amplitude differences between KE and PE oscillations were calculated by determining 222
the amplitude differences (KE - PE) between the oscillation peaks throughout the stride and then 223
averaging the differences. 224
225
Statistical Analysis 226

MANUSCRIP
T
ACCEPTED
ACCEPTED MANUSCRIPT 11
Each variable was averaged for each subject across trials. Parametric Pearson Correlation 227
analyses were performed to examine the associations between COM percent recovery and 228
congruity, energy oscillation amplitude differences, BMI, K/L score, and velocity. Regression 229
lines and R2 values were calculated for relevant variables. Furthermore, COM percent recovery 230
was averaged across 0.25 m/s increments of velocity from 0.5-2.0 m/s and compared to values 231
previously reported by Mian et al.6. Independent t-tests were run to compare the mean recoveries 232
for the symptomatic subjects and the healthy controls at the self-selected walking speed. An 233
alpha level of 0.05 was used to indicate statistically significant differences between groups. All 234
statistical analyses were performed using JMP, Version Pro 10.0.0 (SAS Institute Inc., Cary, 235
NC). 236
237
Results: 238
239
Preferred Walking Velocity 240
For this analysis we needed full, steady state strides with each limb in contact with separate 241
plates (see methods for further detail). Not all subjects provided datasets for both preferred and 242
fast walking speeds. Therefore, of the original 93 subjects, 82 provided data that could be 243
analyzed at self-selected preferred walking speeds. These subjects had an average walking 244
velocity of 1.04±0.18 m/s. The means for the mechanical energy variables calculated during self-245
selected preferred walking indicated a 55.6±10.5% COM percent recovery, 16.4±8.8% 246
congruity, and PE had on average a higher amplitude than KE (-3.24±3.46 J) (Table 2). 247
248

MANUSCRIP
T
ACCEPTED
ACCEPTED MANUSCRIPT 12
There was a strong significant negative relationship (p<0.0001, R2=0.656) between COM 249
percent recovery and congruity (Fig. 2b) and no relationship (p=0.502) between recovery and 250
oscillation amplitude difference (Fig. 2a). The majority of variation in energy recovery is 251
explained by the phase relationship of the fluctuations in KE and PE. Recovery and the K/L 252
score (a measure of radiographic severity) of the most affected knee were not significantly 253
correlated (p=0.280). A similarly weak correlation was found for associations of recovery with 254
subject self-reported pain (Table 2). 255
256
Fast Walking Velocity 257
Of the original group of 93 subjects, 70 subjects had datasets complete enough to analyze at the 258
fast speed (see methods for further detail). They exhibited an average walking velocity of 259
1.38±0.28ms-1, which is similar to the comfortable gait speed of 1.39ms-1 for similarly aged men 260
and women36. When walking at the fast walking speed, subjects had a 54.1±10.9% COM percent 261
recovery, 16.0±9.8% congruity, and fluctuations in PE had on average a higher amplitude than 262
those of KE (-0.46±3.52 J) (Table 2). 263
264
As with preferred speeds, there was a strong, significant negative relationship (p<0.001, 265
R2=0.545) between COM percent recovery and congruity (Fig. 2b). The relationship between 266
COM percent recovery and oscillation amplitude difference was not significant (p=0.196) (Fig. 267
2a). Recovery and the K/L score of the most affected knee were not significantly correlated 268
(p=0.473) (Table 2). 269
270
Preferred vs. Fast Walking Velocity 271

MANUSCRIP
T
ACCEPTED
ACCEPTED MANUSCRIPT 13
Of the original 93 subjects, 84 provided data at preferred speeds and 70 at fast speeds. There was 272
an overlap of 59 subjects who provided data at both speeds and were available for direct 273
comparison across self-selected preferred and fast walking speeds (see methods for further 274
detail). Subjects who exhibited a slower self-selected preferred speed were found to increase 275
their COM percent recovery when walking at a faster speed, while subjects who exhibited a self-276
selected preferred walking speed closer to that expected for an unaffected person of the same leg 277
length were found to decrease their COM percent recovery when engaging in fast walking 278
(R2=0.275) (Fig. 3). 279
280
It is worth noting that several of the subjects with a KL value of 3 or 4 showed show minimum 281
recovery values lower than any exhibited by subjects with KL values of 0 through 2. However, 282
ranges for all groups overlapped considerably and the subjects with KL values of 1 and 2 did not 283
have a higher upper range than those with values of 3 or 4. The few extremely low recovery 284
values seen in patients with low KL values in at least one knee were not enough to drive any 285
statistical trend (Table 2). Similarly, KL score did not statistically explain variation in speed in 286
this sample. However, subjects with KL values of 4 in at least one knee never achieved walking 287
speeds higher than 1.4 m/s when asked to use their fastest comfortable walking speed. Once 288
again, the high variation and overlap in walking speed did not allow for a significant difference 289
across groups or correlation of speed with KL value. 290
291
Healthy Controls 292
The symptomatic knee OA subjects were significantly different from our healthy controls in all 293
variables except energy amplitude difference (Table 2). Of note, the controls exhibited higher 294

MANUSCRIP
T
ACCEPTED
ACCEPTED MANUSCRIPT 14
percent recovery values and faster self-selected walking velocities (p=0.0018 and p<0.0001, 295
respectively). 296
297
Discussion: 298
Subjects affected with symptomatic knee osteoarthritis demonstrate relatively lower energy 299
recovery values at all speeds compared to our own sample of healthy adults. In order to place 300
the results for our OA subjects and asymptomatic controls in context of an older asymptomatic 301
population, we compared our values to that of Mian et al.6 (Table 2, Fig. 4). This comparison 302
demonstrates that our values are lower than those of a healthy sample of similarly aged subjects 303
from this study. The values reported here can also be compared with the one other study of 304
energy recovery in OA15. Our values are not quite as low as those reported by Detrembleur et 305
al.15 Taken together, our data confirm the findings of Detrembleur et al.15 and fail to reject the 306
hypothesis that subjects with knee OA will experience lower values when estimating the 307
exchange of PE and KE when compared with asymptomatic subjects of similar age and body 308
mass. 309
310
The source of the relatively low energy exchange in subjects with OA is multifactorial. The 311
lower recovery values reported for this population at a self-selected speed could have been due to 312
the fact that subjects with OA walked at slower speeds than those typically exhibited by 313
unaffected subjects. When subjects increased walking speed into a range that was consistent with 314
unaffected subjects, the recovery values increased (Fig. 4). These results support our second 315
hypothesis that the value of recovery varies in a predictable way with speed. Therefore, subjects 316
who increase speed to the normal speed exhibited by healthy subjects of their stature may 317

MANUSCRIP
T
ACCEPTED
ACCEPTED MANUSCRIPT 15
experience improvements in energy recovery values. In order understand the effect of walking 318
speed on recovery we restricted the analysis to the area of speed overlap and compared recovery. 319
A highly significant difference (P<0.001) between recoveries of asymptomatic subjects (65%) 320
and OA subjects (56%) in the same speed range existed (Fig 4), suggesting that walking velocity 321
is an important factor in limiting energy recovery in this population, but not the only factor 322
driving this difference. 323
324
When walking velocity was accounted for in this population, most of the variation in COM 325
energy recovery was explained by phase differences in the oscillations of KE and PE. Overall, in 326
this population, the KE and PE fluctuations were moving in the same direction (congruence) for 327
16% of the walking cycle, and this congruity accounted for over 60% of the variance in recovery. 328
In contrast, the amplitude difference between the KE and PE peaks was found to be less 329
important in knee OA recovery. However, amplitude did play a marginally larger role at the 330
faster speed, explaining 3% of the variation compared to approximately zero percent of the 331
variation at the self-selected speed. Although not a direct measure of metabolic costs, our 332
recovery results demonstrate inefficiency in the walking dynamics of patients with symptomatic 333
knee OA, and therefore may also be indirectly representative of higher metabolic costs. 334
335
Low energy recoveries appear to be a consistent characteristic of subjects with knee OA 336
regardless of disease severity. In this regard, our third hypothesis-- that recovery would be 337
negatively correlated to radiographic severity of knee OA and self-reported measures of pain--338
was rejected. Neither K/L score nor any self-report of pain was significantly correlated to energy 339
recovery (Table 2). Previous work by Nebel et al29 did find that AIMS physical disability and 340

MANUSCRIP
T
ACCEPTED
ACCEPTED MANUSCRIPT 16
WOMAC function scores explained a significant proportion of the variation in gait parameters in 341
this same population; however, the center of mass movements reported here are distinct from the 342
measures of speed, range of motion, and peak force reported by Nebel et al 29 and our focus was 343
primarily on the relationship between pain and COM mechanics. 344
345
This study is a first and relatively novel step in examining COM mechanics in subjects with OA. 346
The study grew from a separate study and thus has limitations that deserve to be acknowledged. 347
The subjects walked across multiple force plates rather than a single large surface, which 348
required a more complicated analysis. In addition, although all subjects had been referred to the 349
study by a physician not all had significant levels of radiographically-diagnosed OA. All 350
subjects in the OA pool were also mild or moderately overweight and represented an older age 351
group. Finally we have not yet established a precise control group that includes age-matched 352
people with high BMI values and no OA and low BMI values with OA, both of which are hard 353
to find in a population over fifty years of age. Despite these limitations, the results are consistent 354
with the few other studies of energy recovery in older people6 and those with OA15. We also 355
provide new analysis on congruity and speed and the consequences of gait changes on 356
ambulatory function and mobility. 357
358
One of the goals for patient care and treatment for those persons with osteoarthritis is to establish 359
gait patterns that allow normal activities to be conducted with minimal pain and fatigue. 360
Returning energy recovery to values closer to those in unaffected populations may reduce 361
muscular effort during walking and reduce both pain and fatigue. The data presented here shows 362
that people affected by knee OA consistently exhibit gait patterns that yield low levels of energy 363

MANUSCRIP
T
ACCEPTED
ACCEPTED MANUSCRIPT 17
exchange. Therefore, future research can focus on the kinematics driving recovery in affected 364
populations and develop appropriate interventions. 365
366
Acknowledgements: 367
368
The authors thank Dr. Ershela Sims for her significant contribution to the initial data collection 369
and analysis, Justin DeBiasio for data processing, and Dr. Virginia Kraus for her insight and 370
knowledge in regards to osteoarthritis. 371
372
Author Contributions: 373
374
All authors collectively worked on the study conception and design: 375
The original design of the initial study: FJK, FG, DS 376
Collection of self-reported data: FJK 377
Collection of biomechanical data: DS, RMQ, TJS 378
Development of analysis technique: TLS, DS, CEM 379
Analysis and interpretation of the data: DS, RMQ, CEM, TLS 380
Drafting of the article: TLS, DS 381
All authors revised the article and provided final approval of the submitted version. 382
DS ([email protected]) takes responsibility for the integrity of the work as a whole, from 383
inception to finished article. 384
385
Role of the Funding Source: 386

MANUSCRIP
T
ACCEPTED
ACCEPTED MANUSCRIPT 18
387
This study was supported by the National Institutes of Health (grant no. AR50245). The funding 388
source had no role in the study design, collection, analysis and interpretation of the data; in the 389
writing of the manuscript; or in the decision to submit the manuscript for publication. 390
391
Conflict of Interest: 392
The authors declare no conflict of interest. 393
394

MANUSCRIP
T
ACCEPTED
ACCEPTED MANUSCRIPT 19
References: 395
396
1. Cavagna GA, Heglund NC, Taylor CR. Mechanical work in terrestrial locomotion: two 397 basic mechanisms for minimizing energy expenditure. American Journal of 398 Physiology - Regulatory, Integrative and Comparative Physiology 1977; 233: R243-399 R261. 400
2. Cavagna GA, Kaneko M. Mechanical work and efficiency in level walking and 401 running. The Journal of Physiology 1977; 268: 467-481. 402
3. Kuo AD. The six determinants of gait and the inverted pendulum analogy: A dynamic 403 walking perspective. Human Movement Science 2007; 26: 617-656. 404
4. Kuo AD, Donelan JM, Ruina A. Energetic Consequences of Walking Like an Inverted 405 Pendulum: Step-to-Step Transitions. Exercise and Sport Sciences Reviews 2005; 33: 406 88-97. 407
5. Cavagna GA, Thys H, Zamboni A. The sources of external work in level walking and 408 running. The Journal of Physiology 1976; 262: 639-657. 409
6. Mian OS, Thom JM, Ardigò LP, Narici MV, Minetti AE. Metabolic cost, mechanical 410 work, and efficiency during walking in young and older men. Acta Physiologica 411 2006; 186: 127-139. 412
7. Grabowski A, Farley CT, Kram R. Independent metabolic costs of supporting body 413 weight and accelerating body mass during walking. Journal of Applied Physiology 414 2005; 98: 579-583. 415
8. Duff-Raffaele M, Kerrigan DC, Corcoran PJ, Saini M. The Proportional Work of Lifting 416 the Center of Mass During Walking1. American Journal of Physical Medicine & 417 Rehabilitation 1996; 75: 375-379. 418
9. Neptune RR, Zajac FE, Kautz SA. Muscle mechanical work requirements during 419 normal walking: the energetic cost of raising the body's center-of-mass is significant. 420 Journal of Biomechanics 2004; 37: 817-825. 421
10. Bennett BC, Abel MF, Wolovick A, Franklin T, Allaire PE, Kerrigan DC. Center of Mass 422 Movement and Energy Transfer During Walking in Children With Cerebral Palsy. 423 Archives of Physical Medicine and Rehabilitation 2005; 86: 2189-2194. 424
11. Detrembleur C, Dierick F, Stoquart G, Chantraine F, Lejeune T. Energy cost, 425 mechanical work, and efficiency of hemiparetic walking. Gait & Posture 2003; 18: 426 47-55. 427
12. Tesio L, Civaschi P, Tessari L. Motion of the Center of Gravity of the Body in Clinical 428 Evaluation of Gait. American Journal of Physical Medicine & Rehabilitation 1985; 64: 429 57-70. 430
13. Iida H, Yamamuro T. Kinetic analysis of the center of gravity of the human body in 431 normal and pathological gaits. Journal of Biomechanics 1987; 20: 987-995. 432
14. Cavagna GA, Tesio L, Fuchimoto T, Heglund NC. Ergometric evaluation of 433 pathological gait. Journal of Applied Physiology 1983; 55: 606-613. 434
15. Detrembleur C, De Nayer J, van den Hecke A. Celecoxib improves the efficiency of the 435 locomotor mechanism in patients with knee osteoarthritis. A randomised, placebo, 436 double-blind and cross-over trial. Osteoarthritis Cartilage 2005; 13: 206-210. 437

MANUSCRIP
T
ACCEPTED
ACCEPTED MANUSCRIPT 20
16. Lawrence RC, Felson DT, Helmick CG, Arnold LM, Choi H, Deyo RA, et al. Estimates of 438 the prevalence of arthritis and other rheumatic conditions in the United States: Part 439 II. Arthritis & Rheumatism 2008; 58: 26-35. 440
17. Cushnaghan J, Dieppe P. Study of 500 patients with limb joint osteoarthritis. I. 441 Analysis by age, sex, and distribution of symptomatic joint sites. Annals of the 442 Rheumatic Diseases 1991; 50: 8-13. 443
18. Schepens SL, Kratz AL, Murphy SL. Fatigability in Osteoarthritis: Effects of an 444 Activity Bout on Subsequent Symptoms and Activity. The Journals of Gerontology 445 Series A: Biological Sciences and Medical Sciences 2012; 67: 1114-1120. 446
19. Kazis LE, Meenan RF, Anderson JJ. Pain in the rheumatic diseases. Arthritis & 447 Rheumatism 1983; 26: 1017-1022. 448
20. Mündermann A, Dyrby CO, Hurwitz DE, Sharma L, Andriacchi TP. Potential 449 strategies to reduce medial compartment loading in patients with knee 450 osteoarthritis of varying severity: Reduced walking speed. Arthritis & Rheumatism 451 2004; 50: 1172-1178. 452
21. Stauffer RN, Chao EY, Gyory AN. Biomechanical gait analysis of the diseased knee 453 joint. Clin Orthop Relat Res 1977; 126: 246-255. 454
22. Fisher NM, White SC, Yack HJ, Smolinski RJ, Pendergast DR. Muscle function and gait 455 in patients with knee osteoarthritis before and after muscle rehabilitation. Disability 456 and Rehabilitation 1997; 19: 47-55. 457
23. Bernardi M, Macaluso A, Sproviero E, Castellano V, Coratella D, Felici F, et al. Cost of 458 walking and locomotor impairment. Journal of Electromyography and Kinesiology 459 1999; 9: 149-157. 460
24. Waters RL, Perry J, Conaty P, Lunsford B, O'Meara P. The Energy Cost of Walking 461 with Arthritis of the Hip and Knee. Clinical Orthopaedics and Related Research 462 1987; 214: 278-284. 463
25. Ahn AN, Furrow E, Biewener AA. Walking and running in the red-legged running 464 frog, Kassina maculata. Journal of Experimental Biology 2004; 207: 399-410. 465
26. O'Neill MC, Schmitt D. The gaits of primates: center of mass mechanics in walking, 466 cantering and galloping ring-tailed lemurs, Lemur catta. The Journal of Experimental 467 Biology 2012; 215: 1728-1739. 468
27. Stauffer RN, Chao EY, Gyory AN. Biomechanical gait analysis of the diseased knee 469 joint. Clin Orthop Relat Res 1977: 246-255. 470
28. Hurwitz DE, Ryals AB, Case JP, Block JA, Andriacchi TP. The knee adduction moment 471 during gait in subjects with knee osteoarthritis is more closely correlated with static 472 alignment than radiographic disease severity, toe out angle and pain. Journal of 473 Orthopaedic Research 2002; 20: 101-107. 474
29. Nebel MB, Sims EL, Keefe FJ, Kraus VB, Guilak F, Caldwell DS, et al. The Relationship 475 of Self-Reported Pain and Functional Impairment to Gait Mechanics in Overweight 476 and Obese Persons With Knee Osteoarthritis. Archives of Physical Medicine and 477 Rehabilitation 2009; 90: 1874-1879. 478
30. Somers TJ, Blumenthal JA, Guilak F, Kraus VB, Schmitt DO, Babyak MA, et al. Pain 479 coping skills training and lifestyle behavioral weight management in patients with 480 knee osteoarthritis: A randomized controlled study. PAIN 2012; 153: 1199-1209. 481

MANUSCRIP
T
ACCEPTED
ACCEPTED MANUSCRIPT 21
31. Sims EL, Keefe FJ, Kraus VB, Guilak F, Queen RM, Schmitt D. Racial differences in gait 482 mechanics associated with knee osteoarthritis. Aging Clinical and Experimental 483 Research 2009; 21: 463-469. 484
32. Sims EL, Carland JM, Keefe FJ, Kraus VB, Guilak F, Schmitt D. Sex Differences in 485 Biomechanics Associated with Knee Osteoarthritis. Journal of Women & Aging 2009; 486 21: 159-170. 487
33. Kellgren J, Lawrence J. Radiological assessment of osteoarthrosis. Ann Rheum Dis 488 1957; 16: 494-502. 489
34. Bellamy N, Buchanan WW, Goldsmith CH, Campbell J, Stitt LW. Validation-Study of 490 Womac - a Health-Status Instrument for Measuring Clinically Important Patient 491 Relevant Outcomes to Antirheumatic Drug-Therapy in Patients with Osteo-Arthritis 492 of the Hip or Knee. Journal of Rheumatology 1988; 15: 1833-1840. 493
35. Queen RM, Vap A, Nunley JA, Bolognesi MP, Butler RJ. Biomechanics differences 494 between end-stage hip, knee, and ankle OA when compared with healthy controls. 495 (In Review). 496
36. BOHANNON RW. Comfortable and maximum walking speed of adults aged 20—79 497 years: reference values and determinants. Age and Ageing 1997; 26: 15-19. 498
499

MANUSCRIP
T
ACCEPTED
ACCEPTED MANUSCRIPT 1
Figure Legends: 1
2
Fig 1. The association of Potential Energy (PE), Kinetic Energy (KE), and Total Energy (TE) 3
of the center of mass in a theoretical model of 100% recovery (a) and two examples from 4
osteoarthritis (OA) subjects from the current study (b and c). In (a) PE and KE are of the 5
same magnitude and 100% out of phase (0% congruity) leading to a pattern of TE that does 6
not fluctuate. Recovery (as calculated following the methods described in the text) would 7
be 100%. The points in the gait cycle are indicated and in the lower left is found a 8
schematic of human walking with a pendular models of the human lower limb (as a 9
massless rod) with the mass of the body concentrated at one end. In (b) PE and KE 10
fluctations are highly out of phase with low congruity (10%) and high recovery (67%). In 11
(c) PE and KE flucations are relatively in phase (congruity of 36%) compared to the subject 12
in (b) and also differ in magnitude, resulting in a low recovery value (38%) 13
14
Fig. 2. Representation of the percent of variance in the COM recovery that is explained by 15
(a) amplitude oscillation differences and (b) percent congruity. 16
17
Fig. 3. The relationship between the change in the energy recovery of each subject (fast - 18
preferred) during walking. Subjects with slower self-selected preferred walking speeds 19
were more likely to increase their recovery by speeding up, while those with faster self-20
selected speeds were more likely to decrease their recovery by speeding up. 21
22
23

MANUSCRIP
T
ACCEPTED
ACCEPTED MANUSCRIPT 2
Fig. 4. The relationship between recovery and speed. Points indicate the average recovery 24
for 0.25ms-1 increments of velocity and lines indicate the standard deviation. The recovery 25
of knee OA subjects exhibits the standard parabolic shape across speeds but at a lower 26
value than both old and young healthy subjects tested by Mian et. al6 and our own controls. 27

MANUSCRIP
T
ACCEPTED
ACCEPTED MANUSCRIPT
Table 1: Number of subjects in each of the K/L score groups for both the fast and normal walking speeds.
K/L Score Self Selected Speed (N) Fast Speed (N)
0 4 4
1 6 9
2 11 8
3 43 32
4 17 17
unscored 1 0

MANUSCRIP
T
ACCEPTED
ACCEPTED MANUSCRIPT
Table 3.
Parametric correlations of each variable to energy recovery at the two speeds obtained. Values in bold are significant.
Velocity Congruity Amplitude BMI K/L AIMS Pain
WOMAC Pain VAS
Preferred 0.494 -0.8097 0.0025 0.0109 0.052 -0.126 -0.0683 0.0419 Fast -0.2653 -0.7379 0.168 0.059 0.0053 -0.0459 0.1152 0.0532

MANUSCRIP
T
ACCEPTED
ACCEPTED MANUSCRIPT
Table 2.
Means and standard deviations for each cohort tested and comparative values of previously collected data
N Age (yrs) BMI (kg/m2) Velocity (m/s) Recovery (%) Congruity (%) Energy Difference (J)
Knee OA 82 59.57±10.96 32.69±4.78 1.04±0.18 55.64±10.52 16.35±8.82 -3.24±3.48
Preferred Speed (57.17,61.98) (31.64,33.74) (0.99,1.08) (53.33,57.96) (14.41,18.29) (-4.01,-2.48)
Knee OA 70 58.61±11.05 32.98±4.71 1.38±0.28 54.06±10.90 15.99±9.75 -0.46±3.54
Fast Speed (55.98,61.25) (31.86,34.10) (1.31,1.44) (51.46,56.67) (13.66,18.32) (-1.30,0.39)
Mian et. Al6 Old 20 74.0±3.4 26.06 1.25±0.32 63.2±3.1 - -
Preferred Speed - - - - - -
Mian et. al6 Young 12 26.6±3.3 25.12 1.25±0.32 60.9±2.8 - -
Preferred Speed - - - - - -
Healthy Controls 13 49.77±7.46 26.26±8.67 1.38±0.22 65.45±3.20 10.33±3.58 -2.47±2.71
Preferred Speed (45.26,54.28) (21.02,31.50) (1.24,1.51) (63.50,67.40) (8.17,12.49) (-4.11,-0.83)
p=0.0027* p<0.0001* p<0.0001* p=0.0018* p=0.0257* p=0.457
*significant differences: p values represent independent t-test differences between the knee OA preferred speed means and the healthy controls preferred speed
means
Values are reported as mean ± sd and (95% confidence intervals)

MANUSCRIP
T
ACCEPTED
ACCEPTED MANUSCRIPT

MANUSCRIP
T
ACCEPTED
ACCEPTED MANUSCRIPT

MANUSCRIP
T
ACCEPTED
ACCEPTED MANUSCRIPT

MANUSCRIP
T
ACCEPTED
ACCEPTED MANUSCRIPT


