Embed Size (px)
Citation preview

Knee alignment differences between Chinese and Caucasiansubjects without osteoarthritis
W F Harvey 1, J Niu 1, Y Zhang 1, P I McCree1, D T Felson 1, M Nevitt 2, L Xu3, P Aliabadi 4, andD J Hunter 1
1 Boston University Clinical Epidemiology Research and Training Unit, Boston, Massachusetts,USA
2 Department of Epidemiology and Biostatistics, UCSF, San Francisco, California, USA
3 Department of Obstetrics and Gynecology, PUMC Hospital, Beijing, China
4 Department of Radiology, Brigham and Women's Hospital, Boston, Massachusetts, USA
Abstract
Objective— Despite the lower prevalence of obesity (a known risk factor for osteoarthritis (OA)),the prevalence of lateral tibiofemoral OA is higher in Chinese communities compared withCaucasian communities. One potential explanation is the difference in knee alignment between thetwo populations. We measured various knee alignment indices among Chinese and Caucasiansand assessed whether these indices were different between the two racial groups.
Methods— We selected participants from the Framingham Osteoarthritis Study (FOA) and theBeijing Osteoarthritis Study (BOA), all without knee OA (Kellgren & Lawrence grade <2).Bilateral, fully extended anteroposterior knee radiographs were measured for the following anglesin both knees: the anatomic axis (AA), the condylar angle (CA), the tibial plateau angle and thecondylar–plateau angle (CP). We compared the mean of each measurement between the two racialgroups adjusting for age and body mass index using linear regression and stratified by sex.
Results— The mean AA, CA and CP were significantly different in the BOA compared with theFOA. For women, the mean AA and CA were significantly more valgus in BOA subjects, while inmen, the mean AA and CP were more valgus in BOA subjects.
Conclusions— There are significant differences in knee morphology between Chinese andCaucasian cohorts, which result in a more valgus alignment of the distal femur in Chinese. Thiswould serve to shift the mechanical loading towards the lateral compartment, and provide apossible explanation why Chinese have a higher prevalence of lateral tibiofemoral OA.
The aetiopathogenesis of osteoarthritis (OA) is widely believed to be the result of localmechanical factors acting within the context of systemic susceptibility. The importance ofmechanical factors may explain why knee OA occurs more often in the medial compartmentthan in the lateral compartment, presumably due to its increased loading during gait.1 Themedial compartment absorbs 60–70% of the force across the knee during weight bearing.2 Intheory, any shift from a neutral or collinear alignment of the hip, knee and ankle affects loaddistribution at the knee and could potentially influence the pattern of tibiofemoralinvolvement in OA.3 Knee alignment is a key determinant of the disproportionate medialtransmission of load, and can predict OA progression.45
Correspondence to: Dr David J Hunter, Boston University School of Medicine, Evans 7, 715 Albany St, Boston, MA 02118, USA;[email protected].
Competing interests: None.
NIH Public AccessAuthor ManuscriptAnn Rheum Dis. Author manuscript; available in PMC 2013 May 06.
Published in final edited form as:Ann Rheum Dis. 2008 November ; 67(11): 1524–1528. doi:10.1136/ard.2007.074294.
NIH
-PA
Author M
anuscriptN
IH-P
A A
uthor Manuscript
NIH
-PA
Author M
anuscript

Epidemiological studies exploring the racial or geographic distribution of a disease oftenprovide valuable clues about potential aetiological factors. Recent studies have shownremarkable differences in the patterns of OA between Chinese in Beijing and white peoplein Framingham, USA. 6–8 In particular, the Chinese cohort had an equal (men) or higher(women) prevalence of knee OA than the US population despite a lower mean body massindex (BMI), long thought to be a major risk factor.7 Furthermore, the prevalence of lateraltibiofemoral (LTF) OA particularly among women was much greater than in the Caucasiansample (28.5% vs 11%).6 Examination of the anatomic axis in a small sample of the cohortof the Beijing and Framingham populations did not explain the higher LTF OA prevalencein Chinese, especially that among women.6 The reasons for the differences in patterns of TFOA between the Beijing and Framingham sample were hypothesised to be from such factorsas lifestyle (OA as a consequence of physical labour and squatting), but no clear conclusionscould be made.6
In this study, we sought to apply a more comprehensive assessment of alignment to the sameBeijing and Framingham cohorts. This includes measurement of the anatomic axis angle aswell as condylar and tibial plateau angles (detailed below). Based on work by Cooke andothers, these additional angles may add important additional information not gained bysimply measuring the anatomic axis.910 We hypothesised that we would find differences incondylar angle between the groups and that this may be more important in consideringalignment than the overall anatomic axis. Furthermore, the presence of this difference inalignment will allow further elucidation of the aetiology of compartment-specific knee OA.
METHODS
Study participants
This cross-sectional analysis drew from two studies described below.
The Beijing Osteoarthritis Study (BOA)— The BOA was a population-based cross-sectional study conducted between 1997 and 2000.79 The main goal of the study was tocompare the prevalence of OA between Chinese in Beijing and white people in the USA andto explore if the prevalence of traditional risk factors was different between the two racialgroups. The subjects were recruited from residents aged 60 years and older in the fourcentral districts in Beijing, all of Chinese ancestry. Details of sampling frame, recruitmentand study design have been published previously.7
For the first 1800 subjects, weight-bearing anteroposterior (AP) radiographs were obtainedfor both knees. For the last 700 subjects, the posteroanterior view was used instead of theAP view. For this analysis we drew only from participants who underwent weight-bearingAP radiographs to ensure consistency with the radiographic acquisition used in theFramingham Study (see below).
The Framingham Osteoarthritis Study (FOA)— The Framingham Study began in1948 in Framingham, MA (USA). The original purpose of the study was to evaluate riskfactors for cardiovascular disease.11 The sample used in this study was the FraminghamOffspring Cohort. As part of a study on the inheritance of OA, participants in the OffspringCohort were originally examined between 1992 and 1994 (Offspring examination 5). At thisvisit participants received a weight-bearing AP radiograph of both knees identical inprotocol to the one acquired in the BOA.
Harvey et al. Page 2
Ann Rheum Dis. Author manuscript; available in PMC 2013 May 06.
NIH
-PA
Author M
anuscriptN
IH-P
A A
uthor Manuscript
NIH
-PA
Author M
anuscript

Radiograph reading
Both studies used the same protocols to obtain AP knee radiographs in weight-bearing, witha 14 × 17-inch film and fully extended knees. One bone and joint radiologist read all theradiographs in the BOA and FOA studies. Each knee was evaluated for the presence ofosteophytes and joint space narrowing on a 0–3 scale using the OARSI atlas.12 Each kneewas also graded for overall evidence of radiographic tibiofemoral OA using the Kellgren &Lawrence (K&L) grade on a 0–4 scale.13 The intra-rater weighted κ was 0.78 for the K&Lgrade.
Definition of radiographic tibiofemoral osteoarthritis
A knee was defined as having radiographic TF OA if its K&L grade was ≥2 on the AP kneeradiograph. A subject was considered as having radiographic TF OA if he or she had at leastone knee involved with radiographic TF OA.
Selection of sample
The selection of the sample from the FOA and BOA cohorts for this analysis was fromparticipants without knee OA (K&L<2), as the presence of OA – in particular the presenceof joint space narrowing – may alter alignment. From these subjects without OA werandomly selected 354 participants from each group. All films from these random samplesthat were available digitally at the time of the study were measured, giving 231 participantsin the FOA cohort and 340 participants in the BOA cohort.
Alignment measurements
The load-bearing axis is represented by a line drawn from the centre of the femoral head tothe centre of the ankle. In a varus deformed knee, this line passes medial to the knee centreand an adduction moment arm is created, which increases force across the medialcompartment. In a valgus deformed knee, the load-bearing axis passes lateral to the kneecentre, and the resulting abduction moment arm increases force across the lateralcompartment.3
Knee alignment has been characterised by measuring numerous angles within the joint.14
These include: (a) the mechanical axis (angle between lines drawn from the femoral head tothe tibial spines and the line from the tibial spines to the mid-talus); (b) the anatomic axis(angle between lines drawn from the midpoint of the shaft of the femur through the tibialspines and the line from the tibial spines to the midpoint of the tibia); (c) the condylar angle(angle between the mechanical or anatomic axis line of the femur and a line tangent to thefemoral condyles) (see fig 1); (d) the tibial plateau angle (angle between the mechanical oranatomic axis line of the tibia and a line tangent to the tibial plateau); and (e) the condylar–plateau angle (the angle between the above-mentioned tangent lines – condylar angle andtibial plateau angle) (see fig 1). The anatomic axis measurement does not require a full-length radiograph as does the mechanical axis, and these two measures have been highlycorrelated in previous studies.1516
Digital films were read using imaging software (eFilm Workstation (Version 2.0.0)software; Merge Healthcare, Milwaukee, Wisconsin, USA) allowing manual placement oflines and computer calculation of angles to measure the following angles depicted in fig 1.
1. Anatomical axis, in degrees from 180°, (a) the anatomic axis lines were drawn fromthe visual centre of the femur and tibia at a point 10 cm from joint line through thevisual midpoint of the tibial spines.
2. Condylar angle in degrees from 90°, (a) the condylar line was drawn tangent to themost distal aspect of the femur.
Harvey et al. Page 3
Ann Rheum Dis. Author manuscript; available in PMC 2013 May 06.
NIH
-PA
Author M
anuscriptN
IH-P
A A
uthor Manuscript
NIH
-PA
Author M
anuscript

3. Tibial plateau angle in degrees from 90°, (a) the tibial plateau line was drawntangent to the most lateral aspect of the tibial plateau.
4. Condylar–plateau angle in degrees as measured between the condylar and tibialplateau tangent lines.
By convention, varus angles were recorded as negative numbers, while valgus angles wererecorded as positive numbers. A single reader (WH) made the measurements on both kneesfrom each film, and reader reliability was assessed from a subsample of subjects. All filmswere read blinded to study cohort, patient identifiers and patient symptom status. Toevaluate for reader-drift, we re-assessed intra-rater reliability by inserting one originalreliability x-ray for every 10 new x-rays read. Interobserver correlation coefficient rangedfrom 0.93 to 0.96 and intraobserver correlation coefficient from 0.94 to 0.97 for the differentalignment measures.
Statistical methods
We used SAS software (Ver 9.1.3, SAS Institute Inc., Cary, NC, USA) to perform allstatistical analyses. We examined the distributions of each angle in order see if thedistributions of each appeared normal. To examine the relative importance of measuringeach of the angles, we did Pearson's correlations of each angle to the other angles, stratifiedby cohort and knee.
We calculated the mean and standard deviation of each alignment measurement for left andright knees separately according to sex and racial groups, and compared these indicesbetween the two racial groups using Student's t-test. For each gender, we compared theproportion of knees with K&L grade 1 between the racial groups using χ2-test. Wecompared the difference of each measurement of knee alignment between two racial groupsfor men and women separately while adjusting for age and BMI using generalisedestimating equations to account for the correlation between two knees.17 We also comparedthe variance of each alignment measurement between the two racial groups.
RESULTS
The characteristics of the subjects are presented in table 1. The mean age in the Beijingsubjects was slightly older than the Framingham subjects. The Framingham subjects had aslightly higher mean BMI than the Beijing subjects. Figure 2 shows the distribution for theanatomic axis angle in the Framingham and Beijing subjects before adjusting for age andBMI. Note that in addition to the difference in the mean anatomic axis angle with morevalgus alignment in Beijing subjects, the standard deviation of this measure in the Beijingsubjects is larger compared with the Framingham subjects (F-test for equality of variancesp<0.0001). The distributions for the other angles are similar to that of the anatomic axisangle with a more valgus alignment and higher standard deviation in the BOA sample.Pearson's correlations showed that the anatomic axis angle and condylar angle are highlycorrelated with a range in correlation coefficients of 0.77–0.88 (all with p<0.0001).Anatomic axis angle and tibial plateau angle had a moderate correlation of 0.36–0.49 (allwith p<0.0001). In the Framingham cohort, the anatomic axis angle had no significantcorrelation to the condylar–plateau angle, while in the Beijing cohort, there was a weakcorrelation (0.22, p<0.0001). All other correlations were weak with a correlation coefficient<0.25.
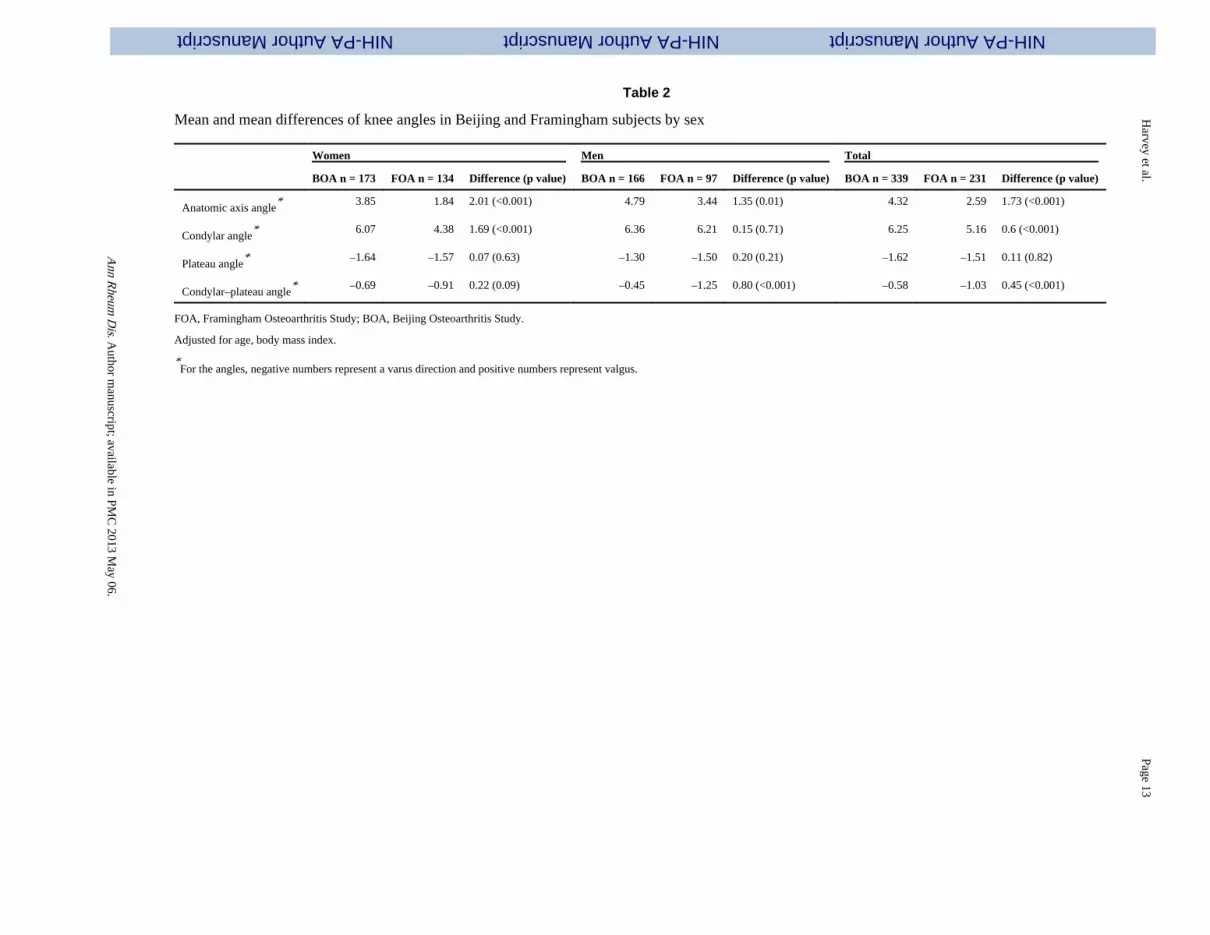
Table 2 shows the comparison of the means, stratified by gender. The mean anatomic axisangle, condyle angle and condyle–plateau angle were significantly different in BOAcompared with FOA. Although the mean anatomic axis angle was valgus in both cohorts,the BOA cohort was 1.35° more valgus (p = 0.01) in men and 2.01° more valgus (p<0.001)
Harvey et al. Page 4
Ann Rheum Dis. Author manuscript; available in PMC 2013 May 06.
NIH
-PA
Author M
anuscriptN
IH-P
A A
uthor Manuscript
NIH
-PA
Author M
anuscript

in women. The difference in mean condylar angle was more apparent in women (meandifference 1.69°, p<0.001). The mean difference of the condylar angle in men was 0.15° (p =0.71). The mean tibial plateau angle in both cohorts was in a varus direction although nostatistically significant difference was observed between the two racial groups. Althoughsubjects in both racial groups tended to have varus condylar–plateau angle, compared withChinese, white people appeared to have more varus condylar–plateau angle, especially inmen. (mean difference 0.80°, p<0.001). The mean difference in the condylar–plateau anglein women approached significance (0.22° p = 0.09).
DISCUSSION
Our results showed that several knee morphological features are different between theChinese and Caucasian subjects. These differences may lead to a more valgus alignment ofthe distal femur in Chinese. The condylar–plateau while in a varus direction in both racialgroups, was less varus in Chinese. This would shift the mechanical loading towards thelateral compartment, and provide one potential explanation as to why the Chinese have ahigher prevalence of LTF OA. Furthermore, as noted previously, the Beijing subjects alsohave a higher prevalence of medial tibiofemoral OA despite lower BMI. These seeminglycontradictory statements might be explained by the larger variance seen in the Beijingcohort, although this is speculative in the absence of a longitudinal study design.
These results are not inconsistent with the results suggested by Felson et al 6 who identifieda mean anatomic axis angle of 4.5° in Framingham and 4.7° in Beijing. Because this sampleincluded only 25 subjects from each cohort, this difference did not reach statisticalsignificance. Our study has a much larger sample size and was therefore able to detect adifference. In addition, we measured more angles, which may help to differentiate themorphological source of these differences.
The contributions of alignment and other biomechanical angles to the pathology of knee OAhas been suggested in several previous studies. Additional measures have been proposed toexplain the relation of the femur and tibia and their articulating joint surfaces. The data onthe correlation between the alignment measures in our study would suggest that there is littleneed to measure condylar angle as this is highly correlated with the anatomic axis. Incontrast there do appear to be potential advantages afforded by measuring the tibial–plateauangle and condylar–plateau angle as these were less related and may provide additionalunique information.
Cooke et al noted the importance of altered condylar angle as a major contributor to varusdeformity, and they questioned in their review the importance of the cause of varusangulations when considering pathogenesis and therapy for knee OA.14 Additionally, acomparison study between Saudi Arabian and Canadian cohorts by the same group foundsome differences in these angles based on ethnicity.9 Nagamine et al also found significantdifferences in these angles when comparing Japanese patients with those from the USA andFrance.10
These studies differ from ours in that they include in their comparison subjects with andwithout OA. Joint space narrowing due to tibiofemoral OA is likely to alter the individualangles of alignment. Some authors, including Cooke et al, attribute the change in condyle–plateau angle to loss in joint space.14 In his study of Canadian subjects, he found the meananatomical axis angle in healthy subjects to be 20.97°. His angles were measured from full-length radiographs and are therefore difficult to compare directly; however, a study byKraus et al has shown the difference in neutral alignment to be approximately 4° morevalgus for anatomic axis compared with the mechanical axis measurements.15 Although
Harvey et al. Page 5
Ann Rheum Dis. Author manuscript; available in PMC 2013 May 06.
NIH
-PA
Author M
anuscriptN
IH-P
A A
uthor Manuscript
NIH
-PA
Author M
anuscript

direct comparison of data between studies is problematic, using this correction factor theangle measured by Cooke et al becomes approximately 3°, placing the Canadian cohortsquarely between our FOA and BOA cohorts.9 A correction factor for the other angles is notknown. It is also possible that the differences in alignment between their Canadian OA andSaudi OA cohorts are related to baseline racial differences in alignment.9 Pre-morbid Saudidata were not reported.
Nagamine et al also included normal and OA subjects in their study, but comparison ispossible between our cohorts and their controls.10 Their femoral angle and tibia angle anglesare complementary angles (measured on the lateral side; ours on the medial side) to ourcondylar angle and tibial plateau angle respectively. Nagamine et al's cohorts includeJapanese, French and American subjects and their results show that the Caucasian (Frenchand American) subjects had a slightly more varus femoral angle compared with the Japanesecohort, although statistical significance was not reported. This supports our findings withour Chinese cohort, and may indicate that Asian subjects have a trend to more valgusalignment compared with Caucasian subjects.
It is unclear what factors may contribute to these alignment differences. The most straightforward potential explanation is that there are genetically programmed differences on bonemorphology. These may cause differences in the bowing bones themselves (femur or tibiavara). Another potential explanation could be behavioural factors. For example, in our study,the Beijing population is known to perform more squatting than the Framingham population.Bicycle riding is another behavioural activity that is likely to be disparate between thepopulations. Other as yet unrealised behavioural factors could also contribute to thedifferences.
There are several limitations in our study. The BOA cohort was of a slightly older age thanthe FOA cohort. To our knowledge, there is no known association between age and kneealignment, and adjusting for age in our study did not significantly change the results. TheFOA cohort had a higher BMI, but adjusting for BMI did not significantly change ourresults.
In addition, our alignment measures were taken from a short film. The measurement ofmechanical axis is difficult, as it requires a full-length radiograph, and two studies showed ahigh correlation between data obtained from mechanical axis and anatomic axismeasurements.1516 This obviates the need for the cumbersome full-length radiographs inexchange for the more commonly obtained, standard AP knee film.
It is also possible that the alignment differences observed are an early manifestation ofdisease that is present even before the presence of joint space narrowing (required for K&L≥2) or even before any disease can be observed by x-ray. Further this is a cross-sectionalanalysis and any relation that differences in alignment could contribute to differencesbetween these samples in the pattern of compartment-specific knee OA need to be furtherexamined in longitudinal samples. No firm conclusions can be drawn from this cross-sectional study.
When compared with Caucasian knees, Chinese knees have a more valgus alignment of thedistal femur. This would serve to shift the mechanical loading towards the lateralcompartment, and provide one potential explanation for the higher prevalence of LTF OAamong Chinese. Examinations of racial and ethnic differences in knee alignment combinedwith epidemiological data about patterns of OA are important to advancing ourunderstanding of the aetiopathogenesis of OA. We suggest that comprehensivemeasurements, such as those used in this study, provide more useful information regardingalignment than simply measuring the anatomic or mechanical axis as has been done in most
Harvey et al. Page 6
Ann Rheum Dis. Author manuscript; available in PMC 2013 May 06.
NIH
-PA
Author M
anuscriptN
IH-P
A A
uthor Manuscript
NIH
-PA
Author M
anuscript

previous studies. Future work in this area should focus on the longitudinal measurements ofthese angles and their relationship to the development of OA.
Acknowledgments
We would like to thank the participants and staff of the Beijing Osteoarthritis Study and Framingham OsteoarthritisStudy.
Funding: The study was supported by NIH AR43873 and AR47785 and NIH AG18393 from the FraminghamHeart Study of the National Heart, Lung, and Blood Institute of the National Institutes of Health and BostonUniversity School of Medicine. This work was supported by the National Heart, Lung, and Blood Institute'sFramingham Heart Study (Contract No. N01-HC-25195). The study sponsor was not involved in study design; inthe collection, analysis, and interpretation of data; in the writing of the report; or the decision to submit the paperfor publication.
REFERENCES
1. Lindenfeld TN, Hewett TE, Andriacchi TP. Joint loading with valgus bracing in patients with varusgonarthrosis. Clin Orthop. 1997; 344:290–7. [PubMed: 9372780]
2. Andriacchi TP. Dynamics of knee malalignment. Orthop Clin North Am. 1994; 25:395–403.[Review] [28 refs]. [PubMed: 8028883]
3. Tetsworth K, Paley D. Malalignment and degenerative arthropathy. Orthop Clin North Am. 1994;25:367–77. [Review] [44 refs]. [PubMed: 8028880]
4. Schipplein OD, Andriacchi TP. Interaction between active and passive knee stabilizers during levelwalking. J Orthop Res. 1991; 9:113–19. [PubMed: 1984041]
5. Sharma L, Song J, Felson DT, Cahue S, Shamiyeh E, Dunlop DD. The role of knee alignment indisease progression and functional decline in knee osteoarthritis. JAMA. 2001; 286:188–95.[PubMed: 11448282] (Erratum appears in JAMA 2001;286:792.)
6. Felson DT, Nevitt MC, Zhang Y, Aliabadi P, Baumer B, Gale D, et al. High prevalence of lateralknee osteoarthritis in Beijing Chinese compared with Framingham Caucasian subjects. ArthritisRheum. 2002; 46:1217–22. [PubMed: 12115226]
7. Zhang Y, Xu L, Nevitt MC, Aliabadi P, Yu W, Qin M, et al. Comparison of the prevalence of kneeosteoarthritis between the elderly Chinese population in Beijing and whites in the United States: theBeijing Osteoarthritis Study. Arthritis Rheum. 2001; 44:2065–71. [PubMed: 11592368]
8. Zhang Y, Xu L, Nevitt MC, Niu J, Goggins JP, Aliabadi P, et al. Lower prevalence of handosteoarthritis among Chinese subjects in Beijing compared with white subjects in the United States:the Beijing Osteoarthritis Study. Arthritis Rheum. 2003; 48:1034–40. [PubMed: 12687546]
9. Cooke TD, Harrison L, Khan B, Scudamore A, Chaudhary MA, Cooke TD, et al. Analysis of limbalignment in the pathogenesis of osteoarthritis: a comparison of Saudi Arabian and Canadian cases.Rheumatol Int. 2002; 22:160–4. [PubMed: 12172956]
10. Nagamine R, Miura H, Bravo CV, Urabe K, Matsuda S, Miyanishi K, et al. Anatomic variationsshould be considered in total knee arthroplasty. J Orthop Sci. 2000; 5:232–7. [PubMed: 10982663]
11. Felson DT, Naimark A, Anderson J, Kazis L, Castelli W, Meenan RF. The prevalence of kneeosteoarthritis in the elderly. The Framingham Osteoarthritis Study. Arthritis Rheum. 1987;30:914–18. [PubMed: 3632732]
12. Altman RD, Hochberg M, Murphy WAJ, Wolfe F, Lequesne M. Atlas of individual radiographicfeatures in osteoarthritis. Osteoarthritis Cartilage. 1995; 3(Suppl A):3–70. [PubMed: 8581752]
13. Kellgren, JH.; Lawrence, JS. Atlas of standard radiographs. Blackwell Scientific Publications;Oxford: 1963.
14. Cooke TD, Scudamore A, Greer W. Varus knee osteoarthritis: whence the varus? J Rheumatol.2003; 30:2521–3. [Review] [11 refs]. [PubMed: 14719187]
15. Kraus VB, Vail TP, Worrell T, McDaniel G, Kraus VB, Vail TP, et al. A comparative assessmentof alignment angle of the knee by radiographic and physical examination methods. ArthritisRheum. 2005; 52:1730–5. [PubMed: 15934069]
Harvey et al. Page 7
Ann Rheum Dis. Author manuscript; available in PMC 2013 May 06.
NIH
-PA
Author M
anuscriptN
IH-P
A A
uthor Manuscript
NIH
-PA
Author M
anuscript
16. Hinman RS, May RL, Crossley KM. Is there an alternative to the full-leg radiograph fordetermining knee joint alignment in osteoarthritis? Arthritis Rheum. 2006; 55:306–13. [PubMed:16583430]
17. Zhang Y, Glynn RJ, Felson DT. Musculoskeletal disease research: should we analyze the joint orthe person? J Rheumatol. 1996; 23:1130–4. [PubMed: 8823682]
Harvey et al. Page 8
Ann Rheum Dis. Author manuscript; available in PMC 2013 May 06.
NIH
-PA
Author M
anuscriptN
IH-P
A A
uthor Manuscript
NIH
-PA
Author M
anuscript

BMJ Careers online re-launches
BMJ Careers online has re-launched to give you an even better online experience. You'llstill find our online services such as jobs, courses and careers advice, but now they'reeven easier to navigate and quicker to find.
New features include:
▶ Job alerts – you tell us how often you want to hear from us with either daily orweekly alerts
▶ Refined keyword searching making it easier to find exactly what you want
▶ Contextual display – when you search for articles or courses we'll automaticallydisplay job adverts relevant to your search
▶ Recruiter logos linked directly to their organisation homepage – find out moreabout the company before you apply
▶ RSS feeds now even easier to set up
Visit careers.bmj.com to find out more.
Harvey et al. Page 9
Ann Rheum Dis. Author manuscript; available in PMC 2013 May 06.
NIH
-PA
Author M
anuscriptN
IH-P
A A
uthor Manuscript
NIH
-PA
Author M
anuscript

Figure 1.Drawing of a typical varus knee. (1) Femoral anatomic axis line. (2) Tibial anatomic axisline. (3) Condylar line. (4) Tibial plateau line. (a) Anatomic axis angle. (b) Condylar angle.(c) Tibial plateau angle. (d) Condylar–plateau angle.
Harvey et al. Page 10
Ann Rheum Dis. Author manuscript; available in PMC 2013 May 06.
NIH
-PA
Author M
anuscriptN
IH-P
A A
uthor Manuscript
NIH
-PA
Author M
anuscript
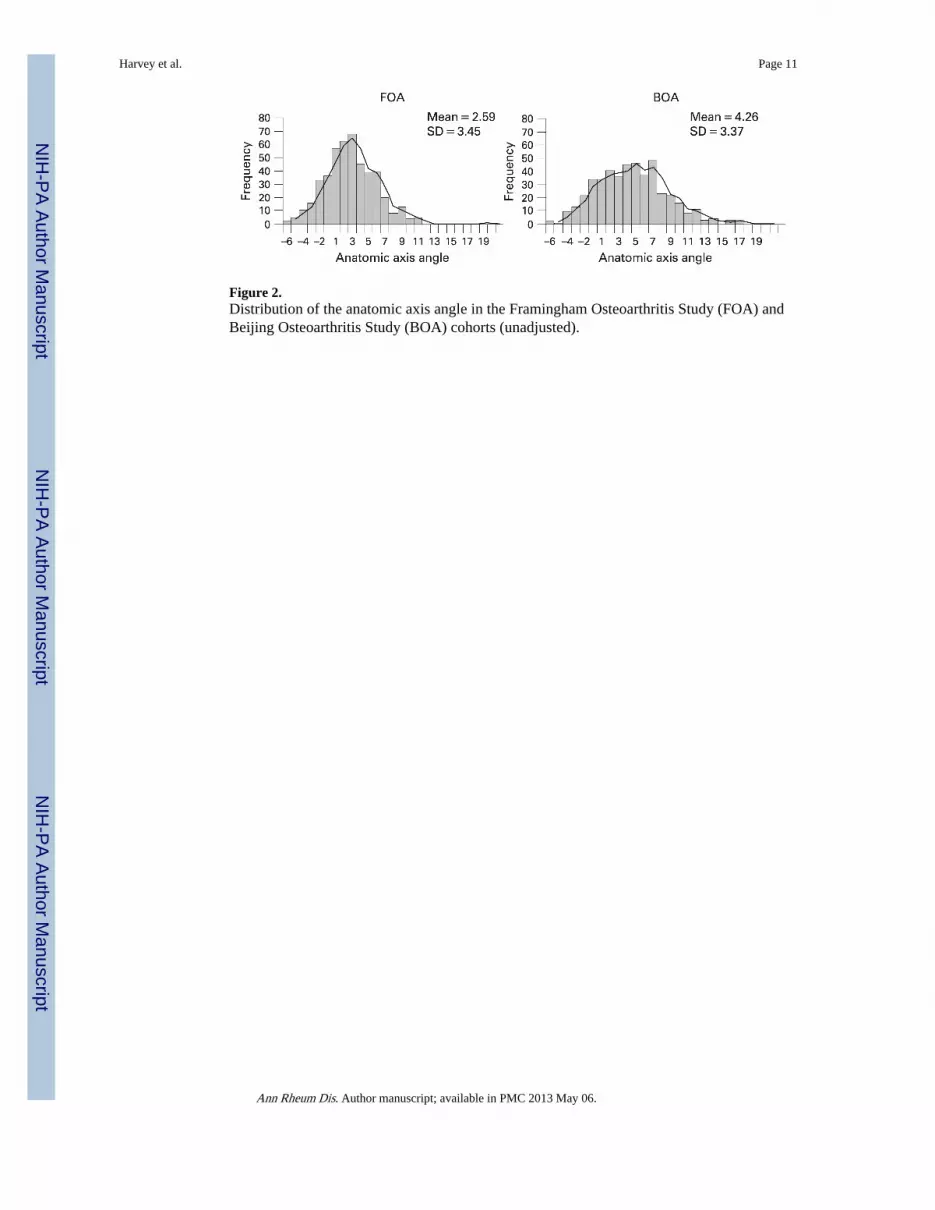
Figure 2.Distribution of the anatomic axis angle in the Framingham Osteoarthritis Study (FOA) andBeijing Osteoarthritis Study (BOA) cohorts (unadjusted).
Harvey et al. Page 11
Ann Rheum Dis. Author manuscript; available in PMC 2013 May 06.
NIH
-PA
Author M
anuscriptN
IH-P
A A
uthor Manuscript
NIH
-PA
Author M
anuscript

NIH
-PA
Author M
anuscriptN
IH-P
A A
uthor Manuscript
NIH
-PA
Author M
anuscript
Harvey et al. Page 12
Table 1
Characteristics of FOA and BOA subjects by sex
Women Men
BOA n = 173 FOA n = 134 BOA n = 166 FOA n = 97
Age (SD) 66.0 (4.9) 63.6 (3.6)† 67.1 (5.2) 63.8 (3.9)†
BMI (SD) 25.0 (3.9) 25.9 (3.9) 24.9 (3.2) 27.7 (3.9)†
K&L = 0, N of knees (%) 314 (90.8) 248 (92.5) 291 (87.7) 175 (90.2)
K&L = 1, N of knees (%) 32 (9.2) 20 (7.5) 41 (12.4) 19 (9.8)
FOA, Framingham Osteoarthritis Study; BOA, Beijing Osteoarthritis Study; BMI, body mass index; K&L, Kellgren & Lawrence (grade).
*For the angles, negative numbers represent a varus direction and positive numbers represent valgus.
†Two-tailed p<0.001.
Ann Rheum Dis. Author manuscript; available in PMC 2013 May 06.
NIH-PA Author ManuscriptNIH-PA Author ManuscriptNIH-PA Author Manuscript
Harvey et al.
Page 13
Table 2
Mean and mean differences of knee angles in Beijing and Framingham subjects by sex
Women Men Total
BOA n = 173 FOA n = 134 Difference (p value) BOA n = 166 FOA n = 97 Difference (p value) BOA n = 339 FOA n = 231 Difference (p value)
Anatomic axis angle* 3.85 1.84 2.01 (<0.001) 4.79 3.44 1.35 (0.01) 4.32 2.59 1.73 (<0.001)
Condylar angle* 6.07 4.38 1.69 (<0.001) 6.36 6.21 0.15 (0.71) 6.25 5.16 0.6 (<0.001)
Plateau angle* –1.64 –1.57 0.07 (0.63) –1.30 –1.50 0.20 (0.21) –1.62 –1.51 0.11 (0.82)
Condylar–plateau angle* –0.69 –0.91 0.22 (0.09) –0.45 –1.25 0.80 (<0.001) –0.58 –1.03 0.45 (<0.001)
FOA, Framingham Osteoarthritis Study; BOA, Beijing Osteoarthritis Study.
Adjusted for age, body mass index.
*For the angles, negative numbers represent a varus direction and positive numbers represent valgus.
Ann R
heum D
is. Author m
anuscript; available in PM
C 2013 M
ay 06.


