Embed Size (px)
Citation preview

RESEARCH ARTICLE
Environment and air pollution: health services bequeathto grotesque menace
Muhammad Imran Qureshi & Amran Md. Rasli &Usama Awan & Jian Ma & Ghulam Ali & Faridullah &
Arif Alam & Faiza Sajjad & Khalid Zaman
Received: 5 July 2014 /Accepted: 8 September 2014# Springer-Verlag Berlin Heidelberg 2014
Abstract The objective of the study is to establish the linkbetween air pollution, fossil fuel energy consumption, indus-trialization, alternative and nuclear energy, combustible re-newable and wastes, urbanization, and resulting impact onhealth services in Malaysia. The study employed two-stageleast square regression technique on the time series data from1975 to 2012 to possibly minimize the problem ofendogeniety in the health services model. The results in gen-eral show that air pollution and environmental indicators actas a strong contributor to influence Malaysian health services.Urbanization and nuclear energy consumption both signifi-cantly increases the life expectancy inMalaysia, while fertilityrate decreases along with the increasing urbanization in acountry. Fossil fuel energy consumption and industrializationboth have an indirect relationship with the infant mortalityrate, whereas, carbon dioxide emissions have a direct relation-ship with the sanitation facility in a country. The resultsconclude that balancing the air pollution, environment, and
health services needs strong policy vistas on the end of thegovernment officials.
Keywords Environment . Air pollution . Health services .
Two-stage least square . Malaysia
Introduction
The economic viewpoint regarding health benefit suggeststhat investment for the welfare of the people transform intothe overall economic growth. Environmental, genetic, andbehavioral practices are the most important aspects causativeto the raise in environmental and public health problems andchallenges. Contact with air pollution, inadequate water re-sources, soil, and physiological hazards create high morbidity,disability, and mortality. In spite of the complex health tech-nology and development technologies, the world still faces
Responsible editor: Philippe Garrigues
M. I. QureshiFaculty of Management, Universiti Teknologi Malaysia, UTMSkudai, 81310 Johor, Malaysia
A. M. RasliCommercialization and Technology Management Group Faculty ofManagement, Universiti Teknologi Malaysia, UTM Skudai,81310 Johor, Malaysiae-mail: [email protected]
U. AwanDepartment of Management Sciences, COMSATS Institute ofInformation Technology, Vehari, Pakistane-mail: [email protected]
J. MaDepartment of East Asian Studies, Faculty of Arts and SocialScience, University of Malaya, 50603 Kuala Lumpur, Malaysia
G. AliDepartment of Commerce, University of Sargodha, Sargodha,Pakistan
.FaridullahDepartment of Environmental Sciences, COMSATS Institute ofInformation Technology, Abbottabad, Pakistan
A. AlamDepartment of Development Studies, COMSATS Institute ofInformation Technology, Abbottabad, Pakistan
F. Sajjad :K. Zaman (*)Department of Management Sciences, COMSATS Institute ofInformation Technology, Abbottabad, Pakistane-mail: [email protected]
Faridullah
Environ Sci Pollut ResDOI 10.1007/s11356-014-3584-2

child malnutrition, injury, and mortality rates (Ministry ofHealth 2011).
For this important notion, Malaysia, like other Asian coun-tries allocates a sizeable amount of budget for the healthsector. Malaysia is opportune to have wide-ranging healthcareservices. The government of Malaysia is dedicated to accesshigh-quality healthcare, through a network of nationwideclinics and hospitals. However, there are still some tribulationsrelated with the environmental factors and climatic changethat needs to be solved (Allianz Worldwide 2013). TheMalaysian economy is improving the economic situationwhich was trapped as a middle income country over a longperiod, although issues and challenges faced during the TenthMalaysia Plan (10MP) is quite similar to those in the NinthMalaysia Plan (9MP), i.e., the issues on globalization and therising trend of private health care spending creates a greatchallenge and distress on maintaining the power of the currenthealthcare system (Ministry of Health 2011). According toBrunekreef and Holgate (2002, p.1233),
“The health effects of air pollution have been subject tointense study in recent years. Exposure to pollutantssuch as airborne participate matter and ozone has beenassociated with increases in mortality and hospital ad-missions due to respiratory and cardiovascular disease”.
De Sario et al. (2013) conclude that climatic factors affectson the patterns of air pollution in the urbanized areas of theworld, associated with the significant effect on respiratoryhealth both independently and synergistically with weatherconditions. Balbus et al. (2013) examined the impact of globalclimate change (GCC) on the human health through the path-way from a chemical source in the environment. The resultsshow that GCC enhanced the level of contact of many envi-ronmental pollutants due to direct and indirect effects on theusage patterns, transport, and fate of chemicals. Rao et al.(2013) presented the set of policy scenarios on air pollution,climate change, energy access, and health impacts for 2030.The results highlighted the urgency of enforcing currentworldwide air quality legislation in addressing the impactsof outdoor air pollution. Akhmat et al. (2014a) explored thelong-run relationship between climatic factors, air pollution,and energy sources in the European Union-15 (EU-15) coun-tries, new EU member states, G-7 countries, and other coun-tries, during the period of 1975–2012. The policy directivethat reduces the greenhouse gases emissions concurrentlyalters emissions of conventional pollutants which have injuri-ous effects on human health and the environment. In anotherstudy, Akhmat et al. (2014b) examined the carbon dioxideemissions, greenhouse gas emissions, and low birthweight inPakistan, during the period of 1975–2012. The results showthat both air pollution and greenhouse gas emissions consid-erably affect the low birthweight in Pakistan, as air pollution
exhibit strong relationship with low birthweight, while there isone-to-one corresponding relationship between greenhousegas emissions and low birthweight in a country. Yasser(2014) examined the possibility of home power generationtechnologies utilizing renewable energies in rural Australia.The results show that home-based power generation is feasibleand an applicable alternative technique by using renewabletechnologies in rural Australia. According to Steinle et al.(2013, p. 184),
“Quantifying human exposure to air pollutants is achallenging task. Ambient concentrations of air pollut-ants at potentially harmful levels are ubiquitous in urbanareas and subject to high spatial and temporalvariability”.
D’Amato et al. (2014) concluded that the recent changes inthe regional temperature affected the varied set of physical andbiological systems across the globe. Allergens patterns amongone of them are changing drastically in response to climatechange. Rafindadi et al. (2014) examined the long-run rela-tionship between carbon dioxide emissions, fossil fuel energyconsumption, and water resources in the panel of selectedAsia-Pacific countries, during the period of 1975–2012. Theresults show that there is a strong nexus between carbondioxide emissions, fossil fuel energy consumption, andwater resources in the region; however, among other factors,fossil fuel has a strong influence on the changes in the airpollution. Sajjad et al. (2014) examined the long-run relation-ship between climatic factors, air pollution, and tourism de-velopment indicators in the aggregate data of South Asia, theMiddle East and North Africa, Sub-Saharan Africa, and EastAsia and the Pacific regions, covering the period of 1975–2012. The results reveal that both the climatic factors and airpollution have a negative impact on tourism indicators in theform of deforestation and natural resource depletion. Shahbazet al. (2014) investigates the long-run relationship betweenenergy consumption, economic growth, carbon dioxide emis-sions, and urbanization in the United Arab Emirates (UAE),covering the quarter frequency data over the period ofQ11975–Q42011. The results confirmed the existence of aninverted U-shaped relationship between economic growth andcarbon dioxide emissions in a country. The causality analysisconfirmed the bidirectional causality between carbon dioxideemissions and electricity consumption. Shabbir et al. (2014)examined the relationship between energy consumption, eco-nomic growth, and carbon dioxide emissions by using thestructural vector autoregressive technique in Pakistan. Theresults show that energy consumption both in the form ofrenewable and non-renewable energy consumption increaseseconomic growth, while carbon dioxide emissions decreaseeconomic activity in a country. Shafiq and Zaman (2014)examined the relationship between economic freedom
Environ Sci Pollut Res

indicators and energy consumption in Pakistan, over the peri-od of 1995–2013. The results reveal that economic freedomindicators increases energy consumption in Pakistan; howev-er, Granger causality test in most of the cases supportedneutrality hypothesis i.e., both economic freedom and eco-nomic growth does not Granger cause each other, except coalconsumption which partially supported the unidirectionalcausal relationship with the economic freedom indicators butnot vice versa. According to Mokhtar and Murad (2010, p.24),
“Environmental health problems in Malaysia are mostlyattributed to atmospheric pollution, water pollution, cli-mate change, ozone depletion, and solid waste manage-ment, as well as toxic, chemical, and hazardous wastemanagement. The Ministry of Health, Malaysia, hasbeen vigorously pursuing the environmental healthagenda by collaborating with other agencies at district,state, national, and international levels”.
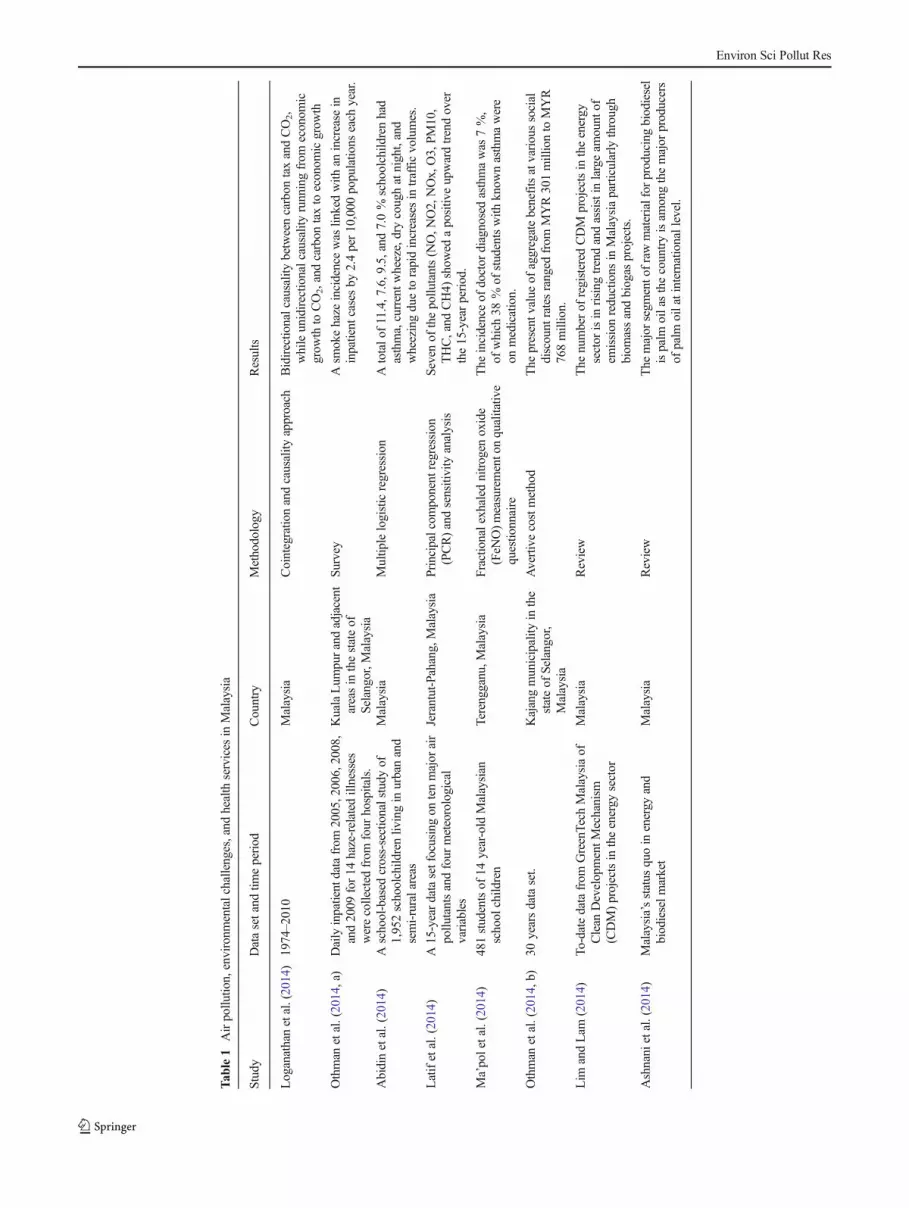
Table 1 shows the current studies on air pollution, environ-mental hazards, and resulting impact on Malaysian healthservices.
The above studies found evidence of long-run relationshipbetween air pollution and health services across the globe. Inthe subsequent section, the study examines the relationshipbetween air pollution, environmental factors, and resultingimpact on Malaysian health services. The study is dividedinto the following sections: after introduction, data source, andmethodological framework presented in “Data source andmethodological framework”. Results are discussed in“Results”, while the final section concludes the study.
Data source and methodological framework
The data set for the selected variables i.e., carbon dioxideemissions, fossil fuel energy consumption, industrialization,alternative and nuclear energy,1 combustible renewable andwastes, urbanization, total fertility rate, total life expectancy atbirth, infant mortality rate, improved sanitation facilities, andimproved water sources were taken fromWorld DevelopmentIndicators published by the World Bank (2013).
The study employed two-stage least square regressiontechnique to possibly encounter the problem of endogenietyin the model. For this purpose, the study brings first lag of theexplanatory variables as an instrumental list. At first, the studyused different simultaneous equations model for five health-related factors in the context of Malaysia and explained withthe number of environmental and air pollutant factors in a
country. Model I to model V explained the impact of airpollutant and environmental indicators on health services inMalaysia i.e.,
Model I: total fertility rate, air pollution, and environmentalindicators
FERT ¼ β0 þ β1CO2þ β2FOSSILþ β3IND
þ β4NUCLEARþ β5RENWASTE
þ β6URBANþ μ
Model II: total life expectancy, air pollution and environ-mental indicators
LEXPECT ¼ β0 þ β1CO2þ β2FOSSILþ β3IND
þ β4NUCLEARþ β5RENWASTE
þ β6URBANþ μ
Model III: infant mortality rate, air pollution and envi-ronmental indicators
MORT ¼ β0 þ β1CO2þ β2FOSSILþ β3IND
þ β4NUCLEARþ β5RENWASTE
þ β6URBANþ μ
Model IV: improved sanitation facility, air pollution andenvironmental indicators
SANIT ¼ β0 þ β1CO2þ β2FOSSILþ β3IND
þ β4NUCLEARþ β5RENWASTE
þ β6URBANþ μ
Model V: improved water resources, air pollution andenvironmental indicators
WATER ¼ β0 þ β1CO2þ β2FOSSILþ β3IND
þ β4NUCLEARþ β5RENWASTE
þ β6URBANþ μ
Where, FERT represents fertility rate, total (births perwoman); LEXPECT represents life expectancy at birth, total(years); MORT represents mortality rate, infant (per 1,000 livebirths); SANIT represents improved sanitation facilities (% ofpopulation with access); WATER represents improved watersource (% of population with access); CO2 represents carbondioxide (CO2) emissions from manufacturing industries and
1 Clean energy is noncarbohydrate energy that does not produce carbondioxide when generated. It includes hydropower and nuclear, geothermal,and solar power, among others.
Environ Sci Pollut Res
Tab
le1
Airpollu
tion,environm
entalchallenges,and
health
services
inMalaysia
Study
Datasetand
timeperiod
Country
Methodology
Results
Loganathanetal.(2014)
1974–2010
Malaysia
Cointegratio
nandcausality
approach
Bidirectio
nalcausalitybetweencarbon
taxandCO2,
whileunidirectio
nalcausalityrunningfrom
econom
icgrow
thto
CO2,and
carbon
taxto
econom
icgrow
th
Othman
etal.(2014,a)
Daily
inpatientdatafrom
2005,2006,2008,
and2009
for14
haze-related
illnesses
werecollected
from
four
hospitals.
KualaLum
purandadjacent
areasin
thestateof
Selangor,M
alaysia
Survey
Asm
okehaze
incidencewas
linkedwith
anincrease
ininpatient
casesby
2.4per10,000
populatio
nseach
year.
Abidinetal.(2014)
Aschool-based
cross-sectionalstudy
of1,952schoolchild
renliv
ingin
urbanand
semi-ruralareas
Malaysia
Multip
lelogisticregression
Atotalo
f11.4,7.6,9.5,and
7.0%
schoolchild
renhad
asthma,currentw
heeze,drycoughatnight,and
wheezingdueto
rapidincreasesin
trafficvolumes.
Latifetal.(2014)
A15-yeardatasetfocusingon
tenmajor
air
pollu
tantsandfour
meteorological
variables
Jerantut-Pahang,Malaysia
Principalcom
ponent
regression
(PCR)andsensitivity
analysis
Sevenof
thepollu
tants(N
O,N
O2,NOx,O3,PM
10,
THC,and
CH4)
show
edapositiv
eupwardtrendover
the15-yearperiod.
Ma’poletal.(2014)
481studentsof
14year-old
Malaysian
school
child
ren
Terengganu,M
alaysia
Fractio
nalexhaled
nitrogen
oxide
(FeN
O)m
easurementonqualitativ
equestio
nnaire
The
incidenceof
doctor
diagnosedasthmawas
7%,
ofwhich
38%
ofstudentswith
know
nasthmawere
onmedication.
Othman
etal.(2014,b)
30yearsdataset.
Kajangmunicipality
inthe
stateof
Selangor,
Malaysia
Avertivecostmethod
The
presentv
alue
ofaggregatebenefitsatvarioussocial
discount
ratesranged
from
MYR301millionto
MYR
768million.
Lim
andLam
(2014)
To-datedatafrom
GreenTech
Malaysiaof
Clean
DevelopmentM
echanism
(CDM)projectsin
theenergy
sector
Malaysia
Review
The
numberof
registered
CDM
projectsin
theenergy
sector
isin
rising
trendandassistin
largeam
ount
ofem
ission
reductions
inMalaysiaparticularly
through
biom
assandbiogas
projects.
Ashnani
etal.(2014)
Malaysia’sstatus
quoin
energy
and
biodieselm
arket
Malaysia
Review
The
major
segm
entofrawmaterialfor
producingbiodiesel
ispalm
oilasthecountryisam
ongthemajor
producers
ofpalm
oilatinternatio
nallevel.
Environ Sci Pollut Res

construction (% of total fuel combustion); FOSSIL representsfossil fuel energy consumption (% of total); IND representsindustry, value added (current US$); NUCLEAR representsalternative and nuclear energy (% of total energy use);RENWASTE represents combustible renewables and waste(% of total energy); and URBAN represents urban population(% of total). These variables are selected because of their vitalimportance in the Malaysian region. Figure 1 shows the trendof the data at level.
Results
This section presents the descriptive statistics, correlationmatrix, and two-stage least square regression technique onthe three most contingent variables i.e., air pollution, environ-ment, and health services in Malaysia. The study brings anumber of variables for air pollution, environment, and healthservices in Malaysia at country level which includes carbondioxide emissions from manufacturing industries and con-struction, fossil fuel energy consumption as percentage of totalenergy consumption, combustible renewables and waste aspercentage of total energy, alternative and nuclear energy aspercentage of total energy use, urban population in percent-age, industry, value added in current US dollar, total fertilityrate—births per woman, total life expectancy at birth in years,infant mortality rate per 1,000 live births, improved sanitationfacilities as percentage of population with access, and im-proved water source (% of population with access). Table 2
shows the descriptive statistics of the variables for the readyreference.
Table 3 shows the correlation matrix between the healthservices, air pollution, and environmental indicators inMalaysian context. The results show that fertility rate has astrong and negative relationship with the fossil fuel energyconsumption, industry value added, and urbanization inMalaysia, while there is a positive association between fertil-ity rate, carbon dioxide emissions, nuclear energy consump-tion, and renewable wastes in a country. Secondly, life expec-tancy exhibit positive association with the fossil fuel energyconsumption, industry value added, and urbanization, whilethere is negative relationship with the carbon dioxide emis-sions, alternative and nuclear energy consumption and renew-able energy and waste. The third determinant of health ser-vices is the infant mortality rate which shows that there ispositive correlation between infant mortality, carbon dioxideemissions, and renewable energy and waste in Malaysia.However, there is some negative association between infantmortality rate, fossil fuel energy consumption, industry valueadded, and urbanization in a country. The fourth factor ofhealth services is the improved sanitation facility which tendsto exhibit the strong positive correlation with the fossil fuelenergy consumption, industry value added, and urbanization,while there is negative correlation with the carbon dioxideemissions, nuclear energy consumption, and renewable ener-gy and waste in Malaysia. Finally, improved water resourceshave positive correlation with the fossil fuel energy consump-tion, industrialization, and urbanization, whereas there is
15
20
25
30
35
40
5 10 15 20 25 30 35
CO2
Carbon dioixde emissions from
manufacturing industries and construction
(% of total fuel combustion)
75
80
85
90
95
5 10 15 20 25 30 35
FOSSIL
Fossil fuel energy consumption (% of total)
4
8
12
16
20
24
5 10 15 20 25 30 35
RENWASTE
Combustible renewables and waste
(% of total energy)
0.5
1.0
1.5
2.0
2.5
3.0
5 10 15 20 25 30 35
NUCLEAR
Alternative and nuclear energy (% of total energy use)
30
40
50
60
70
80
5 10 15 20 25 30 35
URBAN
Urban population (% of total)
0.0E+00
4.0E+10
8.0E+10
1.2E+11
1.6E+11
5 10 15 20 25 30 35
IND
Industry, value added (current US$)
1.5
2.0
2.5
3.0
3.5
4.0
4.5
5 10 15 20 25 30 35
FERT
Fertility rate, total (births per woman)
66
68
70
72
74
76
5 10 15 20 25 30 35
LEXPECT
Life expectancy at birth, total (years)
5
10
15
20
25
30
35
5 10 15 20 25 30 35
MORT
Mortality rate, infant (per 1,000 live births)
76
80
84
88
92
96
5 10 15 20 25 30 35
SANIT
Improved sanitation facilities
(% of population with access)
80
85
90
95
100
5 10 15 20 25 30 35
WATER
Improved water source
(% of population with access)
Fig. 1 Data trend at level
Environ Sci Pollut Res

negative association with the carbon dioxide emissions, nu-clear energy consumption and renewable energy and waste inMalaysia. The overall results indicate the significance of thesevariables in the context of Malaysia.
Table 4 shows the results of two-stage least square regres-sion for the two most promising health factors, i.e., infantfertility rate and life expectancy in a country.
The results show that there is a significant and positiverelationship between alternative and nuclear energy and thetwo most promising health factors, i.e., fertility rate (births perwoman) and life expectancy at birth. The results are quitecontradictory with the previous schools of thoughts whichclaim that the consequences of nuclear energy affects thereproductive health cycle. The studies failed to substantiatethat the consequences of energy radiations decreases the birthrates or decreases the life expectancy at birth (Wurzbacheret al. 2009; Cuttler and Pollycove 2009). The present studyshows the dramatic increase in the fertility rate and life expec-tancy in Malaysia, where the fertility rate increases by 0.211percentage points when there is 1 % increase in the nuclearenergy consumption. Similarly, life expectancy increases by0.010 percentage point in terms of 1 % increase in the nuclearenergy consumption in Malaysia.
Urbanization is one of the major problems in the develop-ing countries with no exception for the Malaysian economy aswell. The results show that there is a significant and negativerelationship between urbanization and fertility rate in
Malaysia, as 1 % increase in the urbanization, fertility ratedecreases by 4.229 percentage points. The results supportedthe findings of theWhite et al. (2008, p. 803) which opine thatthe urbanization is associated with lower fertility in the devel-oping countries or at least, urban women exhibit fertility rateslower than the rural women. The results of the second modelassociated with the increasing life expectancy and urbaniza-tion in Malaysia, as life expectancy increases by 0.164 per-centage point when there is 1 % increase in the urbanization ina country. The results conclude that the urban populations, ingeneral, become healthier than their rural counterparts, asurban residents have a better access to health care and servicesthan do residents in many rural parts (Phillips 1993).
The statistical test for both the models suggests the good-ness of the fit of the model, as the R square is in the range of0.941 to 0.996. The F statistics shows the stability of themodel, as the probability value for both the models show the99 % significance interval. The remaining explanatory vari-ables, i.e., carbon dioxide emission, fossil fuel energy con-sumption, industry value added, and combustible renewablewaste, are insignificant to express the relationship with thefertility rate and life expectancy in the given models. Table 5shows the effect of air pollution and environmental factors oninfant mortality rate in Malaysia.
The results show that along with the increase in the fossilfuel energy consumption in Malaysia, the rate of infant mor-tality significantly decreases, as the coefficient value indicate
Table 3 Correlation matrix
FERT LEXPECT MORT SANIT WATER CO2 FOSSIL IND NUCLEAR RENWASTE URBAN
FERT 1
LEXPECT −0.940 1
MORT 0.855 −0.972 1
SANIT −0.967 0.984 −0.934 1
WATER −0.972 0.980 −0.925 0.997 1
CO2 0.925 −0.900 0.803 −0.901 −0.902 1
FOSSIL −0.893 0.973 −0.970 0.955 0.950 −0.826 1
IND −0.943 0.872 −0.747 0.890 0.894 −0.922 0.804 1
NUCLEAR 0.415 −0.230 0.080 −0.331 −0.355 0.339 −0.287 −0.442 1
RENWASTE 0.871 −0.973 0.985 −0.943 −0.935 0.815 −0.995 −0.780 0.192 1
URBAN −0.981 0.982 −0.916 0.993 0.994 −0.933 0.942 0.928 −0.355 −0.928 1
Table 2 Descriptive statistics
CO2 FERT FOSSIL IND LEXPECT MORT NUCLEAR RENWASTE SANIT URBAN WATER
Mean 29.05508 3.133605 88.82387 3.86E+10 71.21510 14.87105 1.242268 9.951908 87.77257 54.99671 91.57358
Maximum 37.17702 4.209000 94.70309 1.25E+11 74.84229 34.50000 2.659627 22.56580 95.67234 73.36200 99.81000
Minimum 16.72500 1.975000 76.25783 3.36E+09 66.40188 6.900000 0.703096 4.601000 78.00000 37.65200 82.00000
Std. dev. 5.333605 0.706965 5.296116 3.40E+10 2.489246 8.251058 0.516982 5.141777 6.032120 11.27853 6.190169
Observations 38 38 38 38 38 38 38 38 38 38 38
Environ Sci Pollut Res

the more elastic relationship between fossil fuel energy con-sumption and infant mortality rate in a country. The resultsargued that the fossil fuel energy consumption lead to betterknowledge among the public, especially pregnant womenregarding the harmful effects of air pollution and thus, reducetheir exposure to air pollution by engaging in averting behav-ior (Cesur et al 2013). Similarly, there is an indirect relation-ship between urbanization and infant mortality rate; it meansthat if there is 1 % increase in urbanization, the infant mortal-ity rate decreases by 6.219 percentage points. Bandyopadhyayand Green (2013) argued that the most observable way inwhich the mortality decline can add to urbanization is in thecourse of an increase in rural population and following pop-ulation growth above urban threshold levels. The results fur-ther substantiate that due to the rapid industrialization inMalaysia, the rate of infant mortality increases during thestudy time period. The results conclude that industrialization
improved wealth and higher living standards, but it alsoformed industrial towns and big cities which enclosed a sig-nificant underclass whose health was cooperated by the socialand biological pathologies that pulverized poverty andmuddy,overcrowded, and disease-infested urban slums in the country(Encyclopedia of Children and Childhood in History andSociety 2008). Table 6 shows the results of sanitation facilityassess with the percentage of population in accordance withthe air pollution and environmental pollution in Malaysia.
The results show that both the carbon dioxide emissionsand urbanization significantly affect the sanitation facilityavailable to the percentage of population in Malaysia.However, the magnitude of urbanization is largely affectedthan the magnitude of carbon dioxide emissions in a countryas if there is 1 % increase in carbon dioxide emissions andurbanization, sanitation facility is positively affected by0.037% and 0.327 percentage points, respectively. The resultssuggest that the performance of municipal governments andpublic utilities should be improved, as public-private partner-ships be supposed to provide water management and sanita-tion services in a country. The remaining variables insignifi-cantly explained the sanitation facility in Malaysia. Table 7shows the improved water source access with the percent ofpopulation in Malaysia.
The results show that both the industry value added andalternative nuclear energy consumption has a negative andsignificant relationship with the water sources in Malaysia asif there is 1 %increase in the industry value added and alter-native nuclear energy, water accessibility to the populationdecreases by 0.037 and 0.012%, respectively. However, due tothe rapid urbanization in a country, accessibility of waterresources has been improved which lead to a healthy
Table 5 Results of two-stage least square regression on infant mortalityrate
Dependent variable: LOG(MORT)
Method: two-stage least squares
Variable Coefficient Std. error t Statistic Prob.
C 64.316 26.134 2.461 0.019
LOG(CO2) −0.357 0.207 −1.721 0.095
LOG(FOSSIL) −8.725 3.948 −2.209 0.034
LOG(IND) 0.307 0.147 2.089 0.045
LOG(NUCLEAR) −0.030 0.052 −0.576 0.568
LOG(RENWASTE) −1.834 1.141 −1.607 0.118
LOG(URBAN) −6.219 1.743 −3.567 0.001
R squared 0.988 Mean dependent var 2.534
Adjusted R squared 0.986 S.D. dependent var 0.506
S.E. of regression 0.058 Sum squared resid 0.102
F statistic 450.5 Durbin-Watson stat 1.725
Prob(F statistic) 0.000 Second-stage SSR 0.038
Table 4 Results of two-stage least square regression in case of infantfertility rate and life expectancy
Model 1
Dependent variable: LOG(FERT)
Method: two-stage least squares
Variable Coefficient Std. error t Statistic Prob.
C 47.437 28.981 1.636 0.112
LOG(CO2) 0.144 0.230 0.627 0.535
LOG(FOSSIL) −5.408 4.378 −1.235 0.226
LOG(IND) −0.045 0.163 −0.280 0.780
LOG(NUCLEAR) 0.211 0.058 3.628 0.001
LOG(RENWASTE) −2.124 1.265 −1.678 0.103
LOG(URBAN) −4.229 1.933 −2.187 0.036
R squared 0.941 Mean dependent var 1.105
Adjusted R squared 0.929 S.D. dependent var 0.243
S.E. of regression 0.064 Sum squared resid 0.125
F statistic 82.543 Durbin-Watson stat 1.376
Prob(F statistic) 0.000 Second-stage SSR 0.059
Model 2
Dependent variable: LOG(LEXPECT)
Variable Coefficient Std. error t Statistic Prob.
C 2.785 1.001 2.780 0.009
LOG(CO2) 0.003 0.007 0.475 0.637
LOG(FOSSIL) 0.124 0.151 0.821 0.417
LOG(IND) 0.008 0.005 1.440 0.160
LOG(NUCLEAR) 0.010 0.002 5.011 0.000
LOG(RENWASTE) 0.025 0.043 0.584 0.563
LOG(URBAN) 0.164 0.066 2.468 0.019
R squared 0.996 Mean dependent var 4.266
Adjusted R squared 0.995 S.D. dependent var 0.033
S.E. of regression 0.002 Sum squared resid 0.000
F statistic 1357.699 Durbin-Watson stat 1.169
Prob(F statistic) 0.000 Second-stage SSR 7.51E-05
Environ Sci Pollut Res

Malaysia in the region. The results infer that water re-sources due to the enormous growth of coal mining,thermal power generation, and associated industrial ac-tions are anticipated to amplify pollution load to the riversystem (Reza and Singh 2010). The United NationsDevelopment Programme (UNDP) (2006) concludes thatindustrial production required water for processing,cooling, and disposal of waste products. Populationgrowth, per capita income, urbanization, and industrialdevelopment will increase demand for a fixed supply ofwater. In order to meet the demand of water for industrial
use, there is a growing need to use fossil fuel energyconsumption which substantiates carbon free economy ina country.
Conclusion
The objective of the study is to examine the relationshipbetween air pollution, environmental indicators, and healthservices inMalaysia, over the period of 1975–2012. The studyused carbon dioxide emissions as a proxy for air pollution,while fossil fuel energy consumption, combustible renewablesand waste, alternative and nuclear energy, urban population,and industry value added are taken as a proxy for environ-mental factors. Health services include direct and indirecthealth infrastructure, i.e., infant fertility rate, infant mortalityrate, and life expectancy are taken as a proxy for direct healthservices, while improved sanitation facility and water re-sources are taken as indirect health services in Malaysia. Thestudy selected two-stage least square (2SLS) regression tech-nique for simultaneous equations model. The following re-sults are drawn from this exercise, i.e.,
& Alternative and nuclear energy has a positive impact onfertility rate in Malaysia, while there is a negative andmore elastic relationship between urbanization and fertil-ity rate in a country.
& Along with the increase in alternative and nuclear energyand urbanization, life expectancy increases by 0.010 %and 0.164 percentage points, respectively.
& Both the fossil fuel energy consumption and urbanizationexhibit the strong and negative impact on infant mortalityrate in Malaysia, as the coefficient value indicate the moreelastic relationship between the variables.
& While, there is a positive and less elastic relationshipbetween industrialization and infant mortality rate in acountry.
& Carbon dioxide emissions and urbanization both have apositive association with the sanitation facility available tothe people in Malaysia; however, urbanization has a great-er impact on improved sanitation as compared to thecarbon emissions in a country.
& Industrialization and alternative nuclear energy bothplayed a central role to decrease water resources, whilerising urban population improved the water resources in acountry.
& Combustible renewable and waste insignificantly explainthe health infrastructure in two-stage least square regres-sion model; however, in the correlation matrix, this vari-able has a strong and negative correlation with the twomost promising health variables, i.e., fertility rate andinfant mortality rate in Malaysia.
Table 7 Results of two-stage least square regression on improved watersources
Dependent variable: LOG(WATER)
Method: two-stage least squares
Variable Coefficient Std. error t Statistic Prob.
C 3.003 2.505 1.199 0.239
LOG(CO2) 0.024 0.019 1.206 0.237
LOG(FOSSIL) 0.114 0.378 0.303 0.763
LOG(IND) −0.037 0.014 −2.646 0.012
LOG(NUCLEAR) −0.012 0.005 −2.463 0.019
LOG(RENWASTE) −0.009 0.109 −0.082 0.934
LOG(URBAN) 0.459 0.167 2.748 0.010
R squared 0.994 Mean dependent var 4.517
Adjusted R squared 0.992 S.D. dependent var 0.066
S.E. of regression 0.005 Sum squared resid 0.000
F statistic 835.183 Durbin-Watson stat 1.392
Prob(F statistic) 0.000 Second-stage SSR 0.000
Table 6 Results of two-stage least square regression on improved watersanitation facility
Dependent variable: LOG(SANIT)
Method: two-stage least squares
Variable Coefficient Std. error t Statistic Prob.
C 4.186 2.515 1.663 0.106
LOG(CO2) 0.037 0.020 1.897 0.067
LOG(FOSSIL) −0.131 0.380 −0.345 0.732
LOG(IND) −0.017 0.014 −1.231 0.227
LOG(NUCLEAR) −0.006 0.005 −1.309 0.200
LOG(RENWASTE) −0.063 0.109 −0.574 0.569
LOG(URBAN) 0.327 0.167 1.948 0.060
R squared 0.994 Mean dependent var 4.475
Adjusted R squared 0.992 S.D. dependent var 0.067
S.E. of regression 0.005 Sum squared resid 0.000
F statistic 852.122 Durbin-Watson stat 0.907
Prob(F statistic) 0.000 Second-stage SSR 0.000
Environ Sci Pollut Res
& While, there is strong and positive correlation between thecombustible renewable and waste, life expectancy, im-proved sanitation facility and water resources in a country.
The results indicate that the expansion of fossil fuel energyconsumption has caused a significant decrease in the rate ofinfant fertility in Malaysia. In particular, a one percentagepoint increase in the rate of subscription to fossil fuel energyconsumption would cause the infant mortality rate to declineby about 8.725 %.
The study stresses the cost of increasing economic growthand industrialization in the developing countries likeMalaysia, where the pace of economic growth and industrial-ization deteriorate the environmental conditions and air qual-ity in a country. The air pollution is one of the serious threatsto health services in most developing countries; therefore,there is a special need to focus on environmental regulationsin Malaysia. The study results put forward that mortalitydecline in Malaysia causes urbanization through the construc-tion of new cities rather than promoting urban growth inalready-extant cities.
Advancing in efforts that measured the rates of populationgrowth through growing access to voluntary family planningservices which may help to ensure that sufficient water isaccessible for global food production, ecosystem health, andpolitical and social stability, there is a need of flexible andadaptable solutions on the design and development of watersupply infrastructure to trim down the exposure of systems tothese changes.
Increasing urbanization and industrialization is levelingstrain on the environment infrastructure; thus, leading tostrong air pollution which is ultimately reducing the nationalfabric of Malaysia. Energy consumption and industrializationis a good indicator of economic growth, but stabilizing theenvironment along with the investment injection is like oper-ating between a hard place and a rock. Balancing both needsstrong policy vistas on the end of the government officials.
References
Abidin EZ, Semple S, Rasdi I, Ismail SNS, Ayres JG (2014) The rela-tionship between air pollution and asthma in Malaysianschoolchildren. Air Qual Atmos Health. doi:10.1007/s11869-014-0252-0
Akhmat G, Zaman K, Shukui T, Malik IA, Begum S, Ahmed A(2014a) A contemporary landscape of air pollution and green-house gas emissions leads to inevitable phenomena of lowbirthweight. Environ Sci Pollut Res. doi:10.1007/s11356-014-2867-y
Akhmat G, Zaman K, Shukui T, Sajjad F, Khan MA, Khan MZ (2014b)The challenges of reducing greenhouse gas emissions and air pol-lution through energy sources: evidence from a panel of developedcountries. Environ Sci Pollut Res 21(12):7425–7435
Allianz Worldwide Care (2013) Healthcare in Malaysia. Online availableat: http://www.allianzworldwidecare.com/healthcare-in-malaysia(accessed on 2nd July, 2014)
Ashnani MHM, Johari A, Hashim H, Hasani E (2014) A source ofrenewable energy in Malaysia, why biodiesel? Renew Sust EnergRev 35:244–257
Balbus JM, Boxall A, Fenske RA, McKone TE, Zeise L (2013)Implications of global climate change for the assessment and man-agement of human health risks of chemicals in the natural environ-ment. Environ Toxicol Chem 32(1):62–78
Bandyopadhyay S, Green E (2013) Urbanization and Mortality Decline(No. 46). Online available at: http://personal.lse.ac.uk/BANDYOPS/BGurb.pdf (accessed on 16th June,. 2014)
Brunekreef B, Holgate ST (2002) Air pollution and health. Lancet360(9341):1233–1242
Cesur R, Tekin E, Ulker A (2013) Air pollution and infant mortality:evidence from the expansion of natural gas infrastructure.National Bureau of Economic Research, Working paper seriesNo. 18736. Online available at: http://www.iza.org/conference_files/environment2013/tekin_e527.pdf (accessed on 16th June,2014)
Cuttler JM, Pollycove M (2009) Nuclear energy and health: and thebenefits of low-dose radiation hormesis. Dose-Response 7(1):52–89
D’Amato G, Bergmann KC, Cecchi L, Annesi-Maesano I, Sanduzzi A,Liccardi G, Vitale C, Stanziola A, D’Amato M (2014) Climatechange and air pollution. Allergol J Int 23(1):17–23
De Sario M, Katsouyanni K, Michelozzi P (2013) Climate change,extreme weather events, air pollution and respiratory health inEurope. European Respiratory Journal, erj00747-2012, doi: 10.1183/09031936.00074712
Encyclopedia of Children and Childhood in History and Society (2008)Infant Mortality. Online available at: http://www.faqs.org/childhood/In-Ke/Infant-Mortality.html (accessed on 16th June,2014)
Latif MT, Dominick D, Ahamad F, Khan MF, Juneng L, Hamzah FM,Nadzir MSM (2014) Long term assessment of air quality from abackground station on the Malaysian Peninsula. Sci Total Environ482:336–348
Lim XL, Lam WH (2014) Review on Clean Development Mechanism(CDM) implementation in Malaysia. Renew Sust Energ Rev 29:276–285
Loganathan N, Shahbaz M, Taha R (2014) The link between greentaxation and economic growth on CO2 emissions: fresh evidencefrom Malaysia. Renew Sust Energ Rev 38:1083–1091
Ma’pol A, Hashim JH, Norbäck D, Weislander G, Hashim Z, Isa ZM(2014) Prevalence of asthma and level of fractional exhaled nitrogenoxide among Malaysian school children. BMC Public Health14(Suppl 1):O27. doi:10.1080/07900627.2013.876851
Ministry of Health (2011) Country Health Plan: 10th Malaysian Plan2011-2015, Putrajaya, Malaysia. Online available at: http://www.moh.gov.my/images/gallery/Report/Country_health.pdf (accessedon 2nd July, 2014)
Mokhtar MB, Murad W (2010) Issues and framework of environmentalhealth in Malaysia. J Environ Health 72(8):24–29
Othman J, Sahani M, Mahmud M, Sheikh Ahmad MK (2014)Transboundary smoke haze pollution in Malaysia: inpatient healthimpacts and economic valuation. Environ Pollut 189:194–201
Phillips DR (1993) Urbanization and human health. Parasitology106(S1):S93–S107
Rafindadi AA, Yusof Z, Zaman K, Kyophilavong P, Akhmat G(2014) The relationship between air pollution, fossil fuel ener-gy consumption, and water resources in the panel of selectedAsia-Pacific countries. Environ Sci Pollut Res. doi:10.1007/s11356-014-3095-1
Rao S, Pachauri S, Dentener F, Kinney P, Klimont Z, Riahi K, SchoeppW(2013) Better air for better health: forging synergies in policies for
Environ Sci Pollut Res

energy access, climate change and air pollution. Glob EnvironChang 23(5):1122–1130
Reza R, Singh G (2010) Impact of industrial development on surfacewater resources in Angul region of Orissa. Int J Environ Sci 1(4):514–522
Sajjad F, Noreen U, Zaman K (2014) Climate change and air pollutionjointly creating nightmare for tourism industry. Environ Sci PollutRes. doi:10.1007/s11356-014-3146-7
Shabbir MS, Shahbaz M, Zeshan M (2014) Renewable and nonre-newable energy consumption, real GDP and CO2 emissionsnexus: a structural VAR approach in Pakistan. Bull EnergyEcon 2(3):91–105
Shahbaz M, Sbia R, Hamdi H, Ozturk I (2014) Economic growth,electricity consumption, urbanization and environmental degrada-tion relationship in United Arab Emirates. Ecol Indic 45:622–631
Shafiq Q, Zaman K (2014) Economic Freedom indicator contribution toenergy utilization? A missing link in the energy reforms. BullEnergy Econ 2(4):124–135
Steinle S, Reis S, Sabel CE (2013) Quantifying human exposure to airpollution—moving from static monitoring to spatio-temporally re-solved personal exposure assessment. Sci Total Environ 443:184–193
United Nations Development Programme (UNDP) (2006) HumanDevelopment Report 2006: beyond scarcity: power, poverty andthe global water crisis. UNDP, New York, NY
White MJ, Muhidin S, Andrzejewski C, Tagoe E, Knight R, Reed H(2008) Urbanization and fertility: an event-history analysis of coast-al Ghana. Demography 45(4):803–816
World Bank (2013) World Development Indicators–2013. World Bank,Washington, D.C, USA
Wurzbacher K, Oda Y, Gabizon S, Doszhanova E (2009) Unsustainableenergy—nuclear energy: women andmen’s different health risks fromnuclear radiation. Online available at: http://www.womenrio20.org/docs/Unsustainable_Energy.pdf (accessed on 12th June, 2014)
Yasser M (2014) Preliminary possibility of utilising renewable energy fordomestic electricity generation in rural and regional Australia. BullEnergy Econ 2(2):41–49
Environ Sci Pollut Res


