Embed Size (px)
Citation preview
Marine Environmental Research 68 (2009) 49–58
Contents lists available at ScienceDirect
Marine Environmental Research
journal homepage: www.elsevier .com/locate /marenvrev
Environmental magnetism and application in the continental shelf sedimentsof India
R. Alagarsamy *
National Institute of Oceanography, Council of Scientific and Industrial Research (CSIR), Donapaula, Goa 403004, India
a r t i c l e i n f o a b s t r a c t
Article history:Received 11 January 2008Received in revised form 27 February 2009Accepted 13 April 2009
Keywords:Mineral magneticHeavy metalMagnetic methodSedimentContinental shelfIndia
0141-1136/$ - see front matter � 2009 Elsevier Ltd. Adoi:10.1016/j.marenvres.2009.04.003
* Address: Earth Dynamic System Research CeUniversity, Tainan 70101, Taiwan, ROC. Tel.: +886+886 6 2740285.
E-mail address: [email protected]
Mineral magnetic and geochemical analyses were carried out on surface sediments from the continentalshelf of India. The purpose of this study is to examine the environmental assessment of heavy metal con-centrations and its impact in the coastal environment using magnetic techniques and to gain an under-standing on the factors controlling metal concentrations and distributions in the east and west coast ofIndia. The strong relationships between Anhysteretic Remanent Magnetization (vARM) and heavy metalscan be explained by the role of iron oxides controlling metal concentrations, though the link is also rein-forced by the strong tendency of vARM to be associated with the finer particle sizes. Higher values of mag-netic susceptibility, IRM20 mT and SIRM are associated with the east coast shelf sediments suggest thepresence of high ferrimagnetic content, which can be derived from the weathering products of the DeccanBasalts. vARM can be used as a normalizer for particle size effects in the way that Aluminium (Al) is oftenused. The relationship between magnetic parameters and heavy metal concentrations (Fe, Cu, Cr and Ni)showed a strong positive correlation in the east coast sediments, much less so in the case of the westcoast. This finding suggests that the simple, rapid and non-destructive magnetic measurement can beused as an indicator for the heavy metal contamination and proxies for the measurement of heavy metalscontent in the coastal environment.
� 2009 Elsevier Ltd. All rights reserved.
1. Introduction
Magnetic measurements are being used as a powerful tool forthe assessment of heavy metal contamination in soils and sedi-ments and in the investigation of the compositional properties ofrocks, sediments and soils (Thompson and Oldfield, 1986; Waldenet al., 1999; Maher and Thompson, 1999). Magnetic minerals insoils are derived either from the parent rocks (lithogenic origin),pedogenesis or as a result of anthropogenic activities. Susceptibil-ity measurements play an important role for monitoring environ-mental pollution in the case of minor contributions of the firsttwo sources to the magnetic properties of soils. Accumulation ofanthropogenic ferrimagnetic particles, originating during hightemperature combustion of fossil fuels (e.g., Vassilev, 1992; Dek-kers and Pietersen, 1992), results in significant enhancement oftopsoil magnetic susceptibility. Therefore, under favourable cir-cumstances, magnetic properties of soils and sediments can beused for the assessment of emissions, both from local pollutionsources and on a wider regional scale. Already a pioneering workof Thompson and Oldfield (1986) reported that soils near urban
ll rights reserved.
nter, National Cheng Kung6 2757575 65432 219; fax:
areas and industrial zones have an increased magnetic susceptibil-ity, due to the deposition of magnetic particles, such as, dusts ofthe metallurgical industries and fly ashes of the coal combustion.Magnetic measurements are relatively simple and non-destructiveand due to high sensitivity and speed are often applied for detect-ing industrial pollution. Because there is a need for fast and costeffective screening and monitoring tools for industrial pollution,magnetic methods have drawn the attention of modern research-ers as an approximate tool, to detect and characterize environmen-tal pollution (e.g., Dearing et al., 1996; Petrovsky and Ellwood,1999; Hoffmann et al., 1999; Magiera and Strzyszcz, 2000; Petro-vsky et al., 2001; Hanesch and Scholger, 2002; Veneva et al.,2004, and others). This work has been used to identify the sourcesof industrial pollution (Scoullos et al., 1979; Hunt et al., 1984;Matzka and Maher 1999; Petrovsky et al., 2000, 2001; Kloseet al., 2001; Knab et al., 2001; Lecoanet et al., 2001; Hanesch andScholger 2002; Muxworthy et al., 2002; Hanesch et al., 2003;Kapicka et al., 2003; Moreno et al., 2003; Desenfant et al., 2004;Jordanova et al., 2004; Spiteri et al., 2005) and to characterizevarious depositional environments (e.g., Arkell et al., 1983; Oldfieldet al., 1985, 1999; White et al., 1997; Walden et al., 1995, 1997;Schmidt et al., 1999; Wheeler et al., 1999). The relationship be-tween mineral magnetic measurements and chemical/physicalproperties of sediments and soils have been established in severalstudies (Oldfield et al., 1985; Oldfield and Yu, 1994; Clifton et al.,
50 R. Alagarsamy / Marine Environmental Research 68 (2009) 49–58
1997, 1999; Chan et al., 1998; Petrovsky et al., 1998; Xie et al.,1999, 2000; Booth, 2002). Mineral magnetic measurements wereused as a tool for determining sediment provenance (Oldfieldand Yu, 1994), transport pathways (Lepland and Stevens, 1996),as a proxy for geochemical, radioactivity, organic matter contentand particle size data (Bonnett et al., 1988; Oldfield et al., 1993;Hutchinson and Prandle, 1994; Clifton et al., 1997, 1999; Xieet al., 1999, 2000; Zhang et al., 2001; Booth et al., 2005). Magneticmeasurements as a proxy for industrial contamination have alsobeen employed in India (Goddu et al., 2004). Hence, the presentstudy is undertaken in order to examine the environmental assess-ment of heavy metal concentrations and its impact in the coastalenvironment using magnetic techniques and to gain an under-standing on the factors controlling metal concentrations and distri-butions along the east and west coast of India.
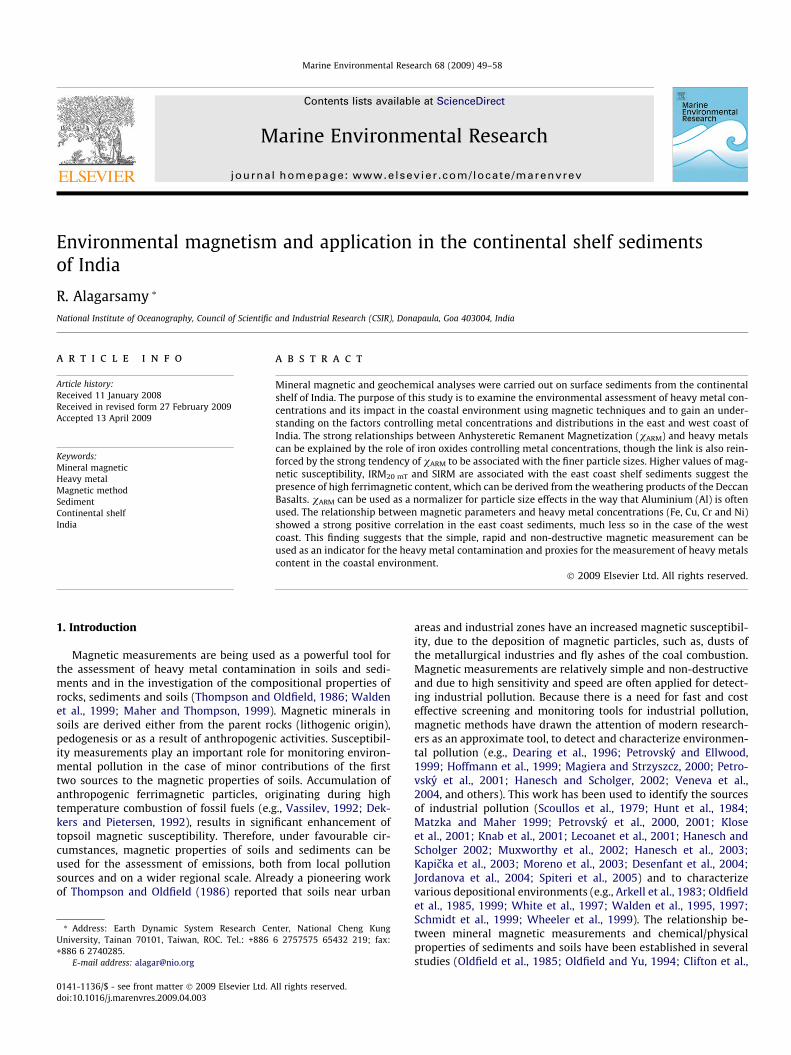
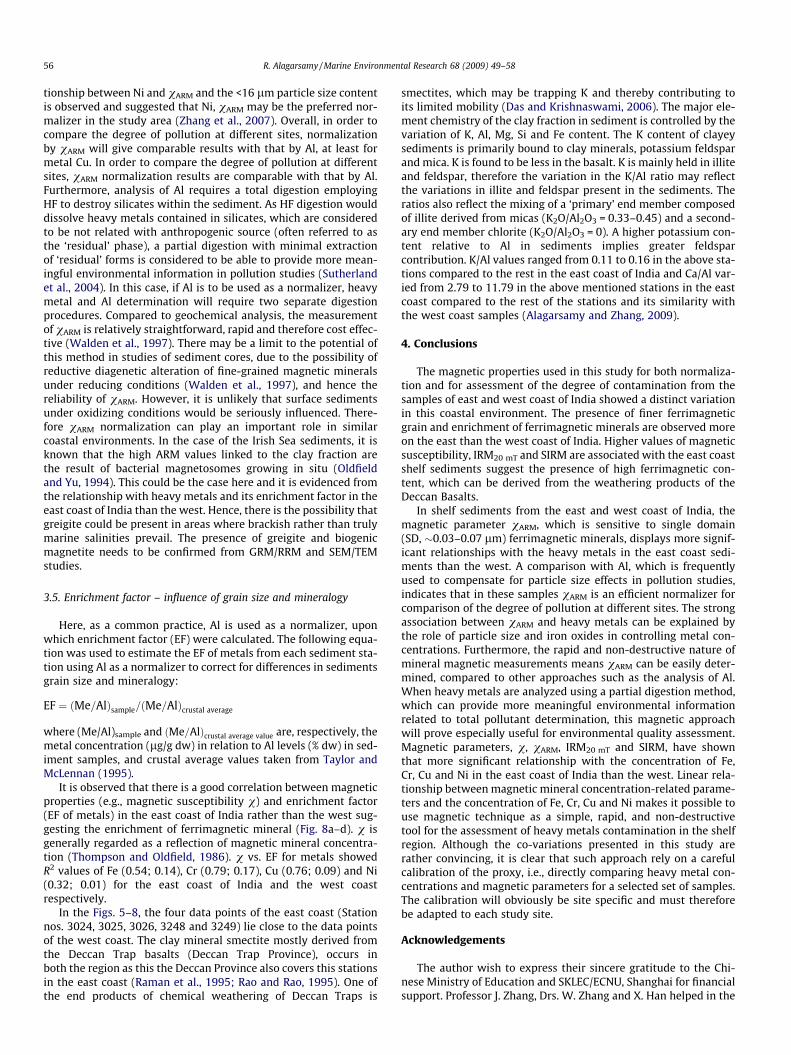
Fig. 1. Location of sediment sampling stations along the east and west coast ofIndia. 4-RVG 130; h-RVG 143; o-RVG 139 represent the sampling sites of differentcruises.
2. Materials and methods
2.1. Study area
2.1.1. Geographic settingThe subcontinent of India, geographically covers tropical to sub-
tropical climatic zones and exhibits strong seasonality from warmhumid to arid and cold arid conditions. The climate of the subcon-tinent is dominated by Monsoon systems; this region remains hu-mid during summer and dry during winter. It has basically twomain seasons, the wet and dry, instead of four seasons. The gradi-ent of climatic zones is largely affected by the sharp altitudinalchanges in the northern half where the Himalaya forms the majorrelief. The Indian subcontinent experiences mostly a tropical mon-soon climate, with significant seasonal variations in rainfall andtemperature. The Himalayas, acting as a barrier to the cold north-erly winds from Central Asia, maintain the pattern of the IndianOcean monsoon circulation. The Thar Desert allows oceanic atmo-spheric circulation and sediment dust-aerosol influx deep into thecontinent. The southwest (SW) monsoon is divided into ArabianSea Branch of the SW Monsoon and Bay of Bengal Branch of theSW Monsoon. The Arabian Sea branch extends the low-pressurearea over the Thar Desert in Rajasthan whereas the Bay of Bengalbranch results in turbulence in the region due to the rapid altitudi-nal differences and narrowing orography. The Arabian Sea branchis roughly three times stronger than the Bay of Bengal branch. Thisbranch of the monsoon moves northwards along the WesternGhats giving rain to the coastal areas west of the Western Ghatsand the eastern parts of the Western Ghats do not receive muchrain from this monsoon. The climate-induced sedimentation pro-cesses take place in large-scale during strong monsoons as cy-clones occur in the coastal region (Sangode et al., 2007).
2.1.2. East coast-geology-climateThe outer limit of the eastern continental shelf of India lies at
�200 m (Fig. 1) and the inner shelf and the continental slope arecovered by clastic sediments (Rao, 1985). The outer shelf is coveredby calcareous relict sediments and off the river mouths the shelf iscovered by fine-grained terrigenous sediments. The shelf at themouths of the rivers receives a large part of its sediment fromthe rivers Ganges, Brahmaputra and Mahanadi in the north, Godav-ari and Krishna in the central region, all forming fertile, heavilypopulated deltas. Sediment from the rivers has made the bay ashallow sea, and the waters have reduced the salinity of surfacewaters along the shore. Sediment input and annual discharge isless from the smaller rivers such as Pennar and Cauvery in thesouth (Rao, 1979, 1985).
The presence of the Deccan Basalt is observed along the tribu-taries of the Godavari and discharged into the Bay of Bengal from
the east coast of the Peninsular India through the Mahanadi, God-avari and Cauvery river systems (Sangode et al., 2007). DeccanProvince also covers the studied stations in the east coast of India(Raman et al., 1995).
2.1.3. West coast-geology-climateThe Indus river is the largest source of sediments in the Arabian
Sea, which extend outward to a distance of �1000–1500 km (Raoand Rao, 1995). It predominantly drains the Precambrian meta-morphic rocks of Himalayas and to a lesser extent the semi aridand arid soils of West Pakistan and NW India (Krishnan, 1968).Deccan Trap basalts (Fig. 1) are the predominant rock types crop-ping out in the Saurashtra and the drainage basins of the Narmadaand Tapti rivers, which annually discharge �60 � 106 tonnes sedi-ment through the Gulf of Cambay (Rao, 1975) where a semi-aridclimate prevails. The Western Ghats are composed of basalts be-tween Mumbai and Goa, and Precambrian granites, gneisses,schists and charnockites between Goa and Cochin (Krishnan,1968). The Ghats are located on the coast between Goa and Bhatkalbut are 50–80 km from the coast south of Bhatkal. The source ofsediments in rivers originating in the western part of India is de-rived the black ‘‘cotton soils”, covering the Deccan Traps, a largepercentage of which is mainly composed of montmorillonite. Thedrainage area in the upper reaches of these rivers is a montmoril-lonite-rich, zone but in the lower reaches, they drain through Pre-cambrian formations that contain kaolinite rich soils that are ofsecondary significance in the shelf sediments derived from theGodavari and Krishna rivers (Rao, 1991). It is well established thatsource rock compositions and weathering mechanisms basicallycontrol the distinct geochemical compositions of sediments inthe east and west coast of India (Alagarsamy and Zhang, 2005).
2.2. Sampling and analysis
Surface sediments from the east and west coasts of India werecollected using a Van Veen Grab/Snapper during several cruisesof the R.V. Gaveshani (130, 139 and 143) (Fig. 1; Table 1). Subsam-ples were collected from the uppermost layer of the sediment tak-ing care to minimize contamination. Samples were frozen after
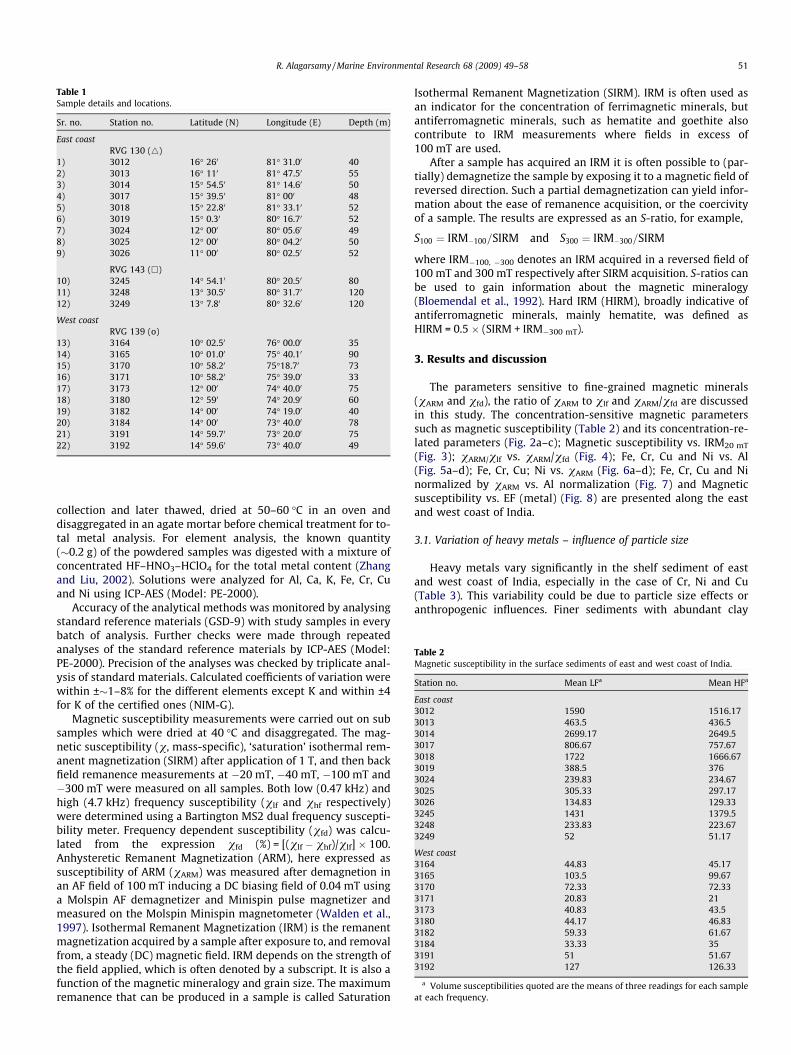
Table 1Sample details and locations.
Sr. no. Station no. Latitude (N) Longitude (E) Depth (m)
East coastRVG 130 (4)
1) 3012 16� 260 81� 31.00 402) 3013 16� 110 81� 47.50 553) 3014 15� 54.50 81� 14.60 504) 3017 15� 39.50 81� 000 485) 3018 15� 22.80 81� 33.10 526) 3019 15� 0.30 80� 16.70 527) 3024 12� 000 80� 05.60 498) 3025 12� 000 80� 04.20 509) 3026 11� 000 80� 02.50 52
RVG 143 (h)10) 3245 14� 54.10 80� 20.50 8011) 3248 13� 30.50 80� 31.70 12012) 3249 13� 7.80 80� 32.60 120
West coastRVG 139 (o)
13) 3164 10� 02.50 76� 00.00 3514) 3165 10� 01.00 75� 40.10 9015) 3170 10� 58.20 75�18.70 7316) 3171 10� 58.20 75� 39.00 3317) 3173 12� 000 74� 40.00 7518) 3180 12� 590 74� 20.90 6019) 3182 14� 000 74� 19.00 4020) 3184 14� 000 73� 40.00 7821) 3191 14� 59.70 73� 20.00 7522) 3192 14� 59.60 73� 40.00 49
Table 2Magnetic susceptibility in the surface sediments of east and west coast of India.
Station no. Mean LFa Mean HFa
East coast3012 1590 1516.173013 463.5 436.53014 2699.17 2649.53017 806.67 757.673018 1722 1666.673019 388.5 3763024 239.83 234.673025 305.33 297.173026 134.83 129.333245 1431 1379.53248 233.83 223.673249 52 51.17
West coast3164 44.83 45.173165 103.5 99.673170 72.33 72.333171 20.83 213173 40.83 43.53180 44.17 46.833182 59.33 61.673184 33.33 353191 51 51.673192 127 126.33
a Volume susceptibilities quoted are the means of three readings for each sampleat each frequency.
R. Alagarsamy / Marine Environmental Research 68 (2009) 49–58 51
collection and later thawed, dried at 50–60 �C in an oven anddisaggregated in an agate mortar before chemical treatment for to-tal metal analysis. For element analysis, the known quantity(�0.2 g) of the powdered samples was digested with a mixture ofconcentrated HF–HNO3–HClO4 for the total metal content (Zhangand Liu, 2002). Solutions were analyzed for Al, Ca, K, Fe, Cr, Cuand Ni using ICP-AES (Model: PE-2000).
Accuracy of the analytical methods was monitored by analysingstandard reference materials (GSD-9) with study samples in everybatch of analysis. Further checks were made through repeatedanalyses of the standard reference materials by ICP-AES (Model:PE-2000). Precision of the analyses was checked by triplicate anal-ysis of standard materials. Calculated coefficients of variation werewithin ±�1–8% for the different elements except K and within ±4for K of the certified ones (NIM-G).
Magnetic susceptibility measurements were carried out on subsamples which were dried at 40 �C and disaggregated. The mag-netic susceptibility (v, mass-specific), ‘saturation’ isothermal rem-anent magnetization (SIRM) after application of 1 T, and then backfield remanence measurements at �20 mT, �40 mT, �100 mT and�300 mT were measured on all samples. Both low (0.47 kHz) andhigh (4.7 kHz) frequency susceptibility (vlf and vhf respectively)were determined using a Bartington MS2 dual frequency suscepti-bility meter. Frequency dependent susceptibility (vfd) was calcu-lated from the expression vfd (%) = [(vlf � vhf)/vlf] � 100.Anhysteretic Remanent Magnetization (ARM), here expressed assusceptibility of ARM (vARM) was measured after demagnetion inan AF field of 100 mT inducing a DC biasing field of 0.04 mT usinga Molspin AF demagnetizer and Minispin pulse magnetizer andmeasured on the Molspin Minispin magnetometer (Walden et al.,1997). Isothermal Remanent Magnetization (IRM) is the remanentmagnetization acquired by a sample after exposure to, and removalfrom, a steady (DC) magnetic field. IRM depends on the strength ofthe field applied, which is often denoted by a subscript. It is also afunction of the magnetic mineralogy and grain size. The maximumremanence that can be produced in a sample is called Saturation
Isothermal Remanent Magnetization (SIRM). IRM is often used asan indicator for the concentration of ferrimagnetic minerals, butantiferromagnetic minerals, such as hematite and goethite alsocontribute to IRM measurements where fields in excess of100 mT are used.
After a sample has acquired an IRM it is often possible to (par-tially) demagnetize the sample by exposing it to a magnetic field ofreversed direction. Such a partial demagnetization can yield infor-mation about the ease of remanence acquisition, or the coercivityof a sample. The results are expressed as an S-ratio, for example,
S100 ¼ IRM�100=SIRM and S300 ¼ IRM�300=SIRM
where IRM�100, �300 denotes an IRM acquired in a reversed field of100 mT and 300 mT respectively after SIRM acquisition. S-ratios canbe used to gain information about the magnetic mineralogy(Bloemendal et al., 1992). Hard IRM (HIRM), broadly indicative ofantiferromagnetic minerals, mainly hematite, was defined asHIRM = 0.5 � (SIRM + IRM�300 mT).
3. Results and discussion
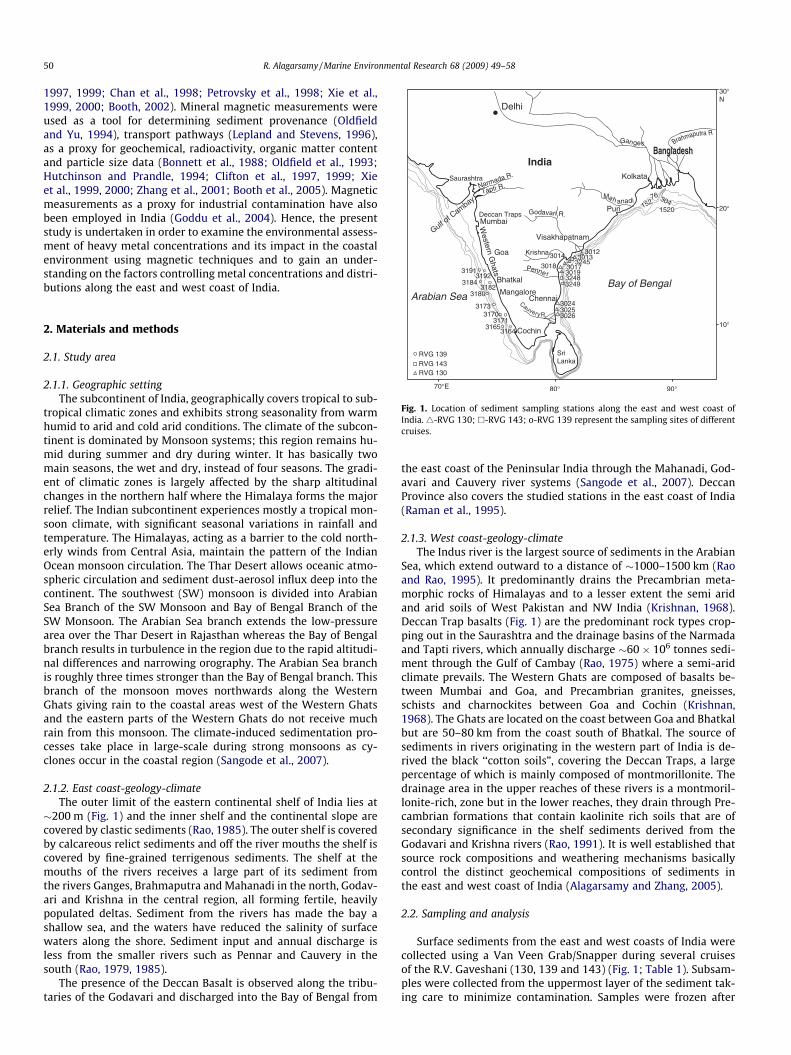
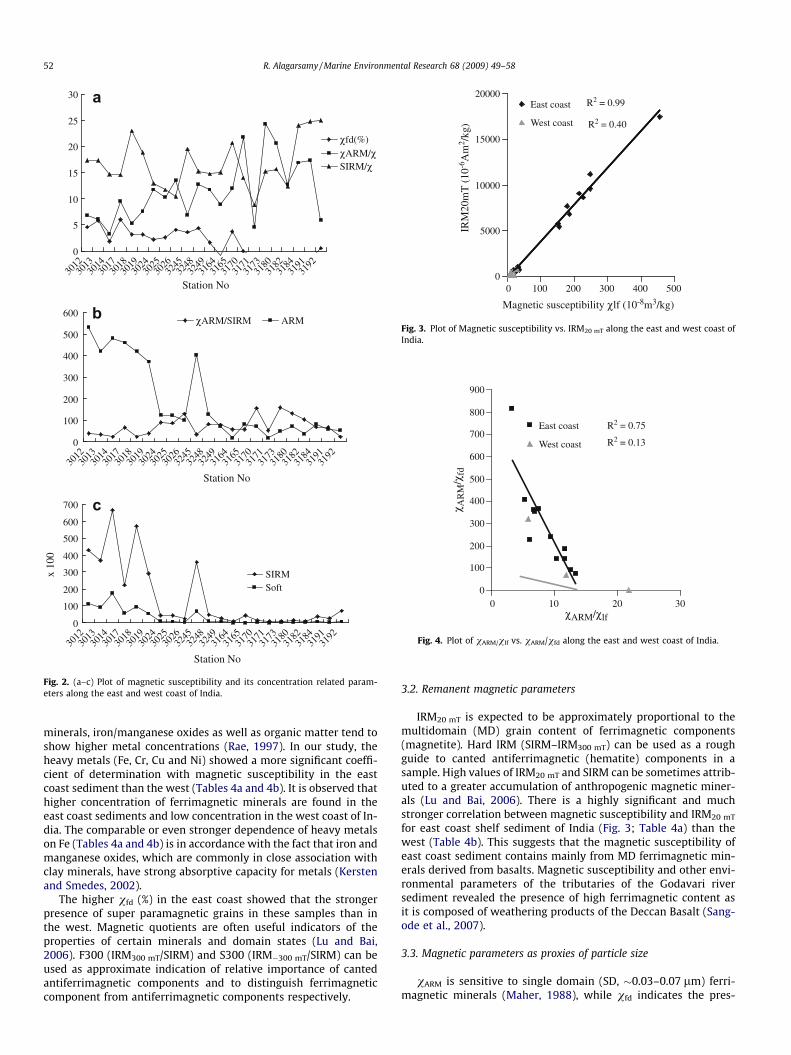
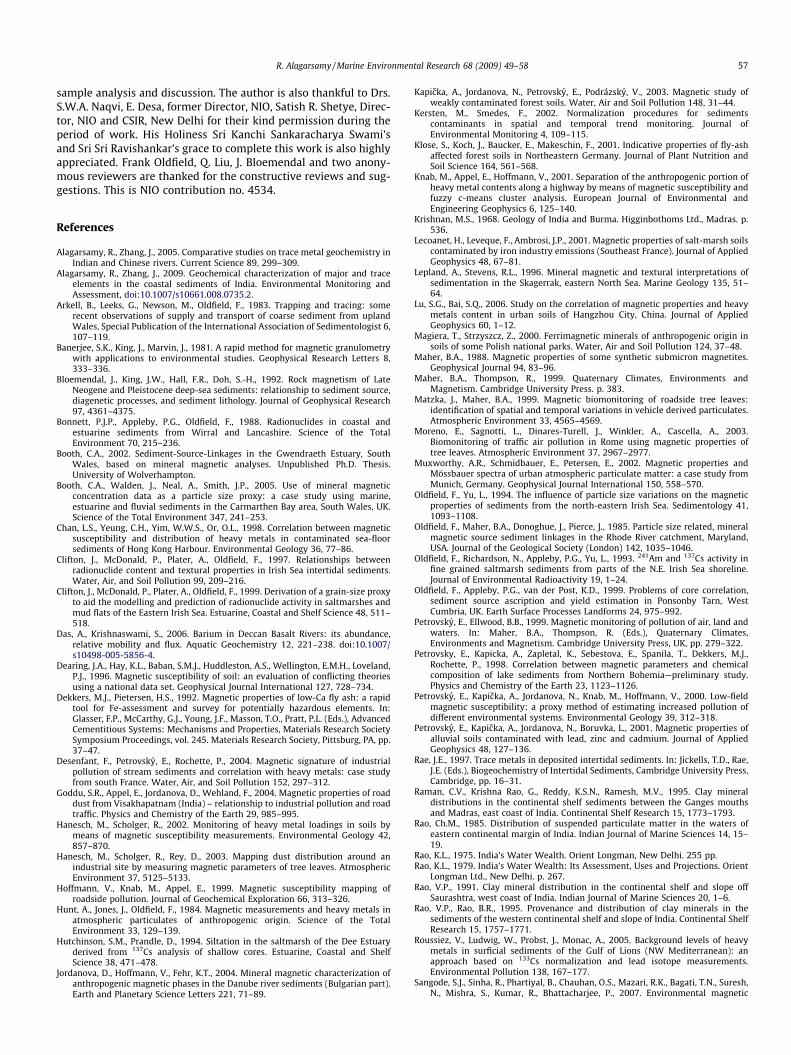
The parameters sensitive to fine-grained magnetic minerals(vARM and vfd), the ratio of vARM to vlf and vARM/vfd are discussedin this study. The concentration-sensitive magnetic parameterssuch as magnetic susceptibility (Table 2) and its concentration-re-lated parameters (Fig. 2a–c); Magnetic susceptibility vs. IRM20 mT
(Fig. 3); vARM/vlf vs. vARM/vfd (Fig. 4); Fe, Cr, Cu and Ni vs. Al(Fig. 5a–d); Fe, Cr, Cu; Ni vs. vARM (Fig. 6a–d); Fe, Cr, Cu and Ninormalized by vARM vs. Al normalization (Fig. 7) and Magneticsusceptibility vs. EF (metal) (Fig. 8) are presented along the eastand west coast of India.
3.1. Variation of heavy metals – influence of particle size
Heavy metals vary significantly in the shelf sediment of eastand west coast of India, especially in the case of Cr, Ni and Cu(Table 3). This variability could be due to particle size effects oranthropogenic influences. Finer sediments with abundant clay
a
0
5
10
15
20
25
30
301230
1330
1430
1730
1830
1930
2430
2530
2632
4532
4832
4931
6431
6531
7031
7131
7331
8031
8231
8431
9131
92
Station No
χfd(%)χARM/χSIRM/χ
c
0
100
200
300
400
500
600
700
301230
1330
1430
1730
1830
1930
2430
2530
2632
4532
4832
4931
6431
6531
7031
7131
7331
8031
8231
8431
9131
92
Station No
x 10
0
SIRMSoft
b
0
100
200
300
400
500
600
301230
1330
1430
1730
1830
1930
2430
2530
2632
4532
4832
4931
6431
6531
7031
7131
7331
8031
8231
8431
9131
92
Station No
χARM/SIRM ARM
Fig. 2. (a–c) Plot of magnetic susceptibility and its concentration related param-eters along the east and west coast of India.
R2 = 0.99
R2 = 0.40
0
5000
10000
15000
20000
0 100 200 300 400 500
Magnetic susceptibility χlf (10-8m3/kg)
IRM
20m
T (
10-6
Am
2 /kg)
East coast
West coast
Fig. 3. Plot of Magnetic susceptibility vs. IRM20 mT along the east and west coast ofIndia.
R2 = 0.75
R2 = 0.13
0
100
200
300
400
500
600
700
800
900
0 10 20 30χARM/χlf
χ AR
M/χ
fd
East coast
West coast
Fig. 4. Plot of vARM/vlf vs. vARM/vfd along the east and west coast of India.
52 R. Alagarsamy / Marine Environmental Research 68 (2009) 49–58
minerals, iron/manganese oxides as well as organic matter tend toshow higher metal concentrations (Rae, 1997). In our study, theheavy metals (Fe, Cr, Cu and Ni) showed a more significant coeffi-cient of determination with magnetic susceptibility in the eastcoast sediment than the west (Tables 4a and 4b). It is observed thathigher concentration of ferrimagnetic minerals are found in theeast coast sediments and low concentration in the west coast of In-dia. The comparable or even stronger dependence of heavy metalson Fe (Tables 4a and 4b) is in accordance with the fact that iron andmanganese oxides, which are commonly in close association withclay minerals, have strong absorptive capacity for metals (Kerstenand Smedes, 2002).
The higher vfd (%) in the east coast showed that the strongerpresence of super paramagnetic grains in these samples than inthe west. Magnetic quotients are often useful indicators of theproperties of certain minerals and domain states (Lu and Bai,2006). F300 (IRM300 mT/SIRM) and S300 (IRM�300 mT/SIRM) can beused as approximate indication of relative importance of cantedantiferrimagnetic components and to distinguish ferrimagneticcomponent from antiferrimagnetic components respectively.
3.2. Remanent magnetic parameters
IRM20 mT is expected to be approximately proportional to themultidomain (MD) grain content of ferrimagnetic components(magnetite). Hard IRM (SIRM–IRM300 mT) can be used as a roughguide to canted antiferrimagnetic (hematite) components in asample. High values of IRM20 mT and SIRM can be sometimes attrib-uted to a greater accumulation of anthropogenic magnetic miner-als (Lu and Bai, 2006). There is a highly significant and muchstronger correlation between magnetic susceptibility and IRM20 mT
for east coast shelf sediment of India (Fig. 3; Table 4a) than thewest (Table 4b). This suggests that the magnetic susceptibility ofeast coast sediment contains mainly from MD ferrimagnetic min-erals derived from basalts. Magnetic susceptibility and other envi-ronmental parameters of the tributaries of the Godavari riversediment revealed the presence of high ferrimagnetic content asit is composed of weathering products of the Deccan Basalt (Sang-ode et al., 2007).
3.3. Magnetic parameters as proxies of particle size
vARM is sensitive to single domain (SD, �0.03–0.07 lm) ferri-magnetic minerals (Maher, 1988), while vfd indicates the pres-
a
R2 = 0.89
R2 = 0.02
0
5
10
0 5 10 15 20Al (%)
Fe (
%)
East coast
West coast
b
R2 = 0.73R2 = 0.04
0
100
200
0 5 10 15 20Al (%)
Cr
x10-4
East coastWest coast
c
R2 = 0.73R2 = 0.1
0
100
200
0 5 10 15 20Al (%)
Cu
x10-4
East coastWest coast
d
R2 = 0.76R2 = 0.11
0
50
100
0 5 10 15 20Al (%)
Ni x
10-4
East coastWest coast
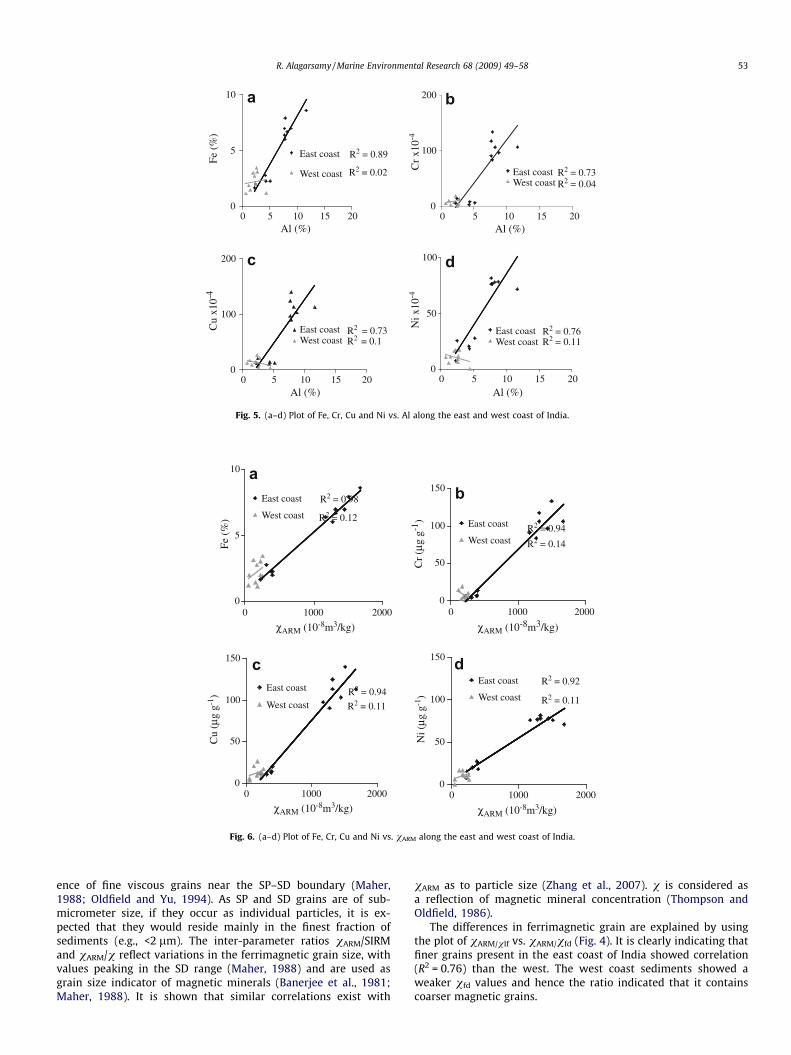
Fig. 5. (a–d) Plot of Fe, Cr, Cu and Ni vs. Al along the east and west coast of India.
aR2 = 0.98
R2 = 0.12
0
5
10
0 1000 2000
χARM (10-8m3/kg)
Fe (
%)
East coast
West coast
b
R2 = 0.94
R2 = 0.14
0
50
100
150
0 1000 2000
χARM (10-8m3/kg)
Cr
(μg
g-1) East coast
West coast
cR2 = 0.94
R2 = 0.11
0
50
100
150
0 1000 2000
χARM (10-8m3/kg)
Cu
(μg
g-1)
East coast
West coast
dR2 = 0.92
R2 = 0.11
0
50
100
150
0 1000 2000
χARM (10-8m3/kg)
Ni (
μg g
-1)
East coast
West coast
Fig. 6. (a–d) Plot of Fe, Cr, Cu and Ni vs. vARM along the east and west coast of India.
R. Alagarsamy / Marine Environmental Research 68 (2009) 49–58 53
ence of fine viscous grains near the SP–SD boundary (Maher,1988; Oldfield and Yu, 1994). As SP and SD grains are of sub-micrometer size, if they occur as individual particles, it is ex-pected that they would reside mainly in the finest fraction ofsediments (e.g., <2 lm). The inter-parameter ratios vARM/SIRMand vARM/v reflect variations in the ferrimagnetic grain size, withvalues peaking in the SD range (Maher, 1988) and are used asgrain size indicator of magnetic minerals (Banerjee et al., 1981;Maher, 1988). It is shown that similar correlations exist with
vARM as to particle size (Zhang et al., 2007). v is considered asa reflection of magnetic mineral concentration (Thompson andOldfield, 1986).
The differences in ferrimagnetic grain are explained by usingthe plot of vARM/vlf vs. vARM/vfd (Fig. 4). It is clearly indicating thatfiner grains present in the east coast of India showed correlation(R2 = 0.76) than the west. The west coast sediments showed aweaker vfd values and hence the ratio indicated that it containscoarser magnetic grains.
R2 = 0.14
R2 = 0.27
0
1
2
3
0.00 0.02 0.04
Fe/χARM (105g m-3)
Fe/A
l
East coastWest coast
a R2 = 0.70R2 = 0.25
0
10
20
0.00 0.05 0.10 0.15
Cr/χARM (105g m-3)
Cr/
Al x
10-4 East coast
West coast
b
R2 = 0.96 R2 = 0.03
0
10
20
0.00 0.05 0.10 0.15 0.20
Cu/χARM (105 g m-3)
Cu/
Al x
10-4
East coastWest coastc R2 = 0.04
R2 = 0.19
0
10
20
0.00 0.05 0.10 0.15
Ni/χARM (105 g m-3)
Ni/A
l x 1
0-4
East coastWest coastd
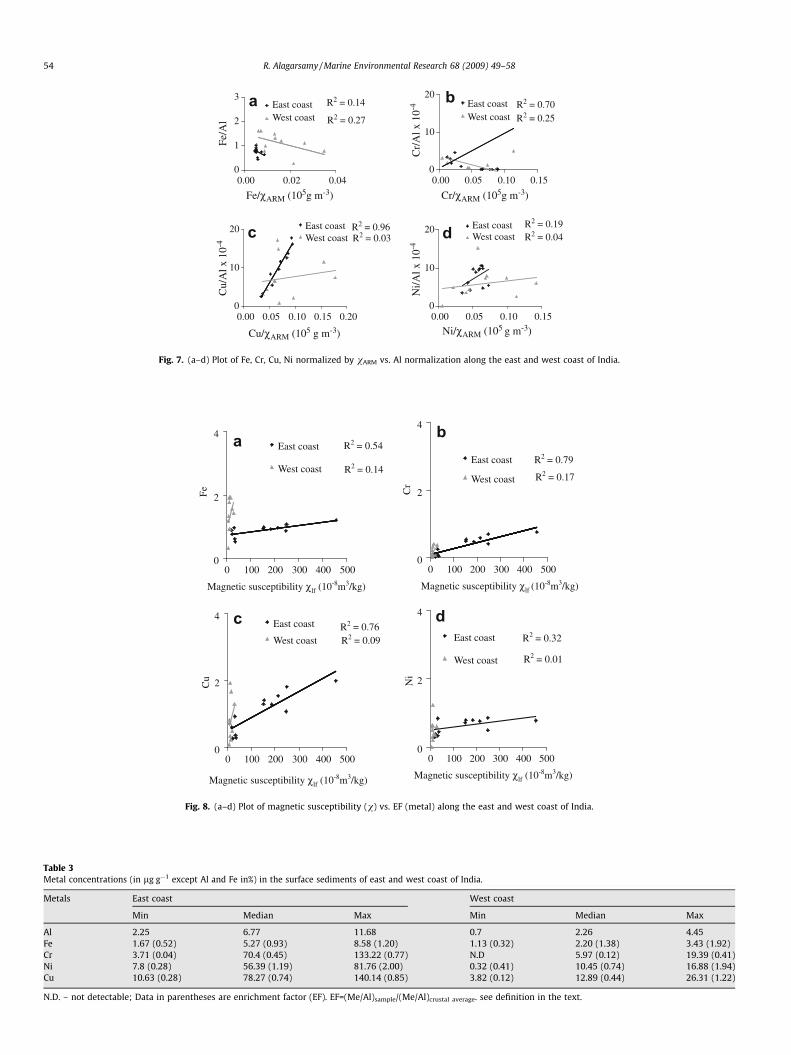
Fig. 7. (a–d) Plot of Fe, Cr, Cu, Ni normalized by vARM vs. Al normalization along the east and west coast of India.
a R2 = 0.54
R2 = 0.14
0
2
4
0 100 200 300 400 500
Magnetic susceptibility χlf (10-8m3/kg)
Fe
East coast
West coast
bR2 = 0.79
R2 = 0.17
0
2
4
0 100 200 300 400 500
Magnetic susceptibility χlf (10-8m3/kg)
Cr
East coast
West coast
cR2 = 0.76R2 = 0.09
0
2
4
0 100 200 300 400 500
Magnetic susceptibility χlf (10-8m3/kg)
Cu
East coast
West coast
d
R2 = 0.01
R2 = 0.32
0
2
4
0 100 200 300 400 500
Magnetic susceptibility χlf (10-8m3/kg)
Ni
East coast
West coast
Fig. 8. (a–d) Plot of magnetic susceptibility (v) vs. EF (metal) along the east and west coast of India.
Table 3Metal concentrations (in lg g�1 except Al and Fe in%) in the surface sediments of east and west coast of India.
Metals East coast West coast
Min Median Max Min Median Max
Al 2.25 6.77 11.68 0.7 2.26 4.45Fe 1.67 (0.52) 5.27 (0.93) 8.58 (1.20) 1.13 (0.32) 2.20 (1.38) 3.43 (1.92)Cr 3.71 (0.04) 70.4 (0.45) 133.22 (0.77) N.D 5.97 (0.12) 19.39 (0.41)Ni 7.8 (0.28) 56.39 (1.19) 81.76 (2.00) 0.32 (0.41) 10.45 (0.74) 16.88 (1.94)Cu 10.63 (0.28) 78.27 (0.74) 140.14 (0.85) 3.82 (0.12) 12.89 (0.44) 26.31 (1.22)
N.D. – not detectable; Data in parentheses are enrichment factor (EF). EF=(Me/Al)sample/(Me/Al)crustal average. see definition in the text.
54 R. Alagarsamy / Marine Environmental Research 68 (2009) 49–58
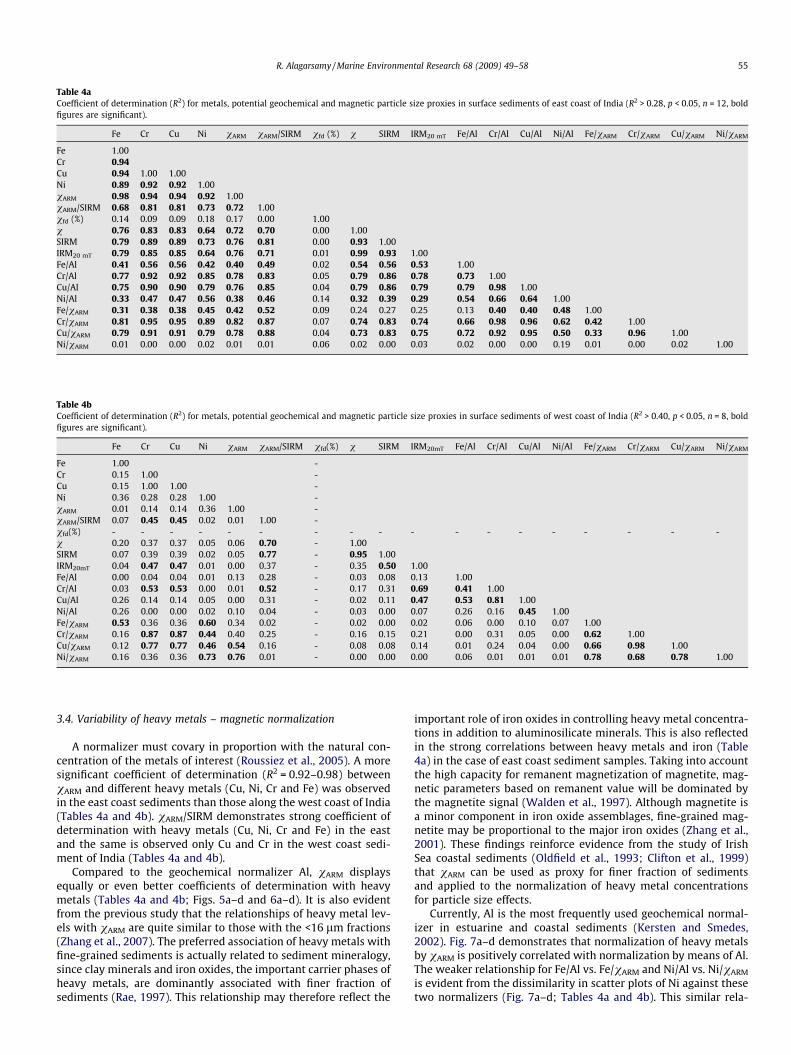
Table 4aCoefficient of determination (R2) for metals, potential geochemical and magnetic particle size proxies in surface sediments of east coast of India (R2 > 0.28, p < 0.05, n = 12, boldfigures are significant).
Fe Cr Cu Ni vARM vARM/SIRM vfd (%) v SIRM IRM20 mT Fe/Al Cr/Al Cu/Al Ni/Al Fe/vARM Cr/vARM Cu/vARM Ni/vARM
Fe 1.00Cr 0.94Cu 0.94 1.00 1.00Ni 0.89 0.92 0.92 1.00vARM 0.98 0.94 0.94 0.92 1.00vARM/SIRM 0.68 0.81 0.81 0.73 0.72 1.00vfd (%) 0.14 0.09 0.09 0.18 0.17 0.00 1.00v 0.76 0.83 0.83 0.64 0.72 0.70 0.00 1.00SIRM 0.79 0.89 0.89 0.73 0.76 0.81 0.00 0.93 1.00IRM20 mT 0.79 0.85 0.85 0.64 0.76 0.71 0.01 0.99 0.93 1.00Fe/Al 0.41 0.56 0.56 0.42 0.40 0.49 0.02 0.54 0.56 0.53 1.00Cr/Al 0.77 0.92 0.92 0.85 0.78 0.83 0.05 0.79 0.86 0.78 0.73 1.00Cu/Al 0.75 0.90 0.90 0.79 0.76 0.85 0.04 0.79 0.86 0.79 0.79 0.98 1.00Ni/Al 0.33 0.47 0.47 0.56 0.38 0.46 0.14 0.32 0.39 0.29 0.54 0.66 0.64 1.00Fe/vARM 0.31 0.38 0.38 0.45 0.42 0.52 0.09 0.24 0.27 0.25 0.13 0.40 0.40 0.48 1.00Cr/vARM 0.81 0.95 0.95 0.89 0.82 0.87 0.07 0.74 0.83 0.74 0.66 0.98 0.96 0.62 0.42 1.00Cu/vARM 0.79 0.91 0.91 0.79 0.78 0.88 0.04 0.73 0.83 0.75 0.72 0.92 0.95 0.50 0.33 0.96 1.00Ni/vARM 0.01 0.00 0.00 0.02 0.01 0.01 0.06 0.02 0.00 0.03 0.02 0.00 0.00 0.19 0.01 0.00 0.02 1.00
Table 4bCoefficient of determination (R2) for metals, potential geochemical and magnetic particle size proxies in surface sediments of west coast of India (R2 > 0.40, p < 0.05, n = 8, boldfigures are significant).
Fe Cr Cu Ni vARM vARM/SIRM vfd(%) v SIRM IRM20mT Fe/Al Cr/Al Cu/Al Ni/Al Fe/vARM Cr/vARM Cu/vARM Ni/vARM
Fe 1.00 -Cr 0.15 1.00 -Cu 0.15 1.00 1.00 -Ni 0.36 0.28 0.28 1.00 -vARM 0.01 0.14 0.14 0.36 1.00 -vARM/SIRM 0.07 0.45 0.45 0.02 0.01 1.00 -vfd(%) - - - - - - - - - - - - - - - - - -v 0.20 0.37 0.37 0.05 0.06 0.70 - 1.00SIRM 0.07 0.39 0.39 0.02 0.05 0.77 - 0.95 1.00IRM20mT 0.04 0.47 0.47 0.01 0.00 0.37 - 0.35 0.50 1.00Fe/Al 0.00 0.04 0.04 0.01 0.13 0.28 - 0.03 0.08 0.13 1.00Cr/Al 0.03 0.53 0.53 0.00 0.01 0.52 - 0.17 0.31 0.69 0.41 1.00Cu/Al 0.26 0.14 0.14 0.05 0.00 0.31 - 0.02 0.11 0.47 0.53 0.81 1.00Ni/Al 0.26 0.00 0.00 0.02 0.10 0.04 - 0.03 0.00 0.07 0.26 0.16 0.45 1.00Fe/vARM 0.53 0.36 0.36 0.60 0.34 0.02 - 0.02 0.00 0.02 0.06 0.00 0.10 0.07 1.00Cr/vARM 0.16 0.87 0.87 0.44 0.40 0.25 - 0.16 0.15 0.21 0.00 0.31 0.05 0.00 0.62 1.00Cu/vARM 0.12 0.77 0.77 0.46 0.54 0.16 - 0.08 0.08 0.14 0.01 0.24 0.04 0.00 0.66 0.98 1.00Ni/vARM 0.16 0.36 0.36 0.73 0.76 0.01 - 0.00 0.00 0.00 0.06 0.01 0.01 0.01 0.78 0.68 0.78 1.00
R. Alagarsamy / Marine Environmental Research 68 (2009) 49–58 55
3.4. Variability of heavy metals – magnetic normalization
A normalizer must covary in proportion with the natural con-centration of the metals of interest (Roussiez et al., 2005). A moresignificant coefficient of determination (R2 = 0.92–0.98) betweenvARM and different heavy metals (Cu, Ni, Cr and Fe) was observedin the east coast sediments than those along the west coast of India(Tables 4a and 4b). vARM/SIRM demonstrates strong coefficient ofdetermination with heavy metals (Cu, Ni, Cr and Fe) in the eastand the same is observed only Cu and Cr in the west coast sedi-ment of India (Tables 4a and 4b).
Compared to the geochemical normalizer Al, vARM displaysequally or even better coefficients of determination with heavymetals (Tables 4a and 4b; Figs. 5a–d and 6a–d). It is also evidentfrom the previous study that the relationships of heavy metal lev-els with vARM are quite similar to those with the <16 lm fractions(Zhang et al., 2007). The preferred association of heavy metals withfine-grained sediments is actually related to sediment mineralogy,since clay minerals and iron oxides, the important carrier phases ofheavy metals, are dominantly associated with finer fraction ofsediments (Rae, 1997). This relationship may therefore reflect the
important role of iron oxides in controlling heavy metal concentra-tions in addition to aluminosilicate minerals. This is also reflectedin the strong correlations between heavy metals and iron (Table4a) in the case of east coast sediment samples. Taking into accountthe high capacity for remanent magnetization of magnetite, mag-netic parameters based on remanent value will be dominated bythe magnetite signal (Walden et al., 1997). Although magnetite isa minor component in iron oxide assemblages, fine-grained mag-netite may be proportional to the major iron oxides (Zhang et al.,2001). These findings reinforce evidence from the study of IrishSea coastal sediments (Oldfield et al., 1993; Clifton et al., 1999)that vARM can be used as proxy for finer fraction of sedimentsand applied to the normalization of heavy metal concentrationsfor particle size effects.
Currently, Al is the most frequently used geochemical normal-izer in estuarine and coastal sediments (Kersten and Smedes,2002). Fig. 7a–d demonstrates that normalization of heavy metalsby vARM is positively correlated with normalization by means of Al.The weaker relationship for Fe/Al vs. Fe/vARM and Ni/Al vs. Ni/vARM
is evident from the dissimilarity in scatter plots of Ni against thesetwo normalizers (Fig. 7a–d; Tables 4a and 4b). This similar rela-
56 R. Alagarsamy / Marine Environmental Research 68 (2009) 49–58
tionship between Ni and vARM and the <16 lm particle size contentis observed and suggested that Ni, vARM may be the preferred nor-malizer in the study area (Zhang et al., 2007). Overall, in order tocompare the degree of pollution at different sites, normalizationby vARM will give comparable results with that by Al, at least formetal Cu. In order to compare the degree of pollution at differentsites, vARM normalization results are comparable with that by Al.Furthermore, analysis of Al requires a total digestion employingHF to destroy silicates within the sediment. As HF digestion woulddissolve heavy metals contained in silicates, which are consideredto be not related with anthropogenic source (often referred to asthe ‘residual’ phase), a partial digestion with minimal extractionof ‘residual’ forms is considered to be able to provide more mean-ingful environmental information in pollution studies (Sutherlandet al., 2004). In this case, if Al is to be used as a normalizer, heavymetal and Al determination will require two separate digestionprocedures. Compared to geochemical analysis, the measurementof vARM is relatively straightforward, rapid and therefore cost effec-tive (Walden et al., 1997). There may be a limit to the potential ofthis method in studies of sediment cores, due to the possibility ofreductive diagenetic alteration of fine-grained magnetic mineralsunder reducing conditions (Walden et al., 1997), and hence thereliability of vARM. However, it is unlikely that surface sedimentsunder oxidizing conditions would be seriously influenced. There-fore vARM normalization can play an important role in similarcoastal environments. In the case of the Irish Sea sediments, it isknown that the high ARM values linked to the clay fraction arethe result of bacterial magnetosomes growing in situ (Oldfieldand Yu, 1994). This could be the case here and it is evidenced fromthe relationship with heavy metals and its enrichment factor in theeast coast of India than the west. Hence, there is the possibility thatgreigite could be present in areas where brackish rather than trulymarine salinities prevail. The presence of greigite and biogenicmagnetite needs to be confirmed from GRM/RRM and SEM/TEMstudies.
3.5. Enrichment factor – influence of grain size and mineralogy
Here, as a common practice, Al is used as a normalizer, uponwhich enrichment factor (EF) were calculated. The following equa-tion was used to estimate the EF of metals from each sediment sta-tion using Al as a normalizer to correct for differences in sedimentsgrain size and mineralogy:
EF ¼ ðMe=AlÞsample=ðMe=AlÞcrustal average
where (Me/Al)sample and ðMe=AlÞcrustal average value are, respectively, themetal concentration (lg/g dw) in relation to Al levels (% dw) in sed-iment samples, and crustal average values taken from Taylor andMcLennan (1995).
It is observed that there is a good correlation between magneticproperties (e.g., magnetic susceptibility v) and enrichment factor(EF of metals) in the east coast of India rather than the west sug-gesting the enrichment of ferrimagnetic mineral (Fig. 8a–d). v isgenerally regarded as a reflection of magnetic mineral concentra-tion (Thompson and Oldfield, 1986). v vs. EF for metals showedR2 values of Fe (0.54; 0.14), Cr (0.79; 0.17), Cu (0.76; 0.09) and Ni(0.32; 0.01) for the east coast of India and the west coastrespectively.
In the Figs. 5–8, the four data points of the east coast (Stationnos. 3024, 3025, 3026, 3248 and 3249) lie close to the data pointsof the west coast. The clay mineral smectite mostly derived fromthe Deccan Trap basalts (Deccan Trap Province), occurs inboth the region as this the Deccan Province also covers this stationsin the east coast (Raman et al., 1995; Rao and Rao, 1995). One ofthe end products of chemical weathering of Deccan Traps is
smectites, which may be trapping K and thereby contributing toits limited mobility (Das and Krishnaswami, 2006). The major ele-ment chemistry of the clay fraction in sediment is controlled by thevariation of K, Al, Mg, Si and Fe content. The K content of clayeysediments is primarily bound to clay minerals, potassium feldsparand mica. K is found to be less in the basalt. K is mainly held in illiteand feldspar, therefore the variation in the K/Al ratio may reflectthe variations in illite and feldspar present in the sediments. Theratios also reflect the mixing of a ‘primary’ end member composedof illite derived from micas (K2O/Al2O3 = 0.33–0.45) and a second-ary end member chlorite (K2O/Al2O3 = 0). A higher potassium con-tent relative to Al in sediments implies greater feldsparcontribution. K/Al values ranged from 0.11 to 0.16 in the above sta-tions compared to the rest in the east coast of India and Ca/Al var-ied from 2.79 to 11.79 in the above mentioned stations in the eastcoast compared to the rest of the stations and its similarity withthe west coast samples (Alagarsamy and Zhang, 2009).
4. Conclusions
The magnetic properties used in this study for both normaliza-tion and for assessment of the degree of contamination from thesamples of east and west coast of India showed a distinct variationin this coastal environment. The presence of finer ferrimagneticgrain and enrichment of ferrimagnetic minerals are observed moreon the east than the west coast of India. Higher values of magneticsusceptibility, IRM20 mT and SIRM are associated with the east coastshelf sediments suggest the presence of high ferrimagnetic con-tent, which can be derived from the weathering products of theDeccan Basalts.
In shelf sediments from the east and west coast of India, themagnetic parameter vARM, which is sensitive to single domain(SD, �0.03–0.07 lm) ferrimagnetic minerals, displays more signif-icant relationships with the heavy metals in the east coast sedi-ments than the west. A comparison with Al, which is frequentlyused to compensate for particle size effects in pollution studies,indicates that in these samples vARM is an efficient normalizer forcomparison of the degree of pollution at different sites. The strongassociation between vARM and heavy metals can be explained bythe role of particle size and iron oxides in controlling metal con-centrations. Furthermore, the rapid and non-destructive nature ofmineral magnetic measurements means vARM can be easily deter-mined, compared to other approaches such as the analysis of Al.When heavy metals are analyzed using a partial digestion method,which can provide more meaningful environmental informationrelated to total pollutant determination, this magnetic approachwill prove especially useful for environmental quality assessment.Magnetic parameters, v, vARM, IRM20 mT and SIRM, have shownthat more significant relationship with the concentration of Fe,Cr, Cu and Ni in the east coast of India than the west. Linear rela-tionship between magnetic mineral concentration-related parame-ters and the concentration of Fe, Cr, Cu and Ni makes it possible touse magnetic technique as a simple, rapid, and non-destructivetool for the assessment of heavy metals contamination in the shelfregion. Although the co-variations presented in this study arerather convincing, it is clear that such approach rely on a carefulcalibration of the proxy, i.e., directly comparing heavy metal con-centrations and magnetic parameters for a selected set of samples.The calibration will obviously be site specific and must thereforebe adapted to each study site.
Acknowledgements
The author wish to express their sincere gratitude to the Chi-nese Ministry of Education and SKLEC/ECNU, Shanghai for financialsupport. Professor J. Zhang, Drs. W. Zhang and X. Han helped in the
R. Alagarsamy / Marine Environmental Research 68 (2009) 49–58 57
sample analysis and discussion. The author is also thankful to Drs.S.W.A. Naqvi, E. Desa, former Director, NIO, Satish R. Shetye, Direc-tor, NIO and CSIR, New Delhi for their kind permission during theperiod of work. His Holiness Sri Kanchi Sankaracharya Swami’sand Sri Sri Ravishankar’s grace to complete this work is also highlyappreciated. Frank Oldfield, Q. Liu, J. Bloemendal and two anony-mous reviewers are thanked for the constructive reviews and sug-gestions. This is NIO contribution no. 4534.
References
Alagarsamy, R., Zhang, J., 2005. Comparative studies on trace metal geochemistry inIndian and Chinese rivers. Current Science 89, 299–309.
Alagarsamy, R., Zhang, J., 2009. Geochemical characterization of major and traceelements in the coastal sediments of India. Environmental Monitoring andAssessment, doi:10.1007/s10661.008.0735.2.
Arkell, B., Leeks, G., Newson, M., Oldfield, F., 1983. Trapping and tracing: somerecent observations of supply and transport of coarse sediment from uplandWales, Special Publication of the International Association of Sedimentologist 6,107–119.
Banerjee, S.K., King, J., Marvin, J., 1981. A rapid method for magnetic granulometrywith applications to environmental studies. Geophysical Research Letters 8,333–336.
Bloemendal, J., King, J.W., Hall, F.R., Doh, S.-H., 1992. Rock magnetism of LateNeogene and Pleistocene deep-sea sediments: relationship to sediment source,diagenetic processes, and sediment lithology. Journal of Geophysical Research97, 4361–4375.
Bonnett, P.J.P., Appleby, P.G., Oldfield, F., 1988. Radionuclides in coastal andestuarine sediments from Wirral and Lancashire. Science of the TotalEnvironment 70, 215–236.
Booth, C.A., 2002. Sediment-Source-Linkages in the Gwendraeth Estuary, SouthWales, based on mineral magnetic analyses. Unpublished Ph.D. Thesis.University of Wolverhampton.
Booth, C.A., Walden, J., Neal, A., Smith, J.P., 2005. Use of mineral magneticconcentration data as a particle size proxy: a case study using marine,estuarine and fluvial sediments in the Carmarthen Bay area, South Wales, UK.Science of the Total Environment 347, 241–253.
Chan, L.S., Yeung, C.H., Yim, W.W.S., Or, O.L., 1998. Correlation between magneticsusceptibility and distribution of heavy metals in contaminated sea-floorsediments of Hong Kong Harbour. Environmental Geology 36, 77–86.
Clifton, J., McDonald, P., Plater, A., Oldfield, F., 1997. Relationships betweenradionuclide content and textural properties in Irish Sea intertidal sediments.Water, Air, and Soil Pollution 99, 209–216.
Clifton, J., McDonald, P., Plater, A., Oldfield, F., 1999. Derivation of a grain-size proxyto aid the modelling and prediction of radionuclide activity in saltmarshes andmud flats of the Eastern Irish Sea. Estuarine, Coastal and Shelf Science 48, 511–518.
Das, A., Krishnaswami, S., 2006. Barium in Deccan Basalt Rivers: its abundance,relative mobility and flux. Aquatic Geochemistry 12, 221–238. doi:10.1007/s10498-005-5856-4.
Dearing, J.A., Hay, K.L., Baban, S.M.J., Huddleston, A.S., Wellington, E.M.H., Loveland,P.J., 1996. Magnetic susceptibility of soil: an evaluation of conflicting theoriesusing a national data set. Geophysical Journal International 127, 728–734.
Dekkers, M.J., Pietersen, H.S., 1992. Magnetic properties of low-Ca fly ash: a rapidtool for Fe-assessment and survey for potentially hazardous elements. In:Glasser, F.P., McCarthy, G.J., Young, J.F., Masson, T.O., Pratt, P.L. (Eds.), AdvancedCementitious Systems: Mechanisms and Properties, Materials Research SocietySymposium Proceedings, vol. 245. Materials Research Society, Pittsburg, PA, pp.37–47.
Desenfant, F., Petrovsky, E., Rochette, P., 2004. Magnetic signature of industrialpollution of stream sediments and correlation with heavy metals: case studyfrom south France. Water, Air, and Soil Pollution 152, 297–312.
Goddu, S.R., Appel, E., Jordanova, D., Wehland, F., 2004. Magnetic properties of roaddust from Visakhapatnam (India) – relationship to industrial pollution and roadtraffic. Physics and Chemistry of the Earth 29, 985–995.
Hanesch, M., Scholger, R., 2002. Monitoring of heavy metal loadings in soils bymeans of magnetic susceptibility measurements. Environmental Geology 42,857–870.
Hanesch, M., Scholger, R., Rey, D., 2003. Mapping dust distribution around anindustrial site by measuring magnetic parameters of tree leaves. AtmosphericEnvironment 37, 5125–5133.
Hoffmann, V., Knab, M., Appel, E., 1999. Magnetic susceptibility mapping ofroadside pollution. Journal of Geochemical Exploration 66, 313–326.
Hunt, A., Jones, J., Oldfield, F., 1984. Magnetic measurements and heavy metals inatmospheric particulates of anthropogenic origin. Science of the TotalEnvironment 33, 129–139.
Hutchinson, S.M., Prandle, D., 1994. Siltation in the saltmarsh of the Dee Estuaryderived from 137Cs analysis of shallow cores. Estuarine, Coastal and ShelfScience 38, 471–478.
Jordanova, D., Hoffmann, V., Fehr, K.T., 2004. Mineral magnetic characterization ofanthropogenic magnetic phases in the Danube river sediments (Bulgarian part).Earth and Planetary Science Letters 221, 71–89.
Kapicka, A., Jordanova, N., Petrovsky, E., Podrázsky, V., 2003. Magnetic study ofweakly contaminated forest soils. Water, Air and Soil Pollution 148, 31–44.
Kersten, M., Smedes, F., 2002. Normalization procedures for sedimentscontaminants in spatial and temporal trend monitoring. Journal ofEnvironmental Monitoring 4, 109–115.
Klose, S., Koch, J., Baucker, E., Makeschin, F., 2001. Indicative properties of fly-ashaffected forest soils in Northeastern Germany. Journal of Plant Nutrition andSoil Science 164, 561–568.
Knab, M., Appel, E., Hoffmann, V., 2001. Separation of the anthropogenic portion ofheavy metal contents along a highway by means of magnetic susceptibility andfuzzy c-means cluster analysis. European Journal of Environmental andEngineering Geophysics 6, 125–140.
Krishnan, M.S., 1968. Geology of India and Burma. Higginbothoms Ltd., Madras. p.536.
Lecoanet, H., Leveque, F., Ambrosi, J.P., 2001. Magnetic properties of salt-marsh soilscontaminated by iron industry emissions (Southeast France). Journal of AppliedGeophysics 48, 67–81.
Lepland, A., Stevens, R.L., 1996. Mineral magnetic and textural interpretations ofsedimentation in the Skagerrak, eastern North Sea. Marine Geology 135, 51–64.
Lu, S.G., Bai, S.Q., 2006. Study on the correlation of magnetic properties and heavymetals content in urban soils of Hangzhou City, China. Journal of AppliedGeophysics 60, 1–12.
Magiera, T., Strzyszcz, Z., 2000. Ferrimagnetic minerals of anthropogenic origin insoils of some Polish national parks. Water, Air and Soil Pollution 124, 37–48.
Maher, B.A., 1988. Magnetic properties of some synthetic submicron magnetites.Geophysical Journal 94, 83–96.
Maher, B.A., Thompson, R., 1999. Quaternary Climates, Environments andMagnetism. Cambridge University Press. p. 383.
Matzka, J., Maher, B.A., 1999. Magnetic biomonitoring of roadside tree leaves:identification of spatial and temporal variations in vehicle derived particulates.Atmospheric Environment 33, 4565–4569.
Moreno, E., Sagnotti, L., Dinares-Turell, J., Winkler, A., Cascella, A., 2003.Biomonitoring of traffic air pollution in Rome using magnetic properties oftree leaves. Atmospheric Environment 37, 2967–2977.
Muxworthy, A.R., Schmidbauer, E., Petersen, E., 2002. Magnetic properties andMössbauer spectra of urban atmospheric particulate matter: a case study fromMunich, Germany. Geophysical Journal International 150, 558–570.
Oldfield, F., Yu, L., 1994. The influence of particle size variations on the magneticproperties of sediments from the north-eastern Irish Sea. Sedimentology 41,1093–1108.
Oldfield, F., Maher, B.A., Donoghue, J., Pierce, J., 1985. Particle size related, mineralmagnetic source sediment linkages in the Rhode River catchment, Maryland,USA. Journal of the Geological Society (London) 142, 1035–1046.
Oldfield, F., Richardson, N., Appleby, P.G., Yu, L., 1993. 241Am and 137Cs activity infine grained saltmarsh sediments from parts of the N.E. Irish Sea shoreline.Journal of Environmental Radioactivity 19, 1–24.
Oldfield, F., Appleby, P.G., van der Post, K.D., 1999. Problems of core correlation,sediment source ascription and yield estimation in Ponsonby Tarn, WestCumbria, UK. Earth Surface Processes Landforms 24, 975–992.
Petrovsky, E., Ellwood, B.B., 1999. Magnetic monitoring of pollution of air, land andwaters. In: Maher, B.A., Thompson, R. (Eds.), Quaternary Climates,Environments and Magnetism. Cambridge University Press, UK, pp. 279–322.
Petrovsky, E., Kapicka, A., Zapletal, K., Sebestova, E., Spanila, T., Dekkers, M.J.,Rochette, P., 1998. Correlation between magnetic parameters and chemicalcomposition of lake sediments from Northern Bohemia—preliminary study.Physics and Chemistry of the Earth 23, 1123–1126.
Petrovsky, E., Kapicka, A., Jordanova, N., Knab, M., Hoffmann, V., 2000. Low-fieldmagnetic susceptibility: a proxy method of estimating increased pollution ofdifferent environmental systems. Environmental Geology 39, 312–318.
Petrovsky, E., Kapicka, A., Jordanova, N., Boruvka, L., 2001. Magnetic properties ofalluvial soils contaminated with lead, zinc and cadmium. Journal of AppliedGeophysics 48, 127–136.
Rae, J.E., 1997. Trace metals in deposited intertidal sediments. In: Jickells, T.D., Rae,J.E. (Eds.), Biogeochemistry of Intertidal Sediments, Cambridge University Press,Cambridge, pp. 16–31.
Raman, C.V., Krishna Rao, G., Reddy, K.S.N., Ramesh, M.V., 1995. Clay mineraldistributions in the continental shelf sediments between the Ganges mouthsand Madras, east coast of India. Continental Shelf Research 15, 1773–1793.
Rao, Ch.M., 1985. Distribution of suspended particulate matter in the waters ofeastern continental margin of India. Indian Journal of Marine Sciences 14, 15–19.
Rao, K.L., 1975. India’s Water Wealth. Orient Longman, New Delhi. 255 pp.Rao, K.L., 1979. India’s Water Wealth: Its Assessment, Uses and Projections. Orient
Longman Ltd., New Delhi. p. 267.Rao, V.P., 1991. Clay mineral distribution in the continental shelf and slope off
Saurashtra, west coast of India. Indian Journal of Marine Sciences 20, 1–6.Rao, V.P., Rao, B.R., 1995. Provenance and distribution of clay minerals in the
sediments of the western continental shelf and slope of India. Continental ShelfResearch 15, 1757–1771.
Roussiez, V., Ludwig, W., Probst, J., Monac, A., 2005. Background levels of heavymetals in surficial sediments of the Gulf of Lions (NW Mediterranean): anapproach based on 133Cs normalization and lead isotope measurements.Environmental Pollution 138, 167–177.
Sangode, S.J., Sinha, R., Phartiyal, B., Chauhan, O.S., Mazari, R.K., Bagati, T.N., Suresh,N., Mishra, S., Kumar, R., Bhattacharjee, P., 2007. Environmental magnetic
58 R. Alagarsamy / Marine Environmental Research 68 (2009) 49–58
studies on some quaternary sediments of varied depositional settings in theIndian sub-continent. Quaternary International 159, 102–118.
Schmidt, A.M., Von Dobeneck, T., Bleil, U., 1999. Magnetic characterisation ofHolocene sedimentation in the South Atlantic. Palaeoceanography 14, 465–481.
Scoullos, M., Oldfield, F., Thompson, R., 1979. Magnetic monitoring of marineparticulate pollution in the Elefsis Gulf, Greece. Marine Pollution Bulletin 10,287–291.
Spiteri, C., Kalinski, V., Rösler, W., Hoffmann, V., Appel, E., 2005. Magnetic screeningof a pollution hotspot in the Lausitz area, Eastern Germany: correlation analysisbetween magnetic proxies and heavy metal contamination in soils.Environmental Geology 49, 1–9.
Sutherland, R.A., Tack, F.M.G., Ziegler, A.D., Bussen, J.O., 2004. Metal extraction fromroad-deposited sediments using nine partial decomposition procedures.Geochemistry 19, 947–955.
Taylor, S.R., McLennan, S.M., 1995. The geochemical evolution of the continentalcrust. Reviews of Geophysics 33, 241–265.
Thompson, R., Oldfield, F., 1986. Environmental Magnetism. Allen and Unwin,London.
Vassilev, S.V., 1992. Phase mineralogy studies of solid waste products from coalburning at some Bulgarian thermoelectric power plants. Fuel 71, 625–633.
Veneva, L., Hoffmann, V., Jordanova, D., Jordanova, N., Fehr, T., 2004. Rock magnetic,mineralogical and microstructural characterization of fly ashes from Bulgarianpower plants and the nearby anthropogenic soils. Physics and Chemistry of theEarth 29, 1011–1023.
Walden, J., Smith, J.P., Dackombe, R.V., Rose, J., 1995. Mineral magnetic analyses ofglacial diamicts from the Midland Valley of Scotland. Scottish Journal ofGeology 31, 79–89.
Walden, J., Slattery, M.C., Burt, T.P., 1997. Use of mineral magnetic measurements tofingerprint suspended sediment sources: approaches and techniques for dataanalysis. Journal of Hydrology 202, 353–372.
Walden, J., Smith, J.P., Oldfield, F., 1999. Environmental Magnetism: A PracticalGuide, Quaternary Research Association Technical Guide, vol. 6, 243 pp.
Wheeler, J., Oldfield, F., Orford, J.D., 1999. Depositional and post-depositionalcontrols on magnetic signals from saltmarshes on the north-west coast ofIreland. Sedimentology 46, 545–558.
White, K., Walden, J., Drake, N., Eckardt, F., Settle, J., 1997. Mapping the iron oxidecontent of dune sands, Namib Sand Sea, Namibia, using Landsat ThematicMapper data. Remote Sensing of Environment 62, 30–39.
Xie, S., Dearing, J.A., Bloemandal, J., Boyle, J.F., 1999. Association between theorganic matter content and magnetic properties in street dust, Liverpool, UK.Science of the Total Environment, 205–214.
Xie, S., Dearing, J.A., Bloemendal, J., 2000. The organic matter content of street dustin Liverpool, UK and its association with dust magnetic properties. AtmosphericEnvironment 34, 269–275.
Zhang, J., Liu, C.L., 2002. Riverine composition and estuarine chemistry ofparticulate metals in China – weathering features, anthropogenic impact andchemical fluxes. Estuarine, Coastal and Shelf Science 54, 1051–1070.
Zhang, W., Yu, L., Hutchinson, S.M., 2001. Diagenesis of magnetic minerals in theintertidal sediments of the Yangtze Estuary, China, and its environmentalsignificance. Science of the Total Environment 266, 169–175.
Zhang, W., Yu, L., Lu, M., Hutchinson, S.M., Feng, H., 2007. Magnetic approach tonormalizing heavy metal concentrations for particle size effects in intertidalsediments in the Yangtze Estuary, China. Environmental Pollution 147, 238–244.