Embed Size (px)
Citation preview
Out of the
Center for International Health
Environmental Risk Factors Associated with Intestinal Parasitic Infections and Respiratory Symptoms in Pregnant Women Residing in Low Income Neighborhoods in Bogotá, Colombia
Doctoral Thesis
for the awarding of a Doctor of Philosophy (Ph.D.)
at the Medical Faculty of
Ludwig-Maximilians-Universität, Munich
submitted by
Ángela Fernanda Espinosa Aranzales
born in
Ibagué, Colombia
submitted on
29 April 2019
2
Supervisors LMU:
Habilitated Supervisor Prof. Dr. Katja Radon
Direct Supervisor Dr. med. Maria Delius
External Supervisor:
Local Supervisor Dr. Angela María Pinzón Rondón
Reviewing Experts:
1st Reviewer Prof. Dr. Katja Radon
2nd Reviewer Dr. med. Maria Delius
Dean: Prof. Dr. med. dent. Reinhard Hickel
Date of Oral Defense: 19 November 2019
3
ABSTRACT Background: Colombia is a country with high socioeconomic inequality, where women living in low-income vulnerable areas are exposed to environments that may negatively affect their health. The aim of this study was to identify the sociodemographic and environmental conditions associated with intestinal parasitic infections (IPI) and respiratory symptoms (RS), both health problems of unknown prevalence, in pregnant women residing in neighborhoods with low socioeconomic conditions in three districts of Bogotá. Methods: A cross-sectional community-based study was done. For IPI prevalence, stool analyses by direct, concentration and qPCR techniques were made. For RS prevalence, questions from the European Community Respiratory Health Survey were applied. Based on a questionnaire and home visit, environmental and socioeconomic factors, as well as health, living and hygiene conditions were identified. As exposure variables for RS, we used residential proximity to greenness, and air pollution, indirectly determined by distance to closest streets and to a waste disposal site. Results: Of 750 pregnant women invited to participate, 550 accepted and answered the questionnaire. For the IPI study, 331 participants were included since they gave at least one stool sample. The prevalence of any parasite was 41%, highest for Blastocystis hominis with 25%. Prevalence of pathogenic parasites and polyparasitism were 1.2% and 9%, respectively. Women who had never dewormed had a significantly higher prevalence of any parasite. Women from minority groups and those not having handwashing facilities in their homes had a higher not significant prevalence of polyparasitism. In 310 participants from Ciudad Bolivar, who provided their home address, the prevalence of physician-diagnosed asthma and rhinitis were 4.5% and 21%, respectively. We identified a significantly higher prevalence of rhinitis in areas with low access to greenness, and increased odds for rhinitis and asthma when participants lived further away from main streets. Conclusions: In pregnant women living in vulnerable conditions, this study revealed a low prevalence of pathogenic intestinal parasites, and a lower prevalence of asthma and rhinitis, when compared with the general population in Bogota. Associated factors identified support generation of hypothesis for future mixed methods studies with active participation of local and community leaders. This research will require adequate sample size and total probabilistic selection to better establish associations affecting the health of women living in vulnerable conditions. KEYWORDS: Pregnant women; Intestinal parasitic infections; Asthma; Rhinitis; Sociodemographic characteristics; Housing Conditions; Vulnerable populations; Green Spaces; Air Pollution; NDVI.
4
TABLE OF CONTENTS
1. INTRODUCTION ................................................................................................................... 10
1.1. The Physical Environment ........................................................................................................ 11
1.2. The Socio-Economic Environment ........................................................................................... 12
1.3. Pregnancy in Neighborhoods participating in the Study ........................................................... 12
1.4. Intestinal parasitic infections .................................................................................................... 13
1.4.1. Epidemiology of intestinal parasitic infections .................................................................... 13
1.4.2. Worldwide environmental and socioeconomic conditions of IPI ......................................... 17
1.4.2.1. Basic sanitary conditions ...................................................................................................... 18
1.4.2.2. Level of Education ................................................................................................................ 18
1.4.2.3. Occupation ............................................................................................................................ 19
1.4.2.4. Forced Displacement ............................................................................................................ 19
1.4.2.5. Deworming ........................................................................................................................... 19
1.4.2.6. Housing characteristics ......................................................................................................... 19
1.4.3. Colombian environmental and socioeconomic conditions of IPI ......................................... 20
1.4.4. IPI in pregnant women and the consequences in their offspring .......................................... 25
1.4.4.1. Effect of parasitic infection in pregnant women and their offspring .................................... 25
1.4.4.2. Treatment of intestinal parasite infections during pregnancy ............................................... 27
1.5. Respiratory symptoms .............................................................................................................. 28
1.5.1. Epidemiology of respiratory symptoms: asthma, wheezing and allergic rhinitis at the worldwide, regional, national and local level ........................................................................................ 28
1.5.2. Respiratory symptoms in pregnant women and the consequences in their offspring ........... 31
1.5.3. Environmental conditions associated with respiratory symptoms: Greenness, housing conditions and air pollution in the general population and during pregnancy ....................................... 31
2. MATERIALS AND METHODS .............................................................................................. 35
2.1. Study design .............................................................................................................................. 35
2.2. Target population ...................................................................................................................... 35
2.3. Sample size calculation ............................................................................................................. 36
2.4. Data Collection ......................................................................................................................... 38
2.4.1. Data Collection Procedures ....................................................................................................... 38
2.4.2. Questionnaire ............................................................................................................................ 41
2.4.3. Parasite detection in stool samples ............................................................................................ 42
2.4.4. Data Control .............................................................................................................................. 43
2.5. Variable Definition ................................................................................................................... 44
2.5.1. IPI .............................................................................................................................................. 44
2.5.2. Respiratory Symptoms .............................................................................................................. 44
2.5.3. Sociodemographic characteristics ............................................................................................. 45
2.5.4. Living conditions and hygienic habits ...................................................................................... 47
5
2.5.5. Greenness .................................................................................................................................. 49
2.5.6. Air pollution .............................................................................................................................. 50
2.5.7. Indices of housing factors ......................................................................................................... 51
2.6. Ethical aspects ........................................................................................................................... 53
2.7. Analysis of results ..................................................................................................................... 54
3. RESULTS ............................................................................................................................... 57
3.1. Intestinal Parasitic Infections Results ....................................................................................... 57
3.1.1. Recruitment and participation .............................................................................................. 57
3.1.2. Prevalence of intestinal parasitic infections in pregnant women .......................................... 62
3.1.2.1. Comparison of qPCR with the combined microscopy technique ......................................... 66
3.1.3. Factors associated with infection by any parasite and intestinal polyparasitism .................. 68
3.2. Respiratory Symptoms Results ................................................................................................. 74
3.2.1. Descriptive characteristics of the study population, their housing, their environmental condition and their respiratory outcomes ............................................................................................... 74
3.2.2. Associations between housing conditions, urban green space, environmental exposures and respiratory outcomes .............................................................................................................................. 77
4. DISCUSSION ......................................................................................................................... 83
4.1. Summary of Main Findings ...................................................................................................... 83
4.2. Methodological Strengths and Limitations ............................................................................... 83
4.2.1. Strengths of this study ............................................................................................................... 83
4.2.2. Limitations of this study ........................................................................................................... 84
4.2.2.1. Limitations of response and field work ................................................................................ 84
4.2.2.2. Limitations of sample size .................................................................................................... 87
4.2.2.3. Limitations of study design .................................................................................................. 88
4.2.2.4. Limitations of questionnaire used in the study ..................................................................... 88
4.2.2.5. Limitations of IPI laboratory methods .................................................................................. 89
4.2.2.6. Limitations of statistical methods ......................................................................................... 89
4.3. Study Findings in Comparison with Other National and International Studies ........................ 89
4.3.1. General study population characteristics .................................................................................. 91
4.3.2. Prevalence of intestinal parasitic infections .............................................................................. 95
4.3.3. Sociodemographic, environmental and living risk factors for intestinal parasitic infections . 114
4.3.3.1. Any parasite ........................................................................................................................ 114
4.3.3.2. Polyparasitism .................................................................................................................... 115
4.3.4. Prevalence of respiratory symptoms ....................................................................................... 117
4.3.5. Pregnancy, environmental and living risk factors for respiratory symptoms ......................... 132
4.3.5.1. Trimester ............................................................................................................................. 132
4.3.5.2. Access to green space ......................................................................................................... 132
4.3.5.3. Hygiene ............................................................................................................................... 138
6
4.4. Conclusions ............................................................................................................................. 139
4.5. The implications of the study .................................................................................................. 140
5. REFERENCES .................................................................................................................................. 141
6. ANNEX ............................................................................................................................................ 162
7
LIST OF TABLES Table 1.1 Prevalence data and health effects of Soil-Transmitted Helminths (STH) ................................ 15 Table 1.2 Prevalence data and health effects of Protozoa .......................................................................... 16 Table 1.3 Household characteristics according to Colombian classification of socioeconomic strata ...... 21 Table 1.4 Poverty and Unsatisfied Basic Needs distribution according to socioeconomic strata in Bogotá .................................................................................................................................................................... 22 Table 2.1 Strata 1 and 2 distribution by districts included in the study ..................................................... 36 Table 2.2 Sample sizes with 80% Statistical Power ................................................................................... 37 Table 2.3 Outcome variables for Respiratory Symptoms .......................................................................... 45 Table 2.4 Variables of sociodemographic characteristics and pregnancy conditions for the IPI study ..... 45 Table 2.5 Variables of Sociodemographic characteristics for the RS study............................................... 47 Table 2.6 Variables of Living conditions and hygienic habits for IPI study .............................................. 47 Table 2.7 Indices of housing factors and associated variables for RS Study ............................................. 51 Table 2.8 Variables and type of analysis for IPI study ............................................................................... 55 Table 2.9 Variables and type of analysis for RS study ............................................................................... 56 Table 3.1. Comparison of characteristics between participants who answered the questionnaire and participants who additionally provided a stool ........................................................................................... 58 Table 3.2.Sensitivity analysis according to method of sample collection .................................................. 60 Table 3.3 Sensitivity analysis according to method of sample collection of sociodemographic and pregnancy characteristics IPI variables ...................................................................................................... 60 Table 3.4 Sensitivity analysis according to outcome variables .................................................................. 62 Table 3.5 Positive and negative agreement between first and second stool samples in 98 participants .... 66 Table 3.6 Comparison between qPCR test and a combined microscopy technique in a subset of 48 participants ................................................................................................................................................. 68 Table 3.7 Prevalence of IPI by sociodemographic characteristics of 331 participants who provided at least one stool sample ......................................................................................................................................... 70 Table 3.8 Prevalence of IPI by living conditions and hygiene habits of 331 participants who provided at least one stool sample ................................................................................................................................. 71 Table 3.9 Crude and adjusted results of the logistic regression model relating sociodemographic and pregnancy characteristics to the Any parasite prevalence among 331 pregnant women who provided at least one stool sample ................................................................................................................................. 72 Table 3.10 Crude and adjusted results of the logistic regression model relating sociodemographic and housing characteristics to the Polyparasitism prevalence among 331 pregnant women who provided at least one stool sample ................................................................................................................................. 73 Table 3.11 General characteristics, environmental factors and housing factors among 310 pregnant women residing in a low-income neighborhood of Bogotá, Colombia ...................................................... 75 Table 3.12 Distribution of variables used to create the housing indices among 310 pregnant women residing in a poor neighborhood in Bogotá, Colombia .............................................................................. 76 Table 3.13 Stratified prevalence of respiratory symptoms by sociodemographic covariates among 310 pregnant women residing in a poor neighborhood in Bogotá, Colombia ................................................... 78 Table 3.14 Stratified prevalence of respiratory symptoms by NDVI covariate among 310 pregnant women residing in a poor neighborhood in Bogotá, Colombia .............................................................................. 78 Table 3.15 Stratified prevalence of respiratory symptoms by air pollution covariates among 310 pregnant women residing in a poor neighborhood in Bogotá, Colombia .................................................................. 79 Table 3.16 Stratified prevalence of respiratory symptoms by housing covariates among 310 pregnant women residing in a poor neighborhood in Bogota, Colombia .................................................................. 79 Table 3.17 Crude and adjusted results of the logistic regression models relating sociodemographic characteristics, environmental factors and housing characteristics to the prevalence of rhinitis among 310 pregnant women residing in a poor neighborhood of Bogotá .................................................................... 80 Table 3.18 Crude and adjusted results of the logistic regression models relating sociodemographic characteristics, environmental factors and housing characteristics to the 12-month prevalence of wheezing among 310 participants residing in Bogotá ................................................................................................ 81
8
Table 3.19 Crude and adjusted results of the logistic regression models relating sociodemographic characteristics, environmental factors and housing characteristics to the 12-month prevalence of asthma among 310 participants residing in Bogotá ................................................................................................ 82 Table 4.1 Comparison of participants’ general characteristics with women in Ciudad Bolívar, Usaquén and Kennedy Districts, Bogotá and Colombia ........................................................................................... 93 Table 4.2 Comparison of findings in our IPI study with other similar IPI Colombian studies .................. 99 Table 4.3 Comparison of findings in our study with other similar IPI pregnancy studies ....................... 108 Table 4.4 Comparison of RS on 310 pregnant women living in Ciudad Bolívar with other RS Colombian studies ....................................................................................................................................................... 118 Table 4.5 Comparison of RS on 310 pregnant women living in Ciudad Bolívar with other RS Latin American studies ...................................................................................................................................... 123 Table 4.6 Comparison of RS on 310 pregnant women living in Ciudad Bolívar with other RS in pregnant women studies .......................................................................................................................................... 129 Table 4.7 Comparison of RS of 310 pregnant women living in Ciudad Bolívar with studies addressing associations between respiratory symptoms and greenness ..................................................................... 135
9
LIST OF FIGURES Figure 1.1: Distribution of homes per districts according to Unsatisfied Basic Needs .............................. 23 Figure 1.2: Distribution of strata in each of the Districts in Bogotá .......................................................... 23 Figure 1.3: Cycle of inadequate nutrition and intestinal parasite infections .............................................. 26 Figure 2.1 Flow chart of Recruitment and Response for IPI ...................................................................... 40 Figure 2.2 Flow Chart of Participation for RS .......................................................................................... 40 Figure 2.3: Spatial distribution of residential addresses of participants in 2016 ........................................ 50 Figure 3.1 Participation in the IPI study: Questionnaire and stool sample ............................................... 57 Figure 3.2 Number of participants with one and two stool samples for analysis by combined microscopy technique .................................................................................................................................................... 63 Figure 3.3 Prevalence of each intestinal parasite from the study population detected by combined microscopy technique (N=331) .................................................................................................................. 64 Figure 3.4 Prevalence of intestinal parasitic infections in the study population ........................................ 65 Figure 3.5 Comparison of qPCR with the combined microscopy technique ............................................. 67
10
1. INTRODUCTION
Social and environmental inequity (1) are determinant factors in the health of many communities
in Colombia (2, 3). Colombia is an upper middle income country with high inequalities, with a
Gini coefficient of 0.539 (4), where a Gini 0 means perfect equality and 1 means total inequality
(5). As such, Colombia ranks 14th among 134 countries in which this coefficient has been estimated
(3) and is socioeconomically the most unequal country in Latin America (6). This fact is shown
by income being concentrated in a few and 20% of the population having at least one unsatisfied
basic need (UBN) (7). Disparities occur in rural and urban settings (8) and are very noticeable in
marginalized urban populations (9). Poverty (10), environmental pollution (2), food insecurity (11,
12), inadequate housing (13), and violence (6, 14) are, among others, inequitable dominant factors
in many neighborhoods.
Bogotá is the most developed urban center in Colombia. However, 9% of its inhabitants (700,000
people approximately) have at least one UBN, represented by overcrowding, financial
dependency, poor housing conditions, lack of sanitary services and out-of-school children (7). This
city also has the highest population that has been forcefully displaced by conflicts from other
regions of the country, affecting more than 300,000 inhabitants, most of them women arriving in
the city as single mothers and without financial support (15). Regarding air pollution, inhabitants
in Bogotá are exposed to high concentrations of PM10, PM2.5, O3, and NO2 (16). These urban living
conditions expose inhabitants to risk factors that may increase the incidence of infectious and
respiratory disorders, among others (2, 17, 18). Furthermore, climate change may be increasing
urban vulnerability to diseases (19).
Social inequity affects health and is more noticeable in women, particularly those living in large
urban centers (20) and during pregnancy (21, 22). Pregnant women living in vulnerable conditions
or adverse urban settings can also be exposed to environmental factors that negatively affect not
only their own health but also their offspring’s health in the short and long term (23). Added to
this, the relative physiological immunosuppression during pregnancy increases the susceptibility
of pregnant women to environmental hazards that may favor various infectious diseases and
allergic conditions, among others (24, 25). Pregnant women are prone to intestinal parasitic
infections (IPI) (26-29). Also, during pregnancy, up to 10% of women worldwide may have
asthma (30-32). Parasitic and respiratory disorders may affect the offspring’s health. Maternal IPI
can potentially cause lower birth weight (33) and may increase the risk of childhood soil-
11
transmitted helminths (STH) (34), while maternal respiratory disorders could increase the risk of
preterm birth, Low Birth Weight (LBW), and neonatal hospitalization, among others (32). This
thesis focused on two health problems, intestinal parasitic infections (IPI) and respiratory
symptoms (RS), in which the prevalence and environmental risk factors were unknown in pregnant
women living in vulnerable neighborhoods in three districts of Bogotá. As both topics were
addressed in the same study, they are described in parallel throughout this document.
1.1. The Physical Environment
In the districts of Ciudad Bolívar and Usaquén, the urban neighborhoods of strata 1 and 2 were
developed on a mountainous topography containing brick factories and quarries, which attracted
human settlements built on eroded and unstable terrain (35, 36). In the district of Kennedy, strata
1 and 2 neighborhoods are located around the Bogotá River, the most polluted in Colombia, and
near the wetlands, with a high risk of flooding (37). In these three districts, housing belonging to
strata 1 and 2 is predominantly self-built (38-40), which means that these houses have been built
step by step, regardless of its quality and where overcrowding is common. It is usual that, as
financial conditions allow, additional levels are built to rent and increase household income. Under
these conditions, it is common for many families to share the kitchen, the sanitary facilities, and
the living spaces (41). Therefore, the houses are a conglomeration of families who share financial
limitations, each of which rents one or two rooms (42).
Regarding urban development, these neighborhoods have spread without order, and district
planning only begins after the inhabitants have already built houses, walkways, and roads;
therefore, vehicular access to properties is limited (43). In the mountainous areas of Usaquén and
Ciudad Bolívar, houses are reached mainly through pedestrian staircases (44, 45). In Kennedy,
with more access roads, homes in strata 1 and 2 are often accessed through unpaved streets that
can be flooded and have potholes (39, 46). Due to these accessibility issues, surveillance and
effective police response in vulnerable neighborhoods are restricted, since criminal activities
cannot be permanently and easily monitored or controlled (44, 47, 48). Moreover, some abandoned
places become garbage dumps or unsafe fields where drug dealing and criminal activities may
occur. In the three districts, difficult-to-access houses can also be places where such illegal
activities happen, becoming urban environments with an unsafe and violent social context (44, 47-
49).
12
1.2. The Socio-Economic Environment
In addition to the physical environment mentioned above, people in these districts, often live with
financial constraints that limit their basic needs, including food, housing, education, safety, and
employment (44, 49, 50). The monthly income in 4%, 32% and 19% of households in Ciudad
Bolívar, Kennedy, and Usaquén respectively, ranges between one and two minimum salaries (USD
260-522 per month) (51-53). Their nutrition is often rich in carbohydrates that are cheaper and
generate satiety (50). Access to education is usually achieved through public schools. In this
challenging environment, it is considered a real success if someone completes high school
education and there are significant limitations to access to higher education programs (54).
Furthermore, in these neighborhoods there are people who have been victims of forced
displacement from other regions of Colombia, arriving in the city, with limited financial resources,
to the homes of family or friends, and thus increasing overcrowding (55).
1.3. Pregnancy in Neighborhoods participating in the Study
Teen pregnancy is common (44, 49, 50), where young women give birth to babies in the same
conditions of vulnerability. Although birth rates have declined the conditions in which pregnancies
occur are not ideal in terms of food, physical and environmental security (50). Financial constraints
limit the availability not only of proper and balanced nutrition but also of adequate and safe
housing (50). Access to health services, although mandatory for prenatal care, is limited by the
barriers inherent to the Colombian healthcare system (56).
Furthermore, pregnant women living in these socioeconomic conditions may be exposed to unsafe
and violent neighborhoods (57). Some others were also forcefully displaced (55). Overall,
pregnant women residing in vulnerable neighborhoods face daily uncertainty about their future
and the wellbeing of their offspring. All these factors may generate stress, which combined with
the physiologic immunosuppression of pregnancy (25) could increase their susceptibility to
disorders that may affect them and their offspring.
13
1.4. Intestinal parasitic infections
1.4.1. Epidemiology of intestinal parasitic infections
IPI are particularly common in low- and middle-income countries. Some factors that contribute to
this phenomenon are the location of many of these countries in tropical areas, where these parasites
are endemic, the lack or low quality of sanitation services, deficient hygiene practices, and the low
socioeconomic conditions that act as barriers to access health services (27, 58, 59). People living
under the poverty line, especially young women, pregnant women, their infants and children in
developing countries are at a high risk of entering a cycle of malnutrition–parasite infections:
Inadequate nutrition is a condition that favors the development of IPI that increases nutritional
problems and generates adverse health consequences (60, 61).
The most common intestinal parasites detected in human beings comprise soil-transmitted
helminths (STH) and protozoa, including:
● Nematodes, such as A. lumbricoides, T. trichiura, S. stercolaris, A. duodenale, and N.
americanus. Eggs present in contaminated soil transmit these parasites by human feces, in
places where sanitation is inadequate or insufficient (62).
● Trematodes, such as Schistosoma and Fasciola species. These are transmitted through
contact with polluted water (63, 64).
● Cestodes, such as T. saginata, T. solium, and H. nana. Their way of transmission to humans
is complex, as these generally require several hosts (65, 66).
● Pathogenic protozoa, such as the amoeba E. histolytica and the flagellate G. intestinalis.
These are transmitted from person to person by fecal contamination of food or hands (67,
68).
● Protozoa whose pathogenicity is still in dispute, such as B. hominis, E. coli, E. nana, and
I. buetschlii. These can be transmitted to human beings as a cyst by the fecal-oral route
(69, 70).
Among intestinal parasites, the World Health Organization (WHO) considers STH as the most
common infections in vulnerable populations. The nematodes, A. lumbricoides and T. trichiura
are the most prevalent helminthiasis (34). STH are considered Neglected Tropical Diseases (NTD)
(71), a group of diseases prevalent in exposed, impoverished and vulnerable populations (72). The
precise world distribution of STH and the number of people infected have not yet been
established, as the quality of epidemiological data in different regions is difficult to ascertain (73).
14
In Latin American and Caribbean countries, a review done by the Pan American Health
Organization (PAHO) in 2009 showed that only 8 out of 35 countries carry out parasitological
surveys nationwide, with 18 countries reporting STH prevalence ranges as low as 0.01-16.3% in
Mexico and up to 12.2-97% in Honduras (74), and the prevalence for Colombia reported to be
between 11% and 50% (74). For children, STH prevalence in Latin American countries ranged
between 20% and 50% (74). The most prevalent helminth was A. lumbricoides with 34% (Table
1.1). Among IPI, most common protozoa include G. lamblia, E. histolytica and B. hominis (27,
75), with varying reported prevalence (Table 1.2). G. lamblia, and E. histolytica, although
globally distributed, are more prevalent in tropical and subtropical areas. In North America,
Giardia is the most prevalent intestinal parasite in humans (76). The global prevalence of B.
hominis varies widely (77), and its pathogenicity is still debated (69, 78).
15
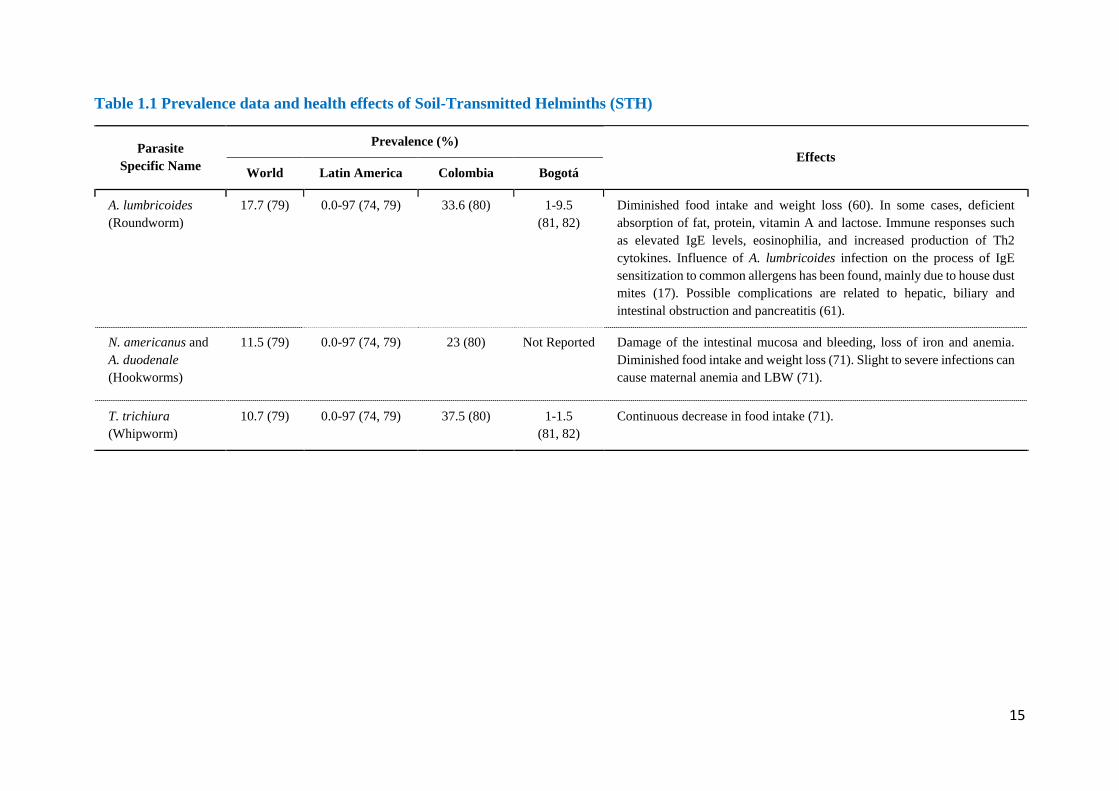
Table 1.1 Prevalence data and health effects of Soil-Transmitted Helminths (STH)
Parasite Specific Name
Prevalence (%) Effects
World Latin America Colombia Bogotá
A. lumbricoides (Roundworm)
17.7 (79) 0.0-97 (74, 79) 33.6 (80) 1-9.5 (81, 82)
Diminished food intake and weight loss (60). In some cases, deficient absorption of fat, protein, vitamin A and lactose. Immune responses such as elevated IgE levels, eosinophilia, and increased production of Th2 cytokines. Influence of A. lumbricoides infection on the process of IgE sensitization to common allergens has been found, mainly due to house dust mites (17). Possible complications are related to hepatic, biliary and intestinal obstruction and pancreatitis (61).
N. americanus and A. duodenale (Hookworms)
11.5 (79) 0.0-97 (74, 79) 23 (80) Not Reported Damage of the intestinal mucosa and bleeding, loss of iron and anemia. Diminished food intake and weight loss (71). Slight to severe infections can cause maternal anemia and LBW (71).
T. trichiura (Whipworm)
10.7 (79) 0.0-97 (74, 79) 37.5 (80) 1-1.5 (81, 82)
Continuous decrease in food intake (71).
16
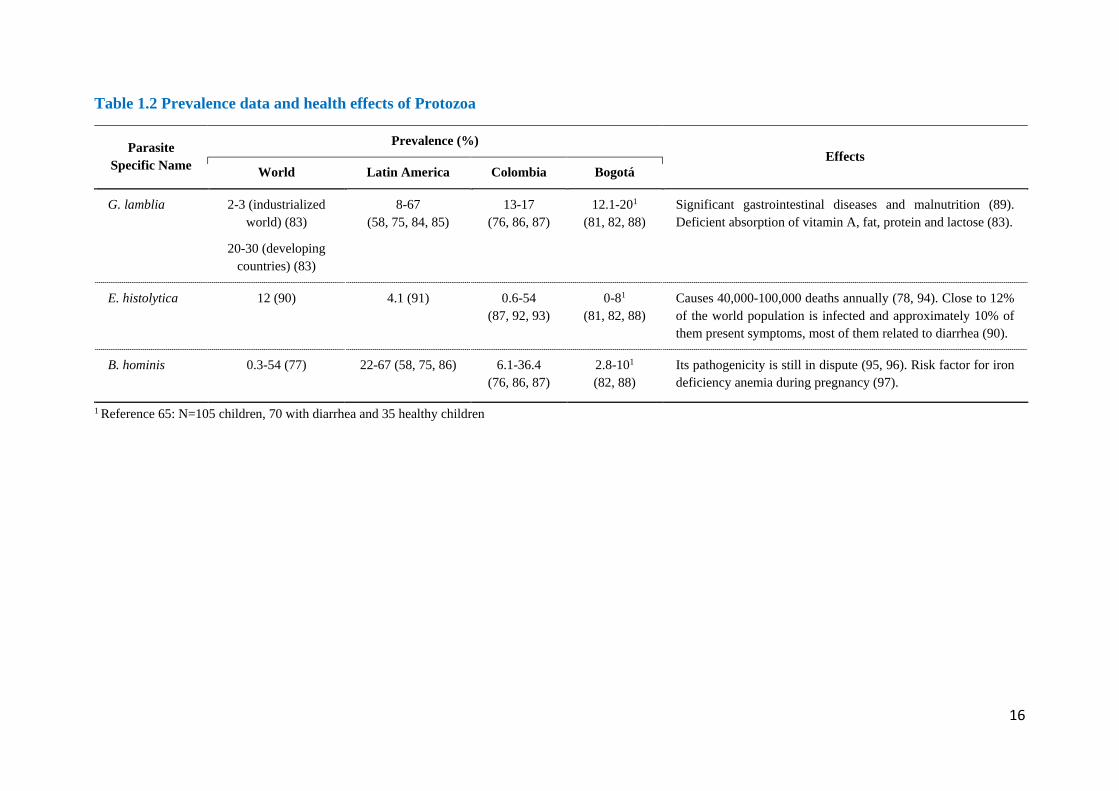
Table 1.2 Prevalence data and health effects of Protozoa
Parasite Specific Name
Prevalence (%) Effects
World Latin America Colombia Bogotá
G. lamblia 2-3 (industrialized world) (83)
20-30 (developing countries) (83)
8-67 (58, 75, 84, 85)
13-17 (76, 86, 87)
12.1-201 (81, 82, 88)
Significant gastrointestinal diseases and malnutrition (89). Deficient absorption of vitamin A, fat, protein and lactose (83).
E. histolytica 12 (90) 4.1 (91) 0.6-54 (87, 92, 93)
0-81 (81, 82, 88)
Causes 40,000-100,000 deaths annually (78, 94). Close to 12% of the world population is infected and approximately 10% of them present symptoms, most of them related to diarrhea (90).
B. hominis 0.3-54 (77) 22-67 (58, 75, 86) 6.1-36.4 (76, 86, 87)
2.8-101 (82, 88)
Its pathogenicity is still in dispute (95, 96). Risk factor for iron deficiency anemia during pregnancy (97).
1 Reference 65: N=105 children, 70 with diarrhea and 35 healthy children
17
1.4.2. Worldwide environmental and socioeconomic conditions of IPI
Intestinal Parasitic Infections (IPI) develop when living conditions of human populations favor the
life cycles of STH and protozoa (98) and may affect all population groups independent of
geography and socioeconomic conditions. In low- and middle-income tropical countries, IPI are a
public health problem, with a higher incidence among those living in poverty (27, 75), where poor
sanitary conditions and low education levels limit good hygiene practices needed for prevention
of fecal-oral, water or food contamination (99). Pregnant women share the same risk factors for
IPI as the general population. However, parity has been identified as a specific risk factor, as
having more children increases the risk of acquiring intestinal parasites (100).
Studies relating high altitude and parasites have been performed in Bolivia, a country with a high
prevalence of STH and where geographical differences can allow comparative analysis according
to altitude above sea level. In 2001, Flores et al. (101) published the first study on children STH
prevalence at altitudes above 3,800 meters in the Bolivian altiplano. These authors found STH
prevalence of 18% in school children and 24% in children living in the community, with A.
lumbricoides 1-28% and T. trichiura 0-24%. More recently, a nationwide study by Chammartin et
al. (102) mapped the geographical distribution of A. lumbricoides, T. trichiura and hookworms in
Bolivian schoolchildren, and included altitude as an environmental variable, among others. Using
geostatistical variable selection to identify important environmental predictors, these authors
found that high-altitude had a protective effect against T. trichiura infection (OR 0.33-0.37),
perhaps caused by the unsuitability of high-altitude conditions for parasite development and
transmission.
Parasitism is linked with climate, as environmental conditions influence parasite life cycles and
environmental thresholds limit parasite reproduction, survival and transmission. Overall, the
prevalence of IPI may be determined by geographic and weather conditions including rainfall,
humidity, temperature and vegetation that together may create permissive or deleterious
environments for parasites, their eggs and larvae. For instance, high temperatures increase egg
development of hookworms, A. lumbricoides and T. trichiura, with decreased egg viability when
temperatures are too high. Decreased relative humidity, which occurs at high altitudes in South
America, can affect larval survival in the soil (103). More recently, Chammartin et al. (104)
performed a geostatistical meta-analysis based on STH prevalence reports from 13 South
American countries and concluded that, overall, high altitude lowered T. trichiura infection risk,
18
and that risks of STH infection have decreased in the last 15 years likely due to nationwide control
programs and improved socioeconomic status.
1.4.2.1. Basic sanitary conditions
Among basic sanitary conditions reported to be associated with IPI, lack of drinking water or
unsafe water supply favor water and food contamination by infesting parasitic forms (58, 59). A
recent systematic review reported that Water, Sanitation and Hygiene (WASH) access and
practices significantly reduced the risk of STH infections, specifically associated with the use of
treated water (105). A National Health and Nutrition Examination Survey (NHANES) study found
that seropositivity for Cryptosporidium was significantly increased in low-income households and
in the absence of household water treatment (106). In populations that do not have basic services
or adequate housing conditions, the prevalence of intestinal parasites is up to 96% (78, 94).
As a consequence of lack of access to improved sanitation, it is estimated that in Latin America,
out of 163 million children (90), close to 34 million (21%) are at risk of developing STH infections
(58). Romina Rivero et al. (107) found that Argentinian children living in houses with UBN had a
higher risk of having intestinal parasitism and that deficient household WASH predicted parasitic
infections. Using real-time PCR, Campbell et al. (108) found that the risk of developing an
intestinal infection by N. americanus decreased when piped water supply was shared, and
increased when the main water supply was surface water. Unsafe water conditions favoring IPI
may include the extra-domiciliary collection of water supply, carrying water from its source to
home or inadequate wastewater and solid waste disposal (75, 109-111).
1.4.2.2. Level of Education
In studies with pediatric populations, it has been established that the level of education of mothers
is a factor in IPI development, with evidence showing that a higher level of education is a
protective factor (110, 112-114). In Colombia, it has been reported that when mothers had less
than 5 years of school education, there was a significant increase in intestinal polyparasitism in
children under 2 years of age. A higher level of education presupposes better hygiene practices
and may also be related to higher income and purchasing power that ensure better living and
sanitary conditions. In pregnant women, the evidence is not conclusive, with some research studies
19
showing associations between level of education and IPI incidence, but without confirmation by
others.
1.4.2.3. Occupation
Studies show that farmers may show higher IPI prevalence, mainly STH, as their work may involve
contact with untreated wastewater (115) and soil, in combination with poor sanitary conditions. In
farms, these may include poor water treatment, infrequent hand washing, and unsafe stool disposal.
1.4.2.4. Forced Displacement
Mobilization of populations for economic, social or political reasons can create humanitarian
emergencies that increase the risk of communicable diseases (116). High IPI prevalence has been
identified in individuals who have been forcefully displaced or have migrated into urban areas
(117). Both create socioeconomic vulnerability and expose them to substandard living conditions
including overcrowding and living in poor infrastructure housing. Besides, food safety may be
compromised due to lack of refrigeration and/or an increased risk of fecal-oral contamination
(118).
1.4.2.5. Deworming
Massive deworming against STH in high-risk regions with vulnerable populations is a strategy
that the WHO has identified to control IPI. However, although prophylactic deworming programs
in children and women of reproductive age have been recommended (119), their effectiveness in
health outcomes is unclear (120, 121). Also, their effects are short term because quick reinfection
may occur as long as critical factors, such as basic sanitation, are not corrected (105). Colombia
has parasite therapy prevention programs focused on sizeable primary school populations (122)
and pregnant women living in endemic zones for hookworms (123).
1.4.2.6. Housing characteristics
Living conditions may favor the development of IPI, by promoting habitats supportive of parasite
life cycles. These may include having dirt floors, poor wastewater management or using untreated
water. Secondly, they can facilitate fecal-oral contamination through household overcrowding
20
(124), shared use of bathrooms by different families within the same house (125), barefoot walking
(113) inadequate pre- and post-prandial handwashing with soap (29, 105), poor food handling
(111), lack of boiling drinking water (110), unsatisfactory pet care (86), outdoor defecation, and
poor home hygiene particularly in bathrooms and kitchens (111).
1.4.3. Colombian environmental and socioeconomic conditions of IPI
Colombia is located in the northwestern tropical region of South America, between the Pacific and
Atlantic oceans, with an Andean mountainous topography that offers a wide altitude-based
climatic range (126). Nearly 20% of the Colombian population of 47 million cannot afford one or
more of their basic needs to live (7), with living conditions characterized by inadequate housing,
poor or unsafe water supply, substandard sanitation, household overcrowding, unemployment and
inaccessible education for their children (127). This country officially has two ways to calculate
poverty, namely, household income and the Multidimensional Poverty Index (MPI) (128).
The poverty line is the minimum cost per capita to acquire a basic food basket that grants an
average life standard in a specific country. In Colombia, the value is estimated to be half of the
basic salary. In 2012 the per capita minimum income was USD 107 monthly. According to this, if
a four-member house had an income lower than USD 428, it was classified under the poverty level
(129). The extreme poverty line is the per capita minimum cost to acquire only the basic food
basket that provides survival. Colombia’s extreme poverty level is USD 45 monthly. Thus, if the
income of a four-member house is lower than USD 180, it is classified as extremely poor. In 2012
Colombia had, according to income classification, 32.7% of its population under the poverty level
and 10.4% under the extreme poverty line. The GINI index, which estimates inequality on income
distribution, was 0.539 (129).
The MPI measures the health conditions and the educational level of the household members,
living conditions of childhood and youth, and access to public services. It calculates poverty using
five factors and provides value from 0 to 100, where 0 corresponds to a household with no
deprivations, and 100 corresponds to a household with all UBN. The households over 33 are
considered poor (129). According to MPI, 27% of the Colombian population in 2012 was poor.
Colombia has a social and economic stratification based on residence and neighborhood
conditions. The strata range is from 1 (worst conditions) to 6 (best conditions). This system is used
to apply differential rates in public services and taxes. People with higher income capacity (strata
21
5 and 6) pay more, while people with lower income capacity (strata 1, 2 and 3) get benefits. Stratum
4 is charged the real fare fixed by companies that are in charge of public services. Stratification is
an approximate index of the living standard, inequality, and poverty. It is also used as a spatial
index of population and areas. Geographically, strata are regions in which people share social and
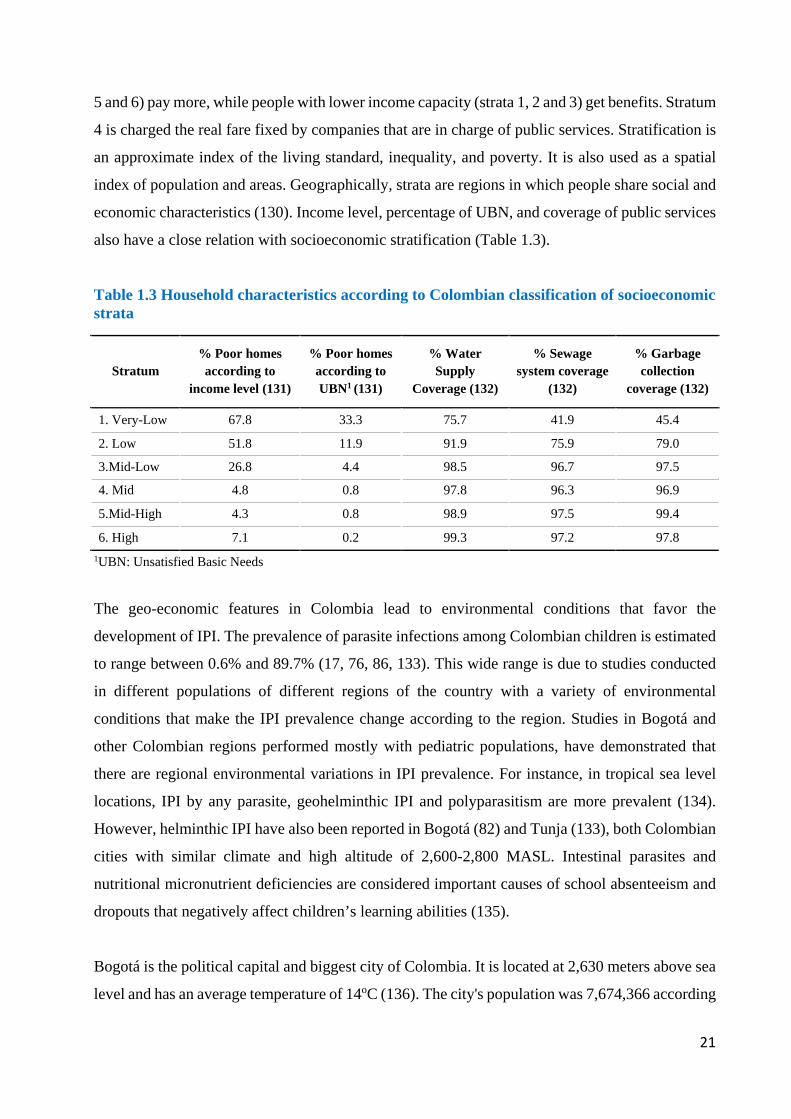
economic characteristics (130). Income level, percentage of UBN, and coverage of public services
also have a close relation with socioeconomic stratification (Table 1.3).
Table 1.3 Household characteristics according to Colombian classification of socioeconomic strata
Stratum % Poor homes according to
income level (131)
% Poor homes according to UBN1 (131)
% Water Supply
Coverage (132)
% Sewage system coverage
(132)
% Garbage collection
coverage (132)
1. Very-Low 67.8 33.3 75.7 41.9 45.4
2. Low 51.8 11.9 91.9 75.9 79.0
3.Mid-Low 26.8 4.4 98.5 96.7 97.5
4. Mid 4.8 0.8 97.8 96.3 96.9
5.Mid-High 4.3 0.8 98.9 97.5 99.4
6. High 7.1 0.2 99.3 97.2 97.8 1UBN: Unsatisfied Basic Needs
The geo-economic features in Colombia lead to environmental conditions that favor the
development of IPI. The prevalence of parasite infections among Colombian children is estimated
to range between 0.6% and 89.7% (17, 76, 86, 133). This wide range is due to studies conducted
in different populations of different regions of the country with a variety of environmental
conditions that make the IPI prevalence change according to the region. Studies in Bogotá and
other Colombian regions performed mostly with pediatric populations, have demonstrated that
there are regional environmental variations in IPI prevalence. For instance, in tropical sea level
locations, IPI by any parasite, geohelminthic IPI and polyparasitism are more prevalent (134).
However, helminthic IPI have also been reported in Bogotá (82) and Tunja (133), both Colombian
cities with similar climate and high altitude of 2,600-2,800 MASL. Intestinal parasites and
nutritional micronutrient deficiencies are considered important causes of school absenteeism and
dropouts that negatively affect children’s learning abilities (135).
Bogotá is the political capital and biggest city of Colombia. It is located at 2,630 meters above sea
level and has an average temperature of 14oC (136). The city's population was 7,674,366 according
22
to the projection for 2013 from the National Bureau of Statistics (DANE for its Spanish acronym)
(137). Bogotá is divided into 20 districts that are political units with different features and
resources. Health services are provided by public and private institutions. The public health system
in each district is divided into different levels of attention, including Primary Care Units (UPA for
its Spanish acronym) with a basic level of attention, and hospital units of medium and high
complexity of second and third level. Antenatal basic care is done in UPA and second level
hospitals.
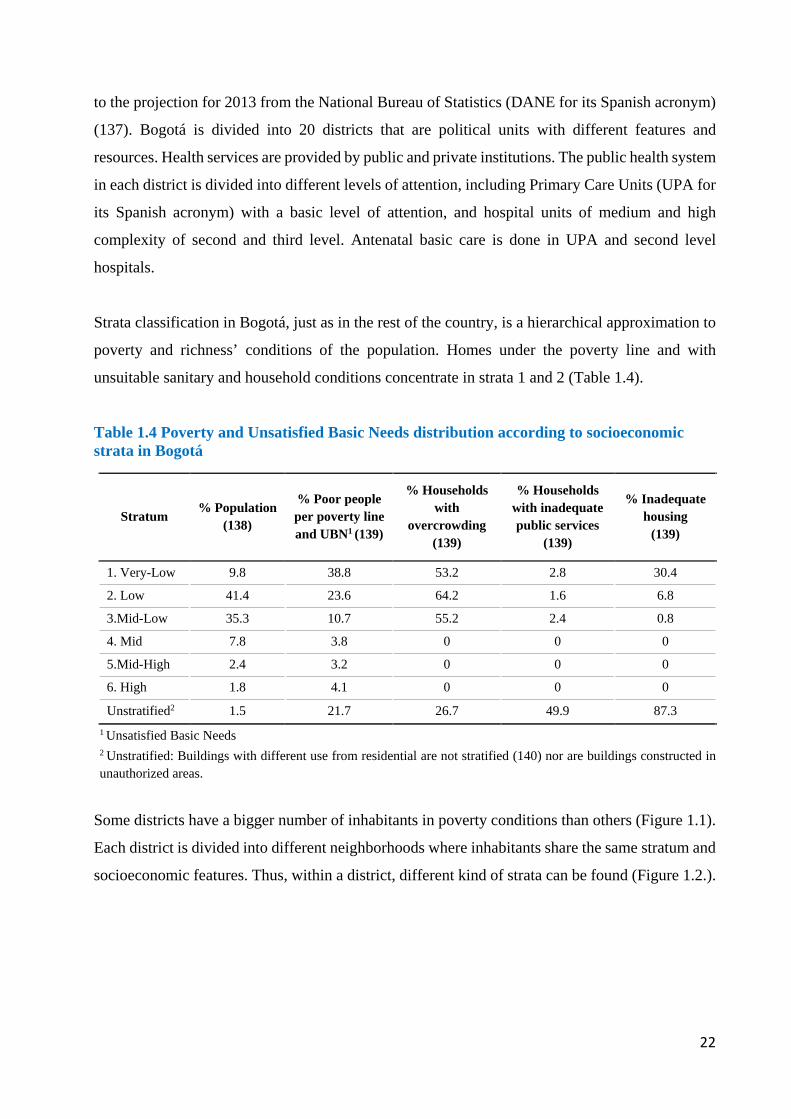
Strata classification in Bogotá, just as in the rest of the country, is a hierarchical approximation to
poverty and richness’ conditions of the population. Homes under the poverty line and with
unsuitable sanitary and household conditions concentrate in strata 1 and 2 (Table 1.4).
Table 1.4 Poverty and Unsatisfied Basic Needs distribution according to socioeconomic strata in Bogotá
Stratum % Population (138)
% Poor people per poverty line and UBN1 (139)
% Households with
overcrowding (139)
% Households with inadequate public services
(139)
% Inadequate housing
(139)
1. Very-Low 9.8 38.8 53.2 2.8 30.4
2. Low 41.4 23.6 64.2 1.6 6.8
3.Mid-Low 35.3 10.7 55.2 2.4 0.8
4. Mid 7.8 3.8 0 0 0
5.Mid-High 2.4 3.2 0 0 0
6. High 1.8 4.1 0 0 0
Unstratified2 1.5 21.7 26.7 49.9 87.3 1 Unsatisfied Basic Needs
2 Unstratified: Buildings with different use from residential are not stratified (140) nor are buildings constructed in unauthorized areas.
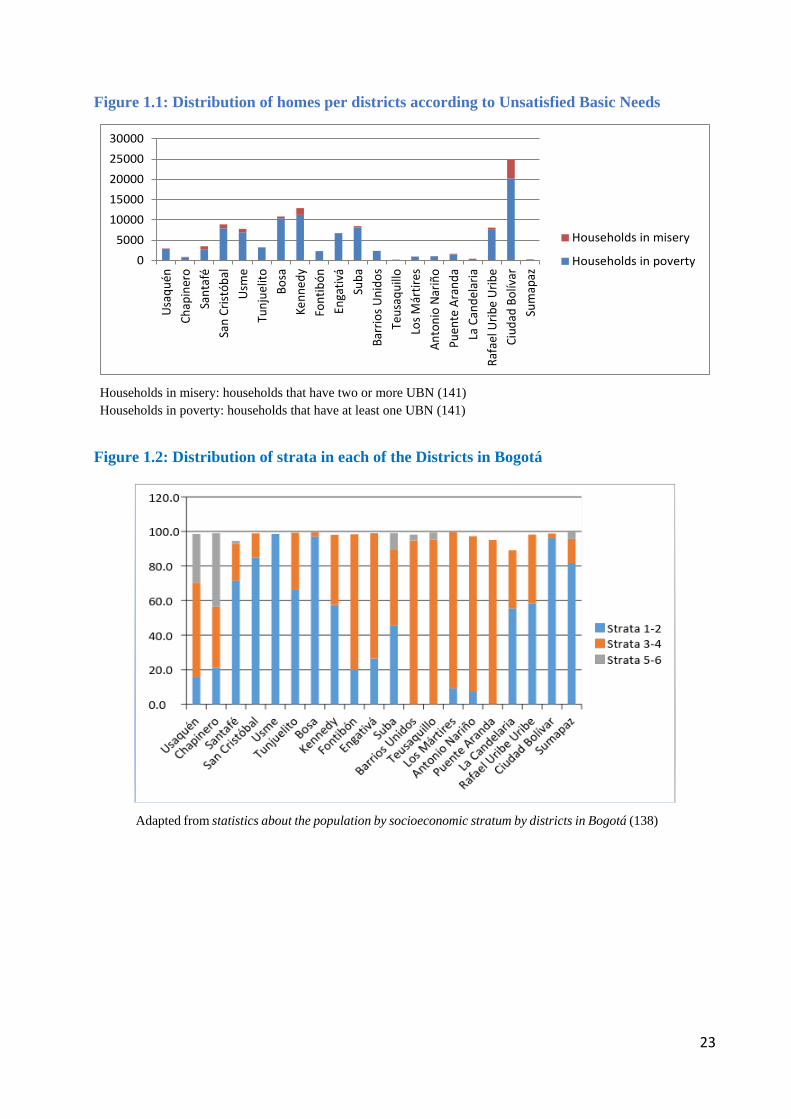
Some districts have a bigger number of inhabitants in poverty conditions than others (Figure 1.1).
Each district is divided into different neighborhoods where inhabitants share the same stratum and
socioeconomic features. Thus, within a district, different kind of strata can be found (Figure 1.2.).
23
Figure 1.1: Distribution of homes per districts according to Unsatisfied Basic Needs
Households in misery: households that have two or more UBN (141)
Households in poverty: households that have at least one UBN (141)
Figure 1.2: Distribution of strata in each of the Districts in Bogotá
Adapted from statistics about the population by socioeconomic stratum by districts in Bogotá (138)
05000
1000015000200002500030000
Usaq
uén
Chap
iner
oSa
ntaf
éSa
n Cr
istób
alUs
me
Tunj
uelit
oBo
saKe
nned
yFo
ntib
ónEn
gativ
áSu
baBa
rrio
s Uni
dos
Teus
aqui
lloLo
s Már
tires
Anto
nio
Nariñ
oPu
ente
Ara
nda
La C
ande
laria
Rafa
el U
ribe
Urib
eCi
udad
Bol
ívar
Sum
apaz
Households in misery
Households in poverty
24
There is a lack of scientific evidence addressing IPI in pregnant women in Bogotá. Studies with
children living in low socioeconomic neighborhoods of the city have shown variable prevalence
of any intestinal parasites ranging from 7% to 44%. In Arabia and Jerusalén, two marginalized
neighbourhoods of Bogotá, Arias and Gonzalez (88) found a 10-39% IPI prevalence in 70
symptomatic versus 7-22% in 35 asymptomatic children aged 3-60 months. Similarly, Bonilla
(142), in 48 pre-school children living in strata 1 and 2 areas of Usaquén, reported a 44% IPI
prevalence. Also, a 2012-2013 cross-sectional study with children aged 4-70 months living in El
Codito, a low socioeconomic community in Bogotá, showed an overall 39% IPI prevalence, mostly
due to protozoal infections ranging from 1 to 19%, and low helminthic IPI not surpassing 1%
prevalence (82). In the general population, Agudelo et al. (143) reported that in marginalized
communities of Bogotá living in poor environmental conditions, a 0-64 year old population
showed prevalence ranges of 1-31% for geohelminths and 8-31% for protozoal IPI.
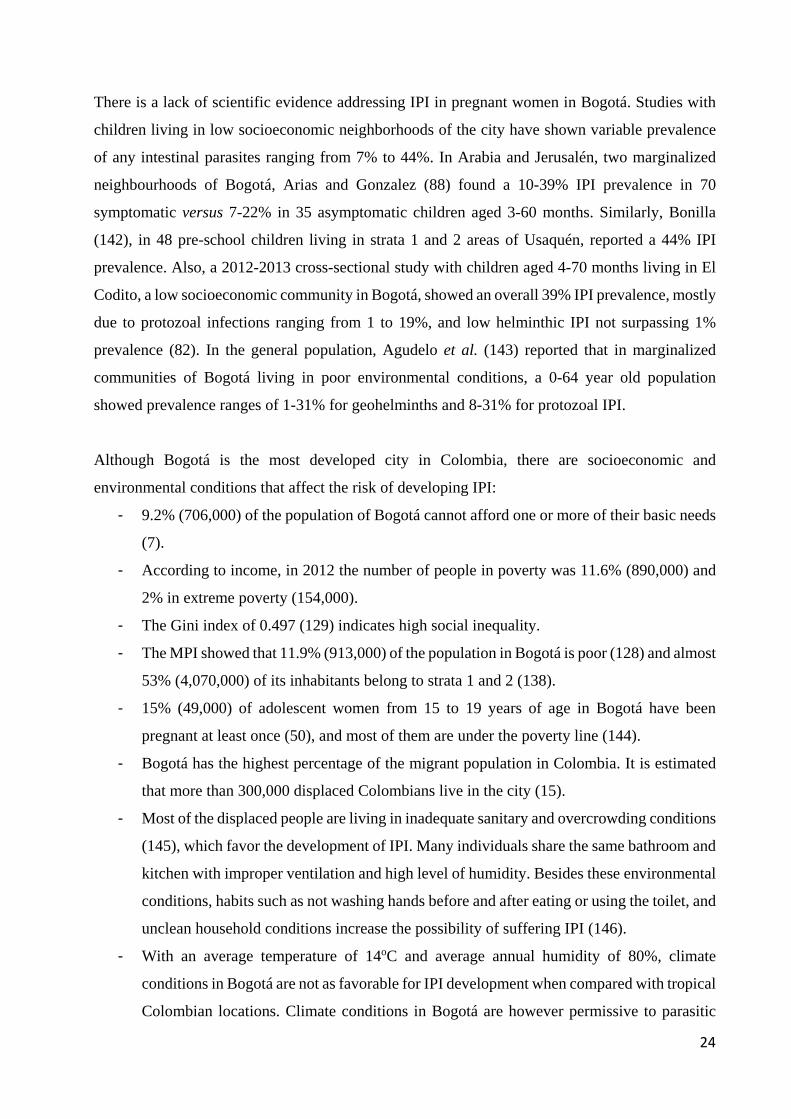
Although Bogotá is the most developed city in Colombia, there are socioeconomic and
environmental conditions that affect the risk of developing IPI:
- 9.2% (706,000) of the population of Bogotá cannot afford one or more of their basic needs
(7).
- According to income, in 2012 the number of people in poverty was 11.6% (890,000) and
2% in extreme poverty (154,000).
- The Gini index of 0.497 (129) indicates high social inequality.
- The MPI showed that 11.9% (913,000) of the population in Bogotá is poor (128) and almost
53% (4,070,000) of its inhabitants belong to strata 1 and 2 (138).
- 15% (49,000) of adolescent women from 15 to 19 years of age in Bogotá have been
pregnant at least once (50), and most of them are under the poverty line (144).
- Bogotá has the highest percentage of the migrant population in Colombia. It is estimated
that more than 300,000 displaced Colombians live in the city (15).
- Most of the displaced people are living in inadequate sanitary and overcrowding conditions
(145), which favor the development of IPI. Many individuals share the same bathroom and
kitchen with improper ventilation and high level of humidity. Besides these environmental
conditions, habits such as not washing hands before and after eating or using the toilet, and
unclean household conditions increase the possibility of suffering IPI (146).
- With an average temperature of 14oC and average annual humidity of 80%, climate
conditions in Bogotá are not as favorable for IPI development when compared with tropical
Colombian locations. Climate conditions in Bogotá are however permissive to parasitic
25
life cycles, particularly protozoal. Yet, both protozoal and helminthic IPI have been
reported in populations of Bogotá (Table 1.1) and it is assumed that inadequate urban
socioeconomic factors outweigh climate conditions as risk factors.
In summary, although Bogotá is the city with the highest economic progress in Colombia, it has
sociodemographic and living conditions favoring the development and dissemination of IPI, with
climatic conditions permissive for protozoal more than helminthic IPI.
1.4.4. IPI in pregnant women and the consequences in their offspring
Pregnant women are an especially vulnerable subgroup for IPI, mainly because during pregnancy
there is a physiological state of relative immunosuppression that may result in susceptibility to
various diseases including parasitic infections (27, 147). In general, the clinical manifestations of
intestinal parasite infections in pregnant women are the same as those present in other periods of
life, depending on the type of parasite: diarrhea, flatulence, dysentery, anal itching, rectal prolapse,
malabsorption syndrome, anemia, and malnutrition. The same situation applies to the
complications: hepatic, biliary and intestinal obstruction and pancreatitis, in the case of A.
lumbricoides infection; poor absorption of fat, protein, vitamin A and lactose, in G. lamblia and/or
A. lumbricoides infection; the hookworms can cause and aggravate anemia of pregnancy (148).
Pregnant women are more prone to biliary Ascaris infection because progesterone alters or relaxes
the motility of the sphincter of Oddi (149). E. histolytica infection might cause a liver abscess in
pregnancy, which can generate preterm labor (150). Giardia infection is one of the most frequent
causes of intestinal parasitism in pregnant women worldwide (89).
1.4.4.1. Effect of parasitic infection in pregnant women and their offspring
IPI in pregnant women may cause iron deficiency anemia (27, 60, 61, 97, 151-153) which in turn
may lead to pregnancy complications related to blood loss and insufficient supply of nutrients
necessary for erythropoiesis. LBW in the offspring (151) is a consequence of this. Iron deficiency
and low Apgar scores occur in infants with LBW who may have more intestinal and respiratory
infections, frequent hospitalizations and higher mortality rates than children with normal birth
weight. Moreover, adults who had LBW are at a higher risk of developing cardiovascular and
metabolic diseases (152). It has been determined that LBW infants are at risk of reduced growth
and development during childhood and adolescence. Slow growth leads to underweight and
26
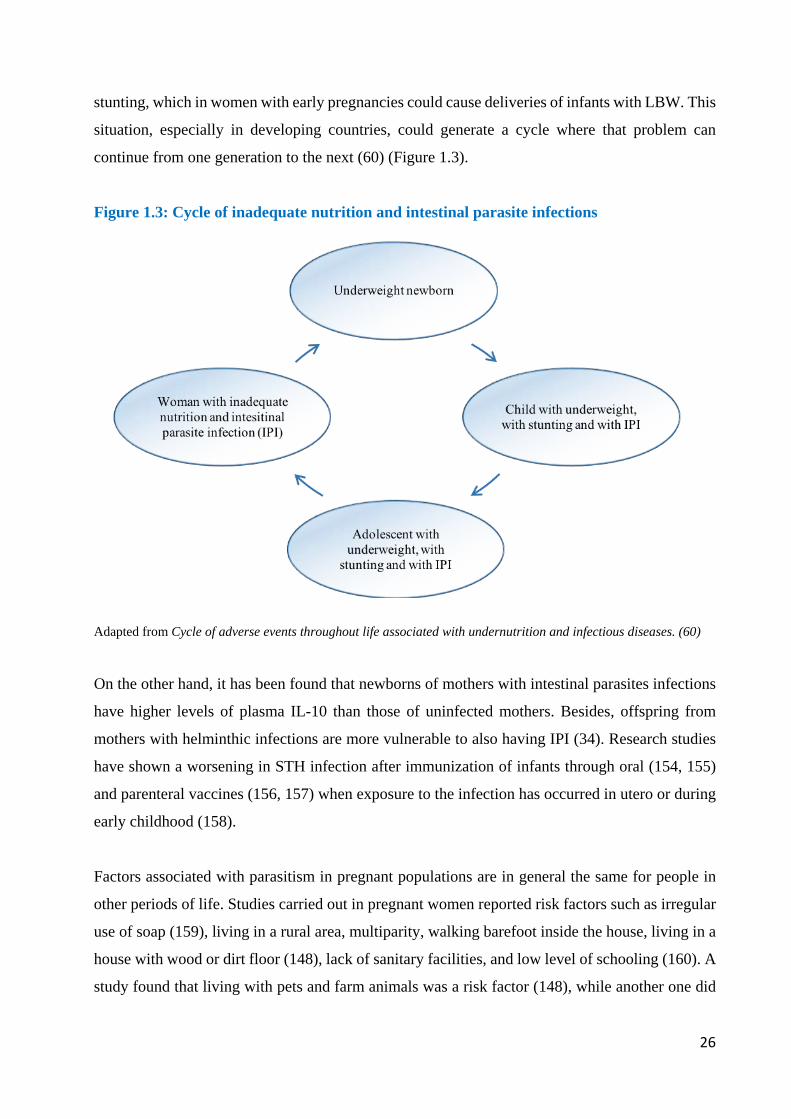
stunting, which in women with early pregnancies could cause deliveries of infants with LBW. This
situation, especially in developing countries, could generate a cycle where that problem can
continue from one generation to the next (60) (Figure 1.3).
Figure 1.3: Cycle of inadequate nutrition and intestinal parasite infections
Adapted from Cycle of adverse events throughout life associated with undernutrition and infectious diseases. (60)
On the other hand, it has been found that newborns of mothers with intestinal parasites infections
have higher levels of plasma IL-10 than those of uninfected mothers. Besides, offspring from
mothers with helminthic infections are more vulnerable to also having IPI (34). Research studies
have shown a worsening in STH infection after immunization of infants through oral (154, 155)
and parenteral vaccines (156, 157) when exposure to the infection has occurred in utero or during
early childhood (158).
Factors associated with parasitism in pregnant populations are in general the same for people in
other periods of life. Studies carried out in pregnant women reported risk factors such as irregular
use of soap (159), living in a rural area, multiparity, walking barefoot inside the house, living in a
house with wood or dirt floor (148), lack of sanitary facilities, and low level of schooling (160). A
study found that living with pets and farm animals was a risk factor (148), while another one did
27
not consider it as determinant (160). Out of these, the only specific risk considered in pregnant
women is multiparity; all the other ones are the same as in the rest of the population.
Finally, the fetal programming theory (161) states that "the biological systems of the human being
are programmed for adult life according to environmental characteristics over very specific periods
of prenatal development" (162). It can be thus assumed that damage suffered by the child in the
womb may be insurmountable, which would justify a timely intervention in pregnant women to
solve this problem.
1.4.4.2. Treatment of intestinal parasite infections during pregnancy
Literature reports deficient knowledge of some obstetrician/gynecologist physicians about the
correct treatment of intestinal parasitic diseases during pregnancy. For instance, a survey among
521 specialists in the US showed that 42% incorrectly answered when asked about a safe treatment
for giardiasis within the first trimester of pregnancy (163). Even though treatments with anti-
parasitic drugs are not entirely safe during pregnancy, only a few of them has absolute
contraindications. When it is necessary to use them, it is crucial to take into account the pregnancy
week and the risk-benefit ratio (164).
In the case of A. lumbricoides treatment, studies report successful results with a single or two doses
of albendazole after 14 weeks of pregnancy (cure rate 92% and 100% respectively) (165).
Evidence indicates that deworming with mebendazole during pregnancy can be safe, and it could
be included in antenatal care programs in hookworms-endemic areas (152, 166). Its use is
recommended during the second and third trimester (167).
IPI are common in developing countries. This kind of infections has been studied mainly in
children. However, pregnant women in vulnerable conditions, are an important population to be
considered in these studies. Colombia and particularly Bogotá D.C., the capital city, offers the
appropriate conditions to acquire intestinal parasites, but the prevalence of IPI in pregnant women
residing in this city is undetermined. Knowing the prevalence and risk factors associated with IPI
allows for preventive measures and timely treatment.
Intestinal protozoan disease during pregnancy is controlled by symptomatic treatment in most
cases. Specific therapy should be postponed after delivery. Severe cases require immediate,
28
specific chemotherapy, which may be dangerous for the fetus due to toxic and teratogenic
potentials. Knowing maternal travel history is essential for timely diagnosis and treatment of
protozoan disease during pregnancy and the first stage of the newborn’s life (168). WHO
guidelines suggest that prophylactic anti-helminthic drugs should be included in regular antenatal
care in areas where hookworm prevalence is higher than 20% to 30% (152). Despite this policy,
Colombian law does not seek the diagnosis of intestinal parasites during pregnancy, and its
treatment is considered only in hookworm-endemic areas. When the prevalence of these parasites
is between 20% and 30%, a single dose of pyrantel pamoate is recommended, and in areas with
prevalence greater than 50%, two doses are needed (123).
In summary, pregnant women are a particularly vulnerable group to develop intestinal parasitic
diseases. Because of these infections, there are significant consequences for both women and their
offspring. Risk factors associated with the development of intestinal parasites in pregnant women
are generally the same as for the rest of the population. Although therapy with anti-parasitic drugs
is not desirable during pregnancy, it is possible to treat pregnant women with IPI as long as
contraindications are into account at each gestational stage. Finally, to achieve preventive
measures and timely treatments in pregnant women with IPI, it is necessary to know the prevalence
and risk factors associated with these infections.
1.5. Respiratory symptoms
1.5.1. Epidemiology of respiratory symptoms: asthma, wheezing and allergic rhinitis at
the worldwide, regional, national and local level
In 2014, the Global Initiative for Asthma (GINA) redefined asthma as “a heterogeneous disease,
usually characterized by chronic airway inflammation. It is defined by the history of RS such as
wheeze, shortness of breath, chest tightness and cough that vary over time and in intensity, together
with variable expiratory airflow limitation” (169). The Global Burden of Disease Study estimated
that, by 2016 counts, asthma affected around 339.4 million people worldwide (170). This number
is probably higher due to underdiagnosis, estimated to range between 20% and 73% in adult and
pediatric populations with current asthma (171). Prevalence can also be affected by the difficulty
to differentiate asthma from chronic obstructive pulmonary disease at older ages, termed as the
“asthma-COPD overlap syndrome” (172).
29
In Latin America, the International Study of Asthma and Allergies in Childhood (ISAAC) reported
geographical variations in asthma prevalence, in the context of socioeconomic inequality, poverty,
ethnicity and climatic diversity characteristic of this region (173). Overall, among Latin American
children age 13-14, 13.6% reported asthma ever, 15.9% current wheeze and 2.6% sleep
disturbance from wheeze. These symptoms were highest in Lima, Peru (33.1%), San Salvador, El
Salvador (30.8%) and Vitoria da Conquista, Brazil (6.1%), respectively. This ISAAC study also
collected information from Colombian children living in three major cities, who reported 14.2%
asthma ever (9.5% in Bogotá), 11.8% current wheeze (8.5% in Bogotá) and 1.9% sleep disturbance
from wheeze (0.7% in Bogotá).
In Colombia, the asthma prevalence studies have included patients living in urban settings, used
questionnaires, some have used spirometry and IgE blood levels. The first large cross sectional
study that aimed to determine asthma prevalence in Colombia was published in 1992, was
conducted in Cartagena, a tropical coastal city in northern Colombia, and included 4,000 local
residents. The participants were considered to have asthma if “they had consulted their physicians
for shortness of breath accompanied by wheezing during the last year and had received asthma
medication”. The point prevalence of asthma in Cartagena was 8.8% (174). In 2004, a cross-
sectional study conducted in six cities of Colombia, including Bogotá, determined the prevalence
of asthma when participants answered “yes” to either of two questions: “Have you had wheezing
(whistling) in the chest during the past year?” or “Has your physician ever told you that you have
asthma?”. In this study, the overall prevalence of asthma in adults 19- 59 years old was 7.6%. In
Bogotá, the prevalence of asthma in adults was 9.4%, ranking fifth among the six cities scrutinized
(175). In 2010, a cross sectional study by the same group reported an asthma prevalence of 9.68%
in 4,026 Colombian adults age 18-59 (176). The most recent cross-sectional study, in 2015,
determined the prevalence of asthma in 5,539 adults 40-93 years old in Colombia. Asthma
definition in this study was established by a positive answer to the question ‘‘Have you ever had
two or more wheezing attacks that caused you shortness of breath?’’ and a post-bronchodilator
FEV1/FVC ratio higher than 70%. With these criteria, the average prevalence of asthma in
Colombia was 9%, higher than physician-diagnosed asthma of 6.5%. For Bogotá, clinical asthma
was 11.9%, higher than in previous reports (177).
Asthma is one of several allergy-related diseases, which usually overlap. Nasal congestion or
inflammation is one of the common symptoms of rhinitis along with frequent sneezing, itching,
and rhinorrhea (178). As with asthma, rhinitis is more prevalent in infants than in the adult
30
population. In adults, a multinational cross-sectional survey of Ear, Nose and Throat (ENT)
specialists published in 2018 reported prevalence of rhinitis between 10% and 30% (179). A
follow-up of 9,156 participants of the European Community Respiratory Health Survey (ECRHS)
concluded that rhinitis prevalence increased from 21.6% to 30.9% in 18 years among Swedish
adults. This prevalence was determined with questions about the symptoms included in the “Global
Allergy and Asthma European Network”, by asking the participants “Do you have any nasal
allergies, including hay fever?”. Participants answered the questionnaire in 1990 and then again in
2008 (180). A study that evaluated the prevalence of RS through the Spanish version of the
International study of Asthma and Allergies in Childhood (ISAAC) questionnaire reported that
41.6% of school-age participants in the province of Oropeza in Bolivia had rhinitis (181). In
Colombia, the cumulative prevalence of rhinitis was 31.3% in a study with 6,507 participants,
while in Bogotá, the point prevalence of rhinitis was 21.6% (175). Determining the actual status
of this condition can be challenging for two main reasons: first, differential diagnosis of rhinitis is
extensive and, second, there is no one universally accepted definition of the disease.
Wheezing is a continuous high-pitched sound with a frequency of 400 Hz or more that manifests
itself in patients of various diseases and not only in asthmatics (182). A 2018 meta-analysis
reported the prevalence of childhood wheezing and recurrent wheezing of 36.06% and 17.41%,
respectively. This frequency varied from one continent to another. For European countries, the
wheezing prevalence was 30.68%, while for Latin America it was 40.55% and 15.97% in Africa
(183). In Colombia, the prevalence of wheezing was 16.9% in adults and 22.7% in all participants
from Bogotá (175).
Allergy-related diseases such as asthma, wheezing, and rhinitis are responsible for reducing active
days and increasing the use of hospital services. The socio-economic burden of asthma was
analyzed in European countries in 2008 when 1,152 asthmatic adults participated in the ECRHS-
II and reported the number of active days reduced and the use of hospital services due to asthma
symptoms. In this survey, 14% of participants reported a large number of days with reduced
activity. This heavy burden was associated with the severity of the disease and the worsening of
life quality (184). Wheezing and rhinitis are also related to hospital visits, school, and work
absence and career-decision making (185).
The prevalence of respiratory symptoms during pregnancy has been reported in studies from
Sweden, Australia, United States, Nigeria and Tanzania. One of these, longitudinally identified a
31
22% prevalence of rhinitis in Swedish women, higher in women who smoked while pregnant
(186). Another Swedish study, based on a cohort, used health registry data and identified a 9%
asthma prevalence, associated with complications during pregnancy (187). A cross-sectional
Australian study found a self-reported asthma prevalence of 13% (188). In the United States, a
cohort-based study estimated a 7% prevalence of physician-diagnosed asthma, with age,
educational level, ethnicity and smoking as associated factors (189). A Nigerian cross-sectional
study reported prevalence of 2% for physician-diagnosed asthma and 6% for rhinitis, with family
history of these conditions associated to both, and monthly income associated to rhinitis (190).
Finally, a study in Tanzania identified prevalence of 11% for wheezing and 4% for asthma (191).
1.5.2. Respiratory symptoms in pregnant women and the consequences in their offspring
The onset of asthma in pregnant women varies depending on their previous health status.
Suboptimal controlled asthma can lead to maternal and fetal complications. Pregnant women are
encouraged to continue asthma therapy with inhalers during gestation and lactation, but some
studies have shown that, during pregnancy, women report poor adherence to inhaled
corticosteroids due to fear of adverse effects, among other causes. However, when pregnant
women enrolled in an asthma management program, adherence improved from 28 to 46% (192).
On the other hand, although the inappropriate use of inhalers is quite common in pregnant women
(64.4%), this does not result in adverse clinical results of the mothers or their offspring (193, 194).
Patients who experienced acute asthma exacerbation during pregnancy had a higher risk of
cesarean section (195), preeclampsia, gestational diabetes, placenta previa and placental abruption
(196). Regarding the consequences for the offspring, asthma during pregnancy was associated with
a significantly higher risk of congenital malformations, cleft lip and/or palate, neonatal death and
hospitalization (197).
1.5.3. Environmental conditions associated with respiratory symptoms: Greenness,
housing conditions and air pollution in the general population and during pregnancy
Asthma, wheezing, and rhinitis can be triggered by environmental conditions. These conditions
are reported to be influenced by a combination of several factors including environment,
socioeconomic status, lifestyle, and genetics (198). Environmental conditions such as access to
32
green spaces, living characteristics and air quality have been studied as factors of these respiratory
conditions (199-201).
The rapid urbanization of cities has lessened human contact with natural environments affecting
global health in different aspects. Closeness and access of city dwellers to urban green spaces have
been reported to have beneficial effects for, among others, mental health, adult body mass index,
birth weight and child development (202). Green spaces may positively affect health outcomes
through mitigation, restoration and instoration (203). Mitigation or harm-reducing paths refer to
diminishing exposure to environmental stressors such as air pollution, excessive heat, and noise.
Restoration mainly promotes the recovery of human capacities such as attention and mental health,
and instoration considers building capacities such as encouraging physical activity and facilitating
social cohesion (203). In contrast, potential adverse effects of greenness on health may relate to
the presence of allergenic pollen and disease vectors, safety issues leading to crime-prone areas,
excessive solar exposure and risk of exposure to pesticides (203).
Specific relationships between greenness and allergy-related diseases have been studied
thoroughly with different results (204). Regarding asthma, an ecological study in England reported
reductions in asthma hospitalizations associated with neighborhood green spaces, domestic
gardens and tree density (205). However, the significance of these associations was dependent on
the level of outdoor air pollution. Asthma in Australian children living in areas with high traffic-
related air pollution was reported to be lower in areas with high green space coverage (206). In
contrast, using Normalized Difference Vegetation Index (NDVI), a satellite image-based
vegetation index (201), reported a positive association of childhood asthma with residential
proximity to parks, and none with residential surrounding greenness or proximity to forests. A
cohort of 5,803 children in Germany, using NDVI too, but segregated by the place of residence in
rural northern and southern urban regions, reported that the effect of greenness varied between
areas. In the urban southern region, there was a significant association between greenness and
rhinitis, as well as eyes and nose symptoms, whereas in the rural northern area every outcome was
significantly lower on all studies (200).
Living and housing conditions must be considered when studying respiratory symptoms. Low
income communities, where poor housing conditions occur, show increasing prevalence of non-
atopic and severe asthma (207). In children, associations between inadequate living conditions and
respiratory allergies have been identified. For instance, Maluleke and Worku (208) found that in a
33
poor South African community, significant predictors of childhood asthma included household
exposure to smoke and lack of access to flush toilets, the latter considered a proxy socioeconomic
status indicator (208). Barreto et al. (209) identified that, in non-atopic Brazilian children,
wheezing was significantly associated with low frequency of room cleaning and presence of
rodents in the house. Colombian children in the department of Cesar had more respiratory
symptoms when exposed to indoor tobacco or firewood smoke, living in housing with walls made
of adobe, damp house and living with pets (210). In Colombian adults, indoor exposure to wood
smoke was associated with asthma and wheezing (177). To contrast, increased levels of
urbanization, higher socioeconomic status, and a more urban lifestyle were associated with a
higher prevalence of asthma in transitional communities in Ecuador (211), and in children living
in peri-urban settings when compared to their rural counterparts in Peru (212). When studying
surface materials in a house, frequent considerations are the relationship with components that can
be harmful to health by generating potential chemical emissions, favoring the growth of
microorganisms or exposure to allergens. A study in Russia, a high income country, identified the
use of linoleum floors, synthetic carpet and new furniture as risk factors for asthma, wheezing and
allergies (213). A Colombian study identified that the material of the walls are associated with
respiratory symptoms (210).
Hygiene at home has been studied in association with respiratory disorders, with inconclusive
research evidence. On the one hand, it has been argued that households where hygienic conditions
are not rigorous favor early exposure to microorganisms that stimulate immunologic maturation.
For instance, in European countries, a lower prevalence especially of atopic asthma and allergic
disease was observed in farmers’ children with higher levels of exposure to microorganisms (214,
215). Also, inverse associations between family size and risk of allergies led to the formulation of
the hygiene hypothesis. This association was initially explained by early exposure to infection
transmitted from older to younger siblings. More recently, this hypothesis has been supplemented
with evidence relating to bacteria signaling, balance between type 1 and 2 of T-helper cells, the
role of immunoregulation and in utero programming of postnatal immune function. All these
mechanisms may partially explain the prevalence of allergy-related diseases according to hygiene
(216). On the other hand, in the Americas, including inner city areas of the United States where
non-atopic asthma is more prevalent, lower hygiene levels were associated with a higher
prevalence of the disease (217). In this context, increased stress levels associated with urban
violence were hypothesized as the underlying reason (218, 219).
34
Air pollution is also a context-dependent variable. Indoor air quality can be negatively affected by
tobacco smoke, cooking fumes, airborne mold, bacterial products and dust, that increase the risk
of developing asthma and other allergic respiratory conditions (220). Anthropogenic outdoor air
pollution is well established as a cause of increased asthma incidence, emergency visits and
hospitalizations (221, 222). In Latin America and the Caribbean, a recent meta-analysis found a
positive association between childhood asthma prevalence and outdoor air pollution levels (223).
Bogotá was reported as one of the top three cities, among 125 in the world, with the largest
pediatric asthma incidence associated with NO2 exposure, an air pollution proxy (224). Regarding
rhinitis, a cross-sectional study with South African schoolchildren reported a relationship between
prevalence of self-reported rhinitis and the frequency of trucks passing near their residence (225).
The prevalence of respiratory symptoms is increasing worldwide, and environmental factors are
more liable to have an effect on that increase than the genetic ones. Overall, not all the factors are
known or how they interact with each other and with the genes, in a person developing respiratory
symptoms. The differential impact of all these factors in high-income countries and low and
middle-income countries remains to be examined (170).
35
2. MATERIALS AND METHODS
2.1. Study design
A cross-sectional population-based study was carried out. Reasons for this type of study design
were:
● This type of study design is useful to measure the prevalence of IPI and RS in a specific
and restricted time span like pregnancy, and at the same time to measure environmental
associated factors.
● This design of study allows reach a greater cohort than designs that requires following
across the time.
● The high rate of housing rotation due to the socio-economic conditions of pregnant women
residing in strata 1 and 2 neighborhoods and safety reasons, would make it difficult to
follow up this cohort longitudinally.
2.2. Target population
Pregnant women from strata 1 and 2 who resided in Bogotá in the districts of Ciudad Bolívar,
Kennedy and Usaquén formed the target population. According to data obtained from the Health
Care Units of these districts, the number of pregnant women who attended the units during 2012
for the first time (first antenatal examination) was 5,900 in Ciudad Bolívar, 4,314 in Kennedy and
985 in Usaquén, totaling 11,199 pregnant women. Most of the inhabitants of the chosen districts,
except Usaquén, belong to strata 1 and 2 (Table 2.1). In Usaquén only 16% (73,838) of its
population resides in strata 1 and 2.
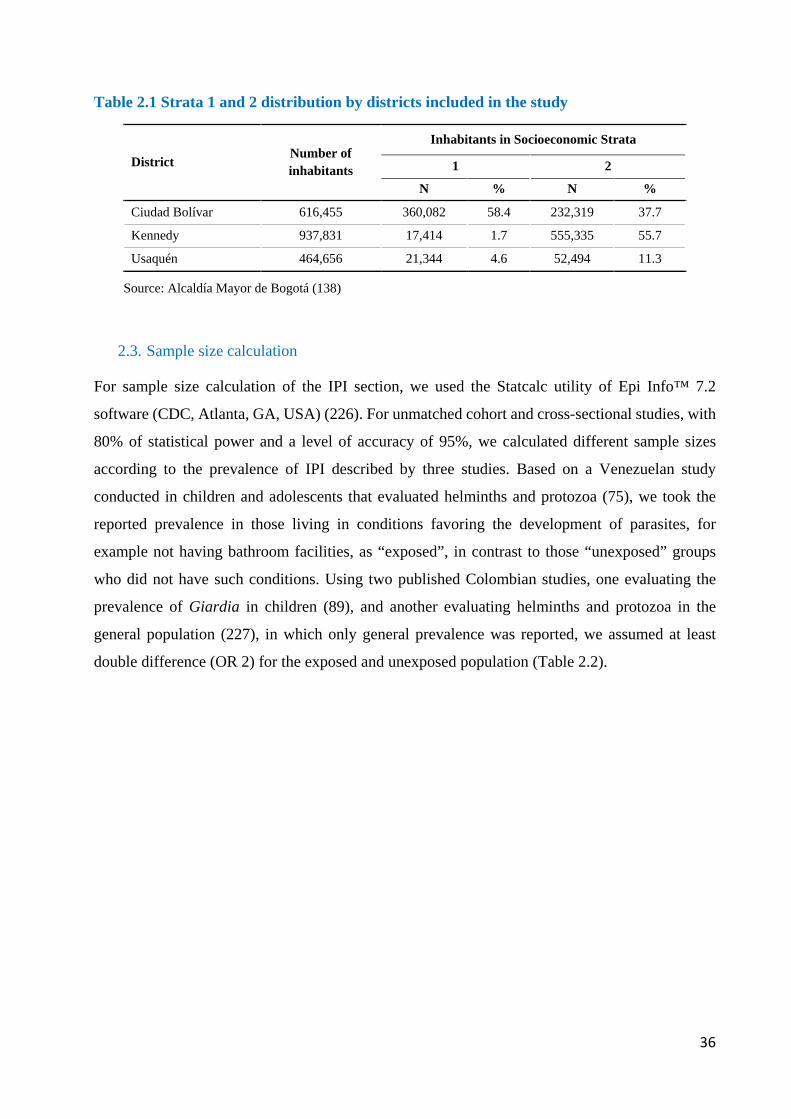
36
Table 2.1 Strata 1 and 2 distribution by districts included in the study
District Number of inhabitants
Inhabitants in Socioeconomic Strata
1 2
N % N %
Ciudad Bolívar 616,455 360,082 58.4 232,319 37.7
Kennedy 937,831 17,414 1.7 555,335 55.7
Usaquén 464,656 21,344 4.6 52,494 11.3
Source: Alcaldía Mayor de Bogotá (138)
2.3. Sample size calculation
For sample size calculation of the IPI section, we used the Statcalc utility of Epi Info™ 7.2
software (CDC, Atlanta, GA, USA) (226). For unmatched cohort and cross-sectional studies, with
80% of statistical power and a level of accuracy of 95%, we calculated different sample sizes
according to the prevalence of IPI described by three studies. Based on a Venezuelan study
conducted in children and adolescents that evaluated helminths and protozoa (75), we took the
reported prevalence in those living in conditions favoring the development of parasites, for
example not having bathroom facilities, as “exposed”, in contrast to those “unexposed” groups
who did not have such conditions. Using two published Colombian studies, one evaluating the
prevalence of Giardia in children (89), and another evaluating helminths and protozoa in the
general population (227), in which only general prevalence was reported, we assumed at least
double difference (OR 2) for the exposed and unexposed population (Table 2.2).
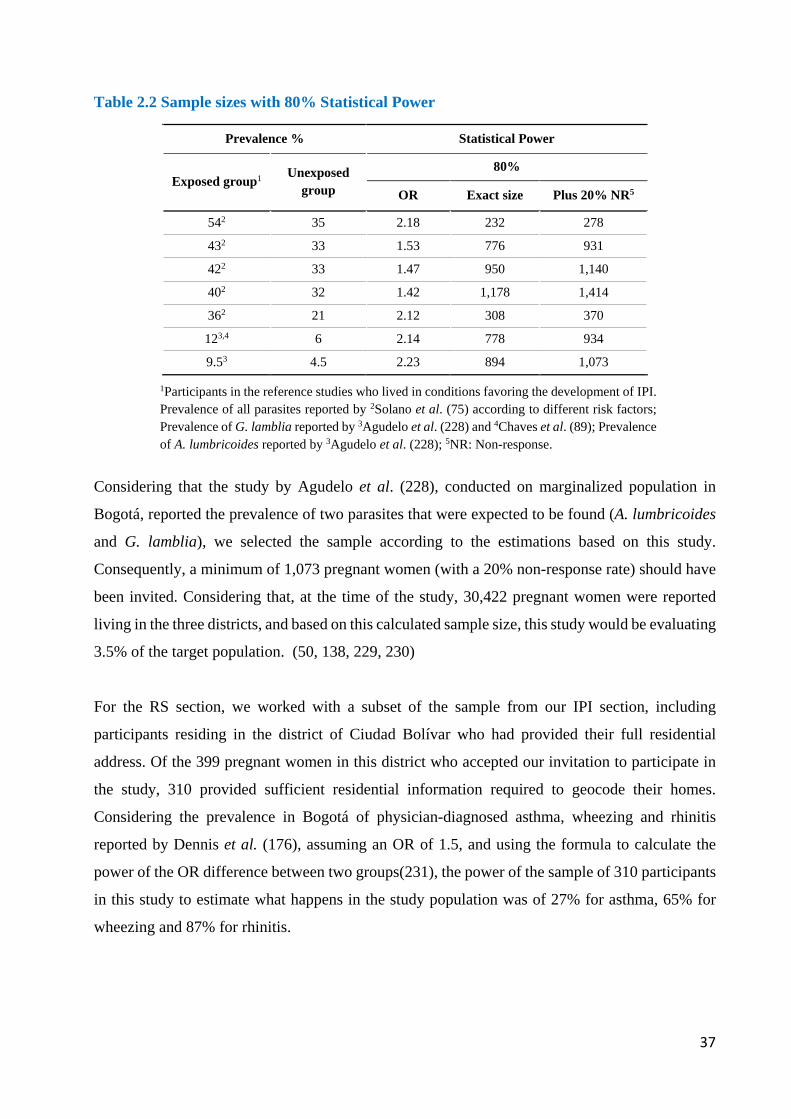
37
Table 2.2 Sample sizes with 80% Statistical Power
Prevalence % Statistical Power
Exposed group1 Unexposed group
80%
OR Exact size Plus 20% NR5
542 35 2.18 232 278
432 33 1.53 776 931
422 33 1.47 950 1,140
402 32 1.42 1,178 1,414
362 21 2.12 308 370
123,4 6 2.14 778 934
9.53 4.5 2.23 894 1,073
1Participants in the reference studies who lived in conditions favoring the development of IPI. Prevalence of all parasites reported by 2Solano et al. (75) according to different risk factors; Prevalence of G. lamblia reported by 3Agudelo et al. (228) and 4Chaves et al. (89); Prevalence of A. lumbricoides reported by 3Agudelo et al. (228); 5NR: Non-response.
Considering that the study by Agudelo et al. (228), conducted on marginalized population in
Bogotá, reported the prevalence of two parasites that were expected to be found (A. lumbricoides
and G. lamblia), we selected the sample according to the estimations based on this study.
Consequently, a minimum of 1,073 pregnant women (with a 20% non-response rate) should have
been invited. Considering that, at the time of the study, 30,422 pregnant women were reported
living in the three districts, and based on this calculated sample size, this study would be evaluating
3.5% of the target population. (50, 138, 229, 230)
For the RS section, we worked with a subset of the sample from our IPI section, including
participants residing in the district of Ciudad Bolívar who had provided their full residential
address. Of the 399 pregnant women in this district who accepted our invitation to participate in
the study, 310 provided sufficient residential information required to geocode their homes.
Considering the prevalence in Bogotá of physician-diagnosed asthma, wheezing and rhinitis
reported by Dennis et al. (176), assuming an OR of 1.5, and using the formula to calculate the
power of the OR difference between two groups(231), the power of the sample of 310 participants
in this study to estimate what happens in the study population was of 27% for asthma, 65% for
wheezing and 87% for rhinitis.
38
2.4. Data Collection
2.4.1. Data Collection Procedures
Fieldwork was carried out between May 2015 and July 2016. Because of Colombian legislation
on personal data protection, we were not able to establish the sampling frame, as the primary health
care units are forbidden from providing access to contact information of pregnant women. These
centers can only use this information for treatment but not for research purposes. Thus, the
recruitment of participants was performed as follows:
● Six research assistants with experience in community work were trained in data collection
procedures, including the ethical and logistical aspects of the planned fieldwork.
● In the districts of Usaquén and Kennedy, research assistants invited pregnant women who
attended to antenatal courses in different primary health care centers to participate in the
study. Besides, in Usaquén, research assistants invited pregnant women by door-to-door
visits.
● In the district of Ciudad Bolívar, the last place where the fieldwork was done, two primary
health care centers were selected, as 80% of all pregnant women in this district attended
antenatal care there. Here, research assistants invited all pregnant woman who arrived at
both centers during opening hours, from 7 am to 4 pm.
● Once the woman agreed to participate, the process was as follows:
− Explanation and signing of informed consent.
− If she was at the Primary Health Care, the first part of the questionnaire was
completed, including information that she would directly provide on
sociodemographic characteristics, as well as her past and current pregnancies. She
was then given a stool sampling kit, and an appointment would be set for the assistant
to pick up the sample and finalize the second part of the questionnaire that would
require observations of their housing and living conditions.
− For women whose recruitment was accomplished at their home in Usaquén, both
parts of the questionnaire were completed at once and an appointment to pick up
stool samples was set.
− During interviews, research assistants emphasized to each participant the importance
of accuracy in their answers to better assess the variables of the study.
● Once the questionnaire and assessments were completed, participants were given specific
and general recommendations regarding their pregnancy. This activity promoted a closer
39
relationship between participants and research assistants beyond the mere response of the
questionnaire and the collection of samples (Appendix 1).
● During interviews, research assistants explained to each participant the importance of not
telling the questions to other potential participants to reduce bias in the investigation.
● Once the laboratory completed parasite detection in stools, participants received the test
results so they could be shared with their physician.
For the IPI study, recruitment in Usaquén took place between May and August 2015 and was later
suspended due to safety concerns from research assistants during fieldwork, resulting in only 24
out of 550 participants in this district. Recruitment in Kennedy was done from May to September
2015 and was suspended because we were doing a selective sampling, focusing on pregnant
women who attended antenatal courses, resulting in 127 out of 550 participants in this district.
Considering the experiences in the two previous districts and that according to DANE, in this
district 59% of the inhabitants live in stratum 1 and 38% in stratum 2 (138), we decided to focus
recruitment efforts, between May 2016 to July 2016, on inhabitants of Ciudad Bolívar where 73%
(399) of the study participants resided (Figure 2.1).
For the RS study all participants lived in Ciudad Bolívar District. From 523 participants of this
district that were invited to participate, only 310 accepted, answered the questionnaire and gave
complete home address information. Due to safety concerns, in 170 out of the 310 participants, the
questionnaires were answered during interviews at the UPA, but the data collected during home
visits about housing construction materials were missing (Figure 2.2). These missing data were
imputed for the final analysis.
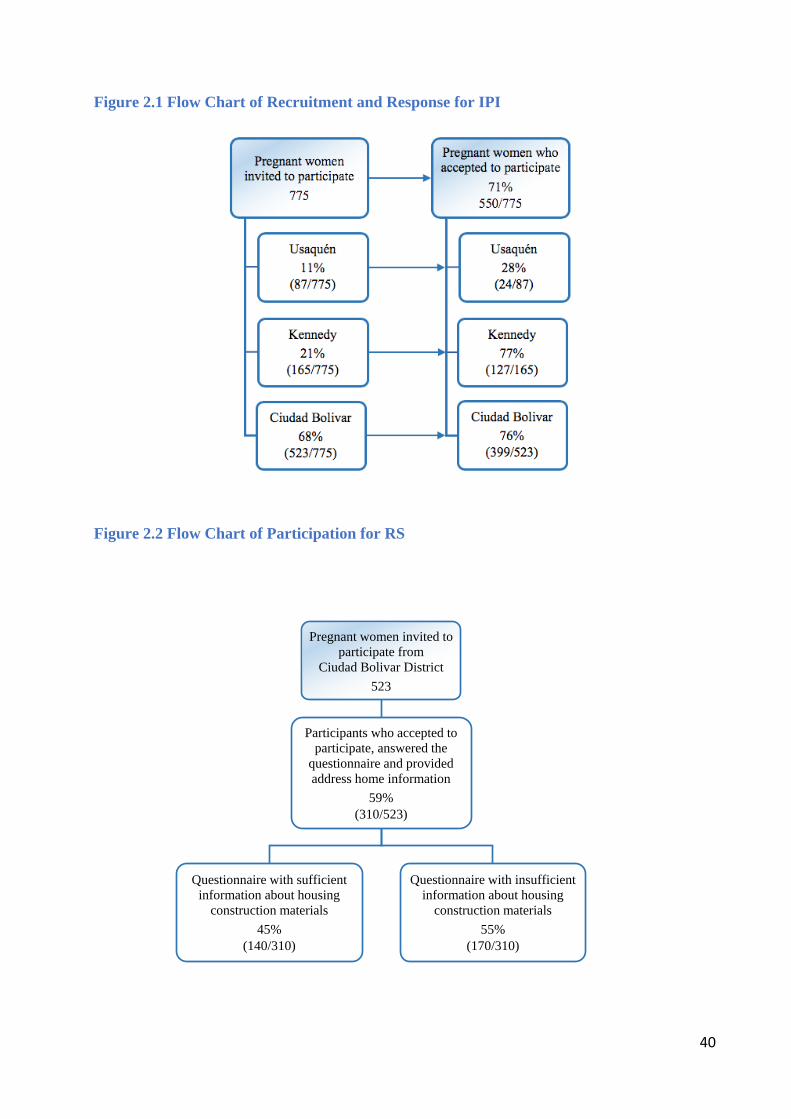
40
Figure 2.1 Flow Chart of Recruitment and Response for IPI
Figure 2.2 Flow Chart of Participation for RS
Pregnant women invited to
participate from Ciudad Bolivar District
523
Participants who accepted to participate, answered the
questionnaire and provided address home information
59%(310/523)
Questionnaire with sufficient information about housing
construction materials45%
(140/310)
Questionnaire with insufficient information about housing
construction materials55%
(170/310)
41
2.4.2. Questionnaire
For the IPI research questions, we created a questionnaire to identify the association between
environmental risk factors and IPI. To do so, we adopted questions about sociodemographic,
household, and hygiene characteristics from the Demographic and Health Surveys (DHS) (232),
which is a validated international survey created by the United States Agency for International
Development (USAID) and implemented by the Inner-City Fund International (ICF-International).
Furthermore, some questions about parity and trimester of pregnancy were taken from Centro
Latinoamericano de Perinatologia/Salud de la Mujer y Reproductiva (CLAP/SMR study) and the
PAHO survey called “Pregnant Women in Primary Health Care” (233). Questions regarding waste
management, exposure to potential parasitic vectors, and household pets, were adopted from the
form “Elementary Family Characteristics” (234), prepared by Salud Distrital de Bogotá (the
Secretary of Health of Bogotá), which is used by health organizations in each of the selected
districts. We also included questions about home address, assigned socioeconomic stratum and
date of the last deworming treatment. Since according to Colombian laws, at least one hematocrit
and hemoglobin test should be performed to each pregnant woman every trimester during regular
antenatal check-ups (123), we obtained a copy of the blood tests done during regular prenatal
check-ups for hematocrit and hemoglobin evaluation, to correlate them with IPI prevalence.
Besides, for the RS section, we also included questions on wheezing without a cold in the past 12
months, ever having asthma, a physician diagnosis of asthma or nasal allergy, including rhinitis.
The questions used were adopted from the ECRHS (235).
In order to improve the clarity, comprehension, and duration of the survey, a pilot survey was
conducted by three fifth-year medical students from Universidad del Rosario, Bogotá, who were
trained to apply the survey by two researchers (Angela Espinosa and Angela Pinzon). Pilot
interviews were carried out by the medical students to ten volunteer pregnant women in the district
of Usaquén, Bogotá. Once they gave their informed consent, these pregnant women were
interviewed and not included as participants in the study. Based on their feedback, minor
adjustments were made to the survey, mainly about sociodemographic characteristics. The
questionnaire had four parts: General characteristics of pregnant women, household
characteristics, general characteristics of pregnancy and hygienic habits. (Appendix 2).
42
2.4.3. Parasite detection in stool samples
Each of the pregnant participants provided one or two stool samples, following instructions for
proper and safe collection and preservation. Since the diagnostic sensitivity of the stool sample
examination increases when different diagnostic methods are combined, a “combined microscopy
technique” was used, analyzing each sample not only through direct wet mount microscopy but
also through Ritchie’s formalin-ether concentration. This combined technique can detect
helminths such as A. lumbricoides, T. trichiura, H. nana and hookworms, as well as protozoa
including G. lamblia, B. hominis, E. coli, E. nana and E. histolytica/dispar complex. Using this
combined technique, the reported range to identify nematodes reached sensitivity ranges from
85.7% to 94.7% (236). In addition to combining detectin methods, diagnostic sensitivity also
improves when taking more than one independent stool sample. Cartwright et al. (237) reported
increased sensitivity from 75.9% with one sample to 92% with two samples, using stools fixed
with 10% formalin or polyvinyl alcohol. The microscopic test has a higher specificity to detect
protozoa, while the concentration method has more sensitivity to diagnose intestinal helminths
[187].
Similarly, Mendoza et al. (238) reported that G. lamblia identification increased proportionally to
the number of samples analyzed. In places with a high prevalence of intestinal parasites, more than
one stool sample should be enough for a correct diagnosis (237, 239). In this study, two stool
samples were considered adequate for epidemiologic research. In order to improve the diagnosis
technique, a combination of different methods was used (240).
We instructed each participant to collect two serial stool samples during two different days.
Considering the high sensitivity of quantitative Polymerase Chain Reaction (qPCR), this technique
was used to detect parasitic nucleic acids in a sub-group of 50 participants, and compare its
agreement in parasite prevalence with the combined microscopy technique. These samples were
taken from participants residing in Ciudad Bolívar district and were selected chronologically by
order of arrival at the laboratory. Comparison between the two techniques was performed for both
tests in the same participant. Since financial constraints did not allow the use of PCR in all
participants, it was instead used to assess the diagnostic agreement between the molecular and
microscopic techniques. PCR was were carried out at the Microbiology laboratory of Universidad
del Rosario in Bogotá, where DNA was extracted from ethanol-fixed stool samples using a Norgen
Stool DNA Isolation kit (Norgen Biotek Corporation, Thorold, Canada). PCR mixtures were
43
prepared with 2.0 microliters sample DNA, 3.5 microliters of Taqman Mastermix (Applied
Biosystems, Foster City, CA, USA) and 1.5 microliters of parasite-specific primers. The samples
were processed in an Applied Biosystems 7500 Fast Real-Time PCR system for 40 cycles with a
3s denaturation time at 95oC and a 30s-extension time at 60o. The results of the qPCR were
considered negative if the cycle threshold values were higher than 38. The PCR primers used were
reported by Mejia et al. (2013) (241) and Stensvold et al. (2012) (242) as specific for B. hominis,
G. lamblia, Cryptosporidium, E. histolytica, A. duodenale, N. americanus, A. lumbricoides, and T.
trichiura. Positive controls were included for each parasite, as well as a reference G. duodenalis
WB strain. Negative controls included stool samples from healthy non-infested children.
2.4.4. Data Control
1. A pilot test of the questionnaire was conducted.
2. To apply the questionnaire: The principal researcher and local supervisor trained the
research assistants and accompanied them during the first five household visits, and then,
based on the preliminary results of these visits, improved the questionnaire.
3. Stool sample collection: The principal researcher and research assistants explained to each
pregnant woman the correct way of collecting and keeping the stool sample (243). To
accomplish this, a brochure with images and instructions was designed and given to the
participants (Appendix 3).
4. To analyze stool samples: Expert bacteriologists from a national reference lab analyzed the
stool samples, and 10% of samples were re-analyzed by a specialist in microbiology
(Universidad del Rosario). We then evaluated the concordance between both reports.
5. Two research assistants separately made a double data entry. The principal researcher was
responsible for checking and solving discrepancies between both databases. When these
were identified, the principal researcher verified the questionnaire and indicated the correct
answer.
6. Database Storage: Data storage was done in two computers and two flash drives with
password protection.
44
2.5. Variable Definition
2.5.1. IPI
The laboratory reported the presence of any parasite form (trophozoites, cysts, eggs, or larvae)
with the direct and concentration techniques, separately and combined, for each parasite. Based
on these data, we created one dichotomous variable for each parasite. When no parasite form was
reported, the variable was defined as negative and assigned the value = 0. Otherwise, when any
parasite form was reported, the variable was defined as positive and the value = 1 assigned.
After estimating the prevalence of each parasite with each of the techniques, a pooled analysis was
generated with both techniques, creating a combined variable for each parasite. When a parasite
was reported by either technique, the variable for this parasite was defined as positive and assigned
the value = 1.
Following the same pooled procedures, we created three outcome variables: the presence of any
parasite, the presence of any pathogenic parasite, and the presence of more than one parasite
(“polyparasitism”) (244, 245). For each outcome, one compound variable was created. When no
forms of parasites were detected with the combined microscopy technique, the variable was
defined as negative and assigned the value = 0. Otherwise, when parasite forms were detected with
the combined microscopy technique, the variable was defined as positive and the value = 1
assigned.
In the subset of stool samples that were analyzed by qPCR, compound variables were created as
described above. Then, the prevalence for each parasite and any parasite was estimated by
combining the microscopy technique and qPCR to compare agreement between both techniques.
2.5.2. Respiratory Symptoms
We took questions from the ECHRS for assessing RS: wheezing without a cold in the past 12
months OR wheezing or whistling in the chest sometime in the last 12 months (no vs. yes),
physician diagnosis of asthma (no vs. yes) and nasal allergies, including rhinitis (no vs. yes) (Table
2.3).
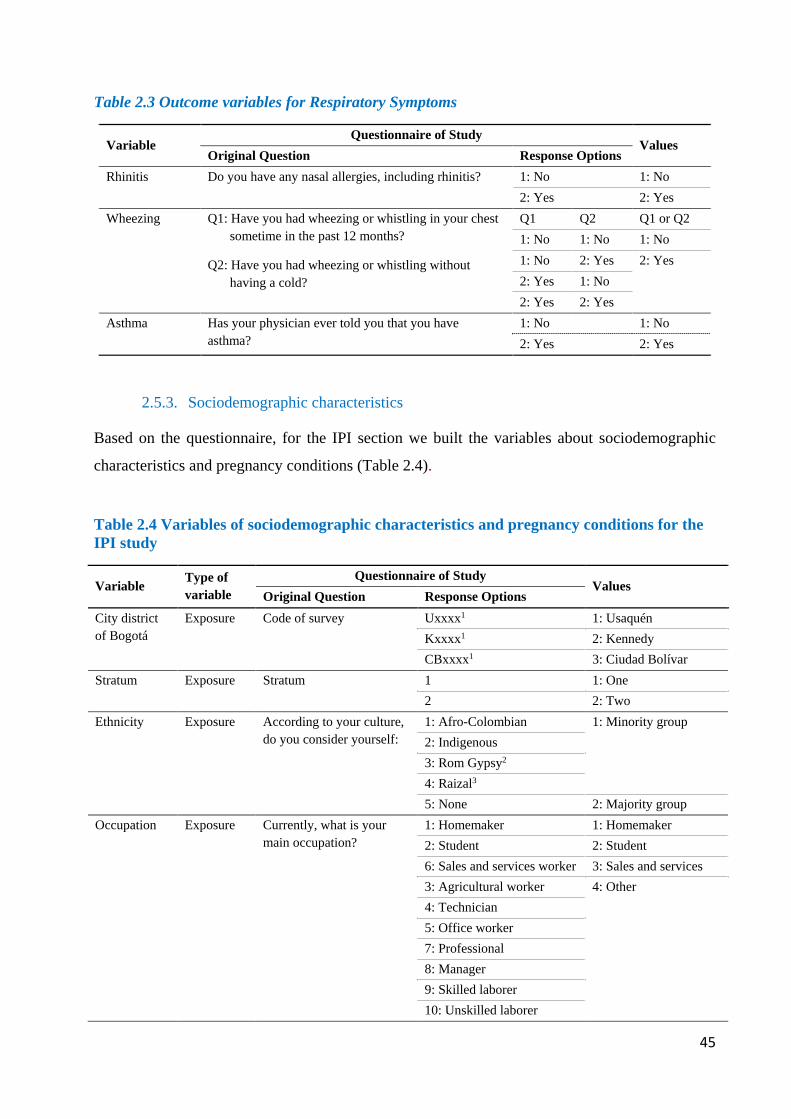
45
Table 2.3 Outcome variables for Respiratory Symptoms
Variable Questionnaire of Study
Values Original Question Response Options
Rhinitis Do you have any nasal allergies, including rhinitis? 1: No 1: No 2: Yes 2: Yes
Wheezing Q1: Have you had wheezing or whistling in your chest sometime in the past 12 months?
Q2: Have you had wheezing or whistling without having a cold?
Q1 Q2 Q1 or Q2 1: No 1: No 1: No 1: No 2: Yes 2: Yes 2: Yes 1: No 2: Yes 2: Yes
Asthma Has your physician ever told you that you have asthma?
1: No 1: No 2: Yes 2: Yes
2.5.3. Sociodemographic characteristics
Based on the questionnaire, for the IPI section we built the variables about sociodemographic
characteristics and pregnancy conditions (Table 2.4).
Table 2.4 Variables of sociodemographic characteristics and pregnancy conditions for the IPI study
Variable Type of variable
Questionnaire of Study Values
Original Question Response Options City district of Bogotá
Exposure Code of survey Uxxxx1 1: Usaquén Kxxxx1 2: Kennedy CBxxxx1 3: Ciudad Bolívar
Stratum Exposure Stratum 1 1: One 2 2: Two
Ethnicity Exposure According to your culture, do you consider yourself:
1: Afro-Colombian 1: Minority group 2: Indigenous 3: Rom Gypsy2 4: Raizal3 5: None 2: Majority group
Occupation Exposure Currently, what is your main occupation?
1: Homemaker 1: Homemaker 2: Student 2: Student 6: Sales and services worker 3: Sales and services 3: Agricultural worker 4: Other 4: Technician 5: Office worker 7: Professional 8: Manager 9: Skilled laborer 10: Unskilled laborer
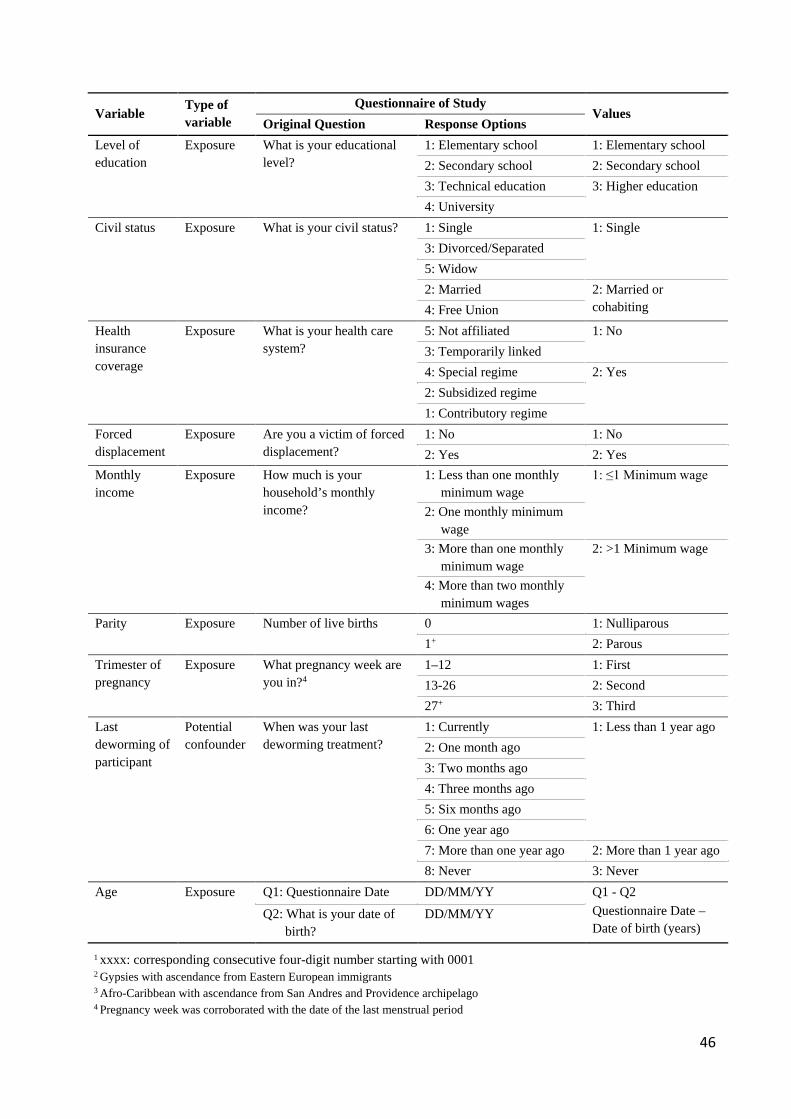
46
Variable Type of variable
Questionnaire of Study Values
Original Question Response Options Level of education
Exposure What is your educational level?
1: Elementary school 1: Elementary school 2: Secondary school 2: Secondary school 3: Technical education 3: Higher education 4: University
Civil status Exposure What is your civil status? 1: Single 1: Single 3: Divorced/Separated 5: Widow 2: Married 2: Married or
cohabiting 4: Free Union Health insurance coverage
Exposure What is your health care system?
5: Not affiliated 1: No 3: Temporarily linked 4: Special regime 2: Yes 2: Subsidized regime 1: Contributory regime
Forced displacement
Exposure Are you a victim of forced displacement?
1: No 1: No 2: Yes 2: Yes
Monthly income
Exposure How much is your household’s monthly income?
1: Less than one monthly minimum wage
1: ≤1 Minimum wage
2: One monthly minimum wage
3: More than one monthly minimum wage
2: >1 Minimum wage
4: More than two monthly minimum wages
Parity Exposure Number of live births 0 1: Nulliparous 1+ 2: Parous
Trimester of pregnancy
Exposure What pregnancy week are you in?4
1–12 1: First 13-26 2: Second 27+ 3: Third
Last deworming of participant
Potential confounder
When was your last deworming treatment?
1: Currently 1: Less than 1 year ago 2: One month ago 3: Two months ago 4: Three months ago 5: Six months ago 6: One year ago 7: More than one year ago 2: More than 1 year ago 8: Never 3: Never
Age Exposure Q1: Questionnaire Date DD/MM/YY Q1 - Q2 Questionnaire Date – Date of birth (years)
Q2: What is your date of birth?
DD/MM/YY
1 xxxx: corresponding consecutive four-digit number starting with 0001 2 Gypsies with ascendance from Eastern European immigrants 3 Afro-Caribbean with ascendance from San Andres and Providence archipelago 4 Pregnancy week was corroborated with the date of the last menstrual period
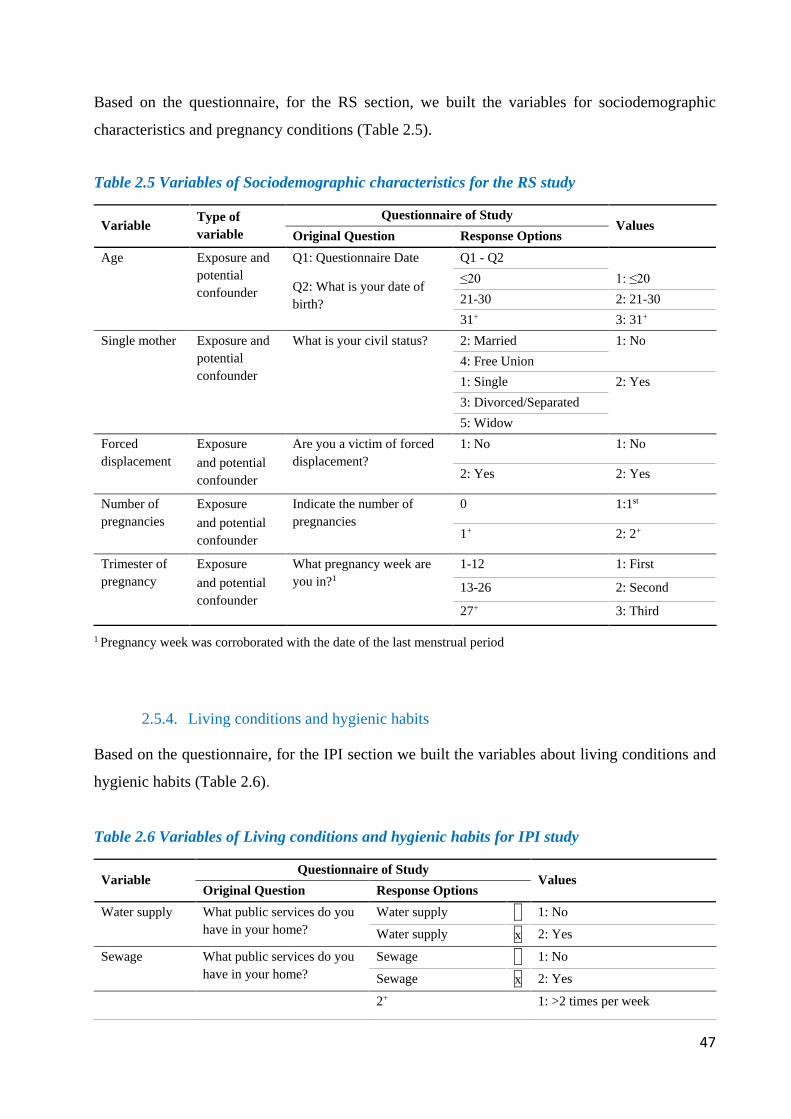
47
Based on the questionnaire, for the RS section, we built the variables for sociodemographic
characteristics and pregnancy conditions (Table 2.5).
Table 2.5 Variables of Sociodemographic characteristics for the RS study
Variable Type of variable
Questionnaire of Study Values
Original Question Response Options Age Exposure and
potential confounder
Q1: Questionnaire Date
Q2: What is your date of birth?
Q1 - Q2 ≤20 1: ≤20 21-30 2: 21-30 31+ 3: 31+
Single mother Exposure and potential confounder
What is your civil status? 2: Married 1: No 4: Free Union 1: Single 2: Yes 3: Divorced/Separated 5: Widow
Forced displacement
Exposure and potential confounder
Are you a victim of forced displacement?
1: No 1: No
2: Yes 2: Yes
Number of pregnancies
Exposure and potential confounder
Indicate the number of pregnancies
0 1:1st
1+ 2: 2+
Trimester of pregnancy
Exposure and potential confounder
What pregnancy week are you in?1
1-12 1: First
13-26 2: Second
27+ 3: Third
1 Pregnancy week was corroborated with the date of the last menstrual period
2.5.4. Living conditions and hygienic habits
Based on the questionnaire, for the IPI section we built the variables about living conditions and
hygienic habits (Table 2.6).
Table 2.6 Variables of Living conditions and hygienic habits for IPI study
Variable Questionnaire of Study
Values Original Question Response Options
Water supply What public services do you have in your home?
Water supply x 1: No
Water supply x 2: Yes
Sewage What public services do you have in your home?
Sewage x 1: No
Sewage x 2: Yes
2+ 1: >2 times per week
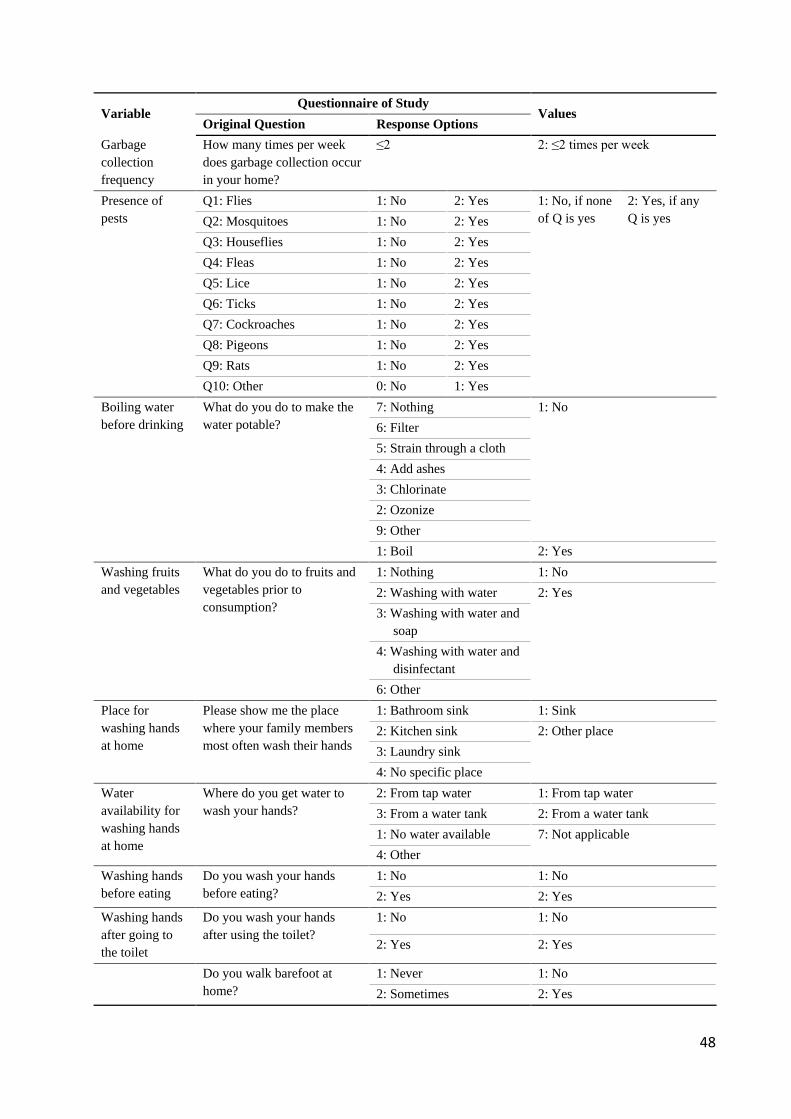
48
Variable Questionnaire of Study
Values Original Question Response Options
Garbage collection frequency
How many times per week does garbage collection occur in your home?
≤2 2: ≤2 times per week
Presence of pests
Q1: Flies 1: No 2: Yes 1: No, if none of Q is yes
2: Yes, if any Q is yes Q2: Mosquitoes 1: No 2: Yes
Q3: Houseflies 1: No 2: Yes Q4: Fleas 1: No 2: Yes Q5: Lice 1: No 2: Yes Q6: Ticks 1: No 2: Yes Q7: Cockroaches 1: No 2: Yes Q8: Pigeons 1: No 2: Yes Q9: Rats 1: No 2: Yes Q10: Other 0: No 1: Yes
Boiling water before drinking
What do you do to make the water potable?
7: Nothing 1: No 6: Filter 5: Strain through a cloth 4: Add ashes 3: Chlorinate 2: Ozonize 9: Other 1: Boil 2: Yes
Washing fruits and vegetables
What do you do to fruits and vegetables prior to consumption?
1: Nothing 1: No 2: Washing with water 2: Yes 3: Washing with water and
soap 4: Washing with water and
disinfectant 6: Other
Place for washing hands at home
Please show me the place where your family members most often wash their hands
1: Bathroom sink 1: Sink 2: Kitchen sink 2: Other place 3: Laundry sink 4: No specific place
Water availability for washing hands at home
Where do you get water to wash your hands?
2: From tap water 1: From tap water 3: From a water tank 2: From a water tank 1: No water available 7: Not applicable 4: Other
Washing hands before eating
Do you wash your hands before eating?
1: No 1: No 2: Yes 2: Yes
Washing hands after going to the toilet
Do you wash your hands after using the toilet?
1: No 1: No
2: Yes 2: Yes
Do you walk barefoot at home?
1: Never 1: No 2: Sometimes 2: Yes
49
Variable Questionnaire of Study
Values Original Question Response Options
Walking barefoot at home
3: Always
All variables of this table are considered exposure variables
2.5.5. Greenness
Greenness was an exposure variable used for the RS section, with geocoded participants’
residences using the Google Maps API. With these geocodes, we assessed the exposure to natural
and green areas around each home address using the NDVI, a satellite image-based vegetation
index. NDVI represents the ratio of the difference between the NIR and RR divided by the sum of
both measures (246-248). Index values of 1.0 indicate dense green vegetation, while values closer
to zero represent built-up concrete urban settings, and index values of -1.0 indicate water. Cloud-
free satellite images from Landsat 5 Thematic Paper (249) taken on April 15, 2017, were used
(Figure 2.4). With this information, an average NDVI was estimated in a 100m radius buffer
around each participants’ address using a 30x30 meter resolution. We chose a 100m radius buffer
because Ciudad Bolívar is densely populated, has a high concentration of population in specific
areas, and is located on a mountainous region. This smaller radius is recommended in studies like
ours, where greenness is assessed along roadsides and in residential locations, and when access
and mobility to settings studied are limited (203). Later in the analysis, access to greenness was
categorized using NDVI quartiles.
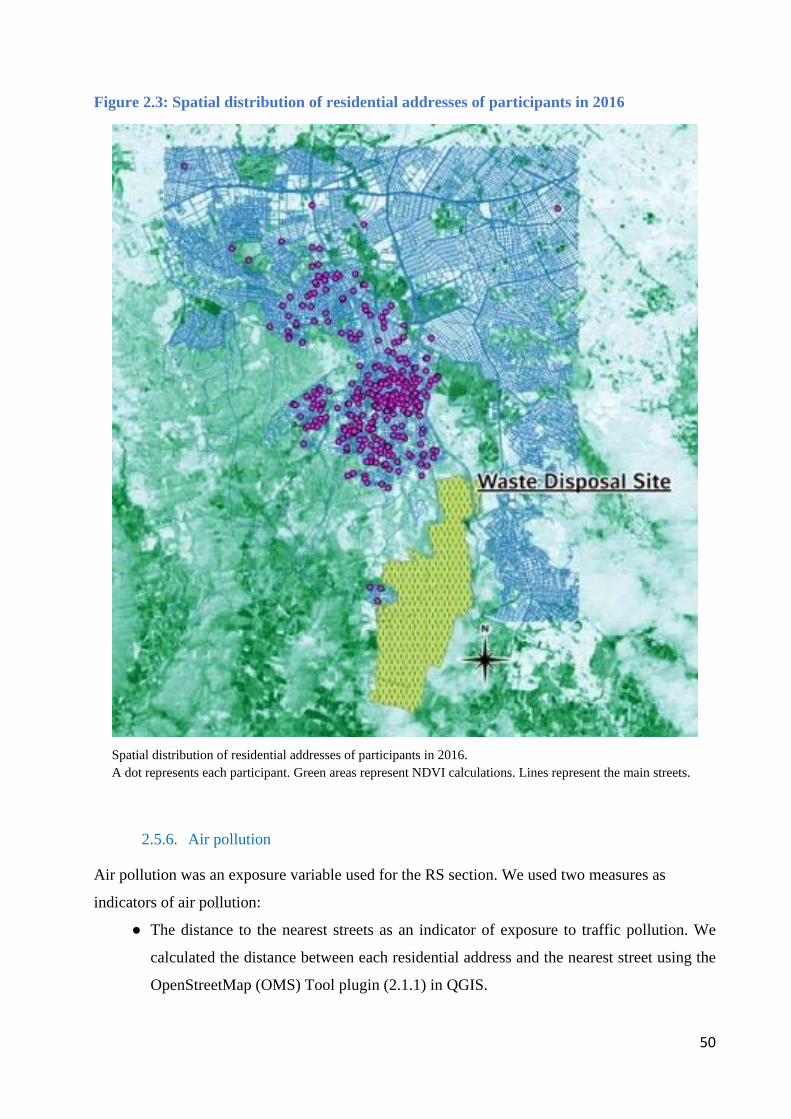
50
Figure 2.3: Spatial distribution of residential addresses of participants in 2016
Spatial distribution of residential addresses of participants in 2016. A dot represents each participant. Green areas represent NDVI calculations. Lines represent the main streets.
2.5.6. Air pollution
Air pollution was an exposure variable used for the RS section. We used two measures as
indicators of air pollution:
● The distance to the nearest streets as an indicator of exposure to traffic pollution. We
calculated the distance between each residential address and the nearest street using the
OpenStreetMap (OMS) Tool plugin (2.1.1) in QGIS.
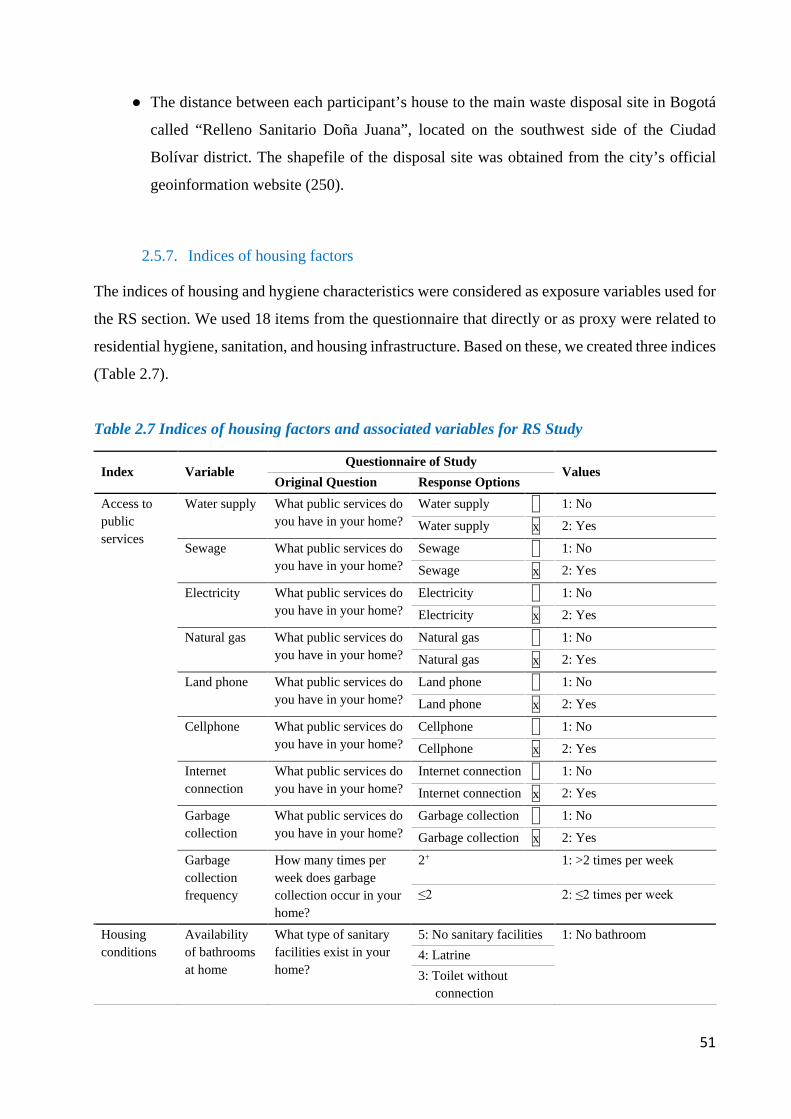
51
● The distance between each participant’s house to the main waste disposal site in Bogotá
called “Relleno Sanitario Doña Juana”, located on the southwest side of the Ciudad
Bolívar district. The shapefile of the disposal site was obtained from the city’s official
geoinformation website (250).
2.5.7. Indices of housing factors
The indices of housing and hygiene characteristics were considered as exposure variables used for
the RS section. We used 18 items from the questionnaire that directly or as proxy were related to
residential hygiene, sanitation, and housing infrastructure. Based on these, we created three indices
(Table 2.7).
Table 2.7 Indices of housing factors and associated variables for RS Study
Index Variable Questionnaire of Study
Values Original Question Response Options
Access to public services
Water supply What public services do you have in your home?
Water supply x 1: No
Water supply x 2: Yes
Sewage What public services do you have in your home?
Sewage x 1: No
Sewage x 2: Yes
Electricity What public services do you have in your home?
Electricity x 1: No
Electricity x 2: Yes
Natural gas What public services do you have in your home?
Natural gas x 1: No
Natural gas x 2: Yes
Land phone What public services do you have in your home?
Land phone x 1: No
Land phone x 2: Yes
Cellphone What public services do you have in your home?
Cellphone x 1: No
Cellphone x 2: Yes
Internet connection
What public services do you have in your home?
Internet connection x 1: No
Internet connection x 2: Yes
Garbage collection
What public services do you have in your home?
Garbage collection x 1: No
Garbage collection x 2: Yes
Garbage collection frequency
How many times per week does garbage collection occur in your home?
2+ 1: >2 times per week
≤2 2: ≤2 times per week
Housing conditions
Availability of bathrooms at home
What type of sanitary facilities exist in your home?
5: No sanitary facilities 1: No bathroom 4: Latrine 3: Toilet without
connection
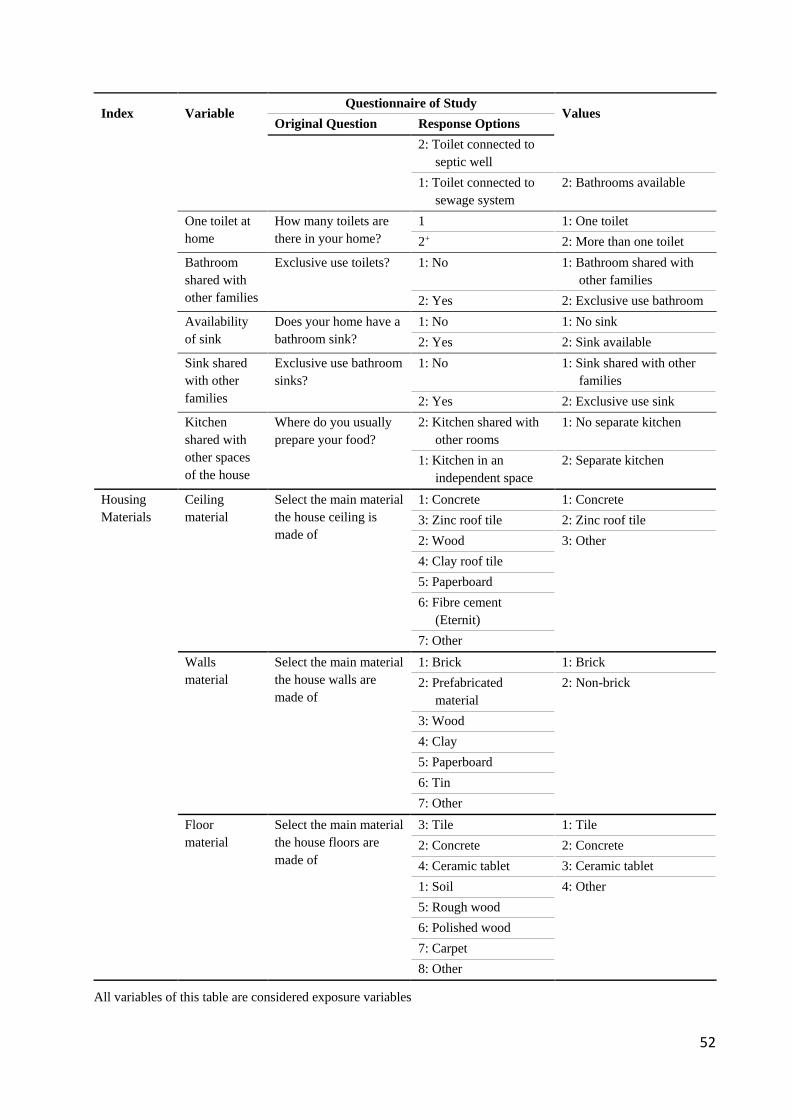
52
Index Variable Questionnaire of Study
Values Original Question Response Options
2: Toilet connected to septic well
1: Toilet connected to sewage system
2: Bathrooms available
One toilet at home
How many toilets are there in your home?
1 1: One toilet 2+ 2: More than one toilet
Bathroom shared with other families
Exclusive use toilets? 1: No 1: Bathroom shared with other families
2: Yes 2: Exclusive use bathroom Availability of sink
Does your home have a bathroom sink?
1: No 1: No sink 2: Yes 2: Sink available
Sink shared with other families
Exclusive use bathroom sinks?
1: No 1: Sink shared with other families
2: Yes 2: Exclusive use sink Kitchen shared with other spaces of the house
Where do you usually prepare your food?
2: Kitchen shared with other rooms
1: No separate kitchen
1: Kitchen in an independent space
2: Separate kitchen
Housing Materials
Ceiling material
Select the main material the house ceiling is made of
1: Concrete 1: Concrete 3: Zinc roof tile 2: Zinc roof tile 2: Wood 3: Other 4: Clay roof tile 5: Paperboard 6: Fibre cement
(Eternit) 7: Other
Walls material
Select the main material the house walls are made of
1: Brick 1: Brick 2: Prefabricated
material 2: Non-brick
3: Wood 4: Clay 5: Paperboard 6: Tin 7: Other
Floor material
Select the main material the house floors are made of
3: Tile 1: Tile 2: Concrete 2: Concrete 4: Ceramic tablet 3: Ceramic tablet 1: Soil 4: Other 5: Rough wood 6: Polished wood 7: Carpet 8: Other
All variables of this table are considered exposure variables
53
The process of creating the indices was:
● Using the R FactoMine package (251) we carried out multifactorial analysis within these
three categories.
● Using the missMDA package (252), we imputed missing data.
● Once the index was obtained, we converted it to a scale from 0 to 100, with higher values
indicating the worst conditions.
● Each index was then dichotomized, using the fourth quartile as the cut-off point.
2.6. Ethical aspects
According to Colombian laws (253), this study was considered to be “without risk”, because no
invasive interventions were performed on the participants. Each participant was asked for written
informed consent (Appendix 4). The project was submitted for review and approved by the Ethics
Committees of Universidad del Rosario (CEI-ABN026-000343) and Ludwig-Maximilians
University (LMU), Munich (231-15).
In Colombia, when research studies include participants under the age of 18, parents or guardians
must sign the informed consent (Appendix 5) and the participants themselves must provide written
consent. In case of single parents, only one signature is necessary. This study followed these
procedures.
To protect the identity of the participants, considering that Colombian Laws demands signature
and name in the informed consent, the research director, as well as the research assistants, signed
a non-disclosure agreement in which they committed to keep the names of the participants
anonymous and to use the information obtained solely for research purposes. The informed consent
forms were kept safe by the research director in a locked cabinet.
The identity of participants was protected by replacing their names with an identification code,
and subsequently using this code for their corresponding questionnaire and stool analysis. A
database with the codes, names, and addresses of each participant was created with the purpose of
notifying them about the results of their stool examination; afterward, the study was carried out
pseudonymously. This information was saved in an Excel file with a password only available to
the principal investigator and the research assistants.
54
2.7. Analysis of results
All data were double entered and corrected for errors. For IPI data analysis was performed using
IBM SPSS Statistics version 24 software (Armonk, NY, USA). Based on the variable definition
for IPI described in the previous section, we estimated the prevalence of each parasite, any parasite,
and polyparasitism. The percentage of agreement between combined microscopy technique and
qPCR was later determined following the formula given by the US Food and Drug Administration
(254):
● The positive agreement percentage was estimated as the ratio of the number of parasites
detected by the combined microscopy technique and identified by qPCR over the total
number of parasites detected by qPCR.
The negative agreement percentage was estimated as the ratio of the number of stool
samples reported as negative for parasites by the combined microscopy technique and
identified by qPCR over the total negative cases detected by qPCR.
Based on outcomes and exposure variables we made univariate, bivariate and multivariate
analysis. Table 3.8 summarizes the analysis done for the IPI section.
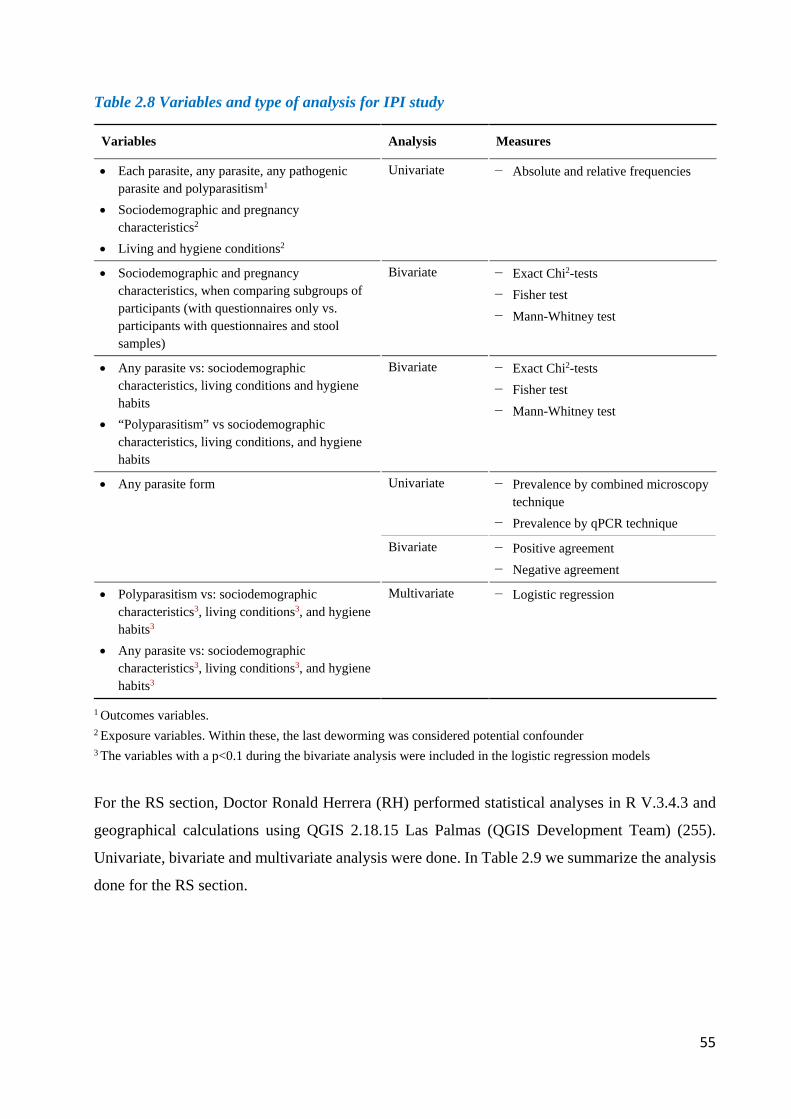
55
Table 2.8 Variables and type of analysis for IPI study
Variables Analysis Measures
• Each parasite, any parasite, any pathogenic parasite and polyparasitism1
• Sociodemographic and pregnancy characteristics2
• Living and hygiene conditions2
Univariate − Absolute and relative frequencies
• Sociodemographic and pregnancy characteristics, when comparing subgroups of participants (with questionnaires only vs. participants with questionnaires and stool samples)
Bivariate − Exact Chi2-tests − Fisher test − Mann-Whitney test
• Any parasite vs: sociodemographic characteristics, living conditions and hygiene habits
• “Polyparasitism” vs sociodemographic characteristics, living conditions, and hygiene habits
Bivariate − Exact Chi2-tests − Fisher test − Mann-Whitney test
• Any parasite form Univariate − Prevalence by combined microscopy technique
− Prevalence by qPCR technique
Bivariate − Positive agreement − Negative agreement
• Polyparasitism vs: sociodemographic characteristics3, living conditions3, and hygiene habits3
• Any parasite vs: sociodemographic characteristics3, living conditions3, and hygiene habits3
Multivariate − Logistic regression
1 Outcomes variables. 2 Exposure variables. Within these, the last deworming was considered potential confounder
3 The variables with a p<0.1 during the bivariate analysis were included in the logistic regression models
For the RS section, Doctor Ronald Herrera (RH) performed statistical analyses in R V.3.4.3 and
geographical calculations using QGIS 2.18.15 Las Palmas (QGIS Development Team) (255).
Univariate, bivariate and multivariate analysis were done. In Table 2.9 we summarize the analysis
done for the RS section.
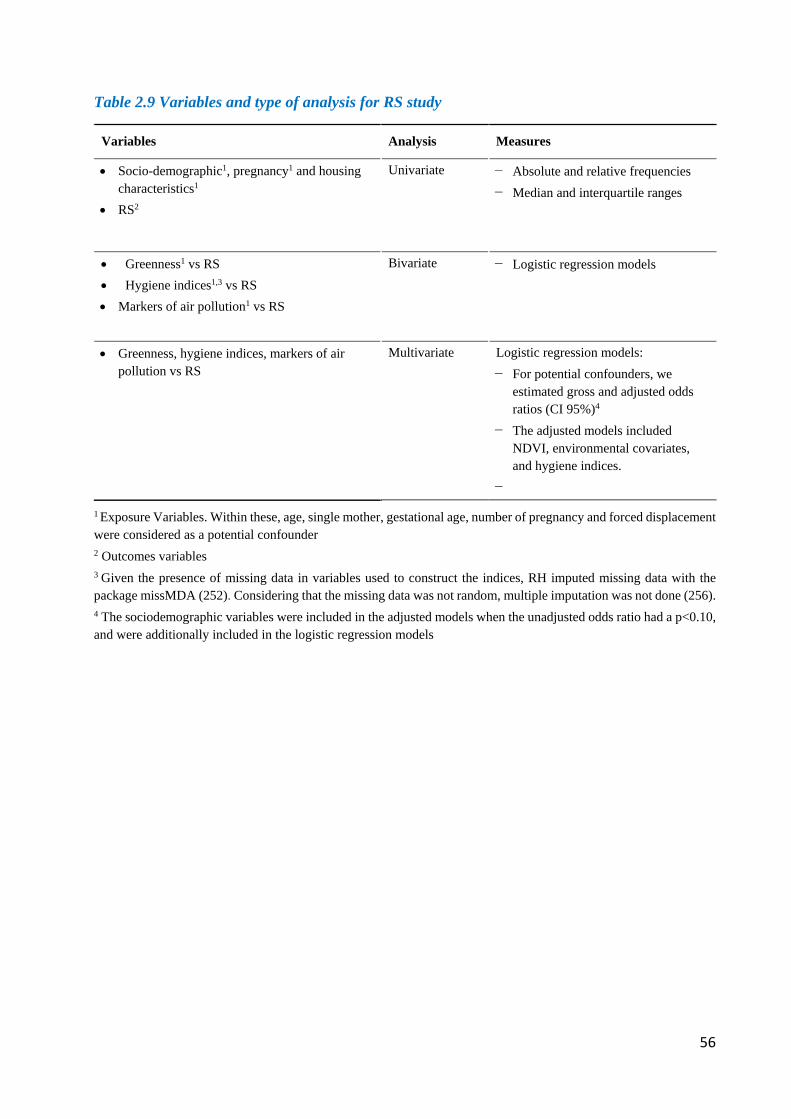
56
Table 2.9 Variables and type of analysis for RS study
Variables Analysis Measures
• Socio-demographic1, pregnancy1 and housing characteristics1
• RS2
Univariate − Absolute and relative frequencies − Median and interquartile ranges
• Greenness1 vs RS • Hygiene indices1,3 vs RS • Markers of air pollution1 vs RS
Bivariate − Logistic regression models
• Greenness, hygiene indices, markers of air pollution vs RS
Multivariate Logistic regression models: − For potential confounders, we
estimated gross and adjusted odds ratios (CI 95%)4
− The adjusted models included NDVI, environmental covariates, and hygiene indices.
−
1 Exposure Variables. Within these, age, single mother, gestational age, number of pregnancy and forced displacement were considered as a potential confounder
2 Outcomes variables
3 Given the presence of missing data in variables used to construct the indices, RH imputed missing data with the package missMDA (252). Considering that the missing data was not random, multiple imputation was not done (256). 4 The sociodemographic variables were included in the adjusted models when the unadjusted odds ratio had a p<0.10, and were additionally included in the logistic regression models
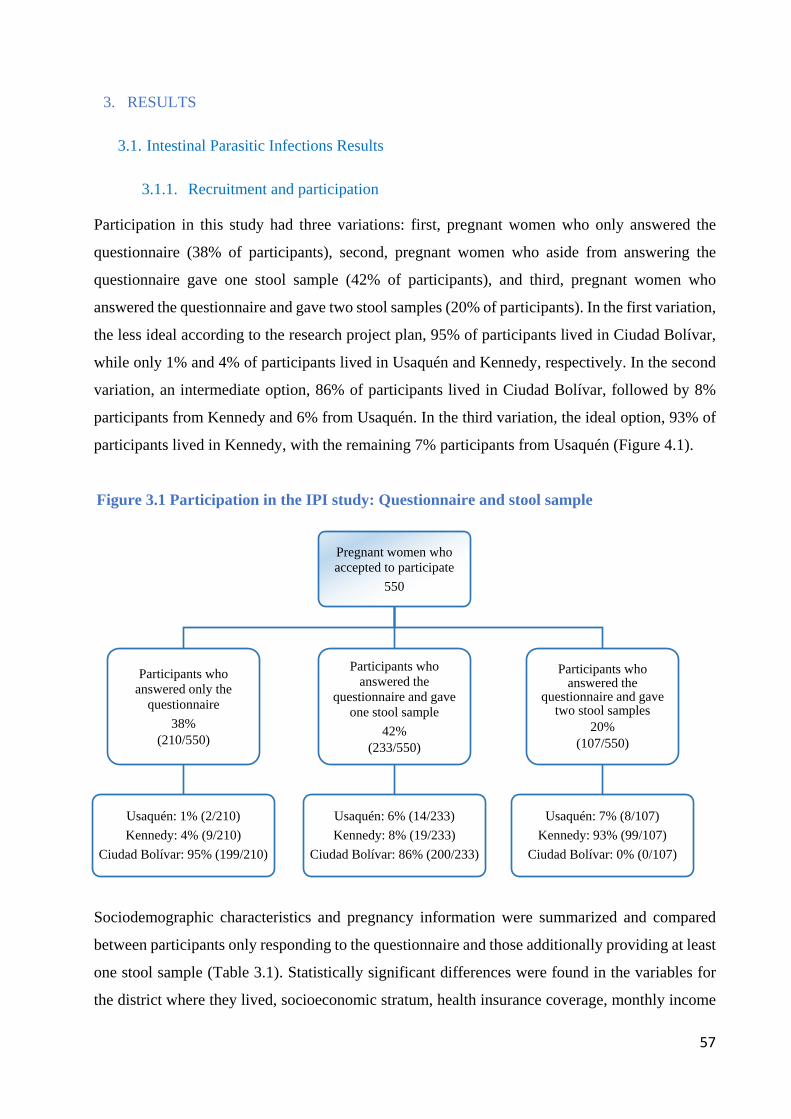
57
3. RESULTS
3.1. Intestinal Parasitic Infections Results
3.1.1. Recruitment and participation
Participation in this study had three variations: first, pregnant women who only answered the
questionnaire (38% of participants), second, pregnant women who aside from answering the
questionnaire gave one stool sample (42% of participants), and third, pregnant women who
answered the questionnaire and gave two stool samples (20% of participants). In the first variation,
the less ideal according to the research project plan, 95% of participants lived in Ciudad Bolívar,
while only 1% and 4% of participants lived in Usaquén and Kennedy, respectively. In the second
variation, an intermediate option, 86% of participants lived in Ciudad Bolívar, followed by 8%
participants from Kennedy and 6% from Usaquén. In the third variation, the ideal option, 93% of
participants lived in Kennedy, with the remaining 7% participants from Usaquén (Figure 4.1).
Figure 3.1 Participation in the IPI study: Questionnaire and stool sample
Sociodemographic characteristics and pregnancy information were summarized and compared
between participants only responding to the questionnaire and those additionally providing at least
one stool sample (Table 3.1). Statistically significant differences were found in the variables for
the district where they lived, socioeconomic stratum, health insurance coverage, monthly income
Pregnant women who accepted to participate
550
Participants who answered only the
questionnaire38%
(210/550)
Usaquén: 1% (2/210)Kennedy: 4% (9/210)
Ciudad Bolívar: 95% (199/210)
Participants who answered the
questionnaire and gave one stool sample
42%(233/550)
Usaquén: 6% (14/233)Kennedy: 8% (19/233)
Ciudad Bolívar: 86% (200/233)
Participants who answered the
questionnaire and gave two stool samples
20%(107/550)
Usaquén: 7% (8/107)Kennedy: 93% (99/107)
Ciudad Bolívar: 0% (0/107)
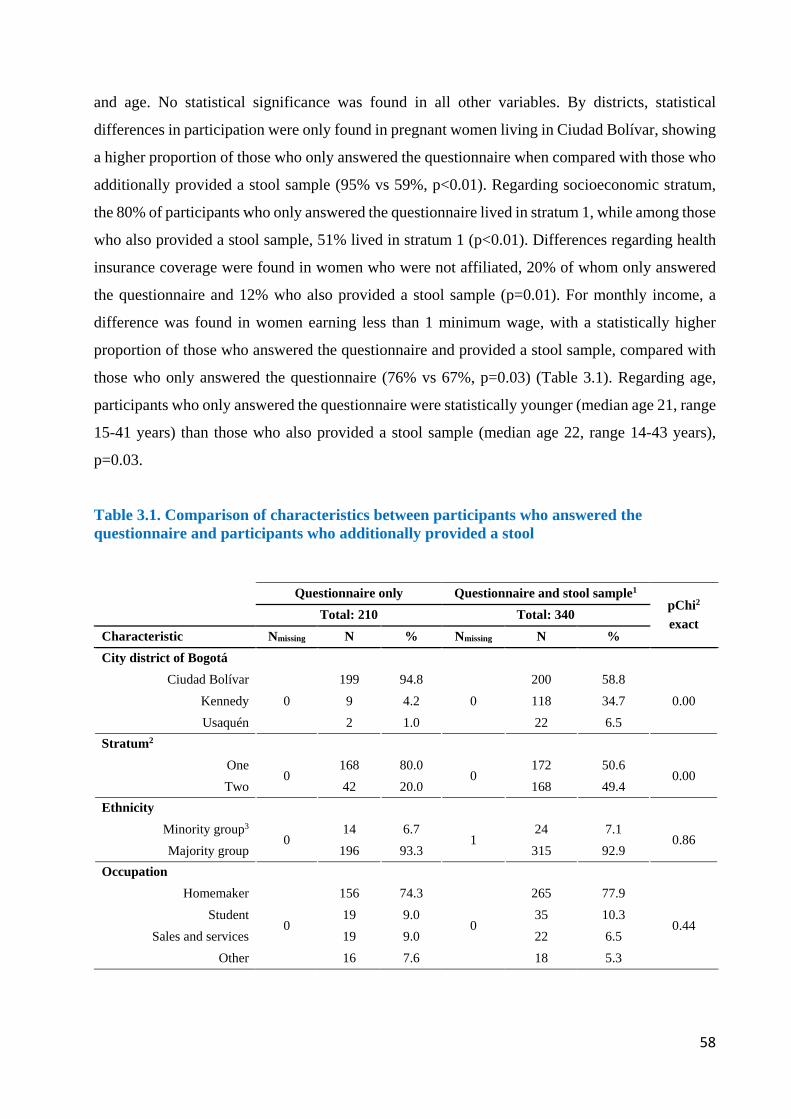
58
and age. No statistical significance was found in all other variables. By districts, statistical
differences in participation were only found in pregnant women living in Ciudad Bolívar, showing
a higher proportion of those who only answered the questionnaire when compared with those who
additionally provided a stool sample (95% vs 59%, p<0.01). Regarding socioeconomic stratum,
the 80% of participants who only answered the questionnaire lived in stratum 1, while among those
who also provided a stool sample, 51% lived in stratum 1 (p<0.01). Differences regarding health
insurance coverage were found in women who were not affiliated, 20% of whom only answered
the questionnaire and 12% who also provided a stool sample (p=0.01). For monthly income, a
difference was found in women earning less than 1 minimum wage, with a statistically higher
proportion of those who answered the questionnaire and provided a stool sample, compared with
those who only answered the questionnaire (76% vs 67%, p=0.03) (Table 3.1). Regarding age,
participants who only answered the questionnaire were statistically younger (median age 21, range
15-41 years) than those who also provided a stool sample (median age 22, range 14-43 years),
p=0.03.
Table 3.1. Comparison of characteristics between participants who answered the questionnaire and participants who additionally provided a stool
Questionnaire only Questionnaire and stool sample1 pChi2
exact Total: 210 Total: 340 Characteristic Nmissing N % Nmissing N % City district of Bogotá
Ciudad Bolívar 0
199 94.8 0
200 58.8 0.00 Kennedy 9 4.2 118 34.7
Usaquén 2 1.0 22 6.5 Stratum2
One 0
168 80.0 0
172 50.6 0.00
Two 42 20.0 168 49.4 Ethnicity
Minority group3 0
14 6.7 1
24 7.1 0.86
Majority group 196 93.3 315 92.9 Occupation
Homemaker
0
156 74.3
0
265 77.9
0.44 Student 19 9.0 35 10.3
Sales and services 19 9.0 22 6.5 Other 16 7.6 18 5.3
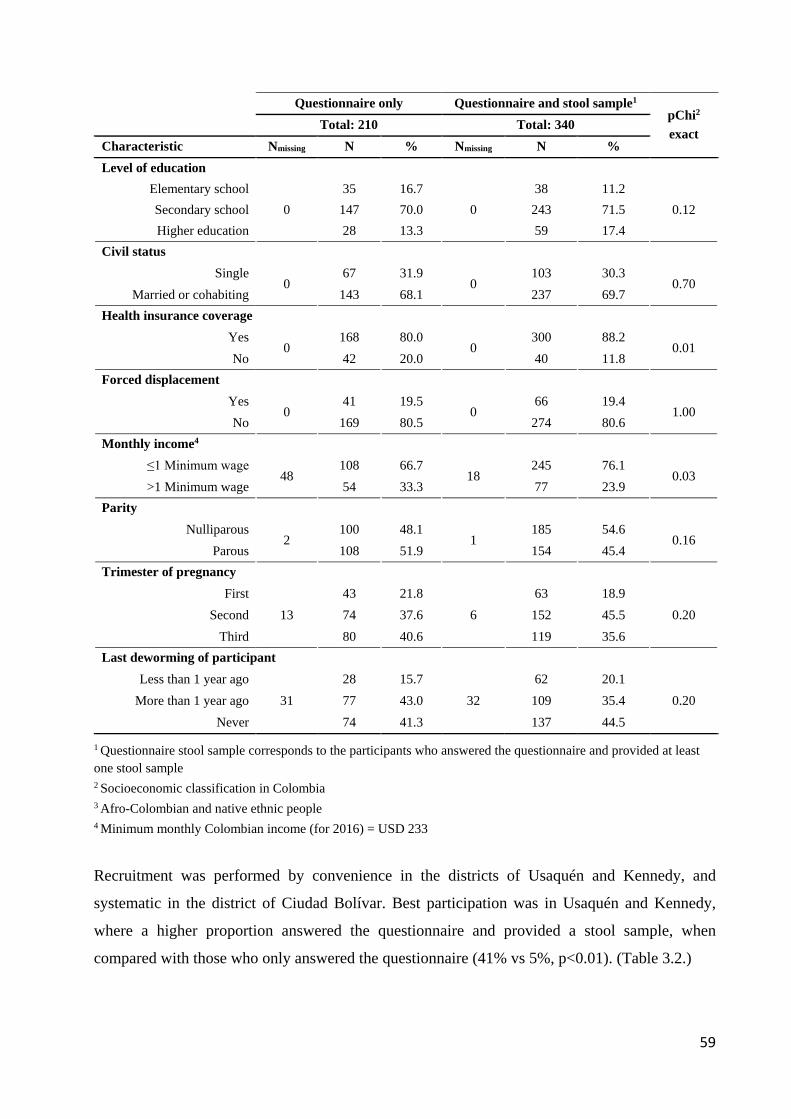
59
Questionnaire only Questionnaire and stool sample1 pChi2
exact Total: 210 Total: 340 Characteristic Nmissing N % Nmissing N % Level of education
Elementary school 0
35 16.7 0
38 11.2 0.12 Secondary school 147 70.0 243 71.5
Higher education 28 13.3 59 17.4 Civil status
Single 0
67 31.9 0
103 30.3 0.70
Married or cohabiting 143 68.1 237 69.7 Health insurance coverage
Yes 0
168 80.0 0
300 88.2 0.01
No 42 20.0 40 11.8 Forced displacement
Yes 0
41 19.5 0
66 19.4 1.00
No 169 80.5 274 80.6 Monthly income4
≤1 Minimum wage 48
108 66.7 18
245 76.1 0.03
>1 Minimum wage 54 33.3 77 23.9 Parity
Nulliparous 2
100 48.1 1
185 54.6 0.16
Parous 108 51.9 154 45.4 Trimester of pregnancy
First 13
43 21.8 6
63 18.9 0.20 Second 74 37.6 152 45.5
Third 80 40.6 119 35.6 Last deworming of participant
Less than 1 year ago 31
28 15.7 32
62 20.1 0.20 More than 1 year ago 77 43.0 109 35.4
Never 74 41.3 137 44.5
1 Questionnaire stool sample corresponds to the participants who answered the questionnaire and provided at least one stool sample 2 Socioeconomic classification in Colombia 3 Afro-Colombian and native ethnic people 4 Minimum monthly Colombian income (for 2016) = USD 233
Recruitment was performed by convenience in the districts of Usaquén and Kennedy, and
systematic in the district of Ciudad Bolívar. Best participation was in Usaquén and Kennedy,
where a higher proportion answered the questionnaire and provided a stool sample, when
compared with those who only answered the questionnaire (41% vs 5%, p<0.01). (Table 3.2.)
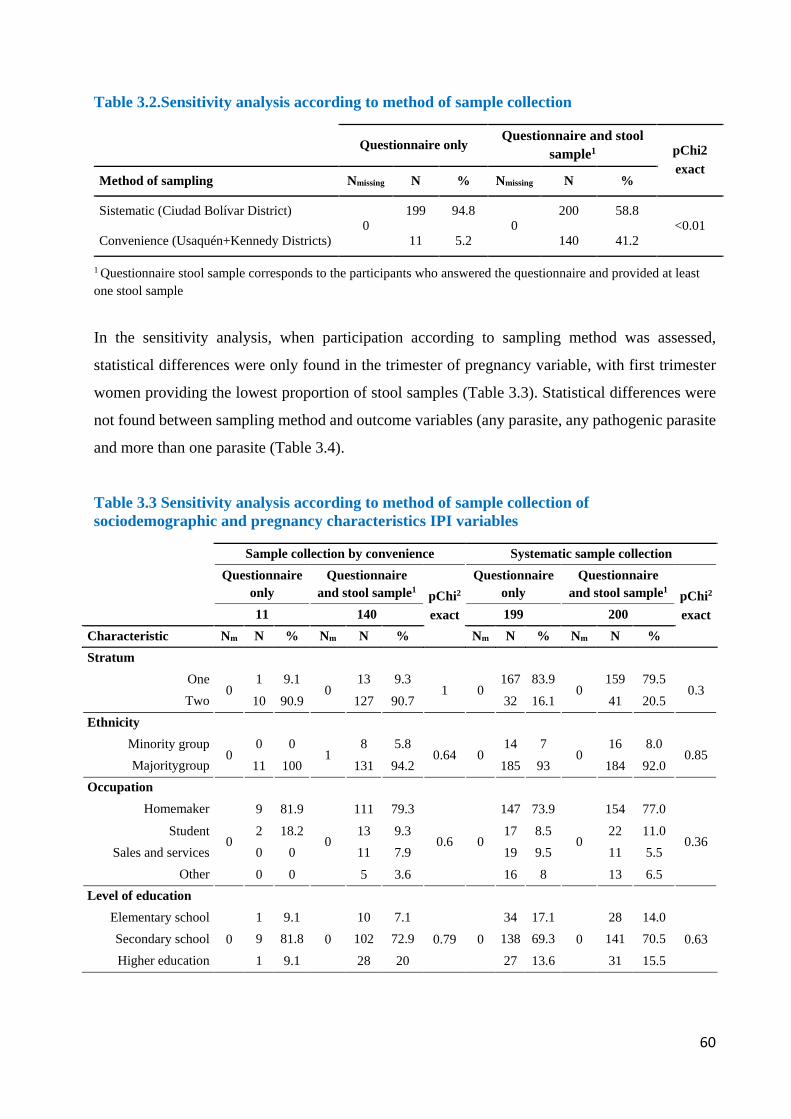
60
Table 3.2.Sensitivity analysis according to method of sample collection
Questionnaire only Questionnaire and stool
sample1 pChi2 exact
Method of sampling Nmissing N % Nmissing N %
Sistematic (Ciudad Bolívar District) 0
199 94.8 0
200 58.8 <0.01
Convenience (Usaquén+Kennedy Districts) 11 5.2 140 41.2
1 Questionnaire stool sample corresponds to the participants who answered the questionnaire and provided at least one stool sample
In the sensitivity analysis, when participation according to sampling method was assessed,
statistical differences were only found in the trimester of pregnancy variable, with first trimester
women providing the lowest proportion of stool samples (Table 3.3). Statistical differences were
not found between sampling method and outcome variables (any parasite, any pathogenic parasite
and more than one parasite (Table 3.4).
Table 3.3 Sensitivity analysis according to method of sample collection of sociodemographic and pregnancy characteristics IPI variables
Sample collection by convenience Systematic sample collection Questionnaire
only Questionnaire
and stool sample1 pChi2
exact
Questionnaire only
Questionnaire and stool sample1 pChi2
exact 11 140 199 200 Characteristic Nm N % Nm N % Nm N % Nm N % Stratum
One 0
1 9.1 0
13 9.3 1 0
167 83.9 0
159 79.5 0.3
Two 10 90.9 127 90.7 32 16.1 41 20.5 Ethnicity
Minority group 0
0 0 1
8 5.8 0.64 0
14 7 0
16 8.0 0.85
Majoritygroup 11 100 131 94.2 185 93 184 92.0 Occupation
Homemaker
0
9 81.9
0
111 79.3
0.6 0
147 73.9
0
154 77.0
0.36 Student 2 18.2 13 9.3 17 8.5 22 11.0
Sales and services 0 0 11 7.9 19 9.5 11 5.5 Other 0 0 5 3.6 16 8 13 6.5
Level of education
Elementary school 0
1 9.1 0
10 7.1 0.79 0
34 17.1 0
28 14.0 0.63 Secondary school 9 81.8 102 72.9 138 69.3 141 70.5
Higher education 1 9.1 28 20 27 13.6 31 15.5
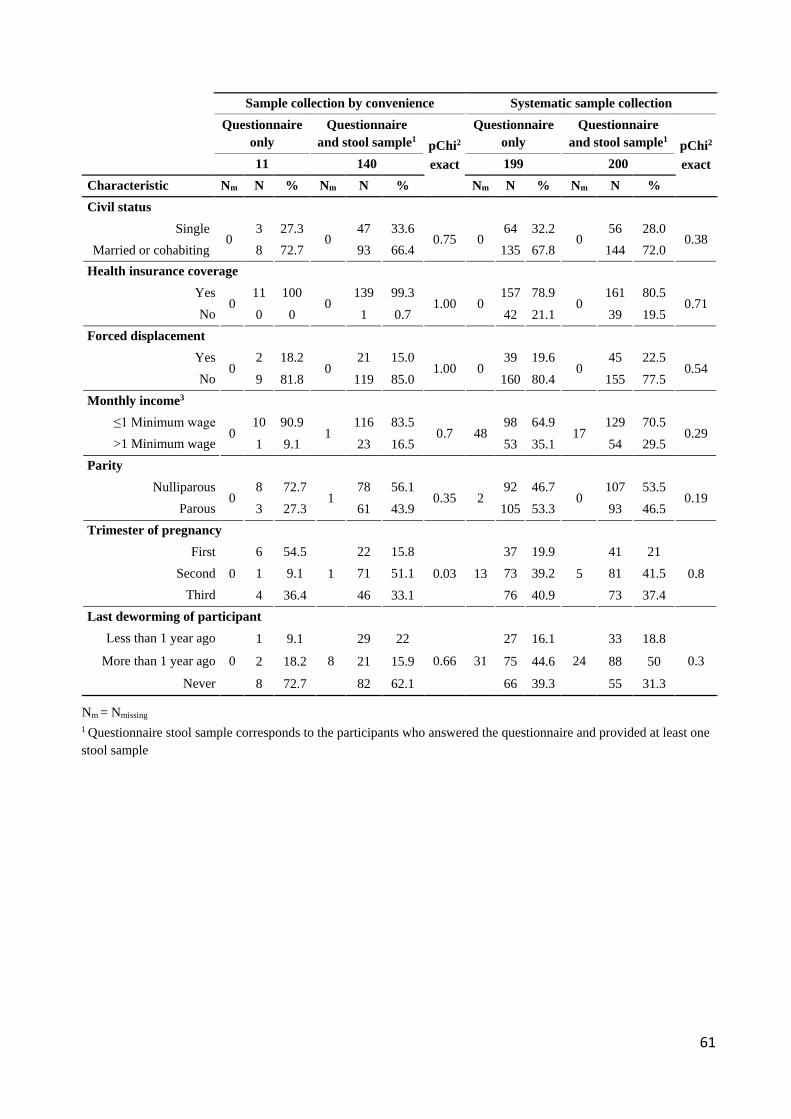
61
Sample collection by convenience Systematic sample collection Questionnaire
only Questionnaire
and stool sample1 pChi2
exact
Questionnaire only
Questionnaire and stool sample1 pChi2
exact 11 140 199 200 Characteristic Nm N % Nm N % Nm N % Nm N % Civil status
Single 0
3 27.3 0
47 33.6 0.75 0
64 32.2 0
56 28.0 0.38
Married or cohabiting 8 72.7 93 66.4 135 67.8 144 72.0 Health insurance coverage
Yes 0
11 100 0
139 99.3 1.00 0
157 78.9 0
161 80.5 0.71
No 0 0 1 0.7 42 21.1 39 19.5 Forced displacement
Yes 0
2 18.2 0
21 15.0 1.00 0
39 19.6 0
45 22.5 0.54
No 9 81.8 119 85.0 160 80.4 155 77.5 Monthly income3
≤1 Minimum wage 0
10 90.9 1
116 83.5 0.7 48
98 64.9 17
129 70.5 0.29
>1 Minimum wage 1 9.1 23 16.5 53 35.1 54 29.5 Parity
Nulliparous 0
8 72.7 1
78 56.1 0.35 2
92 46.7 0
107 53.5 0.19
Parous 3 27.3 61 43.9 105 53.3 93 46.5 Trimester of pregnancy
First 0
6 54.5 1
22 15.8 0.03 13
37 19.9 5
41 21 0.8 Second 1 9.1 71 51.1 73 39.2 81 41.5
Third 4 36.4 46 33.1 76 40.9 73 37.4 Last deworming of participant
Less than 1 year ago
0
1 9.1
8
29 22
0.66 31
27 16.1
24
33 18.8
0.3 More than 1 year ago 2 18.2 21 15.9 75 44.6 88 50 Never 8 72.7 82 62.1 66 39.3 55 31.3
Nm = Nmissing 1 Questionnaire stool sample corresponds to the participants who answered the questionnaire and provided at least one stool sample
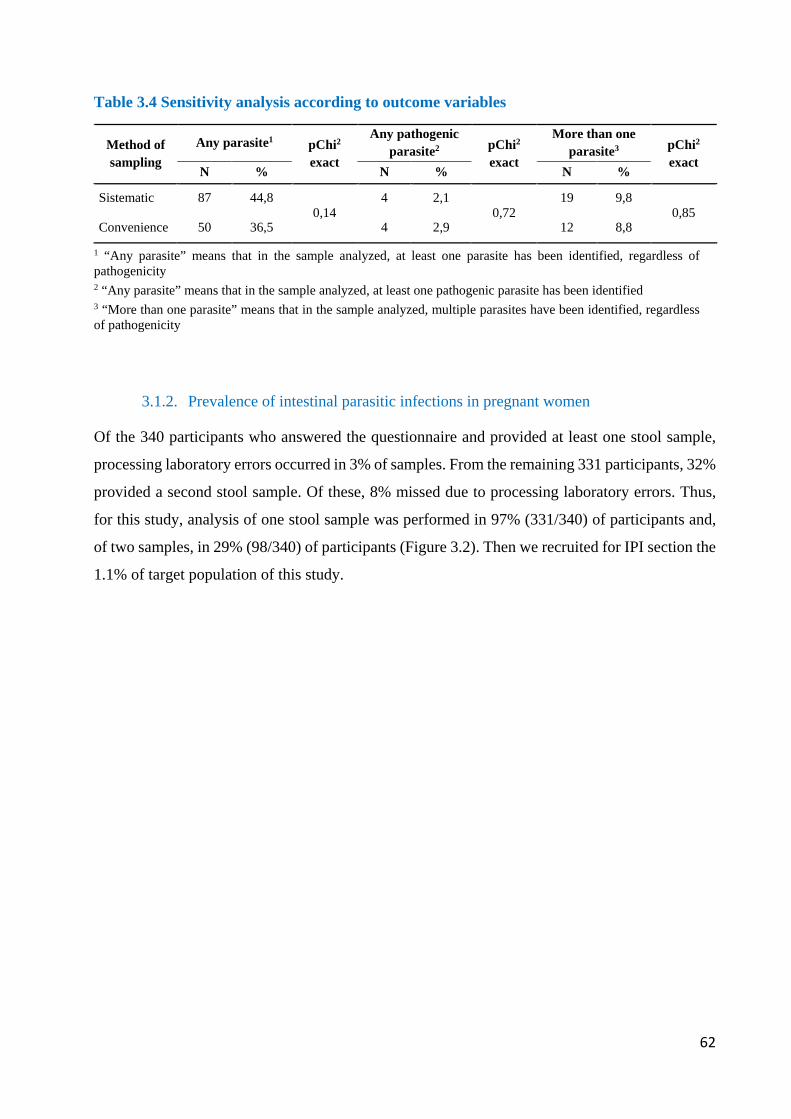
62
Table 3.4 Sensitivity analysis according to outcome variables
Method of sampling
Any parasite1 pChi2 exact
Any pathogenic parasite2 pChi2
exact
More than one parasite3 pChi2
exact N % N % N %
Sistematic 87 44,8 0,14
4 2,1 0,72
19 9,8 0,85
Convenience 50 36,5 4 2,9 12 8,8
1 “Any parasite” means that in the sample analyzed, at least one parasite has been identified, regardless of pathogenicity 2 “Any parasite” means that in the sample analyzed, at least one pathogenic parasite has been identified 3 “More than one parasite” means that in the sample analyzed, multiple parasites have been identified, regardless of pathogenicity
3.1.2. Prevalence of intestinal parasitic infections in pregnant women
Of the 340 participants who answered the questionnaire and provided at least one stool sample,
processing laboratory errors occurred in 3% of samples. From the remaining 331 participants, 32%
provided a second stool sample. Of these, 8% missed due to processing laboratory errors. Thus,
for this study, analysis of one stool sample was performed in 97% (331/340) of participants and,
of two samples, in 29% (98/340) of participants (Figure 3.2). Then we recruited for IPI section the
1.1% of target population of this study.
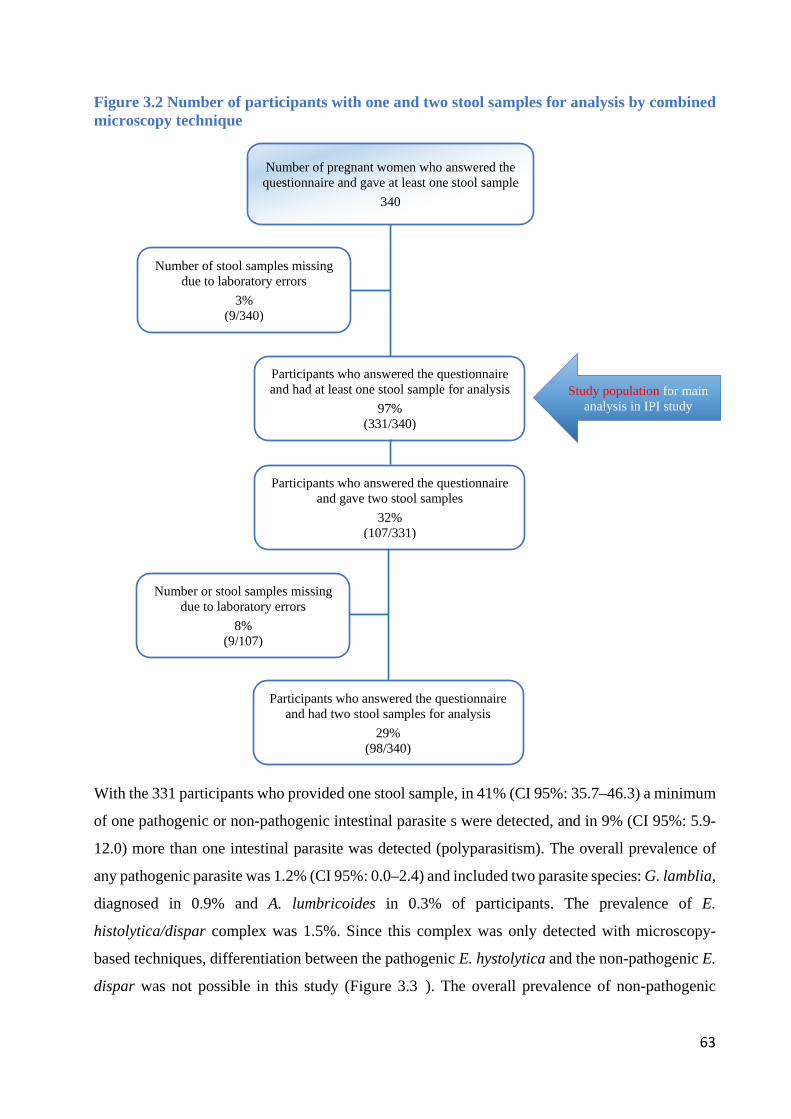
63
Figure 3.2 Number of participants with one and two stool samples for analysis by combined microscopy technique
With the 331 participants who provided one stool sample, in 41% (CI 95%: 35.7–46.3) a minimum
of one pathogenic or non-pathogenic intestinal parasite s were detected, and in 9% (CI 95%: 5.9-
12.0) more than one intestinal parasite was detected (polyparasitism). The overall prevalence of
any pathogenic parasite was 1.2% (CI 95%: 0.0–2.4) and included two parasite species: G. lamblia,
diagnosed in 0.9% and A. lumbricoides in 0.3% of participants. The prevalence of E.
histolytica/dispar complex was 1.5%. Since this complex was only detected with microscopy-
based techniques, differentiation between the pathogenic E. hystolytica and the non-pathogenic E.
dispar was not possible in this study (Figure 3.34). The overall prevalence of non-pathogenic
Number of pregnant women who answered the questionnaire and gave at least one stool sample
340
Number of stool samples missing due to laboratory errors
3% (9/340)
Participants who answered the questionnaire and had at least one stool sample for analysis
97% (331/340)
Participants who answered the questionnaire and gave two stool samples
32% (107/331)
Number or stool samples missing due to laboratory errors
8% (9/107)
Participants who answered the questionnaire and had two stool samples for analysis
29% (98/340)
Study population for main analysis in IPI study
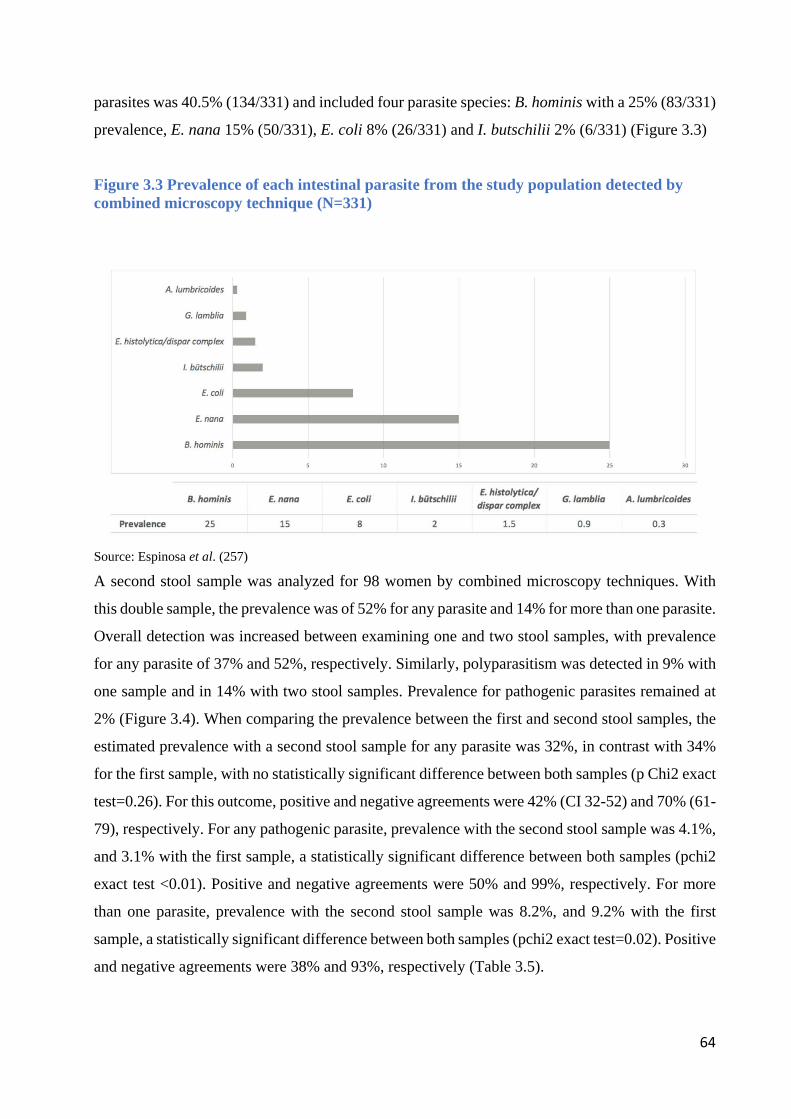
64
parasites was 40.5% (134/331) and included four parasite species: B. hominis with a 25% (83/331)
prevalence, E. nana 15% (50/331), E. coli 8% (26/331) and I. butschilii 2% (6/331) (Figure 3.3)
Figure 3.3 Prevalence of each intestinal parasite from the study population detected by combined microscopy technique (N=331)
Source: Espinosa et al. (257) A second stool sample was analyzed for 98 women by combined microscopy techniques. With
this double sample, the prevalence was of 52% for any parasite and 14% for more than one parasite.
Overall detection was increased between examining one and two stool samples, with prevalence
for any parasite of 37% and 52%, respectively. Similarly, polyparasitism was detected in 9% with
one sample and in 14% with two stool samples. Prevalence for pathogenic parasites remained at
2% (Figure 3.4). When comparing the prevalence between the first and second stool samples, the
estimated prevalence with a second stool sample for any parasite was 32%, in contrast with 34%
for the first sample, with no statistically significant difference between both samples (p Chi2 exact
test=0.26). For this outcome, positive and negative agreements were 42% (CI 32-52) and 70% (61-
79), respectively. For any pathogenic parasite, prevalence with the second stool sample was 4.1%,
and 3.1% with the first sample, a statistically significant difference between both samples (pchi2
exact test <0.01). Positive and negative agreements were 50% and 99%, respectively. For more
than one parasite, prevalence with the second stool sample was 8.2%, and 9.2% with the first
sample, a statistically significant difference between both samples (pchi2 exact test=0.02). Positive
and negative agreements were 38% and 93%, respectively (Table 3.5).
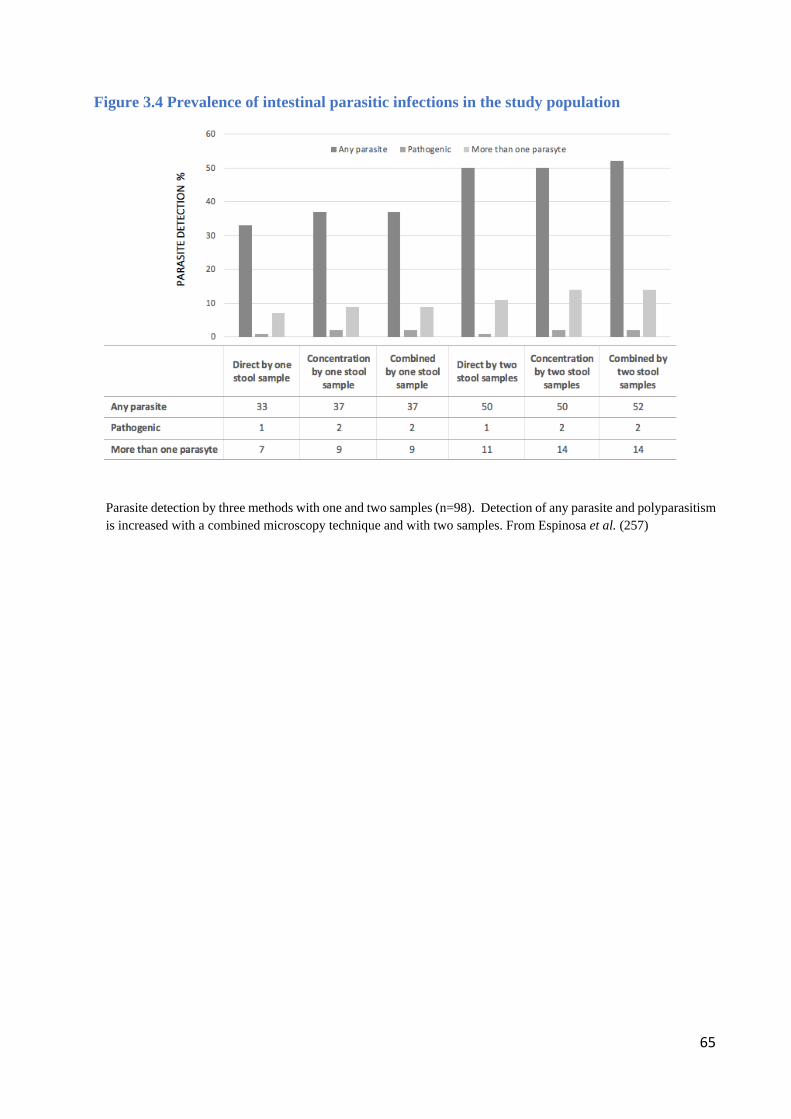
65
Figure 3.4 Prevalence of intestinal parasitic infections in the study population
xxx
Parasite detection by three methods with one and two samples (n=98). Detection of any parasite and polyparasitism is increased with a combined microscopy technique and with two samples. From Espinosa et al. (257)
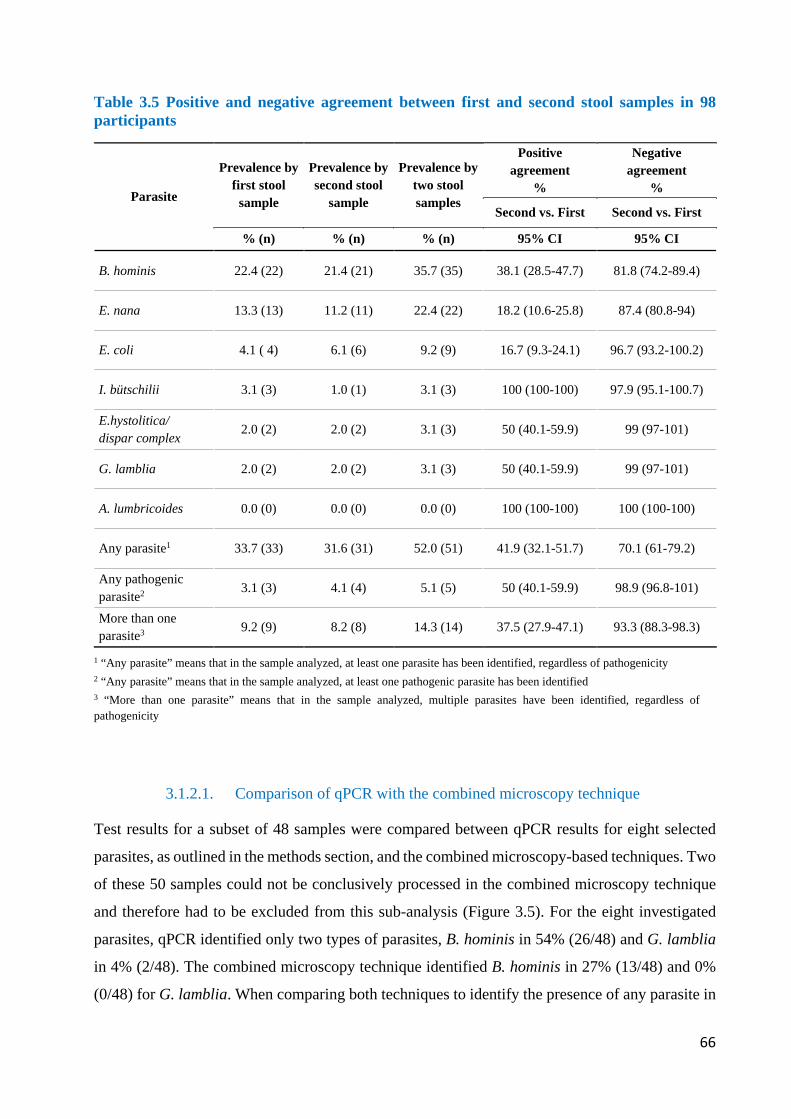
66
Table 3.5 Positive and negative agreement between first and second stool samples in 98 participants
Parasite
Prevalence by first stool
sample
Prevalence by second stool
sample
Prevalence by two stool samples
Positive agreement
%
Negative agreement
%
Second vs. First Second vs. First
% (n) % (n) % (n) 95% CI 95% CI
B. hominis 22.4 (22) 21.4 (21) 35.7 (35) 38.1 (28.5-47.7) 81.8 (74.2-89.4)
E. nana 13.3 (13) 11.2 (11) 22.4 (22) 18.2 (10.6-25.8) 87.4 (80.8-94)
E. coli 4.1 ( 4) 6.1 (6) 9.2 (9) 16.7 (9.3-24.1) 96.7 (93.2-100.2)
I. bütschilii 3.1 (3) 1.0 (1) 3.1 (3) 100 (100-100) 97.9 (95.1-100.7)
E.hystolitica/ dispar complex 2.0 (2) 2.0 (2) 3.1 (3) 50 (40.1-59.9) 99 (97-101)
G. lamblia 2.0 (2) 2.0 (2) 3.1 (3) 50 (40.1-59.9) 99 (97-101)
A. lumbricoides 0.0 (0) 0.0 (0) 0.0 (0) 100 (100-100) 100 (100-100)
Any parasite1 33.7 (33) 31.6 (31) 52.0 (51) 41.9 (32.1-51.7) 70.1 (61-79.2)
Any pathogenic parasite2
3.1 (3) 4.1 (4) 5.1 (5) 50 (40.1-59.9) 98.9 (96.8-101)
More than one parasite3 9.2 (9) 8.2 (8) 14.3 (14) 37.5 (27.9-47.1) 93.3 (88.3-98.3)
1 “Any parasite” means that in the sample analyzed, at least one parasite has been identified, regardless of pathogenicity 2 “Any parasite” means that in the sample analyzed, at least one pathogenic parasite has been identified 3 “More than one parasite” means that in the sample analyzed, multiple parasites have been identified, regardless of pathogenicity
3.1.2.1. Comparison of qPCR with the combined microscopy technique
Test results for a subset of 48 samples were compared between qPCR results for eight selected
parasites, as outlined in the methods section, and the combined microscopy-based techniques. Two
of these 50 samples could not be conclusively processed in the combined microscopy technique
and therefore had to be excluded from this sub-analysis (Figure 3.5). For the eight investigated
parasites, qPCR identified only two types of parasites, B. hominis in 54% (26/48) and G. lamblia
in 4% (2/48). The combined microscopy technique identified B. hominis in 27% (13/48) and 0%
(0/48) for G. lamblia. When comparing both techniques to identify the presence of any parasite in
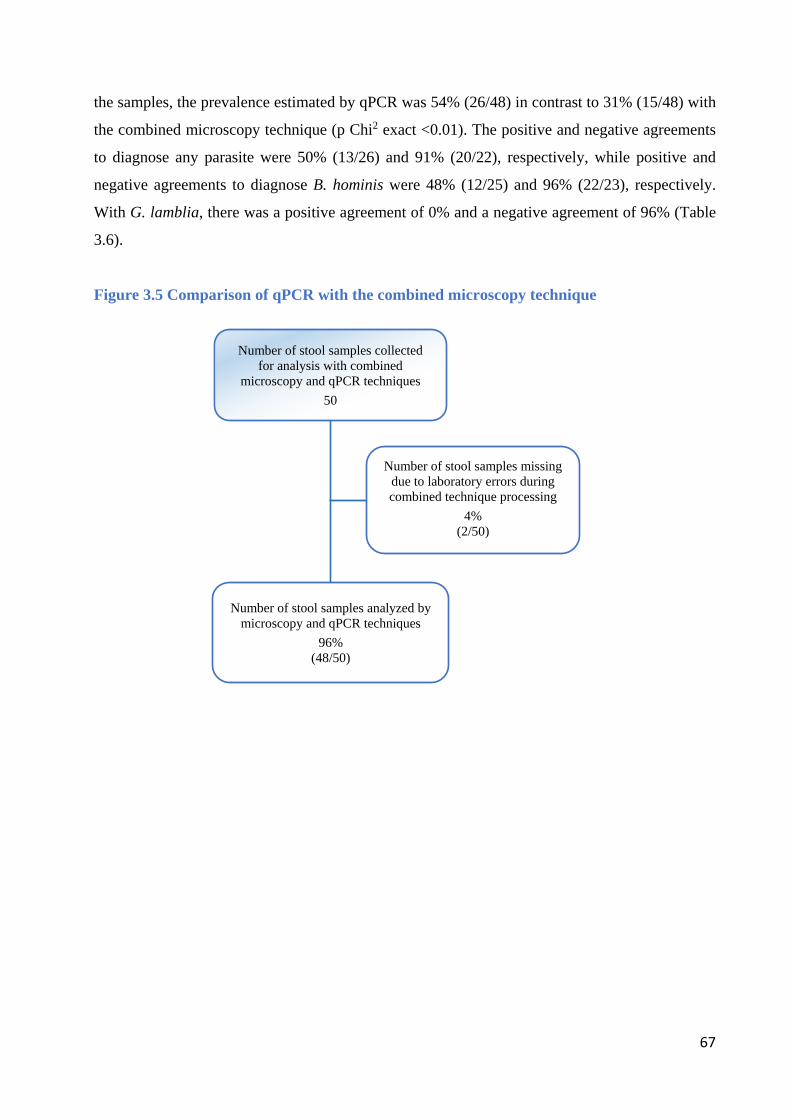
67
the samples, the prevalence estimated by qPCR was 54% (26/48) in contrast to 31% (15/48) with
the combined microscopy technique (p Chi2 exact <0.01). The positive and negative agreements
to diagnose any parasite were 50% (13/26) and 91% (20/22), respectively, while positive and
negative agreements to diagnose B. hominis were 48% (12/25) and 96% (22/23), respectively.
With G. lamblia, there was a positive agreement of 0% and a negative agreement of 96% (Table
3.6).
Figure 3.5 Comparison of qPCR with the combined microscopy technique
Number of stool samples collected for analysis with combined
microscopy and qPCR techniques 50
Number of stool samples missing due to laboratory errors during combined technique processing
4% (2/50)
Number of stool samples analyzed by microscopy and qPCR techniques
96% (48/50)
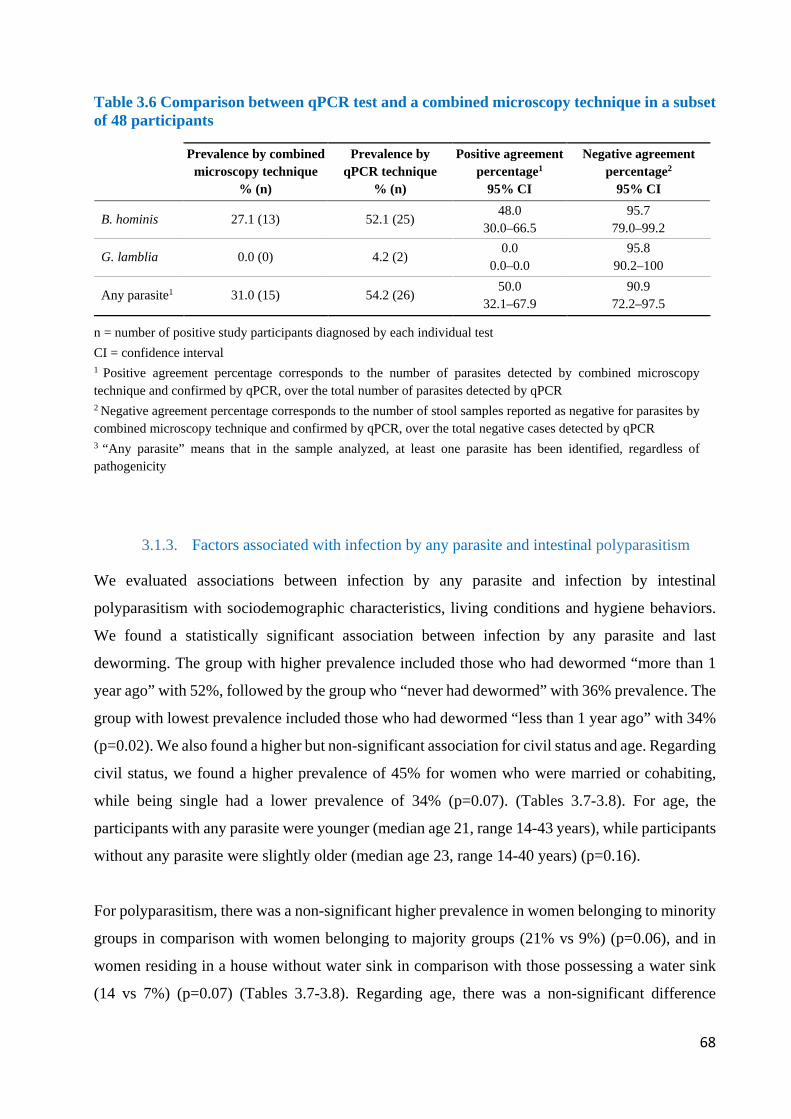
68
Table 3.6 Comparison between qPCR test and a combined microscopy technique in a subset of 48 participants
Prevalence by combined
microscopy technique % (n)
Prevalence by qPCR technique
% (n)
Positive agreement percentage1
95% CI
Negative agreement percentage2
95% CI
B. hominis 27.1 (13) 52.1 (25) 48.0 30.0–66.5
95.7 79.0–99.2
G. lamblia 0.0 (0) 4.2 (2) 0.0
0.0–0.0 95.8
90.2–100
Any parasite1 31.0 (15) 54.2 (26) 50.0 32.1–67.9
90.9 72.2–97.5
n = number of positive study participants diagnosed by each individual test CI = confidence interval 1 Positive agreement percentage corresponds to the number of parasites detected by combined microscopy technique and confirmed by qPCR, over the total number of parasites detected by qPCR 2 Negative agreement percentage corresponds to the number of stool samples reported as negative for parasites by combined microscopy technique and confirmed by qPCR, over the total negative cases detected by qPCR 3 “Any parasite” means that in the sample analyzed, at least one parasite has been identified, regardless of pathogenicity
3.1.3. Factors associated with infection by any parasite and intestinal polyparasitism
We evaluated associations between infection by any parasite and infection by intestinal
polyparasitism with sociodemographic characteristics, living conditions and hygiene behaviors.
We found a statistically significant association between infection by any parasite and last
deworming. The group with higher prevalence included those who had dewormed “more than 1
year ago” with 52%, followed by the group who “never had dewormed” with 36% prevalence. The
group with lowest prevalence included those who had dewormed “less than 1 year ago” with 34%
(p=0.02). We also found a higher but non-significant association for civil status and age. Regarding
civil status, we found a higher prevalence of 45% for women who were married or cohabiting,
while being single had a lower prevalence of 34% (p=0.07). (Tables 3.7-3.8). For age, the
participants with any parasite were younger (median age 21, range 14-43 years), while participants
without any parasite were slightly older (median age 23, range 14-40 years) (p=0.16).
For polyparasitism, there was a non-significant higher prevalence in women belonging to minority
groups in comparison with women belonging to majority groups (21% vs 9%) (p=0.06), and in
women residing in a house without water sink in comparison with those possessing a water sink
(14 vs 7%) (p=0.07) (Tables 3.7-3.8). Regarding age, there was a non-significant difference
69
between women with polyparasitism (median age 22 years, range 17–37 years) and women
without polyparasitism (median age 22 years, range 14-43 years) (p=0.9).
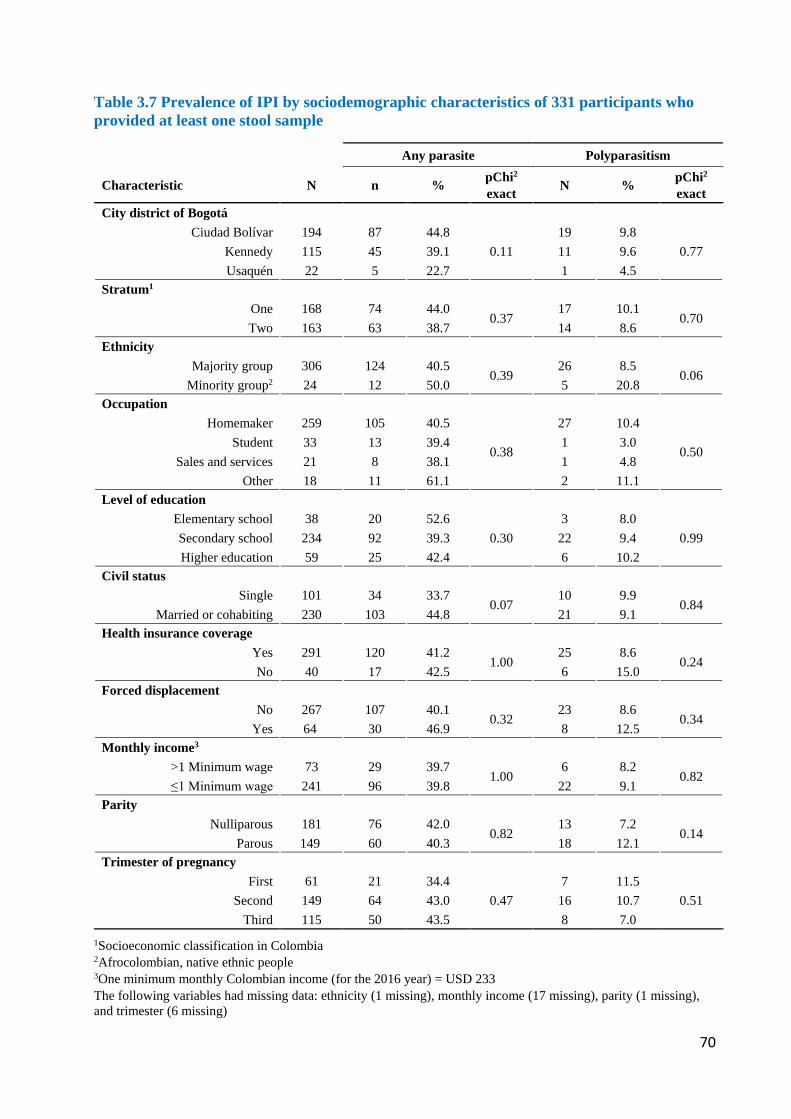
70
Table 3.7 Prevalence of IPI by sociodemographic characteristics of 331 participants who provided at least one stool sample
1Socioeconomic classification in Colombia 2Afrocolombian, native ethnic people 3One minimum monthly Colombian income (for the 2016 year) = USD 233 The following variables had missing data: ethnicity (1 missing), monthly income (17 missing), parity (1 missing), and trimester (6 missing)
Any parasite Polyparasitism
Characteristic N n % pChi2
exact N % pChi2
exact City district of Bogotá
Ciudad Bolívar 194 87 44.8 0.11
19 9.8 0.77 Kennedy 115 45 39.1 11 9.6
Usaquén 22 5 22.7 1 4.5 Stratum1
One 168 74 44.0 0.37
17 10.1 0.70
Two 163 63 38.7 14 8.6 Ethnicity
Majority group 306 124 40.5 0.39
26 8.5 0.06
Minority group2 24 12 50.0 5 20.8 Occupation
Homemaker 259 105 40.5
0.38
27 10.4
0.50 Student 33 13 39.4 1 3.0
Sales and services 21 8 38.1 1 4.8 Other 18 11 61.1 2 11.1
Level of education Elementary school 38 20 52.6
0.30 3 8.0
0.99 Secondary school 234 92 39.3 22 9.4 Higher education 59 25 42.4 6 10.2
Civil status Single 101 34 33.7
0.07 10 9.9
0.84 Married or cohabiting 230 103 44.8 21 9.1
Health insurance coverage Yes 291 120 41.2
1.00 25 8.6
0.24 No 40 17 42.5 6 15.0
Forced displacement No 267 107 40.1
0.32 23 8.6
0.34 Yes 64 30 46.9 8 12.5
Monthly income3 >1 Minimum wage 73 29 39.7
1.00 6 8.2
0.82 ≤1 Minimum wage 241 96 39.8 22 9.1
Parity Nulliparous 181 76 42.0
0.82 13 7.2
0.14 Parous 149 60 40.3 18 12.1
Trimester of pregnancy First 61 21 34.4
0.47 7 11.5
0.51 Second 149 64 43.0 16 10.7 Third 115 50 43.5 8 7.0
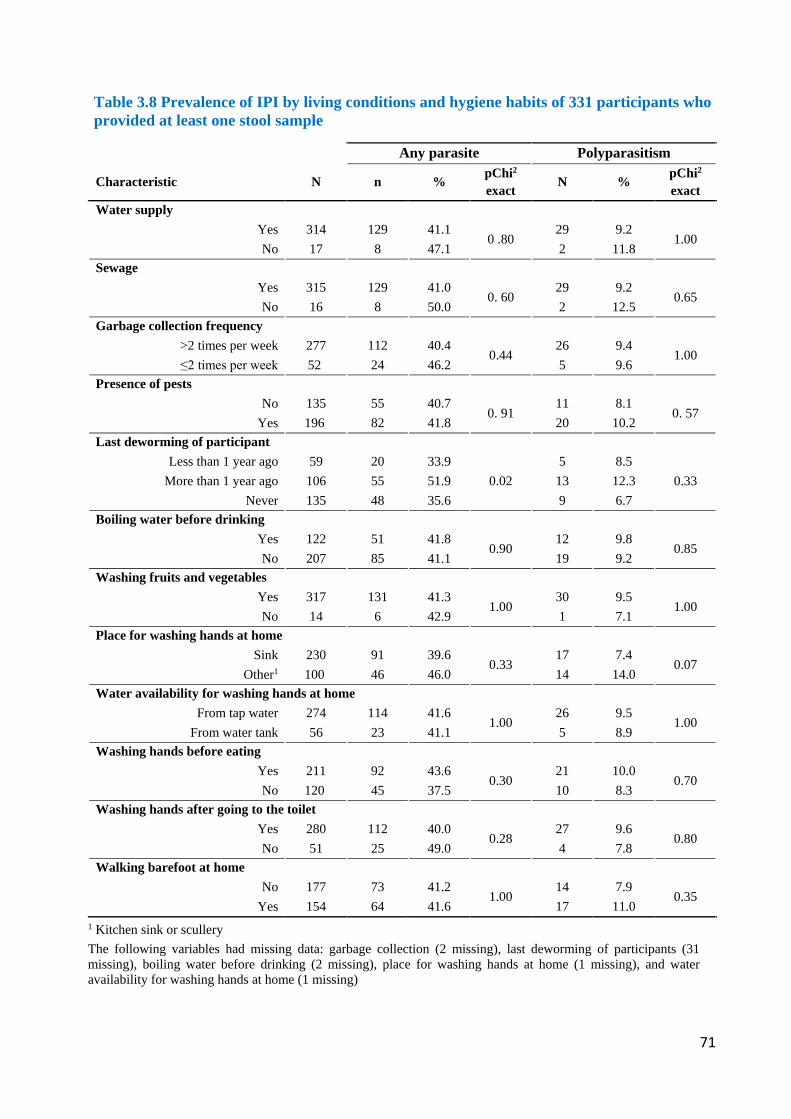
71
Table 3.8 Prevalence of IPI by living conditions and hygiene habits of 331 participants who provided at least one stool sample
Any parasite Polyparasitism
Characteristic N n % pChi2 exact N % pChi2
exact Water supply
Yes 314 129 41.1 0 .80
29 9.2 1.00
No 17 8 47.1 2 11.8 Sewage
Yes 315 129 41.0 0. 60
29 9.2 0.65
No 16 8 50.0 2 12.5 Garbage collection frequency
>2 times per week 277 112 40.4 0.44
26 9.4 1.00
≤2 times per week 52 24 46.2 5 9.6 Presence of pests
No 135 55 40.7 0. 91
11 8.1 0. 57
Yes 196 82 41.8 20 10.2 Last deworming of participant
Less than 1 year ago 59 20 33.9 0.02
5 8.5 0.33 More than 1 year ago 106 55 51.9 13 12.3
Never 135 48 35.6 9 6.7 Boiling water before drinking
Yes 122 51 41.8 0.90
12 9.8 0.85
No 207 85 41.1 19 9.2 Washing fruits and vegetables
Yes 317 131 41.3 1.00
30 9.5 1.00
No 14 6 42.9 1 7.1 Place for washing hands at home
Sink 230 91 39.6 0.33
17 7.4 0.07
Other1 100 46 46.0 14 14.0 Water availability for washing hands at home
From tap water 274 114 41.6 1.00
26 9.5 1.00
From water tank 56 23 41.1 5 8.9 Washing hands before eating
Yes 211 92 43.6 0.30
21 10.0 0.70
No 120 45 37.5 10 8.3 Washing hands after going to the toilet
Yes 280 112 40.0 0.28
27 9.6 0.80
No 51 25 49.0 4 7.8 Walking barefoot at home
No 177 73 41.2 1.00
14 7.9 0.35
Yes 154 64 41.6 17 11.0 1 Kitchen sink or scullery The following variables had missing data: garbage collection (2 missing), last deworming of participants (31 missing), boiling water before drinking (2 missing), place for washing hands at home (1 missing), and water availability for washing hands at home (1 missing)
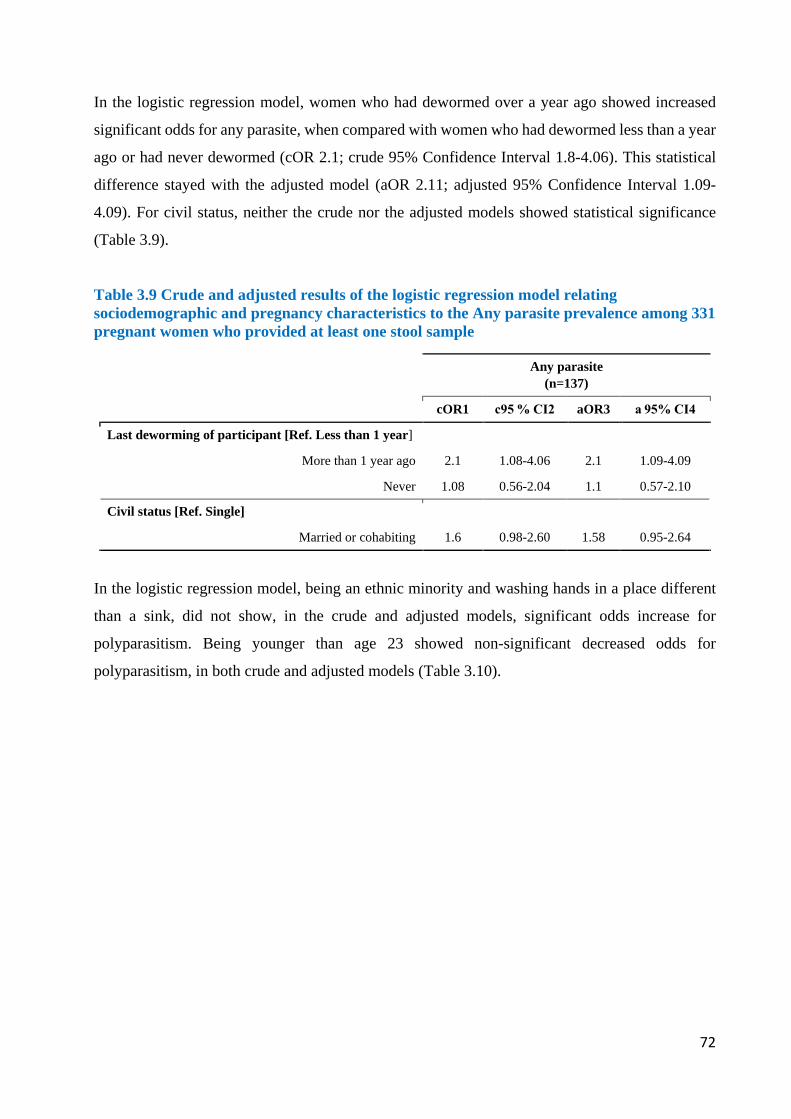
72
In the logistic regression model, women who had dewormed over a year ago showed increased
significant odds for any parasite, when compared with women who had dewormed less than a year
ago or had never dewormed (cOR 2.1; crude 95% Confidence Interval 1.8-4.06). This statistical
difference stayed with the adjusted model (aOR 2.11; adjusted 95% Confidence Interval 1.09-
4.09). For civil status, neither the crude nor the adjusted models showed statistical significance
(Table 3.9).
Table 3.9 Crude and adjusted results of the logistic regression model relating sociodemographic and pregnancy characteristics to the Any parasite prevalence among 331 pregnant women who provided at least one stool sample
Any parasite (n=137)
cOR1 c95 % CI2 aOR3 a 95% CI4
Last deworming of participant [Ref. Less than 1 year]
More than 1 year ago 2.1 1.08-4.06 2.1 1.09-4.09
Never 1.08 0.56-2.04 1.1 0.57-2.10
Civil status [Ref. Single]
Married or cohabiting 1.6 0.98-2.60 1.58 0.95-2.64
In the logistic regression model, being an ethnic minority and washing hands in a place different
than a sink, did not show, in the crude and adjusted models, significant odds increase for
polyparasitism. Being younger than age 23 showed non-significant decreased odds for
polyparasitism, in both crude and adjusted models (Table 3.10).
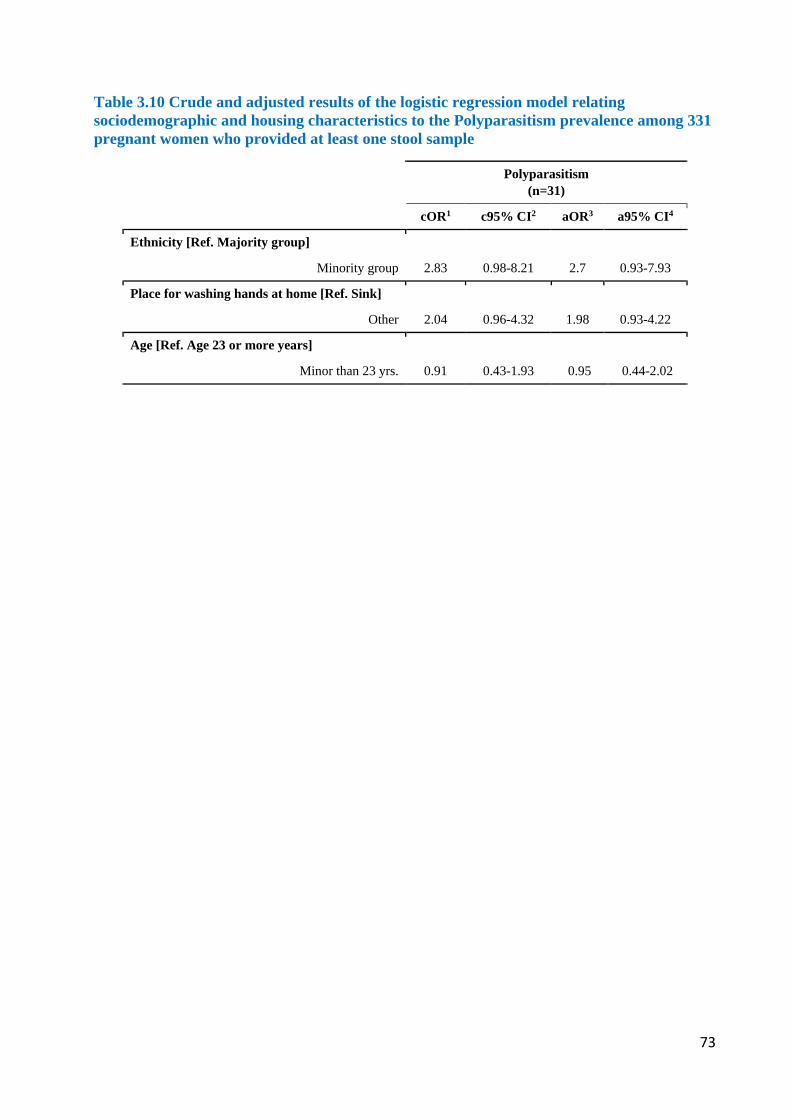
73
Table 3.10 Crude and adjusted results of the logistic regression model relating sociodemographic and housing characteristics to the Polyparasitism prevalence among 331 pregnant women who provided at least one stool sample
Polyparasitism (n=31)
cOR1 c95% CI2 aOR3 a95% CI4
Ethnicity [Ref. Majority group]
Minority group 2.83 0.98-8.21 2.7 0.93-7.93
Place for washing hands at home [Ref. Sink]
Other 2.04 0.96-4.32 1.98 0.93-4.22
Age [Ref. Age 23 or more years]
Minor than 23 yrs. 0.91 0.43-1.93 0.95 0.44-2.02
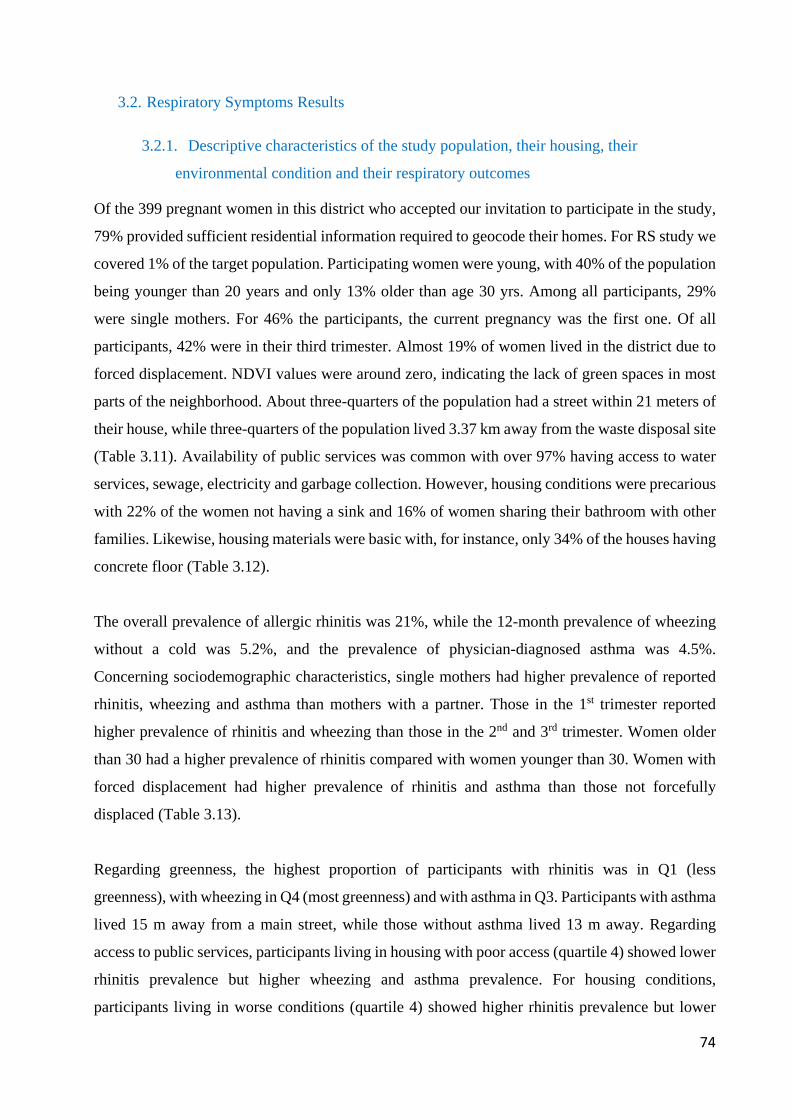
74
3.2. Respiratory Symptoms Results
3.2.1. Descriptive characteristics of the study population, their housing, their
environmental condition and their respiratory outcomes
Of the 399 pregnant women in this district who accepted our invitation to participate in the study,
79% provided sufficient residential information required to geocode their homes. For RS study we
covered 1% of the target population. Participating women were young, with 40% of the population
being younger than 20 years and only 13% older than age 30 yrs. Among all participants, 29%
were single mothers. For 46% the participants, the current pregnancy was the first one. Of all
participants, 42% were in their third trimester. Almost 19% of women lived in the district due to
forced displacement. NDVI values were around zero, indicating the lack of green spaces in most
parts of the neighborhood. About three-quarters of the population had a street within 21 meters of
their house, while three-quarters of the population lived 3.37 km away from the waste disposal site
(Table 3.11). Availability of public services was common with over 97% having access to water
services, sewage, electricity and garbage collection. However, housing conditions were precarious
with 22% of the women not having a sink and 16% of women sharing their bathroom with other
families. Likewise, housing materials were basic with, for instance, only 34% of the houses having
concrete floor (Table 3.12).
The overall prevalence of allergic rhinitis was 21%, while the 12-month prevalence of wheezing
without a cold was 5.2%, and the prevalence of physician-diagnosed asthma was 4.5%.
Concerning sociodemographic characteristics, single mothers had higher prevalence of reported
rhinitis, wheezing and asthma than mothers with a partner. Those in the 1st trimester reported
higher prevalence of rhinitis and wheezing than those in the 2nd and 3rd trimester. Women older
than 30 had a higher prevalence of rhinitis compared with women younger than 30. Women with
forced displacement had higher prevalence of rhinitis and asthma than those not forcefully
displaced (Table 3.13).
Regarding greenness, the highest proportion of participants with rhinitis was in Q1 (less
greenness), with wheezing in Q4 (most greenness) and with asthma in Q3. Participants with asthma
lived 15 m away from a main street, while those without asthma lived 13 m away. Regarding
access to public services, participants living in housing with poor access (quartile 4) showed lower
rhinitis prevalence but higher wheezing and asthma prevalence. For housing conditions,
participants living in worse conditions (quartile 4) showed higher rhinitis prevalence but lower
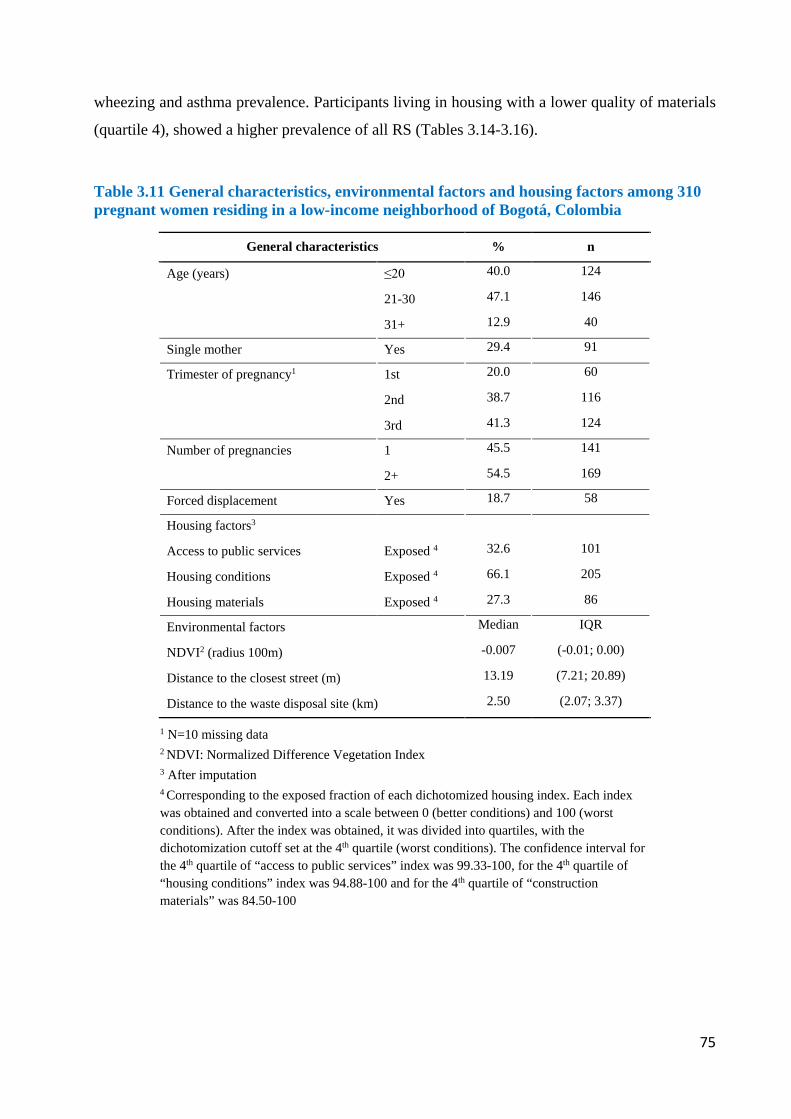
75
wheezing and asthma prevalence. Participants living in housing with a lower quality of materials
(quartile 4), showed a higher prevalence of all RS (Tables 3.14-3.16).
Table 3.11 General characteristics, environmental factors and housing factors among 310 pregnant women residing in a low-income neighborhood of Bogotá, Colombia
General characteristics % n
Age (years) ≤20 40.0 124
21-30 47.1 146
31+ 12.9 40
Single mother Yes 29.4 91
Trimester of pregnancy1 1st 20.0 60
2nd 38.7 116
3rd 41.3 124
Number of pregnancies 1 45.5 141
2+ 54.5 169
Forced displacement Yes 18.7 58
Housing factors3
Access to public services Exposed 4 32.6 101
Housing conditions Exposed 4 66.1 205
Housing materials Exposed 4 27.3 86
Environmental factors Median IQR
NDVI2 (radius 100m) -0.007 (-0.01; 0.00)
Distance to the closest street (m) 13.19 (7.21; 20.89)
Distance to the waste disposal site (km) 2.50 (2.07; 3.37)
1 N=10 missing data 2 NDVI: Normalized Difference Vegetation Index 3 After imputation 4 Corresponding to the exposed fraction of each dichotomized housing index. Each index was obtained and converted into a scale between 0 (better conditions) and 100 (worst conditions). After the index was obtained, it was divided into quartiles, with the dichotomization cutoff set at the 4th quartile (worst conditions). The confidence interval for the 4th quartile of “access to public services” index was 99.33-100, for the 4th quartile of “housing conditions” index was 94.88-100 and for the 4th quartile of “construction materials” was 84.50-100
76
Table 3.12 Distribution of variables used to create the housing indices among 310 pregnant women residing in a poor neighborhood in Bogotá, Colombia
Indices and Variables % N
Index 1: Access to public services No water supply1 2.7 8 No access to sewage system1 2.7 8 No electricity1 2.7 8 No natural gas supply1 8.6 25 No garbage collection1 0.3 1 Garbage collection frequency 1-2 a week2 10.7 31 No land phone1 59.9 175 No cellphone1 6.8 20 No Internet connection1 63.4 185 Index 2: Housing conditions One toilet1 16.4 48 No bathroom1 2.1 6 Bathroom shared with other families3 15.7 45 No sink1 21.6 63 Sink shared with other families4 14.0 32 No separate kitchen5 9.8 25 Index 3: Housing materials Ceiling materials6 Concrete7 50.0 70 Zinc roof tile 30.0 42 Other8 20.0 28 Walls materials 6 Brick9 90.7 127 Non-brick10 9.3 13 Floor materials6 Tile11 26.4 37 Concrete11 33.6 47 Ceramic tablet11 32.9 46 Other12 26.4 10
1 N=18 data missing 2 Only one participant reported no garbage collection 3 N=24 data missing 4 N=81 data missing 5 N=55 data missing 6 N=170 data missing 7 Concrete was considered better material for ceiling 8 Wood, clay roof tile, paperboard or fiber cement (Eternit) 9 Brick was considered better material for walls 10 Prefabricated material, wood, clay, paperboard or tin 11 Tile, concrete and ceramic tablet were considered better materials for floor 12 Soil, wood or carpet.
77
3.2.2. Associations between housing conditions, urban green space, environmental
exposures and respiratory outcomes
Women in their first trimester of pregnancy had increased odds for allergic rhinitis, although not
reaching statistical significance in the adjusted model (aOR 2.09; adjusted 95% Confidence
Interval 0.94-4.62). No other general characteristic was associated with the outcomes under study.
The crude and adjusted logistic regression models identified non-linear inverse associations
between NDVI quartiles and allergic rhinitis reaching statistical significance for the fourth quartile
(aOR 0.41; adjusted 95% Confidence Interval 0.17-0.98). Living further away from a street was
borderline associated with increased odds for allergic rhinitis and asthma (aOR 0.98; adjusted 95%
Confidence Interval 0.93-1.03). None of the housing characteristics were associated with the
outcomes (Tables 3.17-3.19).
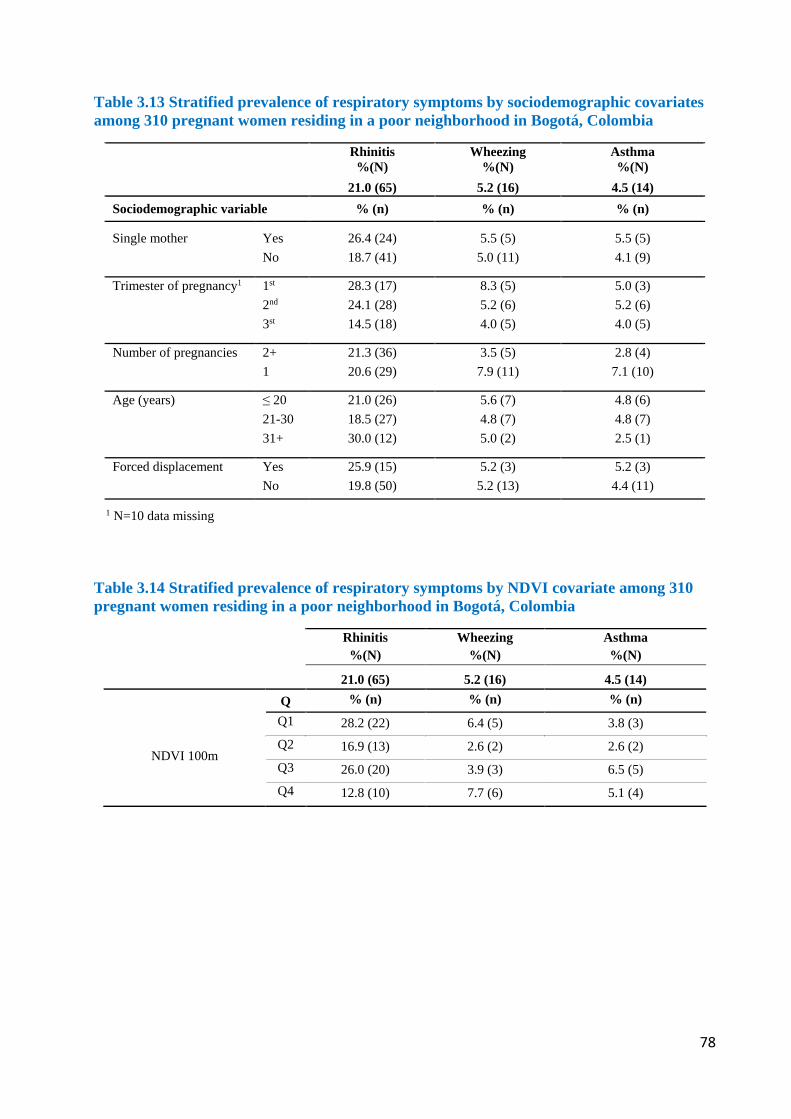
78
Table 3.13 Stratified prevalence of respiratory symptoms by sociodemographic covariates among 310 pregnant women residing in a poor neighborhood in Bogotá, Colombia
Rhinitis %(N)
Wheezing %(N)
Asthma %(N)
21.0 (65) 5.2 (16) 4.5 (14) Sociodemographic variable % (n) % (n) % (n)
Single mother Yes No
26.4 (24) 18.7 (41)
5.5 (5) 5.0 (11)
5.5 (5) 4.1 (9)
Trimester of pregnancy1 1st
2nd 3st
28.3 (17) 24.1 (28) 14.5 (18)
8.3 (5) 5.2 (6) 4.0 (5)
5.0 (3) 5.2 (6) 4.0 (5)
Number of pregnancies 2+ 1
21.3 (36) 20.6 (29)
3.5 (5) 7.9 (11)
2.8 (4) 7.1 (10)
Age (years) ≤ 20 21-30 31+
21.0 (26) 18.5 (27) 30.0 (12)
5.6 (7) 4.8 (7) 5.0 (2)
4.8 (6) 4.8 (7) 2.5 (1)
Forced displacement Yes No
25.9 (15) 19.8 (50)
5.2 (3) 5.2 (13)
5.2 (3) 4.4 (11)
1 N=10 data missing
Table 3.14 Stratified prevalence of respiratory symptoms by NDVI covariate among 310 pregnant women residing in a poor neighborhood in Bogotá, Colombia
Rhinitis %(N)
Wheezing %(N)
Asthma %(N)
21.0 (65) 5.2 (16) 4.5 (14)
NDVI 100m
Q % (n) % (n) % (n) Q1 28.2 (22) 6.4 (5) 3.8 (3) Q2 16.9 (13) 2.6 (2) 2.6 (2) Q3 26.0 (20) 3.9 (3) 6.5 (5) Q4 12.8 (10) 7.7 (6) 5.1 (4)
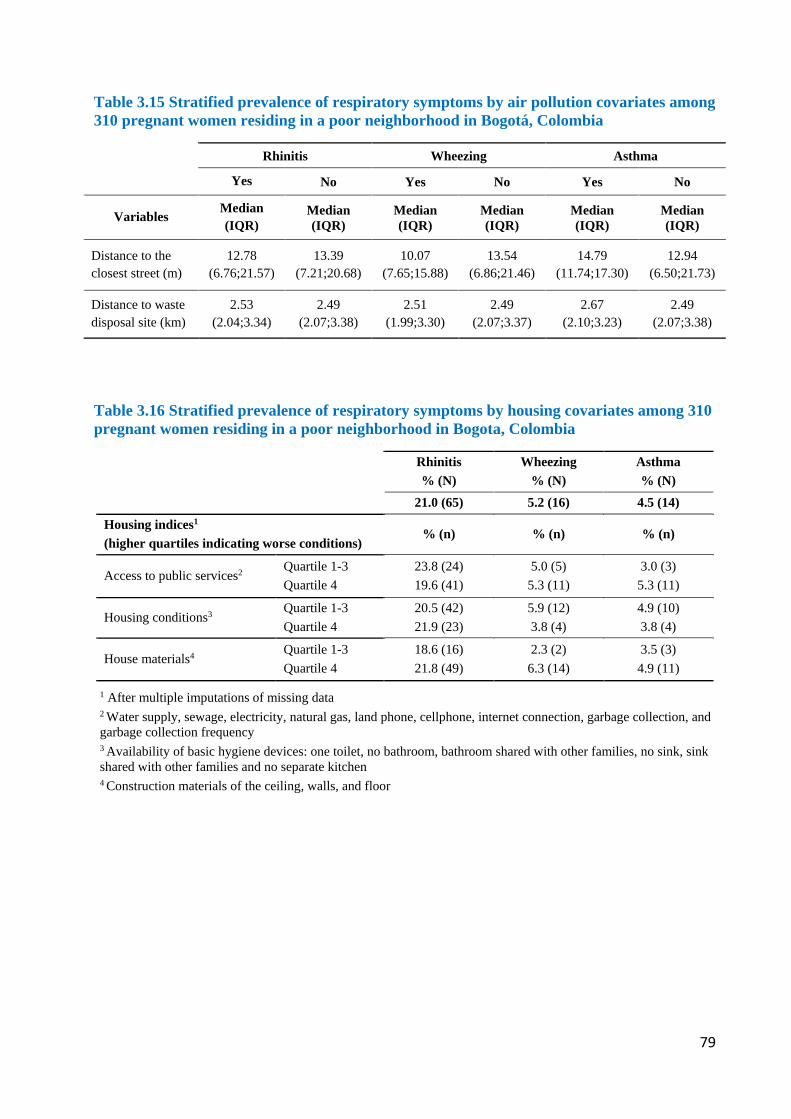
79
Table 3.15 Stratified prevalence of respiratory symptoms by air pollution covariates among 310 pregnant women residing in a poor neighborhood in Bogotá, Colombia
Rhinitis Wheezing Asthma
Yes No Yes No Yes No
Variables Median (IQR)
Median (IQR)
Median (IQR)
Median (IQR)
Median (IQR)
Median (IQR)
Distance to the closest street (m)
12.78 (6.76;21.57)
13.39 (7.21;20.68)
10.07 (7.65;15.88)
13.54 (6.86;21.46)
14.79 (11.74;17.30)
12.94 (6.50;21.73)
Distance to waste disposal site (km)
2.53 (2.04;3.34)
2.49 (2.07;3.38)
2.51 (1.99;3.30)
2.49 (2.07;3.37)
2.67 (2.10;3.23)
2.49 (2.07;3.38)
Table 3.16 Stratified prevalence of respiratory symptoms by housing covariates among 310 pregnant women residing in a poor neighborhood in Bogota, Colombia
Rhinitis % (N)
Wheezing % (N)
Asthma % (N)
21.0 (65) 5.2 (16) 4.5 (14)
Housing indices1 (higher quartiles indicating worse conditions)
% (n) % (n) % (n)
Access to public services2 Quartile 1-3 Quartile 4
23.8 (24) 19.6 (41)
5.0 (5) 5.3 (11)
3.0 (3) 5.3 (11)
Housing conditions3 Quartile 1-3 Quartile 4
20.5 (42) 21.9 (23)
5.9 (12) 3.8 (4)
4.9 (10) 3.8 (4)
House materials4 Quartile 1-3 Quartile 4
18.6 (16) 21.8 (49)
2.3 (2) 6.3 (14)
3.5 (3) 4.9 (11)
1 After multiple imputations of missing data 2 Water supply, sewage, electricity, natural gas, land phone, cellphone, internet connection, garbage collection, and garbage collection frequency 3 Availability of basic hygiene devices: one toilet, no bathroom, bathroom shared with other families, no sink, sink shared with other families and no separate kitchen 4 Construction materials of the ceiling, walls, and floor
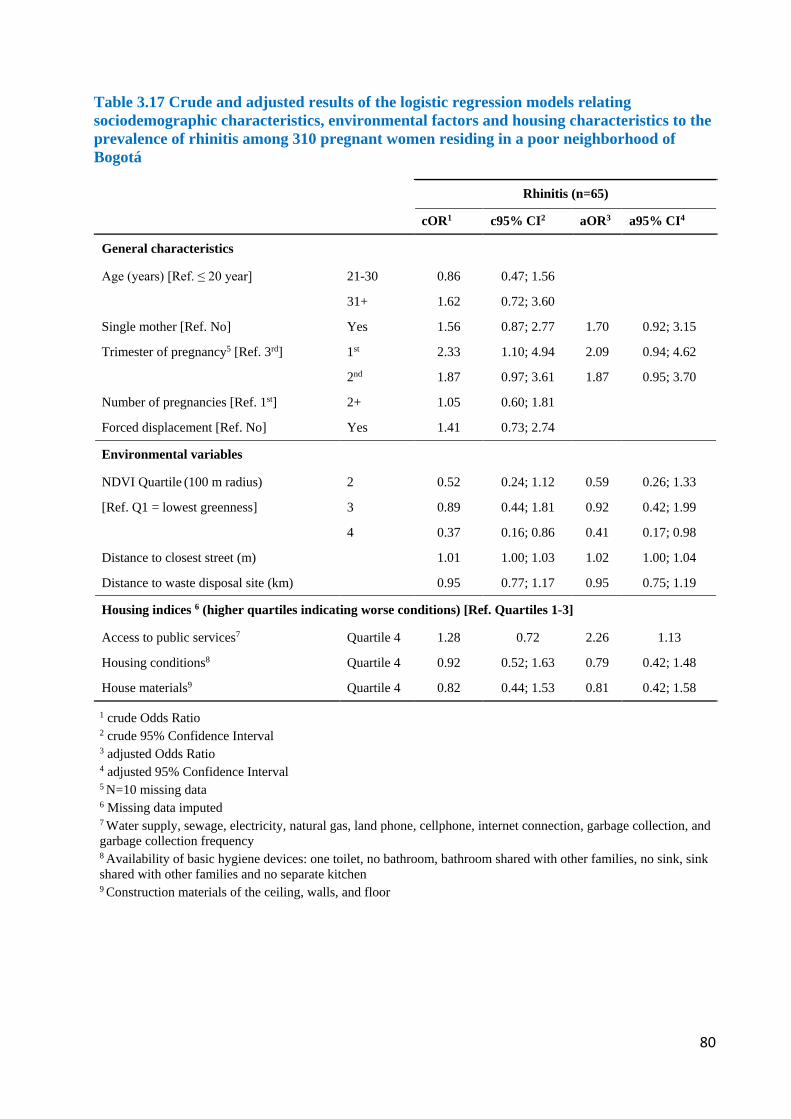
80
Table 3.17 Crude and adjusted results of the logistic regression models relating sociodemographic characteristics, environmental factors and housing characteristics to the prevalence of rhinitis among 310 pregnant women residing in a poor neighborhood of Bogotá
Rhinitis (n=65)
cOR1 c95% CI2 aOR3 a95% CI4
General characteristics
Age (years) [Ref. ≤ 20 year] 21-30 0.86 0.47; 1.56
31+ 1.62 0.72; 3.60
Single mother [Ref. No] Yes 1.56 0.87; 2.77 1.70 0.92; 3.15
Trimester of pregnancy5 [Ref. 3rd] 1st 2.33 1.10; 4.94 2.09 0.94; 4.62
2nd 1.87 0.97; 3.61 1.87 0.95; 3.70
Number of pregnancies [Ref. 1st] 2+ 1.05 0.60; 1.81
Forced displacement [Ref. No] Yes 1.41 0.73; 2.74
Environmental variables
NDVI Quartile (100 m radius) 2 0.52 0.24; 1.12 0.59 0.26; 1.33
[Ref. Q1 = lowest greenness] 3 0.89 0.44; 1.81 0.92 0.42; 1.99
4 0.37 0.16; 0.86 0.41 0.17; 0.98
Distance to closest street (m) 1.01 1.00; 1.03 1.02 1.00; 1.04
Distance to waste disposal site (km) 0.95 0.77; 1.17 0.95 0.75; 1.19
Housing indices 6 (higher quartiles indicating worse conditions) [Ref. Quartiles 1-3]
Access to public services7 Quartile 4 1.28 0.72 2.26 1.13
Housing conditions8 Quartile 4 0.92 0.52; 1.63 0.79 0.42; 1.48
House materials9 Quartile 4 0.82 0.44; 1.53 0.81 0.42; 1.58
1 crude Odds Ratio 2 crude 95% Confidence Interval 3 adjusted Odds Ratio 4 adjusted 95% Confidence Interval 5 N=10 missing data 6 Missing data imputed 7 Water supply, sewage, electricity, natural gas, land phone, cellphone, internet connection, garbage collection, and garbage collection frequency 8 Availability of basic hygiene devices: one toilet, no bathroom, bathroom shared with other families, no sink, sink shared with other families and no separate kitchen 9 Construction materials of the ceiling, walls, and floor
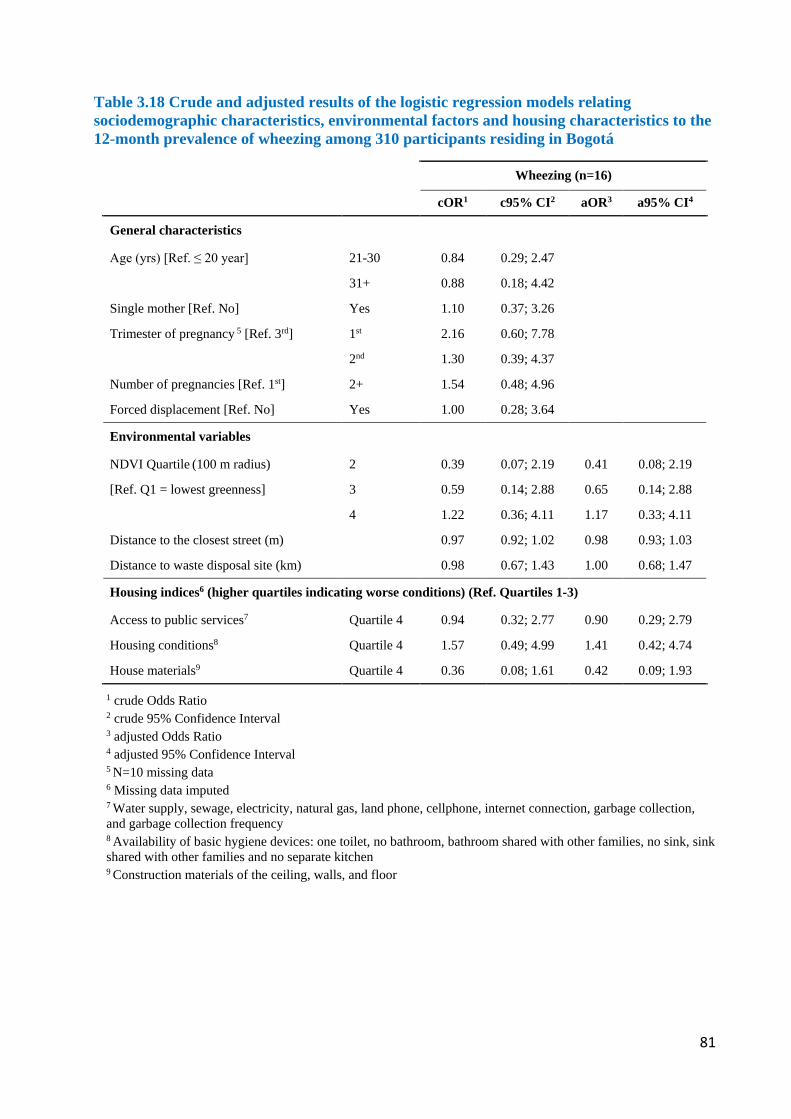
81
Table 3.18 Crude and adjusted results of the logistic regression models relating sociodemographic characteristics, environmental factors and housing characteristics to the 12-month prevalence of wheezing among 310 participants residing in Bogotá
Wheezing (n=16)
cOR1 c95% CI2 aOR3 a95% CI4
General characteristics
Age (yrs) [Ref. ≤ 20 year] 21-30 0.84 0.29; 2.47
31+ 0.88 0.18; 4.42
Single mother [Ref. No] Yes 1.10 0.37; 3.26
Trimester of pregnancy 5 [Ref. 3rd] 1st 2.16 0.60; 7.78
2nd 1.30 0.39; 4.37
Number of pregnancies [Ref. 1st] 2+ 1.54 0.48; 4.96
Forced displacement [Ref. No] Yes 1.00 0.28; 3.64
Environmental variables
NDVI Quartile (100 m radius) 2 0.39 0.07; 2.19 0.41 0.08; 2.19
[Ref. Q1 = lowest greenness] 3 0.59 0.14; 2.88 0.65 0.14; 2.88
4 1.22 0.36; 4.11 1.17 0.33; 4.11
Distance to the closest street (m) 0.97 0.92; 1.02 0.98 0.93; 1.03
Distance to waste disposal site (km) 0.98 0.67; 1.43 1.00 0.68; 1.47
Housing indices6 (higher quartiles indicating worse conditions) (Ref. Quartiles 1-3)
Access to public services7 Quartile 4 0.94 0.32; 2.77 0.90 0.29; 2.79
Housing conditions8 Quartile 4 1.57 0.49; 4.99 1.41 0.42; 4.74
House materials9 Quartile 4 0.36 0.08; 1.61 0.42 0.09; 1.93
1 crude Odds Ratio 2 crude 95% Confidence Interval 3 adjusted Odds Ratio 4 adjusted 95% Confidence Interval 5 N=10 missing data 6 Missing data imputed 7 Water supply, sewage, electricity, natural gas, land phone, cellphone, internet connection, garbage collection, and garbage collection frequency 8 Availability of basic hygiene devices: one toilet, no bathroom, bathroom shared with other families, no sink, sink shared with other families and no separate kitchen 9 Construction materials of the ceiling, walls, and floor
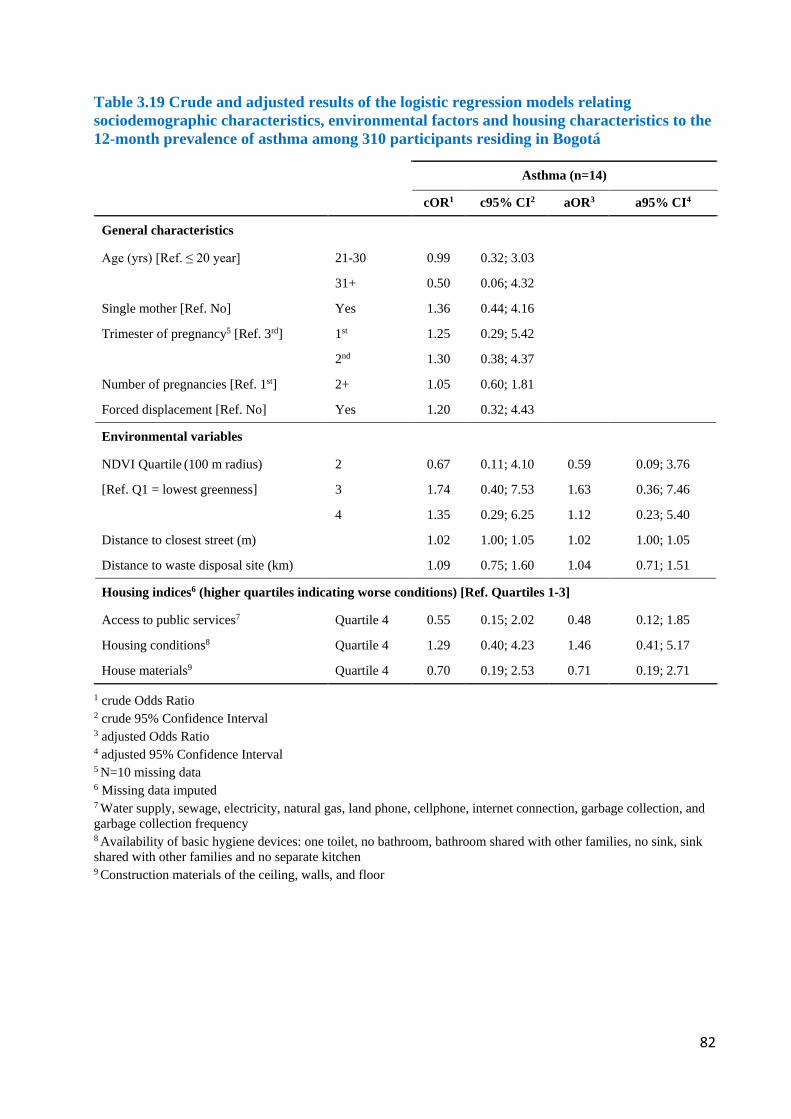
82
Table 3.19 Crude and adjusted results of the logistic regression models relating sociodemographic characteristics, environmental factors and housing characteristics to the 12-month prevalence of asthma among 310 participants residing in Bogotá
Asthma (n=14)
cOR1 c95% CI2 aOR3 a95% CI4
General characteristics
Age (yrs) [Ref. ≤ 20 year] 21-30 0.99 0.32; 3.03
31+ 0.50 0.06; 4.32
Single mother [Ref. No] Yes 1.36 0.44; 4.16
Trimester of pregnancy5 [Ref. 3rd] 1st 1.25 0.29; 5.42
2nd 1.30 0.38; 4.37
Number of pregnancies [Ref. 1st] 2+ 1.05 0.60; 1.81
Forced displacement [Ref. No] Yes 1.20 0.32; 4.43
Environmental variables
NDVI Quartile (100 m radius) 2 0.67 0.11; 4.10 0.59 0.09; 3.76
[Ref. Q1 = lowest greenness] 3 1.74 0.40; 7.53 1.63 0.36; 7.46
4 1.35 0.29; 6.25 1.12 0.23; 5.40
Distance to closest street (m) 1.02 1.00; 1.05 1.02 1.00; 1.05
Distance to waste disposal site (km) 1.09 0.75; 1.60 1.04 0.71; 1.51
Housing indices6 (higher quartiles indicating worse conditions) [Ref. Quartiles 1-3]
Access to public services7 Quartile 4 0.55 0.15; 2.02 0.48 0.12; 1.85
Housing conditions8 Quartile 4 1.29 0.40; 4.23 1.46 0.41; 5.17
House materials9 Quartile 4 0.70 0.19; 2.53 0.71 0.19; 2.71
1 crude Odds Ratio 2 crude 95% Confidence Interval 3 adjusted Odds Ratio 4 adjusted 95% Confidence Interval 5 N=10 missing data 6 Missing data imputed 7 Water supply, sewage, electricity, natural gas, land phone, cellphone, internet connection, garbage collection, and garbage collection frequency 8 Availability of basic hygiene devices: one toilet, no bathroom, bathroom shared with other families, no sink, sink shared with other families and no separate kitchen 9 Construction materials of the ceiling, walls, and floor
83
4. DISCUSSION
4.1. Summary of Main Findings
We performed a study that included 550 pregnant women living in strata 1 and 2 neighborhoods
in three districts of Bogotá. We assessed two health outcomes: IPI and RS. Fieldwork started
initially in the districts of Usaquén and Kennedy to assess IPI and then focused on Ciudad Bolívar
where both, IPI and RS, were studied. For IPI, analysis of stool samples by combined microscopy
techniques found in our participants a 41% prevalence of any intestinal pathogenic and non-
pathogenic parasites, and a 9% prevalence of polyparasitism. Women who had dewormed over a
year ago had a statistically significantly higher prevalence of any parasite, while women who were
married or lived with a partner showed a higher but not statistically significant prevalence of any
parasite. Women reporting to belong to minority ethnic groups and those not having handwashing
facilities had a higher not statistically significant prevalence of polyparasitism.
Regarding RS, based on questions from the ECHRS questionnaire, we found in our participants a
4.5% prevalence of physician-diagnosed asthma, a 5.2% prevalence of asthma based on symptoms
and 21% prevalence of rhinitis. Prevalence of rhinitis was higher in areas with low access to
greenness. Finally, in contrast to our own expectations, odds for rhinitis and asthma increased
when participants lived further away from main streets.
4.2. Methodological Strengths and Limitations
4.2.1. Strengths of this study
The main strength of this study is that it is the first, in Colombia, to assess IPI, a neglected disease,
and RS, in association with sociodemographic and environmental risk factors in pregnant women
living in marginalized urban areas of a megacity and in vulnerable socioeconomic conditions. This
study included a number of participants living in vulnerable urban settings despite important
recruitment and access challenges.
84
4.2.2. Limitations of this study
4.2.2.1. Limitations of response and field work
In the IPI study, restrictions for recruitment of participants, as well as difficulties collecting at least
one stool sample, were main limitations, further magnified by challenging safety conditions and
limited access to participants’ residences by the research team. In addition, obtaining one or two
stool samples was limited by physiologic constipation and specimen collection discomfort often
reported by participating pregnant women.
We had different challenges for the recruitment of participants. First, we were not able to obtain
the information to build a sample size frame since, as under Colombian data protection laws, we
were not allowed to use the contact data that pregnant women gave to the UPA. Consequently, we
could not make phone calls to invite pregnant women to participate in our study. Additionally, the
schedules for prenatal control in the UPA were interspersed with other medical centre
appointments. As a solution to these limitations, the UPA staff suggested that we could invite and
recruit pregnant women who came to antenatal courses.
Second, four months after fieldwork had started, during preliminary analysis, we realized that
women attending antenatal courses were mostly in their first gestation and were housewives.
Added to this, safety problems in Usaquén and selective sampling in Kennedy neighborhoods led
us to decide to suspend fieldwork in these districts. To continue the research study, we then decided
to focus fieldwork on the district of Ciudad Bolívar. This decision was deemed appropriate as, in
this district, most of its inhabitants live in housing classified in strata 1 and 2. Besides, this district
has two UPAs that attend 80% of pregnant women in Ciudad Bolívar. Based on these conditions,
we did systematic recruitment, following statements outlined by Rothman et al. (258).
Third, in Ciudad Bolívar, we again found unsafe conditions for doing fieldwork, and although our
research assistants made their best effort, with help by local community leaders, we had the ethical
responsibility to guarantee the assistants’ safety. Given the low prevalence of pathogenic parasites
being found, we decided to stop fieldwork with 550 participants. Our dropout quote was 26%,
which was close to our expectation based on empirical estimations of 20% dropout quotes for
community-based studies done in Latin America. Also, we were not able to visit homes and
observe indoor living conditions in 31% (170/550) of participants, who provided incorrect
residence addresses or did not attend agreed home visit appointments. Families living in strata 1
85
and 2 often move to other locations, as their limited income determines the quality of their rented
housing and the time of stay in one home (259). This could explain the difficulty to visit homes by
the research team, as a participant could incorrectly provide a past address. Unsafe conditions for
research assistants also hindered some home visits.
In our sensitivity analysis comparing convenience and systematic sampling, the only difference
found was higher participation of pregnant women in their second trimester, and recruited by
convenience sampling. This can be explained as women in the second trimester are more likely to
attend antenatal courses, once the uncomfortable first trimester symptoms have passed and
pregnancy has stabilized. This observation supported our decision to suspend the convenience
recruitment that, in this way, was introducing a selection bias.
Women living in stratum 1 provided fewer stool samples than those who lived in stratum 2. This
may be explained by increased difficulty visiting their homes located in areas that were difficult
to access, through street stairs and/or located close to the less safe summit. Women living in these
conditions can also be more vulnerable as, in this study, they were young and had poor healthcare
insurance coverage. However, regarding income, participants earning less than one minimum
wage provided more stool samples than those with the highest household income. This could be
because women having a job outside the home and thus earning more, were not often there, making
it impossible to meet them at home. Nevertheless, this finding requires further exploration in future
studies. These differences further emphasize a selection bias, that could hide the reality of pregnant
women living in more vulnerable conditions. This is one of the reasons to consider that our
observations were only applicable to our study participants.
Regarding RS, access restrictions to participants’ residences limited the determination of indoor
hygiene indicators through direct observation by research team members. In Ciudad Bolívar, once
pregnant women were contacted at the community health centre, a follow-up visit to their homes
was scheduled to observe housing conditions related to hygiene. However, there were challenges
reaching their homes or obtaining their permission to enter. At times, participants provided an
incorrect address, broke the appointment or warned the team about unsafe access, in which case
they preferred to answer the questionnaire at the health centre. Altogether, these challenges limited
systematic collection of information in some participants, requiring data imputation. The resulting
information bias related to georeferencing and hygiene indicators, was then specifically inferred
only to the participants who provided the information. Reasons for incorrect provision of an
86
address were not further explored in this study, but may occur due to lack of knowledge of the
address, having recently moved in or unwillingness to welcome visits. It would also be possible,
in future studies, to evaluate if frequent home address changes, common in Bogotá and Ciudad
Bolívar, could indicate economic vulnerability, unsafe living conditions and/or social violence. If
this is the case, it is then possible that information bias in this study limited identification of
hygiene variables and georeferencing in economically vulnerable pregnant women living in unsafe
neighborhoods.
Despite these limitations, our research team made their best individual and collaborative efforts to
adapt to the existing conditions. For future similar research, the active participation of local health,
security and community leaders is highly recommended to facilitate safe access to locations that
are difficult to reach. Although this research was assisted by local health professionals and
community leaders, their support was limited. On the one hand, even though health authorities
allowed access to pregnant women attending the health centres and provided information about
their appointment systems and population outreach programs, they did not facilitate a plan to
access women living in the most vulnerable areas in the community. While they had community
access experience and information, during our research fieldwork they were undergoing
restructuring of the local health system, including centralization of attention at the health centre
with less mobilization into the community. On the other hand, the support obtained from
community leaders resulted from efforts by local research team members who had built trust
through previous work with them and facilitated access to local areas unreachable on their own.
Community leaders, however, would often respond informally, with limited commitment and with
timing incongruent with the project chronogram. This is reflective of their working priorities that
do not include local research activities. Consequently, the support required by local health
professionals, community leaders and security authorities, must result from their commitment with
the research project, and be reflected by logistics support motivated by a conviction that the
research findings may positively impact the community. Although our research team discussed the
project and its potential impact with health organizations and community leaders, and invited them
to participate, we would have required more advanced development and community-based
research projection in these locations to assure their stronger participation (260, 261).
87
4.2.2.2. Limitations of sample size
The calculated sample size corresponded to 3.5% of the target population, with the 550
participating pregnant women representing 1.8%, the 331 women assessed in the IPI study
representing 1.1% and the 310 women assessed in the RS study representing 1% of the target
population. Thus, achieving 51% of the estimated sample size in the IPI study reduced the power
from 80% to 57%, limiting the possibility of inference from the study. Namely, the probability
that the differences found in the study population are real is below 80% of the statistical power,
the minimum allowed in biomedical research (262). Thus, in the group of 331 pregnant women
who provided at least one stool sample, the association found between “any parasite” and “last
deworming” showed a 38% power (231), when comparing last deworming over 1 year ago versus
never dewormed, with highest prevalence of “any parasite” in women dewormed over 1 year ago.
For the same association, a 28% power was found when comparing last deworming over 1 year
ago versus less than 1 year ago, with highest prevalence of “any parasite” in women dewormed
over 1 year ago. The highest prevalence of “any parasite” in married or cohabiting women,
compared with single women, showed a 20% statistical power.
In the same group of 331 participants, the highest not significant prevalence of polyparasitism in
women of an ethnic minority, compared to those belonging to an ethnic majority, showed a 48%
statistical power. Similarly, the highest non-significant prevalence of polyparasitism in women
with versus without access to handwashing facilities, showed a 10% statistical power. Although
having stool analysis sub-groups (one sample versus two samples versus qPCR), with different
sample sizes, consistently showed low prevalence of pathogenic parasites, it limited the power of
our findings. Addition of the differences in sensitivity for each type of analysis, further limits
inference of the real IPI prevalence. Diagnostic sensitivity of one single stool sample is 76%, 92%
for two stool samples and 100% for qPCR.
Similar to the IPI study, in the RS study the power of the findings was 30% (231), affected by
imputation of over half of the hygiene data, which negatively impacted the validity of the findings
related to this variable. Thus, it is not possible to draw inferences due to the high beta error, a
consequence of the low power. Increased odds for rhinitis in the first trimester, compared with the
second and third trimesters, showed a 10% and 17% power, respectively. The nonlinear association
identified between NDVI (Q1 vs Q4) and allergic rhinitis showed a 15% power.
88
In conclusion, limitations achieving the sample size affected the power of inference of our results.
Therefore, our findings described only the characteristics of a specific study population in one
specific time.
4.2.2.3. Limitations of study design
A cross-sectional design study simultaneously evaluated exposure and outcomes to establish
associations, but not causal inference (263). Added to that, in the IPI study, making association
inferences of the findings was limited by missing questionnaire information evaluating exposure
data specifically related to monthly income, trimester of pregnancy, last deworming, as well as
missing stool samples, the latter evaluating the outcome variable. In the RS study, more than 50%
of exposure variables related to indoor housing facilities and construction materials were missing,
which limited the possibility of evaluating the real associations with respiratory symptoms. This
imputation may be hiding the real situation regarding these variables in populations living in
conditions with highest vulnerability.
4.2.2.4. Limitations of questionnaire used in the study
Questionnaire limitations were related to sections that, to be answered, required access to the home
of the study participant by a research team member. When access did not occur, these information
gaps hindered exposure data related to housing conditions relevant to both the IPI and RS studies.
The USAID Demographic and Health Surveys Program (232), when using questionnaires as basis
of a study, logistically deploys teams of trained interviewers composed of both men and women
who together visit the home, and are supported by fieldwork leaders and field editors who, in situ,
review data quality. The present study was performed with limited resources that did not permit a
similar field strategy.
Regarding RS, outcome variables were collected through self-reporting which can inherently
generate recall bias. However, the questions used in our survey were selected from internationally
validated questionnaires. Our main limitation was that the exposure variables for housing factors
and air pollution were proxy variables. Although Bogotá has 14 environmental air monitors widely
spread across the city (264), they are not sufficient to identify environmental pollution for each
neighborhood and district. The housing indices used in this study included proxy indicators, some
of which were socioeconomic factors perhaps not fully representative of housing conditions.
.
89
4.2.2.5. Limitations of IPI laboratory methods
Study limitations related to the laboratory methods were, on one hand related to the diagnostic
performance of the combined technique which improves with serial stool samples (265), and, on
the other hand, related to the number of stool samples studied with PCR. Obtaining double stool
sampling in 20% of the study population limited our diagnostic capacity of intestinal parasites.
The increased IPI prevalence we found with a second stool sample supports the use of serial
sampling to achieve better diagnostic capacity. This suggests that IPI prevalence in the study
population may be higher than estimated. Molecular diagnosis using PCR techniques, with 100%
specificity and close to 100% sensitivity (266, 267), was only possible in 9% of the study
population, and revealed higher prevalence of two parasites than with the combined technique.
Similar to our double stool sampling results, this observation implies that, had we been able to use
PCR in all participants, we would have most likely detected a higher proportion of intestinal
parasites. Financial constraints, however, did not permit comprehensive PCR use in all samples.
4.2.2.6. Limitations of statistical methods
The statistical methods used in this study were those originally proposed. In the RS study,
however, 55% of housing construction variables and 7-26% of indoor home facilities variables
were imputed. Since lack of access to home visits predominated in participants who lived in more
vulnerable conditions, these missing data could have revealed more deficient residential
infrastructure.
4.3. Study Findings in Comparison with Other National and International Studies
We investigated two health disorders in which the prevalence in pregnant women living
specifically in marginalized districts of Bogotá and Colombia, in general, was previously
unknown. On the one hand, the study of IPI can provide an approximate overview of
environmental factors associated with sanitary conditions and transmission routes. On the other
hand, studying RS as chronic non-transmissible diseases can deliver a landscape of environmental
factors associated with environmental pollution and living conditions.
Regarding IPI, we found a low prevalence of pathogenic parasites which may reflect the positive
effects of public anti-helminthic therapy prevention programs, the good quality of potable water
in the city, as well as the presence of running water and sewage systems that decrease the
90
likelihood of pathogen transmission. Although this was expected when studying this population in
the capital city of an upper middle-income country, our research also revealed a prevalence of up
to 25% of commensal intestinal protozoa, some of which are of disputed pathogenicity, a finding
that may point to the persistence of fecal-oral contamination routes in our participating pregnant
women. This outcome could be explained through chains of transmission that may still be present
in overcrowded family homes built with inadequate infrastructure. This result is also supported by
the presence of intestinal polyparasitism, which was also higher in pregnant women belonging to
ethnic minorities and in participants who did not have sinks for handwashing in their homes, an
indication of lower economic conditions often seen in self-built or poor infrastructure housing.
These are all characteristics expected in a country with high inequality.
Regarding RS, the prevalence of asthma and rhinitis in this study was within the range previously
reported in the general population in Bogotá. Access to green spaces was inversely correlated with
prevalence of rhinitis and living away from the main streets was a risk factor for rhinitis and
asthma. These findings are consistent with the physical and socioeconomic environment described,
in which study participants living at a distance from green spaces and the main streets are precisely
those living in lower quality housing and unsafe conditions. We hypothesize that these RS are
additionally determined by the stressful context of living in such conditions.
The environmental factors that we found associated with pregnant women in our study are
determined by socioeconomic conditions worth exploring in the future. Although the challenging
access to the participants prevented us from achieving a better sampling power, we perhaps are
seeing only the tip of the iceberg. To further understand and correct the vulnerable nature of
marginalized urban pregnant women, future studies require the participatory support of local
health organizations, community leaders and the police to better access vulnerable pregnant
women, but also to fund an advanced longitudinal community-centered research through
constructive and sustainable fieldwork in Colombia.
Our study provides the first evidence that, in pregnancy, access to green space may be inversely
associated with allergic rhinitis in a vulnerable urban neighborhood of an upper middle-income
country. At the same time, vulnerability, as indicated by living distance to the main street, might
outweigh the effects of housing conditions on respiratory health. The social conditions in Ciudad
Bolívar, evident on economic limitations, high insecurity, and neighborhoods that are difficult to
access (268), provide a unique context to explain our findings regarding greenness and air
91
pollution. Future studies are needed to dissect and control for these variables to more clearly assess
the effects of environmental exposures on respiratory disorders in this population. Because of
security and housing conditions in our study population, we consider that the RS identified can be
mediated by the vulnerability, environmental and socioeconomic conditions. Although these could
all point to the non-atopic nature of the RS, future studies must typify them to confirm this
hypothesis in our population.
4.3.1. General study population characteristics
The distribution by socioeconomic strata in our study population is similar to that of Ciudad
Bolívar District. Specifically, 62% of the study participants lived in stratum 1, similar to the 59%
proportion of Ciudad Bolívar. Moreover, our 39% of study participants living in stratum 2 was
comparable with the 35% in Bogotá. Overall then, regarding socioeconomic strata, our study
population more closely resembled the district of Ciudad Bolívar. Regarding affiliation to the
social security system, in our study, 85% of participants were affiliated, much lower than the
affiliation coverage in Bogotá and Colombia, ranging from 95% nationwide to 99.8% in Usaquén.
Regarding levels of education, 71% of study participants had secondary education, a higher
proportion than the three districts individually, Bogotá and Colombia. Participants also
proportionally had higher post-secondary education than inhabitants of Ciudad Bolívar, but lower
than those living in other districts, Bogotá and Colombia. For occupation, data to compare our
findings regarding stay-at-home women and women who study, were not available. Participant
distribution by occupation including 55% working in sales and services, and 45% in other
occupations, was similar to that reported for the districts of Usaquén and Kennedy, as well as for
Bogotá and Colombia. In contrast, data from Ciudad Bolívar showed a much higher 79%
proportion of women working in sales and services. The proportion of single women in our study
was similar to all women and all pregnant women in Bogotá and Colombia. It is noticeable that
our study included a high proportion of displaced women, similar to the 20% reported in Ciudad
Bolívar but higher than the nationwide Colombian 15% average. In this study, 7% of participants
self-identified as belonging to an ethnic group, higher than those separately reported in the three
districts, similar to Bogotá and lower than Colombia. In our study the 73% of participating women
with income equal or lower than one monthly minimum wage was much higher than that of women
living in the comparing districts, Bogotá and Colombia, where proportions were between 13% in
Kennedy District and 43% in Colombia. This research included 31% of pregnant women under
age 20, a higher proportion than those reported in Bogotá and Colombia, ranging between 15% in
92
Bogotá and up to 25% in Ciudad Bolívar. In conclusion, sociodemographic characteristics of
participants in this study showed particular differences, not comparable with the districts, Bogotá
and Colombia. Specifically, our study participants included a high proportion of women living in
socioeconomic stratum 1, with secondary education, first pregnancy under age 20, displaced and
with income lower than one minimum wage (Table 4.1).
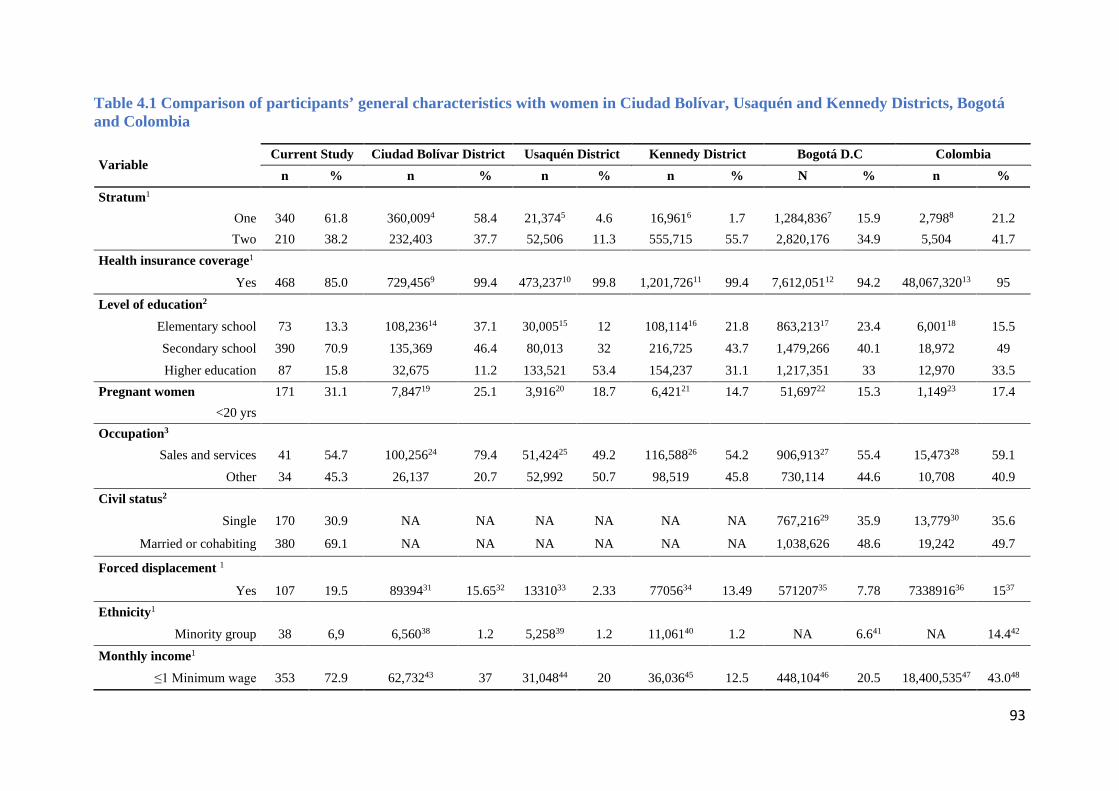
93
Table 4.1 Comparison of participants’ general characteristics with women in Ciudad Bolívar, Usaquén and Kennedy Districts, Bogotá and Colombia
Variable Current Study Ciudad Bolívar District Usaquén District Kennedy District Bogotá D.C Colombia
n % n % n % n % N % n % Stratum1
One 340 61.8 360,0094 58.4 21,3745 4.6 16,9616 1.7 1,284,8367 15.9 2,7988 21.2 Two 210 38.2 232,403 37.7 52,506 11.3 555,715 55.7 2,820,176 34.9 5,504 41.7
Health insurance coverage1 Yes 468 85.0 729,4569 99.4 473,23710 99.8 1,201,72611 99.4 7,612,05112 94.2 48,067,32013 95
Level of education2
Elementary school 73 13.3 108,23614 37.1 30,00515 12 108,11416 21.8 863,21317 23.4 6,00118 15.5 Secondary school 390 70.9 135,369 46.4 80,013 32 216,725 43.7 1,479,266 40.1 18,972 49 Higher education 87 15.8 32,675 11.2 133,521 53.4 154,237 31.1 1,217,351 33 12,970 33.5
Pregnant women 171 31.1 7,84719 25.1 3,91620 18.7 6,42121 14.7 51,69722 15.3 1,14923 17.4 <20 yrs
Occupation3
Sales and services 41 54.7 100,25624 79.4 51,42425 49.2 116,58826 54.2 906,91327 55.4 15,47328 59.1 Other 34 45.3 26,137 20.7 52,992 50.7 98,519 45.8 730,114 44.6 10,708 40.9
Civil status2
Single 170 30.9 NA NA NA NA NA NA 767,21629 35.9 13,77930 35.6
Married or cohabiting 380 69.1 NA NA NA NA NA NA 1,038,626 48.6 19,242 49.7
Forced displacement 1
Yes 107 19.5 8939431 15.6532 1331033 2.33 7705634 13.49 57120735 7.78 733891636 1537 Ethnicity1
Minority group 38 6,9 6,56038 1.2 5,25839 1.2 11,06140 1.2 NA 6.641 NA 14.442 Monthly income1
≤1 Minimum wage 353 72.9 62,73243 37 31,04844 20 36,03645 12.5 448,10446 20.5 18,400,53547 43.048
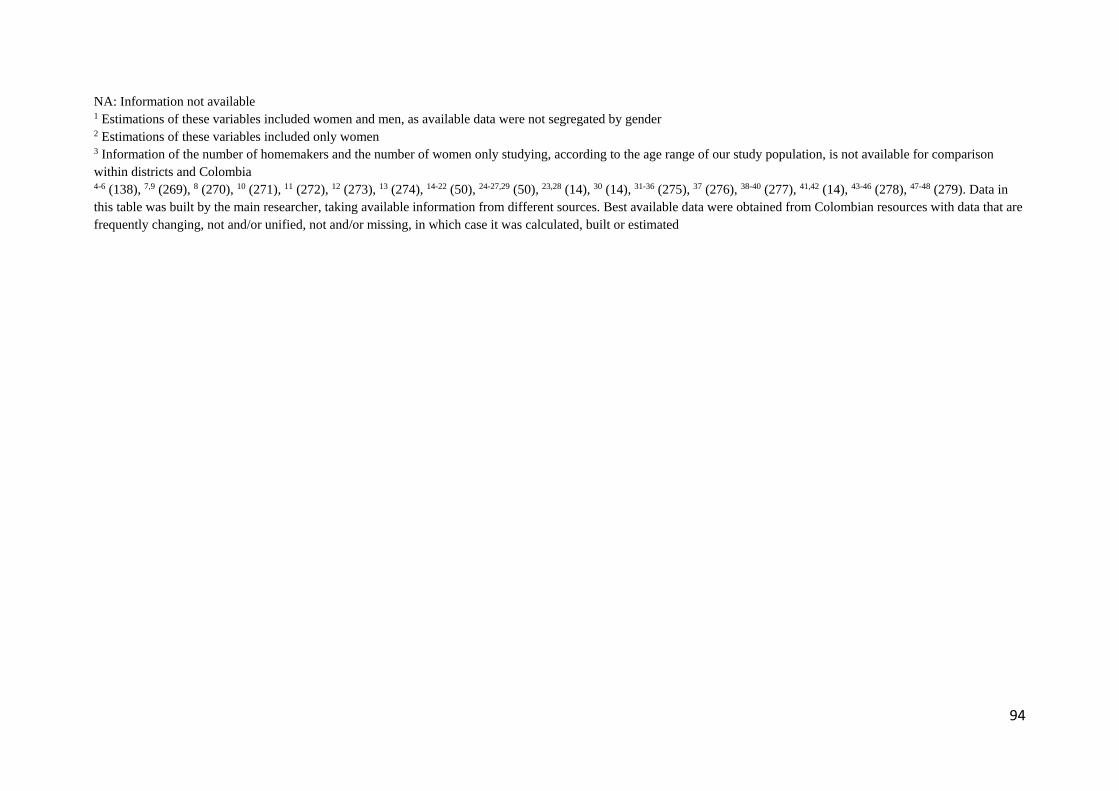
94
NA: Information not available 1 Estimations of these variables included women and men, as available data were not segregated by gender 2 Estimations of these variables included only women 3 Information of the number of homemakers and the number of women only studying, according to the age range of our study population, is not available for comparison within districts and Colombia 4-6 (138), 7,9 (269), 8 (270), 10 (271), 11 (272), 12 (273), 13 (274), 14-22 (50), 24-27,29 (50), 23,28 (14), 30 (14), 31-36 (275), 37 (276), 38-40 (277), 41,42 (14), 43-46 (278), 47-48 (279). Data in this table was built by the main researcher, taking available information from different sources. Best available data were obtained from Colombian resources with data that are frequently changing, not and/or unified, not and/or missing, in which case it was calculated, built or estimated
95
4.3.2. Prevalence of intestinal parasitic infections
Prevalence with one stool sample per participant for any parasite was 41% and less than 2% for
any pathogenic parasite. The detection of parasite infections was increased with two stool samples,
as previously reported by Cartwright (237). Despite this increased sensitivity, we verified the low
prevalence of pathogenic intestinal parasites in our participants. Physiologic constipation during
pregnancy, unsafe conditions during fieldwork and geographical limitations for access, were all
factors that constrained the collection of second samples in more participants. Double stool
sampling in the study, if increased, would have likely shown a more accurate IPI prevalence. Based
on the agreement analyses between the first and second stool samples, first, there was a low
agreement when both samples were independently analyzed, and second, there were statistically
significant differences in the detection of pathogenic parasites and polyparasitism between both
samples. These findings may be explained by the non-continuous parasite excretion in stools (280),
and by the stronger diagnostic performance achieved with serial, rather than independent,
sampling, demonstrated by a higher parasite detection when the sum of both samples is considered
(281). Overall, the diagnostic capacity of this study was negatively affected by the lack of serial
sampling in all participants.
A low prevalence of pathogenic parasites was confirmed by qPCR amplification, although, when
compared with the combined microscopy techniques, this molecular analysis identified a higher
prevalence of B. hominis and G. lamblia. As expected, there was a low relative positive agreement
between both techniques, since qPCR has a sensitivity in stool samples of up to 100% with a
primer-determined specificity of 100% (266, 267). This optimal sensitivity is superior to the
detection reported when combining three techniques (direct, concentration and Kato-Katz) of 47%
for T. trichiura, 75% for hookworms and 78% for A. lumbricoides (236). Of these three parasites,
our study using direct, concentration and qPCR techniques only detected A. lumbricoides in 0.3%
of stool samples. If in our study we could have used qPCR to analyze all stool samples, it would
have been possible to achieve a more precise prevalence of intestinal parasites. Thus, prevalence
findings in this study are likely underestimating the real IPI prevalence in participants.
This research is the first study establishing the prevalence of intestinal parasitism during pregnancy
in Colombia and identifying associated environmental factors. Until now, such studies have mainly
focused on pediatric populations and reported intestinal parasitism prevalence ranging between
11% and 50%. Two large scale studies have confirmed these findings, first one PAHO database
96
from country-specific point prevalence studies (74) and second by a 2012-2014 cross sectional
national study to identify IPI prevalence in school children (282). In the general population, a
1985-1986 cross-sectional study with 205 people aged 0-64 years living in marginal
neighborhoods in Bogotá, found a 31% prevalence of both, A. lumbricoides and E. coli, 15% T.
trichiura, 13% E. histolytica, 11% E. nana, 8% G. lamblia and I. Bütschlii, 3% H. nana and 1%
S. stercoralis. The group age with a higher prevalence of parasitism was 5-14 years, except for E.
histolytica, most prevalent at age 25-44 (227). In contrast, our results showed a decreased
prevalence of pathogenic parasites which could indicate that environmental, socioeconomic and
hygienic conditions were better in our population, and our prevalence of non-pathogenic parasites
(E. coli 8% and E. nana 15%) were closely similar to those reported by Agudelo et al. (227) (Table
4.2).
A 2012-2013 study in Bogotá (82) with children 0-5 years old and living in low socioeconomic
conditions, reported a high prevalence of intestinal parasitism, mainly pathogenic protozoa (G.
lamblia 19% and E. histolytica/dispar complex 8%) and protozoa of debated pathogenicity (mainly
B. hominis 10%). It also found a low prevalence of helminths including H. nana 1%, T. trichiura
1% and A. lumbricoides 1%. Although this study was performed in Usaquén, one of the districts
included in our study, the higher prevalence of pathogenic protozoa reported when compared with
our findings, may be due to studying children who have a developing immune system and depend
on others to practice behaviors that prevent parasitic transmission (283). Moreover, in children
found to have intestinal parasites, 50% lived in areas without access to piped water or sewage
systems, compared with our study population, in which less than 1% of participants lacked these
services (Table 4.2).
The Colombian national survey of parasitism (282) evaluated IPI prevalence in approximately
7,800 children nationwide, using the combined microscopy and Kato-Katz techniques. The most
common parasite was B. hominis with 52% prevalence, two times the reported in our study. The
most common pathogenic parasite was T. trichiura with 18% prevalence, not identified in our
study. Associated factors included living in a rural zone, belonging to an ethnic group, affiliation
to subsidized health coverage, low household income and walking barefoot. The survey also
reported low IPI prevalence in children not recently dewormed with anti-parasitic drugs. Although
it focused on children, the survey did not assess children living in Bogotá. Although it is not
comparable with our study, it identified factors associated with IPI (Table 4.2).
97
A 2011 cross-sectional study of 90 school children living in poor socioeconomic conditions in
urban Medellin (236), analyzed single stool samples collected from each participant, with three
different diagnostic methods, namely, direct examination, Ritchie’s concentration and Kato-Katz
techniques. This study did not, however, assess sociodemographic and environmental
characteristics of the participating schoolchildren. Prevalence reported for soil-transmitted
helminths included 64% for T. trichiura, 44% for A. lumbricoides and 9% for hookworms. The
diagnostic sensitivity and ability to determine degree of infection were similar when comparing
Kato-Katz versus combined direct/Ritchie techniques for A. lumbricoides and hookworms, and
slightly lower for T. trichiura with Kato-Katz alone. These findings showed higher geohelminth
prevalence than in our study, as it was done with schoolchildren living in a city with environmental
characteristics more favorable to helminth life cycles. The comparable sensitivity between Kato-
Katz, the method recommended by the World Health Organization, and the combined microscopy
technique used in our study, further supports the validity of the IPI prevalence found in our study
population (Table 4.2).
A 2005 cross-sectional study in Tunja, Colombia, a city with similar weather and altitude to
Bogotá, where 507 school children and adolescents, aged 5-18 years, showed a 90% overall IPI
prevalence, with B. hominis showing the highest prevalence of 67%, followed in descending order
by E. nana 47%, E. coli 32%, E. histolytica/dispar complex 9%, G. lamblia 8%, I. bütschlii 4%
and T. trichiura 1% (133). Chronic malnutrition was present in 34% of girls and 22% of boys.
Similar to our findings, this study showed higher protozoal, rather than helminthic, IPI prevalence,
an observation that may be partially explained by the similar climatic conditions of Tunja and
Bogotá, both unfavorable to helminthic life cycles. Finally, the protozoal prevalence described in
Tunja is higher than in our study, consistent with the much lower age bracket of the study
population (Table 4.2).
A 2004 cross-sectional study in a Colombian general community, included 382 individuals aged
15-44 living in a rural area without sanitary infrastructure in a tropical northern coast of Colombia.
It found that 92% of participants had at least one intestinal parasite with 60% E. coli, 56% A.
lumbricoides, 54% E. histolytica/dispar complex, 53% T. trichiura, 36% E. nana, 29% B. hominis,
21% I. butschilii, 17% G. lamblia, 6% uncinaria, 4% H. nana and 3% S. stercoralis (87).
Compared with our study, it showed higher prevalence for all parasites, explained by the sea level
community location favoring parasitic life cycles, and the rural community setting with poor
sanitary infrastructure, open defecation, water delivery by tank trucks, 12% illiteracy and 39%
98
incomplete primary school. In contrast, in our study, basic sanitary conditions corresponded with
the urban sanitary infrastructure of the capital city, with less favorable climatic conditions for
parasite life cycles and a community with a higher educational level (Table 4.2).
Overall, these studies show that both, pathogenic and non-pathogenic parasites are prevalent in
urban and rural Colombian communities, and that socioeconomic and sanitary characteristics such
as belonging to an ethnic group in vulnerable conditions, subsidized health insurance, low income,
wearing no shoes at home and dirt floors (227, 282), may be important conditions to favor the
develop of IPI prevalence. Furthermore, differences in prevalence for each parasite within the
same community, although sharing similar risk factors, suggest that there are particular
environmental conditions and host characteristics, such as nutritional and immunological status
and age, that favor higher prevalence for specific parasites (282).
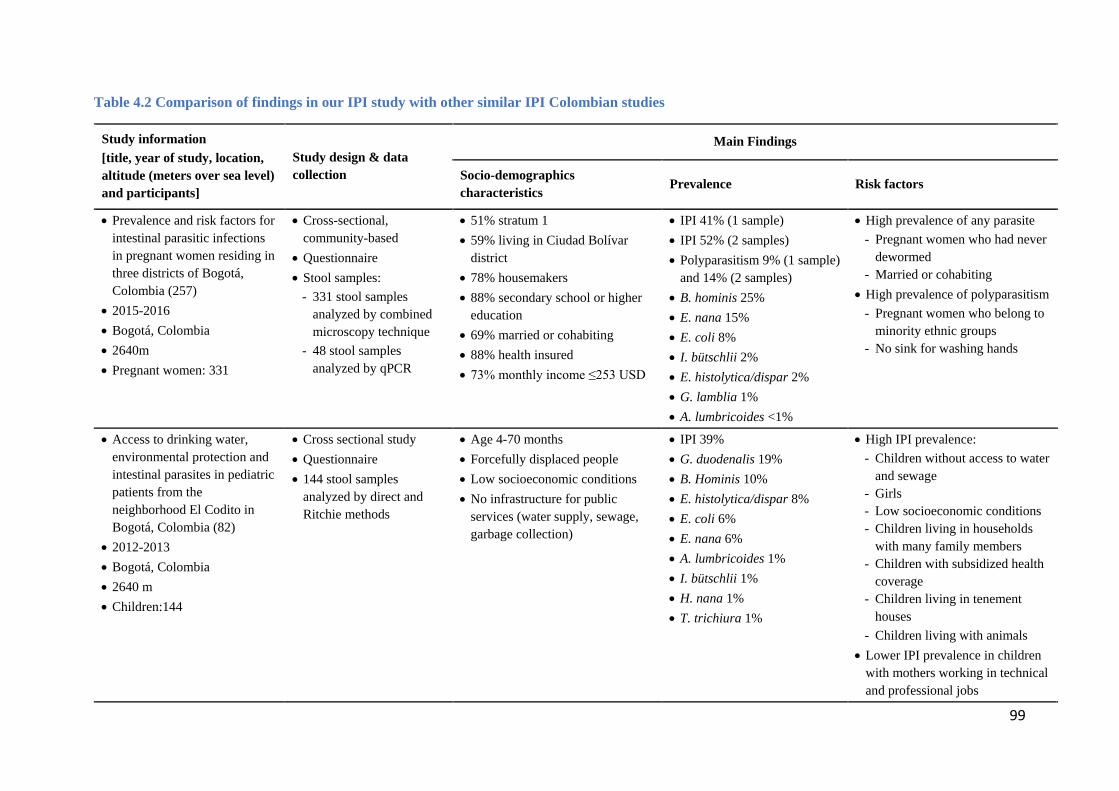
99
Table 4.2 Comparison of findings in our IPI study with other similar IPI Colombian studies
Study information [title, year of study, location, altitude (meters over sea level) and participants]
Study design & data collection
Main Findings
Socio-demographics characteristics Prevalence Risk factors
• Prevalence and risk factors for intestinal parasitic infections in pregnant women residing in three districts of Bogotá, Colombia (257)
• 2015-2016 • Bogotá, Colombia • 2640m • Pregnant women: 331
• Cross-sectional, community-based
• Questionnaire • Stool samples:
- 331 stool samples analyzed by combined microscopy technique
- 48 stool samples analyzed by qPCR
• 51% stratum 1 • 59% living in Ciudad Bolívar
district • 78% housemakers • 88% secondary school or higher
education • 69% married or cohabiting • 88% health insured • 73% monthly income ≤253 USD
• IPI 41% (1 sample) • IPI 52% (2 samples) • Polyparasitism 9% (1 sample)
and 14% (2 samples) • B. hominis 25% • E. nana 15% • E. coli 8% • I. bütschlii 2% • E. histolytica/dispar 2% • G. lamblia 1% • A. lumbricoides <1%
• High prevalence of any parasite - Pregnant women who had never
dewormed - Married or cohabiting
• High prevalence of polyparasitism - Pregnant women who belong to
minority ethnic groups - No sink for washing hands
• Access to drinking water, environmental protection and intestinal parasites in pediatric patients from the neighborhood El Codito in Bogotá, Colombia (82)
• 2012-2013 • Bogotá, Colombia • 2640 m • Children:144
• Cross sectional study • Questionnaire • 144 stool samples
analyzed by direct and Ritchie methods
• Age 4-70 months • Forcefully displaced people • Low socioeconomic conditions • No infrastructure for public
services (water supply, sewage, garbage collection)
• IPI 39% • G. duodenalis 19% • B. Hominis 10% • E. histolytica/dispar 8% • E. coli 6% • E. nana 6% • A. lumbricoides 1% • I. bütschlii 1% • H. nana 1% • T. trichiura 1%
• High IPI prevalence: - Children without access to water
and sewage - Girls - Low socioeconomic conditions - Children living in households
with many family members - Children with subsidized health
coverage - Children living in tenement
houses - Children living with animals
• Lower IPI prevalence in children with mothers working in technical and professional jobs
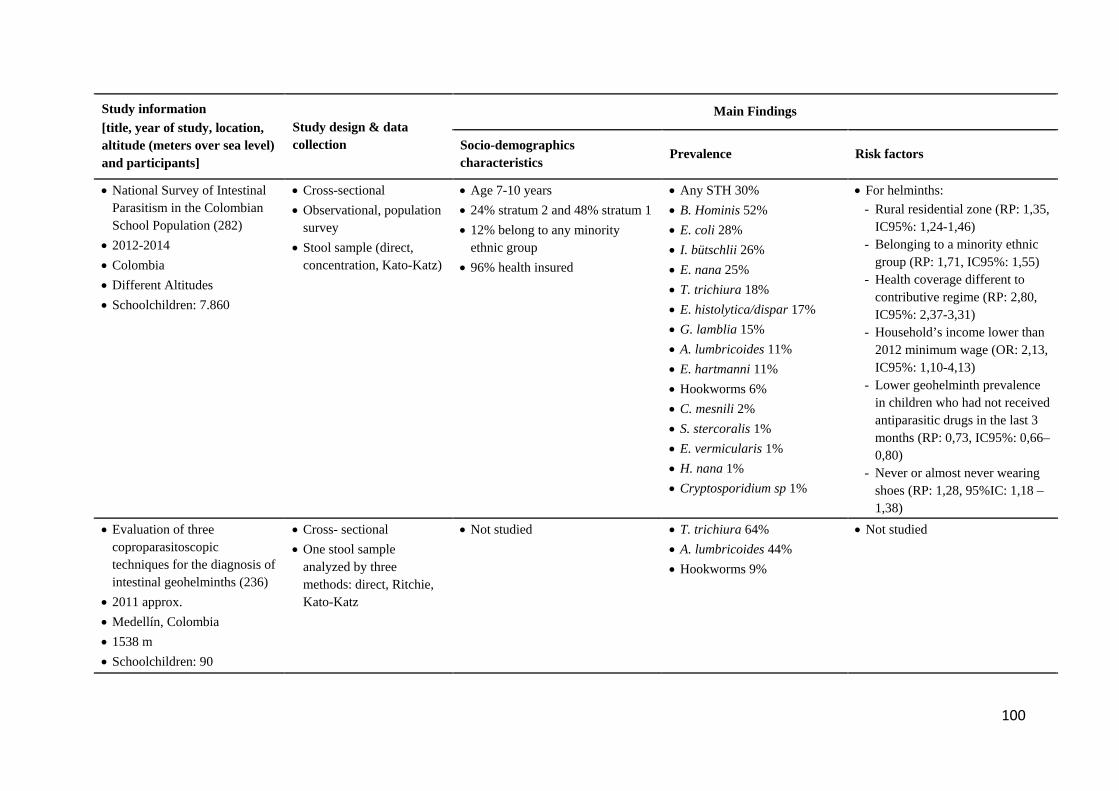
100
Study information [title, year of study, location, altitude (meters over sea level) and participants]
Study design & data collection
Main Findings
Socio-demographics characteristics Prevalence Risk factors
• National Survey of Intestinal Parasitism in the Colombian School Population (282)
• 2012-2014 • Colombia • Different Altitudes • Schoolchildren: 7.860
• Cross-sectional • Observational, population
survey • Stool sample (direct,
concentration, Kato-Katz)
• Age 7-10 years • 24% stratum 2 and 48% stratum 1 • 12% belong to any minority
ethnic group • 96% health insured
• Any STH 30% • B. Hominis 52% • E. coli 28% • I. bütschlii 26% • E. nana 25% • T. trichiura 18% • E. histolytica/dispar 17% • G. lamblia 15% • A. lumbricoides 11% • E. hartmanni 11% • Hookworms 6% • C. mesnili 2% • S. stercoralis 1% • E. vermicularis 1% • H. nana 1% • Cryptosporidium sp 1%
• For helminths: - Rural residential zone (RP: 1,35,
IC95%: 1,24-1,46) - Belonging to a minority ethnic
group (RP: 1,71, IC95%: 1,55) - Health coverage different to
contributive regime (RP: 2,80, IC95%: 2,37-3,31)
- Household’s income lower than 2012 minimum wage (OR: 2,13, IC95%: 1,10-4,13)
- Lower geohelminth prevalence in children who had not received antiparasitic drugs in the last 3 months (RP: 0,73, IC95%: 0,66–0,80)
- Never or almost never wearing shoes (RP: 1,28, 95%IC: 1,18 – 1,38)
• Evaluation of three coproparasitoscopic techniques for the diagnosis of intestinal geohelminths (236)
• 2011 approx. • Medellín, Colombia • 1538 m • Schoolchildren: 90
• Cross- sectional • One stool sample
analyzed by three methods: direct, Ritchie, Kato-Katz
• Not studied • T. trichiura 64% • A. lumbricoides 44% • Hookworms 9%
• Not studied
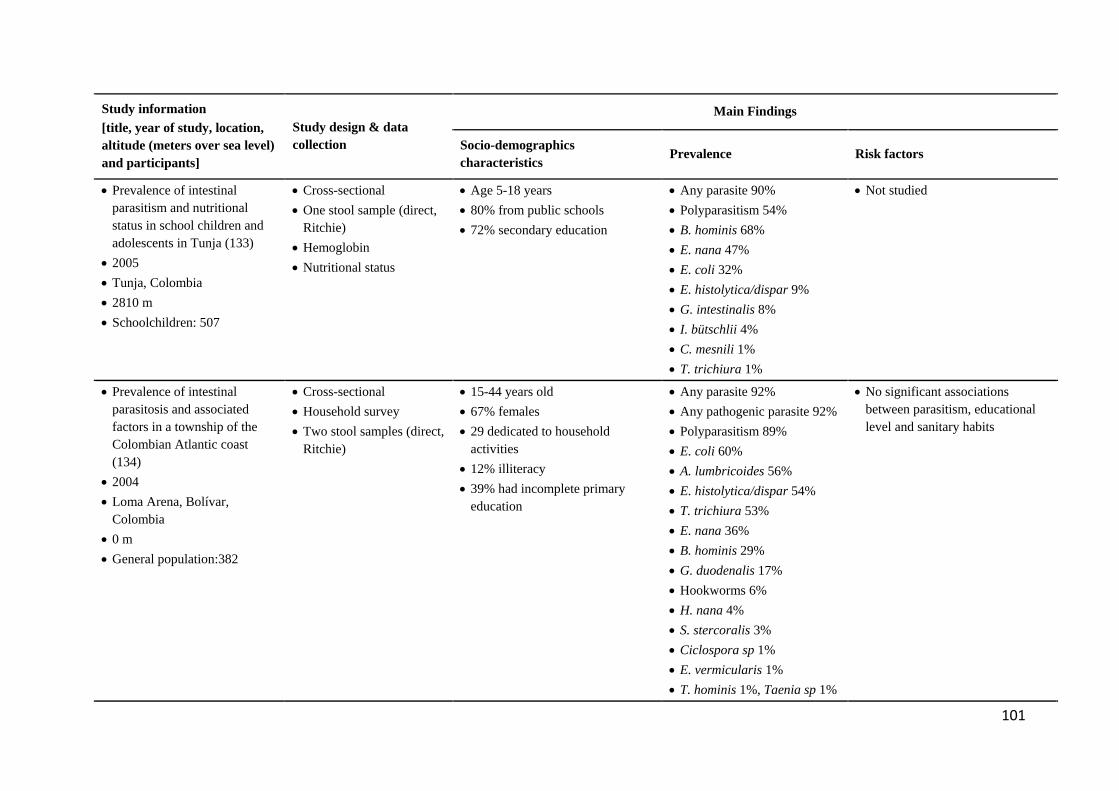
101
Study information [title, year of study, location, altitude (meters over sea level) and participants]
Study design & data collection
Main Findings
Socio-demographics characteristics Prevalence Risk factors
• Prevalence of intestinal parasitism and nutritional status in school children and adolescents in Tunja (133)
• 2005 • Tunja, Colombia • 2810 m • Schoolchildren: 507
• Cross-sectional • One stool sample (direct,
Ritchie) • Hemoglobin • Nutritional status
• Age 5-18 years • 80% from public schools • 72% secondary education
• Any parasite 90% • Polyparasitism 54% • B. hominis 68% • E. nana 47% • E. coli 32% • E. histolytica/dispar 9% • G. intestinalis 8% • I. bütschlii 4% • C. mesnili 1% • T. trichiura 1%
• Not studied
• Prevalence of intestinal parasitosis and associated factors in a township of the Colombian Atlantic coast (134)
• 2004 • Loma Arena, Bolívar,
Colombia • 0 m • General population:382
• Cross-sectional • Household survey • Two stool samples (direct,
Ritchie)
• 15-44 years old • 67% females • 29 dedicated to household
activities • 12% illiteracy • 39% had incomplete primary
education
• Any parasite 92% • Any pathogenic parasite 92% • Polyparasitism 89% • E. coli 60% • A. lumbricoides 56% • E. histolytica/dispar 54% • T. trichiura 53% • E. nana 36% • B. hominis 29% • G. duodenalis 17% • Hookworms 6% • H. nana 4% • S. stercoralis 3% • Ciclospora sp 1% • E. vermicularis 1% • T. hominis 1%, Taenia sp 1%
• No significant associations between parasitism, educational level and sanitary habits
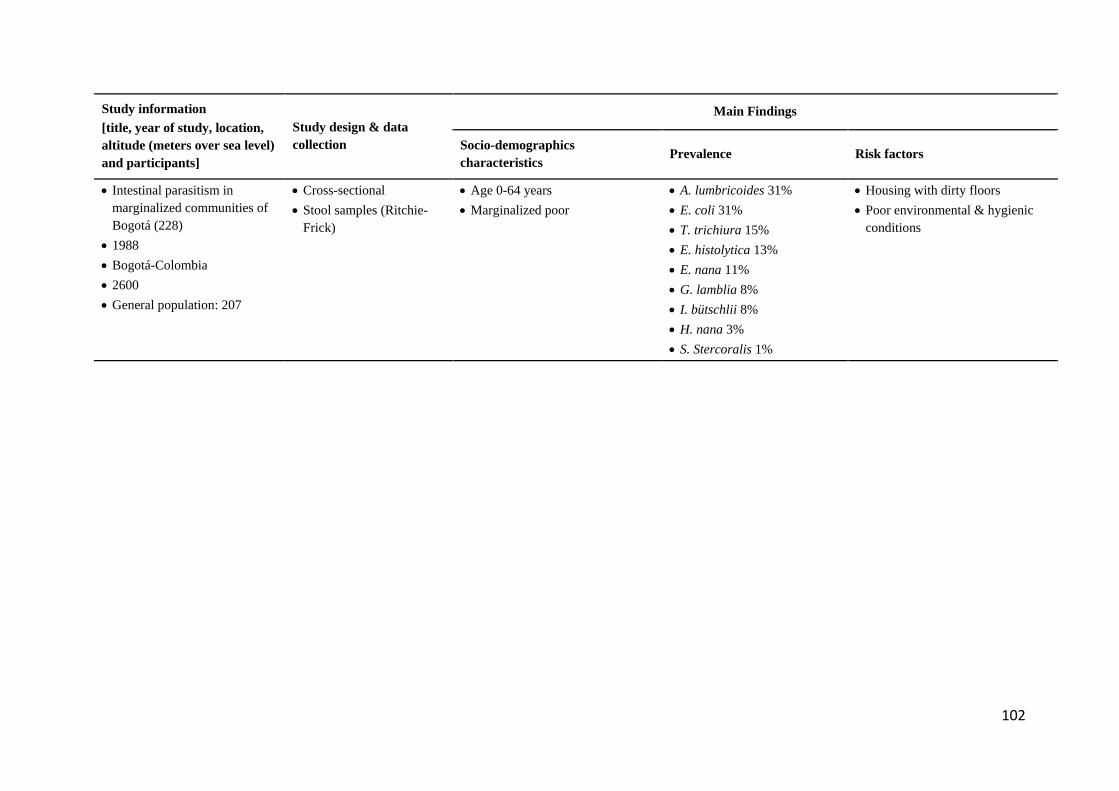
102
Study information [title, year of study, location, altitude (meters over sea level) and participants]
Study design & data collection
Main Findings
Socio-demographics characteristics Prevalence Risk factors
• Intestinal parasitism in marginalized communities of Bogotá (228)
• 1988 • Bogotá-Colombia • 2600 • General population: 207
• Cross-sectional • Stool samples (Ritchie-
Frick)
• Age 0-64 years • Marginalized poor
• A. lumbricoides 31% • E. coli 31% • T. trichiura 15% • E. histolytica 13% • E. nana 11% • G. lamblia 8% • I. bütschlii 8% • H. nana 3% • S. Stercoralis 1%
• Housing with dirty floors • Poor environmental & hygienic
conditions
103
Regarding IPI in pregnancy, we compared the findings of this study with 13 similar investigations
(Table 4.3) evaluating IPI in pregnant women in Latin America, Africa and Oceania. These were
all done with populations living at altitudes ranging between 80 and 2,800 meters above sea level,
while our study was carried out at the high altitude of 2,630 meters. Most studies (11 of 13) shared
similar cross-sectional study designs, with two exceptions being a clinical trial (284) and a
retrospective study (285). All studies were performed between 1994 (Uberlandia, Brazil) and 2016
(Mecha District, Ethiopia) and included between 153 (Kitale, Kenya) and 2,390 (Quininde,
Esmeralda Province, Ecuador) participants. Information on factors associated with IPI was mostly
collected using questionnaires. Stool parasite detection techniques included triple serial fecal
sampling in only one Mexican study that used Faust’s concentration (148). The only studies that
used three techniques, included one with Ecuadorian women in which stools were analyzed with
a combination of direct, formol-ether concentration and Kato-Katz (286), and the other with
Ethiopian participants in which stools were analyzed using direct, formol-ether concentration and
modified Ziehl-Neelsen (29). Aside from these, as in the present study, the most common parasite
stool detection involved a combination of direct and Ritchie’s concentration in four studies (284,
287-289). Finally, just one study used only direct parasite detection methods (290). Overall,
regarding parasite detection techniques, our findings are comparable only with the four studies
that used the same combined microscopy techniques in different Ethiopian and Tanzanian study
populations (Table 4.3).
Latin American studies of IPI in pregnant women revealed contrasting findings with our research.
The first study was done in Uberlandia, Brasil, where polyparasitism in pregnant women and
pathogenic parasite were reported to be higher than in our study (285). A Mexican study with
pregnant women in Minatitlan, Veracruz, assessed associations between IPI and low birth weight,
and reported higher prevalence of pathogenic parasites when compared with our study, including
66% G. lamblia, differences probably understood in the context of an education level lower than
high school in their participants, and a geographical location with warmer low-altitude weather
(148). A large multicentric study involving nine Venezuelan states that evaluated IPI and anemia
in pregnancy, found higher prevalence in all intestinal parasites, except E. nana and E. coli,
without providing a sociodemographic context sufficient to compare with our study (291). In a
study in Quininde, Ecuador, a rural low-altitude location, Cooper et al. (286) evaluated helminthic
IPIs in pregnant women in a follow-up cohort, using three detection techniques, including Kato-
Katz, a high sensitivity technique. This study found a higher STH prevalence than in our study,
likely due to its tropical setting favoring the development of parasitic cycles (292) and the use of
104
more accurate laboratory techniques.
Studies of IPI in pregnant women in Ethiopia, Kenya and Tanzania reported higher prevalence of
soil-transmitted helminths and pathogenic protozoa, when compared to our research, in which just
1% of participants had A. lumbricoides and G. lamblia. A study in the Ethiopian northwestern city
of Bahir Dar, at 1,800 meters above sea level, reported, compared with our findings, lower IPI
prevalence (32%) but higher prevalence of G. lamblia (13%) and STHs, findings interpreted by
the authors as being consistent with their use of three parasite detection techniques and local
environmental water pollution favoring fecal-oral transmission (29). At a similar high altitude of
1,780-2,566 meters above sea level in Ethiopian East Wollega, Mengist et al.(289) reported a 15%
prevalence of hookworms, parasites not found in our study, a contrasting finding that could be
understood in the context of their 63% rural population with 34% illiteracy and lack of basic
sanitary facilities. The Mecha district Ethiopian study, another high-altitude region at 1,720-2,800
meters above sea level, reported a much higher overall 71% IPI prevalence, with 33% A.
lumbricoides, 17% S. mansoni (not found in our participants) and 14% hookworms (113), findings
that may be higher due to the rural setting, overall lower education level, lack of latrines and
handwashing facilities in the community. Three studies carried out in predominantly rural
Ethiopian and Kenyan communities (287, 288, 293), all found higher IPI prevalence for pathogenic
geohelminths than this study, differences likely explained by more limited rural basic sanitary
infrastructure, warmer lower 1,357-1,600 m altitude and higher illiteracy when compared with our
study population. Similarly, a study in the agricultural town of Kitale, Kenya, with an altitude of
1,890 m above sea level, found higher intestinal helminth infections, particularly in individuals
with low educational levels (294). A study in Dar es Salaam, Tanzania, a large port city, reported,
in HIV-infected pregnant women, higher helminth and similar protozoal prevalence than in our
study, likely reflecting the sea level urban conditions of their participants (284). Only one study
from Oceania, examined IPI in pregnant women in Goroka, a small town in the highlands of Papua
New Guinea (290), and reported much higher helminth and protozoa IPI than our study,
differences likely explained by the lack of residential toilet facilities and piped drinking water in
the majority of participants, compared with 5% in our participants (Table 4.3).
Given that many IPI share common routes of transmission, polyparasitism is a common occurrence
in populations with associated risk factors. In our study, the prevalence of polyparasitism was 9%,
within the range found in two studies which reported prevalence as low as 7% in Ethiopian
pregnant women (159) and up to 33% in a Brazilian cohort (285). This variability may be explained
105
by geographic differences, age variations, diversity of health conditions and cultural practices in
different study areas (29). Polyparasitism in pregnant women was reported as low as 1% (4/372)
of women with two or more intestinal helminths (289), 1% (2/153) of women with two parasites
(294), 3% (13/384) with two different parasites (29), 5% (10/207) with two parasites and 1%
(3/207) with three parasites (148), 7% (60/908) with double infection and 1% (6/908) with triple
infection (159), 11% (53/503) having two parasites and 3% (17/503) with several parasites (285),
and as high as 35% (360/1038) with two simultaneous intestinal parasites and 8% (84/1038) with
three and 0.2% (2/1038) with more than 3 parasites (291).
Using various IPI detection techniques, we found a low prevalence of pathogenic intestinal
parasites in pregnant women, including G. lamblia and A. lumbricoides. These results contrast
with similar studies reporting higher prevalence. For G. lamblia, the 1% prevalence reported here
was the same found in 927 Tanzanian pregnant women infected with HIV (284) but lower than
the reported 2% in a Brazilian cohort (285), 3% in southeastern Ethiopia (295), 13% in
northwestern Ethiopia (29), 14% in a Venezuelan study (291), 19% in southern Ethiopia (288),
39% in New Guinea (290) and 66% in coastal Mexico (148). For A. lumbricoides, the only
helminth found in our study, the prevalence of 0.3% reported here contrasted with similar studies
reporting, in ascending order, 3% in northwestern Ethiopia (29), 3% in Brazil (285), 7% in western
Ethiopia Ethiopia (289) and in western Kenya (294), 9% in Butajira, central region from Ethiopia
(159), 14% in coastal Mexico (148) and New Guinea (290), 19% in southeastern Ethiopia (295),
23% in Ecuador (286), 29% in southern Ethiopia (288), 33% in western Ethiopia (113), 52% in
western Kenya (293), and 57% in Venezuela (291). For E. histolytica/dispar complex, the 2%
prevalence reported here was lower than the 12% reported in a large multi-state study from
Venezuela (291) and 8% in a smaller study in northwestern Ethiopia (29). In the combined
microscopy technique we used for stool samples, it was not possible to distinguish between E.
histolytica and the non-pathogenic strain Entamoeba dispar, as their morphologies are identical
(296). Nevertheless, using these microscopy techniques, the prevalence of E. histolytica/dispar
complex in this study was 1.5%. To confirm this low prevalence, multi-parallel real-time qPCR
was performed in a subgroup of stool samples using, among others, a primer targeting an 18S
rRNA target region of E. histolytica, with 100% specificity for this parasite (241). Using this
complementary technique, this study found no (zero out of 48) E. histolytica-positive stool
samples, thus confirming our microscopy findings.
In this study, most positive findings were of non-pathogenic intestinal parasites. B. hominis
106
appeared in 25% of stool samples with the combined microscopy technique, increasing to 36%
with two stool samples and 54% using PCR amplification. This protozoon is ubiquitous worldwide
and is frequently identified in stool samples (84), with a prevalence as high as 100% reported in
Senegalese children in whom B. hominis was detected with PCR (297). In contrast, prevalence as
low as 4% has been reported in children living in San Luis Potosi, a mid-size city in north-central
Mexico (77). In Colombia, using PCR amplification in stool samples, Ramirez et al. (298) detected
B. hominis in 45% (125/277) of participants from six different regions of the country. In the 125
Blastocystis-positive individuals, the protozoal subtypes found included subtype 1 (ST1) in 70
asymptomatic individuals, ST2 in 40 individuals with diarrhea (most of them with polyparasitism)
and ST3 in 15 individuals with inflammatory bowel disease. Colombian studies in schoolchildren
identified this parasite as common with over 50% prevalence (282). In a study in children attending
public daycare, Londoño-Franco et al. (299) reported a 58% prevalence in 275 children under 5
years of age, all living in strata 1 and 2. In this study, B. hominis was also found in domestic
animals, boiling water pots, and the nails of the children and their siblings, among others. In
pregnant women, Acurero et al. (27) reported a 48% prevalence of B. hominis in 120 participants
living in Maracaibo, Venezuela. Despite its debated pathogenicity, B. hominis has been reported
to cause or be associated with abdominal pain and diarrhea (300), hematological abnormalities
(301), pregnancy-related anemia (97), and immunosuppression (302). In 125 Blastocystis-positive
individuals, Ramirez et al. (298) found that 56% were asymptomatic and 12% had symptoms
compatible with inflammatory bowel disease. More recently, Ramirez et al. (303) reported that
72% of children positive for B. hominis were asymptomatic, with just 11% showing abdominal
pain and 2% diarrhea. In contrast, a study of outpatients with digestive disorders in Spain reported
a 7% prevalence of B. hominis infestation (304). The major routes of transmission include drinking
water, food, direct human-to-human contact, and zoonotic infections (300).
Aside from B. hominis, other prevalent non-pathogenic parasites included E. nana and E. coli.
Regarding E. nana, in this study, the prevalence of 15% in pregnant women contrasts with 2% in
the Brazilian study done in pregnant women (285) and the 25% in a Venezuelan study (27). For
E. coli, the prevalence of 5% in this study is lower than the reported range between 13% (27) and
19% (285) in similar cohorts and the 9% reported in HIV-infected Tanzanian women (284).
The presence and intensity of fecal-oral routes of transmission, particularly in study areas where
fecal contamination of water and food may occur, may be evidenced by analyzing the overall
prevalence of non-pathogenic and pathogenic intestinal parasite species (282). In our study, the
107
high prevalence of non-pathogenic and low prevalence of pathogenic parasites may be interpreted
in relation to host, environment and parasitic factors. Intestinal parasitism in pregnant women is
different from that of children and older adults, as in the latter groups, poor hygiene habits and
possible consumption of contaminated water may increase IPI prevalence (305, 306).
Environmental factors unique to our study that may explain the low prevalence of intestinal
pathogenic parasites include the good quality of potable water in Bogotá (307) and the widespread
availability of antiparasitic drugs made available through public health programs or at the UPA
(306). In addition, as is the case with Bogotá, higher education and availability of sanitary facilities
play an essential role in IPI prevention (294). Geographically, this is the first study on IPI in
pregnancy in an urban community living over 2,600 meters above sea level, where an average
temperature of 14 centigrade does not favor most helminthic life cycles but could be permissive
to less demanding environmental conditions by commensal protozoa (282).
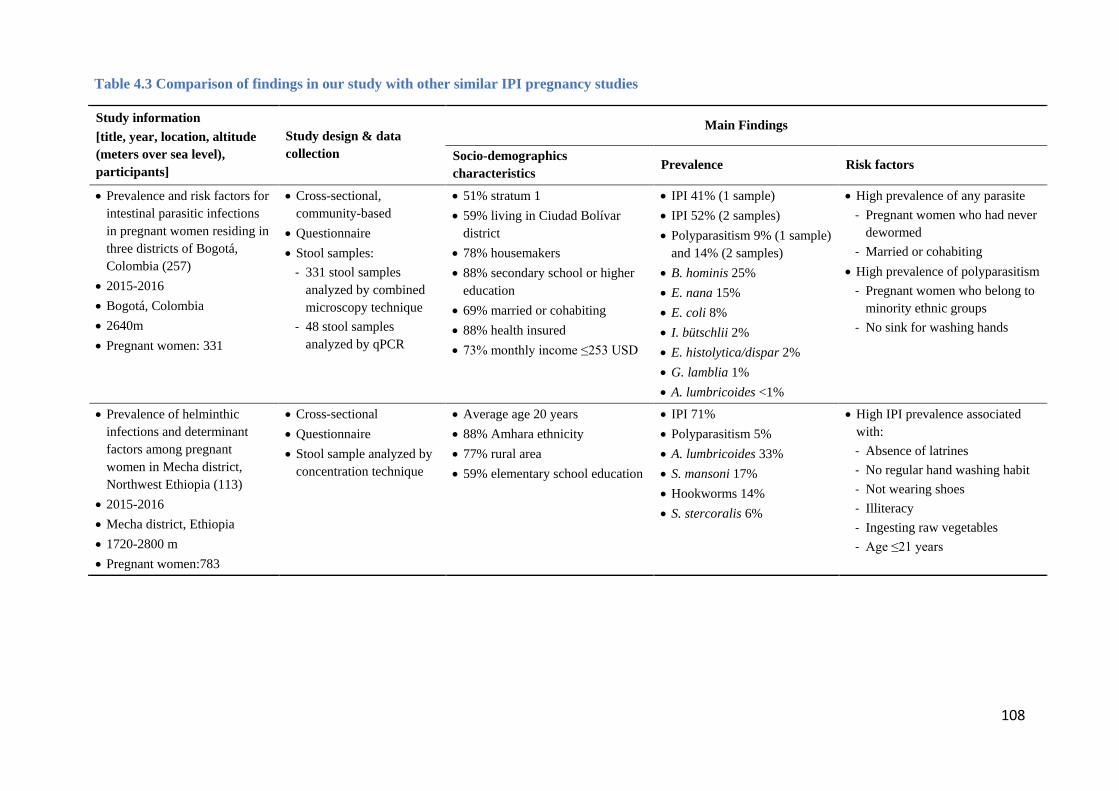
108
Table 4.3 Comparison of findings in our study with other similar IPI pregnancy studies
Study information [title, year, location, altitude (meters over sea level), participants]
Study design & data collection
Main Findings
Socio-demographics characteristics Prevalence Risk factors
• Prevalence and risk factors for intestinal parasitic infections in pregnant women residing in three districts of Bogotá, Colombia (257)
• 2015-2016 • Bogotá, Colombia • 2640m • Pregnant women: 331
• Cross-sectional, community-based
• Questionnaire • Stool samples:
- 331 stool samples analyzed by combined microscopy technique
- 48 stool samples analyzed by qPCR
• 51% stratum 1 • 59% living in Ciudad Bolívar
district • 78% housemakers • 88% secondary school or higher
education • 69% married or cohabiting • 88% health insured • 73% monthly income ≤253 USD
• IPI 41% (1 sample) • IPI 52% (2 samples) • Polyparasitism 9% (1 sample)
and 14% (2 samples) • B. hominis 25% • E. nana 15% • E. coli 8% • I. bütschlii 2% • E. histolytica/dispar 2% • G. lamblia 1% • A. lumbricoides <1%
• High prevalence of any parasite - Pregnant women who had never
dewormed - Married or cohabiting
• High prevalence of polyparasitism - Pregnant women who belong to
minority ethnic groups - No sink for washing hands
• Prevalence of helminthic infections and determinant factors among pregnant women in Mecha district, Northwest Ethiopia (113)
• 2015-2016 • Mecha district, Ethiopia • 1720-2800 m • Pregnant women:783
• Cross-sectional • Questionnaire • Stool sample analyzed by
concentration technique
• Average age 20 years • 88% Amhara ethnicity • 77% rural area • 59% elementary school education
• IPI 71% • Polyparasitism 5% • A. lumbricoides 33% • S. mansoni 17% • Hookworms 14% • S. stercoralis 6%
• High IPI prevalence associated with: - Absence of latrines - No regular hand washing habit - Not wearing shoes - Illiteracy - Ingesting raw vegetables - Age ≤21 years
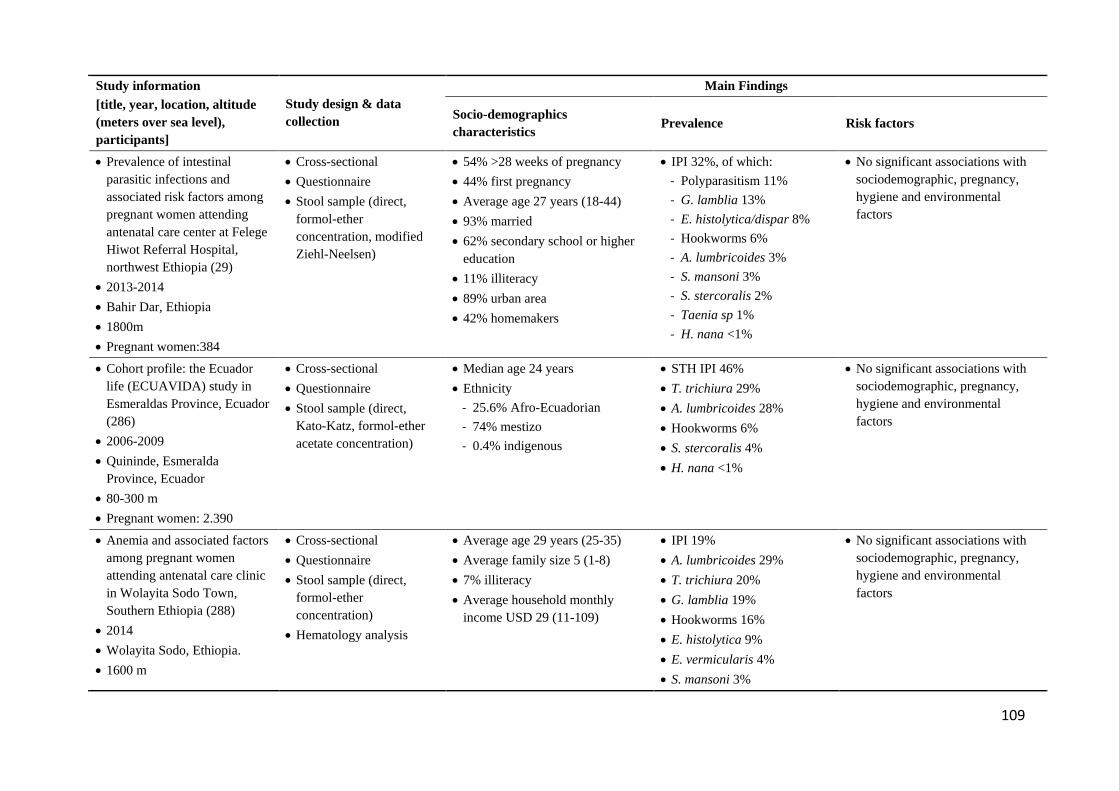
109
Study information [title, year, location, altitude (meters over sea level), participants]
Study design & data collection
Main Findings
Socio-demographics characteristics Prevalence Risk factors
• Prevalence of intestinal parasitic infections and associated risk factors among pregnant women attending antenatal care center at Felege Hiwot Referral Hospital, northwest Ethiopia (29)
• 2013-2014 • Bahir Dar, Ethiopia • 1800m • Pregnant women:384
• Cross-sectional • Questionnaire • Stool sample (direct,
formol-ether concentration, modified Ziehl-Neelsen)
• 54% >28 weeks of pregnancy • 44% first pregnancy • Average age 27 years (18-44) • 93% married • 62% secondary school or higher
education • 11% illiteracy • 89% urban area • 42% homemakers
• IPI 32%, of which: - Polyparasitism 11% - G. lamblia 13% - E. histolytica/dispar 8% - Hookworms 6% - A. lumbricoides 3% - S. mansoni 3% - S. stercoralis 2% - Taenia sp 1% - H. nana <1%
• No significant associations with sociodemographic, pregnancy, hygiene and environmental factors
• Cohort profile: the Ecuador life (ECUAVIDA) study in Esmeraldas Province, Ecuador (286)
• 2006-2009 • Quininde, Esmeralda
Province, Ecuador • 80-300 m • Pregnant women: 2.390
• Cross-sectional • Questionnaire • Stool sample (direct,
Kato-Katz, formol-ether acetate concentration)
• Median age 24 years • Ethnicity
- 25.6% Afro-Ecuadorian - 74% mestizo - 0.4% indigenous
• STH IPI 46% • T. trichiura 29% • A. lumbricoides 28% • Hookworms 6% • S. stercoralis 4% • H. nana <1%
• No significant associations with sociodemographic, pregnancy, hygiene and environmental factors
• Anemia and associated factors among pregnant women attending antenatal care clinic in Wolayita Sodo Town, Southern Ethiopia (288)
• 2014 • Wolayita Sodo, Ethiopia. • 1600 m
• Cross-sectional • Questionnaire • Stool sample (direct,
formol-ether concentration)
• Hematology analysis
• Average age 29 years (25-35) • Average family size 5 (1-8) • 7% illiteracy • Average household monthly
income USD 29 (11-109)
• IPI 19% • A. lumbricoides 29% • T. trichiura 20% • G. lamblia 19% • Hookworms 16% • E. histolytica 9% • E. vermicularis 4% • S. mansoni 3%
• No significant associations with sociodemographic, pregnancy, hygiene and environmental factors
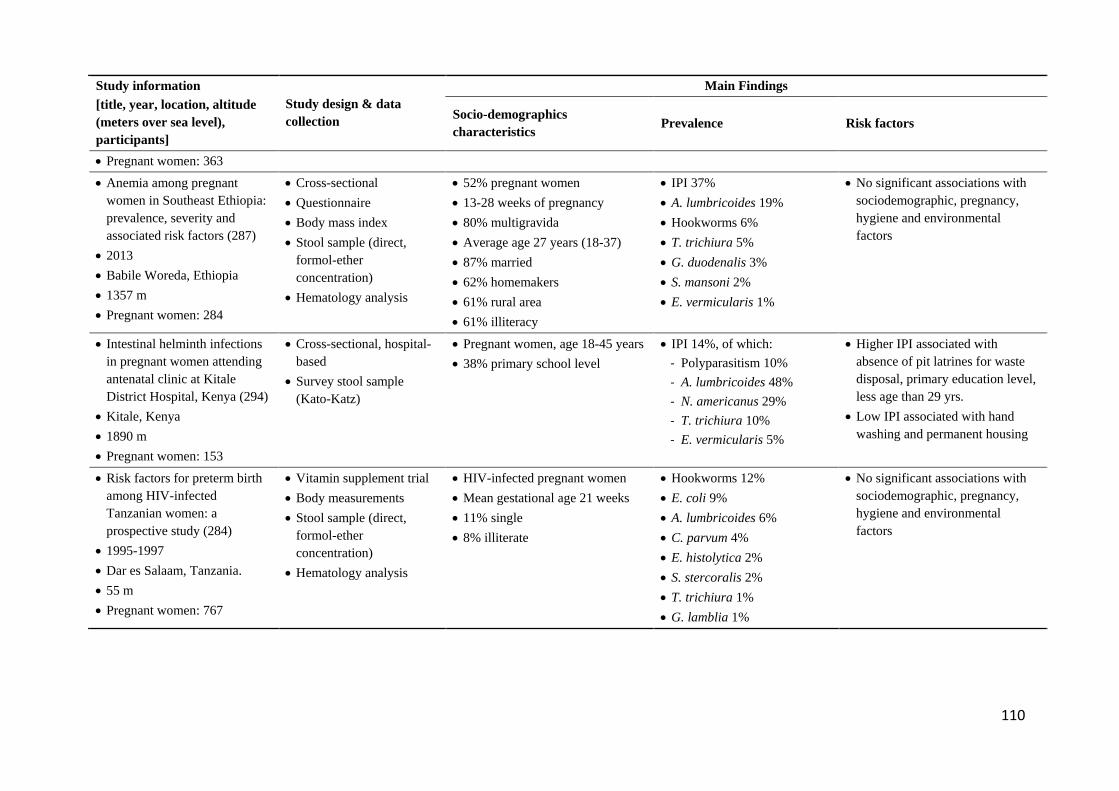
110
Study information [title, year, location, altitude (meters over sea level), participants]
Study design & data collection
Main Findings
Socio-demographics characteristics Prevalence Risk factors
• Pregnant women: 363 • Anemia among pregnant
women in Southeast Ethiopia: prevalence, severity and associated risk factors (287)
• 2013 • Babile Woreda, Ethiopia • 1357 m • Pregnant women: 284
• Cross-sectional • Questionnaire • Body mass index • Stool sample (direct,
formol-ether concentration)
• Hematology analysis
• 52% pregnant women • 13-28 weeks of pregnancy • 80% multigravida • Average age 27 years (18-37) • 87% married • 62% homemakers • 61% rural area • 61% illiteracy
• IPI 37% • A. lumbricoides 19% • Hookworms 6% • T. trichiura 5% • G. duodenalis 3% • S. mansoni 2% • E. vermicularis 1%
• No significant associations with sociodemographic, pregnancy, hygiene and environmental factors
• Intestinal helminth infections in pregnant women attending antenatal clinic at Kitale District Hospital, Kenya (294)
• Kitale, Kenya • 1890 m • Pregnant women: 153
• Cross-sectional, hospital-based
• Survey stool sample (Kato-Katz)
• Pregnant women, age 18-45 years • 38% primary school level
• IPI 14%, of which: - Polyparasitism 10% - A. lumbricoides 48% - N. americanus 29% - T. trichiura 10% - E. vermicularis 5%
• Higher IPI associated with absence of pit latrines for waste disposal, primary education level, less age than 29 yrs.
• Low IPI associated with hand washing and permanent housing
• Risk factors for preterm birth among HIV-infected Tanzanian women: a prospective study (284)
• 1995-1997 • Dar es Salaam, Tanzania. • 55 m • Pregnant women: 767
• Vitamin supplement trial • Body measurements • Stool sample (direct,
formol-ether concentration)
• Hematology analysis
• HIV-infected pregnant women • Mean gestational age 21 weeks • 11% single • 8% illiterate
• Hookworms 12% • E. coli 9% • A. lumbricoides 6% • C. parvum 4% • E. histolytica 2% • S. stercoralis 2% • T. trichiura 1% • G. lamblia 1%
• No significant associations with sociodemographic, pregnancy, hygiene and environmental factors
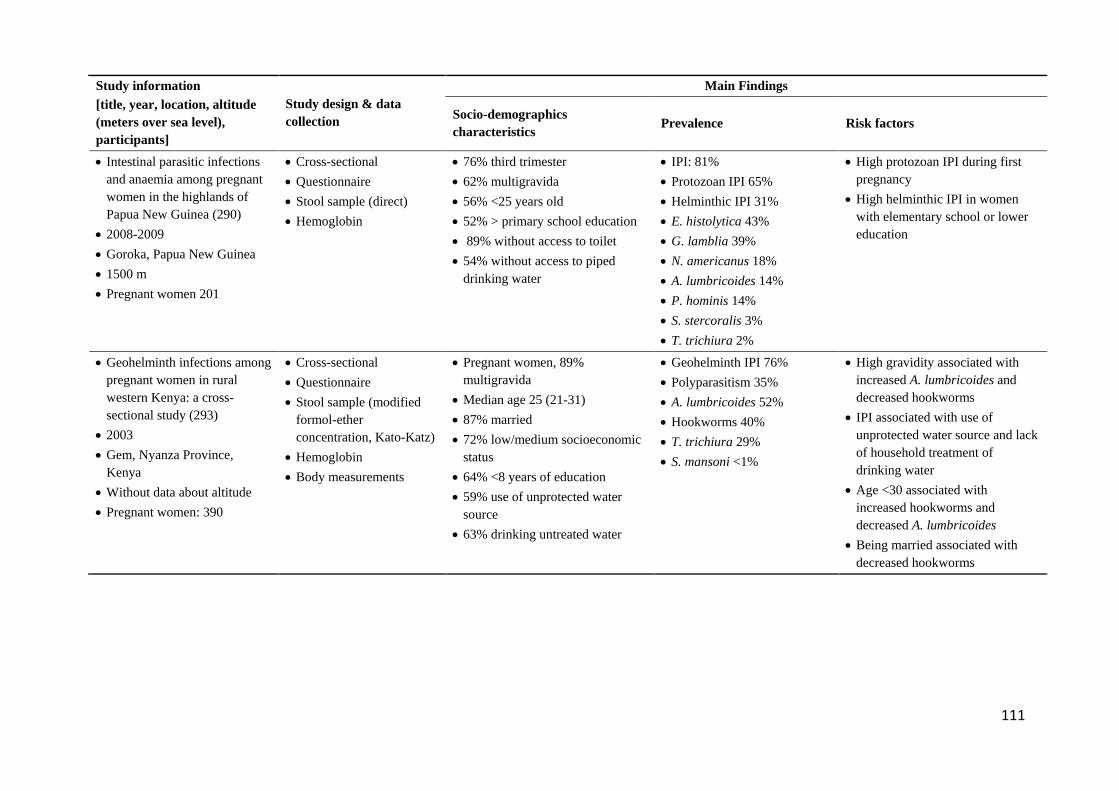
111
Study information [title, year, location, altitude (meters over sea level), participants]
Study design & data collection
Main Findings
Socio-demographics characteristics Prevalence Risk factors
• Intestinal parasitic infections and anaemia among pregnant women in the highlands of Papua New Guinea (290)
• 2008-2009 • Goroka, Papua New Guinea • 1500 m • Pregnant women 201
• Cross-sectional • Questionnaire • Stool sample (direct) • Hemoglobin
• 76% third trimester • 62% multigravida • 56% <25 years old • 52% > primary school education • 89% without access to toilet • 54% without access to piped
drinking water
• IPI: 81% • Protozoan IPI 65% • Helminthic IPI 31% • E. histolytica 43% • G. lamblia 39% • N. americanus 18% • A. lumbricoides 14% • P. hominis 14% • S. stercoralis 3% • T. trichiura 2%
• High protozoan IPI during first pregnancy
• High helminthic IPI in women with elementary school or lower education
• Geohelminth infections among pregnant women in rural western Kenya: a cross-sectional study (293)
• 2003 • Gem, Nyanza Province,
Kenya • Without data about altitude • Pregnant women: 390
• Cross-sectional • Questionnaire • Stool sample (modified
formol-ether concentration, Kato-Katz)
• Hemoglobin • Body measurements
• Pregnant women, 89% multigravida
• Median age 25 (21-31) • 87% married • 72% low/medium socioeconomic
status • 64% <8 years of education • 59% use of unprotected water
source • 63% drinking untreated water
• Geohelminth IPI 76% • Polyparasitism 35% • A. lumbricoides 52% • Hookworms 40% • T. trichiura 29% • S. mansoni <1%
• High gravidity associated with increased A. lumbricoides and decreased hookworms
• IPI associated with use of unprotected water source and lack of household treatment of drinking water
• Age <30 associated with increased hookworms and decreased A. lumbricoides
• Being married associated with decreased hookworms
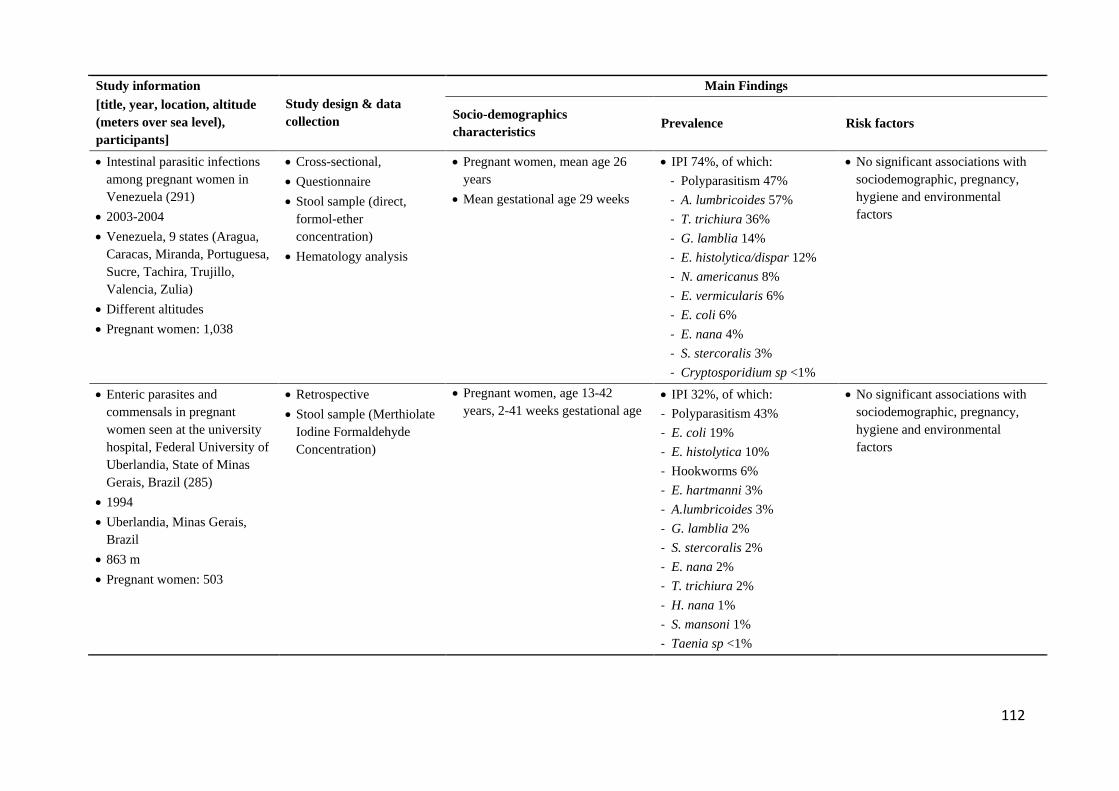
112
Study information [title, year, location, altitude (meters over sea level), participants]
Study design & data collection
Main Findings
Socio-demographics characteristics Prevalence Risk factors
• Intestinal parasitic infections among pregnant women in Venezuela (291)
• 2003-2004 • Venezuela, 9 states (Aragua,
Caracas, Miranda, Portuguesa, Sucre, Tachira, Trujillo, Valencia, Zulia)
• Different altitudes • Pregnant women: 1,038
• Cross-sectional, • Questionnaire • Stool sample (direct,
formol-ether concentration)
• Hematology analysis
• Pregnant women, mean age 26 years
• Mean gestational age 29 weeks
• IPI 74%, of which: - Polyparasitism 47% - A. lumbricoides 57% - T. trichiura 36% - G. lamblia 14% - E. histolytica/dispar 12% - N. americanus 8% - E. vermicularis 6% - E. coli 6% - E. nana 4% - S. stercoralis 3% - Cryptosporidium sp <1%
• No significant associations with sociodemographic, pregnancy, hygiene and environmental factors
• Enteric parasites and commensals in pregnant women seen at the university hospital, Federal University of Uberlandia, State of Minas Gerais, Brazil (285)
• 1994 • Uberlandia, Minas Gerais,
Brazil • 863 m • Pregnant women: 503
• Retrospective • Stool sample (Merthiolate
Iodine Formaldehyde Concentration)
• Pregnant women, age 13-42 years, 2-41 weeks gestational age
• IPI 32%, of which: - Polyparasitism 43% - E. coli 19% - E. histolytica 10% - Hookworms 6% - E. hartmanni 3% - A.lumbricoides 3% - G. lamblia 2% - S. stercoralis 2% - E. nana 2% - T. trichiura 2% - H. nana 1% - S. mansoni 1% - Taenia sp <1%
• No significant associations with sociodemographic, pregnancy, hygiene and environmental factors
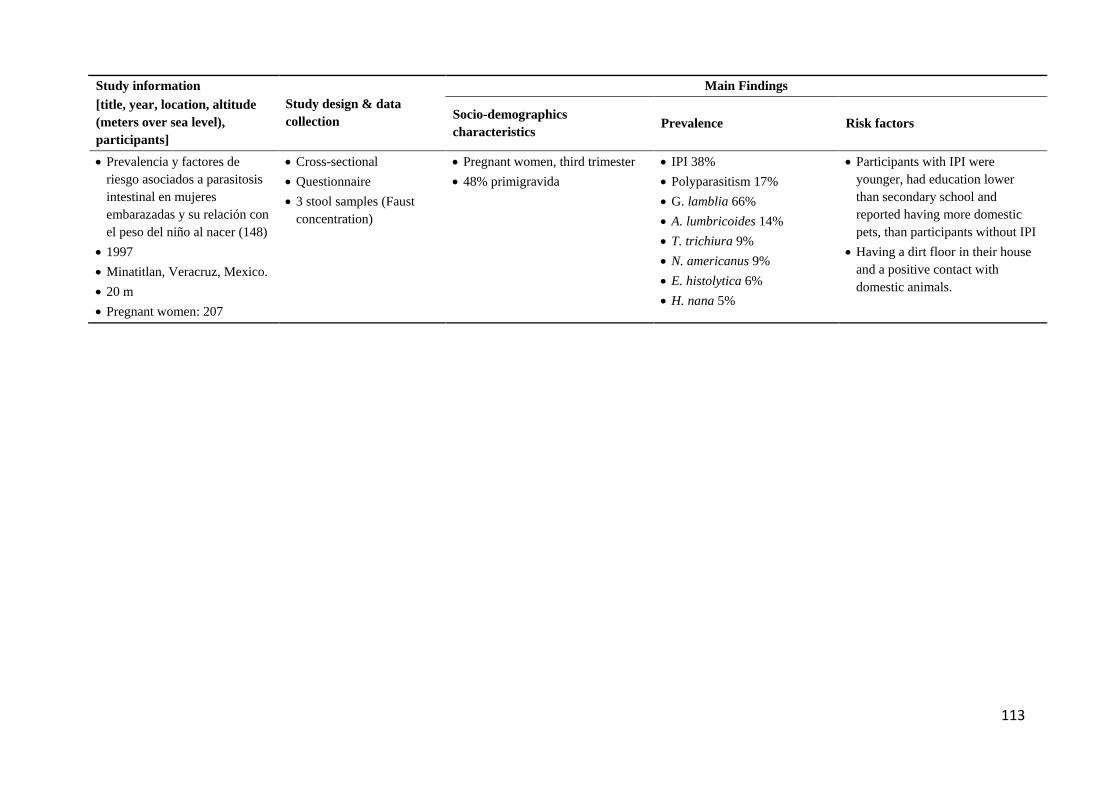
113
Study information [title, year, location, altitude (meters over sea level), participants]
Study design & data collection
Main Findings
Socio-demographics characteristics Prevalence Risk factors
• Prevalencia y factores de riesgo asociados a parasitosis intestinal en mujeres embarazadas y su relación con el peso del niño al nacer (148)
• 1997 • Minatitlan, Veracruz, Mexico. • 20 m • Pregnant women: 207
• Cross-sectional • Questionnaire • 3 stool samples (Faust
concentration)
• Pregnant women, third trimester • 48% primigravida
• IPI 38% • Polyparasitism 17% • G. lamblia 66% • A. lumbricoides 14% • T. trichiura 9% • N. americanus 9% • E. histolytica 6% • H. nana 5%
• Participants with IPI were younger, had education lower than secondary school and reported having more domestic pets, than participants without IPI
• Having a dirt floor in their house and a positive contact with domestic animals.
114
4.3.3. Sociodemographic, environmental and living risk factors for intestinal parasitic
infections
4.3.3.1. Any parasite
For pregnant women infected with any intestinal parasite, two probable factors were identified,
namely the time since the last deworming procedure and civil status. Pregnant women who had
dewormed more than year ago showed a statistically significant higher prevalence of infection by
any intestinal parasite (p=0.01). However, although prophylactic deworming programs in children
and women of reproductive age have been recommended (119, 308), their effectiveness in health
outcomes have not shown constant benefits (120, 121). Colombia has parasite therapy prevention
programs focused on sizeable primary school populations (122) and pregnant women living in
endemic zones for hookworms [(123) where 25oC average temperature and 60-70% relative
humidity conditions favor larvae development, characteristics not present in Bogotá (282). There
is also over the counter availability of antiparasitic drugs in pharmacies, to the point that,
culturally, it is common practice to take antiparasitic drugs as a healthy habit. Thus, our findings
may indicate that deworming treatments and programs could help decrease the prevalence of
intestinal parasites. Of the 13 studies we identified addressing intestinal parasitism in pregnant
women, none included last deworming treatment as a variable, as they focused on the assessment
of environmental conditions and hygiene habits, more than preventive pharmacological therapies.
Although, the World Health Organization recommends preventive interventions in high risk
populations (309), the use of anti-parasitic drugs during pregnancy can generate fear of fetal
secondary effects.
Women who were married or living with a partner showed a not significant trend towards a higher
prevalence of intestinal parasitism, while Derso et al. (29) did not find a difference in IPI in
pregnant women when considering marital status. In contrast, van Eijk et al. (293) found that
married women had a lower prevalence of hookworm infections. An explanation for this trend,
that contrasts with the other studies in northwest Ethiopia and rural western Kenya, will require
further exploration in future research studies.
115
4.3.3.2. Polyparasitism
The prevalence of polyparasitism was higher in women that belonging to minority groups. These
groups, which nationwide include 4% indigenous people, 30% African Colombians, and less than
1% Raizals (from the Colombian Caribbean islands) (310), likely immigrated into Bogotá from
other regions with a high risk of endemic polyparasitism (282) and may have arrived with
undiagnosed infestations. This study recruited 20% of pregnant women who self-identified as
forcefully displaced from other regions in Colombia. This is not surprising since Ciudad Bolívar
accounted for 16% of those forcefully displaced into Bogotá, Kennedy 14% and Usaquén 2%
(275). Migration into Bogotá has been dominated by internal forced displacement due to armed
conflict and human rights abuses. Internal displacement started to increase in the 1980s, peaked in
1999-2002 and progressively decreased ever since, from regions with the highest individual and
mass forced expulsion such as Antioquia, Choco, Cordoba, Magdalena, Nariño, Norte de
Santander and Valle (311). Among these, only Magdalena is a well-established endemic area for
geohelminths and protozoa in children (282). Given the lack of geographic and temporal
congruence between internal displacement and IPI endemicity, it is unlikely that the incoming
migrant populations, despite their socioeconomic vulnerability and unequal access to reproductive
and health care services (312), brought and maintained parasitic life cycles in urban Bogotá.
Prevalence of polyparasitism was also higher in pregnant women living without a water sink.
Having a water sink facilitates the hygienic habit of washing hands before and after going to the
bathroom and after changing diapers. This variable was assessed in Kenyan children living in
urban slums (313), in which 14% of homes lacked adequate sanitary services and 3% practiced
open defecation. The authors found an increased STH infection prevalence in children living in
homes where the water sink was located near to the toilet facility. Although their study population
is different than our participants, both studies support an association between access to
handwashing facilities and IPI prevalence. Altogether, these findings warrant future research to
further analyze this association in pregnant women.
Although illiteracy (113, 159, 289) and low educational level (148, 290, 294) have been reported
as risk factors for intestinal parasitism, our study and Derso et al. (29), did not find associations of
these variables with infection by any parasite or polyparasitism. Our finding could be explained
by the level education in our participants, with only 13% of them reporting primary level
education, while 71% had secondary school and 16% university studies. The education level of
116
our participants was similar to that reported in the districts of Ciudad Bolívar and Kennedy, Bogotá
and Colombia, but not the district of Usaquén, where the professional level is most prevalent
(Table 5.1). Thus, the participants in this study had a higher level of education when compared
with the populations in other studies that analyzed this variable in pregnant women.
Previous studies have reported a lack of handwashing, not cleaning fruits prior to consumption,
use of latrines and walking without shoes, as risk factors for intestinal parasitism (113, 159, 289,
294). However, we did not find differences in the prevalence with these variables. Derso et al. (29)
also did not report associations between handwashing, lack of household bathrooms and IPI
prevalence. Our findings may be explained by the low (15%) proportion of our participants
reporting not handwashing after using the toilet, 4% not washing the fruits and 4% lacking
household bathroom. For these, underreporting can be a consequence of social desirability bias,
which hinders assessment of the real situation, as participants are more likely to provide socially
acceptable answers (314, 315). Thus, it is possible that lack of these hygienic behaviors could be
higher than reported. To control this bias, future studies would require a more probabilistic sample
selection, optimization of the questions regarding hygiene practices and the way interviewers ask
them, as well as a multivariate analysis. Finally, even though 47% of our participants reported
walking without shoes indoors, we did not find an association between this behavior and IPI
prevalence.
Young age in pregnant women was associated with a higher prevalence of intestinal parasitism in
previous studies (113, 148, 159, 294). However, in our study, as well as in Acurero et al. (27), no
associations with this variable were found. This may be explained by local deworming programs
in school-aged children which increase the likelihood that our young participants could have
received anti-parasitic prevention drugs, a hypothesis worth exploring in future studies.
Congruent with Derso et al. (29), our study did not find associations of IPI with parity. This result
contrasts with Phuanukoonnon et al. (290) who reported a higher risk of intestinal protozoal
infections in women in their first pregnancy. Future studies could best assess this variable with
sufficient sample size to perform an explicative multivariate model.
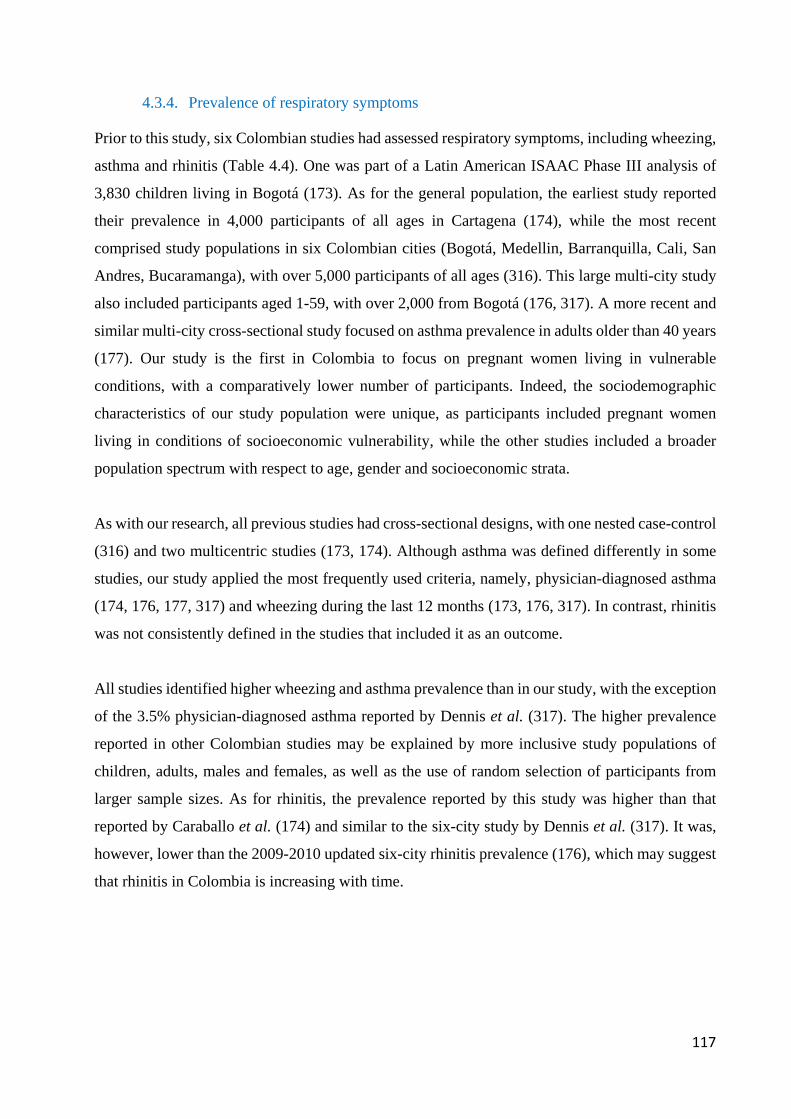
117
4.3.4. Prevalence of respiratory symptoms
Prior to this study, six Colombian studies had assessed respiratory symptoms, including wheezing,
asthma and rhinitis (Table 4.4). One was part of a Latin American ISAAC Phase III analysis of
3,830 children living in Bogotá (173). As for the general population, the earliest study reported
their prevalence in 4,000 participants of all ages in Cartagena (174), while the most recent
comprised study populations in six Colombian cities (Bogotá, Medellin, Barranquilla, Cali, San
Andres, Bucaramanga), with over 5,000 participants of all ages (316). This large multi-city study
also included participants aged 1-59, with over 2,000 from Bogotá (176, 317). A more recent and
similar multi-city cross-sectional study focused on asthma prevalence in adults older than 40 years
(177). Our study is the first in Colombia to focus on pregnant women living in vulnerable
conditions, with a comparatively lower number of participants. Indeed, the sociodemographic
characteristics of our study population were unique, as participants included pregnant women
living in conditions of socioeconomic vulnerability, while the other studies included a broader
population spectrum with respect to age, gender and socioeconomic strata.
As with our research, all previous studies had cross-sectional designs, with one nested case-control
(316) and two multicentric studies (173, 174). Although asthma was defined differently in some
studies, our study applied the most frequently used criteria, namely, physician-diagnosed asthma
(174, 176, 177, 317) and wheezing during the last 12 months (173, 176, 317). In contrast, rhinitis
was not consistently defined in the studies that included it as an outcome.
All studies identified higher wheezing and asthma prevalence than in our study, with the exception
of the 3.5% physician-diagnosed asthma reported by Dennis et al. (317). The higher prevalence
reported in other Colombian studies may be explained by more inclusive study populations of
children, adults, males and females, as well as the use of random selection of participants from
larger sample sizes. As for rhinitis, the prevalence reported by this study was higher than that
reported by Caraballo et al. (174) and similar to the six-city study by Dennis et al. (317). It was,
however, lower than the 2009-2010 updated six-city rhinitis prevalence (176), which may suggest
that rhinitis in Colombia is increasing with time.
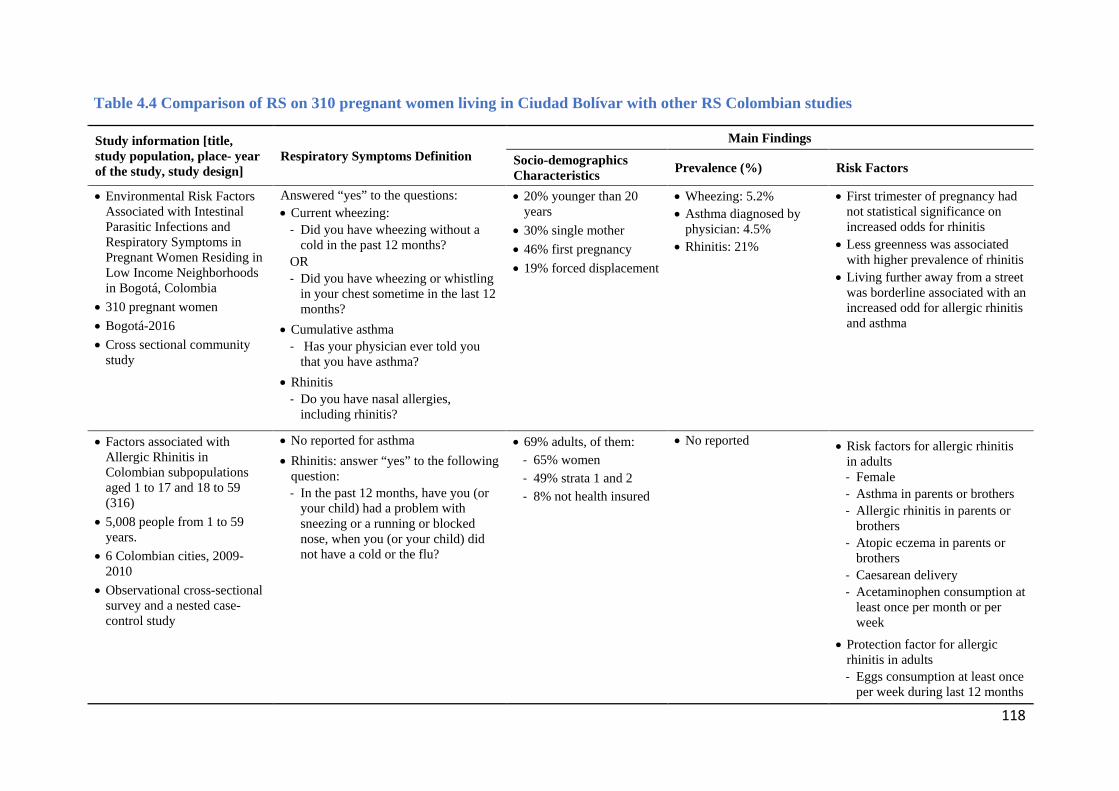
118
Table 4.4 Comparison of RS on 310 pregnant women living in Ciudad Bolívar with other RS Colombian studies
Study information [title, study population, place- year of the study, study design]
Respiratory Symptoms Definition Main Findings
Socio-demographics Characteristics Prevalence (%) Risk Factors
• Environmental Risk Factors Associated with Intestinal Parasitic Infections and Respiratory Symptoms in Pregnant Women Residing in Low Income Neighborhoods in Bogotá, Colombia
• 310 pregnant women • Bogotá-2016 • Cross sectional community
study
Answered “yes” to the questions: • Current wheezing:
- Did you have wheezing without a cold in the past 12 months?
OR - Did you have wheezing or whistling
in your chest sometime in the last 12 months?
• Cumulative asthma - Has your physician ever told you
that you have asthma?
• Rhinitis - Do you have nasal allergies,
including rhinitis?
• 20% younger than 20 years
• 30% single mother • 46% first pregnancy • 19% forced displacement
• Wheezing: 5.2% • Asthma diagnosed by
physician: 4.5% • Rhinitis: 21%
• First trimester of pregnancy had not statistical significance on increased odds for rhinitis
• Less greenness was associated with higher prevalence of rhinitis
• Living further away from a street was borderline associated with an increased odd for allergic rhinitis and asthma
• Factors associated with Allergic Rhinitis in Colombian subpopulations aged 1 to 17 and 18 to 59 (316)
• 5,008 people from 1 to 59 years.
• 6 Colombian cities, 2009-2010
• Observational cross-sectional survey and a nested case-control study
• No reported for asthma
• Rhinitis: answer “yes” to the following question: - In the past 12 months, have you (or
your child) had a problem with sneezing or a running or blocked nose, when you (or your child) did not have a cold or the flu?
• 69% adults, of them: - 65% women - 49% strata 1 and 2 - 8% not health insured
• No reported
• Risk factors for allergic rhinitis in adults - Female - Asthma in parents or brothers - Allergic rhinitis in parents or
brothers - Atopic eczema in parents or
brothers - Caesarean delivery - Acetaminophen consumption at
least once per month or per week
• Protection factor for allergic rhinitis in adults - Eggs consumption at least once
per week during last 12 months
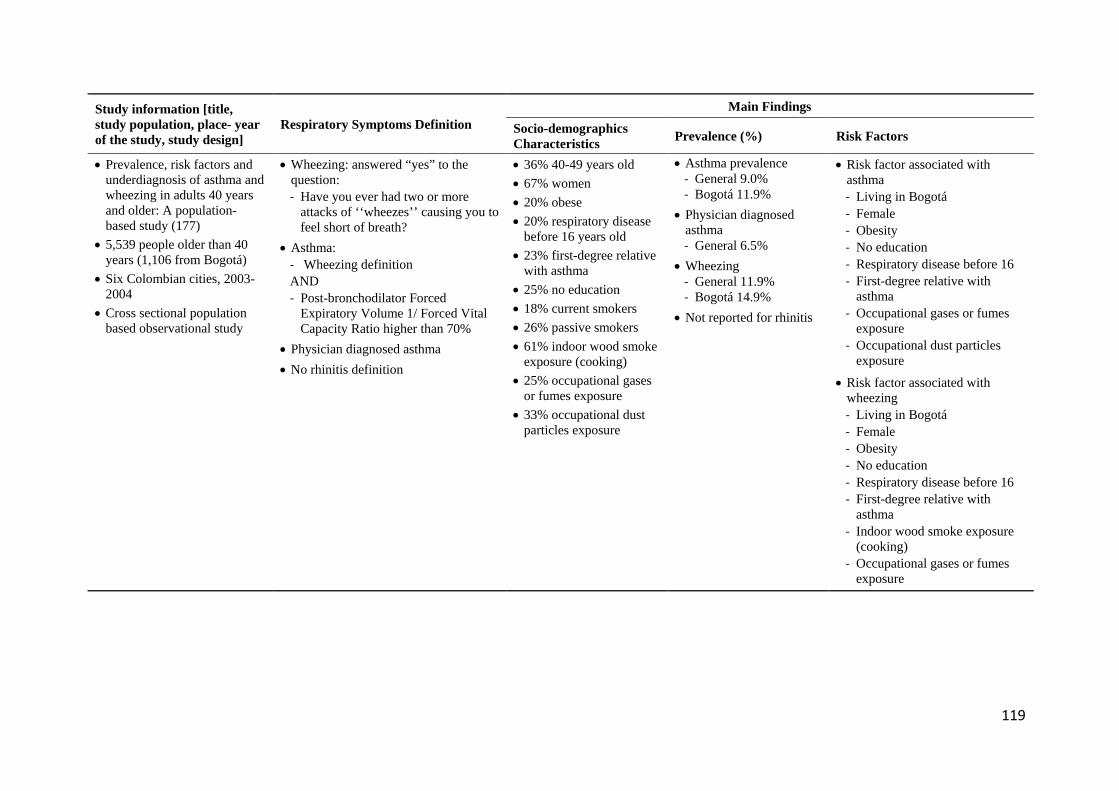
119
Study information [title, study population, place- year of the study, study design]
Respiratory Symptoms Definition Main Findings
Socio-demographics Characteristics Prevalence (%) Risk Factors
• Prevalence, risk factors and underdiagnosis of asthma and wheezing in adults 40 years and older: A population-based study (177)
• 5,539 people older than 40 years (1,106 from Bogotá)
• Six Colombian cities, 2003-2004
• Cross sectional population based observational study
• Wheezing: answered “yes” to the question: - Have you ever had two or more
attacks of ‘‘wheezes’’ causing you to feel short of breath?
• Asthma: - Wheezing definition AND - Post-bronchodilator Forced
Expiratory Volume 1/ Forced Vital Capacity Ratio higher than 70%
• Physician diagnosed asthma
• No rhinitis definition
• 36% 40-49 years old • 67% women • 20% obese • 20% respiratory disease
before 16 years old • 23% first-degree relative
with asthma • 25% no education • 18% current smokers • 26% passive smokers • 61% indoor wood smoke
exposure (cooking) • 25% occupational gases
or fumes exposure • 33% occupational dust
particles exposure
• Asthma prevalence - General 9.0% - Bogotá 11.9%
• Physician diagnosed asthma - General 6.5%
• Wheezing - General 11.9% - Bogotá 14.9%
• Not reported for rhinitis
• Risk factor associated with asthma - Living in Bogotá - Female - Obesity - No education - Respiratory disease before 16 - First-degree relative with
asthma - Occupational gases or fumes
exposure - Occupational dust particles
exposure
• Risk factor associated with wheezing - Living in Bogotá - Female - Obesity - No education - Respiratory disease before 16 - First-degree relative with
asthma - Indoor wood smoke exposure
(cooking) - Occupational gases or fumes
exposure
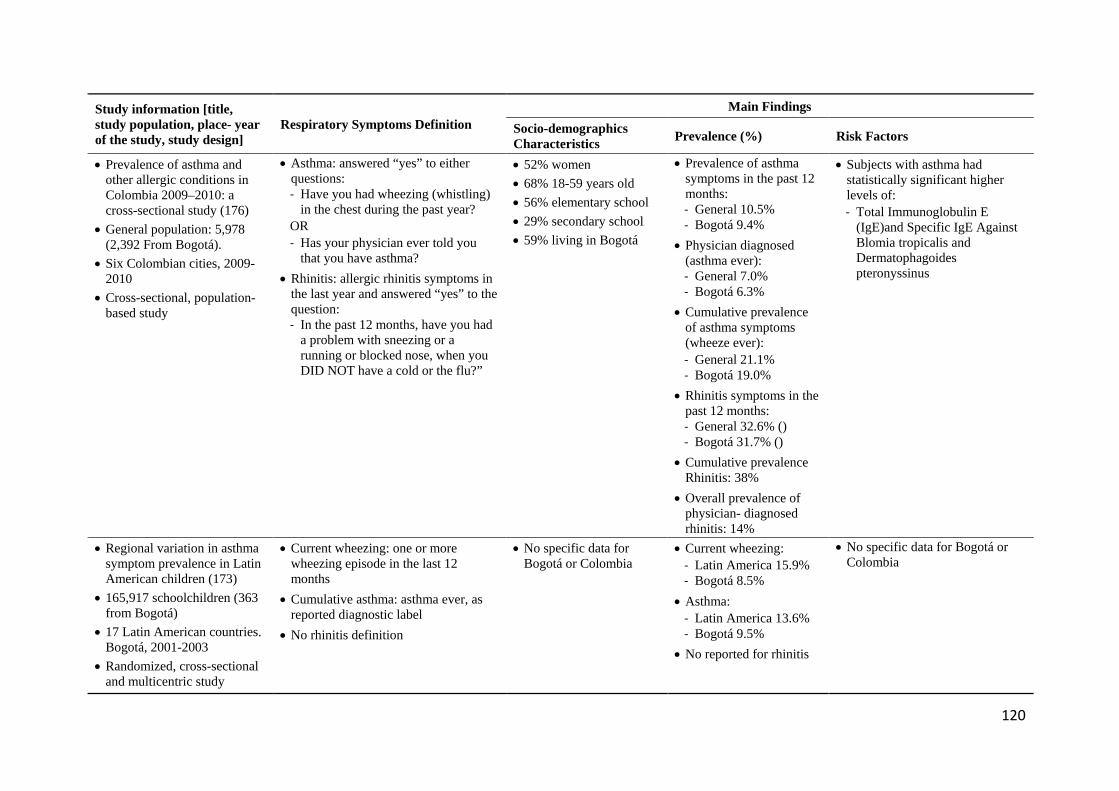
120
Study information [title, study population, place- year of the study, study design]
Respiratory Symptoms Definition Main Findings
Socio-demographics Characteristics Prevalence (%) Risk Factors
• Prevalence of asthma and other allergic conditions in Colombia 2009–2010: a cross-sectional study (176)
• General population: 5,978 (2,392 From Bogotá).
• Six Colombian cities, 2009-2010
• Cross-sectional, population-based study
• Asthma: answered “yes” to either questions: - Have you had wheezing (whistling)
in the chest during the past year? OR - Has your physician ever told you
that you have asthma?
• Rhinitis: allergic rhinitis symptoms in the last year and answered “yes” to the question: - In the past 12 months, have you had
a problem with sneezing or a running or blocked nose, when you DID NOT have a cold or the flu?”
• 52% women • 68% 18-59 years old • 56% elementary school • 29% secondary school • 59% living in Bogotá
• Prevalence of asthma symptoms in the past 12 months: - General 10.5% - Bogotá 9.4%
• Physician diagnosed (asthma ever): - General 7.0% - Bogotá 6.3%
• Cumulative prevalence of asthma symptoms (wheeze ever): - General 21.1% - Bogotá 19.0%
• Rhinitis symptoms in the past 12 months: - General 32.6% () - Bogotá 31.7% ()
• Cumulative prevalence Rhinitis: 38%
• Overall prevalence of physician- diagnosed rhinitis: 14%
• Subjects with asthma had statistically significant higher levels of: - Total Immunoglobulin E
(IgE)and Specific IgE Against Blomia tropicalis and Dermatophagoides pteronyssinus
• Regional variation in asthma symptom prevalence in Latin American children (173)
• 165,917 schoolchildren (363 from Bogotá)
• 17 Latin American countries. Bogotá, 2001-2003
• Randomized, cross-sectional and multicentric study
• Current wheezing: one or more wheezing episode in the last 12 months
• Cumulative asthma: asthma ever, as reported diagnostic label
• No rhinitis definition
• No specific data for Bogotá or Colombia
• Current wheezing: - Latin America 15.9% - Bogotá 8.5%
• Asthma: - Latin America 13.6% - Bogotá 9.5%
• No reported for rhinitis
• No specific data for Bogotá or Colombia
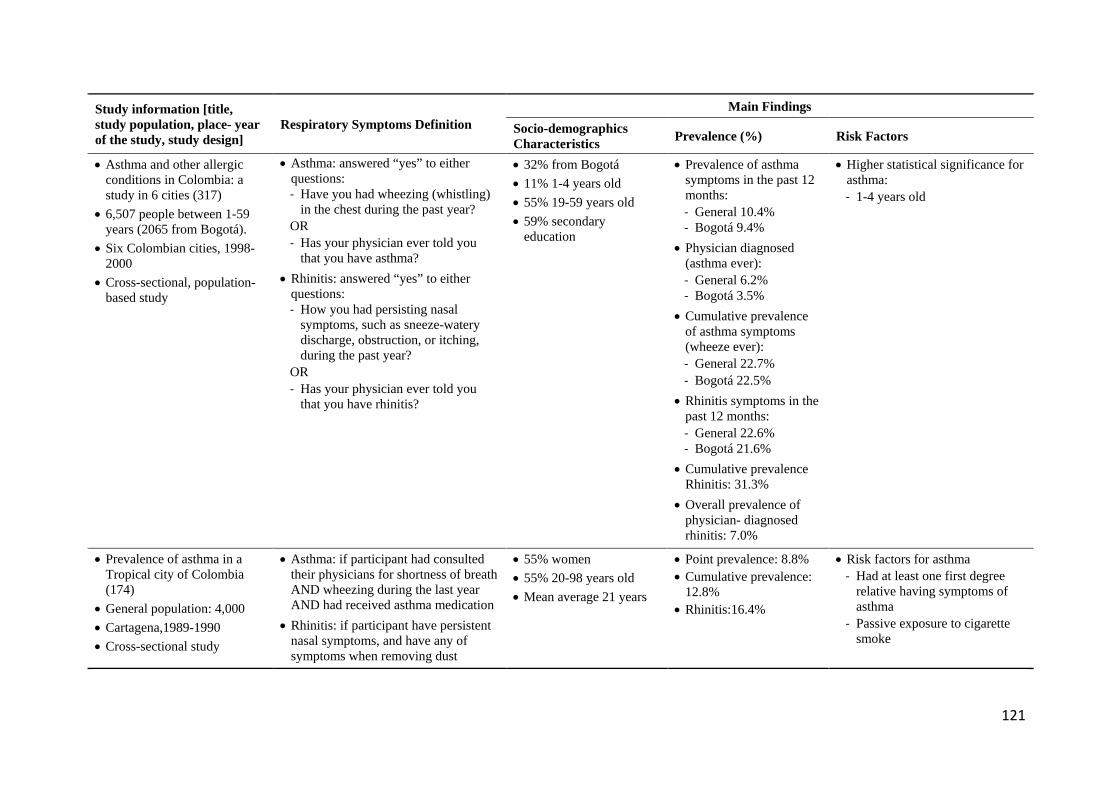
121
Study information [title, study population, place- year of the study, study design]
Respiratory Symptoms Definition Main Findings
Socio-demographics Characteristics Prevalence (%) Risk Factors
• Asthma and other allergic conditions in Colombia: a study in 6 cities (317)
• 6,507 people between 1-59 years (2065 from Bogotá).
• Six Colombian cities, 1998-2000
• Cross-sectional, population-based study
• Asthma: answered “yes” to either questions: - Have you had wheezing (whistling)
in the chest during the past year? OR - Has your physician ever told you
that you have asthma?
• Rhinitis: answered “yes” to either questions: - How you had persisting nasal
symptoms, such as sneeze-watery discharge, obstruction, or itching, during the past year?
OR - Has your physician ever told you
that you have rhinitis?
• 32% from Bogotá • 11% 1-4 years old • 55% 19-59 years old • 59% secondary
education
• Prevalence of asthma symptoms in the past 12 months: - General 10.4% - Bogotá 9.4%
• Physician diagnosed (asthma ever): - General 6.2% - Bogotá 3.5%
• Cumulative prevalence of asthma symptoms (wheeze ever): - General 22.7% - Bogotá 22.5%
• Rhinitis symptoms in the past 12 months: - General 22.6% - Bogotá 21.6%
• Cumulative prevalence Rhinitis: 31.3%
• Overall prevalence of physician- diagnosed rhinitis: 7.0%
• Higher statistical significance for asthma: - 1-4 years old
• Prevalence of asthma in a Tropical city of Colombia (174)
• General population: 4,000 • Cartagena,1989-1990 • Cross-sectional study
• Asthma: if participant had consulted their physicians for shortness of breath AND wheezing during the last year AND had received asthma medication
• Rhinitis: if participant have persistent nasal symptoms, and have any of symptoms when removing dust
• 55% women • 55% 20-98 years old • Mean average 21 years
• Point prevalence: 8.8% • Cumulative prevalence:
12.8% • Rhinitis:16.4%
• Risk factors for asthma - Had at least one first degree
relative having symptoms of asthma
- Passive exposure to cigarette smoke
122
Regarding Latin American RS studies, we compare this study with five others reporting asthma
prevalence and associated factors in Latin America, all published between 2010 and 2018, and
including two systematic reviews, two cross-sectional studies and one report. Two studies focused
on childhood asthma, and one on adults, with the other two including both. Asthma prevalence
ranged between 3% and 33% in children, who were diagnosed by reporting wheezing in the last
year or taking asthma medications. Prevalence in adults with physician-diagnosed asthma ranged
between 3% and 12%. In our study, 4.5% prevalence of physician-diagnosed asthma was within
this range. Our 5.2% prevalence of asthma diagnosed by having had wheezing in the last year, was
lower than the 12% to 23% range reported in the other studies (Table 4.5).
Based on the Global Asthma Report (318), adult asthma prevalence was reported as 2.7% in Chile,
6.5% in Argentinian adults aged 20-44 and 12% physician-diagnosed asthma for Brazilians aged
18-54 (170). In another study carried out in metropolitan Mexico City, 5% of 1,063 participants
older than 40 years reported physician-diagnosed asthma (319). Thus, the 4.5% asthma prevalence
reported in our study was similar to that found in Mexican and Chilean adults, and lower than the
prevalence reported in Argentina and Brazil. Since associated factors with reported asthma
prevalence were not identified in these studies, it was not possible to compare them with our
findings. However, as it is well established that asthma is a syndrome with various phenotypes and
risk factors (198), and considering the environmental and social diversity in Latin America, to
contrast study findings it would be necessary to use comparable diagnostic criteria and age groups
with similar lifestyles and environmental conditions (Table 4.5).
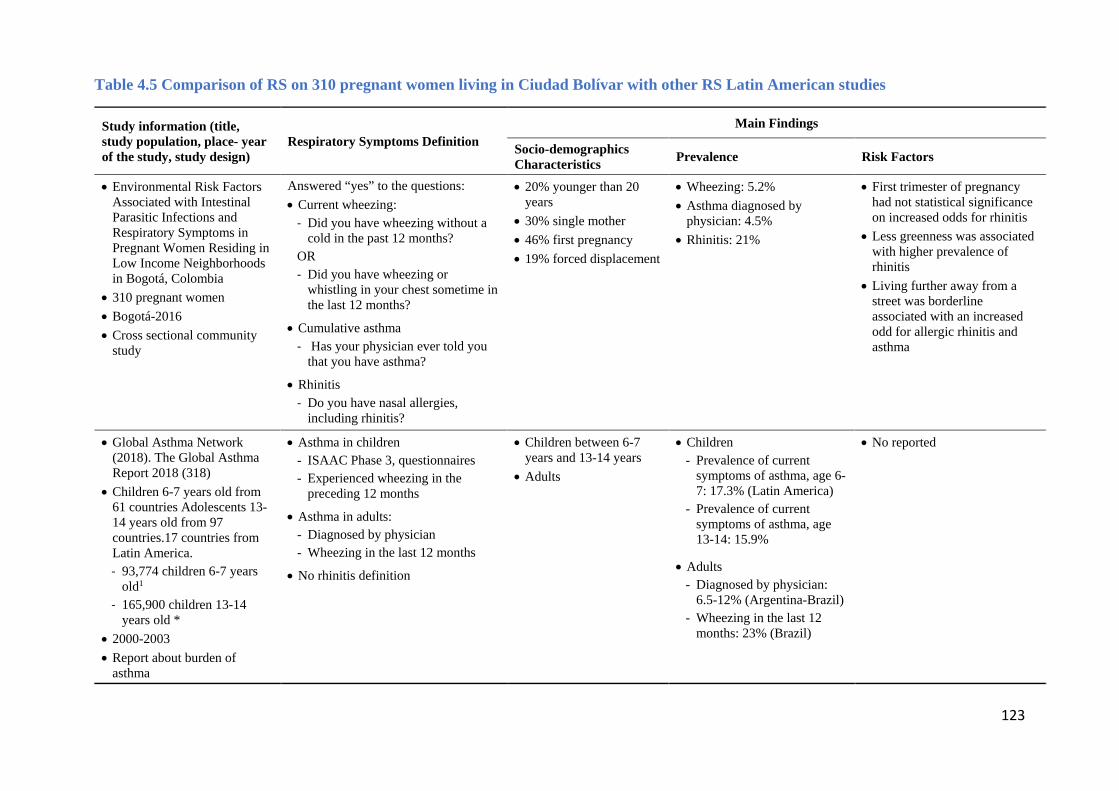
123
Table 4.5 Comparison of RS on 310 pregnant women living in Ciudad Bolívar with other RS Latin American studies
Study information (title, study population, place- year of the study, study design)
Respiratory Symptoms Definition Main Findings
Socio-demographics Characteristics Prevalence Risk Factors
• Environmental Risk Factors Associated with Intestinal Parasitic Infections and Respiratory Symptoms in Pregnant Women Residing in Low Income Neighborhoods in Bogotá, Colombia
• 310 pregnant women • Bogotá-2016 • Cross sectional community
study
Answered “yes” to the questions: • Current wheezing:
- Did you have wheezing without a cold in the past 12 months?
OR - Did you have wheezing or
whistling in your chest sometime in the last 12 months?
• Cumulative asthma - Has your physician ever told you
that you have asthma?
• Rhinitis - Do you have nasal allergies,
including rhinitis?
• 20% younger than 20 years
• 30% single mother • 46% first pregnancy • 19% forced displacement
• Wheezing: 5.2% • Asthma diagnosed by
physician: 4.5% • Rhinitis: 21%
• First trimester of pregnancy had not statistical significance on increased odds for rhinitis
• Less greenness was associated with higher prevalence of rhinitis
• Living further away from a street was borderline associated with an increased odd for allergic rhinitis and asthma
• Global Asthma Network (2018). The Global Asthma Report 2018 (318)
• Children 6-7 years old from 61 countries Adolescents 13-14 years old from 97 countries.17 countries from Latin America. - 93,774 children 6-7 years
old1 - 165,900 children 13-14
years old * • 2000-2003 • Report about burden of
asthma
• Asthma in children - ISAAC Phase 3, questionnaires - Experienced wheezing in the
preceding 12 months
• Asthma in adults: - Diagnosed by physician - Wheezing in the last 12 months
• No rhinitis definition
• Children between 6-7 years and 13-14 years
• Adults
• Children - Prevalence of current
symptoms of asthma, age 6-7: 17.3% (Latin America)
- Prevalence of current symptoms of asthma, age 13-14: 15.9%
• Adults - Diagnosed by physician:
6.5-12% (Argentina-Brazil) - Wheezing in the last 12
months: 23% (Brazil)
• No reported
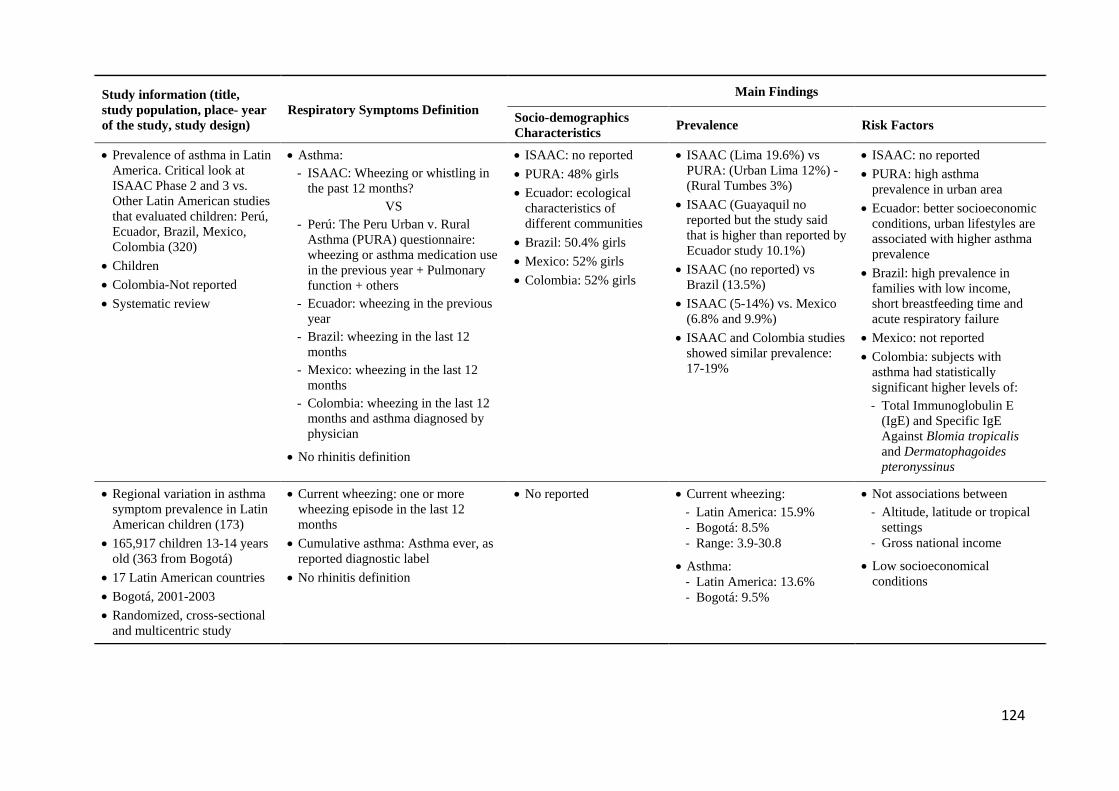
124
Study information (title, study population, place- year of the study, study design)
Respiratory Symptoms Definition Main Findings
Socio-demographics Characteristics Prevalence Risk Factors
• Prevalence of asthma in Latin America. Critical look at ISAAC Phase 2 and 3 vs. Other Latin American studies that evaluated children: Perú, Ecuador, Brazil, Mexico, Colombia (320)
• Children • Colombia-Not reported • Systematic review
• Asthma: - ISAAC: Wheezing or whistling in
the past 12 months? VS
- Perú: The Peru Urban v. Rural Asthma (PURA) questionnaire: wheezing or asthma medication use in the previous year + Pulmonary function + others
- Ecuador: wheezing in the previous year
- Brazil: wheezing in the last 12 months
- Mexico: wheezing in the last 12 months
- Colombia: wheezing in the last 12 months and asthma diagnosed by physician
• No rhinitis definition
• ISAAC: no reported • PURA: 48% girls • Ecuador: ecological
characteristics of different communities
• Brazil: 50.4% girls • Mexico: 52% girls • Colombia: 52% girls
• ISAAC (Lima 19.6%) vs PURA: (Urban Lima 12%) - (Rural Tumbes 3%)
• ISAAC (Guayaquil no reported but the study said that is higher than reported by Ecuador study 10.1%)
• ISAAC (no reported) vs Brazil (13.5%)
• ISAAC (5-14%) vs. Mexico (6.8% and 9.9%)
• ISAAC and Colombia studies showed similar prevalence: 17-19%
• ISAAC: no reported • PURA: high asthma
prevalence in urban area • Ecuador: better socioeconomic
conditions, urban lifestyles are associated with higher asthma prevalence
• Brazil: high prevalence in families with low income, short breastfeeding time and acute respiratory failure
• Mexico: not reported • Colombia: subjects with
asthma had statistically significant higher levels of: - Total Immunoglobulin E
(IgE) and Specific IgE Against Blomia tropicalis and Dermatophagoides pteronyssinus
• Regional variation in asthma symptom prevalence in Latin American children (173)
• 165,917 children 13-14 years old (363 from Bogotá)
• 17 Latin American countries • Bogotá, 2001-2003 • Randomized, cross-sectional
and multicentric study
• Current wheezing: one or more wheezing episode in the last 12 months
• Cumulative asthma: Asthma ever, as reported diagnostic label
• No rhinitis definition
• No reported • Current wheezing: - Latin America: 15.9% - Bogotá: 8.5% - Range: 3.9-30.8
• Asthma: - Latin America: 13.6% - Bogotá: 9.5%
• Not associations between - Altitude, latitude or tropical
settings - Gross national income
• Low socioeconomical conditions
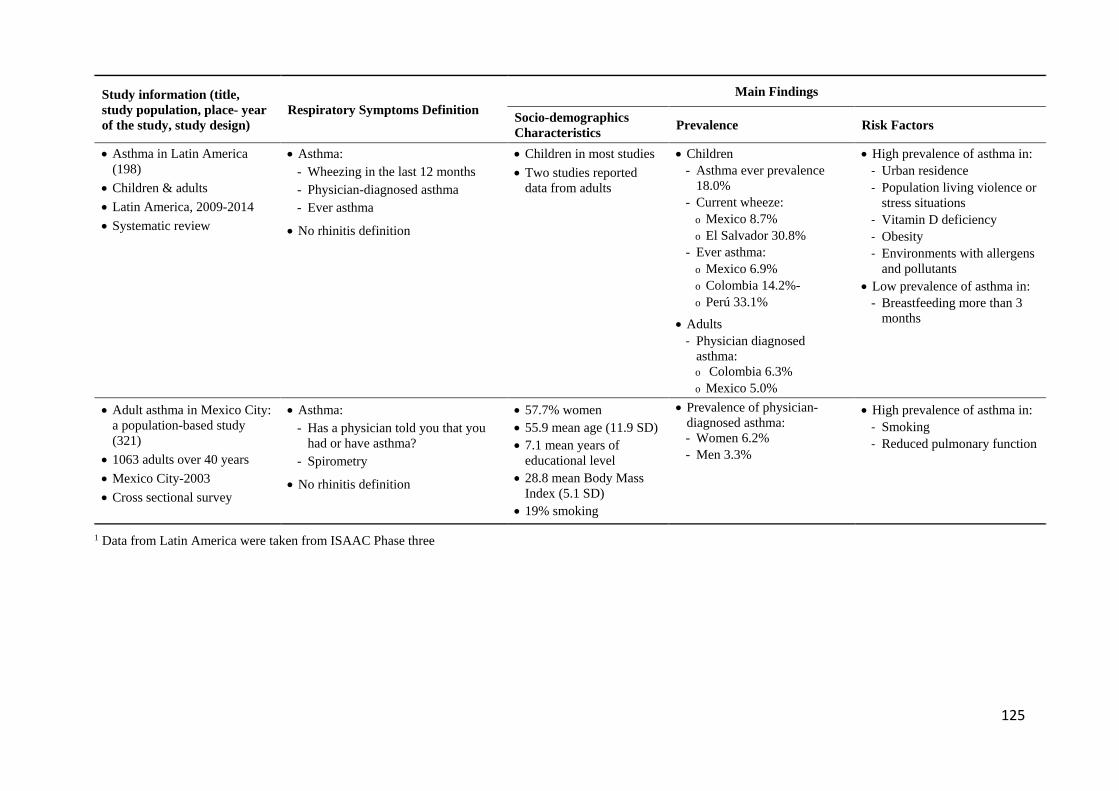
125
Study information (title, study population, place- year of the study, study design)
Respiratory Symptoms Definition Main Findings
Socio-demographics Characteristics Prevalence Risk Factors
• Asthma in Latin America (198)
• Children & adults • Latin America, 2009-2014 • Systematic review
• Asthma: - Wheezing in the last 12 months - Physician-diagnosed asthma - Ever asthma
• No rhinitis definition
• Children in most studies • Two studies reported
data from adults
• Children - Asthma ever prevalence
18.0% - Current wheeze:
o Mexico 8.7% o El Salvador 30.8%
- Ever asthma: o Mexico 6.9% o Colombia 14.2%- o Perú 33.1%
• Adults - Physician diagnosed
asthma: o Colombia 6.3% o Mexico 5.0%
• High prevalence of asthma in: - Urban residence - Population living violence or
stress situations - Vitamin D deficiency - Obesity - Environments with allergens
and pollutants • Low prevalence of asthma in:
- Breastfeeding more than 3 months
• Adult asthma in Mexico City: a population-based study (321)
• 1063 adults over 40 years • Mexico City-2003 • Cross sectional survey
• Asthma: - Has a physician told you that you
had or have asthma? - Spirometry
• No rhinitis definition
• 57.7% women • 55.9 mean age (11.9 SD) • 7.1 mean years of
educational level • 28.8 mean Body Mass
Index (5.1 SD) • 19% smoking
• Prevalence of physician-diagnosed asthma: - Women 6.2% - Men 3.3%
• High prevalence of asthma in: - Smoking - Reduced pulmonary function
1 Data from Latin America were taken from ISAAC Phase three
126
Since Latin American studies evaluating the prevalence of asthma during pregnancy were not
identified, this study was contrasted with six studies that assessed respiratory symptoms in
pregnant women from Africa (2), Sweden (2), Australia (1) and United States (1) (Table 4.6).
Regarding sociodemographic characteristics, in our study, 30% of participants were single
mothers, a high proportion when compared to the 11% reported by Adeyemi et al. (190), 18% by
Hansen et al. (322), 6% by Rejno et al. (323) and 3% by Sawicki et al. (188). This can be explained
by our 20% of participants being aged under 20, as, in Bogotá, less than 5% of young women are
married and less that 9% cohabit with their partner. In our RS study, 55% of participants had two
or more children, higher than the 42% reported by Rejno et al. (323), a difference that could be
understood in the context of the higher global fertility rate of 2.3 in Ciudad Bolívar (50), compared
with 1.8(324) for Colombia. Also, 20% of pregnant women of our study were in their first
gestational trimester, lower than the 43% reported by Sunyer et al. (325), and 19% were forcefully
displaced into the city from other regions of the country, the latter a unique characteristic of our
study when compared with other published studies in pregnant women with RS.
Comparing our results to the two cross-sectional African studies from low- and middle-income
countries in pregnant women, notwithstanding differences in asthma diagnosis between studies,
our 4.5% prevalence was similar to the 3.5% current asthma found in a study done in 658 pregnant
women in the district hospital of Ifakara, a semi-rural area in the southeast of Tanzania (325). Our
prevalence was also higher than the 1.7% physician-diagnosed asthma reported in 347 pregnant
women from Ogbomoso, one of the largest urban centers in southwestern Nigeria (190). Although
the Nigerian study was done in an urban center, as in our study, our prevalence was more
comparable with the rural study from Tanzania. By asking participants if they had wheezing during
the last 12 months, our study found a prevalence of 5%, lower than the 8% reported in the Nigerian
cohort, using the same question (190). In the Tanzanian study, when asking a broader question of
having ever had a wheezing chest, the prevalence reported was of 11% (325). Thus, it is possible
that asthma and wheezing in our participants, similar to the Tanzanian study, where an association
between serum IgE with maternal asthma was not observed, are non-atopic in nature, and that
environmental and socioeconomic conditions are likely underlying determinant factors.
Registry-based studies in high-income countries reported higher asthma prevalence. In United
States, using a sizeable multi-state database of medication during pregnancy, Hansen et al. (322)
reported that 6.7% (38,495 of 575,632) pregnant women had a diagnosis of asthma, and this
127
condition was more prevalent in women under 24 years of age. Similarly, Rejno et al. (323) using
four Swedish national registries, found a 9.4% (26,586 of 284,214) asthma prevalence in pregnant
women, 13% of whom were under age 25, 58% primiparous and 6% single mothers. In Australia,
Sawicki et al. (188), in a questionnaire-based survey, found that 13% (104 of 819) of pregnant
women self-reported asthma during pregnancy, with a mean age of 30 years (range 18-41) and
only 3% being single mothers. Comparing our study done in an upper middle-income country with
these studies done in high-income countries, our asthma prevalence is lower, with similarities in
that most of our participants were also younger than 30 years and with a high number of single
mothers, as with the Swedish participants. Although the prevalence of asthma in the general
population is variable across countries, it tended to be higher in communities living in high-income
countries and is currently showing increasing prevalence in low- and middle-income countries
(326).
For rhinitis, our 21% prevalence coincided with the reported 20% of allergies during pregnancy in
the United States, mainly including rhinitis and asthma (327), and the 22% identified in a Swedish
study (186). It was, however, higher than the 6% reported in Nigeria, in which the question
inquired about self-reported rhinitis ever in the past (190). Thus, the prevalence of rhinitis in our
study is consistent with previous United States and Swedish studies, and may indicate that
although our country is classified as an upper middle-income country, we may share some
common environmental risk factors with these high-income countries, such as “western” lifestyles
and frequent exposures to urban pollution, potential commonalities worth exploring in future
research.
Inner cities, defined as urban areas with high unemployment, low income, common single
parenting, poor quality housing, race disparities, poor socioeconomic status, low health literacy
and poor environmental conditions, face unique personal and public health challenges (328). Most
of these inner-city characteristics are similar to our study population, namely pregnant women
living in the district of Ciudad Bolívar, one of the largest Latin American conglomerates of people
living in vulnerable conditions and high community violence. Individuals living in inner cities are
presumed to have high asthma prevalence as they are more exposed to environmental pollutants
and stress (329). Regarding the asthma prevalence we report in Ciudad Bolívar, similar studies in
inner cities showed much higher prevalence, likely because they compared associated risk factors
in individuals with and without asthma. For instance, Wright et al. (330) found that in prenatal
assessments, mothers living in urban inner cities with high cumulative stress were more likely to
128
have asthma and altered immune responses. However, in a similar study population of young
mothers living in poor socioeconomic conditions in St. Louis, Baltimore, Boston and New York,
Gruenberg et al. (331) reported a 46% prevalence of asthma without finding a positive association
between external stressors, asthma and allergy. Similarly, a study with 509 inner-city pregnant
women from Madison, Wisconsin, USA, reported 36% current asthma diagnosis (329). Finally, a
more recent study with inner-city pregnant women living in Philadelphia, USA, found that those
presenting with severe prenatal asthma exacerbations, when compared to controls without
exacerbations, were characterized by higher maternal history of mechanical ventilation, maternal
use of asthma medications, absence of flu vaccination and allergic rhinitis (332). A study
comparing Afro-Caribbean with Puerto Rican children living in The Bronx, New York, a borough
with inner city communities, reported higher prevalence of asthma morbidity in Puerto Rican
children, underscoring the importance of examining sociocultural factors that may mediate this
difference (333).
The variety of factors determining the clinical presentations of asthma and rhinitis, including
biological, genetic, environmental, psychological and lifestyle habits, challenges the development
of unifying definitions and diagnostic gold standards (198, 320). Studies based on the ISAAC
questionnaire include broad queries, such as having wheezing in the past year, which can generate
over estimation, particularly when including children, as other human diseases can show similar
clinical symptoms (198, 320). However, this methodology has shown reproducible results that
support its validity (320). In addition, the diagnostic amplitude for rhinitis, when based on the
patient’s perception, favors diagnostic imprecision. Latin American studies on asthma and rhinitis
focus on subgroups with specific characteristics, the diversity of which highlights the need for
population studies that include biomarkers (198). Furthermore, these studies require logistic
support to access unique communities living in vulnerable conditions and using questionnaires and
diagnostic tests that will allow diagnostic precision.
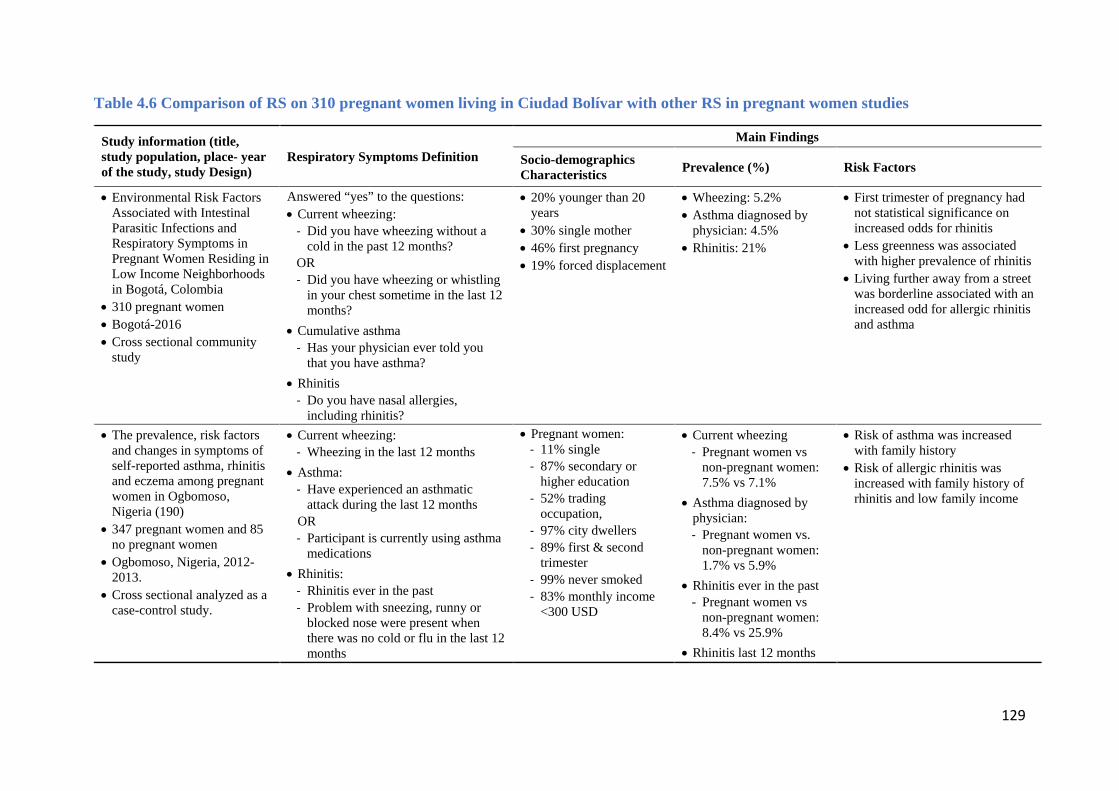
129
Table 4.6 Comparison of RS on 310 pregnant women living in Ciudad Bolívar with other RS in pregnant women studies
Study information (title, study population, place- year of the study, study Design)
Respiratory Symptoms Definition Main Findings
Socio-demographics Characteristics Prevalence (%) Risk Factors
• Environmental Risk Factors Associated with Intestinal Parasitic Infections and Respiratory Symptoms in Pregnant Women Residing in Low Income Neighborhoods in Bogotá, Colombia
• 310 pregnant women • Bogotá-2016 • Cross sectional community
study
Answered “yes” to the questions: • Current wheezing:
- Did you have wheezing without a cold in the past 12 months?
OR - Did you have wheezing or whistling
in your chest sometime in the last 12 months?
• Cumulative asthma - Has your physician ever told you
that you have asthma?
• Rhinitis - Do you have nasal allergies,
including rhinitis?
• 20% younger than 20 years
• 30% single mother • 46% first pregnancy • 19% forced displacement
• Wheezing: 5.2% • Asthma diagnosed by
physician: 4.5% • Rhinitis: 21%
• First trimester of pregnancy had not statistical significance on increased odds for rhinitis
• Less greenness was associated with higher prevalence of rhinitis
• Living further away from a street was borderline associated with an increased odd for allergic rhinitis and asthma
• The prevalence, risk factors and changes in symptoms of self-reported asthma, rhinitis and eczema among pregnant women in Ogbomoso, Nigeria (190)
• 347 pregnant women and 85 no pregnant women
• Ogbomoso, Nigeria, 2012-2013.
• Cross sectional analyzed as a case-control study.
• Current wheezing: - Wheezing in the last 12 months
• Asthma: - Have experienced an asthmatic
attack during the last 12 months OR - Participant is currently using asthma
medications
• Rhinitis: - Rhinitis ever in the past - Problem with sneezing, runny or
blocked nose were present when there was no cold or flu in the last 12 months
• Pregnant women: - 11% single - 87% secondary or
higher education - 52% trading
occupation, - 97% city dwellers - 89% first & second
trimester - 99% never smoked - 83% monthly income
<300 USD
• Current wheezing - Pregnant women vs
non-pregnant women: 7.5% vs 7.1%
• Asthma diagnosed by physician: - Pregnant women vs.
non-pregnant women: 1.7% vs 5.9%
• Rhinitis ever in the past - Pregnant women vs
non-pregnant women: 8.4% vs 25.9%
• Rhinitis last 12 months
• Risk of asthma was increased with family history
• Risk of allergic rhinitis was increased with family history of rhinitis and low family income
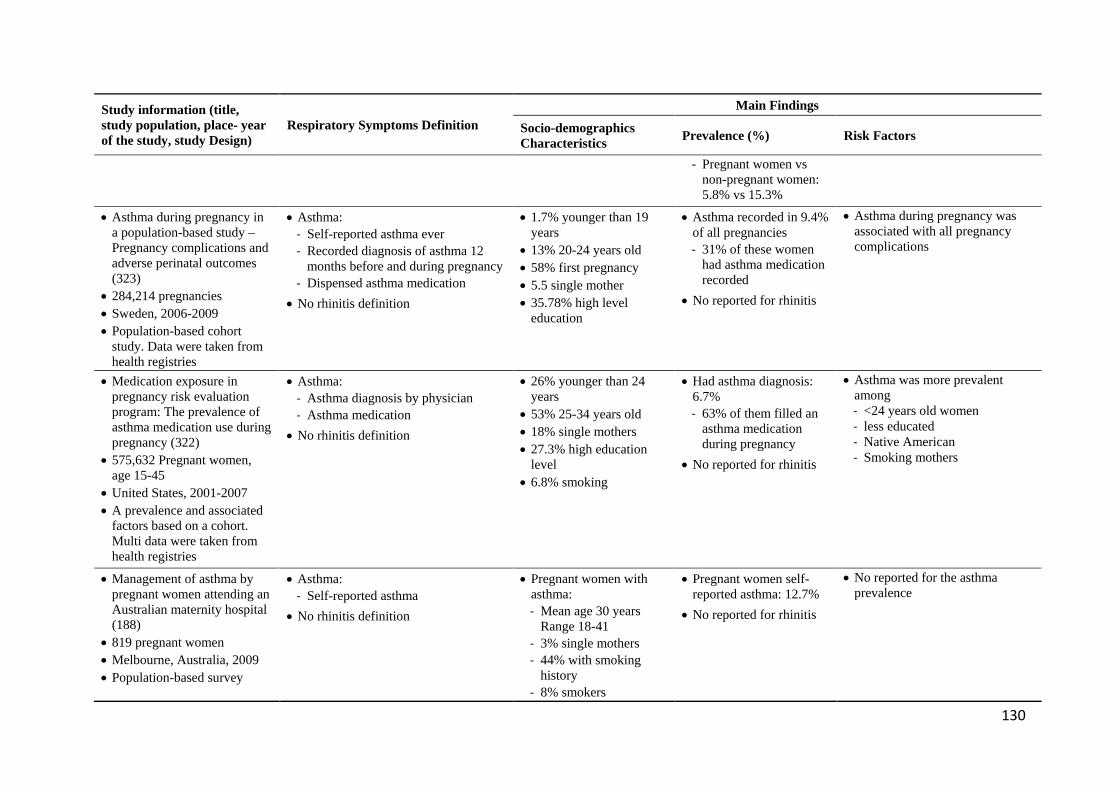
130
Study information (title, study population, place- year of the study, study Design)
Respiratory Symptoms Definition Main Findings
Socio-demographics Characteristics Prevalence (%) Risk Factors
- Pregnant women vs non-pregnant women: 5.8% vs 15.3%
-
• Asthma during pregnancy in a population-based study – Pregnancy complications and adverse perinatal outcomes (323)
• 284,214 pregnancies • Sweden, 2006-2009 • Population-based cohort
study. Data were taken from health registries
• Asthma: - Self-reported asthma ever - Recorded diagnosis of asthma 12
months before and during pregnancy - Dispensed asthma medication
• No rhinitis definition
• 1.7% younger than 19 years
• 13% 20-24 years old • 58% first pregnancy • 5.5 single mother • 35.78% high level
education
• Asthma recorded in 9.4% of all pregnancies - 31% of these women
had asthma medication recorded
• No reported for rhinitis
• Asthma during pregnancy was associated with all pregnancy complications
• Medication exposure in pregnancy risk evaluation program: The prevalence of asthma medication use during pregnancy (322)
• 575,632 Pregnant women, age 15-45
• United States, 2001-2007 • A prevalence and associated
factors based on a cohort. Multi data were taken from health registries
• Asthma: - Asthma diagnosis by physician - Asthma medication
• No rhinitis definition
• 26% younger than 24 years
• 53% 25-34 years old • 18% single mothers • 27.3% high education
level • 6.8% smoking
• Had asthma diagnosis: 6.7% - 63% of them filled an
asthma medication during pregnancy
• No reported for rhinitis
• Asthma was more prevalent among - <24 years old women - less educated - Native American - Smoking mothers
• Management of asthma by pregnant women attending an Australian maternity hospital (188)
• 819 pregnant women • Melbourne, Australia, 2009 • Population-based survey
• Asthma: - Self-reported asthma
• No rhinitis definition
• Pregnant women with asthma: - Mean age 30 years
Range 18-41 - 3% single mothers - 44% with smoking
history - 8% smokers
• Pregnant women self-reported asthma: 12.7%
• No reported for rhinitis
• No reported for the asthma prevalence
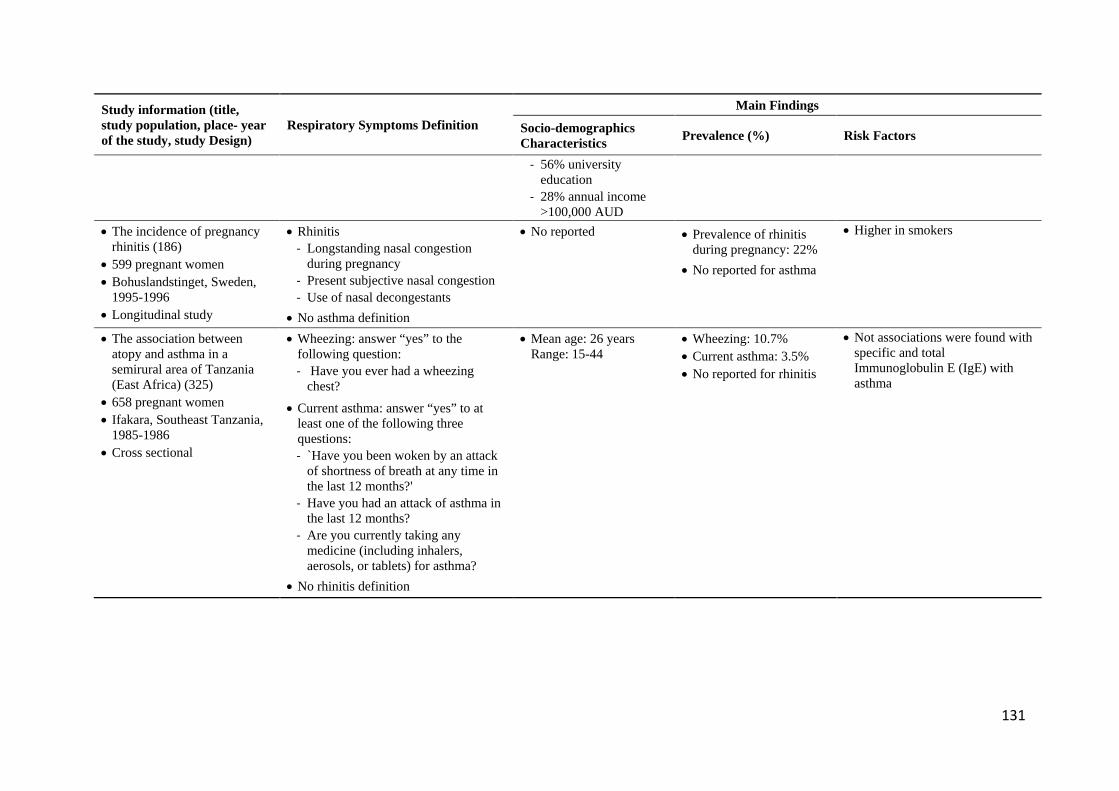
131
Study information (title, study population, place- year of the study, study Design)
Respiratory Symptoms Definition Main Findings
Socio-demographics Characteristics Prevalence (%) Risk Factors
- 56% university education
- 28% annual income >100,000 AUD
• The incidence of pregnancy rhinitis (186)
• 599 pregnant women • Bohuslandstinget, Sweden,
1995-1996 • Longitudinal study
• Rhinitis - Longstanding nasal congestion
during pregnancy - Present subjective nasal congestion - Use of nasal decongestants
• No asthma definition
• No reported
• Prevalence of rhinitis during pregnancy: 22%
• No reported for asthma
• Higher in smokers
• The association between atopy and asthma in a semirural area of Tanzania (East Africa) (325)
• 658 pregnant women • Ifakara, Southeast Tanzania,
1985-1986 • Cross sectional
• Wheezing: answer “yes” to the following question: - Have you ever had a wheezing
chest?
• Current asthma: answer “yes” to at least one of the following three questions: - `Have you been woken by an attack
of shortness of breath at any time in the last 12 months?'
- Have you had an attack of asthma in the last 12 months?
- Are you currently taking any medicine (including inhalers, aerosols, or tablets) for asthma?
• No rhinitis definition
• Mean age: 26 years Range: 15-44
• Wheezing: 10.7% • Current asthma: 3.5% • No reported for rhinitis
• Not associations were found with specific and total Immunoglobulin E (IgE) with asthma
X
132
4.3.5. Pregnancy, environmental and living risk factors for respiratory symptoms
4.3.5.1. Trimester
In this study, the participants who were in their first trimester of pregnancy had increased but not
statistically significant odds of reporting allergic rhinitis, which could be consistent with
physiological changes in the upper airways during pregnancy (334). In the study by Ellergard et
al. (186), it is reported that rhinitis appeared predominantly in the first trimester, although it could
also present in latter pregnancy stages. Demoly et al. (334) reported that persistent allergic rhinitis
could appear during the third trimester disappearing after birth. On the other hand, a Nigerian study
did not find significant differences in prevalence of allergic conditions between gestational
trimesters (190). Our findings, although not statistically significant, show a first trimester
predominance of rhinitis, and its progressive decrease during the second and third trimesters.
These findings may be due to higher susceptibility to rhinitis during early pregnancy in our
participants, who live in inadequate baseline socioeconomic conditions that could enhance their
physiologic immunosuppression.
4.3.5.2. Access to green space
As in other studies (199-201, 335), NDVI was used in our study to establish residential proximity
to greenness by participants. Our population mostly lived in areas characterized by concrete
infrastructure (median NDVI -0.007, IQR -0.01;0.00). When compared with the other studies that
used NDVI (199-201, 335), Ciudad Bolívar had the NDVI value closest to zero, corresponding to
very low or no vegetation. This reflects poor residential environmental conditions, fitting with an
area that was originally a sand quarry and then became inhabited through unplanned urbanization
(268). This sharply contrasts with well-developed areas in the Netherlands, Spain, Sweden and
Germany, where the lowest NDVI value was 0.038 in Sabadell, Spain (201) and the highest was
0.43 in rural Germany (200). Regarding housing location, in our study, we identified that
participants with more access to green spaces showed a significantly lower prevalence of rhinitis.
To our knowledge, this is the first study that reports this association in a population of pregnant
women. The association found is congruent with the German birth cohort GINI/LISA North study
done in 2,497 children where the authors found a protective effect by mean greenness of 0.43 in a
500m buffer zone around their home address during their first 10 years of life, for allergic rhinitis,
eyes and nose symptoms and aeroallergen sensitization (200). Our results are also congruent with
133
the Dutch birth cohort PIAMA done in 3,339 children, where the authors found a protective effect
of mean greenness of 0.37 in a 500m buffer zone around their home address for allergic rhinitis at
6-8 years and 10-12 years (199). In contrast, in the birth cohort GINI/LISA South with 3,306
children during the first 10 years, mean greenness of 0.35 in a similar buffer zone was reported as
a risk factor for eyes, and nose symptoms, without any association with rhinitis and aeroallergen
sensitization (200). Similar risk associations were found in the Swedish BAMSE birth cohort with
3,304 at 6-8 and 10-12 years for allergic rhinitis (199). In 3,178 Spanish schoolchildren, 9 to 12
years of age living in Sabadell, a city on the northeast of Spain, surrounding residential greenness
was not associated with current asthma and rhinoconjunctivitis, and living close to a park or forest
was associated with a higher prevalence of asthma and rhinitis (201). Based on the hypothesis that
more neighborhood trees reduce air pollution, a birth cohort of 727 African American and
Dominican children living in New York City, showed that tree canopy coverage was directly
associated with asthma and allergic sensitization at 7 years of age, while rhinitis showed no such
association (336) (Table 4.7).
Finally, in a UK cross-sectional study done in adults that assessed asthma hospitalization rates
(based on 660,505 registries), urban greenness (based on percentage of green space, percentage of
gardens and density of mature trees) and air pollution (based on NO2, PM2.5 and SO2 levels), the
authors found protective associations between green space and gardens with asthma prevalence
only in areas with low levels of air pollution, while the density of mature trees was reported as a
protective factor where air pollution levels were high. In this study, rhinitis was not included as an
outcome (205) (Table 4.7).
The incidence of rhinitis is increasing (337, 338) and this have a negative effect over quality of
life (339). Although it is presumed that increased exposure to outdoor mold and pollen may
increase the incidence of allergic rhinitis, a plausible link of a protective effect of allergic rhinitis
by greenness suggests that living close to green spaces decreases air pollution, which in turn may
reduce exposures to allergens and pollutants thus decreasing the risk of environmentally-induced
rhinitis. However, the findings about associations between green spaces, air pollution, and RS are
not conclusive (203).
Considering the variability in our findings regarding associations between greenness and rhinitis,
Fuertes et al. (199) suggest interpreting the results based on the specific conditions of the study
settings. Accordingly, our findings may be influenced by variables of population density, that in
134
Ciudad Bolívar shows disparities with some district areas concentrating more inhabitants living in
low income and inadequate housing. In these areas, urban growth is disorganized and unplanned,
generating neighborhoods that are difficult to access, unsafe, stressful and devoid of green spaces.
In Ciudad Bolívar, these are mainly located close to the mountaintop and away from main streets.
In contrast, other district areas show housing with slightly better socioeconomic conditions, with
better-planned neighborhoods, better access to green spaces and proximity to main streets.
Congruent with our observed disparity within Ciudad Bolívar, population density has elsewhere
been identified as an important co-variable that potentiates associations between greenness and
RS, in particular for allergic rhinitis (200). Considering the unsafe conditions of Ciudad Bolívar
district, we could formulate a hypothesis that the association between lack of greenness and higher
prevalence of rhinitis could also be mediated by the stress caused for worst neighborhood
conditions, including high levels of community exposure violence. Although the evidence linking
greenness and violence is ambiguous, there is a trend demonstrating that green spaces favor a
decrease in violence and crime (340). In turn, violent neighborhoods have been associated with
increased odds of allergies and asthma in adolescents and adults, including in a Colombian study
population (341-343).
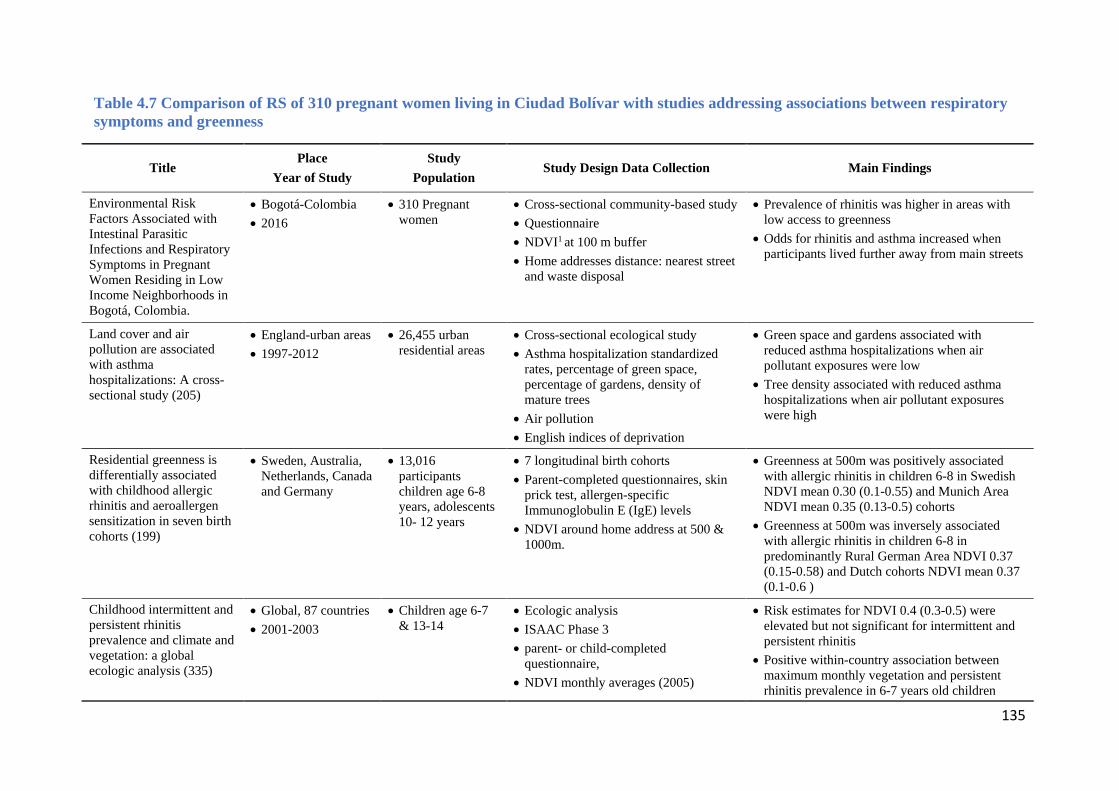
135
Table 4.7 Comparison of RS of 310 pregnant women living in Ciudad Bolívar with studies addressing associations between respiratory symptoms and greenness
Title Place
Year of Study Study
Population Study Design Data Collection Main Findings
Environmental Risk Factors Associated with Intestinal Parasitic Infections and Respiratory Symptoms in Pregnant Women Residing in Low Income Neighborhoods in Bogotá, Colombia.
• Bogotá-Colombia • 2016
• 310 Pregnant women
• Cross-sectional community-based study • Questionnaire • NDVI1 at 100 m buffer • Home addresses distance: nearest street
and waste disposal
• Prevalence of rhinitis was higher in areas with low access to greenness
• Odds for rhinitis and asthma increased when participants lived further away from main streets
Land cover and air pollution are associated with asthma hospitalizations: A cross-sectional study (205)
• England-urban areas • 1997-2012
• 26,455 urban residential areas
• Cross-sectional ecological study • Asthma hospitalization standardized
rates, percentage of green space, percentage of gardens, density of mature trees
• Air pollution • English indices of deprivation
• Green space and gardens associated with reduced asthma hospitalizations when air pollutant exposures were low
• Tree density associated with reduced asthma hospitalizations when air pollutant exposures were high
Residential greenness is differentially associated with childhood allergic rhinitis and aeroallergen sensitization in seven birth cohorts (199)
• Sweden, Australia, Netherlands, Canada and Germany
• 13,016 participants children age 6-8 years, adolescents 10- 12 years
• 7 longitudinal birth cohorts • Parent-completed questionnaires, skin
prick test, allergen-specific Immunoglobulin E (IgE) levels
• NDVI around home address at 500 & 1000m.
• Greenness at 500m was positively associated with allergic rhinitis in children 6-8 in Swedish NDVI mean 0.30 (0.1-0.55) and Munich Area NDVI mean 0.35 (0.13-0.5) cohorts
• Greenness at 500m was inversely associated with allergic rhinitis in children 6-8 in predominantly Rural German Area NDVI 0.37 (0.15-0.58) and Dutch cohorts NDVI mean 0.37 (0.1-0.6 )
Childhood intermittent and persistent rhinitis prevalence and climate and vegetation: a global ecologic analysis (335)
• Global, 87 countries • 2001-2003
• Children age 6-7 & 13-14
• Ecologic analysis • ISAAC Phase 3 • parent- or child-completed
questionnaire, • NDVI monthly averages (2005)
• Risk estimates for NDVI 0.4 (0.3-0.5) were elevated but not significant for intermittent and persistent rhinitis
• Positive within-country association between maximum monthly vegetation and persistent rhinitis prevalence in 6-7 years old children
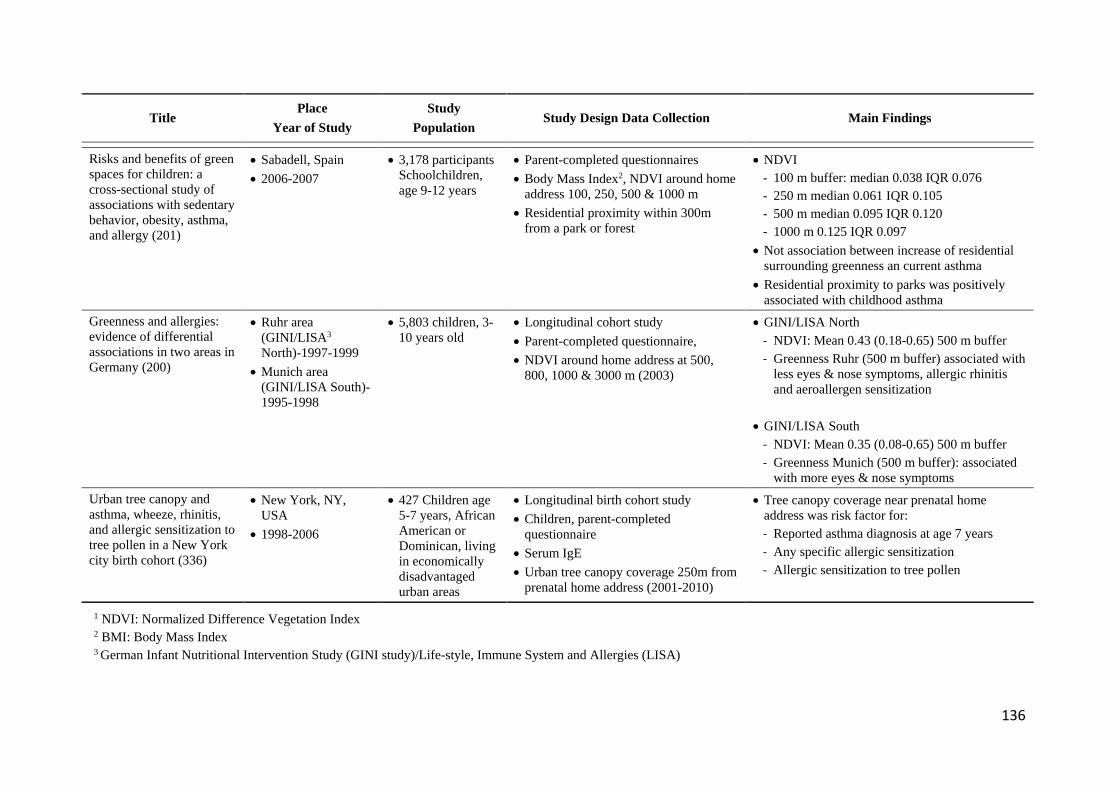
136
Title Place
Year of Study Study
Population Study Design Data Collection Main Findings
Risks and benefits of green spaces for children: a cross-sectional study of associations with sedentary behavior, obesity, asthma, and allergy (201)
• Sabadell, Spain • 2006-2007
• 3,178 participants Schoolchildren, age 9-12 years
• Parent-completed questionnaires • Body Mass Index2, NDVI around home
address 100, 250, 500 & 1000 m • Residential proximity within 300m
from a park or forest
• NDVI - 100 m buffer: median 0.038 IQR 0.076 - 250 m median 0.061 IQR 0.105 - 500 m median 0.095 IQR 0.120 - 1000 m 0.125 IQR 0.097
• Not association between increase of residential surrounding greenness an current asthma
• Residential proximity to parks was positively associated with childhood asthma
Greenness and allergies: evidence of differential associations in two areas in Germany (200)
• Ruhr area (GINI/LISA3 North)-1997-1999
• Munich area (GINI/LISA South)-1995-1998
• 5,803 children, 3-10 years old
• Longitudinal cohort study • Parent-completed questionnaire, • NDVI around home address at 500,
800, 1000 & 3000 m (2003)
• GINI/LISA North - NDVI: Mean 0.43 (0.18-0.65) 500 m buffer - Greenness Ruhr (500 m buffer) associated with
less eyes & nose symptoms, allergic rhinitis and aeroallergen sensitization
• GINI/LISA South
- NDVI: Mean 0.35 (0.08-0.65) 500 m buffer - Greenness Munich (500 m buffer): associated
with more eyes & nose symptoms Urban tree canopy and asthma, wheeze, rhinitis, and allergic sensitization to tree pollen in a New York city birth cohort (336)
• New York, NY, USA
• 1998-2006
• 427 Children age 5-7 years, African American or Dominican, living in economically disadvantaged urban areas
• Longitudinal birth cohort study • Children, parent-completed
questionnaire • Serum IgE • Urban tree canopy coverage 250m from
prenatal home address (2001-2010)
• Tree canopy coverage near prenatal home address was risk factor for: - Reported asthma diagnosis at age 7 years - Any specific allergic sensitization - Allergic sensitization to tree pollen
1 NDVI: Normalized Difference Vegetation Index 2 BMI: Body Mass Index 3 German Infant Nutritional Intervention Study (GINI study)/Life-style, Immune System and Allergies (LISA)
137
Exposure to air pollution was estimated by determining the distance between the house address
and the nearest street. We found increased odds of rhinitis and asthma prevalence in participants
living further away from the main streets. These findings contrast with evidence reporting a higher
prevalence of rhinitis and asthma in inhabitants of housing located closer to streets and thus with
increased exposure to vehicular air pollutants as risk factors. Shirinde et al. (225) performed a
study in two cities in the Highveld region, an area with high air pollution in South Africa, in which
they evaluated 3,764 children aged 13-14, to study associations between RS and exposure to
vehicular truck traffic. These authors found associations between ever having rhinitis and almost
all-day frequency of exposure to truck traffic, reporting that 56% (679/1212) of exposed children
had rhinitis (aOR 1.46, CI 1.16-1.84, p=0.001). An association was also found between current
rhinitis and frequency of truck traffic, with 43% (521/1212) of exposed children having rhinitis
(aOR 1.60, CI 1.24-2.02, p<0.001) (225). In a systematic review of 41 studies addressing the
contribution of traffic-related air pollution to asthma development in children, the overall random-
effects risk estimates (95% CI) showed associations between asthma and black carbon 1.08 (1.03,
1.14), nitrogen dioxide 1.05 (1.02, 1.07), and particulate matter PM2.5 1.03 (1.01, 1.05) and PM10
1.05 (1.02, 1.08) (221).
A review of asthma in Latin America, summarized studies on air pollution as a risk factor for
asthma, including a Mexican report evaluating diesel vehicle exposure as a risk factor for
wheezing, cough and decreased pulmonary function, a Brazilian report in which lung function in
children was negatively affected by PM10 and NO2, and an Argentinian report in which higher
asthma, exacerbations and lower pulmonary function were found in children living close to the
main oil refinery in the country (198).
Our findings may be explained by the unique geographical and sociodemographic characteristics
of Ciudad Bolívar that generate unequal access to main streets, with neighborhood clusters in poor
infrastructure and housing conditions that can likely present differential exposure to environmental
pollution. This district is located on mountain slopes with incomplete urbanization and unequal
access to adequate paved streets and vehicular traffic (344, 345). Along the mountain, from its
base to the summit, there is housing only accessible via steep staircases, of lower commercial value
and inhabited by families with lower income. Particularly at the summit, it is common to inhabit
houses with lower hygiene conditions, higher overcrowding, lower safety and higher exposure to
ozone and ascending airborne PM10 and PM2.5 contaminants (345).
138
4.3.5.3. Hygiene
In our study, hygiene conditions were not associated with RS. This may be due to rhinitis,
wheezing and asthma in our participants, being mediated by mechanisms such as underlying stress
related to low socioeconomic conditions, high levels of violence and social disadvantages, all risk
factors which have been associated with childhood asthma and rhinitis (219, 346-348). This could
be further analyzed particularly in a population such as Ciudad Bolívar, with low socioeconomic
conditions and high levels of violence (349), as stress caused by these lower housing conditions
and safety can affect the prevalence of asthma and rhinitis.
139
4.4. Conclusions
The study population was characterized because the majority of pregnant women were young.
Their sociodemographic conditions were unique with the majority of them living in the capital
district of Ciudad Bolívar in households with adequate basic sanitation. Participants were mostly
homemakers, having achieved secondary education, but reporting a low monthly income. In
addition, 30% of them were single mothers and 20% reported having been forcefully displaced
from other Colombian regions.
Regarding the IPI study, the majority of participants who answered the questionnaire and provided
at least one stool sample, were women in the second trimester of pregnancy, and living in Usaquén
and Kennedy, capital districts where sample selection was non-probabilistic. Study participants
mostly lived in socioeconomic stratum 2, with health insurance coverage and low monthly income.
In this study, the prevalence of pathogenic intestinal parasites was lower than expected, a finding
limited by the stool sample quote response, the diagnostic techniques used and difficult access to
participants living in marginalized unsafe locations. Even so, climate conditions in Bogotá and
urban access to piped water could also be contributing to this low prevalence. The only factor
statistically associated with higher prevalence of any intestinal parasite was having received
deworming drugs over a year ago, a finding that could be indicating a positive effect of preventive
therapy. However, given the limited sample size and selection bias in this study, future research
could explore other factors uncovered by this study, including trends for higher IPI prevalence in
married or cohabiting women, participants who self-identified as belonging to an ethnic minority
and women without access to handwashing facilities at home. These future studies should use
probabilistic selection of all participants, with a sufficient sample size to allow accurate
interpretation of the findings.
Regarding RS, the participants were pregnant women living in Ciudad Bolívar, who reported
asthma and wheezing prevalence lower than the adult population of Colombia, and rhinitis
prevalence similar to other Colombian studies. The high percentage of women who did not
participate limits the statistical power to do inference based on our findings. The findings of higher
prevalence of rhinitis in areas with low access to greenness, and increased odds for rhinitis and
asthma when participants lived away from main streets, may be mediated by individual
socioeconomic variables (203), including low employment and monthly income, high inbound and
outbound migration in the population with short permanence in one house, and the unique
140
environmental quality of each neighborhood. These social and environmental conditions of
vulnerability may override the effects of hygiene on respiratory health. Future studies should focus
on the effects of these variables when evaluating greenness in this population. Other additional
studies are needed to assess the types of greenness and vegetation, as NDVI is a general assessment
that does not fully capture the characteristics of green spaces that could affect allergic disorders
(199).
Overall, considering the challenges inherent to accessing urban populations living in vulnerable
conditions, it is necessary to design and support community-based research studies with active and
committed participation by local community leaders and organizations, and using mixed
methodology that will include qualitative and quantitative approaches.
4.5. The implications of the study
Considering the limitations of sample size and participant selection bias, this study can only
provide hypothesis for future research on health outcomes in pregnant women who live in
vulnerable conditions and in housing that is difficult to access. It argues for studies with larger
population samples, to continue the assessment of the impact of IPI and RS in pregnant women,
as well as the potential health impacts for their offspring. Collaborative initiatives with community
leaders and governmental agencies could facilitate overcoming research barriers regarding safe
and continuous access to participants. Considering our IPI findings, future studies could assess all
stool samples using PCR strategies with 100% sensitivity, which would require more funded
research considering the increased costs of molecular diagnosis. Regarding our finding of higher
rhinitis in pregnant women living away from main streets in marginalized areas, future research
and health actions should focus on these populations. Thus, to perform community-based research
that will discriminate health, socioeconomic and environmental variables with higher resolution,
the support by local health, government and community leadership and agencies is of paramount
importance.
141
5. REFERENCES
1. World Health Organization. Environmental Health Inequalities in Europe. In: Europe ROf, editor. Assesment Report. Geneva: WHO; 2012. 2. Instituto Nacional de Salud, Observatorio_Nacional_de_Salud. Carga de la Enfermedad Ambiental en Colombia. Informe Técnico Especial 10. Bogotá: INS; 2018. 3. Instituto Nacional de Salud. Desigualdad Social en Salud en Colombia. In: Observatorio Nacional de Salud, editor. Policy Brief. Bogotá: INS; 2014. 4. Departamento Nacional Administrativo de Estadísticas. Pobreza monetaria y multidimensional 2013. Boletín de prensa. Bogotá: DANE; 2014. 5. KNOEMA. Colombia-Índice Gini. Atlas mundial de datos-Colombia-Pobreza2014. 6. Rodríguez-Acosta S. La desigualdad de ingreso y salud en Colombia. Perfiles latinoamericanos. 2016;24:265-96. 7. Departamento Administrativo Nacional de Estadística. Necesidades Básicas Insatisfechas (NBI). Bogotá D.C.: DANE; 2011. 8. Banco Mundial. LAC Equity Lab: Desigualdad Desigualdad Urbana/Rural. Washington: Banco Mundial; 2019. 9. Asentamientos Humanos PDLNUPL, ONU. Construcción de Ciudades más equitativas políticas públicas para la inclusión en América Latina. In: Hábitat O, editor. Kenia: ONU; 2014. 10. Caicedo B, Berbesi-Fernández D. Salud autorreferida: influencia de la pobreza y la desigualdad del área de residencia. Gaceta Sanitaria. 2015;29:97-104. 11. Garcia S, Sarmiento OL, Forde I, Velasco T. Socio-economic inequalities in malnutrition among children and adolescents in Colombia: the role of individual-, household- and community-level characteristics. Public Health Nutr. 2013;16(9):1703-18. 12. Weigel MM, Armijos RX, Racines M, Cevallos W. Food Insecurity Is Associated with Undernutrition but Not Overnutrition in Ecuadorian Women from Low-Income Urban Neighborhoods. Journal of Environmental and Public Health. 2016;2016:15. 13. Rivillas JC, Colonia FD. Reducing causes of inequity: policies focused on social determinants of health during generational transitions in Colombia. Glob Health Action. 2017;10(1):1349238. 14. Profamilia. Encuesta Nacional de Demografía y Salud Tomo I. In: Ministerio_de_Salud, editor. ENDS Colombia 2015. Bogotá: Profamilia; 2015. 15. Centro Nacional de Memoria Historica. Una nación desplazada: Informe nacional del desplazamiento forzado en Colombia. Bogotá, D.C.: CNMH - UARIV; 2015. p. 608. 16. Rodriguez-Villamizar LA, Rojas-Roa NY, Blanco-Becerra LC, Herrera-Galindo VM, Fernandez-Nino JA. Short-Term Effects of Air Pollution on Respiratory and Circulatory Morbidity in Colombia 2011–2014: A Multi-City, Time-Series Analysis. Int J Environ Res Public Health. 2018;15(8):1610. 17. Acevedo N, Sánchez J, Zakzuk J, Bornacelly A, Quiroz C, Álvarez A, et al. Particular characteristics of allergic symptoms in tropical environments: follow up to 24 months in the FRAAT birth cohort study. BMC Pulm Med. 2012;12:13. 18. Sarmiento R, Hernández LJ, Medina EK, Rodríguez N, Reyes J. Síntomas respiratorios asociados con la exposición a la contaminación del aire en cinco localidades de Bogotá, 2008-2011, estudio en una cohorte dinámica. Biomédica. 2015;35:167-76. 19. Fagliano JA, Diez Roux AV. Climate change, urban health, and the promotion of health equity. PLoS Med. 2018;15(7):e1002621.
142
20. Rincón CJ, Pinzón CE, Villada AC, Castillo JS, Reveiz L, Elias V, et al. Indice compuesto de inequidad en salud para un país de mediano ingreso. Revista de Salud Pública. 2017;19(2):250-7. 21. Cáceres-Manrique FdM, Molina-Marín G. Inquidades sociales en atención materna. Revista Colombiana de Obstetricia y Ginecología. 2010;61(3):231-8. 22. UNICEF. Informe sobre equidad en salud 2016. In: University T, editor. Análisis de las inequidades en salud reproductiva, materna, neonatal, de la niñez y de la adolescencia en América Latina y el Caribe para guiar la formulación de políticas. Ciudad de Panamá: UNICEF; 2016. 23. Robinson O, Tamayo I, de Castro M, Valentin A, Giorgis-Allemand L, Hjertager Krog N, et al. The Urban Exposome during Pregnancy and Its Socioeconomic Determinants. Environmental health perspectives. 2018;126(7):077005. 24. Mor G, Cardenas I. The immune system in pregnancy: a unique complexity. Am J Reprod Immunol. 2010;63(6):425-33. 25. Hyde KJ, Schust DJ. Immunologic challenges of human reproduction: an evolving story. Fertil Steril. 2016;106(3):499-510. 26. Adegnika AA, Agnandji ST, Chai SK, Ramharter M, Breitling L, Kendjo E, et al. Increased prevalence of intestinal helminth infection during pregnancy in a Sub-Saharan African community. Wien Klin Wochenschr. 2007;119(23-24):712-6. 27. Acurero E, Díaz I, Díaz N, Bracho A, Ferrer M, Matheus A. Prevalencia de enteroparásitos en embarazadas de la maternidad "Dr. Armando Castillo Plaza" en Maracaibo, Venezuela. Kasmera. 2008;36(2):148-58. 28. Mpairwe H, Tweyongyere R, Elliott A. Pregnancy and helminth infections. Parasite Immunol. 2014;36(8):328-37. 29. Derso A, Nibret E, Munshea A. Prevalence of intestinal parasitic infections and associated risk factors among pregnant women attending antenatal care center at Felege Hiwot Referral Hospital, northwest Ethiopia. BMC Infect Dis. 2016;16(1):530. 30. Belanger K, Hellenbrand ME, Holford TR, Bracken M. Effect of pregnancy on maternal asthma symptoms and medication use. Obstet Gynecol. 2010;115(3):559-67. 31. Kelly W, Massoumi A, Lazarus A. Asthma in pregnancy: Physiology, diagnosis, and management. Postgrad Med. 2015;127(4):349-58. 32. Murphy VE, Jensen ME, Gibson PG. Asthma during Pregnancy: Exacerbations, Management, and Health Outcomes for Mother and Infant. Semin Respir Crit Care Med. 2017;38(2):160-73. 33. Aderoba AK, Iribhogbe OI, Olagbuji BN, Olokor OE, Ojide CK, Ande AB. Prevalence of helminth infestation during pregnancy and its association with maternal anemia and low birth weight. Int J Gynaecol Obstet. 2015;129(3):199-202. 34. Mehta RS, Rodriguez A, Chico M, Guadalupe I, Broncano N, Sandoval C, et al. Maternal geohelminth infections are associated with an increased susceptibility to geohelminth infection in children: a case-control study. PLoS neglected tropical diseases. 2012;6(7):e1753. 35. Alcaldía Mayor de Bogotá, Secretaría de Hacienda. Diagnóstico físico y socioeconómico de las localidades de Bogotá D.C.: Ciudad Bolívar. In: Departamento Administrativo de Planeación, editor. Diagnóstico físico y socioeconómico de las localidades de Bogotá DC. Mario Villamor Duque ed. Bogotá: Alcaldía Mayor de Bogotá; 2004. 36. Alcaldía Mayor de Bogotá, Secretaría de Hacienda. Recorriendo a Usaquén. In: Departamento Administrativo de Planeación, editor. Diagnóstico físico y socioeconómico de las localidades de Bogotá DC. Mario Villamor ed. Bogotá: Alcaldía Mayor de Bogotá; 2004.
143
37. Alcaldía Mayor de Bogotá. Recorriendo Kennedy. In: Departamento Administrativo de Planeación, editor. Diagnóstico Físico y socioeconómico de las localidades de Bogotá DC. Mario Villamor ed. Bogotá: Alcaldía Mayor de Bogotá; 2004. 38. Cogua Moreno MI, Vargas Bolívar FH. Dinámica de la construcción por usos: Localidad Ciudad Bolívar en los años 2002-2012. In: Alcaldía_Mayor_de_Bogotá, editor. Bogotá: Alcaldía Mayor de Bogotá; 2013. 39. García Galindo W. Dinámica de la construcción por usos localidad de Kennedy en los años 2002-2012. In: Alcaldía_Mayor_de_Bogotá, editor. Bogotá: Alcaldía Mayor de Bogotá; 2013. 40. Trujillo-Corredor RH. Dinámica de las construcciones por usos de la Localidad de Usaquén en los años 2002 y 2012. In: Alcaldía_Mayor_de_Bogotá, editor. Bogotá: Alcaldía Mayor de Bogotá; 2013. 41. Camargo-Sierra AP, Hurtado-Tarazona A. Vivienda y pobreza: una relación compleja. Cuadernos de Vivienda y Urbanismo. 2011;4(8):224-46. 42. Morales M. Inquilinatos, la otra realidad de la vivienda. El Tiempo. 2010;Sect. Redacción economía y negocios. 43. Alcaldía Mayor de Bogotá. Plan de Ordenamiento Territorial de Bogotá. Resumen del diagnóstico general. Bogotá: Alcaldía Mayor de Bogotá; 2017. 44. Hospital de Usaquén E.S.E. Localidad 01 Usaquén: Diagnóstico local de salud con participación social 2009 - 2010. In: Bogotá AMd, editor. Bogotá: Alcaldía Mayor de Bogotá; 2010. 45. Secretaría de Salud, Subred Integrada de Servicios de Salud, E.S.E. S. Documento Análisis de condiciones de Calidad de Vida, Salud y Enfermedad. In: Bogotá AMd, editor. Bogotá: Alcaldía Mayor de Bogotá; 2016. 46. Secretaría de Cultura Recreación y Deportes. Localidad de Kennedy Ficha Básica. In: Mena Lozano Ú, editor. Bogotá: Secretaría de Cultura, Recreación y Deportes; 2008. 47. Jiménez Reyes LC, Cruz Ojeda D, Cardeño FA. Dinámica espacial del delito y de la convivencia en Ciudad Bolívar Bogotá: Análisis espacial de los hotspot [Available from: http://observatoriogeograficoamericalatina.org.mx/egal11/Geografiasocioeconomica/Geografiacultural/18.pdf. 48. Sossa Portela I, Guío S, Medina Medina I. Diagnóstico Local con participación social 2014: Localidad Kennedy. In: Hospital_del_Sur_ESE, saludables T, Pública VeS, Bogotá AMd, editors. Bogotá: Alcaldía Mayor de Bogotá; 2015. 49. Hospital Vista Hermosa I Nivel E.S.E. Análisis de Situación en Salud Localidad de Ciudad Bolívar. In: Alcaldía Mayor de Bogotá, editor. Bogotá: Alcaldía Mayor de Bogotá; 2010. 50. Asociación Probienestar de la Familia Colombiana. 1ª Encuesta Distrital de Demografía y Salud - Bogotá. Bogotá D.C.: PROFAMILIA; 2011. p. 564. 51. Secretaría de Hábitat, Subdirección de Información Sectorial. Diagnóstico Ciudad Bolívar 2018. In: Bogotá AMd, editor. Hábitat en cifras. Bogotá: Alcaldía Mayor de Bogotá; 2018. 52. Secretaría de Hábitat, Subdirección de Información Sectorial. Diagnóstico Kennedy 2018. In: Bogotá AMd, editor. Hábitat en cifras. Bogotá: Alcaldía Mayor de Bogotá; 2018. 53. Secretaría de Hábitat, Subdirección de Información Sectorial. Diagnóstico Usaquén 2018. In: Bogotá AMd, editor. Hábitat en cifras. Bogotá: Alcaldía Mayor de Bogotá; 2018. 54. Escobar-Pineda S, Orduz-Perdomo M. Determinantes de la calidad en la educación superior en Colombia. Bogotá: Pontificia Universidad Javeriana; 2013. 55. Secretaría Distrital de Planeación. Información, Cartografía y Estadística Bogotá: Alcaldía Mayor de Bogotá; 2011 [Available from: http://www.sdp.gov.co/gestion-estudios-estrategicos/informacion-cartografia-y-estadistica/consulta?page=3.
144
56. Centro de Estudios Económicos Regionales. La salud en Colombia: más cobertura pero menos acceso. In: Ayala-García J, editor. Cartagena: Banco de la República; 2014. 57. Secretaría Distrital de la Mujer. Diagnósticos locales de seguridad y convivencia para las mujeres en Bogotá. Bogotá: Alcaldía Mayor de Bogotá; 2014. 58. Batista O, Martínez R. Intervención comunitaria en las parasitosis intestinales parroquia Santa Bárbara, estado Anzoátegui, 2010. Revista Habanera de Ciencias Médicas. 2011;10(2):233-45. 59. Costa L, Rey L. Aleitamento e parasitismo intestinal materno-infantil. Revista da Sociedade Brasileira de Medicina Tropical. 2000;33(4):371-5. 60. Steketee R. Pregnancy, Nutrition and Parasitic Diseases. JNutr. 2003;133:1661S-7S. 61. Rodríguez-Morales A, Barbella R, Case C, Arria M, Ravelo M, Perez H, et al. Intestinal Parasitic Infections Among Pregnant Women in Venezuela. Infectious Diseases in Obstetrics and Gynecology. 2006;2006:1 - 5. 62. World Health Organization. WHO - Fact sheets - Soil Transmitted Helminths infections: World Health Organization; 2017 [Available from: https://www.who.int/en/news-room/fact-sheets/detail/soil-transmitted-helminth-infections. 63. World Health Organization. WHO - Fact sheets - Schistosomiasis: World Health Organization; 2018 [Available from: https://www.who.int/news-room/fact-sheets/detail/schistosomiasis. 64. World Health Organization. WHO - Foodborne trematode infections - Fascioliasis: World Health Organization; 2019 [Available from: https://www.who.int/foodborne_trematode_infections/fascioliasis/en/. 65. Centers for Disease Control and Prevention. CDC - Parasites - Taeniasis: Biology: CDC; 2013 [Available from: https://www.cdc.gov/parasites/taeniasis/biology.html. 66. Centers for Disease Control and Prevention. CDC - DPDx - Hymenolepiasis: CDC; 2017 [Available from: https://www.cdc.gov/dpdx/hymenolepiasis/index.html. 67. World Health Organization. WHO - International Travel Health - Amoebiasis: WHO; 2012 [Available from: https://www.who.int/ith/diseases/amoebiasis/en/. 68. World Health Organization. WHO - International travel and health - Giardiasis: WHO; 2012 [Available from: https://www.who.int/ith/diseases/giardiasis/en/. 69. Centers for Disease Control and Prevention. CDC - DPDx - Blastocystis hominis: Parasite Biology: CDC; 2019 [Available from: https://www.cdc.gov/dpdx/blastocystis/index.html. 70. Centers for Disease Control and Prevention. CDC - DPDx - Intestinal Amebae: Parasite Biology: CDC; 2019 [Available from: https://www.cdc.gov/dpdx/intestinalamebae/index.html. 71. Pan American Health Organization, World Health Organization. PAHO - Neglected, Tropical and Vector Borne Diseases - Soil Transmitted Helminthiasis: PAHO; 2019 [Available from: https://www.paho.org/hq/index.php?option=com_topics&view=article&id=419&Itemid=41001⟨=en. 72. World Health Organization. WHO - Neglected Tropical Diseases 2019 [Available from: http://www.searo.who.int/entity/vector_borne_tropical_diseases/en/. 73. Silver ZA, Kaliappan SP, Samuel P, Venugopal S, Kang G, Sarkar R, et al. Geographical distribution of soil transmitted helminths and the effects of community type in South Asia and South East Asia - A systematic review. PLoS neglected tropical diseases. 2018;12(1):e0006153. 74. Pan American Health Organization. Epidemiological Profiles of Neglected Diseases and Other Infections Related to Poverty in Latin America and The Caribbean. Washington: PAHO; 2009. Available from: http://new.paho.org/hq/dmdocuments/2009/nds-epi-profiles.pdf.
145
75. Solano L, Acuña I, Barón M, Morón de Salim A, A. S. Asociación entre pobreza e infestación parasitaria intestinal en preescolares, escolares y adolescentes del sur de Valencia Estado Carabobo-Venezuela. Kasmera. 2008;36(2):137-47. 76. Giraldo J, Lora F, Henao L, Mejía S, Gómez J. Prevalencia de Giardiasis y Parásitos Intestinales en preescolares de hogares atendidos en un programa estatal en Armenia, Colombia. Revista de Salud Pública. 2005;7(3):327-38. 77. Velarde L, Mendoza M. Prevalencia de Blastocystis Homanis en menores de 12 años de una población mexicana urbana. Rev Cubana Pediatric. 2006;78(4). 78. Speich B, Marti H, Ame S, Ali S, Bogoch I, Utzinger J, et al. Prevalence of intestinal protozoa infection among school-aged children on Pemba Island, Tanzania, and effect of single-dose albendazole, nitazoxanide and albendazole-nitazoxanide. Parasites & vectors. 2013;6(3). 79. Saboyá M, Catalá L, Ault, Nicholls R. Prevalence and intensity of infection of Soil-transmitted Helminths in Latin America and the Caribbean Countries: Mapping at second administrative level 2000-2010. Washington D.C.: Pan American Health Organization; 2011. 80. Valencia C, Fernández J, Cucunubá Z, Reyes P, López M, Duque S. Correlation between malaria incidence and prevalence of soil-transmitted helminths in Colombia: An ecologic evaluation. Biomédica. 2010;30:501-8. 81. Valderrama J, Arias V, Parra E. Haga usted el diagnóstico. Biomédica. 2005;25:148-51. 82. Pinzón-Rondon ÁM, Gaona MA, Bouwmans M, Chávarro LC, Chafloque J, Zuluaga C, et al. Acceso a agua potable, protección ambiental y parasitismo intestinal infantil en El Codito. Bogotá, Colombia. Revista de Salud Pública. 2019;21:42-8. 83. Escobedo AA, Cimerman S. Giardiasis: a pharmacotherapy review. Expert Opin Pharmacother. 2007;8(12):1885-902. 84. Tan KSW. New Insights on Classification, Identification, and Clinical Relevance of Blastocystis spp. Clinical Microbiology Reviews. 2008;21(4):639-65. 85. Pezzani B, Minvielle M, Ciarmela M, Apezteguía M, Basualdo J. Participación comunitaria en el control de las parasitosis intestinales en una localidad rural de Argentina. Rev Panam Salud Publica. 2009;26(6):471-7. 86. Londoño ÁL, Mejía S, Gómez-Marín JE. Prevalencia y Factores de Riesgo Asociados a Parasitismo Intestinal en Preescolares de Zona Urbana en Calarcá, Colombia. Revista de Salud Pública. 2009;11(1):72-81. 87. Agudelo S, Gómez-Rodríguez L, Coronado X, Orozco A, Valencia-Gutiérrez C, Restrepo-Betancur L, et al. Prevalencia de Parasitosis Intestinales y Factores Asociados en un Corregimiento de la Costa Atlántica Colombiana. Rev salud pública. 2008;10(4):633-42. 88. Arias I, González M. Determinación de la coinfección entre enterobacterias, parásitos y norovirus en niños de edades entre tres meses y cinco años con enfermedad diarreica aguda en la los barrios Arabia y Jerusalén de la localidad de Ciudad Bolívar, Bogotá - Colombia. Bogotá D.C: Pontificia Universidad Javeriana; 2009. 89. Chaves M, Fernández J, Ospina I, López M, Moncada L, Reyes P. Tendencia de la prevalencia y factores asociados a la infección por Giardia duodenalis en escolares y preescolares de una zona rural de Cundinamarca. Biomédica. 2007;27:345-51. 90. González M, Carabin A, Baylon L, Rosales J. De amibas y amebiasis: Entamoeba histolytica. Elementos. 2012;87:13-8. 91. Rojas L, Núñez F, Aguiar P, Silva L, Álvarez D, Martínez R, et al. Segunda encuesta nacional de infecciones parasitarias intestinales en Cuba, 2009. Rev Cubana Med Trop. 2012;64(1):15-21.
146
92. Guzmán C, López M, Reyes P, Gómez J, Corredor A, Agudelo C. Diferenciación de Entamoeba histolytica y Entamoeba dispar en muestras de materia fecal por detección de adhesina de E. histolytica mediante ELISA. Biomédica. 2001;21:167-71. 93. Gallego Ml, Gómez JE, Torres E, Lora F. Prevalencia de E. histolytica en asentamientos temporales post terremoto de la ciudad de Armenia. Infectio. 2003;7:190-94. 94. Lozano R, Naghavi M, Foreman K, Lim S, Shibuya K, Aboyans V, et al. Global and regional mortality from 235 causes of death for 20 age groups in 1990 and 2010: a systematic analysis for the Global Burden of Disease Study 2010. Lancet. 2012;380:2095-128. 95. Centers_for_Disease_Control_and_Prevention. CDC - Immigrant and Refugee Health - Domestic Intestinal Parasite Guidelines: CDC; 2018 [Available from: https://www.cdc.gov/immigrantrefugeehealth/guidelines/domestic/intestinal-parasites-domestic.html. 96. Rincón C, Garzón P, Guasmayan L, Flórez A. Frecuencia de parasitismo intestinal en manipuladores de alimentos de cinco ciudades de Colombia, 2008. NOVA - Publicación Científica en Ciencias Biomédicas. 2009;7(11):80-4. 97. El Deeb HK, Salah-Eldin H, Khodeer S. Blastocystis hominis as a contributing risk factor for development of iron deficiency anemia in pregnant women. Parasitology research. 2012;110(6):2167-74. 98. Rivero-Rodríguez Z, Chourio-Lozano G, Diaz I, Cheng R, Rucsón G. Enteroparásitos en escolares de una institución pública del municipio Maracaibo, Venezuela. Investigación Clínica. 2000;41(1):37-57. 99. Petney TN. Environmental, cultural and social changes and their influence on parasite infections. International journal for parasitology. 2001;31(9):919-32. 100. Tay SC, Nani EA, Walana W. Parasitic infections and maternal anaemia among expectant mothers in the Dangme East District of Ghana. BMC Res Notes. 2017;10(1):3. 101. Flores A, Esteban J-G, Angles R, Mas-Coma S. Soil-transmitted helminth infections at very high altitude in Bolivia. Transactions of The Royal Society of Tropical Medicine and Hygiene. 2001;95(3):272-7. 102. Chammartin F, Scholte RG, Malone JB, Bavia ME, Nieto P, Utzinger J, et al. Modelling the geographical distribution of soil-transmitted helminth infections in Bolivia. Parasites & vectors. 2013;6:152. 103. Weaver HJ, Hawdon JM, Hoberg EP. Soil-transmitted helminthiases: implications of climate change and human behavior. Trends Parasitol. 2010;26(12):574-81. 104. Chammartin F, Scholte RG, Guimarães LH, Tanner M, Utzinger J, Vounatsou P. Soil-transmitted helminth infection in South America: a systematic review and geostatistical meta-analysis. Lancet Infect Dis. 2013;13(6):507-18. 105. Strunz EC, Addiss DG, Stocks ME, Ogden S, Utzinger J, Freeman MC. Water, Sanitation, Hygiene, and Soil-Transmitted Helminth Infection: A Systematic Review and Meta-Analysis. PLoS Med. 2014;11(3):e1001620. 106. Becker DJ, Oloya J, Ezeamama AE. Household Socioeconomic and Demographic Correlates of Cryptosporidium Seropositivity in the United States. PLoS neglected tropical diseases. 2015;9(9):e0004080. 107. Rivero MR, De Angelo C, Nunez P, Salas M, Motta CE, Chiaretta A, et al. Environmental and socio-demographic individual, family and neighborhood factors associated with children intestinal parasitoses at Iguazú, in the subtropical northern border of Argentina. PLoS Negl Trop Dis. 2017;11(11):e0006098.
147
108. Campbell SJ, Nery SV, Wardell R, D’Este CA, Gray DJ, McCarthy JS, et al. Water, Sanitation and Hygiene (WASH) and environmental risk factors for soil-transmitted helminth intensity of infection in Timor-Leste, using real time PCR. PLoS neglected tropical diseases. 2017;11(3):e0005393. 109. Prüss-Üstün A, Bos R, Gore F, Bartram J. Safer water, better health: costs, benefits and sustainability of interventions to protect and promote health. 2008. 110. Mahande AM, Mahande MJ. Prevalence of parasitic infections and associations with pregnancy complications and outcomes in northern Tanzania: a registry-based cross-sectional study. BMC Infectious Diseases. 2016;16(1):78. 111. Gizaw Z, Adane T, Azanaw J, Addisu A, Haile D. Childhood intestinal parasitic infection and sanitation predictors in rural Dembiya, northwest Ethiopia. Environmental health and preventive medicine. 2018;23(1):26. 112. Östan İ, Kilimcioğlu AA, Girginkardeşler N, Özyurt BC, Limoncu ME, Ok ÜZ. Health inequities: lower socio-economic conditions and higher incidences of intestinal parasites. BMC Public Health. 2007;7(1):342. 113. Feleke BE, Jember TH. Prevalence of helminthic infections and determinant factors among pregnant women in Mecha district, Northwest Ethiopia: a cross sectional study. BMC Infect Dis. 2018;18(1):373. 114. Alvarado BE, Vásquez LR. Determinantes sociales, prácticas de alimentación y consecuencias nutricionales del parasitismo intestinal en niños de 7 a 18 meses de edad en Guapi, Cauca. Biomédica. 2006;26(1):82-94. 115. Adegoke AA, Amoah ID, Stenström TA, Verbyla ME, Mihelcic JR. Epidemiological Evidence and Health Risks Associated With Agricultural Reuse of Partially Treated and Untreated Wastewater: A Review. Frontiers in public health. 2018;6:337. 116. Hammer CC, Brainard J, Hunter PR. Risk factors and risk factor cascades for communicable disease outbreaks in complex humanitarian emergencies: a qualitative systematic review. BMJ Glob Health. 2018;3(4):e000647. 117. Gualdieri L, Rinaldi L, Petrullo L, Morgoglione ME, Maurelli MP, Musella V, et al. Intestinal parasites in immigrants in the city of Naples (southern Italy). Acta Trop. 2011;117(3):196-201. 118. Abu-Madi MA, Behnke JM, Boughattas S, Al-Thani A, Doiphode SH, Deshmukh A. Helminth infections among long-term-residents and settled immigrants in Qatar in the decade from 2005 to 2014: temporal trends and varying prevalence among subjects from different regional origins. Parasit Vectors. 2016;9:153. 119. Mofid LS, Gyorkos TW. The Case for Maternal Postpartum Deworming. In: Clements ACA, editor. PLoS neglected tropical diseases. 11. San Francisco, CA USA2017. 120. Thayer WM, Clermont A, Walker N. Effects of deworming on child and maternal health: a literature review and meta-analysis. BMC Public Health. 2017;17(4):830. 121. Taylor-Robinson DC, Maayan N, Soares-Weiser K, Donegan S, Garner P. Deworming drugs for soil-transmitted intestinal worms in children: effects on nutritional indicators, haemoglobin, and school performance. Cochrane Database Syst Rev. 2015(7):Cd000371. 122. Ministerio de Salud y Protección Social. Lineamiento de Desparasitación Antihelmíntica Masiva, en el Marco de la Estrategia “Quimioterapia Preventiva Antihelmíntica de OMS”. Bogotá D.C.: MSPS; 2013. p. 52. 123. Ministerio de Salud y Protección Social. Guías de promoción de la salud y prevención de enfermedades en la salud pública - Guía para la detección temprana de las alteraciones del embarazo. Bogotá D.C.: MSPS; 2007. p. 119-53.
148
124. Romero-Sandoval N, Ortiz-Rico C, Sanchez-Perez HJ, Valdivieso D, Sandoval C, Pastor J, et al. Soil transmitted helminthiasis in indigenous groups. A community cross sectional study in the Amazonian southern border region of Ecuador. BMJ Open. 2017;7(3):e013626. 125. Heijnen M, Cumming O, Peletz R, Chan GK, Brown J, Baker K, et al. Shared sanitation versus individual household latrines: a systematic review of health outcomes. PLoS One. 2014;9(4):e93300. 126. Mendoza J, Rosas A. The Economic Effects of Geography: Colombia as a Case Study. Revista Desarrollo y Sociedad. 2012. 127. Alcaldía Mayor de Bogotá D.C. Conociendo la localidad de Barrios Unidos: Diagnóstico de los aspectos físicos, demográficos y socioeconómicos. Bogotá D.C.: Secretaría Distrital de Planeación; 2009. 128. Departamento Administrativo Nacional de Estadística. Pobreza monetaria y multidimensional en Colombia 2011 - Boletín Técnico. Bogotá, D.C.: DANE; 2012. 129. Departamento Administrativo Nacional de Estadística. Pobreza monetaria y multidimensional en Colombia 2012 - Boletín Técnico. Bogotá D.C.: DANE; 2013. 130. Alcaldía Mayor de Bogotá D.C. La Estratificación en Bogotá D.C. y Estudios Relacionados 1983-2004. Bogotá D.C.: Departamento Administrativo de Planeación Distrital; 2004. p. 56. 131. Departamento Nacional de Planeación. Documento Conpes 3386: Plan de acción para la focalización de los subsidios para servicios públicos domiciliarios. Bogotá, D.C.: DNP: DIES – DDUPA; 2005. p. 30. 132. Ramírez-Gómez M. Pobreza y Servicios Públicos Domiciliarios. Bogotá: Departamento Nacional de Planeación - DNP; 2007. 133. Manrique-Abril FG, Suescún-Carrero SH. Prevalencia de parasitismo intestinal y situación nutricional en escolares y adolescentes de Tunja. Rev CES Med. 2011;25(1):20-30. 134. Agudelo-Lopez S, Gómez-Rodríguez L, Coronado X, Orozco A, Valencia-Gutierrez CA, Restrepo-Betancur LF, et al. [Prevalence of intestinal parasitism and associated factors in a village on the Colombian Atlantic Coast]. Rev Salud Publica (Bogota). 2008;10(4):633-42. 135. López J, Morales A, Perdomo J, Murillo L, Palma O. Guias de manejo (3) Parasitosis intestinal. Manizales: Universidad de Manizales - Facultad de Medicina; 2006. 136. Alcaldía Mayor de Bogotá D.C.-Secretaría General. Alcaldía Mayor de Bogotá - Ciudad - Ubicacion | Clima: Secretaría General - Alcaldía Mayor de Bogotá D.C.; 2017 [Available from: http://www.bogota.gov.co/ciudad. 137. Departamento Administrativo Nacional de Estadística. Estimación y proyección de población nacional, departamental y municipal total por área 1985-2020. Bogotá D.C.: DANE; 2013. 138. Alcaldía Mayor de Bogotá D.C. Conociendo la localidad de Ciudad Bolívar: Diagnóstico de los aspectos físicos, demográficos y socioeconómicos. Bogotá D.C.: Secretaría Distrital de Planeación; 2009. 139. Alcaldía Mayor de Bogotá D.C. Bogotá, Ciudad de Estadísticas. Boletín Nº 42 Método integrado de Pobreza. Bogotá D.C.: Secretaría Distrital de Planeación; Alcaldía Mayor de Bogotá D.C.; 2011. p. 33. 140. Casa Editorial El Tiempo. Mapa e Información de Estratos en Bogotá. Metro Cuadrado. Noviembre 2013 November 2013. 141. Departamento Administrativo Nacional de Estadística, Alcaldía Mayor de Bogotá_D.C. Encuesta Calidad de Vida - Bogotá 2017: Resultados Preliminares. Bogotá D.C.: Colección de Estudios y Políticas Socioeconómicos - DANE; Secretaría de Planeación - Alcaldía Mayor de Bogotá D.C.; 2008. p. 142.
149
142. Bonilla D. Asociación entre estado nutricional y la presencia de parasitosis intestinales en niños preescolares del Colegio San Francisco de Asís, Barrio el Codito y Bella Vista, Bogotá D.C. Bogotá D.C.: Pontificia Universidad Javeriana; 2009. 143. Agudelo C. C, Moncada LI, Mejía LE, Cáceres V. E. Parasitismo intestinal en comunidades marginadas de Bogotá. 1986. 1986;40(4):9. 144. Profamilia. Encuesta Nacional de Demografía y Salud (ENDS 2010). Bogotá D.C.: Asociación Probienestar de la Familia Colombiana - Profamilia; Ministerio de Protección Social; 2011. p. 793. 145. Ibáñez A, Moya A. La población desplazada en Colombia: Examen de sus condiciones socioeconómicas y análisis de las políticas actuales. Bogotá D.C.2007. Available from: https://www.dnp.gov.co/Portals/0/archivos/documentos/DDS/Pobreza/Portadas/POBLACION%20DESPLAZADA.pdf. 146. Marecki M, Heeb K, Zitka W. Protozoan infection in the perinatal period. J Perinat Neonatal Nurs. 1997;11(1):21-33. 147. Adegnika A, Agnandji S, Chai S, Ramharter M, Breitling L, Kendjo E, et al. Increased prevalence of intestinal helminth infection during pregnancy in a Sub-Saharan African community. Wien Klin Wochenschr. 2007;119(23-24):712-6. 148. Rodríguez-García R, Rodríguez-Guzmán LM, Sánchez-Maldonado MI, Gómez-Delgado A, R ivera-Cedillo R. [Prevalence and risk factors associated with intestinal parasitoses in pregnant women and their relation to the infant's birth weight]. Ginecologia y obstetricia de Mexico. 2002;70(Jul):338-43. 149. Shah O, Robanni I, Khan F, Zargar S, Javid G. Management of biliaryascariasis in pregnancy. World J Surg. 2005;29:1294-8. 150. Dotters-Katz S, Kuller J, Phillips Heine R. Parasitic Infections in Pregnancy. Obstetrical and Gynecological Survey. 2011;6(8). 151. Gyorkos T, Gilbert N, Larocque R, Casapía M. Trichuris and hookworm infections associated with anaemia during pregnancy. Trop Med Int Health. 2011;16(4):531-7. 152. Larocque R, Casapia M, Gotuzzo E, MacLean JD, Soto J, Rahme E, et al. A double-blind randomized controlled trial of antenatal mebendazole to reduce low birthweight in a hookworm-endemic area of Peru. Tropical Medicine and International Health. 2006;11(10):1485-95. 153. Gyorkos T, Gilbert N, Larocque R, Casapía M, Montresor A. Re-Visiting Trichuris trichiura Intensity Thresholds Based on Anemia during Pregnancy. PLoS neglected tropical diseases. 2012;6(9). 154. Cooper P, Chico M, Losonsky G, Sandoval C, Espinel I, Sridhara R, et al. Albendazole treatment of children with ascariasis enhances the vibriocidal antibody response to the live attenuated oral cholera vaccine CVD 103-HgR. J Infect Dis. 2000;182(4):1199-206. 155. Cooper P, Chico M, Espinel I, Sandoval C, Guevara A, Levine M, et al. Human infection with Ascaris lumbricoides is associated with suppression of the IL-2 response to recombinant cholera toxin Bsubunit following vaccination with the live oral cholera vaccine CVD 103 HgR. Infect Immun. 2001;69:1574-80. 156. Elias D, Wolday D, Akuffo H, Petros B, Bronner U, Britton S. Effect of deworming on human T cell responses to mycobacterial antigens in helminth-exposed individuals before and after bacille Calmette-Guérin (BCG) vaccination. Clin Exp Immunol. 2001;123(2):219-25. 157. Labeaud A, Malhotra I, King M, King C, King C. Do antenatal parasite infections devalue childhood vaccination? PLoS Negl Trop Dis 2009;3(5). 158. Cooper P, Chico M, Guadalupe I, Sandoval C, Mitre E, Platts-Mills T, et al. Impact of early life exposures to geohelminth infections on the development of vaccine immunity, allergic
150
sensitization, and allergic inflammatory diseases in children living in tropical Ecuador: the ECUAVIDA birthcohort study. BMC Infectious Diseases. 2011;11(184). 159. Belyhun Y, Medhin G, Amberbir A, Erko B, Hanlon C, Alem A, et al. Prevalence and risk factors for soil-transmitted helminth infection in mothers and their infants in Butajira, Ethiopia: a population based study. BMC Public Health. 2010;10:21. 160. Larocque R, Casapia M, Gotuzzo E, Gyorkos T. Relationship between intensity of soil-transmitted helminth infections and anemia during pregnancy. Am J Trop Med Hyg. 2005;73(4):783-9. 161. Barker D, Clark P. Fetal Undernutrition and disease in later life. Rev Reprod. 1997;2(2):105-12. 162. Olza I, editor III Jornada de Salud Perinatal. Ansiedad Materna y Efecto Nocebo del Control Prenatal; 2009; Santiago de Compostela. 163. Jones J, Schulkin J, Maquire J. Therapy for common parasitic diseases in pregnancy in the United States: a review and a survey of obstetrician/gynecologists' level of knowledge about these diseases. Obstet Gynecol Surv. 2005;60(6):386-93. 164. Lenoble R, Chandenier J, Duong T. Antiparasitic treatments in pregnant women and in children in 2003. Med Trop. 2003;63(4-5):491-7. 165. Liabsuetrakul T, Chaikongkeit P, Korviwattanagarn S, Petrueng C, Chaiya S, Hanvattanakul C, et al. Epidemiology and the effect of treatment of soil-transmitted helminthiasis in pregnant women in southern Thailand. Southheast Asian J Tropical Med Pub Health. 2009;40(2):211-22. 166. Gyorkos T, Larocque R, Casapia M, Gotuzzo E. Lack of Risk of Adverse Birth Outcomes After Deworming in Pregnant Women. The Pediatric Infectious Disease Journal. 2006;25(9). 167. de Silva N, Sirisena J, Gunasekera D, Ismail M, de Silva H. Effect of mebendazole therapy during pregnancy on birth outcome. Lancet. 1999;353(9159):1145-9. 168. Bialek R, Knobloch J. [Parasitic infections in pregnancy and congenital protozoan infections. Part I.: Protozoan infections]. Z Geburtshilfe Neonatol. 1999;203(2):55-62. 169. Reddel H. The impact of the global initiative for asthma (GINA): Compass, concepts, controversies and challenges. . 2019;5(1):4-18. 170. Global Asthma Network. The Global Asthma Report. Auckland: The Global Asthma Network; 2018. 171. Aaron SD, Boulet LP, Reddel HK, Gershon AS. Underdiagnosis and Overdiagnosis of Asthma. Am J Respir Crit Care Med. 2018;198(8):1012-20. 172. Postma DS, Rabe KF. The Asthma-COPD Overlap Syndrome. N Engl J Med. 2015;373(13):1241-9. 173. Mallol J, Solé D, Baeza-Bacab M, Aguirre-Camposano V, Soto-Quiros M, Baena-Cagnani C, et al. Regional variation in asthma symptom prevalence in Latin American children. J Asthma. 2010;47(6):644-50. 174. Caraballo L, Cadavid A, Mendoza J. Prevalence of asthma in a Tropical city of Colombia. Ann Allergy. 1992;68(6):525-9. 175. Dennis R, Caraballo L, Garcia E, Caballero A, Aristizabal G, Cordoba H, et al. Asthma and other allergic conditions in Colombia: a study in 6 cities. Ann Allergy Asthma Immunol. 2004;93(6):568-74. 176. Dennis RJ, Caraballo L, García E, Rojas MX, Rondon MA, Pérez A, et al. Prevalence of asthma and other allergic conditions in Colombia 2009–2010: a cross-sectional study. BMC Pulm Med. 122012. p. 17.
151
177. Gonzalez-Garcia M, Caballero A, Jaramillo C, Maldonado D, Torres-Duque CA. Prevalence, risk factors and underdiagnosis of asthma and wheezing in adults 40 years and older: A population-based study. J Asthma. 2015;52(8):823-30. 178. Dykewicz MS, Fineman S, Skoner DP, Nicklas R, Lee R, Blessing-Moore J, et al. Diagnosis and management of rhinitis: complete guidelines of the Joint Task Force on Practice Parameters in Allergy, Asthma and Immunology. American Academy of Allergy, Asthma, and Immunology. Ann Allergy Asthma Immunol. 1998;81(5 Pt 2):478-518. 179. Passali D, Cingi C, Staffa P, Passali F, Muluk NB, Bellussi ML. The International Study of the Allergic Rhinitis Survey: outcomes from 4 geographical regions. Asia Pac Allergy. 2018;8(1):e7. 180. Bjerg A, Ekerljung L, Middelveld R, Dahlén SE, Forsberg B, Franklin K, et al. Increased prevalence of symptoms of rhinitis but not of asthma between 1990 and 2008 in Swedish adults: comparisons of the ECRHS and GA²LEN surveys. PLoS One. 2011;6(2):e16082. 181. Solis Soto MT, Patiño A, Nowak D, Radon K. Prevalence of asthma, rhinitis and eczema symptoms in rural and urban school-aged children from Oropeza Province - Bolivia: a cross-sectional study. BMC Pulmonary Medicine. 2014;14(1):40. 182. Meslier N, Charbonneau G, Racineux J. Wheezes. European Respiratory Journal. 1995;8(11):1942-8. 183. Alvarez-Alvarez I, Niu H, Guillen-Grima F, Aguinaga-Ontoso I. Meta-analysis of prevalence of wheezing and recurrent wheezing in infants. Allergol Immunopathol (Madr). 2018;46(3):210-7. 184. Accordini S, Corsico A, Cerveri I, Gislason D, Gulsvik A, Janson C, et al. The socio-economic burden of asthma is substantial in Europe. Allergy. 2008;63(1):116-24. 185. Radon K, Huemmer S, Dressel H, Windstetter D, Weinmayr G, Weiland S, et al. Do respiratory symptoms predict job choices in teenagers? European Respiratory Journal. 2006;27(4):774-8. 186. Ellegard E, Hellgren M, Toren K, Karlsson G. The incidence of pregnancy rhinitis. Gynecologic and obstetric investigation. 2000;49(2):98-101. 187. Rejnö G, Lundholm C, Gong T, Larsson K, Saltvedt S, Almqvist C. Asthma during pregnancy in a population-based study--pregnancy complications and adverse perinatal outcomes. PloS one. 2014;9(8):e104755. 188. Sawicki E, Stewart K, Wong S, Paul E, Leung L, George J. Management of asthma by pregnant women attending an Australian maternity hospital. Aust N Z J Obstet Gynaecol. 2012;52(2):183-8. 189. Hansen C, Joski P, Freiman H, Andrade S, Toh S, Dublin S, et al. Medication Exposure in Pregnancy Risk Evaluation Program: The Prevalence of Asthma Medication Use During Pregnancy. Maternal and Child Health Journal. 2013;17(9):1611-21. 190. Adeyemi AS, Akinboro AO, Adebayo PB, Tanimowo MO, Ayodele OE. The Prevalence, Risk Factors and Changes in Symptoms of Self Reported Asthma, Rhinitis and Eczema Among Pregnant Women in Ogbomoso, Nigeria. Journal of clinical and diagnostic research : JCDR. 2015;9(9):Oc01-7. 191. Sunyer J, Torregrosa J, Anto JM, Menendez C, Acosta C, Schellenberg D, et al. The association between atopy and asthma in a semirural area of Tanzania (East Africa). Allergy. 2000;55(8):762-6. 192. Baarnes CB, Hansen AV, Ulrik CS. Enrolment in an Asthma Management Program during Pregnancy and Adherence with Inhaled Corticosteroids: The 'Management of Asthma during Pregnancy' Program. Respiration. 2016;92(1):9-15.
152
193. Ibrahim WH, Rasul F, Ahmad M, Bajwa AS, Alamlih LI, El Arabi AM, et al. Errors in Aerosol Inhaler Use and Their Effects on Maternal and Fetal Outcomes among Pregnant Asthmatic Women (Subanalysis from QAKCOP Study). Can Respir J. 2018;2018:7649629. 194. Ibrahim WH, Rasul F, Ahmad M, Bajwa AS, Alamlih LI, El Arabi AM, et al. Asthma knowledge, care, and outcome during pregnancy: The QAKCOP study. Chron Respir Dis. 2019;16:1479972318767719. 195. Kim S, Kim J, Park SY, Um HY, Kim K, Kim Y, et al. Effect of pregnancy in asthma on health care use and perinatal outcomes. J Allergy Clin Immunol. 2015;136(5):1215-23.e1-6. 196. Mendola P, Laughon SK, Männistö TI, Leishear K, Reddy UM, Chen Z, et al. Obstetric complications among US women with asthma. Am J Obstet Gynecol. 2013;208(2):127.e1-8. 197. Murphy VE, Wang G, Namazy JA, Powell H, Gibson PG, Chambers C, et al. The risk of congenital malformations, perinatal mortality and neonatal hospitalisation among pregnant women with asthma: a systematic review and meta-analysis. BJOG. 2013;120(7):812-22. 198. Forno E, Gogna M, Cepeda A, Yañez A, Solé D, Cooper P, et al. Asthma in Latin America. Thorax. 2015;70(9):898-905. 199. Fuertes E, Markevych I, Bowatte G, Gruzieva O, Gehring U, Becker A, et al. Residential greenness is differentially associated with childhood allergic rhinitis and aeroallergen sensitization in seven birth cohorts. Allergy. 2016;71(10):1461-71. 200. Fuertes E, Markevych I, von Berg A, Bauer CP, Berdel D, Koletzko S, et al. Greenness and allergies: evidence of differential associations in two areas in Germany. J Epidemiol Community Health. 2014;68(8):787-90. 201. Dadvand P, Villanueva CM, Font-Ribera L, Martinez D, Basagana X, Belmonte J, et al. Risks and benefits of green spaces for children: a cross-sectional study of associations with sedentary behavior, obesity, asthma, and allergy. Environmental health perspectives. 2014;122(12):1329-35. 202. James P, Banay RF, Hart JE, Laden F. A Review of the Health Benefits of Greenness. 203. Markevych I, Schoierer J, Hartig T, Chudnovsky A, Hystad P, Dzhambov AM, et al. Exploring pathways linking greenspace to health: Theoretical and methodological guidance. Environ Res. 2017;158:301-17. 204. Lambert KA, Bowatte G, Tham R, Lodge C, Prendergast L, Heinrich J, et al. Residential greenness and allergic respiratory diseases in children and adolescents - A systematic review and meta-analysis. Environmental research. 2017;159:212-21. 205. Alcock I, White M, Cherrie M, Wheeler B, Taylor J, McInnes R, et al. Land cover and air pollution are associated with asthma hospitalisations: A cross-sectional study. Environ Int. 2017;109:29-41. 206. Feng X, Astell-Burt T. Is Neighborhood Green Space Protective against Associations between Child Asthma, Neighborhood Traffic Volume and Perceived Lack of Area Safety? Multilevel Analysis of 4447 Australian Children. Int J Environ Res Public Health. 2017;14(5). 207. Cruz Á A, Stelmach R, Ponte EV. Asthma prevalence and severity in low-resource communities. Current opinion in allergy and clinical immunology. 2017;17(3):188-93. 208. Maluleke KR, Worku Z. Environmental determinants of asthma among school children aged 13-14 in and around Polokwane, Limpopo Province, South Africa. Int J Environ Res Public Health. 2009;6(9):2354-74. 209. Barreto ML, Cunha SS, Fiaccone R, Esquivel R, Amorim LD, Alvim S, et al. Poverty, dirt, infections and non-atopic wheezing in children from a Brazilian urban center.
153
210. Quiroz L, Hernández Flórez LJ, Agudelo C, Medina K, Robledo R, Osorio García SD. Enfermedad y síntomas respiratorios en niños de cinco municipios carboníferos del Cesar, Colombia. 2013. 2013;15(1):14. 211. Rodriguez A, Vaca M, Oviedo G, Erazo S, Chico ME, Teles C, et al. Urbanisation is associated with prevalence of childhood asthma in diverse, small rural communities in Ecuador. Thorax. 2011;66(12):1043-50. 212. Robinson CL, Baumann LM, Romero K, Combe JM, Gomez A, Gilman RH, et al. Effect of urbanisation on asthma, allergy and airways inflammation in a developing country setting. Thorax. 2011;66. 213. Jaakkola JJK, Parise H, Kislitsin V, Lebedeva NI, Spengler JD. Asthma, Wheezing, and Allergies in Russian Schoolchildren in Relation to New Surface Materials in the Home. American Journal of Public Health. 2004;94(4):560-2. 214. von Mutius E, Radon K. Living on a farm: impact on asthma induction and clinical course. Immunol Allergy Clin North Am. 2008;28(3):631-47, ix-x. 215. von Mutius E. 99th Dahlem conference on infection, inflammation and chronic inflammatory disorders: farm lifestyles and the hygiene hypothesis. Clin Exp Immunol. 2010;160(1):130-5. 216. Thornton CA, Macfarlane TV, Holt PG. The hygiene hypothesis revisited: role of materno-fetal interactions. Curr Allergy Asthma Rep. 2010;10(6):444-52. 217. Ardura-Garcia C, Garner P, Cooper PJ. Is childhood wheeze and asthma in Latin America associated with poor hygiene and infection? A systematic review. BMJ Open Respir Res. 2018;5(1):e000249. 218. Odhiambo JA, Williams HC, Clayton TO, Robertson CF, Asher MI. Global variations in prevalence of eczema symptoms in children from ISAAC Phase Three. J Allergy Clin Immunol. 2009;124. 219. Bellin M, Osteen P, Collins K, Butz A, Land C, Kub J. The influence of community violence and protective factors on asthma morbidity and healthcare utilization in high-risk children. J Urban Health. 2014;91(4):677-89. 220. Poole JA, Barnes CS, Demain JG, Bernstein JA, Padukudru MA, Sheehan WJ, et al. Impact of weather and climate change with indoor and outdoor air quality in asthma: A Work Group Report of the AAAAI Environmental Exposure and Respiratory Health Committee. J Allergy Clin Immunol. 2019;143(5):1702-10. 221. Khreis H, Kelly C, Tate J, Parslow R, Lucas K, Nieuwenhuijsen M. Exposure to traffic-related air pollution and risk of development of childhood asthma: A systematic review and meta-analysis. Environment international. 2017;100:1-31. 222. Sangkharat K, Fisher P, Thomas GN, Thornes J, Pope FD. The impact of air pollutants on ambulance dispatches: A systematic review and meta-analysis of acute effects. Environmental pollution (Barking, Essex : 1987). 2019;254(Pt A):112769. 223. Orellano P, Quaranta N, Reynoso J, Balbi B, Vasquez J. Association of outdoor air pollution with the prevalence of asthma in children of Latin America and the Caribbean: A systematic review and meta-analysis. J Asthma. 2018;55(11):1174-86. 224. Achakulwisut P, Brauer M, Hystad P, Anenberg SC. Global, national, and urban burdens of paediatric asthma incidence attributable to ambient NO(2) pollution: estimates from global datasets. Lancet Planet Health. 2019;3(4):e166-e78. 225. Shirinde J, Wichmann J, Voyi K. Allergic rhinitis, rhinoconjunctivitis and hayfever symptoms among children are associated with frequency of truck traffic near residences: a cross sectional study. Environmental health : a global access science source. 2015;14(1):84.
154
226. Centers for Disease Control and Prevention. Epi Info™ | CDC: CDC; 2019 [Available from: https://www.cdc.gov/epiinfo/index.html. 227. Agudelo C, Moncada L, Mejía L, Cáceres E. Parasitismo intestinal en comunidades marginadas de Bogotá. Rev Fac Med. 1986;40(4):499-507. 228. Agudelo CA, Hernández CA, Corredor A, López C, Cáceres E, Villareal E, et al. Parasitismos en una comunidad marginada. Revista de la Facultad de Medicina. 1993;41(1):15-21. 229. Alcaldía Mayor de Bogotá D.C. Conociendo la localidad de Kennedy: Diagnóstico de los aspectos físicos, demográficos y socioeconómicos. Bogotá D.C.: Secretaría Distrital de Planeación; 2009. 230. Alcaldía Mayor de Bogotá D.C. Conociendo la localidad de Usaquén: Diagnóstico de los aspectos físicos, demográficos y socioeconómicos. Bogotá D.C.: Secretaría Distrital de Planeación; 2009. 231. HyLown Consulting-LLC. Test Odds Ratio: Equality [Second:[This page allows calculated online the power of a sample sized based on Odds Ratio Equality. The reference cited by this page is the book: Sample Size Calculations in Clinical Research. By Chow,S. Shao, J and Wang,H. Second edition. Chapman & Hall/CRC Bioestatistics Serires. mag 106]. Available from: http://powerandsamplesize.com/Calculators/Test-Odds-Ratio/Equality. 232. ICF-International. Demographic and Health Surveys Methodology - Questionnaires: Household, Woman’s, and Man’s. Calverton, Maryland: MEASURE DHS, Phase III; 2011. 233. Fescina R, H,, De Mucio B, Díaz-Rossello JL, Martínez G, Serruya S, Durán P. Salud sexual y reproductiva: guías para el continuo de atención de la mujer y el recién nacido focalizadas en APS. 3a Edicion. Montevideo: CLAP/SMR - PAHO/WHO; 2011. Available from: https://www.paho.org/clap/index.php?option=com_docman&view=document&layout=default&alias=206-salud-sexual-y-reproductiva-guias-para-el-continuo-de-atencion-de-la-mujer-y-el-recien-nacido-focalizadas-en-aps-3-ed-4&category_slug=sip&Itemid=219⟨=en. 234. Ministerio de Salud y Protección Social, Pan_American_Health_Organization. Ficha de Caracterización a Nivel Familiar. Bogotá D.C.: MSPS - PAHO; 2006. p. 6. 235. Burney PG, Luczynska C, Chinn S, Jarvis D. The European Community Respiratory Health Survey. Eur Respir J. 1994;7(5):954-60. 236. Restrepo I, Mazo L, Salazar M, Montoya M, Botero J. Evaluación de tres técnicas coproparasitoscópicas para el diagnóstico de geohelmintos intestinales. Iatreia. 2013;26(1):15-24. 237. Cartwright CP. Utility of multiple-stool-specimen ova and parasite examinations in a high-prevalence setting. J Clin Microbiol. 1999;37(8):2408-11. 238. Mendoza D, Núñez FÁ, Escobedo ÁA, Pelayo L, Fernández M, Torres D, et al. Utilidad de 2 métodos coproparasitológicos y su empleo en un ensayo terapéutico antigiardiásico. Rev Cubana de Med Trop. 2003;55(3):174-8. 239. Knopp S, Mgeni AF, Khamis IS, Steinmann P, Stothard JR, Rollinson D, et al. Diagnosis of soil-transmitted helminths in the era of preventive chemotherapy: effect of multiple stool sampling and use of different diagnostic techniques. PLoS neglected tropical diseases. 2008;2(11):e331. 240. Devera R, Aponte M, Belandria M, Blanco T, Requena I. Uso del método de sedimentación espontanea en el diagnóstico de parásitos intestinales. Saber,Universidad de Oriente. 2008;20(2):163-71. 241. Mejia R, Vicuña Y, Broncano N, Sandoval C, Vaca M, Chico M, et al. A novel, multi-parallel, real-time polymerase chain reaction approach for eight gastrointestinal parasites provides
155
improved diagnostic capabilities to resource-limited at-risk populations. Am J Trop Med Hyg. 2013;88(6):1041-7. 242. Stensvold CR, Ahmed UN, Andersen LO, Nielsen HV. Development and evaluation of a genus-specific, probe-based, internal-process-controlled real-time PCR assay for sensitive and specific detection of Blastocystis spp. J Clin Microbiol. 2012;50(6):1847-51. 243. Center AB-CM. Stool Specimen Collection Instructions - Other than Fecal Occult Blood Test Green Bay-Wisconsin2008 [Available from: http://www.aurorahealthcare.org/FYWB_pdfs/baycare/x35364spbc.pdf. 244. Al-Delaimy AK, Al-Mekhlafi HM, Nasr NA, Sady H, Atroosh WM, Nashiry M, et al. Epidemiology of intestinal polyparasitism among Orang Asli school children in rural Malaysia. PLoS neglected tropical diseases. 2014;8(8):e3074. 245. Dawaki S, Al-Mekhlafi HM, Ithoi I. The burden and epidemiology of polyparasitism among rural communities in Kano State, Nigeria. Trans R Soc Trop Med Hyg. 2019;113(4):169-82. 246. Tucker CJ. Red and photographic infrared linear combinations for monitoring vegetation. Remote Sensing of Environment. 1979;8(2):127-50. 247. Tucker CJ. Remote sensing of leaf water content in the near infrared. Remote Sensing of Environment. 1980;10(1):23-32. 248. Huang W, Huang J, Wang X, Wang F, Shi J. Comparability of red/near-infrared reflectance and NDVI based on the spectral response function between MODIS and 30 other satellite sensors using rice canopy spectra. Sensors (Basel). 2013;13(12):16023-50. 249. U.S._Geological_Survey. EarthExplorer | USGS 2019 [Available from: https://earthexplorer.usgs.gov/. 250. Alcaldía Mayor de Bogotá D.C. Infraestructura de Datos Espaciales para el Distrito Capital - IDECA | Galeria de Mapas | Mapas por Localidad 2019 [Available from: http://www.ideca.gov.co./mapa/mapas-por-localidad. 251. Lê S, Josse J, Husson F. FactoMineR: An R Package for Multivariate Analysis. 2008. 2008;25(1):18. 252. Josse J, Husson F. missMDA: A Package for Handling Missing Values in Multivariate Data Analysis. 2016. 2016;70(1):31. 253. Ministerio_de_Salud. Resolución Número 8430. Santafé de Bogotá D.C.: MSPS; 1993. 254. U.S._Food_&_Drug_Administration. Statistical Guidance on Reporting Results from Studies Evaluating Diagnostic Tests - Guidance for Industry and FDA Staff. Rockville, MD: Center for Devices and Radiological Health - CDRH / FDA; 2007. 255. QGIS_Development_Team. QGIS Geographic Information System. Open Source Geospatial Foundation Project. https://qgis.org.; 2016. 256. Sterne JAC, White IR, Carlin JB, Spratt M, Royston P, Kenward MG, et al. Multiple imputation for missing data in epidemiological and clinical research: potential and pitfalls. BMJ. 2009;338:b2393. 257. Espinosa-Aranzales AF, Radon K, Froeschl G, Pinzon-Rondon AM, Delius M. Prevalence and risk factors for intestinal parasitic infections in pregnant women residing in three districts of Bogota, Colombia. BMC Public Health. 2018;18(1):1071. 258. Rothman KJ, Gallacher JE, Hatch EE. Why representativeness should be avoided. Int J Epidemiol. 2013;42(4):1012-4. 259. Uribe C, Pardo C. La ciudad vivida: movilidad espacial y representaciones sobre la estratificación social en Bogotá. Universitas Humanística [Internet]. 2006;62:169.
156
260. Wang KH, Ray NJ, Berg DN, Greene AT, Lucas G, Harris K, et al. Using community-based participatory research and organizational diagnosis to characterize relationships between community leaders and academic researchers. Prev Med Rep. 2017;7:180-6. 261. Dwarakanathan V, Kumar A, Nongkynrih B, Kant S, Gupta SK. Challenges in the conduct of community-based research. Natl Med J India. 2018;31(6):366-9. 262. García-García JA, Reding-Bernal A, López-Alvarenga JC. Sample size calculation in medical education research. Investigación en Educación Médica. 2013;2(8):217. 263. Kesmodel US. Cross-sectional studies - what are they good for? Acta Obstet Gynecol Scand. 2018;97(4):388-93. 264. Secretaría_Distrital_de_Ambiente. Red de Monitoreo de Calidad del Aire de Bogotá Bogotá [Available from: http://ambientebogota.gov.co/red-de-calidad-del-aire. 265. Yanet F-S, Fidel Angel N-F, Guillermo N, Sergio S-P. Comparison of parasitological techniques for the diagnosis of intestinal parasitic infections in patients with presumptive malabsorption. 266. Schuurman T, Lankamp P, van Belkum A, Kooistra-Smid M, van Zwet A. Comparison of microscopy, real-time PCR and a rapid immunoassay for the detection of Giardia lamblia in human stool specimens. Clinical microbiology and infection : the official publication of the European Society of Clinical Microbiology and Infectious Diseases. 2007;13(12):1186-91. 267. Elsafi SH, Al-Maqati TN, Hussein MI, Adam AA, Hassan MM, Al Zahrani EM. Comparison of microscopy, rapid immunoassay, and molecular techniques for the detection of Giardia lamblia and Cryptosporidium parvum. Parasitology research. 2013;112(4):1641-6. 268. Alcaldía Mayor de Bogotá. Diagnóstico Local con Participación Social Ciudad Bolívar. Bogotá2016. 269. Alcaldía Mayor de Bogotá. La Localidad de Ciudad Bolívar - Monografía. In: Secretaría Distrital de Planeación, editor. Bogotá2017. p. Alcaldía Mayor de Bogotá. 270. Alzate M, CEPAL. La estratificación socioeconómica para el cobro de los servicios públicos domiciliarios en Colombia ¿Solidaridad o focalización? Santiago de Chile: United Nations; 2006. 101 p. 271. Secretaria Distrital de Planeacion. Monografia 2017 Localidad Usaquen 01. In: Alcaldia Mayor de Bogota, editor. Diagnóstico de los principales aspectos territoriales, de infraestructura, demográficos y sociodemográficos. Bogotá2017. 272. Secretaria Distrital de Planeacion. Monografia 2017 Kennedy. In: Alcaldia Mayor de Bogota, editor. 2017. 273. Secretaria Distrital de Planeacion. 069 Proyecciones de Población Bogota 2016-2020. 2014. 274. Ministerio de Salud y Proteccion Social. Cifras de aseguramiento en salud 2020 [Available from: https://www.minsalud.gov.co/proteccionsocial/Paginas/cifras-aseguramiento-salud.aspx. 275. Alcaldía Mayor de Bogotá. Diagnostico de Paz. In: Armado ODdVdC, editor. Condiciones para la construccion de paz en Bogota. Bogotá2018. 276. DANE. Proyecciones y Retroproyecciones de Poblacion 2020 [Available from: https://www.dane.gov.co/index.php/estadisticas-por-tema/demografia-y-poblacion/proyecciones-de-poblacion. 277. Alcaldia Mayor de Bogota. Bogota Ciudad de Estadisticas Boletin n 15. In: Planeación Sd, editor. Composición y Caracterización Étnica de la Ciudad. Bogotá2010. 278. Alcaldia Mayor de Bogota. Bogota Ciudad de Estadisticas Boletin n 32. In: Distrital SdP, editor. Principales Resultados de la Primera Encuesta Multipropósito para Bogotá 2011. Bogotá2011.
157
279. DANE. Encuesta de ingresos y gastos de los hogares Bogotá2007 [Available from: https://www.dane.gov.co/index.php/estadisticas-por-tema/salud/calidad-de-vida-ecv/encuesta-nacional-de-ingresos-y-gastos. 280. Tarafder MR, Carabin H, Joseph L, Balolong E, Olveda R, McGarvey ST. 281. Uchôa FFdM, Sudré AP, Macieira DdB, Almosny NRP. The influence of serial fecal sampling on the diagnosis of giardiasis in humans, dogs, and cats. Revista do Instituto de Medicina Tropical de São Paulo. 2017;59. 282. Ministerio de Salud y Proteccion Social, Universidad de Antioquia. Encuesta nacional de parasitismo intestinal en población escolar, Colombia, 2012 – 2014: Análisis en profundidad. Medellín: Facultad Nacional de Salud Pública - Universidad de Antioquia; 2015. p. 173. 283. Watson JA, Ensink JHJ, Ramos M, Benelli P, Holdsworth E, Dreibelbis R, et al. Does targeting children with hygiene promotion messages work? The effect of handwashing promotion targeted at children, on diarrhoea, soil-transmitted helminth infections and behaviour change, in low- and middle-income countries. Tropical Medicine & International Health. 2017;22(5):526-38. 284. Zack RM, Golan J, Aboud S, Msamanga G, Spiegelman D, Fawzi W. Risk Factors for Preterm Birth among HIV-Infected Tanzanian Women: A Prospective Study. Obstetrics and Gynecology International. 2014;2014:9. 285. Santos MCd, Costa-Cruz JM, Carvahlo-Neto C, Lima MMR, Cristina M. Enteric parasites and commensals in pregnant women seen at the university hospital, federal university of uberlândia, state of minas gerais, brazil. Revista do Instituto de Medicina Tropical de São Paulo. 1998;40(3):193-6. 286. Cooper PJ, Chico ME, Platts-Mills TAE, Rodrigues LC, Strachan DP, Barreto ML. Cohort Profile: The Ecuador Life (ECUAVIDA) study in Esmeraldas Province, Ecuador. Int J Epidemiol. 442015. p. 1517-27. 287. Kefiyalew F, Zemene E, Asres Y, Gedefaw L. Anemia among pregnant women in Southeast Ethiopia: prevalence, severity and associated risk factors. BMC Res Notes. 2014;7(1):771. 288. Gedefaw L, Ayele A, Asres Y, Mossie A. Anemia and Associated Factors Among Pregnant Women Attending Antenatal Care Clinic in Wolayita Sodo Town, Southern Ethiopia. Ethiop J Health Sci. 2015;25(2):155-62. 289. Mengist HM, Zewdie O, Belew A. Intestinal helminthic infection and anemia among pregnant women attending ante-natal care (ANC) in East Wollega, Oromia, Ethiopia. BMC Res Notes. 2017;10. 290. Phuanukoonnon S, Michael A, Kirarock WS, Pomat WS, van den Biggelaar AH. Intestinal parasitic infections and anaemia among pregnant women in the highlands of Papua New Guinea. Papua and New Guinea medical journal. 2013;56(3-4):119-25. 291. Rodríguez-Morales AJ, Barbella RA, Case C, Arria M, Ravelo M, Perez H, et al. Intestinal Parasitic Infections Among Pregnant Women in Venezuela. Infectious Diseases in Obstetrics and Gynecology. 2006;2006:1 - 5. 292. Booth M. Climate Change and the Neglected Tropical Diseases. Adv Parasitol. 2018;100:39-126. 293. van Eijk AM, Lindblade KA, Odhiambo F, Peterson E, Rosen DH, Karanja D, et al. Geohelminth Infections among Pregnant Women in Rural Western Kenya; a Cross-Sectional Study. PLoS neglected tropical diseases. 2009;3(1). 294. Wekesa AW, Mulambalah CS, Muleke CI, Odhiambo R. Intestinal Helminth Infections in Pregnant Women Attending Antenatal Clinic at Kitale District Hospital, Kenya. Journal of Parasitology Research. 2014;2014:5.
158
295. Kefiyalew F, Zemene E, Asres Y, Gedefaw L. Anemia among pregnant women in Southeast Ethiopia: prevalence, severity and associated risk factors. BMC Res Notes. 72014. 296. Saidin S, Othman N, Noordin R. Update on laboratory diagnosis of amoebiasis. Eur J Clin Microbiol Infect Dis. 2019;38(1):15-38. 297. El Safadi D, Gaayeb L, Meloni D, Cian A, Poirier P, Wawrzyniak I, et al. Children of Senegal River Basin show the highest prevalence of Blastocystis sp. ever observed worldwide. BMC Infect Dis. 14: BioMed Central; 2014. p. 164. 298. Ramirez JD, Sanchez LV, Bautista DC, Corredor AF, Florez AC, Stensvold CR. Blastocystis subtypes detected in humans and animals from Colombia. Infection, genetics and evolution : journal of molecular epidemiology and evolutionary genetics in infectious diseases. 2014;22:223-8. 299. Londono-Franco AL, Loaiza-Herrera J, Lora-Suarez FM, Gomez-Marin JE. [Blastocystis sp. frequency and sources among children from 0 to 5 years of age attending public day care centers in Calarca, Colombia]. Biomedica. 2014;34(2):218-27. 300. Fletcher SM, Stark D, Harkness J, Ellis J. Enteric Protozoa in the Developed World: a Public Health Perspective. American Society for Microbiology Journals. 2012;25(3):420-49. 301. Javaherizadeh H, Khademvatan S, Soltani S, Torabizadeh M, Yousefi E. Distribution of haematological indices among subjects with Blastocystis hominis infection compared to controls. Prz Gastroenterol. 2014;9(1):38-42. 302. Tan KS, Mirza H, Teo JD, Wu B, Macary PA. Current Views on the Clinical Relevance of Blastocystis spp. Current infectious disease reports. 2010;12(1):28-35. 303. Ramirez JD, Florez C, Olivera M, Bernal MC, Giraldo JC. Blastocystis subtyping and its association with intestinal parasites in children from different geographical regions of Colombia. PloS one. 2017;12(2):e0172586. 304. Gonzalez-Moreno O, Domingo L, Teixidor J, Gracenea M. Prevalence and associated factors of intestinal parasitisation: a cross-sectional study among outpatients with gastrointestinal symptoms in Catalonia, Spain. Parasitology research. 2011;108(1):87-93. 305. Visser S, Giatti LL, Carvalho RA, Guerreiro JC. Estudo da associação entre fatores socioambientais e prevalência de parasitose intestinal em área periférica da cidade de Manaus (AM, Brasil). Ciência & Saúde Coletiva. 2011;16(8):3481-92. 306. Casavechia MT, Lonardoni MV, Venazzi EA, Campanerut-Sa PA, da Costa Benalia HR, Mattiello MF, et al. Prevalence and predictors associated with intestinal infections by protozoa and helminths in southern Brazil. Parasitology research. 2016;115(6):2321-9. 307. Guzman BL, Nava G, Díaz P. La calidad del agua para consumo humano y su asociación con la morbimortalidad en Colombia, 2008-2012. Biomédica. 2015;35(Suplement 2):177-90. 308. Uniting to Combat NTDs. London Declaration on Neglected Tropical Diseases 2019 [Available from: https://unitingtocombatntds.org/london-declaration-neglected-tropical-diseases/. 309. World Health Organization. Reaching girls and women of reproductive age with deworming 2018 [Available from: https://www.who.int/intestinal_worms/resources/WHO-CDS-NTD-PCT-2018.01/en/. 310. Gobierno de Colombia. Unidad para la Atención y Reparación Integral de las Víctimas Bogotá2020 [Available from: https://www.unidadvictimas.gov.co/es/registro-unico-de-victimas-ruv/37394. 311. Shultz JM, García NM, Ceballos Á MG, Florez LJH, Araya R, Verdeli H, et al. Outreach to internally displaced persons in Bogotá, Colombia: challenges and potential solutions. Disaster Health. 22014. p. 75-81.
159
312. Rivillas JC, Devia Rodriguez R, Song G, Martel A. How do we reach the girls and women who are the hardest to reach? Inequitable opportunities in reproductive and maternal health care services in armed conflict and forced displacement settings in Colombia. PloS one. 2018;13(1):e0188654. 313. Worrell CM, Wiegand RE, Davis SM, Odero KO, Blackstock A, Cuellar VM, et al. A Cross-Sectional Study of Water, Sanitation, and Hygiene-Related Risk Factors for Soil-Transmitted Helminth Infection in Urban School- and Preschool-Aged Children in Kibera, Nairobi. PloS one. 2016;11(3):e0150744. 314. Latkin CA, Edwards C, Davey-Rothwell MA, Tobin KE. 315. Caputo A. Social Desirability Bias in self-reported well-being Measures: Evidence from an online survey. Universitas Psychologica. 2017;16:245-55. 316. Peñaranda A, Garcia E, Barragán AM, Rondón MA, Pérez A, Rojas MX, et al. Factors associated with Allergic Rhinitis in Colombian subpopulations aged 1 to 17 and 18 to 59. Rhinology. 2016;54(1):56-67. 317. Dennis R, Caraballo L, García E, Caballero A, Aristizabal G, Córdoba H, et al. Asthma and other allergic conditions in Colombia: a study in 6 cities. Annals of allergy, asthma & immunology : official publication of the American College of Allergy, Asthma, & Immunology. 2004;93(6):568-74. 318. GlobalAsthmaNetwork. The Global Asthma Report. Auckland2018. 319. García-Sancho C, Fernández-Plata R, Martínez-Briseño D, Franco-Marina F, Pérez-Padilla JR. [Adult asthma in Mexico City: a population-based study]. Salud Publica Mex. 2012;54(4):425-32. 320. Ocampo J, Gaviria R, Sánchez J. [Prevalence of asthma in Latin America. Critical look at ISAAC and other studies]. Rev Alerg Mex. 2017;64(2):188-97. 321. García-Sancho C, Fernández-Plata R, Martínez-Briseño D, Franco-Marina F, Pérez-Padilla JR. Prevalencia y riesgos asociados con pacientes adultos con asma de 40 años o más de la Ciudad de México: estudio de base poblacional. Salud Pública de México. 2012;54:425-32. 322. Hansen C, Joski P, Freiman H, Andrade S, Toh S, Dublin S, et al. Medication exposure in pregnancy risk evaluation program: the prevalence of asthma medication use during pregnancy. Matern Child Health J. 2013;17(9):1611-21. 323. Rejno G, Lundholm C, Gong T, Larsson K, Saltvedt S, Almqvist C. Asthma during pregnancy in a population-based study--pregnancy complications and adverse perinatal outcomes. PLoS One. 2014;9(8):e104755. 324. World_Bank_Group. The World Bank Data 2020 [Available from: https://data.worldbank.org/indicator/SP.DYN.TFRT.IN. 325. Sunyer J, Torregrosa J, Anto JM, Menendez C, Acosta C, Schellenberg D, et al. The association between atopy and asthma in a semirural area of Tanzania (East Africa). Allergy. 2000;55(8):762-6. 326. Asher I, Pearce N. Global burden of asthma among children. Int J Tuberc Lung Dis. 2014;18(11):1269-78. 327. Pali-Scholl I, Namazy J, Jensen-Jarolim E. Allergic diseases and asthma in pregnancy, a secondary publication. World Allergy Organ J. 2017;10(1):10. 328. Wasylenki DA. Inner city health. Cmaj. 2001;164(2):214-5. 329. Kakumanu S, Jaffee K, Visness CM, Dresen A, Burger M, Witter FR, et al. The influence of atopy and asthma on immune responses in inner-city adults. Immunity, Inflammation and Disease. 2016;4(1):80-90.

160
330. Wright RJ, Visness CM, Calatroni A, Grayson MH, Gold DR, Sandel MT, et al. Prenatal Maternal Stress and Cord Blood Innate and Adaptive Cytokine Responses in an Inner-City Cohort. American Journal of Respiratory and Critical Care Medicine. 2010;182(1):25-33. 331. Gruenberg DA, Wright RJ, Visness CM, Jaffee KF, Bloomberg GR, Cruikshank WW, et al. Relation between stress and cytokine responses in inner-city mothers. Annals of allergy, asthma & immunology : official publication of the American College of Allergy, Asthma, & Immunology. 2015;115(5):439-45.e3. 332. Yoo EJ, Lee NL, Huang KP, Kose LT, Desai D, Plante LA, et al. Clinical characteristics of severe asthma exacerbations among inner-city women in pregnancy. J Allergy Clin Immunol Pract. 2020;8(1):395-7. 333. Steinberg DM, Serebrisky D, Feldman JM. Asthma in children of Caribbean descent living in the inner-city: comparing Puerto Rican and Afro-Caribbean children. Psychol Health Med. 2017;22(6):633-9. 334. Demoly P, Piette V, Daures JP. Treatment of allergic rhinitis during pregnancy. Drugs. 2003;63(17):1813-20. 335. Fuertes E, Butland BK, Ross Anderson H, Carlsten C, Strachan DP, Brauer M. Childhood intermittent and persistent rhinitis prevalence and climate and vegetation: a global ecologic analysis. Ann Allergy Asthma Immunol. 2014;113(4):386-92.e9. 336. Lovasi GS, O'Neil-Dunne JP, Lu JW, Sheehan D, Perzanowski MS, Macfaden SW, et al. Urban tree canopy and asthma, wheeze, rhinitis, and allergic sensitization to tree pollen in a New York City birth cohort. Environ Health Perspect. 2013;121(4):494-500. 337. Bousquet J, Khaltaev N, Cruz AA, Denburg J, Fokkens WJ, Togias A, et al. Allergic Rhinitis and its Impact on Asthma (ARIA) 2008 update (in collaboration with the World Health Organization, GA(2)LEN and AllerGen). Allergy. 2008;63 Suppl 86:8-160. 338. Katelaris CH, Lee BW, Potter PC, Maspero JF, Cingi C, Lopatin A, et al. Prevalence and diversity of allergic rhinitis in regions of the world beyond Europe and North America. Clinical and experimental allergy : journal of the British Society for Allergy and Clinical Immunology. 2012;42(2):186-207. 339. Meltzer EO. Quality of life in adults and children with allergic rhinitis. J Allergy Clin Immunol. 2001;108(1 Suppl):S45-53. 340. Bogar S, Beyer KM. Green Space, Violence, and Crime: A Systematic Review. Trauma Violence Abuse. 2016;17(2):160-71. 341. Scott KM, Koenen KC, Aguilar-Gaxiola S, Alonso J, Angermeyer MC, Benjet C, et al. Associations between lifetime traumatic events and subsequent chronic physical conditions: a cross-national, cross-sectional study. PLoS One. 2013;8(11):e80573. 342. Beck AF, Huang B, Ryan PH, Sandel MT, Chen C, Kahn RS. Areas with high rates of police-reported violent crime have higher rates of childhood asthma morbidity. J Pediatr. 2016;173:175-82.e1. 343. McLaughlin KA, Basu A, Walsh K, Slopen N, Sumner JA, Koenen KC, et al. Childhood Exposure to Violence and Chronic Physical Conditions in a National Sample of US Adolescents. Psychosom Med. 2016;78(9):1072-83. 344. Alcaldía Mayor de Bogotá D.C. Análisis de Condiciones, Calidad de Vida, Salud y Enfermedad - Localidad Ciudad Bolívar. Bogotá D.C.: Subred Integrada de Servicios de Salud Sur E.S.E - Secretaría Distrital de Salud; 2017. 345. Alcaldía Mayor de Bogotá D.C. Plan Ambiental Local (2017 - 2020) - Localidad 19, Ciudad Bolívar. Bogotá D.C.: Alcaldia Local Ciudad Bolívar; 2016. p. 112.
161
346. Williams DR, Sternthal M, Wright RJ. Social determinants: taking the social context of asthma seriously. Pediatrics. 2009;123(Suppl 3):S174-84. 347. Rosa MJ, Lee AG, Wright RJ. Evidence establishing a link between prenatal and early-life stress and asthma development. Curr Opin Allergy Clin Immunol. 2018;18(2):148-58. 348. Flanigan C, Sheikh A, DunnGalvin A, Brew BK, Almqvist C, Nwaru BI. Prenatal maternal psychosocial stress and offspring's asthma and allergic disease: A systematic review and meta-analysis. Clin Exp Allergy. 2018;48(4):403-14. 349. Red Colombiana de Ciudades Cómo Vamos. Bogotá Cómo Vamos | Informe de Calidad de Vida 2016 | Bogotá 2017 [Available from: http://www.bogotacomovamos.org/documentos/informe-de-calidad-de-vida-de-bogota-en-2016/.
162
6. ANNEX
STATEMENT ON PRE-RELEASE AND CONTRIBUTION
Research on IPI was published as Espinosa et al., “Prevalence and risk factors for intestinal
parasitic infections in pregnant women residing in three districts of Bogotá, Colombia”, in BMC
Public Health 18(1):1701 on August 29, 2018.
Under the supervision, support and guidance of Prof. Dr. Katja Radon, Dr. Maria Delius and Dr.
Angela Pinzon, I carried out the research project including the initial proposal, ethics approval,
funding, field work, data collection, analysis of findings, and writing of the published article and
thesis. The statistical analysis of RS section was performed by Dr. Ronald Herrera.
163
ACKNOWLEDGEMENTS
I am most thankful to the individuals and institutions that have made this research project
possible.
To my supervisors for their valuable teaching, guidance, support, patience, help and dedication.
Each one has provided me with precious lessons for my career and life.
To the participants of the study, who made this research project possible. Thank you for your
interest, inspiration and altruism.
To all research assistants who were at my side during the challenging field work and data
collection. Thank you for the commitment, initiative, courage, dedication and love you showed
working in this project.
To Professor Maria Antonia Gaona for her support verifying the quality of stool sample
analyses.
To Dr. Juan David Ramirez and Dr. Angie Sanchez for carrying out PCR analysis.
To Dr. Leonardo Briceño for introducing me to my great teacher, Professor Doctor Katja Radon,
and bridging me into this amazing experience.
To Dr. Guenter Froeschl, for your kind help, scientific support and timely contributions
164
To Dr. Ronald Herrera for his help during different moments of this experience and especially
for his performance of the statistical analysis in the RS section.
To Professor Marcela Varona and Professor Anacaona Martinez for your friendship, constant
cheerful support, company and loving support.
To Lena Kurtz for your warmth, friendship and coaching
To Marcela Buitrago for your support during thesis editing.
To Doctor Otto Sanchez for your valuable, timely, assertive and generous scholarly support.
To my family and friends for your loving light, trust and support.
To Pombo and Lluvia, my unconditional companions.
To Universidad del Rosario (UR), the Ludwig Maximilians University (LMU), the Center for
International Health (CIH), German Academic Exchange Service (Deutscher Akademischer
Austauschdienst DAAD)/ Excellence Centers for Exchange and Development (EXCEED)/the
Federal Ministry for Economic Cooperation and Development (BMZ) for the financial and
academic support that made my doctoral work possible.
To God, giver of life, my most valuable fortress.
165
APPENDIX 1
Information protocol to give maternal women once the questionnaire has been filled Once the form has been filled, request the patient five more minutes to provide her the following information for antenatal care. Signs of alarm There are some symptoms you should pay attention to because may represent a risk to your baby or your own health.
1. High blood pressure: Get your blood pressure checked regularly. 2. Headache. 3. Blurred vision. 4. Hearing a buzzing sound in your ear. 5. Pain or burning sensation in stomach. 6. Face, hands, or feet swelling. 7. Stop feeling the baby's movement during pregnancy. 8. Uterine contractions. 9. Genital bleeding. 10. Pain while urinating. 11. Liquid loss or vaginal discharge.
General recommendations
1. Remember the units of immediate attention in case of emergency: the hospital in your district
2. Do not self medicate. 3. Avoid tobacco, alcohol and psychoactive drugs.
In case of identifying psychoactive drugs use inform the patient about risks of early labour and low birht weight in the baby. Encourage the mother to reduce drug use to minimum
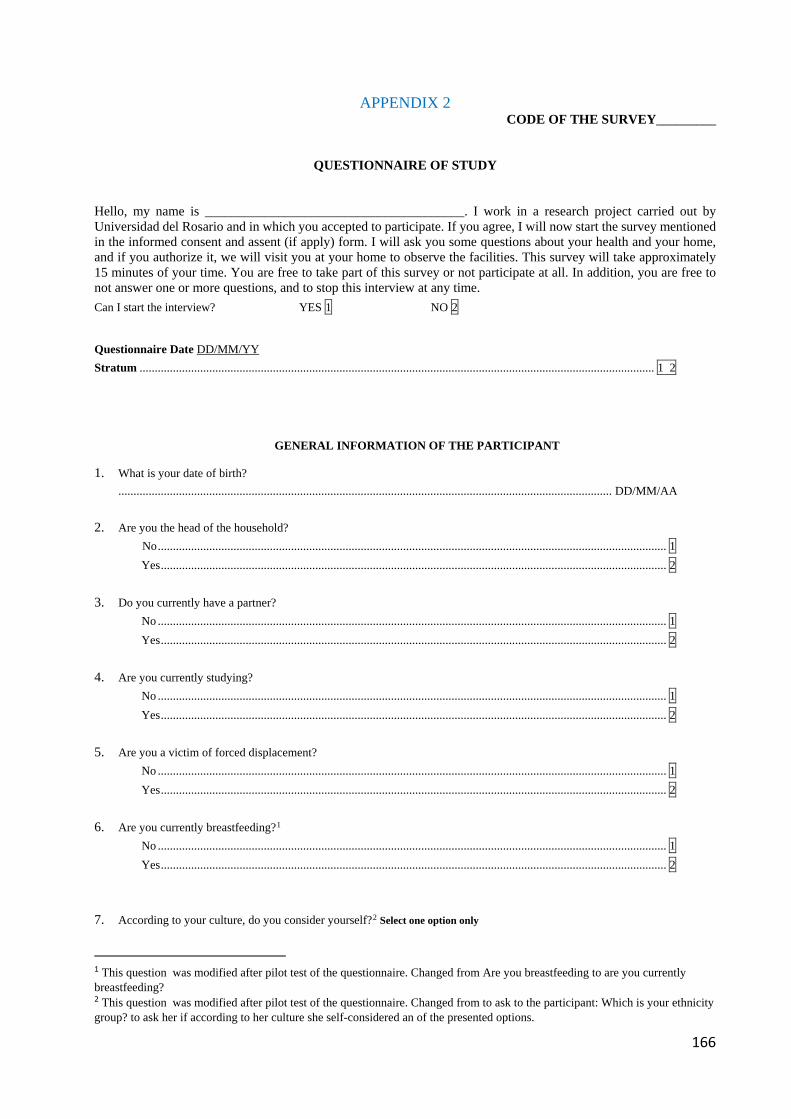
166
APPENDIX 2 CODE OF THE SURVEY_________
QUESTIONNAIRE OF STUDY Hello, my name is _______________________________________. I work in a research project carried out by Universidad del Rosario and in which you accepted to participate. If you agree, I will now start the survey mentioned in the informed consent and assent (if apply) form. I will ask you some questions about your health and your home, and if you authorize it, we will visit you at your home to observe the facilities. This survey will take approximately 15 minutes of your time. You are free to take part of this survey or not participate at all. In addition, you are free to not answer one or more questions, and to stop this interview at any time.
Can I start the interview? YES 1 NO 2 Questionnaire Date DD/MM/YY Stratum .......................................................................................................................................................................... 1 2
GENERAL INFORMATION OF THE PARTICIPANT
1. What is your date of birth? ................................................................................................................................................................... DD/MM/AA
2. Are you the head of the household? No ........................................................................................................................................................................ 1 Yes ....................................................................................................................................................................... 2 3. Do you currently have a partner? No ........................................................................................................................................................................ 1 Yes ....................................................................................................................................................................... 2 4. Are you currently studying? No ........................................................................................................................................................................ 1 Yes ....................................................................................................................................................................... 2 5. Are you a victim of forced displacement?
No ........................................................................................................................................................................ 1 Yes ....................................................................................................................................................................... 2 6. Are you currently breastfeeding?1 No ........................................................................................................................................................................ 1 Yes ....................................................................................................................................................................... 2 7. According to your culture, do you consider yourself?2 Select one option only
1 This question was modified after pilot test of the questionnaire. Changed from Are you breastfeeding to are you currently breastfeeding? 2 This question was modified after pilot test of the questionnaire. Changed from to ask to the participant: Which is your ethnicity group? to ask her if according to her culture she self-considered an of the presented options.
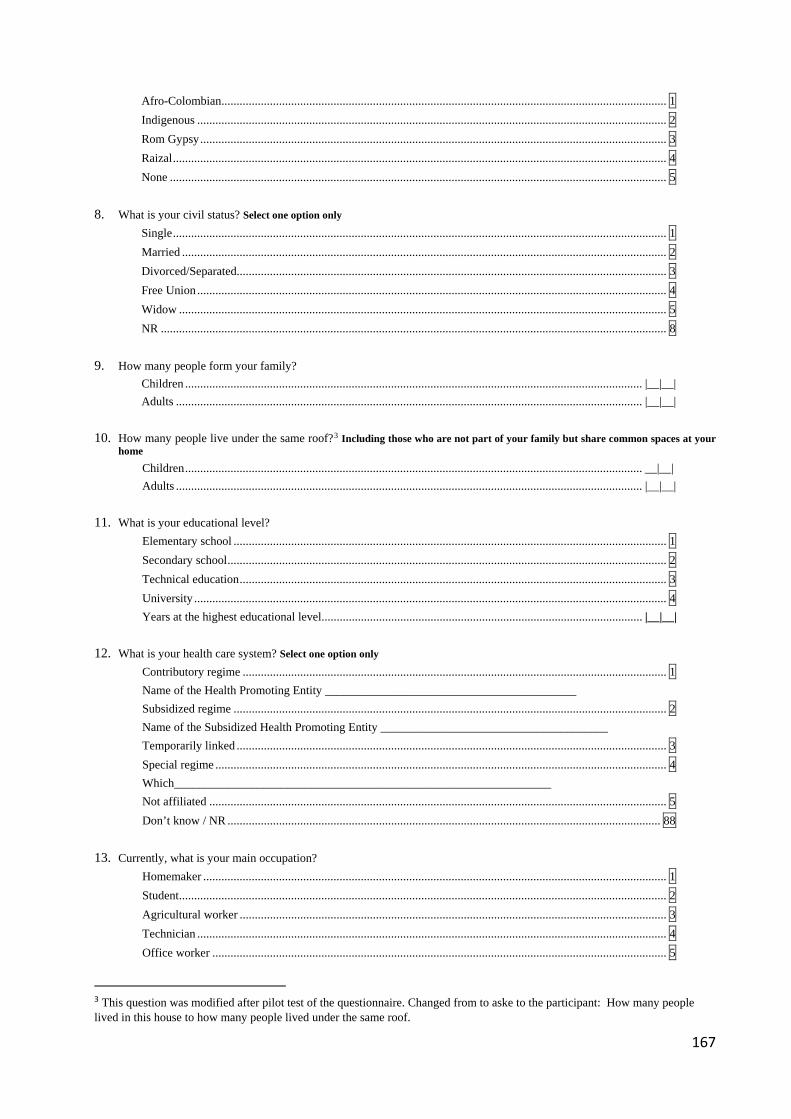
167
Afro-Colombian ................................................................................................................................................... 1 Indigenous ........................................................................................................................................................... 2 Rom Gypsy .......................................................................................................................................................... 3 Raizal ................................................................................................................................................................... 4 None .................................................................................................................................................................... 5 8. What is your civil status? Select one option only Single ................................................................................................................................................................... 1 Married ................................................................................................................................................................ 2 Divorced/Separated.............................................................................................................................................. 3 Free Union ........................................................................................................................................................... 4 Widow ................................................................................................................................................................. 5 NR ....................................................................................................................................................................... 8 9. How many people form your family? Children ....................................................................................................................................................... |__|__| Adults .......................................................................................................................................................... |__|__| 10. How many people live under the same roof?3 Including those who are not part of your family but share common spaces at your
home Children ....................................................................................................................................................... __|__| Adults .......................................................................................................................................................... |__|__| 11. What is your educational level? Elementary school ............................................................................................................................................... 1 Secondary school ................................................................................................................................................. 2 Technical education ............................................................................................................................................. 3 University ............................................................................................................................................................ 4 Years at the highest educational level .......................................................................................................... |__|__| 12. What is your health care system? Select one option only Contributory regime ............................................................................................................................................ 1 Name of the Health Promoting Entity __________________________________________ Subsidized regime ............................................................................................................................................... 2 Name of the Subsidized Health Promoting Entity ______________________________________ Temporarily linked .............................................................................................................................................. 3 Special regime ..................................................................................................................................................... 4 Which_______________________________________________________________ Not affiliated ....................................................................................................................................................... 5 Don’t know / NR ............................................................................................................................................... 88 13. Currently, what is your main occupation? Homemaker ......................................................................................................................................................... 1 Student ................................................................................................................................................................. 2 Agricultural worker ............................................................................................................................................. 3 Technician ........................................................................................................................................................... 4 Office worker ...................................................................................................................................................... 5
3 This question was modified after pilot test of the questionnaire. Changed from to aske to the participant: How many people lived in this house to how many people lived under the same roof.
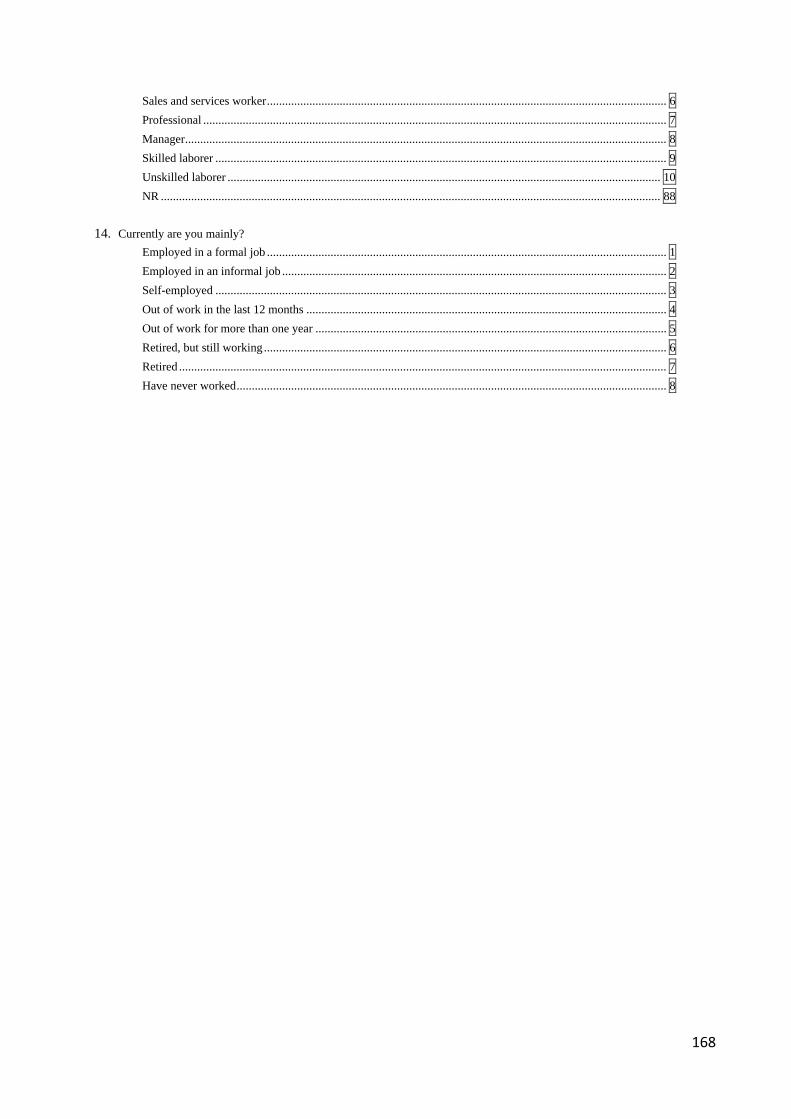
168
Sales and services worker .................................................................................................................................... 6 Professional ......................................................................................................................................................... 7 Manager ............................................................................................................................................................... 8 Skilled laborer ..................................................................................................................................................... 9 Unskilled laborer ............................................................................................................................................... 10 NR ..................................................................................................................................................................... 88 14. Currently are you mainly? Employed in a formal job .................................................................................................................................... 1 Employed in an informal job ............................................................................................................................... 2 Self-employed ..................................................................................................................................................... 3 Out of work in the last 12 months ....................................................................................................................... 4 Out of work for more than one year .................................................................................................................... 5 Retired, but still working ..................................................................................................................................... 6 Retired ................................................................................................................................................................. 7 Have never worked .............................................................................................................................................. 8
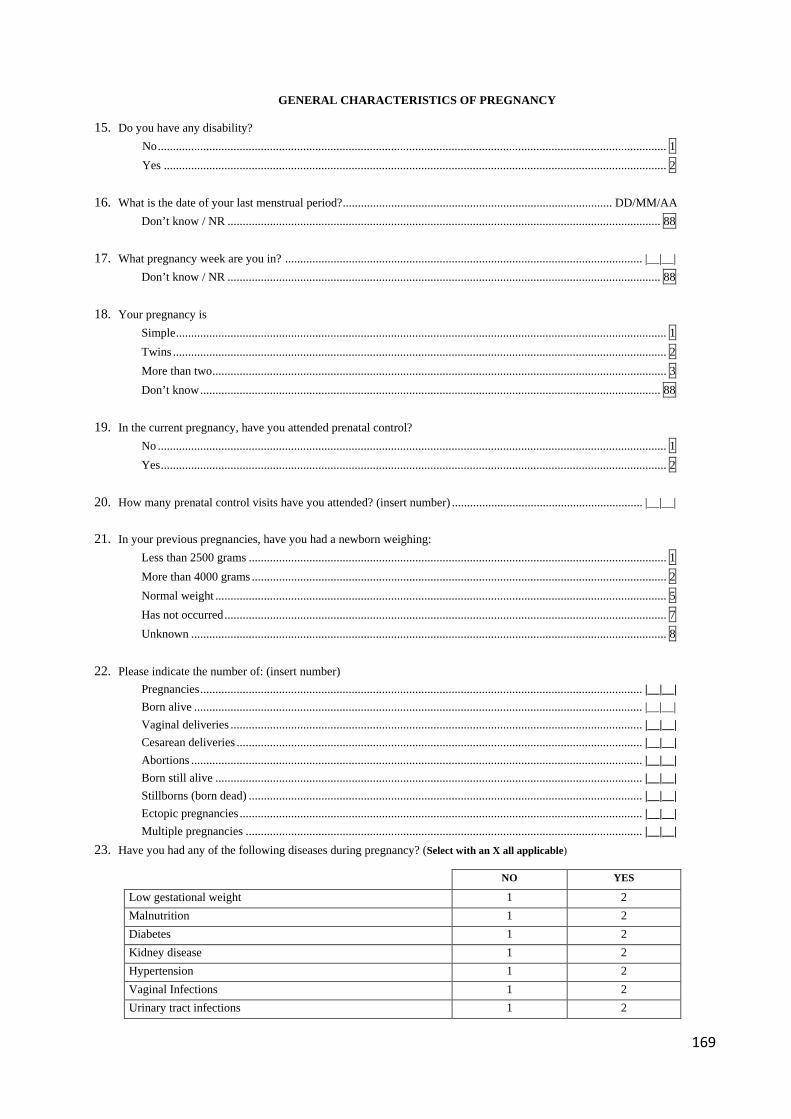
169
GENERAL CHARACTERISTICS OF PREGNANCY
15. Do you have any disability? No ........................................................................................................................................................................ 1 Yes ...................................................................................................................................................................... 2 16. What is the date of your last menstrual period? ......................................................................................... DD/MM/AA Don’t know / NR ............................................................................................................................................... 88 17. What pregnancy week are you in? ...................................................................................................................... |__|__| Don’t know / NR ............................................................................................................................................... 88 18. Your pregnancy is Simple .................................................................................................................................................................. 1 Twins ................................................................................................................................................................... 2 More than two ...................................................................................................................................................... 3 Don’t know ........................................................................................................................................................ 88 19. In the current pregnancy, have you attended prenatal control? No ........................................................................................................................................................................ 1 Yes ....................................................................................................................................................................... 2 20. How many prenatal control visits have you attended? (insert number) ............................................................... |__|__| 21. In your previous pregnancies, have you had a newborn weighing: Less than 2500 grams .......................................................................................................................................... 1 More than 4000 grams ......................................................................................................................................... 2 Normal weight ..................................................................................................................................................... 5 Has not occurred .................................................................................................................................................. 7 Unknown ............................................................................................................................................................. 8 22. Please indicate the number of: (insert number) Pregnancies .................................................................................................................................................. |__|__| Born alive .................................................................................................................................................... |__|__| Vaginal deliveries ........................................................................................................................................ |__|__| Cesarean deliveries ...................................................................................................................................... |__|__| Abortions ..................................................................................................................................................... |__|__| Born still alive ............................................................................................................................................. |__|__| Stillborns (born dead) .................................................................................................................................. |__|__| Ectopic pregnancies ..................................................................................................................................... |__|__| Multiple pregnancies ................................................................................................................................... |__|__| 23. Have you had any of the following diseases during pregnancy? (Select with an X all applicable)
NO YES
Low gestational weight 1 2 Malnutrition 1 2 Diabetes 1 2 Kidney disease 1 2 Hypertension 1 2 Vaginal Infections 1 2 Urinary tract infections 1 2
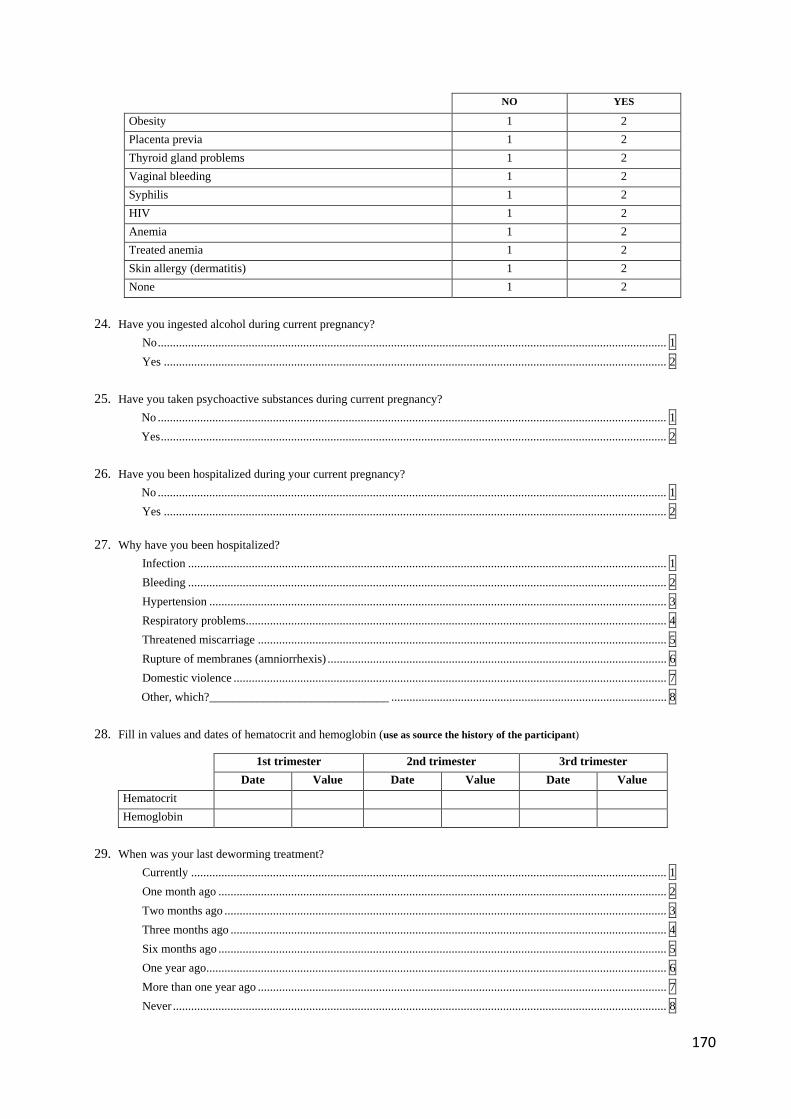
170
NO YES
Obesity 1 2 Placenta previa 1 2 Thyroid gland problems 1 2 Vaginal bleeding 1 2 Syphilis 1 2 HIV 1 2 Anemia 1 2 Treated anemia 1 2 Skin allergy (dermatitis) 1 2 None 1 2
24. Have you ingested alcohol during current pregnancy? No ........................................................................................................................................................................ 1 Yes ...................................................................................................................................................................... 2 25. Have you taken psychoactive substances during current pregnancy? No ........................................................................................................................................................................ 1 Yes ....................................................................................................................................................................... 2 26. Have you been hospitalized during your current pregnancy? No ........................................................................................................................................................................ 1 Yes ...................................................................................................................................................................... 2 27. Why have you been hospitalized? Infection .............................................................................................................................................................. 1 Bleeding .............................................................................................................................................................. 2 Hypertension ....................................................................................................................................................... 3 Respiratory problems ........................................................................................................................................... 4 Threatened miscarriage ....................................................................................................................................... 5 Rupture of membranes (amniorrhexis) ................................................................................................................ 6 Domestic violence ............................................................................................................................................... 7 Other, which?______________________________ ........................................................................................... 8 28. Fill in values and dates of hematocrit and hemoglobin (use as source the history of the participant)
1st trimester 2nd trimester 3rd trimester
Date Value Date Value Date Value Hematocrit Hemoglobin
29. When was your last deworming treatment? Currently ............................................................................................................................................................. 1 One month ago .................................................................................................................................................... 2 Two months ago .................................................................................................................................................. 3 Three months ago ................................................................................................................................................ 4 Six months ago .................................................................................................................................................... 5 One year ago ........................................................................................................................................................ 6 More than one year ago ....................................................................................................................................... 7 Never ................................................................................................................................................................... 8
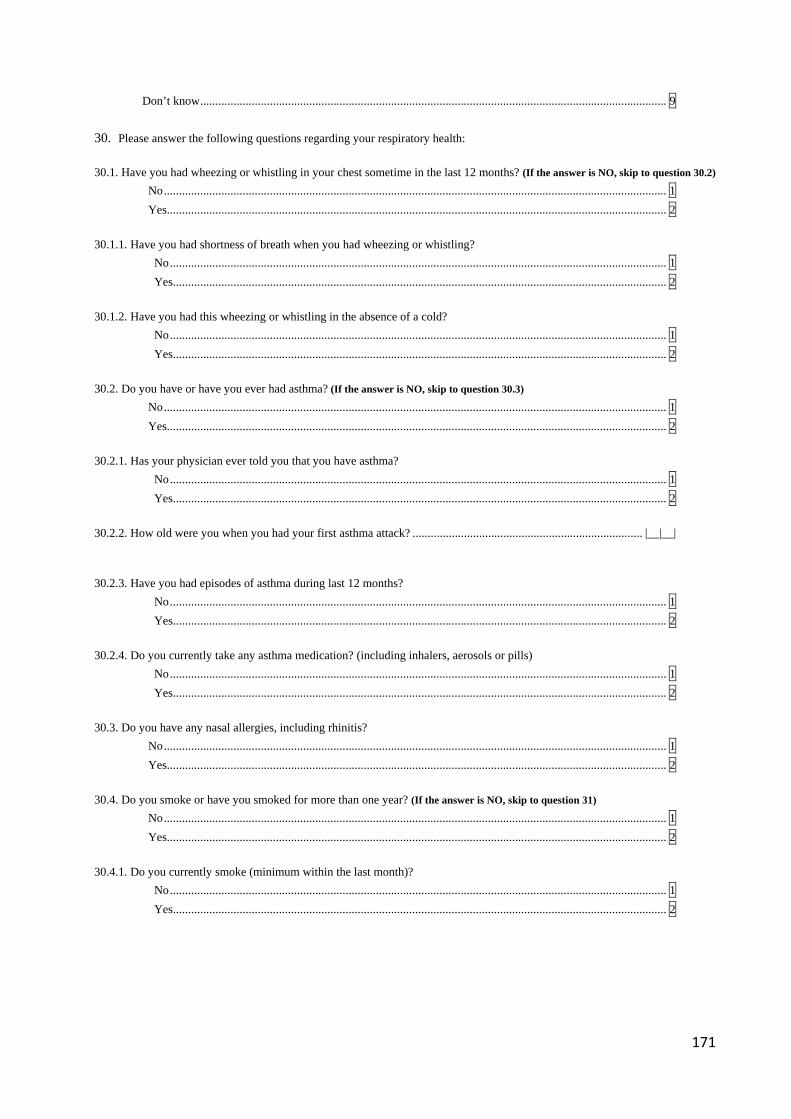
171
Don’t know .......................................................................................................................................................... 9 30. Please answer the following questions regarding your respiratory health:
30.1. Have you had wheezing or whistling in your chest sometime in the last 12 months? (If the answer is NO, skip to question 30.2)
No ...................................................................................................................................................................... 1 Yes..................................................................................................................................................................... 2
30.1.1. Have you had shortness of breath when you had wheezing or whistling?
No .................................................................................................................................................................... 1 Yes ................................................................................................................................................................... 2
30.1.2. Have you had this wheezing or whistling in the absence of a cold?
No .................................................................................................................................................................... 1 Yes ................................................................................................................................................................... 2
30.2. Do you have or have you ever had asthma? (If the answer is NO, skip to question 30.3)
No ...................................................................................................................................................................... 1 Yes..................................................................................................................................................................... 2 30.2.1. Has your physician ever told you that you have asthma?
No .................................................................................................................................................................... 1 Yes ................................................................................................................................................................... 2
30.2.2. How old were you when you had your first asthma attack? ............................................................................ |__|__| 30.2.3. Have you had episodes of asthma during last 12 months?
No .................................................................................................................................................................... 1 Yes ................................................................................................................................................................... 2
30.2.4. Do you currently take any asthma medication? (including inhalers, aerosols or pills)
No .................................................................................................................................................................... 1 Yes ................................................................................................................................................................... 2
30.3. Do you have any nasal allergies, including rhinitis?
No ...................................................................................................................................................................... 1 Yes..................................................................................................................................................................... 2 30.4. Do you smoke or have you smoked for more than one year? (If the answer is NO, skip to question 31)
No ...................................................................................................................................................................... 1 Yes..................................................................................................................................................................... 2 30.4.1. Do you currently smoke (minimum within the last month)?
No .................................................................................................................................................................... 1 Yes ................................................................................................................................................................... 2
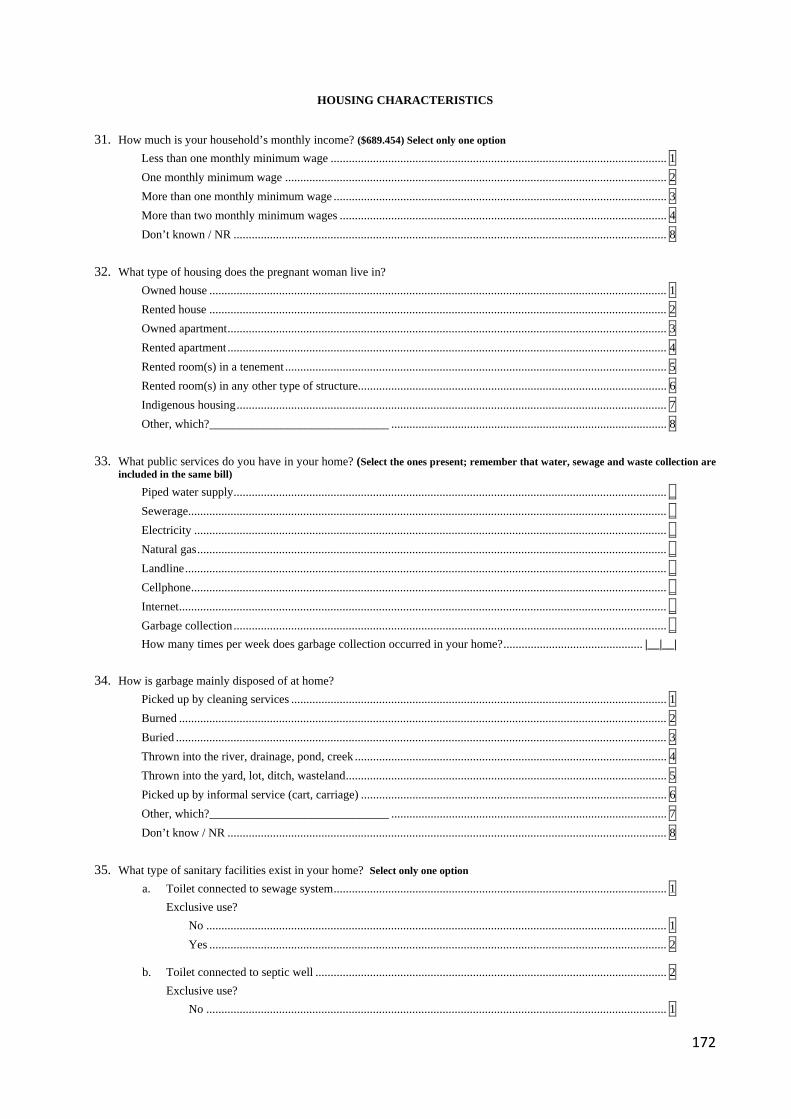
172
HOUSING CHARACTERISTICS
31. How much is your household’s monthly income? ($689.454) Select only one option Less than one monthly minimum wage ............................................................................................................... 1 One monthly minimum wage .............................................................................................................................. 2 More than one monthly minimum wage .............................................................................................................. 3 More than two monthly minimum wages ............................................................................................................ 4 Don’t known / NR ............................................................................................................................................... 8 32. What type of housing does the pregnant woman live in? Owned house ....................................................................................................................................................... 1 Rented house ....................................................................................................................................................... 2 Owned apartment ................................................................................................................................................. 3 Rented apartment ................................................................................................................................................. 4 Rented room(s) in a tenement .............................................................................................................................. 5 Rented room(s) in any other type of structure...................................................................................................... 6 Indigenous housing .............................................................................................................................................. 7 Other, which?______________________________ ........................................................................................... 8 33. What public services do you have in your home? (Select the ones present; remember that water, sewage and waste collection are
included in the same bill)
Piped water supply ............................................................................................................................................... _ Sewerage.............................................................................................................................................................. _ Electricity ............................................................................................................................................................ _ Natural gas ........................................................................................................................................................... _ Landline ............................................................................................................................................................... _ Cellphone ............................................................................................................................................................. _ Internet ................................................................................................................................................................. _ Garbage collection ............................................................................................................................................... _ How many times per week does garbage collection occurred in your home? .............................................. |__|__| 34. How is garbage mainly disposed of at home? Picked up by cleaning services ............................................................................................................................ 1 Burned ................................................................................................................................................................. 2 Buried .................................................................................................................................................................. 3 Thrown into the river, drainage, pond, creek ....................................................................................................... 4 Thrown into the yard, lot, ditch, wasteland .......................................................................................................... 5 Picked up by informal service (cart, carriage) ..................................................................................................... 6 Other, which?______________________________ ........................................................................................... 7 Don’t know / NR ................................................................................................................................................. 8 35. What type of sanitary facilities exist in your home? Select only one option
a. Toilet connected to sewage system .............................................................................................................. 1 Exclusive use? No ........................................................................................................................................................ 1 Yes ....................................................................................................................................................... 2
b. Toilet connected to septic well .................................................................................................................... 2 Exclusive use?
No ........................................................................................................................................................ 1
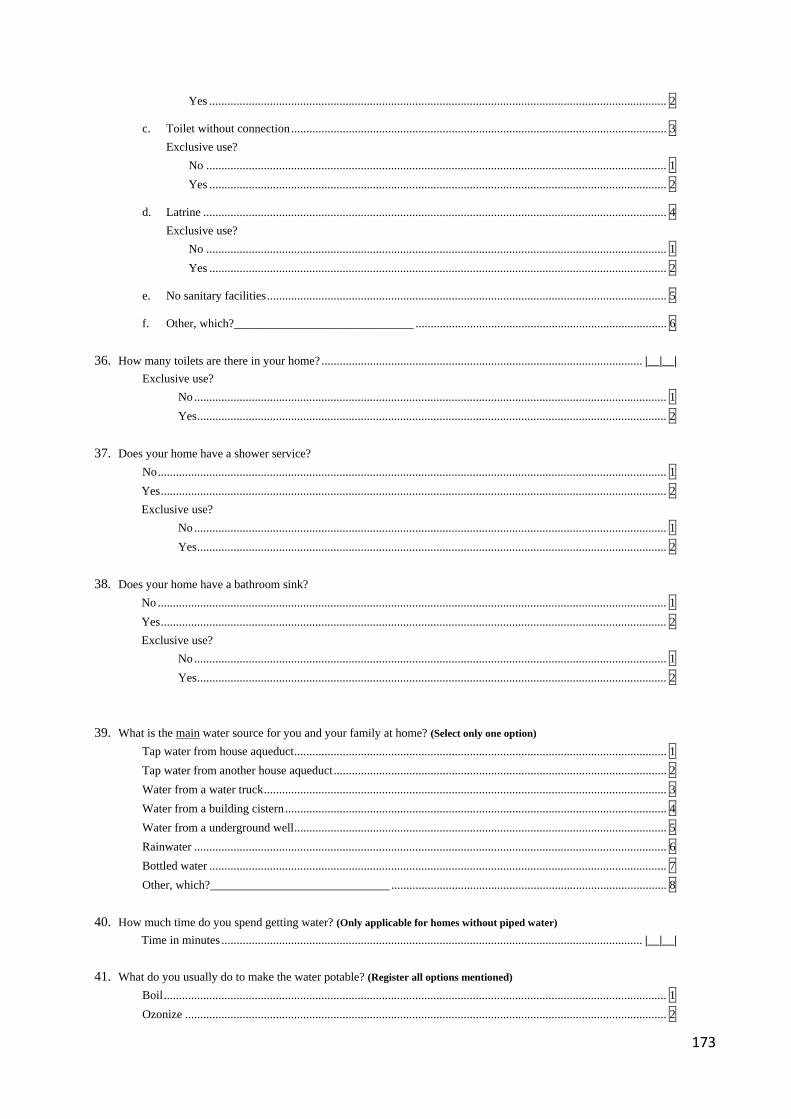
173
Yes ....................................................................................................................................................... 2
c. Toilet without connection ............................................................................................................................ 3 Exclusive use?
No ........................................................................................................................................................ 1 Yes ....................................................................................................................................................... 2
d. Latrine ......................................................................................................................................................... 4 Exclusive use?
No ........................................................................................................................................................ 1 Yes ....................................................................................................................................................... 2
e. No sanitary facilities .................................................................................................................................... 5
f. Other, which?______________________________ ................................................................................... 6 36. How many toilets are there in your home? .......................................................................................................... |__|__|
Exclusive use? No ............................................................................................................................................................ 1 Yes ........................................................................................................................................................... 2
37. Does your home have a shower service?
No ........................................................................................................................................................................ 1 Yes ....................................................................................................................................................................... 2 Exclusive use? No ............................................................................................................................................................ 1 Yes ........................................................................................................................................................... 2
38. Does your home have a bathroom sink?
No ........................................................................................................................................................................ 1 Yes ....................................................................................................................................................................... 2 Exclusive use? No ............................................................................................................................................................ 1 Yes ........................................................................................................................................................... 2
39. What is the main water source for you and your family at home? (Select only one option) Tap water from house aqueduct ........................................................................................................................... 1 Tap water from another house aqueduct .............................................................................................................. 2 Water from a water truck ..................................................................................................................................... 3 Water from a building cistern .............................................................................................................................. 4 Water from a underground well ........................................................................................................................... 5 Rainwater ............................................................................................................................................................ 6 Bottled water ....................................................................................................................................................... 7 Other, which?______________________________ ........................................................................................... 8 40. How much time do you spend getting water? (Only applicable for homes without piped water)
Time in minutes ........................................................................................................................................... |__|__| 41. What do you usually do to make the water potable? (Register all options mentioned)
Boil ...................................................................................................................................................................... 1 Ozonize ............................................................................................................................................................... 2
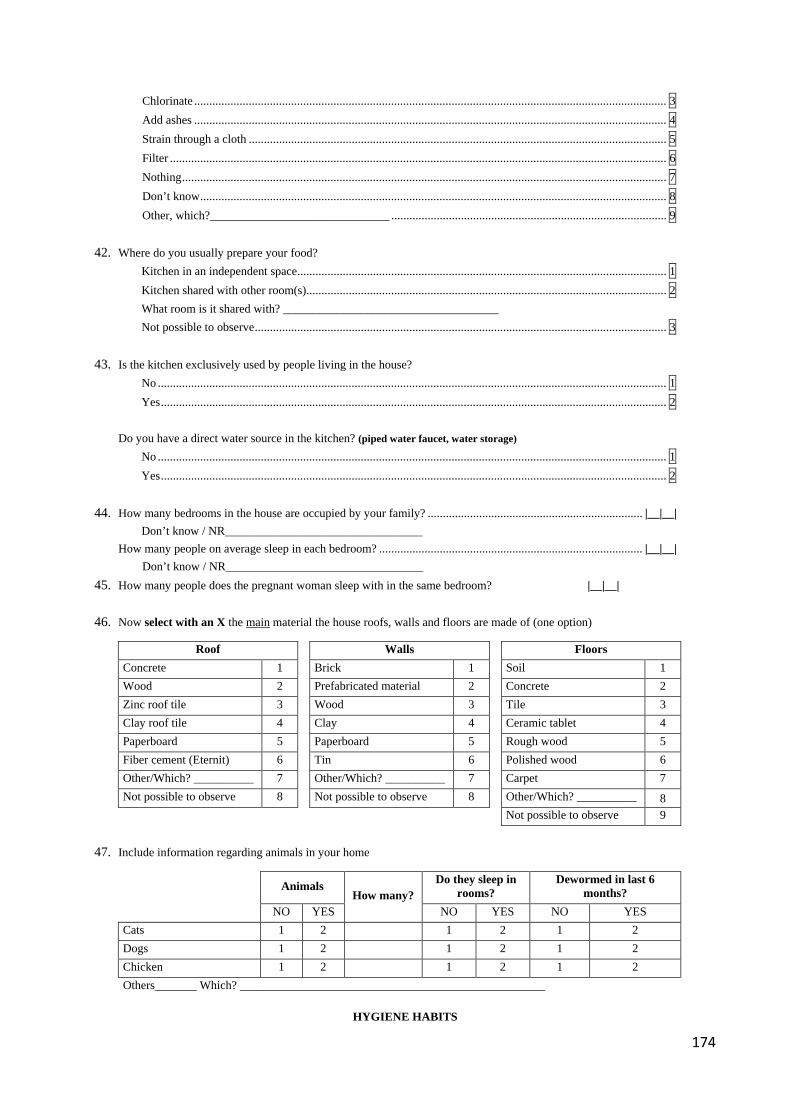
174
Chlorinate ............................................................................................................................................................ 3 Add ashes ............................................................................................................................................................ 4 Strain through a cloth .......................................................................................................................................... 5 Filter .................................................................................................................................................................... 6 Nothing ................................................................................................................................................................ 7 Don’t know .......................................................................................................................................................... 8 Other, which?______________________________ ........................................................................................... 9 42. Where do you usually prepare your food? Kitchen in an independent space .......................................................................................................................... 1 Kitchen shared with other room(s)....................................................................................................................... 2 What room is it shared with? ____________________________________ Not possible to observe ........................................................................................................................................ 3 43. Is the kitchen exclusively used by people living in the house?
No ........................................................................................................................................................................ 1 Yes ....................................................................................................................................................................... 2 Do you have a direct water source in the kitchen? (piped water faucet, water storage) No ........................................................................................................................................................................ 1 Yes ....................................................................................................................................................................... 2
44. How many bedrooms in the house are occupied by your family? ....................................................................... |__|__| Don’t know / NR_________________________________ How many people on average sleep in each bedroom? ....................................................................................... |__|__| Don’t know / NR_________________________________
45. How many people does the pregnant woman sleep with in the same bedroom? |__|__| 46. Now select with an X the main material the house roofs, walls and floors are made of (one option)
Roof Walls Floors Concrete 1 Brick 1 Soil 1 Wood 2 Prefabricated material 2 Concrete 2 Zinc roof tile 3 Wood 3 Tile 3 Clay roof tile 4 Clay 4 Ceramic tablet 4 Paperboard 5 Paperboard 5 Rough wood 5 Fiber cement (Eternit) 6 Tin 6 Polished wood 6 Other/Which? __________ 7 Other/Which? __________ 7 Carpet 7 Not possible to observe 8 Not possible to observe 8 Other/Which? __________ 8
Not possible to observe 9 47. Include information regarding animals in your home
Animals How many?
Do they sleep in rooms?
Dewormed in last 6 months?
NO YES NO YES NO YES Cats 1 2 1 2 1 2 Dogs 1 2 1 2 1 2 Chicken 1 2 1 2 1 2 Others_______ Which? ___________________________________________________
HYGIENE HABITS
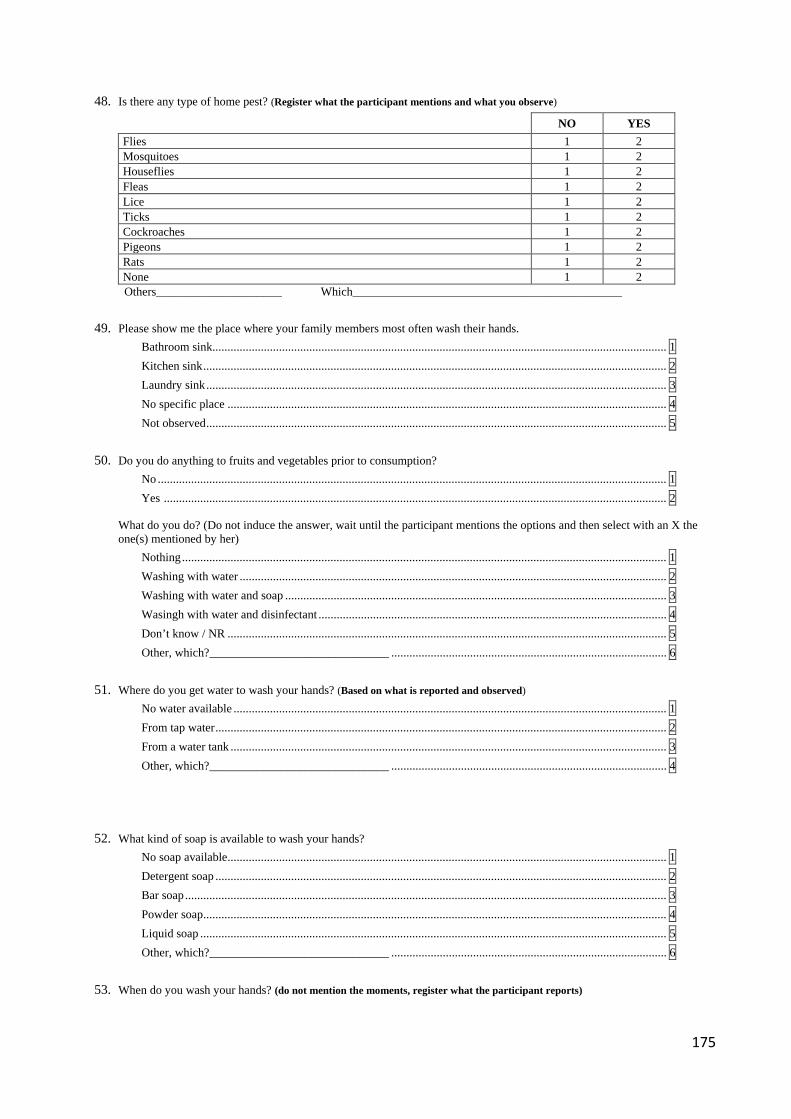
175
48. Is there any type of home pest? (Register what the participant mentions and what you observe)
NO YES Flies 1 2 Mosquitoes 1 2 Houseflies 1 2 Fleas 1 2 Lice 1 2 Ticks 1 2 Cockroaches 1 2 Pigeons 1 2 Rats 1 2 None 1 2
Others_____________________ Which_____________________________________________ 49. Please show me the place where your family members most often wash their hands. Bathroom sink...................................................................................................................................................... 1 Kitchen sink ......................................................................................................................................................... 2 Laundry sink ........................................................................................................................................................ 3 No specific place ................................................................................................................................................. 4 Not observed ........................................................................................................................................................ 5 50. Do you do anything to fruits and vegetables prior to consumption? No ........................................................................................................................................................................ 1 Yes ...................................................................................................................................................................... 2
What do you do? (Do not induce the answer, wait until the participant mentions the options and then select with an X the one(s) mentioned by her)
Nothing ................................................................................................................................................................ 1 Washing with water ............................................................................................................................................. 2 Washing with water and soap .............................................................................................................................. 3 Wasingh with water and disinfectant ................................................................................................................... 4 Don’t know / NR ................................................................................................................................................. 5 Other, which?______________________________ ........................................................................................... 6 51. Where do you get water to wash your hands? (Based on what is reported and observed)
No water available ............................................................................................................................................... 1 From tap water ..................................................................................................................................................... 2 From a water tank ................................................................................................................................................ 3 Other, which?______________________________ ........................................................................................... 4 52. What kind of soap is available to wash your hands? No soap available ................................................................................................................................................. 1
Detergent soap ..................................................................................................................................................... 2 Bar soap ............................................................................................................................................................... 3 Powder soap ......................................................................................................................................................... 4 Liquid soap .......................................................................................................................................................... 5
Other, which?______________________________ ........................................................................................... 6 53. When do you wash your hands? (do not mention the moments, register what the participant reports)
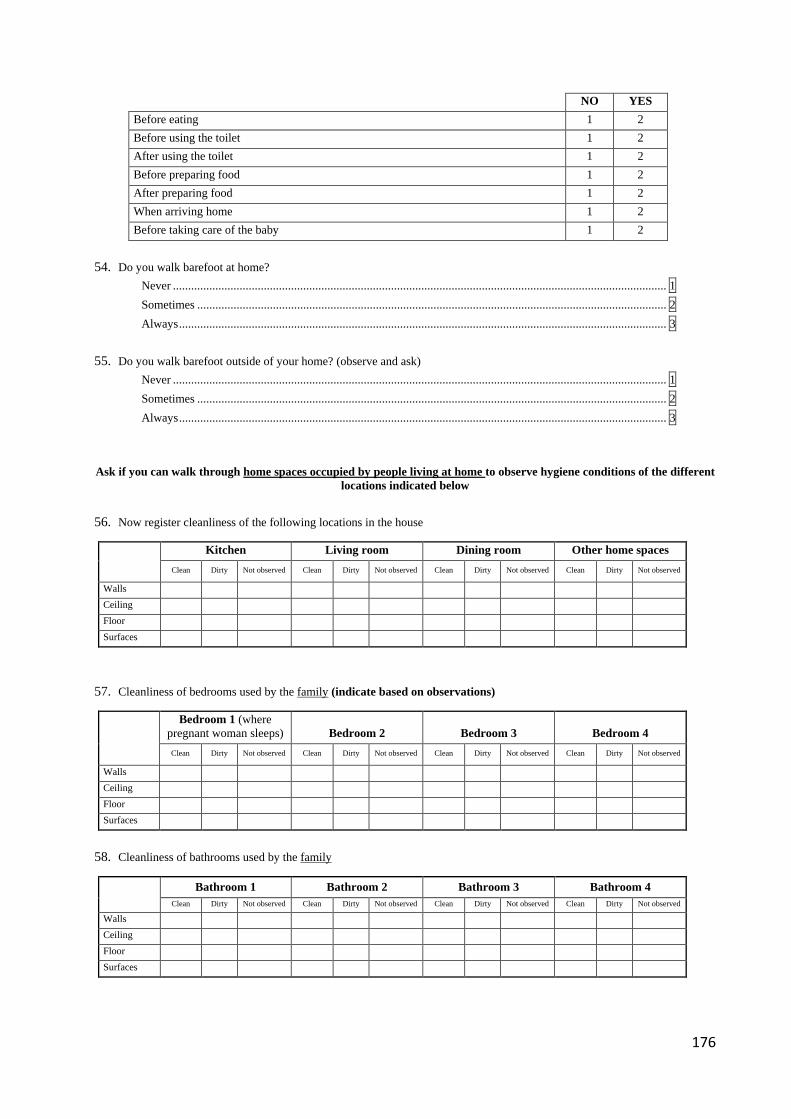
176
NO YES Before eating 1 2 Before using the toilet 1 2 After using the toilet 1 2 Before preparing food 1 2 After preparing food 1 2 When arriving home 1 2 Before taking care of the baby 1 2
54. Do you walk barefoot at home? Never ................................................................................................................................................................... 1 Sometimes ........................................................................................................................................................... 2 Always ................................................................................................................................................................. 3 55. Do you walk barefoot outside of your home? (observe and ask) Never ................................................................................................................................................................... 1 Sometimes ........................................................................................................................................................... 2 Always ................................................................................................................................................................. 3
Ask if you can walk through home spaces occupied by people living at home to observe hygiene conditions of the different locations indicated below
56. Now register cleanliness of the following locations in the house
Kitchen Living room Dining room Other home spaces Clean Dirty Not observed Clean Dirty Not observed Clean Dirty Not observed Clean Dirty Not observed
Walls Ceiling Floor Surfaces
57. Cleanliness of bedrooms used by the family (indicate based on observations)
Bedroom 1 (where pregnant woman sleeps) Bedroom 2 Bedroom 3 Bedroom 4 Clean Dirty Not observed Clean Dirty Not observed Clean Dirty Not observed Clean Dirty Not observed
Walls Ceiling Floor Surfaces
58. Cleanliness of bathrooms used by the family
Bathroom 1 Bathroom 2 Bathroom 3 Bathroom 4
Clean Dirty Not observed Clean Dirty Not observed Clean Dirty Not observed Clean Dirty Not observed Walls Ceiling Floor Surfaces
177
THANK YOU FOR YOUR ATTENTION AND COLLABORATION.
WE REQUEST YOU NOT TO MENTION THE CONTENT OF THESE QUESTIONS TO OTHER PREGNANT WOMEN IN THE NEIGHBOURHOOD SO THAT THE ANSWERS WILL ASSURE THE BEST
RESULTS FROM THE SURVEY
REFERENCES 1. ICF-International. Demographic and Health Surveys Methodology - Questionnaires: Household, Woman’s, and Man’s. Measure DHS Phase III. In: U.S.AgencyforInternationalDevelopment(USAID), editor. Calverton, Maryland 2011. 2. Secretaría de Salud, Hospital del Sur. Caracterización Núcleos Familiares. Bogotá D.C. 3. Fescina R, H,, De Mucio B, Díaz-Rossello JL, Martínez G, Serruya S, Durán P. Salud sexual y reproductiva: guías para el continuo de atención de la mujer y el recién nacido focalizadas en APS. 3a Edicion. Montevideo: CLAP/SMR - PAHO/WHO; 2011. Available from: https://www.paho.org/clap/index.php?option=com_docman&view=document&layout=default&alias=206-salud-sexual-y-reproductiva-guias-para-el-continuo-de-atencion-de-la-mujer-y-el-recien-nacido-focalizadas-en-aps-3-ed-4&category_slug=sip&Itemid=219⟨=en.
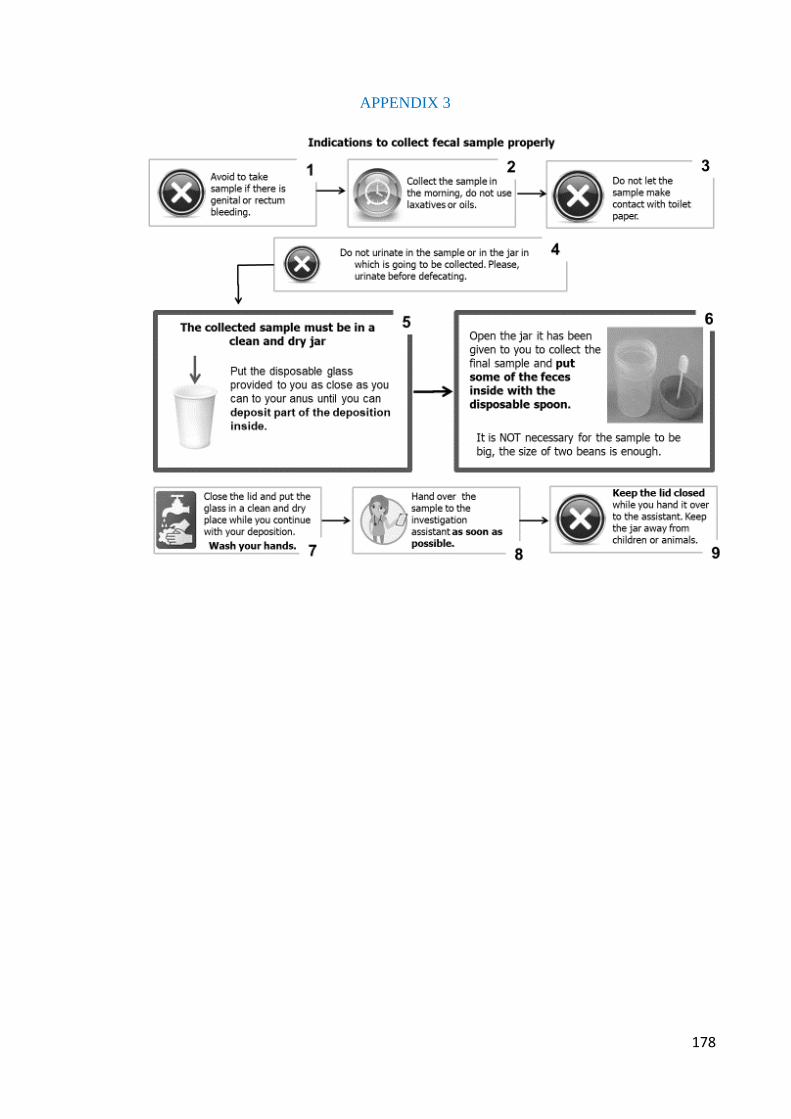
178
APPENDIX 3
179
APPENDIX 4
ENVIRONMENTAL RISK FACTORS ASSOCIATED WITH INTESTINAL PARASITES IN PREGNANT WOMEN IN FOUR DISTRICTS IN BOGOTÁ D.C.
DISTRICTS: BOSA-CIUDAD BOLÍVAR, KENNEDY AND USAQUÉN
ESCUELA DE MEDICINA Y CIENCIAS DE LA SALUD-UNIVERSIDAD DEL ROSARIO-UNIVERSIDAD DEL ROSARIO
CENTER FOR INTERNATIONAL HEALTH-LUDWIG MAXIMILIANS UNIVERSITY
INFORMED CONSENT
We are inviting you to participate in the study: “Environmental risk factors associated with intestinal parasites in pregnant women in four districts in Bogotá D.C.”
AIM OF THE STUDY:
The aim of the study is to determine the number of pregnant women living in strata 1 and 2 of the districts Bosa, Ciudad Bolívar, Kennedy and Usaquén who are infected with intestinal parasites and the possible reasons that trigger the development of these kind of infections in that population.
JUSTIFICATION:
Intestinal parasites infections are very frequent worldwide. Almost one third of the world’s population is infected. Children and pregnant women are the most susceptible to contract these kind of infections, leading to important consequences for their health, such us malnutrition and anemia. In Bogotá the number of pregnant women with intestinal parasites is unknown. In order to be able to implement health interventions it is important to know about the magnitude of the problem. This is the aim of this study.
180
PROCEDURE:
The participation in this research consists of (1) collecting two stool samples (collected on two different days) according to the indications given by the health care worker and (2) answering one survey during the house visit which will take 15 to 20 minutes.
The stool samples will be taken to a laboratory to determine whether intestinal parasites are present or not. These exams do not have any costs for you.
The house visit will be done by a person involved in the research. She will ask some questions and besides that she will ask your permission to view different spaces in the house.
RISKS
According to Resolution 8430 of 1993 of the Ministerio de la Protección Social, this research is considered to be without risks for you.
BENEFITS
The participation in this research will give you insight on whether you have intestinal parasites or not. After the examinations of the stool samples and the house visit you will receive the results of the examinations and recommendations for treatment or for prevention of the infections.
You will not receive payment for your participation in this research. With your participation you will contribute to improve the health of pregnant women in Bogotá.
HANDLING OF INFORMATION
The obtained information from laboratory exams and the house visit will be handled in a confidential way. All people involved in the research have signed a confidentiality agreement in which they committed to keeping all information confidential. Both the laboratory exams and survey will be identified with a code in order to protect your identity. The identification number, your name and your signature will be asked in order to comply to the Colombian rules. The researchers will link your identification number with an assigned code in a file which only they
181
will have access to. The aim of this is to be able to identify pregnant women that require treatment.
According to the Colombian rules both researchers and health care workers must comply to before written. If you consider that this criteria are not met, please contact the Ethical Committee of Universidad del Rosario with phone number 2970200 Ext 4019 or 3405.
INFORMED CONSENT DECLARATION
I read (or was read), and I have understood the information about the study “Environmental risk factors associated with intestinal parasites in pregnant women in four districts in Bogotá D.C.” and I had the opportunity to ask questions and to receive satisfactory answers.
My participation in this study is completely voluntary and I can drop out at any moment for any reason without any negative consequences for me.
My participation in this research does not have any costs for me. I understand that:
I GIVE MY VOLUNTARY CONSENT TO BE PART OF THIS STUDY
IDENTIFICATION NUMBER___________________________________________________
NAME: ___________________________________________________
SIGNATURE __________________________________________________
I.NUMBER_________________________I. NUMBER________________________________
NAME: _________________________NAME: ___________________________________
ADDRESS _________________________ADDRESS_________________________________
PHONE ________________________PHONE____________________________________
182
____________________________ __________________________
SIGNATURE OF WITNESS I SIGNATURE OF WITNESS II
__________________________________
SIGNATURE OF THE MAIN RESEARCHER
NAME OF THE MAIN RESEARCHER
Bogotá, D.C, date (dd/mm/yy): __________________________
If you have any questions, comments or suggestions or you wish to drop out of the study you can communicate directly with:
Ángela Fernanda Espinosa Aranzales, main researcher. Address office: Carrera 24 63C-74. Universidad del Rosario. Phone number 2970200 Ext. 3344
You can always communicate with the president of the Ethical Committee of Universidad del Rosario on phone number 2970200 Ext. 4019/3405
183
APPENDIX 5
ENVIRONMENTAL RISK FACTORS ASSOCIATED WITH INTESTINAL PARASITES IN PREGNANT WOMEN IN FOUR DISTRICTS IN BOGOTÁ D.C.
DISTRICTS: BOSA, CIUDAD BOLÍVAR, KENNEDY AND USAQUÉN ESCUELA DE MEDICINA Y CIENCIAS DE LA SALUD-UNIVERSIDAD DEL
ROSARIO-UNIVERSIDAD DEL ROSARIO CENTER FOR INTERNATIONAL HEALTH-LUDWIG MAXIMILIANS UNIVERSITY
INFORMED ASSENT
We are inviting you to participate in the study: “Environmental risk factors associated with intestinal parasites in pregnant women in four districts in Bogotá D.C.” AIM OF THE STUDY: The aim of the study is to count the number of pregnant women living in strata 1 and 2 of the districts Bosa, Ciudad Bolívar, Kennedy and Usaquén who have intestinal parasites ( the most of them are known as a “lombrices and amebas”). We also want to study the possible reasons that trigger the development of these kind of infections in that population. JUSTIFICATION: When pregnant women are infected with intestinal parasites (“lombrices and amebas”), they and their babies could get sick. Therefore it is important to know whether pregnant women are infected in order to be able to help them. PROCEDURE: The participation in this research consists of (1) collecting two stool samples (collected on two different days) according to the indications given by the health care worker and (2) answering one survey during the house visit which will take 15 to 20 minutes. The stool samples will be taken to a laboratory to determine whether intestinal parasites are present or not. Neither the exams nor the survey have any costs for you. The house visit will be done by a person involved in the research. She will ask some questions and besides that she will ask your permission to view different spaces in the house. RISKS Your participation in this study does not have any risks for you. BENEFITS The participation in this research will give you insight on whether you have intestinal parasites or not. After the examinations of the stool samples and the house visit you will receive the results of the examinations and recommendations for treatment or for prevention of the infections. You will not receive payment for your participation in this research. With your participation you will contribute to improve the health of pregnant women in Bogotá.
184
HANDLING OF INFORMATION Your name and your identification data will be known by the researchers of the study only. They must handle your identity; the results of examinations and the information of the house visit in a secret way. If you consider that this criterion is not met, please contact the Ethical Committee of Universidad del Rosario with phone number 2970200 Ext 4019 or 3405. INFORMED ASSENT DECLARATION I read (or was read), and I have understood the information about the study “Environmental risk factors associated with intestinal parasites in pregnant women in four districts in Bogotá D.C.” and I had the opportunity to ask questions and to receive satisfactory answers. My participation in this study is completely voluntary and I can drop out at any moment for any reason without any negative consequences for me. My participation in this research does not have any costs for me. I understand that: I GIVE MY VOLUNTARY ASSENT TO BE PART OF THIS STUDY IDENTIFICATION NUMBER__________________________________________________ NAME: __________________________________________________ SIGNATURE __________________________________________________ SIGNATURE OF THE MAIN RESEARCHER ___________________________________________________________________________ NAME OF THE MAIN RESEARCHER ___________________________________________________________________________ Bogotá, D.C, date (dd/mm/yy): _________________________________________________ If you have any questions, comments or suggestions or you wish to drop out of the study you can communicate directly with: Ángela Fernanda Espinosa Aranzales, main researcher. Address office: Carrera 24 3 63C-74. Universidad del Rosario. Phone number 2970200 Ext. 3344 You can always communicate with the president of the Ethical Committee of Universidad del Rosario on phone number 2970200 Ext. 4019/3405


