Embed Size (px)
Citation preview

The authors are solely responsible for the content of this technical presentation. The technical presentation does not necessarily reflect the official position of the American Society of Agricultural and Biological Engineers (ASABE), and its printing and distribution does not constitute an endorsement of views which may be expressed. Technical presentations are not subject to the formal peer review process by ASABE editorial committees; therefore, they are not to be presented as refereed publications. Citation of this work should state that it is from an ASABE meeting paper. EXAMPLE: Author's Last Name, Initials. 2008. Title of Presentation. ASABE Paper No. 08----. St. Joseph, Mich.: ASABE. For information about securing permission to reprint or reproduce a technical presentation, please contact ASABE at [email protected] or 269-429-0300 (2950 Niles Road, St. Joseph, MI 49085-9659 USA).
An ASABE Meeting Presentation
Paper Number: 096325
Assessment of Environmental Factors Affecting PM Emission from Turkey Barn
Hong Li1, Hongwei Xin1, Robert Burns1, Steven Hoff1, Jay Harmon1, Larry Jacobson2, Sally Noll3, and Jacek Koziel1
1 Dept. of Agricultural & Biosystems Engineering, Iowa State University, Ames, IA 50011 2 Dept. of Bioproducts and Biosystems Engr., University of Minnesota, St. Paul, MN 55108
3 Dept. of Animal Science, University of Minnesota, St. Paul, MN 55108
Written for presentation at the 2009 ASABE Annual International Meeting
Sponsored by ASABE Grand Sierra Resort and Casino
Reno, Nevada June 21 – June 24, 2009
Abstract. Concentrations and emissions of particulate matters (PM10 and PM2.5) were continuously measured in a mechanically ventilated turkey grow-out house over one-year period. The PM concentrations were measured using tapered element oscillating microbalances (TEOMs), and the building ventilation rate (VR) was measured by monitoring the operation time of calibrated ventilation fans. Bird activities (BA) were monitored with a passive infrared detector (PID). This paper describes the effects of bird age, BA, VR, air temperature, and indoor relative humidity (RH) on the PM emission rate (ER) based on three flocks (bird age of 35 - 140 d) data collected during the one-year monitoring. Considerable diurnal variations were observed in BA, PM concentration and PM ER of the turkey barn. The PM concentration and ER were positively related to BA but negatively related to indoor RH. VR was negatively related to PM concentration but positively related to ER.
Keywords. Particulate matter, emissions, turkey, environmental factors
ASABE AIM09 Paper 096325 – Li et al.
2
Introduction Particulate matter (PM) creates ambient air quality concerns when they are released to the atmosphere. PM is one of the most prominent air pollutants associated with animal feeding operations (AFOs). In 2005 an Air Compliance Agreement (ACA) was reached between EPA and certain sectors of the U.S. livestock and poultry industries, namely, broiler, egg, swine, and dairy industries. The ACA studies will yield more baseline data on air emissions from U.S. AFOs. However, turkey industry was not a part of the ACA and there had been no study that continually quantifies air emissions from U.S. turkey facilities. During 2007 to 2008, a turkey air emissions monitoring study, funded by the USDA-NRI Air Quality Program, was conducted and a tom turkey in Iowa and a hen turkey barn in Minnesota were continuously monitored for one year (Li et al., 2009). As a part of this study, the PM emissions from turkey houses were quantified and the environmental conditions in the turkey houses were monitored.
To control animal-exposure PM level and emissions from the emitting sources, it is important to understand and characterize the factors that influence the PM generation and emission. These factors include, but not limited to, indoor climatic conditions, building ventilation rate (VR), heating and cooling schemes, animal type and age, feed type and feeding schemes, litter or manure conditions, and lighting programs. In mechanically ventilated facilities, high VR in summer results in lower indoor PM concentration due to more air dilution but may increase PM emission rate (ER) (Takai et al., 1998; Haeussermann et al., 2008). Animal activity is the predominant factor that influences airborne particle concentrations (Dawson, 1990; Pedersen et al, 1995; Perkins et al, 1997). However, there were few studies that actually characterize or quantify the impact of animal activity on PM concentrations and emissions (Perkins et al., 1997; Haeussermann et al., 2008). Information is particularly meager concerning animal activity and environmental factors and their impacts on PM emission in poultry operations.
The objective of this paper was to assess the effects of bird activity (BA), VR, indoor air temperature and relative humidity (RH) on PM10 (particulate matter with aerodynamic diameters ≤ 10 µm) and PM2.5 (particulate matter with aerodynamic diameters ≤ 2.5 µm) concentration and ER of a commercial grow-out tom turkey barn.
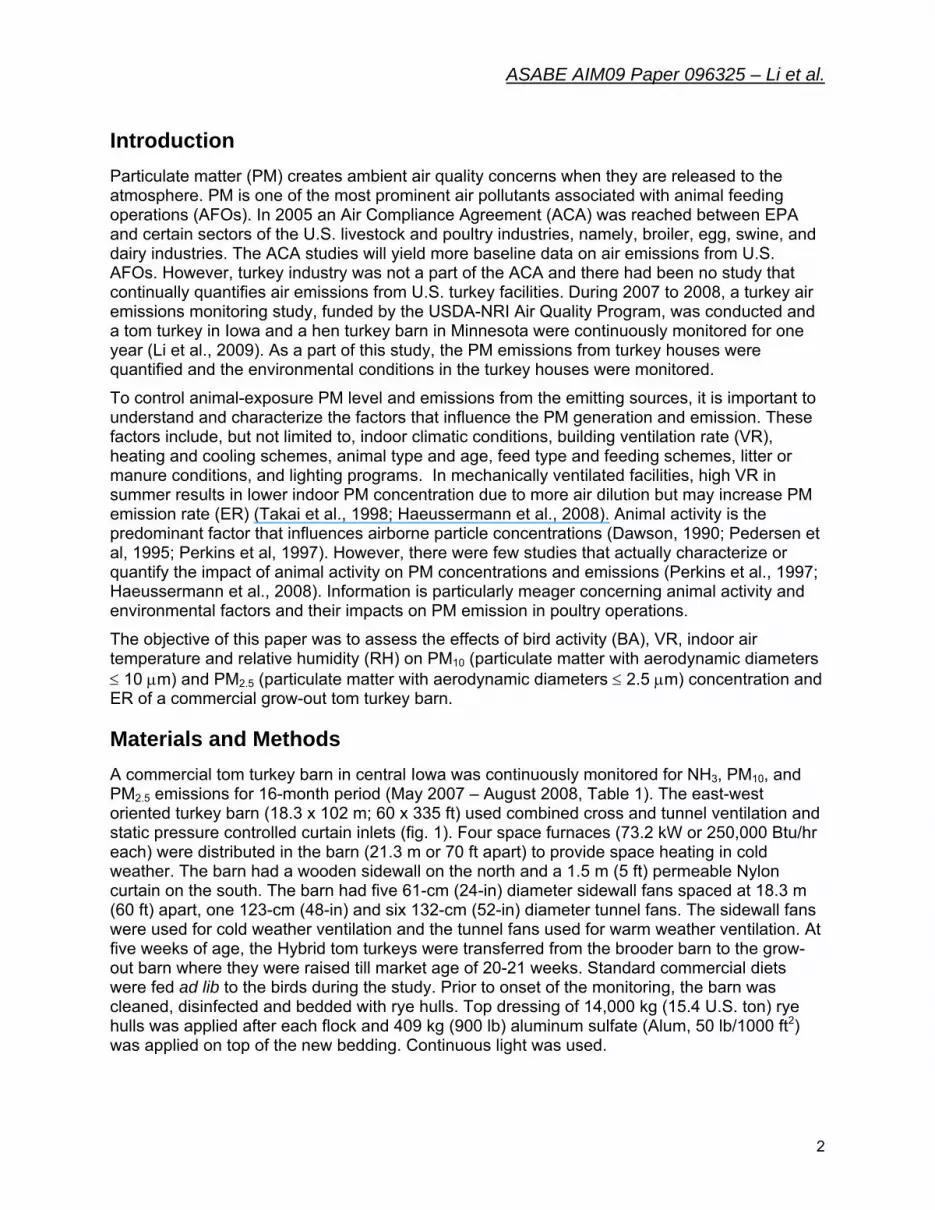
Materials and Methods A commercial tom turkey barn in central Iowa was continuously monitored for NH3, PM10, and PM2.5 emissions for 16-month period (May 2007 – August 2008, Table 1). The east-west oriented turkey barn (18.3 x 10² m; 60 x 335 ft) used combined cross and tunnel ventilation and static pressure controlled curtain inlets (fig. 1). Four space furnaces (73.2 kW or 250,000 Btu/hr each) were distributed in the barn (21.3 m or 70 ft apart) to provide space heating in cold weather. The barn had a wooden sidewall on the north and a 1.5 m (5 ft) permeable Nylon curtain on the south. The barn had five 61-cm (24-in) diameter sidewall fans spaced at 18.3 m (60 ft) apart, one 123-cm (48-in) and six 132-cm (52-in) diameter tunnel fans. The sidewall fans were used for cold weather ventilation and the tunnel fans used for warm weather ventilation. At five weeks of age, the Hybrid tom turkeys were transferred from the brooder barn to the grow-out barn where they were raised till market age of 20-21 weeks. Standard commercial diets were fed ad lib to the birds during the study. Prior to onset of the monitoring, the barn was cleaned, disinfected and bedded with rye hulls. Top dressing of 14,000 kg (15.4 U.S. ton) rye hulls was applied after each flock and 409 kg (900 lb) aluminum sulfate (Alum, 50 lb/1000 ft2) was applied on top of the new bedding. Continuous light was used.

ASABE AIM09 Paper 096325 – Li et al.
3
Tapered element oscillation microbalances (TEOMs) (model 1400a, Thermo Environmental Instruments Inc., Franklin, MA) were used with different heads to measure PM10 and PM2.5 concentrations. One set of (two) TEOMs placed at the sidewall location and another set near the tunnel end. For the ambient (background) location, the PM10 and PM2.5 TEOMs were collocated at the ambient air sampling location near the air inlet. VR of the barn was derived by using in situ calibrated fan curves from a fan assessment numeration system (FANS) (Gates et al., 2004). After the actual airflow curves were established for all the exhaust fans individually and in stage combinations, runtime of each fan was monitored and recorded continuously using an inductive current switch attached to the power supply cord of each fan motor (Muhlbauer et al., 2006). Analog output from each current switch was connected to the compact Fieldpoint modules. Concurrent measurement of the barn static pressure (SP) was made with two SP sensors (Model 264, Setra, Boxborough, MA), each for half of the house. Summation of airflows from the individual fans during each monitoring cycle or sampling interval yielded the overall barn VR. Two RH sensors (HMP 61U, Vaisala Inc., Woburn, MA) located near the TEOMs at sidewall and tunnel location were used to continuously monitor RH. Type T (copper-constantan) thermocouples were used for temperature measurement. Two passive infrared detectors (PIDs) (SRN-2000, Visonic Inc., Bloomfield, CT, USA) were mounted 2 m (6 ft) above the floor: one at the tunnel end and the other in the middle of the house. The PID motion detection sensors were equipped with a #100 lens that had a 90 degree and 18 m radius coverage (fig. 2). The original AC signals from the PIDs were converted to DC signals using a full-wave rectification. The converted DC signals were then amplified and smoothed for the final processing. Dielectric moisture sensors (Model EC5, Decagon Devices, Pullman, WA) were calibrated (Mendes et al., 2008) and used for measuring of litter/bedding moisture content weekly during the flocks (September, 2007 to April, 2008). Fifteen locations were randomly selected and litter moisture contents were measured during each trip.
The relationship of the dynamic PM ER to PM concentrations of inlet and exhaust air and building VR can be expressed as following:
[ ]std
a
a
std
ei
i
eetetPM P
PTT
PMPMQER ×××⎟⎟⎠
⎞⎜⎜⎝
⎛−= −
=∑ 6
2
110][][][
ρρ [1]
where [ERPM]t = PM emission rate of the house (g house-1 t-1)
[Qe]t = Average VR of the house during sample integration time t under field temperature and barometric pressure (m3 house-1 t-1)
[PM]i = PM concentration of incoming ventilation air (ug m-3)
[PM]e = PM concentration of exhaust ventilation air (ug m-3)
Tstd = standard temperature, 273.15 K
Ta = absolute house temperature, (°C+273.15) K
Pstd = standard barometric pressure, 101.325 kPa
Pa = atmospheric barometric pressure for the site elevation, kPa
ρi, ρe = air density of incoming and exhaust air, kg dry air m-3 moist air

ASABE AIM09 Paper 096325 – Li et al.
4
Results and Discussion
Diurnal Variations in PM Concentration, ER, Environmental Factors and BA
As shown by the data in Figure 3, PM10 concentrations, ER, VR, RH and BA exhibited distinctive diurnal variations. The PM10 ER followed the same trend of BA, especially when VR remained constant at 40 d of age. For example, a BA spike (0.6) at 3 AM led to the corresponding PM10 ER increasing from 5 mg/hr-bird at 2 AM to 9 mg/hr-bird at 3 AM. The BA and PM10 ER were much higher during the day than at night, even with the presence of artificial lighting at night. The lower BA at night could have been attributed to the less natural light that would be available through the nylon curtains during the day. The PM10 concentration had a stronger relationship with VR. Figure 3 shows that the PM10 concentration declined under higher VR at 100 d of age but the corresponding PM10 ER was elevated, as compared to those at 40 d of age. Both elevated BA and VR could enhance the PM10 generation and emission of the turkey houses when the stirred-up PM from dry litter and bird feather by air turbulence was exhausted by the ventilation fans. There was no strong evidence to show that higher RH would lower the PM concentrations or emissions. Since PM10 and PM2.5 concentrations and ER are highly correlated (fig. 4), the impacts of BA, VR, and RH on PM10 concentration and ER would be applicable to PM2.5.
Effect of BA and Environmental Variables on PM Emissions
Hourly PM ER The 30-s average ER data and variables were processed and summarized as 60-min (hourly) averages. Higher BA led to elevated PM10 concentration and ER. Figure 5 shows the relationship between the hourly PM10 ER and BA over the three flocks with 6306 valid data points. There was a fairly strong linear relationship between the two variables. In addition, RH and VR had impact on the PM10 ER. Figure 3 reveals that both VR and BA positively affected the PM10 ER. For instance, the PM ER and concentration were highly related to the BA while the VR was kept constant on the day 40 (figs. 3a and 3b). PM10 ER also markedly followed the VR trend when the VR had a remarkable diurnal pattern and changed from 10 to 28 m3/hr while the PM10 concentration had the reversed trend (figs 3d and 3e). The indoor RH tended to be lower during the period of high PM10 ER. In general, the PM10 ER from the turkey house will rise with elevation of BA and VR and lower RH. As mentioned above, PM10 ER and concentration could also be influenced by other variables, such as temperature, litter condition, and bird size. To evaluate the relationship between the various input variables and PM ER, a multiple linear regression analysis was performed, of the form,
PMER = β0+ β1X1+ ••••••+ βiXi [2]
where ERPM = mg hr-1bird-1
Xi = influencing variables
βi = regression coefficient
Variability in PM10 and PM2.5 ER was mainly affected by bird age, BA, VR, and RH (R2=0.54 for PM10 and 0.57 for PM2.5, Table 2). BA positively impacts both PM10 and PM2.5 ERs as higher BA stimulates more PM generation from the litter. VR affected PM ER in that higher VR reduced PM concentration (due to greater dilution) but increased PM emission. Elevated RH led to less PM generation and thus lower emission to the environment. The quantity PMER also increased

ASABE AIM09 Paper 096325 – Li et al.
5
with bird age that had been seen from a previous study with southeastern broiler air emissions monitoring (Burns et al., 2008).
Daily PM ER Daily ERs of PM10 and PM2.5 and daily averages of major environmental factors were also used to assess the effects of the variables. Figure 6 shows that the daily PM10 and PM2.5 ER dramatically increased with the bird growth during the first 8 weeks and remained constant or started to decrease. The bird growth (bird age) is the predominant variable that affects PM emissions from broiler houses (Burns et al., 2008). The litter moisture contents from weekly visits were linear-interpolated to generate the daily litter moisture content. To evaluate the relationship between the various input variables and daily PM ER, a multiple linear regression analysis was performed by using Equation 2. Similar regression patterns were found for daily PM ER with the environmental variables and bird age. The effect of bird age on daily PM10 ER was not significant which might be caused by the large variation of daily PM10 ER after 12-13 wk of bird age. The outcome may also indicate that BA and VR were the predominant variables after certain growth stage. Increased litter-floor coverage by the birds might have been another cause for the leveling or declining ER with bird age. No strong evidence showed that the litter moisture content could significantly affect the PM ER (P-value=0.5).
Conclusions The following conclusions were drawn from this study.
• Diurnal patterns exist in bird activity, PM emission rate, and PM concentration in the turkey barn.
• Bird activity positively impacts both PM emission rate (ER) and concentration. Increased ventilation rate (VR) reduces PM concentration but increases PM emission. Indoor relative humidity is negatively related to PM concentration and ER.
• During the one-year monitoring period (bird age of 35 - 140 d) in Iowa, PM10 and PM2.5 ER varied from 0 to 0.58 g d-1bird-1 and 0 to 0.05 g d-1 bird-1, respectively.
Acknowledgements Financial support of the study was provided in part by the USDA National Research Initiative Air Quality Program. The authors wish to sincerely thank the staff of the commercial turkey operation for their enthusiastic and constant cooperation throughout the study.
References Burns, R.T., H. Li, L. Moody, H. Xin, R. Gates, D. Overhults, J. Earnest. 2008. Quantification of
particulate emissions from broiler houses in the southeastern United States. Proc of the 8th International Livestock Environment Symposium, Sept 1-3, 2008, Iguassu Falls, Brazil. St Joseph, MI: ASAE
Burns, R. T., H. Xin, H. Li, S. Hoff, L. B. Moody, R. Gates, D. Overhults, and J. Earnest. 2006. Monitoring System Design for the Southeastern Broiler Gaseous and Particulate Matter Air Emissions Monitoring Project. Proceedings of the Air and Waste Management Association Air Quality Monitoring and Methodologies Conference.
Dawson, J. R. 1990. Minimizing dust in livestock buildings: Possible alternatives to mechanical separation. J. Agric. Eng. Res. 47(4):235-248.

ASABE AIM09 Paper 096325 – Li et al.
6
Haeussermann, A., A C. Jean-Marie Aerts, E. Hartung, T. J. Guarino, D. Berckmans. 2008. Development of a Dynamic Model to Predict PM10 Emissions from Swine Houses. 2008. J. Environ. Qual. 37:557–564.
Li, H., H. Xin, R.T. Burns, L.D. Jacobson, S. Noll, S.J. Hoff, J. D. Harmon, J. A. Koziel, and I. Celen. 2009. Air emissions from tom and hen turkey houses in the U.S. Midwest. ASABE Technical Paper No. 096318, St. Joseph, MI: ASABE
Li, H., H. Xin, R. T. Burns, S. J. Hoff, J. D. Harmon, L. D. Jacobson, and S. L. Noll. 2008. Effects of Bird Activity, ventilation rate and humidity on PM10 Concentration and Emission Rate of a Turkey Barn. Proc of the 8th
International Livestock Environment Symposium, August 31-September 4, 2008, Iguassu Falls, Brazil. St Joseph, MI: ASAE
Li, H., R. T. Burns, H. Xin, L. B. Moody, R. Gates, D. Overhults, and J. Earnest. 2006. Development of a Continuous NH3 Emissions Monitoring System for Commercial Broiler Houses. Proceedings of the Annual Air and Waste Management Association Conference.
Liang, Y., H. Xin, H. Li, R. S. Gates, E. F. Wheeler, K. D. Casey. 2006. Effects of measurement intervals on estimation of ammonia emissions from layer houses. Trans. ASABE 49(1): 183-186.
Mendes, Luciano Barreto, Hongwei Xin, and Hong Li. 2008. Evaluation and Calibration of a Soil Moisture Sensor for Measuring Poultry Manure or Litter Moisture Content. Paper # 084438. 2008 ASABE Annual Meeting, Providence, RI, American Society of Agricultural and Biological Engineers, St. Joseph, MI: ASAE
Moody, L. B., H. Li, R. T. Burns, H. Xin, and R. Gates. 2006. Quality Assurance Project Plan (QAPP) for Monitoring Gaseous and Particulate Matter Emission from Southeastern Broiler Houses. Proceedings of the Annual Air and Waste Management Association Conference.
Pedersen, S., and C.B. Pedersen. 1995. Animal activity measured by infrared detectors. J. Agric. Eng. Res. 61:239–246.
Perkins, S. L., J. J. R. Feddes, D. Fraser. 1997. Effects of sow and piglet activity on respirable particle concentrations. Applied Engineering in Agriculture 13(4):537-539
Takai, H., S. Pedersen, J.O. Johnsen, J.H.M. Metz, P.W.G. Groot Koerkamp, G.H. Uenk, V.R. Phillips, M.R. Holden, R.W. Sneath, J.L. Short, R.P. White, J.Hartung, J. Seedorf, M. Schröder, K.H. Linkert, and C.M. Wathes. 1998. Concentrations and emissions of airborne dust in livestock buildings in northern Europe. J. Agric. Eng. Res. 70:59–77.

ASABE AIM09 Paper 096325 – Li et al.
7
Table 1. Data of the three flocks of tom turkeys monitored for air emissions in Iowa
Flock # Flock dates Bird age, d Bird weight, kg No. of birds Marketed
Density, birds/m2
1 08/31/07–12/17/07 35 – 143 0.9-17.0 6059 3.3 2 01/07/08–04/28/08 38 – 150 1.4-19.5 5550 3.0 3 05/09/08–08/26/08 35 – 144 1.4-17.9 5124 2.8
Table 2. Multi-variate linear regression of hourly PM10 and PM2.5 emission rate (ER) vs. influencing variables (BA = bird activity, VR = ventilation rate, RH = indoor relative humidity)
ERPM10, mg/hr-bird (R2=0.54) ERPM2.5, mg/hr-bird (R2=0.57) Variables β SE P-value β SE P-value
Intercept 2.22 0.07 <0.001 0.24 0.027 <0.001 Bird age 0.010 0.0004 <0.001 0.007 0.0001 <0.001 BA 3.99 0.076 <0.001 1.39 0.029 <0.001 VR, m3/hr-bird 0.028 0.0006 <0.001 0.010 0.0002 <0.001 RHin, % -0.036 0.001 <0.001 -0.008 0.0004 <0.001
Table 3. Multi-variate linear regression of daily PM10 and PM2.5 emission rate (ER) vs. influencing variables (BA = bird activity, VR = ventilation rate, RH = indoor relative humidity)
ERPM10, g/bird-d (R2=0.45) ERPM2.5, g/bird-d (R2=0.58) Variables β SE P-value β SE P-value
Intercept 0.24 0.11 <0.001 -0.09 0.05 0.005 Bird age - - - 0.0007 0.0001 <0.001 RH inside,% -0.006 0.0008 <0.001 -0.001 0.0003 <0.001 VR, m3/hr-bird 0.004 0.0005 <0.001 0.001 0.0002 <0.001 BA 1.00 0.11 <0.001 0.40 0.06 <0.001

ASABE AIM09 Paper 096325 – Li et al.
8
102 m
16.8 m 85.2 m
9 m 18 m 75 m
Baro: Barometric pressure
MA
EMU
:Thermocouple
RH : Relative humidity:TEOMs:PID sensor:Control room
:Satellite dish
RHRH
SP :Static pressure
BaroRH
Inlet curtain
SW1 SW2 SW3 SW4SW5
T1
T2
T3
T4
T5
T6
T7
Tunnel18.3 m
102 m
16.8 m 85.2 m
9 m 18 m 75 m
Baro: Barometric pressure
MA
EMU
:Thermocouple
RH : Relative humidity:TEOMs:PID sensor:Control room
:Satellite dish
RHRH
SP :Static pressure
BaroRH
Inlet curtain
SW1 SW2 SW3 SW4SW5
T1
T2
T3
T4
T5
T6
T7
Tunnel18.3 m
Figure 1. Schematic layout of the mechanically ventilated tom turkey barn monitored at Iowa
Figure 2. Coverage pattern of the passive IR detection (PID) motion sensor site

ASABE AIM09 Paper 096325 – Li et al.
9
0
2
4
6
8
10
12
14
0:00 4:00 8:00 12:00 16:00 20:00 0:00Time, hr:min
PM10
ER
, mg/
hr-b
ird
00.10.20.30.40.50.60.70.80.9
Bird
Act
ivity
PM10 ERBA
Flock 2_40 d
(a)
0
500
1000
1500
2000
2500
3000
3500
0:00 4:00 8:00 12:00 16:00 20:00 0:00Time, hr:min
PM10
Con
c, u
g/m
3
0
1
2
3
4
5
6
7
VR, m
3 /hr-
bird
PM10 ConcVR
Flock 2_40 d
(b)
0
500
1000
1500
2000
2500
3000
3500
0:00 4:00 8:00 12:00 16:00 20:00 0:00Time, hr:min
PM10
Con
c, u
g/m
3
0
20
40
60
80
100
Indo
or R
H, %
PM10 ConcRH
Flock 2_40 d
(c)
01020304050607080
0:00 4:00 8:00 12:00 16:00 20:00 0:00Time, hr:min
PM10
ER
, mg/
hr-b
ird
00.10.20.30.40.50.60.70.80.9
Bird
Act
ivity
PM10 ERBA
Flock 2_100 d
(d)
0
500
1000
1500
2000
2500
3000
3500
0:00 4:00 8:00 12:00 16:00 20:00 0:00Time, hr:min
PM10
Con
c, u
g/m
3
0
5
10
15
20
25
30
VR, m
3 /hr-
bird
PM10 ConcVR
Flock 2_100 d
(e)
0
500
1000
1500
2000
2500
3000
3500
0:00 4:00 8:00 12:00 16:00 20:00 0:00Time, hr:min
PM10
Con
c, u
g/m
3
0
20
40
60
80
100
Indo
or R
H, %
PM10 ConcRH
Flock 2_100 d
(f)
Figure 3. Hourly PM10 and PM2.5 concentrations, emission rate , ventilation rate (VR) and bird activity (BA) for 40-d and 100-d old tom turkeys
0
2
4
6
8
10
0:00 4:00 8:00 12:00 16:00 20:00 0:00Time, hr:min
PM10
ER
, mg/
hr-b
ird
0.0
0.2
0.4
0.6
0.8
1.0
PM2.
5 ER
, mg/
hr-b
ird
PM10 ERPM2.5 ER
Flock 2_40 dPM2.5 = 0.13 PM10
R2 = 0.7131
0
4
8
12
16
20
0 20 40 60 80 100PM10 ER, mg/hr-bird
PM2.
5 ER
, mg/
hr-b
ird
Figure 4. Diurnal PM10 and PM2.5 ER from 40 d old tome turkeys and hourly ER comparison over the three flocks measurement

ASABE AIM09 Paper 096325 – Li et al.
10
ER = 28.9 BA + 0.36R2 = 0.24
0
20
40
60
80
100
120
0.0 0.2 0.4 0.6 0.8 1.0Bird Activity
PM10
ER
, mg/
hr-b
ird
ER = 0.13 VR + 8.1R2 = 0.09
0
20
40
60
80
100
120
0 20 40 60 80 100VR, m3/hr-bird
PM10
ER
, mg/
hr-b
ird
ER = -0.18 RH + 21.3R2 = 0.07
0
20
40
60
80
100
120
0 20 40 60 80 100RH, %
PM10
ER
, mg/
hr-b
ird
Figure 5. Relationship of PM10 emission rate (ER) to bird activity (BA), ventilation rate (VR), and indoor relative humidity (RH) of a turkey barn.
0.0
0.2
0.4
0.6
0.8
1.0
35 55 75 95 115 135 35 55 75 95 115 135 35 55 75 95 115 135
Bird age, d
PM10
ER
, g/d
-bird
0
20
40
60
80
VR, m
3 /hr-b
ird VR
PM10 ER
Flock 1 (8/31-12/17/07)
Flock 2 (1/7-5/02/08)
Flock 3(5/9-8/26/08)
0.00
0.03
0.06
0.09
0.12
0.15
35 55 75 95 115 135 35 55 75 95 115 135 35 55 75 95 115 135Bird age, d
PM2.
5 ER
, g/d
-bird
0.0
0.2
0.4
0.6
0.8
1.0
Bird
Act
ivity
ActivityPM2.5 ER
Flock 1 (8/31-12/17/07)
Flock 2 (1/7-4/29/08)
Flock 3 (5/9-8/26/08)
Activity sensors installed
Figure 6. PM10 and PM2.5 emission rate (ER), building ventilation rate (VR) and bird activity
during the three-flock monitoring of air emissions from a tom turkey barn in Iowa.